climate change projections for cape town: adding value ... resources/iclei africa_5... · iclei –...
TRANSCRIPT

ICLEI – Local Governments for Sustainability – Africa Climate Change Projections for Cape Town: Adding value through downscaling
Sub-Saharan African Cities: A Five-City Network to Pioneer Climate Adaptation through participatory
Research and Local Action. 1
Climate change projections for Cape Town:
Adding value through downscaling

ICLEI – Local Governments for Sustainability – Africa Climate Change Projections for Cape Town: Adding value through downscaling
Sub-Saharan African Cities: A Five-City Network to Pioneer Climate Adaptation through participatory
Research and Local Action. 2
Sub-Saharan African Cities: A five-City Network to Pioneer Climate
Adaptation through Participatory Research & Local Action
Climate Change Projections for Cape Town: Adding value through
downscaling
March 2012
Authors: Mark Tadross and Peter Johnston
ISBN: 978-0-9921794-8-9

ICLEI – Local Governments for Sustainability – Africa Climate Change Projections for Cape Town: Adding value through downscaling
Sub-Saharan African Cities: A Five-City Network to Pioneer Climate Adaptation through participatory
Research and Local Action. 3
Contents Preface ................................................................................................................................................................ 4
1 Historical observations and trends from Cape Town ................................................................................. 5
1.1 Climate of Cape Town ........................................................................................................................ 5
1.2 Historical trends in climate at Cape Town ......................................................................................... 7
2 GCM projections of future change (for 2050) .......................................................................................... 12
2.1 Rainfall ............................................................................................................................................. 12
2.2 Temperature .................................................................................................................................... 14
2.3 Winds ............................................................................................................................................... 15
3 Statistically downscaled projection of future changes in rainfall, temperature and evaporation .......... 16
3.1 Rainfall ............................................................................................................................................. 17
3.2 Temperature .................................................................................................................................... 18
3.3 Evaporation and effective rainfall ................................................................................................... 19
4 Changes in climate extremes .................................................................................................................... 21
4.1 Changes in extreme temperatures .................................................................................................. 22
4.2 Changes in extreme rainfall ............................................................................................................. 23
5 Cape Town: impacts and vulnerabilities ................................................................................................... 23
5.1 Water and Sanitation....................................................................................................................... 25
5.2 Transport ......................................................................................................................................... 25
5.3 Health .............................................................................................................................................. 25
5.4 Energy .............................................................................................................................................. 25
5.5 Livelihoods ....................................................................................................................................... 26

ICLEI – Local Governments for Sustainability – Africa Climate Change Projections for Cape Town: Adding value through downscaling
Sub-Saharan African Cities: A Five-City Network to Pioneer Climate Adaptation through participatory
Research and Local Action. 4
Preface
Climate change is expected to have severe physical, social, environmental and economic impacts on cities worldwide, both directly and indirectly. Although there are some uncertainties surrounding the understanding of earth’s complex systems, there is strong evidence in current literature and climatic measurements to demonstrate that, as a result of increasing greenhouse gas emissions, atmospheric, land and sea surface temperatures are rising. Global model projections have demonstrated that temperature and rainfall changes throughout Africa, increased frequency of storms and sea-level rise in sub-tropical Oceans, will expose current vulnerabilities of coastal (and other) cities, whilst also potentially heightening risks associated with food security and water resources. Global Climate Model projections of change are presented and discussed in ‘the baseline climate report for southern African countries including: Namibia, South Africa, Mozambique, Tanzania and Mauritius.1 This report shows the results from applying a downscaling methodology developed at the University of Cape Town to nine GCMs and the observed rainfall and temperature data from stations near Walvis Bay. The downscaling relates daily weather systems to the observed rainfall and temperature at each location on each day (to a point-scale). Projections are described as being manifested as certain impacts, depending on the region, amongst
others;
changes in rainfall and precipitation patterns (flooding and drought),
increases in temperature and associated desiccation effects,
increasing frequency and intensity of storm surges or extreme events,
increasing average global sea levels due to melting glaciers and thermal expansion (permanent and
non-permanent inundation) and,
changes in wind speed.
This report will outline impacts and vulnerabilities that the available model results typically imply for Cape Town, whilst also discussing constraints and the limitations of the current methods. It must be noted that sea-level rise is NOT presented here, as it does not feature in downscaled projections and has been dealt with in more detail elsewhere2.
1 Tadross and Johnston, 2011. Projected Climate Change Over Southern Africa; Namibia, South Africa, Mozambique,
Tanzania and Mauritius, Report for ICLEI, February 2011 2 Brundrit, G B (1995). Trends of southern African sea level: statistical analysis and interpretation. South African Journal of Marine
Science 16: 9-17.

ICLEI – Local Governments for Sustainability – Africa Climate Change Projections for Cape Town: Adding value through downscaling
Sub-Saharan African Cities: A Five-City Network to Pioneer Climate Adaptation through participatory
Research and Local Action. 5
1 Historical observations and trends from Cape Town Historical observations of the recent past from weather stations in the vicinity of Cape Town are required in order to understand the current climate context of the city. They also assist in the determination and identification of any historical trends in climate that may be associated with anthropogenic climate change. For this study local rainfall and temperature data from Cape Town were made available through a database held at the University of Cape Town; these data were also used to produce downscaled estimates of changes in rainfall and temperature under anthropogenic climate change. Several stations were available in the vicinity of Cape Town and of these the SA Astronomical Observatory has the longest record, including data for the last 10 years. Figure 1 shows the location of the Observatory data which is used throughout this report.
Figure 1: Location of SA Astronomical Observatory
1.1 Climate of Cape Town The city experiences a Mediterranean climate, with an average rainfall of between 560 and 1400 mm around the Cape Peninsula’s mountains. Summer temperatures peak in February with a monthly average maximum of 26.9oC. Winter averages are lowest in July with an average maximum of 17.7oC and minimum

ICLEI – Local Governments for Sustainability – Africa Climate Change Projections for Cape Town: Adding value through downscaling
Sub-Saharan African Cities: A Five-City Network to Pioneer Climate Adaptation through participatory
Research and Local Action. 6
of 9.1oC. Extremes vary between 42oC in summer and 1oC in winter. Daily rainfall and temperature data were available for the Observatory station between 1850 and 2010, though temperature data was only available for the 1960-2010 period (with missing data 1978-1988). The Priestly-Taylor method was used to calculate reference evapotranspiration3 (ET0) based on simulated temperatures, solar radiation and altitude. Figure 2 shows the daily climatology (average over all years) of rainfall, temperature and reference evapotranspiration at Cape Town. Rainfall falls during winter between April and September, when temperatures and evapotranspiration are at a minimum. During summer (November to March) ET0 is significantly higher than rainfall.
3 Reference evapotranspiration (ETo) indicates the amount of water that would be lost due to evaporation and
transpiration if it were available. If ET is higher than rainfall it means that the soil and vegetation will dry out.

ICLEI – Local Governments for Sustainability – Africa Climate Change Projections for Cape Town: Adding value through downscaling
Sub-Saharan African Cities: A Five-City Network to Pioneer Climate Adaptation through participatory
Research and Local Action. 7
Figure 2: Daily climatology of rainfall (mm day-1) and reference evapotranspiration (mm day-1) (top) at Cape Town and minimum and maximum temperatures (°C) (bottom).
1.2 Historical trends in climate at Cape Town Any data collected at a weather station must undergo quality control procedures. Such quality control procedures are generally flexible and there are no hard and fast guidelines as to what should be implemented. For example, complex statistical techniques that detect discontinuities in time-series (usually

ICLEI – Local Governments for Sustainability – Africa Climate Change Projections for Cape Town: Adding value through downscaling
Sub-Saharan African Cities: A Five-City Network to Pioneer Climate Adaptation through participatory
Research and Local Action. 8
indicating the relocation or deterioration of a sensor) can be used with historical data, though these do not work as well for rainfall data, which is more discrete in nature. In this analysis it was decided to use the following simple tests and data was removed if it failed any of them:
check for duplicate or missing records;
check for negative rainfall (an impossibility in reality);
check for rainfall > 500 mm in one day (also impossible);
remove data more than 6 standard deviations from the mean (this would indicate an error in reading);
remove data where minimum temperatures are greater than maximum temperatures (non-sensical).
The remaining data was then used to calculate extreme temperatures and rainfall indices, both on an annual and seasonal basis utilising software distributed by the ETCCDMI4 and STARDEX5 projects. Increasing temperature trends are detectable in a number of temperature indices with the most significant (at the 90% confidence level) for increasing minimum temperatures. Figure 4 shows the trend in annual average daily maximum and minimum temperatures, both of which show statistically significant increases since 1960. These trends result in statistically significant increases in average temperature and are present during all seasons.
4 http://cccma.seos.uvic.ca/ETCCDMI/software.shtml
5 http://www.cru.uea.ac.uk/projects/stardex/

ICLEI – Local Governments for Sustainability – Africa Climate Change Projections for Cape Town: Adding value through downscaling
Sub-Saharan African Cities: A Five-City Network to Pioneer Climate Adaptation through participatory
Research and Local Action. 9
a)
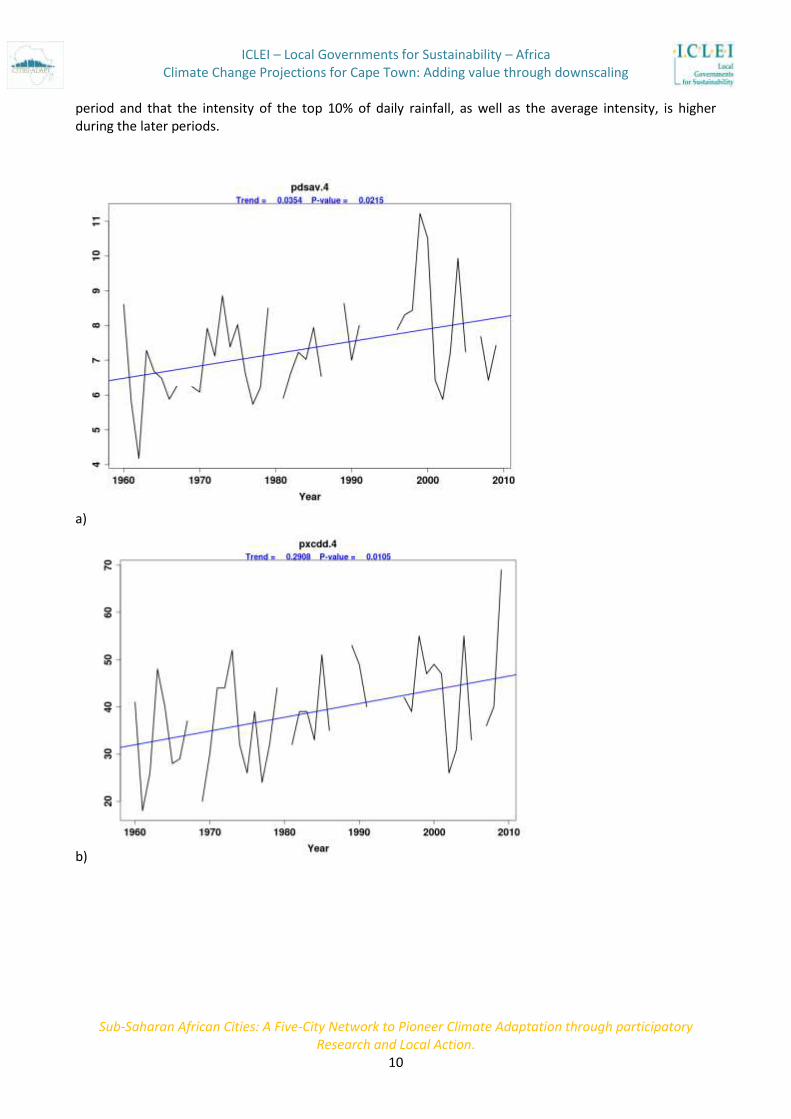
b) Figure 4: Trends in annual average daily minimum (a) and maximum (b) temperatures at Cape Town. Figure 5 shows the annual trends in average dry spell length, maximum number of consecutive dry days, average rainfall intensity and frequency with which the 90th percentile rainfall event is exceeded. It can be seen that all trends are significantly positive, indicating that dry spells are longer on average in the later
ICLEI – Local Governments for Sustainability – Africa Climate Change Projections for Cape Town: Adding value through downscaling
Sub-Saharan African Cities: A Five-City Network to Pioneer Climate Adaptation through participatory
Research and Local Action. 10
period and that the intensity of the top 10% of daily rainfall, as well as the average intensity, is higher during the later periods.
a)
b)

ICLEI – Local Governments for Sustainability – Africa Climate Change Projections for Cape Town: Adding value through downscaling
Sub-Saharan African Cities: A Five-City Network to Pioneer Climate Adaptation through participatory
Research and Local Action. 11
c)
(d) Figure 5: Trends in annual average (a) dry spell length, (b) maximum number of consecutive dry days, (c) average rainfall intensity (mm day-1) and (d) frequency of exceeding the long term (1960-1990) 90th percentile daily rainfall event.

ICLEI – Local Governments for Sustainability – Africa Climate Change Projections for Cape Town: Adding value through downscaling
Sub-Saharan African Cities: A Five-City Network to Pioneer Climate Adaptation through participatory
Research and Local Action. 12
2 GCM projections of future change (for 2050) GCM projections of change were presented in the baseline climate report for southern Africa6 and are shown here with a focus on the region around Cape Town.
2.1 Rainfall Figure 6 demonstrates how rainfall is expected to change under both a B1 and A27 emissions scenario; for each season both the median8 change (15/13 GCMs for the A2/B1 scenario) and percentage of models agreeing on the sign of the change is shown. The median of the models (i.e. the most common outcome) suggests the most likely change for each period, whereas the percentage of models can be taken as an indication of the confidence in whether a positive or negative change is consistently simulated across the GCM models (values less than 50% suggest most models are simulating a negative change, whereas greater than 50% suggest most models simulate a positive change). If one seeks consistency across GCM models (which could be defined as more than 60% of models agreeing on the sign of change) as well as consistency across both the A2 and B1 scenario, then decreases in rainfall are suggested all year round with the greatest changes during the main rainfall season in JJA. During the December-February median changes are small, with consistent model simulations tending towards the western regions over the ocean.
December-February March-May
6 Tadross and Johnston 2011, Projected Climate Change Over Southern Africa; Namibia, South Africa, Mozambique,
Tanzania and Mauritius, Report for ICLEI, February 2011 7 Emissions Scenarios were constructed to explore future developments in the global environment with special
reference to the production of greenhouse gases and aerosol precursor emissions. The A2 scenario family describes a very heterogeneous world. The underlying theme is self-reliance and preservation of local identities. The B1 scenario family describes a convergent world with the emphasis on global solutions to economic, social, and environmental sustainability, including improved equity, but without additional climate initiatives. 8 The median is the midpoint of a frequency distribution of observed values, sometimes reflected as the most
common result.

ICLEI – Local Governments for Sustainability – Africa Climate Change Projections for Cape Town: Adding value through downscaling
Sub-Saharan African Cities: A Five-City Network to Pioneer Climate Adaptation through participatory
Research and Local Action. 13
June-August September-November

ICLEI – Local Governments for Sustainability – Africa Climate Change Projections for Cape Town: Adding value through downscaling
Sub-Saharan African Cities: A Five-City Network to Pioneer Climate Adaptation through participatory
Research and Local Action. 14
Figure 6: Median GCM simulations of rainfall change in mm per month by 2050 under A2 and B1 emissions scenarios for each season. The confidence of the model ensemble simulations is indicated by the percentage of models simulating a positive change.
2.2 Temperature All GCMs simulate an increase in temperature which results in the median changes shown in figure 7 for both scenarios and all four seasons. Increases are similar for each season depending on the scenario; 1.0-1.5°C for the B1 scenario and 1.25-2.0°C for the A2 scenario in the region of Cape Town. Increases inland are significantly more than towards the coast, due to the moderating influence of the surrounding sea. These are median changes and incorporate a range of projected increases, all positive, in each case.

ICLEI – Local Governments for Sustainability – Africa Climate Change Projections for Cape Town: Adding value through downscaling
Sub-Saharan African Cities: A Five-City Network to Pioneer Climate Adaptation through participatory
Research and Local Action. 15
December-February March-May
June-August September-November
Figure 7: Median GCM simulations of change by 2050 under A2 and B1 emissions scenarios for each season.
2.3 Winds Figure 8 shows the median changes in surface (actually 10m above the surface) winds simulated under an A2 scenario; arrows show the direction9 and magnitude of change, red shading indicates that median wind speed increases whereas blue shading indicates that wind speeds decrease. Wind vectors tend to come more from the southeast during all seasons, which increases the wind speeds during all seasons, except JJA when the dominant flow is normally from the west and reflects the northward position of the winter storm tracks. These changes reflect a strengthening of the anticyclonic atmospheric circulation over the southern Atlantic Ocean, particularly during winter and early spring, as depicted in the IPCC 4th assessment report10 and which is partly responsible for a southward retreat of the mid-latitude storm tracks (hence the decrease in winter rainfall noted earlier). The implications of increased wind strength during Sept-May must be considered in terms of any existing vulnerabilities that Cape Town may face. The impact on harbour activity and wave action on the coastline must be also assessed in terms of this projection. December-February March-May
9 Arrows indicate the movement of the wind – e.g.an arrow pointing south indicates a wind coming from the north.
10 IPCC, 2007. IPCC Fourth Assessment Report (AR4) [online]: Available: http://www.ipcc.ch/

ICLEI – Local Governments for Sustainability – Africa Climate Change Projections for Cape Town: Adding value through downscaling
Sub-Saharan African Cities: A Five-City Network to Pioneer Climate Adaptation through participatory
Research and Local Action. 16
June-August September-November
Figure 8: Median changes in 10m wind directions simulated under an A2 emissions scenario; shading indicates changes in wind speed in (m/s).
3 Statistically downscaled projection of future changes in rainfall,
temperature and evaporation The following sections show the results from applying a downscaling methodology developed at the University of Cape Town to nine suitable GCMs11 (forced with the A2 emissions scenario) and the observed rainfall and temperature data from the Cape Town station. The downscaling relates daily weather systems to the observed rainfall and temperature at each location on each day. Taking the simulated changes in daily weather systems from each GCM we can then simulate the expected changes in daily rainfall and temperature at each location. We use the Priestly-Taylor method to calculate reference evapotranspiration (ET0) based on simulated temperatures, solar radiation and altitude.
11
The suitability of GCMs depends on the frequency of data and the type of variable

ICLEI – Local Governments for Sustainability – Africa Climate Change Projections for Cape Town: Adding value through downscaling
Sub-Saharan African Cities: A Five-City Network to Pioneer Climate Adaptation through participatory
Research and Local Action. 17
3.1 Rainfall Figure 9 below compares the downscaled GCM control climates12 (1961-2000) with the observed climate for Cape Town. The GCM control climates are close to the observed climate (black line), replicating the observed seasonal cycle and peak rainfall during June. This gives us confidence that the downscaling methodology applied to these GCMs is simulating the local climates correctly, though it is worth noting that the downscaled climates tend to underestimate the observed rainfall and shift the peak rainfall month later.
Figure 8: GCM downscaled control rainfall climates (mm per day), for the period 1961-2000 at Cape Town. Black line is observed climate and coloured lines are downscaled GCM climates. Figure 10 presents the simulated changes (or anomalies13) in rainfall for Cape Town. The shaded regions indicate the spread between the different downscaled GCMs (between 10th and 90th percentiles) and the solid lines the median downscaled response. The solid lines indicate the median of the downscaled models and the shaded regions the spread between the different downscaled GCMs. Green colouring is for the change simulated for the 2046-2065 period and blue for the 2081-2100 period (all relative to the control period of 1961-2000). The median of the models suggest an increase in rainfall during June for the 2046-2065 period but a decrease for other months and the 2081-2100 period. There is significant spread
12
A Control climate is the current climate as determined by the model – the degree of difference between the control and the observed climate gives an indication of the skill of the model 13
An anomaly is the difference between the current climate and a future climate as projected by a model.

ICLEI – Local Governments for Sustainability – Africa Climate Change Projections for Cape Town: Adding value through downscaling
Sub-Saharan African Cities: A Five-City Network to Pioneer Climate Adaptation through participatory
Research and Local Action. 18
between the 10th and 90th percentile models, particularly during the rainfall months. On the whole, though, these changes are not dissimilar to the suggested changes simulated by the GCMs earlier. The implications of this are discussed in 3.3.
Figure 10: Downscaled rainfall anomalies (mm day-1) for the 2046-2065 period (green) and 2081-2100 period (blue). Shading indicates model spread (10th to 90th percentile change) and solid lines the median model response.
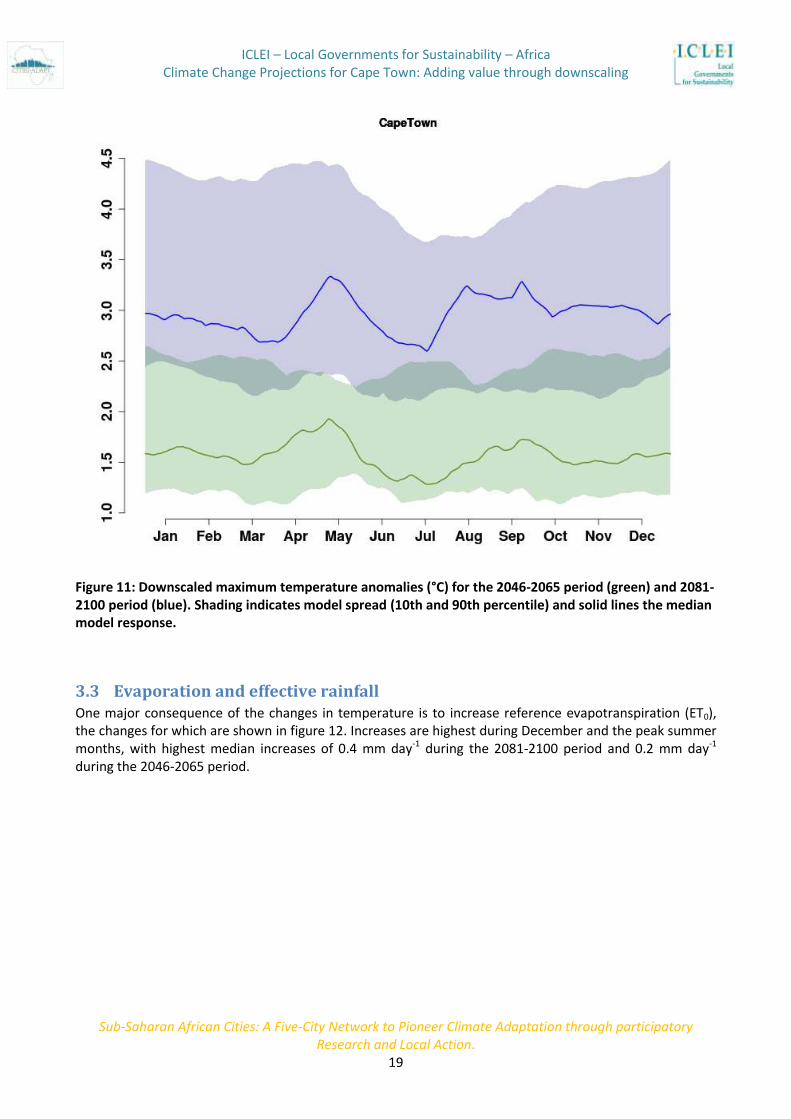
3.2 Temperature The downscaled changes in temperature are similar to those from the GCMs presented earlier and are similar for both minimum and maximum temperatures. Maximum temperature changes are shown in figure 11. Increases are similar during all months, with median changes for the 2081-2100 period as high as 3.4°C and changes for the 2046-2065 period peaking at 1.9°C during May. The implications of this are discussed in 3.3.
ICLEI – Local Governments for Sustainability – Africa Climate Change Projections for Cape Town: Adding value through downscaling
Sub-Saharan African Cities: A Five-City Network to Pioneer Climate Adaptation through participatory
Research and Local Action. 19
Figure 11: Downscaled maximum temperature anomalies (°C) for the 2046-2065 period (green) and 2081-2100 period (blue). Shading indicates model spread (10th and 90th percentile) and solid lines the median model response.
3.3 Evaporation and effective rainfall One major consequence of the changes in temperature is to increase reference evapotranspiration (ET0), the changes for which are shown in figure 12. Increases are highest during December and the peak summer months, with highest median increases of 0.4 mm day-1 during the 2081-2100 period and 0.2 mm day-1 during the 2046-2065 period.

ICLEI – Local Governments for Sustainability – Africa Climate Change Projections for Cape Town: Adding value through downscaling
Sub-Saharan African Cities: A Five-City Network to Pioneer Climate Adaptation through participatory
Research and Local Action. 20
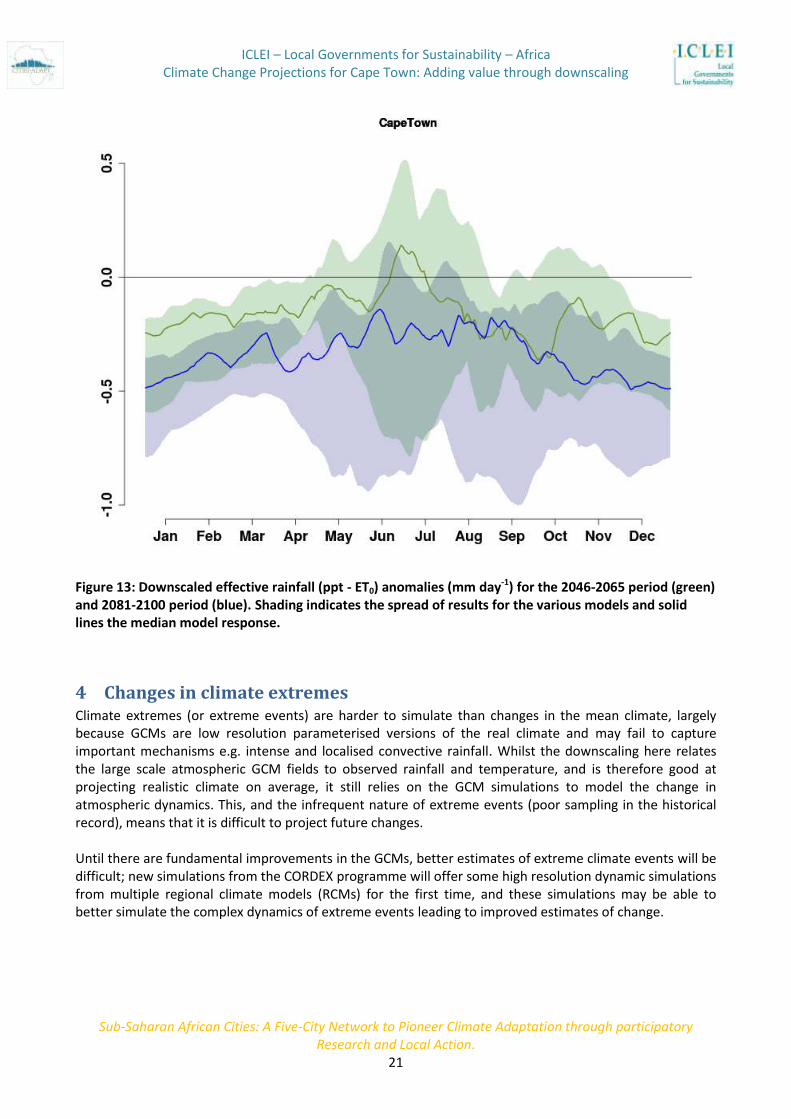
Figure 12: Downscaled reference evapotranspiration (ET0) anomalies (mm day-1) for the 2046-2065 period (green) and 2081-2100 period (blue). Shading indicates model spread and solid lines the median model response. One consequence of these increases in ET0 is that effective rainfall (rainfall – evaporation) becomes less, even without a decrease in rainfall. Assuming that evaporation occurs at the reference level (typical of a surface covered in short grass– for hard surfaces evapotranspiration is meaningless), figure 13 shows the change in effective rainfall. Comparing with figure 10, it can be seen that the change in evaporation results in reductions of effective rainfall in nearly all simulations and all months, with the exception of the earlier 2046-2065 period during the peak of the winter rainfall season. This implies less surface water available for dams, plants and agriculture at most times of the year, except potentially during the peak of the rainfall season in the mid-century period.
ICLEI – Local Governments for Sustainability – Africa Climate Change Projections for Cape Town: Adding value through downscaling
Sub-Saharan African Cities: A Five-City Network to Pioneer Climate Adaptation through participatory
Research and Local Action. 21
Figure 13: Downscaled effective rainfall (ppt - ET0) anomalies (mm day-1) for the 2046-2065 period (green) and 2081-2100 period (blue). Shading indicates the spread of results for the various models and solid lines the median model response.
4 Changes in climate extremes Climate extremes (or extreme events) are harder to simulate than changes in the mean climate, largely because GCMs are low resolution parameterised versions of the real climate and may fail to capture important mechanisms e.g. intense and localised convective rainfall. Whilst the downscaling here relates the large scale atmospheric GCM fields to observed rainfall and temperature, and is therefore good at projecting realistic climate on average, it still relies on the GCM simulations to model the change in atmospheric dynamics. This, and the infrequent nature of extreme events (poor sampling in the historical record), means that it is difficult to project future changes. Until there are fundamental improvements in the GCMs, better estimates of extreme climate events will be difficult; new simulations from the CORDEX programme will offer some high resolution dynamic simulations from multiple regional climate models (RCMs) for the first time, and these simulations may be able to better simulate the complex dynamics of extreme events leading to improved estimates of change.

ICLEI – Local Governments for Sustainability – Africa Climate Change Projections for Cape Town: Adding value through downscaling
Sub-Saharan African Cities: A Five-City Network to Pioneer Climate Adaptation through participatory
Research and Local Action. 22
4.1 Changes in extreme temperatures Changes in extreme temperatures are likely to rise in all simulations from GCMs and the statistical downscaling used here. Figure 14 indicates the cumulative probability of exceeding different maximum daily temperatures for different periods at Cape Town under an assumed A2 emissions scenario. The risk of exceeding high values (e.g. 35°C) is higher during future periods, though this might be an underestimate given that the GCM control climates slightly underestimate the observed exceedances. The table below shows the probability of exceeding several temperatures for Cape Town, as well as for each period.
Temperature threshold
Probability of exceeding the given temperature under present climate (1960-2000)
Probability of exceeding the given temperature under future climate (2046-2065)
Probability of exceeding the given temperature under future climate (2081-2100)
30°C 5% 11% 19%
32°C 2% 5% 9%
35°C 0% 1% 3%
As a rough rule one can therefore expect the frequency of days exceeding these different thresholds to more than double by 2055 (e.g. for 32 degrees, from 2% occurrence to 5 % occurrence) and approximately quadruple by 2090 (e.g. from 2% to 9%) under the A2 emissions scenario.

ICLEI – Local Governments for Sustainability – Africa Climate Change Projections for Cape Town: Adding value through downscaling
Sub-Saharan African Cities: A Five-City Network to Pioneer Climate Adaptation through participatory
Research and Local Action. 23
Figure 14: Cumulative probability of exceeding maximum temperatures under current (black), downscaled control (orange), downscaled 2046-2065 (green) and downscaled 2081-2100 (blue) periods at Cape Town. One improvement on these estimates of change for the future would be to downscale using a higher resolution RCM which would be better able to resolve graded temperature changes in regions of steep topography, something that the GCMs and statistical downscaling used here is not able to do. The multiple RCM simulations generated as part of the CORDEX programme could be used in this regard.
4.2 Changes in extreme rainfall Changes in extreme rainfall are, at least partly, difficult to estimate due to the problems in simulating extreme atmospheric conditions mentioned earlier. Additionally the statistical downscaling technique used here can only simulate daily rainfall values seen in the historical record. This means that it may underestimate increases in rainfall due to increases in intensity, especially at the extreme tail of the distribution. Given that increases in intensity are possible in a hotter climate with more moisture for rainfall, this is a shortcoming of the downscaling methodology employed here. Using RCMs (which are not restricted by such limits) is currently not an option as there are not enough RCM simulations for multiple GCMs available for the region (in order to construct envelopes of change and assess the probability/risk of particular changes). Again this may change when the CORDEX data becomes available.
5 Cape Town: impacts and vulnerabilities Cape Town is situated in the south-west of the Western Cape Province of South Africa. The city’s topography varies dramatically from low lying sandy coastal plains (Cape Flats) to Table Mountain standing over 1000m above sea level (in the centre of the city). The geographic area of the city is approximately 2500 km2, with an estimated 3.15 million people living within its boundaries, and an annual population growth rate of about 3.5%. Global climate modelling suggests that there will be significant climate change impacts in South Africa, and in the Western Cape Province specifically14. These impacts include general warming, disruption of established rainfall patterns and an increase in the frequency of extreme weather events affecting a wide variety of sectors. Cape Town, the largest city in the Western Cape, draws much income from tourism and enjoys significant economic growth, but in common with other major urban centres of the global South, is faced with serious socio-economic challenges15. In the city, a significant number of past disasters and events have been associated with weather conditions, and the city is at risk from the projected impacts of climate-induced warming and changes in rainfall variability16. Thus there is an imperative for the city to include climate change and its potential impacts into policy-making and planning, in order to reduce the vulnerability of its communities and infrastructure to the predicted impacts of climate change.
14
Hewitson, B.C. (2005), in Western Cape Report: A Status Quo, Vulnerability and Adaptation Assessment of the Physical and Socio-Economic Effects of Climate. Midgley, G., A. Chapman, B. Hewitson, P Johnston, M. De Wit, G. Ziervogel, P. Mukheiber, L. Van Niekerk, M. Tadross, B. Van Wilgen, B. Kgope, P. Morant, A. Theron, R. Scholes, and G. Forsyth. 15
Ziervogel, G., M. Shale and M. Du (2010) Climate change adaptation in a developing country context: the case of urban water supply in Cape Town. Climate and Development 2.2, 94 – 110. 16
Mukheibir, P., and G. Ziervogel (2007) Developing a Municipal Adaptation Plan (MAP) for climate change: the city of Cape Town. Environment and Urbanization 19.1, 143 - 58.

ICLEI – Local Governments for Sustainability – Africa Climate Change Projections for Cape Town: Adding value through downscaling
Sub-Saharan African Cities: A Five-City Network to Pioneer Climate Adaptation through participatory
Research and Local Action. 24
Since the city experiences a Mediterranean climate, wet winters accumulate almost all the rainfall required to sustain the dry, warm summers. Decreased rainfall accompanied with increased temperatures could lead to severe water shortages in a region which is already prone to frequent droughts. Since 1985, there have been nine winters with total rainfall below 70% of average (an average of more than one in every three years). The region also experiences a very low rainfall to runoff conversion (3.1%)17. Although Cape Town experiences relatively high precipitation for the sub-region, inter-basin transfer schemes have been necessary to satisfy the growth in urban and agricultural water demand in and around the metropolitan area. Water resource planning and design has conventionally assumed a stationary mean climate. Climate change invalidates this assumption, and places additional uncertainty on projections of river discharge and water supply, as well as on water demand. Climate change will affect both agricultural and domestic demand. Crops would require more water if temperature and potential evapotranspiration were to increase18. A third potential impact is that of sea-level rise. Increased temperatures worldwide are causing both land-based ice to melt and thermal expansion of sea water. Sea levels are predicted to rise by between 200-900 mm by 210019. As many of Cape Town’s industrial, commercial and residential areas lie below 10m above sea-level, any sea-level rise will increase the vulnerability of beaches, shorelines and coastal developments and infrastructure to storm surges and erosion. The sectors most exposed and vulnerable to these threats are determined by their exposure to the impacts and the likely magnitude of the impact. The agricultural sector, located around Cape Town, is clearly very vulnerable to both increased heat (which is likely to affect the deciduous fruit and wine industry), and the reduced rainfall (which will affect rain-fed crops such as wheat and rye)18. The exposure of this sector will have knock-on effects on the city in terms of employment, food security and economic opportunities. The water sector includes supply, treatment and disposal of water for residential, commercial and industrial use in Cape Town. The vulnerability of the supply is obviously affected by both increased temperature and reduced rainfall, but even if rainfall does not decrease the impact of evaporation will stress water resources. All of the city’s water is supplied by a system of five storage dams outside the metropolitan region. Increased sea level rise also threatens certain waste treatment plants. The housing sector is one where significant growth has been experienced in Cape Town, and is expected to continue in the future. Finding suitable land that is not currently agricultural or situated in flood-prone areas or wetlands is a constant challenge. While, ostensibly, a reduced rainfall scenario may lead to a reduction of flooding, early studies show that rainfall intensity has been increasing, thus increasing the vulnerability of dense housing, especially that constituted by informal structures. The required growth in this sector (to cope with increasing in-migration) will also increase stress on the water availability for the city. It must be noted that the downscaling study in the report does not add any further insight into the already identified vulnerability of sea-level rise. In this report the most significant impact is found to be decreases in the amount of effective rainfall, (with possible increases in rainfall intensity), with increase in temperature and a higher frequency of very hot days.
17
Ashton, P. and B. Haasbroek (2002) Water demand management and social adaptive capacity: a South African case study. In A. Turton and R. Henwood (eds.), Hydropolitics in the developing world: a South African perspective. African Water Issues Research Unit, Pretoria, South Africa. 18
Johnston P.A., D.B. Louw, O Crespo. and T.G.Lumsden, (2008), Quantifying the costs, benefits and risks associated with planning and management alternatives associated with climate risk for water resource development – the Berg River Catchment Area Case Study (South Africa) - Moving best samples into good practice in Petermann T 2008, Towards Climate Change Adaptation, InWent, Germany 19
IPCC, 2007. IPCC Fourth Assessment Report (AR4) [online]: Available: http://www.ipcc.ch/

ICLEI – Local Governments for Sustainability – Africa Climate Change Projections for Cape Town: Adding value through downscaling
Sub-Saharan African Cities: A Five-City Network to Pioneer Climate Adaptation through participatory
Research and Local Action. 25
These impacts may increase or decrease specific threats and vulnerabilities to specific local government sectors which were identified in the baseline report20 . The risks and impacts upon sectors such as water and sanitation, energy, transport and health ultimately and inherently affect livelihoods. The risks are summarised in the tables below, and risks that are most expected to increase in the future are highlighted in yellow.
5.1 Water and Sanitation
Impacts upon Water and Sanitation
Evaporation is anticipated to alter the availability of fresh water resource, groundwater and aquifers thus affecting water supply available for drinking and irrigation purposes and thus food security.
Increase pressure and demand for water for drinking and for irrigation purposes.
Increase the range and or distribution of waterborne diseases such as cholera or malaria that could result in severe pressure on sanitation and the health sector.
Impacts on aquatic ecosystem and water quality.
Algal blooms are likely to become more frequent and start occurring in bulk water storage facilities.
The waste water treatment facilities are likely to experience some infrastructure heave and subsidence with changes in soil moisture contents.
Reduced water availability of water from aquifers.
Increased temperatures, associated evaporation rates and the anticipated drying effects are likely to impact the storm water sector by:
o Changing base or low and peak river flow that may result in the reduced health of the waterways. o Increasing erosion and sand particles being blown in the system – exacerbating present blockage problems.
5.2 Transport Impacts upon Transport
Exacerbate air pollution caused by the transport sector
In the short term, minimal impacts on pavements and structural design are anticipated. In longer terms, higher temperatures may have significant impacts such as rutting on bridges, roads and tail buckling.
Thermal expansion in excess of current designs of transport infrastructure and could therefore lead to damage of infrastructure, increasing safety risks and the need for maintenance operations and upgrades / new designs.
It is probable that construction rates will be impacted upon by increasing temperatures i.e. concrete strength, which is affected by the temperature with which it cures.
Increased need for the use of energy for cooling during the transportation of fresh good and the comfort of passengers in public transport.
5.3 Health
Impacts upon Health (see also water above)
An increase in the frequency and duration of severe heat waves and humid conditions during summer is likely to increase morbidity and mortality particularly in the young, elderly and sick.
Increased geographical distribution of vectors; food and waterborne disease (i.e. malaria, dengue fever, cholera)
5.4 Energy Impacts upon Energy
Increasing the use of energy for cooling in homes, businesses and other buildings and during the transportation of fresh good
20
Priscilla Rowswell and Lucinda Fairhurst (2011) Sub-Saharan African Cities: A five-City Network to Pioneer Climate Adaptation through Participatory Research & Local Action Draft Baseline Study (February 2011)

ICLEI – Local Governments for Sustainability – Africa Climate Change Projections for Cape Town: Adding value through downscaling
Sub-Saharan African Cities: A Five-City Network to Pioneer Climate Adaptation through participatory
Research and Local Action. 26
and the comfort of passengers in public transport.
5.5 Livelihoods Impacts upon Livelihoods
Increased temperature, in association of dryer conditions and wind, may increase the incidence of wildfire threats.
Temperature increase affects housing, i.e. in high density informal settlements may exacerbate “heat island effect” also the poor or lack of construction for passive cooling in dwellings may cause significant discomfort or deaths (health risks: i.e. stroke /dehydration).
Hotter weather may affect crop-yields, ecosystem distribution and species range. This may lead to a decline in food security and / or production may be reduced.
Food stored is likely to spoil quicker, resulting in potential hygiene risks.
Cost of keeping livestock and domestic animals may increase as the need for more water and cooling may increase.
Impacts on viability of other livelihood activities (i.e. forest and agricultural production) Increase of urban food prices as a result of increases in production costs.
The risks and impacts upon water and sanitation, transport, health, and energy as shown and highlighted above, ultimately affect human livelihoods. Local authorities need to analyse associated and projected impacts and adapt and plan accordingly to strategically build resilience. There is a need for ongoing vulnerability assessment and the development of adaptation strategies and preparedness in protecting local communities and the environment on which they depend upon for their livelihoods and well-being. It is increasingly important to gauge the value of pre-emptive adaptation strategies that increase resilience and decrease vulnerability, against the cost of damages if these measures are not put in place.