climate change interactive presentation - lacitysan.org · •climate change forecasts for los...
TRANSCRIPT

Climate Change Interactive
Presentation

• Climate change forecasts for Los Angeles
• LASAN system-wide vulnerability by climate threat
• What are other cities doing?
• One Water L.A. approach to addressing climate change
• Q&A - Your input is important!
Climate Change Interactive Presentation Agenda

Clicker Question: Have recent weather events (drought and wildfire) affected your thinking on climate change? (Yes or No)

Clicker Question: Do you know what our climate change threats are in Los Angeles? (Yes or No)

Climate Change impact forecasts vary greatly at the local level
Clicker Question: Which climate change condition have you thought about most?
a) Rainfall (extreme rainfall and/or drought)
b) Temperature
c) Sea Level Rise

7
L.A. Sanitation Compilation of Temperature Variability and Trends
CLIMATE
STATION
NUMBER OF DAYS OVER 95F
2011 2012 2013 2014
Long Beach 1 5 0 12
Pierce
College/
Woodland
Hills
48 80 65 69
Santa Monica 0 2 4 2

• Annual rainfall is historically 14 to 18 inches per year. In the past few years it has averaged about 6.8 inches/year due to the drought
8
L.A. Sanitation Compilation of Temperature Variability and Trends

Sea Level Rise Trend for Los Angeles

Clicker Question: Which City’s infrastructure are you more concerned about?
a) Wastewater
b) Stormwater Drainage
c) Water Supply
d) Transportation
e) Power

Clicker Question: Which climate change impact keeps you up at night?
a) Not having enough water to drink
b) Flooded roads and homes from rain
c) Untreated wastewater in our waterways and on our beaches
d) Mud slides
e) Burned homes and infrastructure by wildfire
f) Brownouts and Blackouts

Wastewater Treatment Plants
Watershed Protection
Solid Waste
Collection System
Pumping Plants
Temperature
Sea Level Rise
Precipitation
Drought
Wildfire
Extreme Winds
Climate Threats Asset Classes
System-Wide Vulnerability

Clicker Question: How often does climate change factor into your decision making?
a) It's often a part of my decision making.
b) Infrequently.
c) I'll be gone before it matters.
d) I let somebody else worry about it.

• Goal • Develop resilient water infrastructure in the face of a
changing climate
• Objectives: • Apply climate change science to engineering
• Integrate assessment of climate change impacts to the City’s existing and planned Wastewater and Stormwater infrastructure
• Develop adaptation strategies for consideration in OWLA Plan (using EPA's Climate Resilience Evaluation & Awareness Tool)
• Provide specific measures that could be incorporated into Wastewater and Stormwater Facility Plans
One Water L.A. Goals and Objectives

EPA Climate Ready Water Utilities: https://www.epa.gov/crwu
EPA's Climate Resilience Evaluation & Awareness Tool (CREAT)

Evaluate Risk via Threat-Asset Pairing
Quantity Benefits of Risk Reduction
CREAT Risk Assessments
16

Climate Awareness
Understand how climate change
affects your utility
Scenario Development
Understand your utility’s risk
Asset Screening
Determine value & vulnerability of
assets
Adaptation Planning
Design plans and determine budgets
Risk Assessment
Evaluate options and create plans
17
EPA's Nationally Recognized CREAT Process
Source: EPA CREAT

• Average maximum temperatures to increase 3-6°F by 2050 (Cal-Adapt, 2016; Hall, 2012 )
• Increased frequency > 95°F temperature from 6 to 22 days/year by 2050 (EPA, 2016)
Temperature
• Sea level rise in Los Angeles of 0.1-0.6 m (0.3-2 ft.) by 2050 (EPA, 2016; NRC, 2012; Grifman et al., 2013)
• Storm surge may cause an additional 5ft. of sea level rise (EPA, 2016)
Sea Level Rise
• Fewer, but heavier events (Hatfield et al., 2014)
• 100-year local storm intensity of 5-7.5 in. in 24 hrs increasing to projected 7-9.5 in. in 24 hrs (EPA, 2016)
Precipitation
• Increasing intensity of drought conditions
• Increasing frequency and duration of dry weather conditions (National Drought Mitigation Center, 2016)
Drought
• More frequent and intense wildfires due to persistent heat
• Increase of annual wildfires by 20% by 2085 (Cal-Adapt/UC Merced, 2016)
Wildfire
Climatic Threats for Los Angeles

Basic Climate Conditions
Increasing Average Annual Temperature
High Winds
Precipitation
Sea Level Rising
Earthquake
Tsunami
Threats To Assets
Power Outages During Peak Demand
Severe Drought/ Water Rationing
More Frequent & Intense Wild Fires
Mudslides / Landslides
Localized Flooding/ Erosion
Coastal Flooding/High Tides/ Storm Surges
Prolonged Power Outage/ Lack of Fuel
Risks to Assets
Property/Structural/ Equipment Damage
Loss of Power
Interrupted Service and Process Operations
Emergency Fuel Depletion
Inundation/Loss of Access
Regulatory Non-Compliance
Loss of Revenue
Climatic Threats for Los Angeles

Rating Risks via Consequence Analysis

Clicker Question: What motivates you more to action? Are you a:
a) Financial Success/Security
b) Quality of Live
c) Mix of Both

22
Other Cities

Clicker Question: How Much Damage Do You Think NYC Wastewater Infrastructure Experienced during Hurricane Sandy?
a) $75M (LA Sanitation annual wastewater collections budget)
b) $500M (last El Nino damage in Los Angeles)
c) $248M (LA Sanitation annual capital improvement budget)

Storm Surge
Water Elevation at Tip of Manhattan
Hurricane Sandy in New York City Region

Flood Water Line
NHSA Adams Street STP – Flooded Pump Basement Hoboken, NJ outside NHSA Adams Street STP
Replacing flooded pumps at Nassau County’s Bay Park WWTP
Replacing flooded pumps at Adams Street STP

• NYCDEP Sustained > $100,000,000 in Damage at Pump Stations and Wastewater Treatment Plants from Sandy
• Developed Adaptation and optimization strategy for minimizing risks related to climate change
• Scenario development: Temperature, sea level, rainfall and population
• Vulnerability appraisals and adaptation plans for pilot facilities and areas
• Climate adaptation plan for wastewater systems with cost estimates $1-2 billion
New York City Department of
Environmental Protection

Based on 100-year floodplain plus 30 inches of SLR:
• All 14 treatment plants and 60% of pumping stations are at risk.
• Over $1 billion of assets are at risk if no protective measures are implemented.
• Cumulative damages could exceed $2 billion over 50 years
NYCDEP Facilities Risk of Storm Surge Inundation
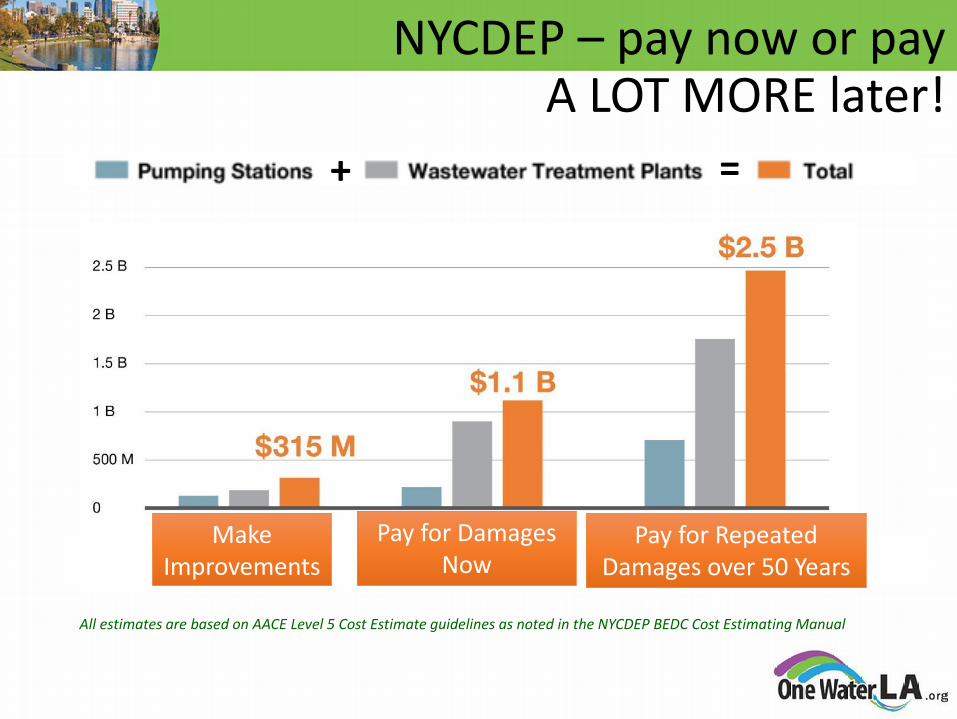
All estimates are based on AACE Level 5 Cost Estimate guidelines as noted in the NYCDEP BEDC Cost Estimating Manual
Make Improvements
Pay for Damages Now
Pay for Repeated Damages over 50 Years
+ =
NYCDEP – pay now or pay A LOT MORE later!

• Investing $315 Million in strategic fortification can safeguard $1.1 Billion of vital infrastructure.
• The investment now may save the City $2.5 Billion in emergency response costs over the next 50 years.
NYCDEP – A No-brainer Decision

Clicker Question: Would you rather?
a) Improve everything as soon as possibe
b) Make improvements gradually over time
c) Fix it each time it gets damaged

Year 2060 Rain and Storm Surge
• Historical Data Analysis on Rainfall, River Flows and Sea Levels
• Climate Change Scenario Development for Facility Planning
• Vulnerability Assessment for River Stages, Sea Level Rise and Storm Surge
• Modeled Sewer and Storm Drain System Performance with Climate Change
• Recommended Adaptation Strategies and Design Standards
Climate Change Resilience Evaluations and Recommendations for Long-term Wastewater Planning

Pump Station Risk Scoring for Worse-case
Year 2100 Sea Level Scenario with Storm Surge
0
10
20
30
40
50
60
70
80
90
100
MW
RA
Cot
tage
Far
m(M
WR
A00
1)
Sulli
van
Squa
re(2
9JPS
1)
Com
mon
wea
lth
Ave
(22I
PS1)
MW
RA
Pri
son
Poin
t(M
WR
A00
3)
Caru
so(2
9NPS
4)
Trill
ing
Way
(22M
PS2)
Publ
ic A
lley
701
(21J
PS52
6)
Sum
mer
Str
eet
(22M
PS5)
Uni
on P
ark
(21K
PS2)
MW
RA
DeL
auri
(MW
RA
002)
Sym
phon
y H
all
(21I
PS1)
Aus
tin
Stre
et
(27J
PS1)
Port
Nor
folk
(11L
PS31
6)
TOTA
L R
ISK
(0-1
00)
PUMP STATION (FACILITY ID)
Pump Station Total Risk Score for P2100 with Storm Surge (23.50 feet)
BWSC MWRA
Pump Stations with the Highest Risk Scores are Being Prioritized and Scheduled for Improvements in the Future

• Capital improvement planning and construction to:
– Improve drainage and sewer services to protect public health and safety with climate change, and during and after storm events
– Protect critical BWSC infrastructure vulnerable to flooding now and in the future
BWSC Wastewater and Storm Drainage Facilities Plan
• Update planning and design guidelines for climate change:
– Drainage design
– Sewer design
– Pump stations and other facilities

34
One Water LA Approach

Clicker Question: Do you know how to assess your climate threats in your neighborhood? (Yes or No)

Threat Analysis Flood Zones Tsunami Zones
Temescal Canyon Pumping Plant No. 634
Terminal Island Water Reclamation Plant
Temescal Canyon
Pumping Plant
TIWRP

Climate Conditions and Threats Used For EPA Pilot
EXAMPLE
LOCATIONS CLIMATE VARIABLE HISTORICAL VALUE (OBSERVED)
PROJECTED VALUE FOR MID-
CENTURY
(OBSERVED + CHANGES)
Coastal Average Annual Temperature 62.9°F 66.0°F
Total Annual Precipitation 18.5 inches 22.4 inches
100-Year Storm Event 5.4 inches in 24 hours 7.0 inches in 24 hours
Hot days (over 95 ͦF) 6 days (1981-2000) 22 days
Sea-Level Rise 2 mm/year 0.5 meters (1.64 feet)
Port of Los Angeles Average Annual Temperature 63.2°F 66.1°F
Total Annual Precipitation 13.7 inches 15.2 inches
100-Year Storm Event 7.3 inches in 24 hours 9.5 inches in 24 hours
Hot days (over 95°F) 6 days (1981-2000) 22 day
Sea-Level Rise 2 mm/year 0.5 meters (1.64 feet)
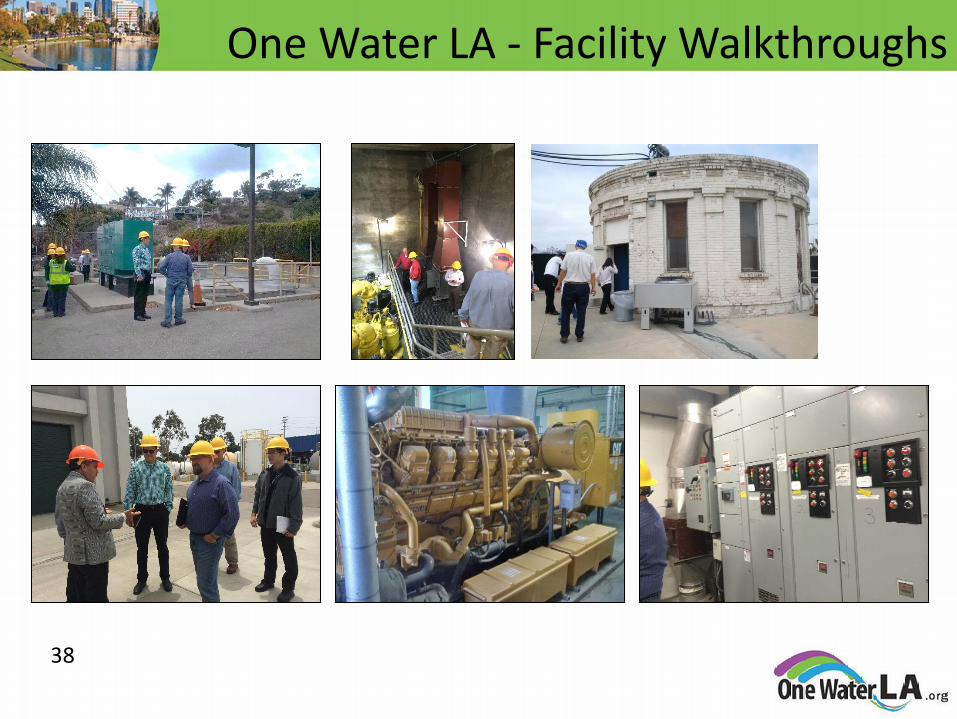
38
One Water LA - Facility Walkthroughs

39
Review of Facility Designs
Pumping Plants Terminal Island WRP

40
Example Adaptation Measures for Water Reclamation Plants
Threats Adaptations
Flooding by storm surge and tsunami with sea level rise
Waterproof individual structures
or
Build perimeter wall around facility
Climate change impacts require modifications to planning, design,
and construction approaches

Threats Adaptations
Flooding by storm surge and tsunami with sea level rise
Waterproof and protect from debris
Power loss Permanent or temporary backup generators
Landslides with heavier rainfall
Slope stabilization
Street flooding worse with heavier rainfall/higher tides
More BMPs for stormwater management w/ capture/reuse
Example Adaptation Measures for Pumping Plants
gardenscouts.com
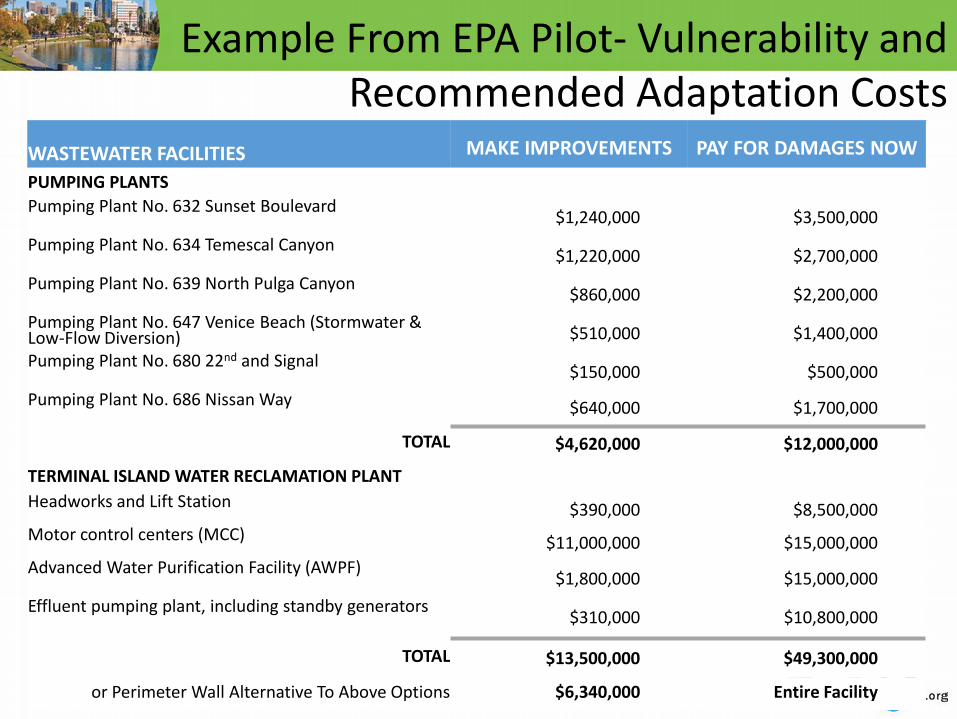
WASTEWATER FACILITIES MAKE IMPROVEMENTS PAY FOR DAMAGES NOW
PUMPING PLANTS
Pumping Plant No. 632 Sunset Boulevard $1,240,000 $3,500,000
Pumping Plant No. 634 Temescal Canyon $1,220,000 $2,700,000
Pumping Plant No. 639 North Pulga Canyon $860,000 $2,200,000
Pumping Plant No. 647 Venice Beach (Stormwater & Low-Flow Diversion) $510,000 $1,400,000
Pumping Plant No. 680 22nd and Signal $150,000 $500,000
Pumping Plant No. 686 Nissan Way $640,000 $1,700,000
TOTAL $4,620,000 $12,000,000
TERMINAL ISLAND WATER RECLAMATION PLANT
Headworks and Lift Station $390,000 $8,500,000
Motor control centers (MCC) $11,000,000 $15,000,000
Advanced Water Purification Facility (AWPF) $1,800,000 $15,000,000
Effluent pumping plant, including standby generators $310,000 $10,800,000
TOTAL $13,500,000 $49,300,000
or Perimeter Wall Alternative To Above Options $6,340,000 Entire Facility
Example From EPA Pilot- Vulnerability and Recommended Adaptation Costs
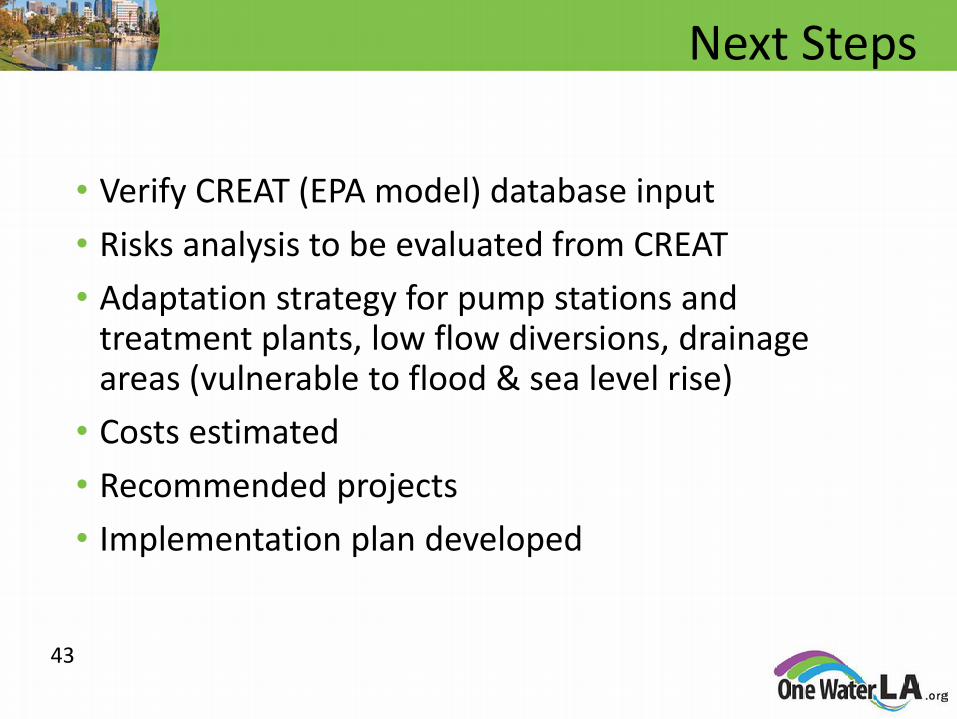
• Verify CREAT (EPA model) database input
• Risks analysis to be evaluated from CREAT
• Adaptation strategy for pump stations and treatment plants, low flow diversions, drainage areas (vulnerable to flood & sea level rise)
• Costs estimated
• Recommended projects
• Implementation plan developed
43
Next Steps

Clicker Question: What services do you think are at risk when pumping plants and water reclamation plants go out of service?
a) Having to use less water
b) Not being able to flush toilets
c) Not being able to swim and surf
d) All of the above
Clicker Question: In your opinion how long is an acceptable time for service disruptions?
a) Hours
b) Days
c) Weeks
d) Months

Clicker Question: Given what you've heard today, what water utility assets are you most concerned about functioning in L.A. in the future?
a) Drinking Water Distribution System
b) Sewer Collection System and Pumping Plants
c) Water Reclamation Plants
d) Stormwater Collection System
e) Not Sure
Clicker Question: Is spending on preparedness worth the expense despite the uncertainty in likelihood? (Yes or No)
Clicker Question: How much more would you be willing to pay for preparedness?
a) None
b) 5% more
c) 10% more
d) Whatever it takes

Clicker Question: Do you think that One Water L.A. is addressing climate change appropriately? (Yes or No)

50
Thank you! Questions?

INNOVATION + INTEGRATION + INCLUSION
= A SUSTAINABLE & RESILIENT CITY
For more updates, follow us:
Twitter.com/onewaterla
Facebook.com/onewaterla
www.onewaterla.org