climate change and energy security in brazil - world...
TRANSCRIPT

Climate Change and Energy Security in Brazil:Understanding the Impact of Climate Change on the Energy Sector
Prof. Roberto Schaeffer (with Alexandre Szklo and Andre Lucena)Energy Planning Program, COPPEFederal University of Rio de Janeiro, Brazil
World Bank Energy Week 2009

Introduction
Renewable energy represent, on one hand, an important alternative for mitigating global climate change (GCC)On the other hand, because it is strongly dependent on climate conditions, renewable energy is vulnerable to the very problem it wants avoid

Introduction
Brazil: strong dependence on renewable energy
Renewable energy responsible for 46.4% of all energy consumed in the country in 2007Hydro responsible for 85.6% of all electricity generated that same yearGross wind potential of 1.26TW, capable of generating more than 3,000TWh/yr compared to a consumption of some 450 TWh/yr as of todayEthanol responsible for 15.1% of all fuels consumed in the transportation sector, already surpassing gasoline

Impacts of GCC on the Supply and Demand of Energy in Brazil
GCC can affect the production/consumption of energy by changing:
Precipitation regimes – hydro and biofuels productionTemperature – hydro (due to higher evaporation in reservoirs and greater competition for water use), thermal electricity efficiency, biofuels production and energy demandWind regimes – wind power potential
What would be, then, the impact of GCC on the Brazilian energy system by 2035?

GCC Scenarios Utilized
IPCC A2 and B2 emission scenarios
Transformed in long term climate projections by CPTEC/INPE

Hydro - Methodology
A2 and B2 climate scenarios:Precipitation and temperature → Natural water flows to the hydro reservoirs
New group of water flow seriesMontly series for 2025-2100195 hydro plants of the Brazilian interconnected power system
Operation model of the hydro system in the country –SUISHI-O
Firm energy (guaranteed) → Capacity factorAverage energy (average generation over time)

Example for 2071-2100: A2 scenario –variation in relation to reference projections

Example for 2071-2100: B2 scenario –variation in relation to reference projections

Hydro – Results SUISHI-O
Bacia Histórico Variação em Relação ao Cenário Referência
MWmédio* A2 B2 E. Firme E. Média E. Firme E. Média E. Firme E. Média
Amazonas 9425 10628 -36% -11% -29% -7% Tocantins Araguaia 7531 10001 -46% -27% -41% -21% São Francisco 5026 5996 -69% -45% -77% -52% Parnaiba 236 293 -83% -83% -88% -82% At. Leste 496 565 -82% -80% -82% -80% At. Sudeste 1937 2268 -32% 1% -37% -10% At. Sul 1739 2037 -26% 8% -18% 11% Uruguai 1715 1996 -30% 4% -20% 9% Paraguai 375 426 -38% 4% -35% -3% Paraná 22903 29038 -8% 43% -7% 37% TOTAL 51382 63247 -31,5% 2,7% -29,3% 1,1%
Nota: Com base na configuração do sistema projetada para 2016 (EPE, 2007b). *: MWmédio indica a quantidade de energia gerada supondo o fator de capacidade médio.

Hydro – Results SUISHI-O
Histórico A2 B2 Fator de Variação Fator de Variação Fator de Subsistema Capacidade vs Ref Capacidade vs Ref Capacidade S/SE/CO <30MW 58.0% -30.7% 40.2% -31.7% 39.7% entre 30 e 300MW 48.5% -34.9% 31.6% -33.9% 32.1% >300MW 44.6% -13.2% 38.7% -11.4% 39.5% N/NE <30MW 58.0% -25.2% 43.4% -15.8% 48.8% entre 30 e 300MW 42.4% -49.4% 21.5% -45.1% 23.3% >300MW 49.6% -48.5% 25.5% -45.9% 26.8%

Wind Energy - Methodology
Wind speed projections 50x50km – number of occurrences with average annual speeds higher than 6m/s (excluding preservation and aquifer areas)Gross wind potential: wind distribution vs. power curve
Fonte: Dutra (2007)

Wind Energy - Methodology
Baseline adjustment – spatial compatibilization with the Brazilian Wind Atlas (CEPEL, 2001) and application of the average wind speed variations between the A2 and B2 scenarios projections and the baseline
Assumptions for calculating the wind potential:No assumption with regard to changes in the distribution of wind speed with respect to its averageWind technology assumed to be kept fixedNo changes in the rugosity of the terrain assumed
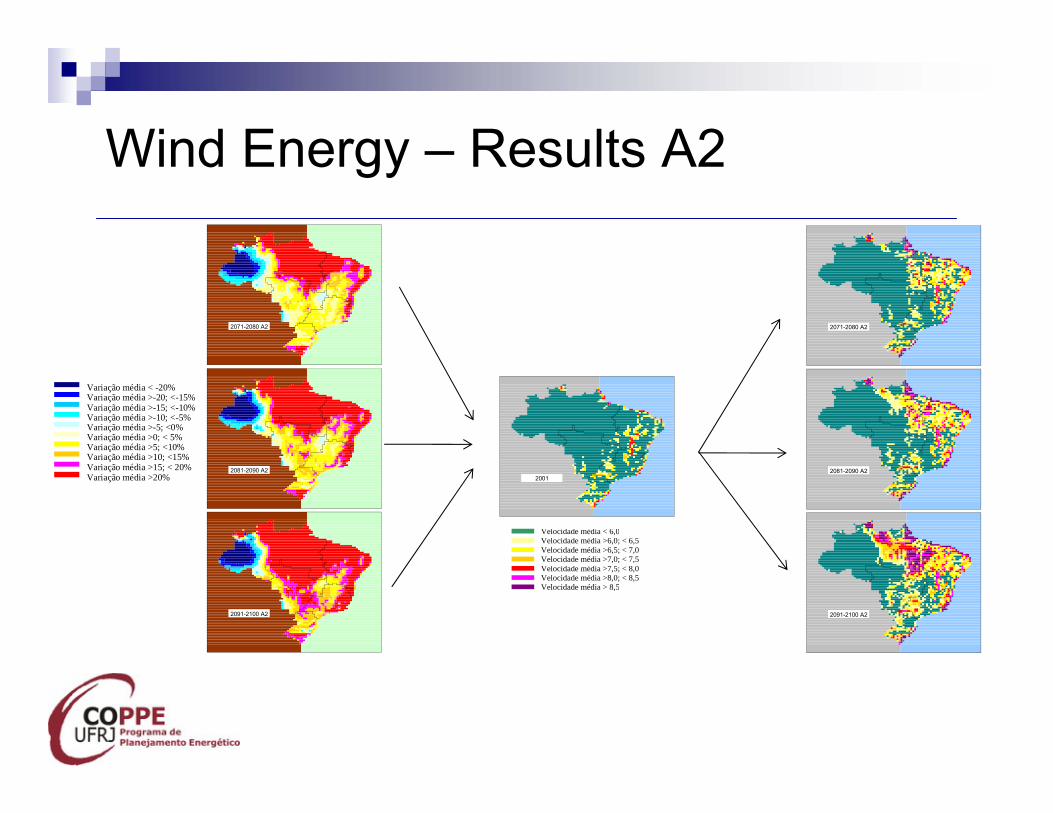
Wind Energy – Results A2
2071-2080 A2
2081-2090 A2
2091-2100 A2
2071-2080 A2
2081-2090 A2
2091-2100 A2
2001
Velocidade média > 8,5
Velocidade média >7,0; < 7,5Velocidade média >7,5; < 8,0Velocidade média >8,0; < 8,5
Velocidade média < 6,0Velocidade média >6,0; < 6,5 Velocidade média >6,5; < 7,0
Variação média < -20% Variação média >-20; <-15% Variação média >-15; <-10% Variação média >-10; <-5%Variação média >-5; <0%Variação média >0; < 5% Variação média >5; <10% Variação média >10; <15% Variação média >15; < 20% Variação média >20%

Wind Energy – Results B2
2001
Velocidade média > 8,5
Velocidade média >7,0; < 7,5Velocidade média >7,5; < 8,0Velocidade média >8,0; < 8,5
Velocidade média < 6,0Velocidade média >6,0; < 6,5 Velocidade média >6,5; < 7,0
Variação média < -20% Variação média >-20; <-15% Variação média >-15; <-10% Variação média >-10; <-5%Variação média >-5; <0%Variação média >0; < 5% Variação média >5; <10% Variação média >10; <15% Variação média >15; < 20% Variação média >20%
2071-2080 B2
2081-2090 B2
2091-2100 B2
2071-2080 B2
2081-2090 B2
2091-2100 B2

Wind Energy - Results
Average wind speeds increase substantially in the coastal areas in general and in the North/Northeast regions in particular in both scenarios, mainly in the A2 scenarioAverage capacity factors by region and in Brazil as a whole increase as a function of a greater relative share of high speed windsAs a result wind energy presents an even greater opportunity in the future

Thermal Power - Methodology
Impact on the thermodynamic efficiency of natural gas turbines
94.0%
95.0%
96.0%
97.0%
98.0%
99.0%
100.0%
101.0%
102.0%
103.0%
0 2 4 6 8 10 12 14 16 18 20 22 24 26 28 30 32 34 36 38 40 42 44
Proportion of Nominal Efficiency
oC
15º C
Fonte: Szklo et al. (2000)

Thermal Power - Results
S/SE/CO N/NE TGN-CA TGN-CC S/SE/CO N/NE S/SE/CO N/NE2005-2010 23.03 26.24 0.55 0.45 0.54 0.54 0.44 0.442011-2015 23.35 26.31 0.55 0.45 0.54 0.54 0.44 0.442016-2020 23.30 26.15 0.55 0.45 0.54 0.54 0.44 0.442021-2025 23.54 26.53 0.55 0.45 0.54 0.54 0.44 0.442026-2030 23.72 26.80 0.55 0.45 0.54 0.54 0.44 0.442031-2035 23.72 26.98 0.55 0.45 0.54 0.54 0.44 0.44
TGN-CA TGN-CCEficiência Operacional
T média (oC) Eficiência Nominal

Liquid Biofuels Production –Methodology
Edafoclimatic conditions (temperature and precipitation) can impact the growth of biomass for biofuels production
Results based on EMBRAPA (Pinto and Assad, 2008)
Liquid Biofuels Production –Results
Biodiesel – two crops examined: soya and sunflower.Areas with low production risks will be reduced for both cropsLack of water in the Northeast may lead to a migration of both crops to the South of the country
Ethanol – sugarcaneNo negative impacts expected, although sugarcane may migrate to other regions

Electricity Demand - Methodology
Increase in electricity consumption due to extra air conditioning
Residential and Services Sectors
2 factors considered:
Increase in the average temperature: COP effect
Increase in the number of warm days: Degree-Days effect
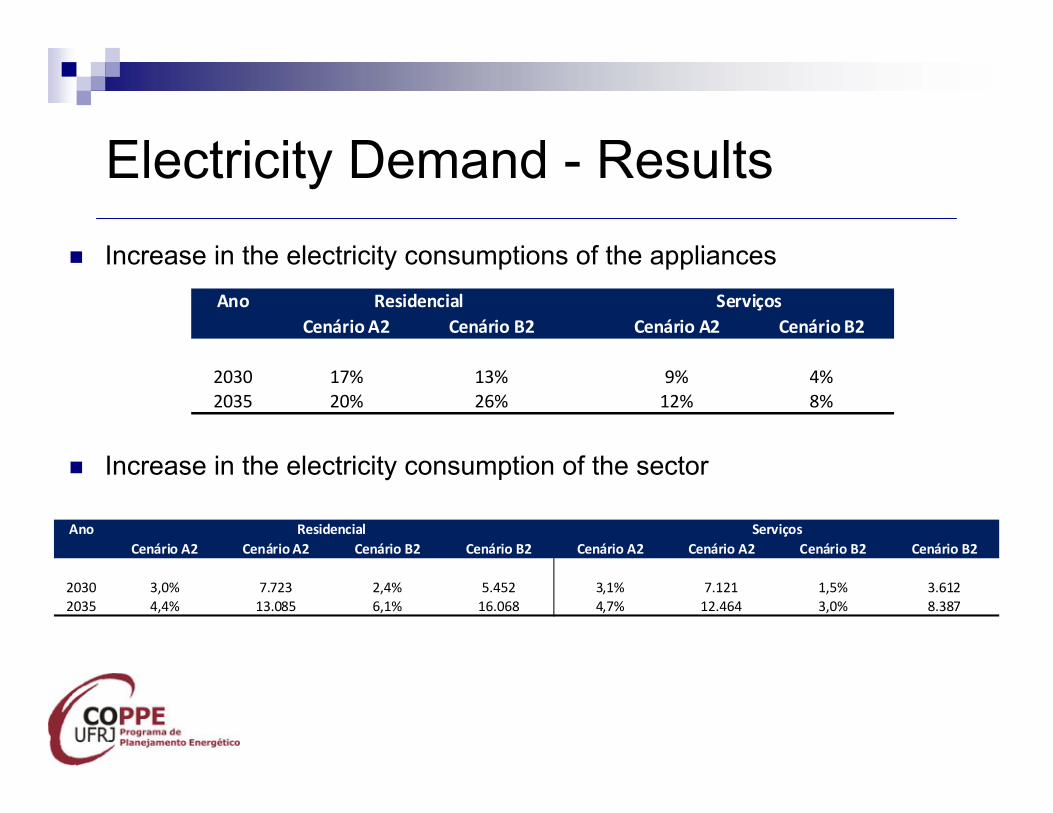
Electricity Demand - ResultsIncrease in the electricity consumptions of the appliances
Increase in the electricity consumption of the sector
AnoCenário A2 Cenário B2 Cenário A2 Cenário B2
2030 17% 13% 9% 4%2035 20% 26% 12% 8%
Residencial Serviços
AnoCenário A2 Cenário A2 Cenário B2 Cenário B2 Cenário A2 Cenário A2 Cenário B2 Cenário B2
2030 3,0% 7.723 2,4% 5.452 3,1% 7.121 1,5% 3.6122035 4,4% 13.085 6,1% 16.068 4,7% 12.464 3,0% 8.387
Residencial Serviços

Impacts – Conclusions
Decrease in the reliability of the hydro system due to GCCSignificant negative impact on hydro generation and biofuels production in the North/Northeast regionsGross wind potential positively affectedNegligible impact on thermal power generation and on ethanol production from sugarcaneIncrease in the demand for electricity in the residential and services sectors due to expected higher temperaturesGCC needs to be embeded in the planning of the energy sector from now on