client-side visualization of cancer pathway data philip heller winter 2019
Post on 19-Dec-2015
214 views
TRANSCRIPT
Client-Side Visualization of Cancer Pathway Data
Philip HellerWinter 2019
Agenda
• Visualization philosophy• ErbB2 pathway• Demo• Future directions

2 Branches of Visualization
• Scientific Viz– Typically engineering data• Measurement• Simulation
– High degree of spatial context
• Information Viz– No x/y/z/t

Scientific Visualization
• f ( 2D / 2D+t, 3D, 3D+t ) = scalar / vector / tensor• Regularity -> Best practices• Natural spatial context -> easier interpretation

Scientific Viz: Fluid Dynamics
Source: http://img.directindustry.com/images_di/photo-g/fluid-dynamics-and-thermal-transfer-simulation-software-387217.jpg

Scientific Viz: Jupiter
Source: http://www.mps.mpg.de/projects/planetary-dynamics/JupiterSim.gif
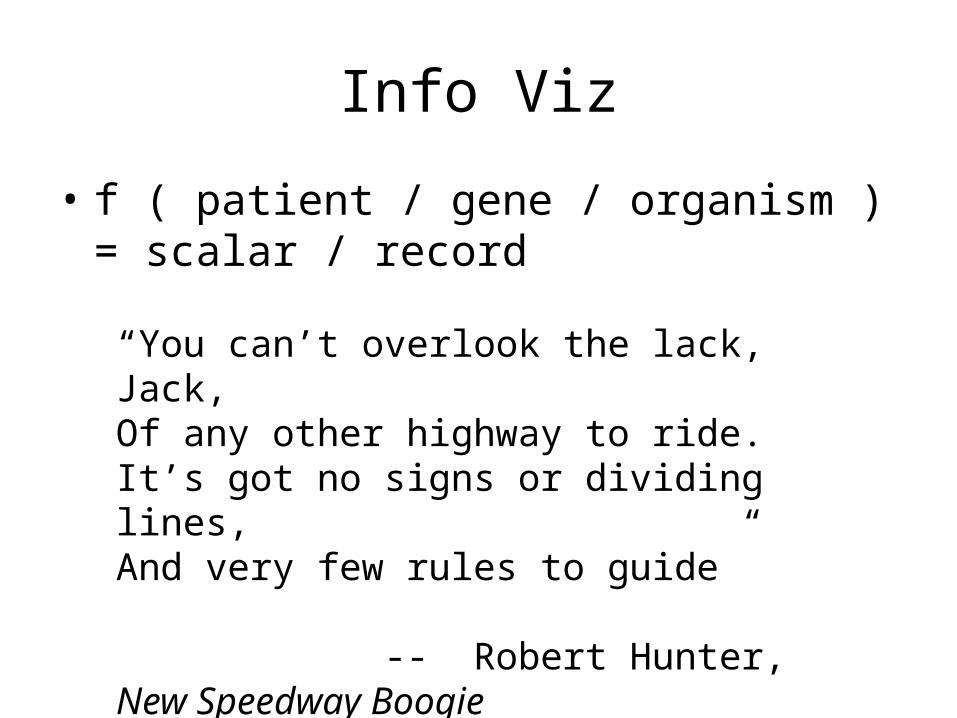
Info Viz
• f ( patient / gene / organism ) = scalar / record
“You can’t overlook the lack, Jack,Of any other highway to ride.It’s got no signs or dividing lines,And very few rules to guide”
-- Robert Hunter, New Speedway Boogie
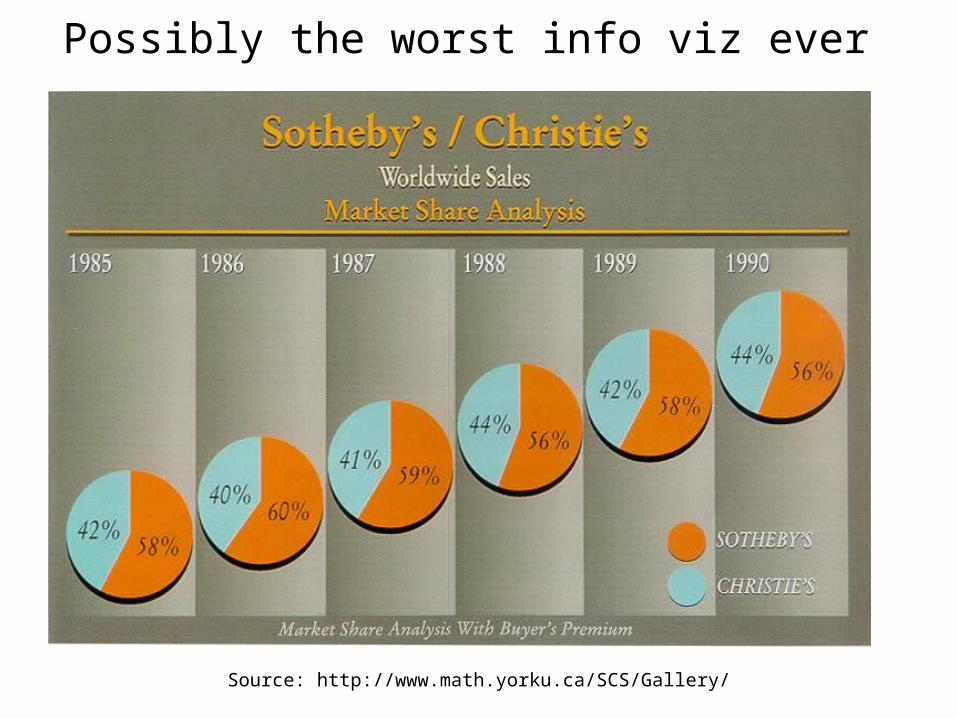
Possibly the worst info viz ever
Source: http://www.math.yorku.ca/SCS/Gallery/

Formalizing Info Viz• A few “don’ts”• Even fewer “do’s”• Start with Edward Tufte– All quotes from presentation 12/10/2009
Complicated Data, Simple Interactions
• “The information is the interface.”• “Be content-driven, not process-driven.”• “Local optimizing of interface elements leads to
global pessimizing of the interface.”• “No matter how beautiful your UI is, it would be
better if there were less of it.”
ErbB2
• Proto-oncogene• Cell surface receptor• Overexpressed in ~ 20% of breast cancer
patients• 20% * 1.3 million new cases / yr worldwide = 260,000 new patients/yr with overexpressed
ErbB2 (Source: ACS)• Under investigation at UCSC by Haussler &
Stuart Labs

The ErbB2 Pathway
Source: Zack Sanborn

PATIENT 1 2 3 4 5 6
EXPRESSION .43 .0302 .2379 -.108 .6112 -.00443
COPY NUM .12214 -.123 .4438 .0012 .8771 .4321
X 12 22 -16 -9 432 321
Y .00001 .022 .000002 -.123 .321321 .45092
Hundreds of patients
How to study a pathway:For each gene…
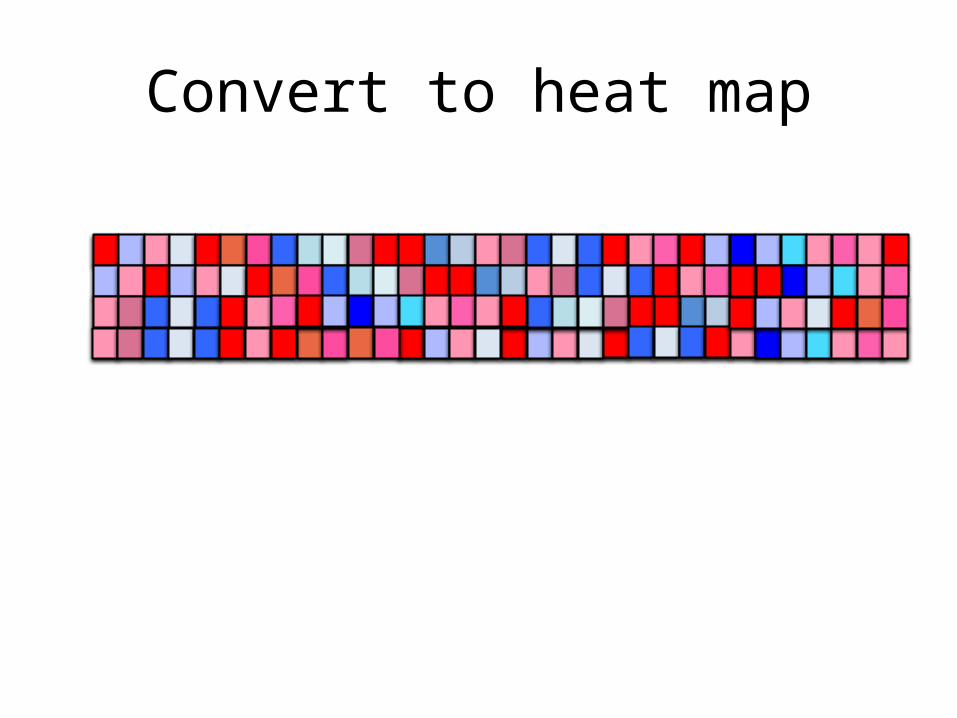
Convert to heat map
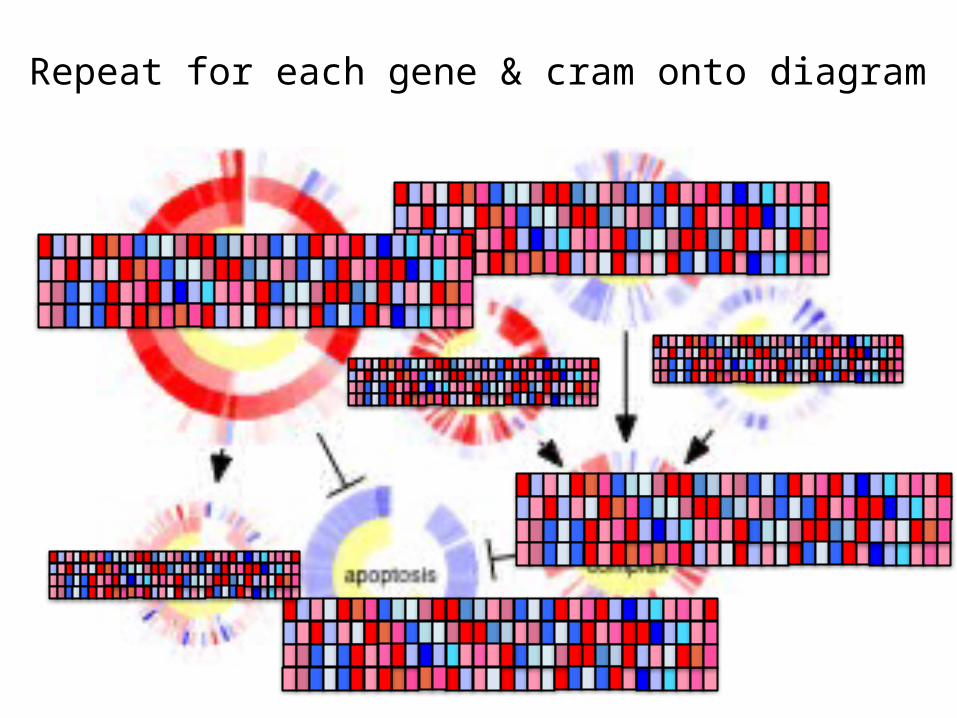
Repeat for each gene & cram onto diagram

Solution: Circle Graphs
• Developed at UCSC by Steve Benz and Zack Sanborn
• Wrap table around central spindle, compress as needed

Source: Zack Sanborn

My Contribution:Circle graphs meet client-side analysis
• What are the measurement values behind the heats?
• What information in hiding in the white?• How does one ring correlate with others?• Let’s see …
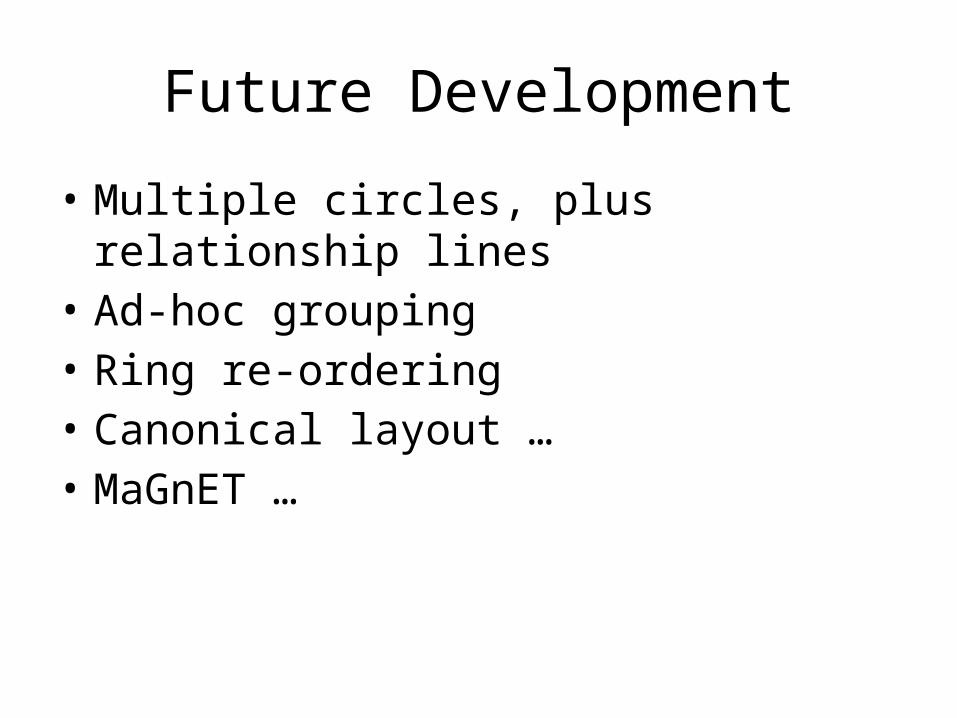
Future Development
• Multiple circles, plus relationship lines• Ad-hoc grouping• Ring re-ordering• Canonical layout …• MaGnET …
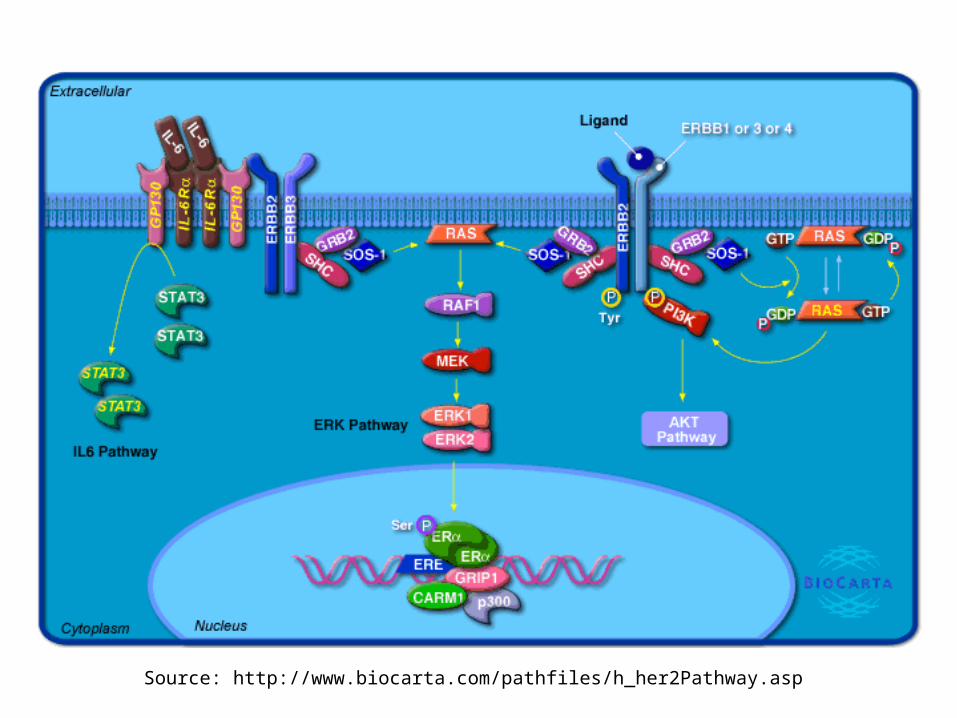
Source: http://www.biocarta.com/pathfiles/h_her2Pathway.asp