clean development mechanism project design document … · the culiacan northern landfill gas...
TRANSCRIPT

PROJECT DESIGN DOCUMENT FORM (CDM PDD) - Version 03.1. CDM – Executive Board page 1
CLEAN DEVELOPMENT MECHANISM PROJECT DESIGN DOCUMENT FORM (CDM-PDD)
Version 03 - in effect as of: 28 July 2006
CONTENTS A. General description of project activity B. Application of a baseline and monitoring methodology C. Duration of the project activity / crediting period D. Environmental impacts E. Stakeholders’ comments
Annexes Annex 1: Contact information on participants in the project activity Annex 2: Information regarding public funding Annex 3: Baseline information
Annex 4: Monitoring plan

PROJECT DESIGN DOCUMENT FORM (CDM PDD) - Version 03.1. CDM – Executive Board page 2 SECTION A. General description of project activity A.1 Title of the project activity: (1) Title: Culiacan Northern Landfill Gas Project. (2) Version: Version Number 1. (3) Date: January, 2008. A.2. Description of the project activity: The project objective is to collect and flare the landfill gas (LFG) generated by the decomposition of the organic wastes disposed at the Northern Landfill of Culiacan. The project requires the installation of a gas collection system, flaring equipment and a modular electricity plant. The Culiacan Northern Landfill Gas Project is developed by Promotora Ambiental S.A.B de C.V., and it is operated by the Municipality; this landfill gas collection and utilization project takes place at the landfill known as Culiacan Northern Landfill, Sinaloa Mexico. The Landfill was opened in 1992, as a controlled dump. It is located outside of the city of Culiacan in the state of Sonora. The total amount of waste disposed is around 2.5 million tons, currently the site receives about 850 tons of municipal waste daily. The composition of the waste received is primarily residential with 62% of organic waste.1
The site natural form was a low hill of approximately 20 meters of height, native soil is clay. The Culiacan Northern Landfill occupied site area is around 33 ha (from a total area of 100 ha) of non-hazardous waste disposal. It has an average annual precipitation of 600 mm/yr and an average temperature of 24 °C. Currently there is no system in place to actively capture or flare the landfill gas generated and it is vented to the atmosphere. The common practice for the handling of the leachate is to reinject it, without any control of the filtrations to the underground. However, a remediation program is being carried out, to improve the integrity of closed areas of the landfill and reducing impacts on the surrounding environment after closure. The project activity has been designed in a first phase; the construction and operation of a landfill gas (LFG) collection and flare system. If the project secures the flow for the electricity generation, a reciprocating engine facility will be installed. Promotora Ambiental S.A.B. de C.V. has more than 15 years of experience dedicated to the collection and disposal of domestic and private wastes, it actually participates in 23 landfills in Mexico; in this project it will have the collaboration of SCS Engineers, company with 37 years of experience in the planning, permitting, investigation, design, construction, and operation of LFG control and energy recovery systems.
1 Municipal Solid Waste Characterization for the Northern Landfill Project, by Auditoria y Gestión Ambiental. May 2007.

PROJECT DESIGN DOCUMENT FORM (CDM PDD) - Version 03.1. CDM – Executive Board page 3 The Project will have several positive social, economic and environmental impacts that will contribute with the international efforts of climate change mitigation: • The objective of LFG flaring is to dispose the methane, in a safe manner, and to control and reduce
odour nuisance and health risks. • It is intended to capture the methane that would be released to the atmosphere. Not only the project will
confront global warming, it will also provide an environmentally solution to minimize risks such as possible explosions for accumulated methane and a secure health for the local community at the landfill site.
• It will add to the national private expertise in the installation and operation of on-grid biogas power generation technology and flaring systems and strengthen institutional capacities.
• It will increase technology diversification in the power sector, enhancing the robustness of the power system and contributing to the security and reliance of supply.
• It will strengthen Mexico's participation in international carbon markets. • Increase of job opportunities related to the management, operation and maintenance of landfill, landfill
gas system and the power plant. A.3. Project participants:
Name of Party involved (*) ((host) indicates a host
Party)
Private and/or public entity(ies) project participants (*) (as applicable)
Kindly indicate if the Party involved wishes to be considered as project
participant (Yes/No)
Mexico (host)
Promotora Ambiental S.A.B. de C.V (private entity) (*)
No
(*) In accordance with the CDM modalities and procedures, at the time of making the CDM-PDD public at the stage of validation, a Party involved may or may not have provided its approval. At the time of requesting registration, the approval by the Party(ies) involved is required. Contact information is available in Annex 1. A.4. Technical description of the project activity: A.4.1. Location of the project activity: A.4.1.1. Host Party(ies):
Mexico A.4.1.2. Region/State/Province etc.:
State of Sinaloa A.4.1.3. City/Town/Community etc:

PROJECT DESIGN DOCUMENT FORM (CDM PDD) - Version 03.1. CDM – Executive Board page 4
Municipality of Culiacan A.4.1.4. Detail of physical location, including information allowing the unique identification of this project activity (maximum one page): The Site is located at Km. 2.5, Pitayita way, without number in the City of Culiacan, Sinaloa. The geographic coordinates of the site are between the parallel 24°53’07” and 24°54’33” Northern Latitude (N.L.) and meridians 107°22’13.14” and 107°21’55” West Latitude (W.L.).
Figure 1.- General map indicating the regional area of the site project
A.4.2. Category(ies) of project activity:

PROJECT DESIGN DOCUMENT FORM (CDM PDD) - Version 03.1. CDM – Executive Board page 5 Type and Category This project is categorized under the: • Sectoral Scope 13. “Waste handling and disposal” by the capture of the biogas resulting from anaerobic
decomposition of organic waste deposited in the landfill site; • Sectoral Scope 1. “Energy Industries (Renewable/non – renewable sources)” for the purpose of electric
generation from the biogas captured at the landfill. A.4.3. Technology to be employed by the project activity: For an appropriate design, construction, installation, collection and operation of the LFG plant, it will be necessary to cover different settings to ensure the capture and flaring of the biogas generated. The installations of the LFG capture and collection system, within the flare components, are composed by the following subsystems: 1. Collection: Consist of a set of vertical wells installed into the refuse, where the LFG is extracted from the degraded refuse. Construction of vertical wells is in closed areas, to different depths, this kind of action does not interfere with the landfill operation. Depending on future development plans, some horizontal wells might be installed, to capture the landfill gas in areas that continue to be filled. 2. Extraction and piping: This is conformed by a network of pipes of specific diameter calculated for the suitability of the anticipated flow rates, and equipment to extract the LFG to the flare system or power generation plant. Along the circuit there are condensed traps, and wellheads with monitoring ports. 3. Monitoring/Analysis: Installed between the subsystems of extraction/conduction and flaring with the objective to accurately register the quantity of methane to be sent to the power generation plant. It is integrated by a flow meter and inline with the main pipe, which will be measuring the flux of the LFG that will be incinerated; there is also a gas analyzer which will analyze and determine the methane content present in the LFG previous to be burned at the flare system. Measurements at the LFG collection system extraction wells will include gas temperature, landfill gas quality (methane, oxygen, and carbon dioxide), and pressure/vacuum. Such data will be measured with an infrared gas analyzer (or equivalent) with a built in microprocessor for storing data electronically. Data collected at the flare station will be accomplished by an automated system that provides continuous measurement of the necessary parameters. Results will be stored electronically and accessible remotely via modem or internet connection. 4. Incineration (or flaring): Based on a burner that has a combustion chamber for the landfill gas and the chimney to vent the exhaust gas to the atmosphere. The collected biogas is flared at high efficiency/high temperature flare (815 to 1038 º C, with a 99% of effectiveness). The system is equipped with a monitoring system for CH4, O2, flow, pressure and temperature of the LFG. The predicted LFG recovery rate for the landfill in 2008 is 1882 m3/h (assuming 75% capture of LFG generated), decreasing to 703 m3/h at the end of the crediting period (2018). The project will produce

PROJECT DESIGN DOCUMENT FORM (CDM PDD) - Version 03.1. CDM – Executive Board page 6 electricity and will be used for auto consumption purposes (i.e. electricity required by the equipment) and also to supply to the national grid if the flow and quality of the LFG is adequate.
A.4.4 Estimated amount of emission reductions over the chosen crediting period: The GHG emissions by sources are estimated at 729,507 tonnes de CO2eq in ten years (the crediting period).
Years Annual estimation of emission reduction in tonnes of CO2e
(since August ) 2008 49,611 2009 109,295 2010 95,842 2011 84,799 2112 75,673 2013 68,075 2014 61,698 2015 56,300 2016 51,690 2017 47,717
(January to August) 2018 28,807 Total estimated reductions (tonnes of CO2 e)
729,507
Total number of crediting years (first period) 10 Annual average over the crediting period estimated reductions (tonnes of CO2 e)
72,950
Table 1. Estimations of emissions reductions achieved by the project A.4.5. Public funding of the project activity: Public funds will not be requested or utilized in the development of the project. SECTION B. Application of a baseline and monitoring methodology B.1. Title and reference of the approved baseline and monitoring methodology applied to the project activity: The baseline and monitoring methodology used for the proposed project activity is the approved consolidated baseline methodology ACM0001, version 8, (EB36): “Consolidated baseline methodology for landfill gas project activities”. Using the latest versions of: “Tool to determine methane emissions avoided from dumping waste at a solid waste disposal site” Version 1. “Combined tool to identify the baseline scenario and demonstrate additionality” Version 1.

PROJECT DESIGN DOCUMENT FORM (CDM PDD) - Version 03.1. CDM – Executive Board page 7 “Tool to calculate project or leakage CO2 emissions form fossil fuel combustion” Version 1. “Tool to calculate the emission factor for an electricity system”. Version 1. “Tool to calculate project emissions from electricity consumption”. Version 1. “Tool for the demonstration and assessment of additionality”. Version 4. “Tool to determine project emissions from flaring gases containing methane”. Version 1. These methodologies are applicable to landfill gas capture project activities where the baseline scenario is the partial or total atmospheric release of the gas, and the project activities consist of the collected gas that is flared. B.2 Justification of the choice of the methodology and why it is applicable to the project activity: The selected methodology (ACM0001, version 8) is appropriate to LFG project activities, where the baseline scenario is either the partial or total atmospheric release of the LFG. In this case the total atmospheric release of the LFG is considered as the baseline scenario. The project activity fulfills the following applicability conditions of the methodology: a) The captured gas is flared; and/or b) The captured gas is used to produce energy (e.g. electricity/thermal energy). c) The captured gas is used to supply consumers through natural gas distribution network. If emissions reductions are claimed for displacing natural gas, project activities may use approved methodologies AM0053, but no emission reductions are claimed for displacing or avoiding energy from other sources. The proposed project activity matches options a) and b), The Northern Landfill Gas Project will collect LFG, flaring it and in a second phase using it to produce energy. Emissions reductions would also be claimed for: 1. Displacing or avoiding energy from other sources. 2. Capture and flaring LFG generated by the decomposition of organic wastes B.3. Description of the sources and gases included in the project boundary The definition of the project boundary states that the project boundary shall encompass all anthropogenic emissions by sources of greenhouses gases (GHG) under the control of the project participants that are significant and reasonably attributable to the CDM project activity. As per ACM0001, the gases involved in the project activity to determine GHG emissions sources are identified as follows:
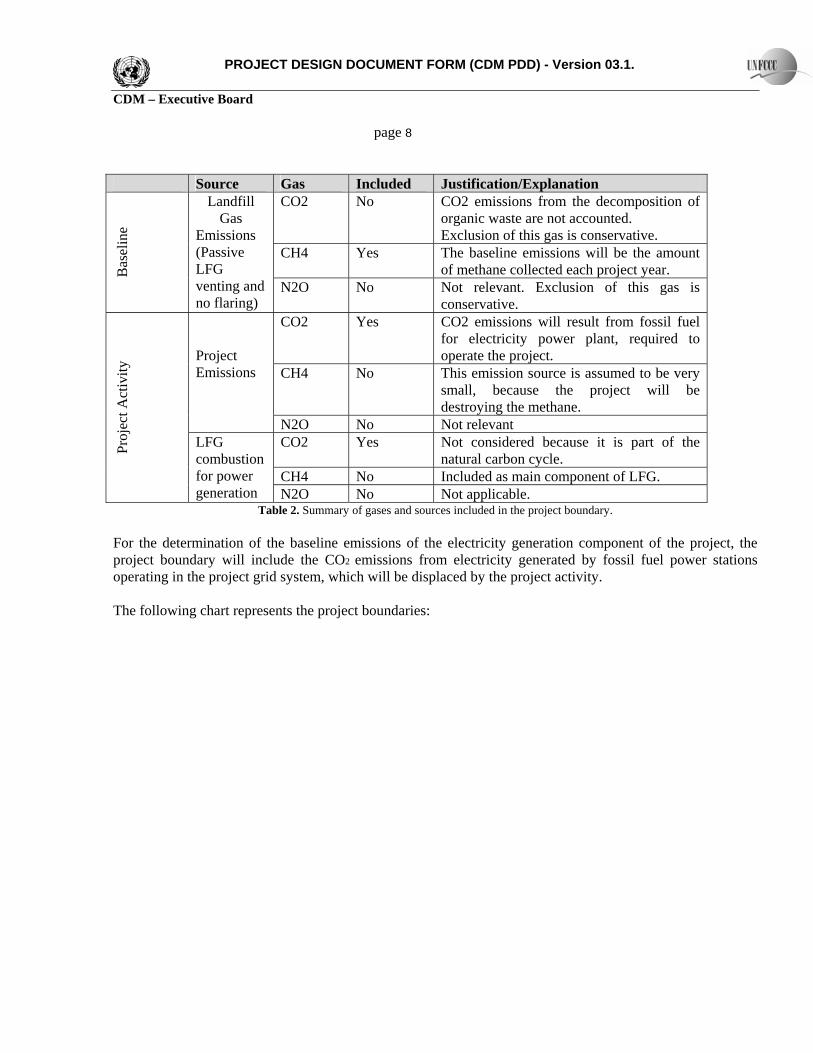
PROJECT DESIGN DOCUMENT FORM (CDM PDD) - Version 03.1. CDM – Executive Board page 8 Source Gas Included Justification/Explanation
CO2 No CO2 emissions from the decomposition of organic waste are not accounted. Exclusion of this gas is conservative.
CH4 Yes The baseline emissions will be the amount of methane collected each project year. B
asel
ine
Landfill Gas
Emissions (Passive LFG venting and no flaring)
N2O No Not relevant. Exclusion of this gas is conservative.
CO2 Yes CO2 emissions will result from fossil fuel for electricity power plant, required to operate the project.
CH4 No This emission source is assumed to be very small, because the project will be destroying the methane.
Project Emissions
N2O No Not relevant CO2 Yes Not considered because it is part of the
natural carbon cycle. CH4 No Included as main component of LFG.
Proj
ect A
ctiv
ity
LFG combustion for power generation N2O No Not applicable.
Table 2. Summary of gases and sources included in the project boundary. For the determination of the baseline emissions of the electricity generation component of the project, the project boundary will include the CO2 emissions from electricity generated by fossil fuel power stations operating in the project grid system, which will be displaced by the project activity. The following chart represents the project boundaries:
PROJECT DESIGN DOCUMENT FORM (CDM PDD) - Version 03.1. CDM – Executive Board page 9
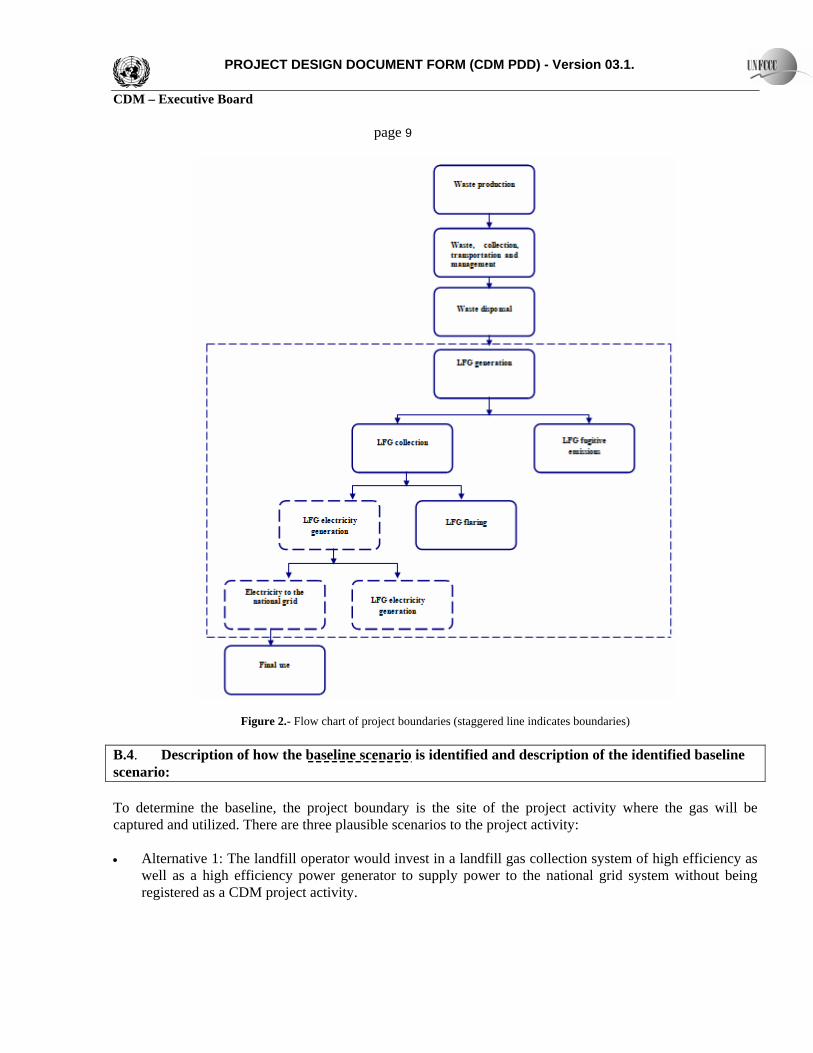
Figure 2.- Flow chart of project boundaries (staggered line indicates boundaries) B.4. Description of how the baseline scenario is identified and description of the identified baseline scenario: To determine the baseline, the project boundary is the site of the project activity where the gas will be captured and utilized. There are three plausible scenarios to the project activity: • Alternative 1: The landfill operator would invest in a landfill gas collection system of high efficiency as
well as a high efficiency power generator to supply power to the national grid system without being registered as a CDM project activity.

PROJECT DESIGN DOCUMENT FORM (CDM PDD) - Version 03.1. CDM – Executive Board page 10 • Alternative 2: The business as usual scenario. The landfill gas would continue being released to the
atmosphere as there are no requirements in place that would mandate LFG capture and flaring. • Alternative 3: The landfill operator would invest in a landfill gas collection system of high efficiency as
well as a high efficiency power generator to supply power to the national grid system (the proposed project activity).
In the case of the Culiacan Northern Landfill Gas Project the baseline scenario is the continued release of the LFG to the atmosphere which constitutes a common practice in Mexico. There are no mandatory regulations or incentives to capture, flare and/or use the LFG. In the absence of the Project, the Culiacan Northern Landfill would continue to release GHG emissions to the atmosphere. The proposed project will, at the least, capture and flare a portion of the LFG generated by the landfill, thus converting its methane content into CO2
and reducing its greenhouse gas impact. As indicated in the methodology, it will be applied a procedure for the selection of the most plausible scenario. First, it is needed to identify all realistic and credible baseline alternatives to the project activity consistent with current laws and regulations (applying step 1 of the “Tool for the demonstration and assessment of additionality”). In the section B.5 it will be described a detailed description of how the anthropogenic emissions of GHG by sources are reduced below those that would have occurred in the absence of the registered CDM project activity. The determination of project scenario additionality is done using “the tool for the demonstration and assessment of additionality”. B.5. Description of how the anthropogenic emissions of GHG by sources are reduced below those that would have occurred in the absence of the registered CDM project activity (assessment and demonstration of additionality): >> This tool consists of following the subsequent steps: Step 1: Identification of alternatives to the project activity consistent with current laws and regulations. Sub-step 1a. Define alternatives to the project activity: As it is indicated in ACM0001, version 8, among other scenarios it will be included the following: • Alternative 1 (LFG1): The project activity (i.e. capture of landfill gas and its flaring and/or its use)
undertaken without being registered as a CDM project activity; • Alternative 2 (LFG2): Atmospheric release of the landfill gas or partial capture of landfill gas and
destruction to comply with regulations or contractual requirements, or to address safety and odour concerns.
There are other options besides to manage solid waste in a landfill (such as biomethanation, incineration, or gasification, among others). Even so, these possible options are not realistic because most of them would require the technological experience that is limited in the host country, increasing the risk for investments for

PROJECT DESIGN DOCUMENT FORM (CDM PDD) - Version 03.1. CDM – Executive Board page 11 its correct operation compared to land filling, where this is the most probable activity to be implemented. It should be kept in mind that the actual landfill site is closed and it is not intended to keep receiving any waste stream nowadays. Therefore, all the options mentioned before are the most common and realistic alternatives for the context of the project activity. It was mentioned before that the project activity proposes to generate electricity. In this case, the methodology proposes to include the following alternatives, among others: • Alternative 1 (P1): Power generated from landfill gas undertaken without being registered as CDM
project activity. • Alternative 2 (P2): Existing or Construction of a new on-site or off-site fossil fuel fired cogeneration
plant. • Alternative 3 (P3): Existing or Construction of a new on-site or off-site renewable based cogeneration
plant. • Alternative 4 (P4): Existing or Construction of a new on-site or off-site fossil fuel fired captive power
plant. • Alternative 5 (P5): Existing or Construction of a new on-site or off-site renewable based captive power
plant. • Alternative 6 (P6): Existing and/or new grid-connected power plants. It is not intended for the project any renewable source that could be available (if any) around the region, then options P3 and P5 are dismissed. For fossil-fuel based captive power plants or cogeneration plants, the comparison with purchasing the electricity from the grid is remarkable, even better than any fossil fuel power plant, because it would require to acquire the fuels, transport them to the site and installed them within the equipment for a plant of this magnitude; therefore P2 and P4 can be dismissed. The only remaining options for plausible baselines are then (P1) “Power generated from landfill gas undertaken without being registered as CDM project activity”, and (P6) “Power plants connected to the grid”. The project does not include thermal energy generation because the project activity only proposes to generate electricity with LFG. In order to represent the real alternatives of the project activity the listed above (LFG1 and LFG2; P1 and P6) are the only alternatives to be considered as possible alternative baselines. There are no other alternatives that deliver outputs and services (e.g. methane destruction, with the methane being used to generate electricity or useful heat to a process) with comparable quality, properties and application. Sub-step 1b. Consistency with mandatory laws and regulations:

PROJECT DESIGN DOCUMENT FORM (CDM PDD) - Version 03.1. CDM – Executive Board page 12 Regulation NOM-083-SEMARNAT-20032 defines the specifications for environmental protection from the selection, design, construction and operation, monitoring and closure of final disposal sites for urban and special solid waste, in Mexico. The regulation provides guidelines for the construction and operation of landfills, and also provides guidance regarding LFG, including recommendations for the collection, utilization and/or flaring of the LFG. However, the regulation does not specify minimum requirements regarding the amount of gas to be collected and utilized or flared. The NOM- 083-SEMARNAT-2003 is not enforced in Mexico, for the following circumstances: • NOM-083-SEMARNAT-2003 is a federal law, however, landfills are the responsibility of the
municipalities, who have sovereignty in solid waste disposal. Thus, NOM-083-SEMARNAT- 2003 would only be legally binding if the local authorities adopt it. In this case, local authorities have not adopted this regulation.
• NOM-083-SEMARNAT-2003 has never been enforced. Even the earlier regulation (NOM-083- SEMARNAT-1996) which NOM-083-SEMARNAT-2003 replaced and which only required the active venting of LFG for safety reasons, was not enforced.
• Given these circumstances, NOM-083-SEMARNAT-2003 has become more of a document outlining policy guidance than a mandatory requirement.
• While NOM-083-SEMARNAT-2003 does not indicate a mandatory requirement for LFG capture and flaring, the current situation implies some limited LFG burning, without any active system for capturing LFG.
Finally, NOM-083-SEMARNAT-2003 does not indicate any mandatory requirement for LFG capture and its flaring, it only mentions LFG venting (for security reasons regarding exploit limits), but not any system for LFG capture. The current configuration of the Northern Landfill of Culiacán may be characterized as follows: • The place consists mostly of passive venting systems • In general there is non infrastructure for the control of the landfill gas and leachates that are generated in
the place. • Due to this, it is considered that in this place, landfill gas is not burning and it is released into the
atmosphere and for that, the percentage that is burnt is 0. With this acknowledgment, both considered alternatives comply with the laws and regulations. The current situation at the Culiacan Northern Landfill Gas Project corresponds to Alternative 2 (LFG2) – (See Sub-step 1a). Step 2: Identify the fuel for the baseline choice of energy source taking into account the national and/or sectoral policies as applicable.
2 Available at http://www.semarnat.gob.mx/leyesynormas/Normas%20Oficiales%20Mexicanas%20vigentes/NOM-083-SEMAR-03-20-OCT-04.pdf
PROJECT DESIGN DOCUMENT FORM (CDM PDD) - Version 03.1. CDM – Executive Board page 13 For power generation, there were two scenarios remaining: • Alternative 1 (P1): Power generated from landfill gas undertaken without being registered as CDM
project activity, and • Alternative 6 (P6): Power plants connected to the grid. The fuels in the power plants connected to the grid are defined by the corresponding company (Federal Commission Electricity, “CFE”), and their emissions factors are determined by the “Tool to calculate the emission factor for an electricity system” (version 1), that would be generated in the grid in the baseline. The baseline scenario in this particular case is the atmospheric release of the landfill gas (venting for security reasons) or its partial capture (but not burned), which happens in most of the existing landfills in the Host Country. There is no incentive to utilize the LFG to produce thermal energy, since there are no potential off-takers for thermal energy. The additionality tool offers two options after Step 1: Investment Analysis (Step 2) or Barrier Analysis (Step 3), with a third option of applying both Steps. Step 2. Investment Analysis Sub-step 2a: Determine appropriate analysis method According to the “tool for the demonstration and assessment of additionality”, one of three options must be applied for this step: (1) simple cost analysis (where no benefits other than CDM income exist for the project), (2) investment comparison analysis (where comparable alternatives to the project exist), or (3) benchmark analysis. By investing in a landfill gas collection and flaring system, the Project would not generate any revenues in the absence of the CDM. Therefore, the project activity is not economically attractive and not a realistic baseline scenario. In the case of the Culiacan Northern Landfill, where the project activity involves collection and utilization of the LFG for electricity generation, the most likely alternative to the project is to simply not install flaring and generation equipment at the site, i.e., the alternative does not involve investments of a similar scale to the project. Therefore, option (3) benchmark analysis will be applied. Sub-step 2b: Option III - Apply benchmark analysis According to the methodology for determination of additionality, if the alternatives to the CDM project activity do not include investments of comparable scale to the project, then Option III must be used. In this case, the most likely alternative to the project is just not install the flaring and generation equipment in site, and therefore does not involve investments of a similar scale to the project. Because of this, benchmark analysis will be applied The development of this type of project, as opposed to the continuation of current activities (i.e., no collection and no combustion of LFG), will be determined by comparing others IRR given by the benchmark of interest rates available from local investors. In February 2008, interest rates at local banks in Mexico were
PROJECT DESIGN DOCUMENT FORM (CDM PDD) - Version 03.1. CDM – Executive Board page 14 7.9% and government bonds were 7.4%3. The benchmark rate of return on construction or projects with similar risks involved is commonly set at least at 17.5%. Sub-step 2c: Calculation and comparison of financial indicators The calculation of the financial indicator for the project activity includes the initial investment costs, the operation and maintenance costs and revenues associated with the operation of the project activity. The timeline includes the crediting period. The initial investment costs are 2.2 million USD (taking into account that 60% is for equipment). The financial analysis was carried out using two scenarios: 1. Without carbon credit revenues. 2. With carbon credit revenues The results of the financial analysis were: 1. Without carbon credit revenues, a discount rate of 12%, the IRR is 13.7% and the NPV is -1.559 million USD. 2. With carbon credit revenues assuming a CERs price of $15 USD/tonCO2e and a discount rate of 12%, the IRR is 25 % and the NPV is 1.226 million USD. Sub-step 2d: Sensitivity analysis A sensitivity analysis was conducted changing the following parameters:
• Increasing and decreasing the total investment costs. • Increasing and decreasing the energy price. • Increasing and decreasing the CERs price
The financial analysis was performed varying the parameters 10%, and assessing what the impact on the project IRR and NPV would be. Variation 3 Both can be consulted in:
<http://www.banxico.org.mx/polmoneinflacion/estadisticas/tasasInteres/tasasInteres.html

PROJECT DESIGN DOCUMENT FORM (CDM PDD) - Version 03.1. CDM – Executive Board page 15 (+10%) (-10%) IRR NVP US($) IRR NVP US ($) Investment costs 18.3% 141,010 13.5% 505,562 Energy price 18.1% 556,741 13.1% 82,345 CERs price 16.9% 438,656 14.4% 207,917
Table 3. Sensitivity Analysis In conclusion, in most cases the project IRR remains lower than the benchmark, even in the case where these parameters change in favor of the Project. The project IRR is significantly lower than private equity investments with rates of return of 18 - 30% and assuming all other risks involved with non-performance of technology and non-error margin for the landfill gas generation model used (US EPA), the project cannot be considered as financially attractive without CDM revenues. Step 3: Barrier analysis: Sub-step 3a. Identify barriers that would prevent the implementation of the proposed CDM project activity: The following categories of barriers: (a) Investment Barriers, (b) Technological Barriers, (c) Prevailing Practice, and (d) Institutional and Regulatory Barriers were used in the analysis as explained below: The barriers that would prevent the proposed project activity from being carried out if the project were not registered as a CDM activity, among others, are: • Investment barriers • Technological barriers • Barriers due to prevailing practice (a) Investment Barriers: In general, a LFG system has difficulty for securing finance. This is accentuated by the relatively high cost of capital and high financial risks related to the capital markets in Mexico. Also, a relatively limited access to international capital markets, which are, more attracted to invest on conventional projects on electricity generation rather than LFG to energy projects; for this reason, it is difficult for such alternative plants in Mexico to attract adequate capital. External financing for LFG to energy projects is difficult to get because locals are misinformed and do not know the details about this technology, though perceive LFG projects to have high risks. The landfill area closed, has the usual method of mixed municipal waste likewise other landfills in the Host Country. This is because this manner is considered as the usual practice for standard operation and cost issues for the municipal solid waste treatment. If it is intended to make good use of the land, and take advantage of the methane generated for electric purposes and flaring (for safety and healthy issues), the construction and installation of an adequate technology is a critical aspect, needed to cover properly to guarantee the success

PROJECT DESIGN DOCUMENT FORM (CDM PDD) - Version 03.1. CDM – Executive Board page 16 of the proposed activity, this is why the insertion of carbon revenues has an important role for the Developer in the implementation and financing strategy. (b) Technological Barriers: The predominant and most well-known technology for solid waste disposal in Mexico is open dumping. Solid waste collection in Mexico depends mostly on personnel with no technical training and the separation of the waste is carried out typically by scavengers. Also, industrial non hazardous solid waste is treated together with municipal solid waste. The solid waste management is not appropriate, but it prevails in Mexico, affecting air, water, and soil. The changes needed to manage systems, particularly in developing countries, require particular care in covering the needs and expectations of local people who are now used to living from the landfill by ‘picking’ and effectively transitioning to “managed sorting” and “recycling”. If managed effectively, this transition can benefit both the operator and the local community in terms of operational stability, sustainability, and health. But if mishandled, it can result in a significant loss of site control that undercuts the overall operation of the landfill and its ancillary products of methane flaring and energy production. These operational challenges are collectively very significant, and while at face value they may not appear to pose a technological barrier, they account for risks that require a significant increase in return on investment in order to make the project attractive. Finally, it should be pointed out that the feasibility study was conducted by SCS Engineers, with its base in the USA, a country with a wide experience in LFG capture and flaring projects. If the project is validated under the CDM, it will be probable that an external company would have to provide technical expertise in order to conduct detailed engineering studies and support project implementation. It is possible that the successful implementation of the project activity can act as an incentive to impulse these kinds of projects around the different landfills located in Mexico. (c) Barriers due to prevailing practices Eventhough there are few landfill gas recovery and use projects operational in Mexico, these were financed through the Global Environmental Facility (GEF) – like the Simeprodeso landfill gas recovery project located at Monterrey, Mexico, designed specifically as a demonstration project to promote the development of CDM projects– and through the CDM Framework– like Aguascalientes and Ecatepec, with carbon credit revenues–, without such incentives, the uncontrolled release of landfill gas is common practice. Sub-step 3b. Show that the identified barriers would not prevent the implementation of at least one of the alternatives (except the proposed project activity). The barriers identified above apply for the alternatives previously mentioned in this subsection. The barriers identified do not prevent the continuation of the current situation at the landfill (Alternative 2), which does not require additional investment neither additional training nor skilled personnel. Therefore, alternative 2 (continuation of current practice) is undertaken as the baseline scenario.

PROJECT DESIGN DOCUMENT FORM (CDM PDD) - Version 03.1. CDM – Executive Board page 17 The tool states: “If both Sub-steps 3a – 3b are satisfied, proceed to Step 4 (Common practice analysis).” Step 4. Common practice analysis. Sub-step 4a. Analyze other activities similar to the proposed project activity. As mentioned previously, there are other LFG recovery projects currently operating in Mexico, in Monterrey, Aguascalientes and Ecatepec, all financed through climate change mitigation resources. “Sub-step 4b: Discuss any similar options that are occurring”. The Simeprodeso landfill project was financed through a GEF grant. There are a few projects of gas collection and flaring or use currently under development in Mexico and all these projects are being presented under the CDM. B.6. Emission reductions:
B.6.1. Explanation of methodological choices: As the applicability of the methodology indicates, the Culiacan Northern Landfill Gas Project fulfills the conditions of option a) and b) of methodology ACM0001, version 8: “The captured gas is flared; and/or is used to produce energy (e.g. electricity/thermal energy)”. The objective of the Culiacan Northern Landfill Gas Project is to avoid methane emissions to the atmosphere by the installation of an efficient landfill gas collection and flaring system. In conclusion, the project has two main activities: • Capture and flare/combustion of the LFG methane to decrease its harmful effects (i.e. to the environment
and also to human health by reducing odors). • A reduction in fossil fuel consumption used to produce electricity (because new energy is produced by
burning methane). In this manner, the project activity accomplishes the necessary conditions to use the methodology ACM0001, version 8. Baseline emissions: It was identified that the baseline consists in a simple passive venting system where no pumping equipment is used and there is no LFG actually used for generation of electricity purposes.

PROJECT DESIGN DOCUMENT FORM (CDM PDD) - Version 03.1. CDM – Executive Board page 18 The baseline emissions reductions due to the partial collection of the LFG (if any) will be taken into account by applying the AF (Adjustment Factor). These facts are taken into account where the methodology estimates the baseline emissions as follows:
BE = (MDproyect,y-MDBL,y)*GWPCH4+ELLFG,y*ETLFG,y*CEFelecy,BL,y + ETy* CEFthermal Equation (1) Where: BEy Baseline emissions in year y (tCO2e) MDproject,y The amount of methane that would have been destroyed/combusted during the year, in
tonnes of methane in the project scenario (tCH4) MDBL,y The amount of methane that would have been destroyed/combusted during the year in
the absence of the project due to regulatory and/or contractual requirement, in tonnes of methane (tCH4).
GWPCH4 Global Warming Potential value for methane for the first commitment period is 21 (tCO2e/tCH4)
ELLFG,y Net quantity of electricity produced using LFG, which in the absence of the project activity would have been produced by power plants connected to the grid or by an onsite/offsite fossil fuel based captive power generation, during year y, in megawatt hours (MWh).
CEFelecy,BL,y CO2 emissions intensity of the baseline source of electricity displaced (tCO2e/MWh) ETLFG,y The quantity of thermal energy produced utilizing the landfill gas, which in the
absence of the project activity would have been produced from onsite/offsite fossil fuel fired boiler, during the year y in TJ.
CEFther,BL,y CO2 emissions intensity of the fuel used by boiler to generate thermal energy which is displaced by LFG based thermal energy generation, in tCO2e/TJ.
As the project electricity consumption is already considered in the formula, in cases when the project is not generating electricity, the ELLFG,y term would be = 0 in the equation 1, and therefore the corresponding project emissions would be reduced from the project´s overall emission reductions. Because the project activity will not generate thermal energy from landfill gas, therefore CEFther,BL,y=ETLFG,y= 0 in Equation 1. For MDBL,y since there is no regulatory or contractual requirements, an Adjustment Factor (AF) will be used and justified, therefore , the estimation of the variable is using the following equation: MDBL,y=MDproyect,y*AF……..Equation (2) The specific system for collection and destruction of methane is not mandated by regulatory or contractual requirements nor is undertaken for other reasons; for this, the ratio of the destruction efficiency of the baseline system to the destruction efficiency of the system used in the project activity is zero.

PROJECT DESIGN DOCUMENT FORM (CDM PDD) - Version 03.1. CDM – Executive Board page 19 For the variable MDproject,y, the methodology dictates a conservative way to select the most appropriate and representative value by comparing between the total quantity of methane captured, and the sum of the quantities fed to the flare(s), to the power plant(s) and to the boiler(s) and to the natural gas distribution network. In case the total methane collection is the highest, MDproject,y is given by: MDproject,y = MDflared,y+MDelectricity,y+MDthermal,y+MDPL,y Equation (3) Where: MDflared, y Quantity of methane destroyed by flaring (tCH4). MDelectricity,y
Quantity of methane destroyed by generation of electricity (tCH4).
MDthermal,y Quantity of methane destroyed for the generation of thermal energy (tCH4). MDPL,y Quantity of methane sent to the pipeline for feeding to the natural gas distribution
network (tCH4). Since there is no intention to collect landfill gas for thermal generation and neither for the gas distribution network, MDthermal = MDPL= 0 in Equation 3 The supply to each point of methane destruction, through flaring or use for energy generation, shall be measured separately. For methane destroyed by flaring (MDflared,y), Equation 4 states its calculation:
⎟⎟⎠
⎞⎜⎜⎝
⎛−=
4
,44,, )**(
CH
yflareCHCHyflareyflared GWP
PEDwLFGMD Equation (4)
Where: LFGflare,y Quantity of landfill gas fed to the flare(s) during the year measured in cubic meters (m3). wCH4 Average methane fraction of the landfill gas as measured during the year and expressed as a
fraction (in m3 CH4 / m3 LFG), measured and reported on wet basis.
DCH4 Methane density expressed in tonnes of methane per cubic meter of methane (tCH4/m3 CH4) PEflare,y Project emissions from flaring of the residual gas stream in year y (tCO2e) determined
following the procedure described in the “Tool to determine project emissions from flaring gases containing methane”. If methane is flared through more than one flare, the PEflare,y shall be determined for each flare using the tool.
For methane used for electricity generation purposes (MDelectricity,y), Equation 5 states its calculation: MDelectricity,y=LFGelectricity,y*wCH4,y*DCH4 Equation (5) Where: MDelectricity,y Quantity of methane destroyed by generation of electricity (tCH4/yr) LFGelectricity, Quantity of landfill gas fed into electricity generator (m3/yr)
PROJECT DESIGN DOCUMENT FORM (CDM PDD) - Version 03.1. CDM – Executive Board page 20
y It should be noted that for landfill gas flows captured either for flaring or electrical purposes (LFGflare,y and LFGelectricity,y), it must be taken into account the annual hours of plant operation. It is recommended to register each hour of operation as minimum. Ex-ante estimation of the amount of methane that would have been destroyed/combusted during the year, in tonnes of methane (MDproject,y). The ex-ante estimation of the amount of methane that would have been destroyed/combusted during the year, in tonnes of methane (MDproject,y) will be done with the latest version of the approved “Tool to determine methane emissions avoided from dumping waste at a solid waste disposal site”, considering the following additional equation: MDproject,y = BECH4,SWDS,y/GWPCH4……..Equation (6) Where: BECH4,SWDS,y Is the methane generation from the landfill in the absence of the project activity at
year y (tCO2e), calculated as per the model based on the US EPA First Order Decay Model.
Determination of CEFelec,BL,y
Because it was identified that in the baseline the electricity generated would come most probably from plants connected to the national grid, the emission factor is calculated according to the “Tool for calculation of emission factor for electricity systems”. The calculation of the emission factor for the electricity system is showed in Annex 3. Project emissions: Possible CO2 emissions coming from other fuels than the recovered methane (contained in the landfill gas), should be accounted for as project emissions. The general equation for Project emissions is stated as follows: PEY = PEEC,Y+PEFC,j,y……..Equation (8) Where: PEEC,y Emissions from consumption of electricity in the project case. The project emissions from
electricity consumption (PEEC,y) will be calculated following the latest version of “Tool to calculate project emissions from electricity consumption”. If in the baseline a part of LFG was captured then the electricity quantity used in calculation is electricity used in the project activity net of that consumed in the baseline.
PEFC,j,y Emissions from consumption of heat in the project case. The project emissions from fossil

PROJECT DESIGN DOCUMENT FORM (CDM PDD) - Version 03.1. CDM – Executive Board page 21
fuel consumption (PEFC,j,y) will be calculated following the latest version of “Tool to calculate project or leakage CO2 emissions from fossil fuel combustion”. For this purpose, the processes j in the tool corresponds to all fossil fuel combustion in the landfill, as well as any other on-site fuel combustion for the purposes of the project activity. If in the baseline part of a LFG was captured, then the heat quantity used in calculation is fossil fuel used in project activity net of that consumed in the baseline.
When the project does not generate electricity in the first project stage, the assumption made was that the electricity needed for the operation of the project activity will be supplied by the national grid. When the project generates electricity, there is a net export of electricity to the grid. For these reasons, the emissions coming from the electricity use are deducted from the overall emissions reductions (this mean that only emissions reductions for the net electricity generation are claimed). At this moment, for the Culiacan Northern Landfill Gas Project, it is considered that there will not be any heat consumption, so PEFC,j,y = 0. PEEC,y will be calculated using the “Tool to calculate project emissions from electricity consumption”. Leakage emissions: No leakage effects need to be accounted for under this methodology. Emission reductions: According to the Methodology the greenhouse gas emission reductions achieved by the project activity during a given year “y” (ERy) shall be estimated as follows: ERy = BEy - PEy……………Equation (9)
B.6.2. Data and parameters that are available at validation: Data / Parameter: Carbon Emission Factor (CEFelectricity,y) Data unit: tCO2/GWh Description: CO2 emissions intensity of the electricity displaced Source of data used: Official statistics from the Secretary of Energy; SENER (2003, 2004, 2005,
2006). “Prospectiva del Sector Electrico 2004-2013, 2005-2014, 2006-2015” Value applied: 526.3 tCO2/GWh Justification of the choice of data or description of measurement methods and procedures actually applied :
The CEFelectricity,y is calculated according to the “Tool to calculate the emission factor for an electricity system”.
Any comment: This value data will be updated according to new information available for its

PROJECT DESIGN DOCUMENT FORM (CDM PDD) - Version 03.1. CDM – Executive Board page 22
calculation each year. Data / Parameter: GWPCH4 Data unit: tCO2e/tCH4 Description: Global warming potential of CH4 Source of data used: 2006 IPCC value Value applied: 21 Justification of the choice of data or description of measurement methods and procedures actually applied :
Value determined as a conservative manner for calculations.
Any comment: Updated according to further changes in the future. Data / Parameter: DCH4 Data unit: tCH4 / m3 CH4 Description: Methane density. Source of data used: As indicated in the present methodology Value applied: 0.0007168 Justification of the choice of data or description of measurement methods and procedures actually applied :
Value applied for the density of methane at standard temperature and pressure (0 degree Celsius and 1,013 bar).
Any comment: - Data / Parameter: AF Data unit: % Description: Adjustment factor (for methane destruction in the baseline) Source of data used: Estimated if there is a contractual or regulations requirements Value applied: 0 Justification of the choice of data or description of measurement methods and procedures actually applied :
The regulatory requirements do not indicate any specific amount of landfill gas to collect and destruct or for its utilization. There are no registered amounts of landfill gas that are actually burnt at the Culiacan Northern Landfill Gas Project; in any case, only passive venting is used for safety purposes and no methane destruction is occurring previous to the project activity. With these facts, an adjustment factor of 0% is the most proper value to be adopted.
Any comment: - Data / Parameter: BECH4,SWDS,y Data unit: tCO2e

PROJECT DESIGN DOCUMENT FORM (CDM PDD) - Version 03.1. CDM – Executive Board page 23 Description: Methane generation from the landfill in the absence of the project activity at
year y. Source of data used: Calculated as indicated in the US EPA First Order Decay Model, using data of
methane density. Value applied: Calculated as shown in B.6.3 Justification of the choice of data or description of measurement methods and procedures actually applied :
This calculation was according to the methodology ACM0001 version 8.
Any comment: It should be noted that no monitoring of these settings need to be taken because the cells that would be used for the landfill gas plant were closed in 2007, and the municipal solid waste generated is deposited in another cell of the Culiacan Northern Landfill Gas Project.
Data / Parameter: NCVfuel,BL Data unit: TJ /Gg Description: Net Calorific Value of fossil fuel Source of data used: 2006 IPCC values for the types of fossil fuel. Value applied: Natural gas: 48 TJ/Gg and for Fuel oil: 44.5 TJ/Gg Justification of the choice of data or description of measurement methods and procedures actually applied :
Data for the country and/or for the project activity are not available
Any comment: Data / Parameter: EF Data unit: tCO2 / TJ Description: Emission Factor for fossil fuels. Source of data used: 2006 IPCC values for the types of fossil fuel. Value applied: 56.1 , for Natural Gas fuel ; and 77.3, for Fuel Oil. Justification of the choice of data or description of measurement methods and procedures actually applied :
Data for the country and/or for the project activity are not available or is not accessible.
Any comment:
B.6.3 Ex-ante calculation of emission reductions:

PROJECT DESIGN DOCUMENT FORM (CDM PDD) - Version 03.1. CDM – Executive Board page 24 In order to follow the requirements of the methodology ACM0001, version 8, it will be provided an ex-ante estimation of the emission reduction of the project activity (calculation of the MDproject). To determine estimated emission reduction ex- ante, a model for Mexico based on the US EPA First Order Decay Model is used. This ex-ante estimate is for the elaboration of this document, as emission reductions will be monitored ex-post, according to the methodology. For the quantity of waste, each amount of waste type was obtained from data from 1992-2007 periods4. The results were applied for the period where the landfill was receiving waste (opened since 1992 and cells closed in 2007). The quantity of LFG flared by the project is estimated using US EPA First Order Decay Model for Mexico, using Lo (methane generation potential) and k (methane generation rate constant) values appropriate for the municipality and assuming that 75% of the LFG generated is collected by the gas collection system. The collection efficiency value considers the physical conditions of the landfill as well as the capping material used to cover the waste, and the area to be used is closed. The precision of these values are not as significant as the actual emission reductions which will be monitored directly. The details of the assumptions of the model are provided in Annex 3. Project emissions from flaring will be calculated and monitored according to the procedures described in “Tool to determine project emissions from flaring gases containing methane”, using the option for continuous monitoring of the methane destruction efficiency of the flare. For ex-ante calculations of emission reductions, a 99% efficiency (�flare,h) value will be assumed for the project (according to the flare´s manufacturer specifications and based on a field test using the same flare technology and design under similar operating conditions. The project does not consider thermal generation using LFG, and no fossil fuel combustion was made in the baseline. For these reasons, the parameters involving thermal components are zero. For ex-ante calculations, it was considered that the project activity will not involve any thermal consumption, but eventually it could be presented (i.e. if there is any combustion of fossil fuels for a captive power plant to meet electrical requirements at a certain time), and the corresponding emissions would be accounted through PEFC,j,y as follows:
yiyjiyjFC COEFFCPE ,,,,, *Σ= Equation (10)
Where: PEFC,j,y Are the CO2 emissions from fossil fuel combustion in process j during the year y (tCO2/yr) FCi,j,y Is the quantity of fuel type i combusted in process j during the year y (mass or volume
unit/yr); COEFi,y Is the CO2 emission coefficient of fuel type i in year y (tCO2 / mass or volume unit); i are the
4 Source: Municipality of Culiacán.

PROJECT DESIGN DOCUMENT FORM (CDM PDD) - Version 03.1. CDM – Executive Board page 25
fuel types combusted in process j during the year y. The type(s) of fossil fuel(s) to be used will depend of the choice of the developer (i.e. natural gas, fuel oil, diesel, etc.), and the corresponding emission factors will be taken from the IPCC default values, in case there is no data available.
• The developer will generate electricity using landfill gas. Eventhough at the moment there isn’t any decision made about the type of equipment that would be used. However, it may be expected that in the second year of the crediting period (2009) the process of generation of electricity and selling to the grid takes place, if the landfill gas flow and quality are adequate.
• For electric generation purposes, it is estimated that a flow of 700 m3/hr of LFG (with 50% of methane) is needed to generate 1000 kW as commented with many manufacturers, however, it must be kept in mind that the final selection of the equipment and, thus, the capacity of the generation of electricity (MW), within the hours of operation of the power plant, will be decided and the information of the selected manufacturer will be provided to adjust these values.
• 80% of the total landfill gas captured may be used for generation of electricity, and the remaining 20% may be flared at the enclosed flare.
• For ex-ante estimations, it was assumed a default flare efficiency of 99% for enclosed flares, but it should be kept in mind that the intention of the developer is to monitor this parameter.
• As the project activity will require electricity to pump the LFG generated at the site, until the power plant is operating, the electricity will be purchased from the grid and its emissions are showed in PEEC,y, according to the “Tool to calculate project emissions from electricity consumption”, and are calculated as follows:
PEEC,y = ECPJ,y*EFgrid* (1+TDLy)…. Equation (11) Where: PEEC,y Are the project emissions from electricity consumption by the project activity during the year y
(tCO2 / yr) ECPJ,y Is the quantity of electricity consumed by the project activity during the year y (MWh) EFgrid,y
Is the emission factor for the grid in year y (tCO2/MWh)
TDL y Are the average technical transmission and distribution losses in the grid in year y for the voltage level at which electricity is obtained from the grid at the project site.
A default 20% was used for the ex-ante calculation (option B) for the TDLy. Also, the emission factor of the grid (EFgrid,y) used is 526.3 tCO2/GWh (see annex 3). It is considered that a blower will use 56 kW. Again, this information is subject to change according to the final decision and when the available data from the manufacturer is provided. When electricity generation with the methane collected in the project takes place, emissions reductions are determined by the sum of the amount of electricity exported from the project site to the grid and the amount of electricity used on-site in the project activity (such as it would have been imported in the absence of the project activity). This constitute ELLFG,y. (see Equation 1).

PROJECT DESIGN DOCUMENT FORM (CDM PDD) - Version 03.1. CDM – Executive Board page 26 • It is assumed that the power plant will operate 8,000 hours per year. • It is assumed that the flare station will operate 8,600 hours per year.
B.6.4 Summary of the ex-ante estimation of emission reductions:
Year
LFGtotal,ym3 LFG/yr
LFGthermal,ym3 LFG/yr
LFGelectricity,ym3 LFG/yr
LFGflare,ym3 LFG/yr
LFGPL,ym3 LFG/yr
2008 16,490,168 0 0 3,435,452 0 2009 14,800,872 0 5,920,349 1,480,087 0 2010 13,013,499 0 5,205,399 1,301,350 0 2011 11,546,262 0 4,618,505 1,154,626 0 2012 10,333,688 0 4,133,475 1,033,369 0 2013 9,324,142 0 3,729,657 932,414 0 2014 8,476,877 0 3,390,751 847,688 0 2015 7,759,723 0 3,103,889 775,972 0 2016 7,147,259 0 2,858,904 714,726 0 2017 6,619,378 0 2,647,751 661,938 0 2018 6,160,160 0 1,642,709 410,677 0
Table 4: Ex-ante estimation of landfill gas collected and flared.
Year
MDPL,y tCH4/yr
MDthermal,ytCH4/yr
MDelectricity,ytCH4/yr
MDflare,ytCH4/yr
MDprojecttCH4/yr
MDreg tCH4/yr
2008 0 0 0 2,377 2,377 0 2009 0 0 4,244 975 5,219 0 2010 0 0 3,731 847 4,578 0 2011 0 0 3,311 742 4,053 0 2012 0 0 2,963 655 3,618 0 2013 0 0 2,673 583 3,256 0 2014 0 0 2,430 522 2,952 0 2015 0 0 2,225 471 2,695 0 2016 0 0 2,049 427 2,476 0 2017 0 0 1,898 389 2,287 0 2018 0 0 1,177 209 1,386 0
Table 5: Ex-ante estimation of net emission reductions by methane destruction.
Year
ECPJ,yMWh/yr
ELLFG,yMWh/yr

PROJECT DESIGN DOCUMENT FORM (CDM PDD) - Version 03.1. CDM – Executive Board page 27
2008 482 0 2009 482 4,763 2010 482 4,763 2011 482 4,763 2012 482 4,763 2013 482 4,763 2014 482 4,763 2015 482 4,763 2016 482 4,763 2017 482 4,763 2018 482 4,763
Table 6: Ex-ante estimation of net emission reductions by fossil fuels displacement, due to electricity generation using landfill gas.
Year
Emission Reduction LFG Project Activity
(tCO2e)
Project Emissions (tCO2e)
Total Emissions Landfill (tCO2e)
2008 49,915 304 49,611 2009 109,599 304 109,295 2010 96,147 304 95,842 2011 85,103 304 84,799 2012 75,977 304 75,673 2013 68,379 304 68,075 2014 62,002 304 61,698 2015 56,604 304 56,300 2016 51,995 304 51,690 2017 48,022 304 47,717 2018 29,111 304 28,807
Table 7: Summary of ex-ante estimation of total emission reductions B.7 Application of the monitoring methodology and description of the monitoring plan:
B.7.1 Data and parameters monitored: Data / Parameter: LFGtotal,y Data unit: Cubic meters (m3) Description: Total amount of landfill gas captured Source of data to be used:
Measured by a flow meter

PROJECT DESIGN DOCUMENT FORM (CDM PDD) - Version 03.1. CDM – Executive Board page 28 Value of data applied for the purpose of calculating expected emission reductions in section B.5
Details of assumptions, calculations and resulting data are presented in section B.6.3 and B.6.4 (Table 4).
Description of measurement methods and procedures to be applied:
The method used will be direct measurement. A flow meter is located upstream from the flare inlet providing measured flow rate values as required by the methodology. Data at the flare station will be automatically recorded on a continuous basis. Under normal operation, monitoring of the collection system (extraction wells) will be conducted on a monthly basis. Data will be measured once per hour, recorded electronically, and data will be kept during the crediting period and two years after. Data will also be aggregated yearly.
QA/QC procedures to be applied:
During the first 3 months of operation, weekly monitoring and adjustments are anticipated. Future monitoring frequencies will be based on the results of initial collection system monitoring. An independent company will conduct data checking in accordance with manufacturer specifications, to ensure accuracy and the proper calibration of the instrument.
Any comment: Continuous mass flow meters will be used to measure the flow rates.
Data / Parameter: LFGflare,y Data unit: Cubic meter (m3) Description: Amount of landfill gas captured and fed into the flare. Source of data to be used:
Measured by a flow meter.
Value of data applied for the purpose of calculating expected emission reductions in section B.5
Details of assumptions, calculations and resulting data are presented in section B.6.3 and B.6.4 (Table 4).
Description of measurement methods and procedures to be applied:
The method used will be direct measurement. A flow meter is located upstream from the flare inlet providing measured flow rate values as required by the methodology. Data at the flare station will be automatically recorded on a continuous basis, once per hour, recorded electronically, and data will be kept during the crediting period and two years after. Data will also be aggregated yearly.
QA/QC procedures to be applied:
During the first 3 months of operations, weekly monitoring and adjustments are anticipated. Future monitoring frequencies will be based on the results of initial collection system monitoring. An independent company will conduct data checking in accordance with manufacturer specifications, to ensure accuracy and the proper calibration of the instrument.
Any comment: Continuous mass flow meters will be used to measure the flow rates. Data / Parameter: LFGelectricity,y

PROJECT DESIGN DOCUMENT FORM (CDM PDD) - Version 03.1. CDM – Executive Board page 29 Data unit: Cubic meter (m3) Description: Amount of landfill gas captured and fed into the electricity generator. Source of data to be used:
Measured by a flow meter.
Value of data applied for the purpose of calculating expected emission reductions in section B.5
Details of assumptions, calculations and resulting data are presented in section B.6.3 and B.6.4 (Table 4).
Description of measurement methods and procedures to be applied:
The method used will be direct measurement. A flow meter is located upstream from the flare inlet providing measured flow rate values as required by the methodology. Data at the power plant will be automatically recorded electronically on a continuous basis, once per hour, and data will be kept during the crediting period and two years after. Data will also be aggregated monthly/yearly.
QA/QC procedures to be applied:
Continuous mass flow meters will be used to measure the flow rates. An independent company will conduct data checking in accordance with manufacturer specifications, to ensure accuracy and the proper calibration of the instrument.
Any comment: Continuous mass flow meters will be used to measure the flow rates. Data / Parameter: wCH4 Data unit: % Description: Methane fraction in the landfill gas Source of data to be used:
Data will be measured with an infrared gas analyzer (or equivalent) with a built in microprocessor for storing data electronically
Value of data applied for the purpose of calculating expected emission reductions in section B.5
50%
Description of measurement methods and procedures to be applied:
Data will be measured at least once per hour, results will be stored electronically and accessible remotely via modem or internet connection, and data will be kept during the crediting period and two years after. Data will also be aggregated monthly/yearly.
QA/QC procedures to be applied:
Methane content will be measured using a continuous gas analyzer. An independent company will conduct data checking in accordance with manufacturer specifications, to ensure accuracy and the proper calibration of the instrument.
Any comment: The system measures CH4, CO2, and O2 in percent volume Data / Parameter: T Data unit: Celsius degrees. Description: Temperature of the landfill gas

PROJECT DESIGN DOCUMENT FORM (CDM PDD) - Version 03.1. CDM – Executive Board page 30 Source of data to be used:
Data will be measured with an infrared gas analyzer (or equivalent) with a built in microprocessor for storing data electronically
Value of data applied for the purpose of calculating expected emission reductions in section B.5
0 (In accordance for STP conditions).
Description of measurement methods and procedures to be applied:
Data will be measured at least once per hour, results will be stored electronically and accessible remotely via modem or internet connection, and data will be kept during the crediting period and two years after. Data will also be aggregated monthly/yearly.
QA/QC procedures to be applied:
Temperature will be measured using a continuous gas analyzer. An independent company will conduct data checking in accordance with manufacturer specifications, to ensure accuracy and the proper calibration of the instrument.
Any comment: A thermocouple will be used to measure temperature. Measurements at the LFG collection system extraction wells will include gas temperature, gas quality (methane, oxygen, and carbon dioxide), and pressure/vacuum.
Data / Parameter: P Data unit: Pa (Pascal) Description: Pressure of landfill gas Source of data to be used:
Data will be measured with an infrared gas analyzer (or equivalent) with a built in microprocessor for storing data electronically
Value of data applied for the purpose of calculating expected emission reductions in section B.5
101,325 Pa (1 atm and for STP conditions)
Description of measurement methods and procedures to be applied:
Data will be measured at least once per hour, results will be stored electronically and accessible remotely via modem or internet connection, and data will be kept during the crediting period and two years after. Data will also be aggregated monthly/yearly.
QA/QC procedures to be applied:
Pressure will be measured using a continuous gas analyzer. An independent company will conduct data checking in accordance with manufacturer specifications, to ensure accuracy and the proper calibration of the instrument.
Any comment: Measurements at the LFG collection system extraction wells will include gas temperature, gas quality (methane, oxygen, and carbon dioxide), and pressure/vacuum.
Data / Parameter: ELLFG,y Data unit: MWh Description: Net quantity of electricity produced with landfill gas during year y, in MWh. Source of data to be used:
See section B.6.4

PROJECT DESIGN DOCUMENT FORM (CDM PDD) - Version 03.1. CDM – Executive Board page 31 Value of data applied for the purpose of calculating expected emission reductions in section B.5
Details of calculations and resulting data are presented in section B.6.3 and B.6.4 (Table 6).
Description of measurement methods and procedures to be applied:
Meter readings of electricity generation using landfill gas.
QA/QC procedures to be applied:
Data will be measured at least once per hour, recorded electronically, and data will be kept during the crediting period and two years after. Data will also be aggregated monthly/yearly.
Any comment: Includes both exports to other on-site activities as well as sold to the power grid.
Data / Parameter: Operation of the electrical plant Data unit: Hours Description: Hours of operation of the electrical energy plant Source of data to be used:
Records on-site by the personnel.
Value of data applied for the purpose of calculating expected emission reductions in section B.5
It is assumed that it will operate 8000 hours per year.
Description of measurement methods and procedures to be applied:
Daily records of the operation of the equipments at the project site for the Project activity.
QA/QC procedures to be applied:
Meter will need to be checked for accuracy, as is required for any electricity sector project.
Any comment: - Data / Parameter: PEEC,y Data unit: tCO2 Description: Project emissions from electricity consumption by the project activity during the
year y Source of data to be used:
Calculated as per the “Tool to calculate project emissions from electricity consumption”.
Value of data applied for the purpose of calculating expected emission reductions in section B.5
As per the “Tool to calculate project emissions from electricity consumption”
Description of As per the “Tool to calculate project emissions from electricity consumption”

PROJECT DESIGN DOCUMENT FORM (CDM PDD) - Version 03.1. CDM – Executive Board page 32 measurement methods and procedures to be applied: QA/QC procedures to be applied:
As per the “Tool to calculate project emissions from electricity consumption”
Any comment: - The following variables are monitored, as required to determine flare efficiency using the Tool (PEflare,y). Data / Parameter: PEFC,j,y Data unit: tCO2 Description: Project emissions from fossil fuel combustion in process j during the year y . Source of data to be used:
Calculated as per the “Tool to calculate project or leakage CO2 emissions from fossil fuel combustion”.
Value of data applied for the purpose of calculating expected emission reductions in section B.5
As per the “Tool to calculate project or leakage CO2 emissions from fossil fuel combustion”.
Description of measurement methods and procedures to be applied:
As per the “Tool to calculate project or leakage CO2 emissions from fossil fuel combustion”.
QA/QC procedures to be applied:
As per the “Tool to calculate project or leakage CO2 emissions from fossil fuel combustion”.
Any comment: - Data / Parameter: FVRG,h Data unit: m3/hr Description: Volumetric flow rate of the residual gas in a dry basis at normal conditions in the
hour h. Source of data to be used:
Data will be measured with an infrared gas analyzer (or equivalent) with a built in microprocessor for storing data electronically
Value of data applied for the purpose of calculating expected emission reductions in section B.5
It was assumed that the corresponding flow for year “y” was the result to the 20% of the total landfill gas captured per year that it will be sent to the flare, except the first year (where no electric generation is intended to occur).
Description of measurement methods and procedures to be applied:
Data will be measured at least once per hour, results will be stored electronically and accessible remotely via modem or internet connection, and data will be kept during the crediting period and two years after. Data will also be aggregated monthly/yearly.
QA/QC procedures to be applied:
Flow will be measured using a continuous gas analyzer. An independent company will conduct data checking in accordance with manufacturer
PROJECT DESIGN DOCUMENT FORM (CDM PDD) - Version 03.1. CDM – Executive Board page 33
specifications, to ensure accuracy and the proper calibration of the instrument. Any comment: The same basis (dry or wet) is considered for this measurement when the residual
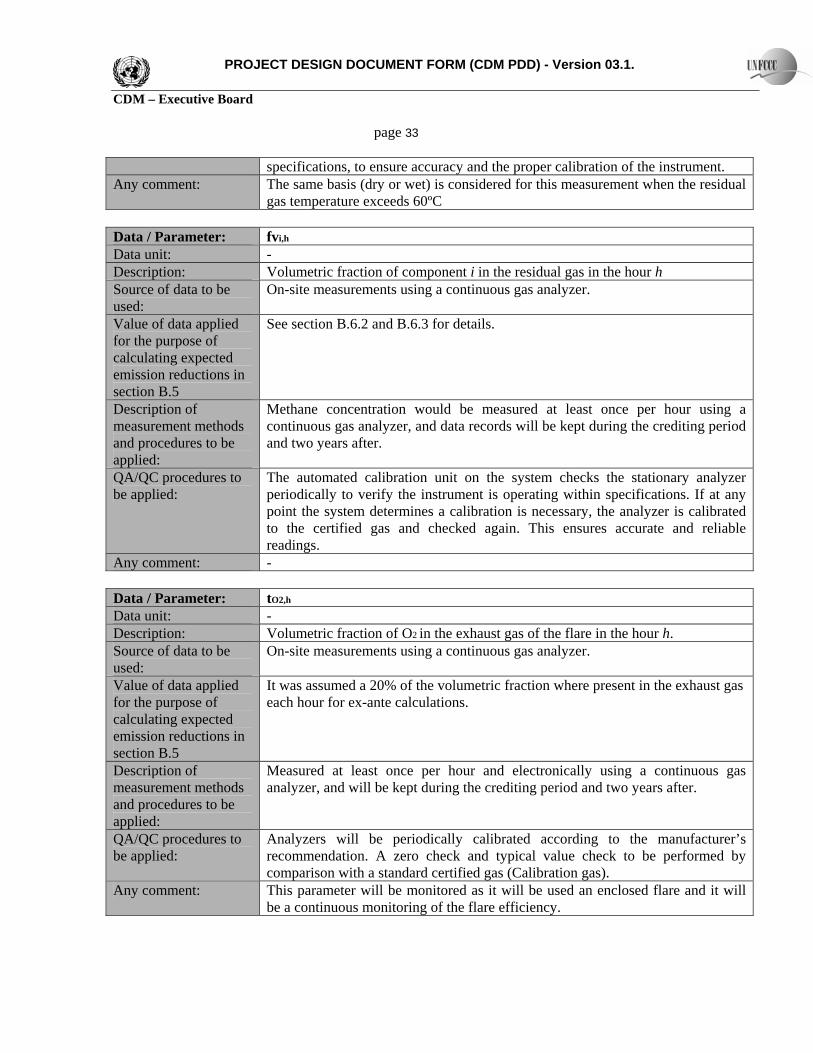
gas temperature exceeds 60ºC Data / Parameter: fvi,h Data unit: - Description: Volumetric fraction of component i in the residual gas in the hour h Source of data to be used:
On-site measurements using a continuous gas analyzer.
Value of data applied for the purpose of calculating expected emission reductions in section B.5
See section B.6.2 and B.6.3 for details.
Description of measurement methods and procedures to be applied:
Methane concentration would be measured at least once per hour using a continuous gas analyzer, and data records will be kept during the crediting period and two years after.
QA/QC procedures to be applied:
The automated calibration unit on the system checks the stationary analyzer periodically to verify the instrument is operating within specifications. If at any point the system determines a calibration is necessary, the analyzer is calibrated to the certified gas and checked again. This ensures accurate and reliable readings.
Any comment: - Data / Parameter: tO2,h Data unit: - Description: Volumetric fraction of O2 in the exhaust gas of the flare in the hour h. Source of data to be used:
On-site measurements using a continuous gas analyzer.
Value of data applied for the purpose of calculating expected emission reductions in section B.5
It was assumed a 20% of the volumetric fraction where present in the exhaust gas each hour for ex-ante calculations.
Description of measurement methods and procedures to be applied:
Measured at least once per hour and electronically using a continuous gas analyzer, and will be kept during the crediting period and two years after.
QA/QC procedures to be applied:
Analyzers will be periodically calibrated according to the manufacturer’s recommendation. A zero check and typical value check to be performed by comparison with a standard certified gas (Calibration gas).
Any comment: This parameter will be monitored as it will be used an enclosed flare and it will be a continuous monitoring of the flare efficiency.

PROJECT DESIGN DOCUMENT FORM (CDM PDD) - Version 03.1. CDM – Executive Board page 34 Data / Parameter: fvCH4,FG,h Data unit: mg/m3
Description: Concentration of methane in the exhaust gas of the flare in dry basis at normal conditions in the hour h
Source of data to be used:
Measurements using a Flare Emissions Analyzer
Value of data applied for the purpose of calculating expected emission reductions in section B.5
It was assumed 1 mg/m3 of methane present in the exhaust gas (dry basis) at
normal conditions.
Description of measurement methods and procedures to be applied:
The emissions monitor measures the emissions gas existing at the flare stack on a parts per million (ppm) range and a conversion unit is used form ppm to mg/m3. The frequency of monitoring will be continuous: values are to be averaged hourly or at a shorter time interval.
QA/QC procedures to be applied:
Analyzers will be periodically calibrated according to the manufacturer’s recommendation. A zero check and a typical value check will be performed by comparison with a standard gas.
Any comment: Measurement instruments may read ppmv or % values. To convert from ppmv to mg/m3, multiply by 0.716. 1% equals 10 000 ppmv.
Data / Parameter: Tflare Data unit: °C Description: Temperature in the exhaust gas of the flare. Source of data to be used:
On-site measurements using a continuous gas analyzer.
Value of data applied for the purpose of calculating expected emission reductions in section B.5
For ex-ante estimates it was assumed 700°C.
Description of measurement methods and procedures to be applied:
Measure the temperature of the exhaust gas stream in the flare by a thermocouple. A temperature above 500 ºC indicates that a significant amount of gases are still being burnt and that the flare is operating,
QA/QC procedures to be applied:
Thermocouples will be replaced or calibrated every year.
Any comment: An excessively high temperature at the sampling point (above 700 ºC) may indicate that the flare is not being adequately operated or that its capacity is not adequate to the actual flow. Using the flare emissions measurement and gas analyzer inlet gas values, the actual destruction efficiency of the flare can be determined in the following way:

PROJECT DESIGN DOCUMENT FORM (CDM PDD) - Version 03.1. CDM – Executive Board page 35
• The temperature of the flare below of 500 °C during more than 20 minutes, the efficiency would be considered as 0%
• The temperature of the flare above of 500 °C during more than 40 minutes, the efficiency would be calculated according to:
hasresidua
hexhaustgas
TMTM
,lg
,1−=η
A thermocouple will be used to measure temperature (maintained between 500 °C to 700 °C for optimum operation).
The following variables are required to determine annual consumption of electricity on the project site using the Tool (PEEC,y). Data / Parameter: TDLy Data unit: - Description: Average technical transmission and distribution losses in the grid in year y for the
voltage level at which electricity is obtained from the grid at the project site. Source of data to be used:
One of the following options will be used: a) Recent, accurate and reliable data available within the host country. b) A default value of 20%.
Value of data applied for the purpose of calculating expected emission reductions in section B.5
For ex-ante estimates, it will be used 20%.
Description of measurement methods and procedures to be applied:
For a): TDLy should be estimated for the distribution and transmission networks of the electricity grid of the same voltage as the connection where the proposed CDM project activity is connected to. The technical distribution losses should not take into account other types of grid losses (e.g. commercial losses/theft). The distribution losses can either be calculated by the project participants or be based on references from utilities, network operators or other official documentation.
QA/QC procedures to be applied:
In the absence of data from the relevant year, most recent figures should be used, but not older than 5 years.
Any comment: Technical distribution losses do not take into account other types of grid losses (e.g. commercial losses/theft).
Data / Parameter: FCk,i,y Data unit: Mass or (normalized) volume unit per year (in m³, ton or l ) Description: Quantity of fossil fuel type i fired in the captive power plant k in year y Source of data to be used:
Onsite measurements

PROJECT DESIGN DOCUMENT FORM (CDM PDD) - Version 03.1. CDM – Executive Board page 36 Value of data applied for the purpose of calculating expected emission reductions in section B.5
Not used in ex-ante estimates
Description of measurement methods and procedures to be applied:
It will be used weight and/or volume meters according to the type of fuel to be employed for the captive power plant, if implemented.
QA/QC procedures to be applied:
The consistency of metered fuel consumption quantities should be cross-checked with an annual energy balance that is based on purchased quantities and stock changes.
Any comment: - Data / Parameter: EGk,y Data unit: MWh Description: The total net amount of electricity produced by captive power plant k. Source of data to be used:
Onsite measurements.
Value of data applied for the purpose of calculating expected emission reductions in section B.5
Not used in ex-ante estimates.
Description of measurement methods and procedures to be applied:
If implemented, meter readings of electricity will be used to quantify the generation made by the captive power plant.
QA/QC procedures to be applied:
Cross check measurement results with records for sold electricity where relevant. It will be recorded each hour, and aggregated annually.
Any comment: - Data / Parameter: COEFi,j Data unit: tCO2 / [mass or volume unit] Description: CO2 emission coefficient of fuel type i in year y Source of data to be used:
Calculated as per the “Tool to calculate project emissions from electricity consumption”.
Value of data applied for the purpose of calculating expected emission reductions in section B.5
Not used for ex-ante estimations
Description of measurement methods
As per the “Tool to calculate project emissions from electricity consumption”.

PROJECT DESIGN DOCUMENT FORM (CDM PDD) - Version 03.1. CDM – Executive Board page 37 and procedures to be applied: QA/QC procedures to be applied:
As per the “Tool to calculate project emissions from electricity consumption”.
Any comment:
B.7.2 Description of the monitoring plan: The responsible entity for the monitoring system is Promotora Ambiental S.A.B de C.V. personnel. The monitoring activities will primarily involve two types of personnel: the Field Technician and the System Manager. The Field Technician will perform activities such as monitoring and adjusting LFG extraction wells, checking operations of the blower and flare, recording data at the blower/flare station, routine maintenance of collection system components, preparing daily logs and completing check lists, and reviewing data with the System Manager. The System Manager’s responsibilities include reviewing the data collected both manually by the Field Technician and the one recorded automatically by analytical equipment, making recommendations and/or implementing system adjustments to maximize methane capture and destruction, scheduling monitoring and O&M activities, performing quality assurance checks on operations, coordinating with system component manufacturers as needed, to maintain proper operations and calibration, and compiling data as required by the Methodology. Project Management Responsibility The project implementation and operation will be under the direct supervision of the Landfill Manager. Technical documentation on the monitoring and maintenance plan has been developed by Promotora Ambiental S.A.B. de C.V.
Research and Development Manager
Culiacan Northern Landfill Manager
System’s Manager
Field Technician Documentation Department

PROJECT DESIGN DOCUMENT FORM (CDM PDD) - Version 03.1. CDM – Executive Board page 38
Figure 3.- Organization chart The quality actions that will guarantee the success of the monitoring plan are the following: Maintenance Plan The following aspects are core to the maintenance of the monitoring system in order to assure proper data monitoring during the project:
• Equipment preventive maintenance • Spare Parts to avoid unwanted stops • Equipment calibration
Monitoring Frequency As noted above, most of the data at the flare station will be automatically recorded on a continuous basis. Under normal operation, monitoring of the collection system (extraction wells) will be conducted on a monthly or more frequent basis. During the first 3 months of operation, weekly monitoring and adjustments are anticipated. Future monitoring frequencies will be based on the results of the initial collection system monitoring. Sometimes, certain extraction wells require more frequent adjustments than others. The flare station operation will be observed on a daily workday basis by the Field Technician. Data to be recorded manually during these observations will include current LFG flow rate, methane content, flare temperature, which blowers are in operation, running time on each blower, blower bearing temperatures (if applicable), pressure drop across the flame arrester and condensate knockout pot, and liquid level in the knockout pot. Although this manually collected information is not normally needed for CER quantification, it is a best management practice to alert the technician of changed conditions and may serve as a backup to electronic data that is lost or corrupted. Data Analysis The collected data will be reviewed and analyzed on a daily basis by the System Manager. In case of a drift of one parameter the Manager or Technician can react quickly to fix potential problems. All data required for

PROJECT DESIGN DOCUMENT FORM (CDM PDD) - Version 03.1. CDM – Executive Board page 39 the emission reduction calculations will be kept in the onsite-monitoring database. This information will be reported to Promotora Ambiental S.A.B. de C.V. Training of Monitoring Personnel At least once a year the monitoring personnel will be trained internally or externally. Training will include:
• Landfill gas collection system balancing • Calibration of monitoring equipment • Impact of the monitoring on the CDM activity • Safety refresher
Emergencies Procedures The flare will be equipped with a telemetry system to notify the Field Technician in case the flare is shut down. If the flare is shut down, no landfill gas will be combusted and no credits will be claimed during this period. The running hours of the flares will be monitored as part of the monitoring procedures. In case of failure of one of the monitoring devices, portable instruments will be used in order to carry out periodic daily monitoring of the missing parameter(s). These data will be recorded on paper. Calibration of the measurement equipment The calibration of the measurement equipment and/or monitoring will be done periodically, considering the valid date of an official calibration document form, whenever applicable, and from qualified companies/entities. Periodical Inspection Inspections will be carried out by the person in charge of the technical team, related to: overview of the operation; inspection of the equipment and analysis of the data collected and indexes of maintenance and regularity of the functioning of the equipment.

PROJECT DESIGN DOCUMENT FORM (CDM PDD) - Version 03.1. CDM – Executive Board page 40
Figure 4. Monitoring system chart
Procedures for record handling The data will be recorded through a “data logger”. The manufacturer has a program where the file can be converted into a spreadsheet with a specific format. This file can be directly used for the verification report, The manufacturer has experience in landfill gas monitoring systems. The data from the analyzer will be sent by analog output signals to a data acquisition and storage machine, or data logger, to record results. Each of these signals will be connected to the data logger, which reads the signals and stores them in its memory for 6 months. The data logger is connected to a computer that downloads the data stored in the data logger’s memory from time to time in order to keep a historic backup of the data. This computer will store the data for the entire period of the project and two years after. Software will be installed on the computer that will allow a graph of each of these signals to be displayed on the screen and the rough and validated data to be uploaded to a web site accessible by password. Procedures for dealing with monitoring data adjustments and uncertainties The verification report will assess the uncertainty associated with each category of adjustments. All data will be kept on site for the duration of the crediting period plus 1-2 years. Procedures for internal audits, performance reviews and corrective actions to be taken On a monthly basis, the technical team will review the performance of the project activity. This team will be responsible for the day-to-day operation of the landfill gas collection and flaring system, they would also be
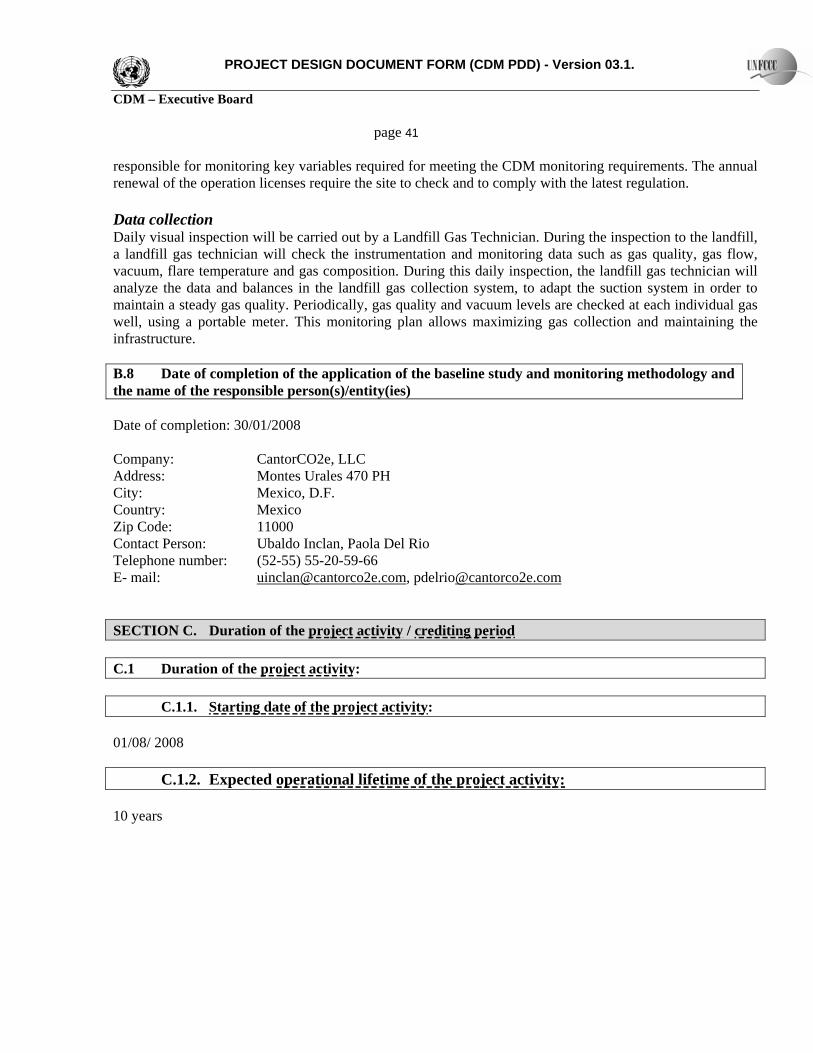
PROJECT DESIGN DOCUMENT FORM (CDM PDD) - Version 03.1. CDM – Executive Board page 41 responsible for monitoring key variables required for meeting the CDM monitoring requirements. The annual renewal of the operation licenses require the site to check and to comply with the latest regulation. Data collection Daily visual inspection will be carried out by a Landfill Gas Technician. During the inspection to the landfill, a landfill gas technician will check the instrumentation and monitoring data such as gas quality, gas flow, vacuum, flare temperature and gas composition. During this daily inspection, the landfill gas technician will analyze the data and balances in the landfill gas collection system, to adapt the suction system in order to maintain a steady gas quality. Periodically, gas quality and vacuum levels are checked at each individual gas well, using a portable meter. This monitoring plan allows maximizing gas collection and maintaining the infrastructure. B.8 Date of completion of the application of the baseline study and monitoring methodology and the name of the responsible person(s)/entity(ies) Date of completion: 30/01/2008 Company: CantorCO2e, LLC Address: Montes Urales 470 PH City: Mexico, D.F. Country: Mexico Zip Code: 11000 Contact Person: Ubaldo Inclan, Paola Del Rio Telephone number: (52-55) 55-20-59-66 E- mail: [email protected], [email protected] SECTION C. Duration of the project activity / crediting period C.1 Duration of the project activity: C.1.1. Starting date of the project activity: 01/08/ 2008 C.1.2. Expected operational lifetime of the project activity: 10 years

PROJECT DESIGN DOCUMENT FORM (CDM PDD) - Version 03.1. CDM – Executive Board page 42 C.2 Choice of the crediting period and related information: C.2.1. Renewable crediting period C.2.1.1. Starting date of the first crediting period: Not applicable C.2.1.2. Length of the first crediting period: Not applicable C.2.2. Fixed crediting period: C.2.2.1. Starting date: 01/08/ 2008 C.2.2.2. Length: 10 years SECTION D. Environmental impacts D.1. Documentation on the analysis of the environmental impacts, including transboundary impacts: The environmental impacts associated with the construction and operation of this project is discussed below. Vegetation Landfill gas collection will improve landfill surface and vegetation. To reduce surface emissions on the landfill, we will be creating a more suitable environment for vegetation to grow. Landfill gas in the soil and air tend to prevent vegetation from growing, which is why there is currently no vegetation on the Northern Landfill Gas Project. Water quality

PROJECT DESIGN DOCUMENT FORM (CDM PDD) - Version 03.1. CDM – Executive Board page 43 Landfill gas condensate will be collected by condensate traps and returned to a leachate treatment facility subject to forced evaporation. The project will reduce aquifer and underground impact due to the inadequate disposition of the leachates in the place. Air Quality The implementation of the LFG collection and flaring system will significantly decrease the environmental impacts that occur under the present operating conditions of the landfill site. Methane and other compounds which are normally released from landfills that do not contain a LFG collection and flaring system will be greatly reduced. As discussed in Section B2, the project activity will generate 72,950 tonnes of CO2e emission reductions. This represents a significant reduction of GHG emissions from the landfill site. The control of LFG emissions through the employment of the LFG collection and flaring system represents many significant environmental and health benefits to the landfill site and local areas including:
• Reduction of LFG migration throughout the landfill. • Improvement of landfill surface and vegetation. • Sustained local wildlife habitats. • Increased safety of landfill site operations through decreased potential for landfill fires. • Reduction of GHG emissions to the atmosphere. • Reduction in pollution from volatile organic compound (VOC) • Reduction of acid rain • Reduction of nuisance odors. • Reduction of health problems related to the landfill (respiratory distress, asthma, asphyxia). • Enhancement of the quality of life and the public safety for the population living close to the landfill.
Noise The use of an enclosed flare will reduce the emitted noise from the system. Visual impact The operation of the LFG collection will not have environmental impacts on the surrounding areas of the landfill. D.2. If environmental impacts are considered significant by the project participants or the host Party, please provide conclusions and all references to support documentation of an environmental impact assessment undertaken in accordance with the procedures as required by the host Party: No significant environmental impacts SECTION E. Stakeholders’ comments E.1. Brief description how comments by local stakeholders have been invited and compiled:

PROJECT DESIGN DOCUMENT FORM (CDM PDD) - Version 03.1. CDM – Executive Board page 44 The stakeholder meeting was held at the Lucerna Hotel, in Culiacan, Sinaloa, Mexico, on November 30th, 2007. The participants were the project developer and stakeholders comprising representatives from the federal and local governments (both State and Municipal levels), deputy’s chamber and neighborhoods that included local population, professionals and NGOs. All of the stakeholders identified received an invitation by mail and a call a few days before the event.
The stakeholders meeting included: a presentation of Promotora Ambiental S.A.B by Alfonso Martínez, who described the project and project technology, an explanation of the Kyoto, environmental and economic benefits of the project, and a period for questions and comments. During the meeting, Paola Del Rio, from the company CantorCO2e presented a description of the CDM process, the objective of the consultation and its implications. Overall participants showed interest on the project and made some comments (below). After the presentation doubts were cleared and Promotora Ambiental S.A.B gave a questionnaire to each participant to ask their opinion about the project, their concerns and if they agreed with the development of the project. List of participants that participated in the event: Name Position/Labor

PROJECT DESIGN DOCUMENT FORM (CDM PDD) - Version 03.1. CDM – Executive Board page 45 1 Ma. De Jesus Millar Municipal worker 2 Antonia Barraza Secretary 3 Petra García Administrative at Municipal Presidency 4 Evangelina García Municipal Presidency 5 David Aguilar Autonomous University of Sinaloa 6 Claudia Camacho City Council 7 Salvador Aragón Autonomous University of Sinaloa 8 Juan Lopez Ortiz Autonomous University of Sinaloa 9 José Gabriel A. Autonomous University of Sinaloa 10 Jesus Manuel López City Council 11 Rosario Medrano City Council 12 Sergio Torres Congress 13 Raúl Terrazas Ecoregion 14 Carlos Contreras Municpal Ecology 15 Lorenzo Gomez PROFEPA (Federal Environmental Protection) 16 Francisco Picusar PROFEPA (Federal Environmental Protection) 17 Teseni Avendio PROFEPA (Federal Environmental Protection) 18 Rigoberto Felix Díaz JAPAC 19 Miguel Angel Lafraga State Government 20 Rosa Ivera Casten CANACO 21 Tomas Villar City Council 22 Guadalupe Canedo City Council 23 Adriana Sese City Council 24 Raclamés Rubio City Council 25 Santana Felix JAPAC 26 Ma. Carmen Teny SEMARNAT (Ministry of the Environment)

PROJECT DESIGN DOCUMENT FORM (CDM PDD) - Version 03.1. CDM – Executive Board page 46 27 Camerino Aguirre City Council 28 Carlos Llanes City Council 29 Victor Salas Lomas de R 30 Dulce Ma. Saucedo Pracifico
E.1. Brief description how comments by local stakeholders have been invited and compiled: The stakeholder consultation allowed stakeholders to understand the basic concepts regarding climate change, its consequences and the objectives of the Kyoto Protocol, as well as the most important features and benefits of the Project. The consultation was conducted by local and state authorities, as well as Promotora Ambiental S.A.B and CantorCO2e. The consultation was announced in the main local newspaper El Financiero de Culiacan. The consultation was well-attended, with more than 30 members of the community participating, and it lasted approximately 2 hours. Most of the participants represented in the event were local and state officials and others from local communities. Participants filled out registration forms, which were kept in the Project Developer’s files. These, as well as the questionnaires answered by each participant at the meeting are available to the DOE upon request. E.2. Summary of the comments received: Received comments show that stakeholders (both council members and residents) agree with the project. Stakeholders understand that the project generates benefits to the local communities, and general environmental protection. During the consultation, the stakeholders raised various questions regarding the Project and the benefits it may bring to the community, and they are enlisted as follows:
1) When will the project begin? August 2008, the process has started with the digging of three wells. The digging is made to determine depth and for the structure design for the extraction. Afterwards, the closure of the landfill proceeds.
2) What kind of technology will be used for flaring? A closed flare with 98% efficiency. The participant mentioned that the State government supports 100% the development of the project and that the environmental benefit of the project is very important for them.
3) When will Promotora Ambiental recover its investment? It will depend on the market price of the CERs, however CantorCO2e will help us obtain the highest possible price. It is worth mentioning that this kind of projects is perceived as risky because not all projects are registered.
4) Carlos Contreras from Municipal Ecology strongly suggested using biogas for electricity generation.

PROJECT DESIGN DOCUMENT FORM (CDM PDD) - Version 03.1. CDM – Executive Board page 47 The consultation was closed by Promotora Ambiental S.A.B. de C.V. and it was emphasized the importance of feedback from the community for the continuation of the Project and underlined the environmental benefits of this Project over economic benefits. E.3. Report on how due account was taken of any comments received: All questions were addressed at the stakeholder consultation and received comments have been positive so far. The consultation was regarded by the local stakeholders as a helpful event where they understood the project activity and the CDM process.

PROJECT DESIGN DOCUMENT FORM (CDM PDD) - Version 03.1. CDM – Executive Board page 48
Annex 1
CONTACT INFORMATION ON PARTICIPANTS IN THE PROJECT ACTIVITY Organization: Promotora Ambiental S.A.B. de C.V. Street/P.O. Box: Av. Transportistas, 390 Building: City: León State/Region: Guanajuato Postfix/ZIP: 37140 Country: Mexico Telephone: 52 477 2114900 FAX: 52 477 2114902 E-Mail: URL: http://www.gen.tv/ Represented by: Manager of Research and Development Title: Salutation: PhD Last Name: Munoz Middle Name: Martinez First Name: Alfonso Department: R&D Mobile: 8115313173 Direct FAX: 52 8183227600 ext. 194 Direct tel: 52 81227600 ext. 316 Personal E-Mail: Alfonso Martinez Munoz

PROJECT DESIGN DOCUMENT FORM (CDM PDD) - Version 03.1. CDM – Executive Board page 49
Annex 2
INFORMATION REGARDING PUBLIC FUNDING No public funding will be used for this project.

PROJECT DESIGN DOCUMENT FORM (CDM PDD) - Version 03.1. CDM – Executive Board page 50
Annex 3
BASELINE INFORMATION General Information of the Northern Landfill Gas Project
Landfill Information Location Culiacan, Sinaloa Country Mexico Area of the site 100 ha Year of starting operations 1992 Year of landfill closure (Area closure) 2007 Estimated total of tons of waste accumulated at the closure (Area closure) 2.5 million tons of solid waste
General data information
Parameter Unit Value Proportion of methane flared in Baseline
(AF) %
0
Landfill efficiency collection % 60 GWPCH4 t CO2e/tCH4 21
Methane content of landfill gas % 50
USA-EPA Decay model used to estimate emission reduction The model employs a first-order exponential decay function. For sites with known (or estimated) year-to-year solid waste acceptance rates, the model estimates the LFG generation rate in a given year using the following equation, which is published in Title 40 of the U.S. Code of Federal Regulations (CFR) Part 60, Subpart WWW:
( )∑=
−=n
i
ktiekLoMiQ1
2
Where: Q = total methane released in year n (m3/yr)
∑=
n
i 1
=
sum from opening year+1 (I=1) through year of projection (n);
k = rate constant of landfill gas generation (1/yr). Lo = theoretical potential amount of landfill gas generated (m3/tonne)

PROJECT DESIGN DOCUMENT FORM (CDM PDD) - Version 03.1. CDM – Executive Board page 51 M = waste disposal rate (tonnes/yr) e = constant t = time since landfill opened (years) Waste Filling History The historical and projected future filling rates were provided by the Municipality’s personnel. At that time it will have reached a capacity of approximately 2.5 million tonnes. The historical data registered by Municipality personnel is presented in the table below:
Waste filling rate per year in the landfill
Year Waste input
(tonnes) 1992 50,000 1993 55,000 1994 65,000 1995 75,000 1996 85,000 1997 106,000 1998 139,355 1999 172,154 2000 208,067 2001 213,915 2002 223,000 2003 243,351 2004 272,139 2005 273,304 2006 274,370 2007 250,000
Methane Generation Rate Constant [k] The decay rate constant is a function of refuse moisture content, nutrient availability, pH, and temperature. A value of 0.065 per year was used. Methane Generation Potential [Lo] The methane generation potential is the total amount of methane that a unit mass of refuse will produce given enough time. The Lo is a function of the organic content of the waste, water content and precipitation data. A value of 84 m3/tonne of waste was estimated and used by the model. LFG System Coverage or collection efficiency
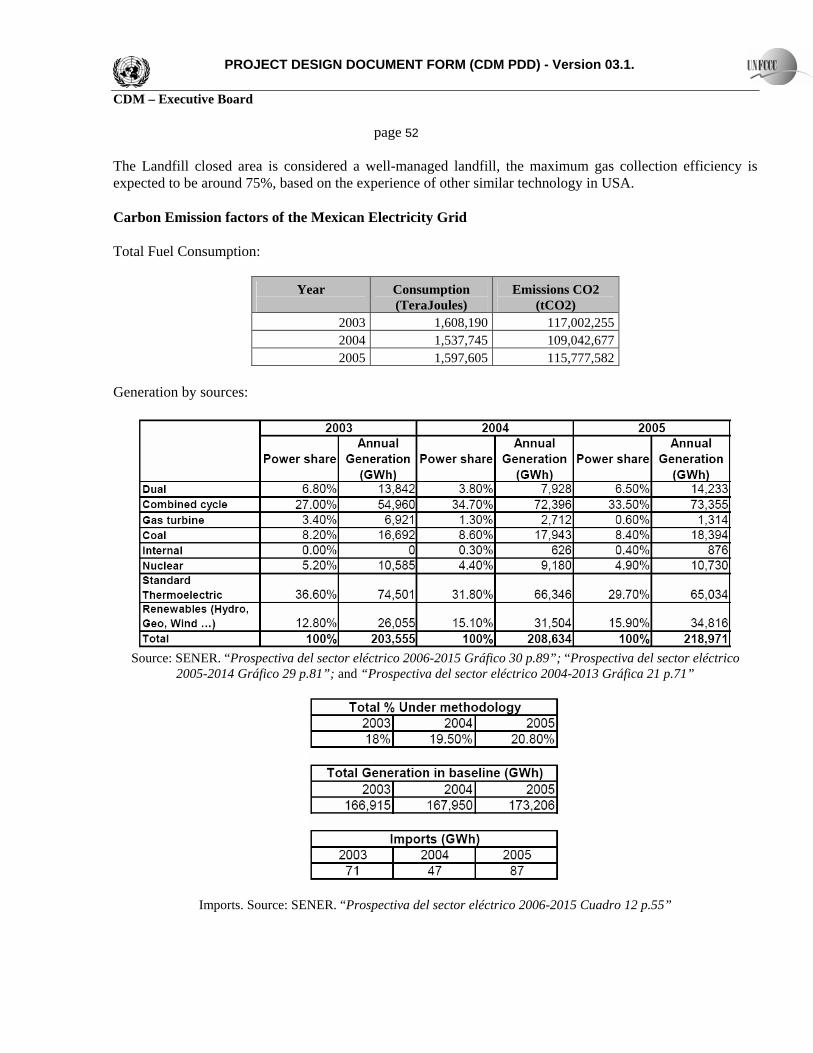
PROJECT DESIGN DOCUMENT FORM (CDM PDD) - Version 03.1. CDM – Executive Board page 52 The Landfill closed area is considered a well-managed landfill, the maximum gas collection efficiency is expected to be around 75%, based on the experience of other similar technology in USA. Carbon Emission factors of the Mexican Electricity Grid Total Fuel Consumption:
Year
Consumption (TeraJoules)
Emissions CO2 (tCO2)
2003 1,608,190 117,002,255 2004 1,537,745 109,042,677 2005 1,597,605 115,777,582
Generation by sources:
Source: SENER. “Prospectiva del sector eléctrico 2006-2015 Gráfico 30 p.89”; “Prospectiva del sector eléctrico
2005-2014 Gráfico 29 p.81”; and “Prospectiva del sector eléctrico 2004-2013 Gráfica 21 p.71”
Imports. Source: SENER. “Prospectiva del sector eléctrico 2006-2015 Cuadro 12 p.55”
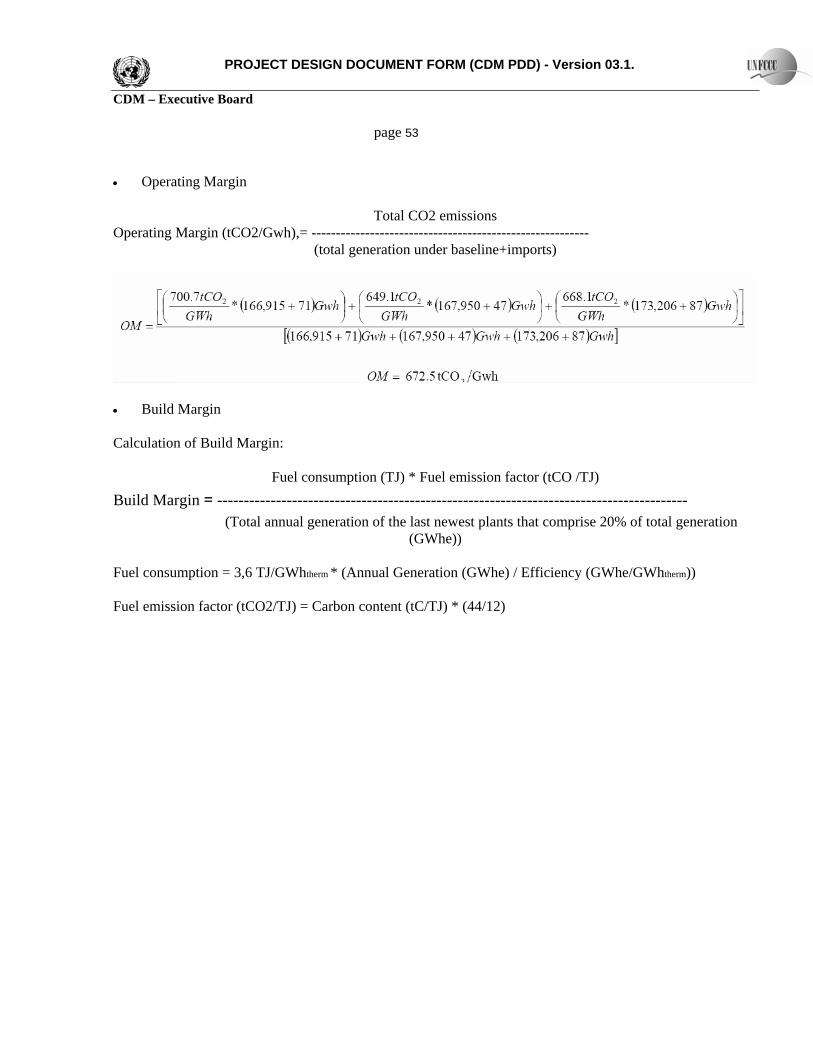
PROJECT DESIGN DOCUMENT FORM (CDM PDD) - Version 03.1. CDM – Executive Board page 53 • Operating Margin
Total CO2 emissions Operating Margin (tCO2/Gwh),= ---------------------------------------------------------
(total generation under baseline+imports)
• Build Margin Calculation of Build Margin:
Fuel consumption (TJ) * Fuel emission factor (tCO /TJ) Build Margin = ----------------------------------------------------------------------------------------
(Total annual generation of the last newest plants that comprise 20% of total generation (GWhe))
Fuel consumption = 3,6 TJ/GWhtherm * (Annual Generation (GWhe) / Efficiency (GWhe/GWhtherm)) Fuel emission factor (tCO2/TJ) = Carbon content (tC/TJ) * (44/12)

PROJECT DESIGN DOCUMENT FORM (CDM PDD) - Version 03.1. CDM – Executive Board page 54
Name Capacity (MW) Technology Fuel typeAnnual
GenerationCumulative percentage Efficiency Fuel Consumption
Additions 2005 0.8 CI DI 1.2 0.00% 47.61 0.1Hol Box La Laguna II 498 CC NG 2,754 1.30% 52.58 188.6Rio Bravo IV 500 CC NG 1,886 2.10% 52.58 129.1Botello 9 HID HID 40 2.10% 90 1.6Baja California Sur I 42.9 CI COM y DIE 121 2.20% 47.61 9.2Yécora 0.7 CI DI 0.4 2.20% 47.61 0Additions 2004Chicoasén (ManuelMoreno Torres) 900 HID HID 592.8 2.50% 90 23.7Rio Bravo III (PIE) 495 CC NG 1,717 3.20% 52.58 117.6El Sauz* 128 CC NG 849 3.60% 52.58 58.1Tuxpan (Pdte. Adolfo 63 TG NG 54 3.70% 38.4 5López Mateos) 1San Lorenzo Potencia 266 TG NG 214 3.80% 38.40 20.1Guerrero Negro II 10.8 CI DI 41.3 3.80% 47.61 3.1Additions 2003Los Azufres 1 6.6 Geo GEO 349.6 3.90% 30 42Calera (bloque)(Arrendamiento) 0 CI DI 0 3.90% 47.61 0El Verde(Arrendamiento) 0 TG NG 0 3.90% 38.4 0Las Cruces(Arrendamiento) 0 TG NG 0 3.90% 0 38.4Dos Bocas (bloque)(Arrendamiento) 0 TG NG 0 3.90% 38.4 0Tuxpan III y IV (PIE) 983 CC NG 5,464 6.40% 52.58 374.1Altamira III y IV (PIE) 1036 CC NG 5,932 9.10% 52.58 406.1Mexicali (PIE) 489 CC NG 2,191 10.10% 52.58 150Transalta Campeche(PIE) 252.4 CC NG 1,782 11.00% 52.58 122Naco Nogales (PIE) 258 CC NG 1,819 11.80% 52.58 124.5Transalta ChihuahuaIII (PIE) 259 CC NG 1,100 12.30% 52.58 75.3Additions 2002Hol Box 0.8 CI DI 1.6 12.30% 47.61 0.1Bajío 565 CC NG 4,698 14.40% 52.58 321.7Altamira II 495 CC NG 3,083 15.80% 52.58 211.1Río Bravo II 495 CC NG 2,279 16.90% 52.58 156.1Monterrey III 449 CC NG 3,147 18.32% 52.58 215.5Valle de México 249.3 TG/CC NG 1,610 19.06% 52.58 110.2El Sauz 129 TG/CC NG 887 19.46% 52.58 60.7El Encino 130.8 TG NG 134 19.52% 38.4 12.5Additions 2001Tres Vírgenes 10 GEO GEO 37 19.50% 30 4.4Saltillo (PIE) 248 CC GAS 1,432 20.19% 52.44 98.3Chihuahua II (ElEncino) 554 CC GAS 3,053 21.59% 209.6 52.44Presidente Juárez 1026 CC COM y GAS 3,772 23.31% 52.44 258.9Hermosillo (PIE) 250 CC GAS 1,316 23.91% 52.44 90.3Tuxpan II (PIE) 495 CC GAS 3,397 25.46% 52.44 233.2El Verde 0 0 0 25.46%Puerto San Carlos 104 CI COM y DIE 586 25.73% 47.61 44.3 New power plants installed. Source: SENER. “Prospectiva del sector eléctrico 2006-2015 Cuadro 13 p.57; Prospectiva del sector eléctrico 2005-2014 Cuadro 14 p.51; Prospectiva del sector eléctrico 2004-2013 Cuadro 9 p.44 and Prospectiva del sector eléctrico 2003-2012 Cuadro 8 p.39”, CFE. “Programa de Obras e Inversiones del Sector Eléctrico 2002-2011 p.2-4” and 2005 Generation data provided by CFE Planning Department. Abbreviations: HID: hydropower plant; GEO: geothermal plant, CC: combined cycle plant, fuelled with natural gas, TG: Gas turbine, fuelled with natural gas (NG). CI: Internal combustion.

PROJECT DESIGN DOCUMENT FORM (CDM PDD) - Version 03.1. CDM – Executive Board page 55 BM factor: 380.16 tCO2/GWh Emission factor ex-ante = 0.50*OM+ 0.50*BM = 526.3 tCO2/GWh

PROJECT DESIGN DOCUMENT FORM (CDM PDD) - Version 03.1. CDM – Executive Board page 56
Annex 4
MONITORING INFORMATION
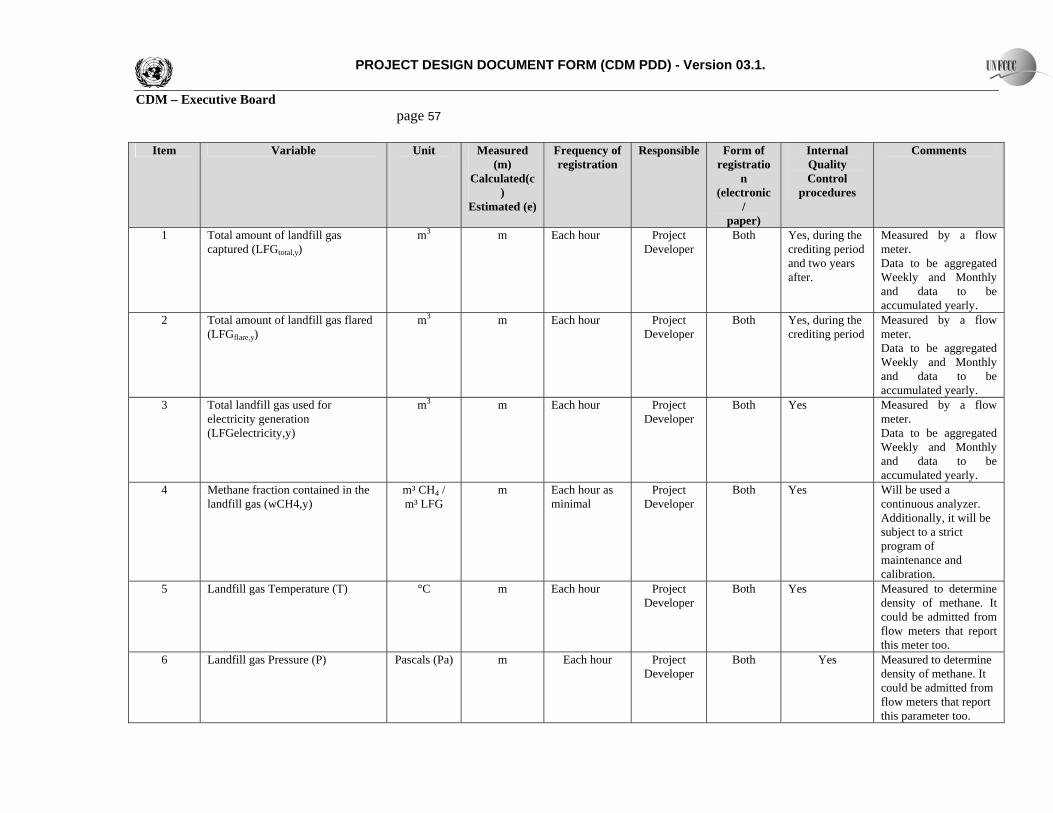
PROJECT DESIGN DOCUMENT FORM (CDM PDD) - Version 03.1. CDM – Executive Board page 57
Item Variable Unit Measured (m)
Calculated(c)
Estimated (e)
Frequency of registration
Responsible Form of registratio
n (electronic
/ paper)
Internal Quality Control
procedures
Comments
1
Total amount of landfill gas captured (LFGtotal,y)
m3 m Each hour Project Developer
Both Yes, during the crediting period and two years after.
Measured by a flow meter. Data to be aggregated Weekly and Monthly and data to be accumulated yearly.
2
Total amount of landfill gas flared (LFGflare,y)
m3
m
Each hour Project Developer
Both Yes, during the crediting period
Measured by a flow meter. Data to be aggregated Weekly and Monthly and data to be accumulated yearly.
3
Total landfill gas used for electricity generation (LFGelectricity,y)
m3
m Each hour Project
Developer Both Yes Measured by a flow
meter. Data to be aggregated Weekly and Monthly and data to be accumulated yearly.
4
Methane fraction contained in the landfill gas (wCH4,y)
m³ CH4 / m³ LFG
m
Each hour as minimal
Project Developer
Both Yes Will be used a continuous analyzer. Additionally, it will be subject to a strict program of maintenance and calibration.
5
Landfill gas Temperature (T)
°C
m Both Project Developer
Each hour
Yes Measured to determine density of methane. It could be admitted from flow meters that report this meter too.
6
Landfill gas Pressure (P)
Pascals (Pa) m Each hour Project Developer
Both Yes Measured to determine density of methane. It could be admitted from flow meters that report this parameter too.

PROJECT DESIGN DOCUMENT FORM (CDM PDD) - Version 03.1. CDM – Executive Board page 58
The following variables correspond to Project Emissions from flaring gases containing methane (PEflare,y) in the enclosed flare.
Item Variable Unit Measured (m)
Calculated(c)
Estimated (e)
Frequency of registration
Responsible Form of registratio
n (electronic
/ paper)
Internal Quality Control
procedures
Comments
For electricity engine generator, the instrument will be subject to maintenance programs and test applications to accurate its exactitude.
7
Net electricity generation (ELLFG) MWh m Each hour Project Developer
Both Yes
Daily Project Hours m 8
Hours of operation of the electrical plant Developer
Both No It will be registered the real hours of operation of the electrical engine generators.
9
Hours of operation of the in flare station
Hours m Daily Project Developer
Both No It will be registered the real hours of operation of the enclosed flare.
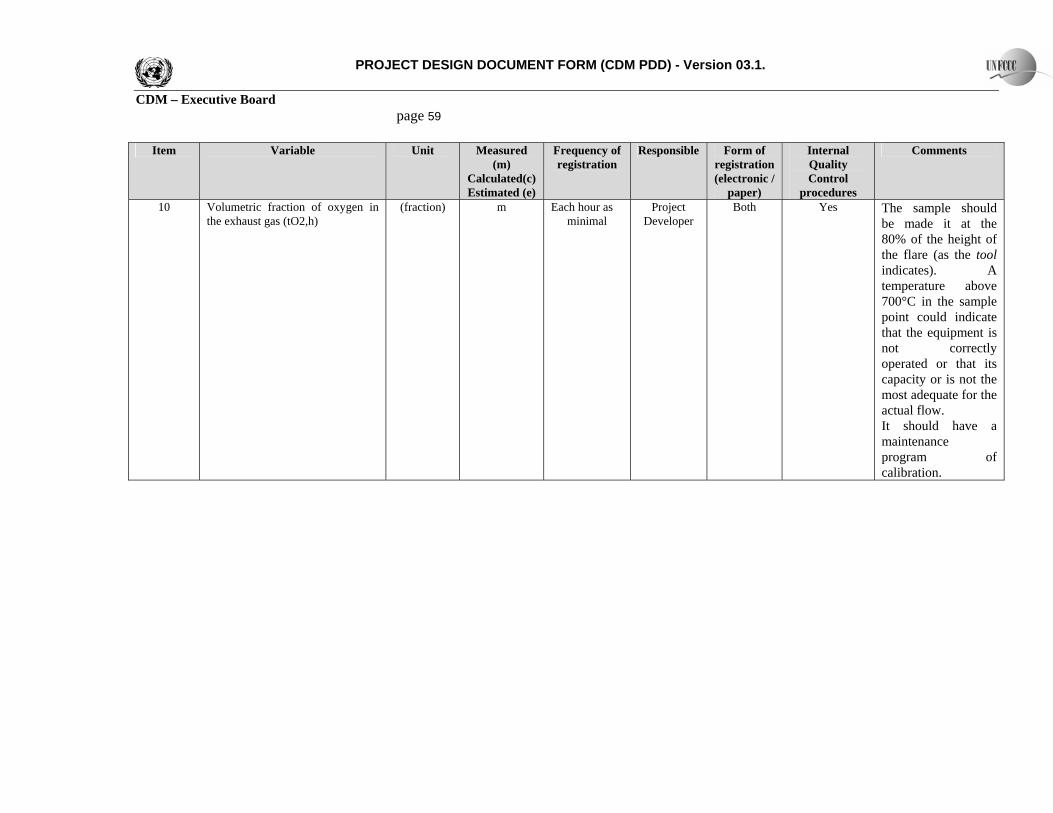
PROJECT DESIGN DOCUMENT FORM (CDM PDD) - Version 03.1. CDM – Executive Board page 59
Item Variable Unit Measured (m)
Calculated(c) Estimated (e)
Frequency of registration
Responsible Form of registration (electronic /
paper)
Internal Quality Control
procedures
Comments
10 Volumetric fraction of oxygen in the exhaust gas (tO2,h)
(fraction) m Each hour as minimal
Project Developer
Both Yes The sample should be made it at the 80% of the height of the flare (as the tool indicates). A temperature above 700°C in the sample point could indicate that the equipment is not correctly operated or that its capacity or is not the most adequate for the actual flow. It should have a maintenance program of calibration.

PROJECT DESIGN DOCUMENT FORM (CDM PDD) - Version 03.1. CDM – Executive Board page 60
The following variables correspond to Project Emissions for electrical consumption (PEEC,y), such as blowers, use of the electrical grid, among others.
Item Variable Unit Measured (m)
Calculated(c) Estimated (e)
Frequency of registration
Responsible Form of registration (electronic /
paper)
Internal Quality Control
procedures
Comments
11 m mg/m3
(Could be in ppmv or
%)
Methane concentration in the exhaust gas (on the exit of the enclosed flare) (fvCH4,FG,h)
Each hour as minimal
Project Developer
Both Yes The simple should be made it at the 80% of the height of the flare. A temperature above 700°C in the sample point could indicate that the equipment is not correctly operated or that its capacity or is not the most adequate for the actual flow. It should have a maintenance program of calibration.
12 Temperature in the exhaust gas of the flare (Tflare)
°C m Each hour Project Developer
Both Yes It should be employed a thermocouple, N type. A temperature above 500°C in the sample point could indicate that considerable quantities of gases are still being flared. The thermocouples will be replaced and/or calibrated each year.

PROJECT DESIGN DOCUMENT FORM (CDM PDD) - Version 03.1. CDM – Executive Board page 61
5 Applies only for cases B2 and C1 of the tool.
Item Variable Unit Measured (m)
Calculated(c) Estimated (e)
Frequency of Responsible Form of registration (electronic /
paper)
Internal Quality Control
procedures
Comments registration
13 Average technical transmission and distribution losses in the grid for the voltage level at which electricity is obtained from the grid at the project site (TDLy)
% e Annual check Project Developer
paper No Within the same type of voltage, it should be estimated for the electrical losses in the transmission and distribution of electricity in the grid. This data is intended to be updated if proper information is available, if not, it will be used the default data suggested by the “Tool to determine the project emissions from flaring gases containing methane”, which is 20%.
m Each hour Project Developer
Both Yes 14 Quantity of fossil fuels used in the captive power plant (FCk,i,y)
m3, tons, or liters (According to the type of fossil fuel employed.)
Only, If in the landfill is used a captive power plant, it should be used weight or volume meters. The consistency of metered fuel consumption quantities should be cross-checked with an annual energy balance that is based on purchased quantities and stock changes. This applies for captive power plants.5

PROJECT DESIGN DOCUMENT FORM (CDM PDD) - Version 03.1. CDM – Executive Board page 62
Item Variable Unit Measured (m)
Calculated(c) Estimated (e)
Frequency of registration
Responsible Form of registration (electronic /
paper)
Internal Comments Quality Control
procedures 15 Total net amount of electricity
produced by captive power plant k. (EGk,y)
MWh m Each hour Operator or Project Developer
Both Yes If applies, it is the electricity produced by the captive power plant. It will be cross checked with records for sold electricity where relevant.