clariant story 2018 - swiss equities conference€¦ · 2 clariant story 2018 ... paper and textile...
TRANSCRIPT

Clariant Story
January, 2019

Clariant Investor Relations
Disclaimer
Clariant Story 20182
This presentation contains certain statements that are neither reported financial results nor other historical
information. This presentation also includes forward-looking statements.
Because these forward-looking statements are subject to risks and uncertainties, actual future results may
differ materially from those expressed in or implied by the statements. Many of these risks and
uncertainties relate to factors that are beyond Clariant’s ability to control or estimate precisely, such as
future market conditions, currency fluctuations, the behavior of other market participants, the actions of
governmental regulators and other risk factors such as: the timing and strength of new product offerings;
pricing strategies of competitors; the Company’s ability to continue to receive adequate products from its
vendors on acceptable terms, or at all, and to continue to obtain sufficient financing to meet its liquidity
needs; and changes in the political, social and regulatory framework in which the Company operates or in
economic or technological trends or conditions, including currency fluctuations, inflation and consumer
confidence, on a global, regional or national basis.
Readers are cautioned not to place undue reliance on these forward-looking statements, which apply only
as of the date of this document. Clariant does not undertake any obligation to publicly release any revisions
to these forward-looking statements to reflect events or circumstances after the date of these materials.

Clariant Today

Clariant Investor Relations
Clariant at a glanceA GLOBALLY LEADING COMPANY IN SPECIALTY CHEMICALS
Clariant Story 20184
Business AreasNet income 2017 (CHF m)Sales 2017 (CHF m)
6377 302 4
18 135EBITDA 2017 (CHF m)
before exceptionals
15.3 %974EBITDA margin 2017
before exceptionals
Employees 2017
156 in 52companies countries

Clariant Investor Relations
Eight successive years of EBITDA* margin growth
Clariant Story 20185
Enhanced and more resilient product
portfolio due to continuous focus on
innovation, sustainability, portfolio
repositioning and operational efficiency
Clariant Excellence achieved cumulated
net benefits of CHF 755 m in the last 6
years
Further saving potential via
implementation of shared service
centers
EBITDA bei* margin rose continually not
only the last 5 years, but 8 years in
succession
Absolute EBITDA bei* grew by approx.
7 % p.a. on a cumulative basis since
2015
* before exceptional items

Clariant Investor Relations
Focus on Operating Cash Flow
Clariant Story 20186
Focus on cash flow
Continuous rise in cash flow until 2016
In 2017, operating cash flow negatively
impacted by temporarily higher one-off
costs and higher net working capital as a
result of brisk demand in Q4 2017 and
anticipated strong demand in Q1 2018
In 2018, intention to again improve
operating cash flow generation as a
result of a
Continued EBITDA* improvement
Focus on net working capital
management
Lower one-off charges
* before exceptional items
2013: divestment of Leather, Paper and Textile businesses
Clariant Investor Relations
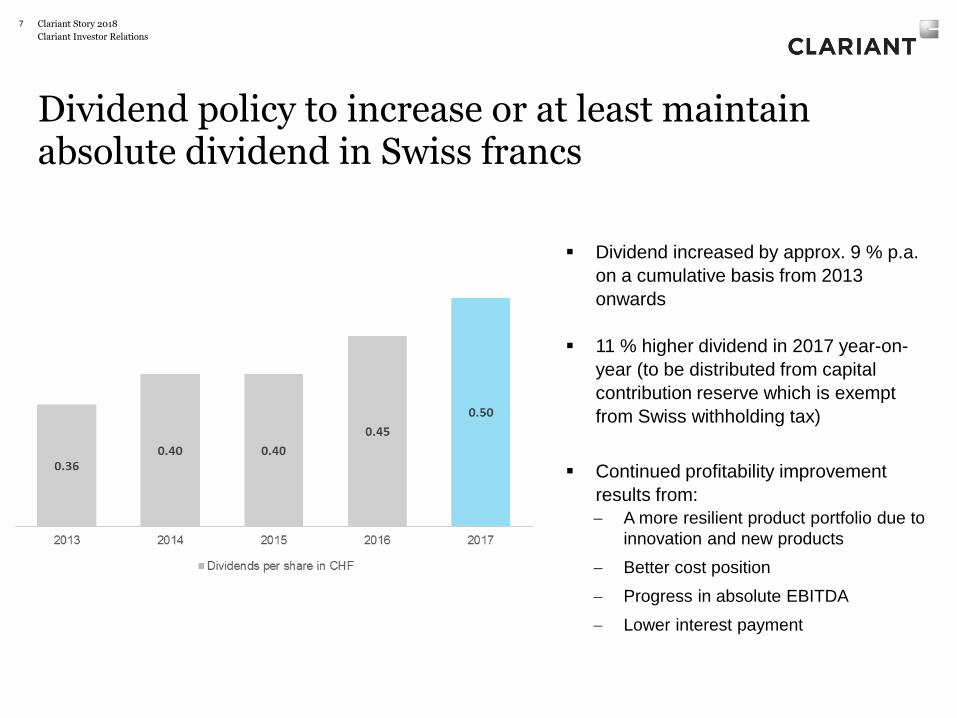
Dividend policy to increase or at least maintain absolute dividend in Swiss francs
Clariant Story 20187
Dividend increased by approx. 9 % p.a.
on a cumulative basis from 2013
onwards
11 % higher dividend in 2017 year-on-
year (to be distributed from capital
contribution reserve which is exempt
from Swiss withholding tax)
Continued profitability improvement
results from:
A more resilient product portfolio due to
innovation and new products
Better cost position
Progress in absolute EBITDA
Lower interest payment

Clariant Tomorrow

Clariant Investor Relations
The new, stronger Clariant
9
• Creation of Business Area High Performance Materials (HPM) through the combination of Clariant’s Additives & high
value Masterbatches with parts of SABIC’s Specialties business
• HPM will be a uniquely positioned provider of highly customized high performance materials and solutions
• Divestment of Pigments, standard Masterbatches and Medical Specialties by 2020E
• Attractive prospects in Care Chemicals, Catalysis and Natural Resources
• Portfolio upgrade allows Clariant to be focused around customer-specific, technologically advanced applications with
high growth and value generations
Step change
into higher
value
specialties
• Signing of a Memorandum of Understanding to form newly created Business Area High Performance Materials
• Clariant to hold the majority stake in the combination
• Equalization consideration will be made by Clariant to SABIC, valuation dependent
• Realization of cost synergies and enhanced operational efficiencies of CHF 100m until end 2022E
• Net debt (incl. pensions) / EBITDA pro-forma 2019E leverage* not to exceed 2.4 x based on the current portfolio
• Completion expected end 2019, effective as of 1 January 2020, subject to reciprocal due diligence and regulatory
clearances
• Significantly EPS accretive in first year (2020E)
Creation of
High
Performance
Materials
• Sales to reach approx. CHF 9 bn in 2021E post creation of HPM and divestments
• Sales growth upgrade to 5 - 6 % p.a., driven by the Group’s enhanced growth profile
• EBITDA margin after exceptional items to rise to approx. 20 % by 2021E
• Operating cash flow increase to above CHF 1.2 bn in 2021E
Financial
Highlights
* including SABIC’s Specialties business and Clariant’s current portfolio set-up (before divestments)
Clariant Story 2018

Clariant Investor Relations
Clariant makes step change into higher value specialties
10
CATALYSIS
BA Catalysis comprises the BU
Catalysts and the Business Line
Biofuels & Derivatives. It develops,
manufactures, and sells a wide
range of catalyst products for the
chemical and fuel industries which
contribute significantly to value
creation in our customers’
operations, ensuring that finite raw
materials and energy are used
efficiently. In addition, Catalysis is in
the forefront of new market
developments such as the
commercialization and licensing of
bio-ethanol.
NATURAL
RESOURCES
BA Natural Resources, comprises the
BUs Oil & Mining Services and
Functional Minerals. It is
characterized by high growth and low
cyclicality as well as a strong
megatrend orientation. Main drivers
are the rising demand for high value-
added specialty chemicals used in
the oil, mining, food and packaging
industries and the increased
consumption of oil, gas and base
metals, driven by the fast-growing
economies.
CARE
CHEMICALS
BA Care Chemicals comprises the
BU Industrial & Consumer
Specialties (ICS), Food additives as
well as the future Industrial
Biotechnology business. It
demonstrates a clear focus on highly
attractive, high- margin, and low-
cyclicality segments. The BA follows
a lifestyle-driven megatrend and
strengthens Clariant’s position as a
supplier of green and sustainable
products.
HIGH PERFORMANCE
MATERIALS
Business Area (BA) High Performance
Materials comprises the businesses
Additives, high value Masterbatches
and high performance thermoplastics.
Major applications include smart
electronics, health care, aerospace,
automotive, robotics, additive
manufacturing, renewable energy, as
well as e-mobility. These applications
demand differentiated fulfillment of
customer specifications which require
exclusive technology and formulation
know-how.
Sales growth
expectation p.a. 5 - 7 %
EBITDA
margin ambition 2021E19 - 21 %
Sales growth
expectation p.a. 6 - 9 %
EBITDA
margin ambition 2021E26 - 30 %
Sales growth
expectation p.a. 6 - 7 %
EBITDA
margin ambition 2021E16 - 17 %
Sales growth
expectation p.a. GDP
Steered for absolute EBITDA and
cash flow generation
Sales growth
expectation p.a. 6 - 9 %
EBITDA
margin ambition 2021E24 - 25 %
PLASTICS &
COATINGS
BA P&C comprises the Pigments
business (pigments, preparations
and dyes used primarily in coatings,
plastics, printing and consumer
goods), standard Masterbatches for
the plastics industry and converters
as well as Medical Specialties. The
BA is typically subject to GDP growth
and economic cycles due to its
highly diversified end applications.
Main drivers are the increasing use
of plastic applications, as well as the
steadily growing demand for more
sustainable coating solutions.
* reporting structure as of 01.01.2019
Clariant Story 2018

Clariant Investor Relations
New Clariant - financial outlook 2021E
11 Clariant Story 2018
Note: combined business foreign exchange rate assumption of 1.0 USD = 1.0 CHF; 2021E at stable 2018 FX rates
* including SABIC’s Specialties business and Clariant’s current portfolio set-up
(before divestments)

Group Strategy

Clariant Investor Relations
Strategic direction
• Our strategy is to leverage our operational efficiency to effectively seize the profitable growth
opportunities arising from global challenges
• Clariant is well positioned to deliver innovative, sustainable products and solutions which
address the increasing demand for more convenience, stricter safety requirements and tighter
environmental regulations as well as improved energy efficiency
• Our customer-specific product portfolio, technology and solution offerings will allow for an
above-average top-line growth, profitability progression as well as a resilient and improving
operating cash flow
13
Clariant, your dedicated and strong partner who provides innovative, specialized solutions
for profitable growth and a sustainable tomorrow.
Clariant Story 2018

Clariant Investor Relations
Group strategy with enhanced product and solution offering
14
Continuous
developments
Portfolio
upgrade
• Increased scale
• Upgraded higher
margin specialties
portfolio
• Additional R&D and
commercial
opportunities
• Digitally-enabled
differentiated operating
models according to
their degree of
specialization
• Product and solution
offering upgrade with
higher profitability
• Enhanced processes
to increase cost
efficiency
• Driven by new
products through
innovations and
customer
specifications
• Above industry
segments' growth
• Strengthen position
in core growth
markets (China,
North America)
• Commercialization of
sustainability (green,
renewable and
ecological products)
• Capture recycling
opportunities
• Mitigation of risk
• Continued product
differentiation and
customer
specification
• Capturing digital
business model
opportunities
• Thought leadership
in disruptive
technology fields
through R&D
INCREASE
PROFITABILITY
5
FOCUS ON
INNOVATION AND
R&D
1
ADD VALUE WITH
SUSTAINABILITY
2
INTENSIFY
GROWTH
4
REPOSITION
PORTFOLIO
3
• Advanced product
and solutions
replacing previous
offering
Clariant Story 2018

Clariant Investor Relations
Total pipeline of CHF 2.1 bn
15
Future peak sales in CHF
> CHF 100m
2017 2018 2019 2020 Launch date
Profitability
CUSTOMER-SPECIFIC
CATALYST
(Catalysis)
RENEWABLE AND BIODEGRADABLE
PRODUCTS CONSUMER CARE
(Care Chemicals)
ADDITIVES
(High Performance Materials)
LIGNOCELLULOSIC ETHANOL
(Catalysis)
INNOVATION FOR OIL
RECOVERY
(Natural Resources)
SEDIMENT MANAGEMENT
(Natural Resources)
PETROCHEMICALS
(Catalysis)
CONSUMER CARE
(Care Chemicals)
SYNGAS
(Catalysis)
CROP SOLUTIONS
(Care Chemicals)
CHF 50 - 100m
CHF 20 - 50m
< CHF 20mInnovation pipeline examples
Clariant Story 2018

The new, stronger Clariant

Clariant Investor Relations
High Performance Materials – customer-specific solutions
creating the basis for accelerated profitable growth
Clariant Story 201817
• Customer-specific and application know-how driven offering for:
thermoplastics for demanding thermo-electro-optical and mechanical
environments, specialty additives and masterbatches in tandem with an
outstanding global compounding platform
• Major applications: smart electronics, health care, aerospace, automotive,
robotics, additive manufacturing, renewable energy as well as e-mobility
• Exclusive technology and formulation know-how allow for fulfillment of
stringent customer specifications
• Enhanced market and customer reach, cost synergies and enhanced
operating efficiencies to fuel substantial profitability progression and unlock
greater value creation
• By 2021E, sales expected to grow to approx. CHF 4 bn
from pro-forma 2017 sales of CHF 3 bn
• EBITDA margin (2021E), incl. synergies, at 24 - 25 %
from 19.4 % in pro-forma 2017
FINANCIAL PERFORMANCE (EBITDA margin after exceptional items)
Sales growth 2017 – 2021E 6 – 9 %*
EBITDA margin a.e.i. 2021E 24 - 25 %
* per annumNote: combined business foreign exchange rate assumption of 1.0 USD = 1.0 CHF; 2021E at stable 2018 FX rates
OUTLOOK

Clariant Investor Relations
High performance polymers and compounds
Clariant Story 201818
Note:
(1) PPE is a specialty engineering polymer and can be categorized in-between engineering and high-performance polymers according to industry
experts; PPE has a range of high value and high margin applications where it competes with high-performance polymers.
(2) TS&A: Thermosets & Additives business line
(3) PCB = Printed Circuit Boards
Source: IHS Chemicals, expert interviews, MarketsandMarkets
HIGH PERFORMANCE
POLYMERS (HPP)
ENGINEERING
POLYMERS
COMMODITY
POLYMERS
ULTEM ™ resin
NORYL™(1) resin, TS&A(2)
(PPE Oligomers for PCBs)(3)
LNP™ compounds
& copolymers
ULTEM™ resin is a high performance
thermoplastics resins (PEI), which provides high
thermal, high strength, flame resistant properties
NORYL™ resin is a specialty engineering polymer
(PPE), which combines the benefits of PPE with
excellent dimensional stability, good processability
and low specific gravity
LNP™ compounds and copolymers consist of
unique combinations of resin system, fillers, additives
and flame retardants
High thermal stability
Low thermal
stability
Medium thermal stability
Information and images are courtesy of SABIC.

Clariant Investor Relations
Clariant Story 201819
Care Chemicals – further accelerating into becoming a leading
innovative and sustainable solution provider
STRATEGY OUTLOOK
• Continue to grow more quickly than the market by:
Increasing offering of sustainable products and solutions by supporting
the expanding demand for sustainable and “ecological” products
coupled with demand for convenience
Strengthening exposure in strategic regions: North America and China /
Asia
• Focus on growing Consumer Care business:
Personal Care (natural ingredients and active ingredients anticipating
the future beauty trends)
Home Care (sustainability and convenience)
Crop Solutions (precision application, delivery and crop yield increase)
• Improve profitability by moving towards more individualized, customer-
specific products with scalability mainly in Consumer Care
UPDATED OUTLOOK
Sales growth 2017 – 2021E 5 – 7 %*
EBITDA margin a.e.i. 2021E 19 - 21 %
FINANCIAL PERFORMANCE (EBITDA margin after exceptional items)
* per annum

Clariant Investor Relations
Clariant Story 201820
Care Chemicals
PRODUCT INNOVATIONS
− Genadvance: enables much improved hair conditioning
performance via sustainable formulations using natural ingredients.
Genadvance currently provides 3 new conditioning ingredients (i.e.
hair shine, hair and scalp moisturization and hair repair)
− Smart surface cleaning offering: entry into new market segment of
a hard surface cleaner which combines several consumer benefits in
one product thus meeting customer’s demand for convenience: i.e.
reducing cleaning time and effort while having additional
performance properties of shine and repair
− Glucamide: currently approx. 180 customers are reformulating their
products to include Glucamide in their formulations for personal
care, home care, crop and industrial applications
INNOVATIVE CUSTOMER-SPECIFIC COOPERATIONS
− Synergen OS: optimizes spray droplet management of agricultural
applications thereby reducing drift and improving crop yield; in a joint
development between Clariant and one of our clients
LINKS TO INNOVATIONS:
SYNERGEN® OS
CROP SOLUTIONS
GENADVANCETM LIFE
GENADVANCETM REPAIR
GENADVANCETM HYDRA
Advanced hair careGENADVANCETM
PERSONAL CARE
GENADVANCETM

Clariant Investor Relations
Clariant Story 201821
Catalysis – maintenance and capitalization of innovation
leadership and strong licensing partnerships
STRATEGY OUTLOOK
Catalysts
− Continue to grow more quickly than the market’s ca. 3 % growth rate via:
• Leveraging our innovation leadership and thus accelerate the introduction
of innovative, customer-specific catalysts for defined areas with large scale
potential
• Adding more sustainable products using less hazardous materials thereby
enhancing sustainability and cost position of customers
• New customer entrants showing preference for proven technologies such
as those of Clariant
Biofuels & Derivatives
− Incremental sunliquid® sales of CHF 100m, of which license sales of CHF
50m and CHF 50m bioethanol sales (entire production of Romanian plant
already contracted for several years) by 2021
− EBITDA margin exceeding 40 %
FINANCIAL PERFORMANCE (EBITDA margin after exceptional items)
UPDATED OUTLOOK
Sales growth 2017 – 2021E 6 – 9 %*
EBITDA margin a.e.i. 2021E 26 – 30 %
* per annum

Clariant Investor Relations
Clariant Story 201822
Catalysis
PRODUCT INNOVATIONS
Catalysts
− Customized catalysts offering significant longer-term activity and a better
stability thus lowering total costs of ownership
− Catalysts with specialized properties, including recyclability, reduction of
hazardous components while providing an improved catalyst specific
performance (increase yield, reduce energy consumption and reduce by-
products)
− Air purification: meeting the demand for “clean, healthy” air in cities with high
pollution levels with catalysts such as ENVICAT®
− Hydrogenation: entering new regional markets
Biofuels & Derivatives: sunliquid® technology
− Flexible process for various renewable feedstocks
− Integrated production of feedstock-specific enzyme to deliver max. efficiency,
independent of suppliers
− Energy neutral / self-sustained: no additional fossil energy required
− Nearly carbon neutral and high process yield based on agricultural wastes: No
additional land needed, no competition with food and feed in land requirement
LINKS TO INNOVATIONS:
SUNLIQUID®
BIOFUELS & DERIVATIVES
ENVICAT®
EMISSION CONTROL

Clariant Investor Relations
Clariant Story 201823
Natural Resources – optimizing operations at OMS and
expanding into new applications at Functional Minerals
STRATEGY OUTLOOK
Oil & Mining Services
− Improved Oil / Oil services growth prospects:
• Oil market rebound to result in momentum turnaround
• Introduction of differentiated steering with focus on the growth oil basins in
North and South America
− Mining: diversify and grow mainly in Latin America and accelerate growth in
North America
− Main profitability improvement drivers include tight cost control and cost
reduction according to respective business landscapes and differentiated
steering
Functional Minerals− Continued above bentonite market growth
− Regional expansion in North America (market entry into purification
segment), Latin America and the Middle East
− Expansion in new applications through innovations by means of smart and
active packaging (e.g. feed and agro)
− Continued attractive margins due to new innovative technologies with
superior growth opportunities
FINANCIAL PERFORMANCE (EBITDA margin after exceptional items)
UPDATED OUTLOOK
Sales growth 2017 – 2021E 6 – 7 %*
EBITDA margin a.e.i. 2021E 16 – 17 %
* per annum

Clariant Investor Relations
Clariant Story 201824
Natural Resources
PRODUCT INNOVATIONS
Oil & Mining Services
− Intelligent chemical management in real-time, VERITRAX™, providing customers with
additional valuable features such as improved operational efficiencies, increasing the
efficiency of business processes, and boosting production up-time
− The VERITRAX™ dashboard quantifies the optimum chemical spend, helps to reduce
unplanned downtime, while proactively maintaining operational efficiency
− Broad rollout of proven and digitally-enabled VERITRAX™ with enhanced scalability
to stimulate further advancement
Functional Minerals
− Low Emissions Technology (Geko LE / Ecosil LE) for the foundry industry lowers total
cost of ownership by reducing the consumption of process aids and suppressing
unwanted side-reactions
− INVOQUE® marks Clariant’s entry into sediment management for the mining sector.
This unique process technology reduces water consumption and improves the use of
tailings reservoirs which results in lower overall operating costs and mitigates the
environment impact
− Our Tonsil® range allows producers of renewable- and bio-resource based diesel to
remove heavy metals at very low dosage rates thereby allowing faster filtration and
low overall residency time, thus increasing production throughput
LINKS TO INNOVATIONS:
VERITRAXTM
TONSIL®
OIL SERVICES
OIL PURIFICATION
SEDIMENT MANGEMENT
INVOQUE®

Clariant Investor Relations
Clariant Story 201825
“Remaining” Plastic & Coatings
STRATEGY OUTLOOK
Pigments
− Marketing driven sales growth via selective innovation projects, growth in
preparations and regional focus on opportunities in China, India and North
America
− Profitability improvements anticipated via:
• Development of functional excellence in pricing and increased capacity
utilization
• Supply chain optimization: improved reliability for customers, digitally
enhanced offering and ensuring a sustainable product range
Standard Masterbatches
− To grow sales in line with GDP by benefiting from strong market position,
convincing product portfolio and focus on more rapidly growing regions and
profitability improvements
Medical Specialties
− Continue sales increase through innovations which meet increasingly stringent
customer and regulatory requirements
Sales growth 2017 – 2021E GDP*
Steered for absolute EBITDA and cash
flow generation
FINANCIAL PERFORMANCE (EBITDA margin after exceptional items)
* per annum
2017 Sales (CHF m) 1 560
EBITDA a.e.i. (CHF m) 182
EBITDA a.e.i. margin 11.7 %
UPDATED OUTLOOK

Appendix

Clariant Investor Relations
EMEA21 %
Americas29 %
APAC50 %
SALES DISTRIBUTION
BY REGION
Clariant Business Area: High Performance Materials – key figures
Clariant Story 201827
1 Refers to Clariant Additives and high value Masterbatches
2 Based on pro-forma 2017 financials excluding synergies.
SALES
in CHF m
EBITDA in CHF m
EBITDA margin
after exceptional items
Based on pro-forma
2017 financials (indicative)
SABIC
Specialties
business (parts)
Clariant
Additives & High
value MB (1)
High Performance
Materials (2)
EMEA41%
Americas34 %
APAC25 %
EMEA28 %
Americas31 %
APAC41 %
1 931 1 119 3 050
389
20.1 %
203
18.1 %
592
19.4 %
Note: combined business foreign exchange rate assumption of 1.0 USD = 1.0 CHF; 2021E at stable 2018 FX rates

Clariant Investor Relations
Creation of High Performance Materials within Clariant
Clariant Story 201828
HPP
SABIC's Specialties business
SABIC
Pigments
Standard Masterbatches
High value Masterbatches
Additives
Current Business Area
Plastics & Coatings
CLARIANT
PLASTICS & COATINGS (P&C)
Medical Specialties
High value P&C
MA
ST
ER
BA
TC
HE
S
HPP
High value P&C segments together
with HPP in new Business Area
High Performance Materials
Transaction Scope
HIGH PERFORMANCE
MATERIALS
High value Masterbatches
Additives
2017 pro-forma financials
SALES in CHF m 1 931
EBITDA in CHF m 389
EBITDA margin 20.1 %
2017A
SALES in CHF m 2 678
EBITDA in CHF m 387
EBITDA margin 14.5 %
2017 pro-forma financials
SALES in CHF m 3 050
EBITDA in CHF m 592
EBITDA margin 19.4 %
2017 pro-forma financials
SALES in CHF m 1 560
EBITDA in CHF m 182
EBITDA margin 11.7 %
Pigments
Remaining segments
within P&C
“Remaining” P&C
Standard Masterbatches
Medical Specialties

Clariant Investor Relations
Clariant’s step change into higher profitability …
Clariant Story 201829
SALES in CHF m EBITDA in CHF m
EBITDA margin a.e.i.
Clariant stand-alone
New Clariant, post divestment
2021E2017
~ 8’000
6’377
2017 pro-forma 2021E
~ 9’000
6’749
2017 pro-forma 2021E
1’019~ 1’800
2017
813
2021E
~ 1’300
15.1 %
~ 20.0* %
12.7 %
16 -17 %
Note: combined business foreign exchange rate assumption of 1.0 USD = 1.0 CHF; 2021E at stable 2018 FX rates
CARE
CHEMICALS CATALYSIS
NATURAL
RESOURCES
PLASTICS &
COATINGS
HIGH
PERFORMANCE
MATERIALS
CARE
CHEMICALS
CATALYSIS
NATURAL
RESOURCES
* including synergies

Clariant Investor Relations
… with a much greater contribution from a higher margin portfolio
Clariant Story 201830
EBITDA margin 2021E –
New Clariant, post
divestment% of total sales
EBITDA margin 2017 -
Clariant stand-alone% of total sales
34 %
47 %
19 %
0%
10%
20%
30%
40%
50%
60%
70%
80%
90%
100%
< 15 % 15 % - 20 % > 20 %
41 %
59 %
0%
10%
20%
30%
40%
50%
60%
70%
80%
90%
100%
< 15 % 15 % - 20 % > 20 %
Based on Business Unit EBITDA margin after exceptional items, excluding corporate costs

Clariant Investor Relations
Synergies arising from business combination
Clariant Story 201831
Synergy distributionTentative, approximation in CHF m
− Stronger presence in joint applications by combining formulation technology, customer access, qualification process participation
− Broader offering including participation in OEM driven development process (e.g. via small lot compounding) including masterbatches as an
alternative coloration delivery system
− Leveraging of Clariant’s Masterbatches’ color houses for parts of SABIC’s Specialties business
2060
100 100
-40 -20 -20- 40
- 20
0
20
40
60
80
100
120
2020E 2021E 2022E 2023E
Synergies phased
Service Cost
Synergies
Procurement
Asset Network
Optimization
Other Sources of
Synergies
Synergies 2022E
Site Efficiency
Distribution
Optimization
CHF ~ 25m− Unify services over shared IT system
− Leverage existing Clariant processes
CHF ~ 25m
CHF ~ 15m
− Combine and optimize purchasing
− Consolidation of assets
CHF ~ 25m
CHF ~ 10m
− Workflow harmonization
− Operational efficiency
− Adopt best-in-class sales approach
Note: combined business foreign exchange rate assumption of 1.0 USD = 1.0 CHF; 2021E at stable 2018 FX rates

Clariant Investor Relations
Net income (in CHF m)
302
Clariant key financial figures 2017
Clariant Story 201832
Sales (in CHF m)
6377
EBITDA (in CHF m)
before exceptional items
974
EBITDA margin
before exceptional items
15.3 %
Net debt (in CHF m)
1539EBITDA (in CHF m)
after exceptional items
813
EBITDA margin
after exceptional items
12.7 %
Operating Cash flow (in CHF m)
428
Net debt incl. pensions* (in CHF m)
2201
*incl. retirement benefit obligations, prepaid pension assets, net deferred tax benefits
Clariant Investor Relations
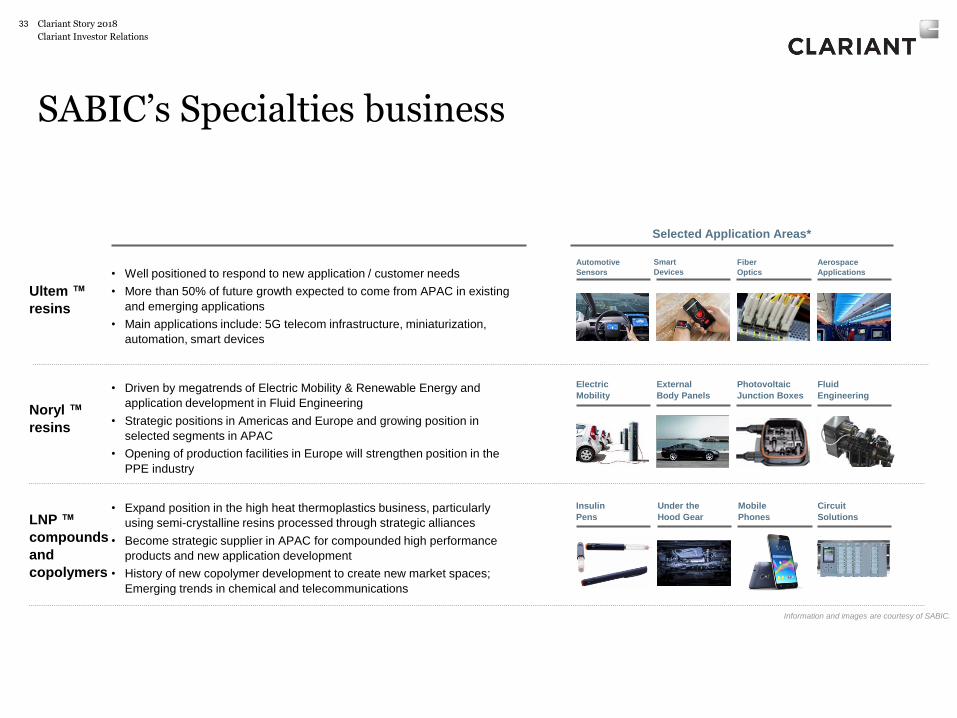
SABIC’s Specialties business
Clariant Story 201833
Ultem ™
resins
Automotive
Sensors
Smart
Devices
Fiber
Optics
Aerospace
Applications
Noryl ™
resins
LNP ™
compounds
and
copolymers
Selected Application Areas*
Electric
Mobility
External
Body Panels
Photovoltaic
Junction Boxes
Fluid
Engineering
Insulin
Pens
Under the
Hood Gear
Mobile
Phones
Circuit
Solutions
• Well positioned to respond to new application / customer needs
• More than 50% of future growth expected to come from APAC in existing
and emerging applications
• Main applications include: 5G telecom infrastructure, miniaturization,
automation, smart devices
• Driven by megatrends of Electric Mobility & Renewable Energy and
application development in Fluid Engineering
• Strategic positions in Americas and Europe and growing position in
selected segments in APAC
• Opening of production facilities in Europe will strengthen position in the
PPE industry
• Expand position in the high heat thermoplastics business, particularly
using semi-crystalline resins processed through strategic alliances
• Become strategic supplier in APAC for compounded high performance
products and new application development
• History of new copolymer development to create new market spaces;
Emerging trends in chemical and telecommunications
Information and images are courtesy of SABIC.

Clariant Investor Relations
Investor Relations Contacts
34
Anja PomrehnHead of Investor Relations
Phone
+41 61 469 63 73
Maria IvekInvestor Relations Officer
Sonja RitschardJunior Investor Relations Manager
Clariant Story 2018

Clariant Investor Relations
Download it here:
iPad App: www.clariant.com/IRapp
Our iPad App
35 Clariant Story 2018