city public service of san antonio, texas
TRANSCRIPT

City Public Service of San Antonio, Texas
Basic Financial Statements For the Fiscal Year Ended January 31, 2020 and 2019
Table of Contents Management’s Discussion and Analysis – Required Supplementary Information (Unaudited) Introduction 2 Basic Financial Statements Overview 2 Financial Highlights and Significant Accounting Policies 3 Results of Operations 8 Financial Position 13 Financing and Debt Covenants Compliance 17 Currently Known Facts 22 Requests for Information 25
Independent Auditors’ Report 26 Basic Financial Statements Statements of Net Position 28
Statements of Revenues, Expenses and Changes in Net Position 29 Statements of Cash Flows 30 Statements of Fiduciary Net Position 31 Statements of Changes in Fiduciary Net Position 32
Notes to Basic Financial Statements Note 1: Summary of Significant Accounting Policies 33 Note 2: Cash, Cash Equivalents and Investments 43 Note 3: Fair Value Measurement 56 Note 4: Disaggregation of Current Accounts Receivable and Accounts Payable 62 Note 5: Capital Assets, Net 63 Note 6: Revenue Bond and Commercial Paper Ordinances Requirements 66 Note 7: Revenue Bonds 68 Note 8: Commercial Paper and Related Revolving Credit Agreements 73 Note 9: Employee Pension Plan 74
Note 10: Other Postemployment Benefits 78 Note 11: Other Obligations and Risk Management 85 Note 12: Other Financial Instruments 88 Note 13: South Texas Project 91 Note 14: Commitments and Contingencies 95 Note 15: Leases 98
Note 16: Pollution Remediation Obligation 100 Note 17: Asset Retirement Obligation 101
Required Supplementary Information (Unaudited) Schedules of Changes in CPS Energy Net Pension Liability and Related Ratios 103 Schedules of Employer Contributions to CPS Energy Pension Plan 104 Schedules of Changes in CPS Energy Net OPEB Liability and Related Ratios 105 Schedules of Employer Contributions to CPS Energy OPEB Plans 108 Schedules of Investment Returns for CPS Energy Fiduciary Funds 111
Glossary of Terms 112
CPS Energy FY2020 Basic Financial Statements
See accompanying independent auditors’ report.
Page 2
MANAGEMENT’SDISCUSSIONANDANALYSIS
INTRODUCTION
The following Management’s Discussion and Analysis (“MD&A”) serves as an introduction to the financial statements of City Public Service Board of San Antonio (also referred to as “CPS Energy” or the “Company”). It is intended to be an objective and easily understandable analysis of significant financial and operating activities and events for the fiscal year (“FY”) ended January 31, 2020, (“FY2020”) compared to the fiscal year ended January 31, 2019 (“FY2019”). It also provides an overview of CPS Energy’s general financial condition and results of operations for FY2019, compared to the previous fiscal year ended January 31, 2018 (“FY2018”). This MD&A has been prepared in accordance with Governmental Accounting Standards Board (“GASB”) Statement No. 34, Basic FinancialStatements–andManagement’sDiscussionandAnalysis – forStateandLocalGovernments and should be read in conjunction with the audited financial statements and accompanying notes that follow.
BASICFINANCIALSTATEMENTSOVERVIEW
In accordance with GASB Statement No. 63, FinancialReportingofDeferredOutflowsofResources,DeferredInflowsofResources,andNetPosition, the Statements of Net Position present CPS Energy’s assets, deferred outflows of resources, liabilities, deferred inflows of resources and net position as of the end of each fiscal year.
Assets are separated into current and noncurrent categories and are reported in the order of liquidity. Current assets include unrestricted cash and cash equivalents; investments; customer, interest and other accounts receivable; and inventories, as well as prepayments and other current assets. Noncurrent assets include cash and cash equivalents, investments, and interest and other accounts receivable that have been restricted by state laws, ordinances or contracts. Noncurrent assets also include the pension regulatory asset, other noncurrent assets and net capital assets.
Deferred outflows of resources include unrealized pension and other postemployment benefits (“OPEB”) contributions made in the current year, unrealized losses related to pension and OPEB, unrealized losses on fuel hedges, unamortized debt reacquisition costs, and unamortized asset retirement obligation costs.
Consistent with the reporting of assets on the Statements of Net Position, liabilities are segregated into current and noncurrent categories. Current liabilities include the current maturities of debt, accounts payable and accrued liabilities. Noncurrent liabilities include net long-term debt, asset retirement obligations, decommissioning net costs refundable, net pension liability and other noncurrent liabilities.
Deferred inflows of resources include unrealized gains related to fuel hedges, unrealized gains related to pension and OPEB, and future revenues. The deferred inflows related to future revenues are associated with the FY2014 sale of certain assets and unrealized future recoveries related to the Joint Base San Antonio (“JBSA”) agreement.
The Statements of Net Position report net position as the difference between (a) the sum of assets and deferred outflows of resources and (b) the sum of liabilities and deferred inflows of resources. The
CPS Energy FY2020 Basic Financial Statements
See accompanying independent auditors’ report.
Page 3
components of net position are classified as net investment in capital assets, restricted or unrestricted. An unrestricted designation indicates the net funds are available for operations.
Within the Statements of Revenues, Expenses and Changes in Net Position, operating results are reported separately from nonoperating results, which primarily relate to financing and investing. Other payments to the City of San Antonio (“City”), contributed capital, impairment loss, and the effect of the South Texas Project’s (“STP”) defined-benefit plan funding obligations are also reported separately as components of the change in net position. These statements identify revenue generated from sales to cover operating and nonoperating expenses. Operating expenses are presented by major cost categories. Revenues remaining are available to service debt, fulfill City Payment commitments, finance capital expenditures and cover contingencies.
The Statements of Cash Flows present cash flows from operating activities, capital and related financing activities, noncapital financing activities, and investing activities. These statements are prepared using the direct method, which reports gross cash receipts and payments, and presents a reconciliation of operating income to net cash provided by operating activities. These statements also separately list the noncash financing activities.
The Statements of Fiduciary Net Position and Statements of Changes in Fiduciary Net Position report the combined assets and liabilities and plan activity associated with the CPS Energy Pension Plan (“Pension Plan”) and the CPS Energy Group Health Plan, CPS Energy Group Life Insurance Plan and the CPS Energy Long-Term Disability Income Plan (collectively, “Employee Benefit Plans”). The Pension Plan and Employee Benefit Plans are reported using the economic resources measurement focus and are prepared on the accrual basis of accounting in conformity with U.S. Generally Accepted Accounting Principles (“GAAP”). Contributions and income are recorded when earned and benefits and expenses are recorded when a liability is incurred, regardless of the timing of the related cash flow. The Pension Plan and the Employee Benefit Plans apply all applicable GASB pronouncements.
FINANCIALHIGHLIGHTSANDSIGNIFICANTACCOUNTINGPOLICIES
Allowance forFundsUsedDuringConstruction (“AFUDC”) – To reflect funding methodology, the AFUDC rate includes both a debt and an equity component. The blended rate is composed of 50% equity and 50% debt based on construction funding. The rate is reviewed quarterly to determine if any adjustments are necessary. Alternate AFUDC rates are applied to projects costing more than $100 million, reflecting the method by which they are funded.
AssetRetirementObligations (“ARO”)– CPS Energy adopted GASB Statement No. 83, CertainAssetRetirementObligations, during FY2019 and accounts for AROs by recognizing the obligations as a liability based on the best estimate of the current value of outlays expected to be incurred once the assets are retired. See Note 17 – Asset Retirement Obligations.
BatteryEnergyStorageSystems(“BESS”) – On September 20, 2016, CPS Energy accepted a $3.0 million New Technology Implementation Grant from the Texas Commission on Environmental Quality (“TCEQ”). The grant proceeds subsidized the purchase of a lithium-ion 10MW battery installed near the Southwest Research Institute substation and adjacent to solar generation resources. The battery will allow generation produced during peak solar intervals to be made available later during peak demand intervals. Grant proceeds are recorded as contributed capital and are exempt from City Payments. As of January 31, 2020, and 2019, CPS Energy had incurred approximately $13.2 million and $6.8 million, respectively, on the project. At January 31, 2020 and 2019, CPS Energy had recorded $3.0 million and $2.7 million, respectively, as a receivable for reimbursable costs due from the TCEQ related to the BESS project. Limits on TCEQ funding require that costs reimbursable under the grant be incurred and paid by May 31, 2020.

CPS Energy FY2020 Basic Financial Statements
See accompanying independent auditors’ report.
Page 4
BuildAmericaBonds (“BABs”) – The American Recovery and Reinvestment Act (“ARRA”) of 2009 provided authority for the issuance of BABs, which were issuable in calendar years 2009 and 2010 as taxable bonds. The ARRA permitted the issuer or the issuer’s paying agent to receive subsidy payments equal to 35% of the bond’s interest costs directly from the U.S. Department of the Treasury. Pursuant to the requirements of the Balanced Budget and Emergency Deficit Control Act of 1985, as amended, the federal government reduced the BABs subsidy as noted below:
SubsidyReduction PeriodCovered
6.9% October 1, 2016 through September 20, 2017 6.6% October 1, 2017 through September 20, 2018 6.2% October 1, 2018 through September 20, 2019 5.9% October 1, 2019 through September 20, 2020
Transaction details for CPS Energy’s BABs issuances are provided in Note 7 – Revenue Bonds.
TheCityofSanAntonio(“City”) – CPS Energy is considered an asset of the community through its legal ownership by the City. In turn, CPS Energy is treated as a component unit of the City, which has a September 30 fiscal year end.
ContributedCapital – Third-party contributions made for construction of capital assets flow through the Statements of Revenues, Expenses and Changes in Net Position and are shown on the Statements of Net Position as a component of net investment in capital assets. The amount reported for contributed capital was $59.5 million at January 31, 2020, as compared with $54.9 million at January 31, 2019. This included donated assets of $4.0 million and $5.1 million, respectively. The remaining portion of these balances, $55.5 million for FY2020, and $49.8 million for FY2019, represents contributions received from customers as payments for utility extensions and services, as well as funding for community initiatives and other local partnership projects.
CounterpartyRisk – CPS Energy is exposed to counterparty risk associated with various transactions primarily related to debt, investments, fuel hedging and wholesale power. Counterparty risk is the risk that a counterparty will fail to meet its obligations in accordance with the terms and conditions of its contract with the Company. The Company has policies and practices in place to ensure the solvency of counterparties is assessed accurately, monitored regularly and managed actively through its Enterprise Risk Management & Solutions division.
CPSEnergyComponentUnits – As required under GASB Statement No. 61, The FinancialReportingEntity: Omnibus, an amendment of GASB Statements No. 14 and No. 34, the assets and liabilities accumulated for CPS Energy’s two nuclear decommissioning trusts (“Decommissioning Trusts” or “Trusts”) for STP Units 1 and 2 are combined into the CPS Energy financial statements using the blended method of inclusion. Initially, CPS Energy owned a 28% interest in STP Units 1 and 2. In May 2005, CPS Energy purchased an additional 12% interest in these units. Assets from an associated decommissioning trust were also received with this purchase. CPS Energy reports the assets in both Trusts—the 28% interest and the 12% interest—as component units.
As required under GASB Statement No 84, FiduciaryActivities, the Pension Plan and Employee Benefit Plans are reported as fiduciary component units. The Statements of Fiduciary Net Position and Statements of Changes in Fiduciary Net Position report the combined assets and liabilities and plan activities of these Plans. See Note 9 – Employee Pension Plan, Note 10 – Other Postemployment Benefits and in Required Supplementary Information for required disclosures of the Pension Plan and the Employee Benefit Plans.

CPS Energy FY2020 Basic Financial Statements
See accompanying independent auditors’ report.
Page 5
Decommissioning – CPS Energy accounts for its legal obligation to decommission STP Units 1 and 2 in accordance with GASB Statement No. 83. The Company has recognized its pro rata share of an ARO based on the best estimate of the current values of outlays expected to be incurred to decommission the units, determined by the most recent cost study. A new cost study is performed every 5 years. In years subsequent the latest study, the GASB No. 83 requires the current value of the Company’s ARO be adjusted for the effects of inflation or deflation, at least annually. In addition to the ARO, the Company has recorded deferred outflows of resources that are being amortized over the remaining useful life of the plant. See Note 17 – Asset Retirement Obligations for the criteria for determining the timing and pattern of recognition for the decommissioning liability. See Note 13 – South Texas Project for additional details on the most recent cost study.
Additionally, due to requirements under the Code of Federal Regulations governing nuclear decommissioning trust funds, a zero-net position approach is applied in accounting for the Decommissioning Trusts. Accordingly, current year and prior year activity in the Trusts is reported in the nonoperating income (expense) section of the Statements of Revenues, Expenses and Changes in Net Position as Decommissioning net costs recoverable (refundable). The cumulative effect of activity in the Trusts is reported on the Statements of Net Position as a noncurrent liability referred to as decommissioning net costs refundable since any excess funds are payable to customers. Going forward, prolonged unfavorable economic conditions could result in the assets of the Trusts being less than the estimated decommissioning liability. In that case, instead of an excess as currently exists, there would be a deficit that would be reported as decommissioning net costs recoverable. This amount would be receivable from customers.
The Dry Cask Storage Project was recently completed at STP to provide for the storage of spent nuclear fuel after the spent fuel pool has reached capacity. CPS Energy’s Decommissioning Trusts have separate spent fuel management accounts that paid for those costs. By contract, spent fuel will eventually be removed to final storage by the Department of Energy (“DOE”). The DOE failed to meet the contractual start date to receive spent fuel, and STP and other utilities have reached settlement agreements with the DOE. In the most recent settlement agreement dated March 15, 2017, the DOE extended its commitment to reimburse STP for allowable spent fuel management expenditures through calendar year 2019. STP is currently working with the DOE to extend the settlement agreement for another three years.
Ongoing costs for the spent fuel management project are being funded by the STP owners (CPS Energy; the City of Austin; and NRG South Texas LP, a wholly owned subsidiary of NRG Energy, Inc.) as expenditures are incurred. CPS Energy is entitled to request reimbursement at its discretion from its Decommissioning Trusts for the Company’s portion of allowable costs. Annually, the South Texas Project Nuclear Operating Company (“STPNOC”) submits claims to the DOE for the reimbursement of allowable costs for spent fuel management. Allowable costs are returned to the owners by STPNOC upon receipt of funds from the DOE. Qualifying spent fuel management costs not reimbursable by the DOE are funded by the Trusts. Spent fuel management costs that do not qualify for reimbursement by the DOE or the Trusts are recorded as operation and maintenance (“O&M”) expense or capital costs.
Depreciation Study – CPS Energy engages an independent third-party consulting firm to conduct a depreciation study, which is performed every five years. The most recent study was completed in FY2018, and the resulting depreciation rates were applied beginning in that period.
ElectricReliabilityCouncilof(“ERCOT”)NodalMarketSystem – ERCOT is the independent system operator managing the flow of electric power for approximately 90% of the electric load for the state of Texas. ERCOT schedules power on the electric grid in a nodal market with more than 8,000 pricing nodes. In the nodal market system, generators are required to make their capacity and ancillary services available to ERCOT, and load-serving entities purchase their supply needs from ERCOT in the day-ahead market and true up in the real-time market. As both a generator and load-serving entity, CPS Energy is an
CPS Energy FY2020 Basic Financial Statements
See accompanying independent auditors’ report.
Page 6
active participant in the nodal market system and actively monitors and manages its exposure to the risks inherent in the retail and wholesale markets.
Federal and State Grant Programs – Periodically, federal and state grants are made available to CPS Energy as a subrecipient for a portion of grant funds allocated to the state of Texas or as a direct award. Grant receipts are recorded as nonoperating income and generally reimburse CPS Energy for costs, recorded as operating expenses, incurred in the administration of the program. Federal or state grants that subsidize in whole or a partial amount of capital assets are recognized as contributed capital. These accounting treatments result in no impact to the Company’s net position. Revenues associated with the grant-related programs are exempt from payments of a percentage of gross revenues made to the City. Grant funding received by the Company is subject to review and audit by the grantor agencies. Such audits could lead to requests for reimbursements to the grantor agencies for expenditures disallowed under terms of the grants. Management believes such disallowances, if any, would be immaterial.
HedgingDerivativeInstruments– CPS Energy accounts for derivative instruments in accordance with GASB Statement No. 53, Accounting and Financial Reporting for Derivative Instruments. Currently, CPS Energy’s only derivative instruments are fuel hedges, which are used to reduce price risk for natural gas purchases. GASB Statement No. 53 requires that hedging derivative instruments be reported at fair value on the Statements of Net Position. In FY2020, 33% of distribution and 28% of generation natural gas volumes were hedged. In FY2019, 33% of distribution and 27% of generation natural gas volumes were hedged. See Note 12 – Other Financial Instruments.
PensionPlan – The financial statements of the Pension Plan are separately audited and reported as of December 31, 2019, with comparative totals as of December 31, 2018. The financial results of the Pension Plan are included as part of the basic financial statements and are presented in combination with the Employee Benefit Plans in the Statements of Fiduciary Net Position and Statements of Changes in Fiduciary Net Position. Additionally, in accordance with GASB Statement No. 68, AccountingandFinancialReportingforPensions–AnAmendmentofGASBStatementNo.27, required disclosures are provided in Note 9 – Employee Pension Plan and in Required Supplementary Information.
PostemploymentBenefitsOtherThanPension(“OPEB”) – The Employee Benefit Plans are separately audited and reported as of December 31, 2019, with comparative totals as of December 31, 2018. The financial results of the Employee Benefit Plans are included as part of the basic financial statements and are presented in combination with the Pension Plan in the Statements of Fiduciary Net Position and Statements of Changes in Fiduciary Net Position. Additionally, in accordance with GASB Statement No. 75, AccountingandFinancialReportingforPostemploymentBenefitsOtherThanPensions, required disclosures are provided in Note 10 – Other Postemployment Benefits and in Required Supplementary Information.
RateIncreases – Rates are set by the CPS Energy Board of Trustees and approved by the San Antonio City Council. On November 7, 2013, the City Council approved a 4.25% increase in both CPS Energy’s electric and natural gas base rates, which were effective February 2014.
Reclassifications– Certain amounts in the prior years’ financial statements have been reclassified to conform to the current-year presentation.
SAEnergyAcquisitionPublicFacilityCorporation(“PFC”) – The PFC is a public, nonprofit corporation organized under the laws of the state of Texas pursuant to the Texas Public Facility Corporation Act, Chapter 303, Texas Local Government Code. The PFC was organized in FY2008 to assist its sponsor, the City, in the procurement of natural gas and in financing, refinancing or providing public facilities to be devoted to public use. The PFC is a component unit of the City.
CPS Energy FY2020 Basic Financial Statements
See accompanying independent auditors’ report.
Page 7
On June 14, 2007, the PFC entered into a Natural Gas Supply Agreement with the City, acting by and through CPS Energy. This gas supply agreement provides for the sale to CPS Energy, on a pay-as-you-go basis, of all-natural gas to be delivered to the PFC under a Prepaid Natural Gas Sales Agreement. Under this prepaid gas agreement between the PFC and the gas supplier, the PFC prepaid the cost of a specified supply of natural gas to be delivered over 20 years. CPS Energy’s net savings resulting from this transaction are passed on, in their entirety, to its distribution gas customers. The financial statements of the PFC are separately audited and reported.
SaveforTomorrowEnergyPlan(“STEP”) – In FY2009, CPS Energy was authorized by City ordinance to spend up to $849 million to save 771 MW of customer demand through energy efficiency and conservation programs by calendar year 2020. Under STEP, CPS Energy launched an array of weatherization, energy efficiency, solar, and demand response programs. As of January 31, 2020, CPS Energy had achieved its STEP goal of reducing demand by an estimated 825 MW and approximately 15% below the original STEP budget. Due to the success of the STEP program, the City authorized Bridge STEP in January 2020, which allows for the existing customer programs to continue for an additional year through January 31, 2021.
Annually, approximately $9.3 million of STEP expenses are funded through the electric base rate and reported as O&M expenses. STEP expenses in excess of this initial amount per year are recovered through the fuel adjustment factor over a period of 12 months, or longer for certain STEP expenses, beginning in the subsequent fiscal year after the costs are incurred and have been independently validated. These STEP recoveries are accrued as a regulatory asset referred to as STEP net costs recoverable.
SolarPrepayments – In November 2011, the Company entered into a prepaid agreement for purchased power from San Antonio-area solar energy facilities with a total of 30 MW of capacity. In FY2013, $77.0 million in prepayments were made for approximately 60% of the anticipated annual output over a period of 25 years. At January 31, 2020, of the remaining prepayment balance, $3.1 million was classified as current and $50.7 million was classified as noncurrent. At January 31, 2019, of the remaining prepayment balance, $3.1 million was classified as current and $53.7 million was classified as noncurrent. The balance of the output is purchased on a pay-as-you-go basis.
STPUnits1and2 – Correlating to CPS Energy’s 40% interest in STP Units 1 and 2 that have been in operation since 1988 and 1989, respectively, the applicable financial results of the nonprofit special-purpose operations project are combined within these financial statements. These units are licensed by the NRC to operate until 2047 and 2048, respectively. STP follows Financial Accounting Standards Board guidance. See Note 13 – South Texas Project.

CPS Energy FY2020 Basic Financial Statements
See accompanying independent auditors’ report.
Page 8
RESULTSOFOPERATIONS
SummaryofRevenues,ExpensesandChangesinNetPosition (Dollars in thousands)
TotalRevenuesandNonoperatingIncome
FY2020 – Representing 97.3% of total revenues and nonoperating income, electric and gas revenues of $2,569.2 million decreased by $175.0 million, or 6.4%, compared to FY2019.
To meet its combined sales requirements for retail customers within the greater San Antonio certificated area and wholesale customers outside of this area, electric energy is primarily generated by CPS Energy from three sources—coal, nuclear and gas. Approximately 83.5% and 86.2% of its customers’ electric energy needs in FY2020 and FY2019, respectively, were produced from CPS Energy’s generating units. In addition to the energy produced from Company-owned facilities, CPS Energy also purchased power from third parties, including producers of renewable energy, such as solar-generated and wind-generated power.
Representing 91.9% of CPS Energy’s total revenues and nonoperating income, electric operating revenue of $2,426.4 million decreased by $150.3 million from FY2019. Contributing to the decrease were lower wholesale recoveries resulting from lower sales volumes stemming from the J.T. Deely Units 1 and 2 retirement in FY2019, as well as lower retail fuel recoveries due to lower gas prices.
Representing 5.4% of total revenues and nonoperating income, gas revenue totaled $142.8 million, a $24.7 million decrease from FY2019. This decrease was primarily due to lower fuel recoveries as a result of lower natural gas prices.
RestatedRevenues and nonoperating income Electric $ 2,426,396 $ 2,576,715 $ 2,439,858 $ (150,319) -5.8% $ 136,857 5.6% Gas 142,782 167,444 180,411 (24,662) -14.7% (12,967) -7.2%
Total operating revenues 2,569,178 2,744,159 2,620,269 (174,981) -6.4% 123,890 4.7% Nonoperating income, net 72,059 55,914 33,938 16,145 28.9% 21,976 64.8%
Total revenues and nonoperating income 2,641,237 2,800,073 2,654,207 (158,836) -5.7% 145,866 5.5%
Expenses Operating expenses
Fuel, purchased power and distribution gas 692,583 824,753 832,070 (132,170) -16.0% (7,317) -0.9%
Operation and maintenance 567,456 573,491 540,104 (6,035) -1.1% 33,387 6.2% Annual OPEB and pension expense 79,635 33,402 41,180 46,233 138.4% (7,778) -18.9% Energy efficiency and conservation (STEP) 72,815 69,124 80,731 3,691 5.3% (11,607) -14.4% STEP net costs recoverable 235 19,912 7,813 (19,677) -98.8% 12,099 154.9% Regulatory assessments 82,622 86,202 84,083 (3,580) -4.2% 2,119 2.5% Decommissioning 18,000 16,525 16,525 1,475 8.9% - - Depreciation and amortization 421,000 445,227 425,260 (24,227) -5.4% 19,967 4.7%
Total operating expenses 1,934,346 2,068,636 2,027,766 (134,290) -6.5% 40,870 2.0% Nonoperating expenses
Interest and debt-related 202,285 201,925 199,785 360 0.2% 2,140 1.1% Payments to the City of San Antonio 342,988 361,351 338,455 (18,363) -5.1% 22,896 6.8%
Total nonoperating expenses 545,273 563,276 538,240 (18,003) -3.2% 25,036 4.7% Total expenses 2,479,619 2,631,912 2,566,006 (152,293) -5.8% 65,906 2.6%
Income before other changes in net position 161,618 168,161 88,201 (6,543) -3.9% 79,960 90.7%Other payments to the City of San Antonio (11,979) (11,766) (11,720) (213) -1.8% (46) -0.4%Contributed capital 59,507 54,936 43,868 4,571 8.3% 11,068 25.2%Special item - plant impairment ‐ (182,723) - 182,723 100.0% (182,723) -100.0%
Effect of defined benefit plan funding obligations – STP (18,668) (8,145) (10,610) (10,523) -129.2% 2,465 23.2% Change in net position 190,478 20,463 109,739 170,015 830.8% (89,276) -81.4% Net position – beginning 3,514,027 3,493,564 3,383,825 20,463 0.6% 109,739 3.2% Net position – ending $ 3,704,505 $ 3,514,027 $ 3,493,564 $ 190,478 5.4% $ 20,463 0.6%
Change
2019 2018 2020 vs. 2019 2019 vs. 2018
Fiscal Year Ended January 31,
2020

CPS Energy FY2020 Basic Financial Statements
See accompanying independent auditors’ report.
Page 9
Net nonoperating income of $72.1 million increased $16.1 million from FY2019, primarily due to improved investment results compared to last year.
FY2019 – Representing 98.0% of total revenues and nonoperating income, electric and gas revenues of $2,744.2 million increased by $123.9 million, or 4.7%, compared to FY2018.
Approximately 86.2% and 83.3% of its customers’ electric energy needs in FY2019 and FY2018, respectively, were produced from CPS Energy’s generating units.
Representing 92.0% of CPS Energy’s total revenues and nonoperating income, electric operating revenue of $2,576.7 million increased by $136.9 million from FY2018. Contributing to the increase were higher wholesale revenues from higher sales volumes resulting from favorable market opportunities and available capacity during the year, as well as higher retail nonfuel recoveries.
Representing 6.0% of total revenues and nonoperating income, gas revenue totaled $167.4 million, a $13.0 million decrease from FY2018. This decrease was primarily due to lower fuel recoveries as a result of a lower average unit cost of fuel partially offset by higher volumes.
Net nonoperating income of $55.9 million increased $22.0 million from FY2018, primarily due to increased interest income from higher interest rates and improved investment results compared to FY2018.
TotalRevenuesandNonoperatingIncomeFiscalYearEndedJanuary31,
OperatingExpenses
FY2020– Operating expenses of $1,934.3 million were $134.3 million, or 6.5%, below last year’s total of $2,068.6 million.
Combined electric and gas fuel costs, which are passed through to customers, totaled $692.6 million and comprised 35.8% of total operating expenses. Electric fuel and purchased power costs of $648.9 million decreased $112.0 million, or 14.7%, below last year primarily due to lower wholesale volumes resulting from reduced capacity from the retirement of J.T. Deely Units 1 and 2 in FY2019. Distribution gas costs of $43.7 million decreased by $20.1 million, or 31.5%, from last year due to a lower natural gas prices.
Operation and maintenance expenses (including annual OPEB and pension expense and STP O&M) of $647.1 million were $40.2 million, or 6.6%, higher than last year primarily due to higher OPEB and
91.9%
5.4%
2.7%
91.9%
6.8%
1.3%
92.0%
6.0%
2.0%
20192020 2018
NonoperatingGasElectric

CPS Energy FY2020 Basic Financial Statements
See accompanying independent auditors’ report.
Page 10
pension expense resulting from the unfavorable benefit trusts’ investment performance in calendar year 2018.
STEP expense of $72.8 million was $3.7 million more than last year’s expense of $69.1 million, primarily due to additional solar program funds awarded. These amounts represent costs incurred in the current year above the approximately $9.3 million funded through the base rate and recorded as O&M expenses. The related contra expense account, STEP net costs recoverable, reflects the net change during the period in expenses delayed to future periods when they will be recognized concurrent with their recovery through rate adjustments. This contra expense was $0.2 million compared to $19.9 million last year. This operating statement item reflects the transfer of these costs to/from the Statements of Net Position as they are deferred or amortized.
Regulatory assessments, including those charged by the Public Utility Commission of Texas (“PUCT”) and ERCOT, of $82.6 million were $3.6 million lower due to decreased transmission costs of service (“TCOS”) expenses.
Decommissioning expense of $18.0 million was comparable to last year’s total of $16.5 million.
Depreciation and amortization expense of $421.0 million was $24.2 million lower than last year’s expense of $445.2 million due to decreased plant-in-service balance in the first part of the year resulting from the J.T. Deely Units 1 and 2 retirement.
FY2019– Operating expenses of $2,068.6 million were $40.9 million, or 2.0%, above FY2018.
Combined electric and gas fuel costs, which are passed through to customers, totaled $824.8 million and comprised 39.9% of total operating expenses. Electric fuel and purchased power costs of $761.0 million increased $11.9 million, or 1.6%, above FY2018 mainly due to higher volumes, partially offset by lower average fuel costs. Distribution gas costs of $63.8 million decreased by $19.2 million, or 23.1%, from FY2018 due to a lower unit cost of fuel.
Operation and maintenance expenses (including annual OPEB and pension expense and STP O&M) of $606.9 million were $25.6 million, or 4.4%, higher than FY2018 due to higher STP O&M expense due to two refueling outages in FY2019 and higher outside services, partially offset by lower OPEB and pension expense resulting from the favorable benefit trusts’ investment performance.
STEP expense of $69.1 million was $11.6 million less than FY2018’s expense of $80.7 million, primarily due to lower solar rebate amounts compared to the rebate program in FY2018. The related contra expense account was $19.9 million compared to $7.8 million in FY2018.
Regulatory assessments, including those charged by the PUCT and ERCOT, of $86.2 million were $2.1 million higher due to increased TCOS expenses.
Decommissioning expense of $16.5 million was comparable to FY2018.
Depreciation and amortization expense of $445.2 million was $20.0 million higher than FY2018’s expense of $425.3 million due to the normal increase of plant-in-service before the J.T. Deely Units 1 and 2 impairment at year end.

CPS Energy FY2020 Basic Financial Statements
See accompanying independent auditors’ report.
Page 11
TotalOperatingExpensesFiscal Year Ended January 31,
(In millions)
NonoperatingExpenses
FY2020– Interest expense and other debt-related costs, including amortization of debt expense and AFUDC, totaled $202.3 million and are comparable to prior year’s $201.9 million.
The payments to the City totaled $343.0 million and were $18.4 million lower than last year due to lower operating revenues.
FY2019– Interest expense and other debt-related costs, including amortization of debt expense and AFUDC, totaled $201.9 million and were $2.1 million, or 1.1%, higher than FY2018. The increase was due to higher interest expense related to bond issuances.
The payments to the City totaled $361.4 million and were $22.9 million higher than FY2018 due to higher electric revenues.
OtherChangesinNetPosition
FY2020– Net income of $161.6 million was $6.6 million lower than last year’s net income of $168.2 million, a decrease of 3.9%, primarily due to higher pension and OPEB expenses, partially offset by lower depreciation and favorable investment performance.
Other payments to the City totaled $12.0 million in FY2020 and were comparable to FY2019.
$1,934.3 $2,068.6 $2,027.8
CPS Energy FY2020 Basic Financial Statements
See accompanying independent auditors’ report.
Page 12
Contributed capital of $59.5 million was $4.6 million higher than last year. Primarily contributing to the increase were greater reimbursed projects completed in the current year.
The effect of the STP defined benefit plan funding obligations, which represents 40% of the change in the unfunded pension and other post-retirement benefits liability at STP, was $(18.7) million compared to $(8.1) million last year, reflecting a net change of $(10.6) million primarily due to the remeasurement of the STP defined benefit plan obligations.
CPS Energy’s change in net position was $190.5 million compared to $20.5 million last year, a favorable change of $170.0 million, primarily due to the prior year impairment of J.T. Deely Units 1 and 2.
FY2019– Net income of $168.2 million was $80.0 million higher than FY2018’s net income of $88.2 million, an increase of 90.7%, primarily due to higher wholesale and retail nonfuel revenues, partially offset by higher O&M expenses.
Other payments to the City totaled $11.8 million in FY2019 and were comparable to FY2018.
Contributed capital of $54.9 million was $11.1 million higher than FY2018. Primarily contributing to the increase were greater reimbursed projects completed in FY2019.
In FY2019, the Company recorded a special item loss of $182.7 million related to the noncash impairment due to early retirement of J.T. Deely Units 1 and 2. See Note 5 – Capital Assets, Net.
The effect of the STP defined benefit plan funding obligations was $(8.1) million compared to $(10.6) million in FY2018. The $2.5 million net change is primarily due to the remeasurement of the STP defined benefit plan obligations.
CPS Energy’s change in net position was $20.5 million compared to $109.7 million in FY2018, an unfavorable change of $89.3 million, due to the net income drivers explained previously and the FY2019 noncash impairment loss recorded as a special item.

CPS Energy FY2020 Basic Financial Statements
See accompanying independent auditors’ report.
Page 13
FINANCIALPOSITION
StatementsofNetPositionSummary(Dollars in thousands)
CurrentAssets
FY2020 – Current assets at January 31, 2020, of $1,031.1 million were $111.0 million higher than the balance at January 31, 2019, due to increases of $61.2 million in materials and supplies, $24.9 million in prepayments, $12.2 million in the General Fund, $10.3 million in coal inventory, $5.1 million in current interest and other accounts receivable, $3.6 million in insurance reserves and $2.4 million in solar farm deposits. These increases were partially offset by decreases of $4.2 million in customer accounts receivable, $3.3 million in gas inventory, and $1.2 million in customer deposits.
FY2019 – Current assets at January 31, 2019, of $920.2 million were $18.0 million lower than the balance at January 31, 2018, due to decreases of $69.7 million in customer accounts receivable and $47.7 million in coal inventory, partially offset by increases of $79.4 million in the General Fund, $8.2 million in current prepayments, $6.3 million in current interest and other accounts receivable, and $5.4 million in solar farm deposits.
NoncurrentRestrictedAssets
FY2020– Noncurrent restricted assets totaled $1,244.3 million at January 31, 2020, a decrease of $103.0 million compared to January 31, 2019. The overall variance was largely attributable to decreases of $171.4 million in the Repair and Replacement Account and $11.0 million in the Debt Service Account. These decreases were partially offset by an increase of $79.2 million in the Decommissioning Trusts balance.
AssetsCurrent assets $ 1,031,139 $ 920,160 $ 938,110 $ 110,979 12.1% $ (17,950) -1.9%Noncurrent assets Restricted 1,244,334 1,347,313 1,289,952 (102,979) -7.6% 57,361 4.4% Other noncurrent assets 444,963 539,733 529,755 (94,770) -17.6% 9,978 1.9% Capital assets, net 8,500,046 8,154,670 8,190,356 345,376 4.2% (35,686) -0.4%
Total assets 11,220,482 10,961,876 10,948,173 258,606 2.4% 13,703 0.1%
Deferred outflows of resources 806,747 731,136 689,889 75,611 10.3% 41,247 6.0%
Total assets plus deferred outflows of resources $ 12,027,229 $ 11,693,012 $ 11,638,062 $ 334,217 2.9% $ 54,950 0.5%
LiabilitiesCurrent liabilities $ 671,631 $ 577,533 $ 622,980 $ 94,098 16.3% $ (45,447) -7.3%Long-term debt, net 5,776,840 5,895,297 5,833,768 (118,457) -2.0% 61,529 1.1%Other noncurrent liabilities 1,736,742 1,532,797 1,632,083 203,945 13.3% (99,286) -6.1%
Total liabilities 8,185,213 8,005,627 8,088,831 179,586 2.2% (83,204) -1.0%
Deferred inflows of resources 137,511 173,358 55,667 (35,847) -20.7% 117,691 211.4%
Total liabilities plus deferred inflows of resources 8,322,724 8,178,985 8,144,498 143,739 1.8% 34,487 0.4%
Net positionNet investment in capital assets 2,563,140 2,123,616 2,162,433 439,524 20.7% (38,817) -1.8%Restricted 596,669 778,629 699,036 (181,961) -23.4% 79,593 11.4%Unrestricted 544,696 611,782 632,095 (67,085) -11.0% (20,313) -3.2%
Total net position 3,704,505 3,514,027 3,493,564 190,478 5.4% 20,463 0.6%
Total liabilities plus deferred inflows of resources plus net position $ 12,027,229 $ 11,693,012 $ 11,638,062 $ 334,217 2.9% $ 54,950 0.5%
Restated
Change2020 2019 2018 2020 vs. 2019 2019 vs. 2018
January 31,

CPS Energy FY2020 Basic Financial Statements
See accompanying independent auditors’ report.
Page 14
FY2019– Noncurrent restricted assets totaled $1,347.3 million at January 31, 2019, an increase of $57.4 million compared to January 31, 2018. The overall variance was largely attributable to an increase of $85.6 million in the Repair and Replacement Account, partially offset by decreases of $21.8 million in the Decommissioning Trusts balance, $5.0 million in the Capital Projects Fund and $1.5 million in the Debt Service Account.
OtherNoncurrentAssets
FY2020– Other noncurrent assets decreased to $445.0 million at January 31, 2020, from $539.7 million at January 31, 2019. The $94.7 million change reflects decreases of $58.1 million in the long-term service agreement inventory, $37.1 million in the net OPEB asset and $5.3 million in the pension regulatory asset, partially offset by increases of $3.7 million STEP net costs recoverable and $2.3 million in unamortized bond expense.
FY2019– Other noncurrent assets increased to $539.7 million at January 31, 2019, from $529.8 million at January 31, 2018. The $10.0 million change reflects increases of $17.5 million in the net OPEB asset resulting from favorable investment performance, $5.9 million in the long-term service agreement inventory and $3.3 million in noncurrent prepayments, partially offset by decreases of $11.6 million in STEP net costs recoverable due to reclassification of approved FY2018 costs to short-term accounts receivable and $5.3 million in the pension regulatory asset.
DeferredOutflowsofResources
FY2020– Deferred outflows of resources increased $75.6 million, from $731.1 million at January 31, 2019, to $806.7 million at January 31, 2020, primarily due to increases of $40.6 million in deferred outflows related to pension and OPEB to reflect updated actuarial valuations, $29.0 million for unrealized losses on fuel hedges and $6.8 million in unamortized asset retirement obligations costs.
FY2019– Deferred outflows of resources increased $41.2 million, from $689.9 million at January 31, 2018, to $731.1 million at January 31, 2019, primarily due to a $77.9 million increase in deferred outflows related to pension and OPEB to reflect updated actuarial valuations, partially offset by decreases of $18.5 million in unamortized reacquisition costs, $16.8 million in unamortized asset retirement obligation costs and $1.3 million for unrealized losses on fuel hedges.

CPS Energy FY2020 Basic Financial Statements
See accompanying independent auditors’ report.
Page 15
CapitalAssets,Net
SummaryofCapitalAssetsNetofAccumulatedDepreciationandAmortization
(Dollars in thousands) FY2020– At January 31, 2020, net capital assets of $8,500.0 million increased $345.3 million from $8,154.7 million at January 31, 2019. The increase was primarily due to a $172.4 million increase in electric plant due to the $87.1 million JBSA electric and gas infrastructure asset purchase, $44.4 million increase in gas plant, and a $6.2 million increase in intangible assets. The increase was partially offset by a $18.9 million decrease in general machinery and equipment. Total depreciable/amortizable assets increased $224.8 million.
In June 2016, the Board approved the purchase of an existing building and land in downtown San Antonio, which will become CPS Energy’s new corporate headquarters. The two towers on the property are being redeveloped and the site is expected to be ready for employees in the fourth quarter of calendar year 2020. The building is currently recorded as construction-in-progress until renovations are complete.
Of the total plant-in-service and construction-in-progress additions, $748.9 million was related to new construction and net removal costs. These additions included funding with $317.3 million of debt, $55.5 million from contributed capital and $376.1 million from the Repair and Replacement Account. Included in capital assets is CPS Energy’s 40% interest in STP Units 1 and 2.
Change
2020 2019 2018Nondepreciable assets Land 104,517$ 104,991$ 97,125$ (474)$ -0.5% 7,866$ 8.1% Land easements 107,520 107,531 106,217 (11) 0.0% 1,314 1.2%
Construction-in-progress 702,054 580,984 521,471 121,070 20.8% 59,513 11.4%Total nondepreciable assets 914,091 793,506 724,813 120,585 15.2% 68,693 9.5%
Depreciable/amortizable assetsElectric plant Buildings and structures 517,970 531,183 536,021 (13,213) -2.5% (4,838) -0.9% Systems and improvements 5,599,931 5,414,331 5,543,289 185,600 3.4% (128,958) -2.3%
Total electric plant 6,117,901 5,945,514 6,079,310 172,387 2.9% (133,796) -2.2%
Gas plant Buildings and structures 84 86 89 (2) -2.3% (3) -3.0% Systems and improvements 670,136 625,783 595,411 44,353 7.1% 30,372 5.1%
Total gas plant 670,220 625,869 595,500 44,351 7.1% 30,369 5.1%
General plant Buildings and structures 169,786 177,979 182,309 (8,193) -4.6% (4,330) -2.4% Machinery and equipment 264,562 283,455 293,331 (18,893) -6.7% (9,876) -3.4% Other 2,535 2,967 5,336 (432) -14.6% (2,369) -44.4%
Total general plant 436,883 464,401 480,976 (27,518) -5.9% (16,575) -3.4%
Intangibles Software 194,196 186,937 155,657 7,259 3.9% 31,280 20.1% Other 30,182 31,202 32,197 (1,020) -3.3% (995) -3.1%
Total intangibles 224,378 218,139 187,854 6,239 2.9% 30,285 16.1%
Nuclear fuel 136,573 107,241 121,903 29,332 27.4% (14,662) -12.0%
Total depreciable/ amortizable assets 7,585,955 7,361,164 7,465,543 224,791 3.1% (104,379) -1.4%
Total capital assets, net 8,500,046$ 8,154,670$ 8,190,356$ 345,376$ 4.2% (35,686)$ -0.4%
2020 vs. 2019 2019 vs. 2018
January 31,

CPS Energy FY2020 Basic Financial Statements
See accompanying independent auditors’ report.
Page 16
FY2019– At January 31, 2019, net capital assets of $8,154.7 million decreased $35.7 million from $8,190.4 million at January 31, 2018. The decrease was primarily due to a $133.8 million decrease in electric plant due to the early retirement of J.T. Deely Units 1 and 2, and $16.6 million decrease in general plant. The decrease was partially offset by a $30.3 million increase in intangible assets and a $30.4 million increase in gas systems and improvements. Total depreciable/amortizable assets decreased $104.4 million.
Of the total plant-in-service and construction-in-progress additions, $605.6 million was related to new construction and net removal costs. These additions included funding with $339.8 million of debt, $49.8 million from contributed capital and $216.0 million from the Repair and Replacement Account.
CurrentLiabilities
FY2020 – Excluding current maturities of debt of $161.2 million, current liabilities increased $69.7 million, from $440.8 million at January 31, 2019, to $510.5 million at January 31, 2020. The higher balance was primarily due to increases of $44.9 million in accounts payable and accrued liabilities, $22.2 million in STP operating, maintenance and construction payables, and $4.1 million in current customer advances partially offset by a decrease of $1.7 million payable to the City.
FY2019 – Excluding current maturities of debt of $136.7 million, current liabilities increased $12.9 million, from $427.9 million at January 31, 2018, to $440.8 million at January 31, 2019. The higher balance was primarily due to increases of $29.0 million in accounts payable and accrued liabilities, $6.5 million in current customer advances for construction and $1.1 million in pollution remediation, partially offset by decreases of $21.3 million in STP operating, maintenance and construction payables and $2.6 million payable to the City.
OtherNoncurrentLiabilities
FY2020 – Excluding the noncurrent portion of debt of $5,776.8 million, noncurrent liabilities increased $203.9 million to $1,736.7 million at January 31, 2020, primarily due to increases of $122.3 million in net pension liability, $61.2 million in decommissioning net costs refundable, $25.1 million in asset retirement obligations, $7.4 million in other liabilities and $2.9 million in operating reserves. These increases were partially offset by decreases of $13.1 million in long-term service agreement liability and $1.2 million in STP OPEB and pension liability.
FY2019 – Excluding the noncurrent portion of debt of $5,895.3 million, noncurrent liabilities decreased $99.3 million to $1,532.8 million at January 31, 2019, primarily due to decreases of $56.6 million in net pension liability, $38.4 million in decommissioning net costs refundable, $12.2 million in long-term service liability and $2.6 million in STP OPEB and pension liability. These decreases were partially offset by increases of $7.4 million in other liabilities and $4.3 million in operating reserves.
DeferredInflowsofResources
FY2020 – Deferred inflows of resources decreased $35.9 million, from $173.4 million at January 31, 2019, to $137.5 million at January 31, 2020, primarily due to a $118.6 million decrease in deferred inflows related to pension and OPEB partially offset by an increase of $84.3 million in deferred inflows for unrealized future recoveries related to the JBSA agreement.
FY2019 – Deferred inflows of resources increased $117.7 million, from $55.7 million at January 31, 2018, to $173.4 million at January 31, 2019, primarily due to a $120.4 million increase in deferred inflows related to pension and OPEB to reflect updated actuarial valuations and favorable investment performance.
CPS Energy FY2020 Basic Financial Statements
See accompanying independent auditors’ report.
Page 17
FINANCINGANDDEBTCOVENANTSCOMPLIANCE
Long‐TermDebt(ExcludingCommercialPaper)
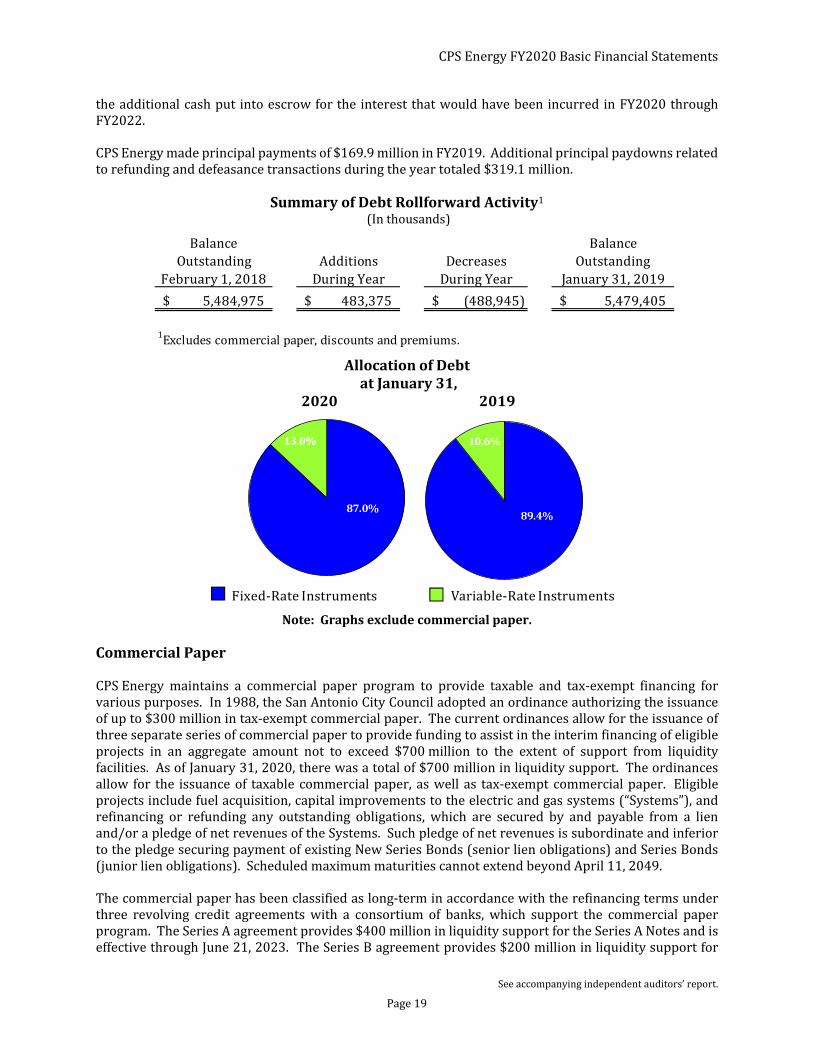
FY2020 –At January 31, 2020, CPS Energy’s total debt was $5,447.0 million, excluding commercial paper, discounts and premiums. This long-term debt was composed of $4,737.1 million in fixed-interest-rate instruments and $709.9 million in variable-interest-rate instruments. Fixed-interest-rate long-term debt had an overall weighted-average yield of 4.1%. Separately, the variable-rate bonds had a weighted-average yield of 2.2%.
Issuances – On September 25, 2019, CPS Energy issued $114.7 million of New Series 2019 Senior Lien Revenue Refunding Bonds. Bond proceeds, including the $22.8 million premium associated with the bonds, were used to refund $116.8 million par value of the New Series 2012 Revenue Bonds. The refunding transaction resulted in net present value debt service savings of $3.1 million, or 2.7%, of the par amount of the bonds being refunded. The true interest cost for this issue, which has maturities in FY2026 through FY2030, is 1.5%.
On November 21, 2019, CPS Energy issued $252.6 million of Series 2019 Junior Lien Revenue Refunding Bonds. Bond proceeds, including $52.8 million premium associated with the bonds, were used to partially refund $100.0 million par value of the 2010A Senior Lien Revenue Bonds (Build America Bonds) and $200.0 million of the 2010B Junior Lien Revenue Bonds (Build America Bonds). The refunding transaction resulted in net present value debt service savings of $50.1 million, or 16.7%, of the par amount of the bonds being refunded. The true interest cost for this issuance, which has maturities in FY2033 through FY2041, is 2.9%.
On December 2, 2019, CPS Energy remarketed $124.2 million of Series 2015A Variable-Rate Junior Lien Revenue Refunding Bonds. The issuance of $0.9 million premium, in conjunction with the remarketing, resulted in a principal paydown for the remarketed bonds of approximately $0.4 million. The bonds have maturities in FY2029 through FY2033. The coupon rate for these bonds is 1.75%, with a current yield of 1.6% and true interest cost of 4.3%, which reflects stepped interest rate provisions applicable to the bonds.
On December 2, 2019, CPS Energy remarketed $99.7 million of Series 2015C Variable-Rate Junior Lien Revenue Refunding Bonds. The issuance of $0.7 million premium, in conjunction with the remarketing, resulted in a principal paydown for the remarketed bonds of approximately $0.3 million. The bonds have maturities in FY2039 through FY2046. The coupon rate for these bonds is 1.75%, with a current yield of 1.6% and true interest cost of 5.2%, which reflects stepped interest rate provisions applicable to the bonds.
On January 28, 2020, CPS Energy issued $134.6 million of New Series 2020 Senior Lien Revenue Refunding Bonds. Proceeds, including the $36.4 million premium associated with the bonds, were used to refund $170.0 million par value of the Commercial Paper Series A. The true interest cost for this issue, which has maturities in FY2026 through FY2049, is 3.1%.
On January 28, 2020, CPS Energy issued $127.8 million of Series 2020 Variable-Rate Junior Lien Revenue Refunding Bonds. Proceeds, including the $3.1 million premium associated with the bonds, were used to refund $50.0 million and $80.0 million par value of the Commercial Paper Series A and Commercial Paper Series C, respectively. Reflecting stepped interest rate provisions applicable to the bonds, the true interest cost for this issue, which has maturities in FY2042 through FY2049, is 5.0%. The bonds were issued as multi-modal variable-rate instruments with initial term rates of 1.75% and a stepped rate of 7.0%, which is only applicable if the bonds are not remarketed before their expiration date.

CPS Energy FY2020 Basic Financial Statements
See accompanying independent auditors’ report.
Page 18
Balance BalanceOutstanding Additions Decreases Outstanding
February 1, 2019 During Year During Year January31,2020
5,479,405$ 853,620$ (886,050)$ 5,446,975$
1Excludes commercial paper, discounts and premiums.
Reductions – On January 28, 2020, $108.0 million of New Series 2016 Senior Lien Revenue Refunding Bonds were legally defeased with cash. Under this defeasance, the debt obligations were technically voided as the cash was escrowed with a third party to service the debt. As a result, $12.5 million was recorded as cost of defeasance representing the additional cash put into escrow for the interest that would have been incurred in FY2022 through FY2025.
CPS Energy made principal payments of $136.7 million in FY2020. Additional principal paydowns related to refunding and defeasance transactions during the year totaled $749.4 million.
SummaryofDebtRollforwardActivity1 (In thousands)
FY2019 –At January 31, 2019, CPS Energy’s total debt was $5,479.4 million, excluding commercial paper, discounts and premiums. This long-term debt was composed of $4,896.7 million in fixed-interest-rate instruments and $582.7 million in variable-interest-rate instruments. Fixed-interest-rate long-term debt had an overall weighted-average yield of 4.1%. Separately, the variable-rate bonds had a weighted-average yield of 2.6%.
Issuances–On November 15, 2018, CPS Energy issued $218.3 million of New Series 2018 Senior Lien Revenue Refunding Bonds. Bond proceeds, including the $25.3 million premium associated with the bonds, were used to refund $99.1 million par value of the New Series 2009D Revenue Refunding Bonds and convert the outstanding $142.3 million Series 2012A, Series 2012B and Series 2012C Variable-Rate Junior Lien Revenue Refunding Bonds from variable-interest-rate debt to fixed-interest-rate debt. The refunding transaction, resulted in net present value debt service savings of $3.6 million, or 3.6% of the par amount of the bonds being refunded. The true interest cost for this issue, which has maturities in FY2020, FY2021, FY2027, and FY2028, is 2.75%.
On December 20, 2018, CPS Energy issued $130.2 million of New Series 2018A Senior Lien Revenue Refunding Bonds. Proceeds, including the $20.9 million premium associated with the bonds, were used to refund $60.0 million and $90.0 million of the Commercial Paper Notes Series A and Series C, respectively. The true interest cost for this issue, which has maturities in FY2026 through FY2048, is 3.65%.
On December 20, 2018, CPS Energy issued $134.9 million of Series 2018 Variable-Rate Junior Lien Revenue Refunding Bonds. Proceeds, including the $1.2 million premium associated with the bonds, were used to refund $135.0 million of the Commercial Paper Series C. Reflecting stepped interest rate provisions applicable to the bonds, the true interest cost for this issue, which has maturities in FY2043 through FY2048, is 6.53%. The bonds were issued as multi-modal variable-rate instruments with initial term rates of 2.75% and a stepped rate of 8.0%, which is only applicable if the bonds are not remarketed before their expiration date.
Reductions–On January 24, 2019, $52.5 million of New Series 2015 Senior Lien Revenue Refunding Bonds and $25.1 million of New Series 2016 Senior Lien Revenue Refunding Bonds were legally defeased with cash. Under the defeasance, the debt obligations were technically voided as the cash was escrowed with a third party to service the debt. As a result, $3.1 million was recorded as cost of defeasance representing
CPS Energy FY2020 Basic Financial Statements
See accompanying independent auditors’ report.
Page 19
Balance BalanceOutstanding Additions Decreases Outstanding
February 1, 2018 During Year During Year January 31, 2019
5,484,975$ 483,375$ (488,945)$ 5,479,405$
1Excludes commercial paper, discounts and premiums.
the additional cash put into escrow for the interest that would have been incurred in FY2020 through FY2022.
CPS Energy made principal payments of $169.9 million in FY2019. Additional principal paydowns related to refunding and defeasance transactions during the year totaled $319.1 million.
SummaryofDebtRollforwardActivity1 (In thousands)
AllocationofDebtatJanuary31,
20202019
Note:Graphsexcludecommercialpaper.
CommercialPaper
CPS Energy maintains a commercial paper program to provide taxable and tax-exempt financing for various purposes. In 1988, the San Antonio City Council adopted an ordinance authorizing the issuance of up to $300 million in tax-exempt commercial paper. The current ordinances allow for the issuance of three separate series of commercial paper to provide funding to assist in the interim financing of eligible projects in an aggregate amount not to exceed $700 million to the extent of support from liquidity facilities. As of January 31, 2020, there was a total of $700 million in liquidity support. The ordinances allow for the issuance of taxable commercial paper, as well as tax-exempt commercial paper. Eligible projects include fuel acquisition, capital improvements to the electric and gas systems (“Systems”), and refinancing or refunding any outstanding obligations, which are secured by and payable from a lien and/or a pledge of net revenues of the Systems. Such pledge of net revenues is subordinate and inferior to the pledge securing payment of existing New Series Bonds (senior lien obligations) and Series Bonds (junior lien obligations). Scheduled maximum maturities cannot extend beyond April 11, 2049.
The commercial paper has been classified as long-term in accordance with the refinancing terms under three revolving credit agreements with a consortium of banks, which support the commercial paper program. The Series A agreement provides $400 million in liquidity support for the Series A Notes and is effective through June 21, 2023. The Series B agreement provides $200 million in liquidity support for
Fixed-Rate Instruments Variable-Rate Instruments
87.0%
13.0%
89.4%
10.6%

CPS Energy FY2020 Basic Financial Statements
See accompanying independent auditors’ report.
Page 20
the Series B Notes and the Series C agreement provides $100 million in liquidity support for the Series C Notes. The Series B and Series C agreements are both effective through June 21, 2022. Under the terms of these revolving credit agreements, CPS Energy may borrow up to an aggregate amount not to exceed $700 million for paying principal due under the commercial paper program. At January 31, 2020, there was no amount outstanding under the revolving credit agreements. Further, there have been no borrowings under the agreements since inception of the program. See Note 6 – Revenue Bond and Commercial Paper Ordinances Requirements and Note 8 – Commercial Paper and Related Revolving Credit Agreements.
FY2020 – Issuances–CPS Energy issued a total of $320.0 million in commercial paper during the fiscal year ended January 31, 2020, to fund construction costs.
Reductions– CPS Energy made reductions of $430.0 million related to the commercial paper refunding transactions in FY2020.
At January 31, 2020, the outstanding commercial paper balance was $95.0 million, all of which was issued as tax-exempt.
SummaryofCommercialPaperRollforwardActivity (In thousands)
FY2019 – Issuances–CPS Energy issued a total of $330.0 million in commercial paper during the fiscal year ended January 31, 2019, to fund construction costs.
Reductions– CPS Energy made reductions of $285.0 million related to the commercial paper refunding transactions in FY2019.
At January 31, 2019, the outstanding commercial paper balance was $205.0 million, all of which was issued as tax-exempt.
SummaryofCommercialPaperRollforwardActivity (In thousands)
The weighted-average interest rate on outstanding commercial paper was 1.4% at January 31, 2020, and 1.8% at January 31, 2019. The weighted-average maturity of commercial paper at January 31, 2020 and 2019, was 146 and 82 days, respectively.
Compliance
With respect to all New Series Bonds outstanding at January 31, 2020, the net revenues of the Systems are pledged to the payment of principal and interest thereon. All New Series Bonds are issued as senior lien
Balance BalanceOutstanding Additions Decreases Outstanding
February 1, 2019 During Year During Year January31,2020
205,000$ 320,000$ (430,000)$ 95,000$
Balance BalanceOutstanding Additions Decreases Outstanding
February 1, 2018 During Year During Year January 31, 2019
160,000$ 330,000$ (285,000)$ 205,000$

CPS Energy FY2020 Basic Financial Statements
See accompanying independent auditors’ report.
Page 21
obligations, and the principal and interest thereon have a first lien upon the net revenues of CPS Energy’s Systems.
The Series 2010A and 2010B Junior Lien BABs; the Series 2013 and Series 2014 Junior Lien Revenue Bonds; the Series 2015A and 2015B Variable-Rate Junior Lien Revenue Refunding Bonds; the Series 2015C and 2015D Variable-Rate Junior Lien Revenue Bonds; the Series 2018 Variable-Rate Junior Lien Revenue Refunding Bonds; and the Series 2020 Variable-Rate Junior Lien Revenue Refunding Bonds were issued as junior lien obligations. The borrowings from the junior lien obligations are equally and ratably secured by and payable from the net revenues of CPS Energy’s Systems. The pledge is subordinate and inferior to the pledge of net revenues securing the senior lien obligations, but prior and superior to the lien on, and pledge of, the net revenues securing the payment of the commercial paper notes.
The commercial paper revolving credit agreements permit CPS Energy to borrow up to an aggregate amount, not to exceed $700 million, for paying amounts due under the commercial paper program. The commercial paper outstanding is also secured by the net revenues of the Systems. Such pledge of net revenues is subordinate and inferior to the pledge securing payment of senior lien and junior lien obligations.
At January 31, 2020 and 2019, CPS Energy was in compliance with the terms and provisions of the documents related to the senior and junior lien obligations, and the commercial paper programs.
DebtService
CPS Energy has taken the position that the BABs direct subsidy should be deducted from debt service when calculating the debt service coverage ratio since the subsidy is received directly by the trustee and is to be used solely for debt service. Therefore, at January 31, 2020, the debt service coverage calculations included a BABs direct subsidy deduction of $14.3 million for the senior lien debt and $23.3 million for both the senior and junior lien debt. At January 31, 2019, the debt service coverage calculations included a BABs direct subsidy deduction of $14.6 million for the senior lien debt and $24.5 million for both the senior and junior lien debt.
BABsSubsidySequestration – Pursuant to the requirements of the Balanced Budget and Emergency Deficit Control Act of 1985, as amended, the federal government has reduced the BABs subsidy which resulted in an increase in CPS Energy’s debt-related interest expense of approximately $1.5 million and $1.7 million in FY2020 and FY2019, respectively.

CPS Energy FY2020 Basic Financial Statements
See accompanying independent auditors’ report.
Page 22
The following table illustrates the debt service coverage ratios in accordance with the bond ordinances and also provides the ratios without the direct subsidy deduction:
DebtServiceCoverageRatiosatJanuary31,2020
DebtServiceCoverageRatios
atJanuary31,2019
The ratio of debt to debt and net position was 59.9% and 61.8% at January 31, 2020 and 2019, respectively.
SummaryofCPSEnergy’sBondandCommercialPaperRatings
CURRENTLYKNOWNFACTS
GASBImplementations– The following guidance issued by the GASB will be effective for future periods:
GASB Statement No. 87, Leases, requires the recognition of certain lease assets and liabilities for leases that previously were classified as operating leases and recognized as inflows of resources or outflows of resources based on the payment provisions of the contract. The standard establishes a single model for lease accounting based on the foundational principle that leases are financings of the right-to-use an underlying asset. Under the Statement, a lessee is required to recognize a lease liability and an intangible right-to-use lease asset, and a lessor is required to recognize a lease receivable and a deferred inflow of resources, which enhances the relevance and consistency of information about the Company’s leasing activities. This standard will be adopted by CPS Energy in the fiscal year ending January 31, 2021. The Company has initiated an evaluation of the impact that adoption of this statement will have on its financial statements.
GASB Statement No. 89, Accounting for InterestCost Incurredbefore theEndofaConstructionPeriod, requires that interest cost incurred before the end of a construction period be recognized
Senior Lien Debt Junior Lien DebtCommercial
Paper
Fitch Ratings AA+ AA+ F1+
Moody's Investors Service, Inc. Aa1 Aa2 P-1
S&P Global Ratings AA AA- A-1+
Ratings at January 31, 2020
WithBABs Subsidy
WithoutBABs Subsidy
Senior lien debt 4.95x 4.65xSenior and junior lien debt 2.97x 2.79x
WithBABs Subsidy
WithoutBABs Subsidy
Senior lien debt 4.62x 4.37xSenior and junior lien debt 2.94x 2.78x
CPS Energy FY2020 Basic Financial Statements
See accompanying independent auditors’ report.
Page 23
as an expense in the period in which the cost is incurred for financial statements prepared using the economic resources measurement focus. As a result, interest cost incurred before the end of a construction period will not be included in the historical cost of a capital asset reported in a business-type activity or enterprise fund. This standard will be adopted by CPS Energy in the fiscal year ending January 31, 2021. The Company has initiated an evaluation of the impact that adoption of this statement will have on its accounting for AFUDC.
GASB Statement No. 91, ConduitDebtObligations,provides a single method of reporting conduit debt obligations by issuers and eliminates diversity in practice for commitments extended by issuers and other arrangements with conduit debt obligations. The standard also clarifies the existing definition of conduit debt obligations and improves required note disclosures. This standard will become effective in CPS Energy’s fiscal year ending January 31, 2022; however, because CPS Energy’s debt instruments do not include conduit debt obligations, there is no expected impact on the Company’s financial statements.
GASB Statement No. 92, Omnibus2020,addresses a variety of topics and practice issues that have been identified during implementation and application of certain GASB Statements. The new statement clarifies issues related to leases, intra-entity transfers, pension and postemployment benefits, asset retirement obligations, risk pools, fair value measurements, and derivative instruments. This standard will be adopted by CPS Energy in the fiscal year ending January 31, 2021. The Company has initiated an evaluation of the impact that adoption of this statement will have on its financial statements.
GASB Statement No. 93, Replacement of Interbank Offered Rates, establishes accounting and financial reporting requirements related to the replacement of interbank offered rates such as the London Interbank Offered Rate which is expected to cease to exist in its current form at the end of calendar year 2021. This statement will provide exceptions to the existing provisions for hedge accounting termination and lease modifications. This standard will be adopted by CPS Energy in the fiscal year ending January 31, 2021. The Company has initiated an evaluation of the impact that adoption of this statement will have on its financial statements.
Legislation and Regulations – The Dodd-Frank Wall Street Reform and Consumer Protection Act ("Dodd-Frank Act") was signed into law on July 21, 2010. Title VII of the Dodd-Frank Act, known as the "Wall Street Transparency and Accountability Act of 2010," substantially modified portions of the Commodity Exchange Act with respect to swap transactions. The law was designed to reduce risk, establish new business conduct rules, increase transparency and promote market integrity within the financial system. The Dodd-Frank Act gave the Commodity Futures Trading Commission ("CFTC") and the Securities and Exchange Commission (“SEC”) statutory authority to regulate the over-the-counter derivatives market, including many of the commodities that are currently being traded or hedged by CPS Energy in accordance with its own policies and procedures. The CFTC and SEC, as well as U.S. prudential regulators charged with guarding against systemic risk to the banking and financial system, propose, finalize and implement rules pursuant to the legislation. CPS Energy is subject to some of the CFTC and SEC rules, including swap transaction reporting and recordkeeping, in addition to other administrative rules and regulations, such as the Independent Registered Municipal Advisor rule that impacts capital market participants. As an “end-user” CPS Energy is exempt from clearing and margining its over-the-counter positions and from capital requirements related to its commodities activities.
While there continues to be uncertainty regarding the future of the Patient Protection and Affordable Care Act, CPS Energy remains focused on its long-term strategy to address any potential cost increases associated with the health plan benefits it provides to its employees. The Company continues to monitor health care regulations as they evolve, as well as the status of the CPS Energy employee health plans, to

CPS Energy FY2020 Basic Financial Statements
See accompanying independent auditors’ report.
Page 24
ensure compliance with all regulations, while maintaining manageable plan costs for the Company and its employees.
The Environmental Protection Agency (“EPA”) issued the final Affordable Clean Energy (“ACE”) rule on June 19, 2019. The rule establishes emission guidelines for states to develop plans to address greenhouse gas (“GHG”) emissions from existing coal-fired power plants. The proposed rule has several components:
Defines the “best system of emission reduction” for GHG emissions from existing power plants as on-site, heat-rate efficiency improvements;
Provides states with a list of “candidate technologies” that can be used to establish standards of performance and incorporated into their state plans;
Aligns Clean Air Act section 111(d) general implementing regulations to give states adequate time and flexibility to develop their state plans.
The Texas Commission on Environmental Quality (“TCEQ”) is planning to implement the rule. They are preparing to send coal plant owners an Information Collection Request about each coal unit. The proposed response date is October 2020.
The Generation Sector Industrial Effluent Guidelines Rule for power plant wastewater was finalized in 2016, with the latest compliance date of December 31, 2023. The Phase 1 rule’s effective date was delayed for two years until November 2020. The EPA issued a proposed rule in November 2019. Extensions to existing compliance deadlines have been proposed. The rule is expected to be finalized later in calendar year 2020. CPS Energy is working with the TCEQ to reflect the rule requirements in our Texas Pollution Elimination Discharge System permit for the Calaveras Power Station.
In July 2018, the EPA completed area designations for the 2015 ozone standards by designating eight counties in the San Antonio, Texas metropolitan area. The rule was published in the Federal Register on July 25, 2018. The EPA designated Bexar County as an Ozone Nonattainment area and the remaining seven counties – Atascosa, Bandera, Comal, Guadalupe, Kendall, Medina, and Wilson – as Unclassifiable (insufficient data to classify). Bexar County is classified as Marginal Nonattainment which is the least stringent. The area has until the end of calendar year 2020 to come into compliance with the ozone standards. Bexar County exceeded the ozone standard in 2019. The City of San Antonio (“COSA”) has developed an Ozone Action Master Plan, and CPS Energy is working with COSA and the Alamo Area Council of Governments to identify mitigation actions.
The EPA’s Coal Combustion Residuals (“CCR”) rule became effective October 15, 2015 and allows for continued beneficial reuse of CCR materials. Proposed partial rule changes, finalized in July 2018, allow continued use of both bottom ash units until October 2020 instead of the original October 2018 date plus 6 months (April 2019). The EPA recently issued a final version of Part One of the CCR Phase One rule. The final rule adopts two alternative performance standards, revises groundwater protection standards (“GWPS”) for four constituents, and extends the deadline by which facilities must cease the placement of waste in CCR units closing for cause in two situations: (1) where the facility has detected a statistically significant increase above a GWPS from an unlined surface impoundment, and (2) where the unit is unable to comply with the aquifer location restriction. The deadline has been extended to October 31, 2020. The EPA issued a proposed rule in December 2019. Extensions to existing compliance deadlines have been proposed but must be requested and approved by the EPA or TCEQ. CPS Energy is designing a new impoundment and will be submitting an extension application request.
CPS Energy complies with all current regulatory requirements and continues to monitor, evaluate, and assess the impacts of new and pending regulations on CPS Energy’s strategies and operations.

CPS Energy FY2020 Basic Financial Statements
See accompanying independent auditors’ report.
Page 25
FederalBudgetDevelopments– In December 2017, Congress passed the Tax Cuts & Jobs Act (“Act”). The Act preserved tax-exempt financing for municipal bonds but eliminated the use of advanced refunding at the end of calendar year 2017. The Act also reduced the corporate tax rate from 35% to 21% effective in calendar year 2018. This 14-percentage point reduction represents a 40% drop, which could potentially make tax-exempt municipal bonds less attractive to some investors. Subsidy payments to BABs issuers will be reduced by 5.9% from October 1, 2019, through September 30, 2020.
As Congressional lawmakers continue to look for ways to manage the federal budget, future proposals affecting financing tools, such as the tax exemption on municipal bond interest and BABs, could be revisited. CPS Energy’s management continues to assess proposals to offer commentary and information to the national discussion. Uncertainty remains regarding the impact any resulting legislation might ultimately have on the tax-exempt status of CPS Energy’s bonds.
COVID‐19 – Worldwide, national and local community transmission of novel coronavirus, COVID-19, subsequent to year end has resulted in economic uncertainties at the national, state and local level. Within CPS Energy’s service territory, state and local officials have implemented requirements for nonessential businesses to either temporarily close or take measures that will slow the spread of the virus. With the temporary closures CPS Energy expects revenues to be impacted, with usage in some customer classes increasing while other classes potentially decreasing. Additionally, CPS Energy has announced that it will suspend service disconnects during this time of uncertainty. As a result of this decision, outstanding customer accounts receivable may increase with additional customers participating in payment plans. The Company continues to evaluate the economic and financial impact that will result from these actions.
REQUESTSFORINFORMATION
For more information about CPS Energy, contact Corporate Communications, Marketing & Smart City Outreach at (210) 353-2344 or at P.O. Box 1771, San Antonio, Texas 78296-1771.
Page 26
INDEPENDENT AUDITORS' REPORT
To the Board of Trustees City Public Service of San Antonio, Texas San Antonio, Texas
We have audited the accompanying financial statements of the business-type activities and the fiduciary fund activities of the City Public Service of San Antonio, Texas (“CPS Energy”), a component unit of the City of San Antonio, Texas as of and for the years ended January 31, 2020 and 2019, and the related notes to the financial statements, which collectively comprise CPS Energy’s basic financial statements as listed in the table of contents.
Management’s Responsibility for the Financial Statements
Management is responsible for the preparation and fair presentation of these financial statements in accordance with accounting principles generally accepted in the United States of America; this includes the design, implementation, and maintenance of internal control relevant to the preparation and fair presentation of financial statements that are free from material misstatement, whether due to fraud or error.
Auditors’ Responsibility
Our responsibility is to express opinions on these financial statements based on our audits. We did not audit the financial statements of the CPS Energy fiduciary funds as of and for the years ended December 31, 2019 and 2018. Those statements were audited by other auditors whose reports has been furnished to us, and our opinion, insofar as it relates to the amounts included for CPS Energy fiduciary funds, is based solely on the report of the other auditors. We conducted our audits in accordance with auditing standards generally accepted in the United States of America. Those standards require that we plan and perform the audits to obtain reasonable assurance about whether the financial statements are free from material misstatement.
An audit involves performing procedures to obtain audit evidence about the amounts and disclosures in the financial statements. The procedures selected depend on the auditors’ judgment, including the assessment of the risks of material misstatement of the financial statements, whether due to fraud or error. In making those risk assessments, the auditor considers internal control relevant to CPS Energy’s preparation and fair presentation of the financial statements in order to design audit procedures that are appropriate in the circumstances, but not for the purpose of expressing an opinion on the effectiveness of CPS Energy’s internal control. Accordingly, we express no such opinion. An audit also includes evaluating the appropriateness of accounting policies used and the reasonableness of significant accounting estimates made by management, as well as evaluating the overall presentation of the financial statements.
We believe that the audit evidence we have obtained is sufficient and appropriate to provide a basis for our audit opinions.
Baker Tilly Virchow Krause, LLP trading as Baker Tilly is a member of the global network of Baker Tilly International Ltd., the members of which are separate and independent legal entities. © 2018 Baker Tilly Virchow Krause, LLP

Page 27
Opinions
In our opinion, based on our audits and the reports of other auditors, the financial statements referred to above present fairly, in all material respects, the financial position of the business-type activities and fiduciary fund activities of CPS Energy as of January 31, 2020 and 2019, and the respective changes in financial position and cash flows (if applicable) thereof for the years then ended in accordance with accounting principles generally accepted in the United States of America.
Emphasis of Matter
As discussed in Note 1, CPS Energy adopted the provisions of GASB Statement No. 84, Fiduciary Activities, effective February 1, 2019. The accounting change has been retrospectively applied to prior period presented. Our opinions are not modified with respect to this matter.
Other Matter
Required Supplementary Information
Accounting principles generally accepted in the United States of America require that the required supplementary information as listed in the table of contents be presented to supplement the basic financial statements. Such information, although not a part of the basic financial statements, is required by the Governmental Accounting Standards Board who considers it to be an essential part of financial reporting for placing the basic financial statements in an appropriate operational, economic, or historical context. We and other auditors have applied certain limited procedures to the required supplementary information in accordance with auditing standards generally accepted in the United States of America, which consisted of inquiries of management about the methods of preparing the information and comparing the information for consistency with management's responses to our inquiries, the basic financial statements, and other knowledge we obtained during our audit of the basic financial statements. We do not express an opinion or provide any assurance on the information because the limited procedures do not provide us with sufficient evidence to express an opinion or provide any assurance.
Austin, Texas April 27, 2020

CPS Energy FY2020 Basic Financial Statements
Page 28
STATEMENTSOFNETPOSITION
Assets (In thousands)Current assets
Cash and cash equivalents $ 174,647 $ 349,704 Investments 296,237 104,171 Interest and other accounts receivable 58,431 53,319 Customer accounts receivable, less allowance for doubtful accounts
of $15.5 million at January 31, 2020, and $14.7 million at January 31, 2019 198,402 202,556 Inventories, at average costs
Materials and supplies, net 161,707 100,542 Fossil fuels 61,341 54,345
Prepayments and other 80,374 55,523 Total current assets 1,031,139 920,160
Noncurrent assetsRestricted
Cash and cash equivalents 247,564 234,326 Investments 989,076 1,107,234 Interest and other accounts receivable 7,694 5,753
Pension regulatory asset 234,477 239,806 Other noncurrent assets 210,486 299,927 Capital assets, net 8,500,046 8,154,670
Total noncurrent assets 10,189,343 10,041,716
Total assets 11,220,482 10,961,876
Deferred outflows of resourcesUnrealized contributions and losses related to pension and OPEB 213,833 173,193Unrealized losses on fuel hedges 33,564 4,606Unamortized debt reacquisition costs 61,391 62,205Unamortized costs for asset retirement obligations 497,959 491,132
Total deferred outflows of resources 806,747 731,136
Total assets plus deferred outflows of resources $ 12,027,229 $ 11,693,012
LiabilitiesCurrent liabilities
Current maturities of debt $ 161,160 $ 136,720Accounts payable and accrued liabilities 510,471 440,813
Total current liabilities 671,631 577,533
Noncurrent liabilitiesLong-term debt, net 5,776,840 5,895,297Asset retirement obligations 1,029,485 1,004,350Decommissioning net costs refundable 120,262 59,053Net pension liability 378,128 255,869 Other noncurrent liabilities 208,867 213,525
Total noncurrent liabilities 7,513,582 7,428,094
Total liabilities 8,185,213 8,005,627
Deferred inflows of resourcesUnrealized gains on fuel hedges ‐ 273 Unrealized gains related to pension and OPEB 52,314 170,949 Unrealized future revenues 85,197 2,136
Total deferred inflows of resources 137,511 173,358
Total liabilities plus deferred inflows of resources 8,322,724 8,178,985
Net position Net investment in capital assets 2,563,140 2,123,616Restricted
Debt service 1,153 11,921Ordinance 595,516 766,708
Unrestricted 544,696 611,782Total net position 3,704,505 3,514,027
Total liabilities plus deferred inflows of resources plus net position $ 12,027,229 $ 11,693,012
SeeaccompanyingNotestoBasicFinancialStatements.
2020 2019January 31,

CPS Energy FY2020 Basic Financial Statements
. Page 29
2020 2019
Operating revenues Electric
Retail $ 2,208,571 $ 2,250,538 Wholesale 217,825 326,177 Total electric operating revenues 2,426,396 2,576,715
Gas 142,782 167,444 Total operating revenues 2,569,178 2,744,159
Operating expensesFuel, purchased power and distribution gas 692,583 824,753 Operation and maintenance 567,456 573,491 Annual OPEB and pension expense 79,635 33,402 Energy efficiency and conservation (STEP) 72,815 69,124 STEP net costs recoverable 235 19,912 Regulatory assessments 82,622 86,202 Decommissioning 18,000 16,525 Depreciation and amortization 421,000 445,227
Total operating expenses 1,934,346 2,068,636
Operating income 634,832 675,523
Nonoperating income (expense)Interest and other income, net 54,059 39,389 Decommissioning Trusts investment income and change
in fair value 80,448 (19,122) Decommissioning net costs recoverable (refundable) (62,448) 35,647 Interest and other expense (257,855) (250,707) Amortization of debt-related costs 40,697 36,010 Allowance for funds used during construction 14,873 12,772 Payments to the City of San Antonio (342,988) (361,351)
Total nonoperating income (expense) (473,214) (507,362)
Income before other changes in net position 161,618 168,161
Other payments to the City of San Antonio (11,979) (11,766) Contributed capital 59,507 54,936 Special item - plant impairment ‐ (182,723) Effect of defined benefit plan funding obligations – STP (18,668) (8,145)
Change in net position 190,478 20,463 Net position – beginning 3,514,027 3,493,564 Net position – ending $ 3,704,505 $ 3,514,027
SeeaccompanyingNotestoBasicFinancialStatements.
(In thousands)
Fiscal Year Ended January 31,
STATEMENTSOFREVENUES,EXPENSESAND CHANGESINNETPOSITION
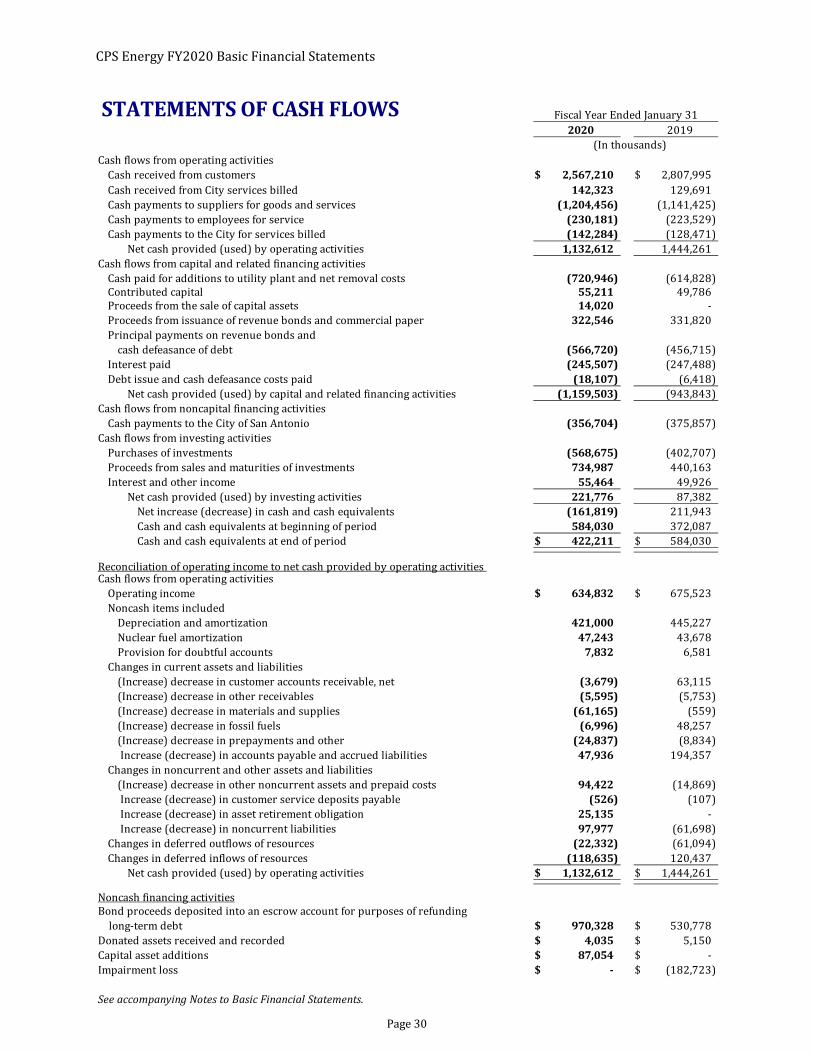
CPS Energy FY2020 Basic Financial Statements
Page 30
STATEMENTSOFCASHFLOWS
2020 2019
Cash flows from operating activities Cash received from customers $ 2,567,210 $ 2,807,995 Cash received from City services billed 142,323 129,691 Cash payments to suppliers for goods and services (1,204,456) (1,141,425) Cash payments to employees for service (230,181) (223,529) Cash payments to the City for services billed (142,284) (128,471)
Net cash provided (used) by operating activities 1,132,612 1,444,261 Cash flows from capital and related financing activities
Cash paid for additions to utility plant and net removal costs (720,946) (614,828) Contributed capital 55,211 49,786 Proceeds from the sale of capital assets 14,020 - Proceeds from issuance of revenue bonds and commercial paper 322,546 331,820 Principal payments on revenue bonds and
cash defeasance of debt (566,720) (456,715) Interest paid (245,507) (247,488) Debt issue and cash defeasance costs paid (18,107) (6,418)
Net cash provided (used) by capital and related financing activities (1,159,503) (943,843) Cash flows from noncapital financing activities
Cash payments to the City of San Antonio (356,704) (375,857) Cash flows from investing activities
Purchases of investments (568,675) (402,707) Proceeds from sales and maturities of investments 734,987 440,163 Interest and other income 55,464 49,926
Net cash provided (used) by investing activities 221,776 87,382 Net increase (decrease) in cash and cash equivalents (161,819) 211,943 Cash and cash equivalents at beginning of period 584,030 372,087 Cash and cash equivalents at end of period $ 422,211 $ 584,030
Reconciliation of operating income to net cash provided by operating activities Cash flows from operating activities
Operating income $ 634,832 $ 675,523 Noncash items included
Depreciation and amortization 421,000 445,227 Nuclear fuel amortization 47,243 43,678 Provision for doubtful accounts 7,832 6,581
Changes in current assets and liabilities(Increase) decrease in customer accounts receivable, net (3,679) 63,115 (Increase) decrease in other receivables (5,595) (5,753) (Increase) decrease in materials and supplies (61,165) (559) (Increase) decrease in fossil fuels (6,996) 48,257 (Increase) decrease in prepayments and other (24,837) (8,834) Increase (decrease) in accounts payable and accrued liabilities 47,936 194,357
Changes in noncurrent and other assets and liabilities (Increase) decrease in other noncurrent assets and prepaid costs 94,422 (14,869) Increase (decrease) in customer service deposits payable (526) (107) Increase (decrease) in asset retirement obligation 25,135 - Increase (decrease) in noncurrent liabilities 97,977 (61,698)
Changes in deferred outflows of resources (22,332) (61,094) Changes in deferred inflows of resources (118,635) 120,437
Net cash provided (used) by operating activities $ 1,132,612 $ 1,444,261
Noncash financing activitiesBond proceeds deposited into an escrow account for purposes of refunding long-term debt $ 970,328 $ 530,778 Donated assets received and recorded $ 4,035 $ 5,150 Capital asset additions $ 87,054 $ - Impairment loss $ ‐ $ (182,723)
SeeaccompanyingNotestoBasicFinancialStatements.
(In thousands)
Fiscal Year Ended January 31

CPS Energy FY2020 Basic Financial Statements
. Page 31
(In thousands)Assets
Cash and cash equivalents $ 48,724 $ 27,186 Cash and cash equivalents collateral from securities lending 36,751 73,572 Receivables
Accrued interest and dividends receivable 3,690 3,640 Receivable from federal government under Medicare Part D 110 199 Investment trades pending receivable 357 208 Receivable from property managers and others 47 517
Total receivables 4,204 4,564 Investments
U.S. Government securities, partially pledged in 2016 116,999 129,217 Corporate bonds 223,536 182,221 Global bond funds 81,869 74,381 Senior loan fund 84,724 78,505 Domestic equities 836,082 648,471 Low-volatility equities 176,021 145,300 International equities 224,538 161,729 Specialized funds 26,824 24,081 Master limited partnerships 129,464 115,229 Alternative investments 62,035 57,891 Real estate 95,918 146,608 Investment in partnership 54,000 67,769
Total investments 2,112,010 1,831,402 Prepayments and other ‐ 48
Total assets $ 2,201,689 $ 1,936,772
LiabilitiesAccounts payable and other liabilities $ 782 $ 1,407 Investment trades pending payable 552 1,835 Investment and administrative expenses payable 527 606 Securities lending obligation 36,751 73,572 Accrued health claims payable 4,745 5,552 Long-term debt 29,000 29,000
Total liabilities 72,357 111,972
Net position restricted for pension and otherpostemployement benefits 2,129,332 1,824,800
Total liabilities plus net position $ 2,201,689 $ 1,936,772
SeeaccompanyingNotestoBasicFinancialStatements.
December 31,2019 2018
STATEMENTSOFFIDUCIARYNETPOSITION
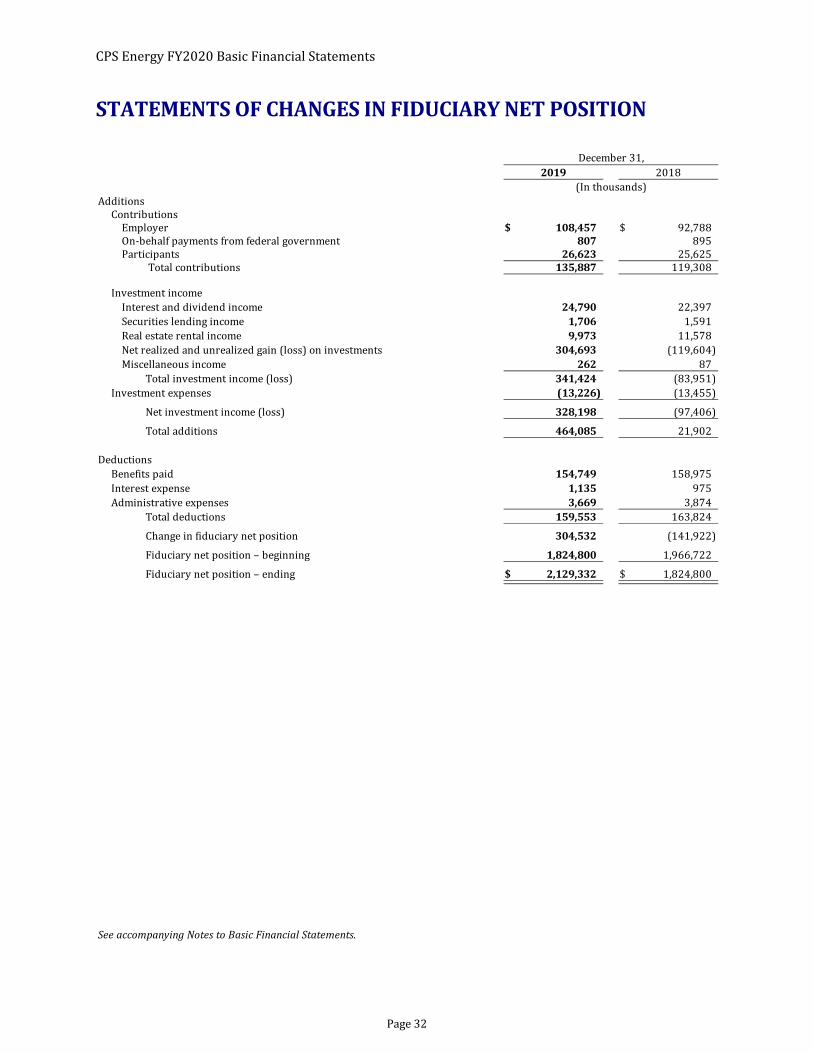
CPS Energy FY2020 Basic Financial Statements
Page 32
STATEMENTSOFCHANGESINFIDUCIARYNETPOSITION
(In thousands)Additions Contributions
Employer $ 108,457 $ 92,788 On-behalf payments from federal government 807 895 Participants 26,623 25,625
Total contributions 135,887 119,308
Investment income Interest and dividend income 24,790 22,397 Securities lending income 1,706 1,591 Real estate rental income 9,973 11,578 Net realized and unrealized gain (loss) on investments 304,693 (119,604) Miscellaneous income 262 87
Total investment income (loss) 341,424 (83,951) Investment expenses (13,226) (13,455)
Net investment income (loss) 328,198 (97,406)
Total additions 464,085 21,902
Deductions Benefits paid 154,749 158,975 Interest expense 1,135 975 Administrative expenses 3,669 3,874
Total deductions 159,553 163,824
Change in fiduciary net position 304,532 (141,922)
Fiduciary net position – beginning 1,824,800 1,966,722
Fiduciary net position – ending $ 2,129,332 $ 1,824,800
SeeaccompanyingNotestoBasicFinancialStatements.
December 31,2019 2018

CPS Energy FY2020 Basic Financial Statements
. Page 33
NOTESTOBASICFINANCIALSTATEMENTSJanuary31,2020and2019 1.SummaryofSignificantAccountingPolicies
ReportingEntity – City Public Service Board of San Antonio (also referred to as “CPS Energy” or the “Company”) has been owned by the City of San Antonio, Texas (“City”) since 1942. CPS Energy provides electricity and natural gas to San Antonio and surrounding areas. As a municipally owned utility, CPS Energy is exempt from the payment of income taxes, state franchise taxes, use taxes, and real and personal property taxes. CPS Energy provides certain payments and benefits to the City as permitted by bond ordinances. CPS Energy’s financial results are also included within the comprehensive annual financial report of the City.
The decision to include applicable component units in CPS Energy’s financial statements was made by applying the criteria set forth in Governmental Accounting Standards Board (“GASB”) Statement No. 61, TheFinancialReportingEntity:Omnibus,anamendmentofGASBStatementsNo.14andNo.34 and GASB Statement No. 84,FiduciaryActivities. The following legally separate entities, for which CPS Energy is financially accountable and with which a financial benefit/burden relationship exists, meet those criteria for inclusion in CPS Energy’s financial statements as component units; therefore, their financial statements are blended with those of CPS Energy:
The City Public Service Restated Decommissioning Master Trust for the South Texas Project (“28% Decommissioning Trust”), and
The City Public Service Decommissioning Master Trust (TCC Funded) (“12% Decommissioning Trust”).
These two component units are collectively referred to herein as the “Decommissioning Trusts” or the “Trusts.”
The fiduciary financial statements include four component units, fiduciary in nature, related to the CPS Energy Pension Plan (“Pension Plan”), the CPS Energy Group Health Plan, the CPS Energy Group Life Plan, and the CPS Energy Long-Term Disability Income Plan (collectively, “Employee Benefit Plans”). The financial results of the Pension Plan and the Employee Benefit Plans are reported on a calendar year basis and included in the Statements of Fiduciary Net Position and Statements of Changes in Fiduciary Net Position. The Pension Plan and the Employee Benefit Plans are also separately audited. Additional disclosures in accordance with GASB Statement No. 68, AccountingandFinancialReportingforPensions–AmendmentofGASBStatementNo.27, are presented for the Pension Plan in Note 9 – Employee Pension Plan and in Required Supplementary Information (“RSI”). Additional disclosures, in accordance with GASB Statement No. 75,Accounting and FinancialReporting for Postemployment BenefitsOther ThanPensions, are presented for the Employee Benefit Plans in Note 10 – Other Postemployment Benefits and RSI.
Included in CPS Energy’s financial statements are the applicable financial results for 40% of the South Texas Project (“STP”) Units 1 and 2.
STP is a nonprofit special-purpose entity that reports under the guidance issued by the Financial Accounting Standards Board (“FASB”), including Topic 958 of the FASB Accounting Standards Codification, Not‐for‐Profit Entities. As such, certain revenue recognition criteria and presentation features are different from GASB revenue recognition criteria and presentation features. No modifications have been made to STP’s financial information within CPS Energy’s financial statements for these differences.
CPS Energy FY2020 Basic Financial Statements
Page 34
FiscalYear(“FY”) – The fiscal years ended January 31, 2020 and 2019, are referred to herein as “FY2020” and “FY2019,” respectively.
BasisofAccounting – The financial statements of CPS Energy are presented in accordance with U.S. generally accepted accounting principles (“GAAP”) for proprietary funds of governmental entities. CPS Energy, including the Decommissioning Trusts, complies with all applicable pronouncements of GASB.
The fiduciary financial statements of the Pension Plan and the Employee Benefit Plans are reported using the economic resources measurement focus and are prepared on the accrual basis of accounting in conformity with U.S. GAAP. Contributions and income are recorded when earned and benefits and expenses are recorded when a liability is incurred, regardless of the timing of the related cash flow. The Pension Plan and the Employee Benefit Plans apply all applicable GASB pronouncements.
In accordance with the utility systems’ revenue bond ordinances, CPS Energy has adopted the uniform system of accounts prescribed by the National Association of Regulatory Utility Commissioners (“NARUC”). The financial statements are presented using the economic resources measurement focus and the accrual basis of accounting.
FY2019 GASB pronouncement implementations:
GASB Statement No. 83, CertainAssetRetirementObligations, establishes criteria for determining the timing and pattern of recognition of a liability and a corresponding deferred outflow of resources for legally enforceable asset retirement obligations (“AROs”) and requires that recognition occur when the liability is both incurred and reasonably estimable. With the adoption of this standard, the affected balances within the financial statements for the period ended January 31, 2018, were restated.
GASB Statement No. 88, CertainDisclosuresRelatedtoDebt,includingDirectBorrowingsandDirectPlacements,requires additional essential information related to debt disclosure in the notes to the financial statements. Required disclosures include unused lines of credit, assets pledged as collateral for the debt, and terms specified in debt agreements which are related to significant events of default with finance-related consequences, significant termination events with finance-related consequences, and significant subjective acceleration clauses. Under the Statement, direct borrowings and direct placement of debt are required to be reported separately from other debt. This Statement did not have a significant effect on CPS Energy’s financial reporting.
FY2020 GASB pronouncement implementations:
GASB Statement No. 84, FiduciaryActivities, establishes criteria for identifying fiduciary activities of all state and local governments for accounting and financial reporting purposes and how those activities should be reported. Evaluation of the Company’s fiduciary activities resulted in the identification of the Pension Plan and Employee Benefit Plans meeting the criteria to be reported under this guidance. Implementation of GASB Statement No. 84 resulted in the addition of the Statements of Fiduciary Net Position and Statements of Changes in Fiduciary Net Position as part of the basic financial statements. The additional statements present the combined activity of the separately audited Pension Plan and Employee Benefit Plans as of December 31, 2019 and 2018.
GASB Statement No. 90, MajorityEquityInterests–anamendmentofGASBStatementsNo.14andNo.61,improves the consistency and comparability of reporting a government’s majority equity interest in a legally separate organization and improves the relevance of financial statement

CPS Energy FY2020 Basic Financial Statements
. Page 35
information for certain component units. CPS Energy does not have a majority equity interest in an organization, therefore, the guidance was not applicable and had no impact on the Company’s financial statements.
Future GASB pronouncement implementations:
GASB Statement No. 87, Leases, requires the recognition of certain lease assets and liabilities for leases that previously were classified as operating leases and recognized as inflows or outflows of resources based on the payment provisions of the contract. The standard establishes a single model for lease accounting based on the foundational principle that leases are financings of the right-to-use an underlying asset. Under the Statement, a lessee is required to recognize a lease liability and an intangible right-to-use lease asset, and a lessor is required to recognize a lease receivable and a deferred inflow of resources, which enhances the relevance and consistency of information about the Company’s leasing activities. This standard will be adopted by CPS Energy in the fiscal year ending January 31, 2021. The Company has initiated an evaluation of the impact that adoption of this Statement will have on its financial statements.
GASB Statement No. 89, Accounting for InterestCost Incurredbefore theEndofaConstructionPeriod, requires that interest cost incurred before the end of a construction period be recognized as an expense in the period in which the cost is incurred for financial statements prepared using the economic resources measurement focus. As a result, interest cost incurred before the end of a construction period will not be included in the historical cost of a capital asset reported in a business-type activity or enterprise fund. This standard will be adopted by CPS Energy in the fiscal year ending January 31, 2021. The Company has initiated an evaluation of the impact that adoption of this statement will have on its accounting for allowance for funds used during construction (“AFUDC”).
GASB Statement No. 91, ConduitDebtObligations,provides a single method of reporting conduit debt obligations by issuers and eliminates diversity in practice for commitments extended by issuers and other arrangements with conduit debt obligations. The standard also clarifies the existing definition of conduit debt obligations and improves required note disclosures. This standard will become effective in CPS Energy’s fiscal year ending January 31, 2022; however, because CPS Energy’s debt instruments do not include conduit debt obligations, there is no expected impact on the Company’s financial statements.
GASB Statement No. 92, Omnibus2020,addresses a variety of topics and practice issues that have been identified during implementation and application of certain GASB Statements. The new statement clarifies issues related to leases, intra-entity transfers, pension and postemployment benefits, asset retirement obligations, risk pools, fair value measurements, and derivative instruments. This standard will be adopted by CPS Energy in the fiscal year ending January 31, 2021. The Company has initiated an evaluation of the impact that adoption of this statement will have on its financial statements.
GASB Statement No. 93, Replacement of Interbank Offered Rates, addresses accounting and financial reporting implications that result from the replacement of an interbank offered rate (IBOR) as the notable, London Interbank Offered Rate, is expected to cease to exist in its current form at the end of calendar year 2021. This statement will provide exceptions to the existing provisions for hedge accounting termination and lease modifications. This standard will be adopted by CPS Energy in the fiscal year ending January 31, 2022. The Company has initiated an evaluation of the impact that adoption of this statement will have on its financial statements.
CPS Energy FY2020 Basic Financial Statements
Page 36
The following information is presented alphabetically: Allowance forFundsUsedDuringConstruction (“AFUDC”) – To reflect funding methodology, the AFUDC rate includes both a debt and an equity component. The blended rate is composed of 50% equity and 50% debt based on construction funding forecasts. The investment rate is reviewed quarterly to determine if any adjustments are necessary. Alternate AFUDC rates are applied to projects costing more than $100 million, reflecting the method by which they are funded.
AssetRetirementObligations (“ARO”)– CPS Energy adopted GASB Statement No. 83, CertainAssetRetirementObligations, during FY2019 and accounts for AROs by recognizing the obligations as a liability based on the best estimate of the current value of outlays expected to be incurred once the assets are retired. See Note 17 – Asset Retirement Obligations.
BuildAmericaBonds (“BABs”) – The American Recovery and Reinvestment Act (“ARRA”) of 2009 provided authority for the issuance of BABs, which were issuable in calendar years 2009 and 2010 as taxable bonds. The ARRA permitted the issuer or the issuer’s paying agent to receive subsidy payments equal to 35% of the bond’s interest costs directly from the U.S. Department of the Treasury. Pursuant to the requirements of the Balanced Budget and Emergency Deficit Control Act of 1985, the federal government reduced the BABs subsidy as noted below:
SubsidyReduction PeriodCovered
6.9% October 1, 2016 through September 20, 2017 6.6% October 1, 2017 through September 20, 2018 6.2% October 1, 2018 through September 20, 2019 5.9% October 1, 2019 through September 20, 2020
CPS Energy has taken the position that the BABs direct subsidy should be deducted when calculating debt service since the subsidy is received directly by a trustee to be used solely for BABs debt service payments. Transaction details for CPS Energy’s BABs issuances are provided in Note 7 – Revenue Bonds.
CapitalAssets – The costs of additions and replacements of assets identified as major components or property units are capitalized. Maintenance and replacement of minor items are charged to operating expense. For depreciable assets that are retired due to circumstances other than impairment, the cost of the retired asset, plus removal costs and less salvage, is charged to accumulated depreciation. Per the financial reporting requirements of GASB Statement No. 42, Accounting and Financial Reporting forImpairment of Capital Assets and for Insurance Recoveries, any losses associated with capital asset impairments will be charged to operations, not to accumulated depreciation.
A constructed utility plant is stated at the cost of construction, including expenditures for contracted services; equipment, material and labor; indirect costs, including general engineering, labor, equipment and material overheads; and AFUDC, or capitalized interest. AFUDC is applied to projects that require 30 days or more to complete.
Proceeds from customers to partially fund construction expenditures are reported as contributed capital in the Statements of Revenues, Expenses and Changes in Net Position as increases in net position in accordance with the requirements of GASB Statement No. 33, Accountingand FinancialReporting forNonexchangeTransactions. The amount reported for contributed capital was $59.5 million at January 31, 2020, as compared with $54.9 million at January 31, 2019. This included donated assets of $4.0 million and $5.2 million, respectively. The remaining portion of these balances, $55.5 million for FY2020 and $49.7 million for FY2019, represents contributions received from customers as payments for utility extensions and services, as well as funding for community initiatives and other local partnership projects.

CPS Energy FY2020 Basic Financial Statements
. Page 37
Except for nuclear fuel, which is amortized over units of production, CPS Energy computes depreciation using the straight-line method over the estimated service lives of the depreciable property according to asset type. Total depreciation as a percent of total depreciable assets, excluding nuclear fuel, was 3.1% for FY2020, and 3.4% for FY2019.
The estimated useful lives of depreciable capital assets for FY2020 and FY2019 were as follows:
CPS Energy engages an independent third-party consulting firm to conduct a depreciation study, which is performed every five years. The most recent study was completed in FY2018, and the resulting depreciation rates were applied beginning in that period.
Thresholds contained in the Company’s capitalization policy, procedures and guidelines for FY2020 and FY2019 were as follows:
CashEquivalentsandInvestments,UnrestrictedandRestricted – CPS Energy’s investments with a maturity date within one year of the purchase date are reported at amortized cost, which approximates fair value. Amortization of premium and accretion of discount are recorded over the terms of the investments. CPS Energy’s investments with a maturity date longer than one year from the purchase date are accounted for at fair value. As available, fair values are determined by using generally accepted financial reporting services, publications and broker-dealer information. The specific identification method is used to determine costs in computing gains or losses on sales of securities. CPS Energy also reports all investments of the Decommissioning Trusts at fair value. The investments of the Pension Plan and the Employee Benefit Plans are also reported at fair value in the fiduciary financial statements. Refer to Note 3 – Fair Value Measurement for additional information.
Restricted funds are generally for uses other than current operations. They are designated by law, ordinance or contract and are often used to acquire or construct noncurrent assets. Restricted funds consist primarily of unspent bond or commercial paper proceeds, debt service required for the New Series Bonds (senior lien obligations), Series Bonds (junior lien obligations), commercial paper, and funds for
Depreciable Capital AssetBuildings and structures 20–45 yearsSystems and improvements
Generation 18–49 years Transmission and distribution 15–60 years Gas 35–65 years
Intangibles ‐ software 10 years Intangibles ‐ other 20–30 yearsMachinery and equipment 4–20 years Mineral rights and other 20–40 years Nuclear fuel Units of Production
Estimated Useful Life
Asset ClassLand, land improvements and certain easementsBuildings and building improvements $10,000Computer software - purchased 50,000 Computer software - internally developed 50,000 Computer software - enhancements/upgrades 50,000 Computer hardware 3,000 All other assets 3,000
ThresholdCapitalize all

CPS Energy FY2020 Basic Financial Statements
Page 38
future construction or contingencies. Restricted funds also include customer assistance programs that receive proceeds from outside parties and the assets of the Decommissioning Trusts. Also included in the restricted funds classification is the Repair and Replacement Account, restricted in accordance with the Company’s bond ordinances.
CPS Energy sets aside 1% of prior fiscal year electric base rate revenue, which is transferred to the City on an annual basis as an additional transfer. In accordance with bond ordinances, the combined total of all payments to the City may not exceed 14% of gross revenues.
For additional disclosures provided in accordance with GASB Statement No. 40, DepositandInvestmentRisk Disclosures, see Note 2 – Cash, Cash Equivalents and Investments. These disclosures address investment exposure to interest rate risk, credit risk (including custodial credit risk and concentration of credit risk), and foreign currency risk, as applicable.
CompensatedAbsences – Employees earn vacation benefits based upon their employment status and years of service. At January 31, 2020 and 2019, the accrued liabilities for those vested benefits were $22.3 million and $21.8 million, respectively, which were recorded as accrued liabilities on the Statements of Net Position.
Decommissioning – CPS Energy accounts for its legal obligation to decommission STP Units 1 and 2 in accordance with GASB Statement No. 83. The Company has recognized its pro rata share of an ARO based on the best estimate of the current values of outlays expected to be incurred to decommission the units, determined by the most recent cost study. A new cost study is performed every 5 years; in years after the latest study, the Statement requires the current value of the Company’s ARO be adjusted for the effects of inflation or deflation, at least annually. In addition to the ARO, the Company has recorded deferred outflows of resources that are being amortized over the remaining useful life of the plant. See Note 13 – South Texas Project for additional details on the most recent cost study.
Additionally, due to requirements under the Code of Federal Regulations governing nuclear decommissioning trust funds, a zero-net position approach is applied in accounting for the Decommissioning Trusts. Accordingly, current year and prior year activity in the Trusts is reported in the nonoperating income (expense) section of the Statements of Revenues, Expenses and Changes in Net Position as decommissioning net costs recoverable (refundable). The cumulative effect of activity in the Trusts is reported on the Statements of Net Position as a noncurrent liability referred to as Decommissioning net costs refundable since any excess funds are payable to customers. Going forward, prolonged unfavorable economic conditions could result in the assets of the Trusts being less than the estimated decommissioning liability. In that case, instead of an excess as currently exists, there would be a deficit that would be reported as decommissioning net costs recoverable and would be receivable from customers.
A project to develop an independent spent fuel storage installation (“Dry Cask Storage Project”) was recently completed at STP to provide for storage of spent nuclear fuel after the spent fuel pool has reached capacity. CPS Energy’s Decommissioning Trusts have separate spent fuel management accounts that paid for these costs. By contract, spent fuel will eventually be removed to final storage by the Department of Energy (“DOE”). The DOE failed to meet the contractual start date to receive spent fuel, and STP and other utilities have reached settlement agreements with the DOE. In the most recent settlement agreement dated March 15, 2017, the DOE extended its commitment to reimburse STP for allowable spent fuel management expenditures through calendar year 2019. STP is currently working with the DOE to extend the settlement agreement for another three years.
Ongoing costs for the spent fuel management project are being funded by the STP owners (CPS Energy; the City of Austin; and NRG South Texas LP, a wholly owned subsidiary of NRG Energy, Inc.) as

CPS Energy FY2020 Basic Financial Statements
. Page 39
expenditures are incurred. CPS Energy is entitled to request reimbursement at its discretion from its Decommissioning Trusts for the Company’s portion of allowable costs. Annually, the South Texas Project Nuclear Operating Company (“STPNOC”) submits claims to the DOE for the reimbursement of allowable costs for spent fuel management. Allowable costs are returned to the owners by STP upon receipt from the DOE. Qualifying spent fuel management costs not reimbursable by the DOE are funded by the Trusts. Spent fuel management costs that do not qualify for reimbursement by the DOE or the Trusts are recorded as operation and maintenance (“O&M”) expense or capital costs.
DeferredInflowsofResources – Deferred inflows of resources related to pension and OPEB amounted to $52.3 million and $170.9 million at January 31, 2020 and 2019, respectively. Deferred inflows of resources related to unrealized future revenue associated with the sale of the communication towers totaled $0.9 million and $2.1 million at January 31, 2020 and 2019, respectively. Deferred inflows of resources related to future recoveries associated with the FY2020 Joint Base San Antonio (“JBSA”) agreement totaled $84.3 million at January 31, 2020.
Consistent with hedge accounting treatment required for derivative instruments that are determined to be effective in offsetting changes in the cash flows of the hedged item, changes in fair value are reported as deferred outflows or deferred inflows of resources on the Statements of Net Position until the expiration of the contract underlying the hedged expected fuel purchase transaction. When fuel hedging contracts expire, at the time the purchase transactions occur, the deferred balance is recorded as an adjustment to fuel expense. There were no deferred inflows of resources related to fuel hedges at January 31, 2020. Deferred inflows of resources related to fuel hedges totaled $0.3 million at January 31, 2019.
Deferred Outflows of Resources – Deferred outflows of resources related to pension and OPEB amounted to $213.8 million and $173.2 million at January 31, 2020 and 2019, respectively.
Deferred outflows of resources related to fuel hedges totaled $33.6 million and $4.6 million at January 31, 2020 and 2019, respectively.
For current and advance refundings of debt, the difference between the reacquisition price and the net carrying amount of the old debt is recorded as unamortized reacquisition costs and reported as deferred outflows of resources. These amounts are amortized as components of interest expense over the shorter of the remaining life of the refunding or the refunded debt. At January 31, 2020 and 2019, reacquisition costs totaled $61.4 million and $62.2 million, respectively.
Deferred outflows of resources related to AROs associated with the decommissioning of STP Units 1 and 2, and the retirement of the fuel storage tanks, and vaults totaled $498.0 million and $491.1 million at January 31, 2020 and 2019, respectively.
Federal and State Grant Programs – Periodically, federal or state grants are made available to CPS Energy as a subrecipient for a portion of grant funds allocated to the state of Texas or as direct awards. Grant receipts are recorded as nonoperating income and generally reimburse CPS Energy for costs, recorded as operating expenses, incurred in the administration of the program. Federal or state grants that subsidize in whole or a partial amount of capital assets are recognized as contributed capital. These accounting treatments result in no impact to the Company’s net position. Revenues associated with the grant-related programs are exempt from payments of a percentage of gross revenues made to the City. Grant funding received by the Company is subject to review and audit by the grantor agencies. Such audits could lead to requests for reimbursements to the grantor agencies for expenditures disallowed under terms of the grants. Management believes such disallowances, if any, would be immaterial.

CPS Energy FY2020 Basic Financial Statements
Page 40
GenerationAssetPurchase – In FY2013, CPS Energy purchased the Rio Nogales combined-cycle natural gas electric generating plant in Seguin, Texas. In conjunction with the purchase, CPS Energy entered into a Tax Exemption Settlement Agreement in which CPS Energy agreed to pay $25.5 million to certain parties to compromise, terminate claims and settle any disputes relating to exemption of ad valorem taxes involving the parties to this agreement. The payment was recorded as an intangible asset that is being amortized over the life of the agreement, which runs through December 2041.
Inventories – CPS Energy maintains inventories for its materials and supplies and fossil fuels. In total, CPS Energy reported ending inventories of $223.0 million and $154.9 million at January 31, 2020 and 2019, respectively. Included in these amounts was CPS Energy’s portion of STP inventories, which are valued at the lower of average cost or net realizable value. CPS Energy’s directly managed inventories are valued using an average costing approach and are subject to write-off when deemed obsolete. CPS Energy has established a reserve for excess and obsolete inventory that is based on a combination of inventory aging and specific identification of items that can be written off. The reserve is intended to adjust the net realizable value of inventory CPS Energy may not be able to use due to obsolescence. The balance in the reserve amounted to $5.9 million and $6.0 million at January 31, 2020 and 2019, respectively. The reserve balance at January 31, 2019, included approximately $2.9 million of inventory associated with the impairment of J.T. Deely Units 1 and 2.
Long‐TermDebt– To support its long-term capital financing needs, CPS Energy uses several types of debt instruments. As of January 31, 2020, and 2019, these included fixed-rate and variable-rate bonds, as well as commercial paper. Relative to the bond instruments, provisions may be included that allow for refunding after specified time periods during the bond term.
Subject to applicable timing restrictions that may prevent early payoff, CPS Energy also has the option to defease or extinguish debt. A defeasance occurs when funds are placed in an irrevocable trust to be used solely for satisfying scheduled payments of both interest and principal of the defeased debt, which fully discharges the bond issuer’s obligation. At the time of an extinguishment, since the issuer no longer has the legal obligation, the defeased debt is removed from the Statements of Net Position, the related unamortized costs are expensed, and the gain or loss is immediately recognized.
Current refundings involve issuing new debt (refunding bonds) to redeem existing debt (refunded bonds) that can be called within 90 days of the call date of the refunded bonds. Advance refunding of bonds involves issuing new debt to redeem existing debt that cannot be called within 90 days of issuing the refunding bonds. In these circumstances, the refunding bond proceeds are irrevocably escrowed with a third party. These proceeds, and income thereon, are used to pay the debt service on the refunded bonds until the refunded bonds can be called. Refunding bonds are generally issued to achieve debt service savings. In December 2017, Congress passed the Tax Cuts & Jobs Act (“Act”). The Act preserved tax-exempt financing for municipal bonds but eliminated the use of tax-exempt advanced refundings at the end of calendar year 2017. See Note 7 – Revenue Bonds for information on current-year debt refundings.
Bond premiums and discounts are amortized using the effective interest method over the life of the related debt.
NetPensionLiability – A net pension liability is recorded in accordance with GASB Statement No. 68, AccountingandFinancialReportingforPensions–anAmendmentofGASBStatementNo.27. The liability is the difference between the actuarial total pension liability and the Pension Plan’s fiduciary net position as of the measurement date. The net pension liability was $378.1 million at January 31, 2020, and $255.9 million at January 31, 2019. For additional information, see Note 9 – Employee Pension Plan.

CPS Energy FY2020 Basic Financial Statements
. Page 41
OtherNoncurrentAssets– Other noncurrent assets include prepayments, Save for Tomorrow Energy Plan (“STEP”) net costs recoverable, inventory relating to long-term service agreements (“LTSA”) and net OPEB (asset) liability. This section also includes a pension regulatory asset and unamortized bond expense discussed within the Regulatory Accounting topic below.
Prepayments– Included in prepayments is the balance related to an agreement entered in November 2011 for purchased power from San Antonio-area solar energy facilities with a total of 30 megawatt (“MW”) of capacity. In FY2013, $77.0 million in prepayments were made for approximately 60% of the anticipated annual output over a period of 25 years. At January 31, 2020, of the remaining prepayment balance, $3.1 million was classified as current and $50.7 million was classified as noncurrent. At January 31, 2019, of the remaining prepayment balance, $3.1 million was classified as current and $53.7 million was classified as noncurrent. The balance of the output is purchased on a pay-as-you-go basis.
SaveforTomorrowEnergyPlan– In FY2009, CPS Energy was authorized by City ordinance to spend up to $849 million to save 771 MW of customer demand through energy efficiency and conservation programs by calendar year 2020. Under STEP, CPS Energy launched an array of weatherization, energy efficiency, solar, and demand response programs. As of January 31, 2020, CPS Energy had achieved its STEP goal of reducing demand by an estimated 825 MW and approximately 15% below the original STEP budget. Due to the success of the STEP program, the City authorized Bridge STEP in January 2020, which allows for the existing customer programs to continue for an additional year (through FY2021).
Annually, approximately $9.3 million of STEP expenses are funded through the electric base rate and reported as O&M expenses. STEP expenses in excess of this initial amount per year are recovered through the fuel adjustment factor over a period of 12 months, or longer for certain STEP expenses, beginning in the subsequent fiscal year after the costs are incurred and have been independently validated. These STEP recoveries are accrued as a regulatory asset referred to as STEP net costs recoverable.
Inventory relating to long‐term service agreements – CPS Energy maintains LTSA arrangements with General Electric Inc. (“GE”) to provide maintenance services and select replacement parts for certain combined-cycle power plants in CPS Energy’s fleet. Per the maintenance schedules, Advanced Gas Path (“AGP”) parts are delivered to the facilities. AGP parts not immediately required for maintenance procedures are recorded as inventory until the installation process for each set of parts at the power plant is initiated, at which time the parts are reclassified to capital assets. The liability for the purchase of the parts, along with other LTSA payment obligations are recorded as a liability on the Statements of Net Position. For additional information related to the LTSAs, see Note 11 – Other Obligations and Risk Management.
NetOPEB(Asset)Liability– A net OPEB (asset) liability is recorded in accordance with GASB Statement No. 75. The asset or liability is the difference between the actuarial total OPEB liabilities and the Employee Benefit Plans’ fiduciary net positions as of the measurement date. The net OPEB (asset) liability was $(6.6) million and $(43.7) million at January 31, 2020 and 2019, respectively. For additional information, see Note 10 – Other Postemployment Benefits.
OtherNoncurrentLiabilities – Other noncurrent liabilities include the obligation for Project Warm resources held by the Company, the unrealized change in fair value of fuel hedges, unearned communication shelter revenue, note payable, long-term LTSA obligations and other liabilities for balances payable and deposits received.
RateIncreases – Rates are set by the CPS Energy Board of Trustees (“Board”) and approved by the San Antonio City Council. On November 7, 2013, the City Council approved a 4.25% increase in both CPS Energy’s electric and natural gas base rates, which were effective February 2014.

CPS Energy FY2020 Basic Financial Statements
Page 42
Reclassifications– Certain amounts in the prior year’s financial statements have been reclassified to conform to the current-year presentation.
RegulatoryAccounting – Regulatory accounting applies to governmental entities with rate-regulated operations, such as CPS Energy, that fall within the scope of GASB Statement No. 62. Regulatory accounting may be applied by entities, as approved by the governing body, to activities that have regulated operations that meet all required criteria. By establishing a regulatory asset, an entity seeks to recognize a cost over a future period and match recovery of those costs from its ratepayers to the amortization of the asset. An entity must demonstrate that adequate future revenue will result from inclusion of that cost in allowable costs for rate-making purposes.
Beginning in FY2014, with the implementation of GASB Statement No. 65, ItemsPreviouslyReportedasAssetsandLiabilities, CPS Energy adopted the use of regulatory accounting to account for debt issuance costs. Prior to FY2014, the Company had historically reported debt issuance costs as assets and amortized them over the life of the related debt. Under GASB Statement No. 65, debt issuance costs no longer meet the definition of an asset, nor do they meet the definition of a deferred outflow of resources; therefore, they must be expensed in the period incurred. CPS Energy establishes regulatory assets for the debt issuance costs that GASB Statement No. 65 would otherwise require be expensed. This regulatory accounting treatment results in the amortization of these costs over the life of the related debt as the designated rate-recovery period. See Note 7 – Revenue Bonds for additional information.
The Company also elected to use regulatory accounting in conjunction with the implementation of GASB Statement No. 68 in FY2015, which required immediate recognition of the Company’s previously unrecognized net pension liability. For governmental entities other than those whose operations are rate regulated, the GASB Statement No. 68 adoption accounting required a charge to net position (equity) for the net effect of the restatements required to recognize the net pension liability. CPS Energy elected to use regulatory accounting, as allowed under GASB Statement No. 62, to create a regulatory asset representing the net effect of the prior period restatements, which totaled $266.5 million and is being amortized over a rate-recovery period of 50 years. The amortization expense was $5.3 million for FY2020 and FY2019 and is included in annual OPEB and pension expense on the Statements of Revenues, Expenses and Changes in Net Position. See Note 9 – Employee Pension Plan for additional information.
Revenues and Expenses – Revenues are recorded when earned. Customers’ meters are read, or periodically estimated, and bills are prepared monthly based on billing cycles. Beginning in 2014, CPS Energy began replacing existing electric and gas meters with new "smart meters" that allow two-way communication between the meters and CPS Energy. One of the benefits of the smart meters is that they allow each meter to be read electronically without having to send a meter reader out to manually read each meter to determine the current billing period’s electric or gas consumption. As system growth continues to increase, CPS Energy will continue to install and replace electric and gas meters with smart meters to optimize efficiencies.
Rate tariffs include adjustment clauses that permit recovery of electric and gas fuel costs. CPS Energy uses historical information from prior fiscal years as partial bases to estimate and record earned revenue not yet billed (unbilled revenue). This process involves an extrapolation of customer usage over the days since the last meter read through the last day of the monthly period. Also included in unbilled revenue are the over/under-recoveries of electric and gas fuel costs and regulatory assessments. Unbilled revenue receivable recorded at January 31, 2020 and 2019, including estimates for electric fuel and gas costs, was $21.4 million and $20.1 million, respectively.
An adjustment clause in CPS Energy’s rate tariffs also permits recovery of regulatory assessments. CPS Energy recovers assessments from the PUCT for transmission access charges and from the Texas Independent System Operator, also known as ERCOT, for its operating costs and other charges applicable

CPS Energy FY2020 Basic Financial Statements
. Page 43
to CPS Energy as a wholesale provider of power to other utilities. Regulatory assessments as of January 31, 2020 and 2019, were $82.6 million and $86.2 million, respectively.
Operating revenues include receipts from energy sales, ancillary services and miscellaneous revenue, such as late payment fees and rental income, related to the operation of the Systems. Operating expenses are recorded as incurred and include those costs that result from the ongoing operations of the Systems.
Nonoperating income consists primarily of investment income, including fair value adjustments. Certain miscellaneous income amounts from renting general property, providing various services and rental income from the sale of communication towers are also recorded as nonoperating income when they are not directly identified with the Systems.
ServiceConcessionArrangement(“SCA”) – In accordance with GASB Statement No. 60, Accountingand Financial Reporting for Service Concession Arrangements, a service concession arrangement between CPS Energy, owner, and Thousand Trails Management Services, Inc. (“TTMSI”), provider, was signed on November 20, 2009. TTMSI provides labor, supervision, management, services and equipment for Braunig Lake Park and Calaveras Lake Park, which are owned by CPS Energy. Gross receipts are distributed based on the contract agreement, which expires on November 30, 2024. CPS Energy is to retain ownership of both parks upon expiration of the arrangement.
At January 31, 2020 and 2019, a receivable was recorded in the amount of $1.2 million and $1.1 million, respectively, related to the TTMSI SCA. This balance represents the net amount of gross receipts less expenditures as of January 31, 2020 and 2019, respectively, for both parks. The asset book values as of January 31, 2020, were $0.8 million for each park. The asset book values as of January 31, 2019, for Braunig Lake Park and Calaveras Lake Park were $0.9 million and $0.8 million, respectively.
StatementsofCashFlows – For purposes of reporting cash flows, CPS Energy considers all highly liquid debt instruments purchased with an original maturity of 90 days or less to be cash equivalents. CPS Energy’s Statements of Cash Flows separately list the noncash transactions.
Use of Estimates – The preparation of financial statements in conformity with GAAP requires management to make estimates and assumptions. Those estimates and assumptions affect the reported amounts of assets and liabilities, disclosure of contingent assets and liabilities at the date of the financial statements, and the amounts of revenues and expenses reported during the fiscal periods. Accordingly, actual results could differ from those estimates.
2.Cash,CashEquivalentsandInvestments
CPS Energy’s cash deposits at January 31, 2020 and 2019, were either insured by federal depository insurance or collateralized by banks. For deposits that were collateralized, the collateral included letters of credit and securities. The securities were U.S. Government, U.S. Government Agency or U.S. Government-guaranteed obligations held in book entry form by the Federal Reserve Bank of New York or other allowable banks in CPS Energy’s name.
Separation–CPS Energy’s cash, cash equivalents and investments can be separated in the following manner:
Those directly managed by CPS Energy, and Those managed through the Decommissioning Trusts.

CPS Energy FY2020 Basic Financial Statements
Page 44
For financial reporting purposes, cash, cash equivalents and investments managed directly by CPS Energy have been consistently measured as of the end of the applicable fiscal years. The Decommissioning Trusts are reported on a calendar year basis.
CashandCashEquivalents (In thousands)
SummaryofCash,CashEquivalentsandInvestments (In thousands)
PublicFunds InvestmentAct (“PFIA”) – CPS Energy’s investments and the investments held in the Decommissioning Trusts are subject to the rules and regulations of the PFIA. The PFIA regulates what types of investments can be made, requires written investment policies, mandates training requirements of investment officers, requires internal management reports to be produced at least quarterly, and provides for the selection of authorized broker-dealers and investment managers.
CashPetty cash funds on hand (current) $ 50 $ 49 Deposits with financial institutions
Unrestricted CPS Energy deposits (current) 1,320 2,002 Restricted CPS Energy deposits (noncurrent)
Capital projects 126 144 Debt service 796 938 Project Warm 335 314
Total cash 2,627 3,447
Cash equivalentsInvestments with original maturities of 90 days or less
CPS Energy unrestricted (current) 173,277 347,653 CPS Energy restricted (noncurrent) 220,493 209,500 Decommissioning Trusts – restricted (noncurrent) 25,814 23,430
Total cash equivalents 419,584 580,583
Total cash and cash equivalents $ 422,211 $ 584,030
2020 2019January 31,
Cash and cash equivalentsCPS Energy – unrestricted and restricted $ 396,397 $ 560,600 Decommissioning Trusts – restricted 25,814 23,430
Total cash and cash equivalents 422,211 584,030
Gross investments – current and noncurrentCPS Energy – unrestricted and restricted 1,062,823 1,228,094 Decommissioning Trusts – restricted 642,074 563,894
Total gross investments 1,704,897 1,791,988
Investments with original maturities of 90 daysor less included in cash and cash equivalents
CPS Energy – unrestricted and restricted (393,770) (557,153) Decommissioning Trusts – restricted (25,814) (23,430)
Total cash equivalents (419,584) (580,583)
Total gross investments less cash equivalents 1,285,313 1,211,405
Total cash, cash equivalents and investments $ 1,707,524 $ 1,795,435
2020 2019January 31,

CPS Energy FY2020 Basic Financial Statements
. Page 45
Investments of CPSEnergy – CPS Energy’s allowable investments are defined by Board resolution, CPS Energy Investment Policy, bond ordinances, commercial paper ordinances and state law. These investments are subject to market risk, and their fair value will vary as interest rates fluctuate. All CPS Energy investments are held in trust custodial funds by independent banks.
Investments of theDecommissioning Trusts – CPS Energy’s investments in the Decommissioning Trusts are held by an independent trustee. Investments are limited to those defined by Board resolution, the South Texas Project Decommissioning Trust Investment Policy, the Investment Committee, the Trust Agreements and state law, as well as PUCT and Nuclear Regulatory Commission (“NRC”) guidelines. Allowable investments for the Decommissioning Trusts include all types directly permissible for CPS Energy, except for investment pools. Additionally, permitted are investments in equities and corporate bonds (including international securities traded in U.S. dollars and on U.S. stock exchanges). In accordance with the Trusts’ Investment Policy, total investments can include a maximum of 60% equity securities. To further reduce the overall risk of the portfolio, the target allocations for both Trusts are 64.0% fixed income, 27.0% equities and 9.0% U.S. real estate investment trusts.
PermissibleInvestments
InvestmentDescriptionCPSEnergyInvestments
DecommissioningTrusts
Investments
U.S. Government, U.S. Government Agency, or U.S. Government-guaranteed obligations
Collateralized mortgage obligations issued by the U.S. Government, or other obligations for which principal and interest are guaranteed by the U.S. or state of Texas
Fully secured certificates of deposit offered by a broker or issued by a depository institution that has its main office or branch office in the state of Texas
Direct repurchase agreements
Reverse repurchase agreements
Defined bankers’ acceptances and commercial paper
No-load money market mutual funds
Investment pools Not Permitted
Equities Not Permitted
Investment quality obligations of states, agencies, counties, cities and political subdivisions of any state
Corporate bonds Not Permitted
International securities Not Permitted
No-load commingled funds Not Permitted
Securities lending programs
Other specific types of secured or guaranteed investments

CPS Energy FY2020 Basic Financial Statements
Page 46
Cash,CashEquivalentsandInvestmentsbyFund (In thousands)
RiskExposure –Cash equivalents, equity and fixed-income investments are exposed to interest rate risk, credit risk (including custodial credit risk and concentration of credit risk) and foreign currency risk. Interest rate risk is the exposure to fair value losses resulting from rising interest rates. Credit risk is the risk that an issuer of an investment will not fulfill its obligations (will be unable to make timely principal and interest payments on the security). Foreign currency risk is the exposure to fair value losses arising from changes in exchange rates. Cash, cash equivalents and fixed-income investments are also exposed to inflation, liquidity, political, legal, event, reinvestment and timing (call) risks. Additionally, equity investments are exposed to political, legal, event, market and general economic risks. Due to market fluctuations, it is possible that substantial changes in the fair value of investments could occur after the end of the reporting period.
CPS Energy’s investments and the investments in the Decommissioning Trusts are managed with a conservative focus. The Investment Policies are structured to ensure compliance with bond ordinances, the PFIA, the Public Funds Collateral Act, the NRC, the PUCT, other applicable state statutes and Board resolutions relating to investments. CPS Energy identifies and manages risks by following an appropriate investment oversight strategy, establishing and monitoring compliance with Investment Policies and procedures, and continually monitoring prudent controls over risks.
UnrestrictedCash and cash equivalents $ 174,647 $ 349,704 Investments 296,237 104,171
Total unrestricted (current) 470,884 453,875
RestrictedDebt service
Cash and cash equivalents 1,944 13,046 Total debt service 1,944 13,046
Capital projectsCash and cash equivalents 54,251 54,233
Total capital projects 54,251 54,233 Ordinance
Cash and cash equivalents 165,202 143,285 Investments 365,315 559,375
Total ordinance 530,517 702,660 Project Warm
Cash and cash equivalents 353 332 Investments 7,501 7,395
Total Project Warm 7,854 7,727 Decommissioning Trusts
Cash and cash equivalents 25,814 23,430 Investments 616,260 540,464
Total Decommissioning Trusts 642,074 563,894
Cash and cash equivalents 247,564 234,326 Investments 989,076 1,107,234
Total restricted (noncurrent) 1,236,640 1,341,560
Total cash, cash equivalents and investments (unrestricted and restricted) $ 1,707,524 $ 1,795,435
January 31,
Total restricted
2020 2019

CPS Energy FY2020 Basic Financial Statements
. Page 47
SummaryofInvestments(IncludingCashEquivalents)byOrganizationalStructureandType1
(In thousands)
InvestmentPolicies – In accordance with state law, the Trusts’ Investment Policy allows for investment in additional types of securities, such as corporate bonds and equity securities. The policy provides guidelines to ensure all funds are invested in authorized securities to earn a reasonable return. The primary emphasis is placed on long-term growth commensurate with the need to preserve the value of the assets and, at the time funds are needed for decommissioning costs, on liquidity. The Investment Policy continues to follow the “prudent person” concept.
GASBStatementNo.40 – In accordance with GASB Statement No. 40, additional disclosures have been provided in this note that address investment exposure to interest rate risk, credit risk (including custodial credit risk and concentration of credit risk), and foreign currency risk, as applicable. CPS Energy’s investments and those in the Decommissioning Trusts do not have custodial credit risk, as all investments are held either by an independent trustee or bank and are in CPS Energy’s or the Decommissioning Trusts’ names.
CPSEnergyInvestments
In accordance with GASB Statement No. 40, the following tables address concentration of credit risk and interest rate risk exposure by investment type using the weighted-average maturity (“WAM”) method. Since CPS Energy does not hold foreign instruments in its direct investments (those held by CPS Energy), foreign currency risk is not applicable.
Interestraterisk –In accordance with its Investment Policy, CPS Energy manages exposure to fair value losses resulting from rising interest rates by placing a limit on the portfolio’s WAM. The Investment Policy limits the WAM to three years or less, which allows for the management of risk while optimizing returns. CPS Energy invests in money market mutual funds that have no fixed maturities.
CPS Energy investmentsU.S. Treasuries, U.S. Agencies, municipal bonds,
CDs, commercial paper, investment poolsand money market mutual funds $ 1,062,823 $ 1,228,094
Decommissioning TrustsU.S. Treasuries, U.S. Agencies, municipal bonds
and money market mutual funds 239,218 218,830 Corporate bonds 148,752 138,496 Foreign bonds 13,186 12,579
Subtotal 401,156 369,905 Common stock 179,629 144,473 Real estate investment trusts 60,538 48,802 Preferred stock 751 714
Total Decommissioning Trusts 642,074 563,894
Total investments $ 1,704,897 $ 1,791,988
1
2020 2019January 31,
Excludes cash of $2.6 million and $3.4 million as of January 31, 2020 and 2019, respectively.

CPS Energy FY2020 Basic Financial Statements
Page 48
(Dollars in thousands)
CreditRating Allocation AllocationU.S. Treasuries (AA+) $ 27,989 $ 27,989 2.63% $ 27,574 $ 27,574 2.24%AAA / Aaa 408,065 408,065 38.39% 565,293 565,293 46.03%AA+ / Aa1 526,317 526,317 49.52% 532,328 532,328 43.35%AA / Aa2 51,885 51,885 4.89% 47,017 47,015 3.83%AA- / Aa3 19,423 19,423 1.83% 17,357 17,357 1.41%A+ / A1 2,775 2,775 0.26% 2,680 2,680 0.22%Not rated1 26,369 26,369 2.48% 35,845 35,845 2.92%
Total fixed-income portfolio $ 1,062,823 $ 1,062,823 100.00% $ 1,228,094 $ 1,228,092 100.00%
CarryingValue
FairValue
January31,2020 January 31, 2019
CarryingValue
FairValue
1 Interest bearing deposit accounts & CDs which still meet PFIA/CPS Energy Investment Policy requirements.
Concentrationofcreditrisk –In accordance with its Investment Policy, CPS Energy manages exposure to concentration of credit risk through diversification and by limiting investment in each federal agency to 35% and investment in any other issuer of debt securities to 5% of the total fixed-income portfolio. Additionally, negotiable certificates of deposit are limited to 35% of the total portfolio per issuer.
Creditrisk – In accordance with its Investment Policy, CPS Energy manages exposure to credit risk by limiting long-term debt security investments to those with a credit rating of “A” or better. As of January 31, 2020, and 2019, CPS Energy held no debt securities with a long-term credit rating below “A-,” or equivalent, or a short-term credit rating below “A-1/P-1/F-1.”
DecommissioningTrustsInvestments
As mentioned previously, the Decommissioning Trusts report their assets on a calendar year basis; therefore, information related to the Trusts is as of December 31, 2019 and 2018. The tables in this section address interest rate risk exposure by investment type, concentration of credit risk, credit risk and foreign currency risk. All investments held by the Decommissioning Trusts are long-term in nature and are recorded at fair value.
Interest rate risk –Generally, the long-term nature of the liabilities and the limited need for daily operating liquidity allow interim fluctuations in fair value to occur without jeopardizing the ultimate value of the assets. Where long-term securities are held, the interim fair value of assets can be sensitive to changes in interest rates. As the general level of interest rates moves up and down, the interim fair value of longer-maturity bonds may change substantially.
To mitigate interest rate risk, a limitation is placed on the weighted-average duration (“WAD”) of the fixed-income portfolio. The overall portfolio duration is limited by the Investment Policy to a deviation of no more than +/- 1.5 years from the WAD of the Investment Committee’s specified fixed-income index.
(Dollars in thousands)
InvestmentType Allocation WAM Allocation WAMU.S. Treasuries $ 27,989 $ 27,989 2.63% 1.0 $ 27,574 $ 27,574 2.24% 1.5 U.S. Agencies
Federal Agriculture Mtg Corp 5,001 5,001 0.47% 0.2 24,891 24,891 2.03% 0.5 Federal Farm Credit Bank 163,578 163,578 15.39% 4.0 95,665 95,665 7.79% 3.3 Federal Home Loan Bank 62,226 62,226 5.85% 4.8 92,478 92,478 7.53% 4.4 Federal Home Loan Mortgage Corp 88,851 88,851 8.36% 3.4 137,067 137,067 11.16% 3.9 Federal National Mortgage Assn 146,707 146,707 13.80% 4.8 126,504 126,504 10.30% 4.6 Small Business Administration 22,678 22,678 2.13% 6.6 22,196 22,196 1.81% 5.7
Municipal bonds 152,024 152,024 14.30% 2.3 134,567 134,565 10.96% 1.9 Certificates of deposit ‐ - - - 10,000 10,000 0.81% 0.6 Investment pools 297,415 297,415 28.00% - 471,702 471,702 38.41% - Money market mutual funds 96,354 96,354 9.07% - 85,450 85,450 6.96% -
Total fixed-income portfolio $ 1,062,823 $ 1,062,823 100.00% 2.3 $ 1,228,094 $ 1,228,092 100.00% 1.9
January 31, 2019
CarryingValue
Fair Value
Carrying Value
Fair Value
January31,2020
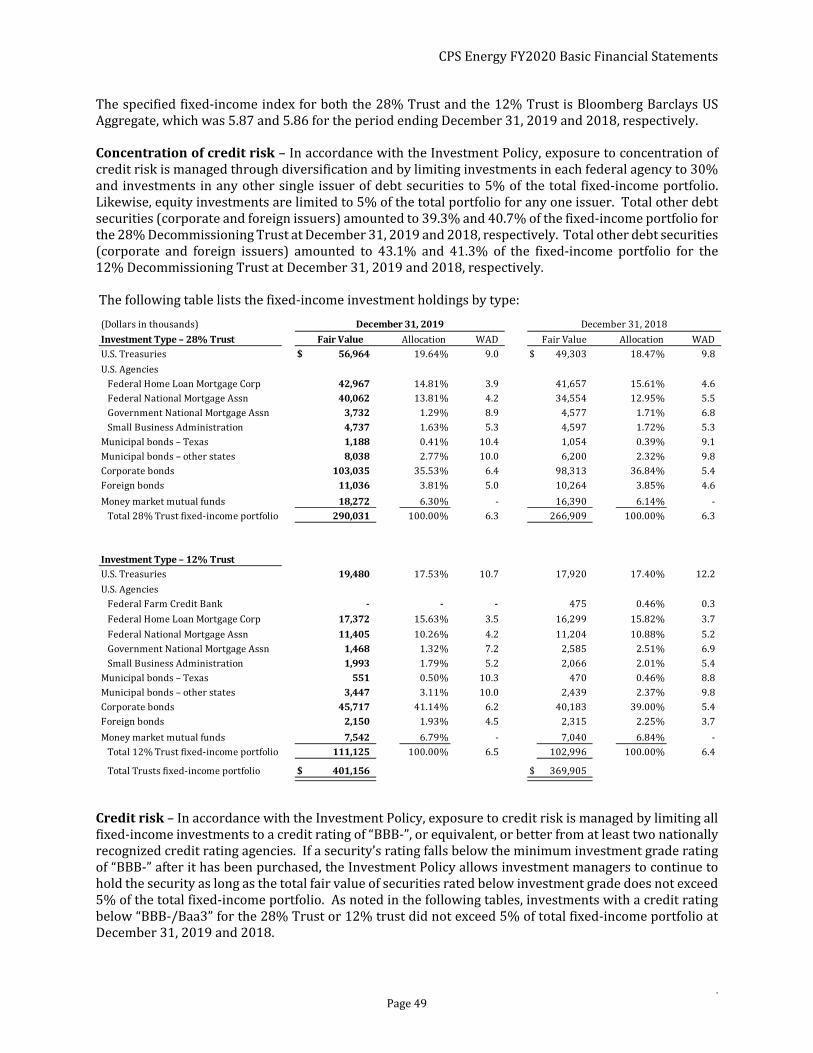
CPS Energy FY2020 Basic Financial Statements
. Page 49
The specified fixed-income index for both the 28% Trust and the 12% Trust is Bloomberg Barclays US Aggregate, which was 5.87 and 5.86 for the period ending December 31, 2019 and 2018, respectively.
Concentrationofcreditrisk –In accordance with the Investment Policy, exposure to concentration of credit risk is managed through diversification and by limiting investments in each federal agency to 30% and investments in any other single issuer of debt securities to 5% of the total fixed-income portfolio. Likewise, equity investments are limited to 5% of the total portfolio for any one issuer. Total other debt securities (corporate and foreign issuers) amounted to 39.3% and 40.7% of the fixed-income portfolio for the 28% Decommissioning Trust at December 31, 2019 and 2018, respectively. Total other debt securities (corporate and foreign issuers) amounted to 43.1% and 41.3% of the fixed-income portfolio for the 12% Decommissioning Trust at December 31, 2019 and 2018, respectively.
The following table lists the fixed-income investment holdings by type:
Creditrisk –In accordance with the Investment Policy, exposure to credit risk is managed by limiting all fixed-income investments to a credit rating of “BBB-”, or equivalent, or better from at least two nationally recognized credit rating agencies. If a security’s rating falls below the minimum investment grade rating of “BBB-” after it has been purchased, the Investment Policy allows investment managers to continue to hold the security as long as the total fair value of securities rated below investment grade does not exceed 5% of the total fixed-income portfolio. As noted in the following tables, investments with a credit rating below “BBB-/Baa3” for the 28% Trust or 12% trust did not exceed 5% of total fixed-income portfolio at December 31, 2019 and 2018.
InvestmentType–28%Trust Allocation WAD Allocation WADU.S. Treasuries $ 56,964 19.64% 9.0 $ 49,303 18.47% 9.8
U.S. AgenciesFederal Home Loan Mortgage Corp 42,967 14.81% 3.9 41,657 15.61% 4.6 Federal National Mortgage Assn 40,062 13.81% 4.2 34,554 12.95% 5.5 Government National Mortgage Assn 3,732 1.29% 8.9 4,577 1.71% 6.8 Small Business Administration 4,737 1.63% 5.3 4,597 1.72% 5.3
Municipal bonds – Texas 1,188 0.41% 10.4 1,054 0.39% 9.1 Municipal bonds – other states 8,038 2.77% 10.0 6,200 2.32% 9.8 Corporate bonds 103,035 35.53% 6.4 98,313 36.84% 5.4 Foreign bonds 11,036 3.81% 5.0 10,264 3.85% 4.6
Money market mutual funds 18,272 6.30% - 16,390 6.14% - Total 28% Trust fixed-income portfolio 290,031 100.00% 6.3 266,909 100.00% 6.3
InvestmentType–12%TrustU.S. Treasuries 19,480 17.53% 10.7 17,920 17.40% 12.2
U.S. AgenciesFederal Farm Credit Bank ‐ ‐ ‐ 475 0.46% 0.3
Federal Home Loan Mortgage Corp 17,372 15.63% 3.5 16,299 15.82% 3.7
Federal National Mortgage Assn 11,405 10.26% 4.2 11,204 10.88% 5.2 Government National Mortgage Assn 1,468 1.32% 7.2 2,585 2.51% 6.9 Small Business Administration 1,993 1.79% 5.2 2,066 2.01% 5.4
Municipal bonds – Texas 551 0.50% 10.3 470 0.46% 8.8 Municipal bonds – other states 3,447 3.11% 10.0 2,439 2.37% 9.8 Corporate bonds 45,717 41.14% 6.2 40,183 39.00% 5.4 Foreign bonds 2,150 1.93% 4.5 2,315 2.25% 3.7
Money market mutual funds 7,542 6.79% - 7,040 6.84% - Total 12% Trust fixed-income portfolio 111,125 100.00% 6.5 102,996 100.00% 6.4
Total Trusts fixed-income portfolio $ 401,156 $ 369,905
(Dollars in thousands) December31,2019 December 31, 2018
FairValue Fair Value

CPS Energy FY2020 Basic Financial Statements
Page 50
The following table lists the fixed-income investment holdings by credit rating:
Foreign currency risk – With the exception of dedicated foreign-equity portfolios, all investments authorized for purchase by the Decommissioning Trusts are in U.S. dollars. This reduces the potential foreign currency risk exposure of the portfolio. All foreign bonds outstanding were issued in the U.S. and amounted to $13.2 million at December 31, 2019, and $12.6 million December 31, 2018. In accordance with the Investment Policy, investments in international equity securities are limited to international commingled funds, American Depository Receipts and exchange-traded funds that are diversified across countries and industries. The international equity portfolio is limited to 20% of the total portfolio. Total foreign equity securities amounted to 13.5% and 12.6% of the 28% Trust’s total portfolio at December 31, 2019 and 2018, respectively. Total foreign equity securities held by the 12% Trust amounted to 12.2% and 11.4% of the Trust’s portfolio at December 31, 2019 and 2018, respectively.
CreditRating–28%TrustU.S. Treasuries (AA+) $ 56,964 19.64% $ 49,303 18.47%AAA / Aaa 25,749 8.88% 32,636 12.23%AA+ / Aa1 100,577 34.68% 88,153 33.03%AA/Aa2 2,855 1.00% 3,961 1.48%AA- / Aa3 1,862 0.64% 4,119 1.54%A+ / A1 5,712 1.97% 8,502 3.19%A/A2 10,608 3.66% 8,191 3.07%A-/A3 24,429 8.42% 21,803 8.17%BBB+/Baa1 30,060 10.36% 23,726 8.89%BBB / Baa2 16,368 5.64% 14,268 5.35%BBB-/Baa3 9,086 3.13% 8,170 3.06%BB+/Ba1 552 0.19% 1,310 0.49%BB/Ba2 529 0.18% 481 0.18%BB-/Ba3 ‐ ‐ 253 0.09%Not Rated¹ 4,680 1.61% 2,033 0.76%
Total 28% Trust fixed-income portfolio 290,031 100.00% 266,909 100.00%
CreditRating–12%TrustU.S. Treasuries (AA+) 19,480 17.53% 17,920 17.40%AAA /Aaa 11,969 10.78% 15,931 15.47%AA+/Aa1 37,452 33.70% 34,809 33.80%AA / Aa2 1,401 1.26% 1,093 1.06%AA-/Aa3 501 0.45% 1,586 1.54%A+/A1 2,770 2.49% 5,446 5.29%A/A2 4,719 4.25% 2,901 2.82%A-/A3 11,470 10.32% 9,263 8.99%BBB+/Baa1 11,571 10.41% 7,553 7.33%BBB/Baa2 4,957 4.46% 4,228 4.10%BBB-/Baa3 2,002 1.80% 1,599 1.55%BB/Ba2 29 0.03% 28 0.03%Not Rated¹ 2,804 2.52% 639 0.62%
Total 12% Trust fixed-income portfolio 111,125 100.00% 102,996 100.00%
Total Trusts fixed-income portfolio $ 401,156 $ 369,905
(Dollars in thousands) December 31, 2018
FairValue Allocation Fair Value Allocation
December31,2019
1 The NDT Investment Managers are given discretion to invest in unrated securities that are of suitable quality and in line with their investment strategy, as long as those do not exceed the 10% limit prescribed for the portfolio by the NDT Investment Policy.
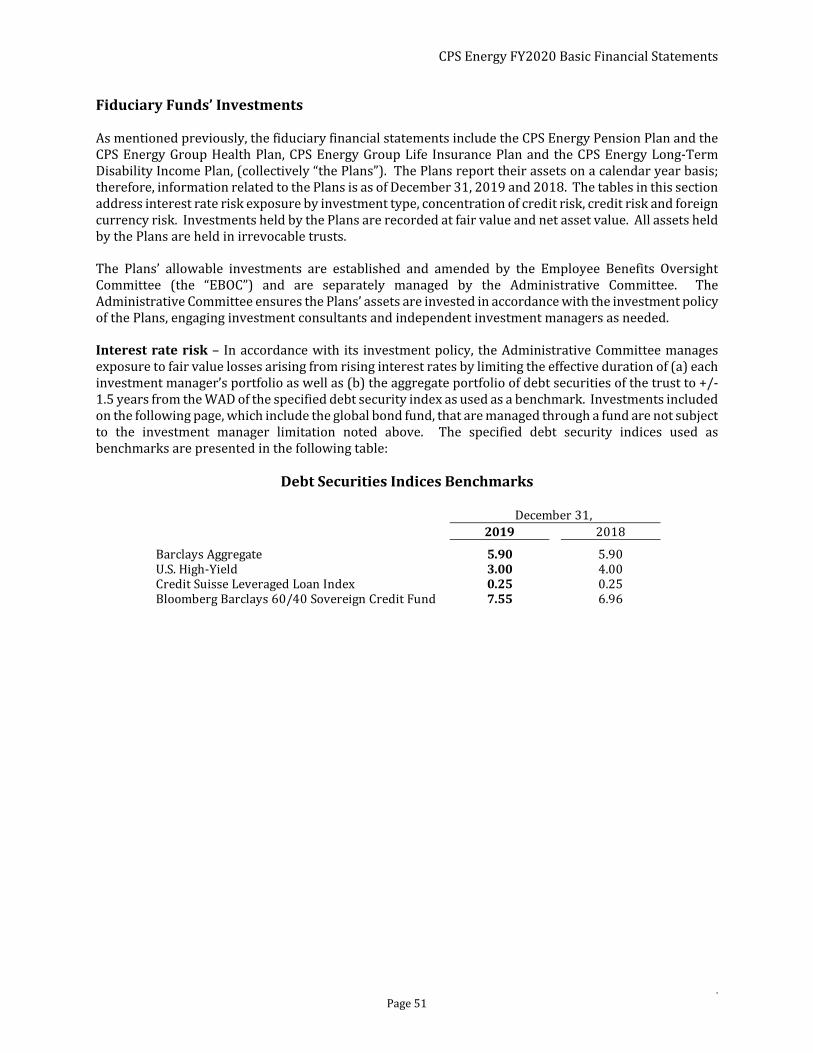
CPS Energy FY2020 Basic Financial Statements
. Page 51
FiduciaryFunds’Investments
As mentioned previously, the fiduciary financial statements include the CPS Energy Pension Plan and the CPS Energy Group Health Plan, CPS Energy Group Life Insurance Plan and the CPS Energy Long-Term Disability Income Plan, (collectively “the Plans”). The Plans report their assets on a calendar year basis; therefore, information related to the Plans is as of December 31, 2019 and 2018. The tables in this section address interest rate risk exposure by investment type, concentration of credit risk, credit risk and foreign currency risk. Investments held by the Plans are recorded at fair value and net asset value. All assets held by the Plans are held in irrevocable trusts.
The Plans’ allowable investments are established and amended by the Employee Benefits Oversight Committee (the “EBOC”) and are separately managed by the Administrative Committee. The Administrative Committee ensures the Plans’ assets are invested in accordance with the investment policy of the Plans, engaging investment consultants and independent investment managers as needed.
Interestraterisk – In accordance with its investment policy, the Administrative Committee manages exposure to fair value losses arising from rising interest rates by limiting the effective duration of (a) each investment manager’s portfolio as well as (b) the aggregate portfolio of debt securities of the trust to +/-1.5 years from the WAD of the specified debt security index as used as a benchmark. Investments included on the following page, which include the global bond fund, that are managed through a fund are not subject to the investment manager limitation noted above. The specified debt security indices used as benchmarks are presented in the following table:
DebtSecuritiesIndicesBenchmarks
2019 2018
Barclays Aggregate 5.90 5.90U.S. High-Yield 3.00 4.00Credit Suisse Leveraged Loan Index 0.25 0.25Bloomberg Barclays 60/40 Sovereign Credit Fund 7.55 6.96
December 31,

CPS Energy FY2020 Basic Financial Statements
Page 52
The following table presents the weighted-average effective duration of debt security asset classes:
(Dollars in thousands)
InvestmentType–PensionPlan FairValue WAD Fair Value WADU.S. Treasury and Agency:
Notes and bonds 34,174$ 9.23 41,919$ 7.65Collateralized mortgage obligations 23,514 3.24 26,226 3.93Mortgage pass-through securities 27,882 3.85 26,099 5.27Commercial mortgage-backed securities 7,324 4.70 6,651 4.73
Asset-backed securities 10,773 1.83 8,142 1.38Corporate bonds 46,227 6.95 31,062 6.88Municipal bonds 563 17.29 498 15.87
Total investment grade 150,457 5.88 140,597 5.87
Senior loan fund (floating rate) 69,991 0.44 64,746 0.65Global bond fund 67,073 4.57 60,848 4.99High-yield corporate bonds 129,609 2.69 112,530 3.88
Total Pension Plan investments in debt securities 417,130 378,721
InvestmentType–HealthPlanU.S. Treasury and Agency:
Notes and bonds 6,424 8.42 8,943 7.08Collateralized mortgage obligations 4,695 2.60 5,614 3.66Mortgage pass-through securities 7,365 3.82 7,259 5.76
Commercial mortgage-backed securities 301 3.10 637 2.05Asset-backed securities 12 0.36 465 1.29
Total investment grade 18,797 5.71 22,918 6.11
Corporate bonds 9,737 6.93 4,936 8.63Senior loan fund (floating rate) 12,383 0.44 11,455 0.65High-yield corporate bonds 10,751 2.34 10,975 3.83High-yield bond fund1 9,935 3.21 8,653 4.05Global bond fund 12,403 4.57 11,252 4.99
Total Health Plan investments in debt securities 74,006 70,189
InvestmentType–LifePlanU.S. Treasury and Agency:
Notes and bonds 1,566 8.42 1,981 7.31Collateralized mortgage obligations 1,098 2.67 1,212 3.58Mortgage pass-through securities 1,661 3.79 1,538 5.70
Commercial mortgage-backed securities 88 2.96 86 3.78Asset-backed securities 2 0.36 87 1.27
Total investment grade 4,415 5.69 4,904 6.15
Corporate bonds 2,192 6.80 1,177 7.97Senior loan fund (floating rate) 2,135 0.44 2,104 0.65Global bond fund 2,169 4.57 2,078 4.99High-yield corporate bonds 1,819 2.38 2,068 3.84High-yield bond fund1 1,877 3.21 1,634 4.05
Total Life Plan investments in debt securities 14,607 13,965
InvestmentType–DisabilityPlanU.S. Treasury and Agency:
Notes and bonds 112 9.39 222 7.27Collateralized mortgage obligations 88 2.61 138 3.56Mortgage pass-through securities 135 3.60 176 5.81
Commercial mortgage-backed securities 10 2.76 19 2.10Asset-backed securities ‐ 0.37 10 1.44Corporate bonds 193 6.84 125 8.13
Total investment grade 538 5.79 690 6.09
Senior loan fund (floating rate) 215 0.44 200 0.65Global bond fund 224 4.57 203 4.99High-yield bond fund1 408 3.21 356 4.05
Total Disability Plan investments in debt securities 1,385 1,449
Total investments in debt securities for the Plans 507,128$ 464,324$
1 The high-yield bond fund is a mutual fund and reports duration to worst in lieu of the weighted-average duration.
December31,2019 December 31, 2018
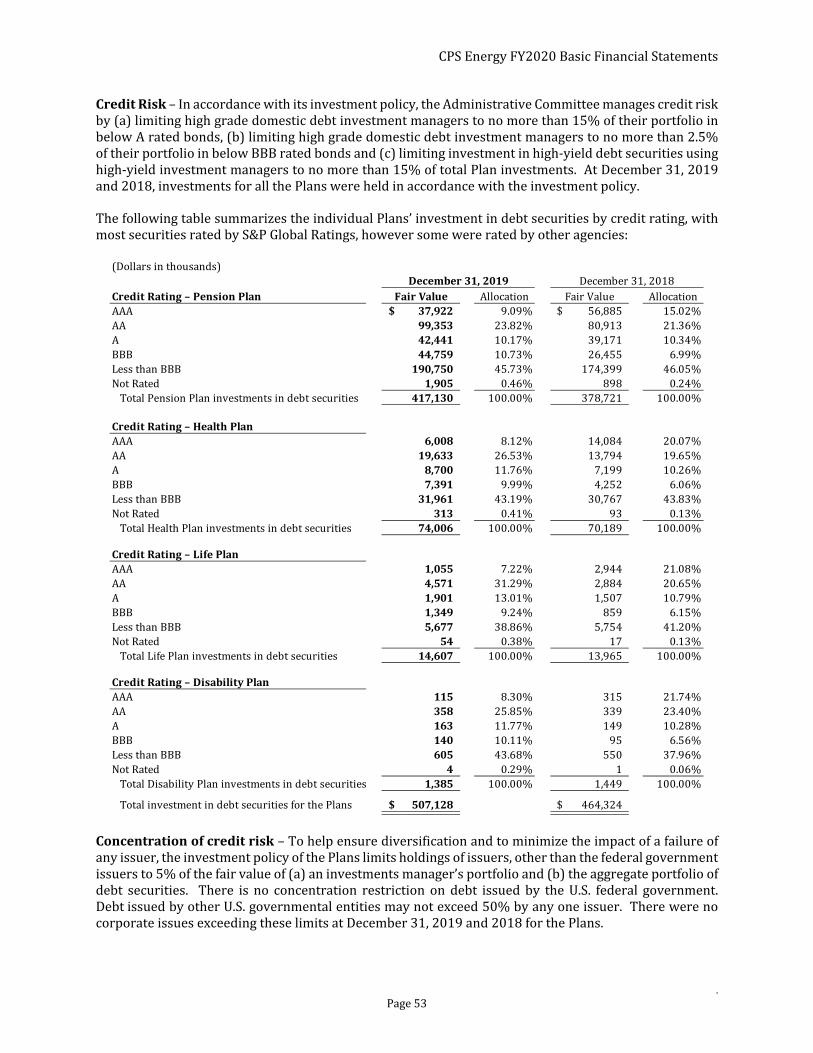
CPS Energy FY2020 Basic Financial Statements
. Page 53
CreditRisk – In accordance with its investment policy, the Administrative Committee manages credit risk by (a) limiting high grade domestic debt investment managers to no more than 15% of their portfolio in below A rated bonds, (b) limiting high grade domestic debt investment managers to no more than 2.5% of their portfolio in below BBB rated bonds and (c) limiting investment in high-yield debt securities using high-yield investment managers to no more than 15% of total Plan investments. At December 31, 2019 and 2018, investments for all the Plans were held in accordance with the investment policy.
The following table summarizes the individual Plans’ investment in debt securities by credit rating, with most securities rated by S&P Global Ratings, however some were rated by other agencies:
Concentrationofcreditrisk – To help ensure diversification and to minimize the impact of a failure of any issuer, the investment policy of the Plans limits holdings of issuers, other than the federal government issuers to 5% of the fair value of (a) an investments manager’s portfolio and (b) the aggregate portfolio of debt securities. There is no concentration restriction on debt issued by the U.S. federal government. Debt issued by other U.S. governmental entities may not exceed 50% by any one issuer. There were no corporate issues exceeding these limits at December 31, 2019 and 2018 for the Plans.
(Dollars in thousands)
CreditRating–PensionPlan FairValue Allocation Fair Value AllocationAAA 37,922$ 9.09% 56,885$ 15.02%AA 99,353 23.82% 80,913 21.36%A 42,441 10.17% 39,171 10.34%BBB 44,759 10.73% 26,455 6.99%Less than BBB 190,750 45.73% 174,399 46.05%Not Rated 1,905 0.46% 898 0.24%
Total Pension Plan investments in debt securities 417,130 100.00% 378,721 100.00%
CreditRating–HealthPlanAAA 6,008 8.12% 14,084 20.07%AA 19,633 26.53% 13,794 19.65%A 8,700 11.76% 7,199 10.26%BBB 7,391 9.99% 4,252 6.06%Less than BBB 31,961 43.19% 30,767 43.83%Not Rated 313 0.41% 93 0.13%
Total Health Plan investments in debt securities 74,006 100.00% 70,189 100.00%
CreditRating–LifePlanAAA 1,055 7.22% 2,944 21.08%AA 4,571 31.29% 2,884 20.65%A 1,901 13.01% 1,507 10.79%BBB 1,349 9.24% 859 6.15%Less than BBB 5,677 38.86% 5,754 41.20%Not Rated 54 0.38% 17 0.13%
Total Life Plan investments in debt securities 14,607 100.00% 13,965 100.00%
CreditRating–DisabilityPlanAAA 115 8.30% 315 21.74%AA 358 25.85% 339 23.40%A 163 11.77% 149 10.28%BBB 140 10.11% 95 6.56%Less than BBB 605 43.68% 550 37.96%Not Rated 4 0.29% 1 0.06%
Total Disability Plan investments in debt securities 1,385 100.00% 1,449 100.00%
Total investment in debt securities for the Plans 507,128$ 464,324$
December31,2019 December 31, 2018

CPS Energy FY2020 Basic Financial Statements
Page 54
The following table presents the fair value of investments by issuer, per individual Plan, representing 5% or more of any of the respective Plan’s debt security portfolio:
As of December 31, 2019, and 2018, the Plans did not have an investment in any one organization whose fair value equaled 5% or more of the individual plan’s net position restricted for the Plans.
Foreigncurrencyrisk – There were no nondollar foreign investments held directly as of December 31, 2019 and 2018. All nondollar denominated foreign investments are held through mutual funds or commingled funds with a similar mandate. These funds are not subject to investment policy constraints on nondollar denominated foreign investments.
Securities lending – Authority to engage in securities lending transactions is granted under the investment policies of the Plans. The Plans are authorized to loan up to 100% of the investments in securities lending transactions. The Plans’ securities lending programs are managed through JPMorgan Chase Bank, N.A. Worldwide Securities Services (“JPMorgan”) as lending agent.
In securities lending transactions, the Plans, through the lending agent, transfer securities to brokers/dealers in exchange for collateral and simultaneously agree to return the collateral for the same securities in the future. Both cash and noncash collateral is accepted. In 2017, the Disability Income Plan’s securities lending program was suspended indefinitely by the Administrative Committee due to minimal activity.
Cash collateral received from the borrower is invested as defined by the Plans in U.S government and agency securities, corporate debt securities rated A-1/P-1 or equivalent, or AAA-rated money market mutual funds. The maturities of these investments do not necessarily match the term of the loans; however, the weighted-average maturity of the portfolio will not exceed 120 days.
Noncash collateral may be accepted from a limited set of borrowers and includes both U.S and certain international equities and government and agency debt securities that meet JPMorgan’s credit criteria.
Lending income is earned if the returns on the cash collateral invested exceed the rebate paid to borrowers of the securities. The income is then shared with the lending agent to cover its fees based on a contractually negotiated rate split. However, if the investment of the cash collateral does not provide a return exceeding the rebate, part of the payment to the borrower would come from the Plans’ resources and the lending agent based on the rate split. The Plans are responsible for losses, if any, related to the investment of cash collateral. No losses were incurred in 2019 or 2018.
Loans that are collateralized with noncash securities generate income when the borrower pays a loan premium for the securities loaned. This income is split at the same ratio as the earnings for cash collateral. The collateral pledged to the Plans for the loaned securities is held by the lending agent. These securities are not available to the Plans for selling or pledging unless the borrower is in default of the loan.
Securities are marked-to-market daily, and additional cash or securities are required from the borrower if the market value of the collateral falls below 100%. Cash collateral is reported on the Statements of Fiduciary Net Positionas an asset, with a corresponding liability for the obligation to repay the cash collateral. Noncash collateral for the securities lending activities is not recorded as an asset because it remains under the control of the transferor, except in the event of default.
(Dollars in thousands)Policy Policy
Issuer–Plan FairValue Limit % Fair Value Limit %Federal National Mortgage Assn. – Pension 31,933$ 7.66% 50% 38,660$ 10.21% 50%Federal National Mortgage Assn. – Health 7,289 9.85% 50% 9,062 12.91% 50%Federal National Mortgage Assn. – Life 1,509 10.33% 50% 1,897 13.58% 50%Federal National Mortgage Assn. – Disability 114 8.20% 50% 212 14.61% 50%
% Debt Securities
% Debt Securities
December31,2019 December 31, 2018

CPS Energy FY2020 Basic Financial Statements
. Page 55
In the event of default, where the borrower is unable to return the securities loaned, the Plans have authorized the lending agent to seize the collateral held. The collateral would then be used to replace the borrowed securities where possible. Due to some market conditions, it is possible the original securities may not be able to be replaced. The lending agent has indemnified the Plans from any loss due to borrower default in the event the collateral is not sufficient to replace the securities.
The Plans had no credit risk exposure to borrowers because the amount the Plans owed to borrowers exceeded the amounts the borrowers owed at December 31, 2019 and 2018.
The Plans received cash and noncash collateral for securities lending activity, as shown in the following table. The cash collateral is presented as an unclassified custodial credit risk.
(Dollars in thousands)
LoanFair Collateral CollateralOutstandingLoans–PensionPlan Value Value %Cash loans 35,049$ 35,927$ 102.51%Noncash loans 14,734 15,424 104.68%
Total Pension Plan outstanding loans 49,783$ 51,351$ 103.15%
OutstandingLoans–HealthPlanCash loans 714$ 730$ 102.22%Noncash loans 3,455 3,553 102.82%
Total Health Plan outstanding loans 4,169$ 4,283$ 102.72%
OutstandingLoans–LifePlanCash loans 92$ 94$ 102.11%Noncash loans 897 918 102.40%
Total Life Plan outstanding loans 989$ 1,012$ 102.38%
Loan Fair Collateral CollateralOutstanding Loans – Pension Plan Value Value %Cash loans 57,765$ 59,156$ 102.41%Noncash loans 9,659 10,043 103.97%
Total Pension Plan outstanding loans 67,424$ 69,199$ 102.63%
Outstanding Loans – Health PlanCash loans 11,899$ 12,140$ 102.03%Noncash loans 20,875 21,452 102.76%
Total Health Plan outstanding loans 32,774$ 33,592$ 102.50%
Outstanding Loans – Life PlanCash loans 2,230$ 2,276$ 102.04%Noncash loans 2,940 3,014 102.53%
Total Life Plan outstanding loans 5,170$ 5,290$ 102.32%
December31,2019
December 31, 2018

CPS Energy FY2020 Basic Financial Statements
Page 56
The following table reflects the income and fees from securities lending activity per individual Plan:
3.FairValueMeasurement
CPS Energy records assets and liabilities in accordance with GASB Statement No. 72, Fair ValueMeasurementandApplication, which determines fair value, establishes a framework for measuring fair value and expands disclosures about fair value measurement.
Fair value is defined in GASB Statement No. 72 as the price that would be received to sell an asset or paid to transfer a liability in an orderly transaction between market participants at the measurement date (an exit price). Fair value is a market-based measurement for a particular asset or liability based on assumptions that market participants would use in pricing the asset or liability. Such assumptions include observable and unobservable inputs of market data, as well as assumptions about risk and the risk inherent in the inputs to the valuation technique.
As a basis for considering market participant assumptions in fair value measurements, GASB Statement No. 72 establishes a fair value hierarchy that prioritizes the inputs to valuation techniques used to measure fair value into three broad levels:
• Level 1 inputs are quoted prices (unadjusted) for identical assets or liabilities in active markets that a government can access at the measurement date. Equity securities and U.S. Government Treasury securities are examples of Level 1 inputs.
• Level 2 inputs are inputs other than quoted prices included within Level 1 that are observable for the asset or liability, either directly or indirectly. Government agency and mortgage-backed securities are examples of Level 2 inputs.
• Level 3 inputs are unobservable inputs that reflect CPS Energy’s own assumptions about factors that market participants would use in pricing the asset or liability (including assumptions about risk).
(In thousands)
Securities Securities LendingLending Rebates to Net Lending Net Income
Plan Income Borrowers Income Agent Fees to the PlanPension 1,438$ 1,172$ 266$ 80$ 186$Health 242 212 30 9 21Life 26 21 5 1 4
Total 1,706$ 1,405$ 301$ 90$ 211$
Securities Securities LendingLending Rebates to Net Lending Net Income
Plan Income Borrowers Income Agent Fees to the PlanPension 1,503$ 1,166$ 337$ 101$ 236$ Health 79 61 18 5 13 Life 9 5 4 1 3
Total 1,591$ 1,232$ 359$ 107$ 252$
December31,2019
December 31, 2018

CPS Energy FY2020 Basic Financial Statements
. Page 57
Valuation methods of the primary fair value measurements disclosed below are as follows:
• The majority of investments in equity securities are valued using Level 1 measurements. Investments in equity securities are typically valued at the closing price in the principal active market. For equity securities, these markets include published exchanges such as the National Association of Securities Dealers Automated Quotations and the New York Stock Exchange. Foreign equity prices are translated from their trading currency using the currency exchange rate in effect at the close of the principal active market.
• Most investments in debt securities are valued using Level 2 measurements because the valuations use interest rate curves and credit spreads applied to the terms of the debt instrument (maturity and coupon interest rate) and consider the counterparty credit rating.
• Commodity derivatives, such as futures, swaps and options, which are ultimately settled using prices at locations quoted through clearinghouses are valued using Level 1 inputs. Options included in this category are those with an identical strike price quoted through a clearinghouse.
• Other commodity derivatives, such as swaps settled using prices at locations other than those quoted through clearinghouses and options with strike prices not identically quoted through a clearinghouse, are valued using Level 2 inputs. For these instruments, fair value is based on internally developed pricing algorithms using observable market quotes for similar derivatives. Pricing inputs are derived from published exchange transactions and other observable data sources.
• The fair value of real estate held by the Employee Benefit Plans is evaluated annually according to the Plans’ policy and is a multi-step process beginning with obtaining a broker’s opinion of value. Additionally, independent appraisals and bids received on properties are also utilized to determine fair value.
Financial assets and liabilities are classified in their entirety based on the lowest level of input that is significant to the fair value measurement. The Company’s assessment of the significance of a particular input to the fair value measurement requires judgement and may affect the valuation of fair value assets and liabilities and their place within the fair value hierarchy levels.
CPS Energy’s fair value measurements are performed on a recurring basis. The table on the following page presents fair value balances and their levels within the fair value hierarchy for CPS Energy as of January 31, 2020 and 2019, and Decommissioning Trusts investment balances as of December 31, 2019 and 2018. The CPS Energy and Decommissioning Trusts investment balances presented exclude amounts related to money market mutual fund investments and short-term investments accounted for using amortized cost.
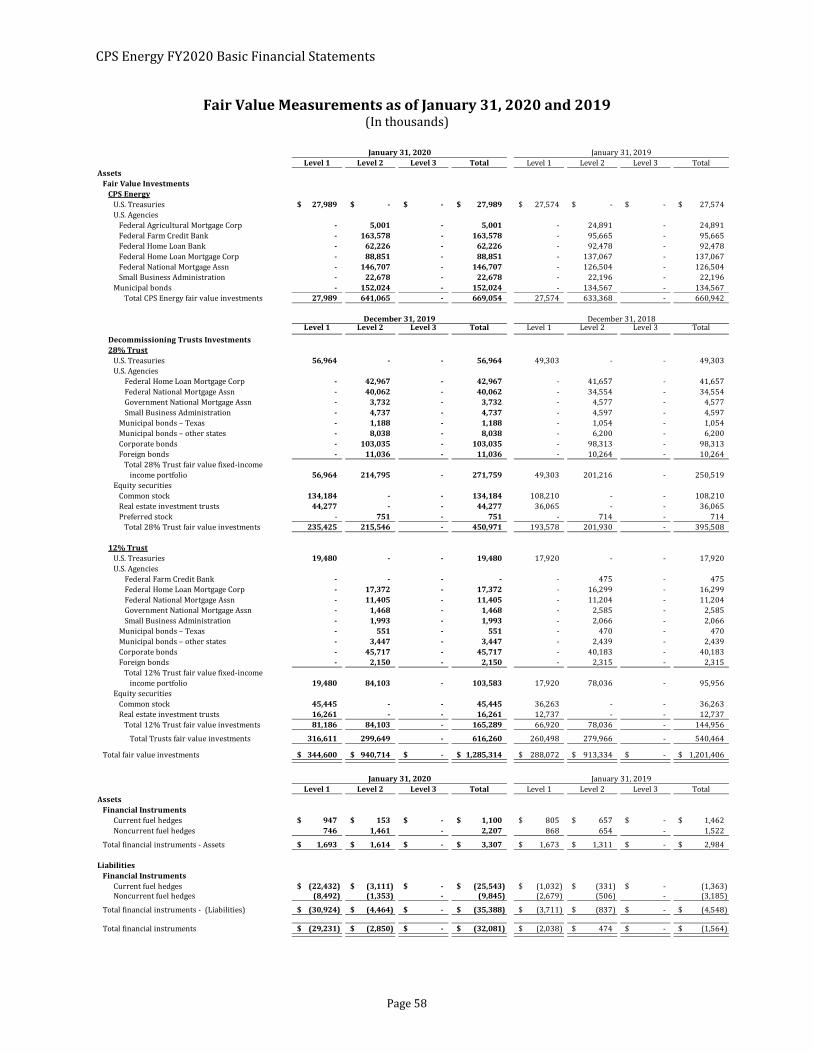
CPS Energy FY2020 Basic Financial Statements
Page 58
FairValueMeasurementsasofJanuary31,2020and2019(In thousands)
Level1 Level2 Level3 Total Level 1 Level 2 Level 3 TotalAssetsFairValueInvestmentsCPSEnergy
U.S. Treasuries 27,989$ ‐$ ‐$ 27,989$ 27,574$ -$ -$ 27,574$ U.S. Agencies
Federal Agricultural Mortgage Corp ‐ 5,001 ‐ 5,001 - 24,891 - 24,891 Federal Farm Credit Bank ‐ 163,578 ‐ 163,578 - 95,665 - 95,665 Federal Home Loan Bank ‐ 62,226 ‐ 62,226 - 92,478 - 92,478 Federal Home Loan Mortgage Corp ‐ 88,851 ‐ 88,851 - 137,067 - 137,067 Federal National Mortgage Assn ‐ 146,707 ‐ 146,707 - 126,504 - 126,504 Small Business Administration ‐ 22,678 ‐ 22,678 - 22,196 - 22,196
Municipal bonds ‐ 152,024 ‐ 152,024 - 134,567 - 134,567 Total CPS Energy fair value investments 27,989 641,065 ‐ 669,054 27,574 633,368 - 660,942
Level1 Level2 Level3 Total Level 1 Level 2 Level 3 Total
DecommissioningTrustsInvestments28%Trust
U.S. Treasuries 56,964 ‐ ‐ 56,964 49,303 - - 49,303 U.S. Agencies
Federal Home Loan Mortgage Corp ‐ 42,967 ‐ 42,967 - 41,657 - 41,657 Federal National Mortgage Assn ‐ 40,062 ‐ 40,062 - 34,554 - 34,554 Government National Mortgage Assn ‐ 3,732 ‐ 3,732 - 4,577 - 4,577 Small Business Administration ‐ 4,737 ‐ 4,737 - 4,597 - 4,597
Municipal bonds – Texas ‐ 1,188 ‐ 1,188 - 1,054 - 1,054 Municipal bonds – other states ‐ 8,038 ‐ 8,038 - 6,200 - 6,200 Corporate bonds ‐ 103,035 ‐ 103,035 - 98,313 - 98,313 Foreign bonds ‐ 11,036 ‐ 11,036 - 10,264 - 10,264
income portfolio 56,964 214,795 ‐ 271,759 49,303 201,216 - 250,519 Equity securities
Common stock 134,184 ‐ ‐ 134,184 108,210 - - 108,210 Real estate investment trusts 44,277 ‐ ‐ 44,277 36,065 - - 36,065 Preferred stock - 751 ‐ 751 - 714 - 714
Total 28% Trust fair value investments 235,425 215,546 ‐ 450,971 193,578 201,930 - 395,508
12%TrustU.S. Treasuries 19,480 ‐ ‐ 19,480 17,920 - - 17,920 U.S. Agencies
Federal Farm Credit Bank ‐ ‐ ‐ ‐ - 475 - 475 Federal Home Loan Mortgage Corp ‐ 17,372 ‐ 17,372 - 16,299 - 16,299 Federal National Mortgage Assn ‐ 11,405 ‐ 11,405 - 11,204 - 11,204 Government National Mortgage Assn ‐ 1,468 ‐ 1,468 - 2,585 - 2,585 Small Business Administration ‐ 1,993 ‐ 1,993 - 2,066 - 2,066
Municipal bonds – Texas ‐ 551 ‐ 551 - 470 - 470 Municipal bonds – other states ‐ 3,447 ‐ 3,447 - 2,439 - 2,439 Corporate bonds ‐ 45,717 ‐ 45,717 - 40,183 - 40,183 Foreign bonds ‐ 2,150 ‐ 2,150 - 2,315 - 2,315
income portfolio 19,480 84,103 ‐ 103,583 17,920 78,036 - 95,956 Equity securities
Common stock 45,445 ‐ ‐ 45,445 36,263 - - 36,263 Real estate investment trusts 16,261 ‐ ‐ 16,261 12,737 - - 12,737
Total 12% Trust fair value investments 81,186 84,103 ‐ 165,289 66,920 78,036 - 144,956
Total Trusts fair value investments 316,611 299,649 ‐ 616,260 260,498 279,966 - 540,464
Total fair value investments 344,600$ 940,714$ ‐$ 1,285,314$ 288,072$ 913,334$ -$ 1,201,406$
Level1 Level2 Level3 Total Level 1 Level 2 Level 3 TotalAssetsFinancialInstruments
Current fuel hedges 947$ 153$ ‐$ 1,100$ 805$ 657$ -$ 1,462$ Noncurrent fuel hedges 746 1,461 ‐ 2,207 868 654 - 1,522
Total financial instruments - Assets 1,693$ 1,614$ ‐$ 3,307$ 1,673$ 1,311$ -$ 2,984$
LiabilitiesFinancialInstruments
Current fuel hedges (22,432)$ (3,111)$ ‐$ (25,543)$ (1,032)$ (331)$ -$ (1,363) Noncurrent fuel hedges (8,492) (1,353) ‐ (9,845) (2,679) (506) - (3,185)
Total financial instruments - (Liabilities) (30,924)$ (4,464)$ ‐$ (35,388)$ (3,711)$ (837)$ -$ (4,548)$
Total financial instruments (29,231)$ (2,850)$ ‐$ (32,081)$ (2,038)$ 474$ -$ (1,564)$
Total 28% Trust fair value fixed-income
Total 12% Trust fair value fixed-income
January31,2020 January 31, 2019
January31,2020 January 31, 2019
December31,2019 December 31, 2018
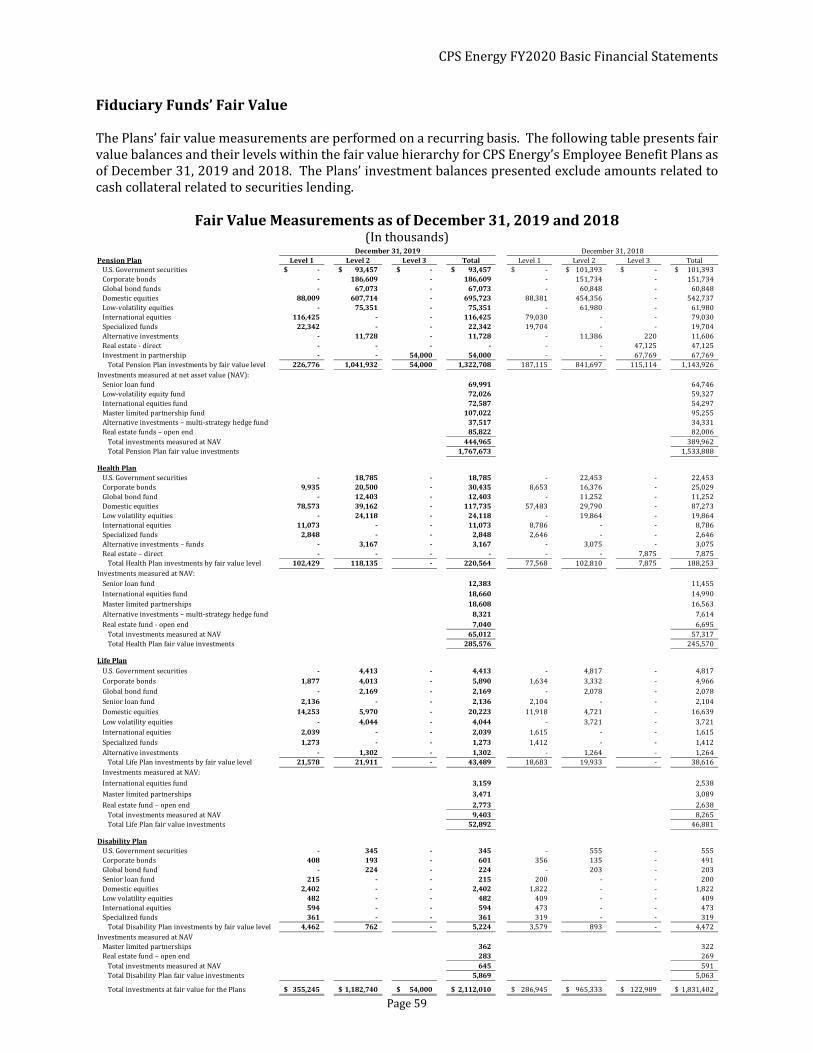
CPS Energy FY2020 Basic Financial Statements
. Page 59
FiduciaryFunds’FairValue
The Plans’ fair value measurements are performed on a recurring basis. The following table presents fair value balances and their levels within the fair value hierarchy for CPS Energy’s Employee Benefit Plans as of December 31, 2019 and 2018. The Plans’ investment balances presented exclude amounts related to cash collateral related to securities lending.
FairValueMeasurementsasofDecember31,2019and2018(In thousands)
PensionPlan Level1 Level2 Level3 Total Level 1 Level 2 Level 3 TotalU.S. Government securities ‐$ 93,457$ ‐$ 93,457$ -$ 101,393$ -$ 101,393$ Corporate bonds ‐ 186,609 ‐ 186,609 - 151,734 - 151,734 Global bond funds ‐ 67,073 ‐ 67,073 - 60,848 - 60,848 Domestic equities 88,009 607,714 ‐ 695,723 88,381 454,356 - 542,737 Low-volatility equities ‐ 75,351 ‐ 75,351 - 61,980 - 61,980 International equities 116,425 ‐ ‐ 116,425 79,030 - - 79,030 Specialized funds 22,342 ‐ ‐ 22,342 19,704 - - 19,704 Alternative investments ‐ 11,728 ‐ 11,728 - 11,386 220 11,606 Real estate - direct ‐ ‐ ‐ ‐ - - 47,125 47,125 Investment in partnership ‐ ‐ 54,000 54,000 - - 67,769 67,769
Total Pension Plan investments by fair value level 226,776 1,041,932 54,000 1,322,708 187,115 841,697 115,114 1,143,926 Investments measured at net asset value (NAV):
Senior loan fund 69,991 64,746 Low-volatility equity fund 72,026 59,327 International equities fund 72,587 54,297 Master limited partnership fund 107,022 95,255 Alternative investments – multi-strategy hedge fund 37,517 34,331 Real estate funds – open end 85,822 82,006
Total investments measured at NAV 444,965 389,962 Total Pension Plan fair value investments 1,767,673 1,533,888
HealthPlanU.S. Government securities ‐ 18,785 ‐ 18,785 - 22,453 - 22,453 Corporate bonds 9,935 20,500 ‐ 30,435 8,653 16,376 - 25,029 Global bond fund ‐ 12,403 ‐ 12,403 - 11,252 - 11,252 Domestic equities 78,573 39,162 ‐ 117,735 57,483 29,790 - 87,273 Low volatility equities ‐ 24,118 ‐ 24,118 - 19,864 - 19,864 International equities 11,073 ‐ ‐ 11,073 8,786 - - 8,786 Specialized funds 2,848 ‐ ‐ 2,848 2,646 - - 2,646 Alternative investments – funds ‐ 3,167 ‐ 3,167 - 3,075 - 3,075 Real estate – direct ‐ ‐ ‐ ‐ - - 7,875 7,875
Total Health Plan investments by fair value level 102,429 118,135 ‐ 220,564 77,568 102,810 7,875 188,253
Senior loan fund 12,383 11,455 International equities fund 18,660 14,990 Master limited partnerships 18,608 16,563 Alternative investments – multi-strategy hedge fund 8,321 7,614 Real estate fund - open end 7,040 6,695
Total investments measured at NAV 65,012 57,317 Total Health Plan fair value investments 285,576 245,570
LifePlanU.S. Government securities ‐ 4,413 ‐ 4,413 - 4,817 - 4,817 Corporate bonds 1,877 4,013 ‐ 5,890 1,634 3,332 - 4,966 Global bond fund ‐ 2,169 ‐ 2,169 - 2,078 - 2,078 Senior loan fund 2,136 ‐ ‐ 2,136 2,104 - - 2,104 Domestic equities 14,253 5,970 ‐ 20,223 11,918 4,721 - 16,639 Low volatility equities ‐ 4,044 ‐ 4,044 - 3,721 - 3,721 International equities 2,039 ‐ ‐ 2,039 1,615 - - 1,615 Specialized funds 1,273 ‐ ‐ 1,273 1,412 - - 1,412 Alternative investments ‐ 1,302 ‐ 1,302 - 1,264 - 1,264
Total Life Plan investments by fair value level 21,578 21,911 ‐ 43,489 18,683 19,933 - 38,616 Investments measured at NAV:
International equities fund 3,159 2,538
Master limited partnerships 3,471 3,089
Real estate fund – open end 2,773 2,638 Total investments measured at NAV 9,403 8,265 Total Life Plan fair value investments 52,892 46,881
DisabilityPlanU.S. Government securities ‐ 345 ‐ 345 - 555 - 555 Corporate bonds 408 193 ‐ 601 356 135 - 491 Global bond fund ‐ 224 ‐ 224 - 203 - 203 Senior loan fund 215 ‐ ‐ 215 200 - - 200 Domestic equities 2,402 ‐ ‐ 2,402 1,822 - - 1,822 Low volatility equities 482 ‐ ‐ 482 409 - - 409 International equities 594 ‐ ‐ 594 473 - - 473 Specialized funds 361 ‐ ‐ 361 319 - - 319
Total Disability Plan investments by fair value level 4,462 762 ‐ 5,224 3,579 893 - 4,472 Investments measured at NAV
Master limited partnerships 362 322 Real estate fund – open end 283 269
Total investments measured at NAV 645 591 Total Disability Plan fair value investments 5,869 5,063
Total investments at fair value for the Plans 355,245$ 1,182,740$ 54,000$ 2,112,010$ 286,945$ 965,333$ 122,989$ 1,831,402$
December 31, 2018
Investments measured at NAV:
December31,2019

CPS Energy FY2020 Basic Financial Statements
Page 60
The following table summarizes changes in the Plan’s Level 3 assets as of December 31, 2019 and 2018.
The following table shows quantitative information about unobservable inputs related to the Level 3 fair value measurements used to derive values at December 31, 2019 and 2018. Significant increases (decreases) in any of those inputs in isolation would result in significantly lower (higher) fair value measurements respectively.
(Dollars in thousands)
Type – Pension Plan Fair Value Valuation Technique Unobservable Inputs RateInvestment in partnership 54,000$ Income Approach –
Discounted Cash FlowDiscount Rate Terminal Capitalization Rate
9.75% 8.25%
Total Pension Plan 54,000
Total Plans 54,000$
Type – Pension Plan Fair Value Valuation Technique Unobservable Inputs RateReal estate direct 47,125$ Income Approach – Discount Rate 8.33%
Discounted Cash Flow Terminal Capitalization Rate 7.33%Investment in partnership 67,769 Income Approach – Discount Rate 8.00%
Discounted Cash Flow Terminal Capitalization Rate 7.25%Alternative investments 220
Total Pension Plan 115,114
Type – Health PlanReal estate direct 7,875 Income Approach – Discount Rate 8.50%
Discounted Cash Flow Terminal Capitalization Rate 7.50%Total Health Plan 7,875
Total Plans 122,989$
December31,2019
December 31, 2018
(In thousands)Health
Real Estate Direct
Investment in Partnership
Alternative Investments
Domestic Equities
Real Estate Total
Balance at December 31, 2017 42,325$ 71,101$ 4,285$ 72$ 7,875$ 125,658$ Net realized and unrealized gains/(losses) 4,800 (4,301) (2,059) (72) - (1,632) Dispositions/distribution - 969 (2,006) - - (1,037) Balance at December 31, 2018 47,125 67,769 220 - 7,875 122,989 Net realized and unrealized gains/(losses) (4,111) (13,157) (68) - (215) (17,551) Dispositions/distribution (43,014) (500) (152) - (7,660) (51,326) Investments / contributions - (112) - - - (112) BalanceatDecember31,2019 ‐$ 54,000$ ‐$ ‐$ ‐$ 54,000$
Level 3 AssetsPension

CPS Energy FY2020 Basic Financial Statements
. Page 61
Certain assets are valued at NAV of units held. The NAV is used as a practical expedient to estimate fair value. The following table reflects key valuation information on investments measured at the NAV:
InvestmentsMeasuredattheNetAssetValueatDecember31,2019(In thousands)
Type – Pension Plan Fair ValueUnfunded
CommitmentsRedemption Frequency
(if currently eligible)Redemption
Notice PeriodSenior loan fund 69,991$ -$ Monthly 20 daysLow-volatility equity fund 72,026 - Daily/Monthly 30 daysInternational equities fund 72,587 - Monthly 30 daysMaster limited partnerships 107,022 - Monthly 30 daysMulti-strategy hedge fund 37,517 - Quarterly 90 daysReal estate fund - open end 85,822 17,600 Quarterly 30–60 days
Total Pension Plan 444,965 17,600
Type – Health PlanSenior loan fund 12,383 - Monthly 20 daysInternational equities fund 18,660 - Monthly 30 daysMaster limited partnerships 18,608 - Monthly 30 daysMulti-strategy hedge fund 8,321 - Quarterly 90 daysReal estate fund - open end 7,040 4,400 Quarterly 45 days
Total Health Plan 65,012 4,400
Type – Life PlanInternational equities fund 3,159 - Monthly 30 daysMaster limited partnerships 3,471 - Monthly 30 daysReal estate fund – open end 2,773 - Quarterly 45 days
Total Life Plan 9,403 -
Type – Disability PlanMaster limited partnerships 362 - Monthly 30 daysReal estate fund – open end 283 - Quarterly 45 days
Total Disability Plan 645 -
Total Plans 520,025$ 22,000$

CPS Energy FY2020 Basic Financial Statements
Page 62
InvestmentsMeasuredattheNetAssetValueatDecember31,2018(In thousands)
4.DisaggregationofCurrentAccountsReceivableandAccountsPayable
AccountsReceivable–Net customer accounts receivable as of January 31, 2020, included $21.4 million for unbilled revenue receivable and $177.0 million for billed utility services. Interest and other accounts receivable included $13.4 million for regulatory-related accounts receivable, $0.2 million for interest receivable and $44.8 million for other miscellaneous accounts receivable.
Net customer accounts receivable as of January 31, 2019, included $20.1 million for unbilled revenue receivable and $182.5 million for billed utility services. Interest and other accounts receivable included $17.9 million for regulatory-related accounts receivable, $0.7 million for interest receivable and $34.7 million for other miscellaneous accounts receivable.
AccountsPayable–At January 31, 2020, accounts payable and accrued liabilities included $273.5 million related to standard operating supplier and vendor accounts payable, including fuels payable; $47.1 million for employee-related accounts payable; $57.9 million for customer-related accounts payable; $57.0 million for STP-related accounts payable; and $74.7 million for other miscellaneous accounts payable and accrued liabilities.
At January 31, 2019, accounts payable and accrued liabilities included $251.8 million related to standard operating supplier and vendor accounts payable, including fuels payable; $51.5 million for
Type – Pension Plan Fair ValueUnfunded
CommitmentsRedemption Frequency
(if currently eligible)Redemption
Notice PeriodSenior loan fund 64,746$ -$ Monthly 20 daysLow-volatility equity fund 59,327 - Daily/Monthly 30 daysInternational equities fund 54,297 - Monthly 30 daysMaster limited partnerships 95,255 - Monthly 30 daysMulti-strategy hedge fund 34,331 - Quarterly 90 daysReal estate fund - open end 82,006 - Quarterly 30–60 days
Total Pension Plan 389,962 -
Type – Health PlanSenior loan fund 11,455 - Monthly 20 daysInternational equities fund 14,990 - Monthly 30 daysMaster limited partnerships 16,563 - Monthly 30 daysMulti-strategy hedge fund 7,614 - Quarterly 90 daysReal estate fund - open end 6,695 - Quarterly 45 days
Total Health Plan 57,317 -
Type – Life PlanInternational equities fund 2,538 - Monthly 30 daysMaster limited partnerships 3,089 - Monthly 30 daysReal estate fund – open end 2,638 - Quarterly 45 days
Total Life Plan 8,265 -
Type – Disability PlanMaster limited partnerships 322 - Monthly 30 daysReal estate fund – open end 269 - Quarterly 45 days
Total Disability Plan 591 -
Total Plans 456,135$ -$

CPS Energy FY2020 Basic Financial Statements
. Page 63
employee-related accounts payable; $53.0 million for customer-related accounts payable; $34.7 million for STP-related accounts payable; and $51.1 million for other miscellaneous accounts payable and accrued liabilities.
5.CapitalAssets,Net
GeneralDescription – CPS Energy’s plant-in-service includes four power stations that are solely owned and operated by the Company. In total, there are 17 generating units at these four power stations, two of which are coal-fired and 15 of which are gas-fired. Excluding STP (nuclear units), the following is a list of power stations and their respective generating units as of January 31, 2020:
Other notable capital assets in electric and gas plant include supporting coal yard assets, a fleet of railcars, a transmission network for the movement of electric power from the generating stations to substations, electric and gas distribution systems, and metering. Included in general plant are two data centers; the main office complex; the construction and customer service centers; the Villita Assembly Building; and a fleet of automobiles, trucks and work equipment.
Intangible assets consist of easements, software, a tax exemption settlement and other intangible items.
In conjunction with the Rio Nogales plant purchase, CPS Energy entered into a Tax Exemption Settlement Agreement in which CPS Energy agreed to pay $25.5 million to certain parties to compromise, terminate claims and settle any disputes relating to exemption of ad valorem taxes involving the parties to this agreement. The payment was recorded as an intangible asset that is being amortized over the life of the agreement, which runs through December 2041.
In July 2019, CPS Energy executed a Bill of Sale with the Department of Defense (“DOD”) for $87.1 million for the electric and gas systems at three JBSA installations: JBSA Randolph, JBSA Lackland and JBSA Lackland Training Annex. In addition to the fixed assets acquired, deferred inflows for the unrealized future recoveries associated with the JBSA agreement were recorded at the time of the purchase which are being amortized over the 50-year Utilities Privatization Contract that covers the JBSA systems.
As part of normal operations, CPS Energy evaluates whether surplus property exists within the capital asset portfolio and whether such property should be sold. On January 13, 2020, CPS Energy completed a transaction to sell excess office property for a sales price of $14.5 million. Of the sales price, CPS Energy received cash proceeds of $14.0 million, net of $0.5 million in closing costs.
Impairments –There were no capital asset impairments identified for FY2020.
In FY2012, CPS Energy announced plans to mothball its J.T. Deely Units 1 and 2 coal-fired power plants in FY2019 instead of the originally projected dates of FY2032 and FY2033, respectively. Therefore, depreciation for these two units was accelerated beginning in FY2013. At the time of the original announcement, to continue operating the units past the announced mothball dates, the Company would have needed to install $565 million in flue gas desulfurization equipment (commonly referred to as scrubbers) to cut SO2 emissions in order to be compliant with more stringent environmental regulations that were expected to take effect in the future. In FY2019, a financial and operational efficiency analysis concluded it was not cost-effective to maintain the units even in a mothball status. Based on the analysis,
GeneratingUnits Type
GeneratingUnits Type
Calaveras 4 Coal (2)/Gas (2) Leon Creek 4 GasBraunig 8 Gas Rio Nogales 1 Gas
Power Station Power Station

CPS Energy FY2020 Basic Financial Statements
Page 64
2020 2019STP capital assets, net
Land 5,701$ 5,701$ Construction-in-progress 37,112 32,369 Electric and general plant 828,768 847,399 Intangibles 9,879 9,879 Nuclear fuel 136,573 107,240
Total STP capital assets, net 1,018,033$ 1,002,588$
Total CPS Energy capital assets, net 8,500,046$ 8,154,670$
STP capital investment as a percentage of total CPS Energy capital assets, net 12.0% 12.3%
January 31,
CPS Energy decided to early retire the units at the end of FY2019 as an impairment due to changes in the duration of use of the units. CPS Energy recorded the impairment loss of $182.7 million as a special item on the Statements of Revenues, Expenses and Changes in Net Position for the year ended January 31, 2019.
During FY2019, an impairment loss of $2.2 million was recorded related to the Customer Relationship Management (“CRM”) Project due to permanent stoppage of the second phase of the software development activities. In FY2018, part of the project was identified as impaired and a loss of $2.5 million was written off. The CRM Project would have enabled scalability within the call center with advancements to the Salesforce software currently being utilized by CPS Energy.
InvestmentinSTPUnits1and2 – STP is currently a two-unit nuclear power plant located in Matagorda County, Texas. It is maintained and operated by STPNOC, a nonprofit Texas corporation special-purpose entity, which is financed and controlled by the owners. CPS Energy’s 40% interest in STP Units 1 and 2 is included in plant assets. See Note 13 – South Texas Project.
STPCapitalInvestment(Dollars In thousands)

CPS Energy FY2020 Basic Financial Statements
. Page 65
CapitalAssetRollforward – The following tables provide more detailed information on the activity of CPS Energy’s net capital assets as presented on the Statements of Net Position, including capital asset activity for FY2020 and FY2019:
FY2020CapitalAssetRollforward(In thousands)
February 1, Additions/ Transfers Reductions/ January31,2019 Increases In/(Out) Decreases 2020
Nondepreciable assetsLand 104,991$ 1,536$ 3,278$ (5,288)$ 104,517$Land easements 107,531 - (11) - 107,520Construction-in-progress 580,984 575,455 (454,849) 464 702,054
Total nondepreciable assets 793,506 576,991 (451,582) (4,824) 914,091
Depreciable/amortizable assetsElectric plant 11,077,814 139,682 339,107 (30,527) 11,526,076Gas plant 1,021,214 11,728 54,342 (57) 1,087,227General plant 726,142 7,867 24,602 (52,054) 706,557Intangibles Software 259,520 - 33,531 (11,529) 281,522 Other 38,572 - - - 38,572Nuclear fuel 1,001,284 76,575 - - 1,077,859Total depreciable/
14,124,546 235,852 451,582 (94,167) 14,717,813
Accumulated depreciationand amortization
Electric plant (5,132,300) (320,576) - 44,701 (5,408,175)Gas plant (395,345) (23,443) - 1,781 (417,007)General plant (261,741) (49,690) - 41,757 (269,674)Intangibles Software (72,583) (26,271) - 11,528 (87,326) Other (7,370) (1,020) - - (8,390)Nuclear fuel (894,043) (47,243) - - (941,286)
Total accumulated depreciationand amortization (6,763,382) (468,243) - 99,767 (7,131,858)
Capital assets, net 8,154,670$ 344,600$ -$ 776$ 8,500,046$
amortizable assets
Cash flow information – Cash paid for additions and net removal costs totaled $630.3 million. This amount includes$736.3 million in additions to construction-in-progress and electric, gas and general plant, net JBSA gas and electric systemsacquisition of $87.1 million, plus net salvage and removal costs of $5.5 million, partially offset by $14.9 million in AFUDC and$4.0 million in donated assets. Net cash proceeds received from the sale of capital assets totaled $14.0 million.
Other – Depreciation and amortization expense for the period totaled $421.0 million, while amortization of nuclear fuel of$47.2 million was included in fuel expense on the Statements of Revenues, Expenses and Changes in Net Position.
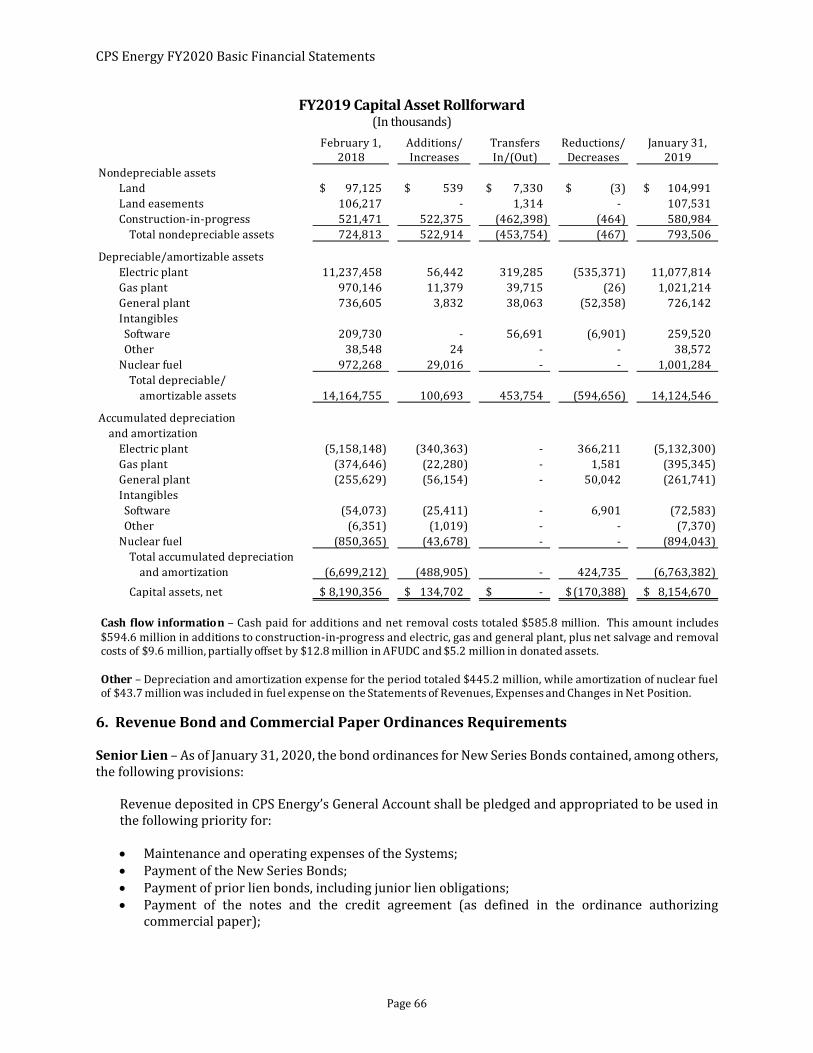
CPS Energy FY2020 Basic Financial Statements
Page 66
FY2019CapitalAssetRollforward(In thousands)
6.RevenueBondandCommercialPaperOrdinancesRequirements
SeniorLien – As of January 31, 2020, the bond ordinances for New Series Bonds contained, among others, the following provisions:
Revenue deposited in CPS Energy’s General Account shall be pledged and appropriated to be used in the following priority for:
Maintenance and operating expenses of the Systems; Payment of the New Series Bonds; Payment of prior lien bonds, including junior lien obligations; Payment of the notes and the credit agreement (as defined in the ordinance authorizing
commercial paper);
February 1, Additions/ Transfers Reductions/ January 31,2018 Increases In/(Out) Decreases 2019
Nondepreciable assetsLand 97,125$ 539$ 7,330$ (3)$ 104,991$ Land easements 106,217 - 1,314 - 107,531 Construction-in-progress 521,471 522,375 (462,398) (464) 580,984
Total nondepreciable assets 724,813 522,914 (453,754) (467) 793,506
Depreciable/amortizable assetsElectric plant 11,237,458 56,442 319,285 (535,371) 11,077,814 Gas plant 970,146 11,379 39,715 (26) 1,021,214 General plant 736,605 3,832 38,063 (52,358) 726,142 Intangibles Software 209,730 - 56,691 (6,901) 259,520 Other 38,548 24 - - 38,572 Nuclear fuel 972,268 29,016 - - 1,001,284
14,164,755 100,693 453,754 (594,656) 14,124,546
Accumulated depreciationand amortization
Electric plant (5,158,148) (340,363) - 366,211 (5,132,300) Gas plant (374,646) (22,280) - 1,581 (395,345) General plant (255,629) (56,154) - 50,042 (261,741) Intangibles Software (54,073) (25,411) - 6,901 (72,583) Other (6,351) (1,019) - - (7,370) Nuclear fuel (850,365) (43,678) - - (894,043)
Total accumulated depreciationand amortization (6,699,212) (488,905) - 424,735 (6,763,382)
Capital assets, net 8,190,356$ 134,702$ -$ (170,388)$ 8,154,670$
amortizable assetsTotal depreciable/
Cash flow information – Cash paid for additions and net removal costs totaled $585.8 million. This amount includes$594.6 million in additions to construction-in-progress and electric, gas and general plant, plus net salvage and removalcosts of $9.6 million, partially offset by $12.8 million in AFUDC and $5.2 million in donated assets.
Other – Depreciation and amortization expense for the period totaled $445.2 million, while amortization of nuclear fuelof $43.7 million was included in fuel expense on the Statements of Revenues, Expenses and Changes in Net Position.
CPS Energy FY2020 Basic Financial Statements
. Page 67
Payment of any inferior lien obligations issued, which are inferior in lien to the New Series Bonds, the prior lien bonds and the notes and credit agreement;
An annual amount equal to 6% of the gross revenues of the Systems to be deposited in the Repair and Replacement Account;
Cash payments and benefits to the General Fund of the City not to exceed 14% of the gross revenues of the Systems; and
Any remaining net revenues of the Systems in the General Account to the Repair and Replacement Account, which is used to partially fund construction costs.
The maximum amount in cash to be transferred or credited to the City’s General Fund from the net revenues of the Systems during any fiscal year shall not exceed 14% of the gross revenues of the Systems, less the value of gas and electric services of the Systems used by the City for municipal purposes and the amounts expended during the fiscal year for additions to the street lighting system and other authorized exclusions. The percentage of gross revenues of the Systems to be paid over, or credited to, the City’s General Fund each fiscal year shall be determined (within the 14% limitation) by the governing body of the City.
The net revenues of the Systems are pledged to the payment of principal and interest on the New Series Bonds, which are classified as senior lien obligations. All New Series Bonds and the interest thereon shall have a first lien upon the net revenues of the Systems.
Junior Lien – The Series Bonds are composed of two categories of debt: fixed-interest-rate and variable-interest-rate. The junior lien fixed-interest-rate Series Bonds are similar to the senior lien New Series Bonds, as they have fixed and set interest rates for the life of the bonds. The junior lien Variable-Rate Note bonds are variable-interest-rate debt instruments of the City. The junior lien obligations are payable solely from, and equally and ratably secured by, a junior lien on and pledge of the net revenues of the Systems, subject and subordinate to liens and pledges securing the outstanding senior lien obligations and any additional senior lien obligations hereafter issued, and superior to the pledge and lien securing the currently outstanding commercial paper obligations, all as fully set forth in the ordinances authorizing the issuance of the junior lien obligations as noted below:
The City agrees that it will maintain rates and charges for the sale of electric energy, gas or other services furnished, provided and supplied by the Systems to the City and all other consumers, which shall be reasonable and nondiscriminatory, and which will produce income and revenues sufficient to pay:
All operation and maintenance expenses, depreciation, replacement and betterment expenses, and other costs as may be required by Chapter 1502 of the Texas Government Code, as amended;
The interest on, and principal of, all senior lien bonds, as defined in the New Series Bond ordinances, as and when the same shall become due, and for the establishment and maintenance of the funds and accounts created for the payment and security of the senior lien bonds;
The interest on, and principal of, the prior lien bonds, including the junior lien obligations and any additional junior lien obligations hereafter issued (all as defined in the New Series Bond ordinances), as and when the same shall become due, and for the establishment and maintenance of the funds and accounts created for the payment and security of the junior lien obligations and any additional junior lien obligations;
To the extent the same are reasonably anticipated to be paid with available revenues (as defined in the ordinance authorizing the commercial paper), the interest on and principal of all notes (as defined in said ordinance), and the credit agreement (as defined in said ordinance); and
Any inferior lien obligations or any other legal debt or obligation of the Systems as and when the same shall become due.

CPS Energy FY2020 Basic Financial Statements
Page 68
CommercialPaper– As of January 31, 2020, the commercial paper ordinances contain, among others, the following provisions: authorized capacity of $700 million, ability to issue tax-exempt or taxable commercial paper, ability to issue multiple series notes and final maturity on April 11, 2049.
To secure the payment of commercial paper principal and interest, a pledge is made of: Proceeds from
− The sale of bonds and additional notes issued for such purposes, and − The sale of Project Notes;
Loans under and pursuant to a revolving credit agreement; Amounts held in funds used specifically for payment of commercial paper principal and interest
balances and unspent proceeds from commercial paper; and The net revenues of the Systems, after payment on New Series Bond requirements and prior lien
bond obligations.
CPS Energy’s outstanding debt agreements specify certain events of default or breach of a financial covenant or failure to make debt service. Such an event would trigger a covenant requiring the City to charge rates sufficient to make debt service payments and satisfy debt service coverage. During the years ended January 31, 2020 and 2019, CPS Energy did not default on any terms of its debt agreements.
7.RevenueBonds
On November 15, 2018, CPS Energy issued $218.3 million of New Series 2018 Senior Lien Revenue Refunding Bonds. Bond proceeds, including the $25.3 million premium associated with the bonds, were used to refund $99.1 million par value of the New Series 2009D Revenue Refunding Bonds and convert the outstanding $142.3 million Series 2012A, Series 2012B and Series 2012C Variable-Rate Junior Lien Revenue Refunding Bonds from variable-interest-rate debt to fixed-interest-rate debt. The refunding transaction resulted in net present value debt service savings of $3.6 million, or 3.6%, of the par amount of the bonds being refunded. The true interest cost for this issue, which has maturities in FY2020, FY2021, FY2027 and FY2028, is 2.75%.
On December 20, 2018, CPS Energy issued $130.2 million of New Series 2018A Senior Lien Revenue Refunding Bonds. Proceeds, including the $20.9 million premium associated with the bonds, were used to refund $60.0 million and $90.0 million of the Commercial Paper Notes Series A and Series C, respectively. The true interest cost for this issue, which has maturities in FY2026 through FY2048, is 3.65%.
On December 20, 2018, CPS Energy issued $134.9 million of Series 2018 Variable-Rate Junior Lien Revenue Refunding Bonds. Proceeds, including the $1.2 million premium associated with the bonds, were used to refund $135.0 million of the Commercial Paper Series C. Reflecting stepped interest rate provisions applicable to the bonds, the true interest cost for this issue, which has maturities in FY2043 through FY2048, is 6.53%. The bonds were issued as multi-modal variable-rate instruments with initial term rates of 2.75% and a stepped rate of 8.0%, which is only applicable if the bonds are not remarketed before their expiration date.
On January 24, 2019, $52.5 million of New Series 2015 Senior Lien Revenue Refunding Bonds and $25.1 million of New Series 2016 Senior Lien Revenue Refunding Bonds were legally defeased with cash. Under the defeasance, the debt obligations were technically voided, as the cash was escrowed with a third party to service the debt. As a result, $3.1 million was recorded as cost of defeasance representing the additional cash put into escrow for the interest that would have been incurred between FY2020 through FY2022.

CPS Energy FY2020 Basic Financial Statements
. Page 69
On September 25, 2019, CPS Energy issued $114.7 million of New Series 2019 Senior Lien Revenue Refunding Bonds. Bond proceeds, including the $22.8 million premium associated with the bonds, were used to refund $116.8 million par value of the New Series 2012 Revenue Bonds. The refunding transaction resulted in net present value debt service savings of $3.1 million, or 2.7%, of the par amount of the bonds being refunded. The true interest cost for this issue, which has maturities in FY2026 through FY2030, is 1.5%.
On November 21, 2019, CPS Energy issued $252.6 million of Series 2019 Junior Lien Revenue Refunding Bonds. Bond proceeds, including $52.8 million premium associated with the bonds, were used to partially refund $100.0 million par value of the 2010A Senior Lien Revenue Bonds (BABs) and $200.0 million of the 2010B Junior Lien Revenue Bonds (BABs). The refunding transaction resulted in a net present value debt service savings of $50.1 million, or 16.7%, of the par amount of the bonds being refunded. The true interest cost for this issuance, which has maturities in FY2033 through FY2041, is 2.9%.
On December 2, 2019, CPS Energy remarketed $124.2 million of Series 2015A Variable-Rate Junior Lien Revenue Refunding Bonds. The issuance of $0.9 million premium, in conjunction with the remarketing, resulted in a principal paydown for the remarketed bonds of approximately $0.4 million. The bonds have maturities in FY2029 through FY2033. The coupon rate for these bonds is 1.75%, with a current yield of 1.6% and true interest cost of 4.3%, which reflects stepped interest rate provisions applicable to the bonds.
On December 2, 2019, CPS Energy remarketed $99.7 million of Series 2015C Variable-Rate Junior Lien Revenue Refunding Bonds. The issuance of $0.7 million premium, in conjunction with the remarketing, resulted in a principal paydown for the remarketed bonds of approximately $0.3 million. The bonds have maturities in FY2039 through FY2046. The coupon rate for these bonds is 1.75%, with a current yield of 1.6% and true interest cost of 5.2%, which reflects stepped interest rate provisions applicable to the bonds.
On January 28, 2020, CPS Energy issued $134.6 million of New Series 2020 Senior Lien Revenue Refunding Bonds. Proceeds, including the $36.4 million premium associated with the bonds, were used to refund $170.0 million par value of the Commercial Paper Series A. The true interest cost for this issue, which has maturities in FY2026 through FY2049, is 3.1%.
On January 28, 2020, CPS Energy issued $127.8 million of Series 2020 Variable-Rate Junior Lien Revenue Refunding Bonds. Proceeds, including the $3.1 million premium associated with the bonds, were used to refund $50.0 million and $80.0 million par value of the Commercial Paper Series A and Commercial Paper Series C, respectively. Reflecting stepped interest rate provisions applicable to the bonds, the true interest cost for this issue, which has maturities in FY2042 through FY2049, is 5.0%. The bonds were issued as multi-modal variable-rate instruments with initial term rates of 1.75% and a stepped rate of 7.0%, which is only applicable if the bonds are not remarketed before their expiration date.
On January 28, 2020, $108.0 million of New Series 2016 Senior Lien Revenue Refunding Bonds were legally defeased with cash. Under the defeasance, the debt obligations were technically voided, as the cash was escrowed with a third party to service the debt. As a result, $12.5 million was recorded as cost of defeasance representing the additional cash put into escrow for the interest that would have been incurred in FY2022 through FY2025.

CPS Energy FY2020 Basic Financial Statements
Page 70
RevenueBondSummary(Dollars in thousands)
BuildAmericaBondsDirectSubsidy – The ARRA of 2009 provided authority for the issuance of BABs, which were issuable in calendar years 2009 and 2010 as taxable bonds. The ARRA permitted the issuer or the issuer’s paying agent to receive a subsidy payment equal to 35% of the bond’s interest directly from the U.S. Department of the Treasury.
Pursuant to the requirements of the Balanced Budget and Emergency Deficit Control Act of 1985, as amended, the federal government has reduced the BABs subsidy through sequestration reduction. For the year ended January 31, 2020, after a sequestration reduction totaling $1.5 million, the total subsidy received for the 2009C and 2010A Senior Lien BABs and the 2010A and 2010B Junior Lien BABs was $23.3 million. For the year ended January 31, 2019, the total subsidy received for the 2009C and 2010A Senior Lien BABs and the 2010A and 2010B Junior Lien BABs was $24.5 million, which included a reduction totaling $1.7 million.
As of January 31, 2020, principal and interest amounts due for all revenue bonds outstanding for each of the next five years and thereafter to maturity are as follows:
Weighted-AverageYield on
Outstanding BondsIssues Maturities at January 31, 2020
Tax-exempt new series bonds 2012, 2015, 2016, 20172018, 2018A, 2019, and 2020 2021-2049 4.0% $ 2,550,250 $ 2,464,500
Taxable new series bonds 2009C1, 2010A1
and 2012 2031-2042 4.1% 1,059,225 1,276,000 Total new series bonds 4.0% 3,609,475 3,740,500
Taxable series bonds 2010A1 2038-2041 3.8% 300,000 500,000
Tax-exempt variable-rate series bonds 2015A, 2015B, 2015C 2015D, 2018, 2020 2029-2049 2.2% 709,860 582,700
Tax-exempt series bonds 2013, 2014, 2019 2026-2048 4.4% 827,640 656,205 Total series bonds 4.3% 1,837,500 1,738,905
Total long-term revenue bonds outstanding 5,446,975 5,479,405 Less: Current maturities of bonds 161,160 136,720
Total revenue bonds outstanding, net of current maturities $ 5,285,815 $ 5,342,685
1Direct Subsidy Build America Bonds
2020 2019January 31,
(In thousands)
Fiscal Year2021 $ 161,160 $ 250,091 $ (18,404) $ 392,8472022 164,495 247,344 (18,403) 393,4362023 169,790 245,426 (18,403) 396,8132024 172,780 243,267 (18,403) 397,6442025 180,880 236,357 (18,403) 398,834
2026-2030 886,725 1,131,631 (92,594) 1,925,7622031-2035 1,063,488 901,856 (94,805) 1,870,5392036-2040 1,360,311 597,990 (55,542) 1,902,7592041-2045 920,023 251,316 (2,768) 1,168,5712046-2049 367,323 46,078 - 413,401
Totals $ 5,446,975 $ 4,151,356 $ (337,725) $ 9,260,606
SubsidyDirect
Total InterestPrincipal
CPS Energy FY2020 Basic Financial Statements
. Page 71
The previous table includes senior lien and junior lien bonds. Interest on the senior lien bonds and the junior lien fixed-rate bonds is based upon the stated coupon rates of each series of bonds outstanding. The direct subsidy associated with the BABs has been presented in a separate column and includes the impact of sequestration. CPS Energy has taken the position that the BABs direct subsidy should be deducted when calculating total debt service since the subsidy is received directly by the trustee to be used solely for BABs debt service payments.
The Series 2015A and Series 2015B Junior Lien Bonds were issued as multi-modal variable-rate bonds. The Series 2015A Junior Lien Bonds were remarketed in FY2020 and utilize an interest rate of 1.75% through their term rate period’s expiration in FY2025. A stepped rate of 7.0% is assumed in the previous table for this series thereafter through applicable final maturity. The Series 2015B Junior Lien Bonds were remarketed in FY2018 and utilize an interest rate of 2.0% through their term rate period’s expiration in FY2022. A stepped rate of 7.0% is assumed in the previous table for this series thereafter through applicable final maturity.
The Series 2015C and Series 2015D Junior Lien Bonds were issued as multi-modal variable-rate bonds. The Series 2015C Junior Lien Bonds were remarketed in FY2020 and utilize an interest rate of 1.75% through their term rate period’s expiration in FY2025. A stepped rate of 7.0% is assumed in the previous table for this series thereafter through applicable final maturity. The Series 2015D Junior Lien Bonds were initially issued in a term rate mode as variable-rate bonds that utilize an interest rate of 3.0% through their term rate period's expiration in FY2021. A stepped rate of 8.0% is assumed in the previous table for each series thereafter through applicable final maturity. The stepped rate is applicable only if the bonds are not remarketed by their respective expiration date.
The Series 2018 Junior Lien Bonds were issued as multi-modal variable-rate bonds that utilize an interest rate of 2.75% through their term rate period's expiration in FY2023. A stepped rate of 8.0% is assumed in the previous table for each series thereafter through applicable final maturity. The stepped rate is applicable only if the bonds are not remarketed by their respective expiration date.
The Series 2020 Junior Lien Bonds were issued as multi-modal variable-rate bonds that utilize an interest rate of 1.75% through their term rate period's expiration in FY2026. A stepped rate of 7.0% is assumed in the previous table for each series thereafter through applicable final maturity. The stepped rate is applicable only if the bonds are not remarketed by their respective expiration date.
Pursuant to guidance provided in GASB Statement No. 65, debt reacquisition costs meet neither the definition of an asset nor a liability and are therefore required to be classified as deferred outflows or inflows of resources on the Statements of Net Position. The debt refundings that occurred in FY2020 and FY2019 resulted in a difference between the reacquisition price and the net carrying amount of the old debt of approximately $29.5 million and $(6.0) million, respectively. Debt reacquisition costs reported as deferred outflows of resources totaled $61.4 million at January 31, 2020, and $62.2 million at January 31, 2019. These amounts are amortized as components of interest expense using the effective interest method over the shorter of the remaining life of the refunding or the refunded debt.
CPS Energy, as a rate-regulated entity and in accordance with guidance found in GASB Statement No. 62, establishes regulatory assets for debt issuance costs that would otherwise be required to be expensed in accordance with GASB Statement No. 65. This regulatory accounting treatment results in the amortization of these costs over the life of the related debt. Debt issuance costs, which are reported within other noncurrent assets on the Statements of Net Position, totaled $37.8 million at January 31, 2020, and $35.5 million at January 31, 2019.

CPS Energy FY2020 Basic Financial Statements
Page 72
FY2020Long‐TermDebtActivity (Dollars in thousands)
Final Balance BalanceOriginal Principal True Interest Outstanding Additions Decreases OutstandingAmount Payment Cost (%) 2-1-19 During Year During Year 1‐31‐20
Revenue and refunding bonds2009C taxable 375,000$ 2039 3.944 375,000$ -$ -$ 375,000$2010A taxable 380,000 2041 3.834 380,000 - (100,000) 280,0002010A taxable – Junior Lien 300,000 2041 3.806 300,000 - - 300,0002010B taxable – Junior Lien 200,000 2037 4.101 200,000 - (200,000) ‐2012 taxable 521,000 2042 4.382 521,000 - (116,775) 404,2252012 tax-exempt 655,370 2025 2.552 655,370 - - 655,3702013 tax-exempt – Junior Lien 375,000 2048 4.753 375,000 - - 375,0002014 tax-exempt – Junior Lien 200,000 2044 4.142 200,000 - - 200,0002014 tax-exempt – Junior Lien 262,530 2020 1.220 81,205 - (81,205) ‐2015A tax-exempt – Junior Lien 125,000 2033 Variable 124,555 124,205 (124,555) 124,2052015B tax-exempt – Junior Lien 125,000 2033 Variable 123,275 - - 123,2752015 tax-exempt 320,530 2032 2.992 237,700 - - 237,7002015 tax-exempt 235,000 2039 3.476 235,000 - - 235,0002015C tax-exempt – Junior Lien 100,000 2046 Variable 100,000 99,740 (100,000) 99,7402015D tax-exempt – Junior Lien 100,000 2046 Variable 100,000 - - 100,0002016 tax-exempt 544,260 2034 2.144 519,140 - (108,000) 411,1402017 tax-exempt 40,685 2021 1.126 6,485 - (6,365) 1202017 tax-exempt 267,320 2047 3.804 267,320 - - 267,3202017 tax-exempt 194,980 2047 3.619 194,980 - - 194,9802018 tax-exempt 218,285 2028 2.745 218,285 - (49,150) 169,1352018A tax-exempt 130,220 2048 3.654 130,220 - - 130,2202018 tax-exempt – Junior Lien 134,870 2048 Variable 134,870 - - 134,8702019 tax-exempt 114,685 2030 1.462 - 114,685 - 114,6852019 tax-exempt – Junior Lien 252,640 2041 2.885 - 252,640 - 252,6402020 tax-exempt 134,580 2049 3.132 - 134,580 - 134,5802020 tax-exempt – Junior Lien 127,770 2049 Variable - 127,770 - 127,770
Bonds outstanding 5,479,405 853,620 (886,050) 5,446,975
Current maturities (136,720) (24,440) - (161,160)(Discount) premium 347,612 116,797 (68,384) 396,025
Revenue bonds, net 5,690,297 945,977 (954,434) 5,681,840Commercial paper, tax-exempt Variable 205,000 320,000 (430,000) 95,000
Long-term debt, net 5,895,297$ 1,265,977$ (1,384,434)$ 5,776,840$

CPS Energy FY2020 Basic Financial Statements
. Page 73
FY2019Long‐TermDebtActivity(Dollars in thousands)
8.CommercialPaperandRelatedRevolvingCreditAgreements
In 1988, the San Antonio City Council adopted an ordinance authorizing the issuance of up to $300 million in tax-exempt commercial paper. The current ordinances allow for the issuance of three separate series of commercial paper to provide funding to assist in the interim financing of eligible projects in an aggregate amount not to exceed $700 million to the extent of support from liquidity facilities. As of January 31, 2020, there was a total of $700 million in liquidity support. The ordinances allow for the issuance of taxable, as well as tax-exempt commercial paper. Eligible projects include fuel acquisition, capital improvements to the Systems, and refinancing or refunding any outstanding obligations, which are secured by and payable from a lien and/or a pledge of net revenues of the Systems. Such pledge of net revenues is subordinate and inferior to the pledge securing payment of existing senior lien and junior lien obligations. Scheduled maximum maturities cannot extend beyond April 11, 2049.
The commercial paper has been classified as long-term in accordance with the refinancing terms under three revolving credit agreements with a consortium of banks, which support the commercial paper program. Each revolving credit agreement relates to a particular series of notes and provides liquidity support in the amount specified. The Series A agreement provides $400 million in liquidity support for the Series A Notes and is effective through June 21, 2023. The Series B agreement provides $200 million in liquidity support for the Series B Notes and the Series C agreement provides $100 million in liquidity
Final Balance BalanceOriginal Principal True Interest Outstanding Additions Decreases OutstandingAmount Payment Cost (%) 2-1-18 During Year During Year 1-31-19
Revenue and refunding bonds2009A tax-exempt 442,005$ 2034 4.863 16,120$ -$ (16,120)$ -$ 2009C taxable 375,000 2039 3.944 375,000 - - 375,000 2009D tax-exempt 207,940 2021 3.720 147,450 - (147,450) - 2010A taxable 380,000 2041 3.834 380,000 - - 380,000 2010A taxable – Junior Lien 300,000 2041 3.806 300,000 - - 300,000 2010B taxable – Junior Lien 200,000 2037 4.101 200,000 - - 200,000 2012 taxable 521,000 2042 4.382 521,000 - - 521,000 2012 tax-exempt 655,370 2025 2.552 655,370 - - 655,370 2012A tax-exempt – Junior Lien 48,170 2027 Variable 47,135 - (47,135) - 2012B tax-exempt – Junior Lien 47,815 2027 Variable 47,650 - (47,650) - 2012C tax-exempt – Junior Lien 47,660 2027 Variable 47,500 - (47,500) - 2013 tax-exempt – Junior Lien 375,000 2048 4.753 375,000 - - 375,000 2014 tax-exempt – Junior Lien 200,000 2044 4.142 200,000 - - 200,000 2014 tax-exempt – Junior Lien 262,530 2020 1.220 158,545 - (77,340) 81,205 2015A tax-exempt – Junior Lien 125,000 2033 Variable 124,555 - - 124,555 2015B tax-exempt – Junior Lien 125,000 2033 Variable 123,275 - - 123,275 2015 tax-exempt 320,530 2032 2.992 306,080 - (68,380) 237,700 2015 tax-exempt 235,000 2039 3.476 235,000 - - 235,000 2015C tax-exempt – Junior Lien 100,000 2046 Variable 100,000 - - 100,000 2015D tax-exempt – Junior Lien 100,000 2046 Variable 100,000 - - 100,000 2016 tax-exempt 544,260 2034 2.144 544,260 - (25,120) 519,140 2017 tax-exempt 40,685 2047 1.126 18,735 - (12,250) 6,485 2017 tax-exempt 267,320 2047 3.804 267,320 - - 267,320 2017 tax-exempt 194,980 2047 3.619 194,980 - - 194,980 2018 tax-exempt 218,285 2028 2.745 - 218,285 - 218,285 2018A tax-exempt 130,220 2048 3.654 - 130,220 - 130,220 2018 tax-exempt – Junior Lien 134,870 2048 Variable - 134,870 - 134,870
Bonds outstanding 5,484,975 483,375 (488,945) 5,479,405
Current maturities (169,895) - 33,175 (136,720)(Discount) premium 358,688 47,350 (58,426) 347,612
Revenue bonds, net 5,673,768 530,725 (514,196) 5,690,297 Commercial paper, tax-exempt Variable 160,000 330,000 (285,000) 205,000
Long-term debt, net 5,833,768$ 860,725$ (799,196)$ 5,895,297$

CPS Energy FY2020 Basic Financial Statements
Page 74
support for Series C Notes. The Series B and Series C agreements are both effective through June 21, 2022. Under the terms of these revolving credit agreements, CPS Energy may borrow up to an aggregate amount not to exceed $700 million for the purpose of paying principal due under the commercial paper program. At January 31, 2020, there was no amount outstanding under the revolving credit agreements. Further, there have been no borrowings under the agreements since inception of the program.
During FY2020, CPS Energy issued a total of $320.0 million in commercial paper and $430.0 million was refunded. As of January 31, 2020 and 2019, the outstanding commercial paper balance was $95.0 million and $205.0 million, respectively, all of which was tax exempt.
CommercialPaperSummary(Dollars in thousands)
9.EmployeePensionPlan
Plan Description – The CPS Energy Pension Plan (the “Pension Plan”) is a self-administered, single-employer, defined-benefit contributory pension plan covering substantially all employees who have attained age 21 and completed one year of service. It is sponsored by and may be amended at any time by CPS Energy, acting by and through the Employee Benefits Oversight Committee (“EBOC”), which includes the President & CEO, the Chief Financial Officer, and the Audit & Finance Committee of the Board. Pension Plan assets are segregated from CPS Energy’s assets and are separately managed by the Administrative Committee, whose members are appointed by the EBOC. The Pension Plan reports results on a calendar year basis, and the separately audited financial statements, which contain historical trend information, may be obtained at www.cpsenergy.com or by contacting Benefit Trust Administration at CPS Energy. The Pension Plan’s financial statements include certain disclosures related to CPS Energy’s net pension liability. However, because the financial reporting and pension measurement dates for the Pension Plan and CPS Energy are not aligned, the Pension Plan’s disclosures will vary from information provided by CPS Energy in this footnote and in the accompanying RSI. The Pension Plan, along with the Employee Benefit Plans are included in the fiduciary financial statements.
In addition to the defined-benefit Pension Plan, CPS Energy has two Restoration Plans that were effective as of January 1, 1998, which supplement benefits paid from the Pension Plan due to Internal Revenue Code restrictions on benefit and compensation limits. The benefits due under those Restoration Plans have been paid annually by CPS Energy.
BenefitsProvided – Participants become fully vested in the benefits of the Pension Plan upon attainment of age 40 or after completion of seven years of vesting service before age 40. Normal retirement age is 65; however, early retirement is available with 25 years of benefit service, as well as to those employees who are age 55 or older with at least ten years of benefit service. Pension Plan benefits consist of a normal retirement annuity calculated based primarily on length of service and compensation. Benefits are reduced for retirement before age 55 with 25 years or more of benefit service or before age 62 with less than 25 years of service. If early retirement occurs due to disability, the reductions in benefits normally associated with early retirement are modified.
Commercial paper outstanding $ 95,000 $ 205,000New commercial paper issues $ 320,000 $ 330,000Weighted-average interest rate of outstanding 1.4% 1.8%Average life outstanding (number of days) 146 82
20192020
January 31,

CPS Energy FY2020 Basic Financial Statements
. Page 75
Payments to retirees are adjusted each year by an amount equal to 50% of the change in the Consumer Price Index-U, limited to a maximum adjustment of 5% each year, with no reduction allowed below the retirees’ initial benefit levels.
The following table presents information about Pension Plan participants covered by the benefit terms. Participants providing the basis of the actuarial valuations used to calculate the net pension liability, as of the measurement dates, for the fiscal years ended January 31, 2020 and 2019, were:
Contributions – The current policy of CPS Energy is to use an actuarial valuation as the basis for determining employer contributions to the Pension Plan during the fiscal year beginning thirteen months after the valuation date. The January 1, 2018, valuation is the basis for contributions in FY2020. With recommendations from the Administrative Committee, composed of a cross-functional group of active and retired CPS Energy employees, the Company establishes funding levels, considering annual actuarial valuations. Generally, participating employees contribute 5.0% of their total compensation, commencing with the effective date of participation and continuing until normal or early retirement, completion of 44 years of benefit service, or termination of employment. Participants who leave CPS Energy service before becoming eligible for retirement benefits receive a return of the total amount they contributed to the Pension Plan, plus the vested portion of accumulated interest. Beginning January 1, 2015, through December 31, 2017, the employee contribution interest crediting rate was 5.50%. Beginning January 1, 2018, the employee contribution interest credit rating was 5.25%.
The balance of Pension Plan contributions is the responsibility of CPS Energy, giving consideration to actuarial information, budget controls, legal requirements, compliance, and industry and/or community norms. For FY2020 and FY2019, the amount to be funded was established using a general target near the 30-year funding contribution level as determined by the Pension Plan’s actuary using the entry-age normal cost method. In December 2019, an additional contribution of $20.0 million was made to the Pension Plan that will be included in the next actuarial valuation as of January 1, 2019, which will be reflected in the net pension liability for the fiscal year ended January 31, 2021.
NetPensionLiability – CPS Energy’s net pension liability at January 31, 2020 and 2019, was measured as of January 31, 2019 and 2018, respectively. The total pension liability used to calculate the net pension liability was determined by actuarial valuations as of January 1, 2018 and 2017, rolled forward using generally accepted actuarial procedures to the January 31, 2019 and 2018, measurement dates, respectively.
2020 2019
Active participants 2,942 2,886 Participants currently receiving benefits 2,427 2,348 Participants entitled to deferred benefits 205 218
Total plan participants 5,574 5,452
January 31,

CPS Energy FY2020 Basic Financial Statements
Page 76
ChangesinNetPensionLiability(In thousands)
CPS Energy recorded $66.1 million and $27.1 million in pension expense for the fiscal years ended January 31, 2020 and 2019, respectively.
ActuarialAssumptions – Significant actuarial assumptions used in the January 1, 2018, valuation include a rate of return on the investment of present and future assets of 7.25%, a discount rate on Pension Plan liabilities of 7.25%, annual projected salary increases averaging 5.36% per year and annual post-retirement cost-of-living increases of 1.5%. The projected salary increases include an inflation rate of 2.30%. Mortality rates were based on the RP-2014 Mortality adjusted backwards to 2006 with MP-2014 and projected forward (fully generational) with MP-2017. The actuarial methods and assumptions are the same as those used in the prior year except for the mortality table assumption that was updated to better reflect anticipated future Pension Plan experience.
The actuarial assumptions used in the January 1, 2018 and 2017, valuations for amounts reported in FY2020 and FY2019, respectively, were based on the results of an actuarial experience study completed in 2017 covering experience for the period January 1, 2012, through December 31, 2016.
The long-term expected rate of return on Pension Plan investments was determined based on a blend of historical performance data and future expectations for each major asset class, while also reflecting current capital market conditions, developed on a geometric basis. An economic simulation method was used in which best-estimate ranges of expected future rates of return (expected returns net of Pension Plan investment expense) for each major asset class were combined using simulations that ensure the economic consistency of each individual trial, and then reduced by a factor representing inflation to
2020 2019Total pension liability
Service cost 37,175$ 32,569$ Interest cost 137,954 132,861 Changes in assumptions (10,129) 77,574 Differences between expected and actual experience (19,385) 6,025 Benefit payments (96,969) (93,550)
Net change in total pension liability 48,646 155,479
Total pension liability, beginning of period 1,940,317 1,784,838 Total pension liability, end of period 1,988,963 1,940,317
Plan fiduciary net positionEmployer contributions (58,700) (46,200) Participant contributions (13,363) (13,039) (Earnings) loss on Plan assets 48,316 (246,772) Benefit payments 96,969 93,550 Administrative expense 391 389
Net change in Plan fiduciary net position 73,613 (212,072)
Plan fiduciary net position, beginning of period (1,684,448) (1,472,376) Plan fiduciary net position, end of period (1,610,835) (1,684,448)
Net pension liability, end of period 378,128$ 255,869$
Fiscal Year Ended January 31,

CPS Energy FY2020 Basic Financial Statements
. Page 77
produce long-term expected real rates of return for each major asset class. The assumed allocation and expected real rates of return for each major asset class are summarized in the following table:
DiscountRate – The discount rate used to measure the total pension liability for FY2020 and FY2019 was 7.25%. The projection of cash flows used to determine the discount rates assumed that future employee contributions will be made at the current contribution rate and that future CPS Energy contributions will be made in a manner consistent with the current contribution practices. Based on those assumptions, the Pension Plan’s fiduciary net position was projected to be available to make all projected future benefit payments of current active and inactive employees. Therefore, the long-term expected rate of return on Pension Plan investments was applied to all periods of projected benefit payments to determine the total pension liability.
The following table presents the sensitivity of net pension liability calculation to a 1% increase and a 1% decrease in the discount rate used to measure the total pension liability:
DiscountRateSensitivity(In thousands)
Pension Plan Fiduciary Net Position – The financial results of the Pension Plan are included, in combination with the Employee Benefit Plans, in the Statements of Fiduciary Net Position. Detailed information about the Pension Plan’s fiduciary net position is available in the separately issued Pension Plan financial statements. For purposes of measuring the net pension liability, deferred outflows of resources and deferred inflows of resources related to pension and pension expense, information about the fiduciary net position for the Pension Plan and additions to/deductions from the Pension Plan’s fiduciary net position have been determined on the same basis as they are reported by the Pension Plan. Investments are stated at fair value. Benefit payments (including refunds of employee contributions) are recognized when due and payable in accordance with the terms of the Pension Plan.
Assumed ExpectedAsset Real Rate
Allocation of Return
Equities 52.5% 5.5%Debt securities 25.5% 3.5%Alternative investments 22.0% 5.2%
Total investments 100.0%
Asset Class
2020 2019
Discount rate1% decrease - 6.25% 629,018$ 496,332$ Current discount rate - 7.25% 378,128 255,869 1% increase - 8.25% 169,246 52,973
at January 31,Net Pension Liability
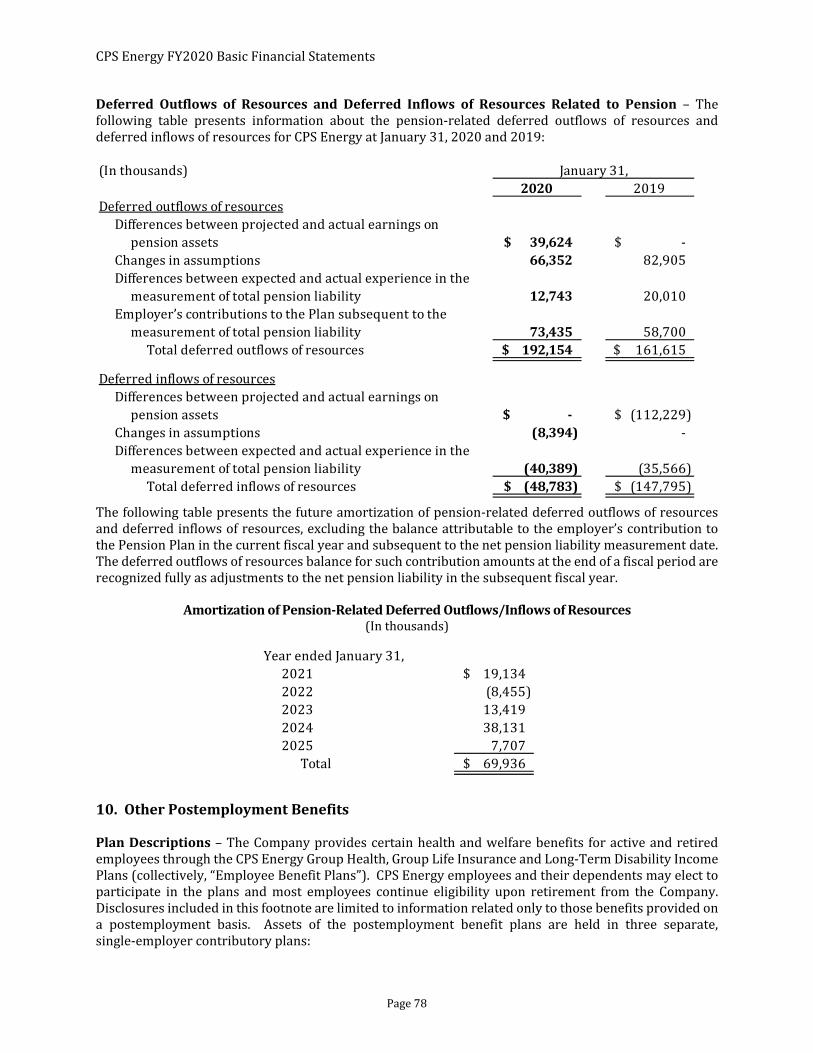
CPS Energy FY2020 Basic Financial Statements
Page 78
(In thousands)2020 2019
Deferred outflows of resourcesDifferences between projected and actual earnings on
pension assets 39,624$ -$ Changes in assumptions 66,352 82,905 Differences between expected and actual experience in the
measurement of total pension liability 12,743 20,010 Employer’s contributions to the Plan subsequent to the
measurement of total pension liability 73,435 58,700 Total deferred outflows of resources 192,154$ 161,615$
Deferred inflows of resourcesDifferences between projected and actual earnings on
pension assets ‐$ (112,229)$ Changes in assumptions (8,394) - Differences between expected and actual experience in the
measurement of total pension liability (40,389) (35,566) Total deferred inflows of resources (48,783)$ (147,795)$
January 31,
Year ended January 31,2021 19,134$ 2022 (8,455) 2023 13,419 2024 38,131 2025 7,707
Total 69,936$
DeferredOutflows of Resources andDeferred Inflows of Resources Related to Pension – The following table presents information about the pension-related deferred outflows of resources and deferred inflows of resources for CPS Energy at January 31, 2020 and 2019:
The following table presents the future amortization of pension-related deferred outflows of resources and deferred inflows of resources, excluding the balance attributable to the employer’s contribution to the Pension Plan in the current fiscal year and subsequent to the net pension liability measurement date. The deferred outflows of resources balance for such contribution amounts at the end of a fiscal period are recognized fully as adjustments to the net pension liability in the subsequent fiscal year.
AmortizationofPension‐RelatedDeferredOutflows/InflowsofResources (In thousands)
10.OtherPostemploymentBenefits
PlanDescriptions – The Company provides certain health and welfare benefits for active and retired employees through the CPS Energy Group Health, Group Life Insurance and Long-Term Disability Income Plans (collectively, “Employee Benefit Plans”). CPS Energy employees and their dependents may elect to participate in the plans and most employees continue eligibility upon retirement from the Company. Disclosures included in this footnote are limited to information related only to those benefits provided on a postemployment basis. Assets of the postemployment benefit plans are held in three separate, single-employer contributory plans:

CPS Energy FY2020 Basic Financial Statements
. Page 79
CPS Energy Group Health Plan (“Health Plan”) – a defined-benefit contributory group health plan that provides health, dental and vision insurance benefits;
CPS Energy Group Life Insurance Plan (“Life Plan”) – a defined-benefit contributory plan that provides life insurance benefits; and
CPS Energy Long-Term Disability Income Plan (“Disability Plan”) – a defined-benefit contributory plan that provides disability income benefits.
The Employee Benefit Plans may be amended at any time by CPS Energy, acting by and through the EBOC, which includes the President & CEO, the Chief Financial Officer, and the Audit & Finance Committee of the Board.
The Employee Benefit Plans’ assets are segregated from CPS Energy’s assets and are separately managed by an Administrative Committee whose members are appointed by the EBOC. The Employee Benefit Plans report results on a calendar year basis and issue separately audited financial statements that may be obtained by contacting Benefit Trust Administration at CPS Energy. The Employee Benefit Plans’ financial statements include certain disclosures related to CPS Energy’s net OPEB (asset) liability. However, because the financial reporting and OPEB measurement dates for the Employee Benefit Plans and CPS Energy are not aligned, the Employee Benefit Plans’ disclosures will vary from information provided by CPS Energy in this footnote and in the accompanying RSI. The Employee Benefit Plans along with the Pension Plan are included in the fiduciary financial statements.
BenefitsProvided – The Health Plan provides health, dental and vision benefits to eligible retirees, including their enrolled dependents, and the spouse and dependent children of deceased employees. The Life Plan provides life insurance benefits and death benefits to eligible retired employees and enrolled dependents. The Disability Plan provides disability income benefits to employees as of an employee’s date of hire; however, benefits under the Plan are reduced if the employee is receiving certain other disability, retirement or welfare benefits.
The following tables present information about the Employee Benefit Plans’ participants covered by the benefit terms. Participants providing the basis of the actuarial valuations used to calculate the net OPEB liability, as of the measurement dates, for the fiscal years ended January 31, 2020 and 2019, were:
Contributions – The funding requirements for both the Plans participants and the employer are established by and may be amended by CPS Energy. Funding is based on projected pay-as-you-go
Health Life Disability
Active participants 2,942 2,942 3,065Non-active participants 1,985 2,325 68
Total plan participants 4,927 5,267 3,133
Health Life Disability
Active participants 2,886 2,886 2,992 Non-active participants 1,926 2,268 69
Total plan participants 4,812 5,154 3,061
January31,2020
January 31, 2019

CPS Energy FY2020 Basic Financial Statements
Page 80
financing requirements, with an additional amount to prefund benefits as determined annually by the Company. The current policy of CPS Energy is to use each actuarial valuation as the basis for determining monthly employer contributions to the Employee Benefit Plans during the fiscal year beginning thirteen months after the valuation date. The January 1, 2018, valuation was the basis for contributions in FY2020.
Retired employees contribute to the Health Plan in varying amounts depending upon an equity formula that considers age and years of service. Individuals who retired before February 1, 1993, contribute a base rate plus 2.25% of the difference between that amount and the aggregate rate for each year that the sum of age and service is less than 95. Those who retired on or after February 1, 1993, contribute a base rate plus a percentage of the CPS Energy contribution, based on the number of years of service, if they retired with less than 35 years.
Based on the funded status of the Health Plan, the Company made no contributions in FY2020 and FY2019.
The Medicare Prescription Drug Improvement and Modernization Act of 2003, known as Medicare Part D, established prescription drug coverage for Medicare beneficiaries. One of the provisions of Medicare Part D entitled the Health Plan to receive retiree drug subsidy payments from the federal government to offset pharmacy claims paid by the Health Plan on behalf of certain plan participants. These payments totaled $0.9 million and $1.0 million for FY2020 and FY2019, respectively. In accordance with GASB Technical Bulletin 2006-01, Accounting and Financial Reporting by Employers for Payments from theFederalGovernmentPursuanttotheRetireeDrugSubsidyProvisionsofMedicarePartD, future projected payments from the federal government have not been used to lessen total projected obligations under the Company’s Health Plan.
Active employees contribute to the Life Plan at a rate of $0.13 per $1,000 of insurance per month on amounts in excess of $20,000. Individuals who retired prior to February 1, 1993, contribute at a rate of $0.13 per $1,000 of insurance per month on amounts in excess of $20,000 plus 2.25% of the difference between that amount and the aggregate rate for retiree coverage for each year the sum of retirement age and service is less than 95. Those who retired on or after February 1, 1993, contribute $0.13 per $1,000 of insurance per month on amounts in excess of $20,000 plus a percentage of the CPS Energy contribution, based on number of years of service, if they retired with less than 35 years. Based on the funded status of the Life Plan, the Company made no contributions in FY2020 and FY2019.
Beginning in FY2015, the Disability Plan has been funded by a combination of employee and employer contributions. Active employee contribution rates are determined by CPS Energy and may be adjusted on an annual basis. The Company's contributions are determined on a discretionary basis and are generally based on actuarial valuation calculations. Retired employees are not eligible to participate and therefore do not contribute to the Disability Plan. Prior to FY2015, the Disability Plan was funded completely by CPS Energy. The Company’s average contribution rate was 0.3% of covered-employee payroll in FY2020 and 0.4% of covered-employee payroll in FY2019.
NetOPEB(Asset)Liability – CPS Energy’s net OPEB (asset) liability at January 31, 2020 and 2019, was measured as of January 31, 2019 and 2018, respectively. The total OPEB liability used to calculate the net OPEB (asset) liability was determined by actuarial valuations as of January 1, 2018 and 2017, rolled forward using generally accepted actuarial procedures to the January 31, 2019 and 2018, measurement dates, respectively.
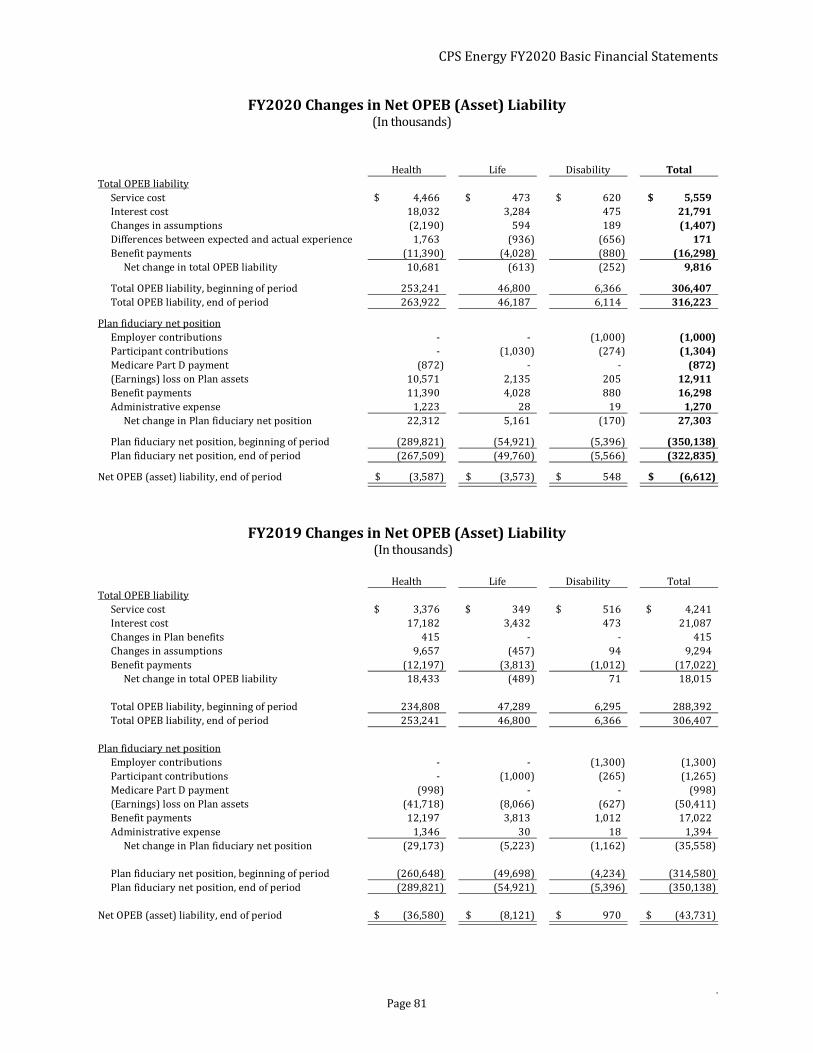
CPS Energy FY2020 Basic Financial Statements
. Page 81
FY2020ChangesinNetOPEB(Asset)Liability(In thousands)
FY2019ChangesinNetOPEB(Asset)Liability
(In thousands)
Health Life Disability TotalTotal OPEB liability
Service cost 4,466$ 473$ 620$ 5,559$Interest cost 18,032 3,284 475 21,791Changes in assumptions (2,190) 594 189 (1,407)Differences between expected and actual experience 1,763 (936) (656) 171Benefit payments (11,390) (4,028) (880) (16,298)
Net change in total OPEB liability 10,681 (613) (252) 9,816
Total OPEB liability, beginning of period 253,241 46,800 6,366 306,407Total OPEB liability, end of period 263,922 46,187 6,114 316,223
Plan fiduciary net positionEmployer contributions - - (1,000) (1,000)Participant contributions - (1,030) (274) (1,304)Medicare Part D payment (872) - - (872)(Earnings) loss on Plan assets 10,571 2,135 205 12,911Benefit payments 11,390 4,028 880 16,298Administrative expense 1,223 28 19 1,270
Net change in Plan fiduciary net position 22,312 5,161 (170) 27,303
Plan fiduciary net position, beginning of period (289,821) (54,921) (5,396) (350,138)Plan fiduciary net position, end of period (267,509) (49,760) (5,566) (322,835)
Net OPEB (asset) liability, end of period (3,587)$ (3,573)$ 548$ (6,612)$
Health Life Disability TotalTotal OPEB liability
Service cost 3,376$ 349$ 516$ 4,241$ Interest cost 17,182 3,432 473 21,087 Changes in Plan benefits 415 - - 415 Changes in assumptions 9,657 (457) 94 9,294 Benefit payments (12,197) (3,813) (1,012) (17,022)
Net change in total OPEB liability 18,433 (489) 71 18,015
Total OPEB liability, beginning of period 234,808 47,289 6,295 288,392 Total OPEB liability, end of period 253,241 46,800 6,366 306,407
Plan fiduciary net positionEmployer contributions - - (1,300) (1,300) Participant contributions - (1,000) (265) (1,265) Medicare Part D payment (998) - - (998) (Earnings) loss on Plan assets (41,718) (8,066) (627) (50,411) Benefit payments 12,197 3,813 1,012 17,022 Administrative expense 1,346 30 18 1,394
Net change in Plan fiduciary net position (29,173) (5,223) (1,162) (35,558)
Plan fiduciary net position, beginning of period (260,648) (49,698) (4,234) (314,580) Plan fiduciary net position, end of period (289,821) (54,921) (5,396) (350,138)
Net OPEB (asset) liability, end of period (36,580)$ (8,121)$ 970$ (43,731)$

CPS Energy FY2020 Basic Financial Statements
Page 82
(In thousands)2020 2019
Health 7,534$ 1,254$ Life 76 (765) Disability 553 473
Total 8,163$ 962$
January 31,
CPS Energy recorded $8.2 million and $1.0 million in OPEB expense for the years ended January 31, 2020 and 2019, respectively, as summarized in the following table:
ActuarialAssumptions – Significant actuarial assumptions used in the calculations for the January 1, 2018, actuarial valuations for FY2020 included: (a) a rate of return on the investment of present and future assets of 7.25% for the Health, Life and Disability Plans, (b) a Consumer Price Index increase of 2.3% per year for the Health, Life and Disability Plans, (c) projected annual base salary increases for the Health, Life and Disability Plan ranging from 3.1% to 11.6% depending on age, and (d) overall average medical and prescription cost increases projected at 6.45% for 2018, decreasing annually thereafter based on medical trend assumptions. Mortality rates for retirees were based on the RP-2014 Mortality Table adjusted backwards to 2006 with Mortality Improvement Scale MP-2014 and projected with Mortality Improvement Scale MP-2017, with employee rates before termination and healthy annuitant rates after termination. Mortality rates for disabled lives were based on the 1987 Commissioners Group Disabled Life Mortality Table.
Significant actuarial assumptions used in the calculations for the January 1, 2017, actuarial valuations for FY2019 included: (a) a rate of return on the investment of present and future assets of 7.25% for the Health, Life and Disability Plans, (b) a Consumer Price Index increase of 3.0% per year for the Health, Life and Disability Plans, (c) projected annual base salary increases for the Health Plan ranging from 3.1% to 11.6% depending on age and projected average annual salary increases of 4.54% and 4.72% for the Life and Disability Plans, respectively, and (d) overall medical and prescription cost increases projected at 7.00% for 2017, decreasing annually to 5.0%, in 2022 and thereafter. Mortality rates for retirees were based on the RP-2016 Combined Healthy, with No Collar Adjustment, Male and Female tables; with MP-2016 Mortality Improvement Scale. Mortality rates for disabled lives were based on the 1987 Commissioners Group Disabled Life Mortality Table.
The actuarial assumptions used in the January 1, 2018 and 2017, valuations for amounts reported in FY2020 and FY2019, respectively, were based on the results of an actuarial experience study completed in 2017 covering experience for the period January 1, 2012, through December 31, 2016.
The long-term expected rate of return on Employee Benefit Plans investments was determined based on a blend of historical performance data and future expectations for each major asset class, while also reflecting current capital market conditions, developed on a geometric basis. An economic simulation method was used in which best-estimate ranges of expected future rates of return (expected returns on Employee Benefit Plans investment expense) for each major asset class were combined using simulations that ensure the economic consistency of each individual trial, then reduced by a factor representing inflation to produce long-term expected real rates of return for each major asset class. The assumed allocation and expected real rates of return for each major asset class are summarized in the following table:
Assumed ExpectedAsset Real Rate
Allocation of Return
Equities 54.5% 5.4%Debt securities 28.5% 3.4%Alternative investments 17.0% 5.6%
Total investments 100.0%
Asset Class

CPS Energy FY2020 Basic Financial Statements
. Page 83
DiscountRateandHealthcareCostTrendRates – The discount rate used to measure the total OPEB liability for FY2020 and FY2019 was 7.25%. The projection of cash flows used to determine the discount rate assumed that CPS Energy contributions will be made in a manner consistent with the current contribution practices. Based on those assumptions, the Employee Benefit Plans’ fiduciary net position was projected to be available to make all projected OPEB payments for current active and inactive employees. Therefore, the long-term expected rate of return on the Employee Benefit Plans’ investments was applied to all periods of projected benefit payments to determine the total OPEB liability.
The following tables present the sensitivity of net OPEB (asset) liability calculation to a 1% increase and a 1% decrease in the discount rate used to measure the total OPEB liability:
DiscountRateSensitivity(In thousands)
The following table presents the sensitivity of net Health Plan OPEB (asset) liability calculation to a 1% increase and a 1% decrease in the healthcare cost trend rates used to measure the total Health Plan OPEB liability:
HealthcareCostTrendRatesSensitivity(In thousands)
EmployeeBenefitPlans’FiduciaryNetPosition – The financial results of the Employee Benefit Plan are included, in combination with the Pension Plan, in the Statements of Fiduciary Net Position. Detailed information about the Employee Benefit Plans’ fiduciary net position is available in the separately issued Employee Benefit Plans financial statements. For purposes of measuring the net OPEB (asset) liability,
Health Life Disability Total
Discount rate1% decrease - 6.25% 26,237$ 2,789$ 682$ 29,708$Current discount rate - 7.25% (3,587) (3,573) 548 (6,612)1% increase - 8.25% (29,017) (8,754) 409 (37,362)
Health Life Disability Total
Discount rate1% decrease - 6.25% (6,335)$ (1,665)$ 1,131$ (6,869)$ Current discount rate - 7.25% (36,580) (8,121) 970 (43,731) 1% increase - 8.25% (66,824) (14,303) 819 (80,308)
NetOPEB(Asset)LiabilityatJanuary31,2020
Net OPEB (Asset) Liability at January 31, 2019
2020 2019
Healthcare Cost Trend Rates1% decrease (34,640)$ (63,986)$ Current healthcare cost trend rates (3,587) (36,580) 1% increase 34,079 (3,849)
at January 31,Net Health Plan OPEB (Asset) Liability

CPS Energy FY2020 Basic Financial Statements
Page 84
deferred outflows of resources and deferred inflows of resources related to OPEB, OPEB expense, information about the fiduciary net position for the Employee Benefit Plans and additions to/deductions from the Employee Benefit Plans’ fiduciary net position have been determined on the same basis as they are reported by the Employee Benefit Plans. Investments are stated at fair value. Benefit payments are recognized when due and payable in accordance with the terms of the Employee Benefit Plans.
DeferredOutflowsofResourcesandDeferredInflowsofResourcesRelatedtoOPEB – The following tables present information about the OPEB-related deferred outflows of resources and deferred inflows of resources for CPS Energy at January 31, 2020 and 2019:
(In thousands)
Health Life Disability TotalDeferred outflows of resources
Changes in assumptions 6,898$ 503$ 226$ 7,627$Differences between projected and actual earnings on
OPEB assets 7,853 1,838 319 10,010Differences between expected and actual experience in the
measurement of total OPEB liability 1,769 1,359 146 3,274Employer’s contributions to the Plan subsequent to the
measurement of total OPEB liability - - 769 769Total deferred outflows of resources 16,520$ 3,700$ 1,460$ 21,680$
Deferred inflows of resourcesDifferences between expected and actual experience in the
measurement of total OPEB liability -$ (792)$ (553)$ (1,345)$Changes in assumptions (1,860) (326) - (2,186)
Total deferred inflows of resources (1,860)$ (1,118)$ (553)$ (3,531)$
Health Life Disability TotalDeferred outflows of resources
Changes in assumptions 8,278$ -$ 80$ 8,358$ Differences between expected and actual experience in the
measurement of total OPEB liability 340 1,698 182 2,220 Employer’s contributions to the Plan subsequent to the
measurement of total OPEB liability - - 1,000 1,000 Total deferred outflows of resources 8,618$ 1,698$ 1,262$ 11,578$
Deferred inflows of resourcesDifferences between projected and actual earnings on
OPEB assets (19,416)$ (3,197)$ (149)$ (22,762)$ Changes in assumptions - (392) - (392)
Total deferred inflows of resources (19,416)$ (3,589)$ (149)$ (23,154)$
January31,2020
January 31, 2019

CPS Energy FY2020 Basic Financial Statements
. Page 85
The following table presents the future amortization of OPEB-related deferred outflows of resources and deferred inflows of resources, excluding the balance attributable to the employer’s contribution to the Employee Benefit Plans in the current fiscal year and subsequent to the net OPEB (asset) liability measurement date. The deferred outflows of resources balance for such contribution amounts at the end of a fiscal period are recognized fully as adjustments to the net OPEB (asset) liability in the subsequent fiscal year.
AmortizationofOPEB‐RelatedDeferredOutflows/InflowsofResources (In thousands)
11.OtherObligationsandRiskManagement
OtherLiabilities – CPS Energy maintains other obligations as noted on the following tables. The relative long-term portion of these obligations compared to the total was 70.7% as of January 31, 2020, and 80.7% as of January 31, 2019.
FY2020OtherLiabilitiesRollforward (In thousands)
Health Life Disability TotalYear ended January 31,
2021 4,156$ 959$ 90$ 5,205$ 2022 (1,417) (192) (3) (1,612) 2023 3,058 535 41 3,634 2024 7,588 1,424 99 9,111 2025 1,315 (118) (60) 1,137 Thereafter (40) (26) (29) (95)
Total 14,660$ 2,582$ 138$ 17,380$
Balance Balance Amounts NoncurrentOutstanding Additions Decreases Outstanding Duewithin Balance
2-1-2019 During Year During Year 1‐31‐2020 OneYear Outstanding
Customer deposits 39,275$ 23,152$ (24,319)$ 38,108$ 22,984$ 15,124$Operating reserves 35,700 18,165 (15,521) 38,344 3,830 34,514STP pension and OPEBs 88,819 28,633 (29,830) 87,622 ‐ 87,622Pollution remediation liability 2,662 1,890 (878) 3,674 3,187 487Project Warm 7,860 249 (239) 7,870 ‐ 7,870Notes payable 2,231 129 (243) 2,117 ‐ 2,117Fuel hedges 5,225 36,903 (7,422) 34,706 25,098 9,608Long-term service agreement liability 58,131 65,415 (66,192) 57,354 31,322 26,032Other 24,689 100,953 (99,911) 25,731 238 25,493
264,592$ 275,489$ (244,555)$ 295,526$ 86,659$ 208,867$Total other long-term liabilities
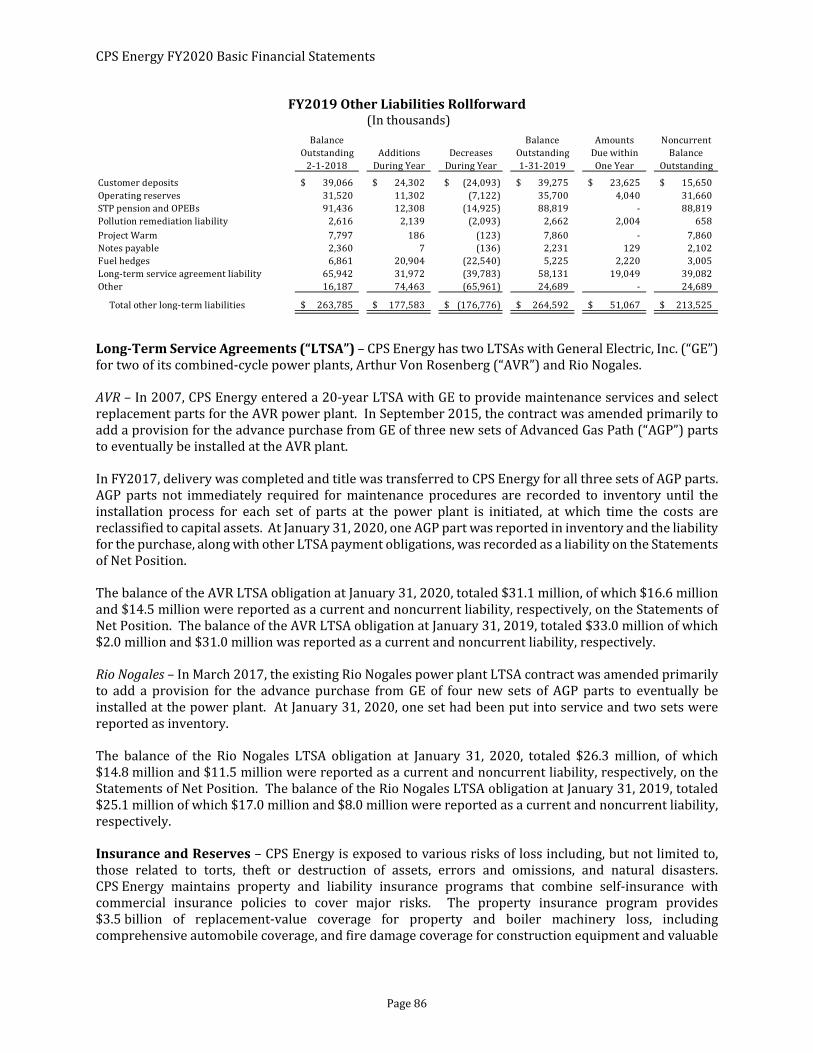
CPS Energy FY2020 Basic Financial Statements
Page 86
FY2019OtherLiabilitiesRollforward (In thousands)
Long‐TermServiceAgreements(“LTSA”) – CPS Energy has two LTSAs with General Electric, Inc. (“GE”) for two of its combined-cycle power plants, Arthur Von Rosenberg (“AVR”) and Rio Nogales.
AVR – In 2007, CPS Energy entered a 20-year LTSA with GE to provide maintenance services and select replacement parts for the AVR power plant. In September 2015, the contract was amended primarily to add a provision for the advance purchase from GE of three new sets of Advanced Gas Path (“AGP”) parts to eventually be installed at the AVR plant.
In FY2017, delivery was completed and title was transferred to CPS Energy for all three sets of AGP parts. AGP parts not immediately required for maintenance procedures are recorded to inventory until the installation process for each set of parts at the power plant is initiated, at which time the costs are reclassified to capital assets. At January 31, 2020, one AGP part was reported in inventory and the liability for the purchase, along with other LTSA payment obligations, was recorded as a liability on the Statements of Net Position.
The balance of the AVR LTSA obligation at January 31, 2020, totaled $31.1 million, of which $16.6 million and $14.5 million were reported as a current and noncurrent liability, respectively, on the Statements of Net Position. The balance of the AVR LTSA obligation at January 31, 2019, totaled $33.0 million of which $2.0 million and $31.0 million was reported as a current and noncurrent liability, respectively.
RioNogales – In March 2017, the existing Rio Nogales power plant LTSA contract was amended primarily to add a provision for the advance purchase from GE of four new sets of AGP parts to eventually be installed at the power plant. At January 31, 2020, one set had been put into service and two sets were reported as inventory.
The balance of the Rio Nogales LTSA obligation at January 31, 2020, totaled $26.3 million, of which $14.8 million and $11.5 million were reported as a current and noncurrent liability, respectively, on the Statements of Net Position. The balance of the Rio Nogales LTSA obligation at January 31, 2019, totaled $25.1 million of which $17.0 million and $8.0 million were reported as a current and noncurrent liability, respectively.
InsuranceandReserves– CPS Energy is exposed to various risks of loss including, but not limited to, those related to torts, theft or destruction of assets, errors and omissions, and natural disasters.CPS Energy maintains property and liability insurance programs that combine self-insurance with commercial insurance policies to cover major risks. The property insurance program provides $3.5 billion of replacement-value coverage for property and boiler machinery loss, including comprehensive automobile coverage, and fire damage coverage for construction equipment and valuable
Balance Balance Amounts NoncurrentOutstanding Additions Decreases Outstanding Due within Balance
2-1-2018 During Year During Year 1-31-2019 One Year Outstanding
Customer deposits 39,066$ 24,302$ (24,093)$ 39,275$ 23,625$ 15,650$ Operating reserves 31,520 11,302 (7,122) 35,700 4,040 31,660 STP pension and OPEBs 91,436 12,308 (14,925) 88,819 - 88,819 Pollution remediation liability 2,616 2,139 (2,093) 2,662 2,004 658 Project Warm 7,797 186 (123) 7,860 - 7,860 Notes payable 2,360 7 (136) 2,231 129 2,102 Fuel hedges 6,861 20,904 (22,540) 5,225 2,220 3,005 Long-term service agreement liability 65,942 31,972 (39,783) 58,131 19,049 39,082 Other 16,187 74,463 (65,961) 24,689 - 24,689
263,785$ 177,583$ (176,776)$ 264,592$ 51,067$ 213,525$ Total other long-term liabilities
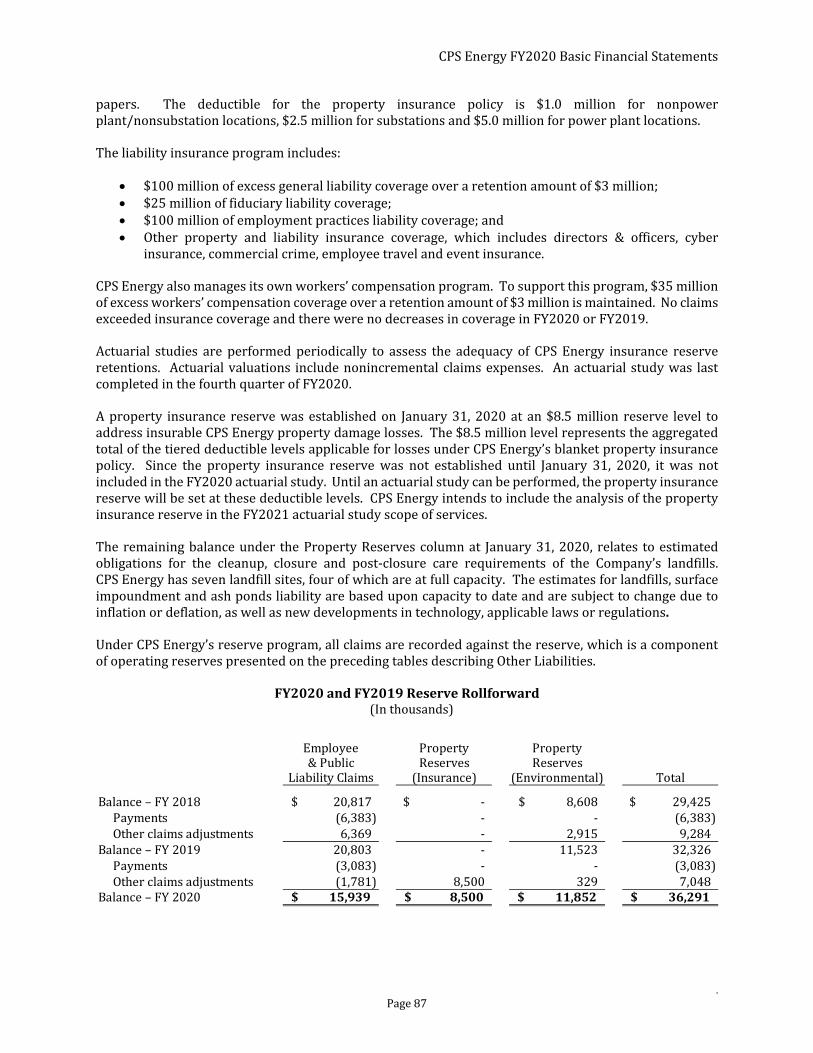
CPS Energy FY2020 Basic Financial Statements
. Page 87
papers. The deductible for the property insurance policy is $1.0 million for nonpower plant/nonsubstation locations, $2.5 million for substations and $5.0 million for power plant locations.
The liability insurance program includes:
$100 million of excess general liability coverage over a retention amount of $3 million; $25 million of fiduciary liability coverage; $100 million of employment practices liability coverage; and Other property and liability insurance coverage, which includes directors & officers, cyber
insurance, commercial crime, employee travel and event insurance.
CPS Energy also manages its own workers’ compensation program. To support this program, $35 million of excess workers’ compensation coverage over a retention amount of $3 million is maintained. No claims exceeded insurance coverage and there were no decreases in coverage in FY2020 or FY2019.
Actuarial studies are performed periodically to assess the adequacy of CPS Energy insurance reserve retentions. Actuarial valuations include nonincremental claims expenses. An actuarial study was last completed in the fourth quarter of FY2020.
A property insurance reserve was established on January 31, 2020 at an $8.5 million reserve level to address insurable CPS Energy property damage losses. The $8.5 million level represents the aggregated total of the tiered deductible levels applicable for losses under CPS Energy’s blanket property insurance policy. Since the property insurance reserve was not established until January 31, 2020, it was not included in the FY2020 actuarial study. Until an actuarial study can be performed, the property insurance reserve will be set at these deductible levels. CPS Energy intends to include the analysis of the property insurance reserve in the FY2021 actuarial study scope of services.
The remaining balance under the Property Reserves column at January 31, 2020, relates to estimated obligations for the cleanup, closure and post-closure care requirements of the Company’s landfills. CPS Energy has seven landfill sites, four of which are at full capacity. The estimates for landfills, surface impoundment and ash ponds liability are based upon capacity to date and are subject to change due to inflation or deflation, as well as new developments in technology, applicable laws or regulations.
Under CPS Energy’s reserve program, all claims are recorded against the reserve, which is a component of operating reserves presented on the preceding tables describing Other Liabilities.
FY2020andFY2019ReserveRollforward (In thousands)
Employee Property Property& Public Reserves Reserves
Liability Claims (Insurance) (Environmental) Total
Balance – FY 2018 20,817$ -$ 8,608$ 29,425$ Payments (6,383) - - (6,383) Other claims adjustments 6,369 - 2,915 9,284
Balance – FY 2019 20,803 - 11,523 32,326 Payments (3,083) - - (3,083) Other claims adjustments (1,781) 8,500 329 7,048
Balance – FY 2020 15,939$ 8,500$ 11,852$ 36,291$

CPS Energy FY2020 Basic Financial Statements
Page 88
CounterpartyRisk – CPS Energy is exposed to counterparty risk associated with various transactions primarily related to debt, investments, fuel hedging, suppliers and wholesale power. Counterparty risk is the risk that a counterparty will fail to meet its obligations in accordance with the terms and conditions of its contract with CPS Energy. CPS Energy has policies and practices in place to ensure the solvency of counterparties is assessed accurately, monitored regularly and managed actively through its Enterprise Risk Management & Solutions Division.
12.OtherFinancialInstruments
Fuel Hedging – The 1999 Texas utility deregulation legislation, Senate Bill 7, contains provisions modifying the PFIA to allow municipal utilities the ability to purchase and sell energy-related derivative instruments in order to hedge or mitigate the effect of market price fluctuations of natural gas, fuel oil and electric energy. In 2002, CPS Energy began hedging its exposure to changes in natural gas prices, with the goal of controlling fuel costs to native load customers and stabilizing the expected cash flows associated with wholesale power transactions.
CPS Energy reports its derivative instruments in accordance with GASB Statement No. 53, AccountingandFinancial Reporting for Derivative Instruments, which addresses recognition, measurement and disclosures related to derivative instruments. CPS Energy does not use derivative instruments for speculative purposes. The only derivative instruments entered are for the purposes of risk mitigation; therefore, these instruments are considered potential hedging derivative instruments under GASB Statement No. 53.
On October 28, 2019, the Board reaffirmed the Energy Price Risk Management Policy, which sets forth the guidelines for the purchase and sale of certain financial instruments and certain physical products, collectively defined as hedge instruments. The essential goal of the Energy Price Risk Management Policy is to provide a framework for the operation of a fuel and energy price hedging program to better manage CPS Energy’s risk exposure in order to stabilize pricing and costs for the benefit of CPS Energy and its customers.
In accordance with the requirements of GASB Statement No. 53, all fuel hedges are reported on the Statements of Net Position at fair value. The fair value of option contracts is determined using a Black Scholes pricing model based on the New York Mercantile Exchange (“NYMEX”) closing futures prices as of the last day of the reporting period. For fixed-price contracts, the fair value is calculated by deriving the difference between the closing futures prices on the last day of the reporting period and the futures or basis swap purchase prices at the time the positions were established. See additional disclosures regarding fuel hedge fair values at Note 3 – Fair Value Measurement.
As of January 31, 2020, the total fair value of outstanding hedge instruments was a net liability of $32.1 million. Fuel hedging instruments with a fair value of $1.0 million and $(25.5) million are classified on the Statements of Net Position as a component of current assets and current accounts payable and accrued liabilities, respectively. Long-term fuel hedging instruments with a fair value of $2.0 million and $(9.6) million are classified as a component of other noncurrent assets and other noncurrent liabilities, respectively.
As of January 31, 2019, the total fair value of outstanding hedge instruments was a net liability of $1.6 million. Fuel hedging instruments with a fair value of $1.7 million and $(1.7) million are classified on the Statements of Net Position as a component of current assets and current accounts payable and accrued liabilities, respectively. Long-term fuel hedging instruments with a fair value of $1.3 million and $(2.9) million are classified as a component of other noncurrent assets and other noncurrent liabilities, respectively.

CPS Energy FY2020 Basic Financial Statements
. Page 89
All hedging derivative instruments were evaluated for effectiveness at January 31, 2020 and 2019. Consistent with hedge accounting treatment required for derivative instruments that are determined to be effective in offsetting changes in the cash flows of the hedged item, changes in fair value are reported as deferred outflows or deferred inflows of resources on the statements of net position until the contract expiration that occurs in conjunction with the hedged expected fuel purchase transaction. When fuel hedging contracts expire, at the time the purchase transactions occur, the deferred balance is recorded as an adjustment to fuel expense. The deferred outflows of resources related to fuel hedges totaled $33.6 million and $4.6 million at January 31, 2020 and 2019, respectively. There were no deferred inflows of resources related to fuel hedges at January 31, 2020. The deferred inflows of resources related to fuel hedges totaled $0.3 million at January 31, 2019.
In FY2020, as a result of revisions to the expected volumes of some underlying physical transactions, it was determined that a group of existing financial hedge positions were no longer effective. Offsetting financial positions were executed, and fair value of the ineffective hedges resulted in a loss totaling $0.3 million, which was recognized as a reduction to investment income.
Following is information related to CPS Energy’s outstanding fuel hedging derivative instruments:
FuelDerivativeTransactionsasofJanuary31,2020 (Dollars in thousands)
FuelDerivativeTransactionsasofJanuary31,2019 (Dollars in thousands)
In the event purchased options are allowed to expire, the related premiums paid to acquire those options will be lost. When a short position is established, and options are sold, premiums are received and an
Referenced Index
Volumes (MMBtu) Fair Value
FY2020Change in Fair Value
Long Natural Gas Swap Henry Hub Feb 2020 through Feb 2023 39,242,075 (15,386)$ (13,231)$ Short Natural Gas Swap Henry Hub Feb 2020 through Dec 2022 2,893,913 1,385 1,200 Long Natural Gas Call Option Henry Hub Feb 2020 through Jan 2023 30,584,576 1,615 1,657 Short Natural Gas Call Option Henry Hub Apr 2020 through Mar 2021 440,914 (1) (1) Short Natural Gas Put Option Henry Hub Feb 2020 through Jan 2023 30,584,576 (4,464) (4,278) Long HSC Basis Swap Henry Hub Feb 2020 through Feb 2023 21,878,324 (561) (1,280) Short HSC Basis Swap Henry Hub Feb 2020 through Dec 2022 753,913 (27) 80 Long HSC Gas Daily Swap Henry Hub Feb 2020 4,495 - 27 Long WAHA Basis Swap Henry Hub Feb 2020 through Jan 2023 25,487,722 (14,636) (14,033) Short WAHA Basis Swap Henry Hub Apr 2020 402,977 (40) (40) Long WAHA Gas Daily Swap Henry Hub Feb 2020 901,871 34 48
(32,081)$ (29,851)$
Type of Transaction Duration
Referenced Index
Volumes (MMBtu) Fair Value
FY2019Change inFair Value
Long Natural Gas Swap Henry Hub Feb 2019 through Dec 2022 26,702,285 (2,155)$ (1,937)$ Short Natural Gas Swap Henry Hub Feb 2019 through Dec 2022 3,279,023 185 363 Long Natural Gas Call Option Henry Hub Feb 2019 through Jan 2022 30,961,179 1,253 (2,532) Short Natural Gas Call Option Henry Hub Jan 2020 1,000 - 2 Long Natural Gas Put Option Henry Hub Jan 2020 1,000 - (1) Short Natural Gas Put Option Henry Hub Feb 2019 through Jan 2022 30,961,179 (815) 1,892 Long HSC Basis Swap Henry Hub Feb 2019 through Dec 2022 24,808,285 719 2,625 Short HSC Basis Swap Henry Hub Feb 2019 through Dec 2022 1,009,023 (107) (165) Long HSC Gas Daily Swap Henry Hub Feb 2019 784,000 (27) - Long WAHA Basis Swap Henry Hub Mar 2019 through Jan 2022 23,506,317 (603) (502) Long WAHA Gas Daily Swap Henry Hub Feb 2019 378,000 (14) 4
(1,564)$ (251)$
Type of Transaction Duration

CPS Energy FY2020 Basic Financial Statements
Page 90
obligation to honor the terms of the option contract, if exercised, is created. The decision to exercise the options or let them expire rests with the purchasing party.
Futures contracts represent a firm obligation to buy or sell the underlying asset. If held to expiration, the contract holder must take delivery of, or deliver, the underlying asset at the established contract price. Basis swap contracts represent a financial obligation to buy or sell the underlying delivery point basis. If held to expiration, the financial difference determined by mark-to-market valuation must be settled on a cash basis. Only if expressly requested in advance, may an exchange for physical assets take place.
Credit Risk – CPS Energy executes over-the-counter hedge transactions directly with approved counterparties. These counterparties are generally highly rated entities that are leaders in their respective industries. CPS Energy monitors the creditworthiness of these entities on a daily basis and manages the resulting financial exposure via a third-party, vertically integrated risk system. Contractual terms with each existing counterparty vary, but each is structured so that, should the counterparty’s credit rating fall below investment grade, no unsecured credit would be granted, and the counterparty would be required to post collateral for any calculated credit exposure. In the event of default or nonperformance by counterparties, brokers or NYMEX, the operations of CPS Energy could be materially affected. However, CPS Energy does not expect these entities to fail to meet their obligations given the level of their credit ratings and the monitoring procedures in place with which to manage this risk. As of January 31, 2020, the exposure to all hedge-related counterparties was such that no material counterparty credit risk existed.
TerminationRisk – For CPS Energy’s fuel hedges that are executed over the counter directly with approved counterparties, the possibility exists that one or more of these derivative instruments may end earlier than expected, thereby depriving CPS Energy of the protection from the underlying risk that was being hedged or potentially requiring CPS Energy to make a significant termination payment. This termination payment between CPS Energy and its counterparty is determined based on current market prices. In the event a transaction is terminated early, CPS Energy would likely be able to replace the transaction at current market prices with similar, although not exact, terms with one of its other approved counterparties.
BasisRisk – The Company is exposed to basis risk on its fuel hedges because the expected commodity purchases being hedged will be priced based on a pricing point (Houston Ship Channel “HSC” or Western Area Hub Association “WAHA”) different than which the contracts are expected to settle (Henry Hub). For January 2020, the HSC price was $2.06 per MMBtu, the WAHA price was $1.09 per MMBtu and the Henry Hub price was $2.16 per MMBtu.
Congestion Revenue Rights – In the normal course of business, CPS Energy acquires Preassigned Congestion Revenue Rights (“PCRRs”) and Congestion Revenue Rights (“CRRs”) as a hedge against congestion costs. The CRRs are purchased at semi-annual and monthly auctions at market value. Non-Opt-In Entities are granted the right to purchase PCRRs annually at a percentage of the cost of CRRs. While PCRRs exhibit the three characteristics of derivatives as defined in GASB Statement No. 53, they are generally used by CPS Energy as factors in the cost of transmission. Therefore, these PCRRs meet the normal purchases and sales scope exception and are thus reported on the Statements of Net Position at cost and classified as prepayments. From time to time, the Company purchases PCRRs and sells them at the same auction at market price. In this case, the PCRRs are considered investments and the proceeds are reported as either investment gains or losses. There were no investment gains or losses on the sale of PCRRs and CRRs for FY2020 and FY2019.

CPS Energy FY2020 Basic Financial Statements
. Page 91
13.SouthTexasProject
Units1and2 – CPS Energy is one of three participant owners of STP, a two-unit nuclear power plant with each unit having a nominal output of approximately 1,330 MW. The other owners in STP Units 1 and 2 are NRG and the City of Austin. The units, along with their support facilities and administrative offices, are located on a 12,220-acre site in Matagorda County, Texas. In-service dates for STP were August 1988 for Unit 1 and June 1989 for Unit 2. CPS Energy’s 40% ownership in STP Units 1 and 2 represents approximately 1,064 MW of total plant capacity.
Effective November 17, 1997, the Participation Agreement among the owners of STP was amended and restated. At that time, STPNOC, a Texas nonprofit, nonmember corporation created by the owners, assumed responsibility as the licensed operator of STP. The participants share costs in proportion to ownership interests, including all liabilities and expenses of STPNOC. STPNOC is financed and controlled by the owners pursuant to an operating agreement among the owners and STPNOC. Currently, a four-member board of directors governs STPNOC, with each owner appointing one member to serve with STPNOC’s chief executive officer.
Units1and2LicensesRenewed– In September 2017, the NRC approved STPNOC’s license renewal applications for STP Units 1 and 2, which extends the operating licenses to 2047 and 2048, respectively.
SuspensionofUsedNuclearFuelFee – Under the Nuclear Waste Policy Act ("NWPA"), the DOE has an obligation to provide for the permanent disposal of high-level radioactive waste, which includes used nuclear fuel at U.S. commercial nuclear power plants such as STP. To fund that obligation, all owners or operators of commercial nuclear power plants entered into a standard contract under which the owners paid a fee to the DOE based on the amount of electricity generated and sold from the power plant, along with additional assessments. In exchange for collecting this fee and the assessments, the DOE undertook the obligation to develop a high-level waste repository for safe, long-term storage of the fuel and, no later than January 31, 1998, to transport and dispose of the used fuel. The NARUC challenged further collection of this fee; and on November 19, 2013, the Court ruled in favor of NARUC and ordered the DOE to submit to the U.S. Congress a proposal to reduce the fee to zero until certain conditions are met. While the reporting to the DOE of used nuclear fuel volumes will continue, effective May 16, 2014, the rate was reduced to zero.
DOESettlement and DryCaskStorageProject("ISFSI" or the "Dry Cask Storage Project") – Multiple cases have been filed in the U.S. Court of Federal Claims by the existing owners or operators of nuclear facilities against the DOE related to its failure to meet its obligations under the NWPA. The owners/operators were seeking damages related to ongoing used nuclear fuel storage costs incurred because the DOE did not meet its obligation. On August 31, 2000, in MaineYankeeAtomicPowerCompany,etal.v.UnitedStates, the U.S. Court of Appeals for the Federal Circuit affirmed that the DOE had breached its obligations to commercial nuclear power plant owners for failing to live up to its obligations to dispose of used nuclear fuel. STPNOC, on behalf of the owners of STP, and other utilities have reached settlement agreements with the DOE. In the most recent settlement agreement dated March 15, 2017, the DOE extended its commitment to reimburse STP for allowable spent fuel management expenditures through calendar year 2019. STP is currently working with the DOE to extend the settlement agreement for another three years. Pursuant to STPNOC’s analysis of NRC guidance, the first dry cask storage campaign was recently completed, with 12 dry casks now stored at the ISFSI.
Ongoing costs for the spent fuel management project are being funded by the STP owners as expenditures are incurred. CPS Energy is entitled to request reimbursement at its discretion from its Decommissioning Trusts for the Company’s portion of allowable costs. Annually, STPNOC submits claims to the DOE for the reimbursement of allowable costs for spent fuel management. Allowable costs are returned to the owners by STP to the owners upon receipt of funds from the DOE. Qualifying spent fuel management costs not
CPS Energy FY2020 Basic Financial Statements
Page 92
reimbursable by the DOE are funded by the Trusts. Any costs not reimbursable by the DOE or the Trusts are recorded as an O&M expense or capital costs.
TexasCommissiononEnvironmentalQuality(“TCEQ”)Violations– On January 11, 2018, STPNOC received a draft notice of enforcement letter from the TCEQ for three violations, which all occurred in 2016. The violations were identified and reported by STPNOC to TCEQ and are related to STP’s air quality permit. These deviations were included in STP’s 2017 semi-annual report submitted to the TCEQ in February 2017. On February 15, 2018, the TCEQ transmitted a proposed agreed order assessing a nominal administrative penalty regarding the Notice of Enforcement issued on January 11, 2018, for late reporting of the air quality permit deviation in 2016. The order acknowledges that STP submitted the report in February 2017 and did not require any additional corrective action. On June 26, 2018, the TCEQ issued a letter approving closure of the enforcement action received in January 2018 related to an air quality permit violation that occurred in 2016. The TCEQ acknowledged that corrective action was complete, and the administrative penalty had been paid. No further action is required.
Units3and4Development– In September 2007, NRG and CPS Energy signed the South Texas Project Supplemental Agreement (“Supplemental Agreement”) under which CPS Energy elected to participate in the development of two new nuclear units at the STP site, STP Units 3 and 4, pursuant to the terms of the participation agreement among the STP owners and agreed to potentially own up to 50% of STP Units 3 and 4. Also in September 2007, STPNOC, on behalf of CPS Energy and NRG, filed with the NRC a combined construction and operating license application (“COLA”) to build and operate STP Units 3 and 4. This COLA was the first complete application for new commercial nuclear units to be filed with the NRC in nearly 30 years. On November 29, 2007, the NRC announced it had accepted the COLA for review. Despite the project having secured the NRC's authorization for issuance of the construction and operating license (“COL”), in January 2016 the Company concluded that, as a result of sustained changes in a number of environmental and economic factors directly affecting the projected economic feasibility of completing construction of STP Units 3 and 4, the project had experienced a permanent impairment. The Company determined it was appropriate to write off the entire $391.4 million investment in STP Units 3 and 4. The impairment loss was reported as an extraordinary item on CPS Energy's Statements of Revenues, Expenses, and Changes in Net Position for the period ending January 31, 2016. In FY2019, a request to terminate the STP Units 3 and 4 COLs was submitted and approved by the NRC. Additionally, an Assignment Agreement and Mutual Release was executed with the owners of STP Units 1 and 2 and STP Units 3 and 4. This agreement returns ownership of the STP Units 3 and 4 assets, including rights for future expansion, to the STP Units 1 and 2 owners and essentially restores the site ownership arrangement to pre-2006 terms. See Note 5 – Capital Assets, Net for more information about CPS Energy’s capital investment in STP. NuclearInsurance – STP maintains required insurance coverage pursuant to the Price-Anderson Act, providing limitations on liability and governmental indemnities with respect to nuclear incidents. Pursuant to the Price-Anderson Act, effective November 1, 2018, the maximum amount that each licensee may be assessed following a nuclear incident at any insured facility is $138 million, taking into account a 5% adjustment for administrative fees and subject to adjustment for inflation every 5 years, for the number of operating nuclear units and for each licensed reactor, payable at $20 million per year per reactor for each nuclear incident. CPS Energy and each of the other participants of STP are subject to such assessments, which will be borne on the basis of their respective ownership interests. For purposes of these assessments, STP currently has two licensed reactors. The participants have purchased the maximum limits of nuclear liability insurance, as required by law, and have executed indemnification

CPS Energy FY2020 Basic Financial Statements
. Page 93
agreements with the NRC in accordance with the financial protection requirements of the Price-Anderson Act. A nuclear liability policy, with a maximum limit of $450 million for the nuclear industry, provides protection from nuclear-related claims. A Master Worker Certificate policy, also with a maximum limit of $450 million for the nuclear industry, provides protection from radiation tort claims of workers at nuclear facilities.
NRC regulations require licensees of nuclear power plants to obtain on-site property damage insurance in a minimum amount of approximately $1.1 billion. NRC regulations also require that the proceeds from this insurance be used first to ensure that the licensed reactor is in a safe and stable condition so as to prevent any significant risk to the public health or safety, and then to complete any decontamination operations that may be ordered by the NRC. Any funds remaining would then be available for covering direct losses to property.
The owners of STP Units 1 and 2 currently maintain nuclear property insurance at or above the legally required amount. The nuclear property insurance consists of primary property damage insurance and excess property damage insurance, both subject to a retrospective assessment being paid by all members of Nuclear Electric Insurance Limited (“NEIL”). A retrospective assessment could occur if property losses, as a result of an accident at any nuclear plant insured by NEIL, exceed the accumulated funds available to NEIL. CPS Energy also maintains accidental outage insurance through STP’s NEIL membership that provides weekly indemnity payments for an insured property loss subject to an applied deductible period.
NuclearDecommissioning – In 1991, CPS Energy started accumulating funds for decommissioning of its 28% ownership in STP Units 1 and 2 in an external trust in accordance with NRC regulations. The 28% Decommissioning Trust’s assets and related liabilities are included in CPS Energy’s financial statements as a component unit. Excess or deficient funds related to the 28% Trust will be distributed to or received from CPS Energy’s ratepayers after decommissioning is complete.
In conjunction with the acquisition of the additional 12% interest in STP Units 1 and 2 in May 2005, the Company also assumed control of a relative portion of the decommissioning trust previously established by the prior owner, American Electric Power (“AEP”). The 12% Decommissioning Trust’s assets and related liabilities are also included in CPS Energy’s financial statements as a component unit. Subject to PUCT approval as may be requested in the future, excess or deficient funds related to the 12% Trust will be distributed to or received from AEP’s ratepayers after decommissioning is complete.
CPS Energy, together with the other owners of STP Units 1 and 2, files a certificate of financial assurance with the NRC for the decommissioning of the nuclear power plant every two years or upon transfer of ownership. The certificate assures that CPS Energy and the other owners meet the minimum decommissioning funding requirements mandated by the NRC. The owners agreed in the financial assurance plan that their estimate of decommissioning costs would be reviewed and updated periodically.
In FY2009, CPS Energy determined that some pre-shutdown decommissioning and spent fuel management activities would be required prior to shutdown of STP Units 1 and 2. As a result, separate trust accounts were created to pay for pre-shutdown decommissioning activities. Additionally, funds in the Trusts applicable to spent fuel management were transferred to separate spent fuel management accounts so that they were not commingled with funds allocable to pre-shutdown or post-shutdown decommissioning costs. Based on projected costs, the spent fuel management accounts are currently fully funded; therefore, no contributions were made to these accounts in FY2020 or FY2019. In FY2020 and FY2019, no contributions were made to fund pre-shutdown decommissioning costs for CPS Energy’s 28% ownership in STP. No pre-shutdown decommissioning expenses were incurred for the 28% ownership in calendar years 2019 or 2018. For the 12% Trust, pre-shutdown costs were funded by AEP’s ratepayers. The 12% Trust incurred no pre-shutdown decommissioning expenses in the calendar years 2019 or 2018.
CPS Energy FY2020 Basic Financial Statements
Page 94
The most recent cost study, which was finalized in May 2018, estimated decommissioning costs for the 28% ownership in STP Units 1 and 2 at $694.1 million and $297.5 million for the 12% ownership in STP Units 1 and 2 in 2018 dollars. Included in the cost study was a 10% contingency component as required to comply with the PUCT. Based on the level of funds accumulated in the 28% Trust and an analysis of this cost study, the Company determined that no further decommissioning contributions would be required to be deposited into the Trust.
As of December 31, 2019, and 2018, CPS Energy had accumulated $473.0 million and $414.8 million, respectively, in the 28% Trust. Total funds are allocated to decommissioning costs, pre-shutdown decommissioning costs, spent fuel management and site restoration. Based on the most recent annual calculation of financial assurance required by the NRC as of December 31, 2018, the 28% Trust funds allocated to decommissioning costs totaled $264.1 million, which exceeded the calculated financial assurance amount of $111.2 million.
As of December 31, 2019, and 2018, $173.4 million and $152.9 million, respectively, had been accumulated in the 12% Trust. Total funds are allocated to decommissioning costs, pre-shutdown decommissioning costs, spent fuel management and site restoration. Based on the most recent annual calculation of financial assurance required by the NRC as of December 31, 2018, the 12% Trust funds allocated to decommissioning costs totaled $105.5 million, which exceeded the calculated financial assurance amount of $47.7 million.
CPS Energy adopted GASB Statement No. 83 during FY2019 and accounts for decommissioning by recognizing its pro rata share of an ARO based on the best estimate of the current values of outlays expected to be incurred, determined by the most recent cost study. A new cost study is performed every 5 years; in years subsequent to the latest study, the Statement requires the current value of the Company’s ARO be adjusted for the effects of inflation or deflation, at least annually. In addition to the ARO, the Company has recorded a deferred outflow of resources that is being amortized over the remaining useful life of the plant. Restatement for the ARO resulted in a change in the calculation of decommissioning expense reflected in the Statements of Revenues, Expenses and Changes in Net Position, which is now based on the amortization of the deferred outflow.
Both Decommissioning Trusts also have separate calendar year financial statements, which are separately audited and can be obtained by contacting the Controller at CPS Energy.
STPPensionPlansandOtherPost‐RetirementBenefits – STPNOC maintains several pension and other post-retirement benefit plans covering most employees, including a noncontributory defined-benefit pension plan, defined-benefit post-retirement plan, supplementary nonqualified unfunded pension plan, supplemental retirement plan, deferred compensation program and a contributory savings plan. The owners of STPNOC, including CPS Energy, although not sponsors to the STPNOC plans, share in all plan costs in the same proportion as their respective ownership percentages.
The noncontributory defined-benefit pension plan covers certain employees. Effective January 1, 2007, STPNOC approved a change to the pension plan to preclude the eligibility of employees hired after December 31, 2006, in the plan. Employees hired after this date receive enhanced matching contributions under the STP Nuclear Operating Company Savings Plan.
On June 4, 2019, STP’s Board of Directors approved freezing the Retirement Plan for non-bargaining participants, effective December 31, 2021.
STPNOC also maintains a defined-benefit postretirement plan that provides postretirement health and welfare benefits. As of May 1, 2014, certain STPNOC employees voted to transition STPNOC’s medical plan to a Taft-Hartley multi-employer health and welfare plan. During calendar 2018, there were

CPS Energy FY2020 Basic Financial Statements
. Page 95
additional plan design changes related to the STPNOC postretirement health and welfare benefits resulting in additional employees transitioning to the Taft-Hartley multi-employer plan, therefore, reducing STPNOC’s OPEB liability as of December 31, 2018. STPNOC pays monthly premiums for the benefits, to be partially funded by participating employees.
Employees whose eligible compensation exceeds the limitations established under the 1974 Employee Retirement Income Security Act, $280 thousand for calendar 2019 and $275 thousand for calendar 2018, are covered by a supplementary nonqualified, unfunded pension plan, which is provided for by charges to operations sufficient to meet the projected benefit obligations. The accruals for the costs of that plan are based on substantially the same actuarial methods and economics as the noncontributory defined-benefit pension plan.
An unfunded supplemental retirement plan and other unfunded deferred compensation programs are maintained by STPNOC for certain key individuals.
The effect to CPS Energy of funding obligations related to the defined-benefit plans sponsored by STPNOC was $18.7 million and $8.1 million for FY2020 and FY2019, respectively, and was reflected as a decrease in Other Changes in Net Position on the Statements of Revenues, Expenses and Changes in Net Position.
14.CommitmentsandContingencies
Purchase and construction commitments were approximately $6,412.3 million at January 31, 2020. This amount includes construction commitments, provisions for coal purchases through December 2021 and natural gas purchases through June 2027; the actual amount to be paid will depend upon CPS Energy’s actual requirements during the contract period and the price of gas. Also included are provisions for wind power through 2038, solar power through 2044, landfill power through 2029, and raw uranium associated with STP fabrication and conversion services needed for refueling through 2026.
On January 20, 2009, the Board approved a policy statement affirming that CPS Energy’s strategic direction centers on transforming from a company focused on providing low-cost power from traditional generation sources to a company providing competitively priced power from a variety of sources, including low and noncarbon emitting sources. As a community owned provider and as part of our FlexiblePath strategy, CPS Energy has a balanced approach of leveraging our community-owned assets with the emergence of new technology. Our strategy is focused around energy considerations of security, safety, resiliency, reliability, environment, and customer affordability. To be sustainable, CPS Energy needs to balance its financial viability, environmental commitments and social responsibility as a community-owned provider.
In FY2008, CPS Energy entered into a Natural Gas Supply Agreement with the SA Energy Acquisition Public Facility Corporation (“PFC”), a component unit of the City, to purchase, to the extent of its gas utility requirements, all-natural gas to be delivered under a Prepaid Natural Gas Sales Agreement. Under the Prepaid Natural Gas Sales Agreement between the PFC and a third-party gas supplier, the PFC prepaid the cost of a specified supply of natural gas to be delivered over 20 years.
In FY2003, CPS Energy entered into a 20-year agreement with Brooks Development Authority (“BDA”) to upgrade the electric and gas utility systems located within Brooks City-Base. CPS Energy and BDA each committed to invest $6.3 million ($4.2 million in year 2002 dollars, which accumulates interest at the rate of 3.7% compounded annually) to upgrade the infrastructure at that location. Annual reductions to BDA’s obligation were made from incremental revenues to the City for electric and gas sales to customers that reside on the BDA-developed property. Annual reductions to BDA’s obligation were also made in accordance with contract terms for economic development at Brooks City-Base that benefited CPS Energy’s Systems. At January 31, 2020, capital renewals and upgrades of $14.7 million have

CPS Energy FY2020 Basic Financial Statements
Page 96
surpassed the $12.6 million commitment. BDA has met its obligation, net of annual interest, of $4.2 million.
In September 2010, CPS Energy and the University of Texas at San Antonio (“UTSA”) entered into an agreement (“Strategic Alliance”) whereby UTSA agreed to perform services for CPS Energy in support of its function as a provider of electric and gas utility services while supporting the progress of the City of San Antonio in renewable energy technologies and energy research. The Strategic Alliance calls for CPS Energy to invest up to but not exceeding $50 million over 10 years. Investment committed through January 31, 2020, was approximately $9.8 million from funds currently allocated to research and development. Future funding will be determined by the scope of the projects defined by the partnership and is subject to annual approval by the CPS Energy Board of Trustees. Projects will be designed to produce clear value to CPS Energy and its customers.
CPS Energy sells excess power into the wholesale market with a balanced portfolio that includes a mix of short-term (less than a month) and mid-term (one month to a year) transactions with market participants and long-term (one to five years) and super long-term (5 years or more) wholesale power agreements with other public power entities and cities. In addition to a long-standing wholesale power relationship with the city of Floresville, the Company currently has agreements to provide either full or partial requirements to six other public power entities. These agreements have varying terms expiring between December 2021 and December 2025. The volumes committed under these agreements represent approximately 5% of current capacity. The Company regularly monitors the market values of these transactions to manage contract provisions with the counterparties.
On June 20, 2011, CPS Energy announced its New Energy Economy initiative. The program is designed to focus on more clean energy sources rather than traditional energy sources and includes several major initiatives to which the Company has committed:
CPS Energy offers customers the opportunity to better manage their home’s energy use through the Wi-Fi Thermostat Rewards program. The program gives customers access to a wide choice of programmable thermostat options. Customers benefit from better control of their home’s air conditioning use and the visibility to program settings from their mobile devices. Customers in Wi-Fi Thermostat Rewards can choose to have a CPS Energy contractor install a free programmable thermostat in their place of residence. Alternatively, they can purchase and self-install their own thermostat from a list of qualifying devices and receive a rebate from CPS Energy. In exchange for the rebate, customers allow CPS Energy to periodically control and interrupt service to manage peak energy periods. The program is funded through STEP. As of January 31, 2020, there were 154,364 CPS Energy customers enrolled in Wi-Fi Thermostat Rewards.
The Company completed the replacement of approximately 23,500 high pressure sodium vapor
streetlights with 250-Watt equivalent Light Emitting Diode (“LED”) streetlights for the City. The streetlights use 60% less energy than standard sodium lights and are designed to last 12 to 15 years, thereby reducing maintenance costs. Approximately $2.2 million of the deployment costs were funded through STEP, with the remainder being funded by the City. The installation of an additional 1,500 LED streetlights is currently on hold pending direction from the City on lighting for the downtown area.
The City also requested the replacement of 30,000 residential streetlights with 100-Watt equivalent LED streetlights. The Company began this project in City Districts 2 and 5 where a total of 5,100 replacement LED lights were installed in FY2017. A total of 4,275 were installed in FY2018. This project has been placed on hold at the request of the City until further notice. At

CPS Energy FY2020 Basic Financial Statements
. Page 97
this time, any new lights installed or replaced are done so on an exception basis upon request by the City.
LED street lights have become the standard for ongoing city-wide streetlight maintenance. As older sodium lights fail, they will be replaced with LED equivalents.
In November 2011, the Company entered into a $77.0 million prepaid agreement for purchased power equal to approximately 60% of the anticipated output from 30 MW of solar energy facilities in the San Antonio area. The unamortized balance of the prepayment was $53.7 million and $56.8 million at January 31, 2020, and 2019, respectively. The agreement expires in 2037, and the purchase of the balance of the output is on a pay-as-you-go basis.
In July 2012, CPS Energy executed a Master Agreement with OCI Solar Power (“OCI”) for approximately 400 MW from seven facilities. All seven facilities became operational by the end of 2017. In March 2017, CPS Energy and OCI executed an Amended and Restated Master Power Purchase and Economic Development Agreement. The original Master Agreement was replaced in order to simplify the agreement and reflect pertinent terms going forward. In addition, CPS Energy also executed two separate 25-year Purchase Power Agreements for Project Pearl and Project Ivory for 50 MW each.
The table below represents a total capacity of approximately 500 MW for all solar farm facilities included in 25-year power purchase agreements mentioned above:
Simply Solar is the trademarked name for CPS Energy’s pilot solar initiatives – Roofless Solar and
SolarHostSA. Roofless Solar is being offered by CPS Energy in partnership with Clean Energy Collective (“CEC”). CEC built and maintains a 1 MW community solar farm in the CPS Energy service territory and sold 107.5-Watt panels in the array to customers who wanted to enjoy the benefits of solar power without having to install their own system. On June 18, 2015, CPS Energy entered into an agreement to purchase the output from the solar farm for 25 years. On December 17, 2018, CPS Energy entered into a 25-year agreement with Big Sun SA 1 (“Big Sun”) to expand the Roofless Solar program by an additional 5 MW. Big Sun will be installing community solar panels on carports at commercial businesses across San Antonio. The panels will be sold to customers who will receive bill credits from CPS Energy for their share of the solar production. For the SolarHostSA program, CPS Energy partnered with PowerFin Partners to install up to 5 MW of rooftop systems on customer homes and businesses. The program provides participating customers a monthly credit for hosting the systems on their rooftops. The program makes solar accessible to more customers by eliminating the significant upfront cost of traditional rooftop systems. On August 12, 2015, CPS Energy entered into an agreement to purchase the output from the rooftop systems for an initial term of 20 years.
Facility CapacityinMWAchievedCommercial
OperationsAlamo 1 40.7 December 2013St. Hedwig (Alamo 2) 4.4 March 2014Walzem (Alamo 3) 5.5 January 2015Eclipse (Alamo 4) 39.6 August 2014Helios (Alamo 5) 95.0 December 2015Sirius 1 (Alamo 6) 110.2 March 2017Solara (Alamo 7) 106.4 September 2016Sirius 2 (Pearl) 50.0 October 2017Lamesa 2 (Ivory) 50.0 December 2018 Total 25-year power purchase capacity 501.8

CPS Energy FY2020 Basic Financial Statements
Page 98
In June 2017, the Company awarded a construction contract to renovate the new corporate headquarters to Sundt Construction. The Board approved a guaranteed maximum price of $145 million. CPS Energy also made provisions for a $5 million contingency fund which may be used to fund additional requirements related to the headquarters project. The Company expects to move its employees into the renovated headquarters during the fourth quarter of calendar year 2020.
In FY2018, CPS Energy entered into a 50-year Utilities Privatization Contract (“Contract”) with the Defense Logistics Agency to operate and maintain the natural gas and the electric utility systems at three JBSA installations: JBSA Randolph, JBSA Lackland and JBSA Lackland Training Annex. On July 1, 2019, CPS Energy and the Department of Defense (“DOD”) executed the Bill of Sale for the systems covered by the Contract, valued at $87.1 million and, in doing so, the DOD transferred ownership of these systems to CPS Energy. The DOD will reimburse CPS Energy for the costs to operate, maintain and upgrade these systems throughout the contract term.
15.Leases
CapitalLeases
CPS Energy was not a contracted party to any capital leases during FY2020 or FY2019, either as a lessee or lessor.
OperatingLeases
LeasesRelatedtoCommunicationTowersSale – In FY2014, the Company entered into an agreement to sell 69 of its communication towers to an independent third party. Title to 62 of the towers was conveyed to the purchaser in January 2014. Resolution of easement issues related to the remaining sites was concluded in early FY2017, resulting in the transfer of title to the purchaser for five additional towers for a total of 67 towers. CPS Energy retained title to the remaining two towers. Additionally, new licensing agreements were entered into between CPS Energy and the purchaser for CPS Energy’s ongoing use of the towers and the purchaser’s use of CPS Energy’s communication buildings for a period of 40 years, with three five-year options by the purchaser to extend the agreement. See Note 5 – Capital Assets, Net for additional information related to the sale.
In accordance with lease guidance provided in GASB Statement No. 62, leases related to the communication towers sale, both with CPS Energy as lessor and as lessee, have been classified as operating leases. Future minimum lease payment information provided in this footnote includes lease revenue and lease expense to be recognized as a result of the following lease components of the communication towers sale:
LeaseofTowerSpaceforCPSEnergyCommunicationEquipment – The parties to the sale transaction agreed that no cash would be paid by CPS Energy for the space it leased on the communication towers for the 40-year term of the lease agreement. As a result, the total sale transaction proceeds received from the purchaser were reduced by an amount representing an advance payment to the purchaser of the net present value of the estimated total lease obligation. This value represents a prepaid lease expense to the Company, benefitting a period of time equal to the 40-year term of the leases. In accordance with GASB Statement No. 62, the value of this prepaid lease obligation for space on the 67 towers was recorded at fair value and totaled $20.2 million, which is being amortized to lease expense over the 40-year term.
LeaseofCommunicationBuildingSpace – The parties agreed that no cash would be paid by the purchaser for the space it leased in CPS Energy’s communication buildings for the term of the
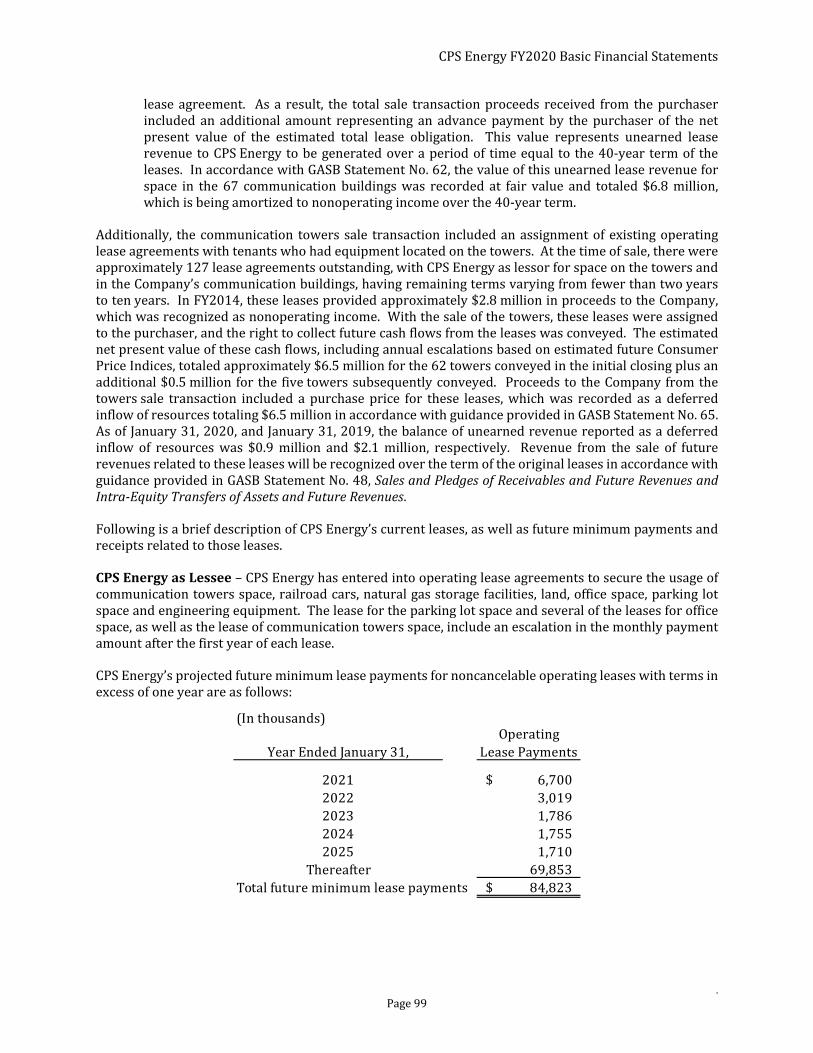
CPS Energy FY2020 Basic Financial Statements
. Page 99
lease agreement. As a result, the total sale transaction proceeds received from the purchaser included an additional amount representing an advance payment by the purchaser of the net present value of the estimated total lease obligation. This value represents unearned lease revenue to CPS Energy to be generated over a period of time equal to the 40-year term of the leases. In accordance with GASB Statement No. 62, the value of this unearned lease revenue for space in the 67 communication buildings was recorded at fair value and totaled $6.8 million, which is being amortized to nonoperating income over the 40-year term.
Additionally, the communication towers sale transaction included an assignment of existing operating lease agreements with tenants who had equipment located on the towers. At the time of sale, there were approximately 127 lease agreements outstanding, with CPS Energy as lessor for space on the towers and in the Company’s communication buildings, having remaining terms varying from fewer than two years to ten years. In FY2014, these leases provided approximately $2.8 million in proceeds to the Company, which was recognized as nonoperating income. With the sale of the towers, these leases were assigned to the purchaser, and the right to collect future cash flows from the leases was conveyed. The estimated net present value of these cash flows, including annual escalations based on estimated future Consumer Price Indices, totaled approximately $6.5 million for the 62 towers conveyed in the initial closing plus an additional $0.5 million for the five towers subsequently conveyed. Proceeds to the Company from the towers sale transaction included a purchase price for these leases, which was recorded as a deferred inflow of resources totaling $6.5 million in accordance with guidance provided in GASB Statement No. 65. As of January 31, 2020, and January 31, 2019, the balance of unearned revenue reported as a deferred inflow of resources was $0.9 million and $2.1 million, respectively. Revenue from the sale of future revenues related to these leases will be recognized over the term of the original leases in accordance with guidance provided in GASB Statement No. 48, SalesandPledgesofReceivablesandFutureRevenuesandIntra‐EquityTransfersofAssetsandFutureRevenues.
Following is a brief description of CPS Energy’s current leases, as well as future minimum payments and receipts related to those leases.
CPSEnergyasLessee – CPS Energy has entered into operating lease agreements to secure the usage of communication towers space, railroad cars, natural gas storage facilities, land, office space, parking lot space and engineering equipment. The lease for the parking lot space and several of the leases for office space, as well as the lease of communication towers space, include an escalation in the monthly payment amount after the first year of each lease.
CPS Energy’s projected future minimum lease payments for noncancelable operating leases with terms in excess of one year are as follows:
(In thousands)
Year Ended January 31,Operating
Lease Payments
2021 6,700$ 2022 3,019 2023 1,786 2024 1,755 2025 1,710
Thereafter 69,853 Total future minimum lease payments 84,823$
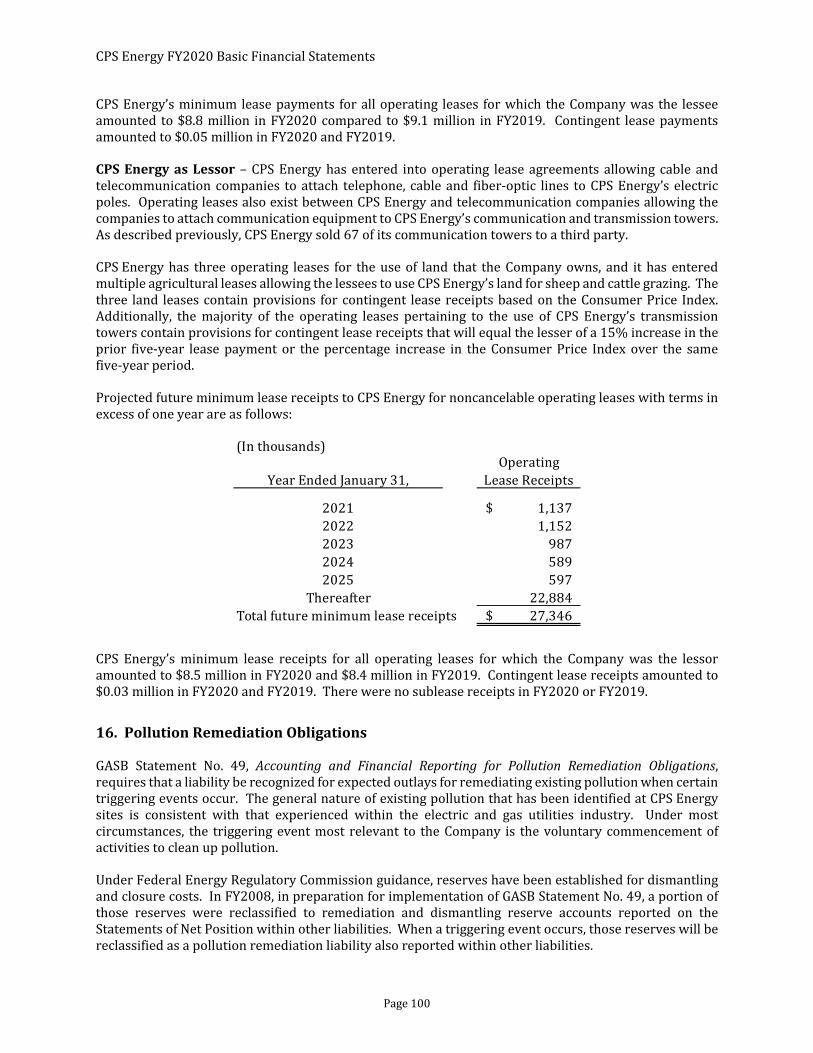
CPS Energy FY2020 Basic Financial Statements
Page 100
CPS Energy’s minimum lease payments for all operating leases for which the Company was the lessee amounted to $8.8 million in FY2020 compared to $9.1 million in FY2019. Contingent lease payments amounted to $0.05 million in FY2020 and FY2019.
CPSEnergyasLessor – CPS Energy has entered into operating lease agreements allowing cable and telecommunication companies to attach telephone, cable and fiber-optic lines to CPS Energy’s electric poles. Operating leases also exist between CPS Energy and telecommunication companies allowing the companies to attach communication equipment to CPS Energy’s communication and transmission towers. As described previously, CPS Energy sold 67 of its communication towers to a third party.
CPS Energy has three operating leases for the use of land that the Company owns, and it has entered multiple agricultural leases allowing the lessees to use CPS Energy’s land for sheep and cattle grazing. The three land leases contain provisions for contingent lease receipts based on the Consumer Price Index. Additionally, the majority of the operating leases pertaining to the use of CPS Energy’s transmission towers contain provisions for contingent lease receipts that will equal the lesser of a 15% increase in the prior five-year lease payment or the percentage increase in the Consumer Price Index over the same five-year period.
Projected future minimum lease receipts to CPS Energy for noncancelable operating leases with terms in excess of one year are as follows:
CPS Energy’s minimum lease receipts for all operating leases for which the Company was the lessor amounted to $8.5 million in FY2020 and $8.4 million in FY2019. Contingent lease receipts amounted to $0.03 million in FY2020 and FY2019. There were no sublease receipts in FY2020 or FY2019.
16.PollutionRemediationObligations
GASB Statement No. 49, Accounting and Financial Reporting for Pollution Remediation Obligations, requires that a liability be recognized for expected outlays for remediating existing pollution when certain triggering events occur. The general nature of existing pollution that has been identified at CPS Energy sites is consistent with that experienced within the electric and gas utilities industry. Under most circumstances, the triggering event most relevant to the Company is the voluntary commencement of activities to clean up pollution.
Under Federal Energy Regulatory Commission guidance, reserves have been established for dismantling and closure costs. In FY2008, in preparation for implementation of GASB Statement No. 49, a portion of those reserves were reclassified to remediation and dismantling reserve accounts reported on the Statements of Net Position within other liabilities. When a triggering event occurs, those reserves will be reclassified as a pollution remediation liability also reported within other liabilities.
(In thousands)
Year Ended January 31,Operating
Lease Receipts
2021 1,137$ 2022 1,152 2023 987 2024 589 2025 597
Thereafter 22,884 Total future minimum lease receipts 27,346$

CPS Energy FY2020 Basic Financial Statements
. Page 101
The pollution remediation liability was $3.7 million and $2.7 million as of January 31, 2020 and 2019, respectively. Costs were estimated using the expected cash flow technique prescribed under GASB Statement No. 49, utilizing information provided by the Company’s environmental staff and consultants.
CPS Energy adopted GASB Statement No. 83, CertainAssetRetirementObligations, in FY2019. Certain pollution remediation obligations presented and accounted for under GASB Statement No. 49 were not affected by implementation of GASB Statement No. 83.
17.AssetRetirementObligations(“ARO”)
CPS Energy adopted GASB Statement No. 83, CertainAssetRetirementObligations, during FY2019 and accounts for AROs by recognizing the obligations as a liability based on the best estimate of the current value of outlays expected to be incurred once the assets are retired. Asset retirement obligations recognized under GASB statement No. 83 were estimated utilizing information provided by the Company’s environmental and engineering staff, external consultants, and costs based on an external cost study for decommissioning.
The Statement requires the AROs be adjusted for the effects of inflation or deflation at least annually. In addition to the AROs, the Company has recorded associated deferred outflows of resources that are being amortized over the remaining useful life of the respective asset groups. The following asset groups have been included in the ARO reflected on the Statements of Net Position:
STPUnits1and2 – CPS Energy is one of three participants in STP, currently a two-unit nuclear power plant located in Matagorda County, Texas. The Code of Federal Regulations provides the main decommissioning requirements mandated by the Nuclear Regulatory Commission (“NRC”) that issues the operational license of the site. The asset retirement obligation is based on an external cost study performed every five years. The most recent study was finalized in May 2018 and estimates costs in 2018 dollars. The associated costs are being amortized utilizing a straight-line method over the estimated remaining useful lives of the units. Total asset lives for the units are 60 years based on the operating license extensions. The deferred outflows of resources are based on the estimated remaining useful life of the assets at the time of implementation. CPS Energy has established two decommissioning trusts that are reported as blended component units combined into the CPS Energy financial statements to cover the eventual decommissioning associated with STP Units 1 and 2. At January 31, 2020 and 2019, the ARO related to STP Units 1 and 2 was $1,016.6 million and $991.5 million, respectively.
Vaults – CPS Energy has approximately 200 underground vaults with useful lives of 46 years. The vaults have regulatory requirements to be met prior to removal and after retirement under the Code of Federal Regulations and the Texas Commission on Environmental Quality (“TCEQ”). Methods and assumptions to determine the associated liability were based on an internal calculation of cost per square foot of each tank which includes assessment, remediation, transportation and disposal costs. The associated costs are being amortized utilizing a straight-line method over the average estimated remaining useful life of the vaults. At January 31, 2020 and 2019, the ARO related to the vaults was $9.2 million.

CPS Energy FY2020 Basic Financial Statements
Page 102
FuelStorageTanks– CPS Energy has 14 underground fuel storage tanks with useful lives of 30 years. The storage tanks have regulatory requirements to be met for removal or permanent closure after retirement under the Texas Administrative Code. The methods and assumptions used to determine the liability associated with the tanks were based on a cost analysis performed by an outside engineering consulting firm in July 2018. The associated retirement costs are being amortized utilizing a straight-line method over the average estimated remaining useful life of the storage tanks. At January 31, 2020 and 2019, the ARO related to the storage tanks was $3.7 million.

CPS Energy FY2020 Basic Financial Statements
. Page 103
REQUIREDSUPPLEMENTARYINFORMATION(“RSI”) January31,2020and2019(Unaudited)
(Dollars in thousands)
2019 2018 2017 2016 2015 2014 2013 2012Total pension liability
Service cost 37,175$ 32,569$ 31,547$ 30,183$ 32,591$ 33,417$ 33,470$ 31,420$ Interest cost 137,954 132,861 128,991 122,800 117,802 116,155 112,356 105,013 Changes in assumptions (10,129) 77,574 - - 38,296 - - - Differences between expected and actual experience (19,385) 6,025 (18,647) 19,691 (35,634) (24,410) 25,158 (13,581) Benefit payments (96,969) (93,550) (91,230) (91,293) (84,319) (74,352) (70,677) (66,147)
Net change in total pension liability 48,646 155,479 50,661 81,381 68,736 50,810 100,307 56,705
Total pension liability, beginning of period 1,940,317 1,784,838 1,734,177 1,652,796 1,584,060 1,533,250 1,432,943 1,376,238 Total pension liability, end of period 1,988,963 1,940,317 1,784,838 1,734,177 1,652,796 1,584,060 1,533,250 1,432,943
Plan fiduciary net positionEmployer contributions (58,700) (46,200) (44,500) (46,000) (55,800) (44,400) (39,016) (37,687) Participant contributions (13,363) (13,039) (12,144) (11,563) (12,140) (12,569) (12,332) (11,745) (Earnings) loss on Plan assets 48,316 (246,772) (207,196) 52,945 (85,520) (145,883) (110,529) (22,510) Benefit payments 96,969 93,550 91,230 91,293 84,319 74,352 70,677 66,147 Administrative expenses 391 389 - - - - - -
Net change in Plan fiduciary net position 73,613 (212,072) (172,610) 86,675 (69,141) (128,500) (91,200) (5,795)
Plan fiduciary net position, beginning of period (1,684,448) (1,472,376) (1,299,766) (1,386,441) (1,317,300) (1,188,800) (1,097,600) (1,091,805) Plan fiduciary net position, end of period (1,610,835) (1,684,448) (1,472,376) (1,299,766) (1,386,441) (1,317,300) (1,188,800) (1,097,600)
Net pension liability, end of period 378,128$ 255,869$ 312,462$ 434,411$ 266,355$ 266,760$ 344,450$ 335,343$
Plan fiduciary net position as a percentage of thetotal pension liability 81.0% 86.8% 82.5% 74.9% 83.9% 83.2% 77.5% 76.6%
Covered payroll 254,241$ 242,477$ 235,360$ 256,236$ 261,085$ 260,730$ 251,136$ 241,318$
Net pension liability as a percentage of covered payroll 148.7% 105.5% 132.8% 169.5% 102.0% 102.3% 137.2% 139.0%
SchedulesofChangesinCPSEnergyNetPensionLiabilityandRelatedRatios– The following schedules present multiyear trend information that demonstrates the components of change in the net pension liability from year to year, as well as trends in related statistical information. Information is presented related to all periods for which the required data is available. Amounts are presented on a net pension liability measurement date basis for the following periods:
Measurement Period Ended January 31,
NotestoScheduleFor FY 2020 and FY 2019, the annual investment rate of return underlying the calculation of total pension liability was assumed to be 7.25%. For FY 2018 and FY 2017, the annual investmentrate of return was assumed to be 7.50%. For the previous years presented, the rate used was 7.75%. Based on an experience study completed in 2017, the FY 2019 valuation results includethe impact of other revised actuarial assumptions including salary increases and the use of updated mortality tables. No other actuarial assumptions were modified in FY 2018. Otheractuarial assumptions were modified in FY 2016 without significantly affecting trends in the amounts reported above. There were no changes in benefit terms, in the size or composition ofthe population covered by the benefit terms, or other factors that significantly affected trends from year to year in the amounts reported above.

CPS Energy FY2020 Basic Financial Statements
Page 104
SchedulesofEmployerContributionstoCPSEnergyPensionPlan – The following schedules, present multiyear trend information regarding employer contributions to the Pension Plan. Information is presented related to all periods for which the required data is available. The amounts presented are determined as of the fiscal years ending:
(Dollars in thousands)
2020 2019 2018 2017 2016 2015 2014 2013
Actuarially determined contribution 53,435$ 58,657$ 46,234$ 44,532$ 46,001$ 48,696$ 44,362$ 39,016$ Contributions in relation to the actuarially
determined contribution 73,435 58,700 46,200 44,500 46,000 55,800 44,400 39,016 Contribution deficiency (excess) (20,000)$ (43)$ 34$ 32$ 1$ (7,104)$ (38)$ -$
Covered payroll 271,449$ 254,241$ 242,477$ 235,360$ 256,236$ 261,085$ 260,730$ 251,136$
Contributions as a percentage of covered payroll 27.1% 23.1% 19.1% 18.9% 18.0% 21.4% 17.0% 15.5%
NotestoSchedule
Valuation date: Actuarially determined contribution rates are calculated as of January 1, two years and one month prior to the end of the fiscal year in which contributions are made.
Methodsandassumptionsusedtodeterminecontributionrates:Actuarial cost method Entry-age normal costAmortization method Level dollarRemaining amortization period 30 yearsAsset valuation method Market value gains/losses recognized over 5 years, beginning with calendar year 2014; expected value adjusted market value method for all prior periodsInflation 3.0% for FY 2020 and for previous years presented per year, compounded annuallySalary increases Average, including inflation: 5.36% for FY 2020 4.72% for FY 2019, 4.66% for FY 2018, 4.78% for FY 2017, 5.01% for FY 2016, 5.03% for FY 2015,
5.07% for FY 2014, 5.18% for FY 2013Investment rate of return 7.25% per year, compounded annually, for FY 2020 and FY 2019, 7.50% for FY 2018 and FY 2017; 7.75% for prior yearsMortality Based on RP-2014 Mortality Table adjusted backwards to 2006 with Mortality Improvement Scale MP-2014 and projected (fully generational) with MP-2017 for FY2020;
RP-2016 Combined Healthy, with No Collar Adjustment, Male and Female Tables; with MP-2016 Mortality Improvement Scale for FY 2019; RP-2000 Combined Healthy Annuitant Mortality Table for Males or Females, projected using Scale BB for 2017 and 2016; RP-2000 Combined Healthy Annuitant Mortality Table for Males or Females, projected using Scale AA for prior years.
Cost-of-living increases 1.50% per year
Other information: In FY 2020, an additional $20.0 million was contributed to the pension plan in excess of the actuarially determined contribution. For FY 2020 and FY 2019, the annual investment rate ofreturn underlying the calculation of total pension liability was assumed to be 7.25%. For FY 2018 and FY 2017, the annual investment rate of return was assumed to be 7.50%. For the previous yearspresented, the rate used was 7.75%. Based on an experience study completed in 2017, the FY 2019 valuation results include the impact of other revised actuarial assumptions including salary increasesand the use of updated mortality tables. No other actuarial assumptions were modified in FY 2018. Other actuarial assumptions were modified in FY 2016 without significantly affecting trends in theamounts reported above. There were no changes in benefit terms, in the size or composition of the population covered by the benefit terms, or other factors that significantly affected trends from year toyear in the amounts reported above.
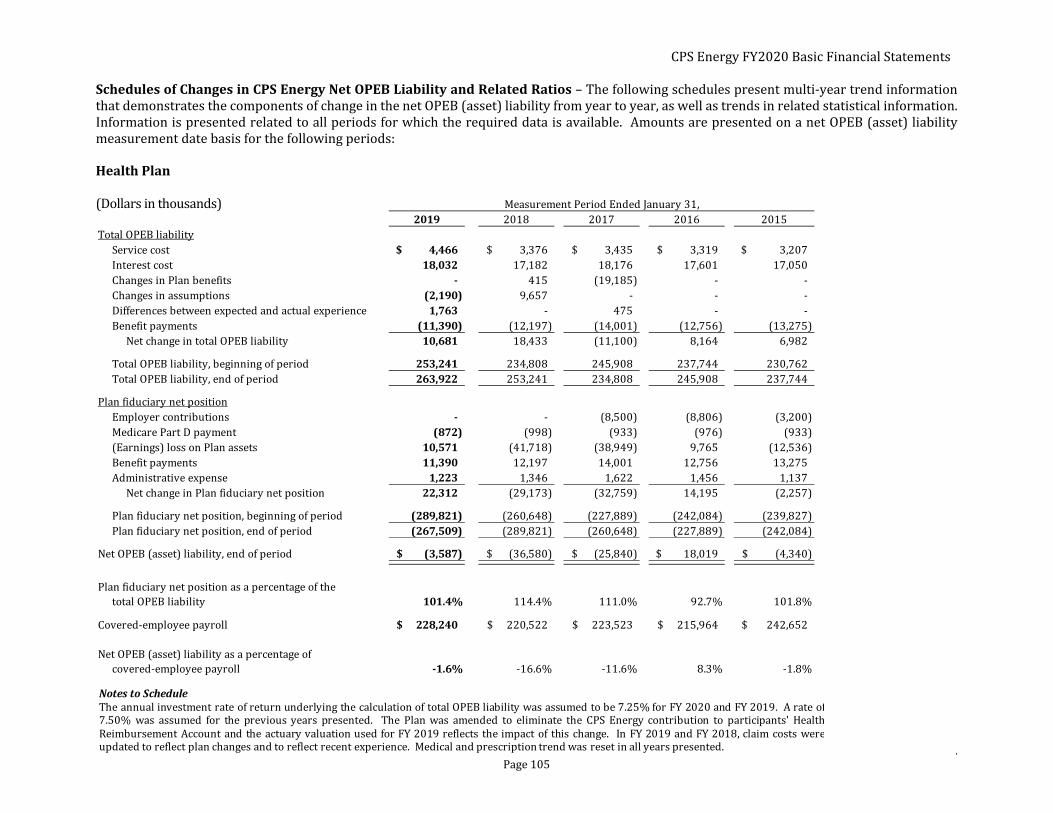
CPS Energy FY2020 Basic Financial Statements
. Page 105
SchedulesofChangesinCPSEnergyNetOPEBLiabilityandRelatedRatios– The following schedules present multi-year trend information that demonstrates the components of change in the net OPEB (asset) liability from year to year, as well as trends in related statistical information. Information is presented related to all periods for which the required data is available. Amounts are presented on a net OPEB (asset) liability measurement date basis for the following periods:
HealthPlan (Dollars in thousands)
2019 2018 2017 2016 2015Total OPEB liability
Service cost 4,466$ 3,376$ 3,435$ 3,319$ 3,207$ Interest cost 18,032 17,182 18,176 17,601 17,050 Changes in Plan benefits ‐ 415 (19,185) - - Changes in assumptions (2,190) 9,657 - - - Differences between expected and actual experience 1,763 - 475 - - Benefit payments (11,390) (12,197) (14,001) (12,756) (13,275)
Net change in total OPEB liability 10,681 18,433 (11,100) 8,164 6,982
Total OPEB liability, beginning of period 253,241 234,808 245,908 237,744 230,762 Total OPEB liability, end of period 263,922 253,241 234,808 245,908 237,744
Plan fiduciary net positionEmployer contributions ‐ - (8,500) (8,806) (3,200) Medicare Part D payment (872) (998) (933) (976) (933) (Earnings) loss on Plan assets 10,571 (41,718) (38,949) 9,765 (12,536) Benefit payments 11,390 12,197 14,001 12,756 13,275 Administrative expense 1,223 1,346 1,622 1,456 1,137
Net change in Plan fiduciary net position 22,312 (29,173) (32,759) 14,195 (2,257)
Plan fiduciary net position, beginning of period (289,821) (260,648) (227,889) (242,084) (239,827) Plan fiduciary net position, end of period (267,509) (289,821) (260,648) (227,889) (242,084)
Net OPEB (asset) liability, end of period (3,587)$ (36,580)$ (25,840)$ 18,019$ (4,340)$
Plan fiduciary net position as a percentage of thetotal OPEB liability 101.4% 114.4% 111.0% 92.7% 101.8%
Covered-employee payroll 228,240$ 220,522$ 223,523$ 215,964$ 242,652$
Net OPEB (asset) liability as a percentage of covered-employee payroll ‐1.6% -16.6% -11.6% 8.3% -1.8%
Measurement Period Ended January 31,
NotestoScheduleThe annual investment rate of return underlying the calculation of total OPEB liability was assumed to be 7.25% for FY 2020 and FY 2019. A rate of7.50% was assumed for the previous years presented. The Plan was amended to eliminate the CPS Energy contribution to participants' HealthReimbursement Account and the actuary valuation used for FY 2019 reflects the impact of this change. In FY 2019 and FY 2018, claim costs wereupdated to reflect plan changes and to reflect recent experience. Medical and prescription trend was reset in all years presented.
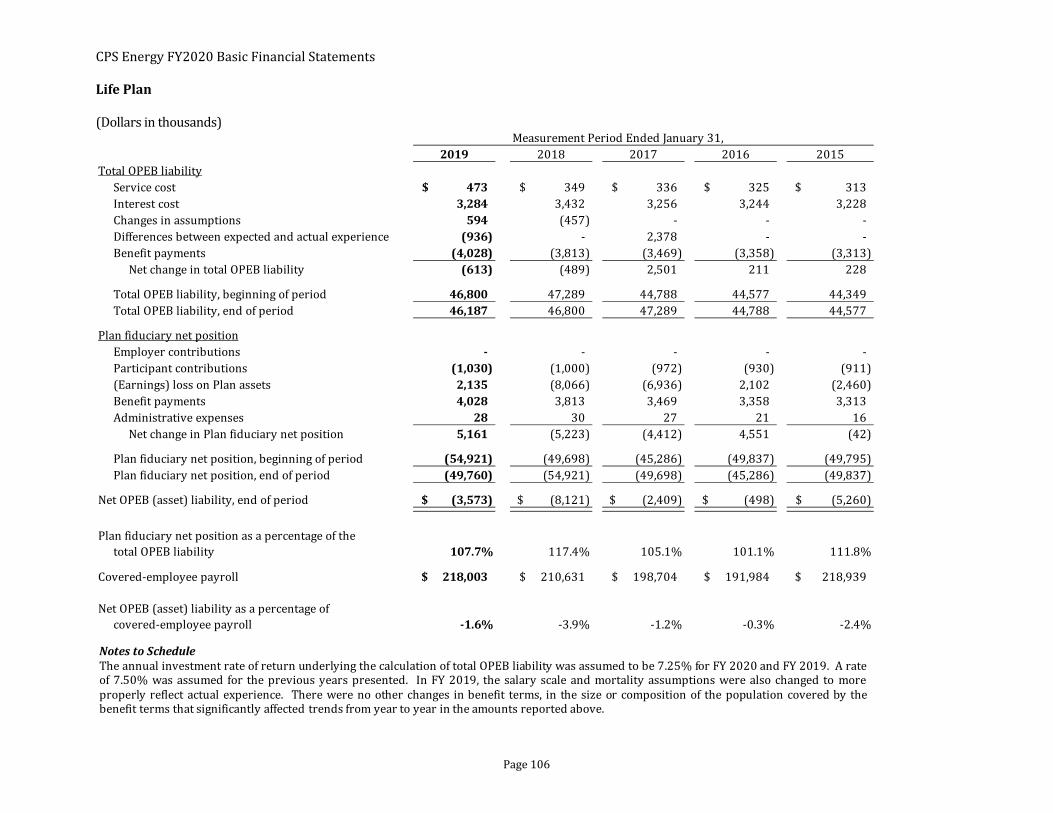
CPS Energy FY2020 Basic Financial Statements
Page 106
LifePlan(Dollars in thousands)
Measurement Period Ended January 31,2019 2018 2017 2016 2015
Total OPEB liabilityService cost 473$ 349$ 336$ 325$ 313$ Interest cost 3,284 3,432 3,256 3,244 3,228 Changes in assumptions 594 (457) - - - Differences between expected and actual experience (936) - 2,378 - - Benefit payments (4,028) (3,813) (3,469) (3,358) (3,313)
Net change in total OPEB liability (613) (489) 2,501 211 228
Total OPEB liability, beginning of period 46,800 47,289 44,788 44,577 44,349 Total OPEB liability, end of period 46,187 46,800 47,289 44,788 44,577
Plan fiduciary net positionEmployer contributions ‐ - - - - Participant contributions (1,030) (1,000) (972) (930) (911) (Earnings) loss on Plan assets 2,135 (8,066) (6,936) 2,102 (2,460) Benefit payments 4,028 3,813 3,469 3,358 3,313 Administrative expenses 28 30 27 21 16
Net change in Plan fiduciary net position 5,161 (5,223) (4,412) 4,551 (42)
Plan fiduciary net position, beginning of period (54,921) (49,698) (45,286) (49,837) (49,795) Plan fiduciary net position, end of period (49,760) (54,921) (49,698) (45,286) (49,837)
Net OPEB (asset) liability, end of period (3,573)$ (8,121)$ (2,409)$ (498)$ (5,260)$
Plan fiduciary net position as a percentage of thetotal OPEB liability 107.7% 117.4% 105.1% 101.1% 111.8%
Covered-employee payroll 218,003$ 210,631$ 198,704$ 191,984$ 218,939$
Net OPEB (asset) liability as a percentage of covered-employee payroll ‐1.6% -3.9% -1.2% -0.3% -2.4%
NotestoScheduleThe annual investment rate of return underlying the calculation of total OPEB liability was assumed to be 7.25% for FY 2020 and FY 2019. A rateof 7.50% was assumed for the previous years presented. In FY 2019, the salary scale and mortality assumptions were also changed to moreproperly reflect actual experience. There were no other changes in benefit terms, in the size or composition of the population covered by thebenefit terms that significantly affected trends from year to year in the amounts reported above.

CPS Energy FY2020 Basic Financial Statements
. Page 107
DisabilityPlan(Dollars in thousands)
Measurement Period Ended January 31,2019 2018 2017 2016 2015
Total OPEB liabilityService cost 620$ 516$ 527$ 509$ 492$ Interest cost 475 473 455 448 426 Changes in assumptions 189 94 - - - Differences between expected and actual experience (656) - 255 - - Benefit payments (880) (1,012) (974) (775) (559)
Net change in total OPEB liability (252) 71 263 182 359
Total OPEB liability, beginning of period 6,366 6,295 6,032 5,850 5,491 Total OPEB liability, end of period 6,114 6,366 6,295 6,032 5,850
Plan fiduciary net positionEmployer contributions (1,000) (1,300) (700) (175) (175) Participant contributions (274) (265) (260) (248) (211) (Earnings) loss on Plan assets 205 (627) (501) 158 (177) Benefit payments 880 1,012 974 775 559 Administrative expense 19 18 15 14 18
Net change in Plan fiduciary net position (170) (1,162) (472) 524 14
Plan fiduciary net position, beginning of period (5,396) (4,234) (3,762) (4,286) (4,300) Plan fiduciary net position, end of period (5,566) (5,396) (4,234) (3,762) (4,286)
Net OPEB liability, end of period 548$ 970$ 2,061$ 2,270$ 1,564$
Plan fiduciary net position as a percentage of thetotal OPEB liability 91.0% 84.8% 67.2% 62.4% 73.3%
Covered-employee payroll 224,137$ 216,558$ 212,904$ 205,704$ 218,939$
Net OPEB liability as a percentage ofcovered-employee payroll 0.2% 0.4% 1.0% 1.1% 0.7%
NotestoScheduleThe annual investment rate of return underlying the calculation of total OPEB liability was assumed to be 7.25% for FY 2020 and FY 2019. A rate of7.50% was assumed for the previous years presented. In FY 2019, the salary scale and mortality assumptions were also changed to more properlyreflect actual experience. There were no other changes in benefit terms, in the size or composition of the population covered by the benefit termsthat significantly affected trends from year to year in the amounts reported above.

CPS Energy FY2020 Basic Financial Statements
Page 108
SchedulesofEmployerContributionstoCPSEnergyOPEBPlans – The following schedules present multi-year trend information regarding employer contributions to the OPEB Plans. Information is presented related to all periods for which the required data is available. The amounts presented are determined as of the fiscal years ending:
HealthPlan (Dollars in thousands)
2020 2019 2018 2017 2016
Actuarially determined contribution ‐$ -$ -$ -$ -$ Contributions in relation to the actuarially
determined contribution ‐ - - 8,500 8,806 Contribution deficiency (excess) ‐$ -$ -$ (8,500)$ (8,806)$
Covered-employee payroll 244,010$ 228,240$ 220,522$ 223,523$ 215,964$
Contributions as a percentage of covered-employee payroll 0.0% 0.0% 0.0% 3.8% 4.1%
NotestoSchedule
Valuation date: Actuarially determined contribution rates are calculated as of January 1, two years and one month prior to the end of the fiscal year in which contributions are made.
Methodsandassumptions usedtodetermine contributionrates:Actuarial cost method Entry-age normal costAmortization method Level dollarRemaining amortization period 30 yearsAsset valuation method Market value gains/losses recognized over 5 yearsHealthcare cost trend rates 8.7% initial, decreasing to an ultimate rate of 4.1% for FY 2020;7.0% initial, decreasing to an ultimate rate of 5.0% for FY 2019 and FY 2018, 7.5%
initial, decreasing to an ultimate of 5.0% for FY 2017 and FY 2016Prescription cost trend rates 8.7% initial, decreasing to an ultimate rate of 4.1% for FY 2020; 7.0% initial, decreasing to an ultimate rate of 5.0% for FY 2019 and FY 2018, 8.5%
initial, decreasing to an ultimate of 5.0% for FY 2017 and FY 2016Salary increases Projected average annual base salary increases from 3.1% to 11.6% for FY 2020 and FY 2019; ranging from 4.0% to 9.5% for previous yearsInvestment rate of return 7.25% per year, compounded annually for FY 2020 and FY 2019, 7.50% for previous yearsMortality Based on RP-2014 Mortality Table adjusted backwards to 2006 with Mortality Scale MP-2014 and projected with Mortality Improvement Scale
MP-2017 (seperate tables for males/females); Based on RP-2000 Combined Healthy, with No Collar Adjustment, Projected to 2020 using Scale BB, Male and Female Tables for Active and Retirees; Based on 1987 Commissioners Group Disabled Life Mortality Table for Disabled
Other information: The Plan was amended to eliminate the CPS Energy contribution to participants' Health Reimbursement Account and the actuary valuation used for FY 2019 reflectsthe impact of this change. For FY 2019 and FY 2018 claim costs were updated to reflect plan changes and to reflect recent experience. The medical and prescription trend was reset inFY 2018. For FY 2017 and FY 2016 claim costs were updated to reflect recent experience, and the medical and prescription trend was reset.
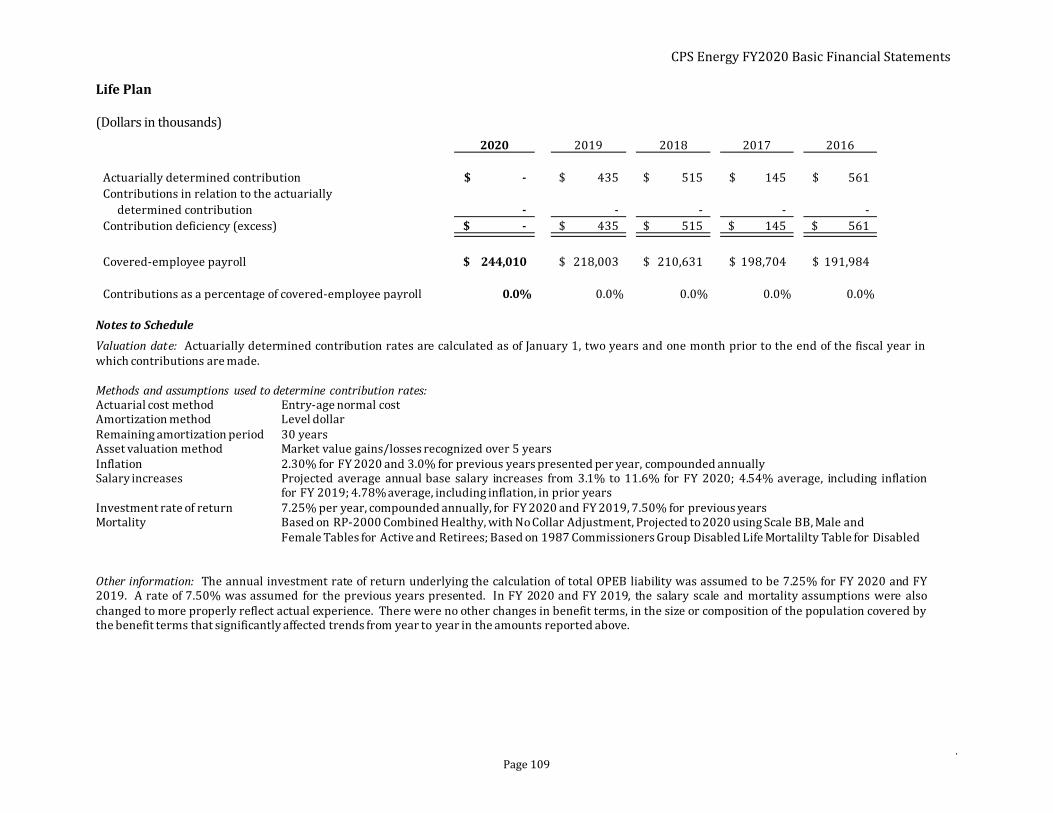
CPS Energy FY2020 Basic Financial Statements
. Page 109
LifePlan(Dollars in thousands)
2020 2019 2018 2017 2016
Actuarially determined contribution ‐$ 435$ 515$ 145$ 561$ Contributions in relation to the actuarially
determined contribution ‐ - - - - Contribution deficiency (excess) ‐$ 435$ 515$ 145$ 561$
Covered-employee payroll 244,010$ 218,003$ 210,631$ 198,704$ 191,984$
Contributions as a percentage of covered-employee payroll 0.0% 0.0% 0.0% 0.0% 0.0%
NotestoSchedule
Valuation date: Actuarially determined contribution rates are calculated as of January 1, two years and one month prior to the end of the fiscal year inwhich contributions are made.
Methodsandassumptions usedtodetermine contributionrates:Actuarial cost method Entry-age normal costAmortization method Level dollarRemaining amortization period 30 yearsAsset valuation method Market value gains/losses recognized over 5 yearsInflation 2.30% for FY 2020 and 3.0% for previous years presented per year, compounded annuallySalary increases Projected average annual base salary increases from 3.1% to 11.6% for FY 2020; 4.54% average, including inflation
for FY 2019; 4.78% average, including inflation, in prior yearsInvestment rate of return 7.25% per year, compounded annually, for FY 2020 and FY 2019, 7.50% for previous yearsMortality Based on RP-2000 Combined Healthy, with No Collar Adjustment, Projected to 2020 using Scale BB, Male and
Female Tables for Active and Retirees; Based on 1987 Commissioners Group Disabled Life Mortalilty Table for Disabled
Other information: The annual investment rate of return underlying the calculation of total OPEB liability was assumed to be 7.25% for FY 2020 and FY2019. A rate of 7.50% was assumed for the previous years presented. In FY 2020 and FY 2019, the salary scale and mortality assumptions were alsochanged to more properly reflect actual experience. There were no other changes in benefit terms, in the size or composition of the population covered bythe benefit terms that significantly affected trends from year to year in the amounts reported above.
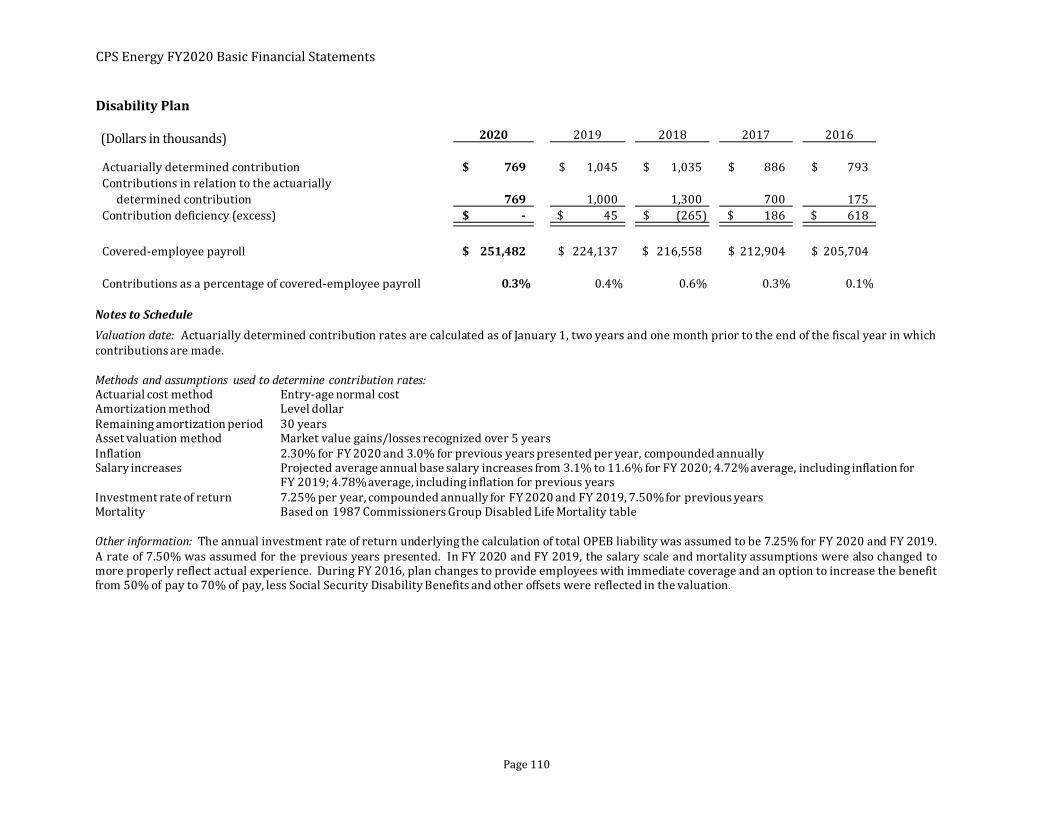
CPS Energy FY2020 Basic Financial Statements
Page 110
DisabilityPlan (Dollars in thousands)
2020 2019 2018 2017 2016
Actuarially determined contribution 769$ 1,045$ 1,035$ 886$ 793$ Contributions in relation to the actuarially
determined contribution 769 1,000 1,300 700 175 Contribution deficiency (excess) ‐$ 45$ (265)$ 186$ 618$
Covered-employee payroll 251,482$ 224,137$ 216,558$ 212,904$ 205,704$
Contributions as a percentage of covered-employee payroll 0.3% 0.4% 0.6% 0.3% 0.1%
NotestoSchedule
Valuation date: Actuarially determined contribution rates are calculated as of January 1, two years and one month prior to the end of the fiscal year in whichcontributions are made.
Methodsandassumptions usedtodetermine contributionrates:Actuarial cost method Entry-age normal costAmortization method Level dollarRemaining amortization period 30 yearsAsset valuation method Market value gains/losses recognized over 5 yearsInflation 2.30% for FY 2020 and 3.0% for previous years presented per year, compounded annuallySalary increases Projected average annual base salary increases from 3.1% to 11.6% for FY 2020; 4.72%average, including inflation for
FY 2019; 4.78%average, including inflation for previous yearsInvestment rate of return 7.25% per year, compounded annually for FY 2020 and FY 2019, 7.50%for previous yearsMortality Based on 1987 Commissioners Group Disabled Life Mortality table
Other information: The annual investment rate of return underlying the calculation of total OPEB liability was assumed to be 7.25% for FY 2020 and FY 2019.A rate of 7.50% was assumed for the previous years presented. In FY 2020 and FY 2019, the salary scale and mortality assumptions were also changed tomore properly reflect actual experience. During FY 2016, plan changes to provide employees with immediate coverage and an option to increase the benefitfrom 50% of pay to 70% of pay, less Social Security Disability Benefits and other offsets were reflected in the valuation.

CPS Energy FY2020 Basic Financial Statements
. Page 111
(Dollars in thousands)
2019 2018 2017 2016 2015 2014 2013Plan
Pension Plan 17.9% -4.5% 14.6% 10.2% -1.1% 5.7% 19.9%Health Plan 16.7% -5.5% 14.0% 11.1% - - - Life Plan 18.9% -5.5% 14.1% 9.7% - - - Disability Plan 18.5% -5.8% 13.8% 8.9% - - -
Fiscal Year Ended December 31,
SchedulesofInvestmentReturnsforCPSEnergyFiduciaryFunds – The following schedules present the annual money-weighted rate of return, net of investment expense for the investments held by the Plans.

Page 112
GLOSSARYOFTERMS
AdvanceRefunding:A bond issuance in which new bonds are sold at a lower interest rate than outstanding ones. The proceeds are then invested in an irrevocable escrow; when the older bonds become callable, they are paid off with the invested proceeds.
Allowance for Funds Used DuringConstruction (“AFUDC”): A cost accounting procedure whereby interest charges on borrowed funds and a return on equity for capital used to finance construction are added to the cost of utility plant being constructed (i.e., capitalized interest).
Amortize:To reduce an original amount or an account balance on an installment basis.
Assets:Resources with present service capacity that a governmental entity presently controls.
Asset Retirement Obligation (“ARO”): A legally enforceable liability associated with the retirement of a tangible capital asset.
Build America Bonds (“BABs”): Taxable municipal bonds created under the American Recovery and Reinvestment Act of 2009 that carry special federal subsidies for either the bondholder or the bond issuer.
Call Option: An option contract giving the owner the right (but not the obligation) to buy a specified amount of an underlying asset at a specified price within a specified time.
CapitalAsset:An asset with a life of more than one year that is not bought and sold in the ordinary course of business.
CashandCashEquivalents:The value of assets that can be converted into cash immediately. Usually includes bank accounts and marketable securities, such as government bonds. Cash equivalents on the Statements of Net Position include securities with an original maturity of 90 days or less.
CommercialPaper: A short-term note with a maximum maturity of 270 days. Maturities for commercial paper notes, however, can be extended indefinitely for the life of the program that supports the commercial paper notes.
ComponentUnit: A legally separate entity for which the elected officials of the primary government are financially accountable and with which a financial benefit/burden relationship exists. The nature and significance of its relationship with the primary government are such that exclusion would cause the reporting entity’s financial statements to be misleading or incomplete.
Decommissioning: The process related to permanently taking a nuclear plant out of service, including decontaminating and removing buildings or other structures.
Defeasance:A provision that legally discharges a borrower for debt incurred when the borrower sets aside cash or bonds sufficient to service the outstanding debt.
DeferredInflowsofResources:Acquisition of net assets applicable to a future reporting period.
Deferred Outflows of Resources: Consumption of net assets applicable to a future reporting period.
Depreciation: Amount allocated during the period to expense the cost of acquiring a capital asset over the useful life of the asset. Derivative: In finance, a security for which price is dependent upon or derived from one or more underlying assets. The derivative itself is merely a contract between two or more parties. Examples of derivatives include futures and options.
Electric Reliability Council of Texas(“ERCOT”): An organization whose mission is to direct and ensure reliable and cost-effective operation of the electric transmission grid in Texas and to enable fair and efficient market-driven solutions to meet customers’ electric service needs.
CPS Energy FY2020 Basic Financial Statements
Page 113
Fair Value: The amount at which a financial instrument could be exchanged in a current transaction between willing parties, other than in a forced or liquidation sale.
Federal Energy Regulatory Commission(“FERC”): Independent federal agency created within the U.S. Department of Energy. FERC is vested with broad regulatory authority over wholesale electric, natural gas and oil production, and the licensing of hydroelectric facilities.
Financial Accounting Standards Board(“FASB”): Board composed of independent members who create and interpret generally accepted accounting principles (“GAAP”) applicable to private sector entities in the United States.
Fiscal Year (“FY”): The 12-month period covered by the income statement. A fiscal year may or may not coincide with a calendar year. For CPS Energy, the fiscal year is from February 1 through January 31.
Futures: Financial contracts obligating the buyer to purchase an asset (or the seller to sell an asset), such as a physical commodity or a financial instrument, at a predetermined future date and price. Futures contracts detail the quality and quantity of the underlying asset; they are standardized to facilitate trading on a futures exchange.
Generally Accepted Accounting Principles(“GAAP”): Conventions, rules and procedures that serve as the norm for the fair presentation of financial statements. The Governmental Accounting Standards Board is responsible for setting GAAP for state and local governments.
Governmental Accounting Standards Board(“GASB”): The authoritative standard-setting body for accounting and financial reporting for governmental entities in the United States.
Hedging:The process of buying and selling fuel oil; natural gas; diesel fuel; and electric energy futures, options or similar contracts to limit risk of loss caused by price fluctuations.
Lease: A legal agreement to pay rent to the lessor for a stated period of time. Sometimes the lease is in substance a purchase of an asset and a financing arrangement (i.e., a capital lease).
Liabilities: Present obligations to sacrifice resources that a governmental entity has little or no discretion to avoid.
MMBtu: 1,000,000 British Thermal Units (“BTU”). A BTU is the standard unit for measuring the quantity of heat energy, such as the heat content of fuel. It is the amount of heat energy necessary to raise the temperature of one pound of water one-degree Fahrenheit at sea level pressure.
Management’s Discussion & Analysis(“MD&A”): A section of the basic financial statements that contains objective and easily readable analysis from management about the company’s financial condition and its operations to assist users in assessing the company’s financial position.
Megawatt(“MW”): A measure of electric power. A megawatt equals 1,000 kilowatts or 1,000,000 watts.
Mothballed: A generation resource that is placed in an inactive state so that it can neither be brought into operation immediately nor counted towards the electric transmission grid’s reserve margin.
National Association of Regulatory UtilityCommissioners (“NARUC”): A nonprofit organization whose members include the governmental agencies that are engaged in the regulation of utilities and carriers in the 50 United States, the District of Columbia, Puerto Rico and the Virgin Islands. NARUC’s member agencies regulate the activities of energy, water and telecommunications utilities.
NaturalGasBasisSwap: A financial contract that allows the purchaser to lock in the price difference between two natural gas delivery points or hubs, such as the Houston Ship Channel and Henry Hub, Louisiana.

CPS Energy FY2020 Basic Financial Statements
Page 114
Net CostsRecoverable/Refundable: Certain costs that are required to be accrued as a regulatory asset or a regulatory liability under GASB Statement No. 62 if regulation provides assurance that these costs can be recovered or refunded through rates in the future.
Net OPEB (Asset) Liability: The difference between the actuarial total OPEB liability and an OPEB plan’s fiduciary net position of as the measurement date.
NetPensionLiability:The difference between the actuarial total pension liability and a pension plan’s fiduciary net position of as the measurement date.
Net Revenue: Per the New Series Bond Ordinance, all income and revenues from the operation of the Company’s electric and gas systems after the deduction of maintenance and operating expenses.
NewSeriesBonds:A CPS Energy term used to distinguish bonds that have a first lien on the net revenues of CPS Energy’s Systems.
Other Postemployment Benefits (“OPEBs”): Postemployment benefits other than pension benefits. OPEBs include postemployment healthcare benefits, regardless of the type of plan that provides them, and all postemployment benefits provided separately from a pension plan, excluding benefits defined as termination benefits.
PublicUtilityCommissionofTexas(“PUCT”):The governmental commission that regulates the rates and services of telephone utilities; investor-owned electric, water and sewer utilities; electric, water and sewer utilities in unincorporated areas; and radio companies statewide. The PUCT does not have authority to regulate retail activities of municipally owned utilities.
Refunding: Retiring all or a portion of an outstanding bond issue after the first call date by using money from the sale of a new offering.
Regulatory Asset/Liability: Specific costs, revenues or gains that a government with qualifying rate-regulated operations is allowed to defer, until recovered through future rates, that would otherwise be immediately recognized in the statement of revenues, expenses and changes in net position.
Required Supplementary Information(“RSI”): Schedules, statistical data and other information that are an essential part of financial reporting and should be presented with, but are not part of, the basic financial statements of a governmental entity.
Retail Sales: Retail electric sales within a utility’s certificated service area. (Also see “Wholesale Sales.”)
Revenue Bonds: Bonds issued by a municipality in which the issuer pledges to the bondholders its revenues as security for the bonds. SA Energy Acquisition Public FacilityCorporation (“PFC”): A public nonprofit corporation organized under the laws of the state of Texas pursuant to the Texas Public Facility Corporation Act, Chapter 303, Texas Local Government Code. The PFC was organized to assist the City of San Antonio in financing, refinancing or providing public facilities, including natural gas, to be devoted to public use.
South Texas Project (“STP”): A two-unit nuclear plant with a capacity of 2,700 MW of electricity, enough to provide service for more than one million homes and businesses.
South Texas Project Nuclear OperatingCompany (“STPNOC”): A not-for-profit entity that provides for the licensing, construction, operation and maintenance of the jointly owned and operated electric generation facilities of STP.

CPS Energy FY2020 Basic Financial Statements
Page 115
Tax‐ExemptBond:A bond usually issued by a municipal, county or state government for which interest payments are not subject to the bondholders’ federal income tax and, in some cases, state and local income tax.
Transmission Costs of Service (“TCOS”): A functional classification of expenses and capital expenditures relating to the operation and maintenance of the transmission plant. The transmission function is that portion of the utility system used for the purpose of transmitting electrical energy in bulk to other principal parts of the system or to other utility systems.
True Interest Cost: The rate, compounded semi-annually, necessary to discount the amounts payable on the respective principal and interest payment dates to the purchase price received for the new issue of bonds.
Weighted‐Average Duration (“WAD”): The weighted-average time to return a dollar of principal and interest and incorporates potential changes in the timing of principal and interest return that may occur as a result of changes in interest rates. It makes assumptions regarding the most likely timing and amounts of variable cash flows and is used as an estimate of the interest rate risk of a fixed-income investment—especially those with payment terms dependent on market interest rates.
Weighted‐Average Maturity (“WAM”): The weighted-average time to return a dollar of principal based on an investment’s stated final maturity. It is used as an estimate of the interest rate risk of a fixed-income investment.
Wholesale Sales: Wholesale electric sales outside a utility’s certificated service area. (Also see “Retail Sales.”)