city of statesboro, georgia
TRANSCRIPT

City of Statesboro, Georgia
Comprehensive Annual Financial Report for the Fiscal Year Ending June 30, 2009
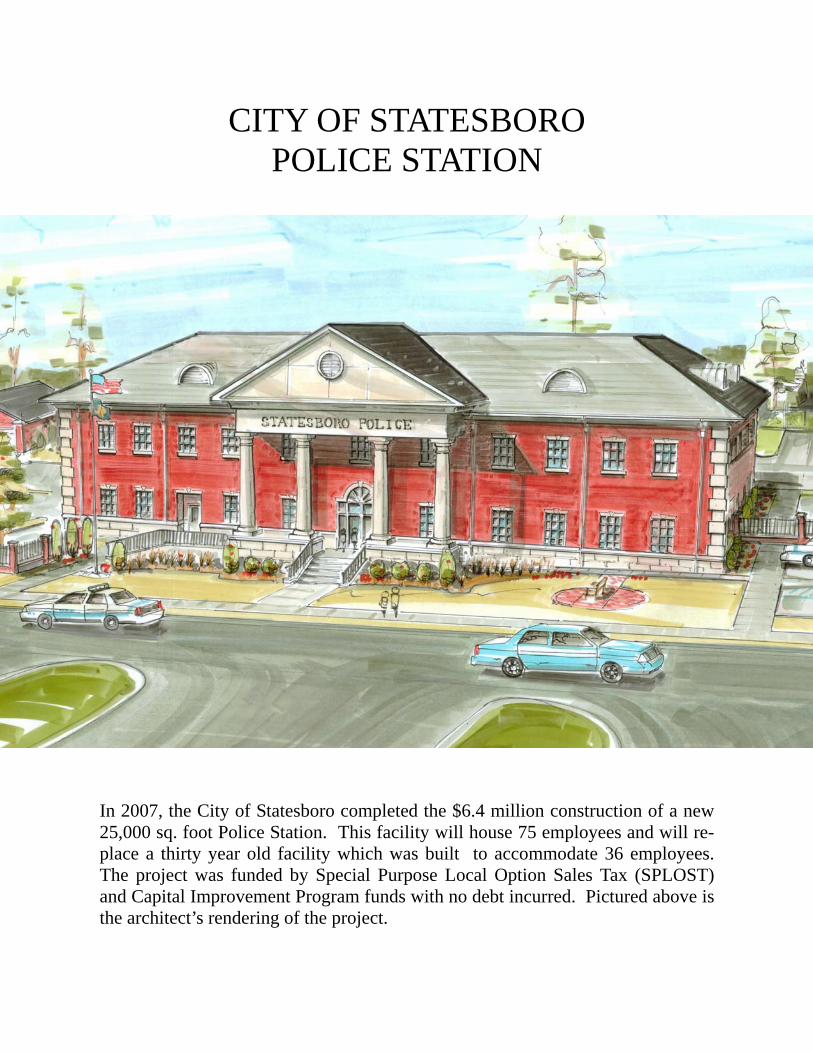
CITY OF STATESBORO POLICE STATION
In 2007, the City of Statesboro completed the $6.4 million construction of a new 25,000 sq. foot Police Station. This facility will house 75 employees and will re-place a thirty year old facility which was built to accommodate 36 employees. The project was funded by Special Purpose Local Option Sales Tax (SPLOST) and Capital Improvement Program funds with no debt incurred. Pictured above is the architect’s rendering of the project.
City of Statesboro, Georgia Comprehensive Annual Financial Report
For The Year Ended June 30, 2009
TABLE OF CONTENTS
Introductory Section (Unaudited)
Letter of Transmittal .................................................................................................................v List of Elected Officials (In office as of June 30, 2009) ........................................................ xiii List of Appointed Officials..................................................................................................... xiv Organizational Chart ................................................................................................................xv
Financial Section Independent Auditors’ Report .................................................................................................1 Management’s Discussion and Analysis (Unaudited)................................................3 Basic Financial Statements: Government-wide Financial Statements: Statement of Net Assets.........................................................................................................15 Statement of Activities ..........................................................................................................16 Fund Financial Statements: Governmental Funds: Balance Sheet ........................................................................................................................17
Reconciliation of the Governmental Funds Balance Sheet to the Statement of Net Assets......................................................................................................................... 18
Statement of Revenues, Expenditures and Changes in Fund Balances ................................19 Reconciliation of the Governmental Funds Statement of Revenues, Expenditures, and Changes in Fund Balances to the Statement of Activities .......................................20 Statement of Revenues, Expenditures, and Changes in Fund Balances – Budget and Actual - General Fund .............................................................................21 Statement of Revenues, Expenditures, and Changes in Fund Balances – Budget and Actual – Statesboro Fire Service Fund ....................................................23 Proprietary Funds: Statement of Net Assets.........................................................................................................24 Statement of Revenues, Expenses, and Changes in Fund Net Assets ...................................25 Statement of Cash Flows .......................................................................................................26 Notes to the Basic Financial Statements ................................................................................28 Supplementary Information Individual Fund Statements and Schedules: Governmental Funds
i

City of Statesboro, Georgia Comprehensive Annual Financial Report
For The Year Ended June 30, 2009 Nonmajor Governmental Funds – By Fund Type: Combining Balance Sheet………………………………………………………….…..51 Combining Statement of Revenues, Expenditures and Changes in Fund Balances………………………………………………………………....52 General Fund: Comparative Balance Sheet ..................................................................................................53 Comparative Statement of Revenues, Expenditures and Changes in Fund Balances………54 Major Capital Projects Funds: 2002 SPLOST Fund Comparative Balance Sheet ………………………………………………………………56 Comparative Statement of Revenues, Expenditures and Changes in Fund Balances……..57 2007 SPLOST Fund Comparative Balance Sheet ……………………………………………………………….58 Comparative Statement of Revenues, Expenditures and Changes in Fund Balances……..59 Capital Improvements Program Fund Comparative Balance Sheet ................................................................................................60 Comparative Statement of Revenues, Expenditures and Changes in Fund Balances .........61 Nonmajor Capital Projects Funds: Downtown Streetscape Fund Comparative Balance Sheet ...............................................................................................62 Comparative Statement of Revenues, Expenditures and Changes in Fund Balances……..63 Major Special Revenue Funds: Statesboro Fire Service Fund Comparative Balance Sheet ...............................................................................................64 Comparative Statement of Revenues, Expenditures and Changes in Fund Balances……..65 Nonmajor Special Revenue Funds: Combining Balance Sheet ....................................................................................................66 Combining Statement of Revenues, Expenditures and Changes in Fund Balances .............67 Confiscated Assest Fund Comparative Balance Sheet ................................................................................................68 Schedule of Revenues, Expenditures and Changes in Fund Balances - Budget and Actual ..........................................................................................................69 Community Development Block Grant Fund Comparative Balance Sheet .................................................................................................70 Schedule of Revenues, Expenditures and Changes in Fund Balances - Budget and Actual ..........................................................................................................71 Department of Justice Fund Comparative Balance Sheet ..................................................................................................72 Schedule of Revenues, Expenditures and Changes in Fund Balances - Budget and Actual ...........................................................................................................73 Hotel/Motel Tax Fund Comparative Balance Sheet ..................................................................................................74
ii
City of Statesboro, Georgia Comprehensive Annual Financial Report
For The Year Ended June 30, 2009 Schedule of Revenues, Expenditures and Changes in Fund Balances - Budget and Actual ...........................................................................................................75 Multiple Grant Fund Comparative Balance Sheet ..................................................................................................76 Schedule of Revenues, Expenditures and Changes in Fund Balances - Budget and Actual ...........................................................................................................77 Proprietary Funds: Enterprise Funds: Major Enterprise Funds: Water and Sewer Operating Fund Comparative Statement of Net Assets ..........................................................................78
Comparative Statement of Revenues, Expenses and Changes in Fund Net Assets ........................................................................................................79 Reclaimed Water System Fund Comparative Statement of Net Assets ..........................................................................80
Comparative Statement of Revenues, Expenses and Changes in Fund Net Assets ........................................................................................................81 Gas Operating Fund Comparative Statement of Net Assets ..........................................................................82
Comparative Statement of Revenues, Expenses and Changes in Fund Net Assets ........................................................................................................83 Solid Waste Collection Fund Comparative Statement of Net Assets ..........................................................................84
Comparative Statement of Revenues, Expenses and Changes in Fund Net Assets ........................................................................................................85 Solid Waste Disposal Fund Comparative Statement of Net Assets ..........................................................................86
Comparative Statement of Revenues, Expenses and Changes in Fund Net Assets ........................................................................................................87 Internal Service Funds: Combining Statement of Net Assets ...................................................................................88 Combining Statement of Revenues, Expenses, and Changes in Fund Net Assets ..............89 Combining Statement of Cash Flows ..................................................................................90 Benefits Insurance Fund Comparative Statement of Net Assets ..........................................................................92
Comparative Statement of Revenues, Expenses and Changes in Fund Net Assets ........................................................................................................93 Fleet Management Fund Comparative Statement of Net Assets ..........................................................................94
Comparative Statement of Revenues, Expenses and Changes in Fund Net Assets ........................................................................................................95 Schedule of SPLOST Expenditures .........................................................................................96
iii

City of Statesboro, Georgia Comprehensive Annual Financial Report
For The Year Ended June 30, 2009
Statistical Section (Unaudited)
Financial Trends: Government-wide Expenses, Program Revenues and Net (Expense)/Revenue By Function/Program......................................................................................................S-1 Government-wide Program Revenues by Category ........................................................S-2 Government-wide General Revenues and Other Changes in Net Assets ....................................................................................................S-3 Government-wide Net Assets by Category.........................................................................S-4 General Governmental Revenues by Source.......................................................................S-5 General Fund Tax Revenues by Source ..............................................................................S-6 General Governmental Expenditures by Function ..............................................................S-7 Changes in Fund Balances of Governmental Funds……………………………………… S-8 Governmental Fund – Fund Balances .................................................................................S-9 Revenue Capacity: Taxable Assessed Value and Estimated Actual Value of Property..................................S-10 Direct and Overlapping Property Tax Rates ....................................................................S-11 Property Tax Levies and Collections ...............................................................................S-12 Principal Property Taxpayers ...........................................................................................S-13 Sales Tax Rates – Overlapping Governments..................................................................S-14 Water and Sewer Rates – Fiscal Years 2000....................................................................S-15 Water and Sewer Rates – Fiscal Years 2001 - 2009 ........................................................S-16 Water Sold by Type of Customer.....................................................................................S-18 Debt Capacity: Ratio of Total Debt Outstanding by Type.........................................................................S-19 Legal Debt Margin ............................................................................................................S-20 Direct and Overlapping Debt ............................................................................................S-21 Pledged Revenue Bond Coverage.....................................................................................S-22 Economic and Demographic Information: Principal Employers ..........................................................................................................S-23 Demographic and Economic Statistics..............................................................................S-24 Operating Information: Full Time City Employees by Function ............................................................................S-25 Capital Asset and Infrastructure Statistics ........................................................................S-26 Operating Statistics by Function/Program ........................................................................S-27 Report on Internal Control Over Financial Reporting and on Compliance And Other matters Based on an Audit of Financial Statements Performed In Accordance with Governmental Auditing Standards
iv

Introduction


this number is impacted by the fact that 19,086 university students, when filling out census forms, do not have significant earned income. Georgia Southern University’s Bureau of Business Research and Economic Development in a recent study confirmed that the non-student population has a much higher per capita income than the census for this reason; and, the university student population has a considerable amount of disposable income, though little earned income, as they are predominantly supported financially by parents. The City of Statesboro is the county seat of Bulloch County, Georgia, located in the southeastern corner of the state. It is included on the southern leg of the Savannah River Parkway, a four-lane connector between Savannah and Augusta. It is located 53 miles west of Savannah, 76 miles south of Augusta, 121 miles east of Macon, 144 miles southwest of Charleston, SC, 168 miles north of Jacksonville, FL, and 199 miles southeast of Atlanta. Statesboro is 15 miles from Interstate 16, and is located on US Highways 301, 80, and 25, and State Routes 73, 46, 67, and 24.
The City is approximately 13.5 square miles with an average elevation of 240 feet above sea level, the terrain being mostly flat. The climate is seasonal, but moderate, with mild winters and warm, humid summers. The average temperature is 52 degrees in January and 82 degrees in July. The average annual rainfall is 47.0” and the relative humidity is 53% in January and 57% in July. Statesboro is served by the Heart of Georgia Railway Company and numerous common freight carriers. The City and Bulloch County jointly own the Statesboro Municipal Airport that is located approximately 30 minutes from Interstate 16. It is 45 minutes from the Savannah/Hilton Head International Airport, which is serviced by 7 major airlines. The City of Statesboro also is located approximately fifty miles from the Georgia Ports Authority’s Savannah terminal, and is within a reasonable distance of the ports of Charleston, Beaufort, Brunswick, and Jacksonville.
There are two institutions of higher learning located in the greater Statesboro area: Georgia Southern University (GSU) within the city limits, and Ogeechee Technical College just outside the city on US Highway 301 South. Accredited by the Southern Association of Colleges and Schools and Georgia’s largest and most comprehensive center of higher education south of Atlanta, Georgia Southern offers more than 120 undergraduate and graduate degree programs through the doctoral level in its eight Colleges. The University’s 19,086 students come from all 50 states and 90 nations. Ogeechee Technical College is accredited by the Commission of the Council on Occupational Education and adheres to statewide curriculum standards established by the Georgia Department of Technical and Adult Education. OTC offers 125 programs of study including 37 diploma programs, 68 certificate programs, and 20 Associate degrees in conjunction with Georgia Southern University and East Georgia College. There are 15 public schools, 3 private and parochial schools, and 1 charter school in Bulloch County
vi

educating the county’s 9,476 students. A total of 614 seniors graduated from these schools in 2009. Statesboro is a leader in health care in southeast Georgia with East Georgia Regional Medical Center, a 150-bed hospital, employing more than 730 staff and 81 physicians representing a wide range of specialties. The hospital is accredited by the Joint Commission on Accreditation of Healthcare Organizations, a distinction that is awarded only to those healthcare facilities that maintain the highest standards of quality. The City is served by 6 local radio stations, WHKN, WMCD, WPMX, WPTB, WWNS and WVGS, and one daily newspaper, the Statesboro Herald. In addition, the Savannah Morning News reports on the news in Statesboro. Statesboro is covered locally by Northland Cable TV, which is located in the city. The City of Statesboro, Georgia Southern University, and Northland Cable TV have partnered to provide the community with a local government access channel, operated by the Communication Arts Department of GSU. Three television stations in Savannah also cover Statesboro regularly: WTOC (CBS), WJCL (ABC), and WSAV (NBC). The City has 118.5 miles of roads of which 117.5 are paved. Natural gas is sold to 3,436 customers while water and sewer service is provided by the City to over 13,000 customers with an average daily water consumption of 3.23 million gallons. Statesboro has 181 miles of sanitary sewer and 216 miles of water mains with 1,451 fire hydrants. The City maintains a Class 3 ISO rating with 2 fire stations. Utilities are provided by the following within the City: City of Statesboro Water and Sewer, Sanitation and Natural Gas Excelsior EMC Electricity Georgia Power Company Electricity Frontier Communications Telecommunications Bulloch Rural Telephone Telecommunications Northland Cable TV Cable Television
ECONOMIC CONDITION AND OUTLOOK
Statesboro has an economy comprised of an industrial base, a growing university, expanding retail activity, and a regional medical center. The City has a highly diversified economy with several major industries located in the area and is a regional shopping center and health care provider for eight surrounding Georgia counties (Effingham, Screven, Jenkins, Emanuel, Candler, Evans, Tattnall, and Toombs).
The 2008 Bulloch County per capita income was $13,017 or 51% of the State of Georgia per capita income. Per capita income is total personal income (including wages, dividends, interest, rent, and government payments) divided by the total population. It is commonly used as an indicator of the quality of consumer markets and the economic well being of a community. As noted above, this figure is actually skewed lower by the high
vii

number of university students who do not report earned income, but have considerable disposable income. The area offers many educational and vocational opportunities that provide a competitive advantage for a strong workforce. The November 2009 unemployment rate was 9.9%, just below the State of Georgia at 10.1% and the national rate of 10.0%. Approximately 20% of the Bulloch County civilian labor force is employed by the government sector including one of the City’s largest employers, Georgia Southern University. Other government employers include Bulloch County, Bulloch County Board of Education, Ogeechee Technical College, and the City of Statesboro. Major private sector employers in the City include East Georgia Regional Medical Center and Wal-Mart Supercenter. The City and County are experiencing moderate growth with the City approving 172 new building permits in 2008 and 166 in 2009. The cost of housing in Bulloch County is among the lowest in the nation. The average residential sales price is $151,054. The median value of owner occupied units was $135,700.
MAJOR INITIATIVES
For The Year. In FY 2009, the City completed several major projects and capital expenditures. Street and drainage projects for FY 2009 were primarily funded by SPLOST in the amount of $353,460. The City expended $234,000 on an intersection improvement at U.S. 301 South and Rucker Lane, and $119,461 on street repaving. The City’s Water and Sewer Department expended $731,238 to extend water and sewer mains along Cawana Road. This project was funded by a Georgia Environmental Facilities Authority (GEFA) loan. SPLOST funds in the amount of $365,124 were used to finance the extension of water mains on Jones Mill Road, engineering costs for the reclaimed water system and the extension of water and sewer lines out Lakeview Road, and the repairs of a well. In FY 2009, construction began on the Downtown Streetscape project. In 2005, the City was awarded a $530,000 Transportation Enhancement Grant (TE-21) to improve sidewalks and curb and gutter and for landscaping and the installation of decorative benches and lighting in the downtown area on East Main Street. An additional $300,000 was approved to fund the West Main Street phase of the project. In FY 2009, the City and County adopted the updated Comprehensive Plan. The Comprehensive Plan will guide them through the next 10 years. The update of the Comprehensive Plan will allow both jurisdictions to share data, partner on public involvement, and collaborate on important issues facing both the City and the County. This will result in a vision for the City that capitalizes on and preserves Statesboro’s historic, cultural and economic resources while providing for a better quality of life for our citizens. Equipment and vehicle replacements were included in the FY 2009 budget for the IT Department, Parks Department and Police Department. These replacements are part of a scheduled plan to maintain City equipment while reducing maintenance cost. Equipment replacements were also made in the Solid Waste Disposal and Solid Waste Collection Funds in the amount of $618,370. The City also was awarded a $345,875 State Homeland Security grant that provided equipment and training to prepare for and react to acts of
viii

terrorism. The Fire Department was awarded a $151,315 State Homeland Security grant that enabled the Fire Department to build and enhance capabilities to prevent, protect against, respond to, and recover from terrorist attacks, major disaster and other emergencies. For The Future. A 2007 SPLOST initiative approved in July, 2006, will provide the City with an estimated $21.7 million in funding for capital projects for FY 2008 - FY 2014. Several major projects are planned for FY 2010. In FY 2010, landfill closure/post-closure expenses and air rights in the Wayne County Landfill will continue to be funded by 2007 SPLOST in the amount of $1,166,000. In FY 2010, the City is looking at refinancing various City water and sewer system bond and loan obligations. The refinancing of the higher interest loans will result in an approximate net present value savings of $406,174 representing 6.0% of the City’s prior debt balance. The City would also realize cash flow relief through the first seven years of the refinancing.
FINANCIAL INFORMATION In developing and evaluating the City's accounting system, consideration is given to the adequacy of the internal control structure. Internal accounting controls are designed to provide reasonable, but not absolute, assurance regarding the safeguarding of assets against loss from unauthorized use or disposition, the reliability of financial statements, and maintaining accountability for assets. The concept of reasonable assurance recognizes that the cost of control should not exceed the benefits likely to be derived; and the evaluation of costs and benefits requires estimates and judgments by management. All internal control evaluations occur within the above framework. We believe that the City's internal control structure adequately safeguards assets and provides reasonable assurance of proper recording of financial transactions. The City's accounting records for general governmental operations are maintained on a modified accrual basis and reported on the same basis at the fund financial reporting level. However, at the government-wide financial reporting level, these activities are presented on the accrual basis. The City’s enterprise funds account for the cost of services using an "economic resources" measurement focus. This means that all assets and liabilities (whether current or non-current) associated with the funds are included on their balance sheets. Their operating statements present increases (revenues) and decreases (expenses) in net total assets. The accrual basis of accounting is used for the proprietary funds. Budgeting Controls. Budgets have been adopted and appropriated at the fund level for each City governmental fund. Budgetary control is maintained at the line-item level by the rendering of monthly reports of revenues and expenditures. Major variances between budget and actual are reviewed monthly with the City Council on an exceptions basis. Unexpended appropriations lapse at year-end for budgetary purposes and are subject to reappropriation in the following year.
Cash Management. It is the City’s policy to aggressively pursue all revenues due to the
ix

City including past due utility bills, court fines, and property taxes; and to pay all obligations on or before the due date. The City utilizes cash management and investment policies that emphasize safety of capital first, sufficient liquidity to meet obligations second, and the highest possible yield third. The City currently has 9 bank accounts that service 19 funds. In 2008, the City’s entire banking services were re-bid and a three-year contract was awarded to Branch Banking and Trust Company (BB &T). All City funds are deposited into a sweep investment account at a rate equal to the targeted federal funds rate multiplied by 102.5% (currently .18%).
Risk Management. The City of Statesboro is a member of the Georgia Interlocal Risk Management Agency (GIRMA). Administered by the Georgia Municipal Association, GIRMA is an intergovernmental risk-sharing fund created in 1987 to provide property and liability insurance coverage to Georgia local government entities. The City’s coverage under this program includes property (including boiler and machinery), auto physical damage and liability, law enforcement liability, general liability, public officials' liability, employee benefits liability, pollution liability, and fidelity liability (including crime and all employee bonds). GIRMA contracts with Gallagher Basset for claims administration and with Willis Caroon for marketing and administrative support and technical assistance. Premiums are based on each individual city’s loss experience and underwriting. Long-term Financial Planning. The City of Statesboro maintains a flexible, yet thorough five year capital improvement plan whereby capital needs are identified several years before funding and implementation, to allow adequate time for planning. This plan also provides for the orderly replacement of facilities and equipment. The City’s current five year plan has identified $62,000,000 in projected expenditures through FY 2014; $14,000,000 of this was budgeted for the 2009 fiscal year, of which $10,000,000 million is for the extension and repair of water and sewer lines. In FY 2010, the City has budgeted $9,000,000 in projected expenditures, with $5,000,000 being funded from the 2007 Special Purpose Local Option Sales Tax. The projects funded from the 2007 SPLOST include $510,000 in street projects, $500,000 for fire equipment, $500,000 for police vehicles, $860,000 in water and sewer projects, $300,000 for solid waste collection equipment, and $1,200,000 for solid waste disposal projects. Relevant Financial Polices. The City of Statesboro financial policies state that the City will not appropriate fund balance or net assets in any fund that would hinder meeting the reserve targets. However, with the recent recession, the City has opted to appropriate fund balance and net assets to cover revenue shortfall from business licenses and building permits and unexpected expenditures in the last quarter of the fiscal year. The City also implemented furlough days for all employees the last quarter of the fiscal year in order to reduce the amount of fund balance or net assets that would need to be used.
OTHER INFORMATION
Independent Audit. State law requires annual audits of the accounting records by independent certified public accountants selected by the City Council. This requirement has been met, and the auditor’s opinion is included in this report. The goal of the independent audit is to provide reasonable assurance that the financial statements are free
x

xi

William S. Hatcher, II Mayor
Gary L. Lewis District 2
William P. Britt District 3
Travis L. Chance District 5
Joe R. Brannen District 4
Tommy Blitch District 1
CITY OF STATESBORO, GEORGIA MAYOR AND COUNCIL
In office since January 2000 Current term expires December 2009
In office since January 1998 Current term expires December 2011
In office since January 2004 Current term expires December 2011
In office since September 1998 Current term expires December 2009
In office since January 2008 Current term expires December 2011
In office since 2004 Current term expires December 2009
xiii

NAME POSITION
LENGTH OF TIME WITH
CITY
Shane Haynes City Manager 1 year
Sam Brannen City Attorney 43 years
Cindy West Finance Director 12 years
Sue Starling City Clerk 19 years
Jason Boyles City Engineer 8 years
Dennis Merrifield Fire Chief 3 years
Steve Hotchkiss Natural Gas Director 19 years
Christian Lentz Planning Director 1 year
Stan York Police Chief 33 years
Bobby Colson Public Works Director 22 years
Wayne Johnson Water/Wastewater Director 28 years
Seth LaVine Information Technology Director 1 year
CITY OF STATESBORO, GEORGIAAPPOINTED PRINCIPAL OFFICIALS
As of June 30, 2009
xiv

ORGANIZATIONAL CHART FOR THE CITY OF STATESBORO
Mayor and Council
Citizens
Director of Public Works Public Works Administration
Solid Waste Collection—Residential Solid Waste Collection—Commercial Solid Waste Collection—Yardwaste
Solid Waste Disposal Fleet Management
Parks Streets
City Engineer Engineering
Protective Inspections Code Enforcement
Governmental Buildings
City Clerk Clerks
Municipal Court
Fire Chief Fire Suppression Fire Prevention
Inspections
Police Chief Support Services
Uniform/Patrol Division Criminal Investigation Division
Animal Control
Director of Planning
Zoning Annexation
Subdivision Regulation
City Attorney City Manager City Judge
Director of Natural Gas Sales/Marketing
Repair & Maintenance System Expansions
Director of Water/Sewer Water Distribution Sewer Collection
Wastewater Treatment Industrial Pretreatment
Director of Finance Accounting
Finance Payroll
Director of Human Resources Personnel Benefits
Director of Purchasing
IT Systems Administrator
xv

Financial
1
2

Management’s Discussion And Analysis

MANAGEMENT'S DISCUSSION AND ANALYSIS (Unaudited) City of Statesboro, Georgia June 30, 2009
MANAGEMENT’S DISCUSSION AND ANALYSIS
Within this section of the City of Statesboro, Georgia’s (the City’s) annual financial report, the City’s management is pleased to provide this narrative discussion and analysis of the financial activities of the City for the fiscal year ended June 30, 2009. The City’s financial performance is discussed and analyzed within the context of the accompanying financial statements and disclosures following this section. Financial Highlights • The City had total net assets (assets exceeded liabilities) of $58,887,538 at 2009 fiscal year-end. That is $1,858,967 or 3.1%,
lower than the total net assets of $60,746,505 at 2008 fiscal year-end . Fiscal year 2008 had seen a $1,755,530, or 3.0%, increase in total net assets.
• Total net assets are comprised of the following:
(1) Capital assets, net of related debt, of $57,032,563 include property and equipment, net of accumulated depreciation, and reduced for outstanding debt related to the purchase or construction of capital assets. The figure for fiscal year 2008 was $57,992,617. That is a decrease of $960,054, or 1.7%. There was an increase of $1,679,091, or 3.0%, for fiscal year 2008.
(2) Net assets of $1,347,560 are restricted by constraints imposed from outside the City such as debt covenants, grantors, laws,
or regulations. That is $160,493, or 13.5%, more than the fiscal year 2008 amount of $1,187,067. That was $484,402 (or 68.9%) more than fiscal year 2007’s $702,665.
(3) Unrestricted net assets of $507,415 represent the portion available to maintain the City’s continuing obligations to citizens
and creditors. This is a $1,059,406(or 67.6%) decrease over the fiscal year 2008 total of $1,566,821. That amount was a $407,963 (or 20.7%) decrease over fiscal year 2007’s figure of $1,974,784. FY 2007 had seen a $4,666,134 (or 70.3%) decrease over FY 2006’s amount. In fiscal year 2009, unrestricted net assets for business-type activities decreased by $355,762 primarily due to the Water and Sewer Operating Fund making an additional transfer to the General fund. The unrestricted net assets for the governmental activities in fiscal year 2009 declined by $703,644 (or 48.7%) primarily due to the decline in building permits, business licenses, the settlement of a lawsuit by a former employee and the write off of a debt owed to the City by the Arts Council.
• The City’s governmental funds reported total ending fund balance of $2,068,826, compared to $2,353,350 in fiscal year 2008.
This is a $284,524 (or 12.1%) decrease. The primary reason is the lawsuit settlement and the receivable write off mentioned above. The fiscal year 2008 ending fund balance for governmental funds showed an increase of $982,956 (or 71.7%). Unreserved fund balance of $1,883,772 for fiscal year 2009 is a $286,339 (or 13.2%) decrease from fiscal year 2008. Unreserved fund balance of $2,170,111 for fiscal year 2008 was a $1,158,922 (or 114.6%) increase from the $1,011,189 in fiscal year 2007.
• At the end of the current fiscal year, unreserved fund balance for the General Fund was $947,789, or 7.0% of total General Fund
expenditures and transfers out in the next fiscal year’s budget. That compares to $1,478,379 or 11.2% of total General Fund expenditures and transfers out in fiscal year 2008. Fiscal year 2007’s unreserved fund balance for the General Fund was $2,595,299, or 18.9% of total General Fund expenditures.
The above financial highlights are explained in more detail in the “financial analysis” section of this document. Overview of the Financial Statements This Management Discussion and Analysis document introduces the City’s basic financial statements. The basic financial statements include: (1) government-wide financial statements, (2) fund financial statements, and (3) notes to the basic financial statements. The City also includes in this report additional information to supplement the basic financial statements.
3

MANAGEMENT'S DISCUSSION AND ANALYSIS (Unaudited) City of Statesboro, Georgia June 30, 2009
Government-wide Financial Statements The City’s annual report includes two government-wide financial statements. These statements provide both long-term and short-term information about the City's overall financial status. Financial reporting at this level uses a perspective similar to that found in the private sector with its basis in accrual accounting and elimination or reclassification of activities between funds. The first of these government-wide statements is the Statement of Net Assets. This is the government-wide statement of position presenting information that includes all of the City’s assets and liabilities, with the difference between them reported as net assets. Over time, increases or decreases in net assets may serve as a useful indicator of whether the financial position of the City as a whole is improving or deteriorating. Evaluation of the overall health of the City would extend to other non-financial factors such as diversification of the taxpayer base or the condition of City infrastructure, in addition to the financial information provided in this report. The second government-wide statement is the Statement of Activities, which reports how the City’s net assets changed during the current fiscal year. All current year revenues and expenses are included regardless of when cash is received or paid. An important purpose of the design of the statement of activities is to show the financial reliance of the City's distinct activities or functions on revenues provided by the City's taxpayers. Both government-wide financial statements distinguish governmental activities of the City that are principally supported by sales and property taxes from business-type activities that are intended to recover all or a significant portion of their costs through user fees and charges. Governmental activities include general government, public safety, and public works. Business-type activities include the natural gas distribution system, the water and wastewater systems, and the solid waste collection and disposal systems. The government-wide financial statements are presented on pages 15 & 16 of this report. Fund Financial Statements A fund is an accountability unit used to maintain control over resources segregated for specific activities or objectives. The City uses funds to ensure and demonstrate compliance with finance-related laws and regulations. Within the basic financial statements, fund financial statements focus on the City’s most significant funds rather than the City as a whole. Major funds are separately reported while all other (non-major) funds are combined into a single, aggregated presentation. Individual fund data for non-major funds is provided in the form of combining statements in a later section of this report. The City has two kinds of funds: 1. Governmental funds are reported in the fund financial statements and encompass the same functions reported as governmental activities in the government-wide financial statements. However, the focus is very different with fund statements providing a distinctive view of the City’s governmental funds. These statements report short-term fiscal accountability focusing on the use of spendable resources and balances of spendable resources available at the end of the year. They are useful in evaluating annual financing requirements of governmental programs and the commitment of spendable resources for the near-term. Since the government-wide focus includes the long-term view, comparisons between these two perspectives may provide insight into the long-term impact of short-term financing decisions. Both the governmental fund balance sheet and the governmental fund operating statement provide a reconciliation to assist in understanding the differences between these two perspectives. The basic governmental fund financial statements are presented on pages 17-23 of this report. Individual fund information for non-major governmental funds is found in combining statements in a later section of this report. 2. Proprietary funds are reported in the fund financial statements and generally report services for which the City charges customers a fee. The City’s proprietary funds are classified as enterprise funds. These enterprise funds essentially encompass the same functions reported as business-type activities in the government-wide statements. Services are provided to customers external to the City organization for gas, water and wastewater utilities; and for solid waste collection and disposal systems. The basic enterprise fund financial statements are presented on pages 24-27 of this report.
4
MANAGEMENT'S DISCUSSION AND ANALYSIS (Unaudited) City of Statesboro, Georgia June 30, 2009
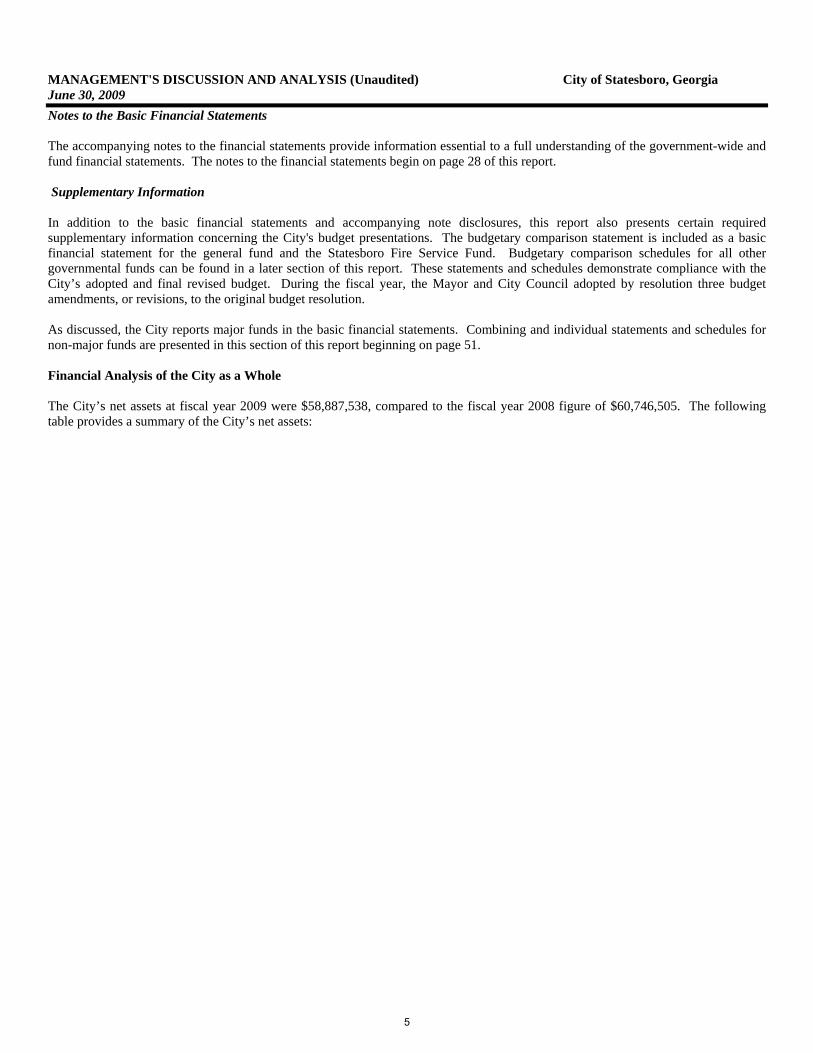
Notes to the Basic Financial Statements The accompanying notes to the financial statements provide information essential to a full understanding of the government-wide and fund financial statements. The notes to the financial statements begin on page 28 of this report. Supplementary Information In addition to the basic financial statements and accompanying note disclosures, this report also presents certain required supplementary information concerning the City's budget presentations. The budgetary comparison statement is included as a basic financial statement for the general fund and the Statesboro Fire Service Fund. Budgetary comparison schedules for all other governmental funds can be found in a later section of this report. These statements and schedules demonstrate compliance with the City’s adopted and final revised budget. During the fiscal year, the Mayor and City Council adopted by resolution three budget amendments, or revisions, to the original budget resolution. As discussed, the City reports major funds in the basic financial statements. Combining and individual statements and schedules for non-major funds are presented in this section of this report beginning on page 51. Financial Analysis of the City as a Whole The City’s net assets at fiscal year 2009 were $58,887,538, compared to the fiscal year 2008 figure of $60,746,505. The following table provides a summary of the City’s net assets:
5

MANAGEMENT'S DISCUSSION AND ANALYSIS (Unaudited) City of Statesboro, Georgia June 30, 2009
The current ratio divides the current assets by the current liabilities, and is an indication of the ability to pay current obligations. For fiscal year 2009, the current ratio for governmental activities is 1.8 and 1.3 for business type activities. For fiscal year 2008, the current ratio for governmental activities was 2.0, and for business type activities 1.4. For the City, overall, the current ratio for fiscal year 2009 is 1.5, compared to 1.7 for fiscal year 2008. For fiscal year 2007, the current ratio for governmental activities was 2.1 and for business type activities 1.7. For the City, overall, the current ratio was 1.9. These ratios have remained fairly consistent for both the governmental activities and the business type activities in all three years. Net assets for fiscal year 2009 decreased by $399,067 for governmental activities, and by $1,459,900 for business-type activities. Net assets for fiscal year 2008 increased by $937,667 for governmental activities and by $817,863 for business type activities. Net assets also increased in fiscal year 2007. Note that in fiscal year 2009, 93.4%, and in fiscal year 2008, 91.4% of the governmental activities’ net assets were invested in capital assets. On the business type activities, the City has spent 99.5% of its net assets in fiscal year 2009, and 98.5% in fiscal year 2008 on capital assets. This is not unusual, as the business type activities are primarily utilities, which are very capital-intensive operations. Expansion of these systems is necessary for the continued growth of the City and for its financial position, as these utility systems generate considerable revenues for all the City’s operations. 96.8% in fiscal year 2009, and 95.5% in fiscal year 2008 of the City’s total net assets were included in capital assets.
2009 2008 2009 2008 2009 2008 2009 2008Assets: Current assets 4,039,691$ 4,765,091$ 2,873,996$ 4,084,405$ 6,913,687$ 8,849,496$ 9% 11%
Capital assets 25,720,181 25,880,086 44,056,922 44,050,494 69,777,103 69,930,580 90% 88%
Other noncurrent assets - - 435,998 460,625 435,998 460,625 1% 1%
Total assets 29,759,872 30,645,177 47,366,916 48,595,524 77,126,788 79,240,701 100% 100%
Liabilities: Current liabilities 2,197,448 2,422,488 2,270,460 2,879,385 4,467,908 5,301,873 24% 29%
Long-term liabilities 1,888,862 2,150,060 11,882,480 11,042,263 13,771,342 13,192,323 76% 71%
Total liabilities 4,086,310 4,572,548 14,152,940 13,921,648 18,239,250 18,494,196 100% 100%
Net assets: Investment in capital assets, net of debt 23,985,317 23,841,321 33,047,246 34,151,296 57,032,563 57,992,617 97% 95%
Restricted 948,367 787,786 399,193 399,281 1,347,560 1,187,067 2% 2%
Unrestricted 739,878 1,443,522 (232,463) 123,299 507,415 1,566,821 1% 3%
Total net assets 25,673,562$ 26,072,629$ 33,213,976$ 34,673,876$ 58,887,538 60,746,505 100% 100%
Summary of Net Assets
Business-type ActivitiesGovernmental Activities Total of TotalPercentage
6

MANAGEMENT'S DISCUSSION AND ANALYSIS (Unaudited) City of Statesboro, Georgia June 30, 2009
The following table provides a summary of the changes in net assets, with comparative data for both fiscal years 2009 and 2008:
Governmental Business Percentage Governmental Business PercentageActivities Activities Total of Total Activities Activities Total of Total
Revenues: Program: Charges for services 3,525,530$ 17,412,955$ 20,938,485$ 65% 3,231,793$ 18,208,538$ 21,440,331$ 62% Operating grants 162,191 48,198 210,389 1% 359,659 45,586 405,245 1% Capital grants and contributions 2,561,768 138,792 2,700,560 8% 4,306,729 631,417 4,938,146 14% General: Taxes 7,912,524 - 7,912,524 25% 7,601,291 - 7,601,291 22% Other 34,097 239,090 273,187 1% 100,435 321,195 421,630 1%
Total revenues 14,196,110 17,839,035 32,035,145 100% 15,599,907 19,206,736 34,806,643 100%
Program Expenses:
General government 2,683,348 - 2,683,348 8% 2,266,551 - 2,266,551 7% Municipal court 697,203 - 697,203 2% 635,975 - 635,975 2% Public safety 8,465,499 - 8,465,499 25% 7,978,175 - 7,978,175 24% Public works 2,452,550 - 2,452,550 7% 2,531,841 - 2,531,841 8% Community development 539,771 - 539,771 2% 495,059 - 495,059 1% Parks and cemetries 533,706 - 533,706 2% 528,039 - 528,039 2% Engineering 760,687 - 760,687 2% 701,021 - 701,021 2% Planning and zoning 285,709 - 285,709 1% 241,067 - 241,067 1% Community services 535,258 - 535,258 2% 349,975 - 349,975 1% Interest 30,966 - 30,966 0% 46,241 - 46,241 0% Water and sewer - 6,557,573 6,557,573 19% - 6,394,274 6,394,274 19% Gas - 5,040,258 5,040,258 15% - 5,299,783 5,299,783 16% Solid waste collection - 2,026,631 2,026,631 6% - 1,968,174 1,968,174 6% Solid waste disposal - 3,284,953 3,284,953 10% - 3,614,938 3,614,938 11%
Total expenses 16,984,697 16,909,415 33,894,112 100% 15,773,944 17,277,169 33,051,113 100%
Excess (deficiency) (2,788,587) 929,620 (1,858,967) (174,037) 1,929,567 1,755,530
Transfers 2,389,521 (2,389,521) - 1,111,704 (1,111,704) -
Change in net assets (399,067) (1,459,900) (1,858,967) 937,667 817,863 1,755,530
Beginning net assets 26,072,629 34,673,876 60,746,505 25,134,962 33,856,013 58,990,975
Ending net assets 25,673,562$ 33,213,976$ 58,887,537$ 26,072,629$ 34,673,876$ 60,746,505$
Summary of Changes in Net Assets2009 2008
7

MANAGEMENT'S DISCUSSION AND ANALYSIS (Unaudited) City of Statesboro, Georgia June 30, 2009
GOVERNMENTAL REVENUES Bulloch County (including the City of Statesboro) is one of only eight counties out of 159 in Georgia that do not receive any of the 1% Local Option Sales Tax (LOST). A local Constitutional Amendment was passed by the Georgia General Assembly in the 1981 Session (Georgia Laws, 1981, p. 1931) which called for a referendum on the question of whether or not the local option sales tax should go to the Bulloch County Board of Education, with a dollar for dollar reduction in the school property tax. (Boards of Education in Georgia are limited to a maximum millage rate of 20.) The referendum passed on November 2, 1982. Since that time, this money has gone to the Board of Education. Since most Georgia counties and cities negotiate a formula to distribute this sales tax among the county and city governments in that county, this puts both the City of Statesboro and Bulloch County government at a distinct disadvantage relative to almost all the other cities and counties in the state. It means that we have to rely more heavily on the local property tax and user fees than these other cities and counties. For example, if the City and County had equally split this approximately $10,392,610 in local option sales taxes in fiscal year 2009, the City would have had $5,196,305 in additional revenue. That is more than the City collected in property taxes. In effect, the City could have done away with its property tax levy totally if not for this local legislation and referendum in the early 1980's. However, the City of Statesboro and Bulloch County (and the other cities in the county) do share the proceeds of a 1% Special Purpose Local Option Sales Tax (SPLOST), which has passed referendums in both 2002 for a five-year term and in 2006 (beginning collections in 2007) for a six-year term. In fiscal year 2009, sales taxes of $1,885,252 out of $14,196,110 in total governmental funds revenues, or 13.3%, were received from the 2002 SPLOST and the 2007 SPLOST. However, $1,371,792 of that money was transferred to the business-type funds for capital projects (water and sewer and solid waste disposal systems). Only $513,460 remained for governmental activities, or only 3.6% of the governmental funds' total revenues. And all of that money was spent on capital outlay, not operating costs, as the SPLOST funds are earmarked by state law specifically for capital outlay only. Similarly, in fiscal year 2008, $4,025,812 in sales taxes represented 25.8% of the $15,573,876 in governmental funds revenues. But all of it was used to finance capital projects. The City is heavily reliant on taxes to support governmental activities operations. In total, taxes make up 55.7% of revenues as compared to 48.7% in fiscal year 2008. Property taxes provided $3,785,398 or 26.7% of the City’s total governmental activities revenue as compared to 23.8% in fiscal year 2008. Also, note that program revenues covered 36.8% in fiscal year 2009, and 50.1% in fiscal year 2008 of governmental operating expenses. This means that the government’s taxpayers and the City’s other general revenues funded the remaining 63.2% in fiscal year 2009, and 49.9% in fiscal year 2008 of the governmental activities. As this documents, the general economy and the local businesses have a major impact on the City’s revenue streams.
GOVERNMENTAL FUNCTIONAL EXPENSES The public safety function comprises 49.8% of the City’s total governmental activity expenses and 25.0% of the total City expenses in fiscal year 2009. In fiscal year 2008, the figures were 50.6% and 24.1% respectively. In fiscal year 2009, general government totaled 15.8% of the total governmental activity expense, and 7.9% of the total City expenses. In fiscal year 2008, general government totaled 14.3% of the total governmental activity expenses, and 6.9% of the total City expenses. Of the total $17 million of governmental expenses, depreciation is 10.1% of that total. In fiscal year 2008, the numbers were $15.8 million and 8.2% respectively. The following table presents the cost of each of the City’s programs, including the net costs (i.e., total cost less revenues generated by the activities). The net costs illustrate the financial burden that was placed on the City’s taxpayers by each of these functions.
8

MANAGEMENT'S DISCUSSION AND ANALYSIS (Unaudited) City of Statesboro, Georgia June 30, 2009
For fiscal year 2009 and 2008, all functions required a subsidy from general revenues except for public works in fiscal year 2008. In fiscal year 2008, $4,025,812 in SPLOST revenue received from the County was included in program revenue for public works.
BUSINESS-TYPE ACTIVITIES
Revenues vs. Expenses
For fiscal year 2007, the operating revenues for the utility funds were 5.8% below fiscal year 2006, and operating expenses were 1.3% below fiscal year 2006. Within the total business type activities of the City, these activities reported $1,021,728 in operating income, or a decrease of 46.1% compared to fiscal year 2006. After transfers in and out between other funds, these funds reported a profit of $130,153, or a decrease of 66.9% compared to fiscal year 2006. . The primary reasons for this decrease were a reduction in the use of water and significant rate increases for electricity; and a significant reduction in natural gas usage due to a mild winter and higher gas prices. This decreased residential usage, and increased conservation by commercial customers. For fiscal year 2008, the operating revenues for the utility funds were 3.5% higher than 2007 and operating expenses were .6% below fiscal year 2007. Within the total business type activities of the City, these activities reported $1,751,428 in operating income, or a increase of 71.4% compared to fiscal year 2007. After transfers in and out between other funds, these funds reported a profit of $939,555 or an increase of $809,402 compared to fiscal year 2007. The primary reasons for this increase were due to a capital contribution for the Gateway Phase II Industrial Park water and sewer lines expansion and a decrease in the cost of natural gas. For fiscal year 2009, the operating revenues for the utility funds were 4.5% lower than 2008 and operating expenses were 2.4% below fiscal year 2008. Within the total business type activities of the City, these activities reported $1,328,682 in operating income, or a decrease of 24.1% compared to fiscal year 2008. After transfers in and out between other funds, these funds reported a loss of $1,317,492, or a decrease of $2,257,047, compared to fiscal year 2008. The primary reasons for this decrease were due to a decrease in water usage and larger transfers from the enterprise funds to the general fund.
T otal C ost N et C ost T otal C ost N et C ostof S ervices of S ervices of S ervices of Services
G eneral governm ent 2 ,683 ,348$ 1 ,917 ,687$ 2 ,266 ,551$ 1 ,484 ,493$ M unicipal court 697 ,203 697 ,203 635 ,975 635 ,975 P ublic safety 8 ,465 ,499 5 ,209 ,571 7 ,978 ,175 5 ,134 ,967 P ublic w orks 2 ,452 ,550 330 ,787 2 ,531 ,841 (1 ,576 ,587) C om m unity developm ent 539 ,771 539 ,771 495 ,059 490 ,559 P arks and cem etries 533 ,706 533 ,706 528 ,039 528 ,039 E ngineering 760 ,687 660 ,050 701 ,021 547 ,284 P lanning and zoning 285 ,709 285 ,709 241 ,067 241 ,067 C om m unity services 535 ,258 529 ,758 349 ,975 343 ,725 In terest 30 ,966 30 ,966 46 ,241 46 ,241
To tal 16 ,984 ,698 10 ,735 ,209$ 15 ,773 ,944 7 ,875 ,763$
G overnm ental A ctivities2009 2008
9

MANAGEMENT'S DISCUSSION AND ANALYSIS (Unaudited) City of Statesboro, Georgia June 30, 2009
Each specific fund reported the following operating income or loss:
2009 2008 Percent Percent Amount Change Amount Change
Water and sewer fund $ 950,051 (38.0)% $ 1,532,011 24.6% Gas fund $1,004,836 6.9% $ 939,540 121.3%
Solid waste collection fund $ 537,567 1.4% $ 530,190 19.0% Solid waste disposal fund $(1,163,772) 6.9% $ (1,250,313) (16.0)%
The operating income for the water and sewer fund decreased by 38.0% in fiscal year 2009 since operating revenues were down 6.2% and operating expenses were up 2.1%. The gas fund’s operating income increased by 6.9% over fiscal year 2008. Operating revenues were down 3.1% and operating expenses were down 4.9% primarily because of a decrease in the cost of natural gas. The solid waste collection fund’s operating income increased 1.4% from last year since operating revenues were 2.7% above fiscal year 2008 and expenses were 3.1% above fiscal year 2008. Finally, the solid waste disposal fund's operating loss decreased by 6.9% from fiscal year 2008. Operating revenues decreased by 10.2% and operating expenses decreased by 9.1%. The revenues do not cover all expenses, and SPLOST is therefore used to make up the difference. The City transfers resources from its enterprise funds to the general fund for the following reasons:
• Since the City does not do any indirect cost allocation, the transfers help cover the General Fund’s indirect costs that could be charged to the enterprise funds as indirect costs. These costs include the various staff divisions, such as personnel, finance, purchasing, and records, as well as part of the City Manager's time.
• If these enterprise funds were privately owned, the City would be entitled to a franchise fee equal to 5% of the gross
revenues, similar to CATV, electricity, or telephone service providers. These transfers offset some of these costs.
• If these enterprise funds were privately owned, the City would be entitled to property taxes on the property in service, net of accumulated depreciation, similar to CATV, electricity, or telephone service providers. These transfers are made in lieu of property taxes.
• If these enterprise funds were privately owned, their approved rate tariffs would include a reasonable return on shareholder
equity. Since the City’s taxpayers are in fact the investors who started and financed these operations, they are being rewarded with a comparable return on equity in the form of lower property taxes. This return can be made while still maintaining retail rates that are at or below the surrounding market prices offered by private utility companies. For example, the City’s natural gas system rates are considerably lower than any investor-owned utility or private gas marketer in our geographic area.
• Hosting a sizable regional university, as well as being the county seat, results in a considerable amount of state and county
property not being subject to property taxation. However, services such as police, fire, street repair and cleaning, and traffic signalization must be provided and expanded as needed, and must be funded from general revenues. Transfers from the enterprise funds help offset this burden, while sharing it more equitably among all citizens and institutions.
10
MANAGEMENT'S DISCUSSION AND ANALYSIS (Unaudited) City of Statesboro, Georgia June 30, 2009
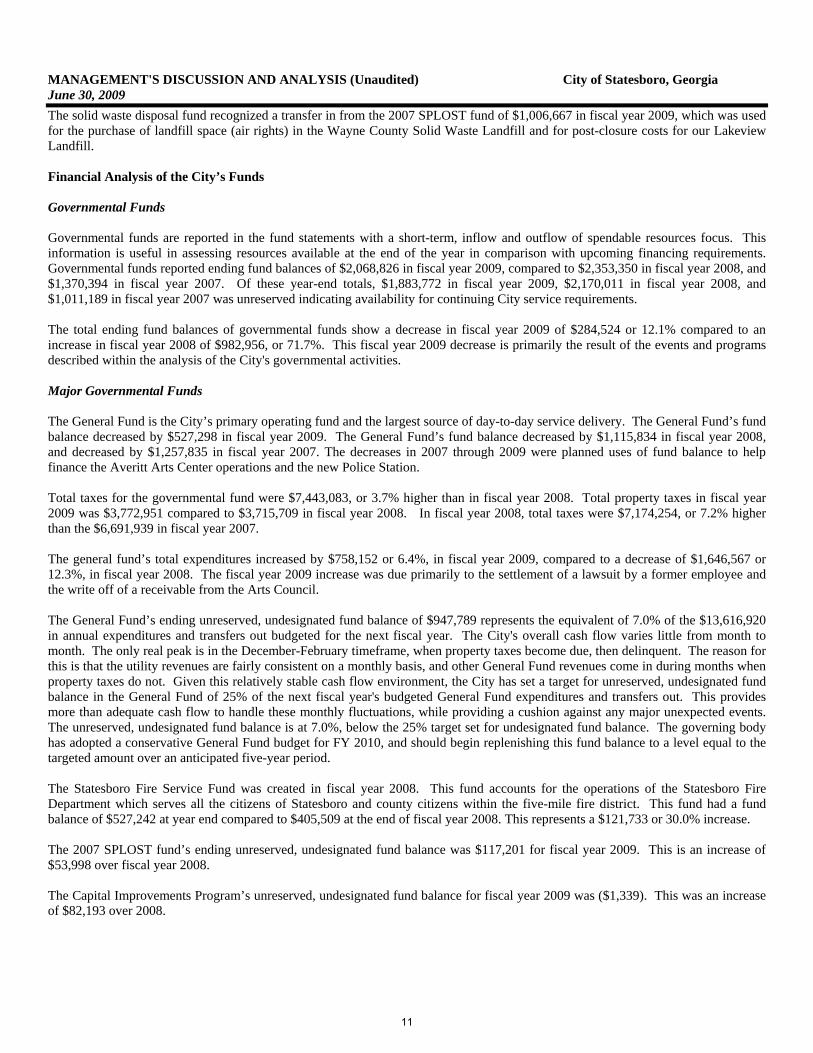
The solid waste disposal fund recognized a transfer in from the 2007 SPLOST fund of $1,006,667 in fiscal year 2009, which was used for the purchase of landfill space (air rights) in the Wayne County Solid Waste Landfill and for post-closure costs for our Lakeview Landfill. Financial Analysis of the City’s Funds Governmental Funds Governmental funds are reported in the fund statements with a short-term, inflow and outflow of spendable resources focus. This information is useful in assessing resources available at the end of the year in comparison with upcoming financing requirements. Governmental funds reported ending fund balances of $2,068,826 in fiscal year 2009, compared to $2,353,350 in fiscal year 2008, and $1,370,394 in fiscal year 2007. Of these year-end totals, $1,883,772 in fiscal year 2009, $2,170,011 in fiscal year 2008, and $1,011,189 in fiscal year 2007 was unreserved indicating availability for continuing City service requirements. The total ending fund balances of governmental funds show a decrease in fiscal year 2009 of $284,524 or 12.1% compared to an increase in fiscal year 2008 of $982,956, or 71.7%. This fiscal year 2009 decrease is primarily the result of the events and programs described within the analysis of the City's governmental activities. Major Governmental Funds The General Fund is the City’s primary operating fund and the largest source of day-to-day service delivery. The General Fund’s fund balance decreased by $527,298 in fiscal year 2009. The General Fund’s fund balance decreased by $1,115,834 in fiscal year 2008, and decreased by $1,257,835 in fiscal year 2007. The decreases in 2007 through 2009 were planned uses of fund balance to help finance the Averitt Arts Center operations and the new Police Station. Total taxes for the governmental fund were $7,443,083, or 3.7% higher than in fiscal year 2008. Total property taxes in fiscal year 2009 was $3,772,951 compared to $3,715,709 in fiscal year 2008. In fiscal year 2008, total taxes were $7,174,254, or 7.2% higher than the $6,691,939 in fiscal year 2007. The general fund’s total expenditures increased by $758,152 or 6.4%, in fiscal year 2009, compared to a decrease of $1,646,567 or 12.3%, in fiscal year 2008. The fiscal year 2009 increase was due primarily to the settlement of a lawsuit by a former employee and the write off of a receivable from the Arts Council. The General Fund’s ending unreserved, undesignated fund balance of $947,789 represents the equivalent of 7.0% of the $13,616,920 in annual expenditures and transfers out budgeted for the next fiscal year. The City's overall cash flow varies little from month to month. The only real peak is in the December-February timeframe, when property taxes become due, then delinquent. The reason for this is that the utility revenues are fairly consistent on a monthly basis, and other General Fund revenues come in during months when property taxes do not. Given this relatively stable cash flow environment, the City has set a target for unreserved, undesignated fund balance in the General Fund of 25% of the next fiscal year's budgeted General Fund expenditures and transfers out. This provides more than adequate cash flow to handle these monthly fluctuations, while providing a cushion against any major unexpected events. The unreserved, undesignated fund balance is at 7.0%, below the 25% target set for undesignated fund balance. The governing body has adopted a conservative General Fund budget for FY 2010, and should begin replenishing this fund balance to a level equal to the targeted amount over an anticipated five-year period. The Statesboro Fire Service Fund was created in fiscal year 2008. This fund accounts for the operations of the Statesboro Fire Department which serves all the citizens of Statesboro and county citizens within the five-mile fire district. This fund had a fund balance of $527,242 at year end compared to $405,509 at the end of fiscal year 2008. This represents a $121,733 or 30.0% increase. The 2007 SPLOST fund’s ending unreserved, undesignated fund balance was $117,201 for fiscal year 2009. This is an increase of $53,998 over fiscal year 2008. The Capital Improvements Program’s unreserved, undesignated fund balance for fiscal year 2009 was ($1,339). This was an increase of $82,193 over 2008.
11

MANAGEMENT'S DISCUSSION AND ANALYSIS (Unaudited) City of Statesboro, Georgia June 30, 2009
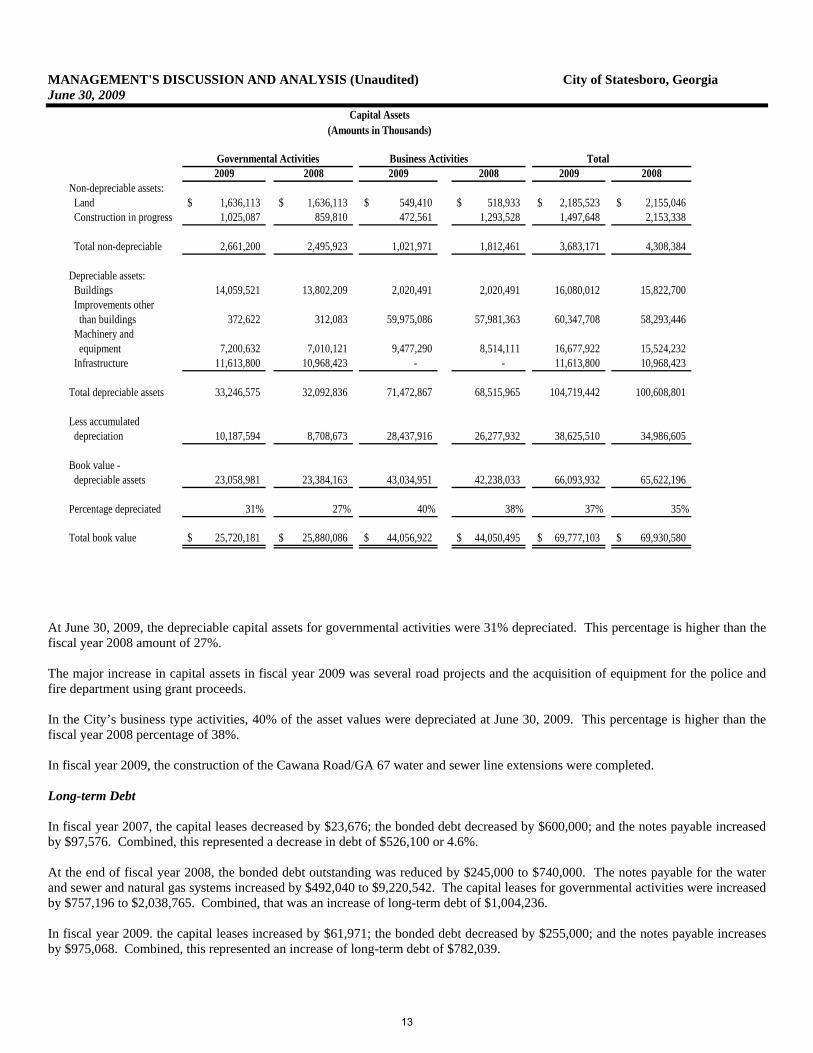
The Proprietary Funds The proprietary funds statements share the same focus as the government-wide statements, reporting both short-term and long-term information about financial status. Each of the fund statements give detailed information about their financial condition. Budgetary Highlights The General Fund – The revenue side of the budget was amended downward by $216,195, or 2.1% primarily to reflect lower collections of licenses and permits. Overall, the City recognized revenues equal to 100.9% of budgeted revenues in the final appropriated budget. The total expenditure budget was increased through budget amendments by $603,572 or 5.1%. Overall, the City recognized expenditures equal to $214,216 more than, or 101.7%, of budgeted expenditures in the final appropriated budget. The budget for transfers in was amended upward by $951,313, or 36.6% to reflect the increased transfers from the enterprise funds. The budget for transfers out was amended upward by $207,000, or 14.7% to reflect the increased transfer to the Benefits Insurance Fund. In summary, the budget was overspent by 1.7%, while revenue estimates were .9% over. On the revenue side of the budget, property taxes came in $17,146 lower than the amended budget. Automobile taxes came in $20,972 less than budgeted. Franchise fees came in $34,907 more than budgeted. Licenses and Permits came in $3,995 more than budgeted. The budgeted amount had been amended downward due to the decline in the construction industry. Fines and Forfeitures came in $63,419 more than budgeted. In total, General Fund revenues came in $89,510 more than the budgeted amount. On the expenditure side, the City Clerk’s Office, Police Department, Engineering, and Planning costs were considerably below the budgeted amounts. Governing Body, Human Resources, Streets and Arts Center exceeded the budget due to some end of year adjustments. Overall, the General Fund expenditures were $214,216 more than budgeted. Fund Balance was budgeted to decrease by $348,639 primarily due to a decrease in licenses and permits and the settlement of a lawsuit. However, fund balance decreased by $178,659 more than budgeted, to end at $527,298 less than the previous year’s fund balance. The FY 2010 Budget for the General Fund has used very conservative revenue projections to build the fund balance as discussed earlier. Capital Assets and Debt Administration Capital Assets The City's investment in capital assets, net of accumulated depreciation, for governmental (including the fleet management internal service fund) and business-type activities as of June 30, 2009 was $25,720,181 and $44,056,922 respectively, for a total of $69,777,103. That compares to fiscal year 2008 numbers of $25,880,086 and $44,050,494 respectively, for a total of $69,930,580. The fiscal year 2009 totals in this net investment were a .6% decrease for governmental and a .01% increase for business-type activities. The overall decrease was .2% for the City as a whole. See Note 3D for additional information about changes in capital assets during the fiscal year and outstanding at the end of the year. The following table provides a summary of capital asset activity.
12
MANAGEMENT'S DISCUSSION AND ANALYSIS (Unaudited) City of Statesboro, Georgia June 30, 2009
Business Activities Total2009 2008 2009 2008 2009 2008
Non-depreciable assets: Land 1,636,113$ 1,636,113$ 549,410$ 518,933$ 2,185,523$ 2,155,046$ Construction in progress 1,025,087 859,810 472,561 1,293,528 1,497,648 2,153,338
Total non-depreciable 2,661,200 2,495,923 1,021,971 1,812,461 3,683,171 4,308,384
Depreciable assets: Buildings 14,059,521 13,802,209 2,020,491 2,020,491 16,080,012 15,822,700 Improvements other than buildings 372,622 312,083 59,975,086 57,981,363 60,347,708 58,293,446 Machinery and equipment 7,200,632 7,010,121 9,477,290 8,514,111 16,677,922 15,524,232 Infrastructure 11,613,800 10,968,423 - - 11,613,800 10,968,423
Total depreciable assets 33,246,575 32,092,836 71,472,867 68,515,965 104,719,442 100,608,801
Less accumulated depreciation 10,187,594 8,708,673 28,437,916 26,277,932 38,625,510 34,986,605
Book value - depreciable assets 23,058,981 23,384,163 43,034,951 42,238,033 66,093,932 65,622,196
Percentage depreciated 31% 27% 40% 38% 37% 35%
Total book value 25,720,181$ 25,880,086$ 44,056,922$ 44,050,495$ 69,777,103$ 69,930,580$
Capital Assets
Governmental Activities
(Amounts in Thousands)
At June 30, 2009, the depreciable capital assets for governmental activities were 31% depreciated. This percentage is higher than the fiscal year 2008 amount of 27%. The major increase in capital assets in fiscal year 2009 was several road projects and the acquisition of equipment for the police and fire department using grant proceeds. In the City’s business type activities, 40% of the asset values were depreciated at June 30, 2009. This percentage is higher than the fiscal year 2008 percentage of 38%. In fiscal year 2009, the construction of the Cawana Road/GA 67 water and sewer line extensions were completed. Long-term Debt In fiscal year 2007, the capital leases decreased by $23,676; the bonded debt decreased by $600,000; and the notes payable increased by $97,576. Combined, this represented a decrease in debt of $526,100 or 4.6%. At the end of fiscal year 2008, the bonded debt outstanding was reduced by $245,000 to $740,000. The notes payable for the water and sewer and natural gas systems increased by $492,040 to $9,220,542. The capital leases for governmental activities were increased by $757,196 to $2,038,765. Combined, that was an increase of long-term debt of $1,004,236. In fiscal year 2009. the capital leases increased by $61,971; the bonded debt decreased by $255,000; and the notes payable increases by $975,068. Combined, this represented an increase of long-term debt of $782,039.
13
MANAGEMENT'S DISCUSSION AND ANALYSIS (Unaudited) City of Statesboro, Georgia June 30, 2009
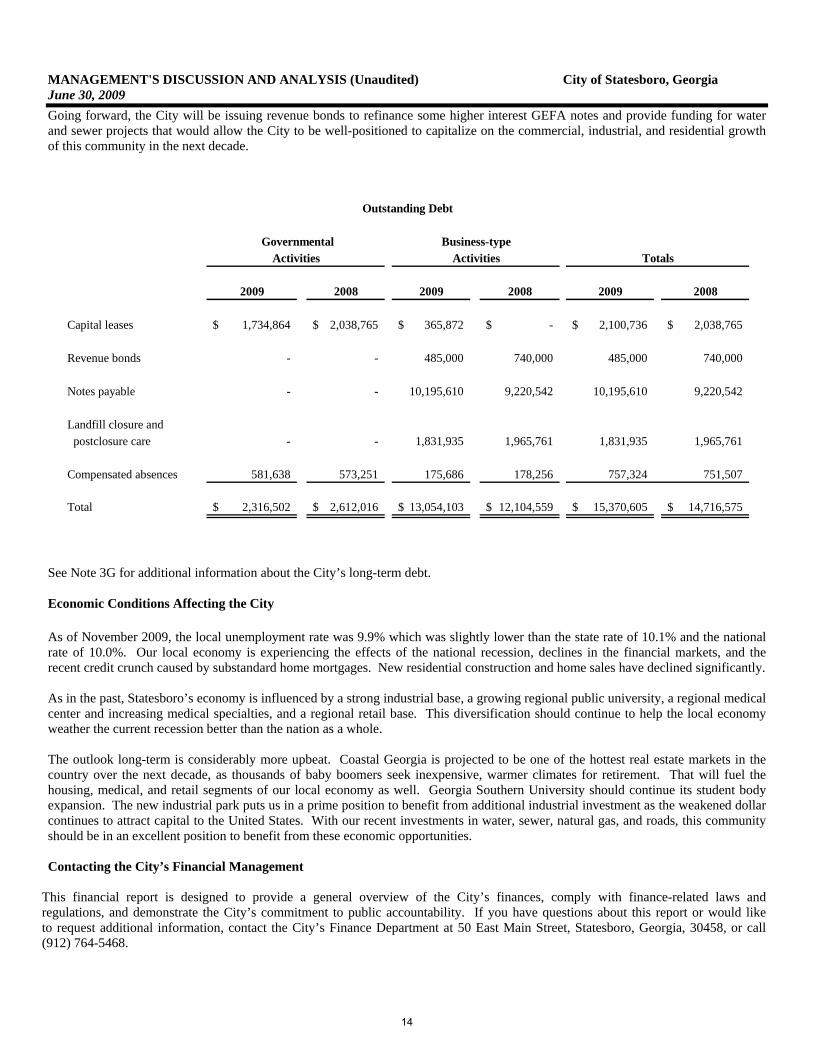
Going forward, the City will be issuing revenue bonds to refinance some higher interest GEFA notes and provide funding for water and sewer projects that would allow the City to be well-positioned to capitalize on the commercial, industrial, and residential growth of this community in the next decade.
2009 2008 2009 2008 2009 2008
Capital leases 1,734,864$ 2,038,765$ 365,872$ -$ 2,100,736$ 2,038,765$
Revenue bonds - - 485,000 740,000 485,000 740,000
Notes payable - - 10,195,610 9,220,542 10,195,610 9,220,542
Landfill closure and postclosure care - - 1,831,935 1,965,761 1,831,935 1,965,761
Compensated absences 581,638 573,251 175,686 178,256 757,324 751,507
Total 2,316,502$ 2,612,016$ 13,054,103$ 12,104,559$ 15,370,605$ 14,716,575$
Totals
Outstanding Debt
GovernmentalActivities
Business-typeActivities
See Note 3G for additional information about the City’s long-term debt. Economic Conditions Affecting the City As of November 2009, the local unemployment rate was 9.9% which was slightly lower than the state rate of 10.1% and the national rate of 10.0%. Our local economy is experiencing the effects of the national recession, declines in the financial markets, and the recent credit crunch caused by substandard home mortgages. New residential construction and home sales have declined significantly. As in the past, Statesboro’s economy is influenced by a strong industrial base, a growing regional public university, a regional medical center and increasing medical specialties, and a regional retail base. This diversification should continue to help the local economy weather the current recession better than the nation as a whole. The outlook long-term is considerably more upbeat. Coastal Georgia is projected to be one of the hottest real estate markets in the country over the next decade, as thousands of baby boomers seek inexpensive, warmer climates for retirement. That will fuel the housing, medical, and retail segments of our local economy as well. Georgia Southern University should continue its student body expansion. The new industrial park puts us in a prime position to benefit from additional industrial investment as the weakened dollar continues to attract capital to the United States. With our recent investments in water, sewer, natural gas, and roads, this community should be in an excellent position to benefit from these economic opportunities.
Contacting the City’s Financial Management
This financial report is designed to provide a general overview of the City’s finances, comply with finance-related laws and regulations, and demonstrate the City’s commitment to public accountability. If you have questions about this report or would liketo request additional information, contact the City’s Finance Department at 50 East Main Street, Statesboro, Georgia, 30458, or call (912) 764-5468.
14

Basic Financial Statements
15

Primary GovernmentGovernmental Business-type Component
Activities Activities Total UnitAssetsCurrent Assets Cash and cash equivalents 2,098,761$ 615,339$ 2,714,100$ 197,949$ Receivables: Accounts 104,674 1,739,106 1,843,780 - Taxes 225,611 - 225,611 - Hotel/motel taxes 44,154 - 44,154 - Intergovernmental 489,401 15,875 505,276 5,129 Notes 185,056 - 185,056 - Internal balances 482,708 (482,708) - - Inventory 141,248 386,028 527,276 - Prepaid items 268,078 118,341 386,419 1,019 Restricted assets - Cash and cash equivalents - 482,015 482,015 - Total Current Assets 4,039,691 2,873,996 6,913,687 204,097 Noncurrent Assets Restricted assets - Cash and cash equivalents - 399,192 399,192 - Deferred charges - 36,806 36,806 - Capital Assets: Nondepreciable capital assets 2,661,200 1,021,971 3,683,171 - Depreciable capital assets, net 23,058,981 43,034,951 66,093,932 13,964 Total Noncurrent Assets 25,720,181 44,492,920 70,213,101 13,964
Total Assets 29,759,872 47,366,916 77,126,788 218,061
LiabilitiesCurrent Liabilities Accounts payable 771,267 516,613 1,287,880 1,491 Accrued payroll 239,764 - 239,764 2,775 Intergovernmental payable - 19,960 19,960 - Accrued interest payable - 80,249 80,249 - Claims payable 400,000 - 400,000 - Unearned revenue 193,561 - 193,561 - Other payables 165,216 - 165,216 - Compensated absences payable 116,328 35,137 151,465 - Capital leases payable 311,312 73,175 384,487 - Notes payable - 662,586 662,586 - Revenue bonds payable - 270,000 270,000 - Customer deposits - 482,015 482,015 - Landfill post-closure care costs - 130,725 130,725 - Total Current Liabilities 2,197,448 2,270,460 4,467,908 4,266 Long-Term Liabilities: Compensated absences payable (net of current portion) 465,310 140,549 605,859 - Capital leases payable (net of current portion) 1,423,552 292,697 1,716,249 - Revenue bonds payable (net of current portion) - 215,000 215,000 - Notes payable (net of current portion) - 9,533,024 9,533,024 - Landfill post-closure care costs (net of current portion) - 1,701,210 1,701,210 - Total Long-Term Liabilities 1,888,862 11,882,480 13,771,342 -
Total Liabilities 4,086,310 14,152,940 18,239,250 4,266
Net AssetsInvested in capital assets, net of related debt 23,985,317 33,047,246 57,032,563 13,964 Restricted for: Capital projects 137,990 - 137,990 - Program purposes 810,377 - 810,377 - Revenue bond retirement - 199,193 199,193 - Renewal and extension - 200,000 200,000 - Unrestricted 739,878 (232,463) 507,415 199,831
Total Net Assets 25,673,562$ 33,213,976$ 58,887,538$ 213,795$
See accompanying notes to the basic financial statements
City of Statesboro, GeorgiaStatement of Net Assets
June 30, 2009
15
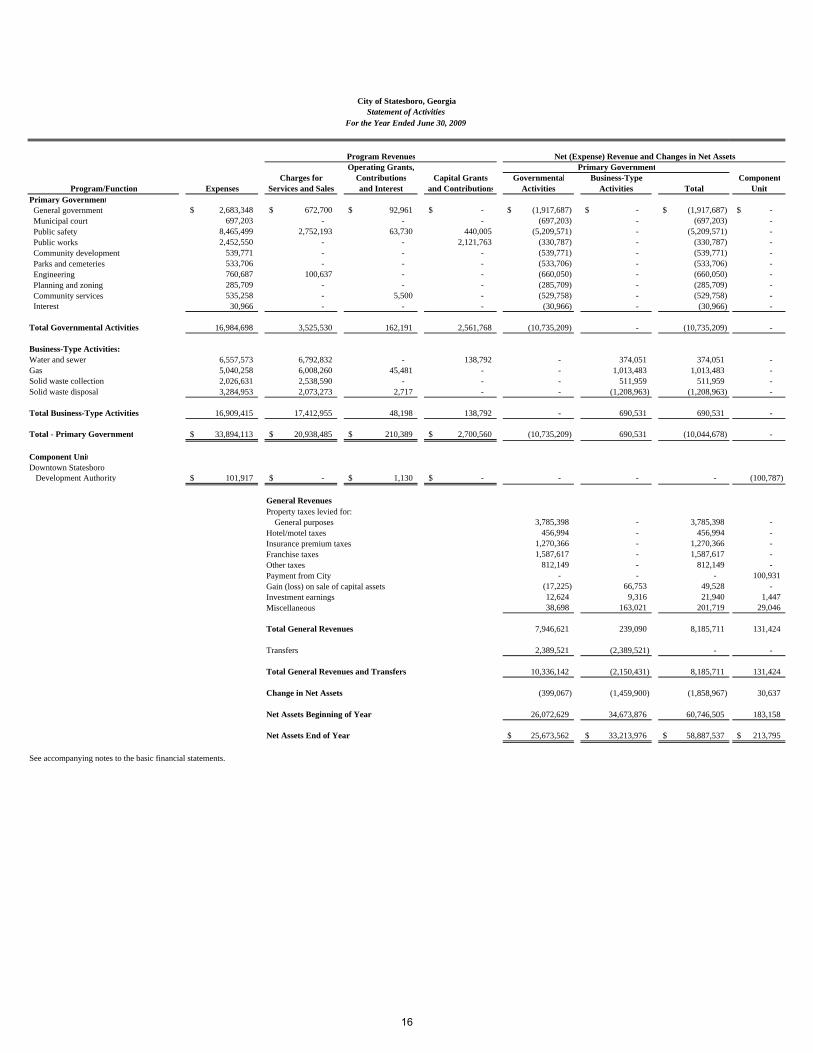
Program RevenuesOperating Grants, Primary Government
Charges for Contributions Capital Grants Governmental Business-Type ComponentProgram/Function Expenses Services and Sales and Interest and Contributions Activities Activities Total Unit
Primary Government General government 2,683,348$ 672,700$ 92,961$ -$ (1,917,687)$ -$ (1,917,687)$ -$ Municipal court 697,203 - - - (697,203) - (697,203) - Public safety 8,465,499 2,752,193 63,730 440,005 (5,209,571) - (5,209,571) - Public works 2,452,550 - - 2,121,763 (330,787) - (330,787) - Community development 539,771 - - - (539,771) - (539,771) - Parks and cemeteries 533,706 - - - (533,706) - (533,706) - Engineering 760,687 100,637 - - (660,050) - (660,050) - Planning and zoning 285,709 - - - (285,709) - (285,709) - Community services 535,258 - 5,500 - (529,758) - (529,758) - Interest 30,966 - - - (30,966) - (30,966) -
Total Governmental Activities 16,984,698 3,525,530 162,191 2,561,768 (10,735,209) - (10,735,209) -
Business-Type Activities:Water and sewer 6,557,573 6,792,832 - 138,792 - 374,051 374,051 - Gas 5,040,258 6,008,260 45,481 - - 1,013,483 1,013,483 - Solid waste collection 2,026,631 2,538,590 - - - 511,959 511,959 - Solid waste disposal 3,284,953 2,073,273 2,717 - - (1,208,963) (1,208,963) -
Total Business-Type Activities 16,909,415 17,412,955 48,198 138,792 - 690,531 690,531 -
Total - Primary Government 33,894,113$ 20,938,485$ 210,389$ 2,700,560$ (10,735,209) 690,531 (10,044,678) -
Component UnitDowntown Statesboro Development Authority 101,917$ -$ 1,130$ -$ - - - (100,787)
General RevenuesProperty taxes levied for: General purposes 3,785,398 - 3,785,398 - Hotel/motel taxes 456,994 - 456,994 - Insurance premium taxes 1,270,366 - 1,270,366 - Franchise taxes 1,587,617 - 1,587,617 - Other taxes 812,149 - 812,149 - Payment from City - - - 100,931 Gain (loss) on sale of capital assets (17,225) 66,753 49,528 - Investment earnings 12,624 9,316 21,940 1,447 Miscellaneous 38,698 163,021 201,719 29,046
Total General Revenues 7,946,621 239,090 8,185,711 131,424
Transfers 2,389,521 (2,389,521) - -
Total General Revenues and Transfers 10,336,142 (2,150,431) 8,185,711 131,424
Change in Net Assets (399,067) (1,459,900) (1,858,967) 30,637
Net Assets Beginning of Year 26,072,629 34,673,876 60,746,505 183,158
Net Assets End of Year 25,673,562$ 33,213,976$ 58,887,537$ 213,795$
See accompanying notes to the basic financial statements.
Net (Expense) Revenue and Changes in Net Assets
City of Statesboro, GeorgiaStatement of Activities
For the Year Ended June 30, 2009
16

Statesboro Capital Other TotalFire 2002 2007 Improvements Governmental Governmental
General Service SPLOST SPLOST Program Funds FundsAssetsCash and cash equivalents 515,690$ 509,905$ -$ 377,098$ 168,035$ 193,934$ 1,764,662$ Receivables: Accounts 49,468 - - - - - 49,468 Taxes 225,611 - - - - - 225,611 Hotel/motel taxes - - - - - 44,154 44,154 Intergovernmental 25,603 58,635 72,770 97,223 - 235,170 489,401 Interfund 1,151,225 - 154,317 46,274 - - 1,351,816 Notes - - - - - 185,056 185,056 Prepaid items 174,009 11,045 - - - - 185,054
Total Assets 2,141,606$ 579,585$ 227,087$ 520,595$ 168,035$ 658,314$ 4,295,222$
Liabilities Accounts payable 504,802$ 40,546$ 6,740$ 111,727$ 15,057$ 59,924$ 738,796$ Accrued payroll and payroll taxes 239,764 - - - - - 239,764 Interfund payable 46,274 - 167,251 291,667 154,317 193,817 853,326 Deferred revenue 160,733 11,797 53,096 - - 3,668 229,294 Other liabilities 68,235 - - - - 96,981 165,216
Total Liabilities 1,019,808 52,343 227,087 403,394 169,374 354,390 2,226,396
Fund Balances Reserved for prepaid items 174,009 11,045 - - - - 185,054 Unreserved: Undesignated, reported in: General fund 947,789 - - - - - 947,789 Special revenue funds - 516,197 - - - 283,135 799,332 Capital projects funds - - - 117,201 (1,339) 20,789 136,651
Total Fund Balances 1,121,798 527,242 - 117,201 (1,339) 303,924 2,068,826
Total Liabilities and Fund Balances 2,141,606$ 579,585$ 227,087$ 520,595$ 168,035$ 658,314$ 4,295,222$
See accompanying notes to the basic financial statements
City of Statesboro, GeorgiaBalance Sheet
Governmental Funds June 30, 2009
17
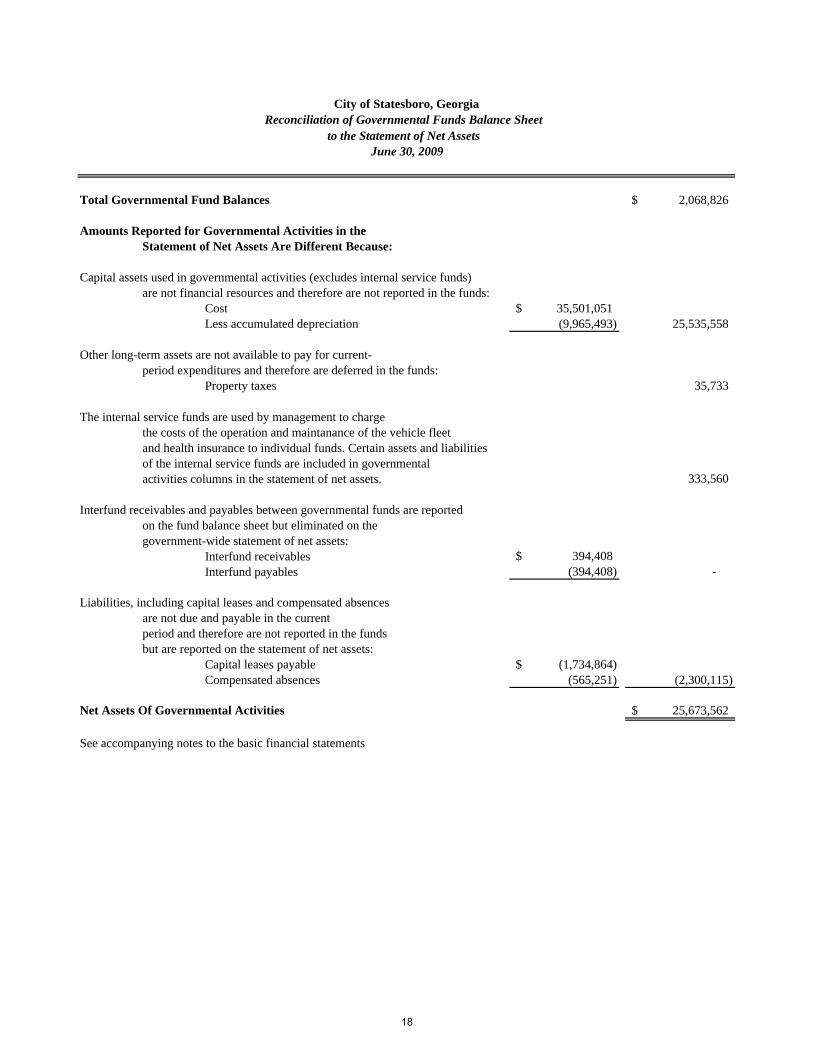
June 30, 2009
Total Governmental Fund Balances 2,068,826$
Amounts Reported for Governmental Activities in the Statement of Net Assets Are Different Because:
Capital assets used in governmental activities (excludes internal service funds)are not financial resources and therefore are not reported in the funds:
Cost 35,501,051$ Less accumulated depreciation (9,965,493) 25,535,558
Other long-term assets are not available to pay for current-period expenditures and therefore are deferred in the funds:
Property taxes 35,733
The internal service funds are used by management to chargethe costs of the operation and maintanance of the vehicle fleet and health insurance to individual funds. Certain assets and liabilitiesof the internal service funds are included in governmental activities columns in the statement of net assets. 333,560
Interfund receivables and payables between governmental funds are reportedon the fund balance sheet but eliminated on the government-wide statement of net assets:
Interfund receivables 394,408$ Interfund payables (394,408) -
Liabilities, including capital leases and compensated absencesare not due and payable in the currentperiod and therefore are not reported in the fundsbut are reported on the statement of net assets:
Capital leases payable (1,734,864)$ Compensated absences (565,251) (2,300,115)
Net Assets Of Governmental Activities 25,673,562$
See accompanying notes to the basic financial statements
Reconciliation of Governmental Funds Balance Sheet to the Statement of Net Assets
City of Statesboro, Georgia
18

Statesboro Capital Other TotalFire 2002 2007 Improvements Governmental Governmental
General Service SPLOST SPLOST Program Funds FundsRevenuesProperty taxes 3,772,951$ -$ -$ -$ -$ -$ 3,772,951$ Insurance premium taxes 1,270,366 - - - - - 1,270,366 Franchise taxes 1,587,617 - - - - - 1,587,617 Other taxes 812,149 - - - - - 812,149 Hotel/motel taxes - - - - - 456,994 456,994 Intergovernmental 98,461 122,369 718,585 1,166,667 190,214 427,663 2,723,959 Licenses and permits 703,815 - - - - - 703,815 Fines and forfeitures 1,656,479 - - - - 109,631 1,766,110 Charges for services 198,489 857,116 - - - - 1,055,605 Investment earnings - 2,082 - 4,401 1,648 365 8,496 Miscellaneous 32,034 2,038 - - - 4,626 38,698
Total Revenues 10,132,361 983,605 718,585 1,171,068 191,862 999,279 14,196,760
ExpendituresCurrent: General government 2,461,925 - - - - - 2,461,925 Municipal court 684,444 - - - - - 684,444 Public safety 5,273,011 2,271,516 - - 428,641 7,973,168 Public works 1,779,706 - - - - - 1,779,706 Community development 82,555 - - - - 456,994 539,549 Parks and cemeteries 444,407 - - - - - 444,407 Engineering 721,165 - - - - - 721,165 Planning and zoning 290,564 - - - - - 290,564 Community services 436,326 - - - - - 436,326 Capital Outlay - - 353,460 110,403 470,074 128,794 1,062,731 Debt Service: - Principal retirement 347,306 - - - - - 347,306 Interest and fiscal charges 30,966 - - - - - 30,966
Total Expenditures 12,552,375 2,271,516 353,460 110,403 470,074 1,014,429 16,772,257
Excess (Deficiency) of Revenues Over (Under) Expenditures (2,420,014) (1,287,911) 365,125 1,060,665 (278,212) (15,150) (2,575,497)
Other Financing Sources (Uses)Sale of capital assets 8,047 - - - - - 8,047 Transfers in 3,501,313 1,409,644 - - 317,000 - 5,227,957 Transfers out (1,616,644) - (365,125) (1,006,667) - - (2,988,436) Inception of capital lease obligations - - - - 43,405 - 43,405
Total Other Financing Sources (Uses) 1,892,716 1,409,644 (365,125) (1,006,667) 360,405 - 2,290,973
Net Change in Fund Balances (527,298) 121,733 - 53,998 82,193 (15,150) (284,524)
Fund Balances Beginning of Year 1,649,096 405,509 - 63,203 (83,532) 319,074 2,353,350
Fund Balances End of Year 1,121,798$ 527,242$ -$ 117,201$ (1,339)$ 303,924$ 2,068,826$
See accompanying notes to the basic financial statements
City of Statesboro, GeorgiaStatement of Revenues, Expenditures and Changes in Fund Balances
Governmental FundsFor the Year Ended June 30, 2009
19

Net Changes In Fund Balances - Total Governmental Funds (284,524)$
Amounts reported for governmental activities in the statement of activities are different because
Governmental funds report capital outlays as expenditures.However, in the statement of activities, the cost of those assets is allocated over their estimated useful lives asdepreciation expense. This is the amount by which capitalized capital outlayexceeded depreciation expense in the current period.
Depreciation expense (1,691,557)$ Capital outlay 1,449,234 (242,323)
Revenues in the statement of activities that do not providecurrent financial resources are not reported as revenuesin the funds.
Property taxes:Deferred @ 6/30/08 35,733$ Deferred @ 6/30/07 (23,286) 12,447
Elimination of transfers between governmental funds:Transfers in 1,416,644$ Transfers out (1,416,644) -
Governmental funds do not report the cost of disposed capital assets but the costis reported on the statement of activities (25,272)
The internal service funds used by management to charge thethe costs of self-insurance and fleet management to individual funds are not reported in the government-widestatement of activities. Governmental fund expendituresand related internal service fund revenues are eliminated. (152,277)
Other financing sources for the inception of capital leases are reported on the fund level operating statement but are reported as a
liability on the governmental-wide financial statements (43,405)
Repayment of capital lease principal is an expenditure in thegovernmental funds, but the repayment reduces long-termliabilities in the statement of net assets. 347,306
Compensated absences reported in the statement of activities, do not require the use of current financialresources and therefore are not reported as expendituresin governmental funds.
Liability @ 6/30/09 (565,251)$ Liability @ 6/30/08 554,232 (11,019)
Change In Net Assets of Governmental Activities (399,067)$
See accompanying notes to the basic financial statements
For the Year Ended June 30, 2009
City of Statesboro, GeorgiaReconciliation of the Governmental Funds Statement of Revenues, Expenditures
and Changes in Fund Balances to the Statement of Activities
20
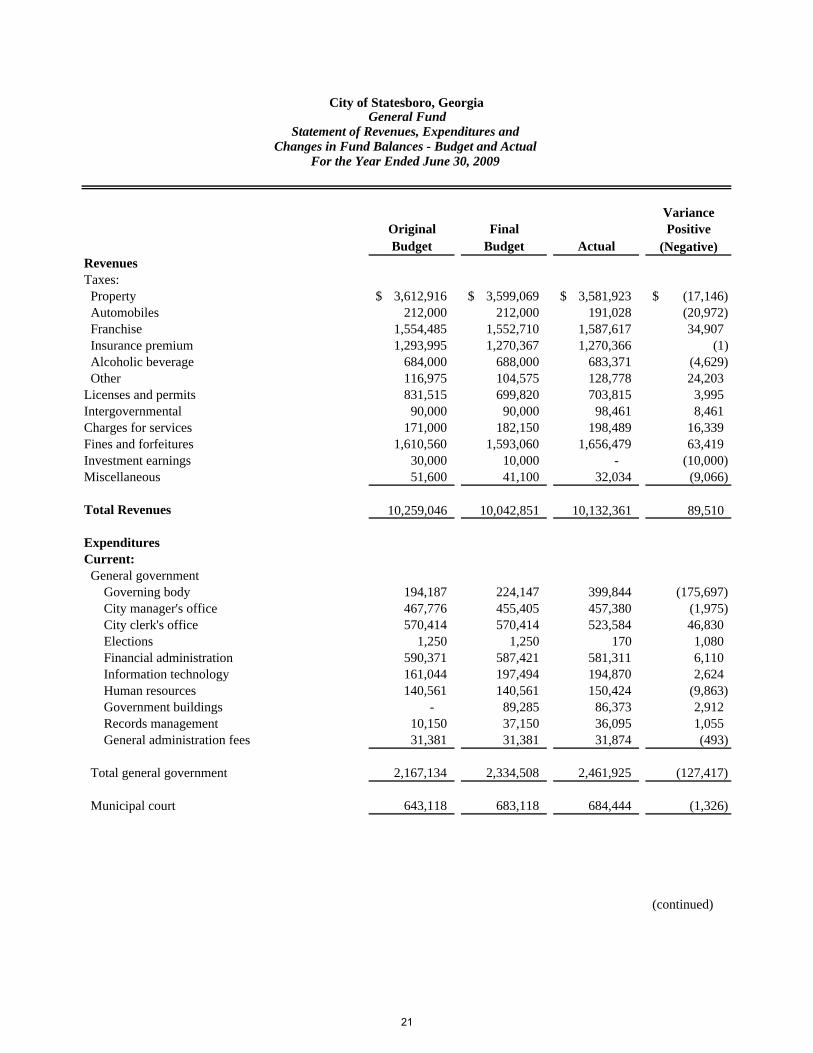
VarianceOriginal Final PositiveBudget Budget Actual (Negative)
RevenuesTaxes: Property 3,612,916$ 3,599,069$ 3,581,923$ (17,146)$ Automobiles 212,000 212,000 191,028 (20,972) Franchise 1,554,485 1,552,710 1,587,617 34,907 Insurance premium 1,293,995 1,270,367 1,270,366 (1) Alcoholic beverage 684,000 688,000 683,371 (4,629) Other 116,975 104,575 128,778 24,203 Licenses and permits 831,515 699,820 703,815 3,995 Intergovernmental 90,000 90,000 98,461 8,461 Charges for services 171,000 182,150 198,489 16,339 Fines and forfeitures 1,610,560 1,593,060 1,656,479 63,419 Investment earnings 30,000 10,000 - (10,000) Miscellaneous 51,600 41,100 32,034 (9,066)
Total Revenues 10,259,046 10,042,851 10,132,361 89,510
ExpendituresCurrent: General government Governing body 194,187 224,147 399,844 (175,697) City manager's office 467,776 455,405 457,380 (1,975) City clerk's office 570,414 570,414 523,584 46,830 Elections 1,250 1,250 170 1,080 Financial administration 590,371 587,421 581,311 6,110 Information technology 161,044 197,494 194,870 2,624 Human resources 140,561 140,561 150,424 (9,863) Government buildings - 89,285 86,373 2,912 Records management 10,150 37,150 36,095 1,055 General administration fees 31,381 31,381 31,874 (493)
Total general government 2,167,134 2,334,508 2,461,925 (127,417)
Municipal court 643,118 683,118 684,444 (1,326)
(continued)
For the Year Ended June 30, 2009
City of Statesboro, GeorgiaGeneral Fund
Statement of Revenues, Expenditures andChanges in Fund Balances - Budget and Actual
21

(continued)
VarianceOriginal Final PositiveBudget Budget Actual (Negative)
Public safety Police 5,014,180$ 5,319,080$ 5,233,278$ 85,802$ Emergency management 5,000 5,000 5,000 - Animal control 46,369 46,369 34,733 11,636
Total public safety 5,065,549 5,370,449 5,273,011 97,438
Streets/public works 1,781,259 1,754,832 1,779,706 (24,874)
Parks and cemeteries 441,490 441,490 444,407 (2,917)
Engineering 695,673 780,973 721,165 59,808
Planning and zoning 358,408 313,108 290,564 22,544
Community services Arts Center 142,420 143,645 399,389 (255,744) Other 40,600 40,600 36,937 3,663
Total community services 183,020 184,245 436,326 (252,081)
Community development 64,436 82,936 82,555 381
Debt Service: Principal retirement 267,500 337,365 347,306 (9,941) Interest and fiscal charges 67,000 55,135 30,966 24,169
Total Debt Service 334,500 392,500 378,272 14,228
Total Expenditures 11,734,587 12,338,159 12,552,375 (214,216)
(Deficiency) of Revenues (Under) Expenditures (1,475,541) (2,295,308) (2,420,014) (124,706)
Other Financing Sources (Uses)Transfers in 2,600,000 3,551,313 3,501,313 (50,000) Transfers out (1,409,644) (1,616,644) (1,616,644) - Sale of capital assets 12,000 12,000 8,047 (3,953)
Total Other Financing Sources (Uses) 1,202,356 1,946,669 1,892,716 (53,953)
Net Change in Fund Balances $ (273,185) $ (348,639) (527,298) $ (178,659)
Fund Balances Beginning of Year 1,649,096
Fund Balances End of Year 1,121,798$
See accompanying notes to the basic financial statements.
For the Year Ended June 30, 2009
City of Statesboro, GeorgiaGeneral Fund
Statement of Revenues, Expenditures andChanges in Fund Balances - Budget and Actual
22

VarianceOriginal Final PositiveBudget Budget Actual (Negative)
RevenuesIntergovernmental -$ 8,477$ 122,369$ 113,892$ Charges for services 835,931 836,564 857,116 20,552 Investment earnings - 1,162 2,082 920 Miscellaneous - 2,018 2,038 20
Total Revenues 835,931 848,221 983,605 135,384
ExpendituresCurrent:Fire 2,378,958 2,378,958 2,271,516 107,442
(Deficiency) of Revenues (Under) Expenditures (1,543,027) (1,530,737) (1,287,911) 242,826
Other Financing Sources (Uses)Transfers in 1,409,644 1,409,644 1,409,644 -
Net Change in Fund Balances $ (133,383) $ (121,093) 121,733 $ 242,826
Fund Balances Beginning of Year 405,509
Fund Balances End of Year 527,242$
See accompanying notes to the basic financial statements.
For the Year Ended June 30, 2009
City of Statesboro, GeorgiaStatesboro Fire Service Fund
Statement of Revenues, Expenditures andChanges in Fund Balances - Budget and Actual
23
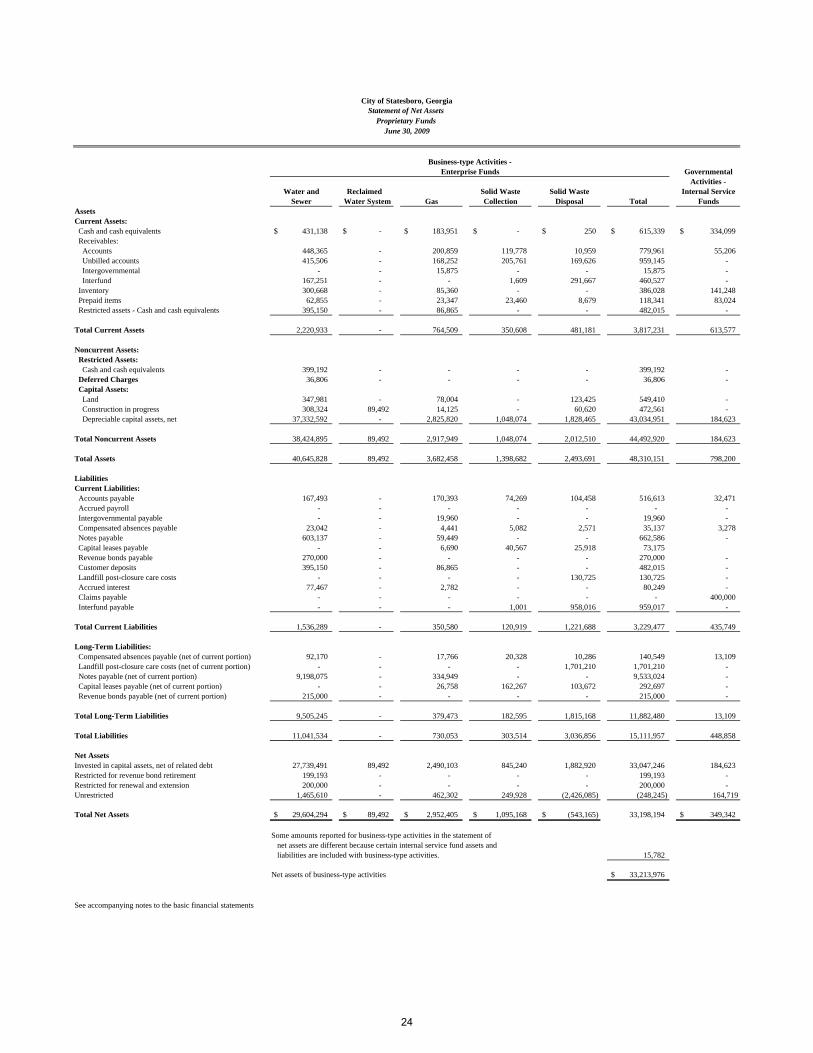
City of Statesboro, GeorgiaStatement of Net Assets
Proprietary Funds June 30, 2009
Business-type Activities -Enterprise Funds Governmental
Activities -Water and Reclaimed Solid Waste Solid Waste Internal Service
Sewer Water System Gas Collection Disposal Total FundsAssetsCurrent Assets: Cash and cash equivalents 431,138$ -$ 183,951$ -$ 250$ 615,339$ 334,099$ Receivables: Accounts 448,365 - 200,859 119,778 10,959 779,961 55,206 Unbilled accounts 415,506 - 168,252 205,761 169,626 959,145 - Intergovernmental - - 15,875 - - 15,875 - Interfund 167,251 - - 1,609 291,667 460,527 - Inventory 300,668 - 85,360 - - 386,028 141,248 Prepaid items 62,855 - 23,347 23,460 8,679 118,341 83,024 Restricted assets - Cash and cash equivalents 395,150 - 86,865 - - 482,015 -
Total Current Assets 2,220,933 - 764,509 350,608 481,181 3,817,231 613,577
Noncurrent Assets: Restricted Assets: Cash and cash equivalents 399,192 - - - - 399,192 - Deferred Charges 36,806 - - - - 36,806 - Capital Assets: Land 347,981 - 78,004 - 123,425 549,410 - Construction in progress 308,324 89,492 14,125 - 60,620 472,561 - Depreciable capital assets, net 37,332,592 - 2,825,820 1,048,074 1,828,465 43,034,951 184,623
Total Noncurrent Assets 38,424,895 89,492 2,917,949 1,048,074 2,012,510 44,492,920 184,623
Total Assets 40,645,828 89,492 3,682,458 1,398,682 2,493,691 48,310,151 798,200
LiabilitiesCurrent Liabilities: Accounts payable 167,493 - 170,393 74,269 104,458 516,613 32,471 Accrued payroll - - - - - - - Intergovernmental payable - - 19,960 - - 19,960 - Compensated absences payable 23,042 - 4,441 5,082 2,571 35,137 3,278 Notes payable 603,137 - 59,449 - - 662,586 - Capital leases payable - - 6,690 40,567 25,918 73,175 Revenue bonds payable 270,000 - - - - 270,000 - Customer deposits 395,150 - 86,865 - - 482,015 - Landfill post-closure care costs - - - - 130,725 130,725 - Accrued interest 77,467 - 2,782 - - 80,249 - Claims payable - - - - - - 400,000 Interfund payable - - - 1,001 958,016 959,017 -
Total Current Liabilities 1,536,289 - 350,580 120,919 1,221,688 3,229,477 435,749
Long-Term Liabilities: Compensated absences payable (net of current portion) 92,170 - 17,766 20,328 10,286 140,549 13,109 Landfill post-closure care costs (net of current portion) - - - - 1,701,210 1,701,210 - Notes payable (net of current portion) 9,198,075 - 334,949 - - 9,533,024 - Capital leases payable (net of current portion) - - 26,758 162,267 103,672 292,697 - Revenue bonds payable (net of current portion) 215,000 - - - - 215,000 -
Total Long-Term Liabilities 9,505,245 - 379,473 182,595 1,815,168 11,882,480 13,109
Total Liabilities 11,041,534 - 730,053 303,514 3,036,856 15,111,957 448,858
Net AssetsInvested in capital assets, net of related debt 27,739,491 89,492 2,490,103 845,240 1,882,920 33,047,246 184,623 Restricted for revenue bond retirement 199,193 - - - - 199,193 - Restricted for renewal and extension 200,000 - - - - 200,000 - Unrestricted 1,465,610 - 462,302 249,928 (2,426,085) (248,245) 164,719
Total Net Assets 29,604,294$ 89,492$ 2,952,405$ 1,095,168$ (543,165)$ 33,198,194 349,342$
Some amounts reported for business-type activities in the statement of net assets are different because certain internal service fund assets and liabilities are included with business-type activities. 15,782
Net assets of business-type activities 33,213,976$
See accompanying notes to the basic financial statements
24

Statement of Revenues,Expenses and Changes in Fund Net Assets
Proprietary FundsFor the Year Ended June 30, 2009
Enterprise Funds GovernmentalActivities -
Water and Reclaimed Solid Waste Solid Waste Internal ServiceSewer Water System Gas Collection Disposal Total Funds
Operating RevenuesCharges for services 6,792,832$ -$ 6,008,260$ 2,538,590$ 2,073,273$ 17,412,955$ 3,913,057$ Miscellaneous 118,959 - 5,159 150 38,753 163,021 -
Total Operating Revenues 6,911,791 - 6,013,419 2,538,740 2,112,026 17,575,976 3,913,057
Operating ExpensesSalaries 1,878,760 - 350,900 556,971 290,263 3,076,894 254,939 Employee benefits 690,706 - 127,003 236,894 113,789 1,168,392 98,157 Purchased services 1,301,557 - 199,815 899,979 2,599,698 5,001,049 160,044 Materials and supplies 434,789 - 77,058 101,436 41,613 654,896 30,473 Cost of sales - - 4,095,083 - - 4,095,083 291,607 Depreciation 1,637,871 - 135,013 199,996 228,396 2,201,276 20,496 Claims - - - - - - 3,503,065 Other 18,057 - 23,711 5,897 2,039 49,704 3,089
Total Operating Expenses 5,961,740 - 5,008,583 2,001,173 3,275,798 16,247,294 4,361,870
Operating Income (Loss) 950,051 - 1,004,836 537,567 (1,163,772) 1,328,682 (448,813)
Non-Operating Revenues (Expenses) Investment earnings 7,522 - 1,439 355 - 9,316 4,128 Intergovernmental - - 45,481 - 2,717 48,198 - Interest expense (479,507) - (15,667) - - (495,174) - Amortization (24,538) - - - - (24,538) - Gain (loss) on disposal of capital assets 5,302 - - 3,476 57,975 66,753 -
Total Non-Operating Revenues (Expenses) (491,221) - 31,253 3,831 60,692 (395,445) 4,128
Income (Loss) before Capital Contributions and Transfers 458,830 - 1,036,089 541,398 (1,103,080) 933,237 (444,685)
Capital contributions 138,792 - - - - 138,792 - Transfers in 306,966 58,159 - - 1,006,667 1,371,792 200,000 Transfers out (1,946,313) - (1,105,000) (550,000) (160,000) (3,761,313) (50,000)
Change in Net Assets (1,041,725) 58,159 (68,911) (8,602) (256,413) (1,317,492) (294,685)
Net Assets Beginning of Year 30,646,019 31,333 3,021,316 1,103,770 (286,752) 644,027
Net Assets End of Year 29,604,294$ 89,492$ 2,952,405$ 1,095,168$ (543,165)$ 349,342$
Some amounts reported for business-type activities in the statemen of activities are different because the net revenue of certain interna service funds is reported with business-type activities (142,408)
(1,459,900)$ See accompanying notes to the basic financial statements
City of Statesboro, Georgia
Business-type Activities -
25

City of Statesboro, GeorgiaStatement of Cash Flows
Proprietary FundsFor the Year Ended June 30, 2009
Enterprise Funds GovernmentalReclaimed Activities -
Water and Water Solid Waste Solid Waste InternalSewer System Gas Collection Disposal Total Service Funds
Cash Flows from Operating Activities Cash received from customers 6,745,487$ -$ 6,219,785$ 2,516,122$ 2,130,821$ 17,612,215$ 3,944,024$ Cash payments to employees for services (2,603,741) - (481,414) (800,126) (406,291) (4,291,572) (359,543) Cash payments for goods and services (2,160,042) - (4,634,475) (1,021,681) (2,754,581) (10,570,779) (504,820) Cash payments for claims - - - - - - (3,654,272)
Net Cash Provided by (Used in) Operating Activities 1,981,704 - 1,103,896 694,315 (1,030,051) 2,749,864 (574,611)
Cash Flows from Noncapital Financing Activities Operating grants received - - 31,326 - - 31,326 - Advances from (to) other funds 770,943 - 27,927 (608) 374,266 1,172,528 - Transfers in 306,966 58,159 - - 1,006,667 1,371,792 200,000 Transfers out (1,946,313) - (1,105,000) (550,000) (160,000) (3,761,313) (50,000)
Net Cash Provided by (Used in) NoncapitalFinancing Activities (868,404) 58,159 (1,045,747) (550,608) 1,220,933 (1,185,667) 150,000
Cash Flows from Capital and Related Financing Activities Proceeds from sale of capital assets 5,302 - - 3,476 58,726 67,504 - Capital contributions 227,767 - - - - 227,767 - Proceeds from loan 1,614,436 - - - - 1,614,436 - Proceeds from capital lease - - 33,448 202,834 129,590 365,872 - Principal paid on revenue bonds (255,000) - - - - (255,000) - Principal paid on notes (531,844) - (107,524) - - (639,368) - Interest paid on debt (485,769) - (16,077) - - (501,846) - Payments for capital acquisitions (1,326,447) (58,159) (6,518) (435,416) (381,915) (2,208,455) (128,186)
Net Cash Provided by (Used in) Capital and Related Financing Activities (751,555) (58,159) (96,671) (229,106) (193,599) (1,329,090) (128,186)
Cash Flows from Investing Activities Investment earnings 7,522 - 1,439 355 2,717 12,033 4,128
Net Increase (Decrease) in Cash and Cash Equivalents 369,267 - (37,083) (85,044) - 247,140 (548,669)
Cash and Cash Equivalents Beginning of Year 856,213 - 307,899 85,044 250 1,249,406 882,768
Cash and Cash Equivalents End of Year 1,225,480$ -$ 270,816$ -$ 250$ 1,496,546$ 334,099$
(continued)
Business-type Activities -
26

City of Statesboro, GeorgiaStatement of Cash Flows
Proprietary FundsFor the Year Ended June 30, 2009
GovernmentalEnterprise Funds Activities -
Reclaimed Water and Water Solid Waste Solid Waste Internal
Sewer System Gas Collection Disposal Total Service Funds
Reconciliation of Operating Income (Loss) to Net Cash Provided by (Used in) Operating Activities
Operating Income (Loss) 950,051$ -$ 1,004,836$ 537,567$ (1,163,772)$ 1,328,682$ (448,813)$
Adjustments: Depreciation 1,637,871 - 135,013 199,996 228,396 2,201,276 20,496
(Increase) Decrease in Assets: Accounts receivable (189,108) - 196,801 (22,618) 18,795 3,870 30,967 Materials and supplies inventory 59,861 - 875 - - 60,736 14,568 Prepaid items (3,763) - 5,351 (405) 2,093 3,276 (5,940) Increase (Decrease) in Liabilities: Accounts payable (461,737) - (249,629) (13,964) 20,502 (704,828) (68,442) Accrued payroll (26,375) - (5,328) (7,968) (4,045) (43,716) (3,815) Compensated absences payable (7,900) - 1,817 1,707 1,806 (2,570) (2,632) Sales taxes payable - - 4,595 - - 4,595 - Customer deposits 22,804 - 9,565 - - 32,369 - Accrued landfill postclosure costs - - - - (133,826) (133,826) - Claims payable - - - - - - (111,000)
Net Cash Provided by (Used in) Operating Activities 1,981,704$ -$ 1,103,896$ 694,315$ (1,030,051)$ 2,749,864$ (574,611)$
See accompanying notes to the basic financial statements
Business-type Activities -
27

Notes to the Basic Financial Statements
29

City of Statesboro, Georgia Notes to the Basic Financial Statements
For the Year Ended June 30, 2009
Index
Summary of Significant Accounting Policies ...................................................................................1 Reporting Entity ...............................................................................................................................1-A Basis of Presentation ........................................................................................................................ 1-B Measurement Focus.......................................................................................................................... 1-C Basis of Accounting..........................................................................................................................1-D Assets, Liabilities and Fund Equity .................................................................................................. 1-E Cash, Cash Equivalents and Investments..................................................................................1-E-1 Receivables...............................................................................................................................1-E-2
Interfund Balances....................................................................................................................1-E-3 Consumable Inventories...........................................................................................................1-E-4 Prepaid Items............................................................................................................................1-E-5 Restricted Assets ......................................................................................................................1-E-6 Capital Assets...........................................................................................................................1-E-7 Compensated Absences............................................................................................................1-E-8 Accrued Liabilities and Long-term Obligations.......................................................................1-E-9 Bond Premiums, Discounts and Issuance Costs.....................................................................1-E-10 Fund Equity............................................................................................................................1-E-11 Operating Revenues and Expenses.........................................................................................1-E-12 Contributions of Capital .........................................................................................................1-E-13 Interfund Activity...................................................................................................................1-E-14 Estimates ................................................................................................................................1-E-15 Comparative Data...................................................................................................................1-E-16
Stewardship, Compliance and Accountability .................................................................................2
Budgetary Information ................................................................................................................2-A Excess of Expenditures over Appropriations……………………………………………………2-B Deficit Fund Equities .................................................................................................................. 2-C
Detailed Notes on All Funds............................................................................................................3 Cash and Cash Equivalents .........................................................................................................3-A Receivables ................................................................................................................................. 3-B Property Taxes ............................................................................................................................ 3-C Capital Assets..............................................................................................................................3-D Interfund Balances and Transfers................................................................................................ 3-E Landfill Closure and Postclosure Care ........................................................................................ 3-F Long-Term Debt..........................................................................................................................3-G
Pensions .......................................................................................................................................3-H Net Assets .................................................................................................................................... 3 -I Other Notes ....................................................................................................................................4
Risk Management........................................................................................................................4-A Contingent Liabilities .................................................................................................................. 4-B Joint Ventures.............................................................................................................................. 4-C Hotel/Motel Lodging Tax............................................................................................................4-D Other Post–Employment Benefits ............................................................................................... 4-E
28

City of Statesboro, Georgia Notes to the Basic Financial Statements
For the Year Ended June 30, 2009
The City of Statesboro (the “City”) was chartered by an act of the General Assembly of the State of Georgia. The City operates under a Council/Manager form of government and provides the following services as authorized by its charter: public safety (police and fire), streets, community development, community services and general administrative services. The City also operates two public utilities (water and sewer system and gas system) and provides sanitation services. The City and Bulloch County jointly operate a transfer station for transport of solid waste and an inert landfill. Note 1 - Summary of Significant Accounting Policies The financial statements of the City have been prepared in conformity with accounting principles generally accepted in the United States (GAAP) as applied to governments. The Governmental Accounting Standards Board (GASB) is the accepted standard-setting body for governmental accounting and financial reporting. The City also applies Financial Accounting Standards Board (FASB) statements and interpretations issued on or before November 30, 1989, to its governmental and business-type activities at the government-wide financial reporting level and to its enterprise funds at the fund reporting level, provided they do not conflict with or contradict GASB pronouncements. The most significant of the City’s accounting policies are described below. 1-A. Reporting Entity The reporting entity is comprised of the primary government, component units and other organizations that are included to ensure that the financial statements are not misleading. The primary government of the City consists of all funds, departments, boards and agencies that are not legally separate from the City. Component units are legally separate organizations for which the City is financially accountable. The City is financially accountable for an organization if the City appoints a voting majority of the organization's governing board and (1) the City is able to significantly influence the programs or services performed or provided by the organizations; or (2) the City is legally entitled to or can otherwise access the organization's resources; the City is legally obligated or has otherwise assumed the responsibility to finance the deficits of, or provide financial support to, the organization; or the City is obligated for the debt of the organization. Component units also may include organizations that are fiscally dependent on the City in that the City approves the budget, levies their taxes or issues their debt. The component unit columns included on the government-wide financial statements identify the financial data of the City’s discretely presented component unit. It is reported separately to emphasize that it is legally separate from the City. A brief description of the City’s discretely presented component unit follows: Downtown Statesboro Development Authority (the Authority) – The Authority is a public corporation created in 1981. The primary purpose of the Authority is to promote industry and trade in the downtown area. The City Council appoints one board member and provides its primary funding. Therefore, the Authority is fiscally dependent on the City. Complete financial statements for the Authority can be obtained at the Authority’s administrative office. After reviewing the above criteria, the City has determined that the Statesboro-Bulloch County Airport and the Statesboro-Bulloch County Parks and Recreation Department do not qualify as component units of the City. Related Organizations The Housing Authority of the City of Statesboro, Georgia is considered a related organization based upon the criteria in GASB Statement 14. The Housing Authority is a legally separate entity and the City does not appoint any of its board members. The City of Statesboro, Georgia is not able to impose its will upon the Housing Authority and a financial benefit/burden relationship does not exist between them. Therefore, based upon the criteria above, the Housing Authority of the City of Statesboro, Georgia is a related organization and is excluded from the reporting entity.
29
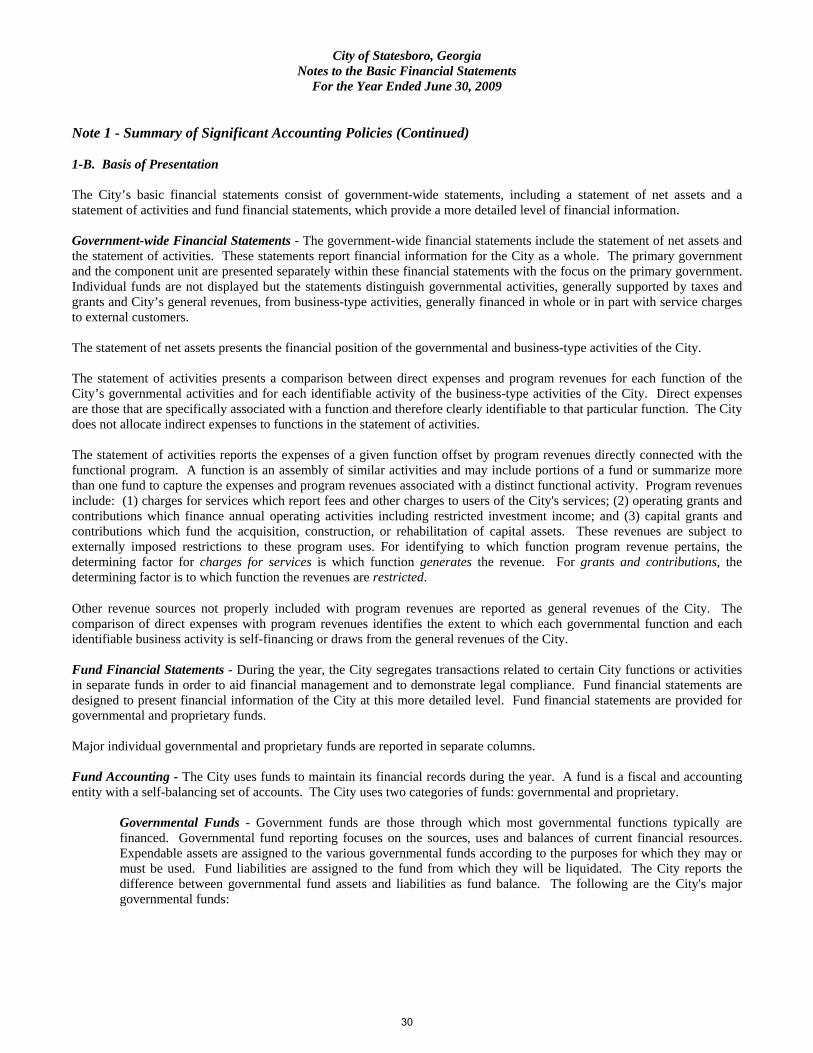
City of Statesboro, Georgia Notes to the Basic Financial Statements
For the Year Ended June 30, 2009
Note 1 - Summary of Significant Accounting Policies (Continued) 1-B. Basis of Presentation The City’s basic financial statements consist of government-wide statements, including a statement of net assets and a statement of activities and fund financial statements, which provide a more detailed level of financial information. Government-wide Financial Statements - The government-wide financial statements include the statement of net assets and the statement of activities. These statements report financial information for the City as a whole. The primary government and the component unit are presented separately within these financial statements with the focus on the primary government. Individual funds are not displayed but the statements distinguish governmental activities, generally supported by taxes and grants and City’s general revenues, from business-type activities, generally financed in whole or in part with service charges to external customers. The statement of net assets presents the financial position of the governmental and business-type activities of the City. The statement of activities presents a comparison between direct expenses and program revenues for each function of the City’s governmental activities and for each identifiable activity of the business-type activities of the City. Direct expenses are those that are specifically associated with a function and therefore clearly identifiable to that particular function. The City does not allocate indirect expenses to functions in the statement of activities. The statement of activities reports the expenses of a given function offset by program revenues directly connected with the functional program. A function is an assembly of similar activities and may include portions of a fund or summarize more than one fund to capture the expenses and program revenues associated with a distinct functional activity. Program revenues include: (1) charges for services which report fees and other charges to users of the City's services; (2) operating grants and contributions which finance annual operating activities including restricted investment income; and (3) capital grants and contributions which fund the acquisition, construction, or rehabilitation of capital assets. These revenues are subject to externally imposed restrictions to these program uses. For identifying to which function program revenue pertains, the determining factor for charges for services is which function generates the revenue. For grants and contributions, the determining factor is to which function the revenues are restricted.
Other revenue sources not properly included with program revenues are reported as general revenues of the City. The comparison of direct expenses with program revenues identifies the extent to which each governmental function and each identifiable business activity is self-financing or draws from the general revenues of the City. Fund Financial Statements - During the year, the City segregates transactions related to certain City functions or activities in separate funds in order to aid financial management and to demonstrate legal compliance. Fund financial statements are designed to present financial information of the City at this more detailed level. Fund financial statements are provided for governmental and proprietary funds. Major individual governmental and proprietary funds are reported in separate columns. Fund Accounting - The City uses funds to maintain its financial records during the year. A fund is a fiscal and accounting entity with a self-balancing set of accounts. The City uses two categories of funds: governmental and proprietary.
Governmental Funds - Government funds are those through which most governmental functions typically are financed. Governmental fund reporting focuses on the sources, uses and balances of current financial resources. Expendable assets are assigned to the various governmental funds according to the purposes for which they may or must be used. Fund liabilities are assigned to the fund from which they will be liquidated. The City reports the difference between governmental fund assets and liabilities as fund balance. The following are the City's major governmental funds:
30

City of Statesboro, Georgia Notes to the Basic Financial Statements
For the Year Ended June 30, 2009
Note 1 - Summary of Significant Accounting Policies (Continued)
The General Fund – The general fund accounts for all financial resources except those required to be accounted for in another fund. The general fund’s fund balance is available to the City for any purpose provided it is expended or transferred according to the general laws of the State of Georgia. Statesboro Fire Service Fund – This fund accounts for revenues collected from city taxpayers and taxpayers in the county’s five mile fire district used to fund the City’s fire department.
2002 SPLOST Fund – This fund accounts for the special purpose local option sales tax collected pursuant
to a 2002 referendum for various capital improvements within the City. 2007 SPLOST Fund – This fund accounts for the special purpose local option sales tax collected pursuant
to a 2007 referendum for various capital improvements within the City.
Capital Improvements Program Fund – This fund accounts for revenues used to acquire or construct major governmental capital assets. This fund is funded primarily from interfund transfers.
Proprietary Funds - Proprietary fund reporting focuses on the determination of operating income, changes in net assets, financial position and cash flows. The proprietary funds are classified as enterprise funds and internal service funds. The City’s major enterprise funds consist of:
Water and Sewer Operating Fund – This fund accounts for the water and sewer provided to the City’s constituents. Reclaimed Water System Fund – This fund accounts for the reclaimed water provided for irrigation to the City’s constituents.
Gas Operating Fund – This fund accounts for the gas services provided to the City’s constituents. Solid Waste Collection Fund – This fund accounts for the solid waste collection program. Solid Waste Disposal Fund – This fund accounts for the solid waste disposal program.
The City’s internal service funds account for the City’s health and workers compensation insurance and fleet management programs.
1-C. Measurement Focus Government-wide Financial Statements - The government-wide financial statements are prepared using the economic resources measurement focus. All assets and all liabilities associated with the operation of the City are included on the statement of net assets. The statement of activities reports revenues and expenses. Fund Financial Statements - All governmental funds are accounted for using a flow of current financial resources measurement focus. With this measurement focus, only current assets and current liabilities generally are included on the balance sheet. The statement of revenues, expenditures and changes in fund balances reports the sources (i.e., revenues and other financing sources) and uses (i.e., expenditures and other financing uses) of current financial resources. This approach differs from the manner in which the governmental activities of the government-wide financial statements are prepared. Governmental fund financial statements therefore include a reconciliation with brief explanations to better identify the relationship between the government-wide statements and the governmental fund statements. Like the government-wide statements, all proprietary fund types are accounted for on a flow of economic resources measurement focus on both financial reporting levels. All assets and all liabilities associated with the operation of these funds are included on the statements of net assets. The statements of changes in fund net assets present increases (i.e.,
31

City of Statesboro, Georgia Notes to the Basic Financial Statements
For the Year Ended June 30, 2009
Note 1 - Summary of Significant Accounting Policies (Continued) revenues) and decreases (i.e., expenses) in net total assets. The statement of cash flows provides information about how the City finances and meets the cash flow needs of its proprietary activities. 1-D. Basis of Accounting Basis of accounting determines when transactions are recorded in the financial records and reported on the financial statements. Government-wide financial statements are prepared using the accrual basis of accounting. At the fund reporting level, the governmental funds use the modified accrual basis of accounting. Proprietary funds use the accrual basis of accounting at both reporting levels. Differences in the accrual and the modified accrual basis of accounting arise in the recognition of revenue, the recording of deferred revenue, and in the presentation of expenses versus expenditures. Revenues – Exchange Transactions - Revenue resulting from exchange transactions, in which each party gives and receives essentially equal value is recorded on the accrual basis when the exchange takes place. On the modified accrual basis, revenue is recorded when the exchange takes place and in the fiscal year in which the resources are measurable and become available. Available means that the resources will be collected within the current fiscal year or are expected to be collected soon enough thereafter to be used to pay liabilities of the current fiscal year. For the City, the phrase “available for exchange transactions” means expected to be received within 60 days of year-end. Revenues - Non-exchange Transactions - Non-exchange transactions in which the City receives value without directly giving equal value in return, include sales taxes, property taxes, grants and donations. On an accrual basis, revenue from sales taxes is recognized in the period in which the taxable sale takes place. Revenue from property taxes is recognized in the fiscal year for which the taxes are levied. Revenue from grants and donations is recognized in the fiscal year in which all eligibility requirements have been satisfied. Eligibility requirements include timing requirements, which specify the year when the resources are required to be used or the year when use is first permitted, matching requirements, in which the City must provide local resources to be used for a specified purpose, and expenditure requirements, in which the resources are provided to the City on a reimbursement basis. On a modified accrual basis, revenue from non-exchange transactions also must be available (i.e., collected within 60 days) before it can be recognized. Under the modified accrual basis, the following revenue sources are considered to be susceptible to accrual: property taxes, sales taxes, interest and federal and state grants. Deferred/Unearned Revenue - Deferred revenue arises when assets are recognized before revenue recognition criteria have been satisfied. On governmental fund financial statements (i.e., on the modified accrual basis), receivables that will not be collected within the available period have been reported as deferred revenue (i.e., they are measurable but not available) rather than as revenue. Grants and entitlements received before the eligibility requirements are met (e.g., cash advances) also are recorded as deferred revenue. Deferred revenue is reported at the fund financial reporting level but reclassified as “unearned revenue” on the government-wide statement of net assets, where applicable. Expenses/Expenditures - On the accrual basis of accounting, expenses are recognized at the time they are incurred. On the modified accrual basis, expenditures generally are recognized in the accounting period in which the related fund liability is incurred and due, if measurable. 1-E. Assets, Liabilities and Fund Equity 1-E-1 Cash, Cash Equivalents, and Investments Cash and cash equivalents include amounts in demand deposits as well as short-term investments with a maturity date within
32

City of Statesboro, Georgia Notes to the Basic Financial Statements
For the Year Ended June 30, 2009
Note 1 - Summary of Significant Accounting Policies (Continued) three months of the date acquired by the City. Investments are stated at fair value based on quoted market prices. Georgia law authorizes the City to invest in the following type of obligations:
• Obligations of the State of Georgia or of any other states • Obligations of the United States Government • Obligations fully insured or guaranteed by the United States Government or United States Government agency • Obligations of any corporation of the United States Government • Prime bankers’ acceptances • The State of Georgia local government investment pool (i.e., Georgia Fund I) • Repurchase agreements • Obligations of the other political subdivisions of the State of Georgia
1-E-2 Receivables All trade and property tax receivables are reported net of an allowance for uncollectibles, where applicable. Unbilled water, sewer and gas charges are accrued as receivables and revenue at June 30, 2009. 1-E-3 Interfund Balances On the fund financial statements, receivables and payables resulting from short-term interfund loans are classified as "interfund receivables/interfund payables." These amounts are eliminated in the governmental and business-type activities columns on the statement of net assets, except for any net residual amounts due between governmental and business-type activities, which are reclassified and presented as internal balances on this statement. These amounts are ultimately eliminated from the total column on the statement of net assets. 1-E-4 Consumable Inventories On the government-wide and the proprietary fund financial statements, inventories are presented at the lower of cost or market on a first-in, first-out basis and are expensed when used (i.e., the consumption method). 1-E-5 Prepaid Items Payments made to vendors for services that will benefit periods beyond June 30, 2009, are recorded as prepaid items using the consumption method by recording an asset for the prepaid amount and reflecting the expenditure/expense in the year in which services are consumed. At the fund reporting level, an equal amount of fund balance is reserved as this amount is not available for general appropriation. 1-E-6 Restricted Assets Restricted assets represent sinking funds required by enterprise fund revenue bonds and designated as such by management, customer utility deposits, funds held specifically for water and sewer system improvements, and funds designated for capital purchases. 1-E-7 Capital Assets General capital assets are those assets not specifically related to activities reported in the proprietary funds. These assets generally result from expenditures in governmental funds. The City reports these assets in the governmental activities column of the government-wide statement of net assets but does not report these assets in the City fund financial statements.
33

City of Statesboro, Georgia Notes to the Basic Financial Statements
For the Year Ended June 30, 2009
Note 1 - Summary of Significant Accounting Policies (Continued) Capital assets utilized by proprietary funds are reported both in the business-type activities column of the government-wide statement of net assets and in the proprietary funds’ statement of net assets. All capital assets are capitalized at cost (or estimated historical cost) and updated for additions and retirements during the year. Donated capital assets are recorded at their fair market values as of the date received. The City maintains a capitalization threshold of five thousand dollars. The City’s infrastructure consists of roads, bridges, water and sewer lines and gas lines. Water and sewer lines and gas lines are classified as “improvements other than buildings”. Improvements to capital assets are capitalized. The costs of normal maintenance and repairs that do not add to the value of the asset or materially extend an asset’s life are expensed. Interest incurred during the construction of capital assets utilized by enterprise funds is capitalized. All reported capital assets are depreciated except for land, right-of-ways and construction in progress. Improvements are depreciated over the remaining useful lives of the related capital assets. Useful lives for infrastructure were estimated based on the City’s historical records of necessary improvements and replacement. Depreciation is computed using the straight-line method over the following useful lives:
Description
Governmental Activities
Estimated Lives
Business-Type Activities
Estimated Lives
Buildings 15 – 40 years 15 - 40 years
Improvements other than buildings 8 – 40 years 15 – 50 years
Machinery and equipment 5 – 20 years 5 – 15 years
Infrastructure 12 – 25 years ---
At the inception of capital leases at the governmental fund reporting level, expenditures and an “other financing source” of an equal amount are reported at the net present value of future minimum lease payments. 1-E-8 Compensated Absences Vacation benefits are accrued as a liability as the benefits are earned if the employees' rights to receive compensation are attributable to services already rendered and it is probable that the employer will compensate the employees for the benefits through paid time off or some other means. All compensated absence liabilities include salary-related payments, where applicable. The total compensated absence liability is reported on the government-wide financial statements. Proprietary funds report the total compensated liability in each individual fund at the fund reporting level. Governmental funds report the compensated absence liability at the fund reporting level only “when due.” 1-E-9 Accrued Liabilities and Long-term Obligations All payables, accrued liabilities and long-term obligations are reported in the government-wide financial statements. In general, governmental fund payables and accrued liabilities that, once incurred, are paid in a timely manner and in full from current financial resources, are reported as obligations of those funds. However, compensated absences that will be paid from governmental funds are reported as a liability in the fund financial statements only to the extent that they are “due for payment” during the current year. Capital leases are recognized as a liability in the governmental fund financial statements when due.
34

City of Statesboro, Georgia Notes to the Basic Financial Statements
For the Year Ended June 30, 2009
Note 1 - Summary of Significant Accounting Policies (Continued) 1-E-10 Bond Premiums, Discounts and Issuance Costs On the government-wide statement of net assets and the proprietary fund type statement of net assets, bond premiums and discounts are netted against bonds payable and bond issuance costs are reported as deferred charges. On the government-wide and proprietary fund type statement of activities, bond premiums and discounts and bond issuance costs are deferred and amortized over the life of the bonds using the effective interest method. At the governmental fund reporting level, bond premiums and discounts are reported as other financing sources and uses, separately from the face amount of the bonds issued. Bond issuance costs are reported as an expenditure. 1-E-11 Fund Equity Fund equity at the governmental fund financial reporting level is classified as “fund balance”. Fund equity for all other reporting is classified as “net assets”. Fund Balance – Generally, fund balance represents the difference between the current assets and current liabilities. The City reserves those portions of fund balance which are legally segregated for a specific future use or which do not represent available, spendable resources and therefore are not available for appropriation or expenditure. Unreserved fund balance indicates that portion of fund balance that is available for appropriation in future periods. Designations are management’s intent to set aside these resources for specific services. Net Assets - Net assets represent the difference between assets and liabilities. Net assets invested in capital assets, net of related debt, consists of capital assets, net of accumulated depreciation, reduced by the outstanding balances of any borrowing used for the acquisition, construction or improvement of those assets. This net asset amount also is adjusted by any bond issuance deferral amounts. Net assets are reported as restricted when there are limitations imposed on their use either through the enabling legislation adopted by the City or through external restrictions imposed by creditors, grantors or laws or regulations of other governments. All other net assets are reported as unrestricted. The City applies restricted resources first when an expense is incurred for purposes for which both restricted and unrestricted net assets are available. 1-E-12 Operating Revenues and Expenses Operating revenues are those revenues that are generated directly from the primary activity of the proprietary funds. For the City, these revenues are charges for services for water, sewer, gas, solid waste, and the insurance benefits and fleet management programs. Operating expenses are necessary costs incurred to provide the good or service that are the primary activity of each fund and include administrative expenses and depreciation on capital assets. All revenues and expenses not meeting this definition are reported as nonoperating revenues and expenses. 1-E-13 Contributions of Capital Contributions of capital in proprietary fund financial statements arise from outside contributions of capital assets, tap-in fees to the extent they exceed the cost of the connection to the system, or from grants or outside contributions of resources restricted to capital acquisition and construction. 1-E-14 Interfund Activity Exchange transactions between funds are reported as revenues in the seller funds and as expenditures/expenses in the purchaser funds. Flows of cash or goods from one fund to another without a requirement for repayment are reported as interfund transfers. Interfund transfers are reported as other financing sources/uses in governmental funds and the after non-operating revenues/expenses section in proprietary funds. Repayments from funds responsible for particular expenditures/expenses to the funds that initially paid for them are not presented on the financial statements (i.e., they are netted).
35
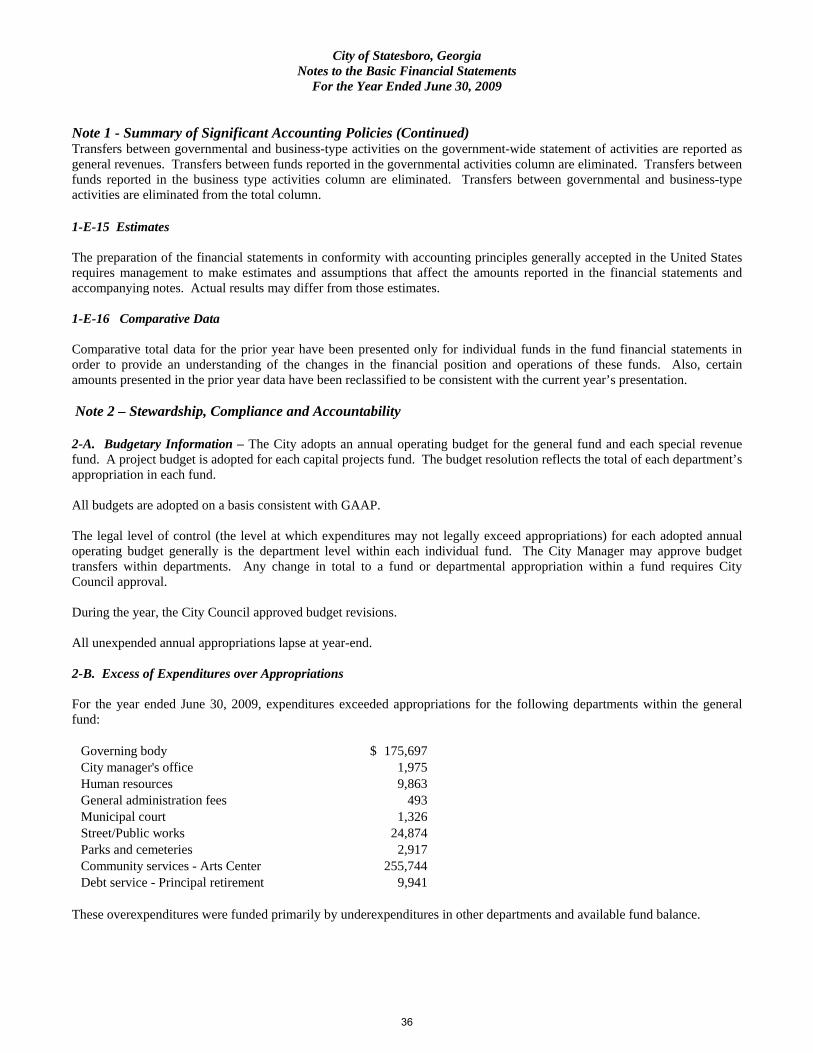
City of Statesboro, Georgia Notes to the Basic Financial Statements
For the Year Ended June 30, 2009
Note 1 - Summary of Significant Accounting Policies (Continued) Transfers between governmental and business-type activities on the government-wide statement of activities are reported as general revenues. Transfers between funds reported in the governmental activities column are eliminated. Transfers between funds reported in the business type activities column are eliminated. Transfers between governmental and business-type activities are eliminated from the total column. 1-E-15 Estimates The preparation of the financial statements in conformity with accounting principles generally accepted in the United States requires management to make estimates and assumptions that affect the amounts reported in the financial statements and accompanying notes. Actual results may differ from those estimates. 1-E-16 Comparative Data Comparative total data for the prior year have been presented only for individual funds in the fund financial statements in order to provide an understanding of the changes in the financial position and operations of these funds. Also, certain amounts presented in the prior year data have been reclassified to be consistent with the current year’s presentation. Note 2 – Stewardship, Compliance and Accountability 2-A. Budgetary Information – The City adopts an annual operating budget for the general fund and each special revenue fund. A project budget is adopted for each capital projects fund. The budget resolution reflects the total of each department’s appropriation in each fund. All budgets are adopted on a basis consistent with GAAP. The legal level of control (the level at which expenditures may not legally exceed appropriations) for each adopted annual operating budget generally is the department level within each individual fund. The City Manager may approve budget transfers within departments. Any change in total to a fund or departmental appropriation within a fund requires City Council approval. During the year, the City Council approved budget revisions. All unexpended annual appropriations lapse at year-end. 2-B. Excess of Expenditures over Appropriations For the year ended June 30, 2009, expenditures exceeded appropriations for the following departments within the general fund:
Governing body 175,697$ City manager's office 1,975 Human resources 9,863 General administration fees 493 Municipal court 1,326 Street/Public works 24,874 Parks and cemeteries 2,917 Community services - Arts Center 255,744 Debt service - Principal retirement 9,941
These overexpenditures were funded primarily by underexpenditures in other departments and available fund balance.
36

City of Statesboro, Georgia Notes to the Basic Financial Statements
For the Year Ended June 30, 2009
Note 2 – Stewardship, Compliance and Accountability (Continued) Expenditures exceeded appropriations by $280,056 in the Multiple Grant special revenue fund and these overexpenditures were funded by additional revenues over amounts budgeted. 2-C. Deficit Fund Equities The following individual funds had a deficit fund balance/net asset balance at June 30, 2009: Solid waste disposal fund $543,165 Capital improvements fund 1,339 Note 3 - Detailed Notes on All Funds 3-A. Cash and Cash Equivalents At June 30, 2009, the carrying amount of the City’s deposits (i.e., checking and certificates of deposits) was $3,595,307 and the bank balance was $3,796,181. Of the bank balance, $250,000 was covered by federal depository insurance and $3,546,181 was collateralized with securities held by the pledging financial institution’s trust department or agent in the City’s name. Cash & Cash Equivalent Reconciliation:
Cash andCash Equivalents
Fund Reporting Level: Governmental Funds - Balance Sheet 1,764,662$ Enterprise Fund Statement of Net Assets 615,339 Enterprise Fund Statement of Net Assets - Restricted 881,207 Internal Service Fund Statement of Net Assets 334,099
Total 3,595,307$
3-B. Receivables Receivables at June 30, 2009, consisted of taxes, interest, accounts (billings for user charges, including unbilled utility receivables), and intergovernmental receivables arising from grants.
37
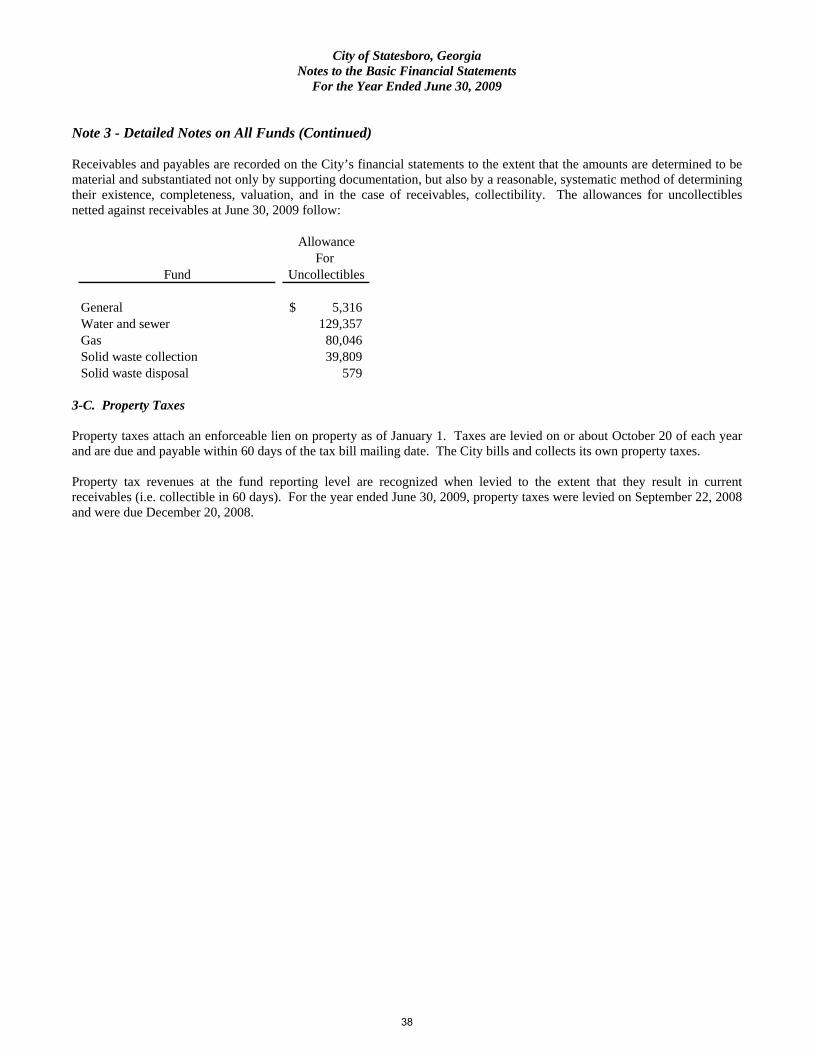
City of Statesboro, Georgia Notes to the Basic Financial Statements
For the Year Ended June 30, 2009
Note 3 - Detailed Notes on All Funds (Continued) Receivables and payables are recorded on the City’s financial statements to the extent that the amounts are determined to be material and substantiated not only by supporting documentation, but also by a reasonable, systematic method of determining their existence, completeness, valuation, and in the case of receivables, collectibility. The allowances for uncollectibles netted against receivables at June 30, 2009 follow:
AllowanceFor
Fund Uncollectibles
General 5,316$ Water and sewer 129,357 Gas 80,046 Solid waste collection 39,809 Solid waste disposal 579
3-C. Property Taxes Property taxes attach an enforceable lien on property as of January 1. Taxes are levied on or about October 20 of each year and are due and payable within 60 days of the tax bill mailing date. The City bills and collects its own property taxes. Property tax revenues at the fund reporting level are recognized when levied to the extent that they result in current receivables (i.e. collectible in 60 days). For the year ended June 30, 2009, property taxes were levied on September 22, 2008 and were due December 20, 2008.
38
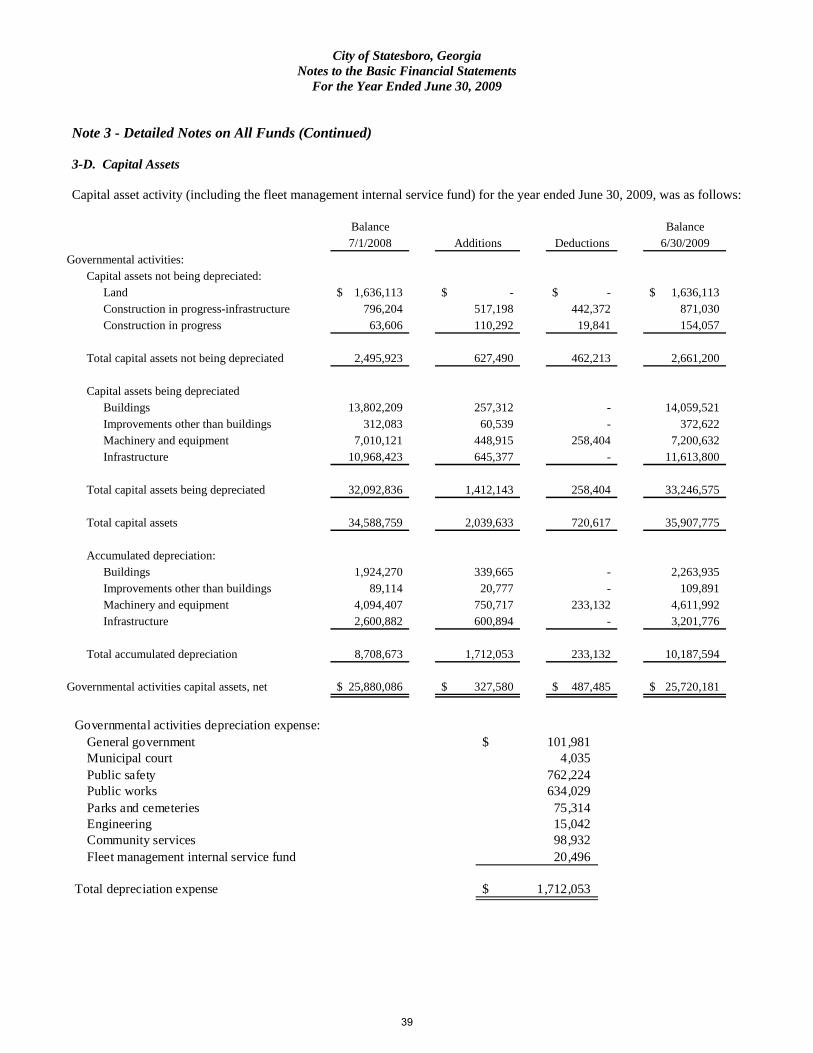
City of Statesboro, Georgia Notes to the Basic Financial Statements
For the Year Ended June 30, 2009
Note 3 - Detailed Notes on All Funds (Continued) 3-D. Capital Assets Capital asset activity (including the fleet management internal service fund) for the year ended June 30, 2009, was as follows:
Balance Balance7/1/2008 Additions Deductions 6/30/2009
Governmental activities:Capital assets not being depreciated:
Land 1,636,113$ -$ -$ 1,636,113$ Construction in progress-infrastructure 796,204 517,198 442,372 871,030 Construction in progress 63,606 110,292 19,841 154,057
Total capital assets not being depreciated 2,495,923 627,490 462,213 2,661,200
Capital assets being depreciatedBuildings 13,802,209 257,312 - 14,059,521 Improvements other than buildings 312,083 60,539 - 372,622 Machinery and equipment 7,010,121 448,915 258,404 7,200,632 Infrastructure 10,968,423 645,377 - 11,613,800
Total capital assets being depreciated 32,092,836 1,412,143 258,404 33,246,575
Total capital assets 34,588,759 2,039,633 720,617 35,907,775
Accumulated depreciation:Buildings 1,924,270 339,665 - 2,263,935 Improvements other than buildings 89,114 20,777 - 109,891 Machinery and equipment 4,094,407 750,717 233,132 4,611,992 Infrastructure 2,600,882 600,894 - 3,201,776
Total accumulated depreciation 8,708,673 1,712,053 233,132 10,187,594
Governmental activities capital assets, net 25,880,086$ 327,580$ 487,485$ 25,720,181$
Governmental activities depreciation expense:
General government 101,981$ Municipal court 4,035 Public safety 762,224 Public works 634,029 Parks and cemeteries 75,314 Engineering 15,042 Community services 98,932 Fleet management internal service fund 20,496
Total depreciation expense 1,712,053$
39

City of Statesboro, Georgia Notes to the Basic Financial Statements
For the Year Ended June 30, 2009
Note 3 - Detailed Notes on All Funds (Continued) The following table presents the changes in capital assets for the City’s enterprise funds: Balance Balance
7/1/2008 Additions Deductions 6/30/2009Business-type activities:
Capital assets not being depreciated:Land 518,933$ 30,477$ -$ 549,410$ Construction in progress 1,293,528 118,452 939,419 472,561
Total capital assets not being depreciated 1,812,461 148,929 939,419 1,021,971
Capital assets being depreciatedBuildings 2,020,491 - - 2,020,491 Improvements other than buildings 57,981,363 1,993,723 - 59,975,086 Machinery and equipment 8,514,111 1,005,214 42,035 9,477,290
Total capital assets being depreciated 68,515,965 2,998,937 42,035 71,472,867
Total capital assets 70,328,426 3,147,866 981,454 72,494,838
Accumulated depreciation:Buildings 743,686 58,178 - 801,864 Improvements other than buildings 19,578,686 1,470,518 - 21,049,204 Machinery and equipment 5,955,560 672,572 41,284 6,586,848
Total accumulated depreciation 26,277,932 2,201,268 41,284 28,437,916
Business-type activities capital assets, net 44,050,494$ 946,598$ 940,170$ 44,056,922$
3-E. - Interfund Balances and Transfers Interfund balances at June 30, 2009, consisted of the following amounts and represent charges for services or reimbursable expenses. These remaining balances resulted from the time lag between the dates that (1) interfund goods or services are provided or reimbursable expenditures occur, (2) transactions are recorded in the accounting period, and (3) payments between funds are made. The City expects to repay all interfund balances within one year. Receivable Fund Payable Fund Amount
General Fund Multiple Grant Fund 193,817$ Solid Waste Collection Fund 1,001 Solid Waste Disposal Fund 956,407
2002 SPLOST Fund Capital Improvements Program Fund 154,317 2007 SPLOST Fund General Fund 46,274 Water and Sewer Operations 2002 SPLOST Fund 167,251 Solid Waste Collection Solid Waste Disposal Fund 1,609 Solid Waste Disposal 2007 SPLOST Fund 291,667
1,812,343$
40
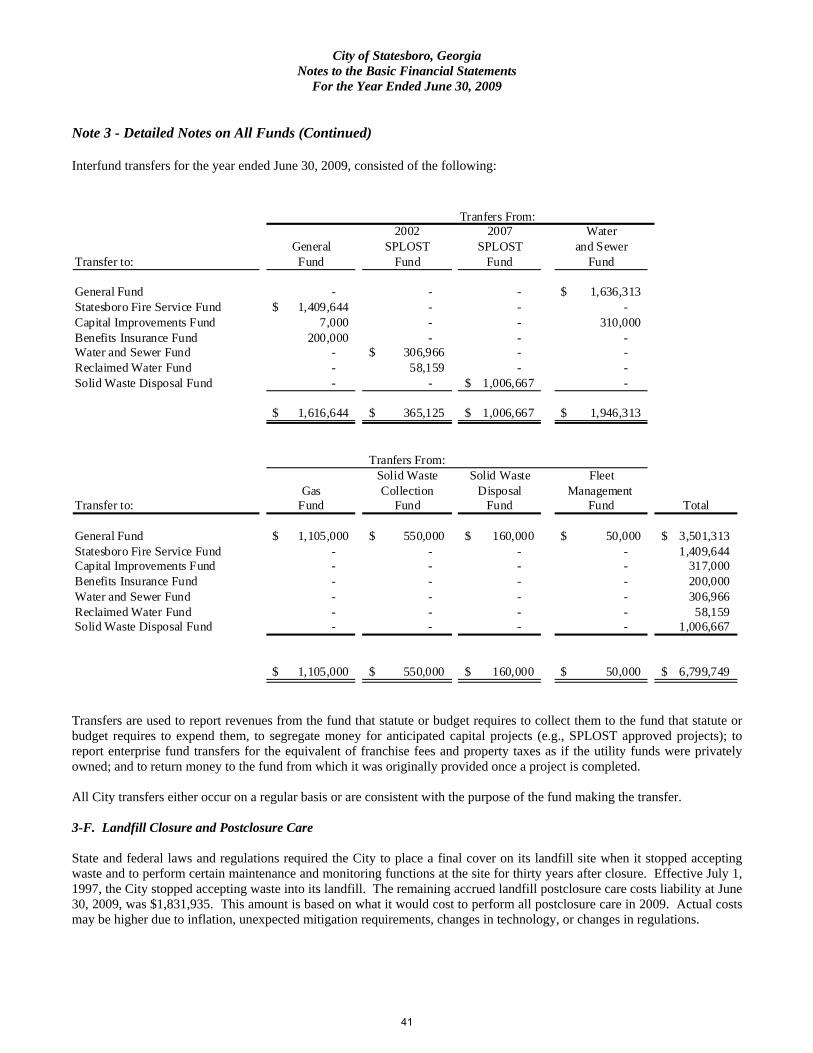
City of Statesboro, Georgia Notes to the Basic Financial Statements
For the Year Ended June 30, 2009
Note 3 - Detailed Notes on All Funds (Continued) Interfund transfers for the year ended June 30, 2009, consisted of the following:
2002 2007 WaterGeneral SPLOST SPLOST and Sewer
Transfer to: Fund Fund Fund Fund
General Fund - - - 1,636,313$ Statesboro Fire Service Fund 1,409,644$ - - - Capital Improvements Fund 7,000 - - 310,000 Benefits Insurance Fund 200,000 - - - Water and Sewer Fund - 306,966$ - - Reclaimed Water Fund - 58,159 - - Solid Waste Disposal Fund - - 1,006,667$ -
1,616,644$ 365,125$ 1,006,667$ 1,946,313$
Solid Waste Solid Waste FleetGas Collection Disposal Management
Transfer to: Fund Fund Fund Fund Total
General Fund 1,105,000$ 550,000$ 160,000$ 50,000$ 3,501,313$ Statesboro Fire Service Fund - - - - 1,409,644 Capital Improvements Fund - - - - 317,000 Benefits Insurance Fund - - - - 200,000 Water and Sewer Fund - - - - 306,966 Reclaimed Water Fund - - - - 58,159 Solid Waste Disposal Fund - - - - 1,006,667
1,105,000$ 550,000$ 160,000$ 50,000$ 6,799,749$
Tranfers From:
Tranfers From:
Transfers are used to report revenues from the fund that statute or budget requires to collect them to the fund that statute or budget requires to expend them, to segregate money for anticipated capital projects (e.g., SPLOST approved projects); to report enterprise fund transfers for the equivalent of franchise fees and property taxes as if the utility funds were privately owned; and to return money to the fund from which it was originally provided once a project is completed. All City transfers either occur on a regular basis or are consistent with the purpose of the fund making the transfer. 3-F. Landfill Closure and Postclosure Care State and federal laws and regulations required the City to place a final cover on its landfill site when it stopped accepting waste and to perform certain maintenance and monitoring functions at the site for thirty years after closure. Effective July 1, 1997, the City stopped accepting waste into its landfill. The remaining accrued landfill postclosure care costs liability at June 30, 2009, was $1,831,935. This amount is based on what it would cost to perform all postclosure care in 2009. Actual costs may be higher due to inflation, unexpected mitigation requirements, changes in technology, or changes in regulations.
41

City of Statesboro, Georgia Notes to the Basic Financial Statements
For the Year Ended June 30, 2009
Note 3 - Detailed Notes on All Funds (Continued) 3-G. Long-Term Debt Water and Sewer Refunding Revenue Bonds - During the fiscal year ended June 30, 1996, the City issued revenue refunding bonds of $6,730,000. The City issued the 1995 Series Revenue Refunding Bonds to advance refund Water and Sewer Revenue Refunding and Improvement Bonds, Series 1978, with an outstanding balance of $3,220,000, an $843,354 Georgia Environmental Facilities Authority (GEFA) note, and a $1,993,690 GEFA note. Additionally, a portion of the net proceeds was deposited into the Water and Sewer Operating Fund Construction Account. The amount of outstanding refunded debt at June 30, 2009 was $485,000. The City pledges income derived from the constructed or acquired assets to pay debt service. The revenue bonds have interest rates ranging from 4.20 percent to 5.20 percent. The bonds require principal payments each April 1 and interest is payable semiannually on April 1 and October 1 each year. Annual debt service requirements to amortize all obligations outstanding, as of June 30, 2009 follow:
Year Principal Interest Total
2010 270,000$ 25,085$ 295,085$ 2011 215,000 11,180 226,180
Total 485,000$ 36,265$ 521,265$
Notes Payable – The City has entered into a number of notes with the Georgia Environmental Facilities Authority (GEFA), the Municipal Gas Authority of Georgia (MGAG) and One Georgia Authority with balances at June 30, 2009, as follows: GEFA (95-S84WS),payable in quarterly installments of $18,561 including interest at 5.12% through April 1, 2016 434,465$
GEFA (97-L99WS),payable in quarterly installments of $4,067 including interest at 4.76% through July 1, 2018 121,143
GEFA (97-L10WJ), payable in quarterly installments of $20,987 including interest at 4.76% through March 1, 2019 651,785
One Georgia Authority, payable in quarterly installments of $8,334 including interest at 3% through April 1, 2022 357,807
MGAG, payable in monthly installments of $7,522 including interest at 5.85% through December 12, 2009 36,591
GEFA (98L44WQ), payable in quarterly installments of $36,217 including interest at 4.79% through January 1, 2020 1,211,655
GEFA (97L11WJ), payable in quarterly installments of $19,532 including interest at 4.76% through December 1, 2020 688,848
GEFA (98L81WQ), payable in quarterly installments of $16,540 including interest at 4.24% through November 1, 2020 599,699
42
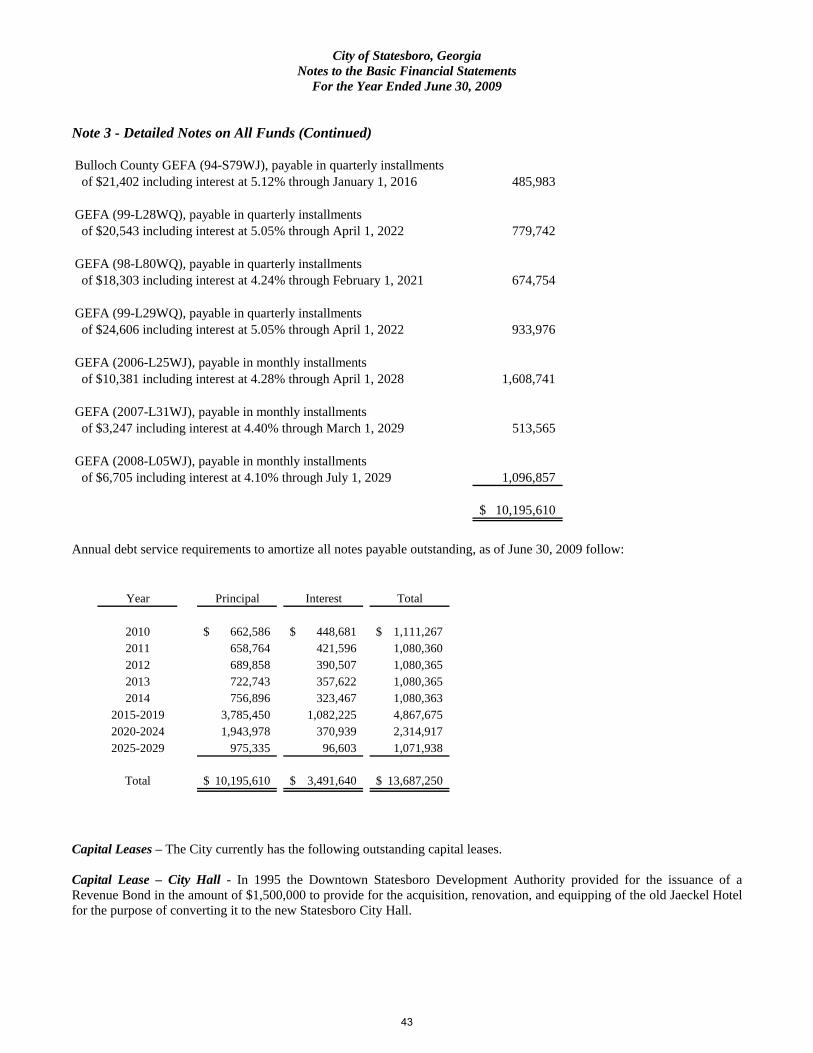
City of Statesboro, Georgia Notes to the Basic Financial Statements
For the Year Ended June 30, 2009
Note 3 - Detailed Notes on All Funds (Continued) Bulloch County GEFA (94-S79WJ), payable in quarterly installments of $21,402 including interest at 5.12% through January 1, 2016 485,983
GEFA (99-L28WQ), payable in quarterly installments of $20,543 including interest at 5.05% through April 1, 2022 779,742
GEFA (98-L80WQ), payable in quarterly installments of $18,303 including interest at 4.24% through February 1, 2021 674,754
GEFA (99-L29WQ), payable in quarterly installments of $24,606 including interest at 5.05% through April 1, 2022 933,976
GEFA (2006-L25WJ), payable in monthly installments of $10,381 including interest at 4.28% through April 1, 2028 1,608,741
GEFA (2007-L31WJ), payable in monthly installments of $3,247 including interest at 4.40% through March 1, 2029 513,565
GEFA (2008-L05WJ), payable in monthly installments of $6,705 including interest at 4.10% through July 1, 2029 1,096,857
10,195,610$
Annual debt service requirements to amortize all notes payable outstanding, as of June 30, 2009 follow:
Year Principal Interest Total
2010 662,586$ 448,681$ 1,111,267$ 2011 658,764 421,596 1,080,360 2012 689,858 390,507 1,080,365 2013 722,743 357,622 1,080,365 2014 756,896 323,467 1,080,363
2015-2019 3,785,450 1,082,225 4,867,675 2020-2024 1,943,978 370,939 2,314,917 2025-2029 975,335 96,603 1,071,938
Total 10,195,610$ 3,491,640$ 13,687,250$
Capital Leases – The City currently has the following outstanding capital leases. Capital Lease – City Hall - In 1995 the Downtown Statesboro Development Authority provided for the issuance of a Revenue Bond in the amount of $1,500,000 to provide for the acquisition, renovation, and equipping of the old Jaeckel Hotel for the purpose of converting it to the new Statesboro City Hall.
43

City of Statesboro, Georgia Notes to the Basic Financial Statements
For the Year Ended June 30, 2009
Note 3 – Detailed Notes on All Funds (Continued) The Bond bears an interest rate of 70% of the prime rate but can never be less than 4.2% or more than 10.5%. Interest on the Bond is paid to Sea Island Bank by the City of Statesboro semi-annually on the first day of June and the first day of December beginning June 1, 1997. Principal payments are made in annual installments on December 1, each year beginning in 1997 and ending in 2022. Upon payment in full of the debt the Downtown Statesboro Development Authority will convey the property to the City without further consideration. The total cost for the project under the capital lease was $1,733,719.
Year Principal Interest Total
2010 55,000$ 42,399$ 97,399$ 2011 58,500 40,015 98,515 2012 62,000 37,485 99,485 2013 65,500 34,808 100,308 2014 69,500 31,972 101,472
2015-2019 414,500 111,080 525,580 2020-2022 312,000 20,160 332,160
Total 1,037,000$ 317,919$ 1,354,919$
Capital Lease – Georgia Municipal Association (GMA) –The City has entered into lease agreements with GMA to purchase the following equipment:
Cost2006 Ford Five Hundred 18,662$ 2008 F350 Truck 25,299 2007 F150 Truck 14,440 Extrication Tool 51,411 Computer Hardware 25,519 2007 Tymco Street Sweeper 92,846 Motorola Communication Equipment 249,404 (8) 2008 Dodge Chargers 217,168 Police Office Furnishings 316,742 2008 Chevrolet Silverado 21,108 2008 F150 Truck 15,412 2009 F150 Truck 22,297 (2) 2008 East Tandem Trucks 129,590 2008 F250 Truck 18,036 2008 Peterbilt 320 Garbage Truck 202,834
1,420,768$
44
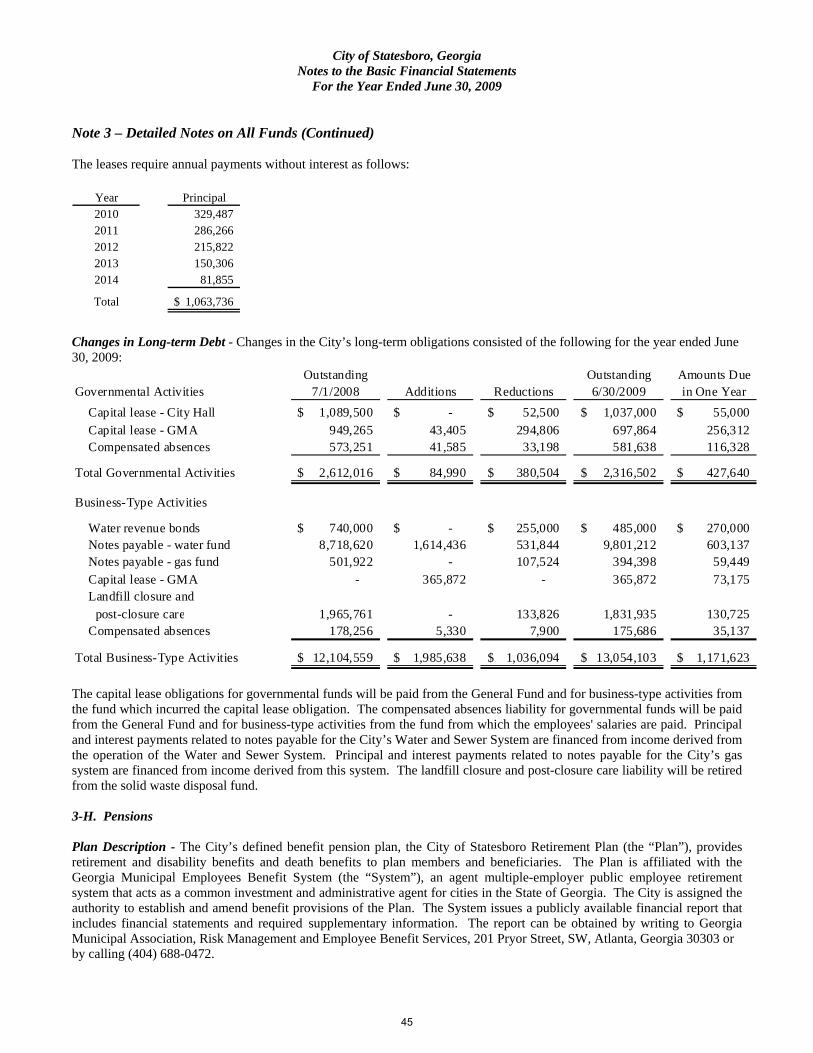
City of Statesboro, Georgia Notes to the Basic Financial Statements
For the Year Ended June 30, 2009
Note 3 – Detailed Notes on All Funds (Continued) The leases require annual payments without interest as follows:
Year Principal2010 329,487 2011 286,266 2012 215,822 2013 150,306 2014 81,855
Total 1,063,736$
Changes in Long-term Debt - Changes in the City’s long-term obligations consisted of the following for the year ended June 30, 2009:
Outstanding Outstanding Amounts DueGovernmental Activities 7/1/2008 Additions Reductions 6/30/2009 in One Year
Capital lease - City Hall 1,089,500$ -$ 52,500$ 1,037,000$ 55,000$ Capital lease - GMA 949,265 43,405 294,806 697,864 256,312 Compensated absences 573,251 41,585 33,198 581,638 116,328
Total Governmental Activities 2,612,016$ 84,990$ 380,504$ 2,316,502$ 427,640$
Business-Type Activities
Water revenue bonds 740,000$ -$ 255,000$ 485,000$ 270,000$ Notes payable - water fund 8,718,620 1,614,436 531,844 9,801,212 603,137 Notes payable - gas fund 501,922 - 107,524 394,398 59,449 Capital lease - GMA - 365,872 - 365,872 73,175 Landfill closure and post-closure care 1,965,761 - 133,826 1,831,935 130,725 Compensated absences 178,256 5,330 7,900 175,686 35,137
Total Business-Type Activities 12,104,559$ 1,985,638$ 1,036,094$ 13,054,103$ 1,171,623$
The capital lease obligations for governmental funds will be paid from the General Fund and for business-type activities from the fund which incurred the capital lease obligation. The compensated absences liability for governmental funds will be paid from the General Fund and for business-type activities from the fund from which the employees' salaries are paid. Principal and interest payments related to notes payable for the City’s Water and Sewer System are financed from income derived from the operation of the Water and Sewer System. Principal and interest payments related to notes payable for the City’s gas system are financed from income derived from this system. The landfill closure and post-closure care liability will be retired from the solid waste disposal fund. 3-H. Pensions Plan Description - The City’s defined benefit pension plan, the City of Statesboro Retirement Plan (the “Plan”), provides retirement and disability benefits and death benefits to plan members and beneficiaries. The Plan is affiliated with the Georgia Municipal Employees Benefit System (the “System”), an agent multiple-employer public employee retirement system that acts as a common investment and administrative agent for cities in the State of Georgia. The City is assigned the authority to establish and amend benefit provisions of the Plan. The System issues a publicly available financial report that includes financial statements and required supplementary information. The report can be obtained by writing to Georgia Municipal Association, Risk Management and Employee Benefit Services, 201 Pryor Street, SW, Atlanta, Georgia 30303 or by calling (404) 688-0472.
45

City of Statesboro, Georgia Notes to the Basic Financial Statements
For the Year Ended June 30, 2009
Note 3 – Detailed Notes on All Funds (Continued) Funding Policy - Employees are not required to contribute to the Plan. The City is required to contribute at an actuarially determined rate. The minimum annual contribution requirements of the City are established by Public Retirement Systems Standards Law (Georgia Code Section 47-20-10). Annual Pension Cost and Net Pension Obligation - For 2009 the City’s annual pension cost of $1,197,070 for the plan was equal to the City’s required and actual contributions. The required contribution was determined as part of the March 1, 2009, actuarial valuation using the projected unit credit actuarial cost method. The actuarial assumptions included (a) 8% investment rate of return, (b) projected salary increases of 5% per year for inflation, (c) additional projected salary increases of 5.5% per year attributed to seniority/merit, and (d) no post-retirement benefit increase. The actuarial value of assets was determined using techniques that smooth the effects of short-term volatility in the market value of investments over a ten-year period. The period, and related method, for amortizing the initial unfunded actuarial accrued liability is thirty years from 1982 and current changes in the unfunded actuarial accrued liability over fifteen years for actuarial gains and losses, twenty years for plan provisions and thirty years for actuarial assumptions and cost methods at a level dollar amount. These amortization periods, if applicable, are closed for this plan year.
(6)(4) Unfunded
(1) (2) (3) Unfunded (5) AAL/(FundingActuarial Actuarial Actuarial Funded AAL/(Funding Annual Excess) as aValuation Value Accrued Ratio Excess) Covered Percentage of
Date of Assets Liability (AAL) (1)/(2) (2)-(1) Payroll Covered Payroll
3/1/2007 12,120,111$ 12,094,093$ 100.2% (26,018)$ 8,058,192$ (0.3)%3/1/2008 13,175,098 14,037,526 93.9% 862,428 9,369,557 9.2%3/1/2009 11,035,485 14,895,270 74.1% 3,859,785 10,180,533 37.9%
Schedule of Funding Progress
AnnualYear Ended Pension Percentage
June 30 Cost Contributed
2007 544,797$ 100%2008 743,290 100%2009 1,197,070 100%
Schedule of Employer Contributions
46

City of Statesboro, Georgia Notes to the Basic Financial Statements
For the Year Ended June 30, 2009
Note 3 – Detailed Notes on All Funds (Continued) 3-I. Net Assets Net assets on the government-wide statement of net assets as of June 30, 2009 are as follows:
Business Governmental Type Component
Investments in capital assets, net of related debt: Activities Activities Unit
Cost of capital assets 35,907,775$ 72,494,838$ 19,997$ Less accumulated depreciation 10,187,594 28,437,916 6,033 Book value 25,720,181 44,056,922 13,964 Less capital related debt 1,734,864 11,046,482 - Plus bond issuance and refunding amounts - 36,806 - Investments in capital assets, net of related debt 23,985,317$ 33,047,246$ 13,964$
Note 4 - Other Notes 4-A. Risk Management The City is exposed to various risks of loss related to torts; theft of, damage to and destruction of assets; errors and omissions; and natural disasters. The City has joined the Georgia Interlocal Risk Management Agency (GIRMA). This membership allows the City to share liability, crime, motor vehicle, and property damage risks. Chapter 85 of Title 36 of the Official Code of Georgia Annotated authorizes Georgia municipalities to form interlocal risk management agencies. The Georgia Interlocal Risk Management Agency (GIRMA) is a municipal interlocal risk management agency to function as an unincorporated nonprofit instrumentality of its member municipalities – GIRMA establishes and administers one or more group self insurance funds and a risk management service to prevent or lessen the incidence and severity of casualty and property losses occurring in the operation of municipal government. GIRMA is to defend and protect in accordance with the member government contract and related coverage descriptions any member of GIRMA against liability or loss. The City of Statesboro must participate at all times in at least one fund which is established by GIRMA. The City of Statesboro retains the first $1,000 of each risk of loss in the form of a deductible. The City files all claims with GIRMA. GIRMA bills the City for any risk of loss up to the $1,000 deductible. The basis for estimating the liabilities for unpaid claims is “IBNR” established by an actuary. During the year ended June 30, 2009, the City paid 9 claims up to the $1,000 deductible totaling $7,708. The City is not aware of any claims which the City is liable for (up to $1,000) which were outstanding and unpaid at June 30, 2009. No provisions have been made in the financial statements for the year ended June 30, 2009 for any estimate of potential unpaid claims. Pursuant to Title 34, Chapter 9, Article 4 of the Official Code of Georgia Annotated, the City of Statesboro became a member of the Georgia Municipal Association Workers’ Compensation Self Insurance Fund. The liability of the fund to the employees of any employer (City) is specifically limited to such obligations as are imposed by applicable state laws against the employer for workers’ compensation and/or employer’s liability.
47
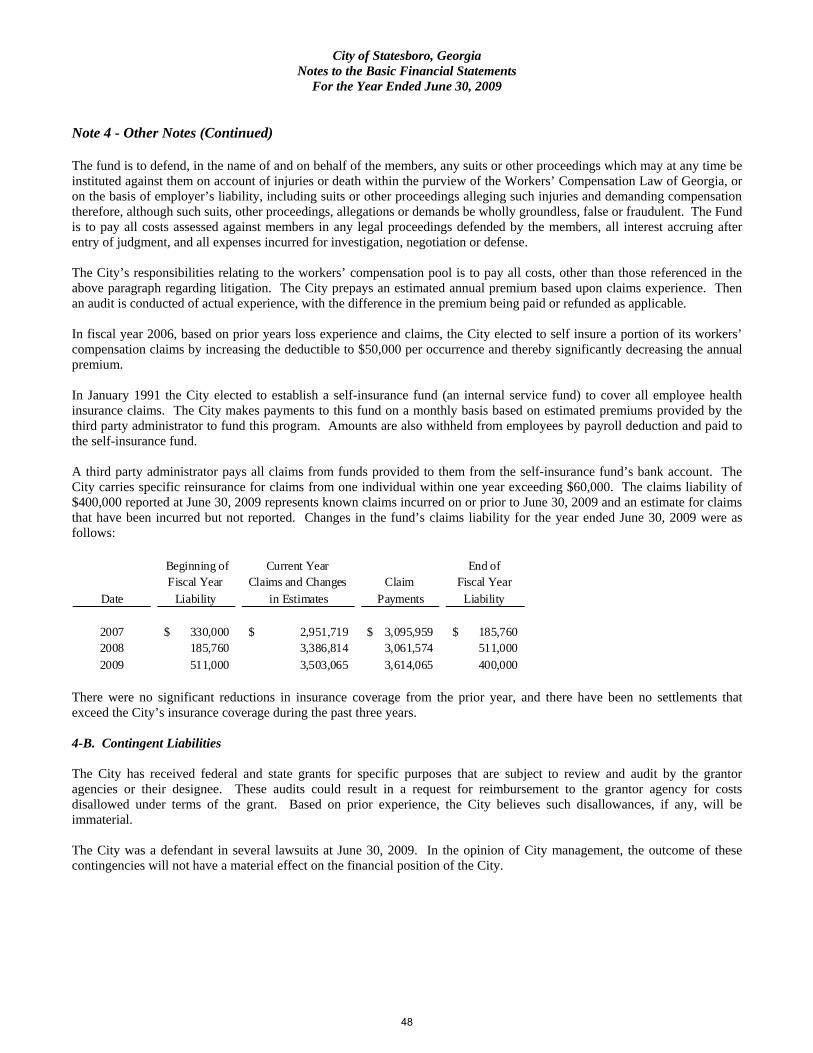
City of Statesboro, Georgia Notes to the Basic Financial Statements
For the Year Ended June 30, 2009
Note 4 - Other Notes (Continued) The fund is to defend, in the name of and on behalf of the members, any suits or other proceedings which may at any time be instituted against them on account of injuries or death within the purview of the Workers’ Compensation Law of Georgia, or on the basis of employer’s liability, including suits or other proceedings alleging such injuries and demanding compensation therefore, although such suits, other proceedings, allegations or demands be wholly groundless, false or fraudulent. The Fund is to pay all costs assessed against members in any legal proceedings defended by the members, all interest accruing after entry of judgment, and all expenses incurred for investigation, negotiation or defense. The City’s responsibilities relating to the workers’ compensation pool is to pay all costs, other than those referenced in the above paragraph regarding litigation. The City prepays an estimated annual premium based upon claims experience. Then an audit is conducted of actual experience, with the difference in the premium being paid or refunded as applicable. In fiscal year 2006, based on prior years loss experience and claims, the City elected to self insure a portion of its workers’ compensation claims by increasing the deductible to $50,000 per occurrence and thereby significantly decreasing the annual premium. In January 1991 the City elected to establish a self-insurance fund (an internal service fund) to cover all employee health insurance claims. The City makes payments to this fund on a monthly basis based on estimated premiums provided by the third party administrator to fund this program. Amounts are also withheld from employees by payroll deduction and paid to the self-insurance fund. A third party administrator pays all claims from funds provided to them from the self-insurance fund’s bank account. The City carries specific reinsurance for claims from one individual within one year exceeding $60,000. The claims liability of $400,000 reported at June 30, 2009 represents known claims incurred on or prior to June 30, 2009 and an estimate for claims that have been incurred but not reported. Changes in the fund’s claims liability for the year ended June 30, 2009 were as follows:
Beginning of Current Year End of Fiscal Year Claims and Changes Claim Fiscal Year
Date Liability in Estimates Payments Liability
2007 330,000$ 2,951,719$ 3,095,959$ 185,760$ 2008 185,760 3,386,814 3,061,574 511,000 2009 511,000 3,503,065 3,614,065 400,000
There were no significant reductions in insurance coverage from the prior year, and there have been no settlements that exceed the City’s insurance coverage during the past three years. 4-B. Contingent Liabilities The City has received federal and state grants for specific purposes that are subject to review and audit by the grantor agencies or their designee. These audits could result in a request for reimbursement to the grantor agency for costs disallowed under terms of the grant. Based on prior experience, the City believes such disallowances, if any, will be immaterial. The City was a defendant in several lawsuits at June 30, 2009. In the opinion of City management, the outcome of these contingencies will not have a material effect on the financial position of the City.
48

City of Statesboro, Georgia Notes to the Basic Financial Statements
For the Year Ended June 30, 2009
Note 4 - Other Notes (Continued) 4-C. Joint Ventures Under Georgia law, the City, in conjunction with other cities and counties in the nine county coastal Georgia area, is a member of the Coastal Georgia Regional Development Center (RDC) and is required to pay annual dues thereto. During the year ended June 30, 2009, the City paid $23,881 in such dues. Membership in an RDC is required by the Official Code of Georgia Annotated (OCGA) Section 50-8-34, which provides for the organizational structure of the RDC in Georgia. The RDC Board membership includes the chief elected official of each county and municipality of the area. OCGA 50-8-39.1 provides that the member governments are liable for any debts or obligations of an RDC. Separate financial statements may be obtained from the Coastal Georgia Regional Development Center, P.O. Box 1917, Brunswick, Georgia 31521. 4-D. Hotel-Motel Lodging Tax The City has levied a 5% lodging tax. A summary of the transactions for the year ended June 30, 2009 follows:
Percentage oftax receipts
Lodging tax receipts 456,994$
Disbursements to the:
Statesboro Convention and Visitors Bureau (315,326) 69.0%for promotion of tourism
Statesboro Arts Council for (104,942) 23.0%performing arts center
Downtown Statesboro Development Authority (36,726) 8.0%for promotion of tourism
Total -$
All expenditures were for promotion of tourism as required by O.C.G.A. 48-13-51. 4-E. Other Post-Employment Benefits Plan Description. The City sponsors a single-employer post-retirement medical plan. The plan provides medical, prescription and death benefits to eligible retirees and their spouses. At June 30, 2009, three retired employees were eligible to participate. Since the plan has no assets, reporting an other employee benefit trust fund in the accompanying financial statements is not required nor was a separate or stand-alone report issued. Funding Policy. The contribution requirements of plan members and the City are established and may be amended by the City Council. Plan members are not required to contribute; however, plan members receiving healthcare benefits pay for 50% of the health care insurance premium for individual and family coverage if the employee had 10 to 25 years of service at retirement and 100% of coverage if the employee has 25 or more years of service. For the year ended June 30, 2009, the City made no contributions and instead elected to continue funding on a pay-as-you-go basis, which amounted to $23,348 for 2009. These costs are recognized as an expense when claims or premiums are paid.
49

City of Statesboro, Georgia Notes to the Basic Financial Statements
For the Year Ended June 30, 2009
Note 4 – Other Notes (Continued) Annual OPEB Cost and Net OPEB Obligation. The City’s annual other post-retirement benefit (OPEB) cost (expense) is calculated based on the annual required contribution of the employer (ARC), an amount actuarially determined in accordance with the parameters of GASB Statement 45. The ARC represents a level of funding that, if paid on an ongoing basis, is projected to cover normal cost each year and amortize any unfunded actuarial liabilities (or funding excess) over a period not to exceed 30 years. The following table shows the components of the City’s annual OPEB cost for the year, the amount actually contributed to the plan, and changes in the City’s net OPEB Obligation.
The City’s annual OPEB cost, the percentage of annual OPEB cost contributed to the plan, and the net OPEB obligation for 2008-2009 is as follows:
Funded Status and Funding Progress. As of July 1, 2008, the most recent actuarial valuation date, the plan was 0% funded. The actuarial accrued liability for benefits was $1,014,592 and the actuarial value of assets was $0 resulting in an unfunded actuarial accrued liability (UAAL) of $1,014,592. The covered payroll (annual payroll of active employees covered by the plan) was $9,868,977 and the ratio of the UAAL to the covered payroll was 10.3%. Actuarial valuations of an ongoing plan involve estimates of the value of reported amounts and assumptions about the probability of occurrence of events far into the future. Examples include assumptions about future employment, mortality, and the healthcare cost trend. Amounts determined regarding the funded status of the plan and the annual required contributions of the employer are subject to continual revision as actual results are compared with past expectations and new estimates are made about the future. Actuarial Methods and Assumptions. Projections of benefits for financial reporting purposes are based on the substantive plan (the plan as understood by the employer and the plan members) and includes the type of benefits provided at the time of each valuation and the historical pattern of sharing the benefit costs between the employer and plan members to that point. The actuarial methods and assumptions used include techniques that are designed to reduce the effects of short-term volatility in actuarial accrued liabilities and the actuarial value of assets, consistent with the long-term perspective of the calculations. In the July 1, 2008 actuarial valuation, the projected unit credit actuarial cost method was used. The actuarial assumptions included a 7.0% investment rate of return (net of administrative expenses), which is a blended rate of the expected long-term investment returns on plan assets and on the employer’s own investments calculated based on the funded level of the plan assets at the valuation date, and an annual healthcare cost trend rate of 8% initially, reduced by decrements to an ultimate rate of 5% after three years. The actuarial value of assets was determined using a standard balanced portfolio expectation for retirement plan asset returns. The UAAL is being amortized as a level percentage of payroll on an open basis. The remaining amortization period at July 1, 2008 was 30 years.
Annual Required Contribution 110,899$ Interest on Net OPEB Obligation - Adjustment to Annual Required Contribution - Annual OPEB Cost (Expense) 110,899 Contributions Made (23,348) Increase in Net Obligation 87,551 Net OPEB Obligation (BOY) - Net OPEB Obligation (EOY) 87,551$
Fiscal Year Ended Annual OPEB Cost
OPEB Cost Contributed
Net OPEB Obligation
6/30/2009 110,899$ 21.1% 87,551$
50

Nonmajor Governmental Funds—By Fund Type

Nonmajor Nonmajor TotalSpecial Capital NonmajorRevenue Projects Governmental
Funds Fund FundsAssetsCash and cash equivalents 156,818$ 37,116$ 193,934$ Receivables: Hotel/motel taxes 44,154 - 44,154 Intergovernmental 197,945 37,225 235,170 Notes 185,056 - 185,056
Total Assets 583,973$ 74,341$ 658,314$
Liabilities and Fund Balance
LiabilitiesAccounts payable 6,372$ 53,552$ 59,924$ Interfund payable 193,817 - 193,817 Deferred revenue 3,668 - 3,668 Other 96,981 - 96,981
Total Liabilities 300,838 53,552 354,390
Fund Balances Unreserved - undesignated 283,135 20,789 303,924
Total Liabilities and Fund Balances 583,973$ 74,341$ 658,314$
City of Statesboro, GeorgiaCombining Balance Sheet
Nonmajor Governmental Funds - By Fund Type June 30, 2009
51

Nonmajor Nonmajor TotalSpecial Capital NonmajorRevenue Projects Governmental
Funds Fund FundsRevenuesHotel/motel taxes 456,994$ -$ 456,994$ Intergovernmental 381,366 46,297 427,663 Fines and forfeitures 109,631 - 109,631 Investment earnings 365 - 365 Miscellaneous 4,626 - 4,626
Total Revenues 952,982 46,297 999,279
Expenditures Public safety 428,641 - 428,641 Community development 456,994 - 456,994 Public works - 128,794 128,794
Total Expenditures 885,635 128,794 1,014,429
Net Change in Fund Balances 67,347 (82,497) (15,150)
Fund Balances Beginning of Year 215,788 103,286 319,074
Fund Balances End of Year 283,135$ 20,789$ 303,924$
City of Statesboro, GeorgiaCombining Statement of Revenues, Expenditures and Changes in Fund Balances
Nonmajor Governmental Funds - By Fund TypeFor the Year Ended June 30, 2009
52

General Fund

2009 2008AssetsCash and cash equivalents 515,690$ 733,835$ Receivables: Taxes 225,611 193,462 Accounts 49,468 63,194 Intergovernmental 25,603 57,980 Notes - 266,109 Interfund 1,151,225 1,006,938 Prepaid items 174,009 170,717
Total Assets 2,141,606$ 2,492,235$
Liabilities and Fund Balances
Liabilities Accounts payable 504,802$ 572,685$ Accrued payroll and payroll taxes 239,764 133,740 Other liabilities 68,235 83,837 Interfund payable 46,274 29,591 Deferred revenue 160,733 23,286
Total Liabilities 1,019,808 843,139
Fund Balances Reserved for prepaid items 174,009 170,717 Unreserved - undesignated 947,789 1,478,379
Total Fund Balances 1,121,798 1,649,096
Total Liabilities and Fund Balances 2,141,606$ 2,492,235$
City of Statesboro, GeorgiaGeneral Fund
Comparative Balance Sheet June 30, 2009 and 2008
53
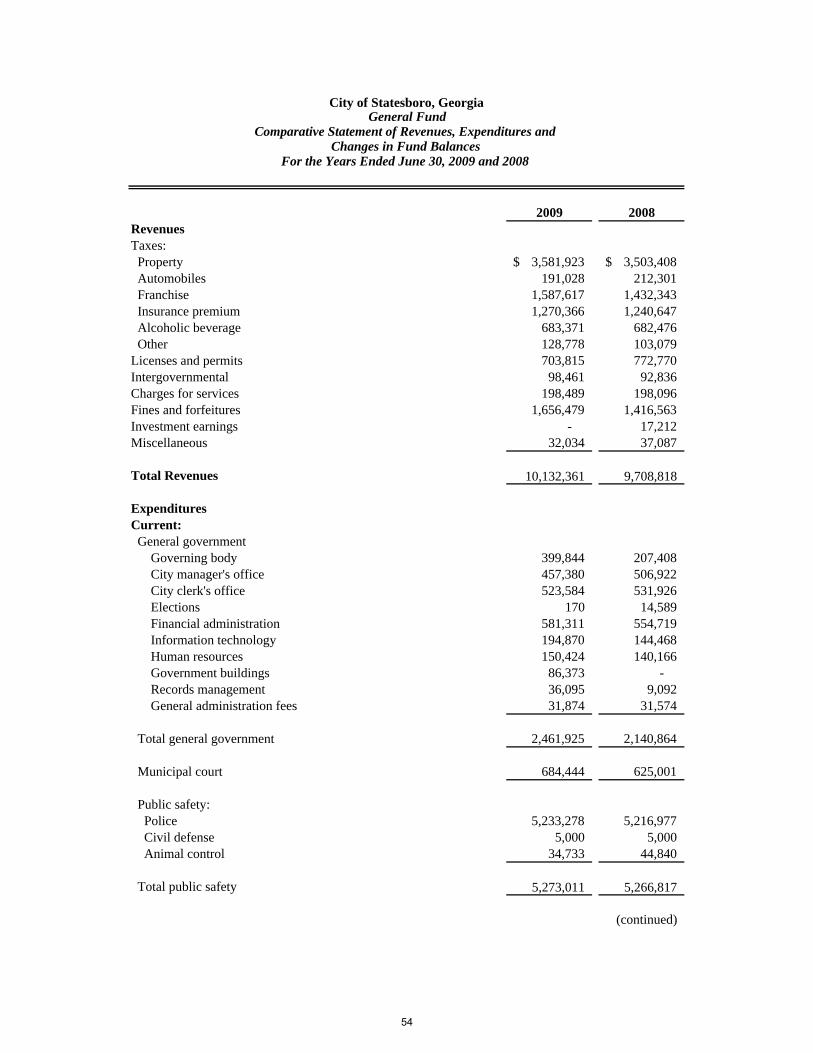
2009 2008RevenuesTaxes: Property 3,581,923$ 3,503,408$ Automobiles 191,028 212,301 Franchise 1,587,617 1,432,343 Insurance premium 1,270,366 1,240,647 Alcoholic beverage 683,371 682,476 Other 128,778 103,079Licenses and permits 703,815 772,770Intergovernmental 98,461 92,836Charges for services 198,489 198,096Fines and forfeitures 1,656,479 1,416,563Investment earnings - 17,212Miscellaneous 32,034 37,087
Total Revenues 10,132,361 9,708,818
ExpendituresCurrent: General government Governing body 399,844 207,408 City manager's office 457,380 506,922 City clerk's office 523,584 531,926 Elections 170 14,589 Financial administration 581,311 554,719 Information technology 194,870 144,468 Human resources 150,424 140,166 Government buildings 86,373 - Records management 36,095 9,092 General administration fees 31,874 31,574
Total general government 2,461,925 2,140,864
Municipal court 684,444 625,001
Public safety: Police 5,233,278 5,216,977 Civil defense 5,000 5,000 Animal control 34,733 44,840
Total public safety 5,273,011 5,266,817
(continued)
For the Years Ended June 30, 2009 and 2008
City of Statesboro, GeorgiaGeneral Fund
Comparative Statement of Revenues, Expenditures andChanges in Fund Balances
54
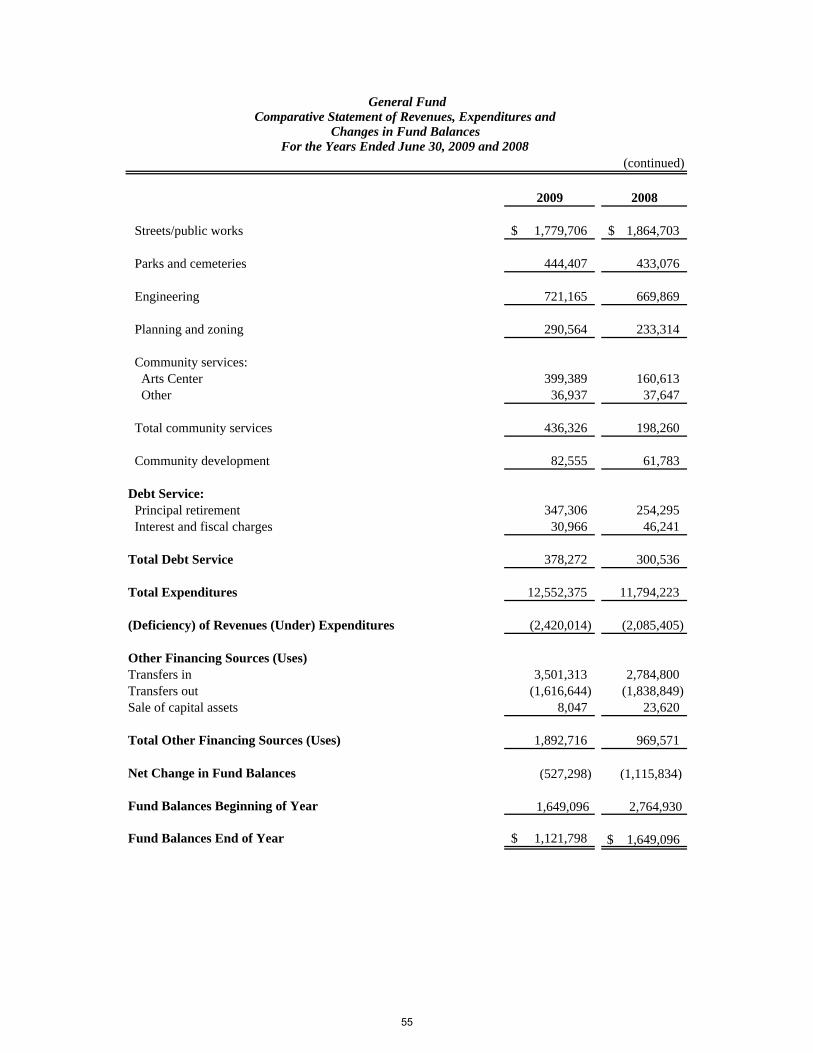
(continued)
2009 2008
Streets/public works 1,779,706$ 1,864,703$
Parks and cemeteries 444,407 433,076
Engineering 721,165 669,869
Planning and zoning 290,564 233,314
Community services: Arts Center 399,389 160,613 Other 36,937 37,647
Total community services 436,326 198,260
Community development 82,555 61,783
Debt Service: Principal retirement 347,306 254,295 Interest and fiscal charges 30,966 46,241
Total Debt Service 378,272 300,536
Total Expenditures 12,552,375 11,794,223
(Deficiency) of Revenues (Under) Expenditures (2,420,014) (2,085,405)
Other Financing Sources (Uses)Transfers in 3,501,313 2,784,800 Transfers out (1,616,644) (1,838,849) Sale of capital assets 8,047 23,620
Total Other Financing Sources (Uses) 1,892,716 969,571
Net Change in Fund Balances (527,298) (1,115,834)
Fund Balances Beginning of Year 1,649,096 2,764,930
Fund Balances End of Year 1,121,798$ $ 1,649,096
For the Years Ended June 30, 2009 and 2008
General FundComparative Statement of Revenues, Expenditures and
Changes in Fund Balances
55

Major Capital Projects Funds

2009 2008AssetsIntergovernmental receivable 72,770$ 397,453$ Interfund receivable 154,317 -
Total Assets 227,087 397,453
Liabilities Accounts payable 6,740$ 67,685$ Deferred revenue 53,096 13,600 Interfund payable 167,251 316,168
Total Liabilities 227,087$ 397,453$
City of Statesboro, Georgia2002 SPLOST Fund
Comparative Balance SheetJune 30, 2009 and 2008
56
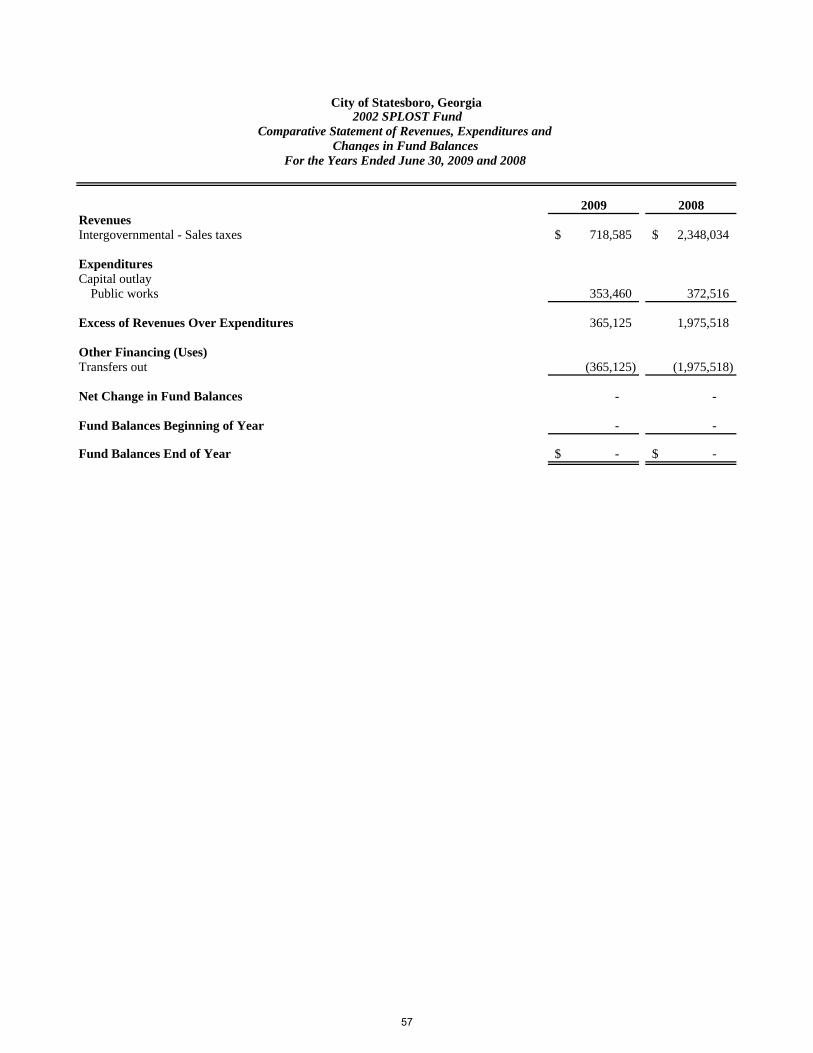
2009 2008RevenuesIntergovernmental - Sales taxes 718,585$ 2,348,034$
ExpendituresCapital outlay Public works 353,460 372,516
Excess of Revenues Over Expenditures 365,125 1,975,518
Other Financing (Uses) Transfers out (365,125) (1,975,518)
Net Change in Fund Balances - -
Fund Balances Beginning of Year - -
Fund Balances End of Year -$ -$
For the Years Ended June 30, 2009 and 2008
City of Statesboro, Georgia2002 SPLOST Fund
Comparative Statement of Revenues, Expenditures andChanges in Fund Balances
57

2009 2008AssetsCash and cash equivalents 377,098$ 557,899$ Intergovernmental receivable 97,223 194,444 Interfund receivable 46,274 -
Total Assets 520,595$ 752,343$
Liabilities and Fund Balances
LiabilitiesAccounts payable 111,727$ -$ Interfund payable 291,667 689,140
Total Liabilities 403,394 689,140
Fund BalancesUnreserved - undesignated 117,201 63,203
Total Liabilities and Fund Balances 520,595$ 752,343$
City of Statesboro, Georgia 2007 SPLOST Fund
Comparative Balance SheetJune 30, 2009 and 2008
58

2009 2008RevenuesIntergovernmental - Sales taxes 1,166,667$ 1,677,778$ Investment earnings 4,401 7,577
Total Revenues 1,171,068 1,685,355
ExpendituresCapital outlay: Parks and Cemetery 52,288 43,765 Municipal Court 58,115 -
Total Expenditures 110,403 43,765
Excess (Deficiency) of Revenues Over (Under) Expenditures 1,060,665 1,641,590
Other Financing (Uses)Transfers out (1,006,667) (777,778)
Net Change in Fund Balances 53,998 863,812
Fund Balances Beginning of Year 63,203 (800,609)
Fund Balances End of Year 117,201$ 63,203$
For the Years Ended June 30, 2009 and 2008
City of Statesboro, Georgia2007 SPLOST Fund
Comparative Statement of Revenues, Expenditures andChanges in Fund Balances
59
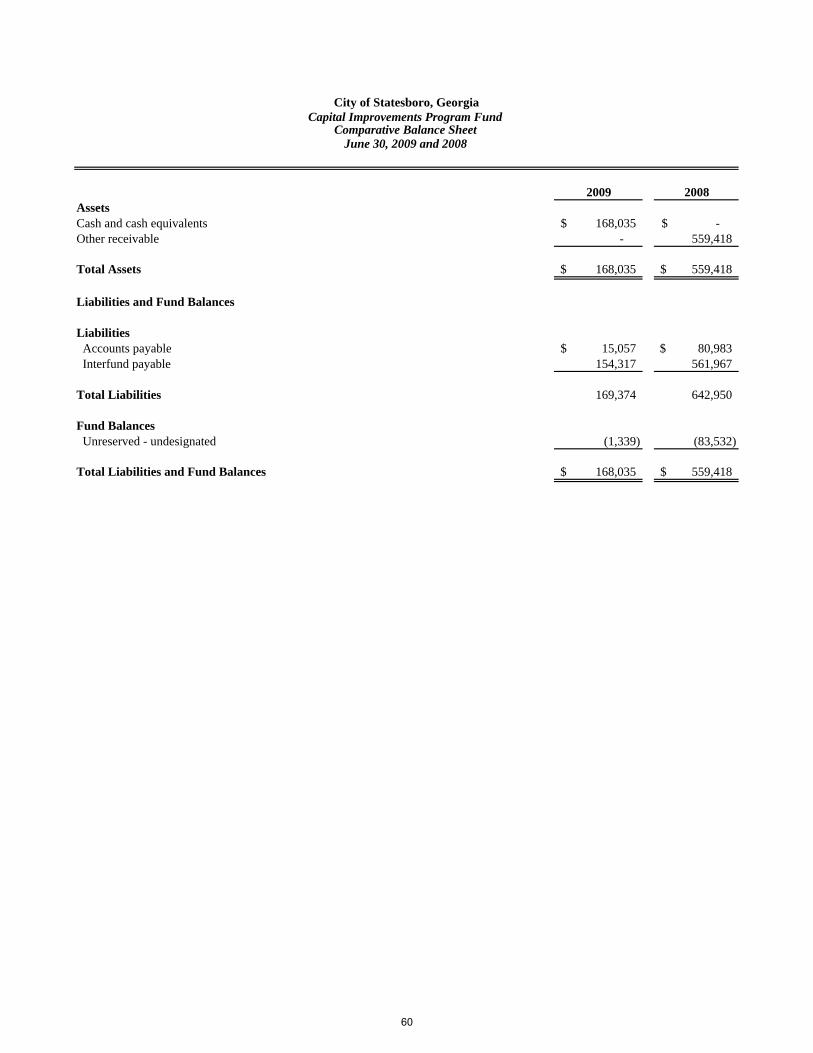
2009 2008AssetsCash and cash equivalents 168,035$ -$ Other receivable - 559,418
Total Assets 168,035$ 559,418$
Liabilities and Fund Balances
Liabilities Accounts payable 15,057$ 80,983$ Interfund payable 154,317 561,967
Total Liabilities 169,374 642,950
Fund Balances Unreserved - undesignated (1,339) (83,532)
Total Liabilities and Fund Balances 168,035$ 559,418$
City of Statesboro, GeorgiaCapital Improvements Program Fund
Comparative Balance SheetJune 30, 2009 and 2008
60
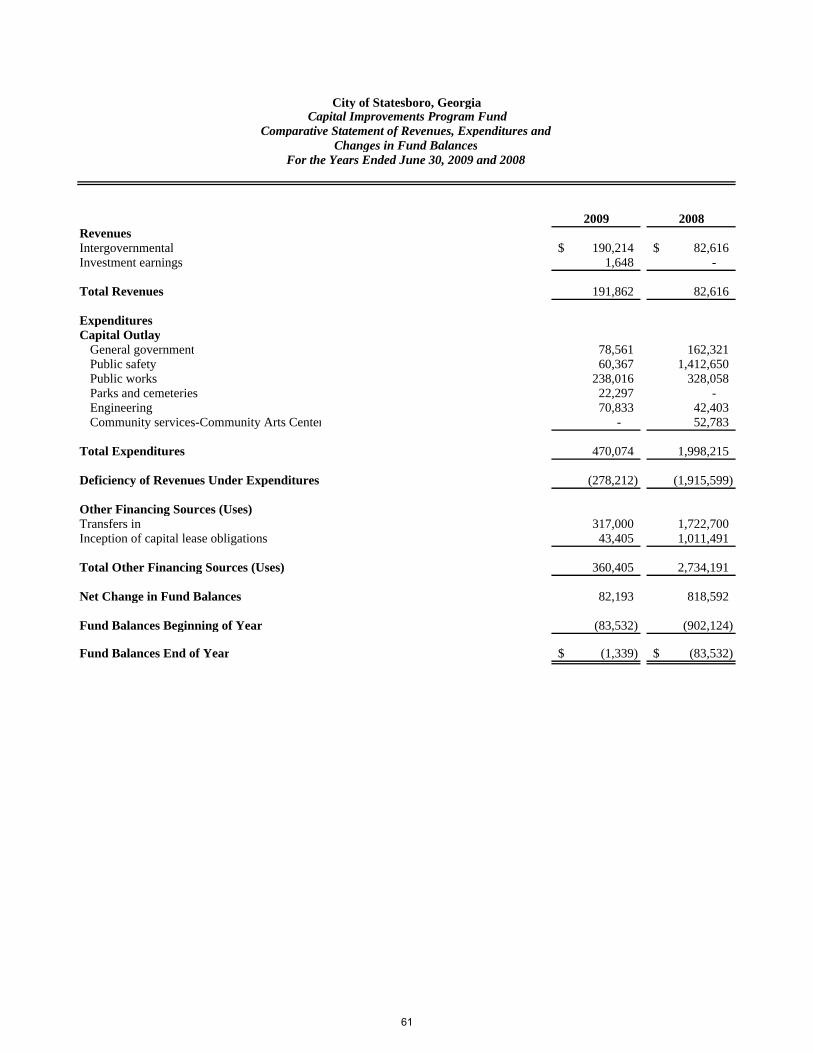
2009 2008RevenuesIntergovernmental 190,214$ 82,616$ Investment earnings 1,648 -
Total Revenues 191,862 82,616
ExpendituresCapital Outlay
General government 78,561 162,321 Public safety 60,367 1,412,650 Public works 238,016 328,058 Parks and cemeteries 22,297 - Engineering 70,833 42,403 Community services-Community Arts Center - 52,783
Total Expenditures 470,074 1,998,215
Deficiency of Revenues Under Expenditures (278,212) (1,915,599)
Other Financing Sources (Uses)Transfers in 317,000 1,722,700 Inception of capital lease obligations 43,405 1,011,491
Total Other Financing Sources (Uses) 360,405 2,734,191
Net Change in Fund Balances 82,193 818,592
Fund Balances Beginning of Year (83,532) (902,124)
Fund Balances End of Year (1,339)$ (83,532)$
For the Years Ended June 30, 2009 and 2008
City of Statesboro, Georgia Capital Improvements Program Fund
Comparative Statement of Revenues, Expenditures andChanges in Fund Balances
61

Nonmajor Capital Projects Funds

2009 2008Assets Cash and cash equivalents 37,116$ 103,318$ Intergovernmental receivable 37,225 -
Total Assets 74,341$ 103,318$
Liabilities and Fund Balances
Liabilities Accounts payable 53,552$ 32$
Fund Balances Unreserved - undesignated 20,789 103,286
Total Liabilities and Fund Balances 74,341$ 103,318$
City of Statesboro, GeorgiaDowntown Streetscape FundComparative Balance Sheet
June 30, 2009 and 2008
62

2009 2008RevenuesIntergovernmental 46,297$ -$
ExpendituresPublic works 128,794 15,337
Deficiency of Revenues Under Expenditures (82,497) (15,337)
Fund Balances Beginning of Year 103,286 118,623
Fund Balances End of Year 20,789$ 103,286$
For the Years Ended June 30, 2009 and 2008
City of Statesboro, GeorgiaDowntown Streetscape Fund
Comparative Statement of Revenues, Expenditures andChanges in Fund Balances
63

Major Special Revenue Funds

2009 2008AssetsCash and cash equivalents 509,905$ 290,074$ Receivables: Intergovernmental 58,635 209,837 Interfund - 1,664 Prepaid items 11,045 12,522
Total Assets 579,585 514,097
Liabilities and Fund Balances
Liabilities Accounts payable 40,546 54,352 Deferred revenue 11,797 13,560 Accrued payroll - 40,676
Total Liabilities 52,343 108,588
Fund Balances Reserved for prepaid items 11,045 12,522 Unreserved - undesignated 516,197 392,987
Total Fund Balances 527,242 405,509
Total Liabilities and Fund Balances 579,585$ 514,097$
City of Statesboro, GeorgiaStatesboro Fire Service FundComparative Balance Sheet
June 30, 2009 and 2008
64

2009 2008RevenuesCharges for services 857,116$ 811,310$ Intergovernmental 122,369 8,477 Investment earnings 2,082 4,297 Miscellaneous 2,038 2,828
Total Revenues 983,605 826,912
ExpendituresCurrent: Fire 2,271,516 2,034,908
(Deficiency) of Revenues (Under) Expenditures (1,287,911) (1,207,996)
Other Financing Sources (Uses)Transfers in 1,409,644 1,608,849 Sale of capital assets - 4,656
Total Other Financing Sources (Uses) 1,409,644 1,613,505
Net Change in Fund Balances 121,733 405,509
Fund Balances Beginning of Year 405,509 -
Fund Balances End of Year 527,242$ 405,509$
Comparative Statement of Revenues,Expenses and Changes in Fund Balances
For the Years Ended June 30, 2009 and 2008
City of Statesboro, GeorgiaStatesboro Fire Service Fund
65

Nonmajor Special Revenue Funds

City of Statesboro, GeorgiaCombining Balance Sheet
Nonmajor Special Revenue FundsJune 30, 2009
TotalNonmajor
Confiscated Department of Hotel/Motel Multiple Special RevenueAssets CDBG Justice Grant Tax Grant Funds
AssetsCash 118,689$ 8,224$ 9,948$ 19,957$ -$ 156,818$ Receivables: Hotel/motel taxes - - - 44,154 - 44,154 Intergovernmental - - - - 197,945 197,945 Notes - 185,056 - - - 185,056
Total Assets 118,689$ 193,280$ 9,948$ 64,111$ 197,945$ 583,973$
Liabilities and Fund Balances
Liabilities Accounts payable -$ -$ 5,912$ -$ 460$ 6,372$ Interfund payable - - - - 193,817 193,817 Deferred revenue - - - - 3,668 3,668 Other 32,870 - - 64,111 - 96,981
Total Liabilities 32,870 - 5,912 64,111 197,945 300,838
Fund Balances Unreserved, undesignated 85,819 193,280 4,036 - - 283,135
Total Liabilities and Fund Balances 118,689$ 193,280$ 9,948$ 64,111$ 197,945$ 583,973$
66
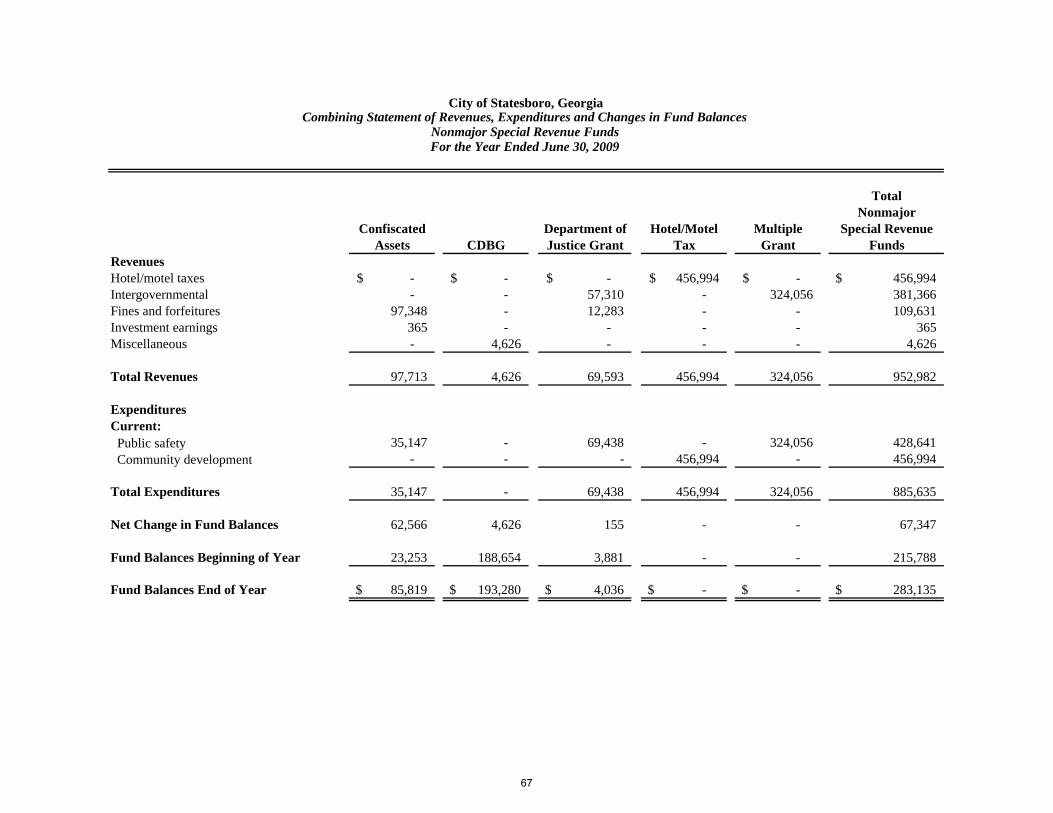
TotalNonmajor
Confiscated Department of Hotel/Motel Multiple Special RevenueAssets CDBG Justice Grant Tax Grant Funds
RevenuesHotel/motel taxes -$ -$ -$ 456,994$ -$ 456,994$ Intergovernmental - - 57,310 - 324,056 381,366 Fines and forfeitures 97,348 - 12,283 - - 109,631 Investment earnings 365 - - - - 365 Miscellaneous - 4,626 - - - 4,626
Total Revenues 97,713 4,626 69,593 456,994 324,056 952,982
ExpendituresCurrent: Public safety 35,147 - 69,438 - 324,056 428,641 Community development - - - 456,994 - 456,994
Total Expenditures 35,147 - 69,438 456,994 324,056 885,635
Net Change in Fund Balances 62,566 4,626 155 - - 67,347
Fund Balances Beginning of Year 23,253 188,654 3,881 - - 215,788
Fund Balances End of Year 85,819$ 193,280$ 4,036$ -$ -$ 283,135$
City of Statesboro, GeorgiaCombining Statement of Revenues, Expenditures and Changes in Fund Balances
Nonmajor Special Revenue FundsFor the Year Ended June 30, 2009
67

2009 2008
AssetsCash and cash equivalents 118,689$ 64,700$
Liabilities and Fund Balances
Liabilities Other liabilities 32,870$ 41,447$
Fund BalancesUnreserved, undesignated 85,819 23,253
Total Liabilities and Fund Balances 118,689$ 64,700$
City of Statesboro, GeorgiaConfiscated Assets Fund
Comparative Balance Sheet June 30, 2009 and 2008
68

2008
VarianceOriginal Final PositiveBudget Budget Actual (Negative) Actual
RevenuesFines and forfeitures 35,000$ 81,000$ 97,348$ 16,348$ 27,845$ Investment earnings 500 500 365 (135) 426
Total Revenues 35,500 81,500 97,713 16,213 28,271
ExpendituresCurrent: Public safety 34,944 39,944 35,147 4,797 2,926
Excess of Revenues Over Expenditures 556 41,556 62,566 21,010 25,345
Other Financing (Uses)Transfers out - - - - (12,500)
Net Change in Fund Balances $ 556 $ 41,556 62,566 $ 21,010 12,845
Fund Balances Beginning of Year 23,253 10,408
Fund Balances End of Year 85,819$ $ 23,253
For the Year Ended June 30, 2009
2009
City of Statesboro, GeorgiaConfiscated Assets Fund
Schedule of Revenues, Expenditures andChanges in Fund Balances - Budget and Actual
(With Comparative Actual Amounts for the Year Ended June 30, 2008)
69

2009 2008
AssetsCash and cash equivalents 8,224$ 35,121$ Notes receivable 185,056 153,533
Total Assets 193,280$ 188,654$
Fund BalancesUnreserved, undesignated 193,280$ 188,654$
City of Statesboro, GeorgiaCommunity Development Block Grant Fund
Comparative Balance Sheet June 30, 2009 and 2008
70

2008
VarianceOriginal and PositiveFinal Budget Actual (Negative) Actual
RevenuesSale of lots 14,340$ 4,626$ (9,714)$ 9,488$
ExpendituresCurrent: Community development - - - -
Net Change in Fund Balances $ 14,340 4,626 $ (9,714) 9,488
Fund Balances Beginning of Year 188,654 179,166
Fund Balances End of Year 193,280$ $ 188,654
For the Year Ended June 30, 2009
2009
City of Statesboro, GeorgiaCommunity Development Block Grant Fund
Schedule of Revenues, Expenditures andChanges in Fund Balances - Budget and Actual
(With Comparative Actual Amounts for the Year Ended June 30, 2008)
71
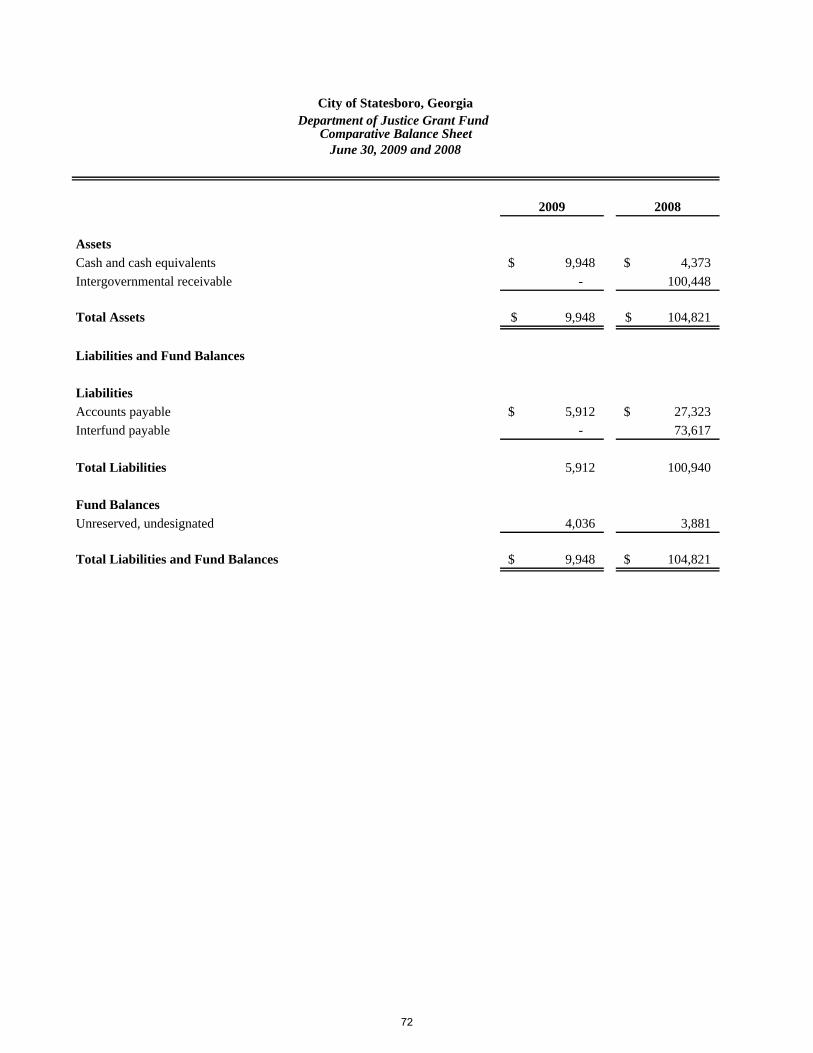
2009 2008
AssetsCash and cash equivalents 9,948$ 4,373$ Intergovernmental receivable - 100,448
Total Assets 9,948$ 104,821$
Liabilities and Fund Balances
LiabilitiesAccounts payable 5,912$ 27,323$ Interfund payable - 73,617
Total Liabilities 5,912 100,940
Fund BalancesUnreserved, undesignated 4,036 3,881
Total Liabilities and Fund Balances 9,948$ 104,821$
City of Statesboro, GeorgiaDepartment of Justice Grant Fund
Comparative Balance Sheet June 30, 2009 and 2008
72

2008
VarianceOriginal Final PositiveBudget Budget Actual (Negative) Actual
RevenuesIntergovernmental 71,315$ 71,315$ 57,310$ (14,005)$ 252,096$ Fines and forfeitures - 20,000 12,283 (7,717) 5,209
Total Revenues 71,315 91,315 69,593 (21,722) 257,305
ExpendituresCurrent: Public safety 71,315 91,315 69,438 21,877 253,424
Net Change in Fund Balances $ - $ - 155 $ 155 3,881
Fund Balances Beginning of Year 3,881 -
Fund Balances End of Year 4,036$ 3,881$
For the Year Ended June 30, 2009
2009
City of Statesboro, GeorgiaDepartment of Justice Grant Fund
Schedule of Revenues, Expenditures andChanges in Fund Balances - Budget and Actual
(With Comparative Actual Amounts for the Year Ended June 30, 2008)
73
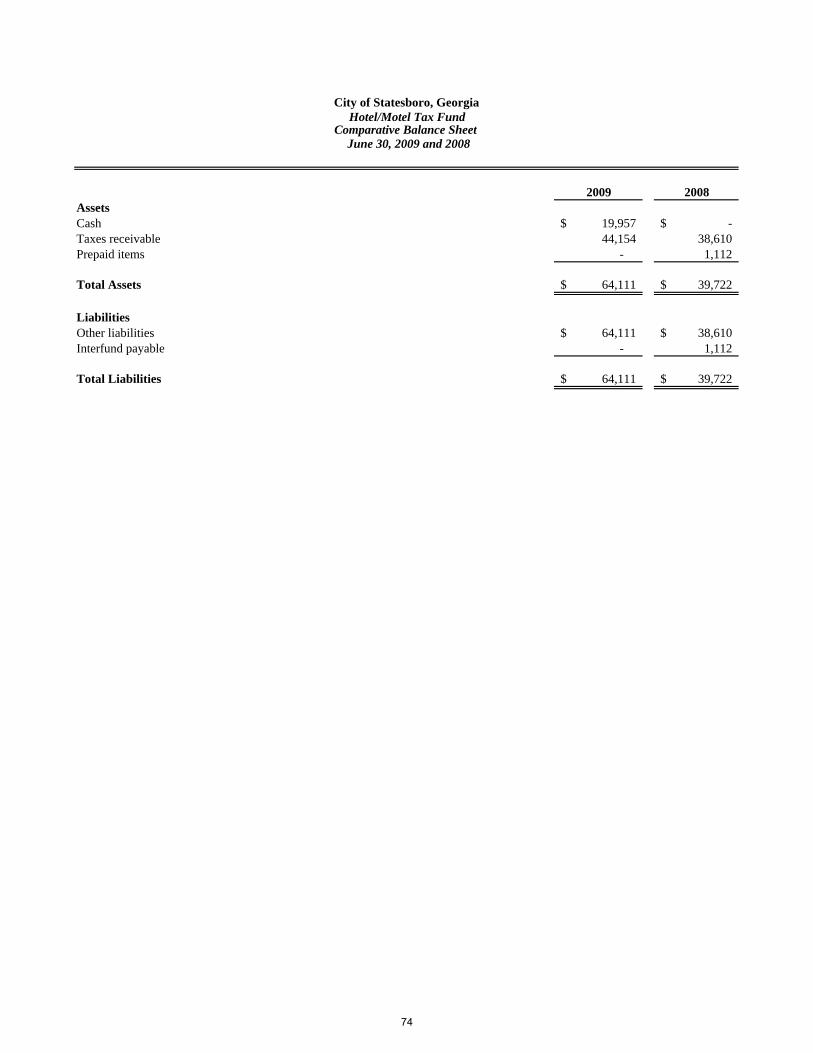
2009 2008AssetsCash 19,957$ -$ Taxes receivable 44,154 38,610 Prepaid items - 1,112
Total Assets 64,111$ 39,722$
LiabilitiesOther liabilities 64,111$ 38,610$ Interfund payable - 1,112
Total Liabilities 64,111$ 39,722$
City of Statesboro, GeorgiaHotel/Motel Tax Fund
Comparative Balance Sheet June 30, 2009 and 2008
74

2008
VarianceOriginal Final PositiveBudget Budget Actual (Negative) Actual
RevenuesHotel/motel taxes 444,130$ 474,130$ 456,994$ (17,136)$ 422,526$
ExpendituresCurrent: Community development 444,130 474,130 456,994 17,136 422,526
Net Change in Fund Balances -$ -$ - -$ -
Fund Balances Beginning of Year - -
Fund Balances End of Year -$ -$
For the Year Ended June 30, 2009
2009
City of Statesboro, GeorgiaHotel/Motel Tax Fund
Schedule of Revenues, Expenditures andChanges in Fund Balances - Budget and Actual
(With Comparative Actual Amounts for the Year Ended June 30, 2008)
75

2009 2008AssetsIntergovernmental receivable 197,945$ 182,819$
Total Assets 197,945 182,819
LiabilitiesAccounts payable 460$ 171,774$ Deferred revenue 3,668 - Interfund payable 193,817 11,045
Total Liabilities 197,945$ 182,819$
City of Statesboro, GeorgiaMultiple Grant Fund
Comparative Balance Sheet June 30, 2009 and 2008
76

2008
VarianceOriginal Final PositiveBudget Budget Actual (Negative) Actual
RevenuesIntergovernmental 6,000$ 39,000$ 324,056$ 285,056$ 200,051$
Expenditures Current: Public safety 6,000 44,000 324,056 (280,056) 193,801 Community development - - - - 6,250
Total Expenditures 6,000 44,000 324,056 (280,056) 200,051
Excess (Deficiency) of Revenues Over (Under) Expenditures - (5,000) - 5,000 -
Other Financing Sources Transfers in - - - - -
Net Change in Fund Balances $ - $ (5,000) - $ 5,000 -
Fund Balances Beginning of Year - -
Fund Balances End of Year -$ $ -
For the Year Ended June 30, 2009
2009
City of Statesboro, GeorgiaMultiple Grant Fund
Schedule of Revenues, Expenditures andChanges in Fund Balances - Budget and Actual
(With Comparative Actual Amounts for the Year Ended June 30, 2008)
77

Major Enterprise Funds

2009 2008AssetsCurrent Assets: Cash and cash equivalents 431,138$ 84,586$ Receivables: Accounts 448,365 335,297 Unbilled accounts 415,506 339,466 Intergovernmental - 88,975 Interfund 167,251 938,194 Materials and supplies inventory 300,668 360,529 Prepaid items 62,855 59,092 Restricted assets - Cash and cash equivalents 395,150 372,346
Total Current Assets 2,220,933 2,578,485
Noncurrent Assets: Restricted Assets: Cash and cash equivalents 399,192 399,281
Capital Assets: Land 347,981 317,504 Buildings 641,859 641,859 Improvements other than buildings 55,003,525 53,125,760 Machinery and equipment 4,201,007 3,843,383 Less accumulated depreciation (22,513,799) (20,875,928) Construction in progress 308,324 1,247,743
Total Capital Assets 37,988,897 38,300,321
Other Assets: Unamortized debt issuance costs 17,410 29,017 Deferred loss on advance refunding 19,396 32,327
Total Other Assets 36,806 61,344
Total Noncurrent Assets 38,424,895 38,760,946
Total Assets 40,645,828 41,339,431
LiabilitiesCurrent Liabilities: Accounts payable 167,493 629,230 Accrued payroll - 26,375 Accrued interest payable 77,467 83,729 Current portion of notes payable 603,137 527,831 Current portion of revenue bonds payable 270,000 255,000 Customer deposits 395,150 372,346 Compensated absences payable 23,042 24,622
Total Current Liabilities 1,536,289 1,919,133
Long-Term Liabilities: Compensated absences payable (net of current portion) 92,170 98,490 Notes payable (net of current portion) 9,198,075 8,190,789 Revenue bonds payable (net of current portion) 215,000 485,000
Total Long-Term Liabilites 9,505,245 8,774,279
Total Liabilities 11,041,534 10,693,412
Net AssetsInvested in capital assets, net of related debt 27,739,491 28,903,045 Restricted for revenue bond retirement 199,193 199,281 Restricted for renewal and extension 200,000 200,000 Unrestricted 1,465,610 1,343,693
Total Net Assets 29,604,294$ 30,646,019$
Comparative Statement of Net Assets
City of Statesboro, Georgia
June 30, 2009 and 2008
Water and Sewer Operating Fund
78

Comparative Statement of Revenues,Expenses and Changes in Fund Net Assets
For The Years Ended June 30, 2009 and 2008
2009 2008Operating Revenues Water sales 3,113,135$ 3,028,514$ Sewer charges 2,982,826 2,947,575 Penalties 108,568 110,909 Reconnecting charges 95,878 69,849 Service fees 159,036 132,929 Tap fees 167,155 847,600 Rental income 166,234 130,125 Miscellaneous 118,959 101,702
Total Operating Revenues 6,911,791 7,369,203
Operating ExpensesSalaries 1,878,760 1,762,189 Employee benefits 690,706 622,888 Purchased services: Training 8,834 5,692 Dues and certification 7,142 5,113 Repairs and maintenance 277,915 243,211 Inspections 32,363 53,162 Contracted services 21,713 19,719 Laboratory services 15,333 14,659 Electricity 662,385 616,019 Telephone 16,710 18,747 Insurance 76,022 68,413 Equipment rental 3,464 5,022 Engineering fees 13,685 213,022 Tippage fees 131,411 145,467 Travel 26,910 25,829 Advertising 1,609 2,543 Postage 6,061 5,443 Materials and supplies: Uniforms 10,240 17,808 Materials and supplies 255,281 245,639 Chemicals 76,025 84,459 Gasoline, oil, etc. 75,048 93,875 Small equipment 18,195 6,956 Depreciation 1,637,871 1,555,563 Bad debts 10,219 394 Other 7,838 5,360
Total Operating Expenses 5,961,740 5,837,192
Operating Income 950,051 1,532,011
Non-Operating Revenues (Expenses) Investment earnings 7,522 49,001 Interest expense (479,507) (463,160) Amortization (24,538) (24,537) Gain on sale of capital assets 5,302 441
Total Non-Operating Revenues (Expenses) (491,221) (438,255)
Income Before Capital Contributions and Transfers 458,830 1,093,756
Capital contributions 138,792 631,417 Transfers in 306,966 563,363 Transfers out (1,946,313) (1,251,000)
Change in Net Assets (1,041,725) 1,037,536
Net Assets Beginning of Year 30,646,019 29,608,483
Net Assets End of Year 29,604,294$ 30,646,019$
City of Statesboro, GeorgiaWater and Sewer Opearating Fund
79

2009 2008Assets Capital Assets: Construction in progress 89,492$ 31,333$
Total Assets 89,492 31,333
Net AssetsInvested in capital assets, net of related debt 89,492 31,333 Unrestricted - -
Total Net Assets 89,492$ 31,333$
City of Statesboro, GeorgiaReclaimed Water System Fund
Comparative Statement of Net Assets June 30, 2009 and 2008
80

2009 2008
Transfers In 58,159$ 31,333$
Change in Net Assets 58,159 31,333
Net Assets Beginning of Year 31,333 -
Net Assets End of Year 89,492$ 31,333$
Comparative Statement of Revenues,Expenses and Changes in Fund Net Assets
For The Year Ended June 30, 2009 and 2008
City of Statesboro, GeorgiaReclaimed Water System Fund
81

2009 2008AssetsCurrent Assets: Cash and cash equivalents 183,951$ 230,599$ Receivables: Accounts 200,859 296,951 Unbilled accounts 168,252 268,961 Intergovernmental 15,875 1,720 Interfund - 27,927 Inventory 85,360 86,235 Prepaid items 23,347 28,698 Restricted assets - Cash and cash equivalents 86,865 77,300
Total Current Assets 764,509 1,018,391
Capital Assets: Land 78,004 78,004 Buildings 154,535 154,535 Improvements other than buildings 4,543,064 4,543,064 Machinery and equipment 502,735 524,550 Less accumulated depreciation (2,374,514) (2,261,316) Construction in progress 14,125 7,607
Total Capital Assets 2,917,949 3,046,444
Total Assets 3,682,458 4,064,835
LiabilitiesCurrent Liabilities: Accounts payable 170,393 420,022 Accrued payroll - 5,328 Accrued interest payable 2,782 3,192 Compensated absences payable 4,441 4,078 Sales tax payable 19,960 15,365 Customer deposits 86,865 77,300 Notes payable 59,449 107,256 Capital lease payable 6,690 -
Total Current Liabilities 350,580 632,541
Long-Term Liabilities: Compensated absences payable (net of current portion) 17,766 16,312 Notes payable (net of current portion) 334,949 394,666 Capital lease payable (net of current portion) 26,758 -
Total Long-Term Liabilities 379,473 410,978
Total Liabilities 730,053 1,043,519
Net AssetsInvested in capital assets, net of related debt 2,490,103 2,544,522 Unrestricted 462,302 476,794
Total Net Assets 2,952,405$ 3,021,316$
Comparative Statement of Net Assets
City of Statesboro, Georgia
June 30, 2009 and 2008
Gas Operating Fund
82

Comparative Statement of Revenues,Expenses and Changes in Fund Net Assets
For the Years Ended June 30, 2009 and 2008
2009 2008Operating RevenuesCharges for services 5,916,703$ 6,095,184$ Penalties 65,356 50,042 Tap fees 2,175 3,000 Transport fees 22,486 29,535 Service fees 1,540 1,635 Miscellaneous 5,159 25,508
Total Operating Revenues 6,013,419 6,204,904
Operating ExpensesSalaries 350,900 355,860 Employee benefits 127,003 116,335 Purchased Services: Training 752 660 Dues and certification 2,864 2,074 Repairs and maintenance 67,607 42,588 Contracted services 58,568 46,954 Electricity 7,937 7,180 Telephone 7,160 7,342 Insurance 23,641 24,589 Equipment rental 3,057 3,388 Legal fees - 8,037 Engineering fees 4,800 4,980 Water heater program 12,398 16,938 Travel 9,474 7,521 Advertising 1,474 2,814 Postage 83 132 Materials and supplies: Uniforms 4,211 2,672 Materials and supplies 41,449 47,069 Chemicals 12,262 704 Gasoline, oil, etc. 13,792 20,392 Small equipment 5,344 5,528 Cost of sales 4,095,083 4,340,908 Depreciation 135,013 164,563 Bad debts 5,009 13,781 Other 18,702 22,355
Total Operating Expenses 5,008,583 5,265,364
Operating Income 1,004,836 939,540
Non-Operating Revenues (Expenses)Investment earnings 1,439 2,610 Intergovernmental 45,481 45,586 Interest expense (15,667) (22,109)
Total Non-Operating Revenues (Expenses) 31,253 26,087
Income Before Transfers 1,036,089 965,627
Transfers out (1,105,000) (925,000)
Change in Net Assets (68,911) 40,627
Net Assets Beginning of Year 3,021,316 2,980,689
Net Assets End of Year 2,952,405$ 3,021,316$
City of Statesboro, GeorgiaGas Operating Fund
83

2009 2008AssetsCurrent Assets: Cash and cash equivalents -$ 85,044$ Receivables: Accounts 119,778 100,267 Unbilled accounts 205,761 202,654 Interfund 1,609 - Prepaid items 23,460 23,055
Total Current Assets 350,608 411,020
Noncurrent Assets: Capital Assets: Buildings 74,602 74,602 Machinery and equipment 2,772,159 2,336,752 Less accumulated depreciation (1,798,687) (1,598,700)
Total Capital Assets 1,048,074 812,654
Total Assets 1,398,682 1,223,674
Liabilities
Current Liabilities Accounts payable 74,269 88,233 Accrued payroll - 7,968 Compensated absences payable 5,082 4,740 Capital lease payable 40,567 - Interfund payable 1,001 -
Total Current Liabilities 120,919 100,941
Long-Term Liabilities: Compensated absences payable (net of current portion) 20,328 18,963 Capital lease payable (net of current portion) 162,267 -
Total Long-Term Liabilities 182,595 18,963
Total Liabilities 303,514 119,904
Net AssetsInvested in capital assets 845,240 812,654 Unrestricted 249,928 291,116
Total Net Assets 1,095,168$ 1,103,770$
Comparative Statement of Net Assets
City of Statesboro, Georgia
June 30, 2009 and 2008
Solid Waste Collection Fund
84
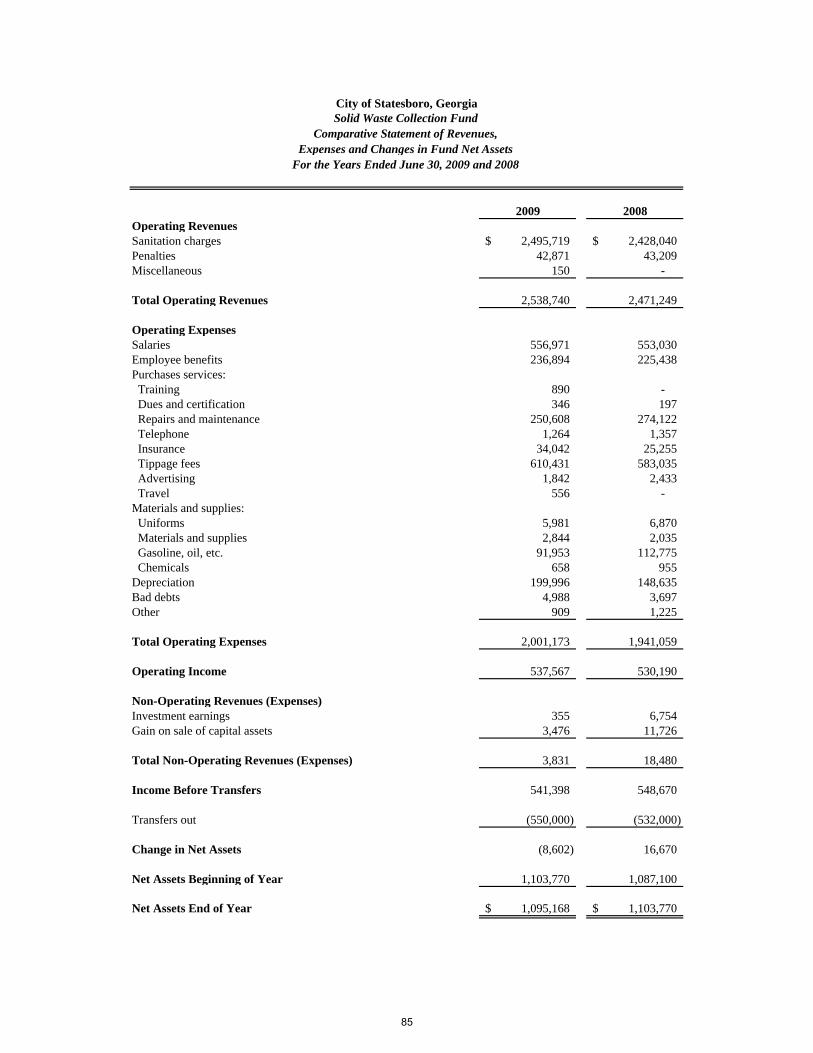
Comparative Statement of Revenues,Expenses and Changes in Fund Net Assets
For the Years Ended June 30, 2009 and 2008
2009 2008Operating RevenuesSanitation charges 2,495,719$ 2,428,040$ Penalties 42,871 43,209 Miscellaneous 150 -
Total Operating Revenues 2,538,740 2,471,249
Operating ExpensesSalaries 556,971 553,030 Employee benefits 236,894 225,438 Purchases services: Training 890 - Dues and certification 346 197 Repairs and maintenance 250,608 274,122 Telephone 1,264 1,357 Insurance 34,042 25,255 Tippage fees 610,431 583,035 Advertising 1,842 2,433 Travel 556 - Materials and supplies: Uniforms 5,981 6,870 Materials and supplies 2,844 2,035 Gasoline, oil, etc. 91,953 112,775 Chemicals 658 955 Depreciation 199,996 148,635 Bad debts 4,988 3,697 Other 909 1,225
Total Operating Expenses 2,001,173 1,941,059
Operating Income 537,567 530,190
Non-Operating Revenues (Expenses)Investment earnings 355 6,754 Gain on sale of capital assets 3,476 11,726
Total Non-Operating Revenues (Expenses) 3,831 18,480
Income Before Transfers 541,398 548,670
Transfers out (550,000) (532,000)
Change in Net Assets (8,602) 16,670
Net Assets Beginning of Year 1,103,770 1,087,100
Net Assets End of Year 1,095,168$ 1,103,770$
City of Statesboro, GeorgiaSolid Waste Collection Fund
85

2009 2008AssetsCurrent Assets: Cash and cash equivalents 250$ 250$ Receivables: Accounts 10,959 7,672 Unbilled accounts 169,626 191,708 Interfund 291,667 486,111 Prepaid items 8,679 10,772
Total Current Assets 481,181 696,513
Noncurrent Assets: Capital Assets: Land 123,425 123,425 Buildings 1,149,495 1,149,496 Improvements other than buildings 202,801 86,843 Infrastructure 225,697 225,697 Machinery and equipment 2,001,387 1,809,424 Less accumulated depreciation (1,750,915) (1,541,988) Construction in progress 60,620 6,845
Total Capital Assets 2,012,510 1,859,742
Total Assets 2,493,691 2,556,255
LiabilitiesCurrent Liabilities: Accounts payable 104,458 83,956 Accrued payroll - 4,045 Compensated absences payable 2,571 2,210 Capital lease payable 25,918 - Interfund payable 958,016 778,194 Landfill postclosure care costs 130,725 136,558
Total Current Liabilities 1,221,688 1,004,963
Long-Term Liabilities: Compensated absences payable 10,286 8,841 Landfill postclosure care costs (net of current portion) 1,701,210 1,829,203 Capital lease payable (net of current portion) 103,672 -
Total Long-Term Liabilities 1,815,168 1,838,044
Total Liabilities 3,036,856 2,843,007
Net AssetsInvested in capital assets 1,882,920 1,859,742 Unrestricted (2,426,085) (2,146,494)
Total Net Assets (543,165)$ (286,752)$
Comparative Statement of Net Assets
City of Statesboro, Georgia
June 30, 2009 and 2008
Solid Waste Disposal Fund
86
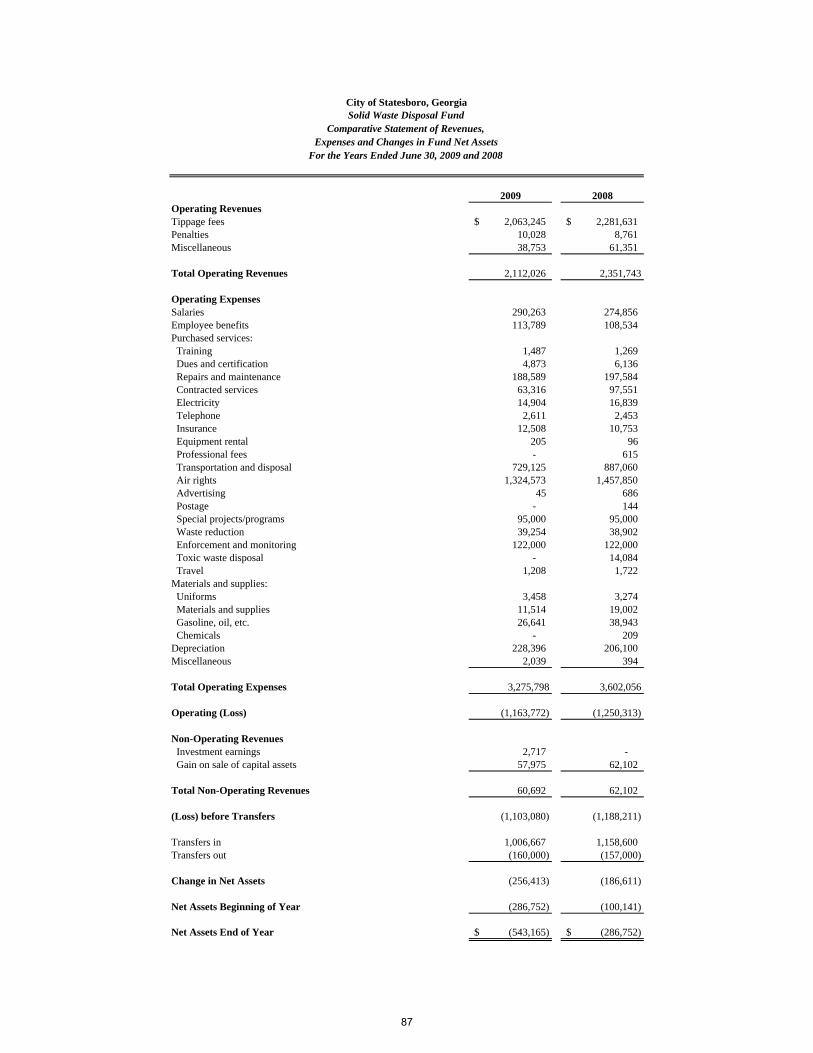
Comparative Statement of Revenues,Expenses and Changes in Fund Net Assets
For the Years Ended June 30, 2009 and 2008
2009 2008Operating RevenuesTippage fees 2,063,245$ 2,281,631$ Penalties 10,028 8,761 Miscellaneous 38,753 61,351
Total Operating Revenues 2,112,026 2,351,743
Operating ExpensesSalaries 290,263 274,856 Employee benefits 113,789 108,534 Purchased services: Training 1,487 1,269 Dues and certification 4,873 6,136 Repairs and maintenance 188,589 197,584 Contracted services 63,316 97,551 Electricity 14,904 16,839 Telephone 2,611 2,453 Insurance 12,508 10,753 Equipment rental 205 96 Professional fees - 615 Transportation and disposal 729,125 887,060 Air rights 1,324,573 1,457,850 Advertising 45 686 Postage - 144 Special projects/programs 95,000 95,000 Waste reduction 39,254 38,902 Enforcement and monitoring 122,000 122,000 Toxic waste disposal - 14,084 Travel 1,208 1,722 Materials and supplies: Uniforms 3,458 3,274 Materials and supplies 11,514 19,002 Gasoline, oil, etc. 26,641 38,943 Chemicals - 209 Depreciation 228,396 206,100 Miscellaneous 2,039 394
Total Operating Expenses 3,275,798 3,602,056
Operating (Loss) (1,163,772) (1,250,313)
Non-Operating Revenues Investment earnings 2,717 - Gain on sale of capital assets 57,975 62,102
Total Non-Operating Revenues 60,692 62,102
(Loss) before Transfers (1,103,080) (1,188,211)
Transfers in 1,006,667 1,158,600 Transfers out (160,000) (157,000)
Change in Net Assets (256,413) (186,611)
Net Assets Beginning of Year (286,752) (100,141)
Net Assets End of Year (543,165)$ (286,752)$
City of Statesboro, GeorgiaSolid Waste Disposal Fund
87
Internal Service Funds
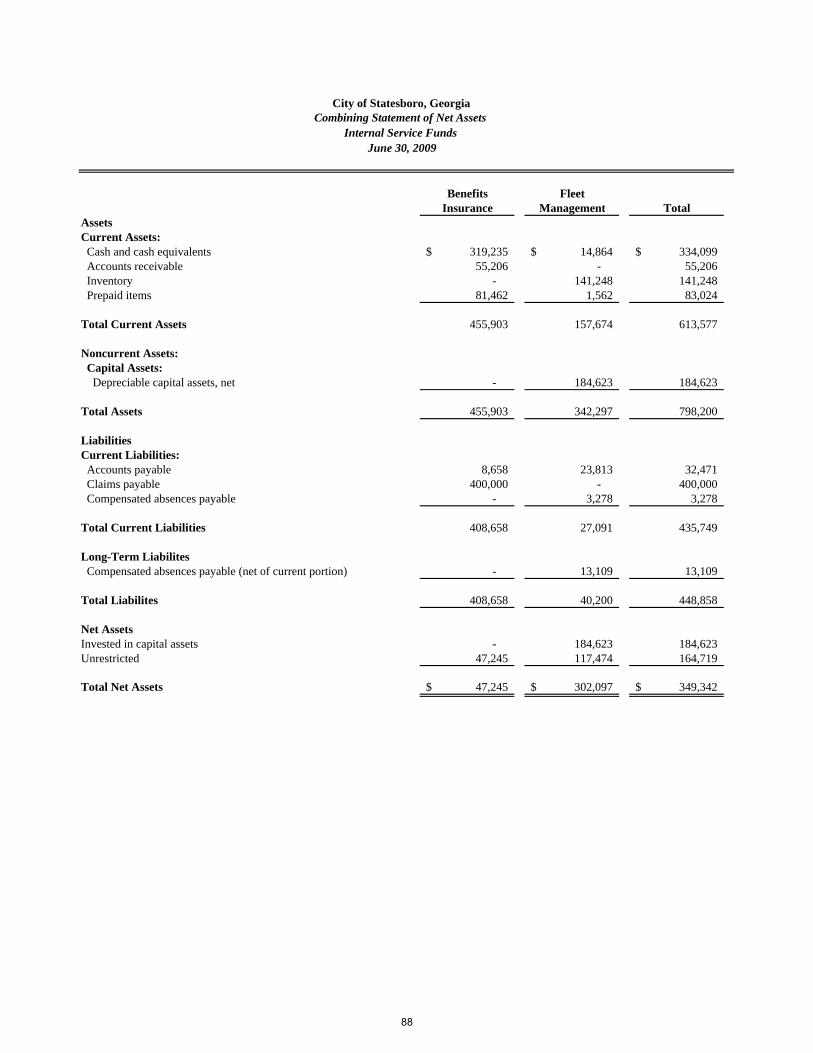
Benefits FleetInsurance Management Total
AssetsCurrent Assets: Cash and cash equivalents 319,235$ 14,864$ 334,099$ Accounts receivable 55,206 - 55,206 Inventory - 141,248 141,248 Prepaid items 81,462 1,562 83,024
Total Current Assets 455,903 157,674 613,577
Noncurrent Assets: Capital Assets: Depreciable capital assets, net - 184,623 184,623
Total Assets 455,903 342,297 798,200
LiabilitiesCurrent Liabilities: Accounts payable 8,658 23,813 32,471 Claims payable 400,000 - 400,000 Compensated absences payable - 3,278 3,278
Total Current Liabilities 408,658 27,091 435,749
Long-Term Liabilites Compensated absences payable (net of current portion) - 13,109 13,109
Total Liabilites 408,658 40,200 448,858
Net AssetsInvested in capital assets - 184,623 184,623 Unrestricted 47,245 117,474 164,719
Total Net Assets 47,245$ 302,097$ 349,342$
Combining Statement of Net AssetsCity of Statesboro, Georgia
Internal Service Funds June 30, 2009
88

City of Statesboro, GeorgiaCombining Statement of Revenues,
Expenses and Changes in Fund Net AssetsInternal Service Funds
For the Year Ended June 30, 2009
Benefits FleetInsurance Management Total
Operating RevenuesCharges for services 3,021,024$ 892,033$ 3,913,057$
Operating ExpensesSalaries - 254,939 254,939 Employee benefits - 98,157 98,157 Purchased services - 160,044 160,044 Materials and supplies - 30,473 30,473 Cost of sales - 291,607 291,607 Depreciation - 20,496 20,496 Claims 3,503,065 - 3,503,065 Miscellaneous - 3,089 3,089
Total Operating Expenses 3,503,065 858,805 4,361,870
Operating Income (Loss) (482,041) 33,228 (448,813)
Non-Operating RevenuesInvestment earnings 3,106 1,022 4,128
Income (Loss) before Transfers (478,935) 34,250 (444,685)
Transfers in 200,000 - 200,000 Transfers out - (50,000) (50,000)
Change in Net Assets (278,935) (15,750) (294,685)
Net Assets Beginning of Year 326,180 317,847 644,027
Net Assets End of Year 47,245$ 302,097$ 349,342$
89

City of Statesboro, GeorgiaCombining Statement of Cash Flows
Internal Service FundsFor the Year Ended June 30, 2009
Benefits FleetInsurance Management Total
Cash Flows from Operating Activities Cash received from customers 3,051,991$ 892,033$ 3,944,024$ Cash payments to employees for services - (359,543) (359,543) Cash payments for goods and services - (504,820) (504,820) Cash payments for claims (3,654,272) - (3,654,272)
Net Cash Provided by (Used in) Operating Activities (602,281) 27,670 (574,611)
Cash Flows from Noncapital Financing Activities Transfers in 200,000 - 200,000 Transfers out - (50,000) (50,000)
Cash Flows from Capital and Related Financing Activities Payments for capital acquisitions - (128,186) (128,186)
Cash Flows from Investing ActivitiesInvestment earnings 3,106 1,022 4,128
Net Increase (Decrease) in Cash and Cash Equivalents (399,175) (149,494) (548,669)
Cash and Cash Equivalents Beginning of Year 718,410 164,358 882,768
Cash and Cash Equivalents End of Year 319,235$ 14,864$ 334,099$
90

City of Statesboro, GeorgiaCombining Statement of Cash Flows
Internal Service FundsFor the Year Ended June 30, 2009
Benefits FleetInsurance Management Total
Reconciliation of Operating Income (Loss) to Net Cash Provided by (Used in) Operating Activities
Operating Income (Loss) (482,041)$ 33,228$ (448,813)$
Adjustments: Depreciation - 20,496 20,496
(Increase) Decrease in Assets: Accounts receivable 30,967 - 30,967 Materials and supplies inventory - 14,568 14,568 Prepaid items (6,260) 320 (5,940) Increase (Decrease) in Liabilities: Accounts payable (33,947) (34,495) (68,442) Accrued wages - (3,815) (3,815) Claims payable (111,000) - (111,000) Compensated absences payable - (2,632) (2,632)
Net Cash Provided by (Used in) Operating Activities (602,281)$ 27,670$ (574,611)$
91

2009 2008AssetsCurrent Assets: Cash and cash equivalents 319,235$ 718,410$ Accounts receivable 55,206 86,173 Prepaid insurance 81,462 75,202
Total Current Assets 455,903 879,785
LiabilitiesCurrent Liabilities: Claims payable 400,000 511,000 Accounts payable 8,658 42,605
Total Current Liabilities 408,658 553,605
Net Assets Unrestricted 47,245$ 326,180$
Comparative Statement of Net Assets
City of Statesboro, Georgia
June 30, 2009 and 2008
Benefits Insurance Fund
92
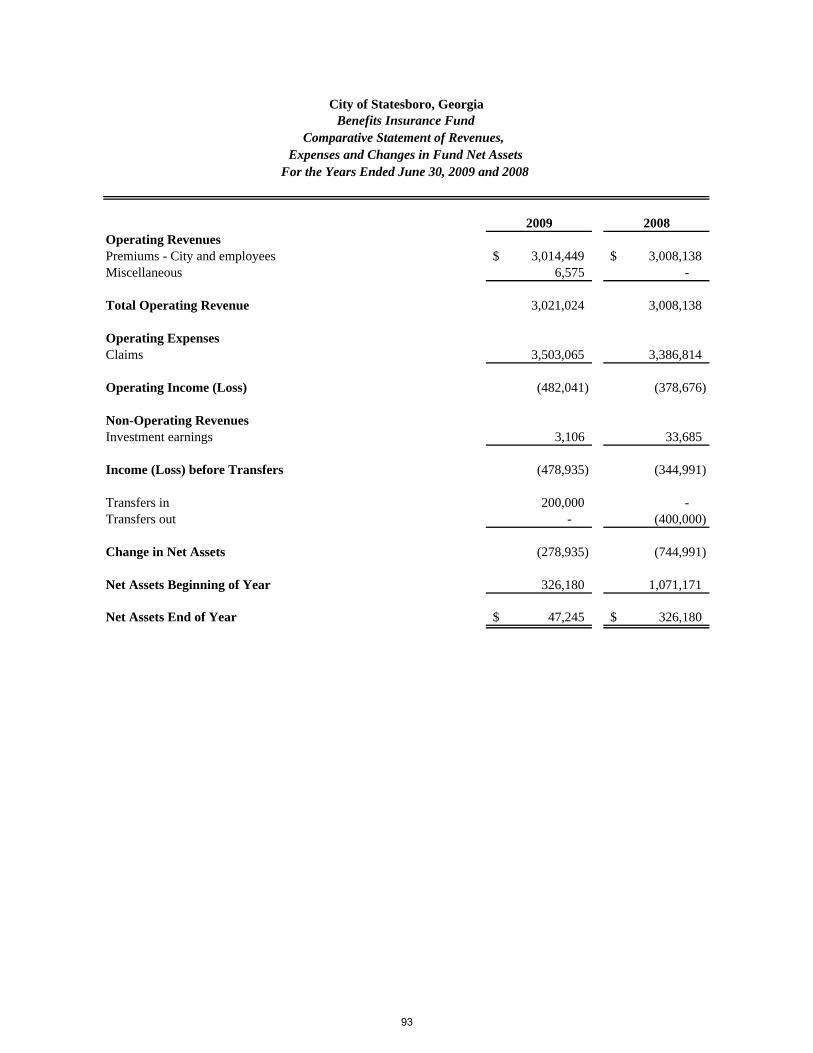
Comparative Statement of Revenues, Expenses and Changes in Fund Net Assets
For the Years Ended June 30, 2009 and 2008
2009 2008Operating RevenuesPremiums - City and employees 3,014,449$ 3,008,138$ Miscellaneous 6,575 -
Total Operating Revenue 3,021,024 3,008,138
Operating ExpensesClaims 3,503,065 3,386,814
Operating Income (Loss) (482,041) (378,676)
Non-Operating RevenuesInvestment earnings 3,106 33,685
Income (Loss) before Transfers (478,935) (344,991)
Transfers in 200,000 - Transfers out - (400,000)
Change in Net Assets (278,935) (744,991)
Net Assets Beginning of Year 326,180 1,071,171
Net Assets End of Year 47,245$ 326,180$
City of Statesboro, GeorgiaBenefits Insurance Fund
93

2009 2008AssetsCurrent Assets: Cash and cash equivalents 14,864$ 164,358$ Inventory 141,248 155,816 Prepaid items 1,562 1,882
Total Current Assets 157,674 322,056
Noncurrent Assets: Capital Assets: Buildings 135,458 - Equipment 271,266 271,266 Less accumulated depreciation (222,101) (201,605) Construction in progress - 7,272
Total Capital Assets 184,623 76,933
Total Assets 342,297 398,989
LiabilitiesCurrent Liabilities: Accounts payable 23,813 58,308 Accrued wages - 3,815 Compensated absences payable 3,278 3,804
Total Current Liabilities 27,091 65,927
Long-Term Liabilities Compensated absences payable (net of current portion) 13,109 15,215
Total Liabilites 40,200 81,142
Net AssetsInvested in capital assets 184,623 76,933 Unrestricted 117,474 240,914
Total Net Assets 302,097$ 317,847$
Comparative Statement of Net Assets
City of Statesboro, Georgia
June 30, 2009 and 2008
Fleet Management Fund
94

Comparative Statement of Revenues, Expenses and Changes in Fund Net Assets
For the Years Ended June 30, 2009 and 2008
2009 2008Operating RevenuesParts sales and labor charges 891,914$ 959,050$ Miscellaneous 119 51
Total Operating Revenue 892,033 959,101
Operating ExpensesSalaries 254,939 256,113 Employee benefits 98,157 93,267 Purchased services: Training 1,540 537 Dues and certification 1,852 1,694 Repairs and maintenance 13,630 17,911 Contracted services 123,260 191,538 Electricity 14,580 11,448 Telephone 841 1,594 Insurance 2,194 1,684 Equipment rental 243 644 Advertising 1,343 240 Travel 561 303 Materials and supplies: Uniforms 3,714 4,110 Materials and supplies 24,035 25,549 Gasoline, oil, etc. 2,724 3,541 Cost of sales 291,607 328,158 Depreciation 20,496 21,431 Miscellaneous 3,089 873
Total Operating Expenses 858,805 960,635
Operating Income (Loss) 33,228 (1,534)
Non-Operating RevenuesInvestment earnings 1,022 6,690
Income Before Transfers 34,250 5,156
Transfers out (50,000) -
Change in Net Assets (15,750) 5,156
Net Assets Beginning of Year 317,847 312,691
Net Assets End of Year 302,097$ 317,847$
City of Statesboro, GeorgiaFleet Management Fund
95

City of Statesboro, GeorgiaSchedule of SPLOST Expenditures
From Inception and for the Fiscal Year Ended June 30, 2009
Original Current EstimatedEstimated Estimated Prior Current Percentage of
Costs Costs Years Year Total Completion
Joint City/County Solid Waste Disposal 2,120,000$ 2,500,822$ 2,500,822$ -$ 2,500,822$ 100%
Waste Water Treatement 5,000,000 4,372,334 1,993,010 365,125 2,358,135 54%
Street and Drainage Projects 5,000,000 4,372,334 3,481,560 353,460 3,835,020 88%
Public Safety - Police Station Expansion/Renovation 2,140,000 3,140,000 3,140,000 - 3,140,000 100%
Public Safety -Police Vehicles 500,000 500,000 500,000 - 500,000 100%
Community Development 1,360,000 1,860,000 1,860,000 - 1,860,000 100%
16,120,000$ 16,745,490$ 13,475,392$ 718,585$ 14,193,977$ 85%
Expenditures
2002 SPLOST
96

City of Statesboro, GeorgiaSchedule of SPLOST Expenditures
From Inception and for the Fiscal Year Ended June 30, 2009
Original Current EstimatedEstimated Estimated Prior Current Percentage of
Costs Costs Years Year Total Completion
Joint City/County Solid Waste Disposal 7,000,000$ 7,000,000$ 937,778$ 1,006,667$ 1,944,445$ 28%
Cemetery Expansion 900,000 900,000 684,374 52,288 736,662 82%
Waste and Sewer Projects 9,860,000 9,860,000 - - - 0%
Street and Drainage Projects 5,307,500 5,307,500 - - - 0%
Public Safety Facilities and Equipment 4,200,000 4,200,000 - 58,115 58,115 1%
Solid Waste Handling Equipment 1,400,000 1,400,000 - - - 0%
28,667,500$ 28,667,500$ 1,622,152$ 1,117,070$ 2,739,222$ 10%
Expenditures
2007 SPLOST
97

Statistical Section

(Unaudited)
Contents Page
Financial Trends S-1
These tables contain trend information that may assist the reader in assessing the City's current financial performance by placing it in historical perspective.
Revenue Capacity S-10These tables contain information that may assist the reader in assessing the viability of the City's two most significant local revenue sources, the property and sales taxes.
Debt Capacity S-19
These tables present information that may assist the reader in analyzing the affordability of the City's current levels of outstanding debt and the City's ability to issue additional debt in the future.
Economic & Demographic Information S-23
This table offers economic and demographic indicators that are commonly used for financial analysis and that can inform one's understanding the City's present and ongoing financial status.
Operating Information S-25These tables contain service and infrastructure indicators that can inform one's understanding how the information in the City's financial statements relates to the services the City provides and the activities it performs.
Source:
This part of the City of Statesboro's comprehensive annual financial report presents detailed information as a context for understanding this year's financial statements, note disclosures, and supplementary information. This information has not been audited by the independent auditor.
Unless otherwise noted, the information in these tables is derived from the annual financial reports for the relevant year. The City implemented GASB Statement No. 34 in fiscal year 2003 therefore tables presenting government-wide information include only seven years.
Statistical SectionCity of Statesboro, Georgia
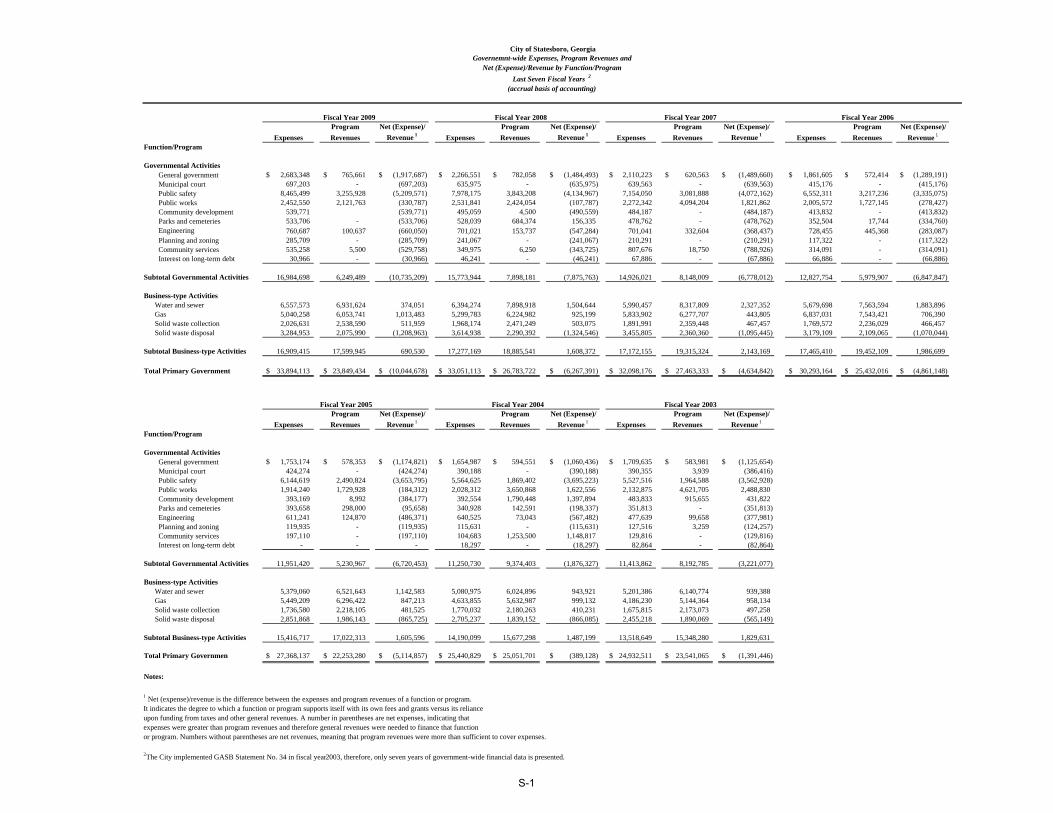
Program Net (Expense)/ Program Net (Expense)/ Program Net (Expense)/ Program Net (Expense)/Expenses Revenues Revenue 1 Expenses Revenues Revenue 1 Expenses Revenues Revenue 1 Expenses Recenues Revenue 1
Function/Program
Governmental Activities General government 2,683,348$ 765,661$ (1,917,687)$ 2,266,551$ 782,058$ (1,484,493)$ 2,110,223$ 620,563$ (1,489,660)$ 1,861,605$ 572,414$ (1,289,191)$ Municipal court 697,203 - (697,203) 635,975 - (635,975) 639,563 - (639,563) 415,176 - (415,176) Public safety 8,465,499 3,255,928 (5,209,571) 7,978,175 3,843,208 (4,134,967) 7,154,050 3,081,888 (4,072,162) 6,552,311 3,217,236 (3,335,075) Public works 2,452,550 2,121,763 (330,787) 2,531,841 2,424,054 (107,787) 2,272,342 4,094,204 1,821,862 2,005,572 1,727,145 (278,427) Community development 539,771 (539,771) 495,059 4,500 (490,559) 484,187 - (484,187) 413,832 - (413,832) Parks and cemeteries 533,706 - (533,706) 528,039 684,374 156,335 478,762 - (478,762) 352,504 17,744 (334,760) Engineering 760,687 100,637 (660,050) 701,021 153,737 (547,284) 701,041 332,604 (368,437) 728,455 445,368 (283,087) Planning and zoning 285,709 - (285,709) 241,067 - (241,067) 210,291 - (210,291) 117,322 - (117,322) Community services 535,258 5,500 (529,758) 349,975 6,250 (343,725) 807,676 18,750 (788,926) 314,091 - (314,091) Interest on long-term debt 30,966 - (30,966) 46,241 - (46,241) 67,886 - (67,886) 66,886 - (66,886)
Subtotal Governmental Activities 16,984,698 6,249,489 (10,735,209) 15,773,944 7,898,181 (7,875,763) 14,926,021 8,148,009 (6,778,012) 12,827,754 5,979,907 (6,847,847)
Business-type ActivitiesWater and sewer 6,557,573 6,931,624 374,051 6,394,274 7,898,918 1,504,644 5,990,457 8,317,809 2,327,352 5,679,698 7,563,594 1,883,896 Gas 5,040,258 6,053,741 1,013,483 5,299,783 6,224,982 925,199 5,833,902 6,277,707 443,805 6,837,031 7,543,421 706,390 Solid waste collection 2,026,631 2,538,590 511,959 1,968,174 2,471,249 503,075 1,891,991 2,359,448 467,457 1,769,572 2,236,029 466,457 Solid waste disposal 3,284,953 2,075,990 (1,208,963) 3,614,938 2,290,392 (1,324,546) 3,455,805 2,360,360 (1,095,445) 3,179,109 2,109,065 (1,070,044)
Subtotal Business-type Activities 16,909,415 17,599,945 690,530 17,277,169 18,885,541 1,608,372 17,172,155 19,315,324 2,143,169 17,465,410 19,452,109 1,986,699
Total Primary Government 33,894,113$ 23,849,434$ (10,044,678)$ 33,051,113$ 26,783,722$ (6,267,391)$ 32,098,176$ 27,463,333$ (4,634,842)$ 30,293,164$ 25,432,016$ (4,861,148)$
Program Net (Expense)/ Program Net (Expense)/ Program Net (Expense)/Expenses Revenues Revenue 1 Expenses Revenues Revenue 1 Expenses Revenues Revenue 1
Function/Program
Governmental Activities General government 1,753,174$ 578,353$ (1,174,821)$ 1,654,987$ 594,551$ (1,060,436)$ 1,709,635$ 583,981$ (1,125,654)$ Municipal court 424,274 - (424,274) 390,188 - (390,188) 390,355 3,939 (386,416) Public safety 6,144,619 2,490,824 (3,653,795) 5,564,625 1,869,402 (3,695,223) 5,527,516 1,964,588 (3,562,928) Public works 1,914,240 1,729,928 (184,312) 2,028,312 3,650,868 1,622,556 2,132,875 4,621,705 2,488,830 Community development 393,169 8,992 (384,177) 392,554 1,790,448 1,397,894 483,833 915,655 431,822 Parks and cemeteries 393,658 298,000 (95,658) 340,928 142,591 (198,337) 351,813 - (351,813) Engineering 611,241 124,870 (486,371) 640,525 73,043 (567,482) 477,639 99,658 (377,981) Planning and zoning 119,935 - (119,935) 115,631 - (115,631) 127,516 3,259 (124,257) Community services 197,110 - (197,110) 104,683 1,253,500 1,148,817 129,816 - (129,816) Interest on long-term debt - - - 18,297 - (18,297) 82,864 - (82,864)
Subtotal Governmental Activities 11,951,420 5,230,967 (6,720,453) 11,250,730 9,374,403 (1,876,327) 11,413,862 8,192,785 (3,221,077)
Business-type ActivitiesWater and sewer 5,379,060 6,521,643 1,142,583 5,080,975 6,024,896 943,921 5,201,386 6,140,774 939,388 Gas 5,449,209 6,296,422 847,213 4,633,855 5,632,987 999,132 4,186,230 5,144,364 958,134 Solid waste collection 1,736,580 2,218,105 481,525 1,770,032 2,180,263 410,231 1,675,815 2,173,073 497,258 Solid waste disposal 2,851,868 1,986,143 (865,725) 2,705,237 1,839,152 (866,085) 2,455,218 1,890,069 (565,149)
Subtotal Business-type Activities 15,416,717 17,022,313 1,605,596 14,190,099 15,677,298 1,487,199 13,518,649 15,348,280 1,829,631
Total Primary Government 27,368,137$ 22,253,280$ (5,114,857)$ 25,440,829$ 25,051,701$ (389,128)$ 24,932,511$ 23,541,065$ (1,391,446)$
Notes:
2The City implemented GASB Statement No. 34 in fiscal year 2003, therefore, only seven years of government-wide financial data is presented.
Net (Expense)/Revenue by Function/ProgramLast Seven Fiscal Years 2
(accrual basis of accounting)
Fiscal Year 2008Fiscal Year 2009 Fiscal Year 2007 Fiscal Year 2006
City of Statesboro, GeorgiaGovernemnt-wide Expenses, Program Revenues and
1 Net (expense)/revenue is the difference between the expenses and program revenues of a function or program.It indicates the degree to which a function or program supports itself with its own fees and grants versus its relianceupon funding from taxes and other general revenues. A number in parentheses are net expenses, indicating thatexpenses were greater than program revenues and therefore general revenues were needed to finance that functionor program. Numbers without parentheses are net revenues, meaning that program revenues were more than sufficient to cover expenses.
Fiscal Year 2005 Fiscal Year 2004 Fiscal Year 2003
S-1

Fiscal Year 2009 Fiscal Year 2008 Fiscal Year 2007 Fiscal Year 2006 Fiscal Year 2005 Fiscal Year 2004 Fiscal Year 2003Governmental Activities
Charges for Services: General Government 672,700$ 689,222$ 518,673$ 468,630$ 471,472$ 470,889$ 457,495$ Municipal Court - - - - - - 3,939 Public Safety 2,752,193 2,388,834 2,172,221 1,789,377 1,911,813 1,809,666 1,757,261 Engineering 100,637 153,737 332,604 445,368 124,870 73,043 99,658 Operating Grants and Contributions 162,191 359,659 156,840 103,784 116,945 213,455 334,284 Capital Grants and Contributions 2,561,768 4,306,729 4,967,671 3,172,748 2,605,867 6,807,350 5,540,148
Subtotal Governmental Activities Program Revenues 6,249,489 7,898,181 8,148,009 5,979,907 5,230,967 9,374,403 8,192,785
Business-type ActivitiesCharges for Services: Water and Sewer 6,792,832 7,267,501 6,696,230 6,912,432 6,135,710 5,833,055 5,976,905 Gas 6,008,260 6,179,396 6,232,576 7,496,631 6,247,110 5,558,803 5,091,818 Solid Waste Collection 2,538,590 2,471,249 2,359,448 2,236,029 2,218,105 2,180,263 2,173,073 Solid Waste Disposal 2,073,273 2,290,392 2,333,218 2,109,065 1,986,143 1,839,152 1,862,335 Operating Grants and Contributions 48,198 45,586 72,373 46,790 49,312 74,184 96,036 Capital Grants and Contributions 138,792 631,417 1,621,579 651,162 385,933 191,841 148,113
Subtotal Business-type Activities Program Revenues 17,599,945 18,885,541 19,315,424 19,452,109 17,022,313 15,677,298 15,348,280
Primary GovernmentCharges for Services 20,938,485 21,440,331 20,644,970 21,457,532 19,095,223 17,764,871 17,422,484 Operating Grants and Contributions 210,389 405,245 229,213 150,574 166,257 287,639 430,320 Capital Grants and Contributions 2,700,560 4,938,146 6,589,250 3,823,910 2,991,800 6,999,191 5,688,261
Total Primary Government Program Revenues 23,849,434$ 26,783,722$ 27,463,433$ 25,432,016$ 22,253,280$ 25,051,701$ 23,541,065$
Notes:
1 The City implemented GASB Statement No. 34 in fiscal year 2003, therefore,only seven years of government-wide financial data are presented.2 Program revenues are related to specific activities of the City. Their sources iseither fees, fines, charges for services or grants restricted to a specific purpose.
City of Statesboro, GeorgiaGovernment-wide Program Revenues 2 by Category
Last Seven Fiscal Years 1
(accrual basis of accounting)
S-2

Fiscal Year 2009 Fiscal Year 2008 Fiscal Year 2007 Fiscal Year 2006 Fiscal Year 2005 Fiscal Year 2004 Fiscal Year 2003Net (Expense), Total Primary Government (see page S-1)Governmental activities (10,735,209)$ (7,875,763)$ (6,778,012)$ (6,847,847)$ (6,720,453)$ (1,876,327)$ (3,221,077)$ Business activities 690,530 1,608,372 2,143,169 1,986,699 1,605,596 1,487,199 1,829,631
Total Primary Government (10,044,678) (6,267,391) (4,634,842) (4,861,148) (5,114,857) (389,128) (1,391,446)
General revenues and other changes in net assetsGovernmental Activities:Taxes Property taxes levied for general purposes 3,785,398 3,720,220 3,360,813 3,188,375 3,111,124 2,986,241 3,010,361 Hotel/motel taxes 456,994 422,526 405,157 376,838 358,315 322,824 342,699 Insurance premium taxes 1,270,366 1,240,647 1,189,372 1,136,795 1,056,630 974,995 904,647 Franchise taxes 1,587,617 1,432,343 1,310,552 1,221,274 1,094,343 1,048,355 1,021,082 Other taxes 812,149 785,555 791,653 741,913 781,329 765,429 701,866 Gain (loss) on sale of capital assets (17,225) (18,855) 16,310 28,230 24,677 456,314 - Investment earnings 12,624 69,887 148,643 192,461 166,013 178,010 118,764 Miscellaneous 38,698 49,403 79,184 84,203 106,974 95,180 101,670 Transfers from (to) business-type activities 2,389,521 1,111,704 2,250,677 1,859,492 1,282,596 (431,276) (523,434)
Subtotal Governmental Activities 10,336,142 8,813,430 9,552,361 8,829,581 7,982,001 6,396,072 5,677,655
Business-type Activities: Gain (loss) on the sale of capital assets 66,753 74,269 16,118 58,641 (32,458) 61,294 20,467 Investment earnings 9,316 58,365 143,201 147,984 88,723 93,636 104,456 Miscellaneous 163,021 188,561 149,983 109,252 151,972 80,439 57,106 Transfers from (to) governmental activities (2,389,521) (1,111,704) (2,250,677) (1,859,492) (1,282,596) 431,276 523,434
Subtotal Business-type Activities (2,150,431) (790,509) (1,941,375) (1,543,615) (1,074,359) 666,645 705,463
Changes in Net AssetsGovernmental activities (399,067) 937,667 2,774,349 1,981,734 1,261,548 4,519,745 2,456,578 Business-type activities (1,459,900) 817,863 201,795 443,084 531,237 2,153,844 2,535,094
Total Primary Government (1,858,967)$ 1,755,530$ 2,976,144$ 2,424,818$ 1,792,785$ 6,673,589$ 4,991,672$
Note:
1 The City implemented GASB Statement No. 34 in fiscal year 2003, therefore,only seven years of government-wide financial data is presented.
City of Statesboro, GeorgiaGovernment-wide General Revenues and Other Changes in Net Assets
Last Seven Fiscal Years 1
(accrual basis of accounting)
S-3

June 30, 2009 June 30, 2008 June 30, 2007 June 30, 2006 June 30, 2005 June 30, 2004 June 30, 2003Governmental Activities
Invested in capital assets, net of related debt 23,985,317$ 23,841,321$ 23,224,510$ 13,872,311$ 12,233,346$ 10,311,153$ 6,982,216$ Restricted for:
Capital projects 137,990 166,489 118,623 1,256,771 7,052 944,493 873,130 Specific projects and programs 810,377 621,297 189,574 181,426 224,223 327,988 206,850
Unrestricted 739,878 1,443,522 1,602,255 4,466,573 5,330,726 4,950,165 3,951,858
Subtotal Governmental Activities Net Assets 25,673,562 26,072,629 25,134,962 19,777,081 17,795,347 16,533,799 12,014,054
Business-type ActivitiesInvested in capital assets, net of related debt 33,047,246 34,151,296 33,089,016 31,093,383 30,290,308 29,608,026 27,583,210 Restricted for revenue bond retirement 199,193 199,281 194,468 186,490 180,879 179,018 179,460
Renewal & extension 200,000 200,000 200,000 200,000 200,000 200,000 200,000 Unrestricted (232,463) 123,299 372,529 2,174,345 2,539,947 2,692,853 2,563,383
Subtotal Business-type Activities Net assets 33,213,976 34,673,876 33,856,013 33,654,218 33,211,134 32,679,897 30,526,053
Primary GovernmentInvested in capital assets, net of related debt 57,032,563 57,992,617 56,313,526 44,965,694 42,523,654 39,919,179 34,565,426 Restricted
Capital projects 137,990 166,489 118,623 1,256,771 7,052 944,493 873,130 Restricted for revenue bond retirement 199,193 199,281 194,468 186,490 180,879 179,018 179,460
Renewal & Extension 200,000 200,000 200,000 200,000 200,000 200,000 200,000 Specific projects and programs 810,377 621,297 189,574 181,426 224,223 327,988 206,850
Unrestricted 507,415 1,566,821 1,974,784 6,640,918 7,870,673 7,643,018 6,515,241
Total Primary Government Net Assets 58,887,538$ 60,746,505$ 58,990,975$ 53,431,299$ 51,006,481$ 49,213,696$ 42,540,107$
Notes:
1 The City implemented GASB Statement No. 34 in fiscal year 2003, therefore,only seven years of government-wide financial data is presented.2 Accounting standards require that net assets be reported in three components in the financial statements: invested in capital assets, net of related debt; restricted; and unrestricted. Net assets are considered restricted only when (1) an external party, such as the State of Georgia or the federal government, places a restriction on how the resources may be used, or (2) enabling legislation is enacted by the City.
City of Statesboro, GeorgiaGovernment-wide Net Assets by Category 2
Last Seven Fiscal Years 1
(accrual basis of accounting)
S-4
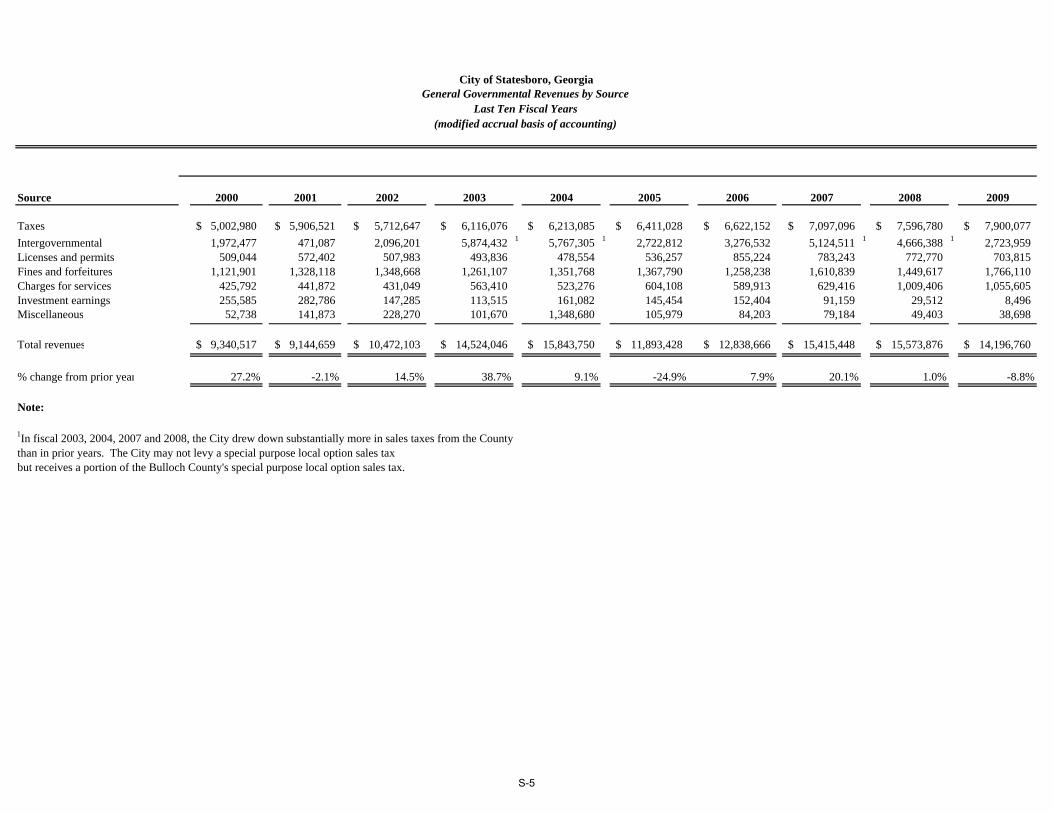
Source 2000 2001 2002 2003 2004 2005 2006 2007 2008 2009
Taxes 5,002,980$ 5,906,521$ 5,712,647$ 6,116,076$ 6,213,085$ 6,411,028$ 6,622,152$ 7,097,096$ 7,596,780$ 7,900,077$ Intergovernmental 1,972,477 471,087 2,096,201 5,874,432 1 5,767,305 1 2,722,812 3,276,532 5,124,511 1 4,666,388 1 2,723,959 Licenses and permits 509,044 572,402 507,983 493,836 478,554 536,257 855,224 783,243 772,770 703,815 Fines and forfeitures 1,121,901 1,328,118 1,348,668 1,261,107 1,351,768 1,367,790 1,258,238 1,610,839 1,449,617 1,766,110 Charges for services 425,792 441,872 431,049 563,410 523,276 604,108 589,913 629,416 1,009,406 1,055,605 Investment earnings 255,585 282,786 147,285 113,515 161,082 145,454 152,404 91,159 29,512 8,496 Miscellaneous 52,738 141,873 228,270 101,670 1,348,680 105,979 84,203 79,184 49,403 38,698
Total revenues 9,340,517$ 9,144,659$ 10,472,103$ 14,524,046$ 15,843,750$ 11,893,428$ 12,838,666$ 15,415,448$ 15,573,876$ 14,196,760$
% change from prior year 27.2% -2.1% 14.5% 38.7% 9.1% -24.9% 7.9% 20.1% 1.0% -8.8%
Note:
1In fiscal 2003, 2004, 2007 and 2008, the City drew down substantially more in sales taxes from the Countythan in prior years. The City may not levy a special purpose local option sales taxbut receives a portion of the Bulloch County's special purpose local option sales tax.
City of Statesboro, GeorgiaGeneral Governmental Revenues by Source
Last Ten Fiscal Years(modified accrual basis of accounting)
S-5

Fiscal Insurance AlcoholicYear Property Vehicles Franchise Premium Beverage Other1 Total2000 2,731,093 211,701 969,827 844,446 550,906 55,007 5,362,980 2001 2,754,100 270,421 1,009,559 896,916 542,208 433,317 5,906,521 2002 2,746,354 222,986 1,018,729 824,484 568,241 35,322 5,416,116 2003 2,935,273 210,509 1,021,082 904,647 594,883 106,983 5,773,377 2004 2,897,418 204,064 1,048,355 974,995 611,823 153,606 5,890,261 2005 2,920,576 199,835 1,094,343 1,056,630 629,362 151,967 6,052,713 2006 2,951,977 193,355 1,221,274 1,136,795 621,962 119,951 6,245,314 2007 3,187,407 212,955 1,310,552 1,189,372 651,652 140,001 6,691,939 2008 3,503,408 212,301 1,432,343 1,240,647 682,476 103,079 7,174,254 2009 3,581,923 191,028 1,587,617 1,270,366 683,371 128,778 7,443,083
Percentage ChangeIn Dollars Over 10 Years 31.2% -9.8% 63.7% 50.4% 24.0% 134.1% 38.8%
Notes:
1 In fiscal year 2001, the method of accounting for hotel/motel taxes was changed from net to gross reporting. Also, fiscal year 2001 includes $121,619 received from an audit of the hotel/motel taxes.
General Fund Tax Revenues by SourceCity of Statesboro, Georgia
Last Ten Fiscal Years(modified accrual basis of accounting)
S-6

Function 2000 2001 2002 2003 2004 2005 2006 2007 2008 2009
Current: General government 1,461,926$ 1,458,500$ 1,386,832$ 1,634,159$ 1,603,534$ 1,686,164$ 1,789,557$ 2,008,167$ 2,140,864$ 2,461,925$ Municipal court1 - 282,090 379,194 385,518 390,604 420,501 412,762 638,695 625,001 684,444 Public safety 4,104,718 4,116,306 4,660,326 5,197,807 5,426,428 5,983,162 6,356,845 6,783,582 7,751,876 7,973,168 Streets/public works 1,034,078 1,090,518 1,535,407 1,616,810 1,859,572 1,651,440 1,673,729 1,824,491 1,864,703 1,779,706 Parks and cemeteries 208,234 227,640 286,868 324,366 421,155 948,682 412,075 406,397 433,076 444,407 Engineering 321,820 329,437 374,887 439,151 522,804 576,857 671,252 640,078 669,869 721,165 Shop2 265,396 278,945 - - - - - - - - Planning and zoning - 98,543 121,277 129,935 117,721 122,457 115,238 210,989 233,314 290,564 Community services 410,633 297,495 203,626 129,816 104,683 123,199 215,159 681,439 198,260 436,326 Community development 140,864 473,123 352,910 483,833 392,554 393,169 413,832 484,187 495,059 539,549
Total Current 7,947,669 8,652,597 9,301,327 10,341,395 10,839,055 11,905,631 12,060,449 13,678,025 14,412,022 15,331,254
% Change From Prior Year 1.1% 8.9% 7.5% 11.2% 4.8% 9.8% 1.3% 13.4% 5.4% 6.4%
Capital Outlay 2,393,110 1,543,190 2,364,006 3,756,405 3,852,211 2,118,841 2,373,967 8,003,416 2,429,833 1,062,731
% Change From Prior Year 140.6% -35.5% 53.2% 58.9% 2.6% -45.0% 12.0% 237.1% -69.6% -56.3%
Debt Service Principal 462,066 463,502 34,500 37,000 39,000 41,000 119,184 170,689 254,295 347,306 Interest 112,234 107,455 94,097 82,864 77,040 88,372 66,886 67,886 46,241 30,966
Total Debt Service 574,300 570,957 128,597 119,864 116,040 129,372 186,070 238,575 300,536 378,272
% Change From Prior Year 117.4% -0.6% -77.5% -6.8% -3.2% 11.5% 43.8% 28.2% 26.0% 25.9%
Total Expenditures 10,915,079$ 10,766,744$ 11,793,930$ 14,217,664$ 14,807,306$ 14,153,844$ 14,620,486$ 21,920,016$ 17,142,391$ 16,772,257$
% Change From Prior Year 19.6% -1.4% 9.5% 20.6% 4.1% -4.4% 3.3% 49.9% -21.8% -2.2%
Debt Service as aPercentage of TotalNoncapital Expenditures 6.7% 6.2% 1.4% 1.1% 1.1% 1.1% 1.5% 1.7% 2.0% 2.4%
Notes:
1 In fiscal year 2001, expenditure functions were changed as a result of the City's implementation of the State of Georgia's mandatory chart of accounts.2 In fiscal year 2002, the shop function was transferred into the fleet management internal service fund.
(modified accrual basis of accounting)
City of Statesboro, GeorgiaGeneral Governmental Expenditures by Function
Last Ten Fiscal Years
S-7

2000 2001 2002 2003 2004 2005 2006 2007 2008 2009
Total Revenues 9,340,517$ 9,144,659$ 10,472,103$ 14,524,046$ 15,843,750$ 11,893,428$ 12,838,666$ 15,415,448$ 15,573,876$ 14,196,760$
Total Expenditures 10,915,079 10,766,744 11,793,930 14,217,664 14,807,306 14,153,844 14,620,486 21,920,016 17,142,391 16,772,257
Excess (Deficiency) of Revenues Over (Under) Expenditures (1,574,562) (1,622,085) (1,321,827) 306,382 1,036,444 (2,260,416) (1,781,820) (6,504,568) (1,568,515) (2,575,497)
Other Financing Sources (Uses) 2,476,009 2,018,480 1,658,196 (564,564) 37,662 1,521,349 1,910,887 2,414,000 2,551,471 2,290,973
Net Change in Fund Balances 901,447 396,395 336,369 (258,182) 1,074,106 (739,067) 129,067 (4,090,568) 982,956 (284,524)
City of Statesboro, GeorgiaChanges in Fund Balances of Governmental Funds
Last Ten Fiscal Years(modified accrual basis of accounting)
S-8

2000 2001 2002 2003 2004 2005 2006 2007 2008 2009General Fund
Reserved 305,904$ -$ -$ 190,475$ 209,413$ 244,757$ 199,020$ 169,631$ 170,717$ 174,009$ Unreserved 4,261,744 4,265,343 3,778,493 3,726,401 4,589,068 4,732,116 3,823,745 2,595,299 1,478,379 947,789
Subtotal General Fund 4,567,648 4,265,343 3,778,493 3,916,876 4,798,481 4,976,873 4,022,765 2,764,930 1,649,096 1,121,798
General Fund Percentage Change 24.6% -6.6% -11.4% 3.7% 22.5% 3.7% -19.2% -31.3% -40.4% -32.0%
All Other Governmental FundsReserved - - - - - - - - 12,522 11,045 Unreserved
Special Revenue Funds2 - - 371,376 206,850 327,988 224,223 181,426 189,574 608,775 799,332 Capital Projects Fund1 - 698,700 1,150,543 873,130 944,493 130,799 1,256,771 (1,584,110) 82,957 136,651
Subtotal All Other Governmental Funds - 698,700 1,521,919 1,079,980 1,272,481 355,022 1,438,197 (1,394,536) 704,254 947,028
Total Governmental FundsReserved 305,904 - - 190,475 209,413 244,757 199,020 169,631 183,239 185,054 Unreserved 4,261,744 4,964,043 5,300,412 4,806,381 5,861,549 5,087,138 5,261,942 1,200,763 2,170,111 1,883,772
Total Governmental Funds 4,567,648$ 4,964,043$ 5,300,412$ 4,996,856$ 6,070,962$ 5,331,895$ 5,460,962$ 1,370,394$ 2,353,350$ 2,068,826$
All Governmental Funds Percentage Change 24.6% 8.7% 6.8% -5.7% 21.5% -12.2% 2.4% -74.9% 71.7% -12.1%
Notes:
1In fiscal year 2001 a separate capital project fund was established.2In fiscal year 2002, six special revenue funds were establishedto meet the requirements of the State of Georgia's mandatory chart of accounts.
City of Statesboro, GeorgiaGovernmental Fund - Fund Balances
Last Ten Fiscal Years(modified accrual basis of accounting)
S-9

Motor TotalConservation Vehicles Less: Total Taxable Direct Estimated Annual
Fiscal Residential Commercial Industrial Agricultural Use Utility and Mobile Other Tax Exempt Assessed Tax Actual PercentageYear Property Property Property Property Property Property Homes Property Property Value1 Rate2 Value Change
2000 112,647,234 143,853,647 12,703,388 1,788,680 368,880 10,551,903 23,474,513 194,920 7,250,000 298,333,165 8.500 763,957,913 2.9%2001 113,435,172 160,103,415 12,607,760 1,721,120 367,320 10,387,350 25,934,525 194,920 435,648 324,315,934 9.200 811,878,955 6.3%2002 133,801,032 206,049,148 9,359,213 1,244,400 1,314,600 13,981,230 28,398,320 216,768 5,733,874 388,630,837 7.750 985,911,778 21.4%2003 133,668,976 213,243,900 7,767,909 1,286,680 1,503,720 13,981,230 28,202,404 213,320 4,504,381 395,363,758 7.750 999,670,348 1.4%2004 133,647,220 234,104,327 6,920,280 1,531,200 1,372,640 14,680,200 28,402,633 213,320 5,096,105 415,775,715 7.741 1,052,179,550 5.3%2005 150,273,037 272,246,100 6,758,133 1,169,760 1,510,880 18,524,000 27,819,183 151,488 5,205,094 473,247,487 6.921 1,196,131,453 13.7%2006 152,086,310 274,694,201 5,908,250 1,142,680 1,424,200 18,524,040 28,606,845 139,084 8,985,597 473,540,013 6.921 1,206,314,025 0.9%2007 157,668,335 291,603,982 5,795,995 1,302,000 1,346,440 16,218,390 27,556,331 266,774 3,931,944 497,826,303 6.921 1,254,395,618 4.0%2008 192,623,437 349,207,061 5,998,633 879,840 1,688,920 15,879,960 29,724,461 120,480 8,794,116 587,328,676 6.358 1,490,306,980 18.8%2009 198,301,459 364,606,300 9,438,297 788,800 527,600 15,171,200 32,148,066 139,999 7,730,648 613,391,073 6.358 1,552,804,303 4.2%
2000 36.9% 47.1% 4.2% 0.6% 0.1% 3.5% 7.7% 0.1% 2.4% 97.6%2001 34.9% 49.3% 3.9% 0.5% 0.1% 3.2% 8.0% 0.1% 0.1% 99.9%2002 33.9% 52.2% 2.4% 0.3% 0.3% 3.5% 7.2% 0.1% 1.5% 98.5%2003 33.4% 53.3% 1.9% 0.3% 0.4% 3.5% 7.1% 0.1% 1.1% 98.9%2004 31.8% 55.6% 1.6% 0.4% 0.3% 3.5% 6.7% 0.1% 1.2% 98.8%2005 31.4% 56.9% 1.4% 0.2% 0.3% 3.9% 5.8% 0.0% 1.1% 98.9%2006 31.5% 56.9% 1.2% 0.2% 0.3% 3.8% 5.9% 0.0% 1.9% 98.1%2007 31.4% 58.1% 1.2% 0.3% 0.3% 3.2% 5.5% 0.1% 0.8% 99.2%2008 32.3% 58.6% 1.0% 0.1% 0.3% 2.7% 5.0% 0.0% 1.5% 98.5%2009 31.9% 58.7% 1.5% 0.1% 0.1% 2.4% 5.2% 0.0% 1.3% 98.7%
Source:
Georgia Department of Revenue, Tax Digest Consolidation Summary
1 All property is assessed at 40% of fair market value.2 Tax rates expressed in rate per $1,000
Notes:
City of Statesboro, GeorgiaTaxable Assessed Value and Estimated Actual Value of Property
Last Ten Fiscal Years
Amounts
Percentages
S-10

City Bulloch TotalFiscal Direct Bulloch County State of Total OverlappingYear Rate County Schools Georgia2 Overlapping and Direct
2000 8.500 9.740 9.400 0.250 19.390 27.890 2001 9.200 9.740 9.400 0.250 19.390 28.590 2002 7.750 8.880 8.570 0.250 17.700 25.450 2003 7.750 9.360 8.570 0.250 18.180 25.930 2004 7.741 9.350 8.560 0.250 18.160 25.901 2005 6.921 8.630 9.450 0.250 18.330 25.251 2006 6.921 8.630 9.450 0.250 18.330 25.251 2007 6.358 10.440 9.450 0.250 20.140 26.498 2008 6.358 10.440 9.450 0.250 20.140 26.498 2009 6.358 10.440 9.450 0.250 20.140 26.498
Source:
Georgia Department of Revenue, Property Tax Division
1 Overlapping rates are those of Bulloch County governments and the State of Georgia that apply to property owners within the City of Statesboro.2 The State of Georgia levies one quarter of one mill on each county's taxable property to help finance their certification of each Georgia county's tax digests.
Overlapping Rates 1
Notes:
City of Statesboro, GeorgiaDirect and Overlapping Property Tax Rates
Last Ten Fiscal Years(rate per $1,000 of assessed taxable value)
S-11

Taxes Levied CollectionsFiscal for the Percentage in Subsequent Percentage PercentageYear Fiscal Year Amount of Levy Years Amount of Levy Amount of Levy
2000 2,490,571 2,189,725 87.92% 300,846 2,490,571 100.00% - 0.00%2001 2,896,406 2,564,160 88.53% 332,246 2,896,406 100.00% - 0.00%2002 2,973,336 2,838,707 95.47% 134,629 2,973,336 100.00% 0.00%2003 3,049,469 2,879,301 94.42% 170,155 3,049,198 99.99% 13 0.00%2004 3,181,994 2,940,178 92.40% 241,425 3,181,493 99.98% 391 0.01%2005 3,243,858 3,104,218 95.70% 139,255 3,243,144 99.98% 385 0.01%2006 3,277,370 3,129,508 95.49% 147,738 3,275,381 99.94% 124 0.00%2007 3,415,324 3,331,010 97.53% 83,181 3,382,686 99.04% 1,133 0.03%2008 3,734,236 3,631,981 97.26% 101,121 3,663,716 98.11% 1,134 0.03%2009 3,931,134 3,798,499 96.63% 103,210 3,901,710 99.25% 29,424 0.75%
Source:
City of Statesboro Tax Collector's Office
Fiscal Year of the Levy Total Collections to Date Uncollected Taxes
City of Statesboro, GeorgiaProperty Tax Levies and Collections
Last Ten Fiscal Years
Collected Within the Total
S-12

Percentage Percentageof Total City of Total City
Taxable Taxable Taxable TaxableAssessed Assessed Assessed Assessed
Principal Taxpayer Value Value Principal Taxpayer Value Value
Statesboro HMA, Inc. 17,188,160$ 2.8% Frontier Communications of GA 5,580,180$ 1.87%Campus Club Associates, LLC 11,263,201 1.8% Georgia Power Co. 4,537,052 1.52%Copper Beech Townhome 10,748,201 1.8% JBPC South Inc. 3,638,440 1.22%Frontier Communications of GA 8,992,111 1.47% Statesboro Mall, LLC 3,195,640 1.07%Fairfield Stateboro Exchange 7,694,560 1.25% Howard Claude Lumber Co., Inc. 2,930,785 0.98%Lanier Inman 6,586,120 1.07% Wal-Mart Real Estate 2,844,440 0.95%Lanier Inman L. Jr as Trustee 6,311,441 1.03% Green, John R. 2,808,400 0.94%Lanier Drive Associates LLC 5,624,601 0.92% Wal-Mart Stores East, Inc. 2,715,452 0.91%Georgia Power Co. 5,471,480 0.89% Lowe's Home Centers, Inc. 2,522,071 0.85%The Garden District 5,366,880 0.87% Venture Properties, LLC 1,828,160$ 0.61%
Total Principal Taxpayers 85,246,752 13.90% Total Principal Taxpayers 32,600,619 10.93%
All Other Taxpayers 528,144,321 86.10% All Other Taxpayers 265,732,546 89.07%
Total 613,391,073$ 100.00% Total 298,333,165$ 100.00%
Source:
City of Statesboro Tax Office
City of Statesboro, GeorgiaPrincipal Property Taxpayers
For the Fiscal Year Ended June 30, 2009 and Nine Years Ago
20002009
S-13

Fiscal State of TotalYear Georgia LOST SPLOST2 E-SPLOST3 Overlapping Rate
2000 4.00% 1.00% 1.00% - 6.00%2001 4.00% 1.00% 1.00% - 6.00%2002 4.00% 1.00% 1.00% - 6.00%2003 4.00% 1.00% 1.00% - 6.00%2004 4.00% 1.00% 1.00% 1.00% 7.00%2005 4.00% 1.00% 1.00% 1.00% 7.00%2006 4.00% 1.00% 1.00% 1.00% 7.00%2007 4.00% 1.00% 1.00% 1.00% 7.00%2008 4.00% 1.00% 1.00% 1.00% 7.00%2009 4.00% 1.00% 1.00% 1.00% 7.00%
Source:
Georgia Department of Revenue, Sales and Use Tax Division
Notes:
1State law does not authorize the City to directly levy a sales tax, however, the Cityhas an agreement with Bulloch County that they will receive amounts from boththe 2002 and 2007 special purpose local option sales taxes.2 The current special purpose local option sales tax was approved effective October 1, 2007 and expires September 30, 2013.3Effective January 1, 2004 the Bulloch County Board of Education began levying a 1% special purpose local option sales tax.
City of Statesboro, GeorgiaOverlapping Sales Tax Rates 1
Last Ten Fiscal Years
Bulloch County
S-14

Rate per Rate per Rate per Rate perFiscal 0-3000 Thousand, Next Thousand, Next Thousand, OverYear Gallons 2000 Gallons 5000 Gallons 10,000 Gallons
2000 7.00 1.65 1.40 1.10
Rate per Rate perThousand Thousand
Gallons - City Gallons - County
2000 1.20 2.40
Note:
Water rates are based on 5/8" meter, which is the standard household meter size.
Sewer
City of Statesboro, GeorgiaWater and Sewer Rates
Fiscal Year 2000
Water
S-15

If a Customer Has Both Water and Sewer Services, the Rates Are:
Rate per Rate perFiscal Inside Rate per 10,000-49,000 50,000 GallonsYear Base Rate 0-9000 Gallons Gallons and up
2001 4.50 1.90 2.00 2.10 2002 4.50 1.90 2.00 2.10 2003 4.50 1.90 2.00 2.10 2004 4.50 1.90 2.00 2.10 2005 4.50 1.90 2.00 2.10 2006 4.50 1.90 2.00 2.10 2007 4.50 1.90 2.00 2.10 2008 4.60 1.94 2.04 2.14 2009 4.60 1.94 2.04 2.14
Outside Rate per Rate perFiscal Base Rate per 10,000-49,000 50,000 GallonsYear Rate 0-9000 Gallons Gallons and up
2001 9.00 3.80 4.00 4.20 2002 9.00 3.80 4.00 4.20 2003 9.00 3.80 4.00 4.20 2004 9.00 3.80 4.00 4.20 2005 9.00 3.80 4.00 4.20 2006 9.00 3.80 4.00 4.20 2007 9.00 3.80 4.00 4.20 2008 9.20 3.88 4.08 4.28 2009 9.20 3.88 4.08 4.28
Inside Rate per Rate perFiscal Base Rate per 10,000-49,000 50,000 GallonsYear Rate 0-9000 Gallons Gallons and up
2001 4.50 2.30 2.40 2.50 2002 4.50 2.30 2.40 2.50 2003 4.50 2.30 2.40 2.50 2004 4.50 2.30 2.40 2.50 2005 4.50 2.30 2.40 2.50 2006 4.50 2.30 2.40 2.50 2007 4.50 2.30 2.40 2.50 2008 4.60 2.35 2.45 2.55 2009 4.60 2.35 2.45 2.55
Outside Rate per Rate perFiscal Base Rate per 10,000-49,000 50,000 GallonsYear Rate 0-9000 Gallons Gallons and up
2001 9.00 4.60 4.80 5.00 2002 9.00 4.60 4.80 5.00 2003 9.00 4.60 4.80 5.00 2004 9.00 4.60 4.80 5.00 2005 9.00 4.60 4.80 5.00 2006 9.00 4.60 4.80 5.00 2007 9.00 4.60 4.80 5.00 2008 9.20 4.70 4.90 5.10 2009 9.20 4.70 4.90 5.10
Rates are based on 5/8" meter, which is the standard household meter size. (continued)
Sewer
Note:
City of Statesboro, GeorgiaWater and Sewer Rates
Fiscal Years 2001 - 2009
Water
S-16
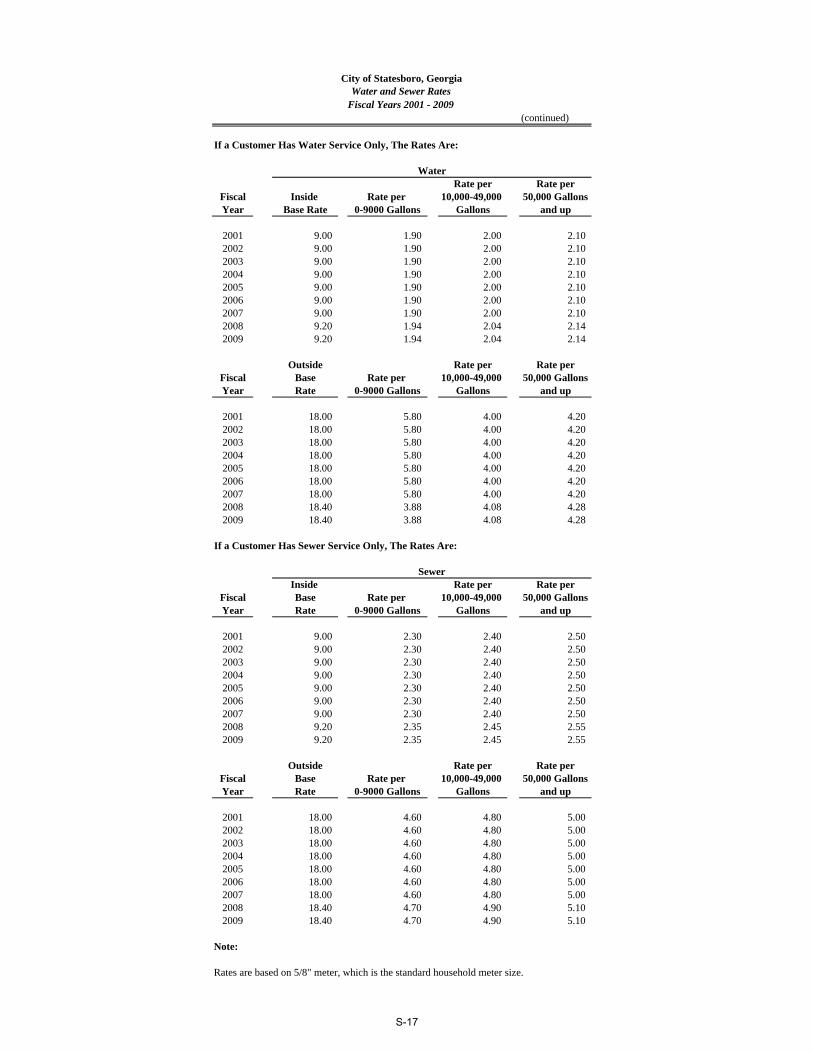
(continued)
If a Customer Has Water Service Only, The Rates Are:
Rate per Rate perFiscal Inside Rate per 10,000-49,000 50,000 GallonsYear Base Rate 0-9000 Gallons Gallons and up
2001 9.00 1.90 2.00 2.10 2002 9.00 1.90 2.00 2.10 2003 9.00 1.90 2.00 2.10 2004 9.00 1.90 2.00 2.10 2005 9.00 1.90 2.00 2.10 2006 9.00 1.90 2.00 2.10 2007 9.00 1.90 2.00 2.10 2008 9.20 1.94 2.04 2.14 2009 9.20 1.94 2.04 2.14
Outside Rate per Rate perFiscal Base Rate per 10,000-49,000 50,000 GallonsYear Rate 0-9000 Gallons Gallons and up
2001 18.00 5.80 4.00 4.20 2002 18.00 5.80 4.00 4.20 2003 18.00 5.80 4.00 4.20 2004 18.00 5.80 4.00 4.20 2005 18.00 5.80 4.00 4.20 2006 18.00 5.80 4.00 4.20 2007 18.00 5.80 4.00 4.20 2008 18.40 3.88 4.08 4.28 2009 18.40 3.88 4.08 4.28
If a Customer Has Sewer Service Only, The Rates Are:
Inside Rate per Rate perFiscal Base Rate per 10,000-49,000 50,000 GallonsYear Rate 0-9000 Gallons Gallons and up
2001 9.00 2.30 2.40 2.50 2002 9.00 2.30 2.40 2.50 2003 9.00 2.30 2.40 2.50 2004 9.00 2.30 2.40 2.50 2005 9.00 2.30 2.40 2.50 2006 9.00 2.30 2.40 2.50 2007 9.00 2.30 2.40 2.50 2008 9.20 2.35 2.45 2.55 2009 9.20 2.35 2.45 2.55
Outside Rate per Rate perFiscal Base Rate per 10,000-49,000 50,000 GallonsYear Rate 0-9000 Gallons Gallons and up
2001 18.00 4.60 4.80 5.00 2002 18.00 4.60 4.80 5.00 2003 18.00 4.60 4.80 5.00 2004 18.00 4.60 4.80 5.00 2005 18.00 4.60 4.80 5.00 2006 18.00 4.60 4.80 5.00 2007 18.00 4.60 4.80 5.00 2008 18.40 4.70 4.90 5.10 2009 18.40 4.70 4.90 5.10
Sewer
Note:
Rates are based on 5/8" meter, which is the standard household meter size.
City of Statesboro, GeorgiaWater and Sewer Rates
Fiscal Years 2001 - 2009
Water
S-17

Type of Customer Gallons % Gallons % Gallons % Gallons % Gallons %
Residential 557.6 47% 548.8 46% 529.5 45% 525.8 52% 550 59%Industrial 102.6 9% 112.9 9% 104.8 9% 103.7 10% 75.5 8%Commercial 301.1 26% 362.3 30% 264.7 23% 247.3 25% 283.5 30%Government 213.5 18% 171.1 14% 275.7 23% 132.3 13% 29.9 3%
Total 1,174.8 100% 1,195.1 100% 1,174.7 100% 1,009.1 100% 938.9 100%
Type of Customer Gallons % Gallons % Gallons % Gallons % Gallons %
Residential 550.1 58% 572.9 57% 614.3 59% 544.9 57% 616.8 56%Industrial 69.9 7% 79.0 8% 74.9 7% 104.8 11% 75.0 7%Commercial 302.7 32% 313.3 31% 314.2 30% 259.9 27% 339.0 31%Government 25.4 3% 33.2 3% 37.3 4% 48.8 5% 69.3 6%
Total 948.1 100% 998.4 100% 1,040.7 100% 958.4 100% 1,100.1 100%
20042003
Fiscal Year2007
Fiscal Year2008
Fiscal Year2009
Fiscal Year2006
City of Statesboro, GeorgiaWater Sold by Type of Customer
Last Ten Fiscal Years(in millions of gallons)
Fiscal Year2005
Fiscal YearFiscal Year2000 2001 2002
Fiscal YearFiscal Year Fiscal Year
S-18
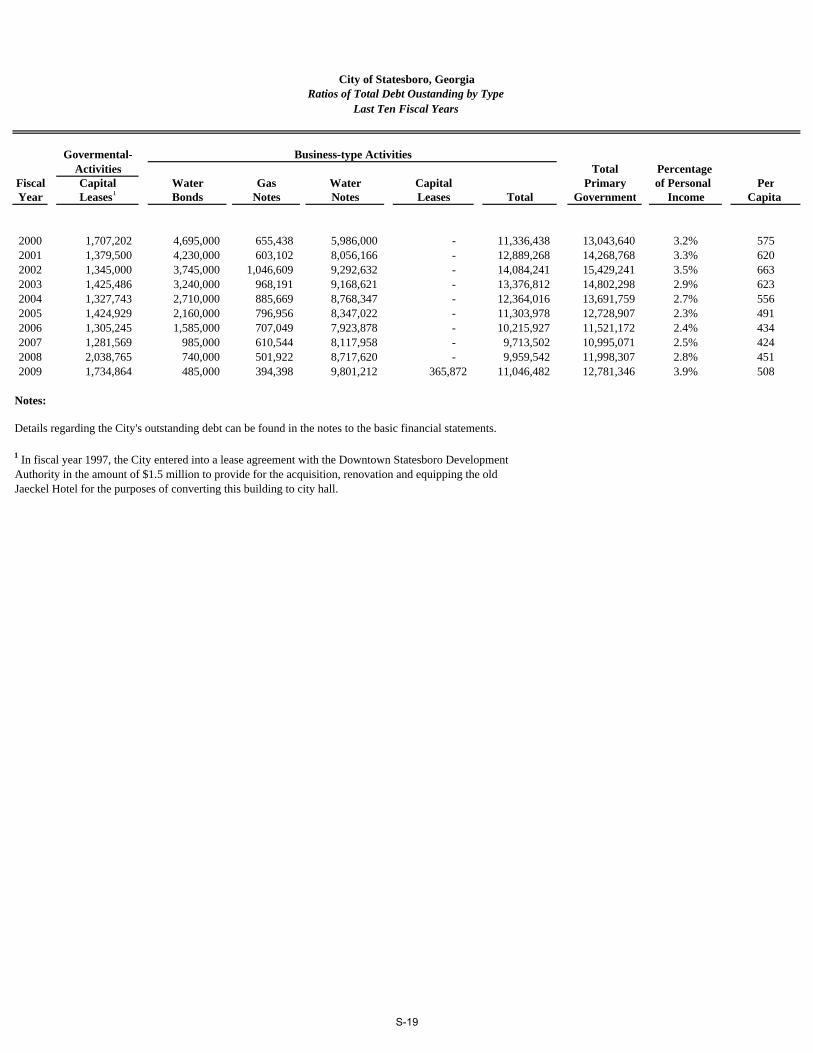
Govermental-Activities Total Percentage
Fiscal Capital Water Gas Water Capital Primary of Personal PerYear Leases1 Bonds Notes Notes Leases Total Government Income Capita
2000 1,707,202 4,695,000 655,438 5,986,000 - 11,336,438 13,043,640 3.2% 5752001 1,379,500 4,230,000 603,102 8,056,166 - 12,889,268 14,268,768 3.3% 6202002 1,345,000 3,745,000 1,046,609 9,292,632 - 14,084,241 15,429,241 3.5% 6632003 1,425,486 3,240,000 968,191 9,168,621 - 13,376,812 14,802,298 2.9% 6232004 1,327,743 2,710,000 885,669 8,768,347 - 12,364,016 13,691,759 2.7% 5562005 1,424,929 2,160,000 796,956 8,347,022 - 11,303,978 12,728,907 2.3% 4912006 1,305,245 1,585,000 707,049 7,923,878 - 10,215,927 11,521,172 2.4% 4342007 1,281,569 985,000 610,544 8,117,958 - 9,713,502 10,995,071 2.5% 4242008 2,038,765 740,000 501,922 8,717,620 - 9,959,542 11,998,307 2.8% 4512009 1,734,864 485,000 394,398 9,801,212 365,872 11,046,482 12,781,346 3.9% 508
Notes:
Details regarding the City's outstanding debt can be found in the notes to the basic financial statements.
1 In fiscal year 1997, the City entered into a lease agreement with the Downtown Statesboro DevelopmentAuthority in the amount of $1.5 million to provide for the acquisition, renovation and equipping the oldJaeckel Hotel for the purposes of converting this building to city hall.
City of Statesboro, GeorgiaRatios of Total Debt Oustanding by Type
Last Ten Fiscal Years
Business-type Activities
S-19

2000 2001 2002 2003 2004 2005 2006 2007 2008 2009
Assessed Value 298,333$ 324,316$ 388,631$ 395,364$ 415,776$ 473,248$ 473,540$ 497,826$ 587,329$ 613,391$
Legal Debt Margin
Debt limit (10% of assessed value) 29,833$ 32,432$ 38,863$ 39,536$ 41,578$ 47,325$ 47,354$ 49,783$ 58,733$ 61,339$
Debt applicable to limit:General obligation bonds - - - - - - - - - - Less: Amount reserved for repayment of general obligation debt - - - - - - - - - -
Total debt applicable to limit - - - - - - - - - -
Legal debt margin 29,833$ 32,432$ 38,863$ 39,536$ 41,578$ 47,325$ 47,354$ 49,783$ 58,733$ 61,339$
As a percentage of debt limit 100.00% 100.00% 100.00% 100.00% 100.00% 100.00% 100.00% 100.00% 100.00% 100.00%
Note:
Under Article 9, Section 5, Paragraph 1 of the State of Georgia Constitution, the City's outstanding general obligation debt should not exceed 10% of the assessed valuation of taxable property within the City.
City of Statesboro, GeorgiaLegal Debt Margin
Last Ten Fiscal Years(Amounts presented in $1,000)
S-20

EstimatedEstimated Share of
Debt Percentage OverlappingGovernmental Unit Outstanding Applicable 1 Debt
Debt Repaid With Property Taxes
Bulloch County Board of Education1 10,450,000$ 100.0% 10,450,000$
City Direct Debt - - -
Total Direct and Overlapping Debt 10,450,000$ 100.0% 10,450,000$
Source:
1 Bulloch County Board of Education
Notes:
2 Overlapping governments are those that coincide, at least in part, with the geographic boundaries of the City.3 For debt repaid with property taxes, the percentage of overlapping debt applicable is estimated using assessed property values. Applicable percentages were estimated by determining the portion of another government unit's assessed value that is within the City's boundaries and dividing it by each unit's total assessed value.
City of Statesboro, GeorgiaDirect and Overlapping Debt
June 30, 2009
S-21

Less: NetFiscal Operating Operating Available TimesYear Revenue Expenses1 Revenue Principal Interest Total Coverage2
2000 5,765,156 2,696,318 3,068,838 450,000 236,703 686,703 4.47 2001 5,983,717 2,620,094 3,363,623 465,000 218,253 683,253 4.92 2002 5,808,386 3,006,314 2,802,072 485,000 198,723 683,723 4.10 2003 6,010,061 3,291,720 2,718,341 505,000 177,868 682,868 3.98 2004 5,889,145 3,173,812 2,715,333 530,000 155,648 685,648 3.96 2005 6,208,677 3,398,860 2,809,817 550,000 125,563 675,563 4.16 2006 6,976,498 3,714,257 3,262,241 575,000 99,669 674,669 4.84 2007 6,782,632 4,047,644 2,734,988 600,000 71,910 671,910 4.07 2008 7,369,203 4,281,629 3,087,574 245,000 47,022 292,022 10.57 2009 6,911,791 4,323,869 2,587,922 255,000 31,512 286,512 9.03
Notes:
1 Operating expenses do not include depreciation or interest.2 The net revenues of the system must equal at least 1.20 times the highest annual debt service on bonds outstanding.
Debt Service
City of Statesboro, GeorgiaPledged Revenue Bond Coverage
Last Ten Fiscal Years
Water and Sewer Revenue Bonds
S-22

Percentage PercentageNumber of of Total City Number of of Total City
Employer Employees Employment Employer Employees Employment
Georgia Southern University 1,974 17.84% Georgia Southern University 1,326 14.21%Bulloch County Board of Education 1,431 12.93% Bulloch County Board of Education 1,310 14.04%East Georgia Regional Medical Center 715 6.46% East Georgia Regional Medical Center 650 6.97%Wal-Mart Supercenter 594 5.37% Wal-Mart Supercenter 400 4.29%Bulloch County Board of Commissioners 359 3.24% Bulloch County Board of Commissioners 353 3.78%City of Statesboro 274 2.48% City of Statesboro 234 2.51%Lowe's Home Center 105 0.95% The Sack Company 205 2.20%Statesboro Herald 103 0.93% Statesboro Herald 134 1.44%Belk 100 0.90% Lowe's Home Center 125 1.34%Braswells 87 0.79% Robbins Packinghouse Company 101 1.08%
Total Principal Employers 5,742 51.89% Total Principal Employers 4,838 51.85%
Other Employers 5,324 48.11% Other Employers 4,493 48.15%
Total All Employers 11,066 100.00% Total All Employers 9,331 100.00%
Source:
City Economic Development Division.Statesboro-Bulloch Chamber of CommerceEast Georgia Medical Center Human Resource DepartmentWal-Mart Super Center People Department
2009
City of Statesboro, GeorgiaPrincipal Employers
For the Fiscal Year Ended June 30, 2009 and Nine Years Ago
2000
S-23

PerEstimated Personal Capita Median School Unemployment
Year Population Income Income Age Enrollment Rate
2000 22,698 412,740,432 18,184 26 8,367 2.7%2001 23,018 433,636,102 18,839 26 8,354 3.5%2002 23,269 438,364,691 18,839 26 8,498 3.2%2003 23,744 514,603,712 21,673 26 9,429 2.9%2004 24,604 501,946,204 20,401 26 9,707 2.9%2005 25,915 561,785,370 21,678 26 9,826 4.5%2006 26,534 486,102,880 18,320 26 9,044 3.5%2007 25,953 444,055,830 17,110 26 8,480 4.2%2008 26,624 425,478,144 15,981 27 9,380 6.7%2009 25,165 327,572,805 13,017 22 9,476 9.1%
Sources:
Georgia County Guide published by the University of Georgia2000 U.S. Census Demographic ProfileGeorgia Department of Education Department of Labor
City of Statesboro, GeorgiaDemographic and Economic Statistics
Last Ten Years
S-24

2000 2001 2002 2003 2004 2005 2006 2007 2008 2009Function/program
City Manager's Office 4 2 2 2 2 2 2 4 4 3City Clerk's Office 8 8 8 8 8 8 9 9 9 10Finance 7 6 7 7 7 7 6 6 6 6Information Technology 0 0 0 0 0 0 0 0 0 2Human Resources 0 2 2 2 2 2 2 2 2 2Municipal Court 3 2 3 3 3 3 2 3 3 3Engineering 7 4 4 4 4 4 4 5 5 6Protective Inspections 0 3 3 4 4 4 4 2 2 4Governmental Buildings 0 0 0 0 0 0 0 0 0 3Police 68 74 74 74 70 70 75 75 76 77Animal Control 0 1 1 1 1 1 1 1 0 0Fire Department 27 31 31 32 32 32 33 33 33 33Public Works Administration 0 2 2 2 2 2 2 2 2 2Streets 20 24 24 24 24 24 23 22 23 22Parks 5 7 7 7 8 8 9 9 9 9Planning 2 2 2 2 2 2 2 3 3 3Water and Sewer 16 19 18 18 20 20 18 18 19 23Wastewater Treatment Plant 25 27 27 27 27 27 27 27 27 27Natural Gas 7 8 9 9 9 9 9 9 9 9Solid Waste Collection 19 19 19 19 19 19 16 16 16 16Solid Waste Disposal 7 8 8 8 8 8 8 8 8 8Fleet Management 7 8 8 8 8 8 6 6 6 6Infiltration and Inflow 2 2 2 2 0 0 0 0 0 0
Total 234 259 261 263 260 260 258 260 262 274
Source:
City Budget Office.
City of Statesboro, GeorgiaCity Employees by Function/Program
Last Ten Fiscal Years
S-25
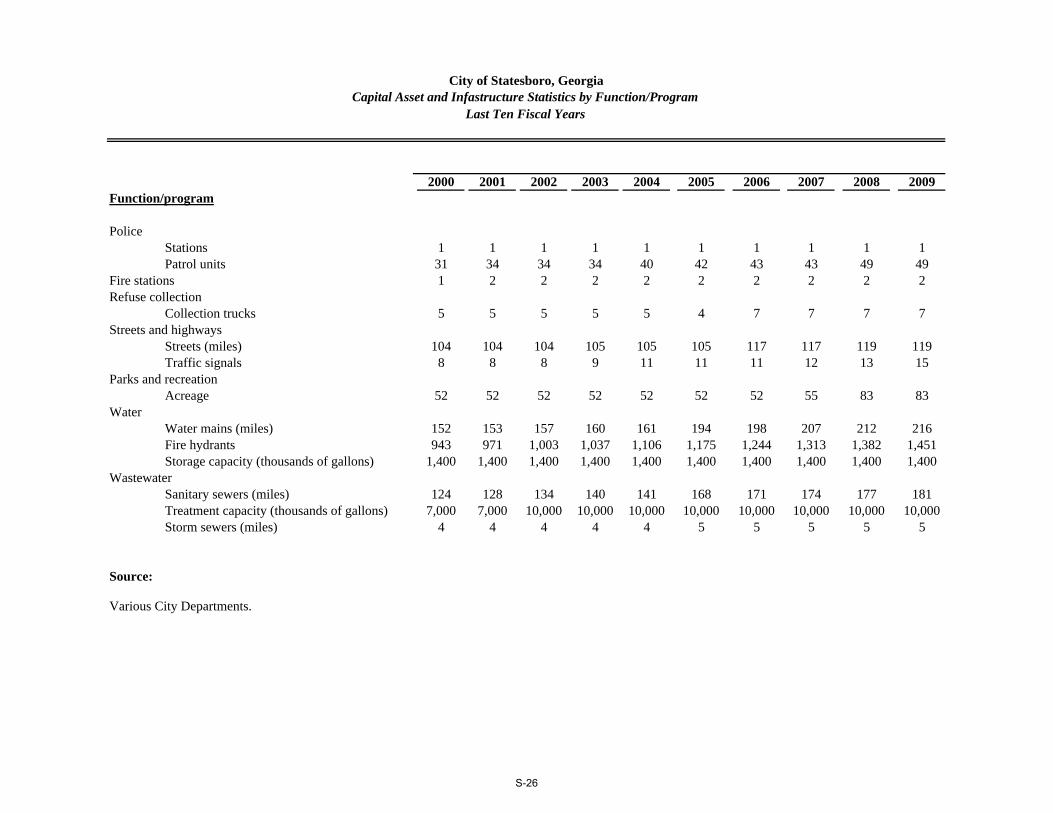
2000 2001 2002 2003 2004 2005 2006 2007 2008 2009Function/program
PoliceStations 1 1 1 1 1 1 1 1 1 1Patrol units 31 34 34 34 40 42 43 43 49 49
Fire stations 1 2 2 2 2 2 2 2 2 2Refuse collection
Collection trucks 5 5 5 5 5 4 7 7 7 7Streets and highways
Streets (miles) 104 104 104 105 105 105 117 117 119 119Traffic signals 8 8 8 9 11 11 11 12 13 15
Parks and recreationAcreage 52 52 52 52 52 52 52 55 83 83
WaterWater mains (miles) 152 153 157 160 161 194 198 207 212 216Fire hydrants 943 971 1,003 1,037 1,106 1,175 1,244 1,313 1,382 1,451Storage capacity (thousands of gallons) 1,400 1,400 1,400 1,400 1,400 1,400 1,400 1,400 1,400 1,400
WastewaterSanitary sewers (miles) 124 128 134 140 141 168 171 174 177 181Treatment capacity (thousands of gallons) 7,000 7,000 10,000 10,000 10,000 10,000 10,000 10,000 10,000 10,000Storm sewers (miles) 4 4 4 4 4 5 5 5 5 5
Source:
Various City Departments.
City of Statesboro, GeorgiaCapital Asset and Infastructure Statistics by Function/Program
Last Ten Fiscal Years
S-26

2000 2001 2002 2003 2004 2005 2006 2007 2008 2009Function/programPolice
Physical arrests 1,788 1,620 1,806 1,782 2,100 1,740 1,863 1,794 1,736 2,185Traffic violations 12,408 10,224 10,100 8,451 8,138 7,691 7,781 10,823 10,032 9,442
FireEmergency responses 902 772 844 890 894 855 930 927 743 1,106Fires extinguished 154 122 162 102 138 214 124 226 157 200Inspections 1,150 1,411 1,739 687 254 151 639 1,353 1,289 1,973
Refuse collectionRefuse collected (tons per month) N/A 1,545.2 1,574.2 1,641.3 1,716.7 1,770.4 1,771.9 1,821.8 1,981.0 1,426.0
Streets and highwaysResurfacing (miles) 1.50 1.50 3.70 3.62 3.35 12.50 0 7.5 1.43 2.75
WaterNew connections 312 194 217 156 90 156 275 562 187 188Water mains breaks 30 27 23 11 28 27 13 18 8 7Average daily consumption 3,174 2,924 2,971 2,724 2,978 2,887 3,091 3,190 3,239 3,130 (thousands of gallons)Peak daily consumption 6,997 5,476 4,293 3,781 4,989 4,989 4,306 4,220 4,630 5,179 (thousands of gallons)
WastewaterAverage daily sewage treatment 2,914 2,692 3,217 4,507 3,718 3,814 3,721 3,615 3,444 3,106 (thousands of gallons)
Sources:
Various City departments.
City of Statesboro, GeorgiaOperating Statistics by Function/Program
Last Ten Fiscal Years
S-27


50 East Main Street Statesboro, GA 30458 www.statesboroga.net