city of san mateo california
TRANSCRIPT

City of San Mateo California
Comprehensive Annual Financial ReportFiscal Year Ended June 30, 2018


CITY OF SAN MATEO SAN MATEO, CALIFORNIA
COMPREHENSIVE ANNUAL FINANCIAL REPORT
FOR THE YEAR ENDED JUNE 30, 2018
Prepared by:
FINANCE DEPARTMENT

City of San Mateo Comprehensive Annual Financial Report For the year ended June 30, 2018 Table of Contents
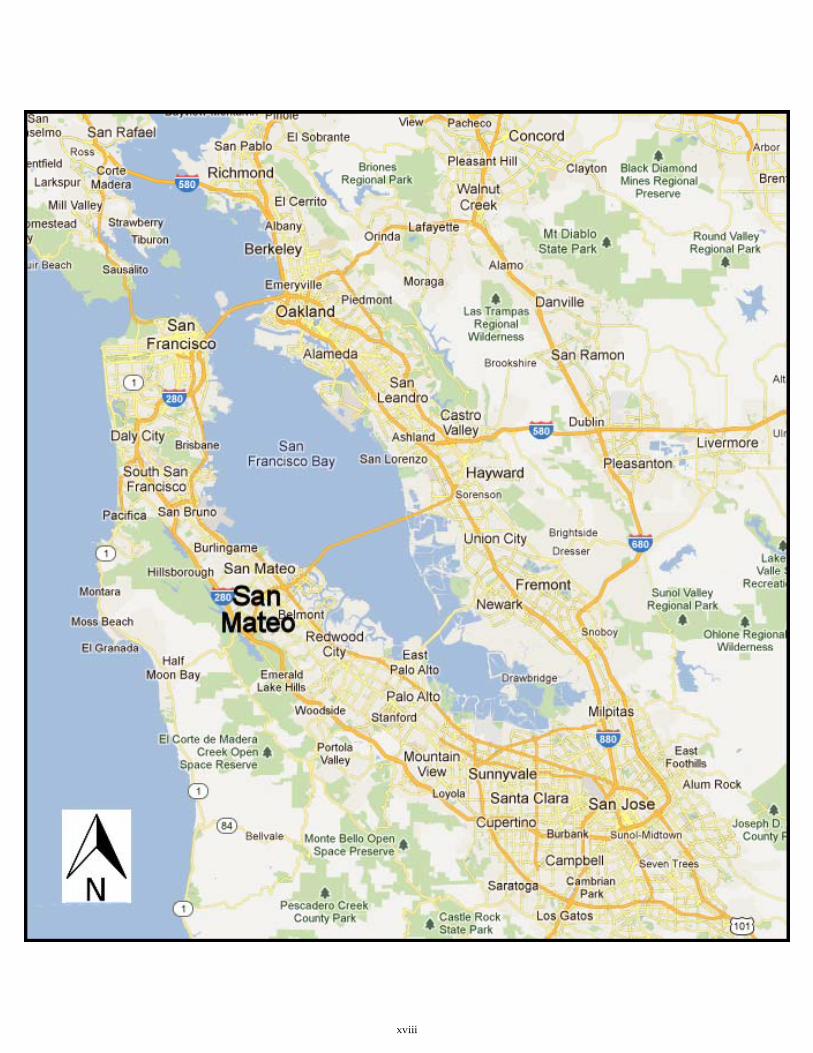
Page INTRODUCTORY SECTION Table of Contents ...................................................................................................................................................... i Letter of Transmittal ................................................................................................................................................. v Directory of City Officials ........................................................................................................................................ xvii Map of City’s Location ............................................................................................................................................. xviii Organization Chart ................................................................................................................................................... xix GFOA Certificate of Excellence in Financial Reporting ...................................................................................... xx FINANCIAL SECTION Independent Auditors’ Report .............................................................................................................................. 1 Management’s Discussion and Analysis ............................................................................................................. 5 Basic Financial Statements: Government-Wide Financial Statements: Statement of Net Position ........................................................................................................................... 26 Statement of Activities ................................................................................................................................ 28 Fund Financial Statements: Governmental Fund Financial Statements: Balance Sheet .......................................................................................................................................... 34 Reconciliation of the Governmental Funds Balance Sheet to the Government-Wide Statement of Net Position ................................................................. 37 Statement of Revenues, Expenditures and Changes in Fund Balances ......................................... 38 Reconciliation of the Governmental Funds Statement of Revenues, Expenditures, and Changes in Fund Balances to the Government-Wide Statement of Activities ................................................................................................................... 40
i
City of San Mateo Comprehensive Annual Financial Report For the year ended June 30, 2018 Table of Contents, Continued
Page FINANCIAL SECTION, Continued Proprietary Fund Financial Statements: Statement of Net Position ..................................................................................................................... 42 Statement of Revenues, Expenses and Changes in Fund Net Position ......................................... 44 Statement of Cash Flows ...................................................................................................................... 46 Fiduciary Fund Financial Statements: Statement of Fiduciary Net Position ................................................................................................... 50 Statement of Changes in Fiduciary Net Position .............................................................................. 51 Notes to Basic Financial Statements ................................................................................................................ 53 Required Supplementary Information (Unaudited): Budgets and Budgetary Accounting ................................................................................................................ 126 Defined Benefit Pension Plans .......................................................................................................................... 129 Other Post Employment Benefits (OPEB) ....................................................................................................... 133 Supplementary Information: Non-Major Governmental Funds: Combining Balance Sheet ........................................................................................................................... 138 Combining Statement of Revenues, Expenditures and Changes in Fund Balances .......................... 140 Schedule of Revenues, Expenditures and Changes in Fund Balances – Budget and Actual: Police Grants Special Revenue Fund .................................................................................................. 142 Community Development Block Grant Special Revenue Fund ..................................................... 143 HOME Special Revenue Fund ............................................................................................................. 144 City Housing Special Revenue Fund .................................................................................................. 145 Low Moderate Income Housing Special Revenue Fund ................................................................. 146 Fire Protection Special Revenue Fund ................................................................................................ 147 Gas Tax Special Revenue Fund ........................................................................................................... 148
ii

City of San Mateo Comprehensive Annual Financial Report For the year ended June 30, 2018 Table of Contents, Continued
Page FINANCIAL SECTION, Continued Advance Planning Special Revenue Fund ......................................................................................... 149 Parking Special Revenue Fund ............................................................................................................ 150 Solid Waste Special Revenue Fund ..................................................................................................... 151 Parks and Recreation Special Revenue Fund ................................................................................... 152 Traffic Impact Fee Special Revenue Fund ......................................................................................... 153 Commercial Linkage Fee Special Revenue Fund ............................................................................. 154 Landfill Bonds Debt Service Fund ...................................................................................................... 155 General Obligation Bonds Debt Service Fund .................................................................................. 156 2% Hotel Tax Capital Project Fund ..................................................................................................... 157 Internal Service Funds: Combining Statement of Net Position ...................................................................................................... 160 Combining Statement of Revenues, Expenses and Changes in Net Position ..................................... 162 Combining Statement of Cash Flows ........................................................................................................ 164 Fiduciary Funds: Combining Statement of Fiduciary Net Position .................................................................................... 168 Combining Statement of Changes in Fiduciary Net Position ................................................................ 169 Statement of Changes in Agency Funds Assets and Liabilities ............................................................ 170 General Capital Projects Fund: Schedule of Assessments and Impact Fees and related Expenditures ................................................. 172 STATISTICAL SECTION (Unaudited) Net Position by Component .................................................................................................................................... 176 Changes in Net Position ........................................................................................................................................... 178 Governmental Activities Tax Revenues by Source .............................................................................................. 182 Fund Balances of Governmental Funds ................................................................................................................. 184 Changes in Fund Balances of Governmental Funds ............................................................................................ 186 Assessed Value and Estimated Actual Value of Taxable Property ................................................................... 188 Direct and Overlapping Property Tax Rates ......................................................................................................... 189 Principal Sales Tax Producers ................................................................................................................................. 190 Principal Property Taxpayers .................................................................................................................................. 191
iii
City of San Mateo Comprehensive Annual Financial Report For the year ended June 30, 2018 Table of Contents, Continued
Page STATISTICAL SECTION (Unaudited), Continued Property Tax Levies and Collections ................................................................................................................... 192 Ratios of Outstanding Debt by Type ................................................................................................................... 193 Ratios of General Bonded Debt Outstanding ..................................................................................................... 194 Direct and Overlapping Governmental Activities Debt ................................................................................... 195 Legal Debt Margin Information ........................................................................................................................... 196 Pledged-Revenue Coverage .................................................................................................................................. 198 Demographic and Economic Statistics ................................................................................................................ 199 Principal Employers for City of San Mateo ........................................................................................................ 200 Full-Time Equivalent City Government Employees by Function ................................................................... 201 Operating Indicators by Function ........................................................................................................................ 202 Capital Asset Statistics by Function ..................................................................................................................... 203
iv
LETTER OF TRANSMITTAL
Finance Department 330 West 20th Avenue
San Mateo, California 94403 p: 650.522.7100 f: 650.522.7101
http://www.cityofsanmateo.org November 15, 2018
Residents of the City of San Mateo, Honorable Mayor, and Honorable Members of the City Council
State law requires that all general-purpose local governments publish within six months of the close of the fiscal year a complete set of financial statements presented in conformity with accounting principles generally accepted in the United States of America (U.S. GAAP) and audited in accordance with generally accepted auditing standards by a firm of licensed certified public accountants. This report is prepared by the City of San Mateo’s Department of Finance in accordance with Section 5.26 of the City’s Charter. Pursuant to the requirements, we hereby issue the Comprehensive Annual Financial Report (CAFR) of the City for the fiscal year ended June 30, 2018.
This report consists of management’s representations concerning the finances of the City and its blended component unit. Responsibility for both the accuracy of the data and the completeness and fairness of the presentation, including all disclosures, rests with the management of the City. To provide a reasonable basis for making those representations, management of the City has established a comprehensive internal control framework that is designed both to protect the government’s assets from loss, theft, or misuse and to compile sufficient reliable information for the preparation of the City’s financial statements in conformity with U.S. GAAP. The first note in the Notes to the Financial Statements provides a detailed explanation of the City’s significant accounting policies. Because the cost of internal controls should not outweigh their benefits, the City’s comprehensive framework of internal controls has been designed to provide reasonable assurance that the financial statements will be free from material misstatement. As management, we assert that, to the best of our knowledge and belief, this financial report is complete and reliable in all material respects.
Badawi & Associates, a firm of licensed certified public accountants, has audited the City’s financial statements. The goal of the independent audit is to provide reasonable assurance that the financial statements of the City and its blended component unit for the fiscal year ended June 30, 2018 are free of material misstatement. The audit involved examining, on a test basis, evidence supporting the amounts and disclosures in the financial statements; assessing the accounting principles used and significant estimates made by management; and evaluating the overall financial statement presentation. The independent auditors concluded, based upon the audit, that there was a reasonable basis for rendering an unmodified opinion on the City’s basic financial statements as of and for the year ended June 30, 2018. The independent auditors’ report is presented as the first component of the financial section of this report.
The analysis of the financial condition and the result of operations are in the Management’s Discussion and Analysis (MD&A) section immediately following the auditor’s report. This transmittal letter is designed to complement the MD&A and should be read in conjunction with the MD&A.
v

LETTER OF TRANSMITTAL
THE REPORT The CAFR is presented in three sections: The Introduction section includes this letter of transmittal, City Council introduction, the City’s
organizational chart, and certificates of achievement. The Financial section includes the report of the independent auditors; Management’s Discussion
and Analysis (MD&A); the basic financial statements, including the government-wide financial statements; and the accompanying notes to the financial statements. The Financial Section also includes the fund financial statements, including the governmental funds financial statements, the proprietary funds financial statements, the fiduciary funds financial statements, and the combining individual funds financial statements for the non-major governmental funds and the internal service funds. Required supplementary information other than the MD&A is also included in the financial section.
The Statistical section includes selected financial and demographic information, presented on a multi-year basis.
CAFR Organization
This CAFR includes all funds of the City and the City’s component unit, which is a legally separate organization for which the City is financially accountable or whose relationship with the City is of a nature and significance that would cause the City’s financial statements to be incomplete were it not included. In addition to the financial audit, the City undertakes a single audit in conformance with the Single Audit Act Amendments of 1996 and the Uniform Guidance. The results of this single audit are available in the City’s single audit report and include a schedule of expenditures of federal awards and the independent auditors’ reports on the City’s internal controls and compliance with legal requirements. Special emphasis is placed on internal controls and legal requirements involving the administration of federal awards.
vi

LETTER OF TRANSMITTAL
CITY PROFILE
The City of San Mateo is in San Mateo County and is situated 19 miles south of San Francisco and 30 miles north of San Jose. The City covers an area of 14.6 square miles and includes tidelands from the Bay to the east and coastal mountains to the west. With its Mediterranean climate, residents enjoy warm, sunny summers and mild damp winters, ideal for various recreational activities in the City’s many neighborhoods and regional parks.
One of the larger suburbs of the San Francisco Peninsula, San Mateo is bordered by the cities of Burlingame to the north, Foster City to the east, Belmont to the south, and Hillsborough to the west. Based on projections from the California Department of Finance, the City of San Mateo had an estimated 2018 population projection of over 104,000, compared to the just over 774,000 residents in San Mateo County.
CITY HISTORY The first inhabitants of what is now the City of San Mateo were members of a tribe of the Ohlone Indians (called Coastanoans by Spanish explorers). This Tribe lived in the area from South San Francisco to Belmont for at least 4,000 years before explorers first arrived on the Peninsula. In 1776, Spanish explorers came to today's San Mateo. During a scouting trip to locate a place to start a colony on the Peninsula, Lieutenant Colonel Juan Bautista de Anza, Padre Pedro Font, Lieutenant Jose Joaquin Moraga, and eleven soldiers set up camp in San Mateo. Father Font named the creek that they slept by "San Mateo Creek." In 1793, the mission fathers in San Francisco created an outpost of the mission on the Peninsula. The outpost was the first building built in San Mateo by non-natives.
In 1822, California received word of Mexico's independence from Spanish rule. The Mexican Land Grants (1835) would leave a few residents owning vast expanses of land in the area. These ranches were so large that what is now the City of San Mateo is comprised of only two land grants - Rancho San Mateo and Rancho de las Pulgas. The year 1889 saw many important events in the developing San Mateo community. Under head engineer, Herman Schussler, the Crystal Springs dam was completed. The completion of this project assured that the people of San Mateo would have quality drinking water, allowing for further growth in the area.
In the same year, William Howard had part of his estate opened for subdivision, the first successful attempt at selling smaller plots of land. With this, the middle class moved to San Mateo. In this same year, Richard H. Jury and Charles N. Kirkbride established the “Leader”, San Mateo's first successful newspaper and one of the earliest proponents of the incorporation of San Mateo. On September 3, 1894, with a vote of 150 in favor and 25 against incorporation, San Mateo became a town.
CITY ORGANIZATION The City was incorporated in 1894 and was originally chartered in 1922. The current charter was adopted in 1971 and revised in 2002. Since 2002, there have been two other voter-approved amendments to the charter. San Mateo has a Council-Manager form of government. Five Council members serve at-large for four-year terms. The Council selects a Mayor from among its members each December for a one-year term. The City Manager is appointed by the Council and serves as chief executive officer responsible for the day-to-day administration of City affairs. The City Council also appoints a City Attorney. There are thirteen Advisory Boards and Commissions, ten of which are appointed by the City Council.
vii
LETTER OF TRANSMITTAL
The City provides a full range of municipal services, including police and fire protection, public works, parks and recreation, library, planning and zoning, building, sewer system, street maintenance, economic development, and general administrative services. The City offers 35 parks, six recreation centers, an 18-hole golf course, and three libraries including a state-of-the-art main library. California Water Service, a private company, provides water to City residents.
The City's management has adopted a set of "organizational principles" that reflect the City’s management philosophy. These principles are:
Engaged and accountable workforce; Working as one organization; Maintaining long-term perspective; Seeking constant improvement; and Leading through informed risk-taking.
These principles, which were adopted in 2016, are intended to guide management actions throughout the City organization. The goals of City management are to see that necessary and desired services are provided in an efficient and effective manner and that planning and continued improvement take place to provide for the community's future.
The City operates on a two-year budget cycle. The two-year budget process requires that each department submit two one-year expenditure plans and revenue estimates to the City Council for approval. In each alternate year, the department directors present mid-cycle performance reports to the City Manager and City Council summarizing budget status to date and seeking approval for year-two funding. The City utilizes a five-year plan for capital improvements. The plan serves as a guide for allocation of future resources.
The City maintains budgetary controls that have the objective of ensuring compliance with legal provisions embodied in the annual appropriated budget submitted by the City Manager and adopted by the City Council. The annual operating budget and the long-term capital improvement plan are adopted on or before June 30th by City Council and can only be amended by City Council. The two-year business plan for operations is adopted in June of every even-numbered year and is amended in the second year of the plan as part of the annual budget development process.
Departmental operating budgets may be reallocated among programs within a department and within the same fund, but expenditures may not exceed annually budgeted appropriations at the department/fund level without Council approval. Project-length budgets are adopted for some special revenue funds and all capital project funds. Capital improvement expenditures may not exceed budgeted amounts without Council approval. Budgetary control (the level at which expenditures and encumbrances cannot legally exceed the appropriated amount) is established at the department level within individual funds, except for some special revenue and all capital project funds, which are at the funded project level.
The City has an Audit Committee consisting of the Mayor and Deputy Mayor. The audit committee is responsible for the selection and management of the external auditor. The Audit Committee discusses with the external auditor any matters related to the audit, and also accepts the results of the annual financial audit.
viii
LETTER OF TRANSMITTAL
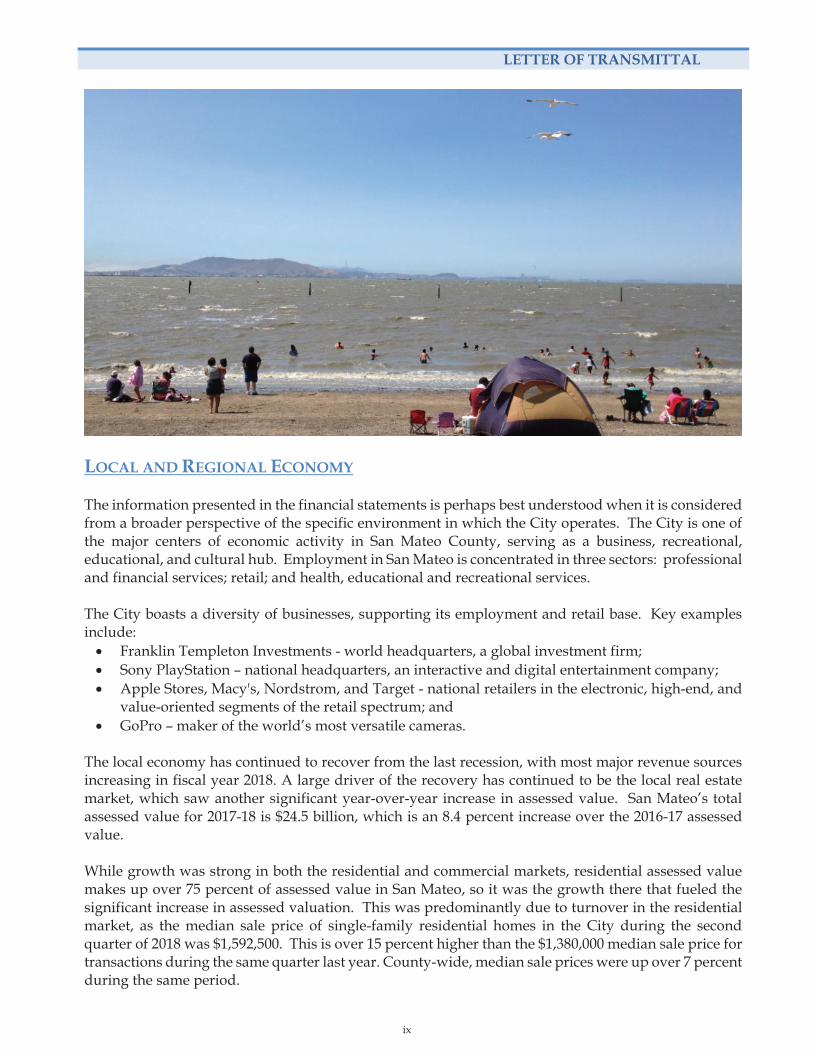
LOCAL AND REGIONAL ECONOMY
The information presented in the financial statements is perhaps best understood when it is considered from a broader perspective of the specific environment in which the City operates. The City is one of the major centers of economic activity in San Mateo County, serving as a business, recreational, educational, and cultural hub. Employment in San Mateo is concentrated in three sectors: professional and financial services; retail; and health, educational and recreational services.
The City boasts a diversity of businesses, supporting its employment and retail base. Key examples include:
Franklin Templeton Investments - world headquarters, a global investment firm; Sony PlayStation – national headquarters, an interactive and digital entertainment company; Apple Stores, Macy's, Nordstrom, and Target - national retailers in the electronic, high-end, and
value-oriented segments of the retail spectrum; and GoPro – maker of the world’s most versatile cameras.
The local economy has continued to recover from the last recession, with most major revenue sources increasing in fiscal year 2018. A large driver of the recovery has continued to be the local real estate market, which saw another significant year-over-year increase in assessed value. San Mateo’s total assessed value for 2017-18 is $24.5 billion, which is an 8.4 percent increase over the 2016-17 assessed value.
While growth was strong in both the residential and commercial markets, residential assessed value makes up over 75 percent of assessed value in San Mateo, so it was the growth there that fueled the significant increase in assessed valuation. This was predominantly due to turnover in the residential market, as the median sale price of single-family residential homes in the City during the second quarter of 2018 was $1,592,500. This is over 15 percent higher than the $1,380,000 median sale price for transactions during the same quarter last year. County-wide, median sale prices were up over 7 percent during the same period.
ix

LETTER OF TRANSMITTAL
Home sale prices, data from HdL Property Tax Division, June 2018
A strong job market within the City boundaries is also fueling the local economy. The current annualized average unemployment rate in the City of San Mateo (2.1%) is slightly lower than the Countywide unemployment rate (2.2%) and is much better than the State’s rate (4.2%). All three rates are currently lower than the 2017 average.
Unemployment rates, data from US Bureau of Labor Statistics, June 2018
While the local economy continues to be robust, there are several economic challenges that could affect local conditions in the future. Two of the most pressing concerns for the City are slowing sales tax revenues due to changes in consumer spending practices and steadily rising pension costs. These conditions will continue to be closely monitored going forward to ensure course corrections to the long-term financial plan are made as necessary.
City of San Mateo Median Single Family Home Sales Prices
x
LETTER OF TRANSMITTAL
CITY FINANCIAL POLICIES & PLAN Formal financial policies and prudent operating practices have enabled the City to maintain core services and minimize the impact of economic fluctuations on residents as much as possible. Formal policies exist in areas such as balanced budgets, revenue diversification, operating expenditures, reserves, investments, and debt. Trust has been built over the years between the City and the community through having and following formal financial policies, as well as maintaining prudent operating practices. This trust and confidence were demonstrated by the voters in San Mateo, who in November 2009 approved a ¼ cent general sales tax on purchases made in the City. This measure generated $5.1 million in additional revenue for FY 2017-18 to support General Fund operations. With this tax set to expire April 2018, the voters again demonstrated their confidence in the City’s financial management by voting in November 2015 to extend the tax until 2048 to fund critical infrastructure and enhancements to public safety services. REVENUE ADMINISTRATION The City’s two main sources of revenue for operating expenditures are property and sales taxes, which make up nearly 65 percent of total General Fund revenues. In addition, the City’s revenue administration includes a review of all fees, fines, and charges for services to ensure the charges are meeting cost-recovery goals. One-time and unpredictable revenues are spent on one-time expenditures, such as equipment replacement, or transferred to capital improvement funds for repair and rehabilitation projects. EXPENDITURE ADMINISTRATION Both City departments and the Finance Department carefully review expenditure budgets. The department directors are responsible for containing expenditures within their Council-approved budget appropriations. The City maintains an encumbrance accounting system as an additional means of budgetary control. Encumbered amounts in the operating budget lapse one year after the end of the fiscal year. For 2018, continued control of salary and benefit costs, as well as controls in other spending areas, resulted in the General Fund’s expenditures totaling below budgeted appropriations by year-end. RESERVES The City Council’s budget policy for the use of reserves varies depending on the reserve type but generally limits the use of reserves to respond to revenue shortfalls, unanticipated expenditures, severe economic downturns, or natural disasters. The policy further states that use of reserves should be combined with structural changes to bring the budget back into balance if it is out of balance. The General Fund reserve policy adopted by the City Council seeks to reflect three months of General Fund budgeted operating expenditures, or 25 percent. As of the close of the 2017-18 fiscal year, General Fund has $71.8 million unassigned fund balance. This amount is well above the 25 percent reserve threshold, which would be approximately $29 million based on fiscal year 2018-19 budgeted operating expenditures. The enterprise reserve policy seeks to reflect four months of expenditures, or 33 percent. As of the close of the 2017-18 fiscal year, the Sewer Enterprise Fund’s accessible cash position is $6.1 million, which is approximately 21 percent of operating and debt interest expenses. While the cash position is lower than is typical, this is a result of the City opting to cash fund its capital projects in the Clean Water Program instead of drawing on the $70 million line of credit the City has access to. This is done strategically during the year as interest rates on borrowed funds, including the line of credit, are higher
xi

LETTER OF TRANSMITTAL
than what the City is earning on its pooled investment portfolio. The City will continue to evaluate the funding of sewer capital, including seeking longer-term financing, as project expenses accelerate. There are additional reserves established in the City’s other funds for vehicle and equipment replacement, general liability, and capital improvements. DEBT ADMINISTRATION The City manages the issuance of new debt and proactively communicates with the investment community in the administration of its outstanding debt. In doing so, the City seeks to ensure that debt is issued prudently and affordably, and bondholders are provided all the information required by the Municipal Securities Rulemaking Board as governed by the Securities and Exchange Commission. Proposition 13 amended the State Constitution by requiring California cities to obtain voter approval prior to issuing general obligation bonds. State statutes further limit general obligation bonded debt to 15% of the assessed value of all real and personal property within the City. At June 30, 2018, the City’s general obligation bonded debt of $23.5 million amounted to 0.62% of the $3.8 billion legal debt limit. According to standard measures used by the primary credit rating agencies to assess debt (e.g. fund balance as a percent of operating expenses, debt-to-assessed valuation ratios, debt per capita, etc.), the City’s level of direct debt obligations is considered low in comparison to similarly-sized cities. Rating agencies cite the City’s strong financial management and prudent fiscal policies as credit strengths. As of June 30, 2018, the City’s rating for general obligation bonds is AA+ by Standard & Poor’s and Aaa from Moody’s Investor Service. The City of San Mateo Joint Powers Public Financing Authority manages three bond issues totaling $25.6 million. CASH MANAGEMENT The State Government Code regulates the securities in which the City may invest its funds. Legally permissible investments include, but are not limited to, obligations of the United States Government, its agencies, and sponsored corporations; prime bankers’ acceptances; prime commercial paper; certificates of deposit issued by banks and savings and loan institutions; highly rated municipal securities; and money market funds that purchase only the types of securities specified herein. The objectives of the City Council-adopted investment policy, in order of priority, are to maintain principal, to ensure the availability of funds to meet obligations promptly, and to maximize yield on the investment portfolio. Bank deposits are either insured by federal deposit insurance or collateralized according to state law. Investments are held at a third-party bank in a safekeeping account in the City’s name. The City had a total cash and investments portfolio of $279.3 million at the fiscal year ended June 30, 2018. LONG-TERM FINANCIAL PLANNING The City of San Mateo has a long tradition of disciplined and prudent fiscal management. To address the significant impacts of the Great Recession, the City Council adopted various strategies for financial sustainability that have been successfully implemented to achieve not only a balanced General Fund budget, but also create a mechanism for the City to accumulate sufficient resources to grow itself out from under its formerly narrow reserve position, which it has accomplished, as evidenced by the FY 2017-18 General Fund unassigned fund balance at 61.3% of General Fund expenditures, including transfers out. This represents significant progress from FY 2010-11, when General Fund unassigned fund balance was 16.0% of expenditures.
xii
LETTER OF TRANSMITTAL
The City continues to adhere to a planning process that focuses on financial sustainability. To this end, the City recurrently updates a long-term General Fund financial projection model designed to inform decision makers of the long-term impacts of near-term financial proposals. The City also maintains a five-year long-range capital planning process and capital improvement plan that is annually updated. This plan drives capital project funding decisions and periodic new bonded debt issuances for larger capital infrastructure investments. For General Fund operations, revenues and expenditures are forecasted out for ten years to continually assess the long-term structural balance of that fund and allow adequate time for thoughtful course correction if a structural imbalance occurs.
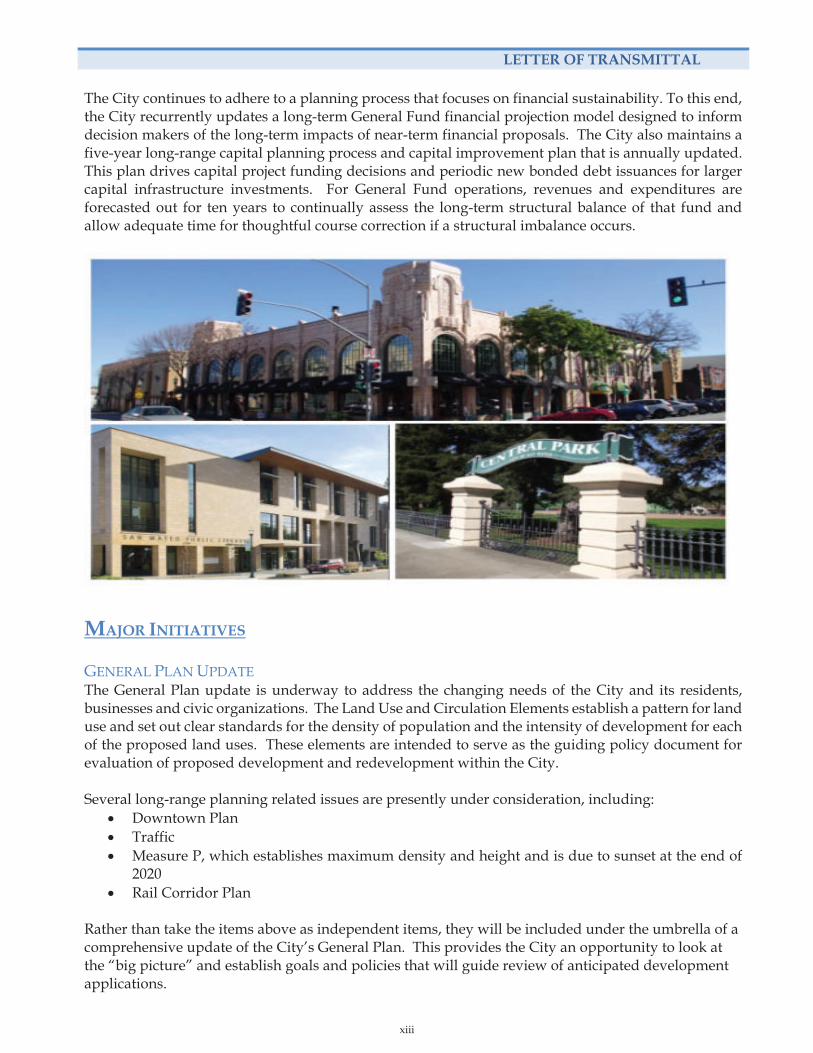
MAJOR INITIATIVES GENERAL PLAN UPDATE The General Plan update is underway to address the changing needs of the City and its residents, businesses and civic organizations. The Land Use and Circulation Elements establish a pattern for land use and set out clear standards for the density of population and the intensity of development for each of the proposed land uses. These elements are intended to serve as the guiding policy document for evaluation of proposed development and redevelopment within the City. Several long-range planning related issues are presently under consideration, including:
Downtown Plan Traffic Measure P, which establishes maximum density and height and is due to sunset at the end of
2020 Rail Corridor Plan
Rather than take the items above as independent items, they will be included under the umbrella of a comprehensive update of the City’s General Plan. This provides the City an opportunity to look at the “big picture” and establish goals and policies that will guide review of anticipated development applications.
xiii
LETTER OF TRANSMITTAL
While updating the General Plan, other elements, such as the Noise Element (largely dependent upon traffic), Safety Element (incorporation of the City’s recent Local Hazard Mitigation Plan), and other elements will also be touched upon to ensure internal consistency and as required by State law.
Additionally, as the update of the General Plan is a community-wide planning effort, it’s vitally important to ensure the community engagement strategy be inclusive and reach as many community members as possible. The engagement approach consists of three major components:
Face-to-face engagementDigital engagementA General Plan Subcommittee appointed by the City Council
These long-range planning efforts will help continue the focus on the vitality and economic strength of the City’s commercial areas as an asset to the City residents, businesses, visitors and the greater San Mateo community.
BAY MEADOWS PHASE II DEVELOPMENT Bay Meadows Phase II is a major transit-oriented mixed-use redevelopment project providing much needed revitalization and housing at the former Bay Meadows Race Track. The development plans on the 83-acre site move away from the previous single-use to include a significant amount of residential, commercial office, and retail space along the Caltrain rail corridor, which includes approximately 1,145 residential units, 767,000 square feet of office space, and 93,000 square feet of retail and restaurant space. Additionally, a 450-student private high school, the nationally-recognized Nueva School, opened in 2014, and three public parks opened as well.
Infrastructure construction of the project began in 2009 and vertical construction of the first townhomes began in 2013. Roughly two-thirds of the project has been completed or is currently under construction. The City is currently reviewing a planning application for a modification of a previously approved Site Plan and Architectural Review (SPAR) planning application. The modification would increase the approved office space by approximately 177,000 square feet, and bring the total approved office space at the Bay Meadows Phase II project site to approximately 944,000 square feet. Full development of the project is expected to be completed in approximately 4-6 years.
STATION PARK GREEN MIXED-USE Station Park Green is a 12-acre transit-oriented mixed-use redevelopment project near the Caltrain station and State Route 92, located on the site of a former Kmart. The project includes 599 residential units, 10,000-15,000 square feet of office space, 25,000-30,000 square feet of retail and restaurant space, and approximately 3.4 acres of parks and open space. The original Specific Plan and Design Guidelines were approved by the City Council in 2011. The planning application was approved in 2015 and included revisions to that document as well as to the site plans and building designs. The project is currently under construction, and when finished will provide valuable revitalization and housing.
HILLSDALE SHOPPING CENTER NORTH BLOCK RENOVATIONThe Hillsdale Shopping Center is the City’s largest commercial site with over 1.3 million square feet of retail commercial space. The North Block renovation project is currently under construction, which includes the replacement of an existing Sears store and food court with new retail, restaurant space, food court, luxury bowling alley, an outdoor plaza, and a new luxury movie theatre. The planning application was approved by the City Council in March 2016. Construction for the food terrace is expected to be completed in the winter of 2018, and the rest of the phases expected to be completed in the spring of 2019. This project will provide an important revitalization of the City’s largest regional shopping center and is expected to improve the City’s tax revenue base.
xiv
LETTER OF TRANSMITTAL
ADDITIONAL HOUSING PROJECTS In addition to the housing being added as part of the larger Bay Meadows and Station Park Green projects, there are several other housing projects recently completed that added much-needed residential units to the City. These include Classics at San Mateo (27 townhomes- completed), Mariner’s Island Condominiums (76 condominium units- completed), 220 North Bayshore (42 townhomes- completed), and Central Park South (60 apartment units- under construction).
Franklin Templeton has an additional two 122,630 square foot four-story office buildings totaling 245,260 square feet. This build out was included as part of the Bay Meadows Phase 1 Specific Plan. Additionally, the City approved the construction of multi-story mixed use office/residential at the corner of Fourth Ave/Claremont Street in the Downtown Area, and this project is currently under construction.
Recently approved projects, which have not yet started construction, include Hillsdale Terrace (67 units) and 2 W. Third (the remaining vacant parcel at this corner), which includes 10 units as well as a fully automated parking garage.
SEWER UTILITY INFRASTRUCTURE NEEDS The Clean Water Program is a major City initiative and 10-year capital improvement program for the rehabilitation and upgrade of the sewer utility that began in 2015 and involves over $900 million in improvements to the wastewater treatment and collection systems to comply with the State of California Water Quality Control Board’s cease and desist order and wastewater treatment discharge permit. The program is expected to be funded with a combination of operating surpluses, sewer charge rate increases, capital contributions from the utility’s sub-regional partners, and bond financing. In addition, the City has pursued federal and state loans to potentially complement the funding approach. Long-range capital improvement plans and an updated Integrated Sewer Master Plan to meet the cease and desist order and discharge permit requirements have been developed and projects within the overall Clean Water Program are underway.
REDEVELOPMENT SUCCESSOR AGENCY California redevelopment agencies were dissolved on February 1, 2012 by the California legislature and governor. The Successor Agency to the Redevelopment Agency of the City of San Mateo received its Finding of Completion letter from the California Department of Finance (DOF) in April of 2013. The Successor Agency’s Long-Range Property Management Plan was submitted to the DOF in October 2013 and was given final approval in December 2014. In December 2017, the DOF approved an amendment to the Agency’s Last and Final Recognized Obligations Payment Schedule (ROPS), to comply with the Master Indenture governing the Redevelopment Agency’s outstanding bonds. In this reporting period, the Agency’s primary activity was the management of debt service. This included refinancing a portion of the outstanding debt into more favorable terms for all impacted taxing entities.
AWARDS AND ACKNOWLEDGEMENTS
The Government Finance Officers Association of the United States and Canada (GFOA) awarded a Certificate of Achievement for Excellence in Financial Reporting to the City for its CAFR for the year ended June 30, 2017. The Certificate of Achievement is a national award recognizing conformance with the highest standards for preparation of state and local government financial reports. To be awarded a Certificate of Achievement, the City must publish an easily readable and efficiently organized CAFR. This report must satisfy both U.S. GAAP and applicable legal requirements. This was the twenty-eighth consecutive year that the City has received this award. A Certificate of Achievement is valid for one
xv
LETTER OF TRANSMITTAL
year only. We believe this FY 2017-18 CAFR continues to conform to the Certificate of Achievement program requirements, and we will submit it to the GFOA to determine its eligibility for another certificate.
The preparation of this CAFR could not have been accomplished without the efficient and dedicated service of a highly-qualified staff in the Finance Department. The dedication and cooperation of staff in all City departments in the administration of financial policies throughout the year is also appreciated. We also acknowledge the thorough and professional manner in which our independent auditors, Badawi & Associates, conducted their audit.
In closing, City staff wishes to express deep appreciation to the City Council for their leadership, support, and responsiveness to the financial concerns of the City.
Respectfully submitted,
Larry Patterson, City Manager
Drew Corbett, Assistant City Manager/ Finance Director
xvi

City of San Mateo
San Mateo, California
City Council – 2018
Rick Bonilla, Mayor
Diane Papan, Deputy Mayor
Maureen Freschet, Council Member
Joe Goethals, Council Member
Eric Rodriguez, Council Member
xvii
xviii
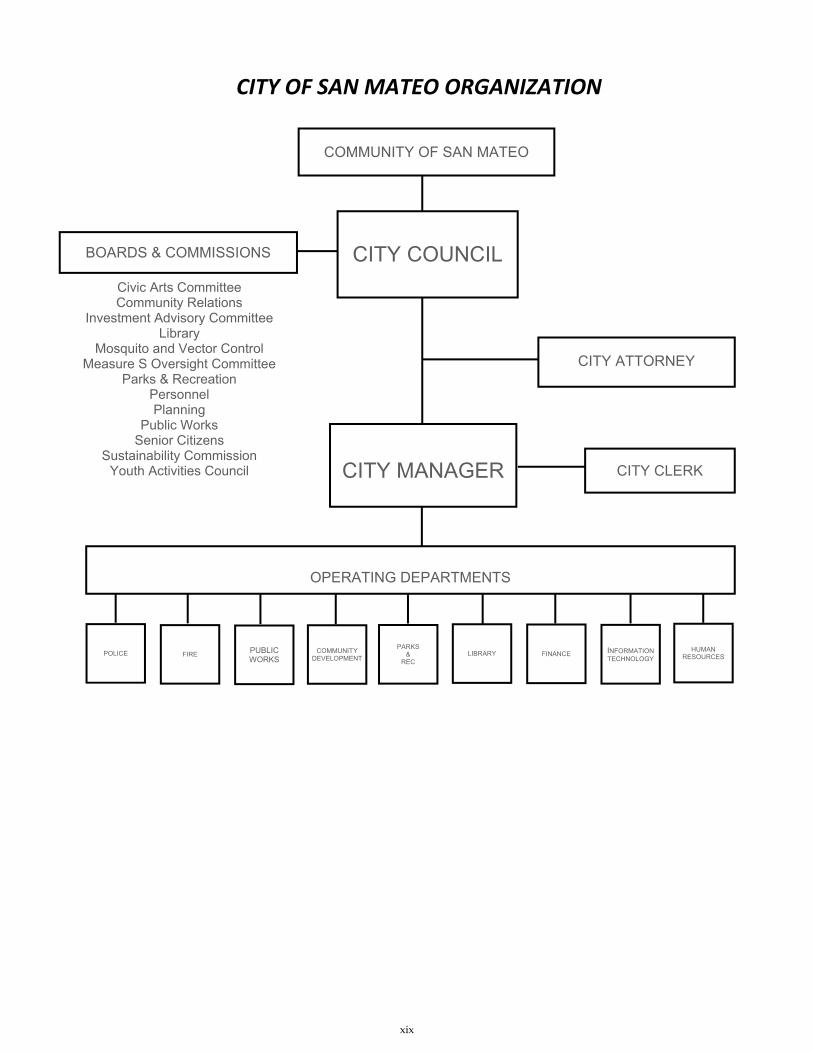
CITY OF SAN MATEO ORGANIZATION
PARKS &
REC
COMMUNITY OF SAN MATEO
CITY COUNCIL
CITY MANAGER
LIBRARY
CITY ATTORNEY
CITY CLERK
BOARDS & COMMISSIONS
OPERATING DEPARTMENTS
HUMAN RESOURCES
Civic Arts Committee Community Relations
Investment Advisory Committee Library
Mosquito and Vector Control Measure S Oversight Committee
Parks & Recreation Personnel Planning
Public Works Senior Citizens
Sustainability Commission Youth Activities Council
INFORMATION TECHNOLOGY
FINANCE POLICE COMMUNITY DEVELOPMENT
PUBLIC WORKS
FIRE
xix
xx

INDEPENDENT AUDITORS’ REPORT
To the Honorable Mayor and Members of the City Council of the City of San Mateo
San Mateo, California
Report on the Financial Statements
We have audited the accompanying financial statements of the governmental activities, the business-type activities, each major fund, and the aggregate remaining fund information of the City of San Mateo, California (City) as of and for the year ended June 30, 2018, and the related notes to the financial statements, which collectively comprise the City’s basic financial statements as listed in the table of contents.
Management’s Responsibility for the Financial Statements
Management is responsible for the preparation and fair presentation of these financial statements in accordance with accounting principles generally accepted in the United States of America; this includes the design, implementation, and maintenance of internal control relevant to the preparation and fair presentation of financial statements that are free from material misstatement, whether due to fraud or error.
Auditor’s Responsibility
Our responsibility is to express opinions on these financial statements based on our audit. We conducted our audit in accordance with auditing standards generally accepted in the United States of America and the standards applicable to financial audits contained in Government Auditing Standards, issued by the Comptroller General of the United States. Those standards require that we plan and perform the audit to obtain reasonable assurance about whether the financial statements are free from material misstatement.
An audit involves performing procedures to obtain audit evidence about the amounts and disclosures in the financial statements. The procedures selected depend on the auditor’s judgment, including the assessment of the risks of material misstatement of the financial statements, whether due to fraud or error. In making those risk assessments, the auditor considers internal control relevant to the entity’s preparation and fair presentation of the financial statements in order to design audit procedures that are appropriate in the circumstances, but not for the purpose of expressing an opinion on the effectiveness of the entity’s internal control. Accordingly, we express no such opinion. An audit also includes evaluating the appropriateness of accounting policies used and the reasonableness of significant accounting estimates made by management, as well as evaluating the overall presentation of the financial statements.
We believe that the audit evidence we have obtained is sufficient and appropriate to provide a basis for our audit opinions.
To the Honorable Mayor and Members of the City Council of the City of San Mateo
San Mateo, California Page 2
Opinions
In our opinion, the financial statements referred to above present fairly, in all material respects, the respective financial position of the governmental activities, the business-type activities, each major fund, and the aggregate remaining fund information of the City as of June 30, 2018, and the respective changes in financial position, and, where applicable, cash flows thereof for the year then ended in accordance with accounting principles generally accepted in the United States of America.
Other Matters
Required Supplementary Information
Accounting principles generally accepted in the United States of America require that the management’s discussion and analysis, budgetary comparison information, pension required supplementary information, and schedules of funding progress for other post employment benefits on pages 5-21 and 126-134, be presented to supplement the basic financial statements. Such information, although not a part of the basic financial statements, is required by the Governmental Accounting Standards Board, who considers it to be an essential part of financial reporting for placing the basic financial statements in an appropriate operational, economic, or historical context. We have applied certain limited procedures to the required supplementary information in accordance with auditing standards generally accepted in the United States of America, which consisted of inquiries of management about the methods of preparing the information and comparing the information for consistency with management’s responses to our inquiries, the basic financial statements, and other knowledge we obtained during our audit of the basic financial statements. We do not express an opinion or provide any assurance on the information because the limited procedures do not provide us with sufficient evidence to express an opinion or provide any assurance.
Other Information
Our audit was conducted for the purpose of forming opinions on the financial statements that collectively comprise the City’s basic financial statements. The introductory section, combining and individual nonmajor fund financial statements, budgetary comparison schedules on pages 137 to 157, schedule of assessments and impact fees, and statistical section, are presented for purposes of additional analysis and are not a required part of the basic financial statements.
The combining and individual nonmajor fund financial statements, budgetary comparison schedules on pages 137 to 157, and schedule of assessments and impact fees are the responsibility of management and were derived from and relate directly to the underlying accounting and other records used to prepare the basic financial statements. Such information has been subjected to the auditing procedures applied in the audit of the basic financial statements and certain additional procedures, including comparing and reconciling such information directly to the underlying accounting and other records used to prepare the basic financial statements or to the basic financial statements themselves, and other additional procedures in accordance with auditing standards generally accepted in the United States of America. In our opinion, the combining and individual nonmajor fund financial statements, the budgetary comparison schedules on pages 137 to 157, the schedule of assessments and impact fees are fairly stated in all material respects in relation to the basic financial statements as a whole.
2

To the Honorable Mayor and Members of the City Council of the City of San Mateo
San Mateo, California Page 3
The introductory section and statistical section have not been subjected to the auditing procedures applied in the audit of the basic financial statements and, accordingly, we do not express an opinion or provide any assurance on them.
Other Reporting Required by Government Auditing Standards
In accordance with Government Auditing Standards, we have also issued our report dated November 15, 2018 on our consideration of the City’s internal control over financial reporting and on our tests of its compliance with certain provisions of laws, regulations, contracts, and grant agreements and other matters. The purpose of that report is to describe the scope of our testing of internal control over financial reporting and compliance and the results of that testing, and not to provide an opinion on internal control over financial reporting or on compliance. That report is an integral part of an audit performed in accordance with Government Auditing Standards in considering the City’s internal control over financial reporting and compliance.
Badawi and Associates Certified Public Accountants Oakland, California
November 15, 2018
3

4
MANAGEMENT’S DISCUSSION & ANALYSIS
Management of the City of San Mateo (City) offers readers of the financial statements this narrative overview and analysis of the financial activities of the City for the fiscal year ended June 30, 2018. Readers are encouraged to consider the information presented here in conjunction with additional information that is furnished in our letter of transmittal, the financial statements and notes. The focus of the information herein is on the primary government.
FINANCIAL HIGHLIGHTS
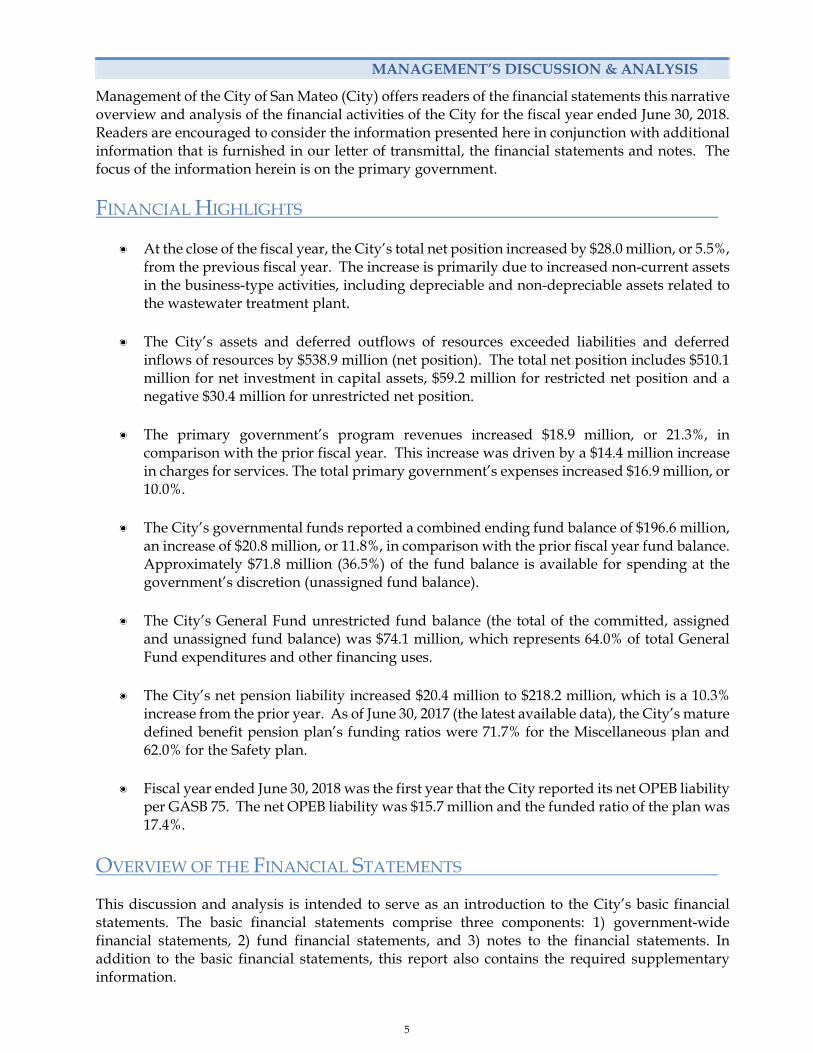
At the close of the fiscal year, the City’s total net position increased by $28.0 million, or 5.5%, from the previous fiscal year. The increase is primarily due to increased non-current assets in the business-type activities, including depreciable and non-depreciable assets related to the wastewater treatment plant.
The City’s assets and deferred outflows of resources exceeded liabilities and deferred
inflows of resources by $538.9 million (net position). The total net position includes $510.1 million for net investment in capital assets, $59.2 million for restricted net position and a negative $30.4 million for unrestricted net position.
The primary government’s program revenues increased $18.9 million, or 21.3%, in
comparison with the prior fiscal year. This increase was driven by a $14.4 million increase in charges for services. The total primary government’s expenses increased $16.9 million, or 10.0%.
The City’s governmental funds reported a combined ending fund balance of $196.6 million,
an increase of $20.8 million, or 11.8%, in comparison with the prior fiscal year fund balance. Approximately $71.8 million (36.5%) of the fund balance is available for spending at the government’s discretion (unassigned fund balance).
The City’s General Fund unrestricted fund balance (the total of the committed, assigned
and unassigned fund balance) was $74.1 million, which represents 64.0% of total General Fund expenditures and other financing uses.
The City’s net pension liability increased $20.4 million to $218.2 million, which is a 10.3% increase from the prior year. As of June 30, 2017 (the latest available data), the City’s mature defined benefit pension plan’s funding ratios were 71.7% for the Miscellaneous plan and 62.0% for the Safety plan.
Fiscal year ended June 30, 2018 was the first year that the City reported its net OPEB liability per GASB 75. The net OPEB liability was $15.7 million and the funded ratio of the plan was 17.4%.
OVERVIEW OF THE FINANCIAL STATEMENTS This discussion and analysis is intended to serve as an introduction to the City’s basic financial statements. The basic financial statements comprise three components: 1) government-wide financial statements, 2) fund financial statements, and 3) notes to the financial statements. In addition to the basic financial statements, this report also contains the required supplementary information.
5
MANAGEMENT’S DISCUSSION & ANALYSIS
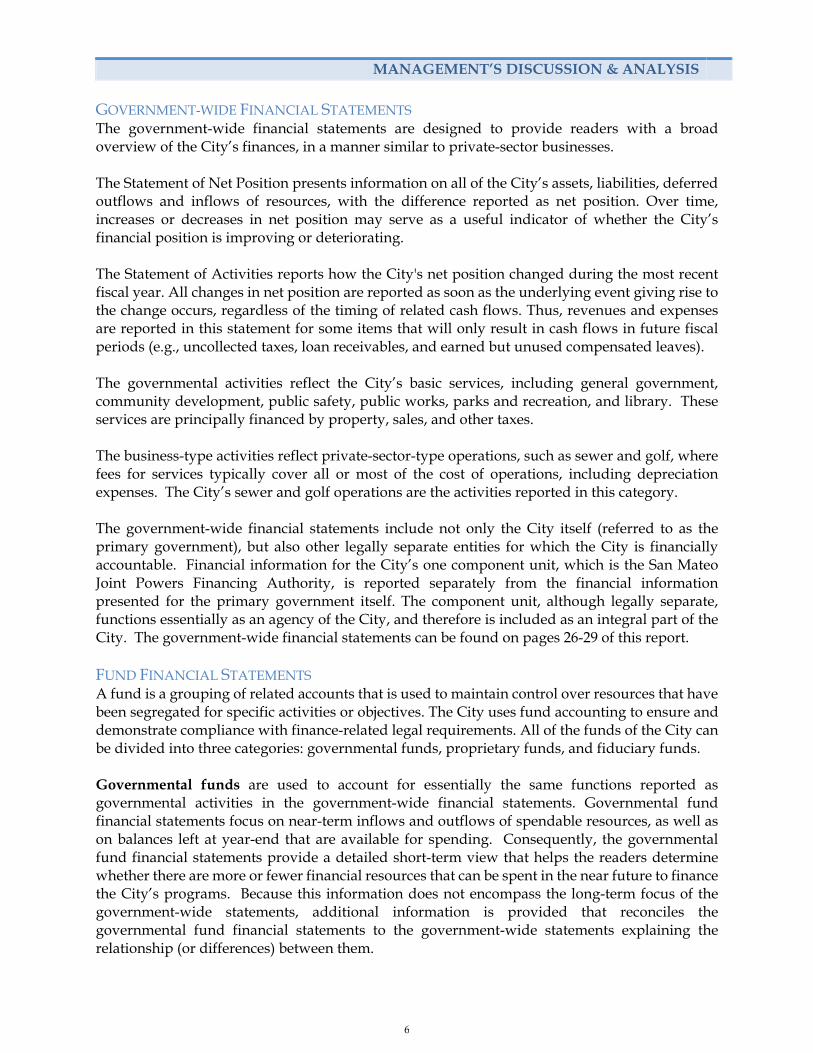
GOVERNMENT-WIDE FINANCIAL STATEMENTS The government-wide financial statements are designed to provide readers with a broad overview of the City’s finances, in a manner similar to private-sector businesses. The Statement of Net Position presents information on all of the City’s assets, liabilities, deferred outflows and inflows of resources, with the difference reported as net position. Over time, increases or decreases in net position may serve as a useful indicator of whether the City’s financial position is improving or deteriorating. The Statement of Activities reports how the City's net position changed during the most recent fiscal year. All changes in net position are reported as soon as the underlying event giving rise to the change occurs, regardless of the timing of related cash flows. Thus, revenues and expenses are reported in this statement for some items that will only result in cash flows in future fiscal periods (e.g., uncollected taxes, loan receivables, and earned but unused compensated leaves). The governmental activities reflect the City’s basic services, including general government, community development, public safety, public works, parks and recreation, and library. These services are principally financed by property, sales, and other taxes. The business-type activities reflect private-sector-type operations, such as sewer and golf, where fees for services typically cover all or most of the cost of operations, including depreciation expenses. The City’s sewer and golf operations are the activities reported in this category. The government-wide financial statements include not only the City itself (referred to as the primary government), but also other legally separate entities for which the City is financially accountable. Financial information for the City’s one component unit, which is the San Mateo Joint Powers Financing Authority, is reported separately from the financial information presented for the primary government itself. The component unit, although legally separate, functions essentially as an agency of the City, and therefore is included as an integral part of the City. The government-wide financial statements can be found on pages 26-29 of this report. FUND FINANCIAL STATEMENTS A fund is a grouping of related accounts that is used to maintain control over resources that have been segregated for specific activities or objectives. The City uses fund accounting to ensure and demonstrate compliance with finance-related legal requirements. All of the funds of the City can be divided into three categories: governmental funds, proprietary funds, and fiduciary funds. Governmental funds are used to account for essentially the same functions reported as governmental activities in the government-wide financial statements. Governmental fund financial statements focus on near-term inflows and outflows of spendable resources, as well as on balances left at year-end that are available for spending. Consequently, the governmental fund financial statements provide a detailed short-term view that helps the readers determine whether there are more or fewer financial resources that can be spent in the near future to finance the City’s programs. Because this information does not encompass the long-term focus of the government-wide statements, additional information is provided that reconciles the governmental fund financial statements to the government-wide statements explaining the relationship (or differences) between them.
6

MANAGEMENT’S DISCUSSION & ANALYSIS
The governmental funds comprise 19 individual funds. Information is presented separately in the governmental funds balance sheet and in the governmental funds statement of revenues, expenditures and changes in fund balances of the General, Capital Projects and Construction Services funds, each of which is considered to be a major fund. Data for the other 16 governmental funds are combined into a single aggregated presentation. Individual fund data for these non-major governmental funds is provided in the form of combining statements, beginning on page 137 of this report. The basic governmental fund financial statements can be found on pages 34-40 of this report. The City adopts an annual appropriated budget for the General Fund and all other governmental funds. Budgetary comparison schedules, beginning on page 142, have been provided to demonstrate compliance with these budgets in accordance with accounting principles generally accepted in the United States (U.S. GAAP). The City maintains two types of proprietary funds: enterprise and internal service. Enterprise funds are used to report the same functions presented as business-type activities in the government-wide financial statements. The City uses enterprise funds to account for its Sewer and Golf funds. Internal service funds are an accounting device used to accumulate and allocate costs internally among the City’s various functions. The City uses internal service funds to account for its general liability, fleet and building maintenance, vehicle and equipment replacement, workers compensation, dental, and other employee benefit programs. The internal service funds provide services that predominantly benefit governmental rather than business-type functions. They have been included within governmental activities to reflect the consolidation for internal services fund activities in the government-wide financial statements. Proprietary funds provide the same type of information as the government-wide financial statements, only in more detail. The proprietary fund financial statements provide separate information for the Sewer and Golf Funds. Data for the two enterprise funds and all of the internal service funds are combined into their respective single aggregated presentations. Individual fund data for the non-major internal service funds is provided in the form of combining statements elsewhere in this report. The basic proprietary fund financial statements can be found on pages 42-47 of this report. Fiduciary funds are used to account for resources held on behalf of outside parties, including other governments. When these assets are held under the terms of formal trust agreement, a private-purpose trust is used. The City maintains a private-purpose trust fund for the Successor Agency of the City of San Mateo Redevelopment Agency (Successor Agency). In addition, the City uses an agency fund for assets that the City is holding for the Community Facilities District No. 2008-01 (Bay Meadows). Fiduciary funds generally are used to account for assets that the City holds on behalf of others as their agent. Fiduciary funds are not reported in the government-wide financial statements because the resources of these funds are not available to support the City’s own programs. The accounting used for fiduciary funds is much like that used for proprietary funds. The basic fiduciary fund financial statements can be found on pages 50-51 of this report. Notes to the Basic Financial Statements provide additional information that is essential to a full understanding of the data provided in the government-wide and fund financial statements. The notes to the basic financial statements can be found on pages 54-123 of this report.
7

MANAGEMENT’S DISCUSSION & ANALYSIS
Other information in addition to the basic financial statements and accompanying notes is presented in the form of certain required supplementary information concerning the City’s budgetary comparison schedules for all major governmental funds and the City’s progress in funding its obligation for the provision of pension and other post-employment benefits to its employees. The combining statements supplementary information referred to earlier in connection with non-major funds and internal services funds are also presented in this section. Required supplementary information can be found on pages 126-134 of this report.
GOVERNMENT-WIDE FINANCIAL ANALYSIS
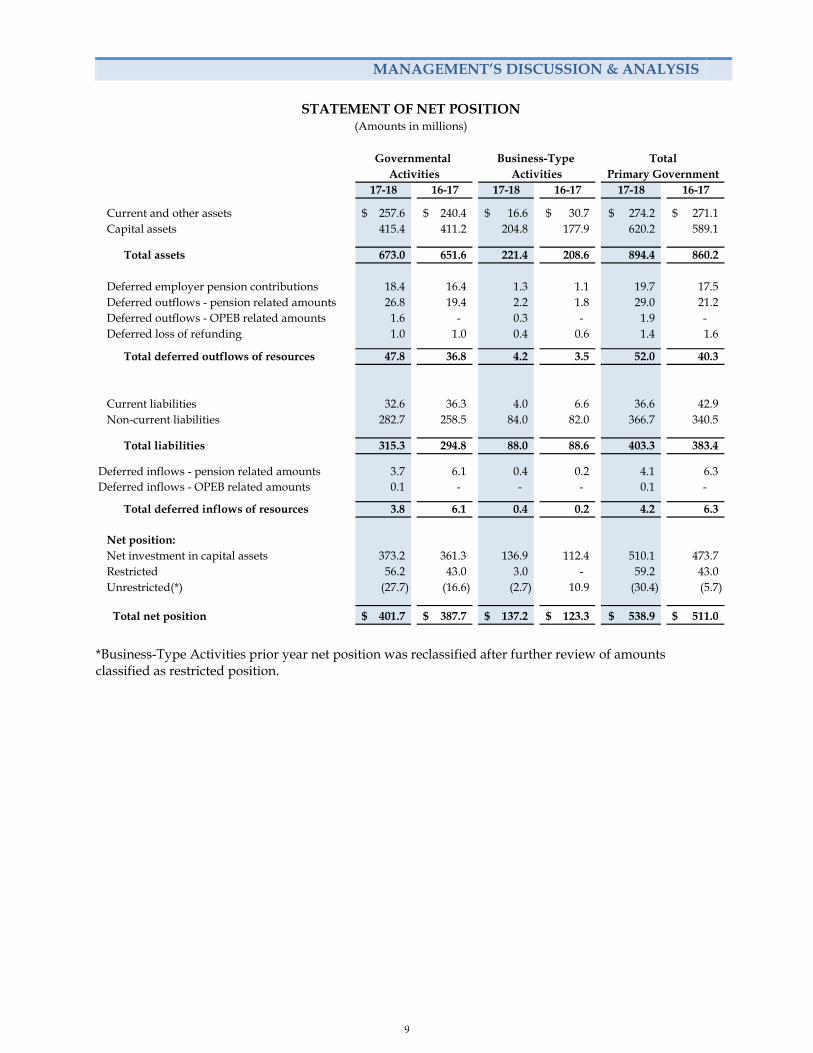
As noted earlier, net position may serve over time as a useful indicator of a government's financial performance. At the close of the fiscal year, the City’s assets and deferred outflows exceeded liabilities and deferred inflows of resources by $538.9 million, a 5.5 percent increase from the prior year. As of June 30, 2018, the City reported positive balances in all categories of net position for the government as a whole except for unrestricted net position. The negative unrestricted net position was predominantly the result of the implementation of GASB Statements No. 68, 71, and 75. Please refer to the notes to basic financial statements for more information about the impact of the implementation of these statements.
The biggest portion of the City’s net position, $510.1 million, reflects its net investment in capital assets (e.g., land, buildings, infrastructure, machinery and equipment), less any related debt used to acquire those assets that is still outstanding. The City uses these capital assets to provide services to citizens; consequently, these assets are not available for future spending. Although the City’s investment in its capital assets is reported net of related debt, it should be noted that the resources needed to repay this debt must be provided from other sources, since the capital assets themselves cannot be used to liquidate these liabilities. The City also reported $59.2 million in restricted net position. These are resources subject to external restrictions as to how they may be used, such as housing and economic development, capital projects, debt service and other purposes. Another portion of the City’s net position, a negative $30.4 million, is unrestricted. This includes the City’s total net pension liability of $218.2 million, which is not a claim on current financial assets. The total net pension liability increased $20.4 million, or 10.3%, from the prior fiscal year. The City has two agent multiple-employer defined benefit pension plans with California Public Employees’ Retirement System. The Miscellaneous plan’s net pension liability increased $6.1 million, or 9.2%, to $72.6 million. Its funding ratio decreased to 71.7% from 71.9% in the prior fiscal year. The Safety plan’s net pension liability increased $14.2 million, or 10.8%, to $145.6 million. Its funding ratio decreased to 62.0% from 62.3% in the prior fiscal year. Tables on the following pages present a summary and net changes of the City’s net position as of June 30, 2017 and June 30, 2018.
8
MANAGEMENT’S DISCUSSION & ANALYSIS
17-18 16-17 17-18 16-17 17-18 16-17
Current and other assets 257.6$ 240.4$ 16.6$ 30.7$ 274.2$ 271.1$ Capital assets 415.4 411.2 204.8 177.9 620.2 589.1
Total assets 673.0 651.6 221.4 208.6 894.4 860.2
Deferred employer pension contributions 18.4 16.4 1.3 1.1 19.7 17.5 Deferred outflows - pension related amounts 26.8 19.4 2.2 1.8 29.0 21.2 Deferred outflows - OPEB related amounts 1.6 - 0.3 - 1.9 - Deferred loss of refunding 1.0 1.0 0.4 0.6 1.4 1.6
Total deferred outflows of resources 47.8 36.8 4.2 3.5 52.0 40.3
Current liabilities 32.6 36.3 4.0 6.6 36.6 42.9 Non-current liabilities 282.7 258.5 84.0 82.0 366.7 340.5
Total liabilities 315.3 294.8 88.0 88.6 403.3 383.4
Deferred inflows - pension related amounts 3.7 6.1 0.4 0.2 4.1 6.3 Deferred inflows - OPEB related amounts 0.1 - - - 0.1 -
Total deferred inflows of resources 3.8 6.1 0.4 0.2 4.2 6.3
Net position:Net investment in capital assets 373.2 361.3 136.9 112.4 510.1 473.7 Restricted 56.2 43.0 3.0 - 59.2 43.0 Unrestricted(*) (27.7) (16.6) (2.7) 10.9 (30.4) (5.7)
Total net position 401.7$ 387.7$ 137.2$ 123.3$ 538.9$ 511.0$
Activities Activities Primary Government
STATEMENT OF NET POSITION(Amounts in millions)
Governmental Business-Type Total
*Business-Type Activities prior year net position was reclassified after further review of amounts classified as restricted position.
9

MANAGEMENT’S DISCUSSION & ANALYSIS
17-18 16-17 17-18 16-17 17-18 16-17Revenues:
Program revenues:Charges for services 42.9$ 38.6$ 44.1$ 34.0$ 87.0$ 72.6$ Operating grants and contributions 6.5 4.9 - - 6.5 4.9 Capital grants and contributions 12.3 7.4 2.6 4.6 14.9 12.0
General revenues:58.1 53.0 - - 58.1 53.0 26.3 26.0 - - 26.3 26.0 11.8 12.2 - - 11.8 12.2 14.9 14.6 - - 14.9 14.6
3.2 3.1 - - 3.2 3.1 - 0.1 - - - 0.1
Property taxesSales taxesProperty transfer taxes Business, hotel & other taxes Franchise taxesMotor vehicle taxesInvestment earnings 1.5 1.0 0.2 0.1 1.7 1.1
Total revenues 177.5 160.9 46.9 38.7 224.4 199.6
Expenses:General government 16.3 15.3 - - 16.3 15.3 Community development 9.0 9.2 - - 9.0 9.2 Public safety 78.0 66.1 - - 78.0 66.1 Public works 22.9 19.5 - - 22.9 19.5 Parks and recreation 17.7 17.7 - - 17.7 17.7 Library 8.4 8.6 - - 8.4 8.6 Interest on long term debt 1.3 1.6 - - 1.3 1.6 Sewer - - 28.5 27.7 28.5 27.7 Golf - - 3.2 2.7 3.2 2.7
Total expenses 153.6 138.0 31.7 30.4 185.3 168.4
Increase (decrease) in net position beforespecial items and transfers 23.9 22.9 15.2 8.3 39.1 31.2
Transfers (0.5) (0.9) 0.5 0.9 - - Total transfers (0.5) (0.9) 0.5 0.9 - -
Change in net position 23.4 22.0 15.7 9.2 39.1 31.2
Net position - Beginning of Year (restated)* 378.3 365.7 121.5 114.1 499.8 479.8 Net position - End of year 401.7$ 387.7$ 137.2$ 123.3$ 538.9$ 511.0$
STATEMENT OF ACTIVITIES(Amounts in millions)
Activities ActivitiesGovernmental Business-Type
Primary GovernmentTotal
*Restated due to implementation of GASB Statement 75. Fiscal year 2016-17 amounts have not beenrestated. See Note 14 for additional information.
10
MANAGEMENT’S DISCUSSION & ANALYSIS
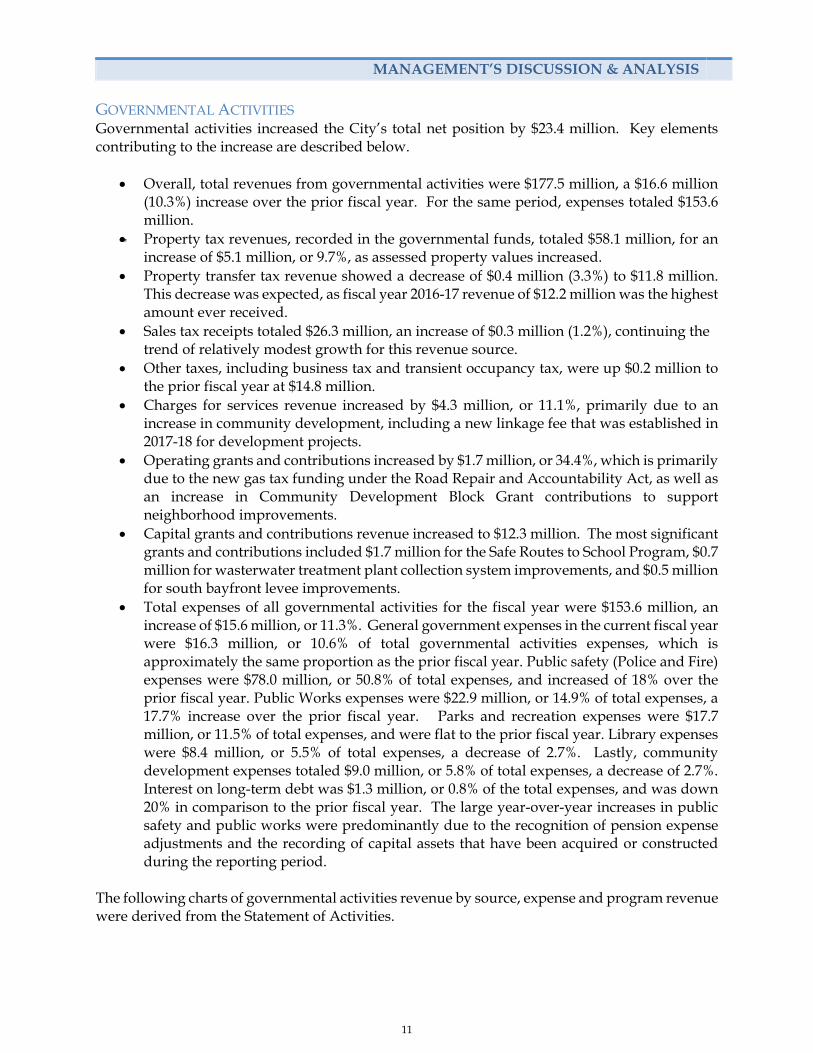
GOVERNMENTAL ACTIVITIES Governmental activities increased the City’s total net position by $23.4 million. Key elements contributing to the increase are described below.
Overall, total revenues from governmental activities were $177.5 million, a $16.6 million (10.3%) increase over the prior fiscal year. For the same period, expenses totaled $153.6 million.
Property tax revenues, recorded in the governmental funds, totaled $58.1 million, for an increase of $5.1 million, or 9.7%, as assessed property values increased.
Property transfer tax revenue showed a decrease of $0.4 million (3.3%) to $11.8 million. This decrease was expected, as fiscal year 2016-17 revenue of $12.2 million was the highest amount ever received.
Sales tax receipts totaled $26.3 million, an increase of $0.3 million (1.2%), continuing the trend of relatively modest growth for this revenue source.
Other taxes, including business tax and transient occupancy tax, were up $0.2 million to the prior fiscal year at $14.8 million.
Charges for services revenue increased by $4.3 million, or 11.1%, primarily due to an increase in community development, including a new linkage fee that was established in 2017-18 for development projects.
Operating grants and contributions increased by $1.7 million, or 34.4%, which is primarily due to the new gas tax funding under the Road Repair and Accountability Act, as well as an increase in Community Development Block Grant contributions to support neighborhood improvements.
Capital grants and contributions revenue increased to $12.3 million. The most significant grants and contributions included $1.7 million for the Safe Routes to School Program, $0.7 million for wasterwater treatment plant collection system improvements, and $0.5 million for south bayfront levee improvements.
Total expenses of all governmental activities for the fiscal year were $153.6 million, an increase of $15.6 million, or 11.3%. General government expenses in the current fiscal year were $16.3 million, or 10.6% of total governmental activities expenses, which is approximately the same proportion as the prior fiscal year. Public safety (Police and Fire) expenses were $78.0 million, or 50.8% of total expenses, and increased of 18% over the prior fiscal year. Public Works expenses were $22.9 million, or 14.9% of total expenses, a 17.7% increase over the prior fiscal year. Parks and recreation expenses were $17.7 million, or 11.5% of total expenses, and were flat to the prior fiscal year. Library expenses were $8.4 million, or 5.5% of total expenses, a decrease of 2.7%. Lastly, community development expenses totaled $9.0 million, or 5.8% of total expenses, a decrease of 2.7%. Interest on long-term debt was $1.3 million, or 0.8% of the total expenses, and was down 20% in comparison to the prior fiscal year. The large year-over-year increases in public safety and public works were predominantly due to the recognition of pension expense adjustments and the recording of capital assets that have been acquired or constructed during the reporting period.
The following charts of governmental activities revenue by source, expense and program revenue were derived from the Statement of Activities.
11

MANAGEMENT’S DISCUSSION & ANALYSIS
The cost of all governmental activities for the fiscal year ended June 30, 2018 was $153.6 million. Some of the costs were paid by those directly benefiting from the programs ($42.9 million), by other governments and organizations which subsidized programs with operating grants and contributions ($6.5 million) or capital grants and contributions ($12.3 million). The City paid for the remaining “public benefit” portion of governmental activities with $91.9 million in taxes (some of which could only be used for certain programs) and investment earnings of $1.5 million.
Charges for services24.2%
Operating grants and contributions
3.7%
Capital grants and contributions
6.9%
Property taxes32.7%
Sales taxes14.8%
Property transfer taxes
6.6%
Business, hotel & other taxes
8.3%Franchise Taxes1.8%
Other revenue0.9%
Revenue by SourcesGovernmental Activities
Fiscal Year Ended June 30, 2018
Total Governmental Activities Revenues: $177.5 million
$0
$10,000,000
$20,000,000
$30,000,000
$40,000,000
$50,000,000
$60,000,000
$70,000,000
$80,000,000
GeneralGovernment
CommunityDevelopment
Public Safety Public Works Parks &Recreation
Library Interest onLong‐term
Debt
Expenses and Program RevenuesGovernmental Activities
Fiscal Year Ended June 30, 2018
Expenses Program Revenue
12

MANAGEMENT’S DISCUSSION & ANALYSIS
BUSINESS-TYPE ACTIVITIES Business-type activities increased the City’s net position by $15.8 million. Key elements contributing to the increase are described below.
Total program revenues of $46.7 million were $8.2 million higher, or 21.3% compared with the prior year. The increase was predominantly due to the 36% increase in sewer service charges that were required to fund the Clean Water Program’s capital needs.
Charges for services, the amount paid by users of the enterprises, totaled $44.1 million, or 94.0% of total revenues. Charges for services were $10.2 million, or 29.9%, higher than the prior year and reflect the rate increases discussed above.
Capital grants and contributions for Sewer enterprise were $2.6 million, a decrease of $2.0 million, or 43.5%, over the prior year, which was primarily due to a decrease in capital grants received this year over last year.
The golf enterprise program revenues were $2.4 million, an increase of $0.2 million, while total expenses (including interest expense on debt) increased by $0.4 million to $3.1 million. During the current fiscal year, $450,000 was transferred from General Fund to cover deficits. With golf operations continuing to require General Fund support, these operations will be moved into the General Fund starting with the 2018-19 fiscal year.
The following charts of business-type activities revenue by source, expense and program revenues were derived from the Statement of Activities.
13

MANAGEMENT’S DISCUSSION & ANALYSIS
Total expenses of all business-type activities for the fiscal year ended June 30, 2018 were $31.7 million, an increase of $1.3 million, or 4.3%, compared to the prior year. Of the total increase in expenses compared to the prior year, Sewer Fund expenses increased by $0.8 million, or 2.9%, and Golf Fund expenses increased by $0.4 million, or 14.8%. The increase in Golf Fund expenses was primarily due to costs related to refinancing the outstanding revenue bonds into more favorable terms, higher staffing costs (per-diem) to support golf course maintenance, accrued compensation leave expenses, and pension expenses (GASB 68 adjustment). Cash and investments of business-type activities totaled $6.2 million, a decrease of $15.1 million compared to the prior year. During fiscal year 2017-18, the City opted to cash fund its sewer-related capital to the extent possible. The City opted to do this because interest rates on borrowed funds, including the line of credit, are higher than the City is earning on its pooled investment portfolio. As available cash is drawn down, the City will resume drawing on the line of credit to fund sewer capital until it seeks longer-term financing as project expenses accelerate. Non-depreciable assets totaling $83.3 million increased by $31 million, reflecting increased Sewer capital projects construction activities for the sewer collection and treatment systems during the fiscal year.
FINANCIAL ANALYSIS OF THE CITY’S FUNDS As noted earlier, the City uses fund accounting to ensure and demonstrate compliance with finance related legal requirements.
$0
$10,000,000
$20,000,000
$30,000,000
$40,000,000
Sewer Golf
Expenses and Program RevenuesBusiness-Type Activities
Fiscal Year ended June 30, 2018
Expenses Program Revenue
14

MANAGEMENT’S DISCUSSION & ANALYSIS
GOVERNMENTAL FUNDS The focus of the City’s governmental funds is to provide information on current year revenues, expenditures, and balances of spendable resources. Such information is useful in assessing the City’s near-term financing requirements. In particular, unassigned fund balance may serve as a useful measure of a government’s net resources available for spending at the end of the fiscal year. As of June 30, 2018, the City’s governmental funds reported a combined ending fund balance of $196.6 million, an increase of $20.8 million, or 11.8% over the prior fiscal year. Of the total fund balances, $71.8 million is unassigned fund balance, which is available for spending at the City’s discretion. The General Fund is the chief operating fund of the City. The unassigned fund balance of the General Fund was $71.8 million, while the total fund balance was $75.5 million. As a measure of liquidity, both unassigned fund balance and total fund balance can be compared to total fund expenditures. Unassigned fund balance represents 64.6% of total General Fund expenditures of $111.1 million, while total fund balance represents 68.0% of the same amount. The City Council policy goal is to have reserves of at least three months of budgeted operating expenditures, which for the fiscal year 2018-19 is projected to be $29 million. This means the City’s unrestricted fund balance is well above the policy goal. The total fund balance of the City’s General Fund increased by $8.4 million, or 12.5%. The increase in fund balance was primarily due to continued growth of property tax and property transfer tax revenues, as well as expenditures falling below the budgeted amounts. Total General Fund expenditures finished $1.0 million lower than final budget amounts, including encumbered amounts. For the year, the General Fund’s total revenue exceeded expenditures by $12.1 million, before other financing uses of $6.1 million. The net other financing uses amount was primarily transfers out for capital projects. Most revenue categories recorded increases in the fiscal year. Certain revenues in the General Fund that increased significantly between fiscal years 2017 and 2018 include:
Property taxes were higher by $5.1 million (10.1%), primarily due to improving property values and high demand for real estate.
Intergovernmental revenues were higher by $0.5 million (19.8%), primarily due to reimbursements that resulted from more fire deployments that occurred during the year.
Total General Fund expenditures, including encumbered amounts, increased $6.9 million (6.6%) to $112.0 million. The primary drivers of the year-over-year expenditure increase were personnel, pension and healthcare costs. The General Capital Projects Fund was established to account for the City’s major infrastructure improvement needs and other capital projects. At the end of the fiscal year, the total fund balance was $32.6 million, decreased by $6.8 million, or 17.3%, over the prior fiscal year. Total expenditures and transfers out totals were $28.5 million and were spent on completion of various capital projects, such as $6.7 million for city-wide street rehabilitation and reconstruction, $4.6 million for city-wide bikeway and pedestrian walkway projects, $1.1 million for the rail corridor grade separation project, $1.1 million for improvements to city buildings, and $0.6 million for
15

MANAGEMENT’S DISCUSSION & ANALYSIS
city-wide park improvements and play area upgrades. These costs were offset by capital project revenues, loan proceeds and transfers in totaling $21.7 million. The Construction Services Fund was established to account for building permit revenue and expenditures for activities relating to the review of private development projects to achieve long-term economic growth in the City. At the end of the fiscal year, the total fund balance was $37.9 million, an increase of $6.5 million, or 20.7%, over the prior fiscal year. The primary reasons for the increase were the continuing improvement of the local economy and the high volume of residential and commercial development activity, particularly large-scale projects such as the Franklin Templeton expansion and Bay Meadows. The fund balance in the Non-Major Governmental Funds totaled $50.6 million, an increase of $12.6 million, or 33.2%, over the prior fiscal year. Revenues and transfers in totaling $35.8 million increased by $17.5 million, or 95.6%, while total expenditures and transfers out of $23.2 million increased by $4.8 million, or 26.1%. The significant increase in resources was primarily due to certain fund balances being moved into new non-major governmental funds from the General Capital Projects Fund, and revenues from a new linkage fee that was established during the year. PROPRIETARY FUNDS Proprietary Funds are comprised of enterprise funds and internal service funds. The City proprietary funds provide the same type of information found in the government-wide financial statements, but with some additional details. The City has two enterprise operations, sewer and golf. Total enterprise fund net position was $137.2 million, an increase of $13.9 million, or 11.3%, over the prior fiscal year net position. The unrestricted net position of the Sewer Enterprise Fund at the end of the fiscal year was negative $1.3 million, which is a reduction of nearly $11.3 million in unrestricted net position from the prior fiscal year. This is due primarily to an increase in the net pension liability and increase in capital assets. Overall net position in this fund increased $16.1 million year-over-year, with much of that attributable to an increase in capital assets. And while the cash position of this fund is lower than is typical, it is important to note that the City has access to a $70 million line of credit for Clean Water Program projects related to the Sewer Enterprise and has only utilized $5 million of those funds through the fiscal year ended June 30, 2018. The unrestricted net position of the Golf Enterprise Fund was negative $1.4 million. The Golf enterprise recorded a loss of $0.5 million before contributions and transfers. Its operating revenues were $2.4 million, an increase of $0.2 million, while total expenses, including interest expense, increased $0.4 million to $3.1 million. An $0.45 million contribution from the General Fund improved the enterprise’s net position, which closed the year at negative $1.8 million. The following table shows actual revenues, expenses and the results of operations for the current fiscal year in the City’s enterprise funds (in millions). This shows that the total net position for these funds increased by approximately $15.8 million due to current year financial activities. Reasons for this change are discussed in the previous section on the City’s business-type activities.
16

MANAGEMENT’S DISCUSSION & ANALYSIS
Total internal service funds’ net position of $27.8 million increased $0.4 million, or 1.5%, from the prior year. The Vehicle & Equipment Replacement Fund’s net position comprises 87.4% of the total internal service funds’ net position, followed by the Comprehensive Liability Fund, comprising of 9.7% of the total. The current year increase in net position of the internal service funds is due to a variety of factors that are discussed in more detail below. The Workers’ Compensation Insurance Fund’s net position of negative $1.4 million was flat to last fiscal year’s net position, as revenues and expenses generally met expectations for the year. Going forward, the City has increased collection rates from the funds covered by this particular internal services fund to bring the net position of this fund back into a positive position. The Comprehensive Liability Insurance Fund’s net position was $2.7 million, an increase of $0.5 million, or 22.7%. This was primarily due to $0.5 million in operating income generated through lower-than-projected operating expenses. Because of this fund’s healthy financial position, collection rates going forward have been slightly reduced to help offset collection rate increases in the Workers’ Compensation Insurance Fund. The Vehicle & Equipment Replacement Fund’s net position decreased by $0.2 million, or 0.8%, over the previous year. Funds continue to be collected in this fund to ensure vehicle replacements can occur as scheduled. The Fleet & Building Maintenance Fund’s net position was reduced by $0.7 million over the previous year as a result of expected increases in expenses in the fund to cover the cost of various projects at city facilities, as well as a planned reduction in net position. The combined net position for the Dental and Benefits Funds increased by $0.8 million, or 66.7%, and reflects the concerted effort on the City’s part to build the cash reserves in these funds to allow for capacity to absorb unexpected increases in medical and/or dental premiums without needing additional General Fund contributions.
GENERAL FUND BUDGETARY HIGHLIGHTS The City’s final budget differs from the original adopted budget in that revenues were adjusted upward by $1.0 million, expenditures were adjusted upward by $3.4 million, and transfers out increased by $0.2 million. In total, the final 2017-18 budget for the General Fund reflected a net deficit of $2.3 million, as revenue/transfer in estimates of $119.2 million were less than amended appropriations of $113.0 million and net transfers out of $8.5 million. Following is a summary of General Fund budgetary comparison schedule (amounts in millions).
Operating Non-Operating Capital Interfund Change in
Operating Operating Income Revenues Contributions Transfers Net
Revenues Expenses (Loss) (Expenses) and Others Net Position
Sewer 41.7$ 26.0$ 15.7$ (2.3)$ 2.6$ 0.1$ 16.1$
Golf 2.4 2.9 (0.5)$ (0.3) 0.0 0.5 (0.3)
Total 44.1$ 28.9$ 15.2$ (2.6)$ 2.6$ 0.6$ 15.8$
17
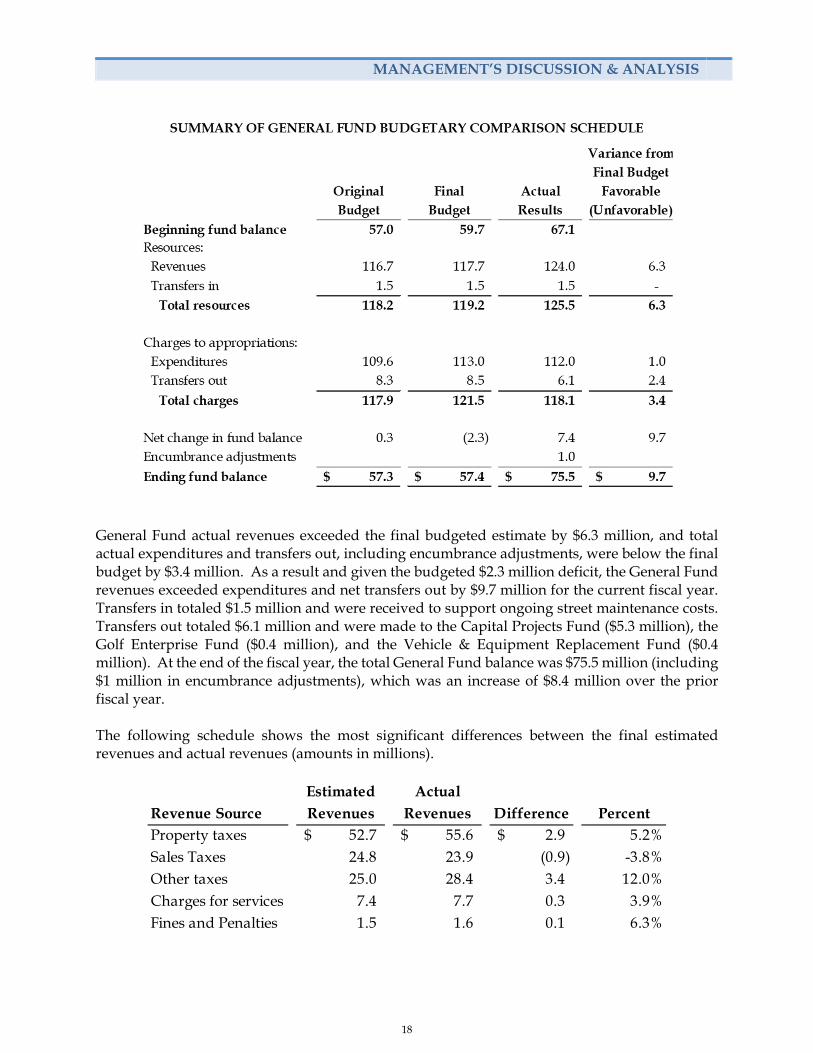
MANAGEMENT’S DISCUSSION & ANALYSIS
General Fund actual revenues exceeded the final budgeted estimate by $6.3 million, and total actual expenditures and transfers out, including encumbrance adjustments, were below the final budget by $3.4 million. As a result and given the budgeted $2.3 million deficit, the General Fund revenues exceeded expenditures and net transfers out by $9.7 million for the current fiscal year. Transfers in totaled $1.5 million and were received to support ongoing street maintenance costs. Transfers out totaled $6.1 million and were made to the Capital Projects Fund ($5.3 million), the Golf Enterprise Fund ($0.4 million), and the Vehicle & Equipment Replacement Fund ($0.4 million). At the end of the fiscal year, the total General Fund balance was $75.5 million (including $1 million in encumbrance adjustments), which was an increase of $8.4 million over the prior fiscal year. The following schedule shows the most significant differences between the final estimated revenues and actual revenues (amounts in millions).
Estimated ActualRevenue Source Revenues Revenues Difference PercentProperty taxes 52.7$ 55.6$ 2.9$ 5.2%Sales Taxes 24.8 23.9 (0.9) -3.8%Other taxes 25.0 28.4 3.4 12.0%Charges for services 7.4 7.7 0.3 3.9%Fines and Penalties 1.5 1.6 0.1 6.3%
18
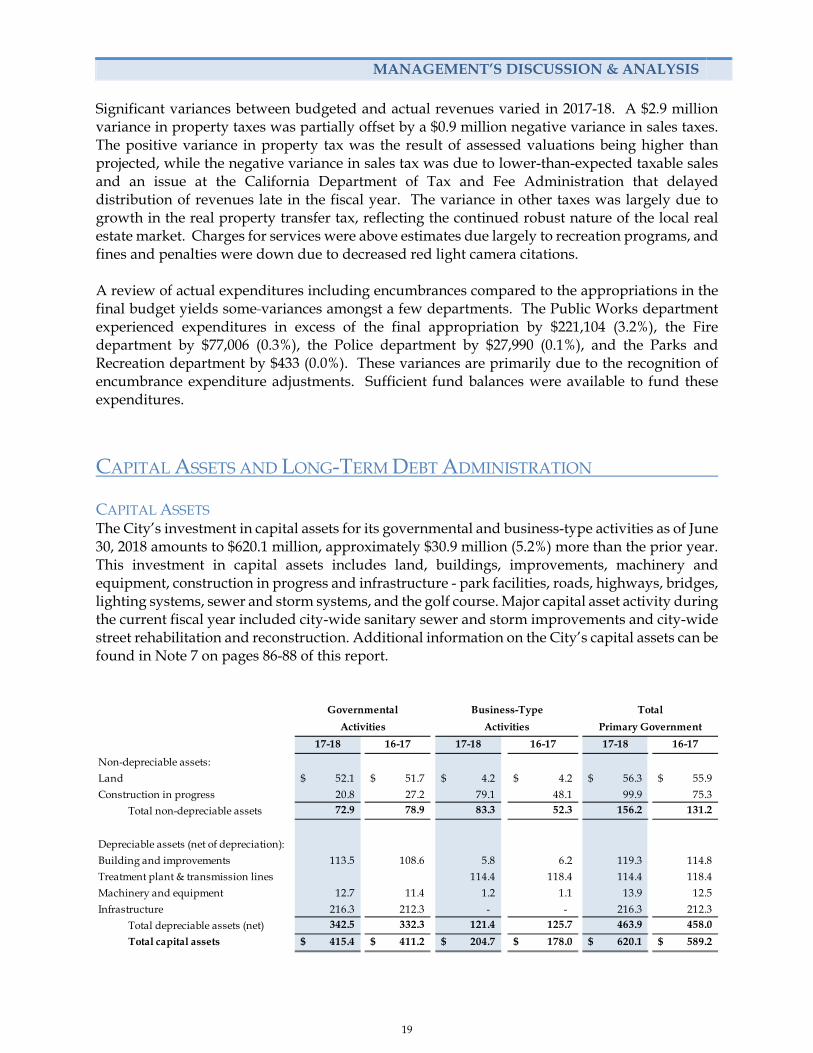
MANAGEMENT’S DISCUSSION & ANALYSIS
Significant variances between budgeted and actual revenues varied in 2017-18. A $2.9 million variance in property taxes was partially offset by a $0.9 million negative variance in sales taxes. The positive variance in property tax was the result of assessed valuations being higher than projected, while the negative variance in sales tax was due to lower-than-expected taxable sales and an issue at the California Department of Tax and Fee Administration that delayed distribution of revenues late in the fiscal year. The variance in other taxes was largely due to growth in the real property transfer tax, reflecting the continued robust nature of the local real estate market. Charges for services were above estimates due largely to recreation programs, and fines and penalties were down due to decreased red light camera citations. A review of actual expenditures including encumbrances compared to the appropriations in the final budget yields some variances amongst a few departments. The Public Works department experienced expenditures in excess of the final appropriation by $221,104 (3.2%), the Fire department by $77,006 (0.3%), the Police department by $27,990 (0.1%), and the Parks and Recreation department by $433 (0.0%). These variances are primarily due to the recognition of encumbrance expenditure adjustments. Sufficient fund balances were available to fund these expenditures.
CAPITAL ASSETS AND LONG-TERM DEBT ADMINISTRATION CAPITAL ASSETS The City’s investment in capital assets for its governmental and business-type activities as of June 30, 2018 amounts to $620.1 million, approximately $30.9 million (5.2%) more than the prior year. This investment in capital assets includes land, buildings, improvements, machinery and equipment, construction in progress and infrastructure - park facilities, roads, highways, bridges, lighting systems, sewer and storm systems, and the golf course. Major capital asset activity during the current fiscal year included city-wide sanitary sewer and storm improvements and city-wide street rehabilitation and reconstruction. Additional information on the City’s capital assets can be found in Note 7 on pages 86-88 of this report.
17-18 16-17 17-18 16-17 17-18 16-17
Non-depreciable assets:
Land 52.1$ 51.7$ 4.2$ 4.2$ 56.3$ 55.9$
Construction in progress 20.8 27.2 79.1 48.1 99.9 75.3
Total non-depreciable assets 72.9 78.9 83.3 52.3 156.2 131.2
Depreciable assets (net of depreciation):
Building and improvements 113.5 108.6 5.8 6.2 119.3 114.8
Treatment plant & transmission lines 114.4 118.4 114.4 118.4
Machinery and equipment 12.7 11.4 1.2 1.1 13.9 12.5
Infrastructure 216.3 212.3 - - 216.3 212.3
Total depreciable assets (net) 342.5 332.3 121.4 125.7 463.9 458.0
Total capital assets 415.4$ 411.2$ 204.7$ 178.0$ 620.1$ 589.2$
Activities Activities Primary Government
Governmental Business-Type Total
19

MANAGEMENT’S DISCUSSION & ANALYSIS
LONG-TERM DEBT At the end of the current fiscal year, the City had total long-term debt outstanding of $114.1 million. Of this amount, $23.5 million comprises debt backed by the full faith and credit of the City. The remainder of outstanding debt is primarily composed of bonds secured by specified revenue sources; e.g., sewer charges, and loans.
The City’s rating for General Obligation Bonds is AA+ from Standard & Poor’s and Aaa from Moody’s. Standard & Poor’s has assigned a rating of Aa2 for the City’s revenue bonds. The Redevelopment Successor Agency’s underlying rating for its series 2007A, 2015A and 2015B merged area and housing Tax Allocation Bonds is A by Standard & Poor’s. State statutes limit the amount of general obligation debt a governmental entity may issue to 15% of its total assessed valuation. The current debt limitation for the City is approximately $3.8 billion, and at June 30, 2018 the City was only at 0.62% of its legal debt limit. Additional information on the City of San Mateo’s long-term debt can be found in Note 8 on pages 89-102 of this report.
ECONOMIC FACTORS AND NEXT YEAR’S BUDGET The strong local economy continues to be driven by low unemployment and a robust real estate market. The unemployment rate in the City of San Mateo is down to 2.1% as of June 2018, which is a 0.5% decrease from last June’e 2.6% rate. The City is slightly outpacing the County of San Mateo (2.2%) in this area and is doing much better than the State of California (4.2%) in the aggregate. The local job market is fueling the high demand for real estate, both commercial and residential, which is driving up sale prices and transaction volume, as well as increasing assessed valuations. The residential market, which makes up over 75 percent of the assessed value in San Mateo, has been particularly strong. In the second quarter of 2018, the median sale price of single-family residential homes was nearly $1.6 million. This is an increase of nearly 15 percent from the same quarter of 2017. Total assessed value also grew significantly year-over-year, reaching $24.5 billion, a 8.4 percent increase. The robust economic activity locally continues to contribute to an increased revenue base for the General Fund. The adopted 2018-19 General Fund budget is the first year of the City’s bi-annual budget, and total General Fund revenue projections are 3.3 percent above final revenue estimates
17-18 16-17 17-18 16-17 17-18 16-17
General Obligation Bonds 23.53$ 24.90$ -$ -$ 23.53$ 24.90$
Revenue Bonds 19.50 26.03 63.14 65.00 82.64 91.03
Loans payable 2.94 0.87 5.00 5.00 7.94 5.87 Total outstanding debt 45.97 51.80 68.14 70.00 114.11 121.80
Activities Activities Primary Government
OUTSTANDING DEBTGeneral Obligation and Revenue Bonds
(Amounts in millions)
Governmental Business-Type Total
20

MANAGEMENT’S DISCUSSION & ANALYSIS
for 2017-18; however, $2.3 million of the $4.1 million increase is the result of the golf operation being moved into the General Fund starting in 2018-19. Without that infusion of revenue, and corresponding expenditure, the increase in revenues would have been 1.3 percent. This minimal projected increase is predominantly due to the reduction in the projection for the real property transfer tax to reflect the expectation that current revenue levels are not expected to be sustainable. Otherwise, projections call for modest growth for most of the General Fund’s revenue sources., with one exception being the transient occupancy tax, which assumes flat revenues in 2018-19 based on current trends. Given that it was the first year of the two-year operating budget cycle, the 2018-19 budget reflects modest increases to service levels that were identified as Council priorities during the budget development process. These priority increases, which were limited due to concerns about sustainability, included areas such as public safety communications, downtown, emergency preparedness, and street maintenance. Other expenditure growth in General Fund operations reflects increases in personnel costs to account for negotiated salary increases, as well as increases to pension and health premium costs. Assumed increases in personnel costs have been incorporated into the long-term forecast beyond 2018-19, and the rate of these increases will continue to put pressure on the General Fund’s ability to maintain existing service levels, especially with the projected increases in pension expenses. Overall, the adopted 2018-19 General Fund budget reflects revenues over expenditures in the amount of $57,000. Total revenues and transfers in are budgeted at $127.4 million, while total expenditures and transfers out are budgeted at $127.3 million, with an estimated total ending fund balance of $71.2 million. Of this amount, $29.0 million represents the General Fund’s operating reserve, which is set at 25% of budget operating expenditures per Council’s reserve policy. This reserve, as well as the amount in excess of the reserve being held in fund balance, is just one example of the City’s fiscal discipline that has assisted in achieving its financial objectives.
REQUESTS FOR INFORMATION
This financial report is designed to provide a general overview of the City of San Mateo’s finances for all those with an interest in the government's finances. Questions concerning any of the information provided in this report or requests for additional financial information should be addressed to the Finance Director, 330 West 20th Avenue, San Mateo, California, 94403.
21

22

BASIC FINANCIAL STATEMENTS
23

24

GOVERNMENT-WIDE FINANCIAL STATEMENTS
25
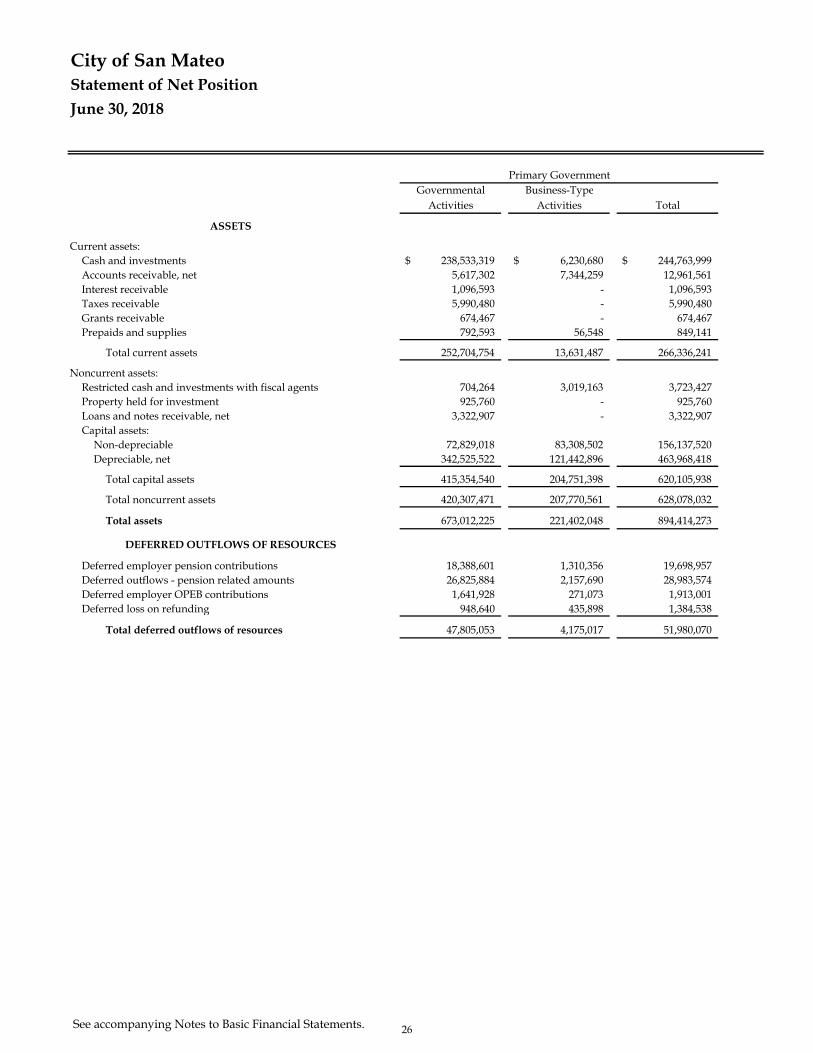
City of San MateoStatement of Net Position
June 30, 2018
Governmental Business-TypeActivities Activities Total
ASSETS
Current assets:Cash and investments 238,533,319$ 6,230,680$ 244,763,999$ Accounts receivable, net 5,617,302 7,344,259 12,961,561 Interest receivable 1,096,593 - 1,096,593 Taxes receivable 5,990,480 - 5,990,480 Grants receivable 674,467 - 674,467 Prepaids and supplies 792,593 56,548 849,141
Total current assets 252,704,754 13,631,487 266,336,241
Noncurrent assets:Restricted cash and investments with fiscal agents 704,264 3,019,163 3,723,427 Property held for investment 925,760 - 925,760 Loans and notes receivable, net 3,322,907 - 3,322,907 Capital assets:
Non-depreciable 72,829,018 83,308,502 156,137,520 Depreciable, net 342,525,522 121,442,896 463,968,418
Total capital assets 415,354,540 204,751,398 620,105,938
Total noncurrent assets 420,307,471 207,770,561 628,078,032
Total assets 673,012,225 221,402,048 894,414,273
DEFERRED OUTFLOWS OF RESOURCES
Deferred employer pension contributions 18,388,601 1,310,356 19,698,957 Deferred outflows - pension related amounts 26,825,884 2,157,690 28,983,574 Deferred employer OPEB contributions 1,641,928 271,073 1,913,001 Deferred loss on refunding 948,640 435,898 1,384,538
Total deferred outflows of resources 47,805,053 4,175,017 51,980,070
Primary Government
See accompanying Notes to Basic Financial Statements. 26

City of San MateoStatement of Net Position
June 30, 2018
Governmental Business-TypeActivities Activities Total
Primary Government
LIABILITIES
Current liabilities:Accounts payable 14,569,455 844,957 15,414,412 Interest payable 442,024 1,038,916 1,480,940 Retentions payable 1,187,864 - 1,187,864 Accrued salaries and wages payable 3,270,292 - 3,270,292 Deposits payable 7,328,860 356,301 7,685,161 Unearned revenue 1,130,280 - 1,130,280 Claims and judgments payable - due within one year 1,500,000 - 1,500,000 Landfill postclosure cost payable - due within one year 113,424 - 113,424 Compensated leaves payable - due within one year 907,764 97,056 1,004,820 Capital lease payable - due within one year - 66,993 66,993 Loans payable - due within one year 208,016 - 208,016 Bonds payable - due within one year 1,920,000 1,585,000 3,505,000
Total current liabilities 32,577,979 3,989,223 36,567,202
Noncurrent liabilities:Claims and judgments payable - due in more than one year 12,113,000 - 12,113,000 Landfill postclosure costs payable - due in more than one year 1,928,218 - 1,928,218 Compensated leaves payable - due in more than one year 7,344,636 785,264 8,129,900 Net OPEB liability 13,495,051 2,227,949 15,723,000 Net pension liability 203,914,681 14,280,953 218,195,634 Capital lease payable - due in more than one year - 74,898 74,898 Loans payable - due in more than one year 2,727,780 5,000,000 7,727,780 Bonds payable - due in more than one year, net 41,120,143 61,558,870 102,679,013
Total noncurrent liabilities 282,643,509 83,927,934 366,571,443
Total liabilities 315,221,488 87,917,157 403,138,645
DEFERRED INFLOWS OF RESOURCES
Deferred inflows - pension related amounts 3,739,775 396,184 4,135,959 Deferred inflows - OPEB related amounts 107,287 17,713 125,000
Total deferred inflows of resources 3,847,062 413,897 4,260,959
NET POSITION
Net investment in capital assets 373,263,037 136,901,535 510,164,572 Restricted for:
Housing and economic development 11,365,097 - 11,365,097 Capital projects 37,370,641 - 37,370,641 Debt service 4,454,814 - 4,454,814 Other purposes 2,989,858 3,019,163 6,009,021
Total restricted 56,180,410 3,019,163 59,199,573
Unrestricted (27,694,719) (2,674,687) (30,369,406)
401,748,728$ 137,246,011$ 538,994,739$ Total net position
See accompanying Notes to Basic Financial Statements. 27
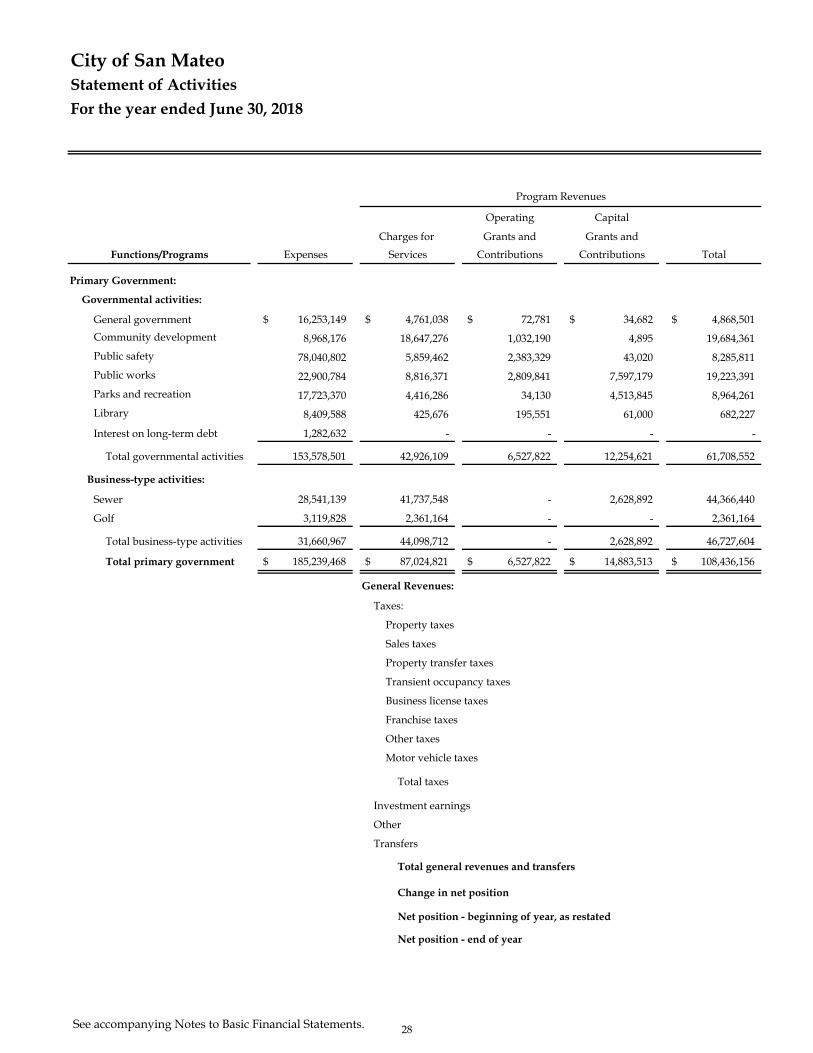
City of San MateoStatement of Activities
For the year ended June 30, 2018
Operating Capital
Charges for Grants and Grants and
Functions/Programs Expenses Services Contributions Contributions Total
Primary Government:
Governmental activities:
General government 16,253,149$ 4,761,038$ 72,781$ 34,682$ 4,868,501$
Community development 8,968,176 18,647,276 1,032,190 4,895 19,684,361
Public safety 78,040,802 5,859,462 2,383,329 43,020 8,285,811
Public works 22,900,784 8,816,371 2,809,841 7,597,179 19,223,391
Parks and recreation 17,723,370 4,416,286 34,130 4,513,845 8,964,261
Library 8,409,588 425,676 195,551 61,000 682,227
Interest on long-term debt 1,282,632 - - - -
Total governmental activities 153,578,501 42,926,109 6,527,822 12,254,621 61,708,552
Business-type activities:
Sewer 28,541,139 41,737,548 - 2,628,892 44,366,440
Golf 3,119,828 2,361,164 - - 2,361,164
Total business-type activities 31,660,967 44,098,712 - 2,628,892 46,727,604
Total primary government 185,239,468$ 87,024,821$ 6,527,822$ 14,883,513$ 108,436,156$
General Revenues:
Taxes:
Property taxes
Sales taxes
Property transfer taxes
Transient occupancy taxes
Business license taxes
Franchise taxes
Other taxes
Motor vehicle taxes
Total taxes
Investment earnings
Other
Transfers
Total general revenues and transfers
Change in net position
Net position - beginning of year, as restated
Net position - end of year
Program Revenues
See accompanying Notes to Basic Financial Statements. 28
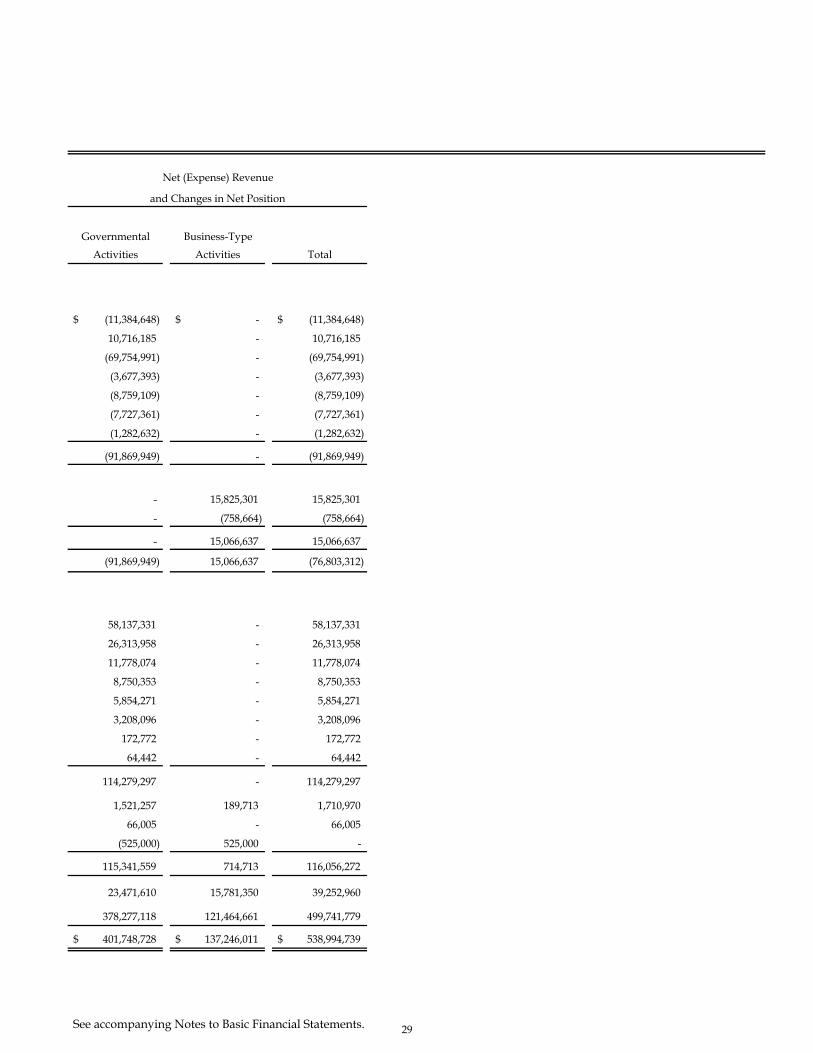
Governmental Business-Type
Activities Activities Total
(11,384,648)$ -$ (11,384,648)$
10,716,185 - 10,716,185
(69,754,991) - (69,754,991)
(3,677,393) - (3,677,393)
(8,759,109) - (8,759,109)
(7,727,361) - (7,727,361)
(1,282,632) - (1,282,632)
(91,869,949) - (91,869,949)
- 15,825,301 15,825,301
- (758,664) (758,664)
- 15,066,637 15,066,637
(91,869,949) 15,066,637 (76,803,312)
58,137,331 - 58,137,331
26,313,958 - 26,313,958
11,778,074 - 11,778,074
8,750,353 - 8,750,353
5,854,271 - 5,854,271
3,208,096 - 3,208,096
172,772 - 172,772
64,442 - 64,442
114,279,297 - 114,279,297
1,521,257 189,713 1,710,970
66,005 - 66,005
(525,000) 525,000 -
115,341,559 714,713 116,056,272
23,471,610 15,781,350 39,252,960
378,277,118 121,464,661 499,741,779
401,748,728$ 137,246,011$ 538,994,739$ 137,246,011$
Net (Expense) Revenue
and Changes in Net Position
See accompanying Notes to Basic Financial Statements. 29

30

FUNDFINANCIAL STATEMENTS
Governmental Fund Financial Statements
Proprietary Fund Financial Statements
Fiduciary Fund Financial Statements
31

32
GOVERNMENTAL FUND FINANCIAL STATEMENTS
General Fund accounts for resources traditionally associated with governmental functions that are notrequired legally or by sound financial management to be accounted for in another fund.
General Capital Projects Fund accounts for the expenditures for capital improvements for the City,including equipment, acquisition and construction of parks, recreation areas, public safety facilities orother public works. The primary sources of funding are intergovernmental revenues, Measure A (half centsales tax), developer impact fees and transfers from other governmental funds.
Construction Services Special Revenue Fund accounts for revenue and expenditures of activities relatingto building permits.
Non-Major Governmental Funds is the aggregate of all the non-major governmental funds.
33
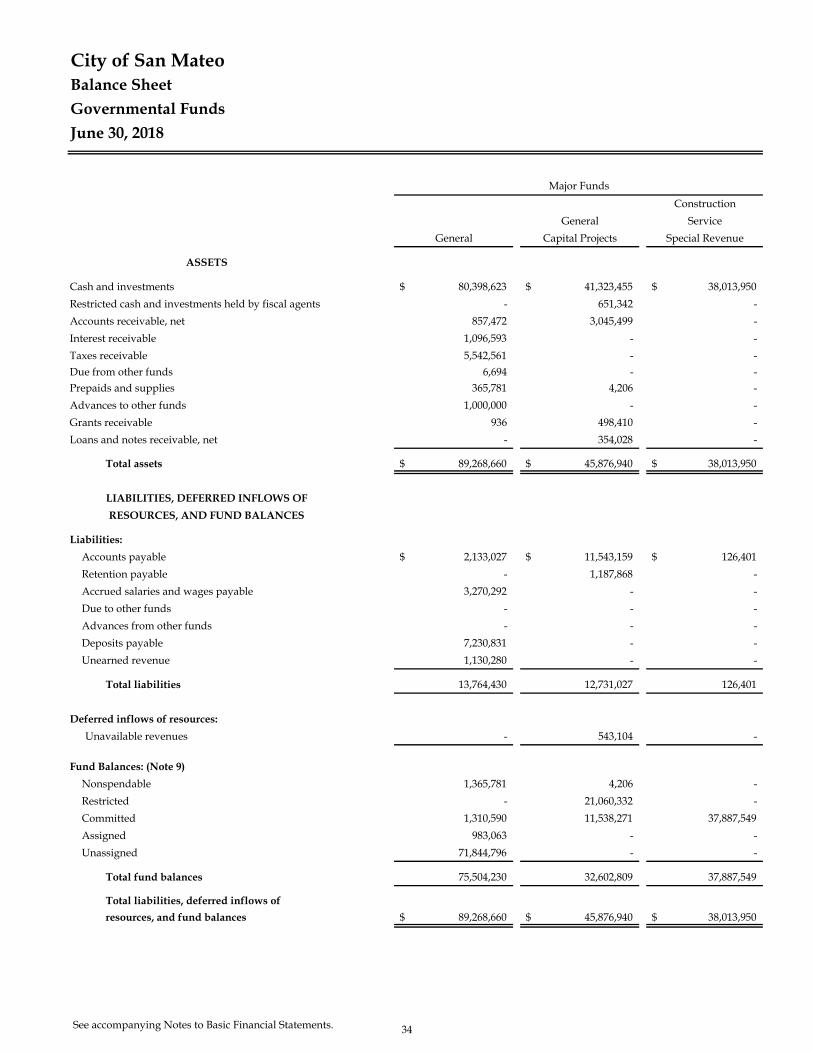
City of San MateoBalance Sheet
Governmental Funds
June 30, 2018
Construction
General Service
General Capital Projects Special Revenue
ASSETS
Cash and investments 80,398,623$ 41,323,455$ 38,013,950$
Restricted cash and investments held by fiscal agents - 651,342 -
Accounts receivable, net 857,472 3,045,499 -
Interest receivable 1,096,593 - -
Taxes receivable 5,542,561 - -
Due from other funds 6,694 - -
Prepaids and supplies 365,781 4,206 -
Advances to other funds 1,000,000 - -
Grants receivable 936 498,410 -
Loans and notes receivable, net - 354,028 -
Total assets 89,268,660$ 45,876,940$ 38,013,950$
LIABILITIES, DEFERRED INFLOWS OF
RESOURCES, AND FUND BALANCES Liabilities:
Accounts payable 2,133,027$ 11,543,159$ 126,401$
Retention payable - 1,187,868 -
Accrued salaries and wages payable 3,270,292 - -
Due to other funds - - -
Advances from other funds - - -
Deposits payable 7,230,831 - -
Unearned revenue 1,130,280 - -
Total liabilities 13,764,430 12,731,027 126,401
Deferred inflows of resources:
Unavailable revenues - 543,104 -
Fund Balances: (Note 9)
Nonspendable 1,365,781 4,206 -
Restricted - 21,060,332 -
Committed 1,310,590 11,538,271 37,887,549
Assigned 983,063 - -
Unassigned 71,844,796 - -
Total fund balances 75,504,230 32,602,809 37,887,549
Total liabilities, deferred inflows of
resources, and fund balances 89,268,660$ 45,876,940$ 38,013,950$
Major Funds
See accompanying Notes to Basic Financial Statements. 34

Non-Major Total
Governmental Governmental
Funds Funds
47,999,679$ 207,735,707$
52,922 704,264
992,674 4,895,645
- 1,096,593
447,919 5,990,480
- 6,694
- 369,987
- 1,000,000
175,121 674,467
2,968,879 3,322,907
52,637,194$ 225,796,744$
322,876$ 14,125,463$
- 1,187,868
- 3,270,292
6,694 6,694
1,000,000 1,000,000
70,640 7,301,471
- 1,130,280
1,400,210 28,022,068
639,335 1,182,439
- 1,369,987
33,937,639 54,997,971
16,660,010 67,396,420
- 983,063
- 71,844,796
50,597,649 196,592,237
`
52,637,194$ 225,796,744$
35

36

Total Fund Balances - Total Governmental Funds 196,592,237$
Total
Non-depreciable 72,829,018$ -$ 72,829,018$ Depreciable, net 342,525,522 (9,027,529) 333,497,993
Total capital assets 415,354,540$ (9,027,529)$ 406,327,011
Unavailable revenue recorded in the fund financial statements resulting fromactivities in which revenues were earned but funds were not available arereclassified as revenues in the Government-Wide Financial Statements. 1,182,439
Interest payable on long-term debt did not require current financial resources.Therefore, interest payable was not reported as a liability in Governmental FundsBalance Sheet. (442,024)
Internal service funds were used by management to charge the costs of certainactivities, such as insurance, to individual funds. The assets and liabilities of theinternal service funds were included in governmental activities in the Government-Wide Statement of Net Position. 27,810,787
Deferred amounts related to the refunding of long-term debt were not currentfinancial resources. Therefore, they were not reported in the Governmental FundsBalance Sheet. This amount is to be amortized over the life of the long-term debt. 948,640
In the Government-Wide Financial Statement certain differences between actuarialestimates and actual results for pensions are deferred and amortized over a period oftime, however, in the governmental funds no transactions are recorded. In addition,employer contributions for pensions and OPEB were recorded as expenditures in thegovernmental funds, however, in the Government-Wide Financial Statement thesecontributions are deferred.
Deferred outflows of resources - pension 45,214,485 Deferred outflows of resources - OPEB 1,641,928 Deferred inflows of resources - pension (3,739,775) Deferred inflows of resources - OPEB (107,287)
Long-term liabilities were not due and payable in the current period. Therefore, theywere not reported in the Governmental Funds Balance Sheet.
Total
Claims and judgments payable - due within one year (1,500,000)$ 1,500,000$ -$ Landfill closure and postclosure cost payable - due within one year (113,424) - (113,424) Compensated leaves payable - due within one year (907,764) - (907,764) Loans payable - due within one year (208,016) (208,016) Bonds payable - due within one year (1,920,000) - (1,920,000) Long term liabilities - due in more than one year (282,643,509) 12,113,000 (270,530,509)
Total long-term liabilities (287,292,713)$ 13,613,000$ (273,679,713)
Net Position of Governmental Activities 401,748,728$
Government-Wide Statement of Net Position
Internal Service Funds
Government-Wide Statement of Net Position
Internal Service Funds
Capital assets used in governmental activities were not current financial resources.Therefore, they were not reported in the Governmental Funds Balance Sheet. Exceptfor the internal service funds reported below, the capital assets were adjusted asfollows:
Amounts reported for governmental activities in the Statement of Net Position weredifferent because:
City of San MateoReconciliation of the Governmental Funds Balance Sheet
to the Government-Wide Statement of Net Position
June 30, 2018
See accompanying Notes to Basic Financial Statements. 37

ConstructionGeneral Services
General Capital Projects Special Revenue
REVENUES:
Property taxes 55,643,949$ -$ -$ Sales taxes 23,873,042 2,440,916 - Other taxes 28,359,383 - - Licenses, building and other permits 163,988 - 11,216,578 Fines, forfeitures and penalties 1,648,282 23,545 - Intergovernmental 3,011,965 2,350,757 - Charges for services 7,735,996 89,059 959,029 Investment income 447,504 120,325 295,334 Assessments and garbage collection surcharge - 538,343 - Parking meter and lease revenue 4,279 2,081,537 - Impact fees - 1,770,552 - Capital contribution - - - Other revenues 3,194,990 437,402 -
Total revenues 124,083,378 9,852,436 12,470,941
EXPENDITURES:
Current:General government:
City Council 382,672 - - City Manager 1,749,804 - - City Clerk 1,032,765 - - City Attorney 1,296,006 - - Finance 3,022,042 - - Information technology 3,529,219 - - Human resources 1,619,054 - -
Community development 2,530,572 - 5,656,163 Public safety:
Police 39,285,684 - - Fire 24,969,620 - -
Public works 6,746,706 - 296,815 Parks and recreation 14,965,251 - - Library 6,721,084 - - Non-departmental 3,001,379 - -
Capital outlay 139,813 18,208,303 - Debt service:
Principal 87,077 265,000 - Interest, and fiscal charges - 234,225 -
Total expenditures 111,078,748 18,707,528 5,952,978
REVENUES OVER (UNDER) EXPENDITURES 13,004,630 (8,855,092) 6,517,963
OTHER FINANCING SOURCES (USES):
Issuance of debt - 2,157,843 - Transfers in 1,517,500 9,691,513 - Transfers out (6,123,412) (9,756,341) -
Total other financing sources (uses) (4,605,912) 2,093,015 -
Net change in fund balances 8,398,718 (6,762,077) 6,517,963
FUND BALANCES:
Beginning of year 67,105,512 39,364,886 31,369,586
End of year 75,504,230$ 32,602,809$ 37,887,549$
Major Funds
City of San MateoStatement of Revenues, Expenditures and Changes in Fund Balances
Governmental Funds
For the year ended June 30, 2018
See accompanying Notes to Basic Financial Statements. 38
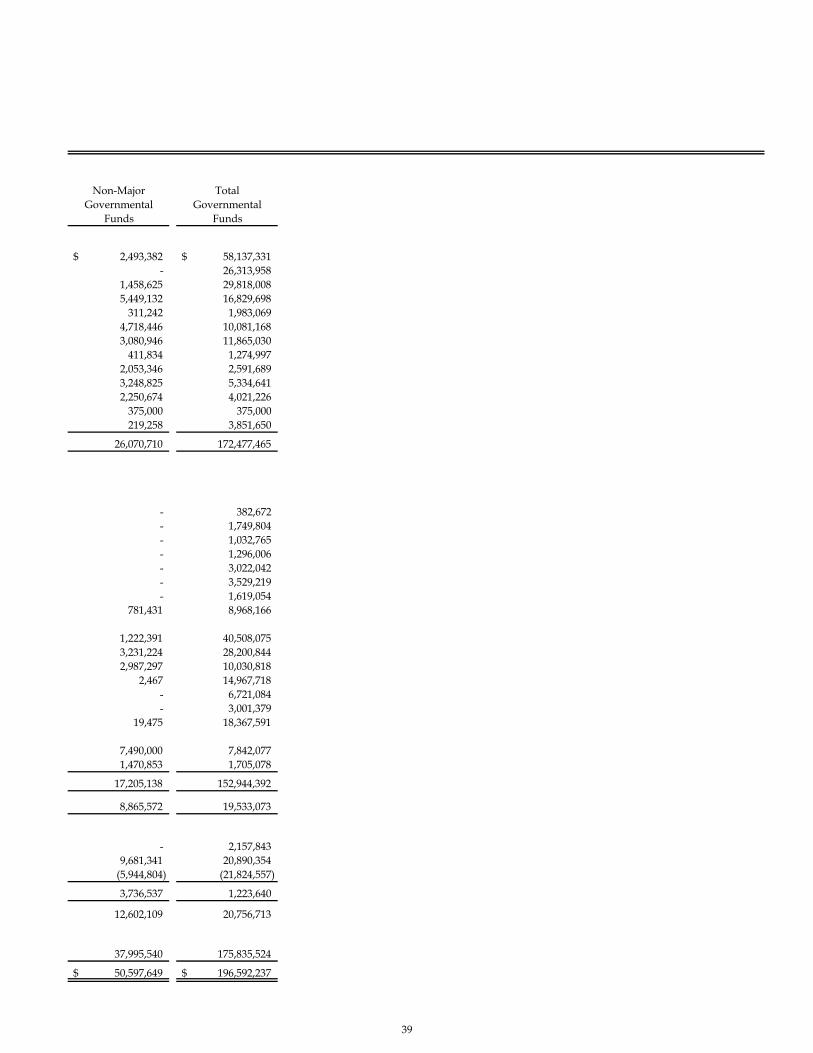
Non-Major TotalGovernmental Governmental
Funds Funds
2,493,382$ 58,137,331$ - 26,313,958
1,458,625 29,818,008 5,449,132 16,829,698
311,242 1,983,069 4,718,446 10,081,168 3,080,946 11,865,030
411,834 1,274,997 2,053,346 2,591,689 3,248,825 5,334,641 2,250,674 4,021,226
375,000 375,000 219,258 3,851,650
26,070,710 172,477,465
- 382,672 - 1,749,804 - 1,032,765 - 1,296,006 - 3,022,042 - 3,529,219 - 1,619,054
781,431 8,968,166
1,222,391 40,508,075 3,231,224 28,200,844 2,987,297 10,030,818
2,467 14,967,718 - 6,721,084 - 3,001,379
19,475 18,367,591
7,490,000 7,842,077 1,470,853 1,705,078
17,205,138 152,944,392
8,865,572 19,533,073
- 2,157,843 9,681,341 20,890,354
(5,944,804) (21,824,557)
3,736,537 1,223,640
12,602,109 20,756,713
37,995,540 175,835,524
50,597,649$ 196,592,237$
39

Net Change in Fund Balances - Total Governmental Funds 20,756,713$
Governmental funds reported capital outlay as expenditures. However, in the Government-Wide Statement of Activities, thecost of those assets was allocated over their estimated useful lives as depreciation expense. This was the amount of capitalassets recorded in the current period, net of Internal Service Funds of $2,823,485. 14,414,460
Donated capital assets and capital assets contributed during the year are reflected in the Government-Wide Statement ofActivities as capital contributions. However capital contributions related to these capital assets are not reported ingovernmental funds as capital assets are not considered current financial resources. 4,278,432
Depreciation expense on capital assets was reported in the Government-Wide Statement of Activities, but they did notrequire the use of current financial resources. Therefore, depreciation expense was not reported as expenditures in thegovernmental funds, net of Internal Service Funds of $1,526,556. (15,838,536)
In the Statement of Activities, only the gain or (loss) on the sale of capital assets is reported, whereas in the governmentalfunds proceeds from sales increases financial resources. This represents the difference between proceeds and the loss ondisposal of capital assets. (3,918)
Accrued compensated leave payable was an expenditure in governmental funds, but the accrued payable increasedcompensated leave liabilities in the Government-Wide Statement of Net Position. 4,848
OPEB expenses reported in the Statement of Activities do not require the use of current financial resources and therefore arenot reported as expenditures in governmental funds. (1,447,094)
Payment of landfill closure and postclosure cost payable was an expenditure in governmental funds, but the paymentreduced landfill closure and postclosure cost liabilities in the Government-Wide Statement of Net Position. Increases in theliability were reflected as expenses in the Government-Wide Statement of Activities, however, no expenditures are reportedin the governmental funds. 75,319
Bond proceeds provided current financial resources to governmental funds, but issuing debt increased long-term liabilities inthe Government-Wide Statement of Net Position. Repayment of bond principal was an expenditure in governmental funds,but the repayment reduced long-term liabilities in the Government-Wide Statement of Net Position.
Long- term debt issuance (2,157,843)
Long-term debt repayments 7,842,077
Revenues that are not considered to be available are reported as unavailable revenues in the governmental funds, however,these amounts are recognized in the Government-Wide Statement of Activities. This amount represents the change inunavailable revenues. 572,956
Current year employer pension and OPEB contributions are recorded as expenditures in the governmental funds, however,these amounts are reported as a deferred outflow of resources in the Government-Wide Statement of Net Position. 20,924,011
Pension expense is recorded as incurred in the Government-Wide Statement of Activities, however, pension expense is notrecognized in the governmental funds. (26,579,665)
Deferred amounts related to the refunding of long-term debt were not current financial resources. Therefore, they were notreported in the Governmental Funds Balance Sheet. This amount is to be amortized over the life of the long-term debt.- This amount is the current year amortization expense (78,508)
Long-term debt premium and discount was recorded as an other financing source or (use) in the governmental funds, butthe payment was treated as an increase (decrease) in long-term liabilities and will be amortized over the life of the bonds inthe Government-Wide Statement of Net Position.- This amount is the current year amortization expense 150,930
Interest expense on long-term debt is reported on the accrual basis on the Government-Wide Statements, but expenditureson long-term debt in the governmental funds statements are recorded when paid. The following amount represents thechange in accrued interest from the prior year. 117,351 Internal service funds were used by management to charge the costs of certain activities, such as insurance and fleetmanagement, to individual funds. The net revenue of the internal service funds was reported with governmental activities. 440,077
Change in Net Position of Governmental Activities 23,471,610$
Amounts reported for governmental activities in the Statement of Activities were different because:
City of San MateoReconciliation of the Governmental Funds Statement of Revenues, Expenditures, and Changes
in Fund Balances to the Government-Wide Statement of Activities
For the year ended June 30, 2018
See accompanying Notes to Basic Financial Statements. 40
PROPRIETARY FUND FINANCIAL STATEMENTS
Sewer Fund accounts for the activities of the wastewater collection and treatment system, which providesservice to the residents of the City and some neighboring cities.
Golf Fund accounts for the activities of the Poplar Creek Golf Course, which provides recreationalfacilities to the public.
Internal Service Funds are used to account for the financing of goods and services provided by onedepartment or agency to other departments or agencies on a cost reimbursement basis.
41
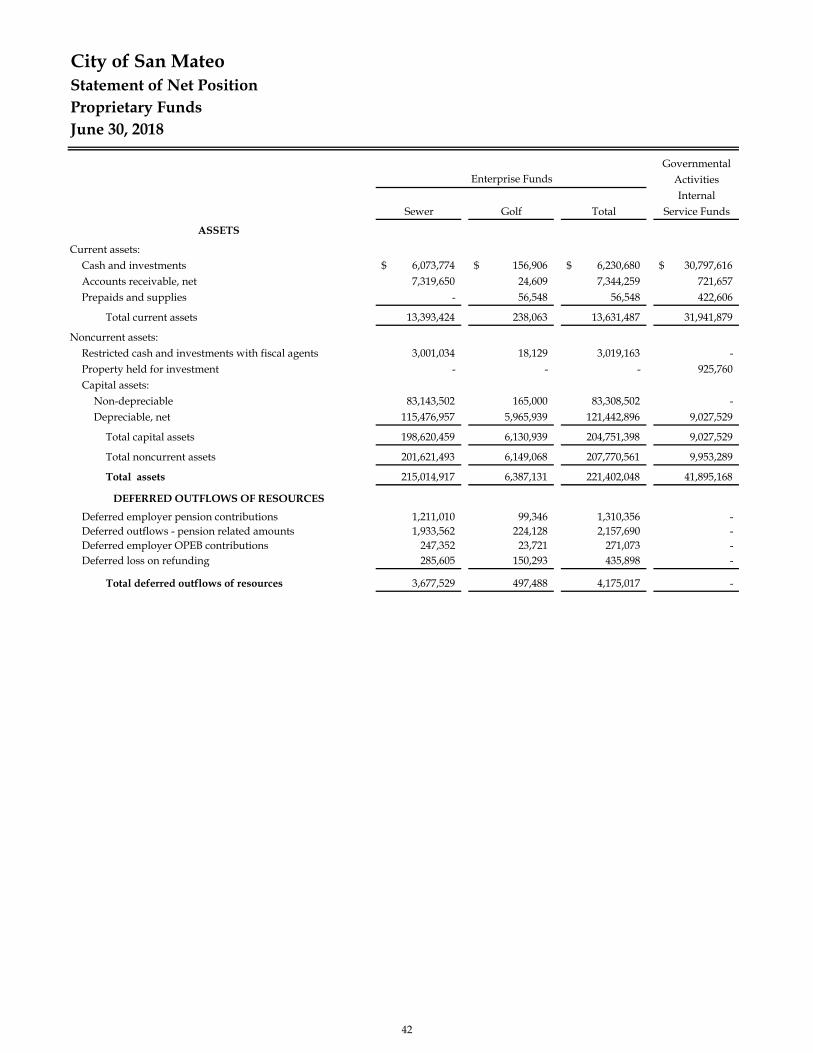
City of San MateoStatement of Net PositionProprietary FundsJune 30, 2018
GovernmentalActivitiesInternal
Sewer Golf Total Service Funds
ASSETS
Current assets:Cash and investments 6,073,774$ 156,906$ 6,230,680$ 30,797,616$ Accounts receivable, net 7,319,650 24,609 7,344,259 721,657 Prepaids and supplies - 56,548 56,548 422,606
Total current assets 13,393,424 238,063 13,631,487 31,941,879
Noncurrent assets: Restricted cash and investments with fiscal agents 3,001,034 18,129 3,019,163 - Property held for investment - - - 925,760 Capital assets:
Non-depreciable 83,143,502 165,000 83,308,502 - Depreciable, net 115,476,957 5,965,939 121,442,896 9,027,529
Total capital assets 198,620,459 6,130,939 204,751,398 9,027,529
Total noncurrent assets 201,621,493 6,149,068 207,770,561 9,953,289
Total assets 215,014,917 6,387,131 221,402,048 41,895,168
DEFERRED OUTFLOWS OF RESOURCES
Deferred employer pension contributions 1,211,010 99,346 1,310,356 - Deferred outflows - pension related amounts 1,933,562 224,128 2,157,690 - Deferred employer OPEB contributions 247,352 23,721 271,073 - Deferred loss on refunding 285,605 150,293 435,898 -
Total deferred outflows of resources 3,677,529 497,488 4,175,017 -
Enterprise Funds
42
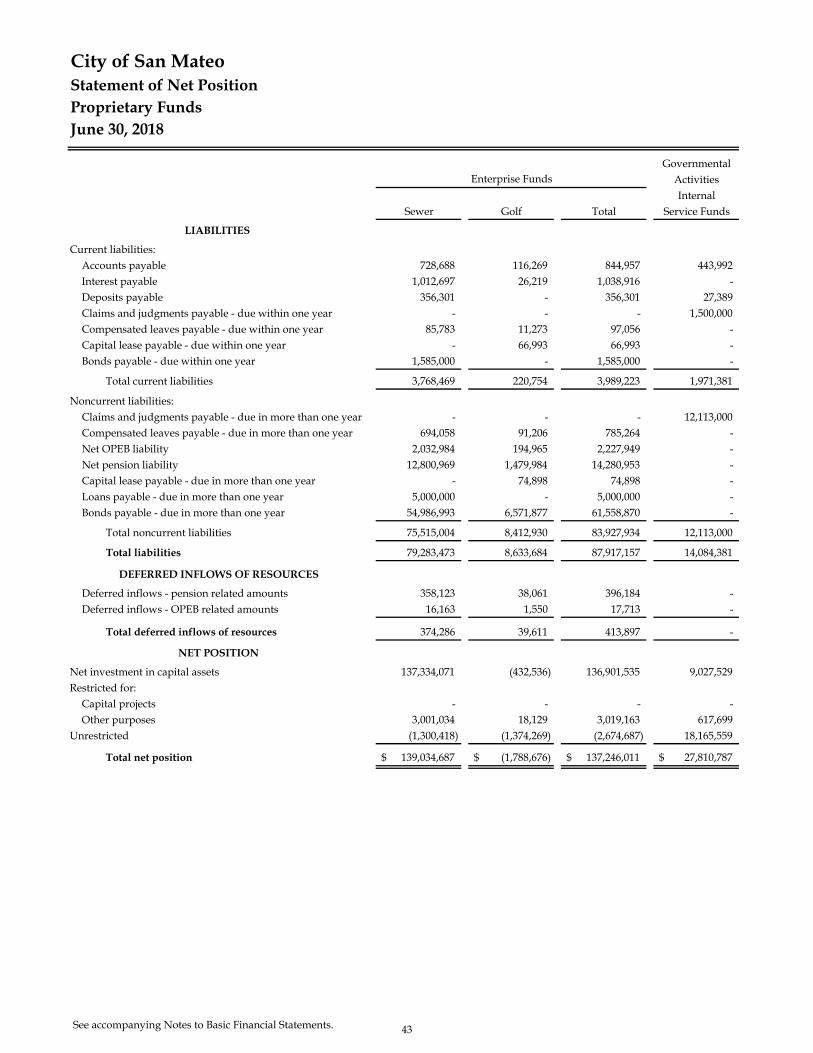
City of San MateoStatement of Net PositionProprietary FundsJune 30, 2018
GovernmentalActivitiesInternal
Sewer Golf Total Service Funds
Enterprise Funds
LIABILITIES
Current liabilities:Accounts payable 728,688 116,269 844,957 443,992 Interest payable 1,012,697 26,219 1,038,916 - Deposits payable 356,301 - 356,301 27,389 Claims and judgments payable - due within one year - - - 1,500,000 Compensated leaves payable - due within one year 85,783 11,273 97,056 - Capital lease payable - due within one year - 66,993 66,993 - Bonds payable - due within one year 1,585,000 - 1,585,000 -
Total current liabilities 3,768,469 220,754 3,989,223 1,971,381
Noncurrent liabilities:Claims and judgments payable - due in more than one year - - - 12,113,000 Compensated leaves payable - due in more than one year 694,058 91,206 785,264 - Net OPEB liability 2,032,984 194,965 2,227,949 - Net pension liability 12,800,969 1,479,984 14,280,953 - Capital lease payable - due in more than one year - 74,898 74,898 - Loans payable - due in more than one year 5,000,000 - 5,000,000 - Bonds payable - due in more than one year 54,986,993 6,571,877 61,558,870 -
Total noncurrent liabilities 75,515,004 8,412,930 83,927,934 12,113,000
Total liabilities 79,283,473 8,633,684 87,917,157 14,084,381
DEFERRED INFLOWS OF RESOURCES
Deferred inflows - pension related amounts 358,123 38,061 396,184 - Deferred inflows - OPEB related amounts 16,163 1,550 17,713 -
Total deferred inflows of resources 374,286 39,611 413,897 -
NET POSITION
Net investment in capital assets 137,334,071 (432,536) 136,901,535 9,027,529 Restricted for:
Capital projects - - - - Other purposes 3,001,034 18,129 3,019,163 617,699
Unrestricted (1,300,418) (1,374,269) (2,674,687) 18,165,559
Total net position 139,034,687$ (1,788,676)$ 137,246,011$ 27,810,787$
See accompanying Notes to Basic Financial Statements. 43
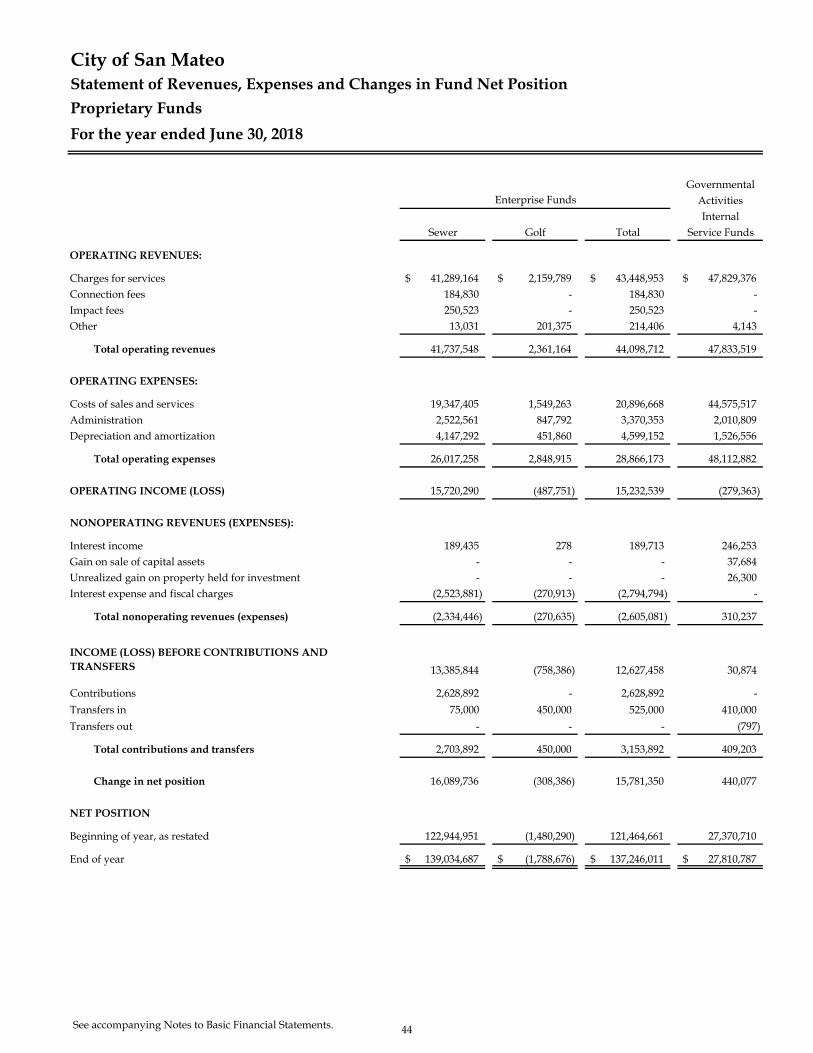
GovernmentalActivitiesInternal
Sewer Golf Total Service Funds
OPERATING REVENUES:
Charges for services 41,289,164$ 2,159,789$ 43,448,953$ 47,829,376$ Connection fees 184,830 - 184,830 - Impact fees 250,523 - 250,523 - Other 13,031 201,375 214,406 4,143
Total operating revenues 41,737,548 2,361,164 44,098,712 47,833,519
OPERATING EXPENSES:
Costs of sales and services 19,347,405 1,549,263 20,896,668 44,575,517 Administration 2,522,561 847,792 3,370,353 2,010,809 Depreciation and amortization 4,147,292 451,860 4,599,152 1,526,556
Total operating expenses 26,017,258 2,848,915 28,866,173 48,112,882
OPERATING INCOME (LOSS) 15,720,290 (487,751) 15,232,539 (279,363)
NONOPERATING REVENUES (EXPENSES):
Interest income 189,435 278 189,713 246,253 Gain on sale of capital assets - - - 37,684 Unrealized gain on property held for investment - - - 26,300 Interest expense and fiscal charges (2,523,881) (270,913) (2,794,794) -
Total nonoperating revenues (expenses) (2,334,446) (270,635) (2,605,081) 310,237
INCOME (LOSS) BEFORE CONTRIBUTIONS AND TRANSFERS 13,385,844 (758,386) 12,627,458 30,874
Contributions 2,628,892 - 2,628,892 -
Transfers in 75,000 450,000 525,000 410,000
Transfers out - - - (797)
Total contributions and transfers 2,703,892 450,000 3,153,892 409,203
Change in net position 16,089,736 (308,386) 15,781,350 440,077
NET POSITION
Beginning of year, as restated 122,944,951 (1,480,290) 121,464,661 27,370,710
End of year 139,034,687$ (1,788,676)$ 137,246,011$ 27,810,787$
Enterprise Funds
City of San MateoStatement of Revenues, Expenses and Changes in Fund Net Position
Proprietary Funds
For the year ended June 30, 2018
See accompanying Notes to Basic Financial Statements. 44

45

City of San MateoStatement of Cash FlowsProprietary Funds
GovernmentalActivitiesInternal
Sewer Golf Total Service Funds
CASH FLOWS FROM OPERATING ACTIVITIES:
Cash received from customers 37,774,805$ 2,156,096$ 39,930,901$ -$ Cash received from other funds - - - 47,825,080 Cash payments to suppliers for goods and services (11,613,858) (1,214,335) (12,828,193) (44,020,070) Cash paid to employees (9,671,357) (1,045,935) (10,717,292) (2,802,866) Cash received from others - 201,375 201,375 4,143
Net cash provided by (used in) operating activities 16,489,590 97,201 16,586,791 1,006,287
CASH FLOWS FROM NONCAPITAL FINANCING ACTIVITIES:
Transfers in 75,000 450,000 525,000 410,000 Transfers out - - - (797)
Net cash provided by noncapital financing activities 75,000 450,000 525,000 409,203
CASH FLOWS FROM CAPITAL AND RELATED FINANCING ACTIVITIES:
Cash contributions 2,628,892 - 2,628,892 - Proceeds from sale of capital assets - - - 44,647 Acquisition of capital assets (31,430,515) - (31,430,515) (2,823,485) Proceeds from debt - 6,575,801 6,575,801 - Long-term debt repayments (1,565,000) (6,776,993) (8,341,993) - Interest paid and fiscal charges (2,526,671) (360,920) (2,887,591) -
Net cash used in capital and related financing activities (32,893,294) (562,112) (33,455,406) (2,778,838)
CASH FLOWS FROM INVESTING ACTIVITIES:
Investment income received 189,435 278 189,713 246,253
Net cash provided by investing activities 189,435 278 189,713 246,253
NET INCREASE (DECREASE) IN CASH AND CASH EQUIVALENTS (16,139,269) (14,633) (16,153,902) (1,117,095)
CASH AND CASH EQUIVALENTS - Beginning of year 25,214,077 189,668 25,403,745 31,914,711
CASH AND CASH EQUIVALENTS - End of year 9,074,808$ 175,035$ 9,249,843$ 30,797,616$
FINANCIAL STATEMENT PRESENTATION:
Cash and investments 6,073,774$ 156,906$ 6,230,680$ 30,797,616$ Restricted cash and investments with fiscal agents 3,001,034 18,129 3,019,163 -
Total 9,074,808$ 175,035$ 9,249,843$ 30,797,616$
Enterprise Funds
For the year ended June 30, 2018
See accompanying Notes to Basic Financial Statements. 46
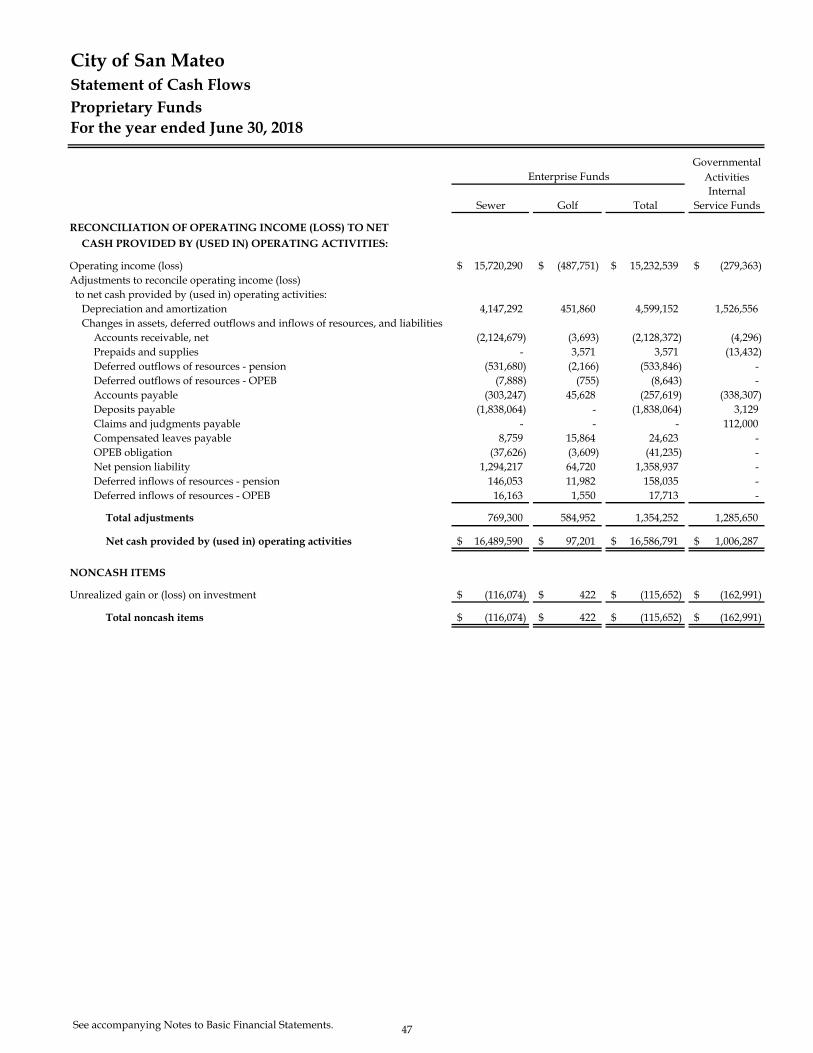
City of San MateoStatement of Cash FlowsProprietary Funds
GovernmentalActivitiesInternal
Sewer Golf Total Service Funds
Enterprise Funds
For the year ended June 30, 2018
RECONCILIATION OF OPERATING INCOME (LOSS) TO NETCASH PROVIDED BY (USED IN) OPERATING ACTIVITIES:
Operating income (loss) 15,720,290$ (487,751)$ 15,232,539$ (279,363)$ Adjustments to reconcile operating income (loss) to net cash provided by (used in) operating activities:
Depreciation and amortization 4,147,292 451,860 4,599,152 1,526,556 Changes in assets, deferred outflows and inflows of resources, and liabilities
Accounts receivable, net (2,124,679) (3,693) (2,128,372) (4,296) Prepaids and supplies - 3,571 3,571 (13,432) Deferred outflows of resources - pension (531,680) (2,166) (533,846) - Deferred outflows of resources - OPEB (7,888) (755) (8,643) - Accounts payable (303,247) 45,628 (257,619) (338,307) Deposits payable (1,838,064) - (1,838,064) 3,129 Claims and judgments payable - - - 112,000 Compensated leaves payable 8,759 15,864 24,623 - OPEB obligation (37,626) (3,609) (41,235) - Net pension liability 1,294,217 64,720 1,358,937 - Deferred inflows of resources - pension 146,053 11,982 158,035 - Deferred inflows of resources - OPEB 16,163 1,550 17,713 -
Total adjustments 769,300 584,952 1,354,252 1,285,650
Net cash provided by (used in) operating activities 16,489,590$ 97,201$ 16,586,791$ 1,006,287$
NONCASH ITEMS
Unrealized gain or (loss) on investment (116,074)$ 422$ (115,652)$ (162,991)$
Total noncash items (116,074)$ 422$ (115,652)$ (162,991)$
See accompanying Notes to Basic Financial Statements. 47

48
FIDUCIARY FUND FINANCIAL STATEMENTS
Agency Fund
Community Facilities District No. 2008-01 Agency Fund accounts for assets that the City is holding forthe Community Facilities District No. 2008-01 for which the City is acting as an agent.
Private Purpose Trust Funds
Successor Agency Trust Fund accounts for assets and liabilities transferred from the City to theSuccessor Agency Trust Fund.
49
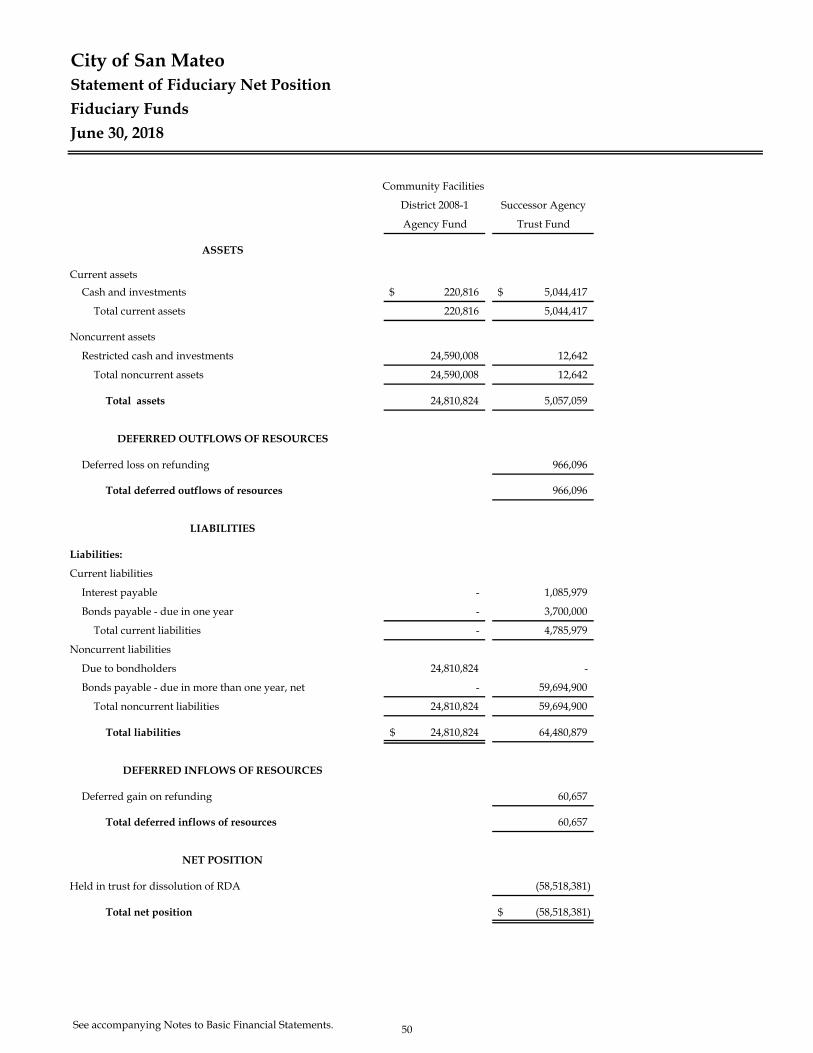
City of San MateoStatement of Fiduciary Net Position
Fiduciary Funds
June 30, 2018
Community Facilities
District 2008-1 Successor Agency
Agency Fund Trust Fund
ASSETS
Current assets
Cash and investments 220,816$ 5,044,417$
Total current assets 220,816 5,044,417
Noncurrent assets
Restricted cash and investments 24,590,008 12,642
Total noncurrent assets 24,590,008 12,642
Total assets 24,810,824 5,057,059
DEFERRED OUTFLOWS OF RESOURCES
Deferred loss on refunding 966,096
Total deferred outflows of resources 966,096
LIABILITIES
Liabilities:
Current liabilities
Interest payable - 1,085,979
Bonds payable - due in one year - 3,700,000
Total current liabilities - 4,785,979
Noncurrent liabilities
Due to bondholders 24,810,824 -
Bonds payable - due in more than one year, net - 59,694,900
Total noncurrent liabilities 24,810,824 59,694,900
Total liabilities 24,810,824$ 64,480,879
DEFERRED INFLOWS OF RESOURCES
Deferred gain on refunding 60,657
Total deferred inflows of resources 60,657
NET POSITION
Held in trust for dissolution of RDA (58,518,381)
Total net position (58,518,381)$
See accompanying Notes to Basic Financial Statements. 50

City of San MateoStatement of Changes in Fiduciary Net Position
All Fiduciary Funds - Private Purpose Trust Funds
Successor Agency
Trust Fund
ADDITIONS:
Investment income (4,854)$
RDA property tax trust fund distribution 6,121,469
Transfer within Successor Agency 6,252,517
Total additions 12,369,132
DEDUCTIONS:
Administration 297,445
Interest expense 2,314,047
Transfer within Successor Agency 6,252,516
Total deductions 8,864,008
Change in net position 3,505,124
NET POSITION:
Beginning of year (62,023,505)
End of year (58,518,381)$
For the year ended June 30, 2018
See accompanying Notes to Basic Financial Statements. 51

52

NOTES TO BASIC FINANCIAL STATEMENTS
53

City of San Mateo Notes to Basic Financial Statements For the year ended June 30, 2018
1. SUMMARY OF SIGNIFICANT ACCOUNTING POLICIES The basic financial statements of the City of San Mateo, California (City) have been prepared in conformity with generally accepted accounting principles (GAAP) as applied to governmental agencies. The Governmental Accounting Standards Board (GASB) is the accepted standard setting body for establishing governmental accounting and financial reporting principles. The more significant of the City’s accounting policies are described below. A. Financial Reporting Entity
The City of San Mateo (City) was incorporated as a charter city on September 4, 1894; the current charter was adopted in 1971 and revised in 2002. The City operates under the Council-Manager form of government and provides the following services: public safety, including police and fire; building inspection; parks and streets; sanitation; leisure services; planning and zoning; general administration services; and redevelopment. These basic financial statements present the City and its component units, entities for which the City is considered to be financially accountable. Blended component units, although legally separate entities are, in substance, part of the City’s operations and data from these units are combined with data of the City. The City had no discretely presented component units. The blended component unit has a June 30 year-end. The following entity is reported as a blended component unit:
The San Mateo Joint Powers Financing Authority (Authority) was established solely to assist the City in the issuance of certain revenue bonds. It is controlled by and financially dependent on the City; its financial activities were accounted for as part of the respective funds.
Separate financial statements for the San Mateo Joint Powers Financing Authority are not available.
B. Basis of Accounting and Measurement Focus
The accounts of the City are organized on the basis of funds, each of which is considered a separate accounting entity with its own self-balancing set of accounts that comprise its assets, deferred outflows of resources, liabilities, deferred inflows of resources, fund equity, revenues and expenditures or expenses. These funds are established for the purpose of carrying out specific activities or certain objectives in accordance with specific regulations, restrictions or limitations. Governmental resources are allocated to and accounted for in individual funds based upon the purposes for which they are to be spent and the means by which spending activities are controlled.
Government-Wide Financial Statements The City’s Government-Wide Financial Statements include a Statement of Net Position and a Statement of Activities. These statements present summaries of Governmental and Business-Type Activities for the City accompanied by a total column.
54

City of San Mateo Notes to Basic Financial Statements For the year ended June 30, 2018
1. SUMMARY OF SIGNIFICANT ACCOUNTING POLICIES, Continued B. Basis of Accounting and Measurement Focus, Continued
Government-Wide Financial Statements, Continued These financial statements are presented on an “economic resources” measurement focus and the accrual basis of accounting. Accordingly, all of the City’s assets, deferred inflows/outflows of resources, and liabilities, including capital assets, as well as infrastructure assets, and long-term liabilities, are included in the accompanying Statement of Net Position. The Statement of Activities presents changes in net position. Under the accrual basis of accounting, revenues are recognized in the period in which they are earned while expenses are recognized in the period in which the liabilities are incurred. Certain types of transactions reported as program revenues for the City are reported in three categories:
Charges for services Operating grants and contributions Capital grants and contributions
Certain eliminations have been made in regards to interfund activities, payables, and receivables. All internal balances in the Statement of Net Position have been eliminated except those representing balances between the governmental activities and the business-type activities, which are presented as internal balances and eliminated in the total primary government column. In the Statement of Activities, internal fund transactions have been eliminated; however, those transactions between governmental and business-type activities have not been eliminated. The following interfund activities have been eliminated:
Due to/from other funds Transfers in/out
The City applies all applicable GASB pronouncements including all NCGA Statements and Interpretations currently in effect. Governmental Fund Financial Statements Governmental fund financial statements include a Balance Sheet and a Statement of Revenues, Expenditures and Changes in Fund Balances for all major governmental funds and non-major funds aggregated. An accompanying schedule is presented to reconcile and explain the differences in net position as presented in these statements to the net position presented in the government-wide financial statements. The City has presented all major funds that meet specific qualifications.
55
City of San Mateo Notes to Basic Financial Statements For the year ended June 30, 2018
1. SUMMARY OF SIGNIFICANT ACCOUNTING POLICIES, Continued
B. Basis of Accounting and Measurement Focus, Continued
Governmental Fund Financial Statements, Continued
All governmental funds are accounted for on a spending or “current financial resources” measurement focus and the modified accrual basis of accounting. Accordingly, only current assets and current liabilities are included on the balance sheets. The Statement of Revenues, Expenditures and Changes in Fund Balances present increases (revenues and other financing sources) and decreases (expenditures and other financing uses) in net current assets. Under the modified accrual basis of accounting, revenues are recognized in the accounting period in which they become both measurable and available to finance expenditures of the current period. The City reports the following funds as major governmental funds of the City.
General Fund accounts for resources traditionally associated with governmental activities that are not required legally or by sound financial management to be accounted for in another fund. General Capital Projects Fund accounts for the expenditures for capital improvements for the City, including equipment, acquisition and construction of parks, recreation areas, public safety facilities or other public works. The primary sources of funding are intergovernmental revenues, Measure A (half cent sales tax), developer impact fees and transfers from other governmental funds. Construction Services Special Revenue Fund accounts for revenue and expenditures of activities relating to building permits. These revenues have been committed by City Council for construction service activities.
The City reports the following governmental funds as non-major governmental funds of the City.
Police Grants Special Revenue Fund accounts for the revenues and expenditures of State and Federalgrants such as State SLESF (Supplemental Law Enforcement Services Fund).
Community Development Block Grant Special Revenue Fund (CDBG) accounts for revenue andexpenditures of CDBG funds awarded by the Department of Housing and Urban Development.
HOME Special Revenue Fund accounts for revenues and expenditures of the Federal HOME grantprogram.
City Housing Special Revenue Fund accounts for revenues from a former Federal Rental Rehabilitationprogram and loan payments from the First Time Homebuyer program.
Low Moderate Income Housing Special Revenue Fund accounts for revenues and expenditures of theformer Redevelopment Agency Special Revenue Fund.
Fire Protection Special Revenue Fund accounts for the fees charged and expenditures for activities relating to fire inspections and permits.
56

City of San Mateo Notes to Basic Financial Statements For the year ended June 30, 2018
1. SUMMARY OF SIGNIFICANT ACCOUNTING POLICIES, Continued
B. Basis of Accounting and Measurement Focus, Continued
Governmental Fund Financial Statements, Continued
Gas Tax Special Revenue Fund accounts for gasoline tax revenues as required by State law.
Advance Planning Special Revenue Fund accounts for fees collected through building permits andexpenditures for activities relating to long-term planning, including the general plan update. Parking Special Revenue Fund accounts for parking meter revenues and expenditures of the City'sdowntown parking facilities. Solid Waste Special Revenue Fund accounts for garbage collection surcharge revenues. The use of fundsis restricted by City ordinance to street cleaning and waste disposal. Park and Recreation Special Revenue Fund accounts for the park and recreation tax, as well as the parksand recreation impact and in lieu fees to fund Parks and Recreation related projects through a transferto the Capital Improvement Projects Fund. Traffic Impact Fee Special Revenue Fund accounts for traffic impact fees to mitigate the cumulativeimpacts of new development and to accommodate future development. Commercial Linkage Fee Special Revenue Fund accounts for the City’s commercial linkage fees to be usedfor housing programs including acquisition, rehabilitation, or new construction of housing.
Landfill Bonds Debt Service Fund accounts for debt service payments on landfill revenue bonds (tofinance expenditures related to final closure of the former landfill site, and construction of related parkimprovements) and post-closure monitoring costs. General Obligation Bonds Debt Service Fund accounts for voter-approved property tax revenues and debtservice payments on general obligation bonds. 2% Hotel Tax Capital Projects Fund accounts for the voter approved 2% hotel tax revenue Measure C,the related transfers to the capital improvement fund, and debt service on variable rate bonds.
Revenues are recorded when received in cash, except that revenues subject to accrual (generally those received 45 to 90 days after year-end) are recognized when due. The primary revenue sources that have been treated as susceptible to accrual by the City are property taxes, taxpayer-assessed tax revenues (sales taxes, transient occupancy taxes, franchise taxes, etc.), grant revenues and earnings on investments. Expenditures are recorded in the accounting period in which the related fund liability is incurred. The Reconciliation of the Fund Financial Statements to the Government-Wide Financial Statements is provided.
57
City of San Mateo Notes to Basic Financial Statements For the year ended June 30, 2018
1. SUMMARY OF SIGNIFICANT ACCOUNTING POLICIES, Continued B. Basis of Accounting and Measurement Focus, Continued
Proprietary Fund Financial Statements Proprietary fund financial statements include a Statement of Net Position, a Statement of Revenues, Expenses and Change in Net Position, and a Statement of Cash Flows for all proprietary funds. A column representing internal service funds is also presented in these statements. However, internal service balances and activities have been combined with the governmental activities in the Government-Wide Financial Statements. Proprietary funds are accounted for using the “economic resources” measurement focus and the accrual basis of accounting. Accordingly, all assets and liabilities (whether current or noncurrent) are included on the Statement of Net Position. The Statement of Revenues, Expenses and Changes in Net Position present increases (revenues) and decreases (expenses) in total net position. Under the accrual basis of accounting, revenues are recognized in the period in which they are earned while expenses are recognized in the period in which a liability is incurred. Operating revenues in the proprietary funds are those revenues that are generated from the primary operations of the fund. All other revenues are reported as non-operating revenues. Operating expenses are those expenses that are essential to the primary operations of the fund. All other expenses are reported as non-operating expenses. The City reports the Sewer, Golf and Internal Service Funds as proprietary funds of the City.
Sewer Fund accounts for the activities of the wastewater collection and treatment system, which provides service to the residents of the City and some neighboring cities. Golf Fund accounts for the activities of the Poplar Creek Golf Course, which provides recreational facilities to the public.
Internal service fund balances and activities have been combined with governmental activities in the Government-Wide Financial Statements, and are comprised of the following funds:
Workers’ Compensation Insurance Fund accounts for all workers’ compensation self-insurance activities. Dental Self-Insurance Fund accounts for the City’s self-insurance activities related to the dental plan it provides to its employees. Benefits Fund accounts for charges for other funds and expenditures relating to employee benefits other than those accounted for in the Workers’ Compensation and Dental Self-Insurance Funds.
Comprehensive Liability Insurance Fund accounts for general liability self-insurance transactions.
58
City of San Mateo Notes to Basic Financial Statements For the year ended June 30, 2018
1. SUMMARY OF SIGNIFICANT ACCOUNTING POLICIES, Continued B. Basis of Accounting and Measurement Focus, Continued
Proprietary Fund Financial Statements, Continued
Vehicle and Equipment Replacement Fund accounts for charges to the City departments for funding and acquisition of vehicles and equipment. Fleet and Building Maintenance Fund accounts for the charges to user departments and the expenses related to the maintenance of City vehicles and buildings.
Fiduciary Fund Financial Statements Fiduciary fund financial statements consist of a Statement of Fiduciary Net Position and a Statement of Changes in Fiduciary Net Position. The City has two types of fiduciary funds, an agency fund and a private-purpose trust fund. Agency funds are used to account for the assets held for distribution by the City as an agent for another entity for which the City has custodial responsibility and accounts for the flow of assets. Private-purpose trust funds account for resources of all other trust arrangements in which principal and income benefit individuals, private organizations, or other governments (i.e. unclaimed property/escheat property). Fiduciary funds are accounted for using the accrual basis of accounting. The City reports the following fiduciary funds:
Community Facilities District No. 2008-1 Agency Fund – accounts for assets held by the City for the Community Facilities District No. 2008-1 (Bay Meadows).
Successor Agency Private Purpose Trust Fund – accounts for assets and liabilities transferred in fiscal year 2012 from the Redevelopment Agency of the City of San Mateo to the Successor Agency Trust Fund.
C. Cash, Cash Equivalents, and Investments
The City pools cash resources from all funds in order to facilitate the management of cash. The balance in the pooled cash account is available to meet current operating requirements. Cash in excess of current requirements is invested in various interest-bearing accounts and other investments for varying terms. In accordance with GASB Statement No. 40, Deposit and Investment Disclosures (Amendment of GASB No. 3), certain disclosure requirements for Deposits and Investment Risks were made in the following areas:
• Interest Rate Risk • Credit Risk
o Overall o Custodial Credit Risk o Concentrations of Credit Risk
In addition, other disclosures are specified including use of certain methods to present deposits and investments, highly sensitive investments, credit quality at year-end, and other disclosures.
59
City of San Mateo Notes to Basic Financial Statements For the year ended June 30, 2018
1. SUMMARY OF SIGNIFICANT ACCOUNTING POLICIES, Continued
C. Cash, Cash Equivalents, and Investments, Continued In accordance with GASB Statement No. 31, Accounting and Financial Reporting for Certain Investments and for External Investment Pools, highly liquid market investments with maturities of one year or less at time of purchase are stated at amortized cost. All other investments are stated at fair value. The City categorizes the fair value measurements of its investments based on the hierarchy established by generally accepted accounting principles. The fair value hierarchy, which has three levels, is based on the valuation inputs used to measure an asset’s fair value: Level 1 inputs are quoted prices in active markets for identical assets; Level 2 inputs are significant other observable inputs; Level 3 inputs are significant unobservable inputs. The City had one investment in property that is measured using Level 3 inputs. The City participates in an investment pool managed by the State of California entitled Local Agency Investment Fund (LAIF) which has invested a portion of the pooled funds in Structured Notes and Asset-Backed Securities. LAIF’s investments are subject to credit risk with the full faith and credit of the State of California collateralizing these investments. In addition, these Structured Notes and Asset-Backed Securities are subject to market risk as to the change in interest rates. Cash equivalents are considered amounts in demand deposits and short-term investments with a maturity date within three months of the date acquired by the City and are presented as “Cash and Investments” in the accompanying Basic Financial Statements. For the purpose of the statement of cash flows, the City considers all pooled cash and investments (consisting of cash and investments and restricted cash and investments) held by the City as cash and cash equivalents because the pool is used essentially as a demand deposit account from the standpoint of the funds. The City also considers all non-pooled cash and investments (consisting of cash with fiscal agent and restricted cash and investments held by fiscal agent) as cash and cash equivalents because investments meet the criteria for cash equivalents defined above.
D. Restricted Cash and Investments Certain restricted cash and investments are held by fiscal agents for the redemption of bonded debt, for acquisition and construction of capital projects, and to meet bond indenture debt reserve requirements. Cash and investments are also restricted for deposits held for others within the enterprise funds.
E. Prepaids and Supplies Certain payments to vendors reflect costs applicable to future accounting periods. Supplies are valued at cost on a first-in first-out basis. Supplies in the General Fund consist of expendable supplies held for consumption by all departments of the City. The cost is recorded as expenditure at the time individual inventory items are withdrawn for use (consumption method). The General Fund supplies amount is equally offset by non-spendable fund balance, which indicates that it does not constitute expendable available financial resources. Supplies in the enterprise funds consist principally of materials and supplies for utility operations and are expensed as consumed.
60
City of San Mateo Notes to Basic Financial Statements For the year ended June 30, 2018
1. SUMMARY OF SIGNIFICANT ACCOUNTING POLICIES, Continued
F. Capital Assets Capital assets, which include land, buildings, improvements, equipment, furniture, and infrastructure assets (e.g. roads, sidewalks, and similar items), are reported in the applicable governmental or business-type activities in the Government-Wide Financial Statements. Capital assets are recorded at historical cost or estimated historical cost if actual cost is not available. Donated assets are valued at acquisition value on the date donated. City policy has set the capitalization threshold for reporting capital assets at the following:
General Capital Assets $10,000 Infrastructure Capital Assets $100,000 Intangible Assets associated with Real Property $1,000,000
For capital assets, depreciation is recorded on a straight-line basis over the useful lives of the assets as follows:
Sewer Treatment Plant and Transmission Lines 60 years Buildings and Improvements 20 - 35 years Machinery and Equipment 3 – 15 years Infrastructure 25 – 50 years
The City defines infrastructure as the basic physical assets that allow the City to function. The assets include:
Street systems Site amenities such as parking and landscaped areas used by the City in the conduct of its
business Each major infrastructure system can be divided into subsystems. For example, the street system can be subdivided into pavement, curb and gutters, sidewalks, medians, streetlights, traffic control devices (signs, signals and pavement markings), landscaping and land. These subsystems were not delineated in the Basic Financial Statements. The appropriate operating department maintains information regarding the subsystems. The City elected to use the Basic Approach as defined by GASB Statement No. 34 for infrastructure reporting. The City conducted a valuation of its infrastructure assets as of July 1, 2002. This valuation determined the original cost using one of the following methods:
Use of historical records where available. Standard unit costs appropriate for the construction/acquisition date. Present cost indexed by a reciprocal factor of the price increase from the
construction/acquisition date to the current date.
61
City of San Mateo Notes to Basic Financial Statements For the year ended June 30, 2018
1. SUMMARY OF SIGNIFICANT ACCOUNTING POLICIES, Continued
F. Capital Assets, Continued Accumulated depreciation is defined as the total depreciation from the date of construction/acquisition to the current date on a straight-line method using industry accepted life expectancies for each infrastructure subsystem. The book value was then computed by deducting the accumulated depreciation from the original cost. Interest accrued during capital assets construction, if any, is capitalized for the business-type activities as part of the asset cost.
G. Interest Payable In the Government-Wide Financial Statements, interest payable on long-term debt is recognized as the liability is incurred for governmental fund types and proprietary fund types. In the Fund Financial Statements, proprietary fund types recognize the interest payable when the liability is incurred.
H. Unearned revenue Unearned revenue is recognized for transactions for which revenue has not yet been earned. Typical transactions recorded as unearned revenues in the Government-Wide Financial Statements are prepaid charges for services. On the Construction Services Special Revenue Fund, the City elected to defer the revenue for projects expected longer than two years and have permitting revenue of greater than $1.5 million, and recognize the revenue evenly over the estimated project’s life.
I. Claims and Judgments The short-term and long-term workers’ compensation claims liability is reported in the Workers’ Compensation Insurance Internal Service Fund. The short-term and long-term general claims liability is reported in the Comprehensive Liability Insurance Internal Service Fund. The short-term liability which will be liquidated with current financial resources is the amount of settlement reached, but unpaid, related to claims and judgments entered.
J. Long-Term Debt Government-Wide Financial Statements – Long-term debt and other long-term obligations are reported as liabilities in the appropriate activities. Bond premiums and discounts are amortized over the life of the bonds using the effective interest method. Bonds payable is reported net of the applicable bond premium or discount. Bond issuance costs, except any portion related to prepaid insurance costs, are recognized as an expense in the period incurred.
62

City of San Mateo Notes to Basic Financial Statements For the year ended June 30, 2018
1. SUMMARY OF SIGNIFICANT ACCOUNTING POLICIES, Continued J. Long-Term Debt, Continued
Fund Financial Statements – The governmental fund financial statements do not present long-term debt. As such, long-term debt is shown in the Reconciliation of the Governmental Funds Balance Sheet to the Government-Wide Statement of Net Position. Bond premiums and discounts are recognized during the current period as other financing sources or uses. Issuance costs, whether or not withheld from the actual debt proceeds received, are reported as debt service expenditures. Bond proceeds are reported as other financing sources. Proprietary Fund and Fiduciary Fund Financial Statements use the same principles as those used in the Government-Wide Financial Statements.
K. Property Taxes San Mateo County (County) assesses properties and it bills, collects, and distributes property taxes to all taxing entities within its jurisdiction including the City. Under State law, known as the Teeter Plan, the County remits the entire amount levied and handles all delinquencies, retaining interest and penalties. Secured and unsecured property taxes are levied on January 1. Secured property tax is due in two installments, on November 1 and March 1, and becomes a lien on those dates. It becomes delinquent on December 10 and April 10, respectively. Unsecured property tax is due on July 1, and becomes delinquent on August 31. Collection of delinquent accounts is the responsibility of the County, which retains all penalties. The term “unsecured” refers to taxes on personal property other than real estate, land and buildings. These taxes are secured by liens on the property being taxed. Property tax revenues are recognized by the City in the fiscal year they are levied provided they become available as defined above.
L. Deferred Outflows/Inflows of Resources
In addition to assets, the statement of net position (balance sheet) will sometimes report a separate section for deferred outflows of resources. This separate financial statement element, deferred outflows of resources, represents a consumption of net position that applies to a future period(s) and so will not be recognized as an outflow of resources (expense/expenditure) until then. In addition to liabilities, the statement of net position (balance sheet) will sometimes report a separate section for deferred inflows of resources. This separate financial statement element, deferred inflows of resources, represents an acquisition of net position that applies to a future period(s) and so will not be recognized as an inflow of resources (revenue) until that time.
63

City of San Mateo Notes to Basic Financial Statements For the year ended June 30, 2018
1. SUMMARY OF SIGNIFICANT ACCOUNTING POLICIES, Continued M. Net Position
Government-Wide Financial Statements In the Government-Wide Financial Statements, net position are classified in the following categories: Net Investment in Capital Assets – This amount consists of capital assets net of accumulated depreciation and reduced by outstanding debt that is attributed to the acquisition, construction, or improvement of the assets. Restricted – This amount is restricted by external creditors, grantors, contributors, or laws or regulations of governments. Unrestricted – This amount is all net position that does not meet the definition of “net investment in capital assets” or “restricted net position” as defined above. When an expense is incurred for purposes for which both restricted and unrestricted net position are available, the City’s policy is to apply restricted net position first.
N. Fund Balances Fund Financial Statements In February 2009, the Governmental Accounting Standards Board (GASB) issued Statement 54, Fund Balance Reporting and Governmental Fund Type Definitions (GASB 54). The new classifications of fund balances are listed below: Non-spendable Fund Balances These include amounts that cannot be spent because they are either (a) not in spendable form or (b) legally or contractually required to be maintained intact, e.g., the principal of an endowment fund. Examples of “not in spendable form” include inventory, prepaid amounts, long-term notes and loans, property held for resale and other items not expected to be converted to cash. However, if the proceeds from the eventual sale or liquidation of the items would be considered restricted, committed or assigned (as defined further on) then these amounts would be included in the restricted, committed or assigned instead of the non-spendable classification. A debt service reserve fund held by a trustee is an example of fund balance in non-spendable form that is classified as restricted instead of non-spendable since the reserve is eventually liquidated to make the final debt service principal payment.
64
City of San Mateo Notes to Basic Financial Statements For the year ended June 30, 2018
1. SUMMARY OF SIGNIFICANT ACCOUNTING POLICIES, Continued
N. Fund Balances, Continued Restricted Fund Balances Restricted fund balances have externally enforceable limitations on use. The limitations on use can be imposed by creditors, grantors, or contributors as well as by constitutional provisions, City charter, enabling legislation, laws and government regulations. Examples of funds subject to limitation by grantors include Federal American Recovery and Reinvestment Act (ARRA) grants for street rehabilitation, FEMA assistance to firefighters grants for safety equipment, the Office of Traffic Safety grant for the Selective Traffic Enforcement Program, the Community Block Development Grant and the portion of the fund balance in the City Housing Fund remaining from a former Federal Rental Rehabilitation program and loan payments from the First Time Homebuyer Program. Taxes and assessments collected under voter-approved indebtedness, revenues pledged by indenture to secure debt repayment, debt service reserve funds and the unspent fund balances from these revenues are examples of fund balances subject to limitations imposed by creditors. Developer impact fees, Measure A sales tax, the gas tax, the ½ cent public safety sales tax, and the Measure C 2% Transient Occupancy Tax (TOT) are examples of revenue enabled by legislation or government regulation for which the unspent balance would be classified as restricted in the fund within which they are accounted. Committed Fund Balances
Amounts that can only be used for specific purposes pursuant to constraints imposed by formal action (Resolution) of the City Council are classified as committed fund balances. The formal action that is required to be taken to establish, modify, or rescind the fund balance commitment is resolution. In the City of San Mateo, this category generally is comprised of amounts committed to specific projects in Capital Improvement Program and the special revenue funds for Solid Waste, Fire Protection and Life Safety, Advance Planning, Construction Services, Parking, Parks and Recreation, Traffic Impact Fee, and Commercial Linkage Fee. The General Fund transfers to specific projects in the Capital Improvement Fund are committed once approved by the City Council and under the City Charter cannot be used for any purpose other than specified without subsequent Council action. The special revenue funds Solid Waste, Fire Protection and Life Safety, Advance Planning, Construction Services, Parking, Parks and Recreation, Traffic Impact Fee, and Commercial Linkage Fee have been established by the City Council to account for and report specified revenue that is committed to fund expenditures for specified purposes. A substantial portion of the revenue in each of these funds is generated from fees charged to provide the services and conduct the activities related to the funds’ stated purposes. The fees are established in the Comprehensive Fee Schedule that the City Council approves annually after holding public hearings.
65

City of San Mateo Notes to Basic Financial Statements For the year ended June 30, 2018
1. SUMMARY OF SIGNIFICANT ACCOUNTING POLICIES, Continued
N. Fund Balances, Continued Assigned Fund Balances Fund balance amounts for which the City Council has expressed intent for use but not taken formal action to commit are reported as assigned under GASB 54. These include funds encumbered by purchase order in the General Fund for which the authorization has not lapsed, amounts held in petty cash accounts in the General Fund, interest accrued to restricted or committed fund balances when such interest is not required to be classified as restricted or committed and the operating budget contingency. The City Council has not delegated the authority to assign fund balance to management. Unassigned Fund Balance The residual classification for the General Fund, collectively comprised of the General Fund, the Reserves Fund and Recreational Services Fund, is unassigned fund balance. The General Fund is the only fund that may report a positive unassigned balance. An example of residual revenue which would comprise the Unassigned Fund Balance in the General Fund is the unspent portion of the additional 0.25% sales tax and 2% Transient Occupancy Tax approved by voters as Measure L, M and S to fund the City’s general operating services. Although the Reserves Fund is included in the unassigned fund balance classification, it is used to account for amounts set aside by City Council action as Reserves for Contingency pursuant to the City Charter. The balance in the Reserves Fund is not available for appropriation unless the Council takes action to transfer amounts to another fund for appropriation to proposed expenditures it deems consistent with the purpose of the reserves. Hierarchy of Expenditures to Classify Fund Balance Amounts To determine the composition of ending fund balances, the Council established the order in which restricted and unrestricted (committed, assigned and unassigned) funds are to be expended. To this purpose, for expenditures made in any governmental fund, the restricted amounts will be reduced first, followed by committed amounts, assigned amounts, and then unassigned amounts. The City uses encumbrance accounting throughout the fiscal year to encumber appropriations based upon purchase orders issued to the City’s vendors. Encumbrances outstanding at year-end are reported as expenditures in the budgetary financial statements reported in the Required Supplementary Information and the Supplementary Information. General Fund encumbrances not lapsed at year-end are reported as assigned amounts. For all other funds, encumbrances not lapsed at year-end are reported as part of the funds’ restricted or committed balances according to the original source of funds.
66
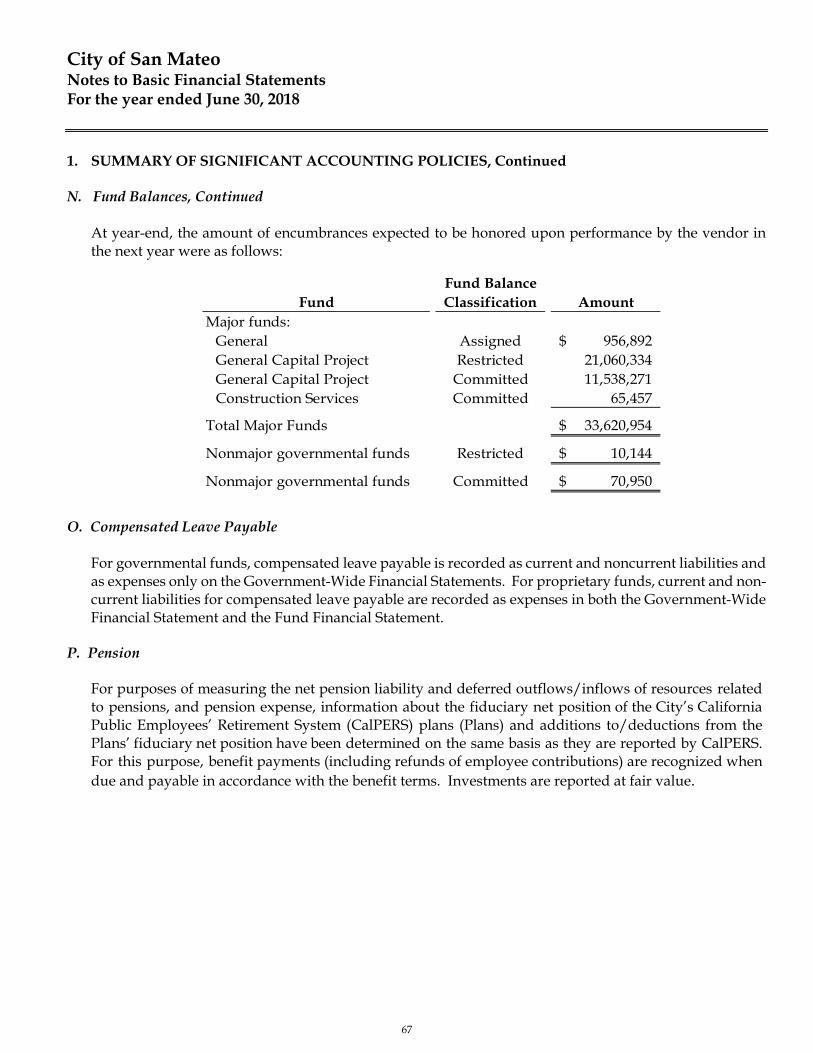
City of San Mateo Notes to Basic Financial Statements For the year ended June 30, 2018
1. SUMMARY OF SIGNIFICANT ACCOUNTING POLICIES, Continued
N. Fund Balances, Continued At year-end, the amount of encumbrances expected to be honored upon performance by the vendor in the next year were as follows:
FundFund Balance Classification Amount
Major funds:General Assigned 956,892$ General Capital Project Restricted 21,060,334 General Capital Project Committed 11,538,271 Construction Services Committed 65,457
Total Major Funds 33,620,954$
Nonmajor governmental funds Restricted 10,144$
Nonmajor governmental funds Committed 70,950$
O. Compensated Leave Payable
For governmental funds, compensated leave payable is recorded as current and noncurrent liabilities and as expenses only on the Government-Wide Financial Statements. For proprietary funds, current and non-current liabilities for compensated leave payable are recorded as expenses in both the Government-Wide Financial Statement and the Fund Financial Statement.
P. Pension
For purposes of measuring the net pension liability and deferred outflows/inflows of resources related to pensions, and pension expense, information about the fiduciary net position of the City’s California Public Employees’ Retirement System (CalPERS) plans (Plans) and additions to/deductions from the Plans’ fiduciary net position have been determined on the same basis as they are reported by CalPERS. For this purpose, benefit payments (including refunds of employee contributions) are recognized when due and payable in accordance with the benefit terms. Investments are reported at fair value.
67

City of San Mateo Notes to Basic Financial Statements For the year ended June 30, 2018
1. SUMMARY OF SIGNIFICANT ACCOUNTING POLICIES, Continued
Q. Other Postemployment Benefits (OPEB) For purposes of measuring the net OPEB liability, deferred outflows of resources and deferred inflows of
resources related to OPEB, and OPEB expense, information about the fiduciary net position of the City’s plan (OPEB Plan) and additions to/deductions from the OPEB Plan’s fiduciary net position have been determined on the same basis. For this purpose, benefit payments are recognized when currently due and payable in accordance with the benefit terms. Investments are reported at fair value. Generally accepted accounting principles require that the reported results must pertain to liability and asset information within certain defined timeframes. For this report, the following timeframes are used:
Valuation Date June 30, 2017 Measurement Date June 30, 2017 Measurement Period July 1, 2016 to June 30, 2017
R. Use of Estimates
The preparation of the Basic Financial Statements in conformity with GAAP requires management to make estimates and assumptions. These estimates and assumptions affect the reported amounts of assets and liabilities and the disclosure of contingent assets and liabilities. In addition, estimates affect the reported amounts of revenues and expenses. Actual results could differ from these estimates and assumptions.
S. New Pronouncements
In 2018, the City adopted new accounting standards in order to conform to the following Governmental Accounting Standards Board Statements: GASB Statement No. 75, Accounting and Financial Reporting for Postemployment Benefits Other Than
Pensions - The objective of this statement is to address reporting by governments that provide other postemployment benefits (OPEB) to their employees and for governments that finance OPEB for employees of other governments. The City restated its beginning net position as part of implementation of this statement.
GASB Statement No. 81, Irrevocable Split-Interest Agreements – The objective of this statement is to improve accounting and financial reporting for irrevocable split-interest agreements by providing recognition and measurement guidance for situations in which a government is a beneficiary of the agreement. The requirements of this statement did not apply to the City for the current fiscal year.
68
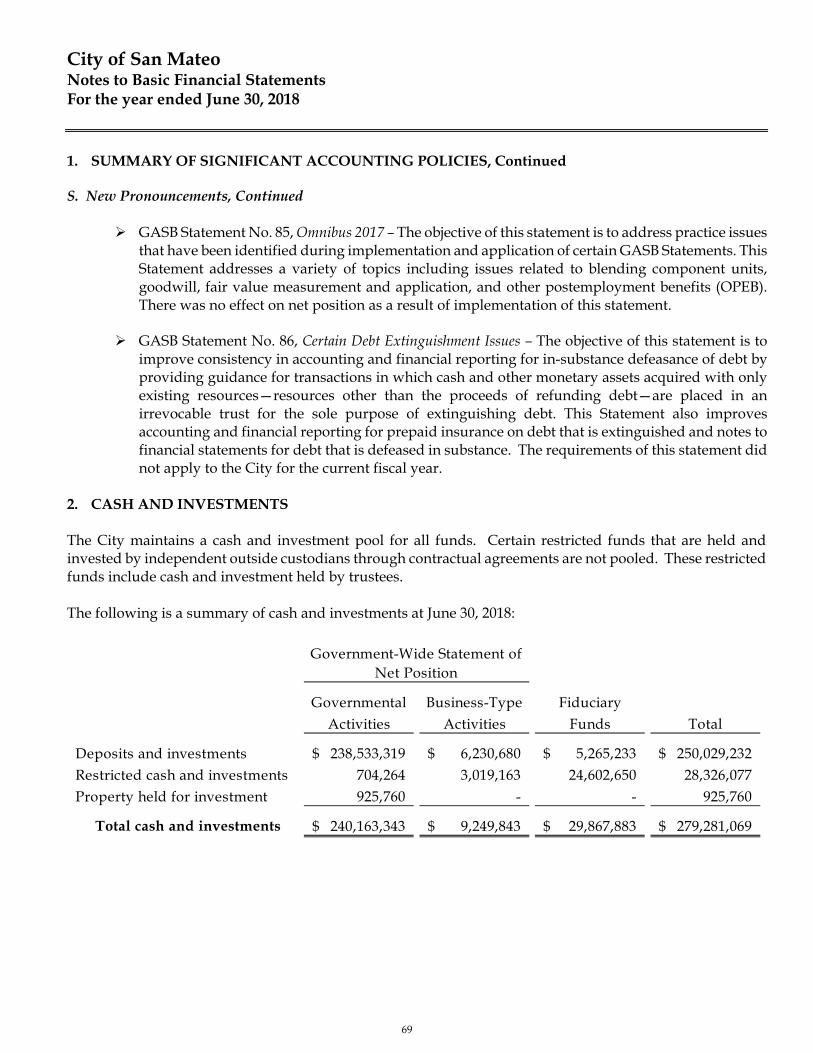
City of San Mateo Notes to Basic Financial Statements For the year ended June 30, 2018
1. SUMMARY OF SIGNIFICANT ACCOUNTING POLICIES, Continued
S. New Pronouncements, Continued
GASB Statement No. 85, Omnibus 2017 – The objective of this statement is to address practice issues that have been identified during implementation and application of certain GASB Statements. This Statement addresses a variety of topics including issues related to blending component units, goodwill, fair value measurement and application, and other postemployment benefits (OPEB). There was no effect on net position as a result of implementation of this statement.
GASB Statement No. 86, Certain Debt Extinguishment Issues – The objective of this statement is to
improve consistency in accounting and financial reporting for in-substance defeasance of debt by providing guidance for transactions in which cash and other monetary assets acquired with only existing resources—resources other than the proceeds of refunding debt—are placed in an irrevocable trust for the sole purpose of extinguishing debt. This Statement also improves accounting and financial reporting for prepaid insurance on debt that is extinguished and notes to financial statements for debt that is defeased in substance. The requirements of this statement did not apply to the City for the current fiscal year.
2. CASH AND INVESTMENTS The City maintains a cash and investment pool for all funds. Certain restricted funds that are held and invested by independent outside custodians through contractual agreements are not pooled. These restricted funds include cash and investment held by trustees. The following is a summary of cash and investments at June 30, 2018:
Governmental Business-Type FiduciaryActivities Activities Funds Total
Deposits and investments 238,533,319$ 6,230,680$ 5,265,233$ 250,029,232$ Restricted cash and investments 704,264 3,019,163 24,602,650 28,326,077 Property held for investment 925,760 - - 925,760
Total cash and investments 240,163,343$ 9,249,843$ 29,867,883$ 279,281,069$
Government-Wide Statement of Net Position
69
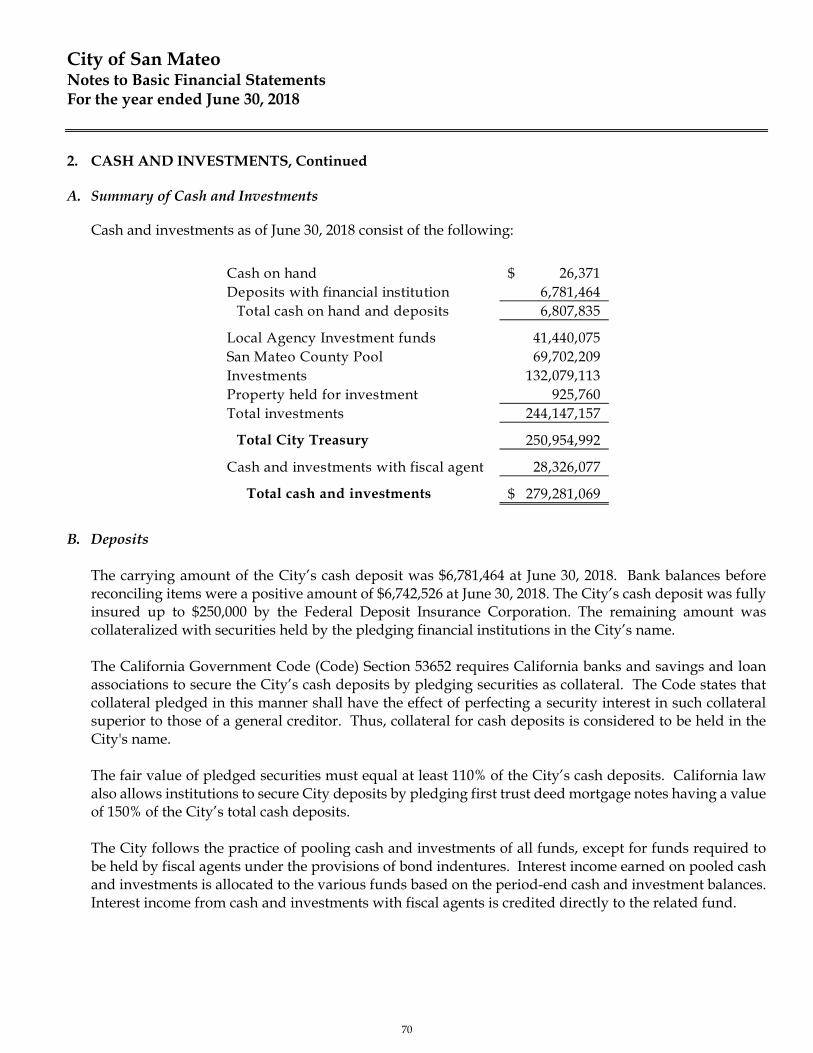
City of San Mateo Notes to Basic Financial Statements For the year ended June 30, 2018
2. CASH AND INVESTMENTS, Continued
A. Summary of Cash and Investments
Cash and investments as of June 30, 2018 consist of the following:
Cash on hand 26,371$ Deposits with financial institution 6,781,464
Total cash on hand and deposits 6,807,835
Local Agency Investment funds 41,440,075 San Mateo County Pool 69,702,209 Investments 132,079,113 Property held for investment 925,760 Total investments 244,147,157
Total City Treasury 250,954,992
Cash and investments with fiscal agent 28,326,077
Total cash and investments 279,281,069$
B. Deposits
The carrying amount of the City’s cash deposit was $6,781,464 at June 30, 2018. Bank balances before reconciling items were a positive amount of $6,742,526 at June 30, 2018. The City’s cash deposit was fully insured up to $250,000 by the Federal Deposit Insurance Corporation. The remaining amount was collateralized with securities held by the pledging financial institutions in the City’s name. The California Government Code (Code) Section 53652 requires California banks and savings and loan associations to secure the City’s cash deposits by pledging securities as collateral. The Code states that collateral pledged in this manner shall have the effect of perfecting a security interest in such collateral superior to those of a general creditor. Thus, collateral for cash deposits is considered to be held in the City's name. The fair value of pledged securities must equal at least 110% of the City’s cash deposits. California law also allows institutions to secure City deposits by pledging first trust deed mortgage notes having a value of 150% of the City’s total cash deposits. The City follows the practice of pooling cash and investments of all funds, except for funds required to be held by fiscal agents under the provisions of bond indentures. Interest income earned on pooled cash and investments is allocated to the various funds based on the period-end cash and investment balances. Interest income from cash and investments with fiscal agents is credited directly to the related fund.
70
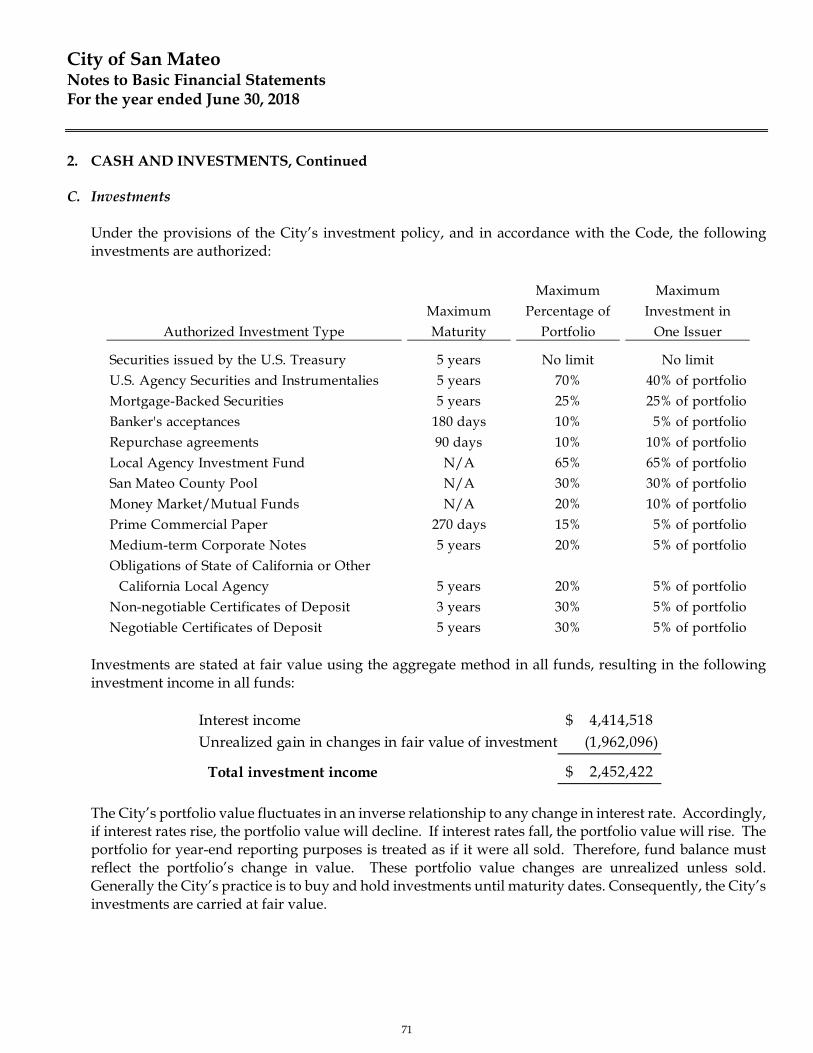
City of San Mateo Notes to Basic Financial Statements For the year ended June 30, 2018
2. CASH AND INVESTMENTS, Continued
C. Investments Under the provisions of the City’s investment policy, and in accordance with the Code, the following investments are authorized:
Maximum MaximumMaximum Percentage of Investment in
Authorized Investment Type Maturity Portfolio One Issuer
Securities issued by the U.S. Treasury 5 years No limit No limitU.S. Agency Securities and Instrumentalies 5 years 70% 40% of portfolioMortgage-Backed Securities 5 years 25% 25% of portfolioBanker's acceptances 180 days 10% 5% of portfolioRepurchase agreements 90 days 10% 10% of portfolioLocal Agency Investment Fund N/A 65% 65% of portfolioSan Mateo County Pool N/A 30% 30% of portfolioMoney Market/Mutual Funds N/A 20% 10% of portfolioPrime Commercial Paper 270 days 15% 5% of portfolioMedium-term Corporate Notes 5 years 20% 5% of portfolioObligations of State of California or Other
California Local Agency 5 years 20% 5% of portfolioNon-negotiable Certificates of Deposit 3 years 30% 5% of portfolioNegotiable Certificates of Deposit 5 years 30% 5% of portfolio
Investments are stated at fair value using the aggregate method in all funds, resulting in the following investment income in all funds:
The City’s portfolio value fluctuates in an inverse relationship to any change in interest rate. Accordingly, if interest rates rise, the portfolio value will decline. If interest rates fall, the portfolio value will rise. The portfolio for year-end reporting purposes is treated as if it were all sold. Therefore, fund balance must reflect the portfolio’s change in value. These portfolio value changes are unrealized unless sold. Generally the City’s practice is to buy and hold investments until maturity dates. Consequently, the City’s investments are carried at fair value.
Interest income 4,414,518$ Unrealized gain in changes in fair value of investment (1,962,096)
Total investment income 2,452,422$
71

City of San Mateo Notes to Basic Financial Statements For the year ended June 30, 2018
2. CASH AND INVESTMENTS, Continued
C. Investments, Continued
The City is a voluntary participant in the Local Agency Investment Fund (LAIF) that is regulated by Code Section 16429 under the oversight of the Treasurer of the State of California. The City’s investments with LAIF at June 30, 2018, include a portion of the pool funds invested in Structured Notes and Asset-Backed Securities. These investments include the following:
Structured Notes – are debt securities (other than asset-backed securities) whose cash flow characteristics (coupon rate, redemption amount, or stated maturity) depend upon one or more indices and/or have embedded forwards or options. Asset-Backed Securities – the bulk of which are mortgage-backed securities, entitle their purchasers to receive a share of the cash flows from a pool of assets such as principal and interest repayments from a pool of mortgages (such as Collateralized Mortgage Obligations) or credit card receivables.
As of June 30, 2018, the City had $41,440,075 invested in LAIF, which had invested 2.67% of the pool investment funds in Structured Notes and Asset-Backed Securities as compared to 2.89% in the previous year. The LAIF fair value factor of 0.998126 was used to calculate the fair value of the investments in LAIF.
The City is also a voluntary participant in the San Mateo County Investment Fund (County Pool) that is regulated by Code Section 16429 under the oversight of the Treasurer of the County. The City reports its investment in the County Pool at the fair value amount provided by the County. Included in the County Pool’s investment portfolio are US Treasury Notes, Obligations issued by agencies of the United States Government, LAIF, Corporate Notes, Commercial Paper, collateralized mortgage obligations, mortgage-backed securities, other asset-backed securities, and floating rate securities issued by federal agencies, government-sponsored enterprises, and corporations. The fair value factor of 0.99548 was used to calculate the fair value of the investments in the County Pool.
D. Risk Disclosures
Interest Risk: Interest rate risk is the market value fluctuation due to overall changes in the interest rates. It is mitigated by limiting the average maturity of the City’s portfolio not to exceed three years.
72
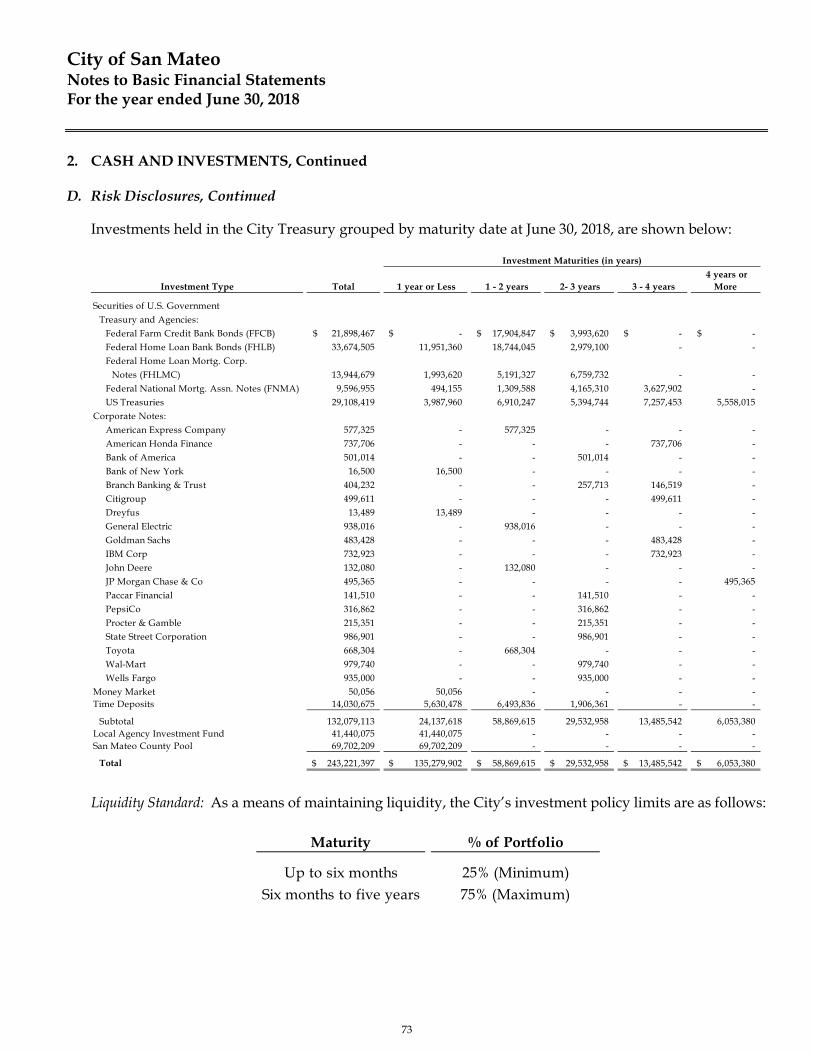
City of San Mateo Notes to Basic Financial Statements For the year ended June 30, 2018
2. CASH AND INVESTMENTS, Continued D. Risk Disclosures, Continued
Investments held in the City Treasury grouped by maturity date at June 30, 2018, are shown below:
Investment Type Total 1 year or Less 1 - 2 years 2- 3 years 3 - 4 years 4 years or
More
Securities of U.S. Government Treasury and Agencies:
Federal Farm Credit Bank Bonds (FFCB) 21,898,467$ -$ 17,904,847$ 3,993,620$ -$ -$ Federal Home Loan Bank Bonds (FHLB) 33,674,505 11,951,360 18,744,045 2,979,100 - - Federal Home Loan Mortg. Corp.
Notes (FHLMC) 13,944,679 1,993,620 5,191,327 6,759,732 - - Federal National Mortg. Assn. Notes (FNMA) 9,596,955 494,155 1,309,588 4,165,310 3,627,902 - US Treasuries 29,108,419 3,987,960 6,910,247 5,394,744 7,257,453 5,558,015
Corporate Notes:American Express Company 577,325 - 577,325 - - - American Honda Finance 737,706 - - - 737,706 - Bank of America 501,014 - - 501,014 - - Bank of New York 16,500 16,500 - - - - Branch Banking & Trust 404,232 - - 257,713 146,519 - Citigroup 499,611 - - - 499,611 - Dreyfus 13,489 13,489 - - - - General Electric 938,016 - 938,016 - - - Goldman Sachs 483,428 - - - 483,428 - IBM Corp 732,923 - - - 732,923 - John Deere 132,080 - 132,080 - - - JP Morgan Chase & Co 495,365 - - - - 495,365 Paccar Financial 141,510 - - 141,510 - - PepsiCo 316,862 - - 316,862 - - Procter & Gamble 215,351 - - 215,351 - - State Street Corporation 986,901 - - 986,901 - - Toyota 668,304 - 668,304 - - - Wal-Mart 979,740 - - 979,740 - - Wells Fargo 935,000 - - 935,000 - -
Money Market 50,056 50,056 - - - - Time Deposits 14,030,675 5,630,478 6,493,836 1,906,361 - -
Subtotal 132,079,113 24,137,618 58,869,615 29,532,958 13,485,542 6,053,380 Local Agency Investment Fund 41,440,075 41,440,075 - - - - San Mateo County Pool 69,702,209 69,702,209 - - - -
Total 243,221,397$ 135,279,902$ 58,869,615$ 29,532,958$ 13,485,542$ 6,053,380$
Investment Maturities (in years)
Liquidity Standard: As a means of maintaining liquidity, the City’s investment policy limits are as follows:
Maturity % of Portfolio
Up to six months 25% (Minimum)Six months to five years 75% (Maximum)
73

City of San Mateo Notes to Basic Financial Statements For the year ended June 30, 2018
2. CASH AND INVESTMENTS, Continued D. Risk Disclosures, Continued
Credit Risk: Credit risk is the risk that a security or a portfolio will lose some or all of its value due to a real or perceived change in the ability of the issuer to repay its debt. According to the City’s investment policy, no more than 5% or 10% of the total portfolio (10% for commercial paper and medium term notes) may be invested in securities of any single issuer, other than the US Government, its agencies and instrumentalities, San Mateo County Pool and LAIF. If a security is downgraded by either Moody’s or S&P to a level below the minimum quality required by the City, it shall be the City’s policy to sell that security as soon as practicable. At June 30, 2018, the City’s deposits and investments were rated as follows:
Custodial Credit Risk: For an investment, custodial credit risk is the risk that, in the event of the failure of the counterparty, the City will not be able to recover the value of its investments or collateral securities that are in the possession of an outside party. None of the City’s investments were subject to custodial credit risk.
Moody's S&P
Deposits P-1 A1Investments:Securities of U.S. Government Agencies:
Federal Farm Credit Bank Bonds (FFCB) Aaa AA+Federal Home Loan Bank Bonds (FHLB) Aaa AA+Federal Home Loan Mortg. Corp. Notes (FHLMC) Aaa AA+Federal National Mortg. Assn. Notes (FNMA) Aaa AA+US Treasuries Aaa AA+
Corporate Notes:American Express Company A3 A-American Honda Finance A1 A+Bank of America A3 A-Bank of New York Aa3 AA-Branch Banking & Trust A3 A-Citigroup Baa1 BBB+Dreyfus Aa3 AAAmGeneral Electric A2 AGoldman Sachs Baa1 BBB+IBM Corp A1 A+John Deere A2 AJP Morgan Chase & Co A3 A-Paccar Financial A1 A+PepsiCo A1 A+Procter & Gamble Aa3 AA-State Street Corporation A2 AToyota Aa3 AA-Wal-Mart WR AAWells Fargo A3 A-
Local Agency Investment Funds Not Rated Not RatedSan Mateo County Pool Not Rated Not RatedMoney Market Funds Aaa AAA
Credit Quality Ratings
74

City of San Mateo Notes to Basic Financial Statements For the year ended June 30, 2018
2. CASH AND INVESTMENTS, Continued
E. Investment Valuation, Continued
Investments (except for money market accounts, time deposits, and commercial paper) are measured at fair value on a recurring basis. Recurring fair value measurements, are those that Governmental Accounting Standards Board (GASB) Statements require or permit in the statement of net position at the end of each reporting period. Fair value measurements are categorized based on the valuation inputs used to measure an asset’s fair value: Level 1 inputs are quoted prices in active markets for identical assets; Level 2 inputs are significant other observable inputs; Level 3 inputs are significant unobservable inputs. Investment fair value measurements at June 30, 2018 are described on the following page. Investments included in restricted cash and investments included money market accounts and guaranteed investment contracts are not subject to fair value measurements.
Investment Type Fair Value Level 1 Level 2 Level 3
Securities of U.S. GovernementTreasury and Agencies:
Federal Farm Credit Bank Bonds (FFCB) 21,898,467$ -$ 21,898,467$ -$ Federal Home Loan Banks (FHLB) 33,674,505 - 33,674,505 - Federal Home Loan Mortg Corp Notes (FHLMC) 13,944,679 - 13,944,679 - Federal National Mortg Assoc Notes (FNMA) 9,596,955 - 9,596,955 - US Treasuries 29,108,419 - 29,108,419 -
Corporate Notes:American Express Company 577,325 - 577,325 - American Honda Finance 737,706 - 737,706 - Bank of America 501,014 - 501,014 - Bank of New York 16,500 - 16,500 - Branch Banking & Trust 404,232 - 404,232 - Citigroup 499,611 - 499,611 - Dreyfus 13,489 - 13,489 - General Electric 938,016 - 938,016 - Goldman Sachs 483,428 - 483,428 - IBM Corp 732,923 - 732,923 - John Deere 132,080 - 132,080 - JP Morgan Chase & Co 495,365 - 495,365 - Paccar Financial 141,510 - 141,510 - PepsiCo 316,862 - 316,862 - Procter & Gamble 215,351 - 215,351 - State Street Corporation 986,901 - 986,901 - Toyota 668,304 - 668,304 - Wal-Mart 979,740 - 979,740 - Wells Fargo 935,000 - 935,000 -
Property held for investment 925,760 - - 925,760 Total investments subject to fair value 118,924,142 -$ 117,998,382$ 925,760$
Investments not subject to fair value measurement:Money Market 50,056 Time Deposits 14,030,675 Local Agency Investment Fund 41,440,075 San Mateo County Pool 69,702,209
Total Investments 244,147,157$
Fair Value Measurement Using
75
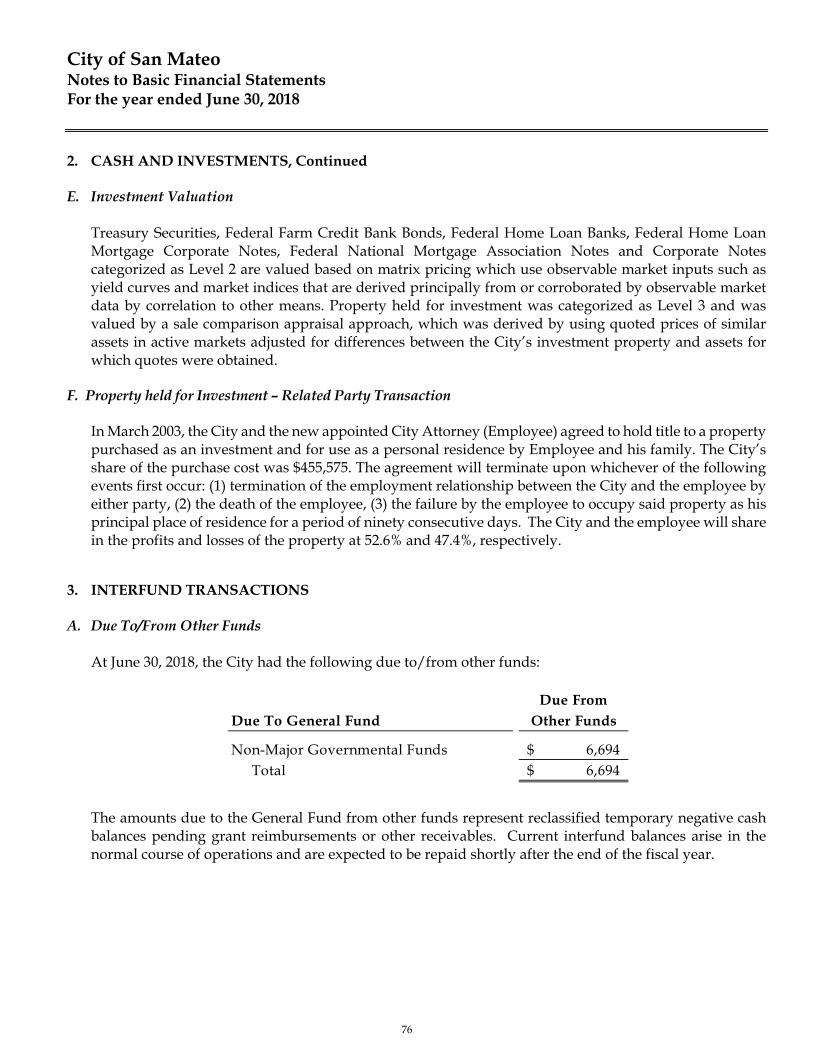
City of San Mateo Notes to Basic Financial Statements For the year ended June 30, 2018
2. CASH AND INVESTMENTS, Continued
E. Investment Valuation
Treasury Securities, Federal Farm Credit Bank Bonds, Federal Home Loan Banks, Federal Home Loan Mortgage Corporate Notes, Federal National Mortgage Association Notes and Corporate Notes categorized as Level 2 are valued based on matrix pricing which use observable market inputs such as yield curves and market indices that are derived principally from or corroborated by observable market data by correlation to other means. Property held for investment was categorized as Level 3 and was valued by a sale comparison appraisal approach, which was derived by using quoted prices of similar assets in active markets adjusted for differences between the City’s investment property and assets for which quotes were obtained.
F. Property held for Investment – Related Party Transaction
In March 2003, the City and the new appointed City Attorney (Employee) agreed to hold title to a property purchased as an investment and for use as a personal residence by Employee and his family. The City’s share of the purchase cost was $455,575. The agreement will terminate upon whichever of the following events first occur: (1) termination of the employment relationship between the City and the employee by either party, (2) the death of the employee, (3) the failure by the employee to occupy said property as his principal place of residence for a period of ninety consecutive days. The City and the employee will share in the profits and losses of the property at 52.6% and 47.4%, respectively.
3. INTERFUND TRANSACTIONS
A. Due To/From Other Funds At June 30, 2018, the City had the following due to/from other funds:
Due FromDue To General Fund Other Funds
Non-Major Governmental Funds 6,694$ Total 6,694$
The amounts due to the General Fund from other funds represent reclassified temporary negative cash balances pending grant reimbursements or other receivables. Current interfund balances arise in the normal course of operations and are expected to be repaid shortly after the end of the fiscal year.
76
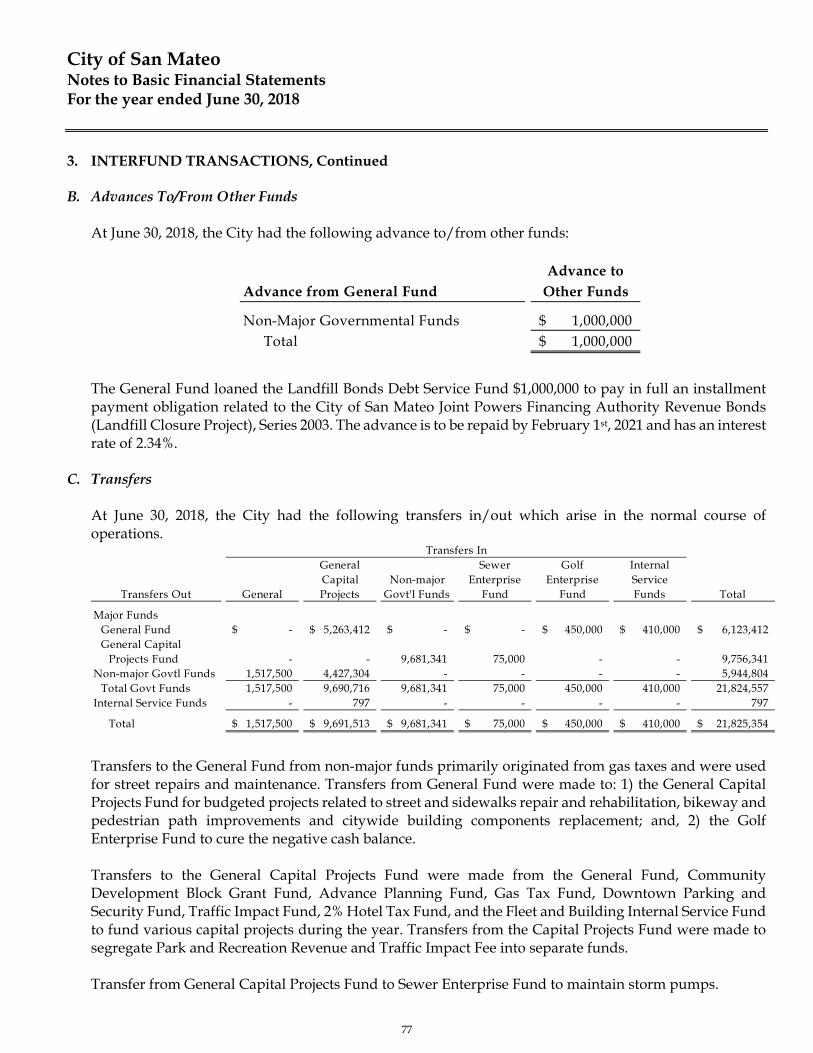
City of San Mateo Notes to Basic Financial Statements For the year ended June 30, 2018
3. INTERFUND TRANSACTIONS, Continued
B. Advances To/From Other Funds
At June 30, 2018, the City had the following advance to/from other funds:
Advance toAdvance from General Fund Other Funds
Non-Major Governmental Funds 1,000,000$ Total 1,000,000$
The General Fund loaned the Landfill Bonds Debt Service Fund $1,000,000 to pay in full an installment payment obligation related to the City of San Mateo Joint Powers Financing Authority Revenue Bonds (Landfill Closure Project), Series 2003. The advance is to be repaid by February 1st, 2021 and has an interest rate of 2.34%.
C. Transfers
At June 30, 2018, the City had the following transfers in/out which arise in the normal course of operations.
Transfers Out General
General Capital Projects
Non-major Govt'l Funds
Sewer Enterprise
Fund
Golf Enterprise
Fund
Internal Service Funds Total
Major FundsGeneral Fund -$ 5,263,412$ -$ -$ 450,000$ 410,000$ 6,123,412$ General Capital
Projects Fund - - 9,681,341 75,000 - - 9,756,341 Non-major Govtl Funds 1,517,500 4,427,304 - - - - 5,944,804
Total Govt Funds 1,517,500 9,690,716 9,681,341 75,000 450,000 410,000 21,824,557 Internal Service Funds - 797 - - - - 797
Total 1,517,500$ 9,691,513$ 9,681,341$ 75,000$ 450,000$ 410,000$ 21,825,354$
Transfers In
Transfers to the General Fund from non-major funds primarily originated from gas taxes and were used for street repairs and maintenance. Transfers from General Fund were made to: 1) the General Capital Projects Fund for budgeted projects related to street and sidewalks repair and rehabilitation, bikeway and pedestrian path improvements and citywide building components replacement; and, 2) the Golf Enterprise Fund to cure the negative cash balance. Transfers to the General Capital Projects Fund were made from the General Fund, Community Development Block Grant Fund, Advance Planning Fund, Gas Tax Fund, Downtown Parking and Security Fund, Traffic Impact Fund, 2% Hotel Tax Fund, and the Fleet and Building Internal Service Fund to fund various capital projects during the year. Transfers from the Capital Projects Fund were made to segregate Park and Recreation Revenue and Traffic Impact Fee into separate funds. Transfer from General Capital Projects Fund to Sewer Enterprise Fund to maintain storm pumps.
77

City of San Mateo Notes to Basic Financial Statements For the year ended June 30, 2018
4. LOANS AND NOTES RECEIVABLE The City acting as the successor agency of the former redevelopment agency engages in programs designed to encourage construction or improvement in low-to-moderate income housing or other projects. Under these programs, loans are provided under favorable terms to homeowners or developers who agree to spend these funds in accordance with the City’s terms. The amounts for potential loan forgiveness represent the best estimate of the amount of loans receivable that may not be collectible from borrowers. It does not necessarily reflect subsequent actual payments, which could differ from expectations.
At June 30, 2018, the City’s loans and notes receivable consisted of the following: Loans and notes receivable 57,249,585$ Allowances for potential forgiveness (53,926,678)
Loans and notes receivable, net 3,322,907$
Loans and notes receivable, including accrued interest comprised balances from the following programs, all of which are discussed on the following page.
Balance BalanceDescription Year Due June 30, 2018 June 30, 2017
Governmental Funds:First-Time Homebuyer Loans Various 20,005,456$ 19,611,077$ Home Rehabilitation Loans Various 1,349,088 1,413,403 106 N. Eldorado 2036 450,000 450,000 Darcy Building 2040 1,404,148 1,413,611 Edgewater Isle Senior Apartments 2048 4,685,727 4,295,698 Belmont Building 2032 800,000 800,000 St. Matthew Hotel 2036 2,638,810 2,607,673 Rotary Hacienda & Rotary Floritas 2058 4,611,828 4,581,034 First Step for Families (Turning Point) 2018 999,517 1,000,888 12 N. Idaho Street 2034 100,000 100,000 200 S. Delaware Street 2049 1,965,639 1,927,763 Employees' Housing Assistance Program Various - 370 232 S. Humboldt Street 2021 759,110 744,151 11 S. Delaware Street 2032 1,209,388 1,184,564 El Camino Family Housing 2042 4,045,041 4,810,877 Swanson - 349 North Claremont 2025 380,078 368,332 MP San Mateo Transit Associates 2062 8,187,013 8,078,441 MP Delaware Pacific Associates LP 2067 1,257,589 1,239,340 MP Foster Square 2070 357,142 422,900 Gateway Commons Assessment Loan Various 521,737 589,950 Cal Home Loans Various 354,028 547,667 HIP Housing -1100 Cypress Avenue 2071 1,168,246 1,135,336
Total governmental funds 57,249,585 57,323,075
Total Primary Government 57,249,585$ 57,323,075$
78
City of San Mateo Notes to Basic Financial Statements For the year ended June 30, 2018
4. LOANS AND NOTES RECEIVABLE, Continued
First-Time Homebuyer Loans The City has provided various loan programs for first time homebuyers since 1989. In general they provide secondary financing for low and moderate buyers in the City of San Mateo that have deferred payments in order to allow the buyer to maximize their purchasing capacity. The various loan terms are described below:
Gateway Commons Original Buyers – Second loans accrue interest that compounds annually. Interest accrues for 20 years. Starting in year 21, 10% of principal and accrued interest is forgiven until the loan is fully forgiven in year 30. Payment of principal and interest is paid upon sale of property. Units are sold at market value and at that time the City also receives as payment a share of the appreciation based on the percentage of the City loan to original purchase price. First Time Buyer Resale Program – Subsequent buyers at Gateway Commons and other first time buyer complexes have different loan terms: Prior to 2007, second loans up to $60,000 accrue interest that is compounded annually. The resale price is restricted by applying the percentage increase in median income from the time of the purchase date to the sale date, to the initial sales price. The principal is repaid, but payment of the accrued interest is waived. The City has the first right to purchase to roll unit to a new eligible buyer at the restricted sales price. If the City does not exercise the option to purchase, the unit can be sold at fair market value to a non-eligible buyer. In this case the principal, interest and appreciation share payment is paid to the City. After 2007, the second loans were restructured to eliminate the interest rate and appreciation share in the event the unit is sold to non-eligible buyer. Instead “contingent interest” is paid to the City which is determined by the difference between the restricted price and the actual sales price (market value). Neighborhood Purchase Program – A second loan of up to 20% of the purchase price, or maximum of $60,000, accrues simple interest of 3% per year. This is an amortized loan where monthly payments are deferred for five years and then repaid over 25 years. This program is no longer active. There are no resale price restrictions. Countywide Home Investment Partnership (CHIP) Program – This program provides a second loan of up to 20% of the purchase price, or maximum of $60,000. No interest and no payments are due for 10 years. Then payments are amortized at 4% for 25 years. Upon sale of the property or refinance, an appreciation share payment is due to the City.
Meadow Court Program – This program provides first-time homebuyers down payment assistance for the purchase of units at Meadow Court. The loans are secured by a second deed of trust with a term of 40 years and interest compounding annually. At year 31, provided that the property has not been sold or transferred, 10% of principal and interest will be forgiven each year until year 40, at which time the entire note is forgiven.
79
City of San Mateo Notes to Basic Financial Statements For the year ended June 30, 2018
4. LOANS AND NOTES RECEIVABLE, Continued
Home Rehabilitation Loans
The City has administered various housing rehabilitation loan programs using Community Development Block Grant funds, former Redevelopment Agency Housing Set-Aside funds and City Housing funds. Under these Programs, individuals with incomes below a certain level are eligible to receive low interest, variable term loans, secured by deeds of trust for rehabilitation work on their homes. The maximum loan limit is $85,000 for standard properties and $100,000 for historic properties. The loan repayments may be amortized over the life of the loans, deferred or a combination of both.
106 N. Eldorado
The City loaned $450,000 to Housing Association for the Needy and Dispossessed, Inc. (HAND), a non-profit organization, to acquire and rehabilitate six apartment units at 106 N. Eldorado for low-income housing. The loan bears no interest and is due in 40 years. If the property has not been sold or transferred, beginning in 2027, ten percent of the principal will be forgiven annually until 2036, at which time the entire loan principal will be forgiven. Darcy Building
On June 30, 2000, the City and the former Redevelopment Agency made four loans, the proceeds of which were used to conduct substantial rehabilitation and residential conversion of the Darcy Building for low income households. The loans carry interest at rates that vary from 0% to 5% with a term of 30 years. If the property remains in the developer’s hands, two of the loans allow partial forgiveness beginning in year 30, with full forgiveness in year 40. Edgewater Isle Senior Apartments
On June 30, 2000, the City and the former Redevelopment Agency made a loan to the Human Investment Project for the purchase and minor rehabilitation of ninety-two low and moderate income senior rental units at Edgewater Isle. Payments of principal and 3% interest are deferred until 2048 or the sale or transfer of the property, whichever comes first. Belmont Building
On June 30, 2000, the City and the former Redevelopment Agency made two loans, the proceeds of which were used to convert this building into six one-bedroom units for very low income families. The loans bear no interest and are for a term of 40 years. If the property remains in the developer’s hands, beginning in year 2023, ten percent of the principal will be forgiven annually until year 2032, at which time the entire loan principal will have been forgiven. St. Matthew Hotel
On June 30, 2000, the City and the former Redevelopment Agency made a loan to a developer, who used these funds to rehabilitate this hotel into a single room occupancy development for very low-income households. Interest is at 0% to 3%; principal and interest are due in 2036. Annual payments on the 3% loan are based on available cash flow, if any.
80
City of San Mateo Notes to Basic Financial Statements For the year ended June 30, 2018
4. LOANS AND NOTES RECEIVABLE, Continued Rotary Hacienda
In 1988, the former Redevelopment Agency entered into a Development and Disposition Agreement with Rotary Hacienda Inc. for the construction and operation of an 82-unit senior rental housing project. The Agreement includes a promissory note in the amount of $968,383, which bears simple interest at a rate of 8.75% compounded annually, and is due on December 30, 2028. In 2004, the loan was recast for $968,000 with 0% interest, a 40-year term and no prepayment penalty. Rotary Floritas The former Redevelopment Agency provided $3,000,000 for the construction of 50 senior rental units at Rotary Floritas on March 24, 2006. The interest rate is 3% for 55 years. Annual payments of principal and interest are based on the “available cash flow” from the borrower’s preceding fiscal year. First Step for Families (Turning Point) On June 26, 1988, the City provided zero interest deferred loans of $69,262 in City CDBG funds and $305,000 in former Redevelopment Agency funds to Mid-Peninsula Coalition Belle Haven, Inc. (MPCBH), for the acquisition and development of an emergency housing shelter called Turning Point. In 2002 MPCBH redeveloped the site into a new facility consisting of both emergency beds and transitional housing units to assist 39 families. The original loans plus interest were recast effective on April 1, 2002 in the amounts of $95,320 and $419,566 respectively. The loans bear 3% interest; principal and accrued interest are due in 30 years. At the same time, the City provided an additional $500,000 ($143,500 CDBG and $356,500 HOME) for the new project. These loans bear 3% interest, annual payments are based on “available cash flow”. As long as the facility is operated as emergency and transitional housing, 1/30 of the principal and accrued interest annually until it fully forgiven in 30 years.
12 N. Idaho Street In 1994, HAND, Inc., a non-profit organization, received loans of $100,000 from the former Redevelopment Agency and $10,436 from the City to assist in the purchase of a six-unit apartment building located at 12 N. Idaho Street to be used as an affordable housing complex. The Agency loan carries an interest rate of 10% and is for a period of 40 years, and the City loan carries no interest and is for a period of 15 years. Principal payments on both loans are deferred until the earlier of sale or transfer of the property or the maturity date. 200 S. Delaware Street On October 6, 1999, the City and the former Redevelopment Agency loaned $1,266,000 to HAND to acquire and rehabilitate sixteen units at 200 S. Delaware Street for low-income housing. The loan bears an interest rate of 3%. Principal and interest are due in 2049. HAND has an option of renewing the loan agreement for another fifty years.
81
City of San Mateo Notes to Basic Financial Statements For the year ended June 30, 2018
4. LOANS AND NOTES RECEIVABLE, Continued 232 S. Humboldt Street On February 9, 2001, the City and the former Redevelopment Agency loaned $500,000 to Mateo Lodge, Inc., to rehabilitate nine units at 232 S. Humboldt Street for low-income housing. The loan bears an interest rate of 3%. Principal and interest are due in 2021. Mateo Lodge, Inc. has an option of renewing the loan agreement for another twenty years. 11 S. Delaware Street On June 17, 2002, the City loaned $660,000 to HAND to acquire and rehabilitate eleven units at 11 S. Delaware Street for affordable housing. The loan bears an interest rate of 3%. Principal and interest are due in 2032. However, HAND has an option of renewing the loan agreement for another thirty years. El Camino Family Housing In December 2002, El Camino Family Housing, L.P., received a loan of $3,386,000 from the former Redevelopment Agency to develop the Santa Inez Apartments at an interest rate of 3% and for a period of 40 years. Annual payments of principal and interest in the amount of $140,688 are based on the “available cash flow” from the borrower’s preceding fiscal year. On January 19, 2018 the project was refinanced in order to allow one of the general partners to purchase the property as Santa Inez Apartments, LP. Upon closing a portion of the accrued interest was paid to the City. The promissory note was amended to revise the principal amount to $4,000,000 (original principal plus remaining accrued interest). The other original terms remained the same for another 25 years. Swanson Loan On January 1, 2005, the City loaned $7,500 to Angelina Swanson for architectural services and structural engineering testing at 349 North Claremont Street. Additional loans for reconstruction were made during the next 3 years, bringing the total principal to $235,552. The loan bears an interest rate of 5%. Principal and interest payments are deferred for 20 years or until sale or transfer of the property.
MP San Mateo Transit Associates Loan In November 2006, the City and the former Redevelopment Agency entered into a loan agreement with the Mid-Peninsula Housing Coalition. The agreement includes three promissory notes in the amounts of $1,230,000 (City funds), $1,200,000 (Agency funds), and $2,870,000 (Agency funds), which bear 3% interest. The payment of principal and interest is due on the maturity date or the sale or transfer of the property except for a sale or transfer to an affiliate nonprofit public benefit corporation or to a limited partnership in which an affiliate is the general partner. The maturity date shall occur fifty-five (55) years from the date of the receipt of the final certificate of occupancy. Beginning with borrower’s first fiscal year following the first year after receipt of the certificate of occupancy, borrower shall make annual payments of principal and interest to the City only from “Available Cash Flow” which is defined from borrower’s preceding fiscal year.
82
City of San Mateo Notes to Basic Financial Statements For the year ended June 30, 2018
4. LOANS AND NOTES RECEIVABLE, Continued
MP San Mateo Transit Associates Loan, Continued
In October 2009, the City received Infill Infrastructure Grant funds from the State of California in the amount of $3,854,240, which was passed on to the Mid-Peninsula Housing Coalition in the form of a deferred zero interest loan which is due at maturity, which is 55 years from receipt of the final certificate of occupancy.
MP Delaware Pacific Associates L.P.
In April 2012, the City and the Successor Agency entered into a loan agreement with the Mid-Peninsula Delaware Pacific Associates, LP. The agreement includes two promissory notes in the amounts of $880,000 (HOME Grant funds) and $320,000 (Successor Agency Funds), which bear 3% interest. Beginning with borrower’s first fiscal year following the first year after receipt of the certificate of occupancy, borrower shall make annual payments of principal and interest to the City only from “Available Cash Flow”, which is defined from borrower’s preceding fiscal year. The payment of remaining principal and interest is due on the maturity date or the sale or transfer of the property except for a sale or transfer to an affiliate nonprofit public benefit corporation or to a limited partnership in which an affiliate is the general partner.
The maturity date shall occur fifty-five (55) years from the date of the receipt of the final certificate of occupancy.
MP Foster Square
In July 2014, the City entered into a loan agreement with Mid-Peninsula Foster Square Associates, LP. The agreement includes one promissory note in the amount of $420,000 (HOME Grant funds), which bears 3% interest. Beginning with borrower’s first fiscal year following the first year after receipt of the certificate of occupancy, borrower shall make annual payments of principal and interest to the City only from “Residual Receipts”, which is defined from the project’s preceding fiscal year. The payment of remaining principal and interest is due on the maturity date or the sale or transfer of the property. The maturity date shall occur fifty-five (55) years from the date of the receipt of the final certificate of occupancy.
Gateway Commons Assessment Loan
In February 2011, the City and the former Redevelopment Agency entered into a loan agreement with the Gateway Commons Owners Association to assist owner pay for a special assessment for needed repairs at the complex. This agreement provides eligible owners of the affordable units loans in the range of $10,000 to $30,000 as one-time lump sum special assessment to Gateway Commons. The original term of the loan is 15 years with an interest rate varying between 0% and 3%. The loan repayment are amortized, deferred or a combination of both.
Cal Home Loans
In June 2009, the City entered into a program agreement with the California Department of Housing and Community Development to receive $750,000 in grant funds from the CalHOME program for its Owner Occupancy Rehabilitation Program. These funds are used for home repair loans up to $60,000 to low and moderate income households at 3% interest, with payments deferred for 30 years. Loan repayments will go into a revolving loan fund to be used for future housing loans for owner occupied units.
83
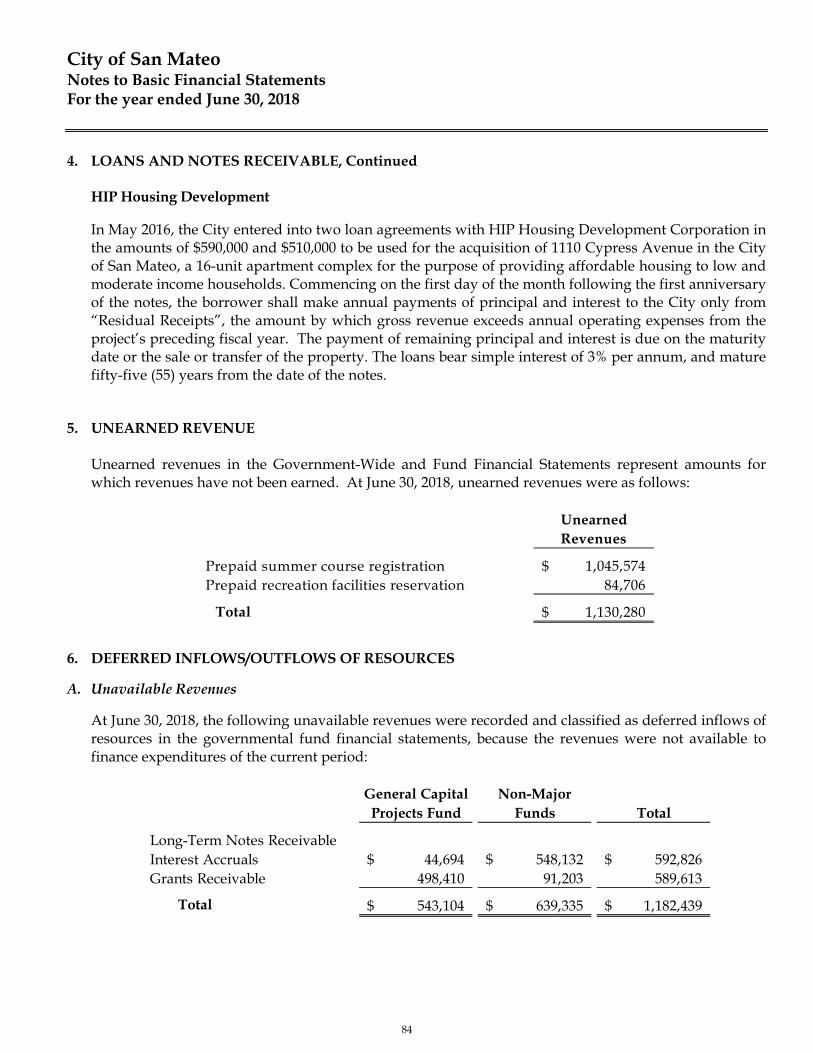
City of San Mateo Notes to Basic Financial Statements For the year ended June 30, 2018
4. LOANS AND NOTES RECEIVABLE, Continued HIP Housing Development In May 2016, the City entered into two loan agreements with HIP Housing Development Corporation in the amounts of $590,000 and $510,000 to be used for the acquisition of 1110 Cypress Avenue in the City of San Mateo, a 16-unit apartment complex for the purpose of providing affordable housing to low and moderate income households. Commencing on the first day of the month following the first anniversary of the notes, the borrower shall make annual payments of principal and interest to the City only from “Residual Receipts”, the amount by which gross revenue exceeds annual operating expenses from the project’s preceding fiscal year. The payment of remaining principal and interest is due on the maturity date or the sale or transfer of the property. The loans bear simple interest of 3% per annum, and mature fifty-five (55) years from the date of the notes.
5. UNEARNED REVENUE
Unearned revenues in the Government-Wide and Fund Financial Statements represent amounts for which revenues have not been earned. At June 30, 2018, unearned revenues were as follows:
UnearnedRevenues
Prepaid summer course registration 1,045,574$ Prepaid recreation facilities reservation 84,706
Total 1,130,280$
6. DEFERRED INFLOWS/OUTFLOWS OF RESOURCES
A. Unavailable Revenues
At June 30, 2018, the following unavailable revenues were recorded and classified as deferred inflows of resources in the governmental fund financial statements, because the revenues were not available to finance expenditures of the current period:
General Capital Non-MajorProjects Fund Funds Total
Long-Term Notes ReceivableInterest Accruals 44,694$ 548,132$ 592,826$ Grants Receivable 498,410 91,203 589,613
Total 543,104$ 639,335$ 1,182,439$
84
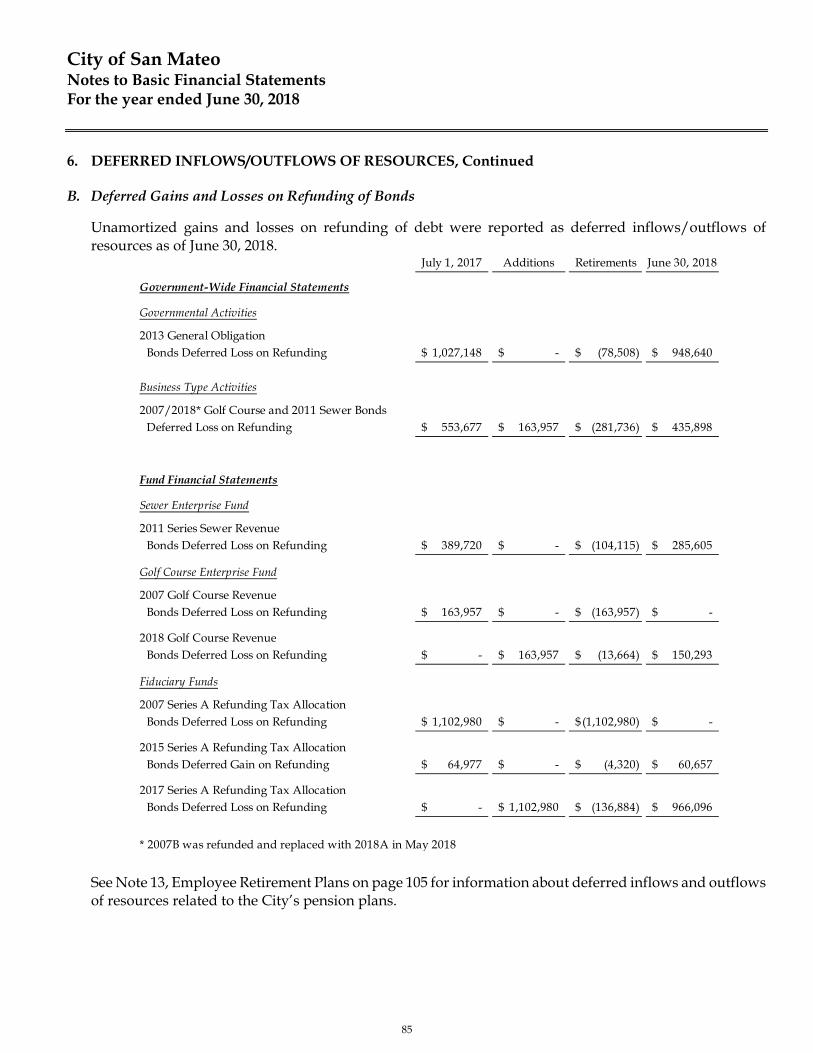
City of San Mateo Notes to Basic Financial Statements For the year ended June 30, 2018
6. DEFERRED INFLOWS/OUTFLOWS OF RESOURCES, Continued B. Deferred Gains and Losses on Refunding of Bonds
Unamortized gains and losses on refunding of debt were reported as deferred inflows/outflows of resources as of June 30, 2018.
See Note 13, Employee Retirement Plans on page 105 for information about deferred inflows and outflows of resources related to the City’s pension plans.
July 1, 2017 Additions Retirements June 30, 2018
Government-Wide Financial Statements
Governmental Activities
2013 General ObligationBonds Deferred Loss on Refunding 1,027,148$ -$ (78,508)$ 948,640$
Business Type Activities
2007/2018* Golf Course and 2011 Sewer BondsDeferred Loss on Refunding 553,677$ 163,957$ (281,736)$ 435,898$
Fund Financial Statements
Sewer Enterprise Fund
2011 Series Sewer RevenueBonds Deferred Loss on Refunding 389,720$ -$ (104,115)$ 285,605$
Golf Course Enterprise Fund
2007 Golf Course Revenue Bonds Deferred Loss on Refunding 163,957$ -$ (163,957)$ -$
2018 Golf Course Revenue Bonds Deferred Loss on Refunding -$ 163,957$ (13,664)$ 150,293$
Fiduciary Funds
2007 Series A Refunding Tax AllocationBonds Deferred Loss on Refunding 1,102,980$ -$ (1,102,980)$ -$
2015 Series A Refunding Tax AllocationBonds Deferred Gain on Refunding 64,977$ -$ (4,320)$ 60,657$
2017 Series A Refunding Tax AllocationBonds Deferred Loss on Refunding -$ 1,102,980$ (136,884)$ 966,096$
* 2007B was refunded and replaced with 2018A in May 2018
85
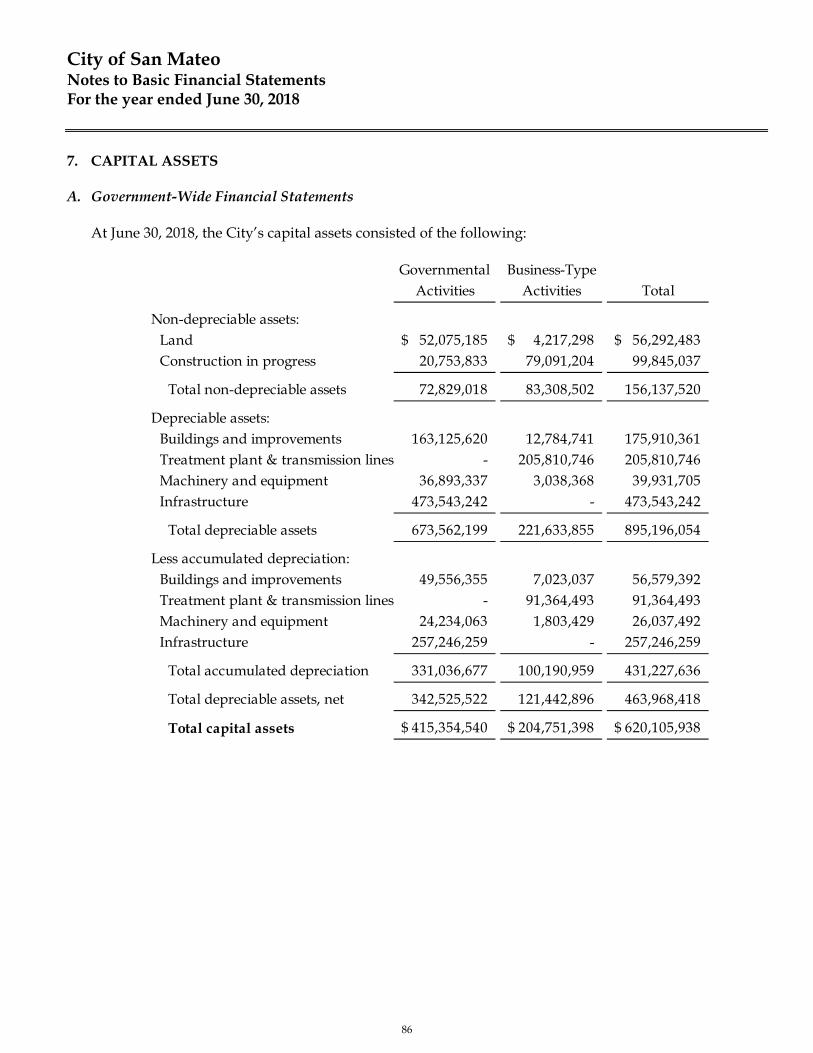
City of San Mateo Notes to Basic Financial Statements For the year ended June 30, 2018
7. CAPITAL ASSETS
A. Government-Wide Financial Statements At June 30, 2018, the City’s capital assets consisted of the following:
Governmental Business-TypeActivities Activities Total
Non-depreciable assets:Land 52,075,185$ 4,217,298$ 56,292,483$ Construction in progress 20,753,833 79,091,204 99,845,037
Total non-depreciable assets 72,829,018 83,308,502 156,137,520
Depreciable assets:Buildings and improvements 163,125,620 12,784,741 175,910,361 Treatment plant & transmission lines - 205,810,746 205,810,746 Machinery and equipment 36,893,337 3,038,368 39,931,705 Infrastructure 473,543,242 - 473,543,242
Total depreciable assets 673,562,199 221,633,855 895,196,054
Less accumulated depreciation:Buildings and improvements 49,556,355 7,023,037 56,579,392 Treatment plant & transmission lines - 91,364,493 91,364,493 Machinery and equipment 24,234,063 1,803,429 26,037,492 Infrastructure 257,246,259 - 257,246,259
Total accumulated depreciation 331,036,677 100,190,959 431,227,636
Total depreciable assets, net 342,525,522 121,442,896 463,968,418
Total capital assets 415,354,540$ 204,751,398$ 620,105,938$
86
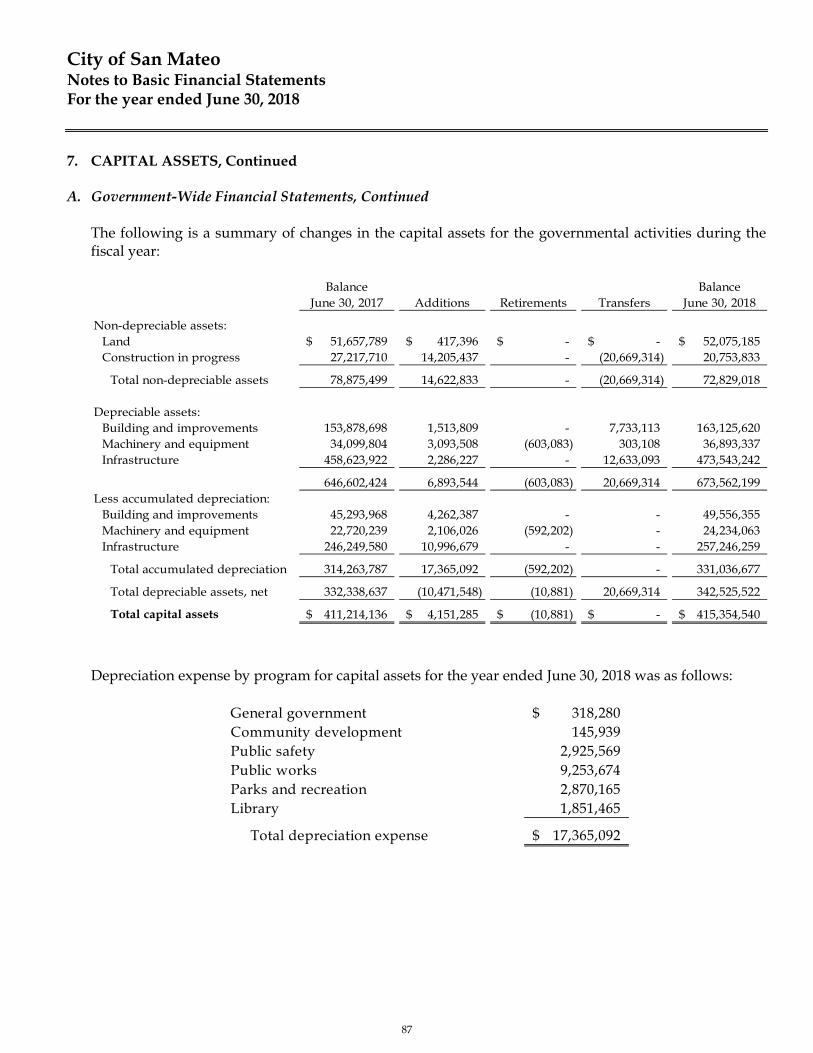
City of San Mateo Notes to Basic Financial Statements For the year ended June 30, 2018
7. CAPITAL ASSETS, Continued
A. Government-Wide Financial Statements, Continued The following is a summary of changes in the capital assets for the governmental activities during the fiscal year:
Balance BalanceJune 30, 2017 Additions Retirements Transfers June 30, 2018
Non-depreciable assets:Land 51,657,789$ 417,396$ -$ -$ 52,075,185$ Construction in progress 27,217,710 14,205,437 - (20,669,314) 20,753,833
Total non-depreciable assets 78,875,499 14,622,833 - (20,669,314) 72,829,018
Depreciable assets:Building and improvements 153,878,698 1,513,809 - 7,733,113 163,125,620 Machinery and equipment 34,099,804 3,093,508 (603,083) 303,108 36,893,337 Infrastructure 458,623,922 2,286,227 - 12,633,093 473,543,242
646,602,424 6,893,544 (603,083) 20,669,314 673,562,199 Less accumulated depreciation:
Building and improvements 45,293,968 4,262,387 - - 49,556,355 Machinery and equipment 22,720,239 2,106,026 (592,202) - 24,234,063 Infrastructure 246,249,580 10,996,679 - - 257,246,259
Total accumulated depreciation 314,263,787 17,365,092 (592,202) - 331,036,677
Total depreciable assets, net 332,338,637 (10,471,548) (10,881) 20,669,314 342,525,522
Total capital assets 411,214,136$ 4,151,285$ (10,881)$ -$ 415,354,540$
Depreciation expense by program for capital assets for the year ended June 30, 2018 was as follows:
General government 318,280$ Community development 145,939Public safety 2,925,569Public works 9,253,674Parks and recreation 2,870,165Library 1,851,465
Total depreciation expense 17,365,092$
87
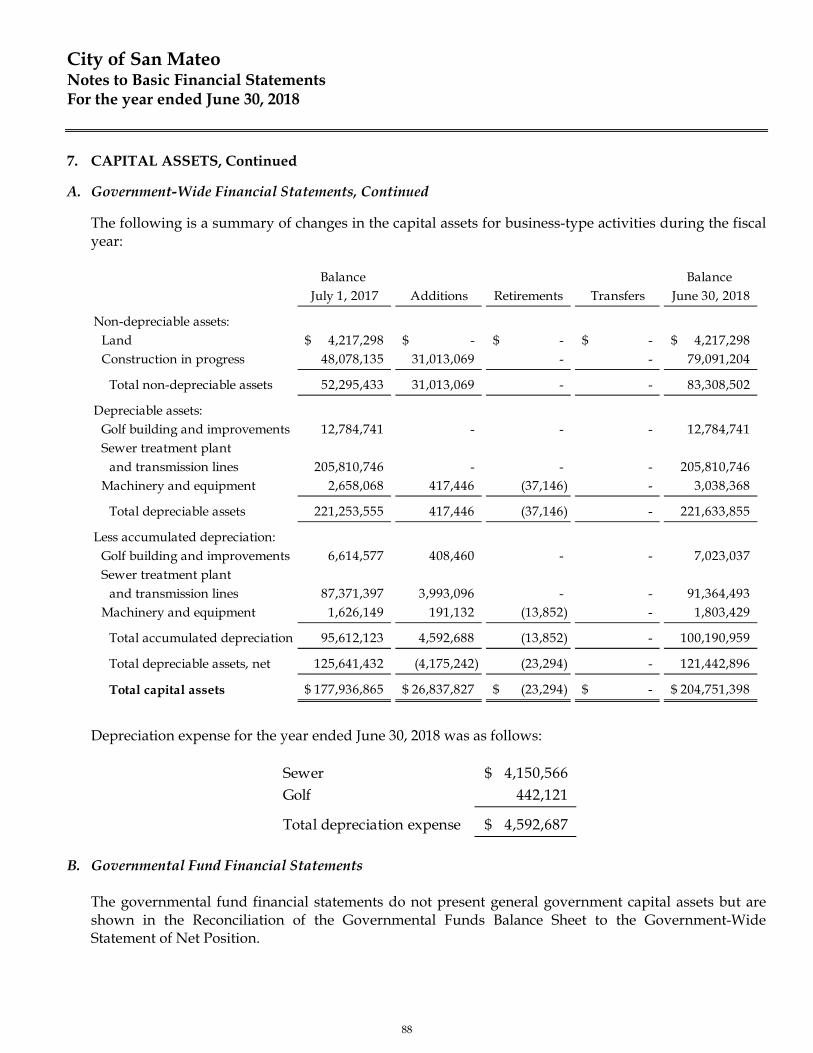
City of San Mateo Notes to Basic Financial Statements For the year ended June 30, 2018
7. CAPITAL ASSETS, Continued
A. Government-Wide Financial Statements, Continued
The following is a summary of changes in the capital assets for business-type activities during the fiscal year:
Balance Balance July 1, 2017 Additions Retirements Transfers June 30, 2018
Non-depreciable assets:Land 4,217,298$ -$ -$ -$ 4,217,298$ Construction in progress 48,078,135 31,013,069 - - 79,091,204
Total non-depreciable assets 52,295,433 31,013,069 - - 83,308,502
Depreciable assets:Golf building and improvements 12,784,741 - - - 12,784,741 Sewer treatment plant
and transmission lines 205,810,746 - - - 205,810,746 Machinery and equipment 2,658,068 417,446 (37,146) - 3,038,368
Total depreciable assets 221,253,555 417,446 (37,146) - 221,633,855
Less accumulated depreciation:Golf building and improvements 6,614,577 408,460 - - 7,023,037 Sewer treatment plant
and transmission lines 87,371,397 3,993,096 - - 91,364,493 Machinery and equipment 1,626,149 191,132 (13,852) - 1,803,429
Total accumulated depreciation 95,612,123 4,592,688 (13,852) - 100,190,959
Total depreciable assets, net 125,641,432 (4,175,242) (23,294) - 121,442,896
Total capital assets 177,936,865$ 26,837,827$ (23,294)$ -$ 204,751,398$
Depreciation expense for the year ended June 30, 2018 was as follows:
B. Governmental Fund Financial Statements The governmental fund financial statements do not present general government capital assets but are shown in the Reconciliation of the Governmental Funds Balance Sheet to the Government-Wide Statement of Net Position.
Sewer 4,150,566$ Golf 442,121
Total depreciation expense 4,592,687$
88

City of San Mateo Notes to Basic Financial Statements For the year ended June 30, 2018
8. LONG-TERM DEBT
A. Governmental Activities The following is a summary of long-term debt transactions including amortization for the year ended June 30, 2018:
Due inOriginal Issue Balance Bond Discount/ Balance Due Within More than
Amount June 30, 2017 Additions Deletions Premium June 30, 2018 One Year One Year
Governmental Activities:Bonds Payable:
General Obligation Bonds:Series 2013, Refunding 27,295,000$ 24,920,513$ -$ (1,235,000)$ (157,109)$ 23,528,404$ 1,285,000$ 22,243,404$
Revenue Bonds, Series 2003 7,900,000 5,920,000 - (5,920,000) - - - - Lease Revenue Bonds, Series 2007A 17,400,000 15,560,000 - (335,000) - 15,225,000 360,000 14,865,000 S. Bayfront Flood Ctrl, Series 2011A 5,745,000 4,545,560 - (265,000) 6,179 4,286,739 275,000 4,011,739
Total bonds payable 58,340,000 50,946,073 - (7,755,000) (150,930) 43,040,143 1,920,000 41,120,143
Loans Payable:CEC Streetlight Loan 3,000,000 777,953 2,157,843 - - 2,935,796 208,016 2,727,780 PG&E Energy Efficiency
Retrofit Loan 248,790 87,077 - (87,077) - - - -
Total loans payable 3,248,790 865,030 2,157,843 (87,077) - 2,935,796 208,016 2,727,780
Total long-term debt 61,588,790$ 51,811,103 2,157,843$ (7,842,077)$ (150,930)$ 45,975,939 2,128,016$ 43,847,923$
Less: Due within one year (2,383,593) (2,128,016)
Due in more than more year 49,427,510$ 43,847,923$
General Obligation Refunding Bonds (Library Improvement Project), Series 2013 – Original Issue $27,295,000 On March 21, 2013, the City of San Mateo issued $27,295,000 principal amount General Obligation Refunding Bonds (Library Improvement Project), Series 2013 (2013 Refunding Bonds). The proceeds of the 2013 Refunding Bonds were used to refund the 2000 and 2004A General Obligation Bonds. The 2000 and 2004A General Obligation Bonds were used to finance the construction, acquisition and improvement of a new main library and the improvement of the City’s branch libraries. The General Obligation Refunding Bonds mature annually each August 1 through 2030, with installments ranging from $1,285,000 to $2,070,000. The interest on the Bonds is payable semi-annually on each February 1 and August 1, with coupons ranging from 3.0% to 4.0%. The 2013 Refunding Bonds are secured by voter-approved, ad valorem property taxes. Annual principal and interest payments on the bonds are expected to require 100% percent of net revenues. The outstanding principal balance net of bond premium was $23,528,404 as of June 30, 2018. Total principal and interest remaining to be paid on the 2013 Refunding Bonds is $26,804,475. For the current year, principal and interest paid on the 2013 Refunding Bonds was $2,030,950 and ad valorem property tax net revenues were $2,493,382.
89
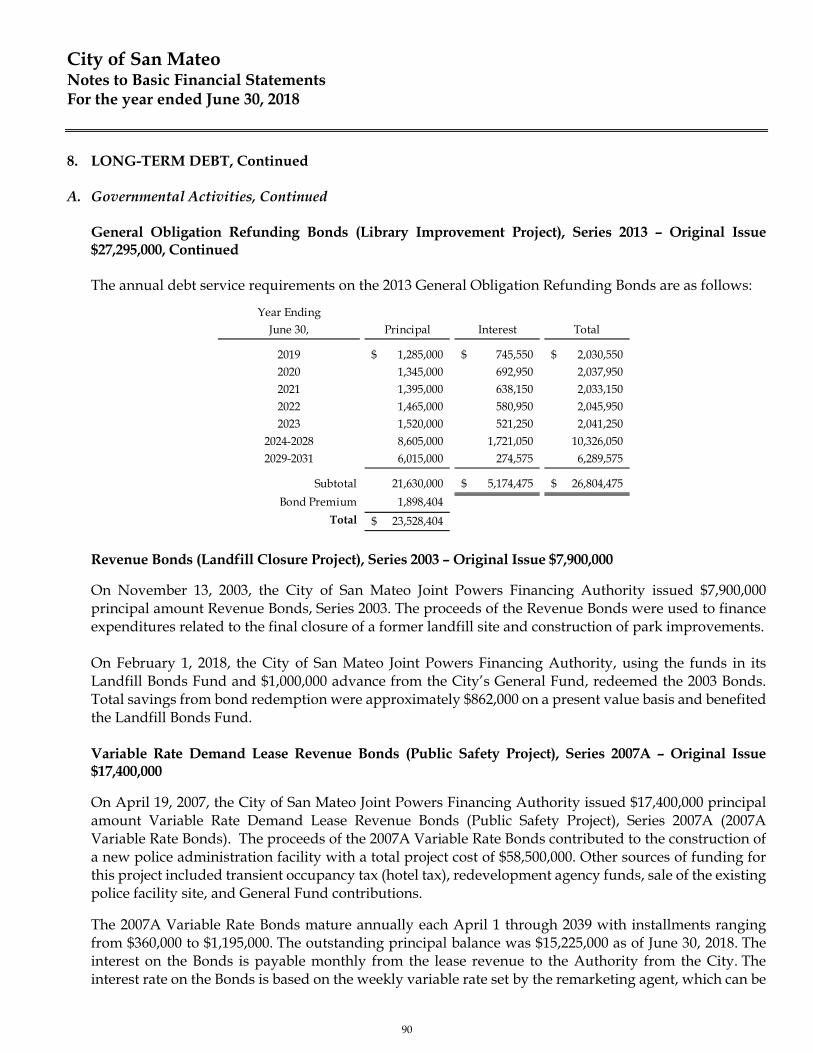
City of San Mateo Notes to Basic Financial Statements For the year ended June 30, 2018
8. LONG-TERM DEBT, Continued
A. Governmental Activities, Continued General Obligation Refunding Bonds (Library Improvement Project), Series 2013 – Original Issue $27,295,000, Continued The annual debt service requirements on the 2013 General Obligation Refunding Bonds are as follows:
Year EndingJune 30, Principal Interest Total
2019 1,285,000$ 745,550$ 2,030,550$ 2020 1,345,000 692,950 2,037,950 2021 1,395,000 638,150 2,033,150 2022 1,465,000 580,950 2,045,950 2023 1,520,000 521,250 2,041,250
2024-2028 8,605,000 1,721,050 10,326,050 2029-2031 6,015,000 274,575 6,289,575
Subtotal 21,630,000 5,174,475$ 26,804,475$
Bond Premium 1,898,404
Total 23,528,404$
Revenue Bonds (Landfill Closure Project), Series 2003 – Original Issue $7,900,000
On November 13, 2003, the City of San Mateo Joint Powers Financing Authority issued $7,900,000 principal amount Revenue Bonds, Series 2003. The proceeds of the Revenue Bonds were used to finance expenditures related to the final closure of a former landfill site and construction of park improvements. On February 1, 2018, the City of San Mateo Joint Powers Financing Authority, using the funds in its Landfill Bonds Fund and $1,000,000 advance from the City’s General Fund, redeemed the 2003 Bonds. Total savings from bond redemption were approximately $862,000 on a present value basis and benefited the Landfill Bonds Fund. Variable Rate Demand Lease Revenue Bonds (Public Safety Project), Series 2007A – Original Issue $17,400,000
On April 19, 2007, the City of San Mateo Joint Powers Financing Authority issued $17,400,000 principal amount Variable Rate Demand Lease Revenue Bonds (Public Safety Project), Series 2007A (2007A Variable Rate Bonds). The proceeds of the 2007A Variable Rate Bonds contributed to the construction of a new police administration facility with a total project cost of $58,500,000. Other sources of funding for this project included transient occupancy tax (hotel tax), redevelopment agency funds, sale of the existing police facility site, and General Fund contributions.
The 2007A Variable Rate Bonds mature annually each April 1 through 2039 with installments ranging from $360,000 to $1,195,000. The outstanding principal balance was $15,225,000 as of June 30, 2018. The interest on the Bonds is payable monthly from the lease revenue to the Authority from the City. The interest rate on the Bonds is based on the weekly variable rate set by the remarketing agent, which can be
90
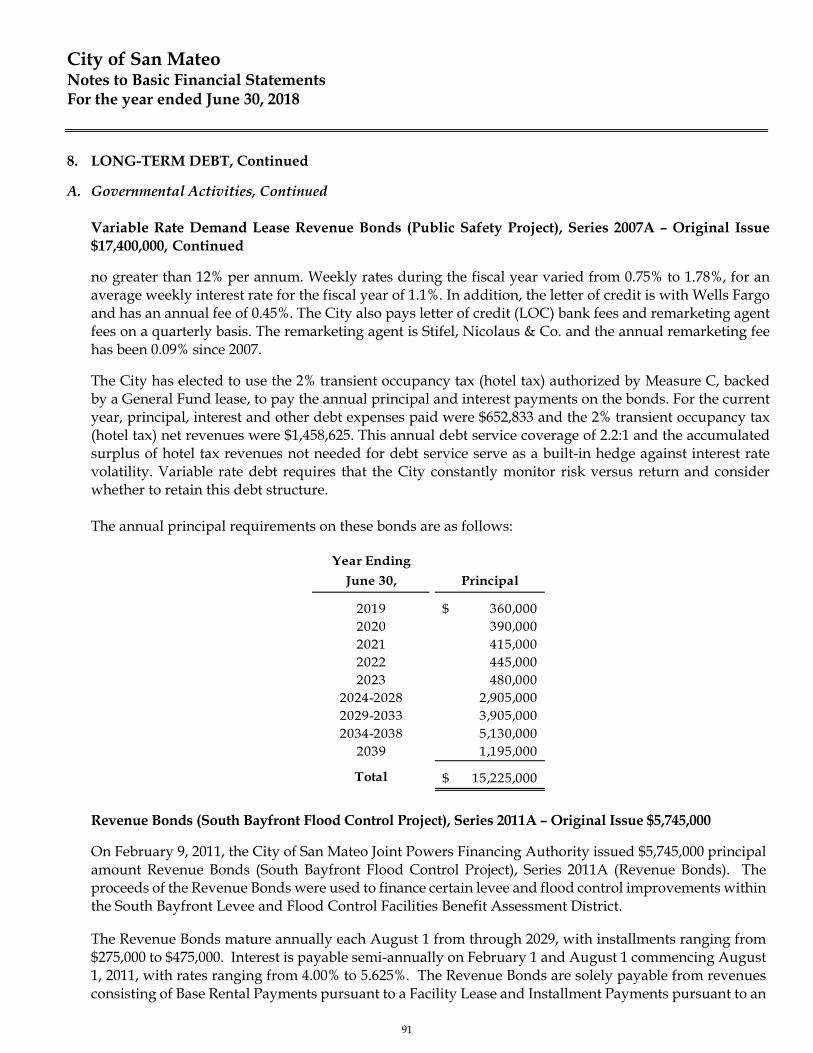
City of San Mateo Notes to Basic Financial Statements For the year ended June 30, 2018
8. LONG-TERM DEBT, Continued
A. Governmental Activities, Continued
Variable Rate Demand Lease Revenue Bonds (Public Safety Project), Series 2007A – Original Issue$17,400,000, Continued
no greater than 12% per annum. Weekly rates during the fiscal year varied from 0.75% to 1.78%, for an average weekly interest rate for the fiscal year of 1.1%. In addition, the letter of credit is with Wells Fargo and has an annual fee of 0.45%. The City also pays letter of credit (LOC) bank fees and remarketing agent fees on a quarterly basis. The remarketing agent is Stifel, Nicolaus & Co. and the annual remarketing fee has been 0.09% since 2007.
The City has elected to use the 2% transient occupancy tax (hotel tax) authorized by Measure C, backed by a General Fund lease, to pay the annual principal and interest payments on the bonds. For the current year, principal, interest and other debt expenses paid were $652,833 and the 2% transient occupancy tax (hotel tax) net revenues were $1,458,625. This annual debt service coverage of 2.2:1 and the accumulated surplus of hotel tax revenues not needed for debt service serve as a built-in hedge against interest rate volatility. Variable rate debt requires that the City constantly monitor risk versus return and consider whether to retain this debt structure.
The annual principal requirements on these bonds are as follows:
Year Ending
June 30, Principal
2019 360,000$ 2020 390,000 2021 415,000 2022 445,000 2023 480,000
2024-2028 2,905,000 2029-2033 3,905,000 2034-2038 5,130,000
2039 1,195,000
Total 15,225,000$
Revenue Bonds (South Bayfront Flood Control Project), Series 2011A – Original Issue $5,745,000
On February 9, 2011, the City of San Mateo Joint Powers Financing Authority issued $5,745,000 principal amount Revenue Bonds (South Bayfront Flood Control Project), Series 2011A (Revenue Bonds). The proceeds of the Revenue Bonds were used to finance certain levee and flood control improvements within the South Bayfront Levee and Flood Control Facilities Benefit Assessment District.
The Revenue Bonds mature annually each August 1 from through 2029, with installments ranging from $275,000 to $475,000. Interest is payable semi-annually on February 1 and August 1 commencing August 1, 2011, with rates ranging from 4.00% to 5.625%. The Revenue Bonds are solely payable from revenues consisting of Base Rental Payments pursuant to a Facility Lease and Installment Payments pursuant to an
91

City of San Mateo Notes to Basic Financial Statements For the year ended June 30, 2018
8. LONG-TERM DEBT, Continued
A. Governmental Activities, Continued
Revenue Bonds (South Bayfront Flood Control Project), Series 2011A – Original Issue $5,745,000, Continued
Installment Payment Contract made between the Authority and the City. Total principal and interest remaining to be paid on the Bonds is $5,913,206. The outstanding principal balance net of bond discount of the Revenue Bonds was $4,286,739 as of June 30, 2018.
The City funds installments to the Authority from all revenue received by the City from the levy and collection of assessments from the South Bayfront Levee and Flood Control Facilities Benefit Assessment District.
Annual principal and interest payments on the bonds are expected to require 90% of assessment net revenues. The current year principal and interest payments amounted to $496,775 and the assessment net revenues were $538,343.
The annual debt service requirements on these bonds are as follows:
Year EndingJune 30, Principal Interest Total
2019 275,000$ 220,975$ 495,975$ 2020 285,000 208,350 493,350 2021 300,000 194,663 494,663 2022 315,000 180,816 495,816 2023 330,000 164,869 494,869
2024-2028 1,925,000 535,800 2,460,800 2029-2030 925,000 52,734 977,734
Subtotal 4,355,000 1,558,206$ 5,913,206$
Bond Discount (68,261)
Total 4,286,739$
CEC Streetlight Loan
On January 14, 2015, the City entered into a loan agreement with the State of California Energy Conservation and Development Commission in the amount of $3,000,000 for the City-wide LED and High Voltage Conversion project. Loan funds are to be disbursed to the City on a reimbursement basis based on invoices submitted by the City for actual expenditures incurred for the project.
Semiannual payments due to the Energy Commission under this agreement are expected to be made from savings in energy costs or other available funds. The Loan accrues interest at a rate of 1.00% per annum on the unpaid principal computed from the date of each disbursement to the City. As of June 30, 2018, the City had drawn down $2,935,796 of the awarded amount.
92
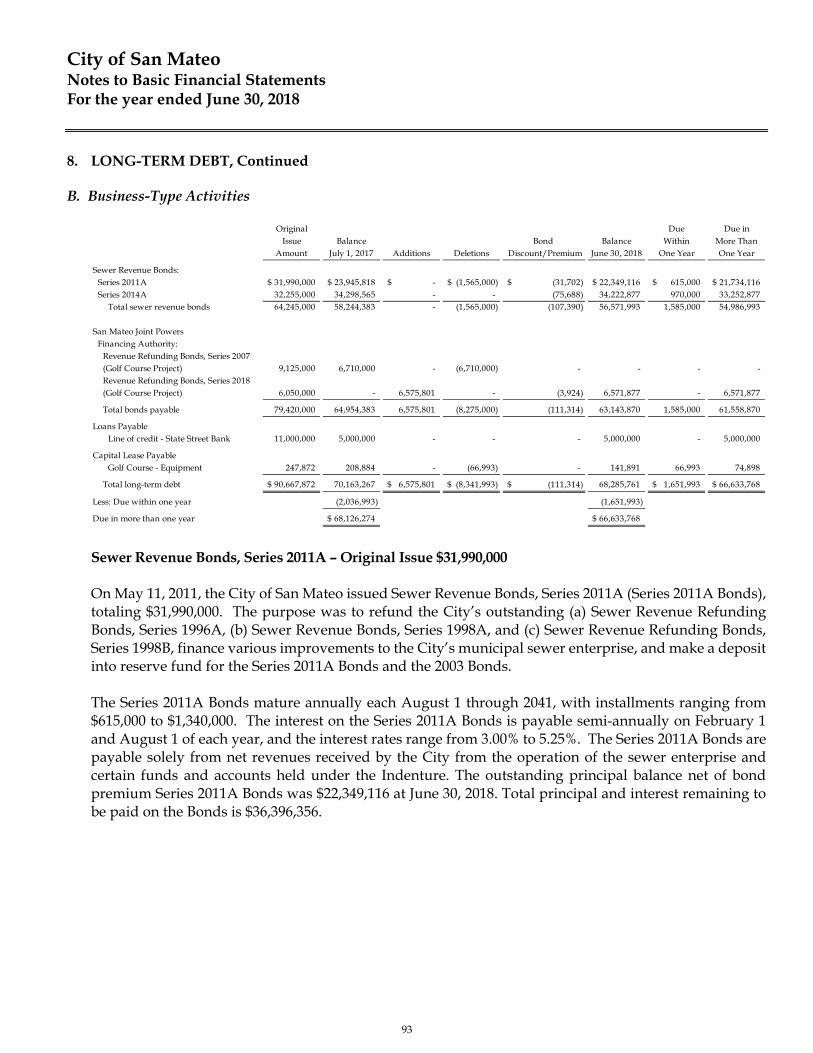
City of San Mateo Notes to Basic Financial Statements For the year ended June 30, 2018
8. LONG-TERM DEBT, Continued
B. Business-Type Activities
Original Due Due inIssue Balance Bond Balance Within More Than
Amount July 1, 2017 Additions Deletions Discount/Premium June 30, 2018 One Year One Year
Sewer Revenue Bonds:Series 2011A 31,990,000$ 23,945,818$ -$ (1,565,000)$ (31,702)$ 22,349,116$ 615,000$ 21,734,116$ Series 2014A 32,255,000 34,298,565 - - (75,688) 34,222,877 970,000 33,252,877
Total sewer revenue bonds 64,245,000 58,244,383 - (1,565,000) (107,390) 56,571,993 1,585,000 54,986,993
San Mateo Joint PowersFinancing Authority:
Revenue Refunding Bonds, Series 2007 (Golf Course Project) 9,125,000 6,710,000 - (6,710,000) - - - - Revenue Refunding Bonds, Series 2018 (Golf Course Project) 6,050,000 - 6,575,801 - (3,924) 6,571,877 - 6,571,877
Total bonds payable 79,420,000 64,954,383 6,575,801 (8,275,000) (111,314) 63,143,870 1,585,000 61,558,870
Loans PayableLine of credit - State Street Bank 11,000,000 5,000,000 - - - 5,000,000 - 5,000,000
Capital Lease PayableGolf Course - Equipment 247,872 208,884 - (66,993) - 141,891 66,993 74,898
Total long-term debt 90,667,872$ 70,163,267 6,575,801$ (8,341,993)$ (111,314)$ 68,285,761 1,651,993$ 66,633,768$
Less: Due within one year (2,036,993) (1,651,993)
Due in more than one year 68,126,274$ 66,633,768$
Sewer Revenue Bonds, Series 2011A – Original Issue $31,990,000
On May 11, 2011, the City of San Mateo issued Sewer Revenue Bonds, Series 2011A (Series 2011A Bonds), totaling $31,990,000. The purpose was to refund the City’s outstanding (a) Sewer Revenue Refunding Bonds, Series 1996A, (b) Sewer Revenue Bonds, Series 1998A, and (c) Sewer Revenue Refunding Bonds, Series 1998B, finance various improvements to the City’s municipal sewer enterprise, and make a deposit into reserve fund for the Series 2011A Bonds and the 2003 Bonds.
The Series 2011A Bonds mature annually each August 1 through 2041, with installments ranging from $615,000 to $1,340,000. The interest on the Series 2011A Bonds is payable semi-annually on February 1 and August 1 of each year, and the interest rates range from 3.00% to 5.25%. The Series 2011A Bonds are payable solely from net revenues received by the City from the operation of the sewer enterprise and certain funds and accounts held under the Indenture. The outstanding principal balance net of bond premium Series 2011A Bonds was $22,349,116 at June 30, 2018. Total principal and interest remaining to be paid on the Bonds is $36,396,356.
93

City of San Mateo Notes to Basic Financial Statements For the year ended June 30, 2018
8. LONG-TERM DEBT, Continued B. Business-Type Activities, Continued
Sewer Revenue Bonds, Series 2011A – Original Issue $31,990,000, Continued The annual debt service requirements on the Series 2011A Bonds are as follows:
Year EndingJune 30, Principal Interest Total
2019 615,000$ 1,073,808$ 1,688,808$ 2020 640,000 1,048,708 1,688,708 2021 665,000 1,019,283 1,684,283 2022 700,000 985,158 1,685,158 2023 735,000 948,364 1,683,364
2024-2028 4,275,000 4,145,969 8,420,969 2029-2033 4,115,000 3,063,875 7,178,875 2034-2038 4,915,000 1,953,331 6,868,331 2039-2042 4,960,000 537,863 5,497,863
Subtotal 21,620,000 14,776,356$ 36,396,356$
Bond Premium 729,116
Total 22,349,116$
Sewer Revenue Bonds, Series 2014A – Original Issue $32,255,000 On July 2, 2014, the City of San Mateo issued Sewer Revenue Bonds, Series 2014A (Series 2014A Bonds), totaling $32,225,000. The purpose was to refund the City’s outstanding Sewer Revenue Bonds, Series 2003, and finance various improvements to the City’s municipal sewer enterprise. The Series 2014A Bonds mature annually each August 1 beginning in 2018 through 2044, with installments ranging from $670,000 to $2,665,000. The interest on the Series 2014A Bonds is payable semi-annually on February 1 and August 1 of each year, with coupons ranging from 3.00% to 5.00%. The Series 2014A Bonds are payable solely from net revenues received by the City from the operation of the sewer enterprise and certain funds and accounts held under the Indenture. The outstanding principal balance net of bond premium Series 2014A Bonds was $34,222,877 at June 30, 2018. Total principal and interest remaining to be paid on the Bonds is $51,019,725.
94
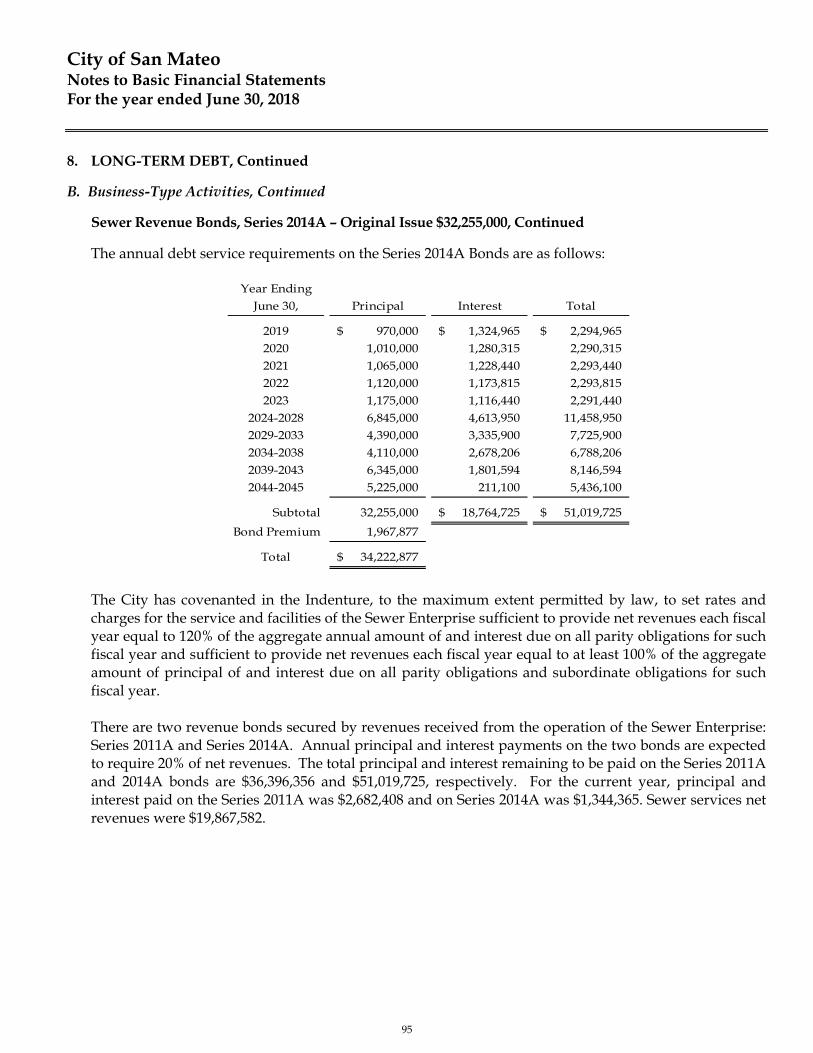
City of San Mateo Notes to Basic Financial Statements For the year ended June 30, 2018
8. LONG-TERM DEBT, Continued
B. Business-Type Activities, Continued
Sewer Revenue Bonds, Series 2014A – Original Issue $32,255,000, Continued
The annual debt service requirements on the Series 2014A Bonds are as follows:
Year EndingJune 30, Principal Interest Total
2019 970,000$ 1,324,965$ 2,294,965$ 2020 1,010,000 1,280,315 2,290,315 2021 1,065,000 1,228,440 2,293,440 2022 1,120,000 1,173,815 2,293,815 2023 1,175,000 1,116,440 2,291,440
2024-2028 6,845,000 4,613,950 11,458,950 2029-2033 4,390,000 3,335,900 7,725,900 2034-2038 4,110,000 2,678,206 6,788,206 2039-2043 6,345,000 1,801,594 8,146,594 2044-2045 5,225,000 211,100 5,436,100
Subtotal 32,255,000 18,764,725$ 51,019,725$
Bond Premium 1,967,877
Total 34,222,877$
The City has covenanted in the Indenture, to the maximum extent permitted by law, to set rates and charges for the service and facilities of the Sewer Enterprise sufficient to provide net revenues each fiscal year equal to 120% of the aggregate annual amount of and interest due on all parity obligations for such fiscal year and sufficient to provide net revenues each fiscal year equal to at least 100% of the aggregate amount of principal of and interest due on all parity obligations and subordinate obligations for such fiscal year. There are two revenue bonds secured by revenues received from the operation of the Sewer Enterprise: Series 2011A and Series 2014A. Annual principal and interest payments on the two bonds are expected to require 20% of net revenues. The total principal and interest remaining to be paid on the Series 2011A and 2014A bonds are $36,396,356 and $51,019,725, respectively. For the current year, principal and interest paid on the Series 2011A was $2,682,408 and on Series 2014A was $1,344,365. Sewer services net revenues were $19,867,582.
95
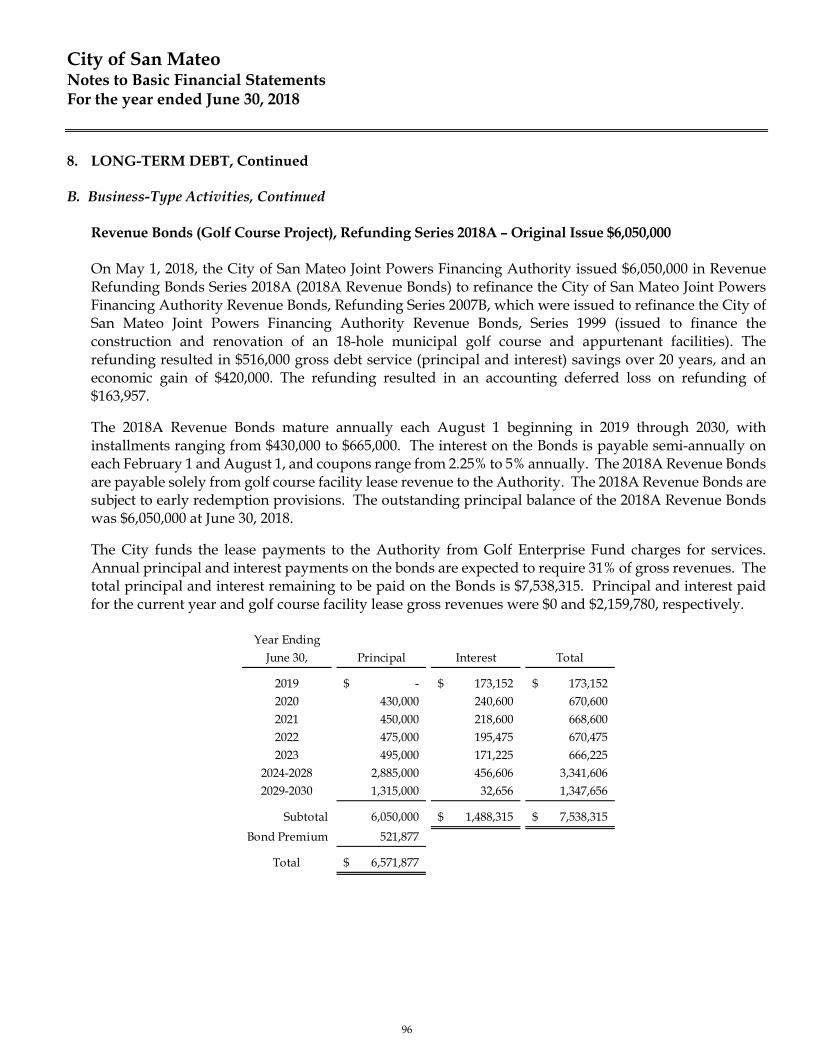
City of San Mateo Notes to Basic Financial Statements For the year ended June 30, 2018
8. LONG-TERM DEBT, Continued
B. Business-Type Activities, Continued Revenue Bonds (Golf Course Project), Refunding Series 2018A – Original Issue $6,050,000 On May 1, 2018, the City of San Mateo Joint Powers Financing Authority issued $6,050,000 in Revenue Refunding Bonds Series 2018A (2018A Revenue Bonds) to refinance the City of San Mateo Joint Powers Financing Authority Revenue Bonds, Refunding Series 2007B, which were issued to refinance the City of San Mateo Joint Powers Financing Authority Revenue Bonds, Series 1999 (issued to finance the construction and renovation of an 18-hole municipal golf course and appurtenant facilities). The refunding resulted in $516,000 gross debt service (principal and interest) savings over 20 years, and an economic gain of $420,000. The refunding resulted in an accounting deferred loss on refunding of $163,957.
The 2018A Revenue Bonds mature annually each August 1 beginning in 2019 through 2030, with installments ranging from $430,000 to $665,000. The interest on the Bonds is payable semi-annually on each February 1 and August 1, and coupons range from 2.25% to 5% annually. The 2018A Revenue Bonds are payable solely from golf course facility lease revenue to the Authority. The 2018A Revenue Bonds are subject to early redemption provisions. The outstanding principal balance of the 2018A Revenue Bonds was $6,050,000 at June 30, 2018.
The City funds the lease payments to the Authority from Golf Enterprise Fund charges for services. Annual principal and interest payments on the bonds are expected to require 31% of gross revenues. The total principal and interest remaining to be paid on the Bonds is $7,538,315. Principal and interest paid for the current year and golf course facility lease gross revenues were $0 and $2,159,780, respectively.
Year EndingJune 30, Principal Interest Total
2019 -$ 173,152$ 173,152$ 2020 430,000 240,600 670,600 2021 450,000 218,600 668,600 2022 475,000 195,475 670,475 2023 495,000 171,225 666,225
2024-2028 2,885,000 456,606 3,341,606 2029-2030 1,315,000 32,656 1,347,656
Subtotal 6,050,000 1,488,315$ 7,538,315$
Bond Premium 521,877
Total 6,571,877$
96

City of San Mateo Notes to Basic Financial Statements For the year ended June 30, 2018
8. LONG-TERM DEBT, Continued
B. Business-Type Activities, Continued
Loans Payable – State Street Bank – Original Issue $70,000,000
On June 1, 2016, the City entered into a revolving loan agreement with State Street Public Lending Corporation with an initial loan amount of $11,000,000 and a total not to exceed loan amount of $70,000,000 to provide funding for the City’s Clean Water program and to repay the balance owed to the California’s Water Resources Control Board (CSWRCB) for the 25th Avenue Sanitary Sewer Relief Project, Clean Water State Revolving Fund Project No. C-06-7858-110. As of June 30, 2018, the outstanding loan balance was $5,000,000. Capital Lease Payable – Golf Course Carts The City entered into a lease agreement to acquire equipment for the City’s golf course. The lease agreement provides for 60 annual payments of $4,918 through December 29, 2020. Payments include interest at 0.25%. The cost of the equipment was $247,872, with accumulated depreciation of $71,979 at June 30, 2018. As of June 30, 2018, future minimum lease payments under the capital lease obligation were as follows:
Fiscal Year Ending June 30,
2019 59,021$ 2020 59,021 2021 29,511
Total payments 147,553
Less amounts representing interest (5,662)
Net present value of future minimum lease payments 141,891$
C. Fiduciary Funds – Private Purpose Trust Funds - Successor Agency to the Redevelopment Agency of the City of San Mateo The summary of long-term debt transactions including amortization for the year ended June 30, 2018:
Due in Original Issue Balance Bond Balance Due Within More Than
Amount June 30, 2017 Additions Deletions Premium June 30, 2018 One Year One Year
Redevelopment Tax Allocation Bonds:Series 2007A, Refunding 46,135,000$ 28,150,000$ -$ (28,150,000)$ -$ -$ -$ -$ Series 2015A TAB Refunding 31,210,000 33,945,107 - - (182,340) 33,762,767 - 33,762,767 Series 2015B TAB Refunding 7,385,000 6,305,000 - (1,070,000) - 5,235,000 1,095,000 4,140,000 Series 2017A TAB Refunding 21,440,000 - 24,675,451 - (278,318) 24,397,133 2,605,000 21,792,133
Total long term debt 106,170,000$ 68,400,107$ 24,675,451$ (29,220,000)$ (460,658)$ 63,394,900$ 3,700,000$ 59,694,900$
97

City of San Mateo Notes to Basic Financial Statements For the year ended June 30, 2018
8. LONG-TERM DEBT, Continued
C. Fiduciary Funds – Private Purpose Trust Funds - Successor Agency to the Redevelopment Agency of the City of San Mateo, Continued Successor Agency of the Redevelopment Agency of the City of San Mateo, Series 2015A– Original Issue $31,210,000 On August 5, 2015, the Successor Agency of the Redevelopment Agency of the City of San Mateo issued $31,210,000 principal amount Tax Allocation Refunding Bonds, Series 2015A (2015A Refunding Bonds). The proceeds of the 2015A Refunding Bonds were used to advance refund the Merged Area Tax Allocation Bonds, Series 2005A Bonds. The 2015A Refunding Bonds are tax-exempt. The 2015A Refunding Bonds mature annually each August 1 through 2032, with installments ranging from $530,000 to $4,150,000. The interest on the 2015A Refunding Bonds is payable semi-annually on each February 1 and August 1, with coupon rates ranging from 2.47% to 4.07%. The 2015A Refunding Bonds are subject to early redemption provisions. The outstanding principal balance of the 2015A Refunding Bonds was $33,762,767 at June 30, 2018. Total principal and interest remaining to be paid on the Bonds is $47,156,575. The annual debt service requirements on the 2015A Refunding Bonds are as follows:
Year Ending
June 30, Principal Interest Total
2019 -$ 1,474,050$ 1,474,050$
2020 - 1,474,050 1,474,050
2021 - 1,474,050 1,474,050
2022 - 1,474,050 1,474,050
2023 530,000 1,463,450 1,993,450
2024-2028 11,830,000 6,324,925 18,154,925
2029-2033 18,850,000 2,262,000 21,112,000
Subtotal 31,210,000 15,946,575$ 47,156,575$
Bond Premium 2,552,767
Total 33,762,767$
Successor Agency of the Redevelopment Agency of the City of San Mateo, Series 2015B– Original Issue $7,385,000 On August 5, 2015, the Successor Agency of the Redevelopment Agency of the City of San Mateo issued $7,385,000 principal amount Tax Allocation Refunding Bonds, Series 2015B (2015B Refunding Bonds). The proceeds of the 2015B Refunding Bonds were used to advance refund the Merged Area Housing Set-Aside Tax Allocation Bonds, Series 2005A Bonds. The 2015B Refunding Bonds are federally taxable.
98
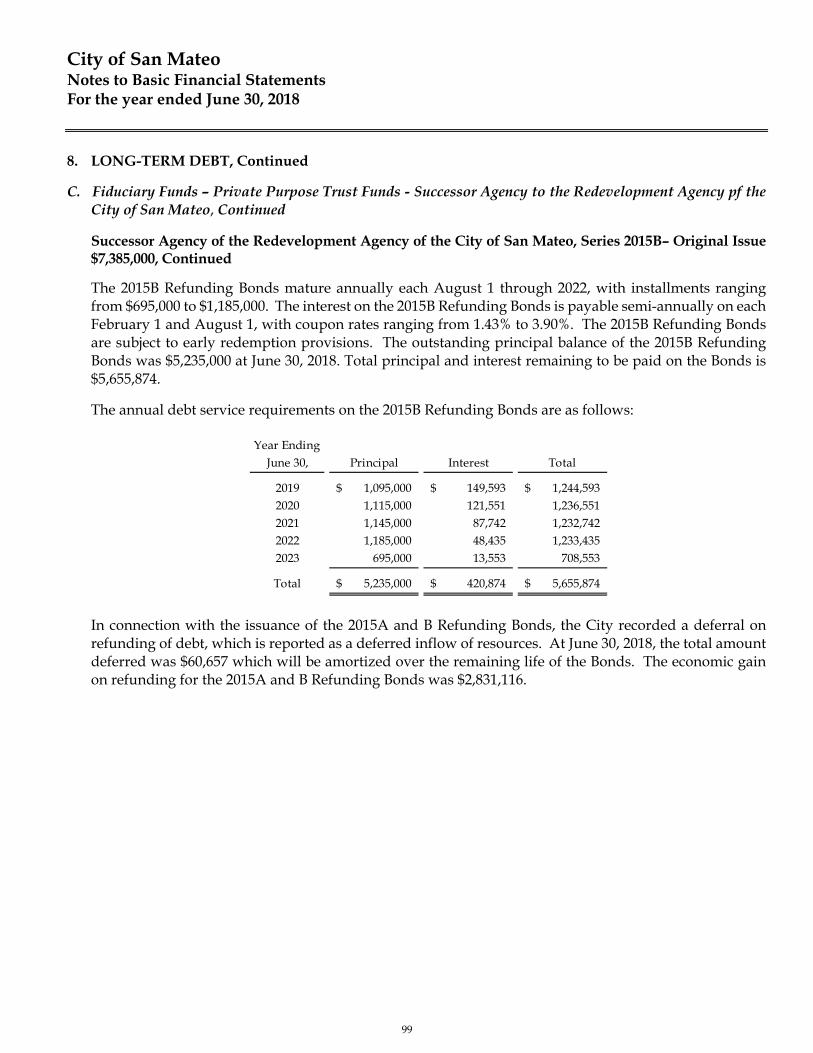
City of San Mateo Notes to Basic Financial Statements For the year ended June 30, 2018
8. LONG-TERM DEBT, Continued
C. Fiduciary Funds – Private Purpose Trust Funds - Successor Agency to the Redevelopment Agency pf the City of San Mateo, Continued
Successor Agency of the Redevelopment Agency of the City of San Mateo, Series 2015B– Original Issue $7,385,000, Continued
The 2015B Refunding Bonds mature annually each August 1 through 2022, with installments ranging from $695,000 to $1,185,000. The interest on the 2015B Refunding Bonds is payable semi-annually on each February 1 and August 1, with coupon rates ranging from 1.43% to 3.90%. The 2015B Refunding Bonds are subject to early redemption provisions. The outstanding principal balance of the 2015B Refunding Bonds was $5,235,000 at June 30, 2018. Total principal and interest remaining to be paid on the Bonds is $5,655,874.
The annual debt service requirements on the 2015B Refunding Bonds are as follows:
Year EndingJune 30, Principal Interest Total
2019 1,095,000$ 149,593$ 1,244,593$ 2020 1,115,000 121,551 1,236,551 2021 1,145,000 87,742 1,232,742 2022 1,185,000 48,435 1,233,435 2023 695,000 13,553 708,553
Total 5,235,000$ 420,874$ 5,655,874$
In connection with the issuance of the 2015A and B Refunding Bonds, the City recorded a deferral on refunding of debt, which is reported as a deferred inflow of resources. At June 30, 2018, the total amount deferred was $60,657 which will be amortized over the remaining life of the Bonds. The economic gain on refunding for the 2015A and B Refunding Bonds was $2,831,116.
99

City of San Mateo Notes to Basic Financial Statements For the year ended June 30, 2018
8. LONG-TERM DEBT, Continued
C. Fiduciary Funds – Private Purpose Trust Funds - Successor Agency to the Redevelopment Agency of theCity of San Mateo, Continued
Successor Agency of the Redevelopment Agency of the City of San Mateo, Series 2017A– Original Issue$21,440,000
On October 17, 2017, the Successor Agency of the Redevelopment Agency of the City of San Mateo issued$21,440,000 principal amount Tax Allocation Refunding Bonds, Series 2017A (2017A Refunding Bonds).The proceeds of the 2017A Refunding Bonds were used to advance refund the tax-exempt Merged AreaTax Allocation Refunding Bonds, Series 2007A. The 2017A Refunding Bonds are tax-exempt.
The 2017A Refunding Bonds mature annually each August 1 through 2025, with installments rangingfrom $2,335,000 to $3,100,000. The interest on the 2017A Refunding Bonds is payable semi-annually oneach February 1 and August 1, with coupon rates ranging from 2.00% to 5.00%. The 2017A RefundingBonds are subject to early redemption provisions. The outstanding principal balance of the 2017ARefunding Bonds was $24,397,133 at June 30, 2018. Total principal and interest remaining to be paid onthe Bonds is $25,848,900.
The annual debt service requirements on the 2017A Refunding Bonds are as follows:
Year EndingJune 30, Principal Interest Total
2019 2,605,000$ 944,450$ 3,549,450$ 2020 2,335,000 871,700 3,206,700 2021 2,425,000 764,375 3,189,375 2022 2,545,000 640,125 3,185,125 2023 2,675,000 509,625 3,184,625
2024-2026 8,855,000 678,625 9,533,625
Subtotal 21,440,000 4,408,900$ 25,848,900$
Bond Premium 2,957,133
Total 24,397,133$
Pledged Revenues
Tax Allocation Bonds held by the Successor Agency of the Redevelopment Agency of the City of San Mateo are secured by property tax revenues. For the current year, principal and interest paid on the Series 2007A, 2015A, 2015B, and 2017A, Tax Allocation Bonds were $3,237,562, $1,474,050, $1,241,647, and $280,367, respectively and Redevelopment Agency Property Tax Trust Fund distributions were $6,121,469.
100

City of San Mateo Notes to Basic Financial Statements For the year ended June 30, 2018
8. LONG-TERM DEBT, Continued
D. Land Secured Debt Financing with No City Commitment
The City of San Mateo has authorized the formation of the Bay Meadows Community Facilities District No. 2008-1 (Bay Meadows CFD), acting through its eligible landowner voters, and the issuance of bonds under the public improvement act (Mello-Roos Community Facilities Act of 1982) of the State of California to finance eligible public facilities necessary to serve developing commercial, industrial, residential and/or mixed use developments. The bonds are secured by annual special tax levies or liens placed on the property within the district. The City of San Mateo is not liable for repayment and acts only as an agent for the property owners in collecting the special taxes or assessments, forwarding the collections to bondholders, and initiating foreclosure proceedings when necessary. These bonds are payable solely from special taxes or assessments, specific reserves, and the proceeds from property foreclosures to be levied by the Bay Meadows CFD. The City is the collecting and paying agent for the debt, but has no direct or contingent liability for the payment of this debt. Accordingly, the special tax bonds are not reported as liabilities in the City’s basic financial statements. As of June 30, 2018, there are three Bay Meadows CFD special tax bonds outstanding with principal amounts payable of $31,430,000 for the Series 2012, $25,475,000 for the Series 2013, and $28,475,000 for the Series 2014. Total outstanding principal balance of the three Bay Meadows CFD special tax bonds was $85,380,000 as of June 30, 2018.
E. Landfill Closure and Post-Closure Costs Payable The City is responsible for closing the East Third Avenue Waste Disposal and Landfill site in accordance with the California Code of Regulations under the jurisdiction of the California Integrated Waste Management Board. In fiscal year 1992, the City developed a Closure Plan that in management’s view will meet all regulatory requirements. As stated in the California Code of Regulations, Division 2 Title 27 Article 2 Section 21180, “a)…the landfill shall be maintained and monitored for a period of not less than thirty (30) years after the completion of closure of the entire solid waste landfill.” The landfill is at capacity and inactive, and final closure occurred in FY 2005-06. As of June 30, 2018, the estimated amount of $2,041,642 has been recorded as Landfill Post-Closure Costs Payable in the Government-Wide Financial Statements. The City received approval from CalRecycle of a reduction in financial obligation for Post-Closure maintenance activities to $2,041,642 ($113,424 annually for eighteen years).
Due inBalance Balance Due Within More Than
July 1, 2017 Additions Deletions June 30, 2018 One Year One Year
Landfill Closure and Post-ClosureCosts Payable 2,116,961$ 36,100$ (111,419)$ 2,041,642$ 113,424$ 1,928,218$
101
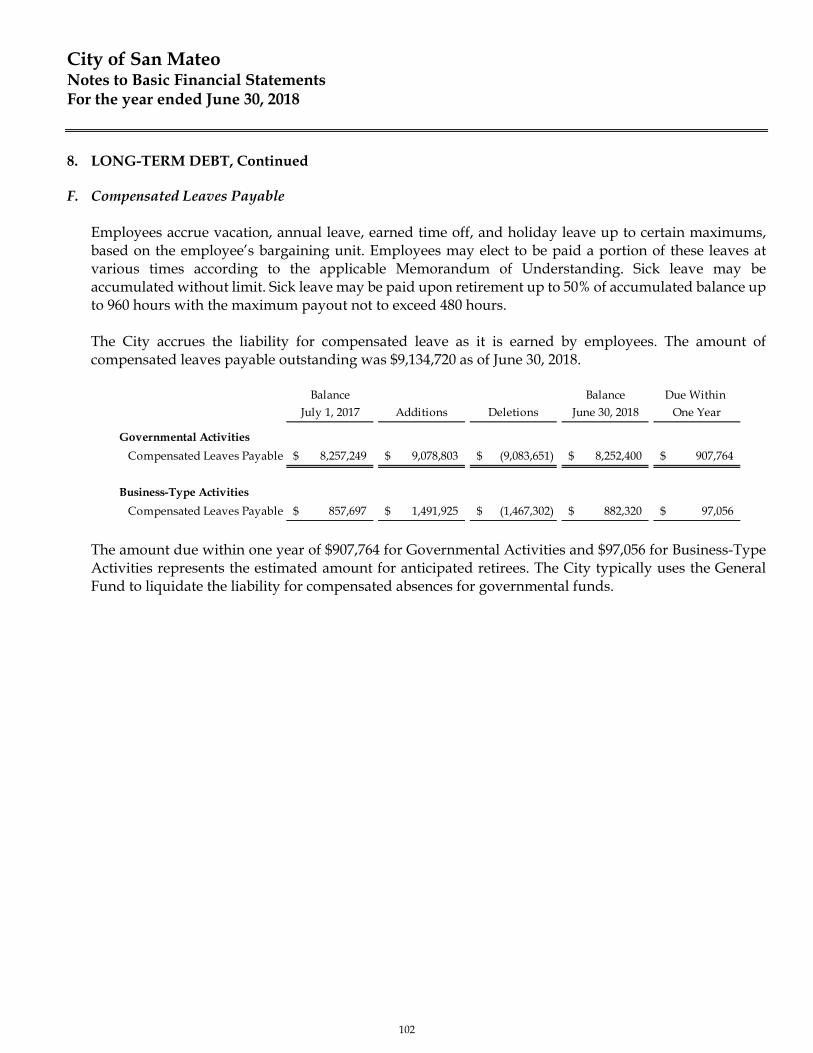
City of San Mateo Notes to Basic Financial Statements For the year ended June 30, 2018
8. LONG-TERM DEBT, Continued
F. Compensated Leaves Payable Employees accrue vacation, annual leave, earned time off, and holiday leave up to certain maximums, based on the employee’s bargaining unit. Employees may elect to be paid a portion of these leaves at various times according to the applicable Memorandum of Understanding. Sick leave may be accumulated without limit. Sick leave may be paid upon retirement up to 50% of accumulated balance up to 960 hours with the maximum payout not to exceed 480 hours. The City accrues the liability for compensated leave as it is earned by employees. The amount of compensated leaves payable outstanding was $9,134,720 as of June 30, 2018.
The amount due within one year of $907,764 for Governmental Activities and $97,056 for Business-Type Activities represents the estimated amount for anticipated retirees. The City typically uses the General Fund to liquidate the liability for compensated absences for governmental funds.
Balance Balance Due Within July 1, 2017 Additions Deletions June 30, 2018 One Year
Governmental Activities
Compensated Leaves Payable 8,257,249$ 9,078,803$ (9,083,651)$ 8,252,400$ 907,764$
Business-Type Activities
Compensated Leaves Payable 857,697$ 1,491,925$ (1,467,302)$ 882,320$ 97,056$
102
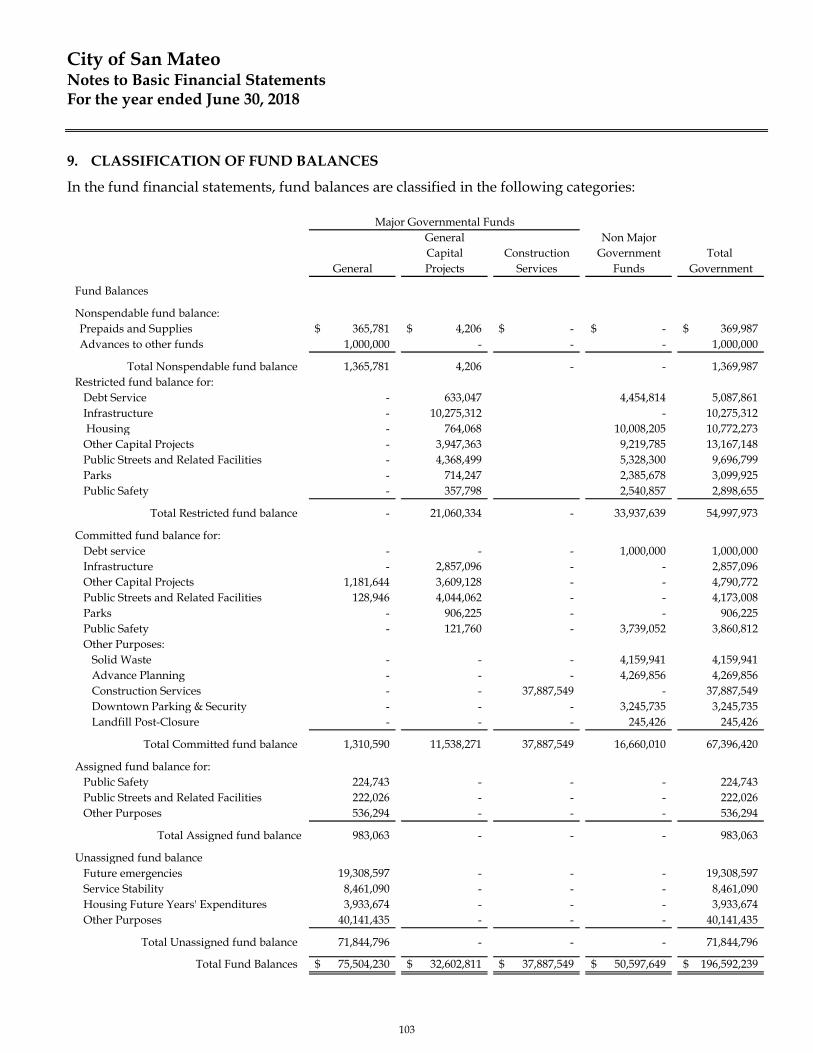
City of San Mateo Notes to Basic Financial Statements For the year ended June 30, 2018
9. CLASSIFICATION OF FUND BALANCES
In the fund financial statements, fund balances are classified in the following categories:
General Non MajorCapital Construction Government Total
General Projects Services Funds Government
Fund Balances
Nonspendable fund balance:Prepaids and Supplies 365,781$ 4,206$ -$ -$ 369,987$ Advances to other funds 1,000,000 - - - 1,000,000
Total Nonspendable fund balance 1,365,781 4,206 - - 1,369,987 Restricted fund balance for:
Debt Service - 633,047 4,454,814 5,087,861 Infrastructure - 10,275,312 - 10,275,312 Housing - 764,068 10,008,205 10,772,273 Other Capital Projects - 3,947,363 9,219,785 13,167,148 Public Streets and Related Facilities - 4,368,499 5,328,300 9,696,799 Parks - 714,247 2,385,678 3,099,925 Public Safety - 357,798 2,540,857 2,898,655
Total Restricted fund balance - 21,060,334 - 33,937,639 54,997,973
Committed fund balance for:Debt service - - - 1,000,000 1,000,000 Infrastructure - 2,857,096 - - 2,857,096 Other Capital Projects 1,181,644 3,609,128 - - 4,790,772 Public Streets and Related Facilities 128,946 4,044,062 - - 4,173,008 Parks - 906,225 - - 906,225 Public Safety - 121,760 - 3,739,052 3,860,812 Other Purposes:
Solid Waste - - - 4,159,941 4,159,941 Advance Planning - - - 4,269,856 4,269,856 Construction Services - - 37,887,549 - 37,887,549 Downtown Parking & Security - - - 3,245,735 3,245,735 Landfill Post-Closure - - - 245,426 245,426
Total Committed fund balance 1,310,590 11,538,271 37,887,549 16,660,010 67,396,420
Assigned fund balance for:Public Safety 224,743 - - - 224,743 Public Streets and Related Facilities 222,026 - - - 222,026 Other Purposes 536,294 - - - 536,294
Total Assigned fund balance 983,063 - - - 983,063
Unassigned fund balanceFuture emergencies 19,308,597 - - - 19,308,597 Service Stability 8,461,090 - - - 8,461,090 Housing Future Years' Expenditures 3,933,674 - - - 3,933,674 Other Purposes 40,141,435 - - - 40,141,435
Total Unassigned fund balance 71,844,796 - - - 71,844,796
Total Fund Balances 75,504,230$ 32,602,811$ 37,887,549$ 50,597,649$ 196,592,239$
Major Governmental Funds
103
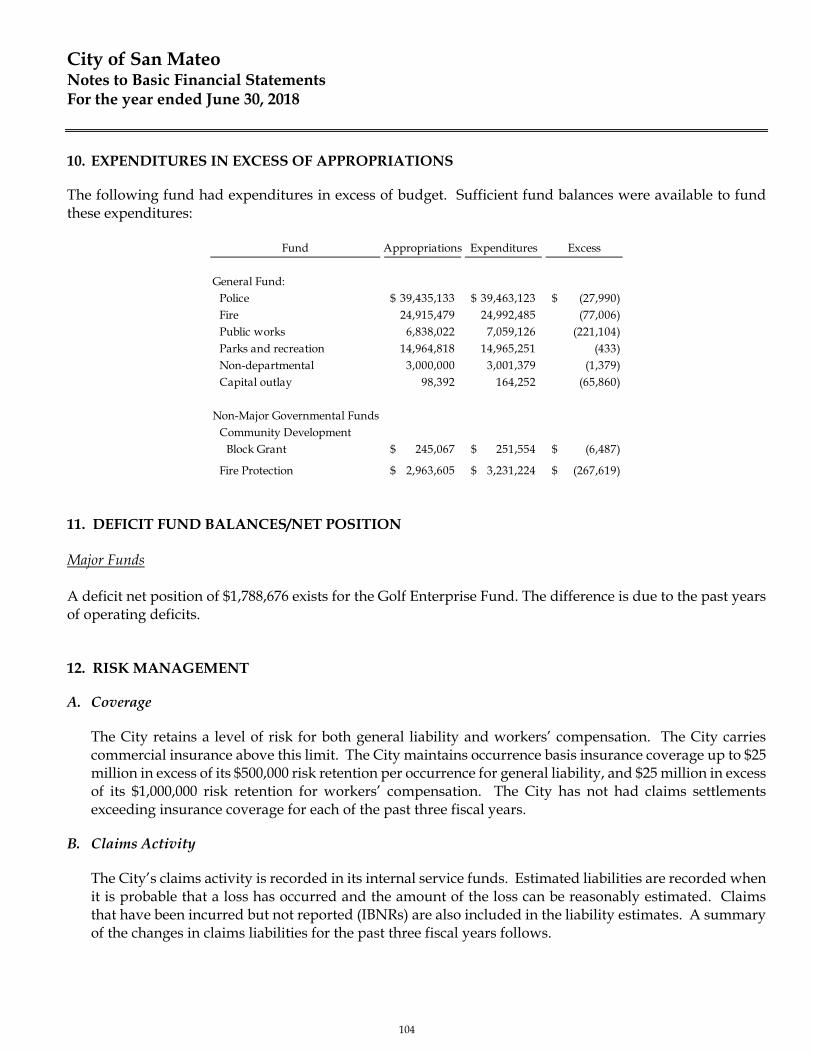
City of San Mateo Notes to Basic Financial Statements For the year ended June 30, 2018
10. EXPENDITURES IN EXCESS OF APPROPRIATIONS The following fund had expenditures in excess of budget. Sufficient fund balances were available to fund these expenditures:
Fund Appropriations Expenditures Excess
General Fund:Police 39,435,133$ 39,463,123$ (27,990)$ Fire 24,915,479 24,992,485 (77,006) Public works 6,838,022 7,059,126 (221,104) Parks and recreation 14,964,818 14,965,251 (433) Non-departmental 3,000,000 3,001,379 (1,379) Capital outlay 98,392 164,252 (65,860)
Non-Major Governmental FundsCommunity Development
Block Grant 245,067$ 251,554$ (6,487)$
Fire Protection 2,963,605$ 3,231,224$ (267,619)$
11. DEFICIT FUND BALANCES/NET POSITION Major Funds A deficit net position of $1,788,676 exists for the Golf Enterprise Fund. The difference is due to the past years of operating deficits.
12. RISK MANAGEMENT A. Coverage
The City retains a level of risk for both general liability and workers’ compensation. The City carries commercial insurance above this limit. The City maintains occurrence basis insurance coverage up to $25 million in excess of its $500,000 risk retention per occurrence for general liability, and $25 million in excess of its $1,000,000 risk retention for workers’ compensation. The City has not had claims settlements exceeding insurance coverage for each of the past three fiscal years.
B. Claims Activity
The City’s claims activity is recorded in its internal service funds. Estimated liabilities are recorded when it is probable that a loss has occurred and the amount of the loss can be reasonably estimated. Claims that have been incurred but not reported (IBNRs) are also included in the liability estimates. A summary of the changes in claims liabilities for the past three fiscal years follows.
104
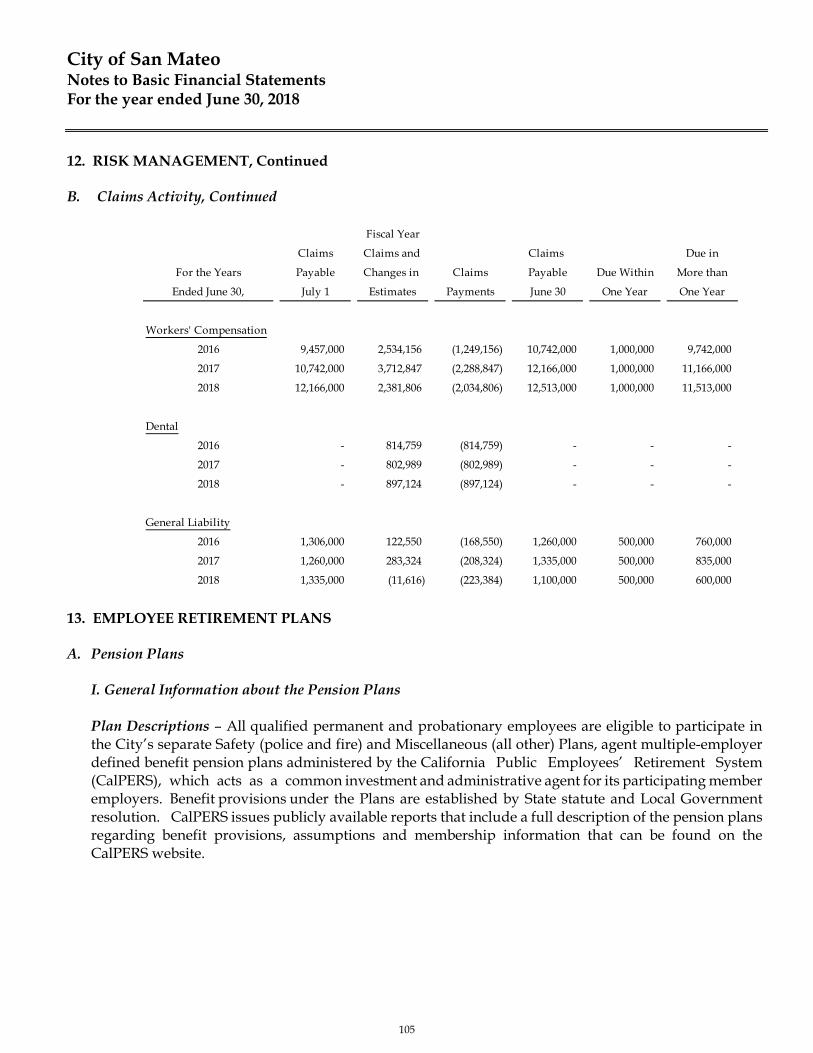
City of San Mateo Notes to Basic Financial Statements For the year ended June 30, 2018
12. RISK MANAGEMENT, Continued
B. Claims Activity, Continued
Fiscal Year
Claims Claims and Claims Due in
For the Years Payable Changes in Claims Payable Due Within More than
Ended June 30, July 1 Estimates Payments June 30 One Year One Year
Workers' Compensation
2016 9,457,000 2,534,156 (1,249,156) 10,742,000 1,000,000 9,742,000
2017 10,742,000 3,712,847 (2,288,847) 12,166,000 1,000,000 11,166,000
2018 12,166,000 2,381,806 (2,034,806) 12,513,000 1,000,000 11,513,000
Dental
2016 - 814,759 (814,759) - - -
2017 - 802,989 (802,989) - - -
2018 - 897,124 (897,124) - - -
General Liability
2016 1,306,000 122,550 (168,550) 1,260,000 500,000 760,000
2017 1,260,000 283,324 (208,324) 1,335,000 500,000 835,000
2018 1,335,000 (11,616) (223,384) 1,100,000 500,000 600,000
13. EMPLOYEE RETIREMENT PLANS
A. Pension Plans
I. General Information about the Pension Plans
Plan Descriptions – All qualified permanent and probationary employees are eligible to participate in the City’s separate Safety (police and fire) and Miscellaneous (all other) Plans, agent multiple-employer defined benefit pension plans administered by the California Public Employees’ Retirement System (CalPERS), which acts as a common investment and administrative agent for its participating member employers. Benefit provisions under the Plans are established by State statute and Local Government resolution. CalPERS issues publicly available reports that include a full description of the pension plans regarding benefit provisions, assumptions and membership information that can be found on the CalPERS website.
105

City of San Mateo Notes to Basic Financial Statements For the year ended June 30, 2018
13. EMPLOYEE RETIREMENT PLANS, Continued
A. Pension Plans, Continued I. General Information about the Pension Plans, Continued Benefits Provided – CalPERS provides service retirement and disability benefits, annual cost of living adjustments and death benefits to plan members, who must be public employees and beneficiaries. Benefits are based on years of credited service, equal to one year of full time employment. Members with five years of total service are eligible to retire at age 50 with statutorily reduced benefits. All members are eligible for non-duty disability benefits after 10 years of service. The death benefit is one of the following: the Basic Death Benefit, the 1957 Survivor Benefit, or the Optional Settlement 2W Death Benefit. The cost of living adjustments for each plan are applied as specified by the Public Employees’ Retirement Law. The Plans’ provisions and benefits in effect at June 30, 2018, are summarized as follows:
On January 1, 2013, the Public Employee Pension Reform Act (PEPRA) went into effect. This State law applies to employees hired after January 1, 2013 who are new to PERS. These employees are termed PEPRA members and employees that were enrolled in PERS (without significant separation) prior to January 1, 2013 are now referred to as classic members. PEPRA miscellaneous members will be enrolled in a 2% at 62 plan and PEPRA safety members will be enrolled in a 2.7% at 57 plan. PEPRA members will be required to pay half the normal cost of their plans. Employees Covered – At June 30, 2018, the following employees were covered by the benefit terms for each Plan:
Safety Miscellaneous
Benefit vesting schedule 5 years of service 5 years of service
Benefit payments monthly for life monthly for life
Earliest retirement age 50 50
Benefit factor for each year of service
as a % of annual salary 3% at age 50 2% at age 55
Required employee contribution rates 9% 7%
Required employer contribution rates 17.87% 8.08%
Required unfunded accrued liability
payment (UAL) 7,473,106$ 3,766,532$
Miscellaneous Safety
Inactive employees or beneficiaries currently receiving benefits
570 356
Inactive employees entitled to but not yet receiving benefits
313 118
Active employees 348 190
Total 1,231 664
106

City of San Mateo Notes to Basic Financial Statements For the year ended June 30, 2018
13. EMPLOYEE RETIREMENT PLANS, Continued
A. Pension Plans, Continued I. General Information about the Pension Plans, Continued Contributions – Section 20814(C) of the California Public Employees’ Retirement Law (PERL) requires that the employer contribution rates for all public employers be determined on an annual basis by the actuary and shall be effective on the July 1 following notice of a change in the rate. Funding contributions for both Plans are determined annually on an actuarial basis as of June 30 by CalPERS. The actuarially determined rate is the estimated amount necessary to finance the costs of benefits earned by employees during the year, with additional amount to finance any unfunded accrued liability. The City is required to contribute the difference between the actuarially determined rate and the contribution rate of employees. For the measurement period ended June 30, 2017 (the measurement date), the average active employee contribution rate is 7 percent of annual pay for the Miscellaneous Plan and 9 percent of annual pay for the Safety Plan, and employer contribution rate is 18.61 percent of annual payroll for the Miscellaneous Plan and 43.06 percent of annual payroll for the Safety Plan II. Net Pension Liability The City’s net pension liability for each Plan is measured as the total pension liability, less the pension plan’s fiduciary net position. The net pension liability of each of the Plans is measured as of June 30, 2017, using an annual actuarial valuation as of June 30, 2016 rolled forward to June 30, 2017 using standard update procedures. A summary of principal assumptions and methods used to determine the net pension liability is shown on the following page.
Actuarial Assumptions – The total pension liabilities in the June 30, 2016 actuarial valuations were determined using the following actuarial assumptions:
Miscellaneous Safety
Valuation Date June 30, 2016 June 30, 2016
Measurement Date June 30, 2017 June 30, 2017
Actuarial Cost Method
Actuarial Assumptions:
Discount Rate 7.15% 7.15%
Inflation 2.75% 2.75%
Salary Increases
Investment Rate of Return (1) 7.50% 7.50%
Mortality (2)
Post Retirement Benefit Increase
(1) Net of pension plan administrative expenses.
Entry-Age Normal Cost Method
Varies by Entry Age and Service
Derived using CalPERS' Membership Data for all Funds
Contract COLA up to 2.75% until Purchasing Power Protection Allowance Floor on Purchasing Power applies, 2.75% thereafter
(2) The mortality table used was developed based on CalPERS' specific data. The table includes 20 years of mortality improvements using Society of Actuaries Scale BB.
107
City of San Mateo Notes to Basic Financial Statements For the year ended June 30, 2018
13. EMPLOYEE RETIREMENT PLANS, Continued
A. Pension Plans, Continued II. Net Pension Liability, Continued The underlying mortality assumptions and all other actuarial assumptions used in the June 30, 2016 valuation were based on the results of a January 2014 actuarial experience study for the period 1997 to 2011. Further details of the Experience Study can be found on the CalPERS website. Discount Rate – The discount rate used to measure the total pension liability was 7.15% for each Plan. This rate includes investment expenses and inflation. To determine whether the municipal bond rate should be used in the calculation of a discount rate for each plan, CalPERS stress tested plans that would most likely result in a discount rate that would be different from the actuarially assumed discount rate. Based on the testing, none of the tested plans run out of assets. Therefore, the current 7.15 percent discount rate is adequate and the use of the municipal bond rate calculation is not necessary. The long term expected discount rate of 7.15 percent will be applied to all plans in the Public Employees Retirement Fund (PERF). The stress test results are presented in a detailed report that can be obtained from the CalPERS website. The long-term expected rate of return on pension plan investments was determined using a building-block method in which best-estimate ranges of expected future real rates of return (expected returns, net of pension plan investment expense and inflation) are developed for each major asset class. In determining the long-term expected rate of return, CalPERS took into account both short-term and long-term market return expectations as well as the expected pension fund cash flows. Using historical returns of all the funds’ asset classes, expected compound returns were calculated over the short-term (first 10 years) and the long-term (11-60 years) using a building-block approach. Using the expected nominal returns for both short-term and long-term, the present value of benefits was calculated for each fund. The expected rate of return was set by calculating the single equivalent expected return that arrived at the same present value of benefits for cash flows as the one calculated using both short-term and long-term returns. The expected rate of return was then set equivalent to the single equivalent rate calculated above, and rounded down to the nearest one quarter of one percent.
108
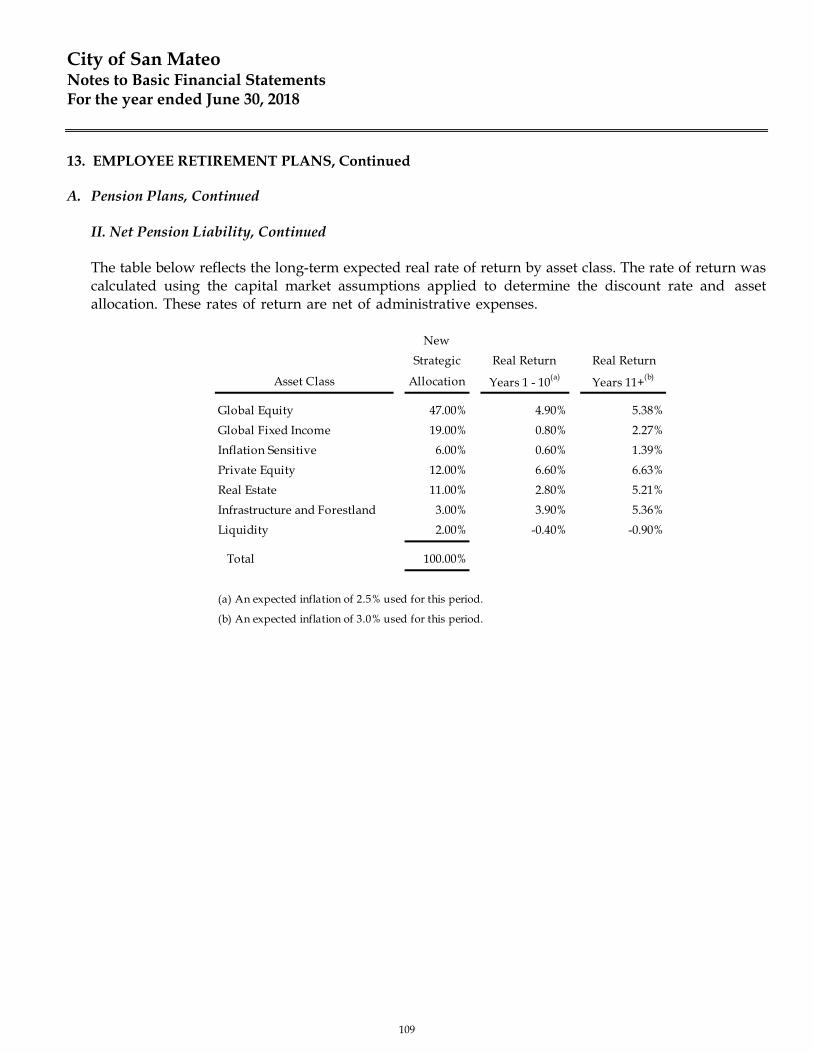
City of San Mateo Notes to Basic Financial Statements For the year ended June 30, 2018
13. EMPLOYEE RETIREMENT PLANS, Continued A. Pension Plans, Continued
II. Net Pension Liability, Continued
The table below reflects the long-term expected real rate of return by asset class. The rate of return was calculated using the capital market assumptions applied to determine the discount rate and asset allocation. These rates of return are net of administrative expenses.
New
Strategic Real Return Real Return
Asset Class Allocation Years 1 - 10(a) Years 11+(b)
Global Equity 47.00% 4.90% 5.38%
Global Fixed Income 19.00% 0.80% 2.27%
Inflation Sensitive 6.00% 0.60% 1.39%
Private Equity 12.00% 6.60% 6.63%
Real Estate 11.00% 2.80% 5.21%
Infrastructure and Forestland 3.00% 3.90% 5.36%
Liquidity 2.00% -0.40% -0.90%
Total 100.00%
(a) An expected inflation of 2.5% used for this period.
(b) An expected inflation of 3.0% used for this period.
109
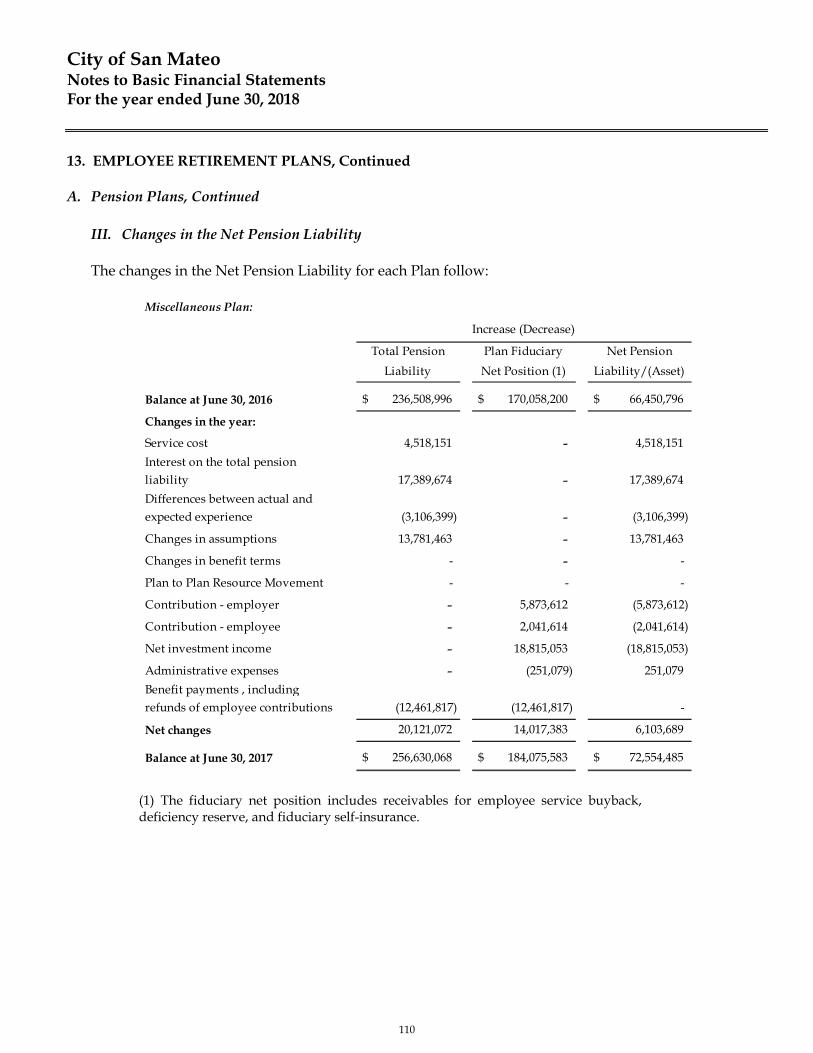
City of San Mateo Notes to Basic Financial Statements For the year ended June 30, 2018
13. EMPLOYEE RETIREMENT PLANS, Continued
A. Pension Plans, Continued III. Changes in the Net Pension Liability The changes in the Net Pension Liability for each Plan follow:
(1) The fiduciary net position includes receivables for employee service buyback, deficiency reserve, and fiduciary self-insurance.
Miscellaneous Plan:
Total Pension Plan Fiduciary Net Pension
Liability Net Position (1) Liability/(Asset)
Balance at June 30, 2016 $ 236,508,996 $ 170,058,200 $ 66,450,796
Changes in the year:
Service cost 4,518,151 - 4,518,151
Interest on the total pension liability 17,389,674 - 17,389,674
Differences between actual and expected experience (3,106,399) - (3,106,399)
Changes in assumptions 13,781,463 - 13,781,463
Changes in benefit terms - - -
Plan to Plan Resource Movement - - -
Contribution - employer - 5,873,612 (5,873,612)
Contribution - employee - 2,041,614 (2,041,614)
Net investment income - 18,815,053 (18,815,053)
Administrative expenses - (251,079) 251,079
Benefit payments , including refunds of employee contributions (12,461,817) (12,461,817) -
Net changes 20,121,072 14,017,383 6,103,689
Balance at June 30, 2017 $ 256,630,068 $ 184,075,583 $ 72,554,485
Increase (Decrease)
110
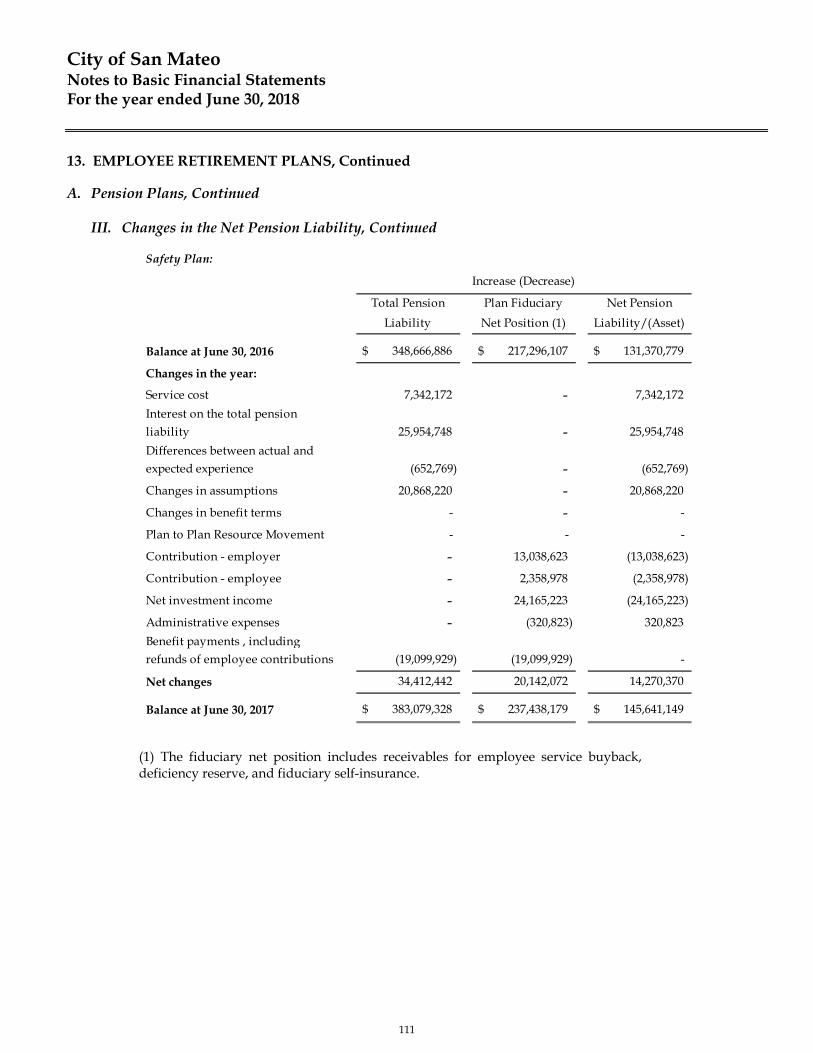
City of San Mateo Notes to Basic Financial Statements For the year ended June 30, 2018
13. EMPLOYEE RETIREMENT PLANS, Continued
A. Pension Plans, Continued
III. Changes in the Net Pension Liability, Continued
(1) The fiduciary net position includes receivables for employee service buyback, deficiency reserve, and fiduciary self-insurance.
Safety Plan:
Total Pension Plan Fiduciary Net Pension
Liability Net Position (1) Liability/(Asset)
Balance at June 30, 2016 $ 348,666,886 $ 217,296,107 $ 131,370,779
Changes in the year:
Service cost 7,342,172 - 7,342,172
Interest on the total pension liability 25,954,748 - 25,954,748
Differences between actual and expected experience (652,769) - (652,769)
Changes in assumptions 20,868,220 - 20,868,220
Changes in benefit terms - - -
Plan to Plan Resource Movement - - -
Contribution - employer - 13,038,623 (13,038,623)
Contribution - employee - 2,358,978 (2,358,978)
Net investment income - 24,165,223 (24,165,223)
Administrative expenses - (320,823) 320,823
Benefit payments , including refunds of employee contributions (19,099,929) (19,099,929) -
Net changes 34,412,442 20,142,072 14,270,370
Balance at June 30, 2017 $ 383,079,328 $ 237,438,179 $ 145,641,149
Increase (Decrease)
111

City of San Mateo Notes to Basic Financial Statements For the year ended June 30, 2018
13. EMPLOYEE RETIREMENT PLANS, Continued A. Pension Plans, Continued
III. Changes in the Net Pension Liability, Continued
Sensitivity of the Net Pension Liability to Changes in the Discount Rate – The following presents the net pension liability of the City for each Plan, calculated using the discount rate for each Plan, as well as what the City’s net pension liability would be if it were calculated using a discount rate that is 1-percentage point lower or 1-percentage point higher than the current rate:
1% Decrease 6.15% 6.15% 6.15%
Net Pension Liability $ 105,466,074 $ 195,833,770 $ 301,299,844
Current Discount Rate 7.15% 7.15% 7.15%
Net Pension Liability $ 72,554,485 $ 145,641,149 $ 218,195,634
1% Increase 8.15% 8.15% 8.15%
Net Pension Liability $ 45,214,161 $ 104,235,065 $ 149,449,226
Miscellaneous Safety Total
. Pension Plan Fiduciary Net Position – Detailed information about each pension plan’s fiduciary net position is available in the separately issued CalPERS financial reports.
IV. Pension Expenses and Deferred Outflows/Inflows of Resources Related to Pensions For the year ended June 30, 2017, the City recognized pension expense of $11,005,197 for the Miscellaneous Plan and $18,349,269 for the Safety Plan.
112

City of San Mateo Notes to Basic Financial Statements For the year ended June 30, 2018
13. EMPLOYEE RETIREMENT PLANS, Continued A. Pension Plans, Continued
IV. Pension Expenses and Deferred Outflows/Inflows of Resources Related to Pensions, Continued At June 30, 2018, the City reported deferred outflows of resources and deferred inflows of resources related to pensions from the following sources:
Deferred Outflows of Resources
Deferred Inflows of Resources
Deferred Outflows of Resources
Deferred Inflows of Resources
Pension contributions subsequent to measurement date $ 6,287,697 $ - $ 13,411,260 $ - Differences between actual and expected experience - 1,988,229 - 1,476,338 Changes in assumptions 8,480,900 - 14,730,508 671,392 Net differences between projected and actual earnings on plan investments 2,531,701 - 3,240,465 -
Total 17,300,298$ 1,988,229$ 31,382,233$ 2,147,730$
Deferred Outflows of Resources
Deferred Inflows of Resources
Pension contributions subsequent to measurement date $ 19,698,957 $ - Differences between actual and expected experience - 3,464,567 Changes in assumptions 23,211,408 671,392 Net differences between projected and actual earnings on plan investments 5,772,166 -
Total 48,682,531$ 4,135,959$
Total
Miscellaneous Plan Safety Plan
$19,698,957 reported as deferred outflows of resources related to contributions subsequent to the measurement date will be recognized as a reduction of the net pension liability in the year ending June 30, 2019.
113

City of San Mateo Notes to Basic Financial Statements For the year ended June 30, 2018
13. EMPLOYEE RETIREMENT PLANS, Continued A. Pension Plans, Continued
IV. Pension Expenses and Deferred Outflows/Inflows of Resources Related to Pensions, Continued Other amounts reported as deferred outflows of resources and deferred inflows of resources related to pensions will be recognized as pension expense as follows:
Fiscal Year Miscellaneous Safety
Ending June 30: Plan Plan Total
2019 $ 3,930,609 $ 4,270,542 $ 8,201,151
2020 5,385,746 9,568,082 14,953,828
2021 1,077,829 3,742,389 4,820,218
2022 (1,369,812) (1,757,770) (3,127,582)
V. Payable to Pension Plans As of June 30, 2018, the City reported a payable of $464,236 for the outstanding amount of contributions to the pension plans required for the year ended June 30, 2018.
VI. Change of Assumptions
In 2017, the accounting discount rate reduced from 7.65 percent to 7.15 percent. B. Social Security
Total contributions to Social Security for all City employees during the year ended June 30, 2018 amounted to $ 4,070,624 of which the City paid $2,035,312. The Omnibus Budget Reconciliation Act of 1990 (OBRA) mandates that public sector employees who are not members of their employer’s existing retirement system as of January 1, 1992 be covered by either Social Security or an alternative plan. The City’s part-time, seasonal and temporary employees are covered under an alternative savings plan, which requires these employees and the City to each contribute 3.75% of the employees’ pay for a total of 7.50%.
114
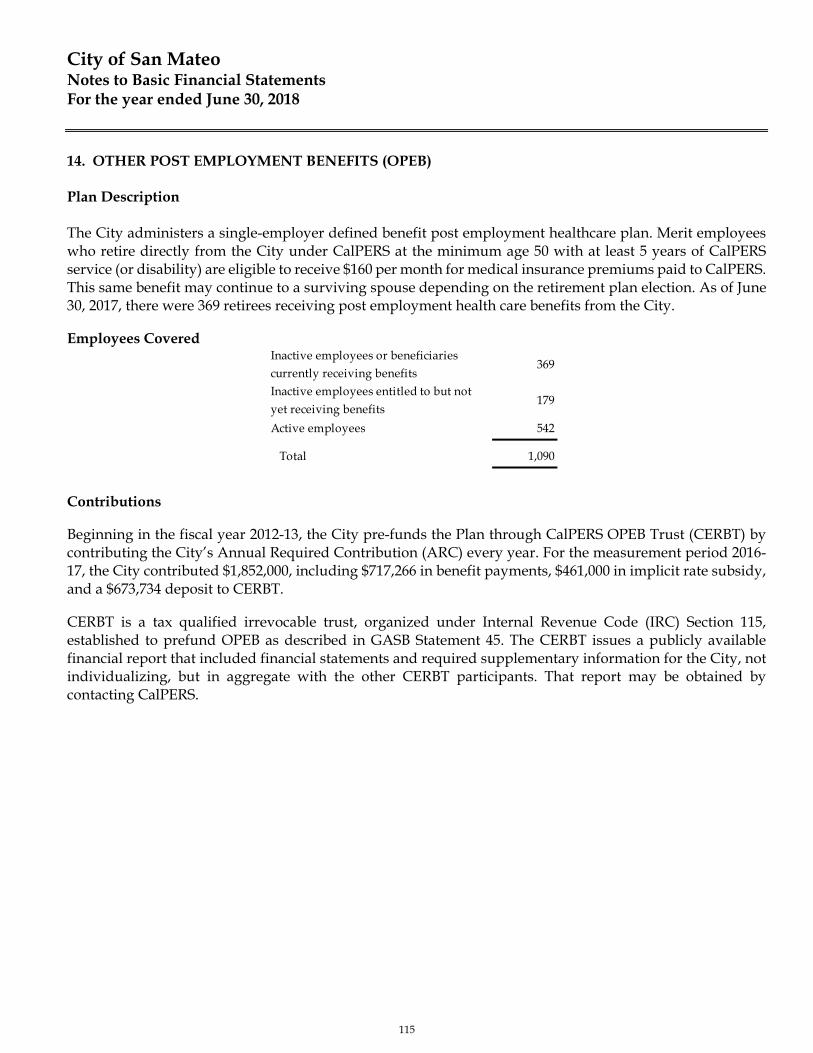
City of San Mateo Notes to Basic Financial Statements For the year ended June 30, 2018
14. OTHER POST EMPLOYMENT BENEFITS (OPEB) Plan Description The City administers a single-employer defined benefit post employment healthcare plan. Merit employees who retire directly from the City under CalPERS at the minimum age 50 with at least 5 years of CalPERS service (or disability) are eligible to receive $160 per month for medical insurance premiums paid to CalPERS. This same benefit may continue to a surviving spouse depending on the retirement plan election. As of June 30, 2017, there were 369 retirees receiving post employment health care benefits from the City. Employees Covered
Inactive employees or beneficiaries currently receiving benefits
369
Inactive employees entitled to but not yet receiving benefits
179
Active employees 542
Total 1,090
Contributions Beginning in the fiscal year 2012-13, the City pre-funds the Plan through CalPERS OPEB Trust (CERBT) by contributing the City’s Annual Required Contribution (ARC) every year. For the measurement period 2016-17, the City contributed $1,852,000, including $717,266 in benefit payments, $461,000 in implicit rate subsidy, and a $673,734 deposit to CERBT. CERBT is a tax qualified irrevocable trust, organized under Internal Revenue Code (IRC) Section 115, established to prefund OPEB as described in GASB Statement 45. The CERBT issues a publicly available financial report that included financial statements and required supplementary information for the City, not individualizing, but in aggregate with the other CERBT participants. That report may be obtained by contacting CalPERS.
115
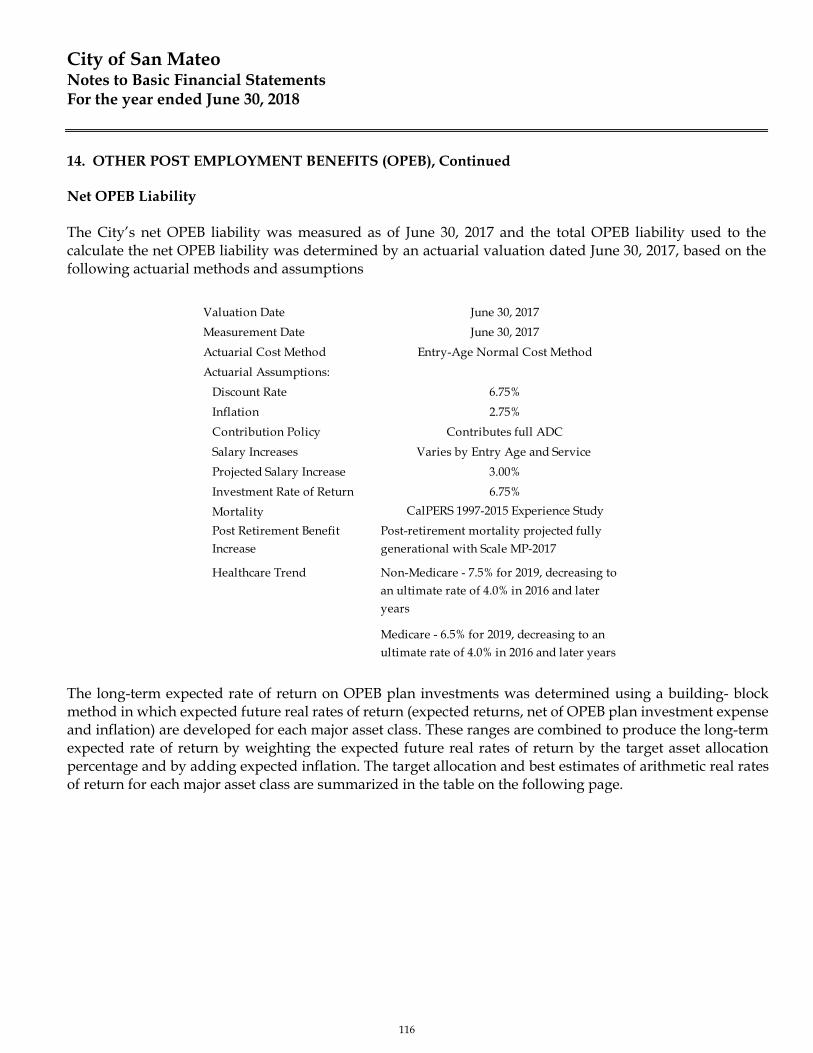
City of San Mateo Notes to Basic Financial Statements For the year ended June 30, 2018
14. OTHER POST EMPLOYMENT BENEFITS (OPEB), Continued Net OPEB Liability The City’s net OPEB liability was measured as of June 30, 2017 and the total OPEB liability used to the calculate the net OPEB liability was determined by an actuarial valuation dated June 30, 2017, based on the following actuarial methods and assumptions
The long-term expected rate of return on OPEB plan investments was determined using a building- block method in which expected future real rates of return (expected returns, net of OPEB plan investment expense and inflation) are developed for each major asset class. These ranges are combined to produce the long-term expected rate of return by weighting the expected future real rates of return by the target asset allocation percentage and by adding expected inflation. The target allocation and best estimates of arithmetic real rates of return for each major asset class are summarized in the table on the following page.
Valuation Date June 30, 2017
Measurement Date June 30, 2017
Actuarial Cost Method Entry-Age Normal Cost Method
Actuarial Assumptions:
Discount Rate 6.75%
Inflation 2.75%
Contribution Policy Contributes full ADC
Salary Increases Varies by Entry Age and Service
Projected Salary Increase 3.00%
Investment Rate of Return 6.75%
Mortality CalPERS 1997-2015 Experience Study
Post Retirement Benefit Increase
Post-retirement mortality projected fully generational with Scale MP-2017
Healthcare Trend Non-Medicare - 7.5% for 2019, decreasing to an ultimate rate of 4.0% in 2016 and later years
Medicare - 6.5% for 2019, decreasing to an ultimate rate of 4.0% in 2016 and later years
116

City of San Mateo Notes to Basic Financial Statements For the year ended June 30, 2018
14. OTHER POST EMPLOYMENT BENEFITS (OPEB), Continued Net OPEB Liability, Continued
Target Expected Real
Asset Class Allocation* Rate of Return
Public Equity 57.00% 4.82%
Fixed Income 27.00% 1.47%
TIPS 5.00% 1.29%
Commodities 3.00% 0.84%
REITS 8.00% 3.76%
Assumed Long-Term Rate of Inflation 2.75%
Assumed Long-Term Investment Expenses n/a
Expected Long-Term Net Rate of Return, Rounded 6.75%
Discount Rate** 6.75%
*P ro vided by CalP ERS' S tra tegic As s e t Allo ca tio n Analys is Overview in Augus t 2014 – S tra tegy 1.
**The fiduc ia ry ne t po s itio n is pro jec ted to be s uffic ient to make pro jec ted benefit payments , and
the plan as s e ts a re expec ted to be inves ted us ing the s tra tegy to achieve the expec ted re turn.
Discount Rate The discount rate used to measure the total OPEB liability was 6.75 percent. The projection of cash flows used to determine the discount rate assumed that City contributions will be made at rates equal to the actuarially determined contribution rates. Based on those assumptions, the OPEB plan’s fiduciary net position was projected to be available to make all projected OPEB payments for current active and inactive employees and beneficiaries. Therefore, the long-term expected rate of return on OPEB plan investments was applied to all periods of projected benefit payments to determine the total OPEB liability.
117
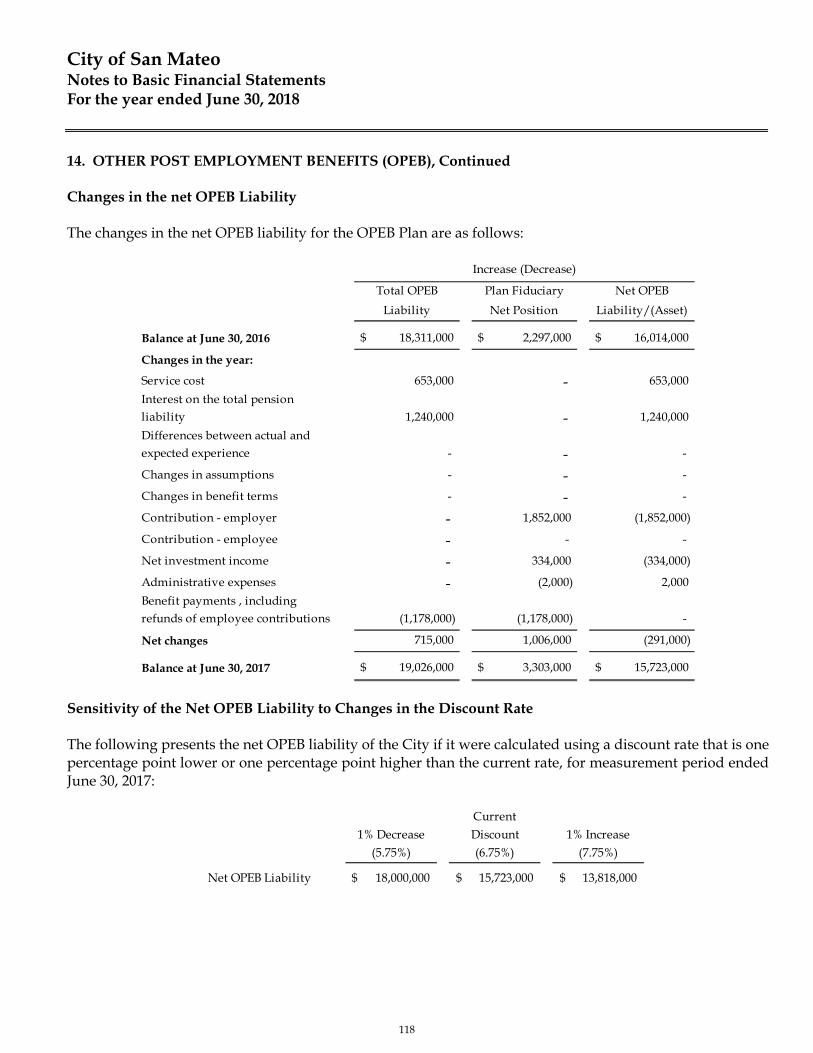
City of San Mateo Notes to Basic Financial Statements For the year ended June 30, 2018
14. OTHER POST EMPLOYMENT BENEFITS (OPEB), Continued
Changes in the net OPEB Liability
The changes in the net OPEB liability for the OPEB Plan are as follows:
Total OPEB Plan Fiduciary Net OPEB
Liability Net Position Liability/(Asset)
Balance at June 30, 2016 $ 18,311,000 $ 2,297,000 $ 16,014,000
Changes in the year:
Service cost 653,000 - 653,000
Interest on the total pension liability 1,240,000 - 1,240,000
Differences between actual and expected experience - - -
Changes in assumptions - - -
Changes in benefit terms - - -
Contribution - employer - 1,852,000 (1,852,000)
Contribution - employee - - -
Net investment income - 334,000 (334,000)
Administrative expenses - (2,000) 2,000
Benefit payments , including refunds of employee contributions (1,178,000) (1,178,000) -
Net changes 715,000 1,006,000 (291,000)
Balance at June 30, 2017 $ 19,026,000 $ 3,303,000 $ 15,723,000
Increase (Decrease)
Sensitivity of the Net OPEB Liability to Changes in the Discount Rate
The following presents the net OPEB liability of the City if it were calculated using a discount rate that is one percentage point lower or one percentage point higher than the current rate, for measurement period ended June 30, 2017:
Current
1% Decrease Discount 1% Increase(5.75%) (6.75%) (7.75%)
Net OPEB Liability $ 18,000,000 15,723,000$ 13,818,000$
118
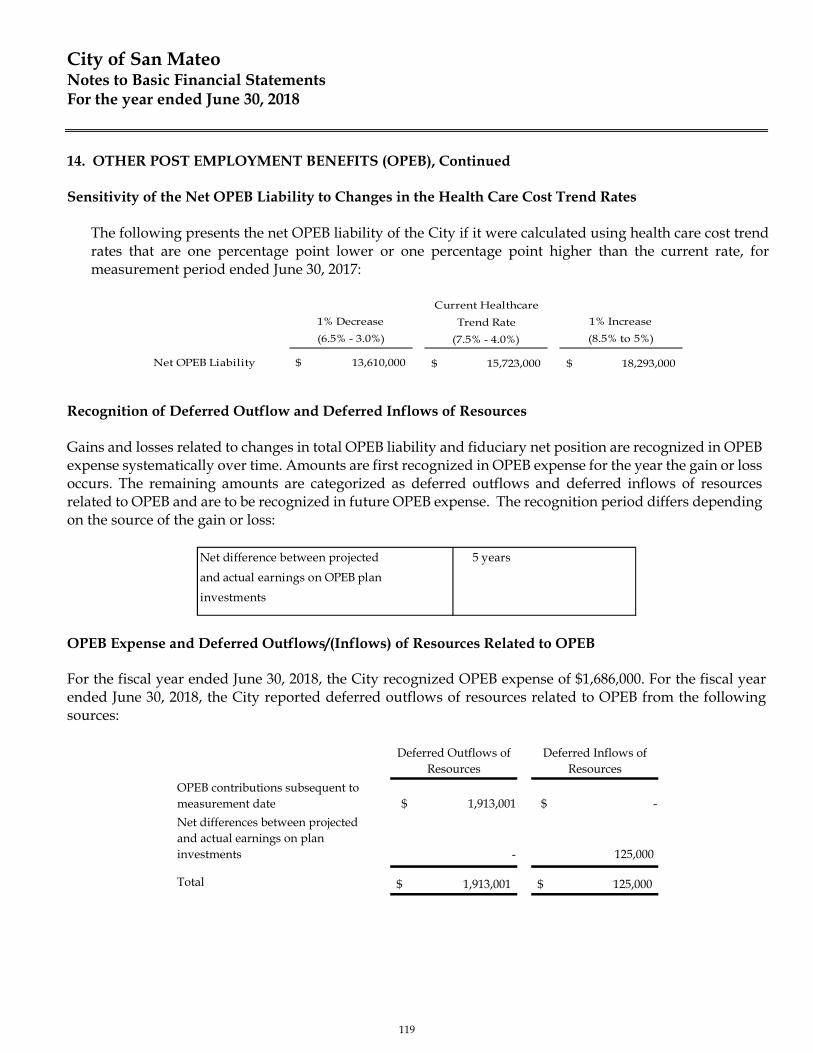
City of San Mateo Notes to Basic Financial Statements For the year ended June 30, 2018
14. OTHER POST EMPLOYMENT BENEFITS (OPEB), Continued Sensitivity of the Net OPEB Liability to Changes in the Health Care Cost Trend Rates
The following presents the net OPEB liability of the City if it were calculated using health care cost trend rates that are one percentage point lower or one percentage point higher than the current rate, for measurement period ended June 30, 2017:
Current Healthcare
1% Decrease Trend Rate 1% Increase
(6.5% - 3.0%) (7.5% - 4.0%) (8.5% to 5%)
Net OPEB Liability $ 13,610,000 15,723,000$ 18,293,000$
Recognition of Deferred Outflow and Deferred Inflows of Resources Gains and losses related to changes in total OPEB liability and fiduciary net position are recognized in OPEB expense systematically over time. Amounts are first recognized in OPEB expense for the year the gain or loss occurs. The remaining amounts are categorized as deferred outflows and deferred inflows of resources related to OPEB and are to be recognized in future OPEB expense. The recognition period differs depending on the source of the gain or loss:
OPEB Expense and Deferred Outflows/(Inflows) of Resources Related to OPEB For the fiscal year ended June 30, 2018, the City recognized OPEB expense of $1,686,000. For the fiscal year ended June 30, 2018, the City reported deferred outflows of resources related to OPEB from the following sources:
Deferred Outflows of Resources
Deferred Inflows of Resources
OPEB contributions subsequent to measurement date $ 1,913,001 $ -
Net differences between projected and actual earnings on plan investments - 125,000
Total 1,913,001$ 125,000$
Net difference between projected 5 years
and actual earnings on OPEB plan
investments
119
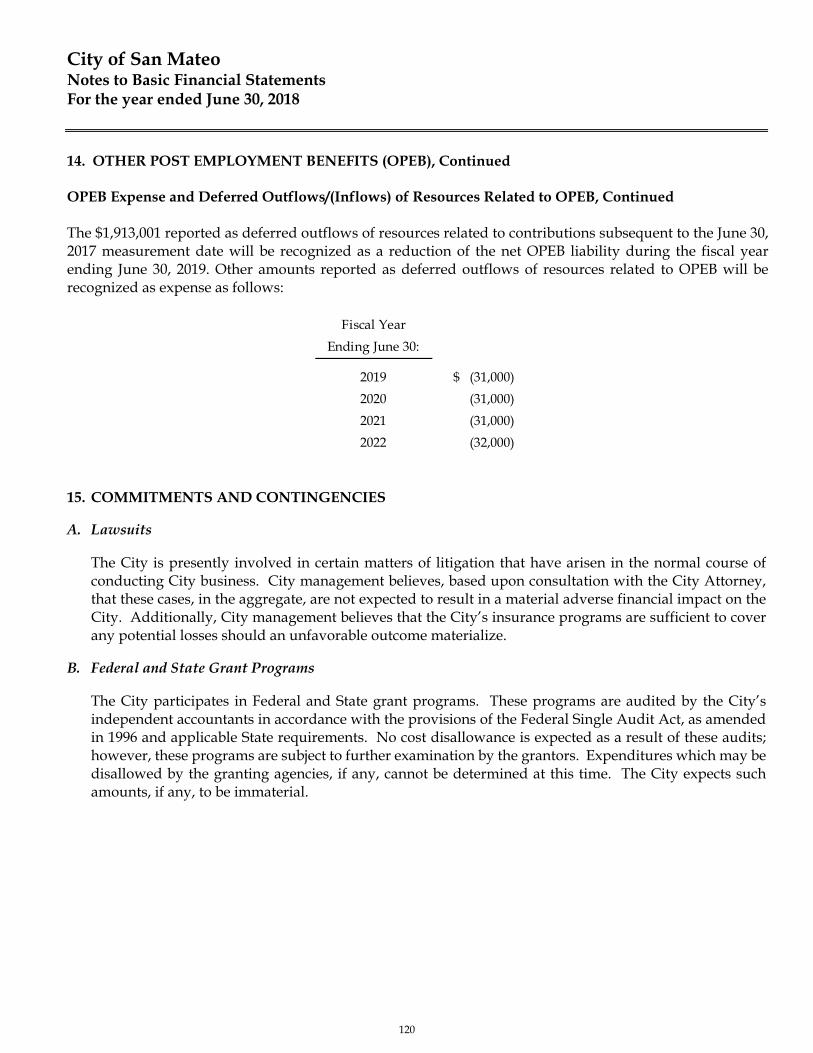
City of San Mateo Notes to Basic Financial Statements For the year ended June 30, 2018
14. OTHER POST EMPLOYMENT BENEFITS (OPEB), Continued
OPEB Expense and Deferred Outflows/(Inflows) of Resources Related to OPEB, Continued The $1,913,001 reported as deferred outflows of resources related to contributions subsequent to the June 30, 2017 measurement date will be recognized as a reduction of the net OPEB liability during the fiscal year ending June 30, 2019. Other amounts reported as deferred outflows of resources related to OPEB will be recognized as expense as follows:
Fiscal Year
Ending June 30:
2019 $ (31,000)
2020 (31,000)
2021 (31,000)
2022 (32,000) 15. COMMITMENTS AND CONTINGENCIES A. Lawsuits
The City is presently involved in certain matters of litigation that have arisen in the normal course of conducting City business. City management believes, based upon consultation with the City Attorney, that these cases, in the aggregate, are not expected to result in a material adverse financial impact on the City. Additionally, City management believes that the City’s insurance programs are sufficient to cover any potential losses should an unfavorable outcome materialize.
B. Federal and State Grant Programs
The City participates in Federal and State grant programs. These programs are audited by the City’s independent accountants in accordance with the provisions of the Federal Single Audit Act, as amended in 1996 and applicable State requirements. No cost disallowance is expected as a result of these audits; however, these programs are subject to further examination by the grantors. Expenditures which may be disallowed by the granting agencies, if any, cannot be determined at this time. The City expects such amounts, if any, to be immaterial.
120
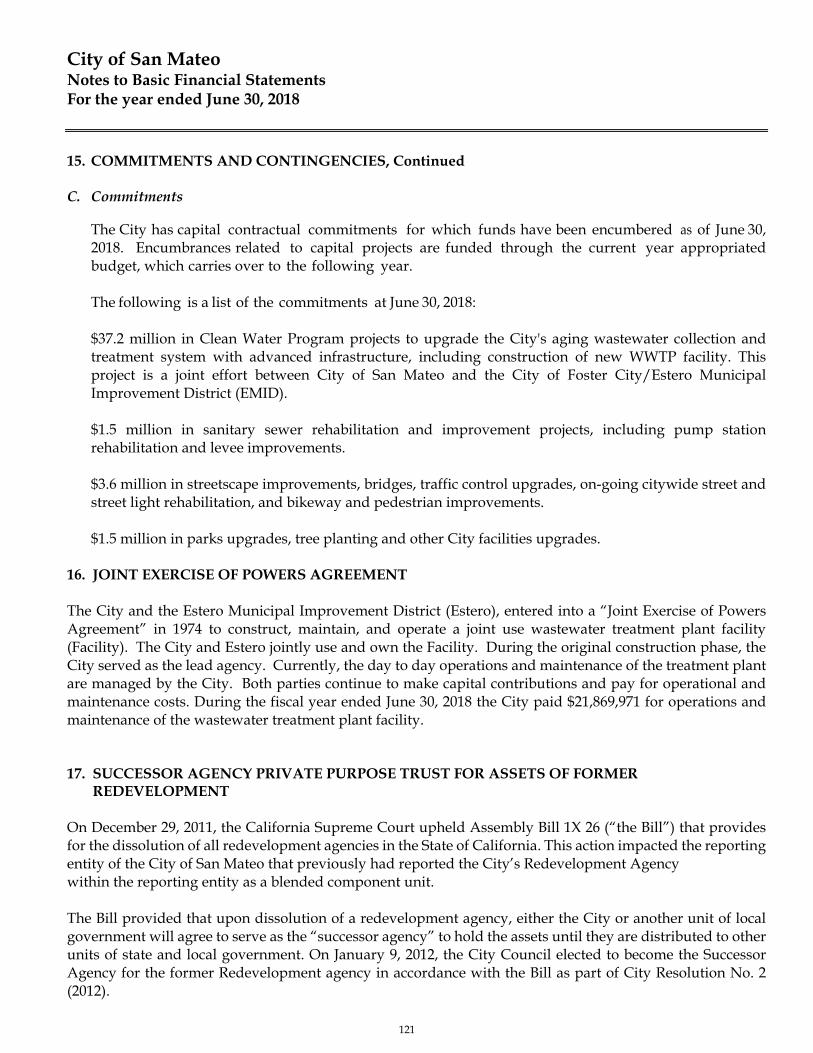
City of San Mateo Notes to Basic Financial Statements For the year ended June 30, 2018
15. COMMITMENTS AND CONTINGENCIES, Continued
C. Commitments
The City has capital contractual commitments for which funds have been encumbered as of June 30, 2018. Encumbrances related to capital projects are funded through the current year appropriated budget, which carries over to the following year. The following is a list of the commitments at June 30, 2018:
$37.2 million in Clean Water Program projects to upgrade the City's aging wastewater collection and treatment system with advanced infrastructure, including construction of new WWTP facility. This project is a joint effort between City of San Mateo and the City of Foster City/Estero Municipal Improvement District (EMID).
$1.5 million in sanitary sewer rehabilitation and improvement projects, including pump station rehabilitation and levee improvements.
$3.6 million in streetscape improvements, bridges, traffic control upgrades, on-going citywide street and street light rehabilitation, and bikeway and pedestrian improvements.
$1.5 million in parks upgrades, tree planting and other City facilities upgrades.
16. JOINT EXERCISE OF POWERS AGREEMENT The City and the Estero Municipal Improvement District (Estero), entered into a “Joint Exercise of Powers Agreement” in 1974 to construct, maintain, and operate a joint use wastewater treatment plant facility (Facility). The City and Estero jointly use and own the Facility. During the original construction phase, the City served as the lead agency. Currently, the day to day operations and maintenance of the treatment plant are managed by the City. Both parties continue to make capital contributions and pay for operational and maintenance costs. During the fiscal year ended June 30, 2018 the City paid $21,869,971 for operations and maintenance of the wastewater treatment plant facility. 17. SUCCESSOR AGENCY PRIVATE PURPOSE TRUST FOR ASSETS OF FORMER REDEVELOPMENT On December 29, 2011, the California Supreme Court upheld Assembly Bill 1X 26 (“the Bill”) that provides for the dissolution of all redevelopment agencies in the State of California. This action impacted the reporting entity of the City of San Mateo that previously had reported the City’s Redevelopment Agency within the reporting entity as a blended component unit. The Bill provided that upon dissolution of a redevelopment agency, either the City or another unit of local government will agree to serve as the “successor agency” to hold the assets until they are distributed to other units of state and local government. On January 9, 2012, the City Council elected to become the Successor Agency for the former Redevelopment agency in accordance with the Bill as part of City Resolution No. 2 (2012).
121
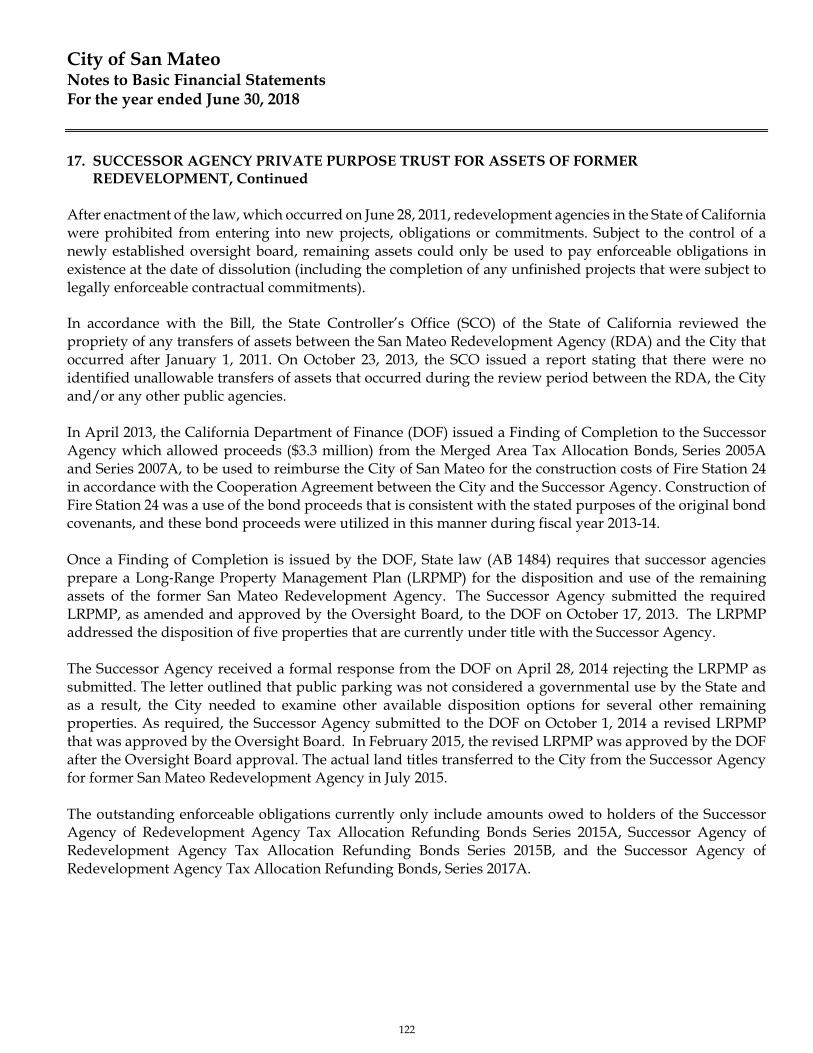
City of San Mateo Notes to Basic Financial Statements For the year ended June 30, 2018
17. SUCCESSOR AGENCY PRIVATE PURPOSE TRUST FOR ASSETS OF FORMER REDEVELOPMENT, Continued After enactment of the law, which occurred on June 28, 2011, redevelopment agencies in the State of California were prohibited from entering into new projects, obligations or commitments. Subject to the control of a newly established oversight board, remaining assets could only be used to pay enforceable obligations in existence at the date of dissolution (including the completion of any unfinished projects that were subject to legally enforceable contractual commitments). In accordance with the Bill, the State Controller’s Office (SCO) of the State of California reviewed the propriety of any transfers of assets between the San Mateo Redevelopment Agency (RDA) and the City that occurred after January 1, 2011. On October 23, 2013, the SCO issued a report stating that there were no identified unallowable transfers of assets that occurred during the review period between the RDA, the City and/or any other public agencies. In April 2013, the California Department of Finance (DOF) issued a Finding of Completion to the Successor Agency which allowed proceeds ($3.3 million) from the Merged Area Tax Allocation Bonds, Series 2005A and Series 2007A, to be used to reimburse the City of San Mateo for the construction costs of Fire Station 24 in accordance with the Cooperation Agreement between the City and the Successor Agency. Construction of Fire Station 24 was a use of the bond proceeds that is consistent with the stated purposes of the original bond covenants, and these bond proceeds were utilized in this manner during fiscal year 2013-14. Once a Finding of Completion is issued by the DOF, State law (AB 1484) requires that successor agencies prepare a Long‐Range Property Management Plan (LRPMP) for the disposition and use of the remaining assets of the former San Mateo Redevelopment Agency. The Successor Agency submitted the required LRPMP, as amended and approved by the Oversight Board, to the DOF on October 17, 2013. The LRPMP addressed the disposition of five properties that are currently under title with the Successor Agency. The Successor Agency received a formal response from the DOF on April 28, 2014 rejecting the LRPMP as submitted. The letter outlined that public parking was not considered a governmental use by the State and as a result, the City needed to examine other available disposition options for several other remaining properties. As required, the Successor Agency submitted to the DOF on October 1, 2014 a revised LRPMP that was approved by the Oversight Board. In February 2015, the revised LRPMP was approved by the DOF after the Oversight Board approval. The actual land titles transferred to the City from the Successor Agency for former San Mateo Redevelopment Agency in July 2015. The outstanding enforceable obligations currently only include amounts owed to holders of the Successor Agency of Redevelopment Agency Tax Allocation Refunding Bonds Series 2015A, Successor Agency of Redevelopment Agency Tax Allocation Refunding Bonds Series 2015B, and the Successor Agency of Redevelopment Agency Tax Allocation Refunding Bonds, Series 2017A.
122

City of San Mateo Notes to Basic Financial Statements For the year ended June 30, 2018
17. SUCCESSOR AGENCY PRIVATE PURPOSE TRUST FOR ASSETS OF FORMER REDEVELOPMENT, Continued Late in the 2016-17 fiscal year, the Successor Agency began the due diligence process to refund the 2007 Tax Allocation Bonds, which were eligible to be refunded as of August 1, 2017. The Agency approved the refunding and an amendment to the Last and Final ROPS on June 5, 2017, and the Oversight Board made the same approvals on June 7, 2017. The resolutions of approval were submitted to the Department of Finance in June 2018, with approval for the Oversight Board Resolutions coming on August 21, 2017. Department of Finance approved the amendment to the Last and Final ROPS, and its confirmation that this entire transaction would be considered the first of two allowed amendments to the Last and Final ROPS in a letter dated December 13, 2017. 18. PRIOR PERIOD ADJUSTMENT
The City recorded a prior period adjustment to eliminate the previously reported net OPEB obligation, and to recognize deferred outflows of resources and net OPEB liability as of June 30, 2017.
Net Position, as Deferred Net Position, asPreviously Reported Employer OPEB Net OPEB Net OPEB Restated at
at June 30, 2017 Contributions Obligation Liability June 30, 2017
Government-Wide Statements
Governmental Activities 387,652,316$ 1,589,572$ 2,780,046$ (13,744,816)$ 378,277,118$
Business-type Activities 123,289,534$ 262,428$ 181,883$ (2,269,184)$ 121,464,661$
Fund Statements
Sewer Enterprise 124,611,884$ 239,464$ 164,213$ (2,070,610)$ 122,944,951$
Golf Enterprise (1,332,350)$ 22,964$ 17,670$ (198,574)$ (1,490,290)$
Prior Period Adjustments
19. SUBSEQUENT EVENTS Formation of San Mateo Consolidated Fire Department: The cities of San Mateo, Foster City, and Belmont have been operating for a number of years under shared services agreements that allow for the sharing of fire operations resources amongst the three cities. This arrangement has created operational efficiencies and has provided for better service levels for residents and businesses in the three cities; however, this arrangement has been administratively burdensome. To remedy this, the three cities are in the process of forming a Joint Powers Authority that will create the San Mateo Consolidated Fire Department, which is expected to commence operations in January 2019.
123
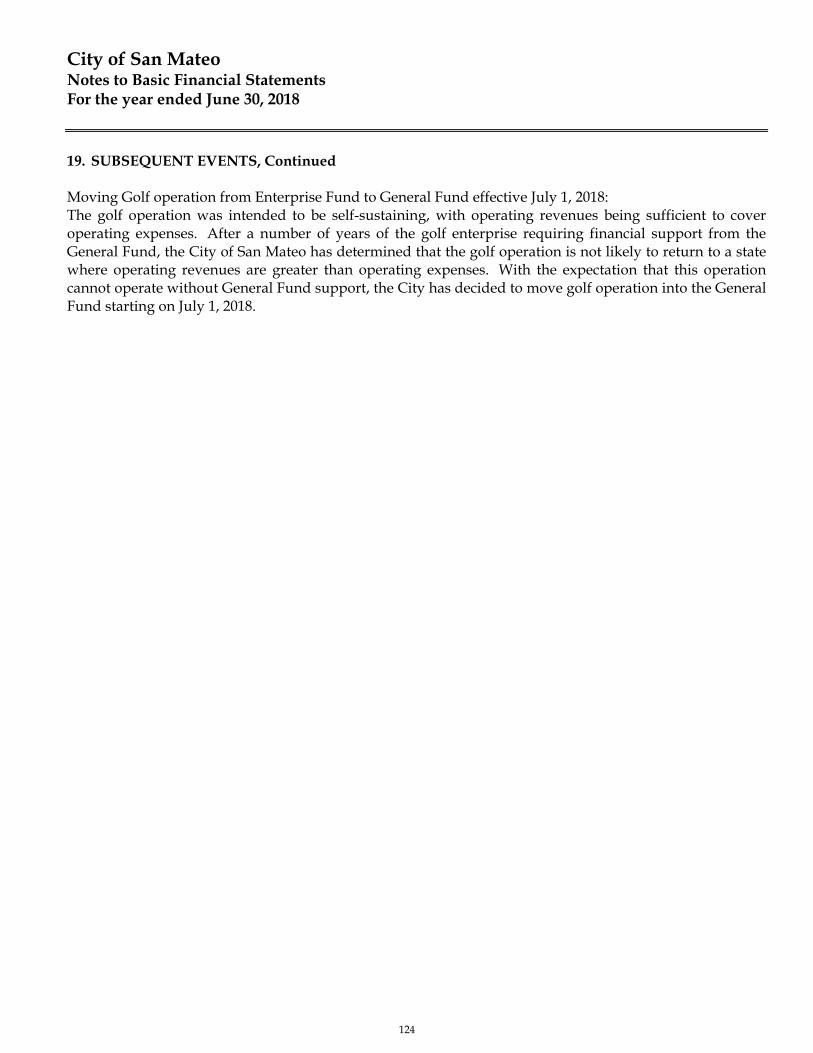
City of San Mateo Notes to Basic Financial Statements For the year ended June 30, 2018
19. SUBSEQUENT EVENTS, Continued Moving Golf operation from Enterprise Fund to General Fund effective July 1, 2018: The golf operation was intended to be self-sustaining, with operating revenues being sufficient to cover operating expenses. After a number of years of the golf enterprise requiring financial support from the General Fund, the City of San Mateo has determined that the golf operation is not likely to return to a state where operating revenues are greater than operating expenses. With the expectation that this operation cannot operate without General Fund support, the City has decided to move golf operation into the General Fund starting on July 1, 2018.
124
REQUIRED SUPPLEMENTARY INFORMATION
125
City of San Mateo Required Supplementary Information For the year ended June 30, 2018
1. BUDGETS AND BUDGETARY ACCOUNTING
A. Budgetary Control and Budgetary Accounting The City uses a two-year financial plan for operations that is called the Business Plan. The Long-Term Capital Improvement Plan, which corresponds with the General Plan, is adopted on an incremental basis to coincide with the Business Plan. Budgets are adopted annually for the General Fund, Special Revenue Funds, and Debt Service Funds. Capital Projects are budgeted on a project length basis. The Business Plan and the Long-Term Capital Improvement Plan are adopted by City Council and can be amended only by City Council. An annual operating budget is adopted by City Council on or before June 30, and comprises the departmental operating budget and the capital improvement budget. The departmental operating budget may be reallocated among programs within a department, but expenditures may not exceed budgeted appropriations at the department level each year without Council acknowledgment and approval. Capital improvement expenditures may not exceed budgeted amounts without Council approval. The original budget includes amounts automatically carried over from the prior years’ budget such as encumbrances.
B. Encumbrances and Budgetary Financial Statements The City’s budgets, and the accompanying budgetary financial statements, are prepared using encumbrance accounting. Encumbrance accounting requires that purchase orders, contracts and other commitments for the expenditure of monies be recorded as expenditures in order to reserve that portion of the applicable appropriation. Encumbrance accounting is employed as an extension of formal budgetary integration in all budgeted funds. Encumbrances outstanding at year-end are reported as expenditures in the budgetary financial statements. Unencumbered operating appropriations lapse at year-end, while capital improvement appropriations are carried over to subsequent years until projects are completed.
C. Adjustments to GAAP Basis from Budgetary Basis City budgets are adopted on a basis consistent with GAAP except for encumbrances and loan repayments. Encumbrances are considered budgetary expenditures in the year of the commitment of purchase, and capital projects expenditures are budgeted on a project length basis, as discussed above. Loan repayments are considered budgetary revenue in the year of the receipts. The effects of these differences are shown as adjustments in the budgetary financial statements.
126

City of San Mateo Required Supplementary Information, Continued For the year ended June 30, 2018
1. BUDGETS AND BUDGETARY ACCOUNTING, Continued
D. Budgetary Comparison Schedules
The following are the budget comparison schedules for all major Governmental Funds.
Budgetary Comparison Schedule (Budgetary Basis), General Fund
Variance withActua l Fina l Budge t
Origina l Fina l Amo unts P o s itive (Nega tive)
R EVEN UES :
P ro perty taxes 52,697,054$ 52,697,054$ 55,643,949$ 2,946,895$ Sa les taxes 24,832,031 24,832,031 23,873,042 (958,989) Other taxes 24,968,430 24,968,430 28,359,383 3,390,953 Licens es , building and o ther pe rmits 121,911 121,911 163,988 42,077 F ines , fo rfe itures and pena ltie s 1,546,395 1,546,395 1,648,282 101,887 Intergo vernmenta l 1,991,212 2,869,966 3,011,965 141,999 Charges fo r s ervices 7,450,385 7,450,385 7,735,996 285,608 Inves tment inco me 809,719 809,719 447,504 (362,215) P a rking mete r and leas e revenue - - 4,279 4,279 Other revenues 2,286,914 2,434,956 3,194,990 760,034
To ta l re v e nue s 116,704,051 117,730,847 124,083,378 6,352,528
EXP EN D ITUR ES :
Current:Genera l go vernment:
City Co unc il 298,521 396,737 386,419 10,318 City Manager 2,276,444 2,373,444 1,866,507 506,937 City Clerk 849,053 1,049,053 1,032,765 16,288 City Atto rney 1,498,694 1,525,732 1,296,006 229,726 F inance 3,276,485 3,411,534 3,052,767 358,767 Info rmatio n techno lo gy 3,690,785 3,874,916 3,710,600 164,316 Human res o urces 1,691,229 1,761,229 1,619,054 142,175
Co mmunity deve lo pment 2,537,878 2,537,878 2,530,572 7,306 P ublic s a fe ty:
P o lice 39,247,715 39,435,133 39,463,123 (27,990) F ire 23,264,368 24,915,479 24,992,485 (77,006)
P ublic wo rks 6,532,783 6,838,022 7,059,126 (221,104) P a rks and rec rea tio n 14,688,139 14,964,818 14,965,251 (433) Libra ry 6,674,051 6,860,853 6,808,258 52,595 No n-departmenta l 3,000,000 3,000,000 3,001,379 (1,379)
Capita l o utlay 46,635 98,392 164,252 (65,860) Debt s e rvice :
P rincipa l - - 87,077 (87,074)
To ta l e xpe nditure s 109,572,780 113,043,220 112,035,641 1,007,582
R EVEN UES OVER (UN D ER ) EXP EN D ITUR ES 7,131,271 4,687,627 12,047,737 7,360,110
OTHER F IN A N C IN G S OUR C ES (US ES ):
Trans fe rs in 1,517,500 1,517,500 1,517,500 - Trans fe rs o ut (8,285,000) (8,534,000) (6,123,412) 2,410,588
To ta l o the r f ina nc ing s o urc e s (us e s ) (6,767,500) (7,016,500) (4,605,912) 2,410,588
N e t c ha ng e in fund ba la nc e 363,771$ (2,328,873)$ 7,441,825 9,770,698$
F UN D B A LA N C E:
Beginning o f year 67,105,512
End o f year, budge ta ry bas is 74,547,337
Adjus tments to GAAP bas is : Encumbrance adjus tments 956,893
End o f year 75,504,230$
Budge ted Amo unts
127

City of San Mateo Required Supplementary Information, Continued For the year ended June 30, 2018
1. BUDGETS AND BUDGETARY ACCOUNTING, Continued D. Budgetary Comparison Schedules, Continued
Budgetary Comparison Schedule (Budgetary Basis), Construction Services Special Revenue Fund
Variance with
Final Budget
Actual Positive
Original Final Amounts (Negative)
REVENUES:
Licenses, building and other permits 5,825,932$ 5,825,932$ 11,216,578$ 5,390,646$
Charges for services 696,000 696,000 959,029 263,029
Investment income 67,626 67,626 295,334 227,708
Total revenues 6,589,558 6,589,558 12,470,941 5,881,383
EXPENDITURES:
Current:
Community development 6,368,910 6,749,874 5,721,620 1,028,254
Public works 219,743 219,743 296,815 (77,072)
Total expenditures 6,588,653 6,969,617 6,018,435 951,182
REVENUES OVER (UNDER) EXPENDITURES 905 (380,059) 6,452,506 6,832,565
OTHER FINANCING SOURCES (USES):
Transfers out - (35,643) - 35,643
Total other financing sources (uses) - (35,643) - 35,643
Net change in fund balance 905$ (415,702)$ 6,452,506 6,868,208$
FUND BALANCE:
Beginning of year 31,369,586
End of year, budgetary basis 37,822,092
Adjustments to GAAP basis:
Encumbrance adjustments 65,457
End of year 37,887,549$
Budgeted Amounts
128

City of San Mateo Required Supplementary Information, Continued For the year ended June 30, 2018
2. DEFINED BENEFIT PENSION PLANS
A. Schedule of Changes in Net Pension Liability and Related Ratios During the Measurement Period
Miscellaneous Plan
2016-17 2015-16 2014-15 2013-14
TOTAL PENSION LIABILITY
Service Cost 4,518,151$ 3,993,514$ 3,892,876$ 3,828,331$
Interest 17,389,674 17,090,620 16,438,129 15,777,588
Changes of Benefit Terms - - - -
Difference Between Expected and
Actual Experience (3,106,399) (331,929) (627,100) -
Changes of Assumptions 13,781,463 - (3,817,336) -
Benefit Payments, Including Refunds of
Employee Contributions (12,461,817) (11,970,354) (11,069,836) (10,298,370)
Net Change in Total Pension Liability 20,121,072 8,781,851 4,816,733 9,307,549
Total Pension Liability - Beginning 236,508,996 227,727,145 222,910,412 213,602,863
Total Pension Liability - Ending (a) 256,630,068$ 236,508,996$ 227,727,145$ 222,910,412$
PLAN FIDUCIARY NET POSITION
Contributions - Employer 5,873,612$ 5,126,750$ 4,501,438$ 3,783,964$
Contributions - Employee 2,041,614 1,928,776 1,950,191 1,924,145
Net Investment Income (2) 18,815,053 868,395 3,955,299 26,395,339
Benefit Payments, Including Refunds
of Employee Contributions (12,461,817) (11,970,354) (11,069,836) (10,298,370)
Other Changes in Fiduciary Net Position (251,079) (106,172) (198,614) -
Net Change in Fiduciary Net Position 14,017,383 (4,152,605) (861,522) 21,805,078
Plan Fiduciary Net Position - Beginning 170,058,200 174,210,805 175,072,327 153,267,249
Plan Fiduciary Net Position - Ending (b) 184,075,583$ 170,058,200$ 174,210,805$ 175,072,327$
Plan Net Position Liability (Asset)
- Ending (a) - (b) 72,554,485$ 66,450,796$ 53,516,340$ 47,838,085$
Plan Fiduciary Net Position as a Percentage
of the Total Pension Liability 71.73% 71.90% 76.50% 78.54%
Covered Payroll 31,556,856$ 28,252,538$ 26,888,005$ 25,179,750$
Plan Net Pension Liability/(Asset) as a
a Percentage of Covered Payroll 229.92% 235.20% 199.03% 189.99%
Measurement Period (1)
(1) Historical information is required only for measurement periods for which GASB 68 is applicable. (2) Net of administrative expenses.
129
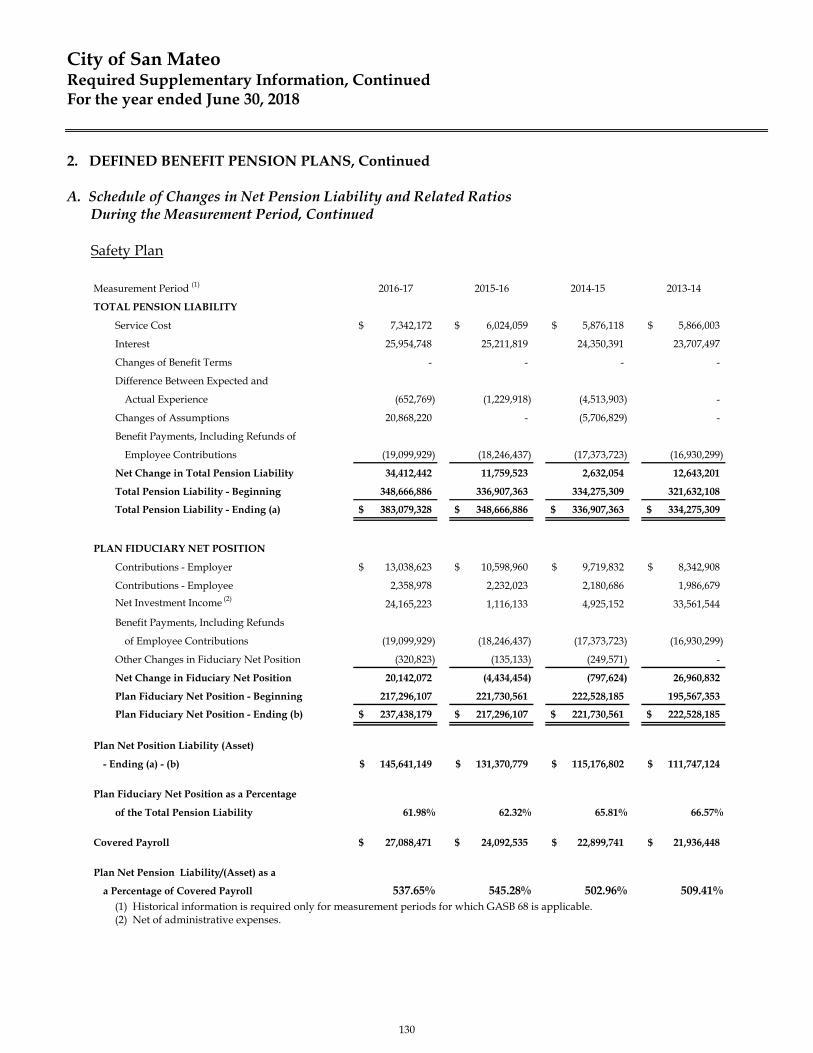
City of San Mateo Required Supplementary Information, Continued For the year ended June 30, 2018
2. DEFINED BENEFIT PENSION PLANS, Continued
A. Schedule of Changes in Net Pension Liability and Related Ratios During the Measurement Period, Continued
Safety Plan
2016-17 2015-16 2014-15 2013-14
TOTAL PENSION LIABILITY
Service Cost 7,342,172$ 6,024,059$ 5,876,118$ 5,866,003$
Interest 25,954,748 25,211,819 24,350,391 23,707,497
Changes of Benefit Terms - - - -
Difference Between Expected and
Actual Experience (652,769) (1,229,918) (4,513,903) -
Changes of Assumptions 20,868,220 - (5,706,829) -
Benefit Payments, Including Refunds of
Employee Contributions (19,099,929) (18,246,437) (17,373,723) (16,930,299)
Net Change in Total Pension Liability 34,412,442 11,759,523 2,632,054 12,643,201
Total Pension Liability - Beginning 348,666,886 336,907,363 334,275,309 321,632,108
Total Pension Liability - Ending (a) 383,079,328$ 348,666,886$ 336,907,363$ 334,275,309$
PLAN FIDUCIARY NET POSITION
Contributions - Employer 13,038,623$ 10,598,960$ 9,719,832$ 8,342,908$
Contributions - Employee 2,358,978 2,232,023 2,180,686 1,986,679
Net Investment Income (2)24,165,223 1,116,133 4,925,152 33,561,544
Benefit Payments, Including Refunds
of Employee Contributions (19,099,929) (18,246,437) (17,373,723) (16,930,299)
Other Changes in Fiduciary Net Position (320,823) (135,133) (249,571) -
Net Change in Fiduciary Net Position 20,142,072 (4,434,454) (797,624) 26,960,832
Plan Fiduciary Net Position - Beginning 217,296,107 221,730,561 222,528,185 195,567,353
Plan Fiduciary Net Position - Ending (b) 237,438,179$ 217,296,107$ 221,730,561$ 222,528,185$
Plan Net Position Liability (Asset)
- Ending (a) - (b) 145,641,149$ 131,370,779$ 115,176,802$ 111,747,124$
Plan Fiduciary Net Position as a Percentage
of the Total Pension Liability 61.98% 62.32% 65.81% 66.57%
Covered Payroll 27,088,471$ 24,092,535$ 22,899,741$ 21,936,448$
Plan Net Pension Liability/(Asset) as a
a Percentage of Covered Payroll 537.65% 545.28% 502.96% 509.41%
Measurement Period (1)
(1) Historical information is required only for measurement periods for which GASB 68 is applicable. (2) Net of administrative expenses.
130
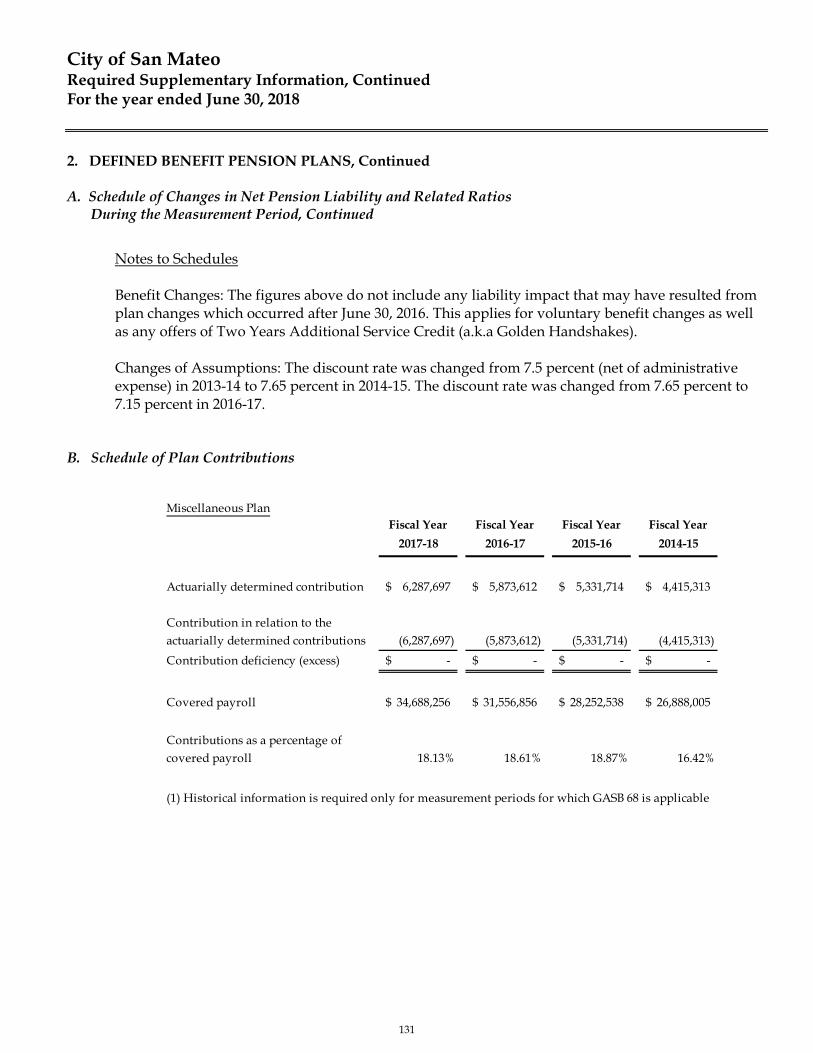
City of San Mateo Required Supplementary Information, Continued For the year ended June 30, 2018
2. DEFINED BENEFIT PENSION PLANS, Continued
A. Schedule of Changes in Net Pension Liability and Related Ratios During the Measurement Period, Continued
Notes to Schedules Benefit Changes: The figures above do not include any liability impact that may have resulted from plan changes which occurred after June 30, 2016. This applies for voluntary benefit changes as well as any offers of Two Years Additional Service Credit (a.k.a Golden Handshakes). Changes of Assumptions: The discount rate was changed from 7.5 percent (net of administrative expense) in 2013-14 to 7.65 percent in 2014-15. The discount rate was changed from 7.65 percent to 7.15 percent in 2016-17.
B. Schedule of Plan Contributions
Miscellaneous PlanFiscal Year
2017-18
Fiscal Year
2016-17
Fiscal Year
2015-16
Fiscal Year
2014-15
Actuarially determined contribution 6,287,697$ 5,873,612$ 5,331,714$ 4,415,313$
Contribution in relation to the actuarially determined contributions (6,287,697) (5,873,612) (5,331,714) (4,415,313)
Contribution deficiency (excess) -$ -$ -$ -$
Covered payroll 34,688,256$ 31,556,856$ 28,252,538$ 26,888,005$
Contributions as a percentage of covered payroll 18.13% 18.61% 18.87% 16.42%
(1) Historical information is required only for measurement periods for which GASB 68 is applicable
131
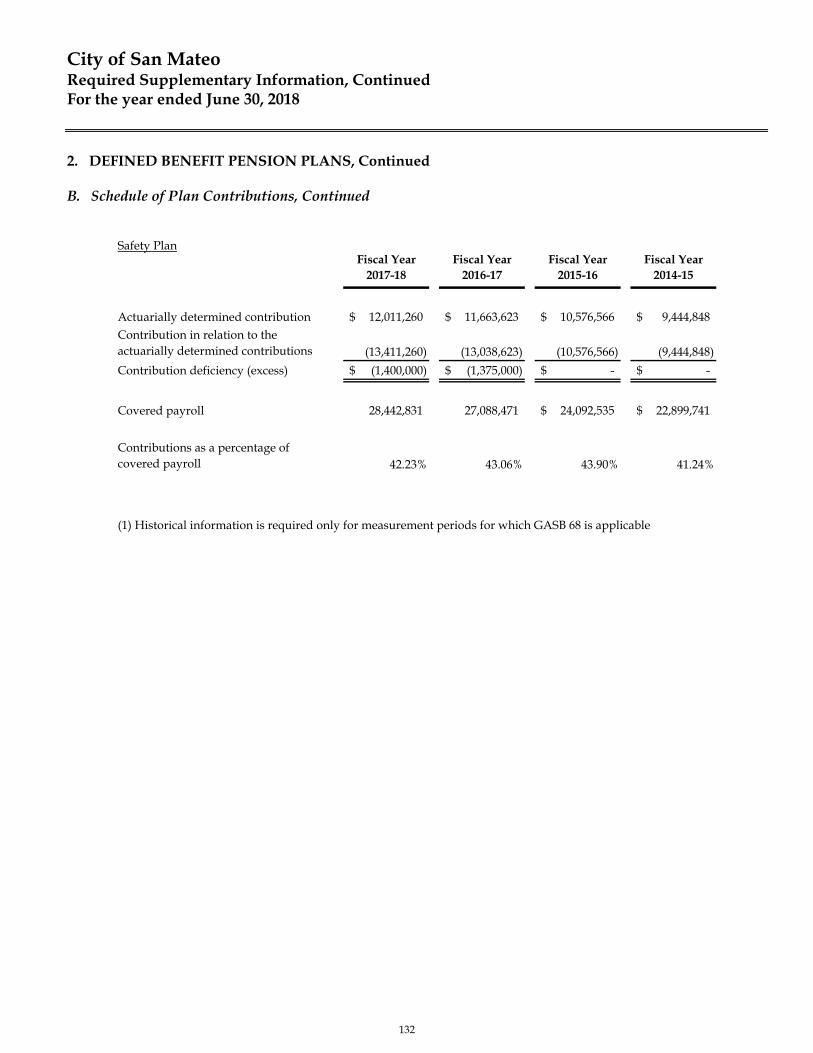
City of San Mateo Required Supplementary Information, Continued For the year ended June 30, 2018
2. DEFINED BENEFIT PENSION PLANS, Continued B. Schedule of Plan Contributions, Continued
Safety PlanFiscal Year
2017-18Fiscal Year
2016-17Fiscal Year
2015-16Fiscal Year
2014-15
Actuarially determined contribution 12,011,260$ 11,663,623$ 10,576,566$ 9,444,848$ Contribution in relation to the actuarially determined contributions (13,411,260) (13,038,623) (10,576,566) (9,444,848)
Contribution deficiency (excess) (1,400,000)$ (1,375,000)$ -$ -$
Covered payroll 28,442,831 27,088,471 24,092,535$ 22,899,741$
Contributions as a percentage of covered payroll 42.23% 43.06% 43.90% 41.24%
(1) Historical information is required only for measurement periods for which GASB 68 is applicable
132
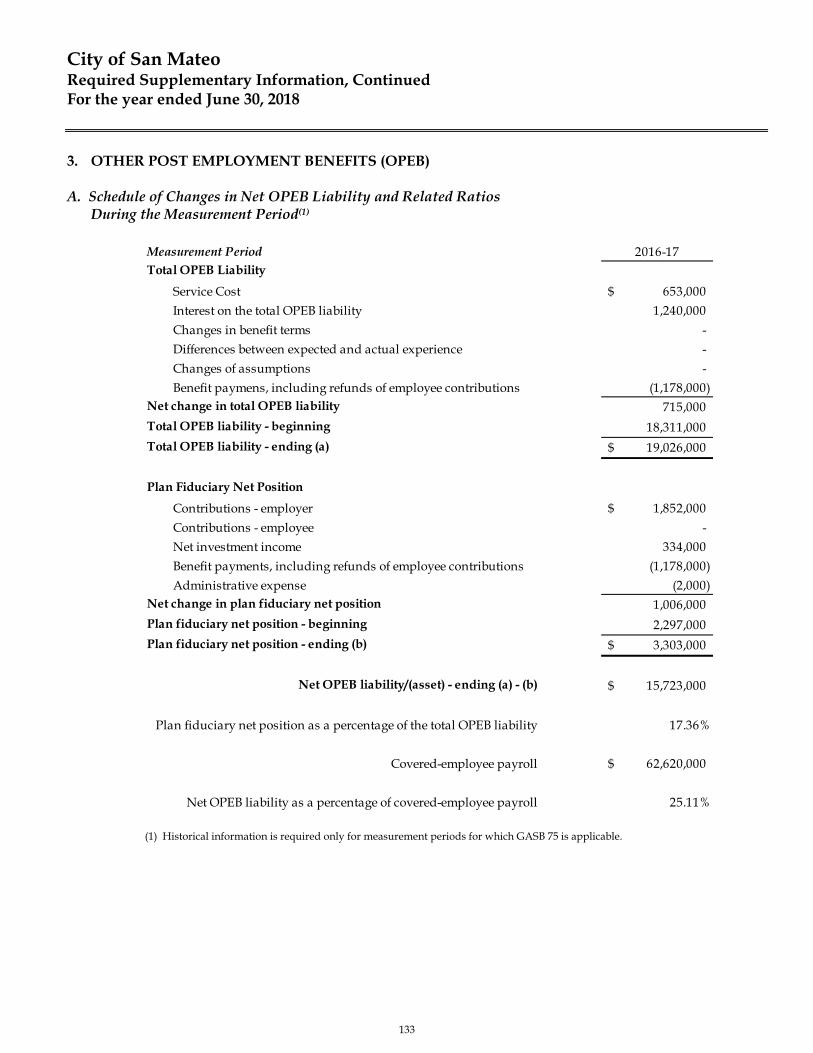
City of San Mateo Required Supplementary Information, Continued For the year ended June 30, 2018
3. OTHER POST EMPLOYMENT BENEFITS (OPEB)
A. Schedule of Changes in Net OPEB Liability and Related Ratios During the Measurement Period(1)
(1) Historical information is required only for measurement periods for which GASB 75 is applicable.
Measurement Period 2016-17Total OPEB Liability
Service Cost 653,000$
Interest on the total OPEB liability 1,240,000
Changes in benefit terms -
Differences between expected and actual experience -
Changes of assumptions -
Benefit paymens, including refunds of employee contributions (1,178,000) Net change in total OPEB liability 715,000
Total OPEB liability - beginning 18,311,000
Total OPEB liability - ending (a) 19,026,000$
Plan Fiduciary Net Position
Contributions - employer 1,852,000$
Contributions - employee -
Net investment income 334,000
Benefit payments, including refunds of employee contributions (1,178,000)
Administrative expense (2,000) Net change in plan fiduciary net position 1,006,000
Plan fiduciary net position - beginning 2,297,000
Plan fiduciary net position - ending (b) 3,303,000$
Net OPEB liability/(asset) - ending (a) - (b) 15,723,000$
Plan fiduciary net position as a percentage of the total OPEB liability 17.36%
Covered-employee payroll 62,620,000$
Net OPEB liability as a percentage of covered-employee payroll 25.11%
133

City of San Mateo Required Supplementary Information, Continued For the year ended June 30, 2018
3. OTHER POST EMPLOYMENT BENEFITS (OPEB), Continued B. Schedule of Plan Contributions(1)
Fiscal Year Ended June 30 2018
Actuarially Determined Contribution (ADC) 1,913,000$
Contributions in relation to the ADC (1,913,000)
Contribution deficiency (excess) -$
Covered-employee payroll 66,373,000$
Contributions as a percentage of covered-employee payroll 2.88%
(1) Historical information is required only for measurement periods for which GASB 75 is applicable.
134

SUPPLEMENTARY INFORMATION
135

136

Police Grants Fund accounts for the revenues and expenditures of State and Federal grants such as State SLESF(Supplemental Law Enforcement Services Fund).
Community Development Block Grant Fund (CDBG) accounts for revenue and expenditures of CDBG funds awarded by theDepartment of Housing and Urban Development.
HOME Special Revenue Fund accounts for revenue and expenditures of the Federal HOME grant program.
City Housing Special Revenue Fund accounts for revenues from a former Federal Rental Rehabilitation program and loanpayments from the First-Time Homebuyer program.
Low and Moderate Income Housing Special Revenue Fund accounts for revenues and expenditures of the formerRedevelopment Agency Special Revenue Fund.
Fire Protection Fund accounts for the fees charged and expenditure for activities relating to fire inspections and permits.
Gas Tax Fund accounts for gasoline tax revenues as required by State law.
Advance Planning Fund accounts for fees collected through building permits and expenditures for activities relating to longterm planning, including the general plan update.
Parking Fund accounts for parking meter revenues and expenditures of the City's downtown parking facilities.
Solid Waste Fund accounts for garbage collection surcharge revenues. The use of funds is restricted by City ordinance tostreet cleaning and waste disposal.
Parks and Recreation accounts for the Parks and Recreation Tax, as well as the Parks and Recreation Impact and In LieuFees to fund Parks and Recreation related projects through a transfer to the Capital Improvement Projects Fund.
Traffic Impact Fee accounts for traffic impact fee revenues to mitigate the cumulative impacts of new development and toaccommodate future development.
Commercial Linkage Fee accounts for commercial linkage fee to be used for housing programs including acquisition,rehabilitation, or new construction of housing.
Landfill Bonds Fund accounts for debt service payments on landfill revenue bonds (to finance expenditures related to finalclosure of the former landfill site and construction of related park improvements) and post-closure monitoring costs.
General Obligation Bonds Fund accounts for voter-approved property tax revenues and debt service payments on generalobligation bonds.
2% Hotel Tax Fund accounts for the voter-approved 2% hotel tax revenue Measure C, the related transfers to the capitalimprovement fund, and debt service on variable rate bonds.
NON-MAJOR GOVERNMENTAL FUNDS
SPECIAL REVENUE FUNDS
DEBT SERVICE FUNDS
CAPITAL PROJECT FUND
137

City of San MateoCombining Balance Sheet
Non-Major Governmental Funds
June 30, 2018
Community Low Moderate
Police Development City Income Fire
Grants Block Grant HOME Housing Housing Protection Gas Tax
ASSETS
Cash and investments 31,754$ -$ 199,425$ 615,320$ 4,514,039$ 3,241,035$ 1,558,481$
Restricted cash and investments
held by fiscal agents - - - - - - -
Accounts receivable, net - - - - - 534,715 219,210
Taxes receivable - - - - - - 171,913
Grants receivable 91,203 83,918 - - - - -
Loans and notes receivable, net - 603,385 355,226 106,245 1,904,023 - -
Total assets 122,957$ 687,303$ 554,651$ 721,565$ 6,418,062$ 3,775,750$ 1,949,604$
LIABILITIES
AND FUND BALANCES
Liabilities:
Accounts payable -$ 34,242$ -$ 15,000$ 3,411$ 36,697$ -$
Due to other funds - 6,694 - - - - -
Advances from other funds - - - - - - -
Deposits payable - - - - - - -
Total liabilities - 40,936 - 15,000 3,411 36,697 -
Deferred inflows of resources:
Unavailable revenue 91,203 167,553 51,065 51,560 277,954 - -
Total deferred inflows of resources 91,203 167,553 51,065 51,560 277,954 - -
Fund Balances:
Restricted 31,754 478,814 503,586 655,005 6,136,697 - 1,949,604
Committed - - - - - 3,739,053 -
Total fund balances 31,754 478,814 503,586 655,005 6,136,697 3,739,053 1,949,604
Total liabilities, deferred inflows
resources and fund balances 122,957$ 687,303$ 554,651$ 721,565$ 6,418,062$ 3,775,750$ 1,949,604$
Special Revenue
138
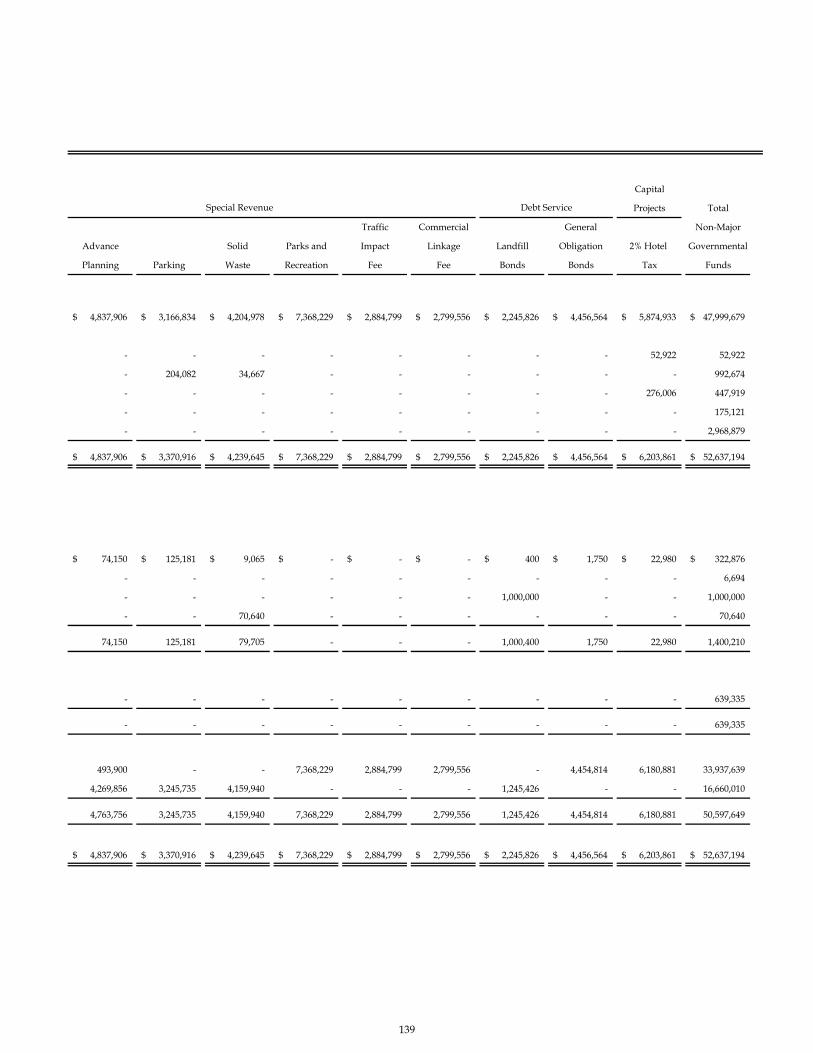
Capital
Projects Total
Traffic Commercial General Non-Major
Advance Solid Parks and Impact Linkage Landfill Obligation 2% Hotel Governmental
Planning Parking Waste Recreation Fee Fee Bonds Bonds Tax Funds
4,837,906$ 3,166,834$ 4,204,978$ 7,368,229$ 2,884,799$ 2,799,556$ 2,245,826$ 4,456,564$ 5,874,933$ 47,999,679$
- - - - - - - - 52,922 52,922
- 204,082 34,667 - - - - - - 992,674
- - - - - - - - 276,006 447,919
- - - - - - - - - 175,121
- - - - - - - - - 2,968,879
4,837,906$ 3,370,916$ 4,239,645$ 7,368,229$ 2,884,799$ 2,799,556$ 2,245,826$ 4,456,564$ 6,203,861$ 52,637,194$
74,150$ 125,181$ 9,065$ -$ -$ -$ 400$ 1,750$ 22,980$ 322,876$
- - - - - - - - - 6,694
- - - - - - 1,000,000 - - 1,000,000
- - 70,640 - - - - - - 70,640
74,150 125,181 79,705 - - - 1,000,400 1,750 22,980 1,400,210
- - - - - - - - - 639,335
- - - - - - - - - 639,335
493,900 - - 7,368,229 2,884,799 2,799,556 - 4,454,814 6,180,881 33,937,639
4,269,856 3,245,735 4,159,940 - - - 1,245,426 - - 16,660,010
4,763,756 3,245,735 4,159,940 7,368,229 2,884,799 2,799,556 1,245,426 4,454,814 6,180,881 50,597,649
4,837,906$ 3,370,916$ 4,239,645$ 7,368,229$ 2,884,799$ 2,799,556$ 2,245,826$ 4,456,564$ 6,203,861$ 52,637,194$
Debt ServiceSpecial Revenue
139
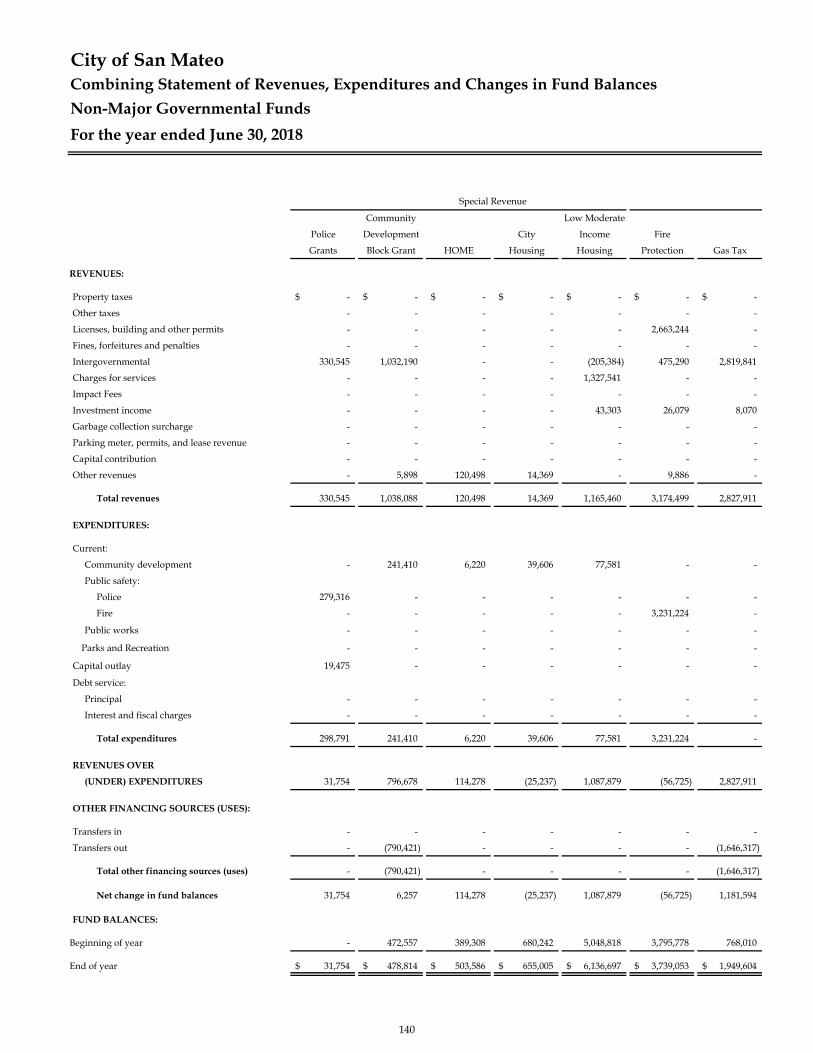
Community Low Moderate
Police Development City Income Fire
Grants Block Grant HOME Housing Housing Protection Gas Tax
REVENUES:
Property taxes -$ -$ -$ -$ -$ -$ -$
Other taxes - - - - - - -
Licenses, building and other permits - - - - - 2,663,244 -
Fines, forfeitures and penalties - - - - - - -
Intergovernmental 330,545 1,032,190 - - (205,384) 475,290 2,819,841
Charges for services - - - - 1,327,541 - -
Impact Fees - - - - - - -
Investment income - - - - 43,303 26,079 8,070
Garbage collection surcharge - - - - - - -
Parking meter, permits, and lease revenue - - - - - - -
Capital contribution - - - - - - -
Other revenues - 5,898 120,498 14,369 - 9,886 -
Total revenues 330,545 1,038,088 120,498 14,369 1,165,460 3,174,499 2,827,911
EXPENDITURES:
Current:
Community development - 241,410 6,220 39,606 77,581 - -
Public safety:
Police 279,316 - - - - - -
Fire - - - - - 3,231,224 -
Public works - - - - - - -
Parks and Recreation - - - - - - -
Capital outlay 19,475 - - - - - -
Debt service:
Principal - - - - - - -
Interest and fiscal charges - - - - - - -
Total expenditures 298,791 241,410 6,220 39,606 77,581 3,231,224 -
REVENUES OVER
(UNDER) EXPENDITURES 31,754 796,678 114,278 (25,237) 1,087,879 (56,725) 2,827,911
OTHER FINANCING SOURCES (USES):
Transfers in - - - - - - -
Transfers out - (790,421) - - - - (1,646,317)
Total other financing sources (uses) - (790,421) - - - - (1,646,317)
Net change in fund balances 31,754 6,257 114,278 (25,237) 1,087,879 (56,725) 1,181,594
FUND BALANCES:
Beginning of year - 472,557 389,308 680,242 5,048,818 3,795,778 768,010
End of year 31,754$ 478,814$ 503,586$ 655,005$ 6,136,697$ 3,739,053$ 1,949,604$
City of San MateoCombining Statement of Revenues, Expenditures and Changes in Fund Balances
Non-Major Governmental Funds
Special Revenue
For the year ended June 30, 2018
140
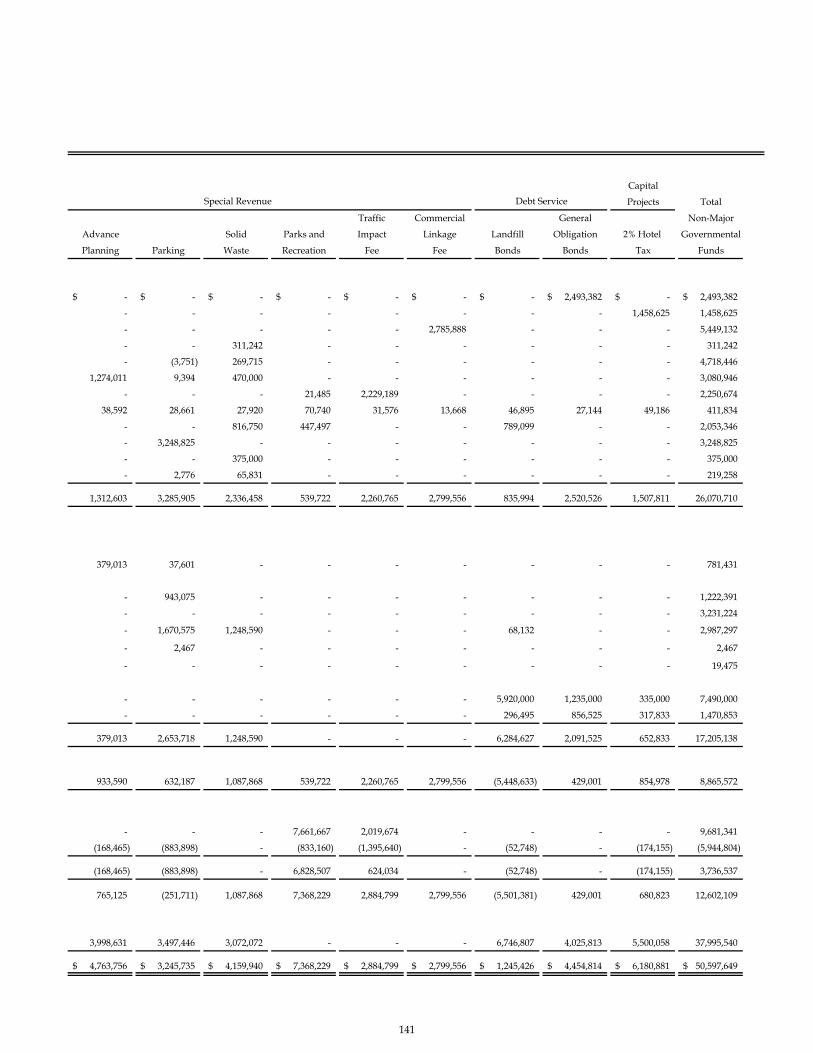
Capital
Projects Total
Traffic Commercial General Non-Major
Advance Solid Parks and Impact Linkage Landfill Obligation 2% Hotel Governmental
Planning Parking Waste Recreation Fee Fee Bonds Bonds Tax Funds
-$ -$ -$ -$ -$ -$ -$ 2,493,382$ -$ 2,493,382$
- - - - - - - - 1,458,625 1,458,625
- - - - - 2,785,888 - - - 5,449,132
- - 311,242 - - - - - - 311,242
- (3,751) 269,715 - - - - - - 4,718,446
1,274,011 9,394 470,000 - - - - - - 3,080,946
- - - 21,485 2,229,189 - - - - 2,250,674
38,592 28,661 27,920 70,740 31,576 13,668 46,895 27,144 49,186 411,834
- - 816,750 447,497 - - 789,099 - - 2,053,346
- 3,248,825 - - - - - - - 3,248,825
- - 375,000 - - - - - - 375,000
- 2,776 65,831 - - - - - - 219,258
1,312,603 3,285,905 2,336,458 539,722 2,260,765 2,799,556 835,994 2,520,526 1,507,811 26,070,710
379,013 37,601 - - - - - - - 781,431
- 943,075 - - - - - - - 1,222,391
- - - - - - - - - 3,231,224
- 1,670,575 1,248,590 - - - 68,132 - - 2,987,297
- 2,467 - - - - - - - 2,467
- - - - - - - - - 19,475
- - - - - - 5,920,000 1,235,000 335,000 7,490,000
- - - - - - 296,495 856,525 317,833 1,470,853
379,013 2,653,718 1,248,590 - - - 6,284,627 2,091,525 652,833 17,205,138
933,590 632,187 1,087,868 539,722 2,260,765 2,799,556 (5,448,633) 429,001 854,978 8,865,572
- - - 7,661,667 2,019,674 - - - - 9,681,341
(168,465) (883,898) - (833,160) (1,395,640) - (52,748) - (174,155) (5,944,804)
(168,465) (883,898) - 6,828,507 624,034 - (52,748) - (174,155) 3,736,537
765,125 (251,711) 1,087,868 7,368,229 2,884,799 2,799,556 (5,501,381) 429,001 680,823 12,602,109
3,998,631 3,497,446 3,072,072 - - - 6,746,807 4,025,813 5,500,058 37,995,540
4,763,756$ 3,245,735$ 4,159,940$ 7,368,229$ 2,884,799$ 2,799,556$ 1,245,426$ 4,454,814$ 6,180,881$ 50,597,649$
Debt ServiceSpecial Revenue
141

Variance with
Final BudgetActual Positive
Original Final Amounts (Negative)
REVENUES:
Intergovernmental 166,000$ 266,000$ 330,545$ 64,545$
Investment income 104 104 - (104)
Total revenues 166,104 266,104 330,545 64,441
EXPENDITURES:
Current:Public safety:
Police 245,923 345,923 279,316 66,607
Capital outlay - - 19,475 (19,475)
Total expenditures 245,923 345,923 298,791 47,132
Net change in fund balances (79,819)$ (79,819)$ 31,754 111,573$
FUND BALANCES:
Beginning of year -
End of year 31,754$
Budget Amounts
City of San MateoSchedule of Revenues, Expenditures and Changes in Fund Balances - Budget and Actual
(Budgetary Basis) - Police Grants Special Revenue Fund
For the year ended June 30, 2018
142
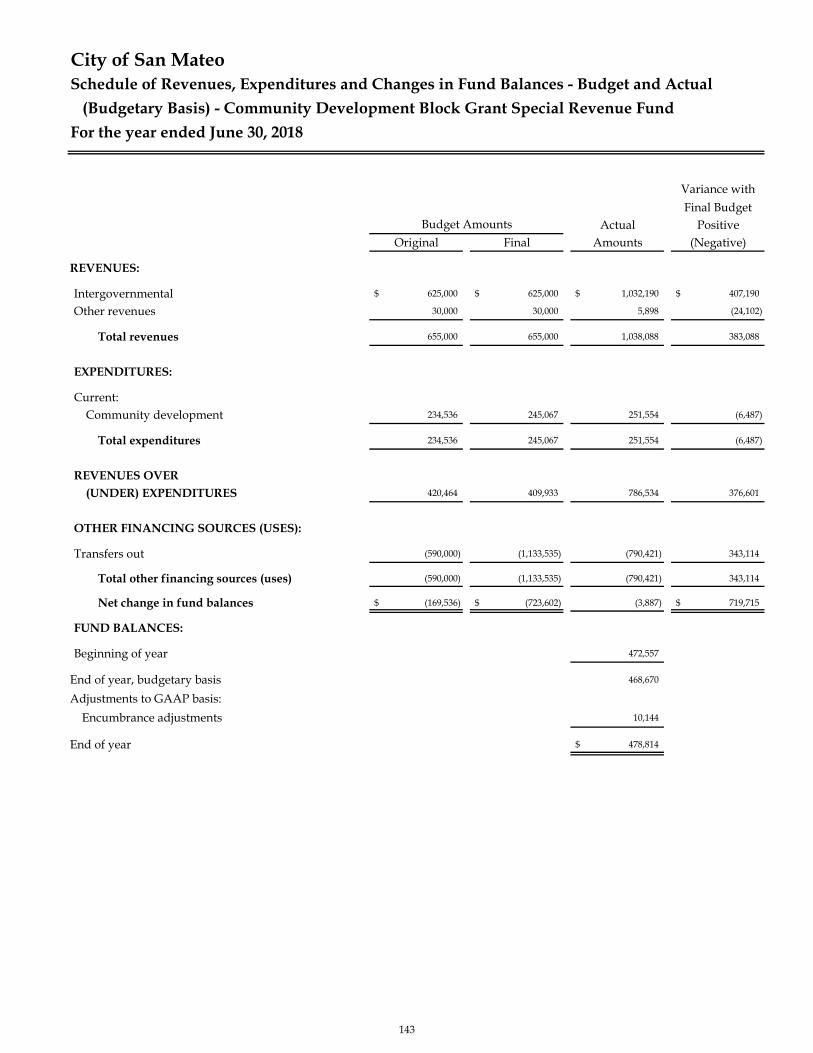
Variance with
Final BudgetActual Positive
Original Final Amounts (Negative)
REVENUES:
Intergovernmental 625,000$ 625,000$ 1,032,190$ 407,190$
Other revenues 30,000 30,000 5,898 (24,102)
Total revenues 655,000 655,000 1,038,088 383,088
EXPENDITURES:
Current:Community development 234,536 245,067 251,554 (6,487)
Total expenditures 234,536 245,067 251,554 (6,487)
REVENUES OVER (UNDER) EXPENDITURES 420,464 409,933 786,534 376,601
OTHER FINANCING SOURCES (USES):
Transfers out (590,000) (1,133,535) (790,421) 343,114
Total other financing sources (uses) (590,000) (1,133,535) (790,421) 343,114
Net change in fund balances (169,536)$ (723,602)$ (3,887) 719,715$
FUND BALANCES:
Beginning of year 472,557
End of year, budgetary basis 468,670
Adjustments to GAAP basis:
Encumbrance adjustments 10,144
End of year 478,814$
Budget Amounts
City of San MateoSchedule of Revenues, Expenditures and Changes in Fund Balances - Budget and Actual
(Budgetary Basis) - Community Development Block Grant Special Revenue Fund
For the year ended June 30, 2018
143
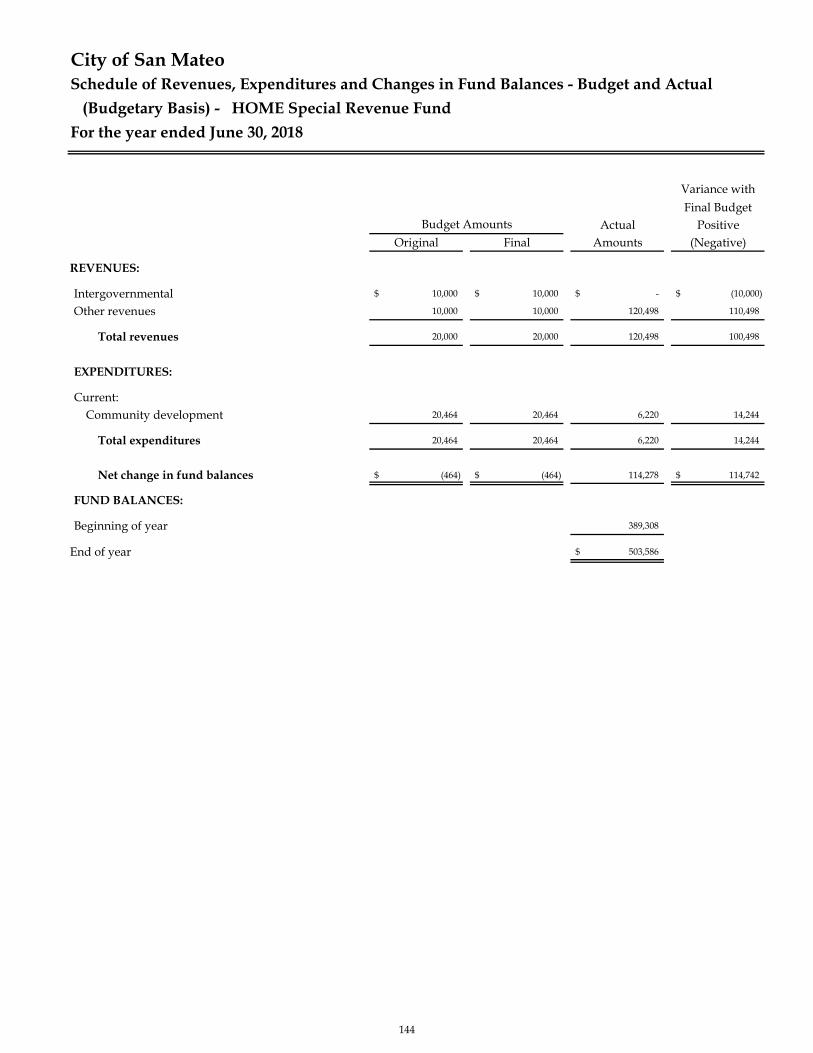
Variance with
Final BudgetActual Positive
Original Final Amounts (Negative)
REVENUES:
Intergovernmental 10,000$ 10,000$ -$ (10,000)$
Other revenues 10,000 10,000 120,498 110,498
Total revenues 20,000 20,000 120,498 100,498
EXPENDITURES:
Current:Community development 20,464 20,464 6,220 14,244
Total expenditures 20,464 20,464 6,220 14,244
Net change in fund balances (464)$ (464)$ 114,278 114,742$
FUND BALANCES:
Beginning of year 389,308
End of year 503,586$
City of San MateoSchedule of Revenues, Expenditures and Changes in Fund Balances - Budget and Actual
(Budgetary Basis) - HOME Special Revenue Fund
For the year ended June 30, 2018
Budget Amounts
144

Variance with
Final BudgetActual Positive
Original Final Amounts (Negative)
REVENUES:
Other revenues 56,000$ 56,000$ 14,369$ (41,631)$
Total revenues 56,000 56,000 14,369 (41,631)
EXPENDITURES:
Current:Community development 51,000 51,000 39,606 11,394
Total expenditures 51,000 51,000 39,606 11,394
Net change in fund balances 5,000$ 5,000$ (25,237) (30,237)$
FUND BALANCES:
Beginning of year 680,242
End of year 655,005$
City of San MateoSchedule of Revenues, Expenditures and Changes in Fund Balances - Budget and Actual
(Budgetary Basis) - City Housing Special Revenue Fund
For the year ended June 30, 2018
Budget Amounts
145

Variance with
Final BudgetActual Positive
Original Final Amounts (Negative)
REVENUES:
Intergovernmental -$ -$ (205,384)$ (205,384)$
Charges for services 80,000 80,000 1,327,541 1,247,541
Investment income 10,404 10,404 43,303 32,899
Total revenues 90,404 90,404 1,165,460 1,075,056
EXPENDITURES:
Current:Community development 134,111 144,711 77,581 67,130
Total expenditures 134,111 144,711 77,581 67,130
REVENUES OVER (UNDER) EXPENDITURES (43,707) (54,307) 1,087,879 1,142,186
OTHER FINANCING SOURCES (USES):
Transfers out (500,000) (2,190,924) - 2,190,924
Total other financing sources (uses) (500,000) (2,190,924) - 2,190,924
Net change in fund balances (543,707)$ (2,245,231)$ 1,087,879 3,333,110$
FUND BALANCES:
Beginning of year 5,048,818
End of year 6,136,697$
City of San MateoSchedule of Revenues, Expenditures and Changes in Fund Balances - Budget and Actual
(Budgetary Basis) - Low Moderate Income Housing Special Revenue Fund
For the year ended June 30, 2018
Budget Amounts
146
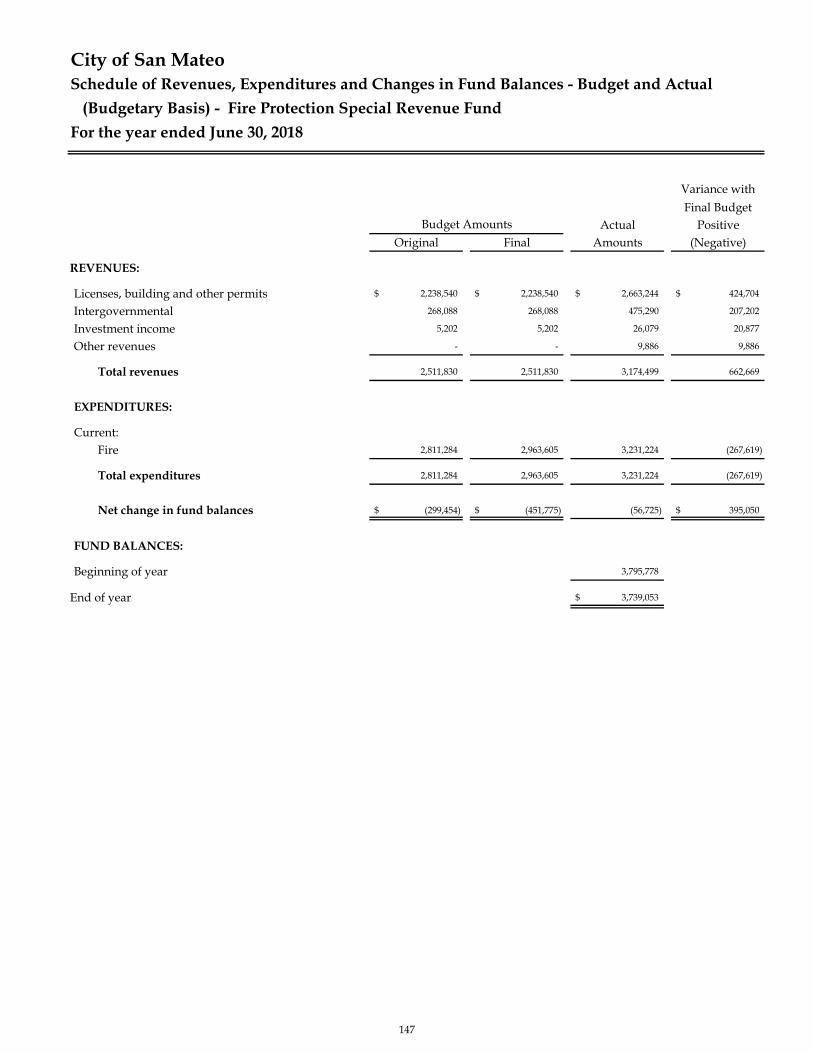
Variance with
Final BudgetActual Positive
Original Final Amounts (Negative)
REVENUES:
Licenses, building and other permits 2,238,540$ 2,238,540$ 2,663,244$ 424,704$
Intergovernmental 268,088 268,088 475,290 207,202
Investment income 5,202 5,202 26,079 20,877
Other revenues - - 9,886 9,886
Total revenues 2,511,830 2,511,830 3,174,499 662,669
EXPENDITURES:
Current:Fire 2,811,284 2,963,605 3,231,224 (267,619)
Total expenditures 2,811,284 2,963,605 3,231,224 (267,619)
Net change in fund balances (299,454)$ (451,775)$ (56,725) 395,050$
FUND BALANCES:
Beginning of year 3,795,778
End of year 3,739,053$
Budget Amounts
City of San MateoSchedule of Revenues, Expenditures and Changes in Fund Balances - Budget and Actual
(Budgetary Basis) - Fire Protection Special Revenue Fund
For the year ended June 30, 2018
147
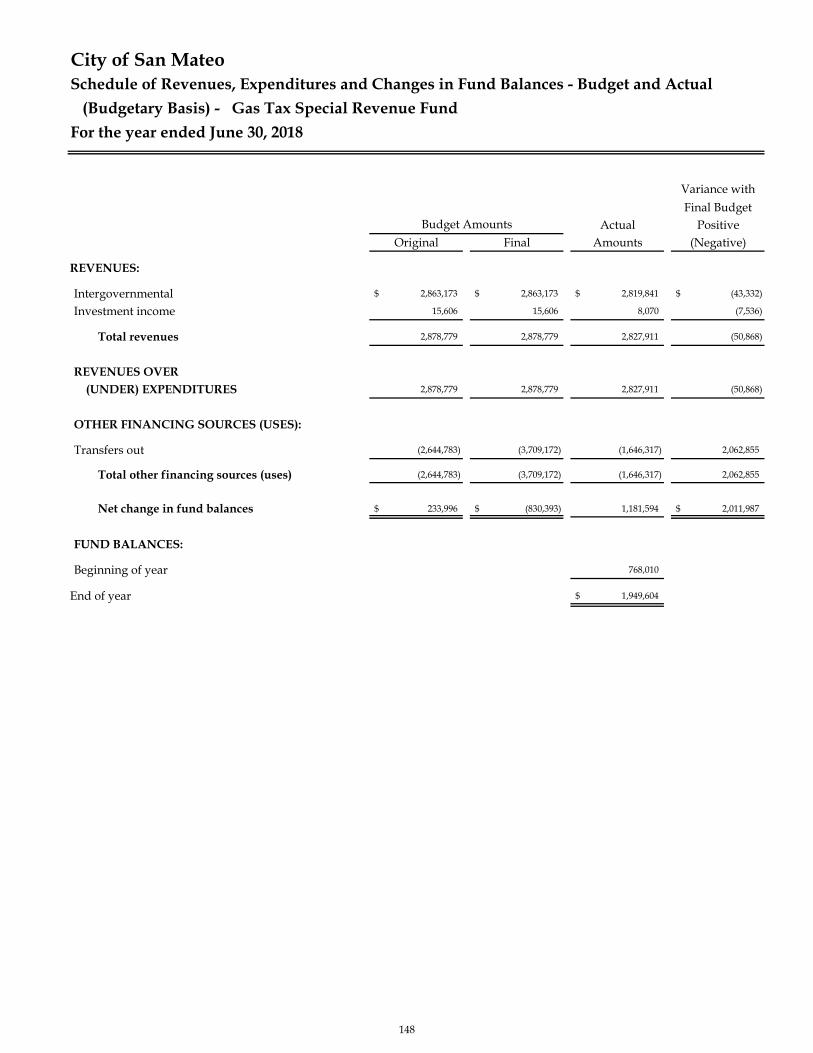
Variance with
Final BudgetActual Positive
Original Final Amounts (Negative)
REVENUES:
Intergovernmental 2,863,173$ 2,863,173$ 2,819,841$ (43,332)$
Investment income 15,606 15,606 8,070 (7,536)
Total revenues 2,878,779 2,878,779 2,827,911 (50,868)
REVENUES OVER (UNDER) EXPENDITURES 2,878,779 2,878,779 2,827,911 (50,868)
OTHER FINANCING SOURCES (USES):
Transfers out (2,644,783) (3,709,172) (1,646,317) 2,062,855
Total other financing sources (uses) (2,644,783) (3,709,172) (1,646,317) 2,062,855
Net change in fund balances 233,996$ (830,393)$ 1,181,594 2,011,987$
FUND BALANCES:
Beginning of year 768,010
End of year 1,949,604$
Budget Amounts
City of San MateoSchedule of Revenues, Expenditures and Changes in Fund Balances - Budget and Actual
(Budgetary Basis) - Gas Tax Special Revenue Fund
For the year ended June 30, 2018
148

Variance with
Final BudgetActual Positive
Original Final Amounts (Negative)
REVENUES:
Charges for services 600,000$ 600,000$ 1,274,011$ 674,011$
Investment income 10,404 10,404 38,592 28,188
Total revenues 610,404 610,404 1,312,603 702,199
EXPENDITURES:
Current:Community development 555,252 1,100,252 379,013 721,239
Total expenditures 555,252 1,100,252 379,013 721,239
REVENUES OVER (UNDER) EXPENDITURES 55,152 (489,848) 933,590 1,423,438
OTHER FINANCING SOURCES (USES):
Transfers out - (662,364) (168,465) 493,899
Total other financing sources (uses) - (662,364) (168,465) 493,899
Net change in fund balances 55,152$ (1,152,212)$ 765,125 1,917,337$
FUND BALANCES:
Beginning of year 3,998,631
End of year 4,763,756$
Budget Amounts
City of San MateoSchedule of Revenues, Expenditures and Changes in Fund Balances - Budget and Actual
(Budgetary Basis) - Advance Planning Special Revenue Fund
For the year ended June 30, 2018
149
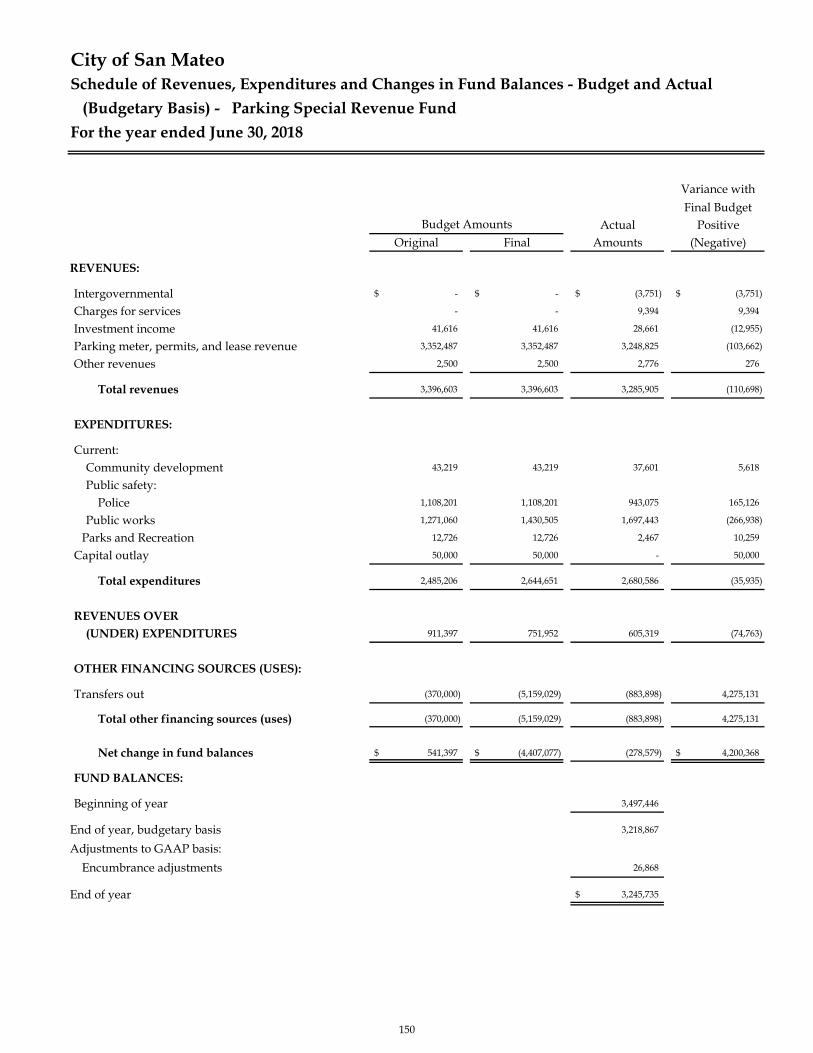
Variance with
Final BudgetActual Positive
Original Final Amounts (Negative)
REVENUES:
Intergovernmental -$ -$ (3,751)$ (3,751)$
Charges for services - - 9,394 9,394
Investment income 41,616 41,616 28,661 (12,955)
Parking meter, permits, and lease revenue 3,352,487 3,352,487 3,248,825 (103,662)
Other revenues 2,500 2,500 2,776 276
Total revenues 3,396,603 3,396,603 3,285,905 (110,698)
EXPENDITURES:
Current:Community development 43,219 43,219 37,601 5,618
Public safety:Police 1,108,201 1,108,201 943,075 165,126
Public works 1,271,060 1,430,505 1,697,443 (266,938)
Parks and Recreation 12,726 12,726 2,467 10,259
Capital outlay 50,000 50,000 - 50,000
Total expenditures 2,485,206 2,644,651 2,680,586 (35,935)
REVENUES OVER (UNDER) EXPENDITURES 911,397 751,952 605,319 (74,763)
OTHER FINANCING SOURCES (USES):
Transfers out (370,000) (5,159,029) (883,898) 4,275,131
Total other financing sources (uses) (370,000) (5,159,029) (883,898) 4,275,131
Net change in fund balances 541,397$ (4,407,077)$ (278,579) 4,200,368$
FUND BALANCES:
Beginning of year 3,497,446
End of year, budgetary basis 3,218,867
Adjustments to GAAP basis:
Encumbrance adjustments 26,868
End of year 3,245,735$
Budget Amounts
City of San MateoSchedule of Revenues, Expenditures and Changes in Fund Balances - Budget and Actual
(Budgetary Basis) - Parking Special Revenue Fund
For the year ended June 30, 2018
150

Variance with
Final BudgetActual Positive
Original Final Amounts (Negative)
REVENUES:
Fines, forfeitures and penalties 35,000$ 35,000$ 311,242$ 276,242$
Intergovernmental 140,000 140,000 269,715 129,715
Charges for services 320,000 320,000 470,000 150,000
Investment income 10,404 10,404 27,920 17,516
Garbage collection surcharge 904,000 904,000 816,750 (87,250)
Capital contribution - - 375,000 375,000
Other revenues 65,000 65,000 65,831 831
Total revenues 1,474,404 1,474,404 2,336,458 862,054
EXPENDITURES:
Current:Public works 1,455,646 1,513,992 1,267,475 246,517
Total expenditures 1,455,646 1,513,992 1,267,475 246,517
REVENUES OVER (UNDER) EXPENDITURES 18,758 (39,588) 1,068,983 1,108,571
OTHER FINANCING SOURCES (USES):
Transfers out - (777,888) - 777,888
Total other financing sources (uses) - (777,888) - 777,888
Net change in fund balances 18,758$ (817,476)$ 1,068,983 1,886,459$
FUND BALANCES:
Beginning of year 3,072,072
End of year, budgetary basis 4,141,055
Adjustments to GAAP basis:
Encumbrance adjustments 18,885
End of year 4,159,940$
Budget Amounts
City of San MateoSchedule of Revenues, Expenditures and Changes in Fund Balances - Budget and Actual
(Budgetary Basis) - Solid Waste Special Revenue Fund
For the year ended June 30, 2018
151
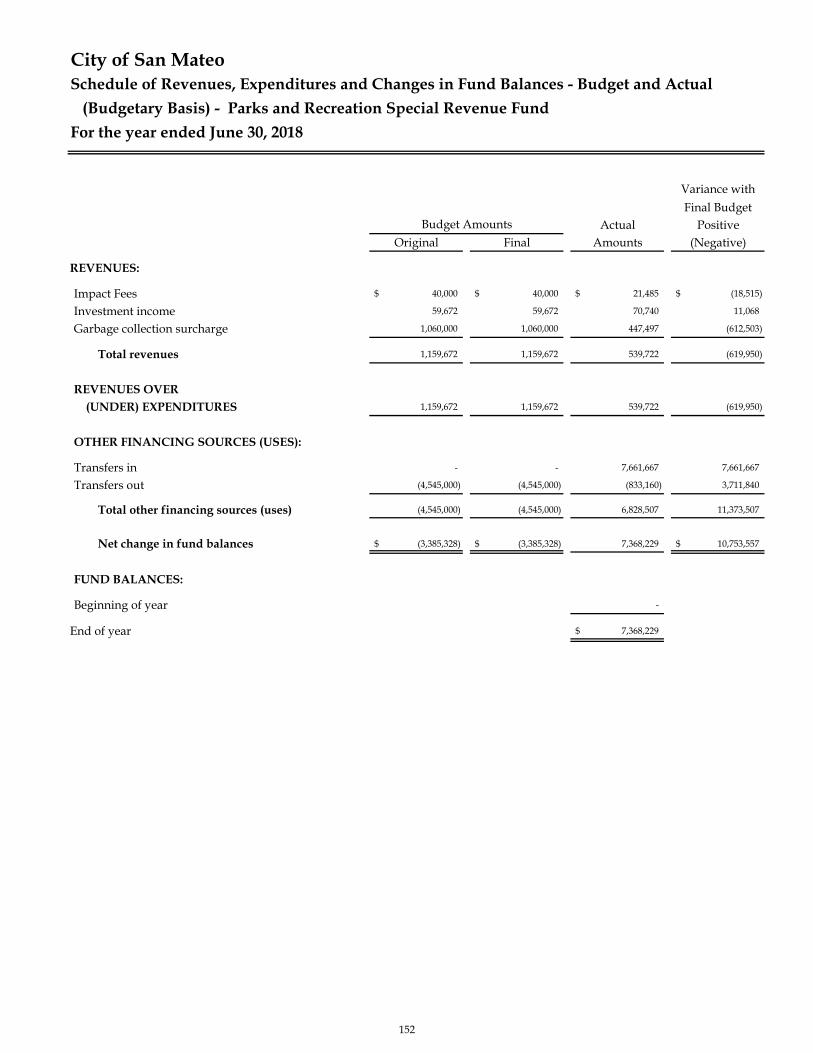
Variance with
Final BudgetActual Positive
Original Final Amounts (Negative)
REVENUES:
Impact Fees 40,000$ 40,000$ 21,485$ (18,515)$
Investment income 59,672 59,672 70,740 11,068
Garbage collection surcharge 1,060,000 1,060,000 447,497 (612,503)
Total revenues 1,159,672 1,159,672 539,722 (619,950)
REVENUES OVER (UNDER) EXPENDITURES 1,159,672 1,159,672 539,722 (619,950)
OTHER FINANCING SOURCES (USES):
Transfers in - - 7,661,667 7,661,667
Transfers out (4,545,000) (4,545,000) (833,160) 3,711,840
Total other financing sources (uses) (4,545,000) (4,545,000) 6,828,507 11,373,507
Net change in fund balances (3,385,328)$ (3,385,328)$ 7,368,229 10,753,557$
FUND BALANCES:
Beginning of year -
End of year 7,368,229$
Budget Amounts
City of San MateoSchedule of Revenues, Expenditures and Changes in Fund Balances - Budget and Actual
(Budgetary Basis) - Parks and Recreation Special Revenue Fund
For the year ended June 30, 2018
152
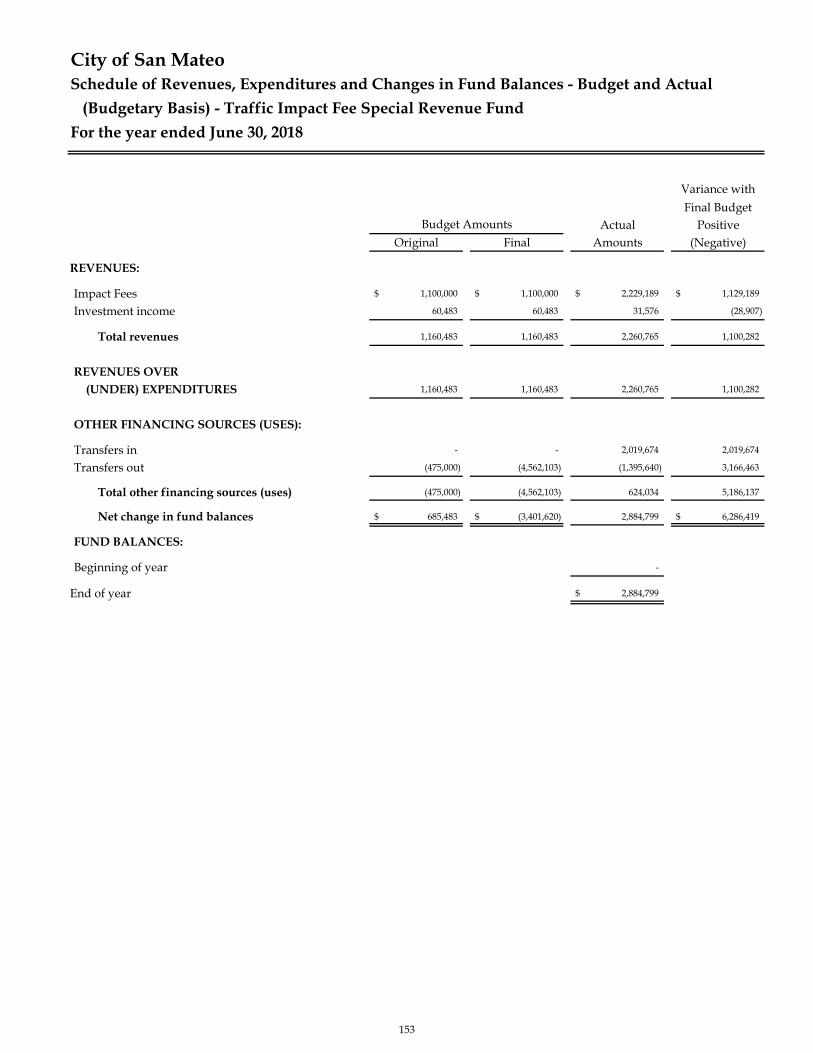
Variance with
Final BudgetActual Positive
Original Final Amounts (Negative)
REVENUES:
Impact Fees 1,100,000$ 1,100,000$ 2,229,189$ 1,129,189$
Investment income 60,483 60,483 31,576 (28,907)
Total revenues 1,160,483 1,160,483 2,260,765 1,100,282
REVENUES OVER (UNDER) EXPENDITURES 1,160,483 1,160,483 2,260,765 1,100,282
OTHER FINANCING SOURCES (USES):
Transfers in - - 2,019,674 2,019,674
Transfers out (475,000) (4,562,103) (1,395,640) 3,166,463
Total other financing sources (uses) (475,000) (4,562,103) 624,034 5,186,137
Net change in fund balances 685,483$ (3,401,620)$ 2,884,799 6,286,419$
FUND BALANCES:
Beginning of year -
End of year 2,884,799$
City of San MateoSchedule of Revenues, Expenditures and Changes in Fund Balances - Budget and Actual
(Budgetary Basis) - Traffic Impact Fee Special Revenue Fund
For the year ended June 30, 2018
Budget Amounts
153
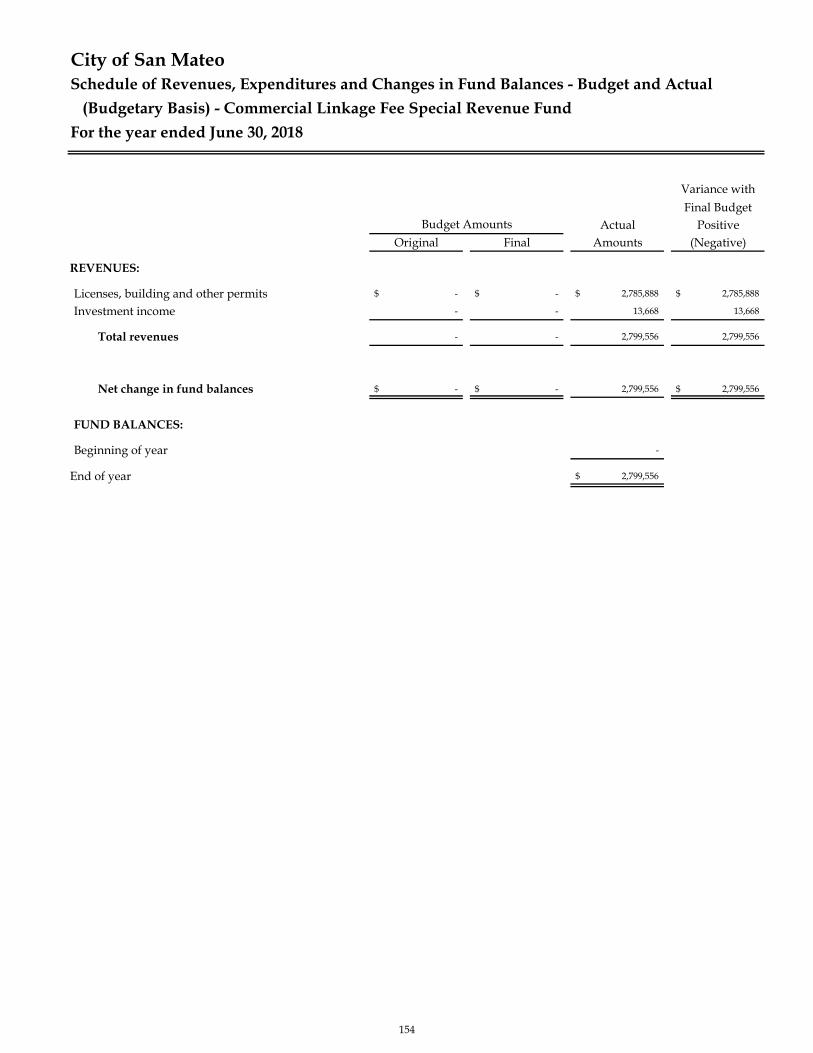
Variance with
Final BudgetActual Positive
Original Final Amounts (Negative)
REVENUES:
Licenses, building and other permits -$ -$ 2,785,888$ 2,785,888$
Investment income - - 13,668 13,668
Total revenues - - 2,799,556 2,799,556
Net change in fund balances -$ -$ 2,799,556 2,799,556$
FUND BALANCES:
Beginning of year -
End of year 2,799,556$
City of San MateoSchedule of Revenues, Expenditures and Changes in Fund Balances - Budget and Actual
(Budgetary Basis) - Commercial Linkage Fee Special Revenue Fund
For the year ended June 30, 2018
Budget Amounts
154
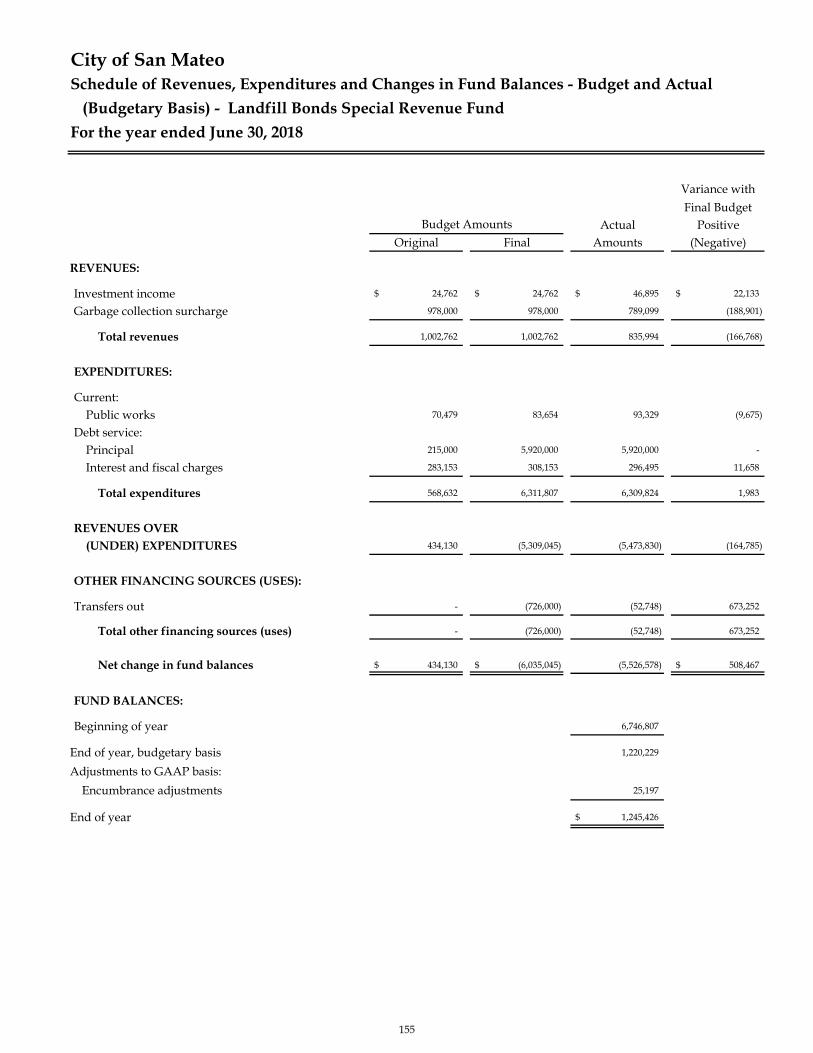
Variance with
Final BudgetActual Positive
Original Final Amounts (Negative)
REVENUES:
Investment income 24,762$ 24,762$ 46,895$ 22,133$
Garbage collection surcharge 978,000 978,000 789,099 (188,901)
Total revenues 1,002,762 1,002,762 835,994 (166,768)
EXPENDITURES:
Current:Public works 70,479 83,654 93,329 (9,675)
Debt service:Principal 215,000 5,920,000 5,920,000 -
Interest and fiscal charges 283,153 308,153 296,495 11,658
Total expenditures 568,632 6,311,807 6,309,824 1,983
REVENUES OVER (UNDER) EXPENDITURES 434,130 (5,309,045) (5,473,830) (164,785)
OTHER FINANCING SOURCES (USES):
Transfers out - (726,000) (52,748) 673,252
Total other financing sources (uses) - (726,000) (52,748) 673,252
Net change in fund balances 434,130$ (6,035,045)$ (5,526,578) 508,467$
FUND BALANCES:
Beginning of year 6,746,807
End of year, budgetary basis 1,220,229
Adjustments to GAAP basis:
Encumbrance adjustments 25,197
End of year 1,245,426$
Budget Amounts
City of San MateoSchedule of Revenues, Expenditures and Changes in Fund Balances - Budget and Actual
(Budgetary Basis) - Landfill Bonds Special Revenue Fund
For the year ended June 30, 2018
155

Variance with
Final BudgetActual Positive
Original Final Amounts (Negative)
REVENUES:
Property taxes 2,030,950$ 2,030,950$ 2,493,382$ 462,432$
Investment income 15,606 15,606 27,144 11,538
Total revenues 2,046,556 2,046,556 2,520,526 473,970
EXPENDITURES:
Debt service:Principal 1,235,000 1,235,000 1,235,000 -
Interest and fiscal charges 3,106,275 3,106,275 856,525 2,249,750
Total expenditures 4,341,275 4,341,275 2,091,525 2,249,750
REVENUES OVER (UNDER) EXPENDITURES (2,294,719) (2,294,719) 429,001 2,723,720
OTHER FINANCING SOURCES (USES):
Transfers in 2,250,000 2,250,000 - (2,250,000)
Total other financing sources (uses) 2,250,000 2,250,000 - (2,250,000)
Net change in fund balances (44,719)$ (44,719)$ 429,001 473,720$
FUND BALANCES:
Beginning of year 4,025,813
End of year 4,454,814$
Budget Amounts
City of San MateoSchedule of Revenues, Expenditures and Changes in Fund Balances - Budget and Actual
(Budgetary Basis) - General Obligation Bonds Special Revenue Fund
For the year ended June 30, 2018
156
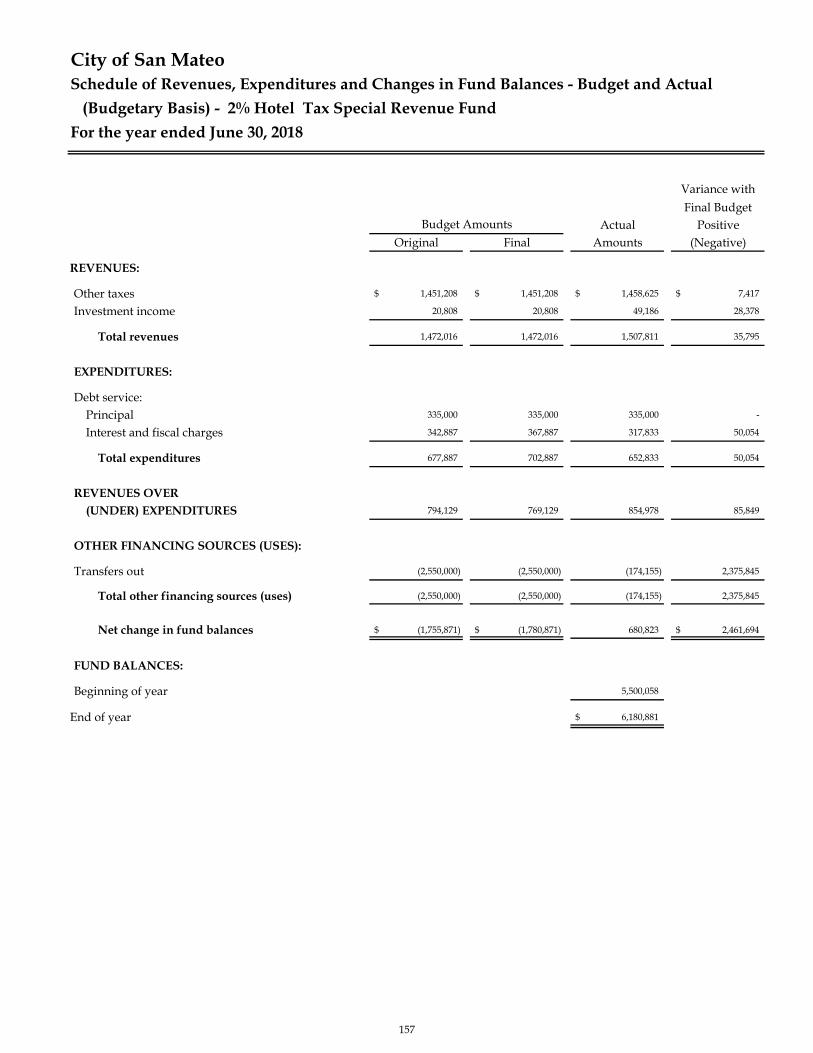
Variance with
Final BudgetActual Positive
Original Final Amounts (Negative)
REVENUES:
Other taxes 1,451,208$ 1,451,208$ 1,458,625$ 7,417$
Investment income 20,808 20,808 49,186 28,378
Total revenues 1,472,016 1,472,016 1,507,811 35,795
EXPENDITURES:
Debt service:Principal 335,000 335,000 335,000 -
Interest and fiscal charges 342,887 367,887 317,833 50,054
Total expenditures 677,887 702,887 652,833 50,054
REVENUES OVER (UNDER) EXPENDITURES 794,129 769,129 854,978 85,849
OTHER FINANCING SOURCES (USES):
Transfers out (2,550,000) (2,550,000) (174,155) 2,375,845
Total other financing sources (uses) (2,550,000) (2,550,000) (174,155) 2,375,845
Net change in fund balances (1,755,871)$ (1,780,871)$ 680,823 2,461,694$
FUND BALANCES:
Beginning of year 5,500,058
End of year 6,180,881$
Budget Amounts
City of San MateoSchedule of Revenues, Expenditures and Changes in Fund Balances - Budget and Actual
(Budgetary Basis) - 2% Hotel Tax Special Revenue Fund
For the year ended June 30, 2018
157

158
INTERNAL SERVICE FUNDS
Workers' Compensation Insurance Fund accounts for all workers' compensation self-insurance activities.
Dental Self-Insurance Fund accounts for the City's self-insurance activities related to the dental plan theCity provides to its employees.
Benefits Fund accounts for charges to other funds and expenditures relating to employee benefits otherthan those accounted for in the Worker Compensation and Dental Self-Insurance Funds.
Comprehensive Liability Insurance Fund accounts for the general liability self-insurance transactions.
Vehicle and Equipment Replacement Fund accounts for rental charges to City departments and thereplacement of vehicles and equipment.
Fleet and Building Maintenance Fund accounts for the charges to user departments and the expensesrelating to the maintenance of City vehicles and buildings.
159
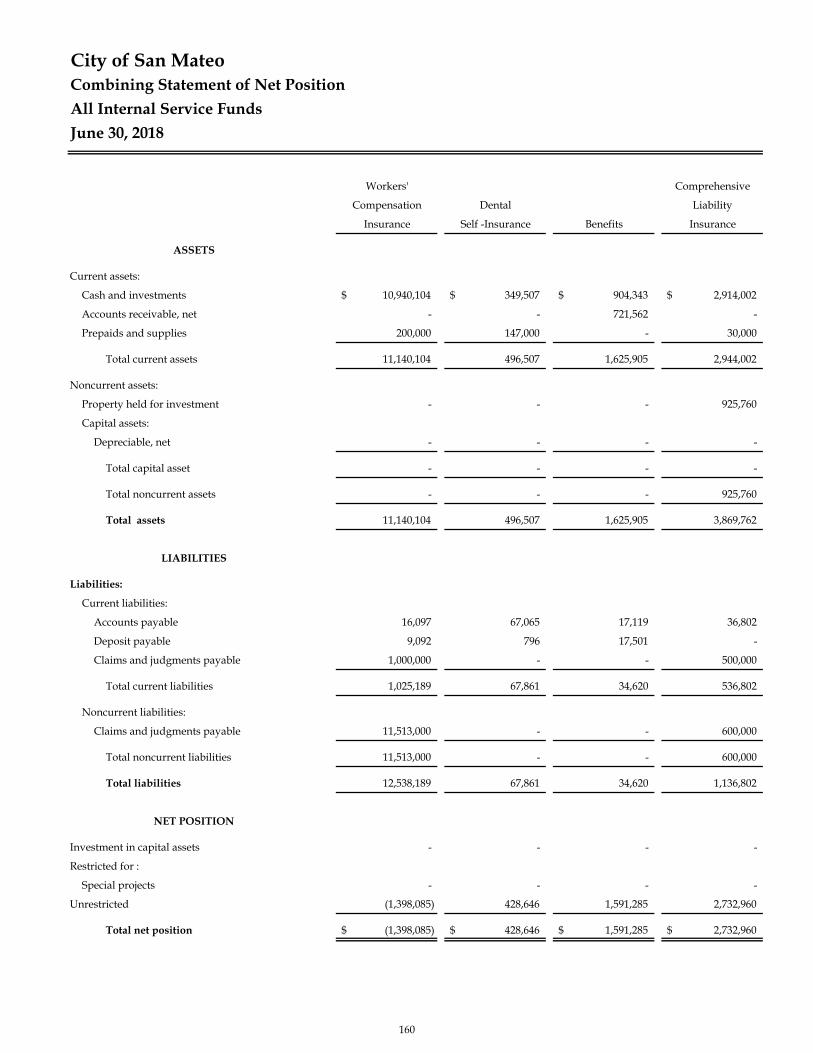
City of San MateoCombining Statement of Net Position
All Internal Service Funds
June 30, 2018
Workers' Comprehensive
Compensation Dental Liability
Insurance Self -Insurance Benefits Insurance
ASSETS
Current assets:
Cash and investments 10,940,104$ 349,507$ 904,343$ 2,914,002$
Accounts receivable, net - - 721,562 -
Prepaids and supplies 200,000 147,000 - 30,000
Total current assets 11,140,104 496,507 1,625,905 2,944,002
Noncurrent assets:
Property held for investment - - - 925,760
Capital assets:
Depreciable, net - - - -
Total capital asset - - - -
Total noncurrent assets - - - 925,760
Total assets 11,140,104 496,507 1,625,905 3,869,762
LIABILITIES
Liabilities:
Current liabilities:
Accounts payable 16,097 67,065 17,119 36,802
Deposit payable 9,092 796 17,501 -
Claims and judgments payable 1,000,000 - - 500,000
Total current liabilities 1,025,189 67,861 34,620 536,802
Noncurrent liabilities:
Claims and judgments payable 11,513,000 - - 600,000
Total noncurrent liabilities 11,513,000 - - 600,000
Total liabilities 12,538,189 67,861 34,620 1,136,802
NET POSITION
Investment in capital assets - - - -
Restricted for :
Special projects - - - -
Unrestricted (1,398,085) 428,646 1,591,285 2,732,960
Total net position (1,398,085)$ 428,646$ 1,591,285$ 2,732,960$
160
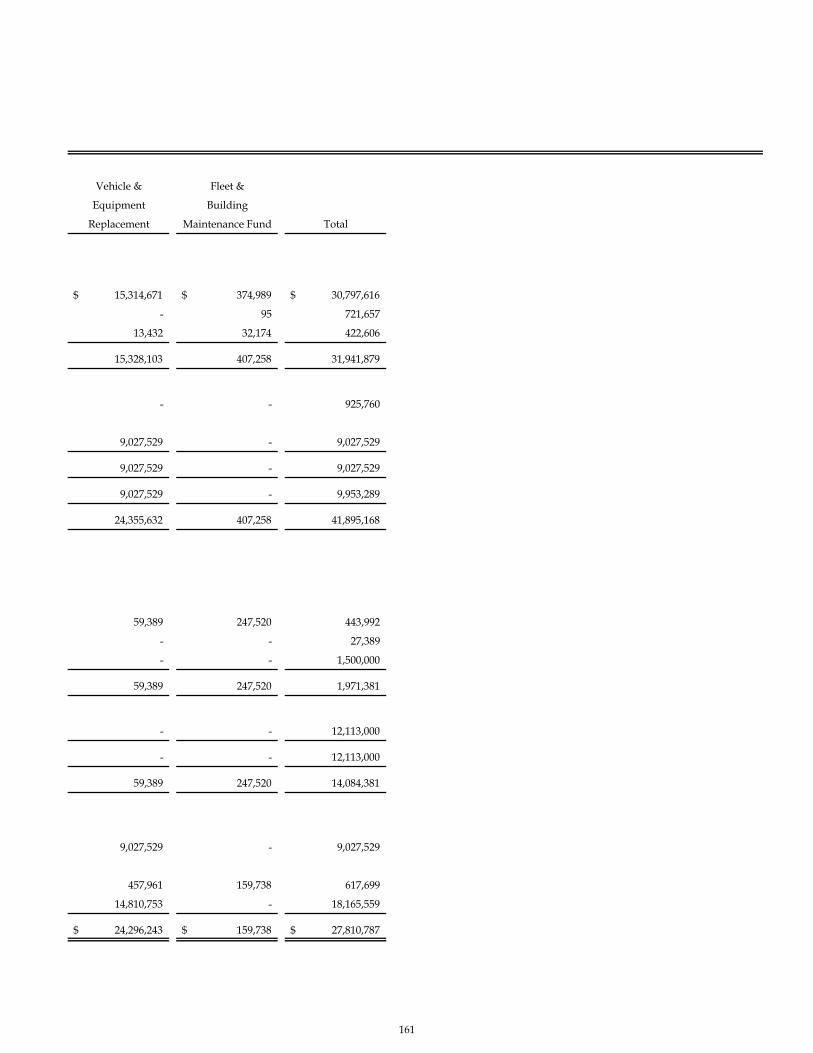
Vehicle & Fleet &
Equipment Building
Replacement Maintenance Fund Total
15,314,671$ 374,989$ 30,797,616$
- 95 721,657
13,432 32,174 422,606
15,328,103 407,258 31,941,879
- - 925,760
9,027,529 - 9,027,529
9,027,529 - 9,027,529
9,027,529 - 9,953,289
24,355,632 407,258 41,895,168
59,389 247,520 443,992
- - 27,389
- - 1,500,000
59,389 247,520 1,971,381
- - 12,113,000
- - 12,113,000
59,389 247,520 14,084,381
9,027,529 - 9,027,529
457,961 159,738 617,699
14,810,753 - 18,165,559
24,296,243$ 159,738$ 27,810,787$
161
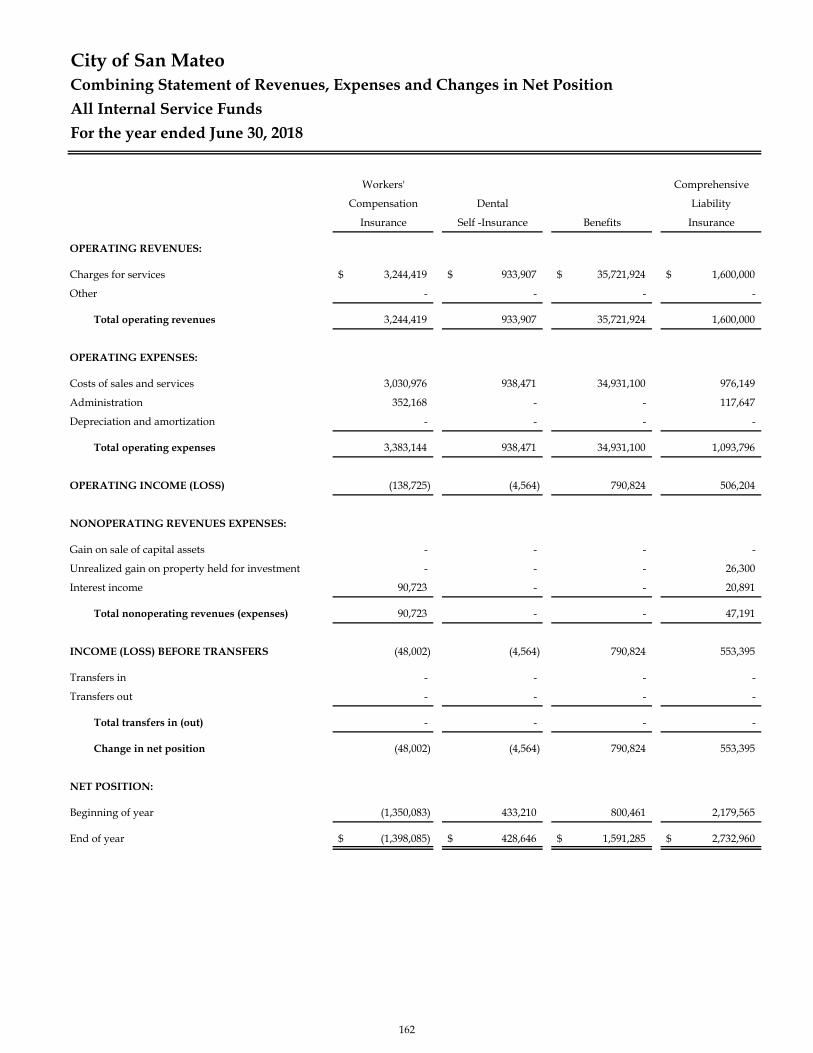
City of San MateoCombining Statement of Revenues, Expenses and Changes in Net Position
All Internal Service Funds
For the year ended June 30, 2018
Workers' Comprehensive
Compensation Dental Liability
Insurance Self -Insurance Benefits Insurance
OPERATING REVENUES:
Charges for services 3,244,419$ 933,907$ 35,721,924$ 1,600,000$
Other - - - -
Total operating revenues 3,244,419 933,907 35,721,924 1,600,000
OPERATING EXPENSES:
Costs of sales and services 3,030,976 938,471 34,931,100 976,149
Administration 352,168 - - 117,647
Depreciation and amortization - - - -
Total operating expenses 3,383,144 938,471 34,931,100 1,093,796
OPERATING INCOME (LOSS) (138,725) (4,564) 790,824 506,204
NONOPERATING REVENUES EXPENSES:
Gain on sale of capital assets - - - -
Unrealized gain on property held for investment - - - 26,300
Interest income 90,723 - - 20,891
Total nonoperating revenues (expenses) 90,723 - - 47,191
INCOME (LOSS) BEFORE TRANSFERS (48,002) (4,564) 790,824 553,395
Transfers in - - - -
Transfers out - - - -
Total transfers in (out) - - - -
Change in net position (48,002) (4,564) 790,824 553,395
NET POSITION:
Beginning of year (1,350,083) 433,210 800,461 2,179,565
End of year (1,398,085)$ 428,646$ 1,591,285$ 2,732,960$
162
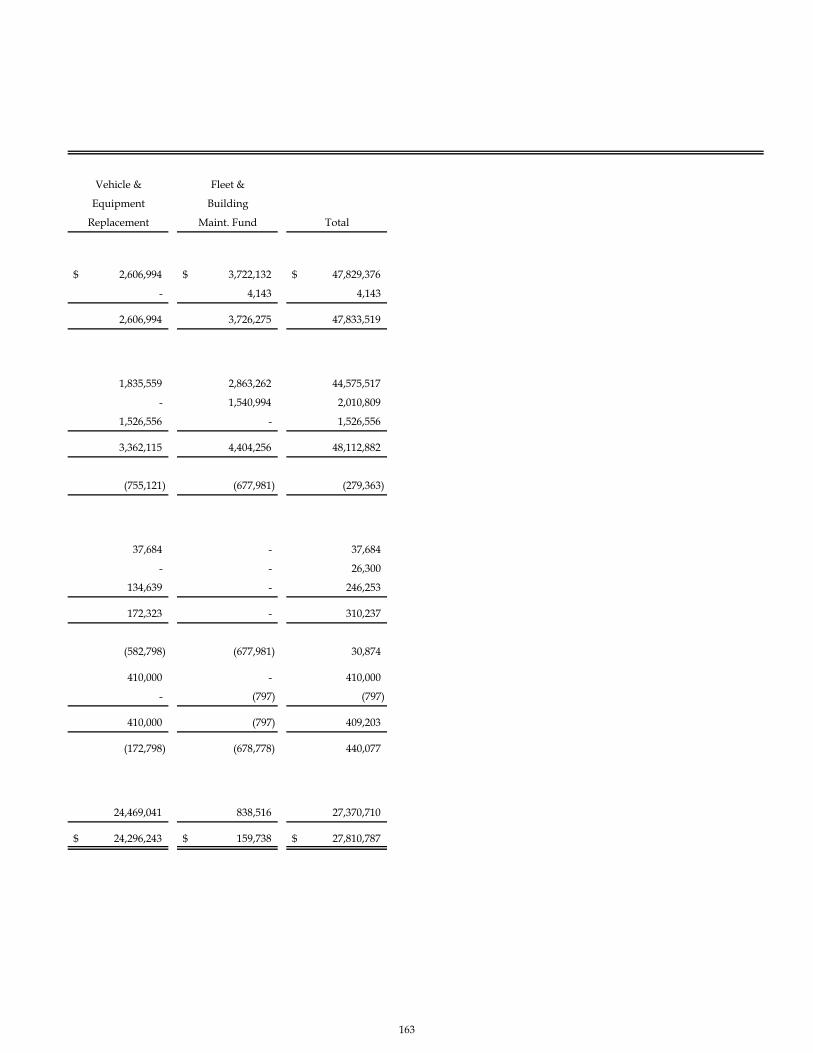
Vehicle & Fleet &
Equipment Building
Replacement Maint. Fund Total
2,606,994$ 3,722,132$ 47,829,376$
- 4,143 4,143
2,606,994 3,726,275 47,833,519
1,835,559 2,863,262 44,575,517
- 1,540,994 2,010,809
1,526,556 - 1,526,556
3,362,115 4,404,256 48,112,882
(755,121) (677,981) (279,363)
37,684 - 37,684
- - 26,300
134,639 - 246,253
172,323 - 310,237
(582,798) (677,981) 30,874
410,000 - 410,000
- (797) (797)
410,000 (797) 409,203
(172,798) (678,778) 440,077
24,469,041 838,516 27,370,710
24,296,243$ 159,738$ 27,810,787$
163

City of San MateoCombining Statement of Cash Flows
All Internal Service Funds
For the year ended June 30, 2018
Workers' Comprehensive
Compensation Dental Liability
Insurance Self -Insurance Benefits Insurance
CASH FLOWS FROM OPERATING ACTIVITIES:
Cash received from other funds 3,244,419$ 933,907$ 35,717,628$ 1,600,000$
Cash payments to suppliers for goods and services (2,891,338) (937,282) (34,162,424) (1,194,298)
Cash paid to employees (352,168) - (792,057) (117,647)
Cash received from others - - - -
Net cash provided by (used in) operating activities 913 (3,375) 763,147 288,055
CASH FLOWS FROM NONCAPITAL FINANCING ACTIVITIES:
Transfers in - - - -
Transfers out - - - -
Net cash provided by (used in) noncapital financing activities - - - -
CASH FLOWS FROM CAPITAL AND RELATED
FINANCING ACTIVITIES:
Proceeds from sale of capital assets - - - -
Acquisition of capital assets - - - -
Net cash (used in) capital and related financing activities - - - -
CASH FLOWS FROM INVESTING ACTIVITIES:
Interest income received 90,723 - - 20,891
Net cash provided by investing activities 90,723 - - 20,891
Net increase (decrease) in cash and cash equivalents 91,636 (3,375) 763,147 308,946
CASH AND CASH EQUIVALENTS:
Beginning of year 10,848,468 352,882 141,196 2,605,056
End of year 10,940,104$ 349,507$ 904,343$ 2,914,002$
RECONCILIATION OF OPERATING INCOME (LOSS) TO NET 10,940,104 349,507 904,343 2,914,002
CASH PROVIDED BY (USED IN) OPERATING ACTIVITIES:
Operating income (loss) (138,725)$ (4,564)$ 790,824$ 506,204$
Adjustments to reconcile operating income (loss) to net
cash provided by (used in) operating activities:
Depreciation and amortization - - - -
Changes in assets and liabilities:
Accounts receivable - - (4,296) -
Prepaids and supplies - - - -
Accounts payable (207,362) 1,189 (26,510) 16,851
Deposit payable - - 3,129 -
Claims and judgments payable 347,000 - - (235,000)
Total adjustments 139,638 1,189 (27,677) (218,149)
Net cash provided by (used in) operating activities 913$ (3,375)$ 763,147$ 288,055$ - - -
NONCASH ITEMS
Unrealized gain on investment -$ -$ -$ (162,991)$
Total noncash items -$ -$ -$ (162,991)$
164
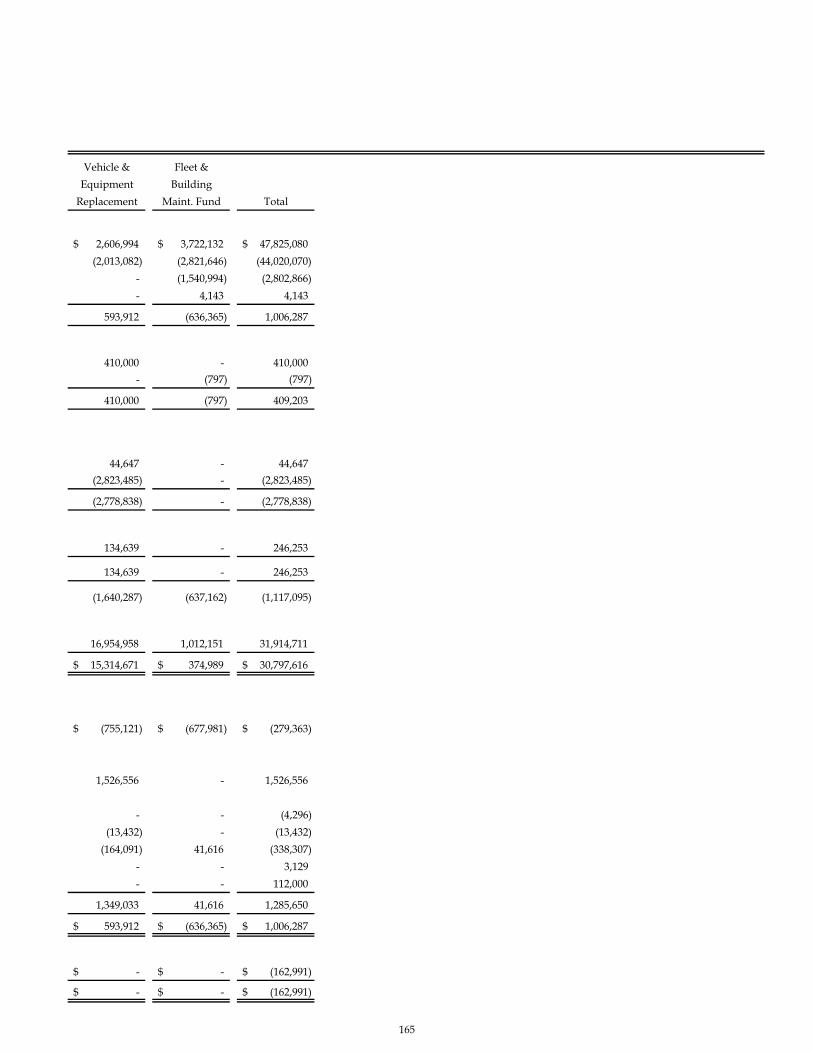
Vehicle & Fleet &
Equipment Building
Replacement Maint. Fund Total
2,606,994$ 3,722,132$ 47,825,080$
(2,013,082) (2,821,646) (44,020,070)
- (1,540,994) (2,802,866)
- 4,143 4,143
593,912 (636,365) 1,006,287
410,000 - 410,000
- (797) (797)
410,000 (797) 409,203
44,647 - 44,647
(2,823,485) - (2,823,485)
(2,778,838) - (2,778,838)
134,639 - 246,253
134,639 - 246,253
(1,640,287) (637,162) (1,117,095)
16,954,958 1,012,151 31,914,711
15,314,671$ 374,989$ 30,797,616$
15,314,671 374,989
(755,121)$ (677,981)$ (279,363)$
1,526,556 - 1,526,556
- - (4,296)
(13,432) - (13,432)
(164,091) 41,616 (338,307)
- - 3,129
- - 112,000
1,349,033 41,616 1,285,650
593,912$ (636,365)$ 1,006,287$ - - -
-$ -$ (162,991)$
-$ -$ (162,991)$
165

166
FIDUCIARY FUNDS
RDA Obligation Retirement Fund (RORF), established in accordance with AB 1X 26, accounts forRedevelopment Property Tax Trust Fund amounts received after January 31, 2012 to pay for RecognizedObligation Payment Schedule (ROPS) items.
Successor Agency to RDA Merged Area Fund , a sub-fund of the RORF, accounts for assets and liabilities ofthe former RDA merged project area which were transferred to the Successor Agency upon RDAdissolution to be used for ROPS payments or redistributed to taxing entities.
Successor Agency to RDA Housing Fund , a sub-fund of the RORF, accounts for assets and liabilities of theformer RDA housing set aside transferred to the Successor Agency upon RDA dissolution to be used forROPS payments or redistributed to taxing entities.
Community Facilities District No. 2008-01 Agency Fund accounts for assets that the City is holding for theCommunity Facilities District No. 2008-01 for which the City is acting as an agent.
167

RDA Successor Agency Successor Agency
Retirement to RDA Merged to RDA
Obligation Area Housing Total
ASSETS
Current assets
Cash and investments 5,031,792$ 12,625$ -$ 5,044,417$
Total current assets 5,031,792 12,625 - 5,044,417
Noncurrent assets
Restricted cash and investments - 1 12,641 12,642
Total noncurrent assets - 1 12,641 12,642
Total assets 5,031,792 12,626 12,641 5,057,059
DEFERRED OUTFLOWS OF RESOURCES
Deferred loss on refunding - 966,096 - 966,096
Total deferred outflows of resources - 966,096 - 966,096
LIABILITIES
Liabilities:
Current liabilities
Interest payable - 1,018,562 67,417 1,085,979
Bonds payable - due in one year - 2,605,000 1,095,000 3,700,000
Total current liabilities - 3,623,562 1,162,417 4,785,979
Noncurrent liabilities
Bonds payable - due in more than one year, net - 55,554,900 4,140,000 59,694,900
Total noncurrent liabilities - 55,554,900 4,140,000 59,694,900
Total liabilities - 59,178,462 5,302,417 64,480,879
DEFERRED INFLOWS OF RESOURCES
Deferred gain on refunding - 60,657 - 60,657
Total deferred inflows of resources - 60,657 - 60,657
NET POSITION
Held in trust for dissolution of RDA 5,031,792 (58,260,397) (5,289,776) (58,518,381)
Total net position 5,031,792$ (58,260,397)$ (5,289,776)$ (58,518,381)$
City of San MateoCombining Statement of Fiduciary Net Position
Fiduciary Funds - Private Purpose Trust Funds
June 30, 2018
168

RDA Successor Agency Successor Agency
Retirement to RDA Merged to RDA
Obligation Area Housing Total
ADDITIONS:
Investment income 222$ (5,075)$ -$ (4,853)$
RDA property tax trust fund distribution 6,121,469 - - 6,121,469
Transfer within Successor Agency - 5,076,745 1,175,772 6,252,517
Total additions 6,121,691 5,071,670 1,175,772 12,369,133
DEDUCTIONS:
Administration - 295,060 2,385 297,445
Interest expense - 2,231,505 82,542 2,314,047
Transfer within Successor Agency 6,252,517 - - 6,252,517
Total deductions 6,252,517 2,526,565 84,927 8,864,009
Change in net position (130,826) 2,545,105 1,090,845 3,505,124
NET POSITION:
Beginning of year 5,162,618 (60,805,502) (6,380,621) (62,023,505)
End of year 5,031,792$ (58,260,397)$ (5,289,776)$ (58,518,381)$
City of San MateoCombining Statement of Changes in Fiduciary Net PositionFiduciary Funds - Private Purpose Trust FundsFor the year ended June 30, 2018
169
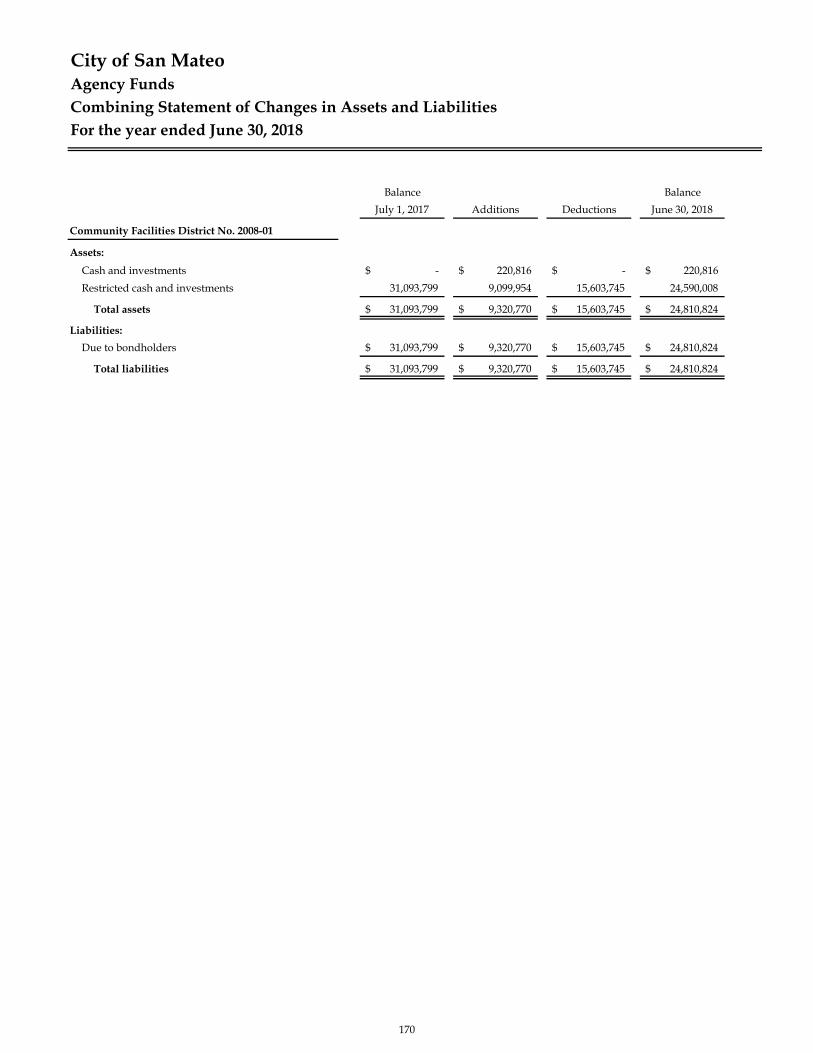
City of San MateoAgency FundsCombining Statement of Changes in Assets and LiabilitiesFor the year ended June 30, 2018
Balance Balance
July 1, 2017 Additions Deductions June 30, 2018
Community Facilities District No. 2008-01
Assets:
Cash and investments -$ 220,816$ -$ 220,816$
Restricted cash and investments 31,093,799 9,099,954 15,603,745 24,590,008
Total assets 31,093,799$ 9,320,770$ 15,603,745$ 24,810,824$
Liabilities:
Due to bondholders 31,093,799$ 9,320,770$ 15,603,745$ 24,810,824$
Total liabilities 31,093,799$ 9,320,770$ 15,603,745$ 24,810,824$
170

171

City of San MateoGeneral Capital Projects FundSchedule of Assessments and Impact Fees and Related ExpendituresFor the year ended June 30, 2018
South
Bayfront Parks and
Levee Recreation South Child Care
Improvement Tax and Traffic Trunk Sewer Development Tree
Project In-Lieu Fee Impact Fee Impact Fee Impact Fee Impact Fee
REVENUES:
Assessments 538,343$ 468,981$ 2,641,115$ 669,083$ 789,280$ 199,680$
Interest income 5,702 70,741 31,575 44,490 25,217 8,663
Total revenues 544,045 539,722 2,672,690 713,573 814,497 208,343
EXPENDITURES:
Capital outlay 10,667 833,160 1,395,640 72,276 - 199,251
Debt service 499,195 - - - - -
Total expenditures 509,862 833,160 1,395,640 72,276 - 199,251
BALANCES:
Beginning of year 1,833,449 7,559,667 2,019,675 2,361,679 1,146,345 530,797
End of year 1,867,632$ 7,266,229$ 3,296,725$ 3,002,976$ 1,960,842$ 539,889$
172
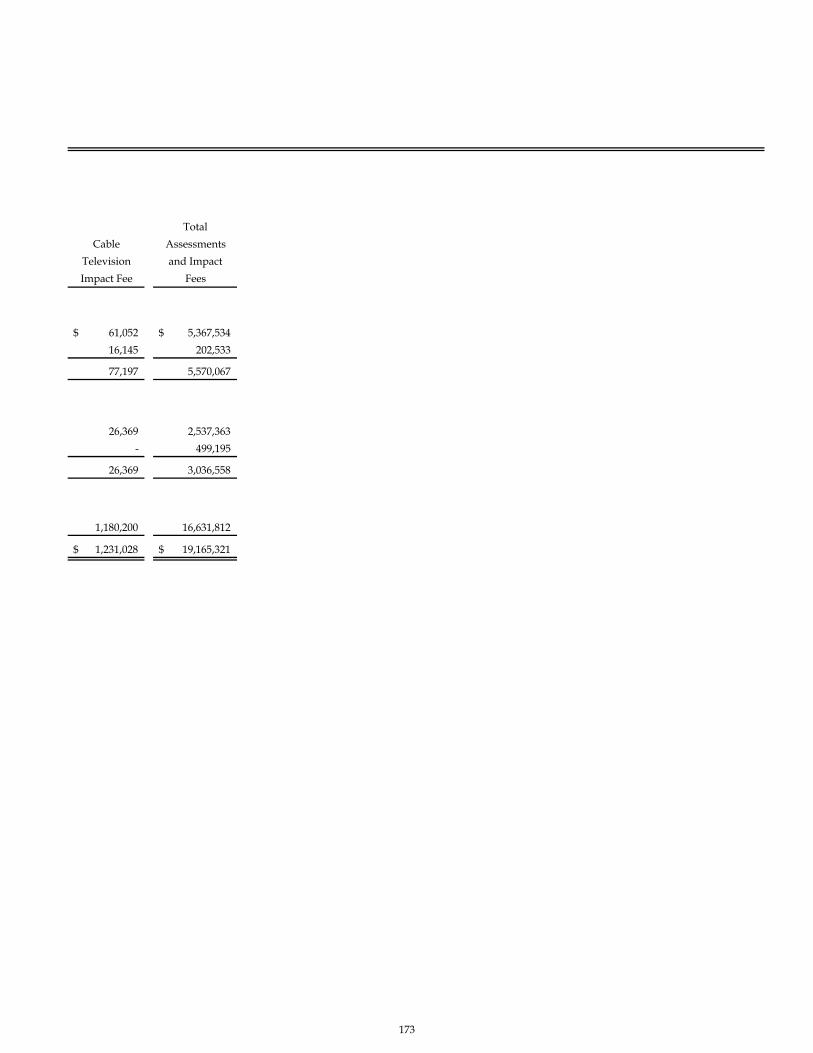
Total
Cable Assessments
Television and Impact
Impact Fee Fees
61,052$ 5,367,534$
16,145 202,533
77,197 5,570,067
26,369 2,537,363
- 499,195
26,369 3,036,558
1,180,200 16,631,812
1,231,028$ 19,165,321$
173

174

STATISTICAL SECTION (Unaudited)
This part of the City of San Mateo’s comprehensive annual financial report presents detailed information as a context for understanding what the information in the financial statements, note disclosures, and required supplementary information says about the City’s overall financial condition.
Contents
Financial TrendsThese schedules contain trend information to help the reader understand how the City’s
Revenue Capacity
Debt Capacity
Demographic and Economic Information
Operating Information
Page
176
178
193
199
202
175
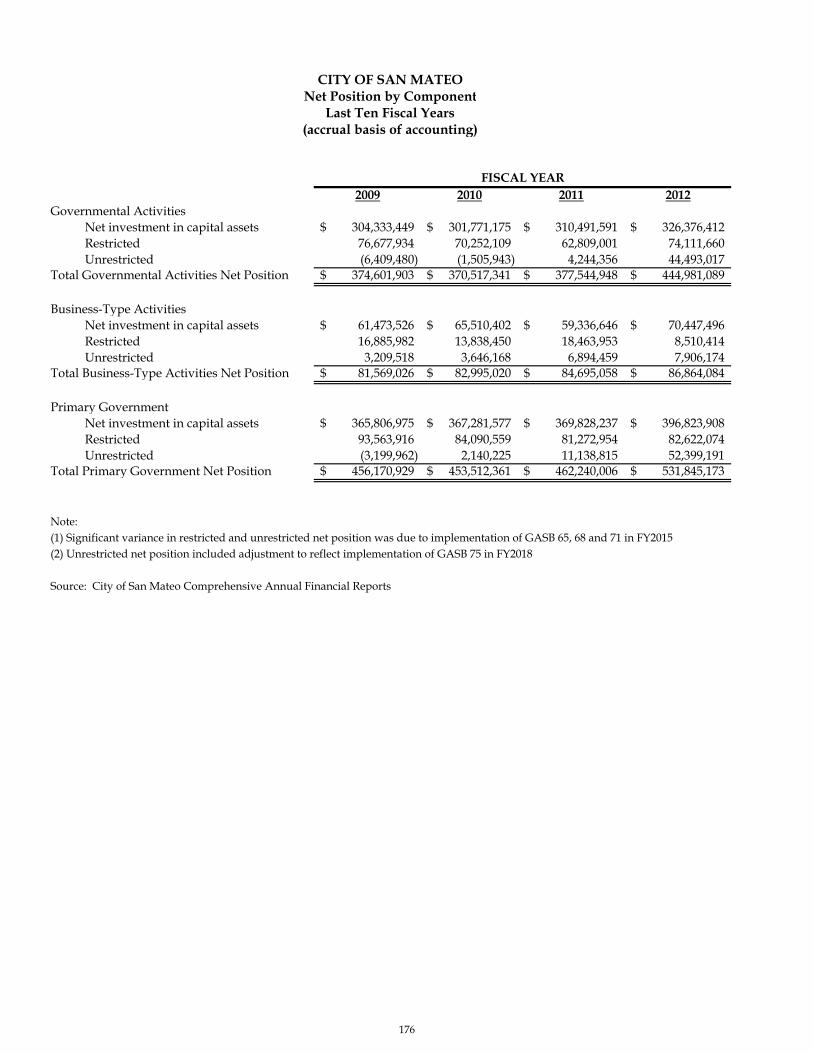
2009 2010 2011 2012Governmental Activities
Net investment in capital assets 304,333,449$ 301,771,175$ 310,491,591$ 326,376,412$ Restricted 76,677,934 70,252,109 62,809,001 74,111,660 Unrestricted (6,409,480) (1,505,943) 4,244,356 44,493,017
Total Governmental Activities Net Position 374,601,903$ 370,517,341$ 377,544,948$ 444,981,089$
Business-Type ActivitiesNet investment in capital assets 61,473,526$ 65,510,402$ 59,336,646$ 70,447,496$ Restricted 16,885,982 13,838,450 18,463,953 8,510,414 Unrestricted 3,209,518 3,646,168 6,894,459 7,906,174
Total Business-Type Activities Net Position 81,569,026$ 82,995,020$ 84,695,058$ 86,864,084$
Primary GovernmentNet investment in capital assets 365,806,975$ 367,281,577$ 369,828,237$ 396,823,908$ Restricted 93,563,916 84,090,559 81,272,954 82,622,074 Unrestricted (3,199,962) 2,140,225 11,138,815 52,399,191
Total Primary Government Net Position 456,170,929$ 453,512,361$ 462,240,006$ 531,845,173$
Note:(1) Significant variance in restricted and unrestricted net position was due to implementation of GASB 65, 68 and 71 in FY2015(2) Unrestricted net position included adjustment to reflect implementation of GASB 75 in FY2018
Source: City of San Mateo Comprehensive Annual Financial Reports
CITY OF SAN MATEONet Position by Component
Last Ten Fiscal Years(accrual basis of accounting)
FISCAL YEAR
176

2013 2014 2015 2016 2017 2018
333,716,045$ 338,446,921$ 338,597,493$ 348,551,145$ 361,295,211$ 373,263,037$ 80,544,476 82,599,049 35,940,430 42,628,946 43,004,559 56,180,410 64,260,546 83,713,423 (56,568,094) (25,485,083) (16,647,454) (27,694,719)
478,521,067$ 504,759,393$ 317,969,829$ 365,695,008$ 387,652,316$ 401,748,728$
70,235,094$ 76,417,915$ 78,438,576$ 83,893,024$ 112,410,305$ 136,901,535$ 9,139,202 5,982,278 11,056,422 9,457,948 17,976,147 3,019,163
13,889,683 17,701,761 10,218,009 20,791,916 (7,096,918) (2,674,687) 93,263,979$ 100,101,954$ 99,713,007$ 114,142,888$ 123,289,534$ 137,246,011$
403,951,139$ 414,864,836$ 417,036,069$ 432,444,169$ 473,705,516$ 510,164,572$ 89,683,678 88,581,327 46,996,852 52,086,894 60,980,706 59,199,573 78,150,229 101,415,184 (46,350,085) (4,693,167) (23,744,372) (30,369,406)
571,785,046$ 604,861,347$ 417,682,836$ 479,837,896$ 510,941,850$ 538,994,739$
FISCAL YEAR
CITY OF SAN MATEONet Position by Component
Last Ten Fiscal Years(accrual basis of accounting)
(1) (2)
177
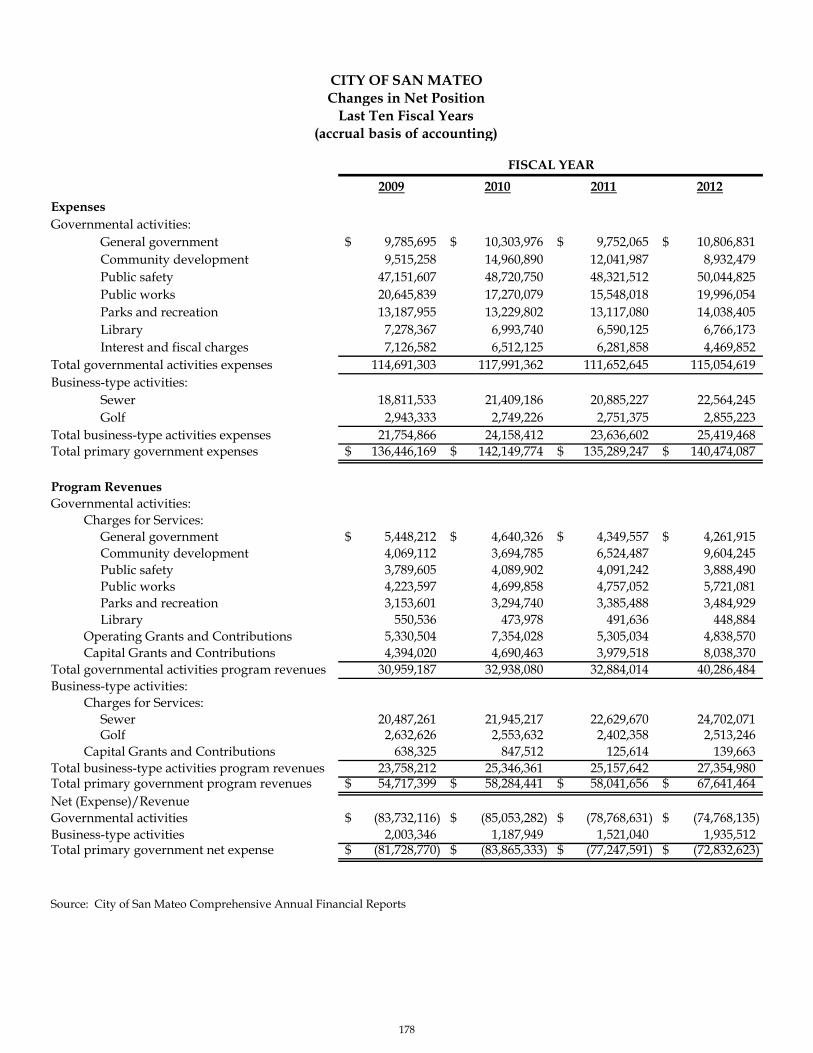
2009 2010 2011 2012
ExpensesGovernmental activities:
General government 9,785,695$ 10,303,976$ 9,752,065$ 10,806,831$ Community development 9,515,258 14,960,890 12,041,987 8,932,479 Public safety 47,151,607 48,720,750 48,321,512 50,044,825 Public works 20,645,839 17,270,079 15,548,018 19,996,054 Parks and recreation 13,187,955 13,229,802 13,117,080 14,038,405 Library 7,278,367 6,993,740 6,590,125 6,766,173 Interest and fiscal charges 7,126,582 6,512,125 6,281,858 4,469,852
Total governmental activities expenses 114,691,303 117,991,362 111,652,645 115,054,619 Business-type activities:
Sewer 18,811,533 21,409,186 20,885,227 22,564,245 Golf 2,943,333 2,749,226 2,751,375 2,855,223
Total business-type activities expenses 21,754,866 24,158,412 23,636,602 25,419,468 Total primary government expenses 136,446,169$ 142,149,774$ 135,289,247$ 140,474,087$
Program RevenuesGovernmental activities:
Charges for Services:General government 5,448,212$ 4,640,326$ 4,349,557$ 4,261,915$ Community development 4,069,112 3,694,785 6,524,487 9,604,245 Public safety 3,789,605 4,089,902 4,091,242 3,888,490 Public works 4,223,597 4,699,858 4,757,052 5,721,081 Parks and recreation 3,153,601 3,294,740 3,385,488 3,484,929 Library 550,536 473,978 491,636 448,884
Operating Grants and Contributions 5,330,504 7,354,028 5,305,034 4,838,570 Capital Grants and Contributions 4,394,020 4,690,463 3,979,518 8,038,370
Total governmental activities program revenues 30,959,187 32,938,080 32,884,014 40,286,484 Business-type activities:
Charges for Services:Sewer 20,487,261 21,945,217 22,629,670 24,702,071 Golf 2,632,626 2,553,632 2,402,358 2,513,246
Capital Grants and Contributions 638,325 847,512 125,614 139,663 Total business-type activities program revenues 23,758,212 25,346,361 25,157,642 27,354,980 Total primary government program revenues 54,717,399$ 58,284,441$ 58,041,656$ 67,641,464$ Net (Expense)/RevenueGovernmental activities (83,732,116)$ (85,053,282)$ (78,768,631)$ (74,768,135)$ Business-type activities 2,003,346 1,187,949 1,521,040 1,935,512 Total primary government net expense (81,728,770)$ (83,865,333)$ (77,247,591)$ (72,832,623)$
Source: City of San Mateo Comprehensive Annual Financial Reports
FISCAL YEAR
CITY OF SAN MATEOChanges in Net Position
Last Ten Fiscal Years(accrual basis of accounting)
178

2013 2014 2015 2016 2017 2018
10,130,843$ 11,250,111$ 13,531,819$ 13,408,222$ 15,288,834$ 16,253,149$ 5,365,548 6,219,895 11,520,058 8,615,056 9,218,215 8,968,176
50,037,399 52,241,250 54,499,943 56,518,491 66,098,015 78,040,802 16,749,537 18,936,651 17,572,481 19,194,348 19,454,397 22,900,784 13,737,283 14,485,575 14,604,719 14,715,076 17,688,663 17,723,370
6,464,282 6,963,743 7,456,042 7,481,649 8,640,943 8,409,588 2,105,784 1,712,704 1,687,938 1,563,149 1,603,120 1,282,632
104,590,676 111,809,929 120,873,000 121,495,991 137,992,187 153,578,501
23,210,165 22,208,673 25,394,787 29,446,279 27,650,895 28,541,139 2,512,817 2,719,709 2,599,156 2,925,638 2,699,895 3,119,828
25,722,982 24,928,382 27,993,943 32,371,917 30,350,790 31,660,967 130,313,658$ 136,738,311$ 148,866,943$ 153,867,908$ 168,342,977$ 185,239,468$
4,005,058$ 3,796,035$ 7,746,426$ 8,864,516$ 4,460,496$ 4,761,038$ 9,332,116 10,824,597 11,841,340 13,040,363 15,504,626 18,647,276 4,528,802 5,032,066 4,748,609 4,963,005 5,460,041 5,859,462 5,604,208 5,798,006 3,380,143 3,204,712 7,078,959 8,816,371 3,729,797 3,640,528 3,917,392 4,026,981 5,733,587 4,416,286
379,807 396,619 366,424 376,099 384,442 425,676 5,712,470 4,621,620 4,659,218 4,920,003 4,855,791 6,527,822
22,068,697 12,304,741 5,932,115 17,519,113 7,404,767 12,254,621 55,360,955 46,414,212 42,591,667 56,914,792 50,882,709 61,708,552
28,712,336 28,381,469 32,202,568 31,349,390 31,790,037 41,737,548 2,450,940 2,470,030 2,179,638 2,259,273 2,155,822 2,361,164
897,868 1,269,568 1,418,940 9,648,484 4,559,627 2,628,892 32,061,144 32,121,067 35,801,146 43,257,147 38,505,486 46,727,604 87,422,099$ 78,535,279$ 78,392,813$ 100,171,939$ 89,388,195$ 108,436,156$
(49,229,721)$ (65,395,717)$ (78,281,333)$ (64,581,199)$ (87,109,478)$ (91,869,949)$ 6,338,162 7,192,685 7,807,203 10,885,230 8,154,696 15,066,637
(42,891,559)$ (58,203,032)$ (70,474,130)$ (53,695,969)$ (78,954,782)$ (76,803,312)$
FISCAL YEAR
CITY OF SAN MATEOChanges in Net Position
Last Ten Fiscal Years(accrual basis of accounting)
179
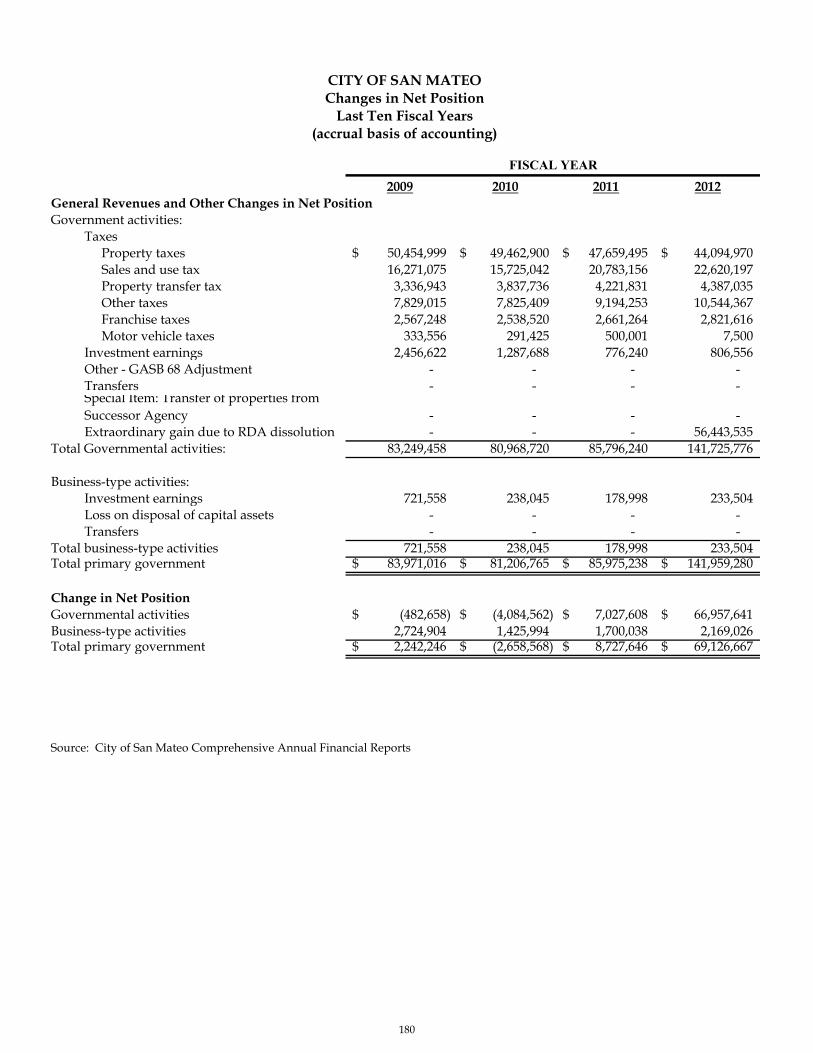
2009 2010 2011 2012General Revenues and Other Changes in Net PositionGovernment activities:
TaxesProperty taxes 50,454,999$ 49,462,900$ 47,659,495$ 44,094,970$ Sales and use tax 16,271,075 15,725,042 20,783,156 22,620,197 Property transfer tax 3,336,943 3,837,736 4,221,831 4,387,035 Other taxes 7,829,015 7,825,409 9,194,253 10,544,367 Franchise taxes 2,567,248 2,538,520 2,661,264 2,821,616 Motor vehicle taxes 333,556 291,425 500,001 7,500
Investment earnings 2,456,622 1,287,688 776,240 806,556 Other - GASB 68 Adjustment - - - - Transfers - - - -
- - - - Extraordinary gain due to RDA dissolution - - - 56,443,535
Total Governmental activities: 83,249,458 80,968,720 85,796,240 141,725,776
Business-type activities:Investment earnings 721,558 238,045 178,998 233,504 Loss on disposal of capital assets - - - - Transfers - - - -
Total business-type activities 721,558 238,045 178,998 233,504 Total primary government 83,971,016$ 81,206,765$ 85,975,238$ 141,959,280$
Change in Net PositionGovernmental activities (482,658)$ (4,084,562)$ 7,027,608$ 66,957,641$ Business-type activities 2,724,904 1,425,994 1,700,038 2,169,026 Total primary government 2,242,246$ (2,658,568)$ 8,727,646$ 69,126,667$
Source: City of San Mateo Comprehensive Annual Financial Reports
Special Item: Transfer of properties from Successor Agency
FISCAL YEAR
CITY OF SAN MATEOChanges in Net Position
Last Ten Fiscal Years(accrual basis of accounting)
180

2013 2014 2015 2016 2017 2018
38,179,530$ 42,485,569$ 45,514,243$ 49,821,722$ 52,989,559$ 58,137,331$ 23,822,654 23,621,580 26,406,209 27,458,762 26,001,431 26,313,958
6,307,133 9,476,087 10,636,846 9,894,291 12,179,016 11,778,074 11,519,884 12,582,033 13,764,540 14,503,661 14,536,828 14,777,396
2,858,607 2,967,823 3,049,847 3,143,082 3,142,369 3,208,096 57,889 68,688 61,024 416,222 55,990 64,442 24,002 1,430,926 1,167,612 2,469,425 978,899 1,521,257
- - - 344,425 32,694 66,005 - - (2,501,852) (3,020,196) (850,000) (525,000)
- - - 7,274,984 - - - - - - - -
82,769,699 92,632,706 98,098,469 112,306,378 109,066,786 115,341,559
68,856 324,021 250,398 524,455 141,950 189,713 (7,123) - - - - -
- - 2,501,852 3,020,196 850,000 525,000 61,733 324,021 2,752,250 3,544,651 991,950 714,713
82,831,432$ 92,956,727$ 100,850,719$ 115,851,029$ 110,058,736$ 116,056,272$
33,539,978$ 26,936,988$ 19,817,136$ 47,725,179$ 21,957,308$ 23,471,610$ 6,399,895 7,516,706 10,559,453 14,429,881 9,146,646 15,781,350
39,939,873$ 34,453,694$ 30,376,589$ 62,155,060$ 31,103,954$ 39,252,960$
CITY OF SAN MATEOChanges in Net Position
Last Ten Fiscal Years(accrual basis of accounting)
FISCAL YEAR
181
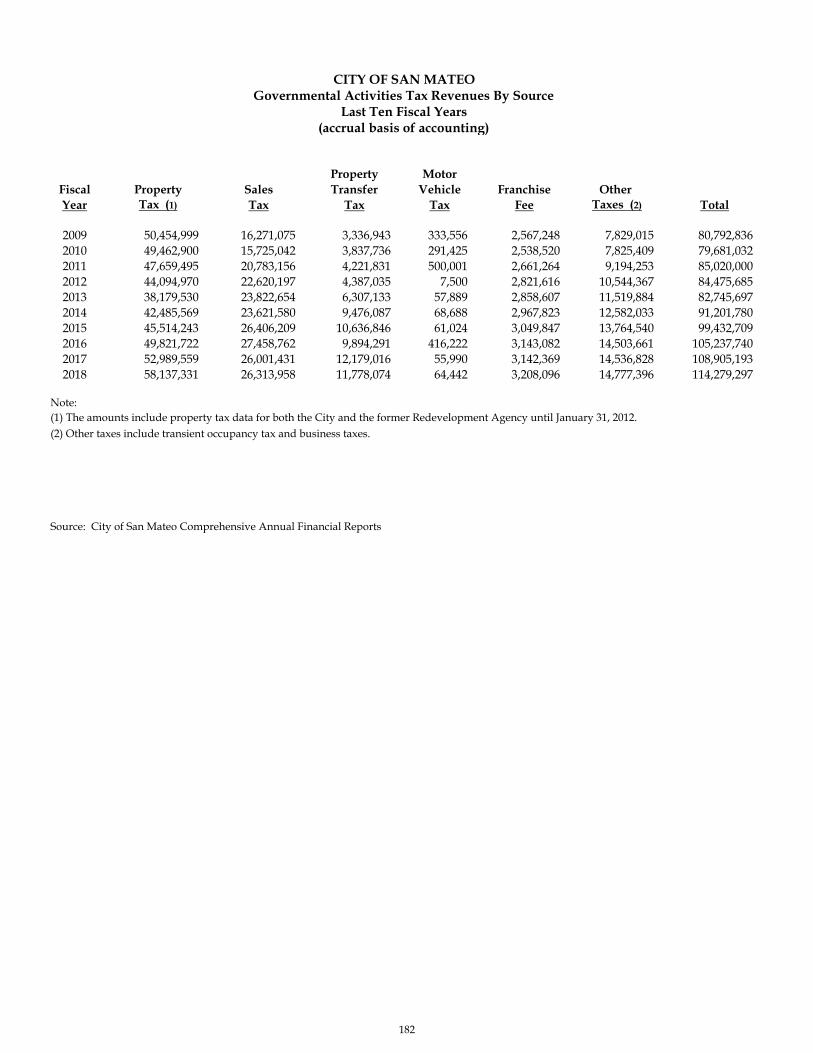
Property MotorFiscal Property Sales Transfer Vehicle Franchise Other Year Tax (1) Tax Tax Tax Fee Taxes (2) Total
2009 50,454,999 16,271,075 3,336,943 333,556 2,567,248 7,829,015 80,792,836 2010 49,462,900 15,725,042 3,837,736 291,425 2,538,520 7,825,409 79,681,032 2011 47,659,495 20,783,156 4,221,831 500,001 2,661,264 9,194,253 85,020,000 2012 44,094,970 22,620,197 4,387,035 7,500 2,821,616 10,544,367 84,475,685 2013 38,179,530 23,822,654 6,307,133 57,889 2,858,607 11,519,884 82,745,697 2014 42,485,569 23,621,580 9,476,087 68,688 2,967,823 12,582,033 91,201,780 2015 45,514,243 26,406,209 10,636,846 61,024 3,049,847 13,764,540 99,432,709 2016 49,821,722 27,458,762 9,894,291 416,222 3,143,082 14,503,661 105,237,740 2017 52,989,559 26,001,431 12,179,016 55,990 3,142,369 14,536,828 108,905,193 2018 58,137,331 26,313,958 11,778,074 64,442 3,208,096 14,777,396 114,279,297
Note:(1) The amounts include property tax data for both the City and the former Redevelopment Agency until January 31, 2012.(2) Other taxes include transient occupancy tax and business taxes.
Source: City of San Mateo Comprehensive Annual Financial Reports
(accrual basis of accounting)Last Ten Fiscal Years
Governmental Activities Tax Revenues By SourceCITY OF SAN MATEO
182

183
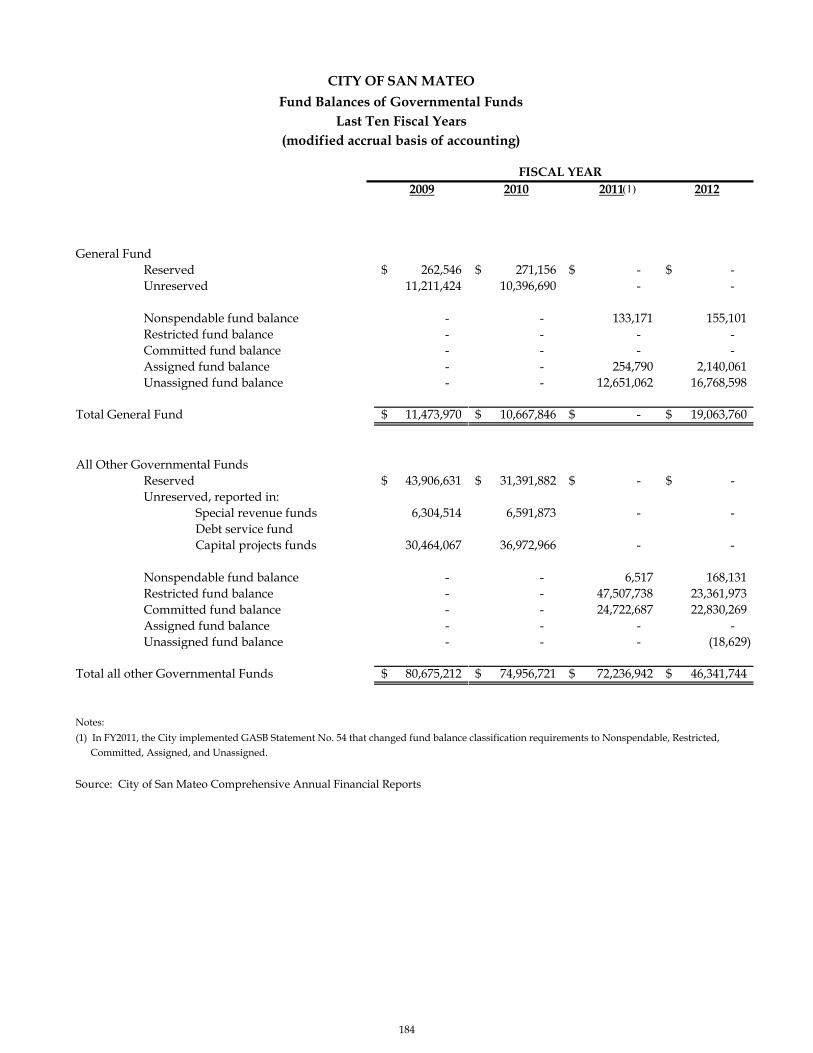
2009 2010 2011 2012
General Fund Reserved 262,546$ 271,156$ -$ -$
Unreserved 11,211,424 10,396,690 - -
Nonspendable fund balance - - 133,171 155,101 Restricted fund balance - - - - Committed fund balance - - - - Assigned fund balance - - 254,790 2,140,061 Unassigned fund balance - - 12,651,062 16,768,598
Total General Fund 11,473,970$ 10,667,846$ -$ 19,063,760$
All Other Governmental FundsReserved 43,906,631$ 31,391,882$ -$ -$ Unreserved, reported in:
Special revenue funds 6,304,514 6,591,873 - - Debt service fundCapital projects funds 30,464,067 36,972,966 - -
Nonspendable fund balance - - 6,517 168,131 Restricted fund balance - - 47,507,738 23,361,973 Committed fund balance - - 24,722,687 22,830,269 Assigned fund balance - - - - Unassigned fund balance - - - (18,629)
Total all other Governmental Funds 80,675,212$ 74,956,721$ 72,236,942$ 46,341,744$
(1) In FY2011, the City implemented GASB Statement No. 54 that changed fund balance classification requirements to Nonspendable, Restricted, Committed, Assigned, and Unassigned.
Source: City of San Mateo Comprehensive Annual Financial Reports
Notes:
FISCAL YEAR
CITY OF SAN MATEO
Fund Balances of Governmental FundsLast Ten Fiscal Years
(modified accrual basis of accounting)
(1)
184

2013 2014 2015 2016 2017 2018
-$ -$ -$ -$ -$ -$ - - - - - -
137,314 165,313 133,030 93,968 146,668 1,365,781 - - - - - - - - - - - 1,310,590
1,521,652 1,849,458 696,064 653,902 1,151,152 983,063 23,797,373 34,083,800 46,814,928 57,850,140 65,807,692 71,844,796
25,456,339$ 36,098,571$ 47,644,022$ 58,598,010$ 67,105,512$ 75,504,230$
-$ -$ -$ -$ -$ -$
- - - - - -
- - - - - -
- - - - - 4,206 30,314,487 32,452,933 36,477,074 42,628,946 42,468,316 54,997,971 32,304,156 41,759,610 51,111,814 63,490,793 66,261,696 66,085,830
- - - - - - - (3,999) - - - -
62,618,643$ 74,208,544$ 87,588,888$ 106,119,739$ 108,730,012$ 121,088,007$
FISCAL YEAR
(modified accrual basis of accounting)Last Ten Fiscal Years
Fund Balances of Governmental FundsCITY OF SAN MATEO
185

2009 2010 2011 2012
Revenues:
Property taxes 50,454,992$ 49,770,136$ 47,659,494$ 44,094,971$
Sales taxes 16,387,270 15,725,043 20,783,155 22,620,197
Other taxes 11,165,959 11,663,147 13,416,084 17,753,018
Licenses, building and other permits 6,258,740 6,198,138 7,064,740 5,563,732
Fines, forfeitures and Penalties 1,919,311 1,891,683 1,671,540 1,644,699
Intergovernmental Revenues 7,181,274 11,114,908 9,140,309 11,155,347
Charges for services 4,857,710 4,936,027 5,374,244 9,835,848
Investment Earnings 2,303,431 1,059,564 662,105 671,674
Indirect and in-lieu fees 1,969,765 2,045,449 2,005,949 -
Assessment and Garbage collection surcharge 1,130,724 1,872,880 2,418,852 5,202,065
Parking meter and lease revenue 1,747,843 1,844,491 2,029,159 2,215,812
Impact fees 2,101,738 1,043,248 590,889 949,863
Capital contributions - - - -
Other Revenues 5,601,364 4,757,180 4,590,352 3,124,839
Total Revenues 113,080,121 113,921,894 117,406,872 124,832,065
Expenditures:
General Government 9,354,758 9,185,947 8,200,787 8,693,749
Community development 9,428,805 13,390,381 8,650,128 6,648,962
Public Safety 46,863,256 46,232,348 47,417,641 48,797,774
Public Works 6,779,372 6,621,018 7,536,796 9,095,961
Parks and recreation 11,867,994 11,348,177 11,868,145 11,622,101
Library 5,498,992 5,093,473 4,847,027 5,007,303
Non-departmental - - 3,110,311 780,000
Capital Outlay 32,931,787 18,352,876 17,476,298 18,528,824
Debt Service
Principal 2,695,000 4,425,000 5,815,000 4,290,000
Interest & Fiscal Charges 6,943,120 6,297,289 6,224,181 5,912,898
Cost of issuance - - - -
Total Expenditures 132,363,084 120,946,509 121,146,314 119,377,572
Excess of Revenues
over (under) expenditures (19,282,963) (7,024,615) (3,739,442) 5,454,493
Other Financing Sources (Uses)
Proceeds from debt issuance - - - -
Premium - - - -
Debt refunding - payment to escrow - - - -
Proceeds from Loans 495,967 - - -
Transfers in 11,431,950 8,905,653 7,758,324 15,054,919
Transfers Out (10,881,950) (8,405,653) (9,844,324) (15,596,599)
Issuance of debt - - 5,630,686 -
Cost of issue - - (153,846) -
Total other financing sources (uses) 1,045,967 500,000 3,390,840 (541,680)
Extraordinary Items
Extraordinary Gain (loss) on dissolution of RDA - - - (25,261,774)
Net change in fund balances (18,236,996)$ (6,524,615)$ (348,602)$ (20,348,961)$
Debt Service as a percentage of noncapital expenditures (1) 10.12% 10.75% 13.14% 10.68%
Note:
(1) Former Redevelopment Agency Bonds were excluded in fiscal year 2012 and subsequent fiscal years.
Source: City of San Mateo Comprehensive Annual Financial Reports
CITY OF SAN MATEOChanges in Fund Balances of Governmental Funds
Last Ten Fiscal Years(modified accrual basis of accounting)
FISCAL YEAR
186

2013 2014 2015 2016 2017 2018
38,179,530$ 42,485,569$ 45,514,243$ 49,821,722$ 52,989,555$ 58,137,331$
23,822,654 23,621,580 26,406,209 27,458,762 26,001,428 26,313,958
20,736,014 25,084,632 27,492,257 27,947,256 29,904,204 29,818,008
8,814,956 10,208,410 10,993,854 12,481,519 13,986,765 16,829,698
1,990,067 1,828,124 1,797,820 1,608,517 2,347,508 1,983,069
9,812,480 10,422,872 9,000,823 10,139,448 10,514,086 10,081,168
9,199,159 9,426,652 9,822,219 11,642,713 10,994,505 11,865,030
46,163 1,121,679 939,463 2,016,000 436,583 1,274,997
- - - - - -
6,816,900 4,586,404 3,128,070 8,000,287 2,405,534 2,591,689
2,338,849 2,653,178 2,722,471 2,881,193 3,113,739 5,334,641
2,289,600 2,552,388 3,260,222 4,274,248 3,747,065 4,021,226
- - - - - 375,000
2,634,474 2,692,908 2,402,206 3,438,927 3,751,388 3,851,650
126,680,846 136,684,396 143,479,857 161,710,592 160,192,360 172,477,465
9,136,330 9,947,383 12,563,127 13,389,976 11,823,438 12,631,562
5,177,198 6,226,200 7,304,546 7,283,445 8,382,090 8,968,166
48,458,630 49,554,095 53,016,349 58,605,898 63,623,621 68,708,919
7,699,391 7,102,703 6,103,576 7,128,676 8,585,107 10,030,818
12,178,049 12,298,322 12,759,601 13,190,936 14,666,422 14,967,718
4,798,978 5,160,200 5,744,931 6,099,700 6,499,489 6,721,084
1,280,000 1,280,000 1,280,000 1,250,000 2,891,155 3,001,379
11,104,728 19,524,506 18,045,935 20,745,215 28,829,906 18,367,591
1,520,000 1,610,000 1,802,440 1,939,637 2,019,637 7,842,077
2,452,907 1,661,805 1,761,775 1,656,297 1,702,963 1,705,078
314,224 - - - -
104,120,435 114,365,214 120,382,280 131,289,780 149,023,828 152,944,392
22,560,411 22,319,182 23,097,577 30,420,812 11,168,532 19,533,073
27,295,000 - - - - -
2,683,949 - - - - -
(29,581,180) - - - - -
- - 265,820 14,027 746,896 2,157,843
9,468,607 12,623,834 11,402,970 13,083,222 14,117,848 20,890,354
(9,757,309) (12,706,883) (13,729,596) (14,033,222) (14,915,501) (21,824,557)
- - - - - -
- - - - - -
109,067 (83,049) (2,060,806) (935,973) (50,757) 1,223,640
- - - - - -
22,669,478$ 22,236,133$ 21,036,771$ 29,484,839$ 11,117,775$ 20,756,713$
4.39% 3.46% 3.54% 3.21% 3.11% 7.40%
FISCAL YEAR
(modified accrual basis of accounting)Last Ten Fiscal Years
Changes in Fund Balances of Governmental FundsCITY OF SAN MATEO
187

Fiscal Year End
Residential Property
Commercial Property
Industrial Property
Other Property (1)
Unsecured Property
Less Tax-Exempt Property
Taxable Assessed
Value
Total Direct
Tax Rate (2)
Estimated Actual Value (3)
Factor of Taxable
Assessed Value (3)
2009 13,005,898 2,948,484 167,547 448,941 560,541 447,617 16,683,794 0.18% 22,513,112 1.3494
2010 12,894,324 2,879,860 171,214 523,642 569,599 458,346 16,580,293 0.18% 16,683,505 1.0062
2011 12,830,764 2,621,910 172,139 485,004 628,718 472,874 16,265,661 0.18% 16,436,938 1.0105
2012 12,976,523 2,696,014 174,929 460,901 640,569 517,189 16,431,747 0.18% 20,095,665 1.2230
2013 13,313,456 2,872,202 170,041 410,573 615,933 522,010 16,860,195 0.18% 24,094,905 1.4291
2014 14,242,602 3,067,403 178,139 432,072 630,440 510,141 18,040,515 0.18% 28,743,512 1.5933
2015 15,233,601 3,228,752 199,821 291,470 724,375 309,015 19,369,004 0.18% 32,278,244 1.6665
2016 16,649,492 3,454,897 176,544 324,490 760,591 348,736 21,017,279 0.18% 40,006,118 1.9035
2017 17,909,339 3,823,284 180,072 574,686 738,320 591,188 22,634,512 0.18% 44,026,273 1.9451
2018 19,417,451 4,213,927 187,130 598,899 710,584 587,446 24,540,546 0.18% 48,683,633 1.9838
(2) Total direct tax rate is the city share of the 1% Proposition 13 tax only for TRA 12-001. Rates are not adjusted for ERAF.
Source: San Mateo County Assessor data, MuniServices, LLC.
CITY OF SAN MATEO
Last Ten Fiscal Years (amount expressed in thousands)
Assessed Value and Estimated Actual Value of Taxable Property
Notes:
(3) Estimated Actual Value is derived from a series of calculations comparing median assessed values from 1940 to current median sale prices. Based on these calculations a multiplier value was extrapolated and applied to current assessed values.
(1) Other property includes state unitary value.
188
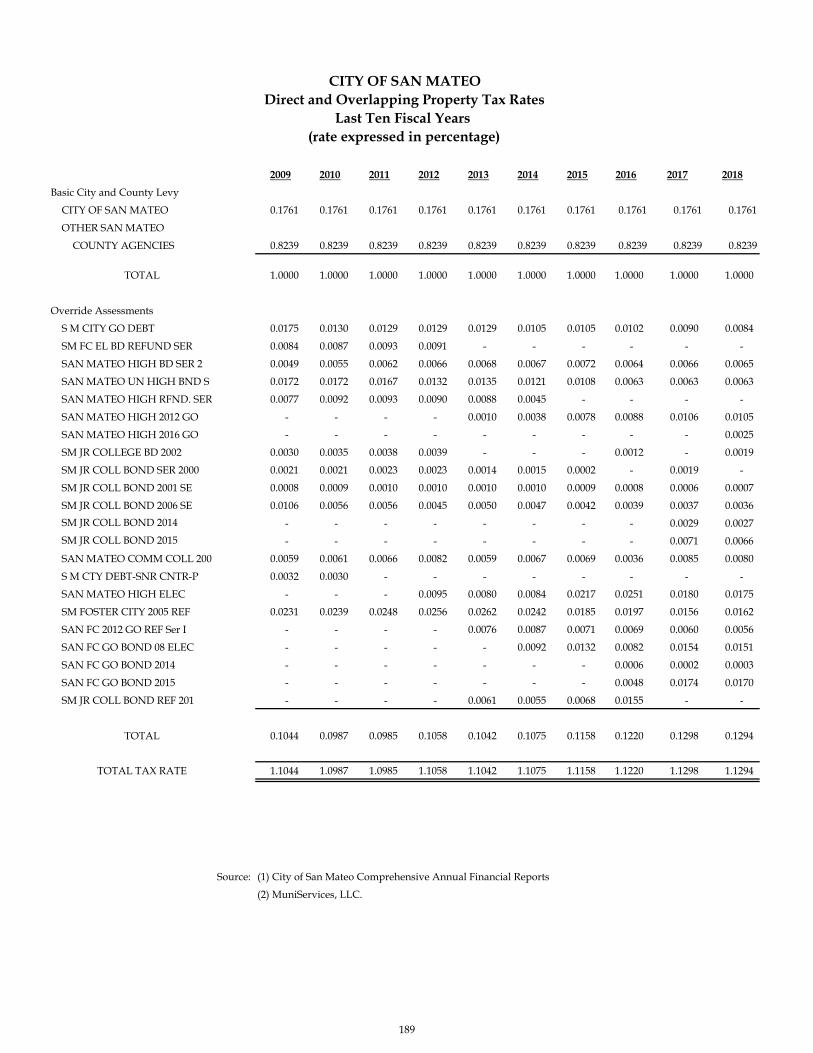
2009 2010 2011 2012 2013 2014 2015 2016 2017 2018
Basic City and County Levy
CITY OF SAN MATEO 0.1761 0.1761 0.1761 0.1761 0.1761 0.1761 0.1761 0.1761 0.1761 0.1761
OTHER SAN MATEO
COUNTY AGENCIES 0.8239 0.8239 0.8239 0.8239 0.8239 0.8239 0.8239 0.8239 0.8239 0.8239
TOTAL 1.0000 1.0000 1.0000 1.0000 1.0000 1.0000 1.0000 1.0000 1.0000 1.0000
Override Assessments
S M CITY GO DEBT 0.0175 0.0130 0.0129 0.0129 0.0129 0.0105 0.0105 0.0102 0.0090 0.0084
SM FC EL BD REFUND SER 0.0084 0.0087 0.0093 0.0091 - - - - - -
SAN MATEO HIGH BD SER 2 0.0049 0.0055 0.0062 0.0066 0.0068 0.0067 0.0072 0.0064 0.0066 0.0065
SAN MATEO UN HIGH BND S 0.0172 0.0172 0.0167 0.0132 0.0135 0.0121 0.0108 0.0063 0.0063 0.0063
SAN MATEO HIGH RFND. SER 0.0077 0.0092 0.0093 0.0090 0.0088 0.0045 - - - -
SAN MATEO HIGH 2012 GO - - - - 0.0010 0.0038 0.0078 0.0088 0.0106 0.0105
SAN MATEO HIGH 2016 GO - - - - - - - - - 0.0025
SM JR COLLEGE BD 2002 0.0030 0.0035 0.0038 0.0039 - - - 0.0012 - 0.0019
SM JR COLL BOND SER 2000 0.0021 0.0021 0.0023 0.0023 0.0014 0.0015 0.0002 - 0.0019 -
SM JR COLL BOND 2001 SE 0.0008 0.0009 0.0010 0.0010 0.0010 0.0010 0.0009 0.0008 0.0006 0.0007
SM JR COLL BOND 2006 SE 0.0106 0.0056 0.0056 0.0045 0.0050 0.0047 0.0042 0.0039 0.0037 0.0036
SM JR COLL BOND 2014 - - - - - - - - 0.0029 0.0027
SM JR COLL BOND 2015 - - - - - - - - 0.0071 0.0066
SAN MATEO COMM COLL 200 0.0059 0.0061 0.0066 0.0082 0.0059 0.0067 0.0069 0.0036 0.0085 0.0080
S M CTY DEBT-SNR CNTR-P 0.0032 0.0030 - - - - - - - -
SAN MATEO HIGH ELEC - - - 0.0095 0.0080 0.0084 0.0217 0.0251 0.0180 0.0175
SM FOSTER CITY 2005 REF 0.0231 0.0239 0.0248 0.0256 0.0262 0.0242 0.0185 0.0197 0.0156 0.0162
SAN FC 2012 GO REF Ser I - - - - 0.0076 0.0087 0.0071 0.0069 0.0060 0.0056
SAN FC GO BOND 08 ELEC - - - - - 0.0092 0.0132 0.0082 0.0154 0.0151
SAN FC GO BOND 2014 - - - - - - - 0.0006 0.0002 0.0003
SAN FC GO BOND 2015 - - - - - - - 0.0048 0.0174 0.0170
SM JR COLL BOND REF 201 - - - - 0.0061 0.0055 0.0068 0.0155 - -
TOTAL 0.1044 0.0987 0.0985 0.1058 0.1042 0.1075 0.1158 0.1220 0.1298 0.1294
TOTAL TAX RATE 1.1044 1.0987 1.0985 1.1058 1.1042 1.1075 1.1158 1.1220 1.1298 1.1294
Source: (1) City of San Mateo Comprehensive Annual Financial Reports
(2) MuniServices, LLC.
CITY OF SAN MATEODirect and Overlapping Property Tax Rates
Last Ten Fiscal Years (rate expressed in percentage)
189
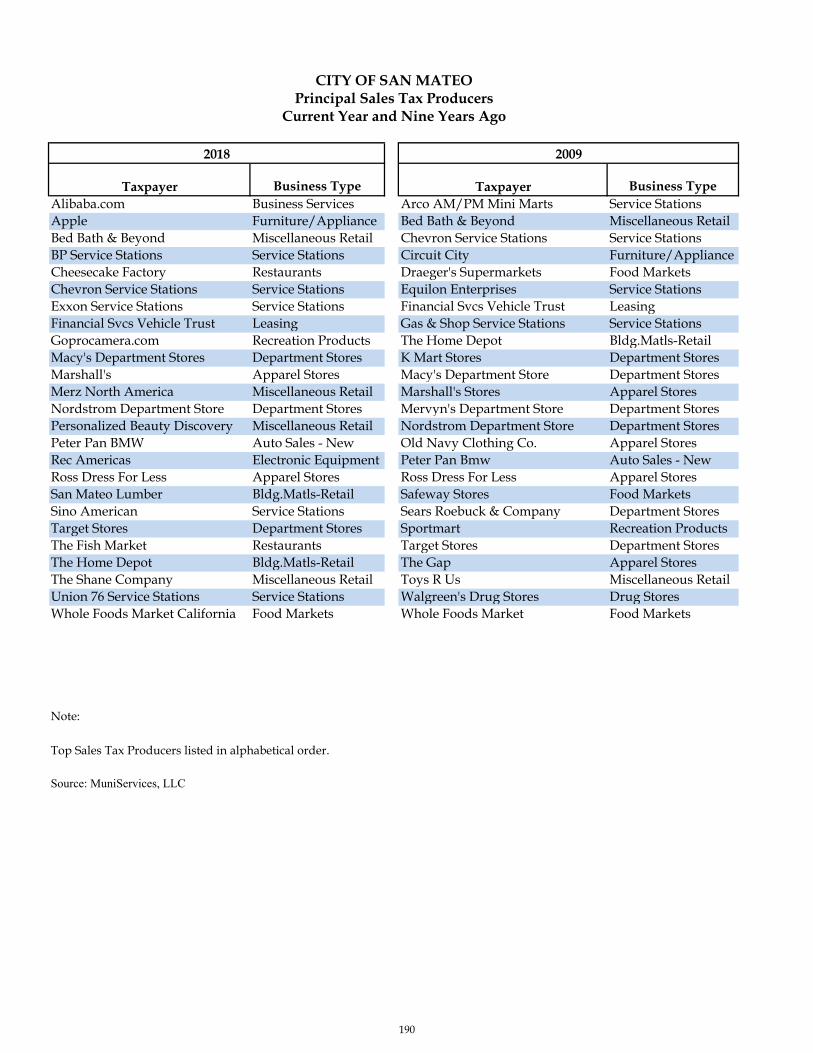
2018 2009
Taxpayer Business Type Taxpayer Business TypeAlibaba.com Business Services Arco AM/PM Mini Marts Service StationsApple Furniture/Appliance Bed Bath & Beyond Miscellaneous RetailBed Bath & Beyond Miscellaneous Retail Chevron Service Stations Service StationsBP Service Stations Service Stations Circuit City Furniture/ApplianceCheesecake Factory Restaurants Draeger's Supermarkets Food MarketsChevron Service Stations Service Stations Equilon Enterprises Service StationsExxon Service Stations Service Stations Financial Svcs Vehicle Trust LeasingFinancial Svcs Vehicle Trust Leasing Gas & Shop Service Stations Service StationsGoprocamera.com Recreation Products The Home Depot Bldg.Matls-RetailMacy's Department Stores Department Stores K Mart Stores Department StoresMarshall's Apparel Stores Macy's Department Store Department StoresMerz North America Miscellaneous Retail Marshall's Stores Apparel StoresNordstrom Department Store Department Stores Mervyn's Department Store Department StoresPersonalized Beauty Discovery Miscellaneous Retail Nordstrom Department Store Department StoresPeter Pan BMW Auto Sales - New Old Navy Clothing Co. Apparel StoresRec Americas Electronic Equipment Peter Pan Bmw Auto Sales - NewRoss Dress For Less Apparel Stores Ross Dress For Less Apparel StoresSan Mateo Lumber Bldg.Matls-Retail Safeway Stores Food MarketsSino American Service Stations Sears Roebuck & Company Department StoresTarget Stores Department Stores Sportmart Recreation ProductsThe Fish Market Restaurants Target Stores Department StoresThe Home Depot Bldg.Matls-Retail The Gap Apparel StoresThe Shane Company Miscellaneous Retail Toys R Us Miscellaneous RetailUnion 76 Service Stations Service Stations Walgreen's Drug Stores Drug StoresWhole Foods Market California Food Markets Whole Foods Market Food Markets
Note:
Top Sales Tax Producers listed in alphabetical order.
CITY OF SAN MATEOPrincipal Sales Tax Producers
Current Year and Nine Years Ago
Source: MuniServices, LLC
190
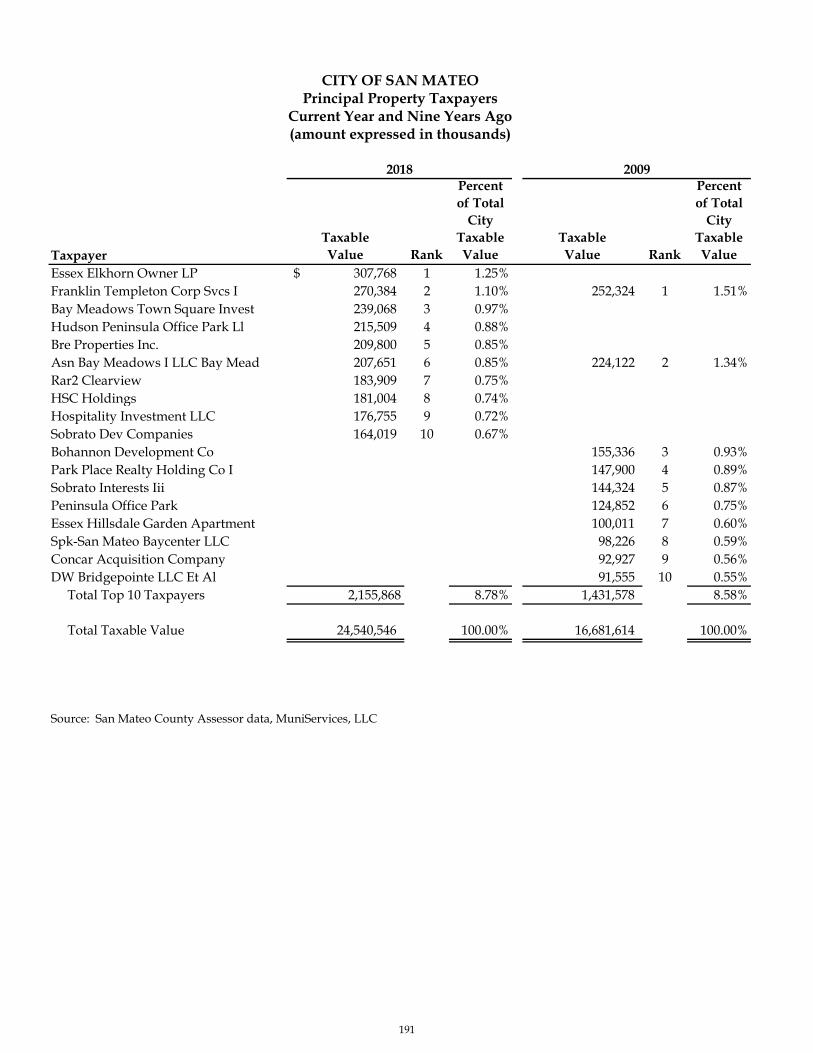
TaxpayerTaxableValue Rank
Percent of Total
City Taxable Value
TaxableValue Rank
Percent of Total
City Taxable Value
Essex Elkhorn Owner LP 307,768$ 1 1.25%Franklin Templeton Corp Svcs I 270,384 2 1.10% 252,324 1 1.51%Bay Meadows Town Square Invest 239,068 3 0.97%Hudson Peninsula Office Park Ll 215,509 4 0.88%Bre Properties Inc. 209,800 5 0.85%Asn Bay Meadows I LLC Bay Mead 207,651 6 0.85% 224,122 2 1.34%Rar2 Clearview 183,909 7 0.75%HSC Holdings 181,004 8 0.74%Hospitality Investment LLC 176,755 9 0.72%Sobrato Dev Companies 164,019 10 0.67%Bohannon Development Co 155,336 3 0.93%Park Place Realty Holding Co I 147,900 4 0.89%Sobrato Interests Iii 144,324 5 0.87%Peninsula Office Park 124,852 6 0.75%Essex Hillsdale Garden Apartment 100,011 7 0.60%Spk-San Mateo Baycenter LLC 98,226 8 0.59%Concar Acquisition Company 92,927 9 0.56%DW Bridgepointe LLC Et Al 91,555 10 0.55% Total Top 10 Taxpayers 2,155,868 8.78% 1,431,578 8.58%
Total Taxable Value 24,540,546 100.00% 16,681,614 100.00%
Source: San Mateo County Assessor data, MuniServices, LLC
2018 2009
CITY OF SAN MATEO
Current Year and Nine Years Ago(amount expressed in thousands)
Principal Property Taxpayers
191

FiscalYear Total Tax Delinquent
Ended Levied for Collected Percentage Tax Collected PercentageJune 30 Fiscal Year (1) Amount (2) of Levy Collections (3) Amount of Levy (4)
2009 50,028,000 50,028,000 100.00% n/a 50,028,000 100.00%2010 50,537,000 49,770,000 98.48% n/a 49,770,000 98.48%2011 48,616,000 47,659,000 98.03% n/a 47,659,000 98.03%2012 47,020,000 44,094,970 93.78% n/a 44,094,970 93.78%2013 38,200,000 38,179,530 99.95% n/a 38,179,530 99.95%2014 42,500,000 42,485,569 99.97% n/a 42,485,569 99.97%2015 45,515,000 45,514,243 100.00% n/a 45,514,243 100.00%2016 49,821,722 49,821,722 100.00% n/a 49,821,722 100.00%2017 52,989,556 52,989,556 100.00% n/a 52,989,556 100.00%2018 58,146,288 58,137,331 99.98% n/a 58,137,331 99.98%
Notes:(1) The data in this table includes the basic and supplemental city property taxes and subventions, debt service tax and the Redevelopment Agency tax increments, ERAF refunds, and property tax in-lieu of motor vehicle fees.(2) Former redevelopment agency tax increments were excluded starting February 1, 2012 and subsequent fiscal years.(3) San Mateo County assesses properties and it bills, collects, and distributes property taxes to all taxing entities including the City. Under State law, known as the Teeter Plan, the county remits the entire amount levied and handles all delinquencies, retaining interest and penalties. Only secured taxes will be paid under the Teeter Plan.(4) Years of lower collection are due to weak housing market and assessed value appeals.
Source: County of San Mateo
Fiscal Year of the Levy Total Collections To Date
CITY OF SAN MATEOProperty Tax Levies and Collections
Last Ten Fiscal Years
Collected Within the
192
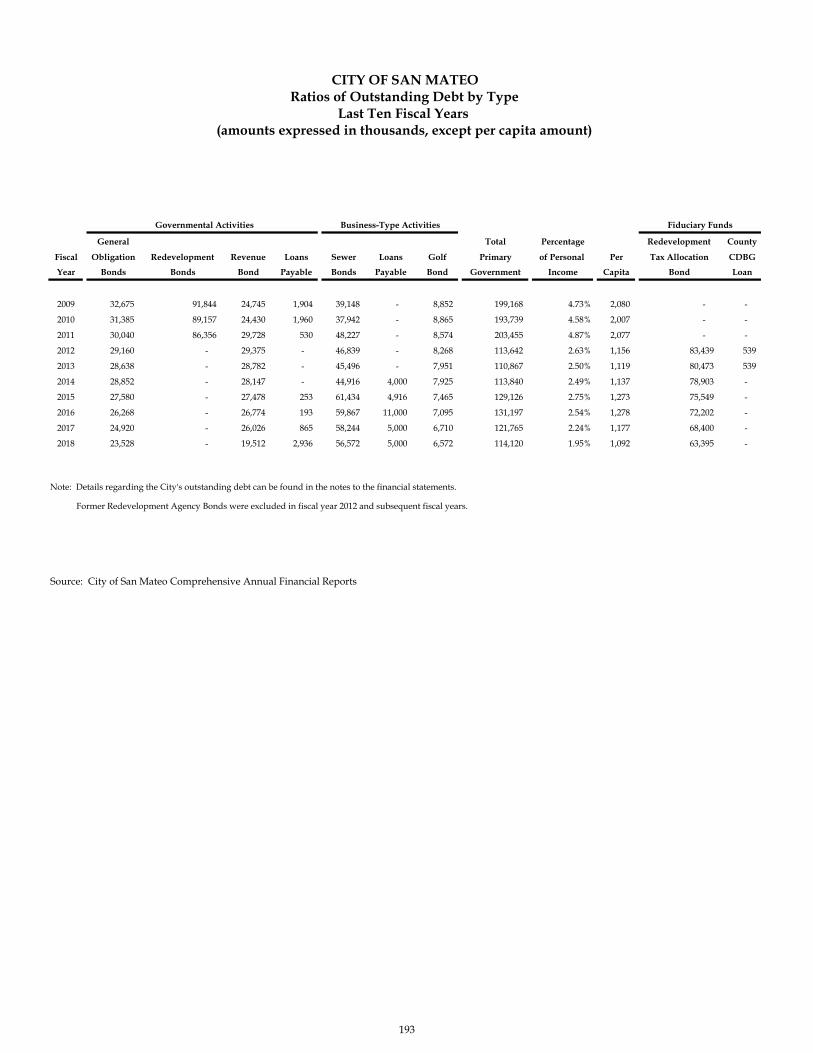
General Total Percentage Redevelopment County
Fiscal Obligation Redevelopment Revenue Loans Sewer Loans Golf Primary of Personal Per Tax Allocation CDBG
Year Bonds Bonds Bond Payable Bonds Payable Bond Government Income Capita Bond Loan
2009 32,675 91,844 24,745 1,904 39,148 - 8,852 199,168 4.73% 2,080 - -
2010 31,385 89,157 24,430 1,960 37,942 - 8,865 193,739 4.58% 2,007 - -
2011 30,040 86,356 29,728 530 48,227 - 8,574 203,455 4.87% 2,077 - -
2012 29,160 - 29,375 - 46,839 - 8,268 113,642 2.63% 1,156 83,439 539
2013 28,638 - 28,782 - 45,496 - 7,951 110,867 2.50% 1,119 80,473 539
2014 28,852 - 28,147 - 44,916 4,000 7,925 113,840 2.49% 1,137 78,903 -
2015 27,580 - 27,478 253 61,434 4,916 7,465 129,126 2.75% 1,273 75,549 -
2016 26,268 - 26,774 193 59,867 11,000 7,095 131,197 2.54% 1,278 72,202 -
2017 24,920 - 26,026 865 58,244 5,000 6,710 121,765 2.24% 1,177 68,400 -
2018 23,528 - 19,512 2,936 56,572 5,000 6,572 114,120 1.95% 1,092 63,395 -
Former Redevelopment Agency Bonds were excluded in fiscal year 2012 and subsequent fiscal years.
Source: City of San Mateo Comprehensive Annual Financial Reports
(amounts expressed in thousands, except per capita amount)Last Ten Fiscal Years
Ratios of Outstanding Debt by TypeCITY OF SAN MATEO
Fiduciary FundsGovernmental Activities Business-Type Activities
Note: Details regarding the City's outstanding debt can be found in the notes to the financial statements.
193

PercentageGeneral Tax Less: Amount of Total Taxable
Fiscal Obligation Allocation Available in AssessedYear Bonds Bonds Debt Svc Fund Total (net) Value Per Capita
2009 32,675 91,844 9,362 115,157 0.69% 1,202 2010 31,385 89,157 8,789 111,753 0.67% 1,158 2011 30,040 86,356 8,240 108,156 0.66% 1,104 2012 29,160 - 2,459 26,701 0.16% 272 2013 28,638 - 2,404 26,234 0.16% 265 2014 28,852 - 2,747 26,105 0.14% 261 2015 27,580 - 3,034 24,546 0.13% 242 2016 26,268 - 3,642 22,626 0.11% 220 2017 24,920 - 4,026 20,894 0.09% 202 2018 23,528 - 4,455 19,073 0.08% 183
Former Redevelopment Agency Bonds were excluded in fiscal year 2012 and subsequent fiscal years.Note: Details regarding the City's outstanding debt can be found in the notes to the financial statements.
Source: City of San Mateo Comprehensive Annual Financial Reports
CITY OF SAN MATEO
(amounts expressed in thousands, except per capita amount)Last Ten Fiscal Years
Ratios of General Bonded Debt Outstanding
Outstanding General Bonded Debt
194
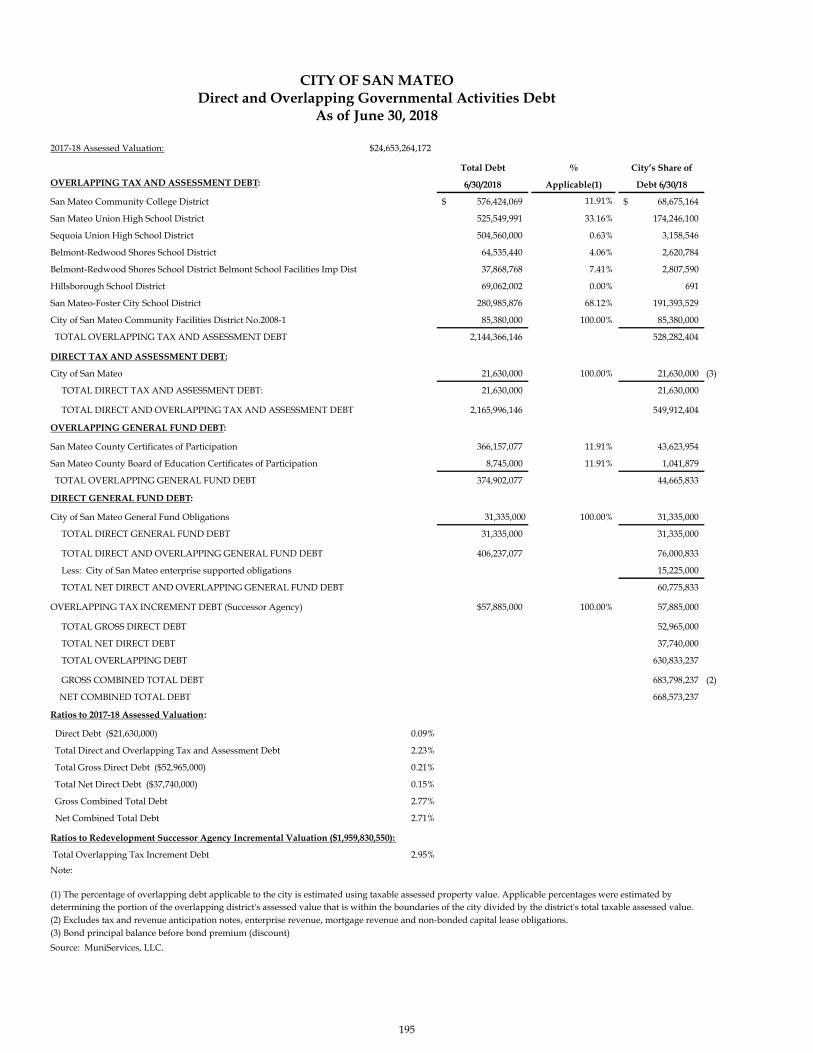
2017-18 Assessed Valuation: $24,653,264,172
Total Debt % City’s Share of
OVERLAPPING TAX AND ASSESSMENT DEBT: 6/30/2018 Applicable(1) Debt 6/30/18
San Mateo Community College District 576,424,069$ 11.91% 68,675,164$
San Mateo Union High School District 525,549,991 33.16% 174,246,100
Sequoia Union High School District 504,560,000 0.63% 3,158,546
Belmont-Redwood Shores School District 64,535,440 4.06% 2,620,784
Belmont-Redwood Shores School District Belmont School Facilities Imp Dist 37,868,768 7.41% 2,807,590
Hillsborough School District 69,062,002 0.00% 691
San Mateo-Foster City School District 280,985,876 68.12% 191,393,529
City of San Mateo Community Facilities District No.2008-1 85,380,000 100.00% 85,380,000
TOTAL OVERLAPPING TAX AND ASSESSMENT DEBT 2,144,366,146 528,282,404
DIRECT TAX AND ASSESSMENT DEBT:
City of San Mateo 21,630,000 100.00% 21,630,000 (3)
TOTAL DIRECT TAX AND ASSESSMENT DEBT: 21,630,000 21,630,000
TOTAL DIRECT AND OVERLAPPING TAX AND ASSESSMENT DEBT 2,165,996,146 549,912,404
OVERLAPPING GENERAL FUND DEBT:
San Mateo County Certificates of Participation 366,157,077 11.91% 43,623,954
San Mateo County Board of Education Certificates of Participation 8,745,000 11.91% 1,041,879
TOTAL OVERLAPPING GENERAL FUND DEBT 374,902,077 44,665,833
DIRECT GENERAL FUND DEBT:
City of San Mateo General Fund Obligations 31,335,000 100.00% 31,335,000
TOTAL DIRECT GENERAL FUND DEBT 31,335,000 31,335,000
TOTAL DIRECT AND OVERLAPPING GENERAL FUND DEBT 406,237,077 76,000,833
Less: City of San Mateo enterprise supported obligations 15,225,000
TOTAL NET DIRECT AND OVERLAPPING GENERAL FUND DEBT 60,775,833
OVERLAPPING TAX INCREMENT DEBT (Successor Agency) $57,885,000 100.00% 57,885,000
TOTAL GROSS DIRECT DEBT 52,965,000
TOTAL NET DIRECT DEBT 37,740,000
TOTAL OVERLAPPING DEBT 630,833,237
GROSS COMBINED TOTAL DEBT 683,798,237 (2)
NET COMBINED TOTAL DEBT 668,573,237
Ratios to 2017-18 Assessed Valuation:
Direct Debt ($21,630,000) 0.09%
Total Direct and Overlapping Tax and Assessment Debt 2.23%
Total Gross Direct Debt ($52,965,000) 0.21%
Total Net Direct Debt ($37,740,000) 0.15%
Gross Combined Total Debt 2.77%
Net Combined Total Debt 2.71%
Ratios to Redevelopment Successor Agency Incremental Valuation ($1,959,830,550):
Total Overlapping Tax Increment Debt 2.95%
Note:
Source: MuniServices, LLC.
(1) The percentage of overlapping debt applicable to the city is estimated using taxable assessed property value. Applicable percentages were estimated by determining the portion of the overlapping district's assessed value that is within the boundaries of the city divided by the district's total taxable assessed value.(2) Excludes tax and revenue anticipation notes, enterprise revenue, mortgage revenue and non-bonded capital lease obligations.(3) Bond principal balance before bond premium (discount)
CITY OF SAN MATEODirect and Overlapping Governmental Activities Debt
As of June 30, 2018
195
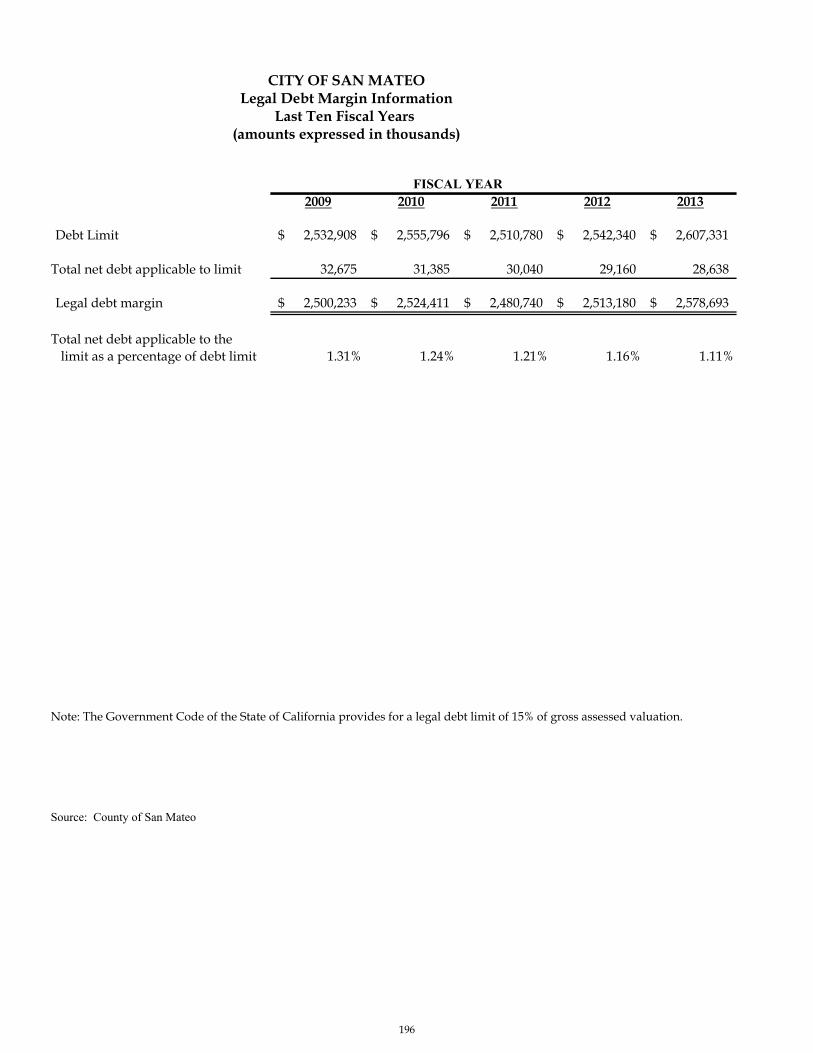
2009 2010 2011 2012 2013
Debt Limit 2,532,908$ 2,555,796$ 2,510,780$ 2,542,340$ 2,607,331$
Total net debt applicable to limit 32,675 31,385 30,040 29,160 28,638
Legal debt margin 2,500,233$ 2,524,411$ 2,480,740$ 2,513,180$ 2,578,693$
Total net debt applicable to the limit as a percentage of debt limit 1.31% 1.24% 1.21% 1.16% 1.11%
Note: The Government Code of the State of California provides for a legal debt limit of 15% of gross assessed valuation.
Source: County of San Mateo
FISCAL YEAR
CITY OF SAN MATEOLegal Debt Margin Information
Last Ten Fiscal Years (amounts expressed in thousands)
196

2014 2015 2016 2017 2018
2,782,598$ 2,951,703$ 3,204,902$ 3,483,855$ 3,769,199$
28,852 27,580 26,268 24,920 23,528
2,753,746$ 2,924,123$ 3,178,634$ 3,458,935$ 3,745,671$
1.05% 0.94% 0.83% 0.72% 0.63%
Legal Debt Margin Calculation for Fiscal Year 20182018
Assessed value 24,540,546$ Add back: exempt real property 587,446
Total assessed value 25,127,992$
Debt limit (15% of assessed value) 3,769,199$
Debt Application to limit:General obligation bonds 23,528
Total net debt applicable to limit 23,528 Legal debt margin 3,745,671$
FISCAL YEAR
CITY OF SAN MATEOLegal Debt Margin Information
Last Ten Fiscal Years (amounts expressed in thousands)
197

Sewer Less Net
Fiscal Charges Operating Available Tax
Year and Other (1) Expenses (2) Revenue Principal Interest Coverage Increment Principal Interest Coverage
2009 21,209 14,920 6,289 1,250 1,898 2.00 13,210 1,310 4,044 2.47
2010 22,183 16,788 5,395 1,305 1,840 1.72 12,943 2,820 3,954 1.91
2011 22,809 16,419 6,390 1,365 1,779 2.03 12,455 2,935 3,838 1.84
2012 24,936 17,463 7,473 1,460 1,719 2.35 12,657 (3) 3,050 3,719 1.87
2013 28,781 17,980 10,801 1,415 2,072 3.10 - - - -
2014 28,705 16,874 11,831 1,455 2,016 3.41 - - - -
2015 32,453 19,511 12,942 17,800 (4) 2,041 3.65 (4) - - - -
2016 31,874 23,218 8,656 1,460 2,560 2.15 - - - -
2017 31,932 21,419 10,513 1,515 2,516 2.61 - - - -
2018 41,927 21,870 20,057 1,565 2,462 4.98 - - - -
Note: (1) Sewer charges and other include investment earnings.
(2) Operating expenses do not include interest or depreciation.
(3) The Successor Agencies to the redevelopment agencies receive funding from the Redevelopment Property Tax Trust Fund
to pay these types of debt obligations began in February 2012.
(4) Increase due to the refunding of the 2003 Sewer Revenue bonds totaling $16.3 million which is excluded from the coverage calculation.
Source: City of San Mateo Comprehensive Annual Financial Reports
Pledged-Revenue CoverageCITY OF SAN MATEO
Debt Service
Tax Allocation Bonds
Debt Service
(amounts expressed in thousands)Last Ten Fiscal Years
Sewer Revenue Bonds
198
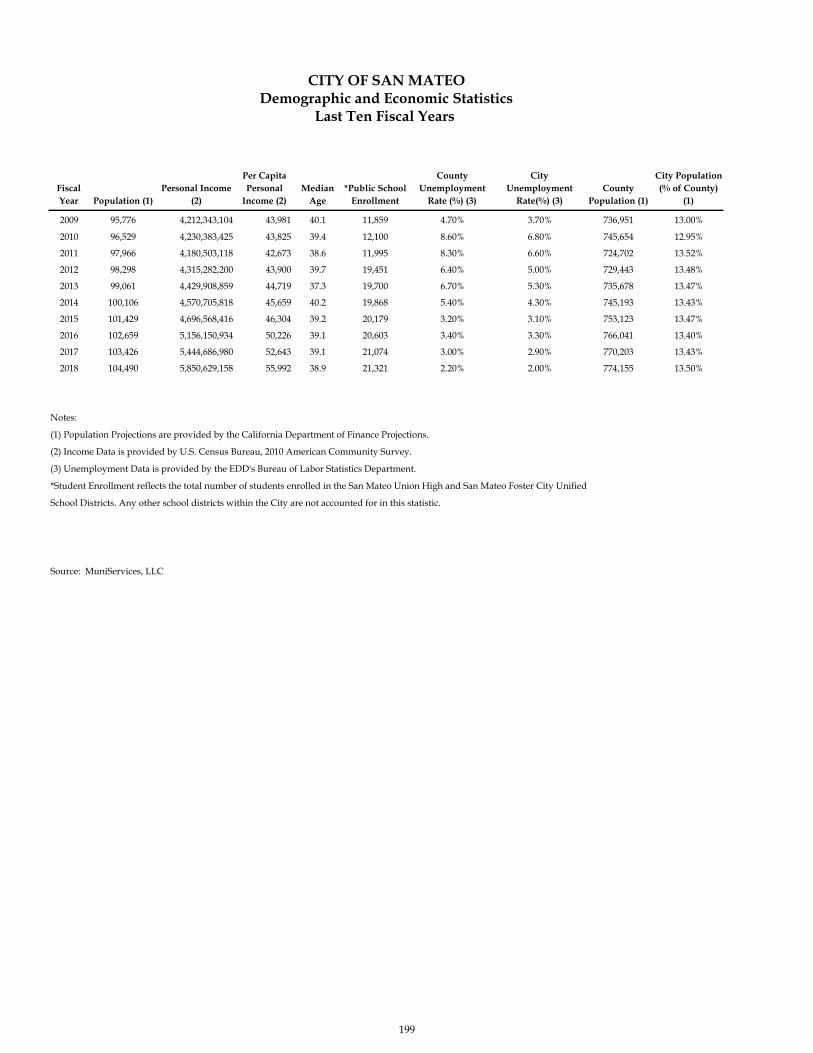
Fiscal Year Population (1)
Personal Income (2)
Per Capita Personal
Income (2)Median
Age*Public School
Enrollment
County Unemployment
Rate (%) (3)
City Unemployment
Rate(%) (3)County
Population (1)
City Population (% of County)
(1)
2009 95,776 4,212,343,104 43,981 40.1 11,859 4.70% 3.70% 736,951 13.00%
2010 96,529 4,230,383,425 43,825 39.4 12,100 8.60% 6.80% 745,654 12.95%
2011 97,966 4,180,503,118 42,673 38.6 11,995 8.30% 6.60% 724,702 13.52%
2012 98,298 4,315,282,200 43,900 39.7 19,451 6.40% 5.00% 729,443 13.48%
2013 99,061 4,429,908,859 44,719 37.3 19,700 6.70% 5.30% 735,678 13.47%
2014 100,106 4,570,705,818 45,659 40.2 19,868 5.40% 4.30% 745,193 13.43%
2015 101,429 4,696,568,416 46,304 39.2 20,179 3.20% 3.10% 753,123 13.47%
2016 102,659 5,156,150,934 50,226 39.1 20,603 3.40% 3.30% 766,041 13.40%
2017 103,426 5,444,686,980 52,643 39.1 21,074 3.00% 2.90% 770,203 13.43%
2018 104,490 5,850,629,158 55,992 38.9 21,321 2.20% 2.00% 774,155 13.50%
Notes:
(1) Population Projections are provided by the California Department of Finance Projections.
(2) Income Data is provided by U.S. Census Bureau, 2010 American Community Survey.
(3) Unemployment Data is provided by the EDD's Bureau of Labor Statistics Department.
*Student Enrollment reflects the total number of students enrolled in the San Mateo Union High and San Mateo Foster City Unified
School Districts. Any other school districts within the City are not accounted for in this statistic.
Source: MuniServices, LLC
CITY OF SAN MATEODemographic and Economic Statistics
Last Ten Fiscal Years
199

Business NameNumber of Employees
Percent of Total Employment (%)
Number of Employees
Percent of Total Employment (%)
Sony Interactive Entertainment America, Playstation America 1,168 1.82%County of San Mateo Medical Center* 1,425 2.22% 1,504 2.96%San Mateo-Foster City Unified 1,191 1.85%Franklin Templeton Investor 1,055 1.64% 1,029 2.03%San Mateo Union High School District** 1,026 1.60%San Mateo County Behavioral Health 650 1.01%Net Suite Inc 600 0.93%City of San Mateo 547 0.85% 769 1.51%Fisher Investments 423 0.66%Marketo Inc 410 0.64%San Mateo Community College *** 1,500 2.95%Department of Mental Health (San Mateo) 550 1.08%Mills-Peninsula Health Services 514 1.01%Safeway Stores (3 locations) 360 0.71%New York Life Insurance Co. 285 0.56%Macy's Department Store 275 0.54%
Total Top 10 Employers 8,495 13.21% 6,786 13.36%
Total Labor Force (1) 64,300 50,800
Source: MuniServices, LLCResults based on direct correspondence with city’s local businesses.* Count includes San Mateo Medical Center as well as outside clinic locations.**Includes Capuchino and Burlingame HS which aren't in the city of San Mateo.1.) Total City Labor Force for 2017-18 provided by EDD Labor Force Data. 2008-09 provided by previous City CAFR.
*** Excludes Part-time, short-term, Skyline College in San Bruno and Canada College in Redwood City.
Principal Employers for City of San MateoCITY OF SAN MATEO
Current Year and Nine Years Ago
2018 2009
200
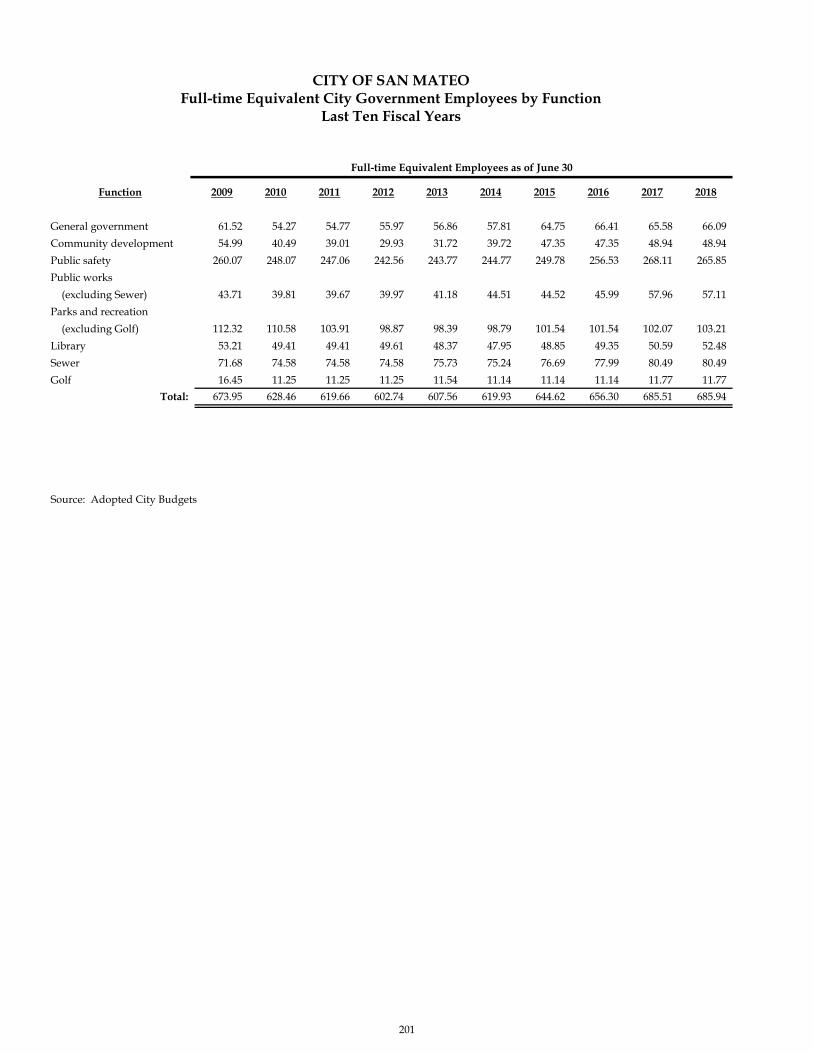
CITY OF SAN MATEOFull-time Equivalent City Government Employees by Function
Last Ten Fiscal Years
Full-time Equivalent Employees as of June 30
Function 2009 2010 2011 2012 2013 2014 2015 2016 2017 2018
General government 61.52 54.27 54.77 55.97 56.86 57.81 64.75 66.41 65.58 66.09
Community development 54.99 40.49 39.01 29.93 31.72 39.72 47.35 47.35 48.94 48.94
Public safety 260.07 248.07 247.06 242.56 243.77 244.77 249.78 256.53 268.11 265.85
Public works
(excluding Sewer) 43.71 39.81 39.67 39.97 41.18 44.51 44.52 45.99 57.96 57.11
Parks and recreation
(excluding Golf) 112.32 110.58 103.91 98.87 98.39 98.79 101.54 101.54 102.07 103.21
Library 53.21 49.41 49.41 49.61 48.37 47.95 48.85 49.35 50.59 52.48
Sewer 71.68 74.58 74.58 74.58 75.73 75.24 76.69 77.99 80.49 80.49
Golf 16.45 11.25 11.25 11.25 11.54 11.14 11.14 11.14 11.77 11.77
Total: 673.95 628.46 619.66 602.74 607.56 619.93 644.62 656.30 685.51 685.94
Source: Adopted City Budgets
201
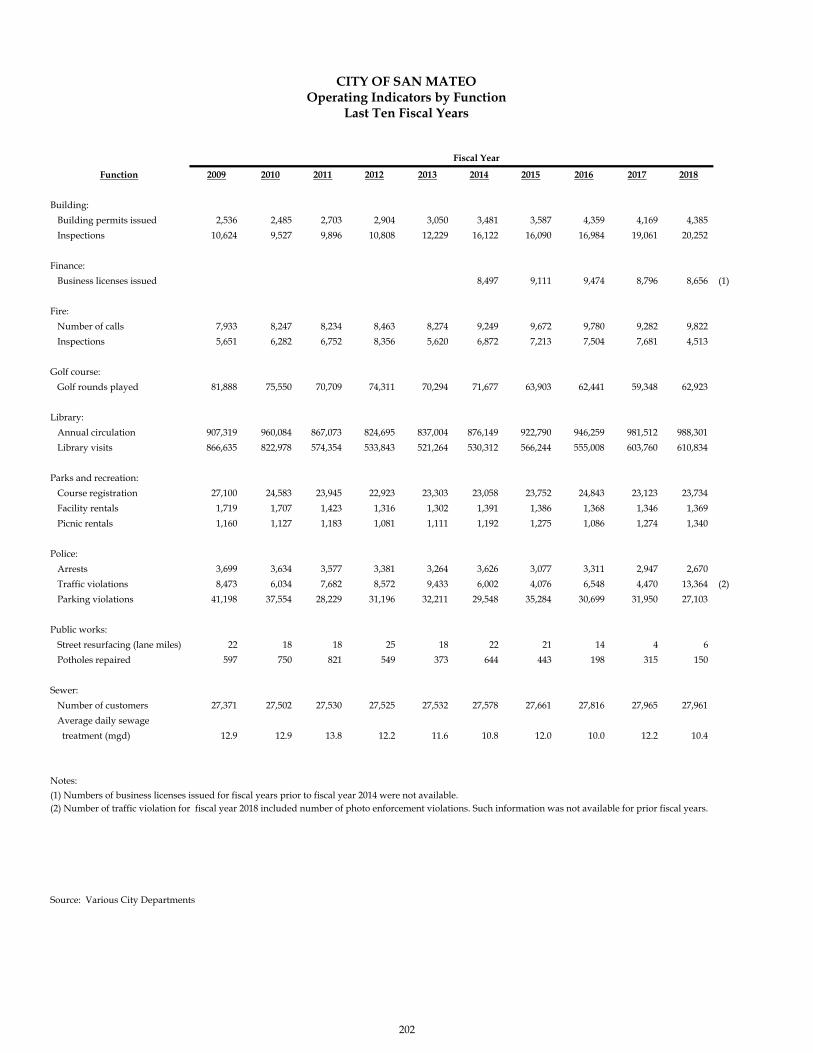
CITY OF SAN MATEOOperating Indicators by Function
Last Ten Fiscal Years
Fiscal Year
Function 2009 2010 2011 2012 2013 2014 2015 2016 2017 2018
Building:
Building permits issued 2,536 2,485 2,703 2,904 3,050 3,481 3,587 4,359 4,169 4,385
Inspections 10,624 9,527 9,896 10,808 12,229 16,122 16,090 16,984 19,061 20,252
Finance:
Business licenses issued 8,497 9,111 9,474 8,796 8,656 (1)
Fire:
Number of calls 7,933 8,247 8,234 8,463 8,274 9,249 9,672 9,780 9,282 9,822
Inspections 5,651 6,282 6,752 8,356 5,620 6,872 7,213 7,504 7,681 4,513
Golf course:
Golf rounds played 81,888 75,550 70,709 74,311 70,294 71,677 63,903 62,441 59,348 62,923
Library:
Annual circulation 907,319 960,084 867,073 824,695 837,004 876,149 922,790 946,259 981,512 988,301
Library visits 866,635 822,978 574,354 533,843 521,264 530,312 566,244 555,008 603,760 610,834
Parks and recreation:
Course registration 27,100 24,583 23,945 22,923 23,303 23,058 23,752 24,843 23,123 23,734
Facility rentals 1,719 1,707 1,423 1,316 1,302 1,391 1,386 1,368 1,346 1,369
Picnic rentals 1,160 1,127 1,183 1,081 1,111 1,192 1,275 1,086 1,274 1,340
Police:
Arrests 3,699 3,634 3,577 3,381 3,264 3,626 3,077 3,311 2,947 2,670
Traffic violations 8,473 6,034 7,682 8,572 9,433 6,002 4,076 6,548 4,470 13,364 (2)
Parking violations 41,198 37,554 28,229 31,196 32,211 29,548 35,284 30,699 31,950 27,103
Public works:
Street resurfacing (lane miles) 22 18 18 25 18 22 21 14 4 6
Potholes repaired 597 750 821 549 373 644 443 198 315 150
Sewer:
Number of customers 27,371 27,502 27,530 27,525 27,532 27,578 27,661 27,816 27,965 27,961
Average daily sewage
treatment (mgd) 12.9 12.9 13.8 12.2 11.6 10.8 12.0 10.0 12.2 10.4
Notes:
Source: Various City Departments
(2) Number of traffic violation for fiscal year 2018 included number of photo enforcement violations. Such information was not available for prior fiscal years.(1) Numbers of business licenses issued for fiscal years prior to fiscal year 2014 were not available.
202
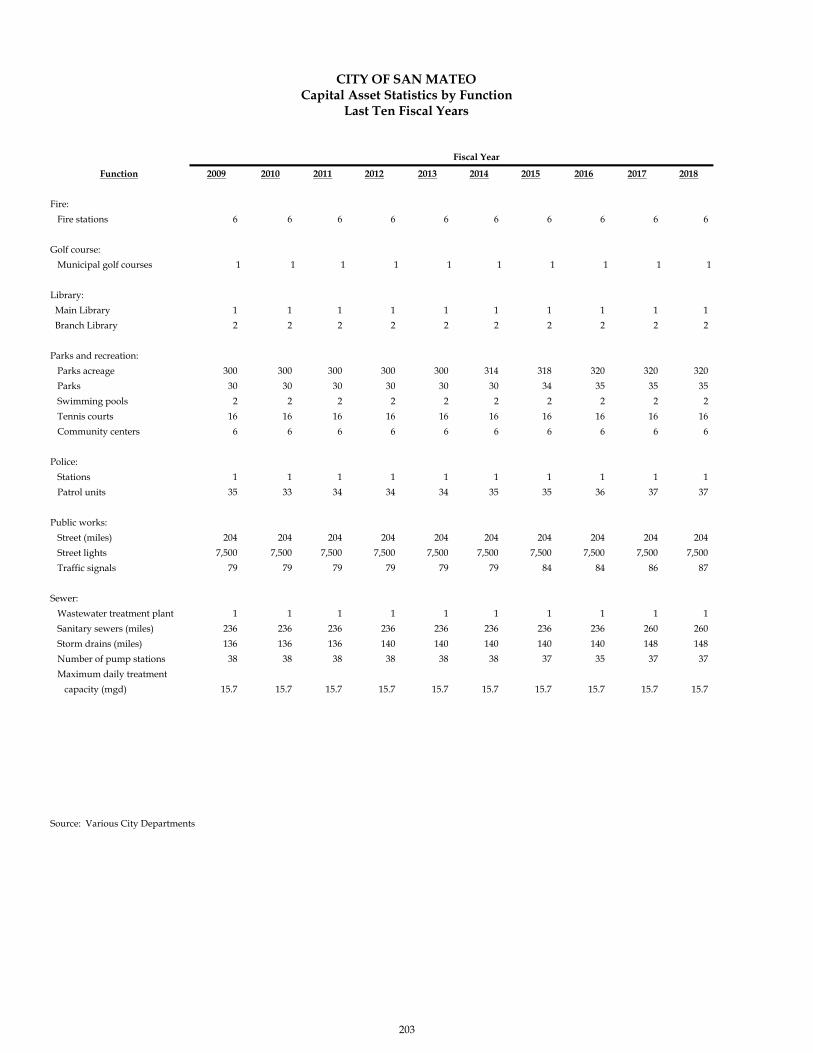
CITY OF SAN MATEOCapital Asset Statistics by Function
Last Ten Fiscal Years
Fiscal Year
Function 2009 2010 2011 2012 2013 2014 2015 2016 2017 2018
Fire:
Fire stations 6 6 6 6 6 6 6 6 6 6
Golf course:
Municipal golf courses 1 1 1 1 1 1 1 1 1 1
Library:
Main Library 1 1 1 1 1 1 1 1 1 1
Branch Library 2 2 2 2 2 2 2 2 2 2
Parks and recreation:
Parks acreage 300 300 300 300 300 314 318 320 320 320
Parks 30 30 30 30 30 30 34 35 35 35
Swimming pools 2 2 2 2 2 2 2 2 2 2
Tennis courts 16 16 16 16 16 16 16 16 16 16
Community centers 6 6 6 6 6 6 6 6 6 6
Police:
Stations 1 1 1 1 1 1 1 1 1 1
Patrol units 35 33 34 34 34 35 35 36 37 37
Public works:
Street (miles) 204 204 204 204 204 204 204 204 204 204
Street lights 7,500 7,500 7,500 7,500 7,500 7,500 7,500 7,500 7,500 7,500
Traffic signals 79 79 79 79 79 79 84 84 86 87
Sewer:
Wastewater treatment plant 1 1 1 1 1 1 1 1 1 1
Sanitary sewers (miles) 236 236 236 236 236 236 236 236 260 260
Storm drains (miles) 136 136 136 140 140 140 140 140 148 148
Number of pump stations 38 38 38 38 38 38 37 35 37 37
Maximum daily treatment
capacity (mgd) 15.7 15.7 15.7 15.7 15.7 15.7 15.7 15.7 15.7 15.7
Source: Various City Departments
203

183