city of san josé police and fire department retirement plan
TRANSCRIPT

A Pension Trust Fund of the City of San José, California
Comprehensive Annual Financial Report
for the Fiscal Year Ended June 30, 2011
City of San José Police and Fire DepartmentRetirement Plan


A Pension Trust Fund of the City of San José, California
Comprehensive Annual Financial Report
for the Fiscal Year Ended June 30, 2011
City of San José Police and Fire DepartmentRetirement Plan
Department of Retirement Services 1737 North First Street, Suite 580San Jose, California 95112-4505Phone 408-794-1000Fax 408-392-6732www.sjretirement.com
Russell U. CrosbyDirector


Board Chair Letter
December 16, 2011
The Honorable Mayor and City Council Members of the Police and Fire Department Retirement Plan City of San Jose San Jose, California
Dear Mayor, Council Members, and Plan Members:
On behalf of the members of the Board of Administration, I am pleased to present the Police and Fire Department Retirement Plan’s (Plan) Comprehensive Annual Financial Report (CAFR) for the fiscal year ended June 30, 2011.
A major accomplishment during the fiscal year was the implementation of a new board governance structure. The San Jose City Council passed legislation in August 2010 creating a new board structure for the Plan. The new board structure replaced the two City Council representatives, the Civil Service Commission representative, and the City Administration representative with four public members. In addition, the new board structure created a new position for a Fire Retiree representative and stipulated that, once the Board had eight members, the Board would interview applicants and make a recommendation to City Council on a ninth and final board member, who would also be a public member. From August 2010 through November 2010, staff conducted extensive outreach to recruit qualified professionals to ensure that the City Council had the broadest possible range of applicants. Interviews with the City Council took place in December 2010.
A major focus of the new board structure was the addition of the public board members who are independent of the City and who have specific education and experience relevant to the administration of public retirement plans. In December 2010, the City Council appointed four public members, Damon Krytzer, Sean Bill, Michael Flaherman, and Vincent Sunzeri, who were sworn in at the Board’s January 2011 meeting. In February 2011, the City Council
appointed the Fire Retiree representative, Richard Santos, who was sworn in at the Board’s March 2011 meeting. As the Board had reached eight members, the Board held interviews in April 2011 for the ninth and final Trustee and made a recommendation to the City Council. Later in
April 2011, the City Council accepted the recommendation and appointed the ninth Trustee, Andrew Lanza, who was sworn in at the Board’s May 2011 meeting. The newly constituted Board met in its entirety for the first time in May 2011.
The new public trustees bring a wealth of investment knowledge and experience to the Board. Specifically, Damon Krytzer is a Managing Director at Waverly Advisors, a tactical portfolio advisor, and has 18 years of investment management experience in asset allocation strategy, proper benchmarking, asset/liability matching, and investment product research. Sean Bill has recently relocated to the Bay Area from Los Angeles, where he was Director of Fixed Income, Currency, and Commodities proprietary trading at Crowell, Weedon & Co. Sean has 16 years of experience in the investment management business. Michael Flaherman is a Managing Director at New Mountain Capital LLC, partner in the firm’s private equity funds and public equity fund, and has led investor relations and fund raising for the past eight years. He served as the Investment Committee Chair for CalPERS for three years and on the Board of Administration for CalPERS for eight years. Vincent Sunzeri is a Senior Vice President at Morgan Stanley Smith Barney and has 22 years of investment management experience and 15 years of experience as financial advisor to the Los Gatos-Saratoga Department of Education and Recreation. He is a Certified Investment Management Analyst, CIMA, and Certified Private Wealth Advisor, CPWA. Drew Lanza is recently retired and has 10 years of experience as a venture capitalist at Morgenthaler Venture Capital, has served on over two dozen boards, and started and managed four companies earlier in his career.
In addition to the new public members, the newly appointed Fire Retiree representative,
Comprehensive Annual Financial Report 2010-2011 San José Police & Fire Department Retirement Plan

Board Chair Letter (Continued)
Richard Santos, brings a wealth of knowledge and experience to the Board. He served as Vice Chair of the Plan for 12 years, worked in the San Jose Fire Department for over 32 years, and has served on the Santa Clara Valley Water District Board for 10 years, with two of those 10 years as Chair. In June 2011, Trustee Flaherman resigned for personal reasons leaving the position vacant at the end of the fiscal year.
The Plan earned a time-weighted gross of fees rate of return of 18.4% and net of investment fees rate of return of 18.1% on investments, compared to a 20.5% return for its policy benchmark and a 21.7% return for the Independent Consultants Cooperative’s (ICC) Public Funds Median. Additionally, the Plan earned a time-weighted gross of fees rate of return of 3.5% and 4.6% for the three-year and five-year periods ending June 30, 2011, respectively, while the ICC Public Fund Median earned a time-weighted rate of return of 3.6% and 4.8% for the same periods. In contrast, the net rate of return assumed by the Plan’s actuary is 7.75%.
Moreover, the net asset value of the Plan increased from $2,314,870,000 to $2,687,397,000, net of pending purchases and sales (see the Financial Section beginning on page 23). The net increase in Plan assets for fiscal year 2010-2011 was $372,527,000.
After conducting extensive searches, the Board hired RS Investments as an active U.S. small cap value equity manager, Credit Suisse Asset Management and First Quadrant as active risk parity commodities managers, and Blackstone/GSO, Medley Capital, and White Oak Global Advisors as active opportunistic direct lending managers. In addition, American Realty Advisors was hired to take over management and disposition of the individually owned real estate and Cheiron was hired as Board Actuary.
The Board believes that the professional services rendered by the staff, the auditors, investment consultant, actuary, and the Plan’s performance
evaluators have produced a sound fund capable of continued growth. The Board of Administration and its staff are available to provide additional information as requested.
Sincerely,
David A. Bacigalupi, Chairman Board of Administration
Comprehensive Annual Financial Report 2010-2011 San José Police & Fire Department Retirement Plan

Table of Contents
I. INTRODUCTORY SECTION 11 Letter of Transmittal 14 Certificate of Achievement for Excellence in Financial Reporting 15 Certificate of Meeting Professional Standards in Public Pensionsr 16 Board of Administration 16 Administration/Outside Consultants 16 Standing Public Meetings 17 Department of Retirement Services Organizational Chart 18 Summary of the Principal Plan Provisions
II. FINANCIAL SECTION 24 Independent Auditor’s Report 26 Management’s Discussion and Analysis
Basic Financial Statements 35 Statements of Plan Net Assets 37 Statements of Changes in Plan Net Assets 39 Notes to Financial Statements
Required Supplementary Information 60 Schedule of Funding Progress – Defined Benefit Pension Plan 60 Schedule of Employer Contributions – Defined Benefit Pension Plan 61 Schedule of Funding Progress –
Postemployment Healthcare Plan 61 Schedule of Employer Contributions –
Postemployment Healthcare Plan
Other Supplementary Information 62 Market Value of Assets Schedule of Funding Progress – Defined Benefit Pension Plan 63 Combining Schedule of Defined Benefit Pension Plan
Net Assets 64 Combining Schedule of Changes in Defined Benefit Pension Plan Net Assets 65 Schedules of Administrative Expenses and Other 65 Schedules of Investment Expenses 66 Schedules of Payments to Consultants
III. INVESTMENT SECTION 70 Report of Investment Activity 74 Statement of Investment Policy 86 Investment Professionals 87 Gross Performance Summary by Asset Class
Investment Review 88 Target Asset Allocation/Actual Asset Allocation 89 Historical Asset Allocation (Actual)/
Market Value Growth of Plan Assets/ History of Performance 90 List of Largest Assets Held 91 Schedule of Investment Fees 92 Schedule of Commissions 98 Investment Summary 99 Investment Properties
IV. ACTUARIAL SECTION 104 Actuary’s Certification Letter 106 Schedule of Actuarial Methods and Assumptions
and Funding Method 107 Probabilities of Separation Prior to Retirement 108 Years of Life Expectancy After Service Retirement 109 Years of Life Expectancy After Disability Retirement 110 Schedule of Active Member Valuation Data 110 Changes in Retirants (Including Beneficiaries) 111 Actuarial Analysis of Financial Experience 111 Solvency Test 112 Assumption Changes 112 Major Provisions of the Retirement Plan 114 Actuary’s Certification Letter (Other Postemployment Benefits) 116 Schedule of Actuarial Methods and Assumptions (Other Postemployment Benefits) 119 Summary of Plan Benefits (Other Postemployment Benefits) 120 Solvency Test (Other Postemployment Benefits) 121 Actuarial Analysis of Financial Experience (Other Postemployment Benefits)
V. STATISTICAL SECTION
Statistical Review 124 Changes in Net Assets 125 Benefit and Refund Deductions from Net Assets by Type 126 Employer and Employee Contribution Rates 127 Retired Members by Type of Benefit 128 Average Benefit Payment Amounts
Retirements During Fiscal Year 130 Service Retirements 131 Early Retirements 131 Deferred Vested Retirements 131 Service connected Disability Retirements 131 Non-Service Connected Disability Retirements
Deaths During Fiscal Year 131 Deaths After Retirement 131 Deaths Before Retirement
Comprehensive Annual Financial Report 2010-2011 San José Police & Fire Department Retirement Plan


City of San José
Comprehensive Annual Financial Report
for the Fiscal Year Ended June 30, 2011
IntroductorySection


11 Comprehensive Annual Financial Report 2010-2011 San José Police & Fire Department Retirement Plan Comprehensive Annual Financial Report 2010-2011 San José Police & Fire Department Retirement Plan
Letter of Transmittal
December 16, 2011
Board of Administration Police and Fire Department Retirement Plan 1737 North First Street, Suite 580 San Jose, CA 95112
Dear Board Members:
I am pleased to present the Comprehensive Annual Financial Report (CAFR) of the Police and Fire Department Retirement Plan (Plan) for the fiscal year ended June 30, 2011. Responsibility for both the accuracy of the data, and the completeness and fairness of the presentation, rests with the Plan’s management. This CAFR was prepared to conform to the principles of governmental accounting and reporting set forth by the Governmental Accounting Standards Board. Transactions of the Plan are reported on the accrual basis of accounting. For an overview and analysis of the financial activities of the Plan for the fiscal years ended 2010 and 2011 refer to the Management’s Discussion and Analysis on page 26.
Macias Gini & O’Connell LLP, the Plan’s independent auditor, has audited the accompanying financial statements. Management believes internal controls are adequate and the accompanying statements, schedules, and tables are fairly presented and free from material misstatement. Sufficient internal controls over financial reporting exist to provide reasonable assurance regarding the safekeeping of assets and fair presentation of the financial statements and supporting schedules.
The financial audit provides reasonable assurance that the Plan’s financial statements are presented in conformity with generally accepted accounting principles and are free of material mis statements. The Plan recognizes that even sound and well designed internal controls have their inherent limitations in that errors may still occur as a result of factors such as carelessness, faulty judgment, communication breakdowns, and/or that internal controls can be circumvented by internal or external collusion. The Plan continuously reviews internal controls to ensure that the Plan’s operating policies and procedures are being
adhered to and that the controls are adequate to ensure accurate and reliable financial reporting and to safeguard the Plan’s assets.
Information contained in this report is designed to provide a complete and accurate financial review of the year’s operations. I am proud to report that the Government Finance Officers Association of the United States and Canada (GFOA) awarded its Certificate of Achievement for Excellence in Financial Reporting to the Plan for its CAFR for the fiscal year ended June 30, 2010. The Certificate of Achievement is a prestigious national award recognizing conformance with the highest standards for preparation of state and local government financial reports. This report satisfies both generally accepted accounting principles and applicable legal requirements. We believe this report continues to conform to the Certificate of Achievement Program Requirements and staff will submit it to the GFOA to determine its eligibility for another certificate for the fiscal year ended June 30, 2011. The Plan also received the Public Pension Standards Award in recognition of meeting professional standards for plan design and administration by the Public Pension Coordinating Council.
I encourage you to review this report carefully. I trust that you and the members of the Plan will find this CAFR helpful in understanding the Plan.
Funding
The Plan’s funding objective for both its defined benefit pension plan and its defined benefit other postemployment healthcare (OPEB) plan is to meet long-term benefit obligations through contributions and investment income. As of June 30, 2010, the funding ratio of the defined benefit pension plan was approximately 79.8% based on the actuarial value of assets and 69.1% based on market value of assets. As of June 30, 2010, the funding ratio of the defined benefit OPEB plan was 6.19% based on the actuarial value of assets.
For the valuation of pension and OPEB benefits, the actuarial assumption for the net rate of return to be earned by the Plan is currently 7.75% and 6.30%, respectively. The impact of the difference

12 Comprehensive Annual Financial Report 2010-2011 San José Police & Fire Department Retirement Plan
Letter of Transmittal (Continued)
between the actual net rate of return earned by the Plan, 18.1%, and the 7.75% and 6.30% assumption will result in an investment gain that will be reflected in the pension and OPEB unfunded liabilities, respectively, in next year’s CAFR. The net increase in Plan assets for fiscal year 2010-2011 was $372,527,000. Details of the components of this increase are included in the Statement of Changes in Plan Net Assets on page 37. A six-year history of the defined benefit pension plan’s funding progress is presented on page 60. A four-year history of the defined benefit OPEB plan’s funding progress is presented on page 61.
Financial and Economic Summary
The 2010-2011 fiscal year began with signs of stabilization in the global economy. During the third quarter of 2010, the U.S. Federal Reserve began openly considering another major round of quantitative easing and emerging markets led the rebound in September. During the fourth quarter of 2010, the economy continued to improve sparking renewed investor optimism. Congress announced a two-year extension of Bush-era tax cuts as well as a reduction in social security taxes for 2011 and the U.S. Federal Reserve announced QE2. During the first quarter of 2011, investor optimism persisted despite major events such as geopolitical uncertainty in the Middle East, renewed sovereign debt concerns, and the March earthquake and tsunami in Japan. The U.S. Federal Reserve continued to maintain an accommodative monetary policy in the U.S., but many policymakers worldwide began raising interest rates to combat inflationary concerns. The fiscal year’s fourth quarter saw a reversal in the trends from the first three quarters as concerns over the future of the global economy began to weigh on riskier assets. QE2 ended in June and U.S. policymakers debated the various means of reducing the U.S. budget deficiency as a prerequisite to raise the U.S. Treasury’s debt ceiling, but failed to reach resolution by fiscal year end.
Fiscal year 2012 promises continued volatility in the markets and, while the Plan is diversified in a way that provides the best possible chance for achieving long-term returns to meet its obligations and objectives, it is of critical importance that the Plan continues to focus on low volatility and stability of returns going forward.
Investment Summary
The Board of Administration has exclusive control of all investments of the Plan and is responsible for the establishment of investment objectives, strategies, and policies. Members of the Board serve in a fiduciary capacity and discharge their duties with respect to the Plan and the investment portfolio solely in the interest of, and for the exclusive purposes of providing benefits to, members of the Plan and defraying the reasonable cost of administration.
Over the past fiscal year, the Plan’s gross of fees rate of return was 18.4% and net of investment fees rate of return was 18.1%, while the policy benchmark returned 20.5% and the Master Trust Public Funds Median returned 21.7%. Additionally, the Plan’s gross of fees rate of return was 3.5% and 4.6% for the three-year and five-year periods ended June 30, 2011 respectively, while the ICC Public Funds median was 3.6% and 4.8% for the same periods.
Moreover, the net asset value of the Plan increased from $2,314,870,000 to $2,687,397,000, net of pending purchases and sales (see the Financial Section beginning on page 23). During the fiscal year, Trustees selected active managers for U.S. small cap value equity, risk parity commodities, and opportunistic direct lending. The Trustees continued implementation of the new asset allocation, which aims to better position the Plan for potential future market environments.
Major Initiatives
During the fiscal year 2010-2011, a new Board governance structure was implemented. In order to ensure that the retirement boards on balance will possess sufficient and relevant expertise to effectively guide and oversee the retirement systems and to ensure that the retirement board will be free of significant conflicts of interest and be able to focus freely on the administration of the Plan and the best interests of the members and beneficiaries, the City Council approved changes to the retirement board in August 2010. Specifically, the two City Council board members, the Civil Service Commission board member, and the City Administration board member were replaced with four public board members. In addition, a new position for a Fire Retiree representative was created and, once the board reached eight members, the Board would conduct

13 Comprehensive Annual Financial Report 2010-2011 San José Police & Fire Department Retirement Plan Comprehensive Annual Financial Report 2010-2011 San José Police & Fire Department Retirement Plan
Letter of Transmittal (Continued)
interviews and make a recommendation to City Council for the ninth and final board member, who would also be a public member.
Interviews for four new public members were held in December 2010 and the four public members selected were sworn in at the January 2011 Board meeting. In February 2011, the City Council approved the Retiree representative board member, who was sworn in at the March 2011 Board meeting. At a special April 2011 Board meeting, the Board conducted interviews for the ninth and final Board member and the City Council approved the ninth Board member later in April 2011. After swearing in the ninth board member, the newly constructed Board met for the first time in May 2011. In June 2011, one of the newly appointed public members resigned for personal reasons and the Board has been operating with a vacant position since.
After conducting extensive searches, the Board hired RS Investments as an active U.S. small cap value equity manager, Credit Suisse Asset Management and First Quadrant as active risk parity commodities mangers, and Blackstone/GSO, Medley Capital, and White Oak Global Advisors as active opportunistic direct lending managers. In addition, American Realty Advisors was hired to take over management and disposition of the individually owned real estate and Cheiron was hired as Board Actuary.
The Retirement Services Department participated in the Medical, Dental, and Voluntary Insurance Provider (Trustmark) selections for the City in conjunction with the City’s Human Resources Department and Labor Groups. Staff implemented the new Adult Dependent guidelines under the PPACA (Healthcare Reform), and was a key instrument for the application of the Early Retiree Reinsurance Program (ERRP), which so far brought in $1.2 million. There was higher retiree participation during Open Enrollment due to the new $25 co-pay plans that were introduced. Staff also organized free flu shots for retirees for the duration of the Retiree Health Fair and for the first time welcomed a representative from Social Security Administration, who provided valuable information regarding Medicare and the Windfall Elimination Provision.
During the fiscal year, staff streamlined the retirement group counseling process, which resulted in efficiencies that allowed service to be
provided to a greater number of customers. The Retirement Services Department has experienced incremental growth in the number of retirements processed for the past two fiscal years. The number of retirements processed during the fiscal year ending June 30, 2010 had increased 20% over the preceding year, followed by a 31% increase in the fiscal year ending June 30, 2011.
In addition, the Retirement Services Department offered 40 educational classes with over 1,303 Police, Fire, and Federated active and retired members participating. Staff successfully completed the Business Continuance Plan Mock Event and issued a Request for Proposals for Pension and Business Administration System with LR Wechsler being the vendor selected.
Due to the City’s overall financial difficulties, critical positions were kept open and remain unfilled. As a result, the Retirement Services Department functioned with staff losses and was forced to take a passive stance on recruiting with the exception of hiring one investment analyst.
Conclusion
I would like to take this opportunity to thank the members of the Plan for their confidence in the Plan management during the past year. I also want to express my thanks to the Board of Administration for its dedicated effort in supporting the staff through this past year. I thank the consultants and staff for their commitment to the Plan and for their diligent work to ensure the Plan’s continued successful operation.
Respectfully Submitted,
Russell U. Crosby Director, Retirement Services

14 Comprehensive Annual Financial Report 2010-2011 San José Police & Fire Department Retirement Plan
Certificate of Achievement for Excellence in Financial Reporting

15 Comprehensive Annual Financial Report 2010-2011 San José Police & Fire Department Retirement Plan
Certificate of Meeting Professional Standards in Public Pensions
P CP CPublic Pension Coordinating Council
Public Pension Standards AwardFor Funding and Administration
2010
Presented to
San Jose Police and Fire Department Retirement Plan
In recognition of meeting professional standards for plan funding and administration as
set forth in the Public Pension Standards.
Presented by the Public Pension Coordinating Council, a confederation of
National Association of State Retirement Administrators (NASRA)National Conference on Public Employee Retirement Systems (NCPERS)
National Council on Teacher Retirement (NCTR)
Alan H. WinkleProgram Administrator

16 Comprehensive Annual Financial Report 2010-2011 San José Police & Fire Department Retirement Plan
Board of Administration, Administration, and Outside ConsultantsBOARD OF ADMINISTRATION
The Retirement System is administered by a nine-member Board of Administration composed of two City employees elected by members of the system, two Retired Plan members elected by the Retiree Associations, four public members, who are not connected with the City and have significant banking or investment experience, and another public member, who is selected by the eight Board members and approved by the City Council. The Board is appointed by the City Council and serves in accordance with Section 2.08, Part 12 of the San Jose Municipal Code.
As of June 30, 2011, the members of the Board were as follows:
RUSSELL U. CROSBYDIRECTOR OF RETIREMENT SERVICES
DONNA BUSSEDEPUTY DIRECTORCHIEF OPERATIONS OFFICER
DAVID BACIGALUPI, CHAIRRetired Plan member appointed to the Board in January 2009. His current term expires November 30, 2012.
CONRAD TAYLOR, VICE CHAIREmployee Representative for the Police Department appointed to the Board in March 2009. His current term expires November 30, 2013.
SEAN KALDOR, TRUSTEEEmployee Representative for the Fire Department appointed to the Board in May 2010. His current term expires November 30, 2011.
DEPARTMENT OF RETIREMENT SERVICES ADMINISTRATION
SEAN BILL, TRUSTEEPublic member appointed to the Board in December 2010. His current term expires November 30, 2014.
VACANT, TRUSTEE
DAMON KRYTZER, TRUSTEEPublic member appointed to the Board in December 2010. His current term expires November 30, 2014.
VINCENT SUNZERI, TRUSTEEPublic member appointed to the Board in December 2010. His current term expires November 30, 2014.
RICHARD SANTOS, TRUSTEERetired Plan member appointed to the Board in March 2011. His current term expires November 30, 2014.
ANDREW LANZA, TRUSTEEPublic member appointed to the Board in April 2011. His current term expires April 30, 2015.
PETE CONSTANT, COUNCIL LIAISON
CARMEN RACY-CHOYDEPUTY DIRECTORCHIEF INVESTMENT OFFICER
OUTSIDE CONSULTANTS
ACTUARY Cheiron, Inc. Encinitas, CA
ATTORNEY, BOARD Saltzman & Johnson San Francisco, CA
ATTORNEY, INVESTMENT Hanson Bridgett, LLP San Francisco, CA
CONSULTANT, INVESTMENT NEPC, LLC Redwood City, CA
AUDITOR Macias Gini & O’Connell LLP Walnut Creek, CA A list of Investment Professionals begins on page 86 of the Investment Section of this report.
STANDING PUBLIC MEETINGS
Board Meetings: First Thursday of the Month, 8:30 AM Agendas for all public meetings are posted on the bulletin board at City Hall and on the department’s website at http://sjretirement.com/PF/meetings/agendas.asp or they can be obtained from the retirement office at 1737 North First Street, Suite 580, San Jose, CA 95112. Meeting times and locations are subject to change; please call our office at (408) 794-1000 for current information.

17 Comprehensive Annual Financial Report 2010-2011 San José Police & Fire Department Retirement Plan
2011 Department of Retirement Services Organizational Chart
Director
Principal Accountant Administrative
AssistantRetirement Investment Officer
Benefits Manager (vacant)
Information Systems Analyst
Deputy Director Chief Operations
Officer
Deputy Director Chief Investment
Officer
Retirement Investment Officer
(vacant)
Retirement Investment Officer
Analyst –Health Benefits
Senior Analyst –Pension Benefits
Analyst –Education/Training
Analyst
Analyst
Staff Technician
Senior Accountant
(vacant)
Accounting Technician
Senior Account Clerk
Account Clerk
Secretary (vacant)
Office Specialist
Office Specialist
Systems Analyst
Network Technician II
Analyst
Retirement Investment Officer
(vacant)
P/T Staff Technician
Retirement Investment Officer
(vacant)
Retirement Investment Officer
(vacant)
Analyst II – Operations
Analyst
Financial Analyst –Operations
Retirement Investment Analyst
DEPARTMENT OF RETIREMENT SERVICES1737 North First Street, Suite 580
San Jose, CA 95112
(408) 794-1000(800) 732-6477
(408) 392-6732 FAX
www.sjretirement.com

18 Comprehensive Annual Financial Report 2010-2011 San José Police & Fire Department Retirement Plan
Summary of the Principal Plan Provisions
Membership
Mandatory for all full-time safety employees.
Member Contribution
Police Department members contribute 15.57% and Fire Department members contribute 13.70% of their base salary.
City’s Contribution
The City contributes 44.58% of the base salary of the Police Department members and 44.16% of the base salary of the Fire Department members.
Interest
Two percent annual interest is calculated each biweekly pay period and is added to employee contributions. This interest is derived from investments.
Termination of Benefits
Upon termination, the member shall be paid all of his/her accumulated contributions and interest in full satisfaction of all rights and benefits under this Retirement Plan. The City’s contributions and interest will not be refunded to the employee.
Military Leave Credit
If during employment with the City of San Jose a member has served in the military, the City will pay the member’s contributions into the Retirement System for that period of time if the following conditions exist: (1) a time of war, a national emergency proclaimed by the President or the Congress, or (2) Service outside the United States as requested by the United Nations. This is not refundable to an employee who resigns and requests a refund of contributions.
Vesting of Pension Credit
After 10 years of service, a member may resign his/her position with the Police or Fire Department and leave the accumulated contributions in the Retirement Plan. A member who vests in this fashion is eligible to retire later at age 55 or when 20 years have elapsed from the original hire date. For a deferred vested retirement, the monthly retirement allowance is calculated with the same formula as a service retirement (See Below).
Service Retirement
An employee who reaches the normal retirement age of 55 with 20 years of service; an employee of age 50 with 25 years of service; an employee of any age with 30 years of service; or an employee of age 70 with no service requirement is entitled to a monthly retirement allowance equal to the final compensation multiplied by 2.5% multiplied by years of service up to 30 years (Maximum benefit, 75% of final average salary) if the employee retired prior to February 4, 1996. After February 4, 1996 but prior to February 4, 2000, the monthly allowance consists of final compensation multiplied by 2.5% for the first 20 years of service, by 3% for the next ten years (Maximum benefit, 80% of final average salary). After February 4, 2000, the monthly allowance consists of final compensation multiplied by 2.5% for the first 20 years of service, by 3% for the next five years of service, by 4% for the next 5 years of service (Maximum benefit, 85% of final average salary). Effective July 1, 2006, the monthly allowance for Police members only consists of final compensation multiplied by 2.5% for the first 20 years of service and by 4% for the next 10 years of service (Maximum benefit, 90% of final average salary). Effective July 1, 2008 for Fire members only, the monthly allowance for a service retirement consists of final average salary multiplied by 2.5% for the first 20 years of service. For Fire members with 20 or more years of service, allowance for a service retirement consisting of final average salary multiplied by 3.0% for each year (maximum benefit, 90% of final average salary).
Service-Connected Disability
If an employee suffers a service related disability before retirement, an annual benefit is paid equal to 50% of final compensation. For members with more than 20 years of service, the monthly retirement allowance is the final average salary multiplied by 50%, plus the final average salary multiplied by 2.5% for each year over 20 if a member retires prior to February 4, 1996 (Maximum benefit, 75% of final average salary). After February 4, 1996 but prior to February 4, 2000, the monthly allowance consists of the final average salary multiplied by 50%, plus final average salary multiplied by 3% for each year over 20 years of service (Maximum benefit, 80% of final average salary). After February 4, 2000, the monthly allowance consists of the final average salary multiplied by 50%, plus final average salary multiplied by 3% for each year over 20 but less than 25 years of service, plus 4% of final average salary for each year over 25 but less than 30 years of service (Maximum benefit, 85% of final average salary). Effective July 1, 2006, the monthly allowance for Police members only consists of final compensation multiplied by 50% plus 4% for each year in excess of 20 years

19 Comprehensive Annual Financial Report 2010-2011 San José Police & Fire Department Retirement Plan
Summary of the Principal Plan Provisions (Continued)
of service (Maximum benefit, 90% of final average salary). Effective July 1, 2008 for Fire members only, the monthly allowance consists of final average salary multiplied by 60%, plus final average salary multiplied by 3% for each full year of service in excess of 20 years (maximum 90%). For less than 20 years of service, the allowance consists of final average salary multiplied by 50%.
Non-Service-Connected Disability
Retirement for a non-service-connected disability with at least 2 years of service will provide the following benefit: For members with 2 to 20 years of service, the monthly retirement allowance is 32% multiplied by the final compensation for the first two years plus 1% for each additional year of service. After February 4, 1996 but prior to February 4, 2000, for members with over 20 years of service, the benefit consists of 50% of final average salary, plus final average salary multiplied by 3% for each year over 20 years of service (Maximum benefit, 80% of final average salary). After February 4, 2000, the monthly allowance consists of 50% of the final average salary, plus final average salary multiplied by 3% for each year over 20 but less than 25 years of service, plus 4% of final average salary for each year over 25 but less than 30 years of service (Maximum benefit, 85% of final average salary). Effective July 1, 2006, the monthly allowance for Police members only consists of final compensation multiplied by 50% plus 4% for each year in excess of 20 years of service (Maximum benefit, 90% of final average salary). Effective July 1, 2008 for Fire members only with at least 20 years of service, the monthly allowance consists of final average salary multiplied by 3.0% for each year of service (maximum benefit, 90% of final average salary).
Early Service Retirement
Retirement at age 50 to 55 with at least 20 years of service: Members’ retirement allowance shall be calculated as if the members were at least 55, and then reduced according to guidelines set forth in Section 3.36.810 of the City of San Jose Municipal Code.
Mandatory Retirement
Age 70.
Survivorship Allowance
The surviving spouse will receive 37.5% of the final compensation if the member dies while entitled to
immediate retirement for service, dies at any age due to a service-connected injury or illness, is retired for service, or is retired for service-connected disability. Optional Retirement Allowances are available. For those that retire on or after February 4, 2000, the surviving spouse of a member who is entitled to a retirement benefit greater than 75% of final compensation gets a spousal benefit equal to 50% of the member benefit up to a maximum of 42.5% of final compensation. Effective July 1, 2008 for Fire only, the surviving spouse of a Fire member, who is entitled to a retirement benefit greater than 75% of final compensation gets a spousal benefit equal to 50% of the member benefit up to a maximum of 45%.
If the member dies before age 55 with two or more years of service due to a non-service-connected injury or illness, or if the member is retired for non-service-connected disability, the spouse will receive 24% of final compensation for two years of service and 0.75% for each year thereafter (Maximum: 37.5%).
In all cases above, Surviving child or children conceived prior to retirement will receive the following:
1 child receives 25% of the final compensation
2 children share 37.5% of the final compensation
3+ children share 50% of the final compensation
Unless the death is service-connected in which case the eligible child or children will receive the following:
1 child receives 25% of the final compensation
2 children share 50% of the final compensation
3+ children share 75% of the final compensation
The maximum family benefit is 75% of the final compensation. If the sum of spousal benefit plus the children’s benefit is greater than 75%, the children’s benefit is reduced. Dependent children are paid to age 18 or to age 22 if full-time students.
Remarriage of Spouse
If the employee is 55 at time of death and has twenty years of service, or the member is entitled to 30 years of service regardless of age, the spouse will retain allowance for life. If less than 20 years or under age 55, the spouse loses the allowance upon a remarriage, unless the person was an eligible surviving spouse as of October 1, 1999 or becomes an eligible surviving spouse of a member who had retired as of October 1, 1999.

20 Comprehensive Annual Financial Report 2010-2011 San José Police & Fire Department Retirement Plan
Summary of the Principal Plan Provisions (Continued)
Post-Retirement Marriage
Effective June 11, 2002, the Post-Retirement Optional Settlement allows for payment of an annuity to a spouse if a member marries after retirement. To do this, the member must take a reduced allowance to provide the spouse a benefit. The election of the Post-Retirement Optional Settlement must be filed within 30 days after the date of the marriage if a retiree marries after June 12, 2002. If the retiree marries after June 12, 2002, the election becomes effective one year from the date of marriage.
Management
The Plan is under the management of a nine member Board of Administration consisting of two active employees, one each from the Police Department and the Fire Department who are members of the Plan; two members who have retired under the provisions of the Plan, one formerly employed in the Police Department and one formerly employed in the Fire Department; and five public members.
The Board of Administration is a policy-making body and responsible for the proper operation of the Plan. The Plan operates as an independent trust, separate and distinct from the City and other entities. The administration of the Plan is under its guidance and direction and is subject to such rules, regulations and directives as it may adopt from time to time. The City Attorney provides legal advice and counsel.
Administration
A full-time Director is employed by the Board. He serves as Secretary and Chief Executive Officer to the Board of Administration. The Fund pays the cost of the personnel who are employed for the purpose of managing the Retirement Plan. It also pays any directly related administrative costs.
State Street Bank and Trust is employed as the custodian of fund assets and collector of investment income.
Actuarial Soundness
Cheiron Inc. is retained for regular, continuing actuarial services. Plan and benefit provisions are periodically reviewed to ensure continuing actuarial soundness.
Investment Authority and Policy
The investment authority is broad and flexible, allowing maximum utilization of the System’s resources. Nationally known investment advisory services from managers listed on page 86 are retained for full-time investment counsel. NEPC, LLC is retained as the pension consultant.
Cost of Living
The cost-of-living (COL) provision provides a flat 3% annual adjustment in February. Survivors will be paid their first COL increase as if they were a new retiree according to the above schedule.


City of San José
Comprehensive Annual Financial Report
for the Fiscal Year Ended June 30, 2011
FinancialSection

24 Comprehensive Annual Financial Report 2010-2011 San José Police & Fire Department Retirement Plan
Independent Auditor’s Report
Board of Administration of the City of San José Police and Fire Department Retirement PlanSan José, California
We have audited the accompanying statements of plan net assets of the City of San José Police and Fire Department Retirement Plan (Plan), a pension trust fund of the City of San José, California, as of June 30, 2011 and 2010, and the related statements of changes in plan net assets for the years then ended. These financial statements are the responsibility of the Plan’s management. Our responsibility is to express an opinion on these financial statements based on our audits.
We conducted our audits in accordance with auditing standards generally accepted in the United States of America and the standards applicable to financial audits contained in Government Auditing Standards, issued by the Comptroller General of the United States. Those standards require that we plan and perform the audit to obtain reasonable assurance about whether the financial statements are free of material misstatement. An audit includes consideration of internal control over financial reporting as a basis for designing audit procedures that are appropriate in the circumstances, but not for the purpose of expressing an opinion on the effectiveness of the Plan’s internal control over financial reporting. Accordingly, we express no such opinion. An audit also includes examining, on a test basis, evidence supporting the amounts and disclosures in the financial statements, assessing the accounting principles used and the significant estimates made by management, as well as evaluating the overall financial statement presentation. We believe that our audits provide a reasonable basis for our opinion
As discussed in Note 2(a), the financial statements of the Plan are intended to present only the plan net assets and changes in plan net assets of the Plan. They do not purport to, and do not, present fairly the financial position of the City of San José, California, as of June 30, 2011 and 2010, and the changes in its financial position for the years then ended in conformity with accounting principles generally accepted in the United States of America.
In our opinion, the financial statements referred to above present fairly, in all material respects, the plan net assets of the Plan as of June 30, 2011 and 2010, and the changes in plan net assets for the years then ended in conformity with accounting principles generally accepted in the United States of America.
As described in Note 5, based on the most recent actuarial valuation as of June 30, 2010, the Plan’s independent actuaries determined that, at June 30, 2010, the value of the defined benefit pension plan’s actuarial accrued liability exceeded the actuarial value of its assets by $654 million. As described in Note 6, based on the most recent actuarial valuation as of June 30, 2010, the Plan’s independent actuaries determined that, at June 30, 2010, the value of the postemployment healthcare plan’s actuarial accrued liability exceeded the actuarial value of its assets by $888 million. The most recent actuarial value of assets as of June 30, 2010 does not reflect the impact of deferred investment losses of $354 million that will be recognized in future valuations for both the defined benefit and postemployment healthcare plans.

25 Comprehensive Annual Financial Report 2010-2011 San José Police & Fire Department Retirement Plan
Independent Auditor’s Report (Continued)
In accordance with Government Auditing Standards, we have also issued our report dated November 30, 2011 on our consideration of the Plan’s internal control over financial reporting and on our tests of its compliance with certain provisions of laws, regulations, contracts, and grant agreements and other matters for the year ended June 30, 2011. The purpose of that report is to describe the scope of our testing of internal control over financial reporting and compliance and the results of that testing, and not to provide an opinion on internal control over financial reporting or on compliance. That report is an integral part of an audit performed in accordance with Government Auditing Standards and should be considered in assessing the results of our audit.
Accounting principles generally accepted in the United States of America require that the management’s discussion and analysis and the Schedules of Funding Progress and Employer Contributions, as listed in the table of contents, be presented to supplement the basic financial statements. Such information, although not a part of the basic financial statements, is required by the Governmental Accounting Standards Board who considers it to be an essential part of financial reporting for placing the basic financial statements in an appropriate operational, economic, or historical context. We have applied certain limited procedures to the required supplementary information in accordance with auditing standards generally accepted in the United States of America, which consisted of inquiries of management about the methods of preparing the information and comparing the information for consistency with management’s responses to our inquiries, the basic financial statements, and other knowledge we obtained during our audits of the basic financial statements. We do not express an opinion or provide any assurance on the information because the limited procedures do not provide us with sufficient evidence to express an opinion or provide any assurance.
Our audits were conducted for the purpose of forming an opinion on the financial statements as a whole. The introductory section, other supplementary information in the financial section, investment section, actuarial section and statistical section as listed in the table of contents are presented for purposes of additional analysis and are not a required part of the financial statements. The other supplementary information in the financial section is the responsibility of management and was derived from and relates directly to the underlying accounting and other records used to prepare the financial statements. The information has been subjected to the auditing procedures applied in the audit of the financial statements and certain additional procedures, including comparing and reconciling such information directly to the underlying accounting and other records used to prepare the financial statements or to the financial statements themselves, and other additional procedures in accordance with auditing standards generally accepted in the United States of America. In our opinion, the information is fairly stated in all material respects in relation to the financial statements as a whole. The introductory, investment, actuarial and statistical sections have not been subjected to the auditing procedures applied in the audits of the basic financial statements and, accordingly, we do not express an opinion or provide any assurance on them.
Walnut Creek, CaliforniaNovember 30, 2011

26 Comprehensive Annual Financial Report 2010-2011 San José Police & Fire Department Retirement Plan
Management’s Discussion and Analysis (Unaudited)
Board of Administration Police and Fire Department Retirement Plan 1737 North First Street, Suite 580 San José, California 95112-4505
We are pleased to provide this overview and analysis of the financial activities of the Police and Fire Department Retirement Plan (the Plan) for the fiscal years ended June 30, 2011 and 2010. The Plan, consisting of a single employer Defined Benefit Pension Plan and a Postemployment Healthcare Plan, was established to provide retirement benefits for sworn employees of the Police and Fire Departments of the City of San José (City). We encourage readers to consider the information presented here in conjunction with additional information that we have furnished in our Letter of Transmittal, which begins on page 11 of this report, and in the financial section which follows this discussion.
Financial Highlights for Fiscal Year 2011
•ThenetassetsofthePlanatthecloseofthefiscalyear 2011 are $2,687,397,000 (net assets held in trust for pension benefits and postemployment healthcare benefits.) All of the net assets are available to meet the Plan’s ongoing obligations to Plan participants and their beneficiaries except the supplemental retiree benefit reserve of $33,343,000.
•ThePlan’stotalnetassetsheldintrustforpension benefits and postemployment healthcare benefits increased by approximately $372,527,000 or 16.1%, primarily as a result of the Plan’s diversified asset allocation and overall improvement in the financial market. In the previous fiscal year the Board approved an asset allocation that diversified the portfolio structure and reduced risk by approximately 10% from the prior asset allocation.
•AdditionstoPlannetassetsfortheyearwere $541,120,000, which includes member and employer contributions of $135,777,000, net investment income before securities lending income of $402,801,000, and net securities lending income of $2,542,000.
•DeductionsfromPlannetassetsincreasedfrom $145,041,000 to $168,593,000 to over the prior year, or approximately 16.2% due primarily to increased retirement benefit payments and healthcare insurance premiums.
Overview of the Financial Statements
The following discussion and analysis are intended to serve as an introduction to the Plan’s financial statements, which are comprised of these components:
1. Statements of Plan Net Assets 2. Statements of Changes in Plan Net Assets 3. Notes to Basic Financial Statements
Please note, however, that this report also contains required supplementary information and other supplemental information in addition to the basic financial statements themselves.
The Statements of Plan Net Assets are a snapshot of account balances at fiscal year-end. It indicates the assets available for future payments to retirees and any current liabilities that are owed at this time.
The Statements of Changes in Plan Net Assets, on the other hand, provide a view of current year additions to and deductions from the Plan.
Both statements are in compliance with generally accepted accounting principles (GAAP) as set forth by the Governmental Accounting Standards Board. GAAP requires state and local government pension plan and postemployment benefit plan reports to use full accrual accounting and make certain disclosures. The Plan complies with all significant requirements of these pronouncements.
The Statements of Plan Net Assets and the Statements of Changes in Plan Net Assets report information about the Plan’s activities. These statements include all assets and liabilities using the full accrual basis of accounting, which recognizes contributions as revenue when due pursuant to formal commitments as well as statutory and contractual commitments and benefits and refunds of contributions when due and payable under the provisions of the Plan. All of the current year’s additions and deductions are taken into account regardless of when cash is received or paid. All realized investment gains and losses are reported at the trade date, not the settlement date. In addition, both realized and unrealized gains and losses on investments are reported.
These two statements report the Plan’s net assets held in trust for pension benefits and postemployment healthcare benefits (net assets)—the difference between assets and liabilities. Over time, increases and decreases in the Plan’s net assets are one indicator of whether its financial health is improving or deteriorating. Other factors, such as the Plan’s funding progress and funded status, should also be considered in measuring the Plan’s overall health (see the Schedules of Funding Progress and Schedules of Employer Contributions on pages 60-61 of this report).

27 Comprehensive Annual Financial Report 2010-2011 San José Police & Fire Department Retirement Plan
Management’s Discussion and Analysis (Unaudited) (Continued)
Notes to Basic Financial Statements provide additional information that is essential to a full understanding of the data provided in the financial statements (see Notes to Basic Financial Statements on pages 39-59 of this report).
Other Information In addition to the financial statements and accompanying notes, this report presents certain required supplementary information concerning employer contributions and the Plan’s progress in funding its obligations to provide pension and postemployment healthcare benefits to members (see Required Supplemen- tary Information beginning on page 60 of this report).
The combining schedules of Defined Benefit Pension Plan net assets and changes in net assets, schedules of administrative expenses, investment manager fees and other investment expenses, and payments to consultants are presented immediately following the required supplementary information.
Financial Analysis
As previously noted, net assets may serve over time as a useful indication of the Plan’s financial position (see Tables 1a and 1c on page 28). The assets of the Plan exceeded its current liabilities at the close of fiscal year 2011 and 2010.
The funded status of the Plan should also be considered when evaluating the Plan’s financial health. As of June 30, 2010, the Plan’s most recent valuation date, the actuarial funded status of the Plan decreased from 86.7% to 79.8% for the Defined Benefit Pension Plan. On a market value of assets basis as of June, 30, 2010, the funded status of the Defined Benefit Pension Plan was 69.1% resulting in a variance of 10.7% between the funded ratios calculated under the two bases. A Schedule of Funding Progress for the Defined Benefit Pension Plan on a market value of assets basis and a description of the variance between the actuarial value of assets and market value of assets is presented in the other supplemental information on page 62. The decrease in Plan’s funded status (on an actuarial basis) was primarily due to a $260 million increase in the unfunded actuarial accrued liability (UAAL). The increase in the UAAL was primarily due to unfavorable investment returns (after smoothing) and the reduction in the investment return assumption from 8.0% to 7.75%, which was slightly offset by lower than expected salary increases. The Postemployment Healthcare Plan’s actuarial funded status decreased from 7% to 6%.
As of June 30, 2011, $2,627,727,000 and $59,670,000 in total net assets are held by the Defined Benefit Pension Plan and Postemployment Healthcare Plan, respectively (see Tables 1a and 1c on page 28. All of the net assets are available to meet the Plan’s ongoing obligation to plan participants and their beneficiaries, except assets held in the supplemental retiree benefit reserve (a reserve in the Defined Benefit Pension Plan), of $33,343,000,
which is used to provide negotiated supplemental benefits to retirees. The total net assets for the Defined Benefit Pension Plan and Postemployment Healthcare Plan increased by 16.1% and 17.4%, respectively, from the prior year primarily due to the net appreciation in the fair value of investments of $336,027,000. The appreciation in the fair value of investments was due to the recovery in the investment markets and the Plan’s implementation of an improved asset allocation strategy with higher allocation to fixed income and alternative investments, which have performed well over the past two fiscal years. In the current fiscal year the Plan continued to implement and invest in an asset allocation with increased allocation to alternative investments. The Plan’s current asset allocation is discussed in detail in Note 2(c) of the financial statements on page 41. In the previous year, the Plan held $2,264,050,000 and $50,820,000 in total net assets for the Defined Benefit Pension Plan and the Postemployment Healthcare Plan, respectively (see Tables 1b and 1d on page 28). This total represented an increase of 13.1% for pension benefits and 18.8% for postemployment healthcare benefits net assets over the prior year primarily due to the appreciation in the fair value of investments of $256,176,000 due to the Plan’s transition to a new and improved asset allocation strategy with higher allocation to fixed income and alternative investments, which performed well.
As of June 30, 2011, receivables decreased by $16,264,000 or 40.1% and $287,000 or 15.1% in the Defined Benefit Pension Plan and Postemployment Healthcare Plan, respectively, due to a decrease in receivables from brokers and others for year-end investment trades. In the previous year, receivables for the Defined Benefit Pension Plan and the Postemployment Healthcare Plan decreased by $14,719,000 or 26.6% and $251,000 or 11.6%, respectively, also due to the amount of receivables from brokers and others for year-end investment trades.
As of June 30, 2011, total liabilities for the Defined Benefit Pension Plan and the Postemployment Healthcare Plan decreased by $109,382,000, or 23.4% and $2,295,000 or 22.2%, respectively, compared with June 30, 2010, due mainly to a decrease in payables to brokers and others for year-end investment trades and securities lending collateral due to borrowers. The decrease in securities lending balance from the prior year was due to a decline in market demands for securities in the market as of June 30, 2011. In the previous year, total liabilities for the Defined Benefit Pension Plan and the Postemployment Healthcare Plan increased by $167,869,000, or 56.0% and $4,055,000 or 64.8%, respectively, due mainly to an increase securities lending collateral due to borrowers and accounts payable for administrative expenses and real estate activity.

28 Comprehensive Annual Financial Report 2010-2011 San José Police & Fire Department Retirement Plan
Management’s Discussion and Analysis (Unaudited) (Continued)
POLICE AND FIRE PLAN’S DEFINED BENEFIT PENSION PLAN NET ASSETS (Table 1b) As of June 30, 2010, and 2009
2010 2009Increase/(Decrease)
AmountIncrease/(Decrease)
Percent
Receivables $ 40,587,000 $ 55,306,000 $ (14,719,000) -26.6%
Investments at Fair Value 2,691,195,000 2,246,016,000 445,179,000 19.8%
Total Assets 2,731,782,000 2,301,322,000 430,460,000 18.7%
Current Liabilities 467,732,000 299,863,000 167,869,000 56.0%
Total Liabilities 467,732,000 299,863,000 167,869,000 56.0%
Net Assets $ 2,264,050,000 $ 2,001,459,000 $ 262,591,000 13.1%
POLICE AND FIRE PLAN’S POSTEMPLOYMENT HEALTHCARE PLAN NET ASSETS (Table 1c) As of June 30, 2011, and 2010
2011 2010Increase/(Decrease)
AmountIncrease/(Decrease)
Percent
Receivables $ 1,619,000 $ 1,906,000 $ (287,000) -15.1%
Investments at Fair Value 66,071,000 59,229,000 6,842,000 11.6%
Total Assets 67,690,000 61,135,000 6,555,000 10.7%
Current Liabilities 8,020,000 10,315,000 (2,295,000) -22.2%
Total Liabilities 8,020,000 10,315,000 (2,295,000) -22.2%
Net Assets $ 59,670,000 $ 50,820,000 $ 8,850,000 17.4%
POLICE AND FIRE PLAN’S POSTEMPLOYMENT HEALTHCARE PLAN NET ASSETS (Table 1d) As of June 30, 2010, and 2009
2010 2009Increase/(Decrease)
AmountIncrease/(Decrease)
Percent
Receivables $ 1,906,000 $ 2,157,000 $ (251,000) -11.6%
Investments at Fair Value 59,229,000 46,886,000 12,343,000 26.3%
Total Assets 61,135,000 49,043,000 12,092,000 24.7%
Current Liabilities 10,315,000 6,260,000 4,055,000 64.8%
Total Liabilities 10,315,000 6,260,000 4,055,000 64.8%
Net Assets $ 50,820,000 $ 42,783,000 $ 8,037,000 18.8%
POLICE AND FIRE PLAN’S DEFINED BENEFIT PENSION PLAN NET ASSETS (Table 1a) As of June 30, 2011, and 2010
2011 2010Increase/(Decrease)
AmountIncrease/(Decrease)
Percent
Receivables $ 24,323,000 $ 40,587,000 $ 16,264,000) -40.1%
Investments at Fair Value 2,961,754,000 2,691,195,000 270,559,000 10.1
Total Assets 2,986,077,000 2,731,782,000 254,295,000 9.3%
Current Liabilities 358,350,000 467,732,000 (109,382,000) -23.4%
Total Liabilities 358,350,000 467,732,000 (109,382,000) -23.4%
Net Assets $ 2,627,727,000 $ 2,264,050,000 $ 363,677,000 16.1%

29 Comprehensive Annual Financial Report 2010-2011 San José Police & Fire Department Retirement Plan
Management’s Discussion and Analysis (Unaudited) (Continued)
Reserves
The Plan is required by the City of San José Municipal Code to establish various reserves in the Plan net assets. The Plan net assets are allocated between the Defined Benefit Pension Plan (which includes the Retirement Fund and the Cost-of-Living Fund) and the Postemployment Healthcare Plan. Within the Defined Benefit Pension Plan Retirement Fund there are three reserves: the general reserve, employee contributions reserve, and supplemental retiree benefit reserve.
The Postemployment Healthcare Plan has a general reserve and employee contributions reserve. See table on page 38 for a complete listing and year-end balances of the Plan’s reserves.
The Plan’s reserves are established from contributions and the accumulation of investment income, after satisfying investment and administrative expenses. Additionally, the appreciation in the fair value of investments is held in the unrealized gain/loss account, a component of the general reserve.
POLICE AND FIRE PLAN’S DEFINED BENEFIT PENSION PLAN NET ASSETS
(Tables 1a and 1b) As of June 30, 2011, 2010, and 2009 (in Millions)
POLICE AND FIRE PLAN’S POSTEMPLOYMENT HEALTHCARE PLAN NET ASSETS
(Tables 1c and 1d) As of June 30, 2011, 2010, and 2009 (in Millions)
0
500
1000
1500
2000
2500
$ 3000
NetAssets
TotalLiabilities
TotalAssets
2009
2010
2011
0
10
20
30
40
50
60
70
$ 80
2009
2010
2011
NetAssets
TotalLiabilities
TotalAssets

30 Comprehensive Annual Financial Report 2010-2011 San José Police & Fire Department Retirement Plan
Management’s Discussion and Analysis (Unaudited) (Continued)
CHANGES IN PLAN NET ASSETS FOR THE POLICE AND FIRE PLAN’S DEFINED BENEFIT PENSION PLAN (Table 2a) For the Fiscal Years Ended June 30, 2011 and 2010
2011 2010Increase/(Decrease)
Amount
Increase/(Decrease)
Percent
Employee Contributions $ 29,629,000 $ 20,097,000 $ 9,532,000 47.4%
Employer Contributions 77,918,000 52,315,000 25,603,000 48.9%
Net Investment Income* 393,892,000 306,878,000 87,014,000 28.4%
Net Securities Lending Income 2,485,000 7,575,000 (5,090,000) -67.2%
Total Additions 503,924,000 386,865,000 117,059,000 30.3%
* Net of Investment Expenses of $9,604,000 and $9,056,000 in 2011 and 2010, respectively.
Retirement Benefits 129,472,000 114,604,000 14,868,000 13.0%
Death Benefits 7,213,000 6,519,000 694,000 10.6%
Refund of Contributions 435,000 196,000 239,000 121.9%
Administrative 3,127,000 2,955,000 172,000 5.8%
Total Deductions 140,247,000 124,274,000 15,973,000 12.9%
Net Increase in Plan Assets 363,677,000 262,591,000 101,086,000 38.5%
Beginning Net Assets 2,264,050,000 2,001,459,000 262,591,000 13.1%
Ending Net Assets $ 2,627,727,000 $ 2,264,050,000 $ 363,677,000 16.1%
CHANGES IN PLAN NET ASSETS FOR THE DEFINED BENEFIT PENSION PLAN (Table 2b) For the Fiscal Years Ended June 30, 2010 and 2009
2010 2009Increase/(Decrease)
Amount
Increase/(Decrease)
Percent
Employee Contributions $ 20,097,000 $ 20,323,000 $ (226,000) -1.1%
Employer Contributions 52,315,000 53,103,000 (788,000) -1.5%
Net Investment Income* 306,878,000 (461,991,000) 768,869,000 166.4%
Net Securities Lending Income 7,575,000 (7,244,000) 14,819,000 204.6%
Total Additions 386,865,000 (395,809,000) 782,674,000 197.7%
* Net of Investment Expenses of $9,056,000 and $9,037,000 in 2010 and 2009, respectively.
Retirement Benefits 114,604,000 102,363,000 12,241,000 12.0%
Death Benefits 6,519,000 5,982,000 537,000 9.0%
Refund of Contributions 196,000 363,000 (167,000) -46.0%
Administrative 2,955,000 2,669,000 286,000 10.7%
Total Deductions 124,274,000 111,377,000 12,897,000 11.6%
Net Increase/(Decrease) in Plan Assets 262,591,000 (507,186,000) 769,777,000 151.8%
Beginning Net Assets 2,001,459,000 2,508,645,000 (507,186,000) -20.2%
Ending Net Assets $ 2,264,050,000 $ 2,001,459,000 $ 262,591,000 13.1%

31 Comprehensive Annual Financial Report 2010-2011 San José Police & Fire Department Retirement Plan
Management’s Discussion and Analysis (Unaudited) (Continued)
CHANGES IN PLAN NET ASSETS FOR THE POLICE AND FIRE PLAN’S POSTEMPLOYMENT HEALTHCARE PLAN (Table 2c) For the Fiscal Years Ended June 30, 2011 and 2010
2011 2010Increase/(Decrease)
Amount
Increase/(Decrease)
Percent
Employee Contributions $ 11,229,000 $ 10,650,000 $ 579,000 5.4%
Employer Contributions 17,001,000 11,284,000 5,717,000 50.7%
Net Investment Income* 8,909,000 6,701,000 2,208,000 33.0%
Net Securities Lending Income 57,000 169,000 (112,000) -66.3%
Total Additions 37,196,000 28,804,000 8,392,000 29.1%
* Net of Investment Expenses of $220,000 and $200,000 in 2011 and 2010, respectively.
Healthcare Insurance Premiums 28,273,000 20,701,000 7,572,000 36.6%
Administrative 73,000 66,000 7,000 10.6%
Total Deductions 28,346,000 20,767,000 7,579,000 36.5%
Net Increase in Plan Assets
8,850,000 8,037,000 813,000 10.1%
Beginning Net Assets 50,820,000 42,783,000 8,037,000 18.8%
Ending Net Assets $ 59,670,000 $ 50,820,000 $ (8,037,000) -15.8%
CHANGES IN PLAN NET ASSETS FOR THE POLICE AND FIRE PLAN’S POSTEMPLOYMENT HEALTHCARE PLAN (Table 2d) For the Fiscal Years Ended June 30, 2010 and 2009
2010 2009Increase/(Decrease)
Amount
Increase/(Decrease)
Percent
Employee Contributions $ 10,650,000 $ 9,218,000 $ 1,432,000 15.5%
Employer Contributions 11,284,000 9,888,000 1,396,000 14.1%
Net Investment Income* 6,701,000 (9,649,000) 16,350,000 -169.4%
Net Securities Lending Income 169,000 (151,000) 320,000 -211.9%
Total Additions 28,804,000 9,306,000 19,498,000 209.5%
* Net of Investment Expenses of $200,000 and $189,000 in 2010 and 2009, respectively.
Healthcare Insurance Premiums 20,701,000 18,039,000 2,662,000 14.8%
Administrative 66,000 60,000 6,000 10.0%
Total Deductions 20,767,000 18,099,000 2,668,000 14.7%
Net Increase/(Decrease) in Net Plan Assets
8,037,000 (8,793,000) 16,830,000 191.4%
Beginning Net Assets 42,783,000 51,576,000 (8,793,000) -17.0%
Ending Net Assets $ 50,820,000 $ 42,783,000 $ 8,037,000 18.8%

32 Comprehensive Annual Financial Report 2010-2011 San José Police & Fire Department Retirement Plan
Management’s Discussion and Analysis (Unaudited) (Continued)
The Police and Fire Activities
Market returns were the main driver of the increase in the Defined Benefit Pension Plan and Postemployment Healthcare Plan net assets, which increased by $372,527,000, thereby accounting for a 16.1% increase from the prior year. Key elements of the Plan’s financial activities are described in the sections that follow.
Additions to Plan Net Assets
The assets needed to finance retirement benefits are accumulated through the collection of employer and employee contributions and through earnings on investments (net of investment expense). Additions to the Defined Benefit Pension Plan and Postemployment Healthcare Plan for the fiscal year ended June 30, 2011, were $503,924,000 and $37,196,000, respectively (see Tables 2a and 2c on pages 30-31).
For the fiscal year ended June 30, 2011, overall additions for the Defined Benefit Pension Plan and Postemployment Healthcare Plan had increased by $117,059,000 and $8,392,000, or 30.3% and 29.1%, respectively, from the prior year primarily due to increases of $87,014,000 and $2,208,000, respectively, in net investment income excluding securities lending income, which was a result of the implementation and investment in the Plan’s diversified asset allocation and overall improvement in the financial markets. The new asset allocation strategy adopted by the Board in fiscal year 2010 increased the Plan’s allocation to fixed income and alternative investments, which performed well over the past two fiscal years. The Plan’s asset allocation strategy increased the allocation to alternative investments while reducing the allocation to equity investments. The new allocation strategy reduced the equity exposure by 9% from 49% to 40% of the Plan. The Plan’s time-weighted gross rate of return for the fiscal year ended June 30, 2011, was 18.4% compared to 14.3% for the fiscal year ended June 30, 2010. On a net of management fee expenses basis, the Plan’s time-weighted rate of return for the fiscal year ended June 30, 2011, was 18.1% compared to 14.0% for the fiscal year ended June 30, 2010.
Additions to the Defined Benefit Pension Plan and Postemployment Healthcare Plan for fiscal year ended June 30, 2010, increased by $782,674,000 and $19,498,000, or 197.7% and 209.5%, respectively, from the prior year primarily due to increases of $768,869,000 and $16,350,000, respectively, in net investment income excluding securities lending income, which was as a result of the Plan’s transition to a new diversified asset allocation and overall improvement in the financial markets. In addition, as of June 30, 2010, the Plan’s investment in securities lending activities had positive returns compared to securities lending losses in 2009 (see Tables 2b and 2d on pages 30-31).
Deductions from Plan Net Assets
The Plan was created to provide lifetime retirement annuities, survivor benefits, permanent disability benefits, and postemployment healthcare benefits to qualified members and their beneficiaries. The cost of such programs includes recurring benefit payments and healthcare premium payments, as designated by the Plan, refund of contributions to terminated employees, and the cost of administering the Plan.
Deductions for the fiscal year ended June 30, 2011, totaled $140,247,000 and $28,346,000 for the Defined Benefit Pension Plan and Postemployment Healthcare Plan, respectively. Deductions for the Defined Benefit Pension Plan increased by 12.9% from the previous year due to an increase in retirees and beneficiaries, and final average salaries (see Table 2a on page 30). Deductions for the Postemployment Healthcare Plan, increased by 36.5% over the previous year due to increased healthcare insurance premium costs and the reporting of the actuarially determined implicit rate subsidy amount of $4,939,000. The Plan also reported corresponding employer contributions in the same amount.
Deductions for the fiscal year ended June 30, 2010, totaled $124,274,000 and $20,767,000 for the Defined Benefit Pension Plan and Postemployment Healthcare Plan, respectively. Deductions for the Defined Benefit Pension Plan increased by 11.6% from the previous year due to an increase in retirees and beneficiaries, and final average salaries (see Tables 2b and 2d on pages 30-31). Deductions for the Postemployment Healthcare Plan, of $20,767,000 increased by 14.7% over the previous year due to increased healthcare insurance premium costs (see Table 2d on page 31).
The Plan’s Fiduciary Responsibilities
The Plan’s Board is the fiduciary of the Defined Benefit Pension Plan and a Postemployment Healthcare Plan. Under the California Constitution and the San José Municipal Code, Plan assets can only be used for the exclusive benefit of plan participants and their beneficiaries.
Economic Factors and Rates Affecting Next Year
The Plan’s most recent annual valuation as of June 30, 2010, was used to determine the contribution rates effective June 26, 2011, for fiscal year 2011-2012. The annual required contribution rates and dollar amounts calculated in the June 30, 2010, valuation were adopted by the Board and became effective in fiscal year 2011-2012.

33 Comprehensive Annual Financial Report 2010-2011 San José Police & Fire Department Retirement Plan
Management’s Discussion and Analysis (Unaudited) (Continued)
Defined Benefit Pension Plan
The Plan’s funding objective is to meet long-term benefit obligations through contributions and investment income. The Plan’s actuarial valuation uses a five year smoothing method for investment returns. This means that the current year’s gains or losses, as calculated at year-end, are smoothed with the results from the prior four years. The investment income, including securities lending and excluding investment expenses, of $406 million for fiscal year 2011 will be smoothed and netted against the remaining 2010 actuarial valuation unrecognized investment losses of approximately $354 million ($346 million pension benefits plus $8 million postemployment benefits) both before and after the application of the 80%-120% market value of assets corridor applicable as of June 30, 2010. This is a reduction from the deferred loss of $613 million after the application of the 70%-130% corridor applicable in the June 30, 2009 valuation. The market value of assets corridor limits the smoothing of assets to be no greater than 120% and no less than 80% of the market value of assets as of June 30, 2010. Under this practice, investment gains or losses would be recognized immediately if necessary to maintain the smoothed assets within the 80-120% market value corridor rather than be smoothed over the next five years.
Additionally, the June 30, 2010 valuation included a 0.49% or approximately $1.3 million reduction in the City’s pension contribution rate effective June 26, 2011. The reduction in the City’s contribution rate was a result of a transfer from the Supplemental Retiree Benefit Reserve (SRBR) due to poor investment earnings. Per San José Municipal code section 3.36.580(c), if the City’s contribution rate as determined by the Board’s actuary during any actuarial valuation will increase as a result of poor investment earnings in the retirement fund, the SRBR reserve will transfer an amount equal to ten percent of the City’s increased contributions for the first twelve months following the increase in the contribution rates, but the transfer will not exceed five percent of the accrued balance in the SRBR reserve as of the date of the actuarial valuation.
The Plan is exposed to general market risk. In a pension plan context, this is the risk that the long-term rate of return earned on the pension plan assets could be below the actuarially assumed rate of return, which is 7.75%, net of SRBR payments and investment and administrative expenses. Underperforming the assumed rate of return would negatively impact the funded status of the Plan and the City’s required contribution to the Plan.
In addition to investment market risk, the Plan is exposed to non-economic or demographic risk. The demographic assumptions which include rates of retirement, disability
and mortality are often unique to the Plan’s provisions and the specific demographics of the Plan participants. Deviations from these long term actuarial assumptions cause the Plan to experience gains or losses which in turn leads to volatility in the contribution rate. To minimize this risk every two years, the Plan’s actuary conducts an experience study to assess whether the experience of the Plan is conforming to the long term actuarial assumptions. The actuarial assumptions may be adjusted where it is felt that current assumptions will not provide the best expectation of what may happen in the future.
The June 30, 2011 pension valuation is anticipated to include decreased covered payroll due to the City’s continued budget cuts. To mitigate the risk of not collecting the annual required contribution, in January 2011, the Board adopted a funding policy setting the annual required contribution to be the greater of the dollar amount reported in the actuarial valuation and dollar amount determined by applying the percentage of payroll reported in the valuation to the actual payroll for the fiscal year. The annual required contribution determined in the June 30, 2010 valuation for fiscal year ending June 30, 2012 is the greater of $120,797,917 (if paid on 07/01/2011) and 49.29% and 51.05% of actual payroll for the police and fire, respectively, for the fiscal year. On July 1, 2011, the City funded the annual required contribution dollar amount.
Postemployment Healthcare Plan
This year the Plan completed its fourth GASB Statement No. 43 compliant Other Postemployment Benefits (OPEB) valuation study as of June 30, 2010. A summary of the results is presented in Note 6 to the Financial Statements. The June 30, 2011 OPEB valuation will include increased contributions for the Fire members as a result of the Memorandum of Agreement (MOA) entered into by the Fire members and the City of San Jose, on March 3, 2011, to increase the contribution rates for retiree health and dental in order to phase-in to full funding of the GASB Statement No. 43 annual required contribution over the next five years. Fiscal year 2012 will be the first year of the phase-in for the fire members of the Plan. In the MOA the City and fire members of the Plan agreed that the Plan and member cash contribution rate shall not have an incremental increase of more than 1.25% and 1.35% of pensionable pay in each year for the members and City, respectively. Additionally, if the retiree healthcare contributions exceed 10% of member and 11% of City contributions (excluding the implicit rate subsidy) the parties shall meet and confer on how to address the contributions above 10% and 11%.
The June 30, 2011 OPEB valuation will also include continued increased OPEB contributions for Police members as a result of the Memorandum of Agreement

34 Comprehensive Annual Financial Report 2010-2011 San José Police & Fire Department Retirement Plan
Management’s Discussion and Analysis (Unaudited) (Continued)
(MOA) entered into by the Police members of the Plan and the City of San José, on June 28, 2009, to increase the contribution rates for retiree health and dental in order to phase-in to full funding of the GASB Statement No. 43 annual required contribution over five years. Fiscal year 2010 was the first year of the phase-in for the police members of the Plan. In the MOA the City and Police members of the Plan agreed that the Plan and member cash contribution rate shall not have an incremental increase of more than 1.25% and 1.35% of pensionable pay in each year for the members and City, respectively. Additionally, if the retiree healthcare contributions exceed 10% of member and 11% of City contributions (excluding the implicit rate subsidy) the parties shall meet and confer on how to address the contributions above 10% and 11%.
Requests for Information
This financial report is designed to provide the Board of Administration, Mayor and City Council, our membership, taxpayers, and investment managers with a general overview of the Plan’s finances and to account for the money it receives. Questions concerning any of the information provided in this report or requests for additional financial information should be addressed to:
Police and Fire Department Retirement Plan 1737 North First Street, Suite 580 San José, California 95112-4505
Respectfully Submitted,
Russell U. Crosby Director

35 Comprehensive Annual Financial Report 2010-2011 San José Police & Fire Department Retirement Plan

36 Comprehensive Annual Financial Report 2010-2011 San José Police & Fire Department Retirement Plan
Basic Financial StatementsSTATEMENTS OF PLAN NET ASSETS June 30, 2011 and 2010 (In Thousands)
2011
Defined Benefit Pension Plan
Postemployment Healthcare Plan
Total
Assets:
Receivables:
Employee contributions $ 1,457 $ 625 $ 2,082
Employer contributions 3,429 549 3,978
Brokers and others 11,271 261 11,532
Accrued investment income 8,166 184 8,350
Total receivables 24,323 1,619 25,942
Investments, at fair value:
Securities and other:
Domestic fixed income 652,124 14,545 666,669
International fixed income 15,081 336 15,417
Pooled fixed income bond funds 11,111 248 11,359
Collective shor t term investments 39,596 883 40,479
Corporate conver tible bonds 70,559 1,574 72,133
Domestic equity 659,107 14,701 673,808
International equity 348,622 7,776 356,398
Pooled international equity 166,973 3,724 170,697
Private equity 124,382 2,774 127,156
Oppor tunistic 117,242 2,615 119,857
Real assets 299,562 6,681 306,243
Real estate 124,258 2,771 127,029
International currency contracts, net 404 9 413
Securities lending cash collateral investment pool 332,733 7,434 340,167
Total investments 2,961,754 66,071 3,027,825
TOTAL ASSETS 2,986,077 67,690 3,053,767
Liabilities:Payable to brokers 20,364 469 20,833
Securities lending collateral due to borrowers 335,478 7,495 342,973
Other liabilities 2,508 56 2,564
TOTAL LIABILITIES 358,350 8,020 366,370
Net Assets Held In Trust For:Pension benefits 2,627,727 - 2,627,727
Postemployment healthcare benefits - 59,670 59,670
TOTAL NET ASSETS $ 2,627,727 $ 59,670 $ 2,687,397
See accompanying notes to basic financial statements. (Continued)

37 Comprehensive Annual Financial Report 2010-2011 San José Police & Fire Department Retirement Plan
Basic Financial Statements (Continued)
STATEMENTS OF PLAN NET ASSETS (continued) June 30, 2011 and 2010 (In Thousands)
See accompanying notes to basic financial statements. (Concluded)
Defined Benefit Pension Plan
Postemployment Healthcare Plan
Total
Assets
Receivables:
Employee contributions $ 1,031 $ 538 $ 1,569
Employer contributions 2,983 564 3,547
Brokers and others 27,880 613 28,493
Accrued investment income 8,693 191 8,884
Total receivables 40,587 1,906 42,493
Investments, at fair value:
Securities and other:
Domestic fixed income 873,516 19,066 892,582
International fixed income 24,537 536 25,073
Pooled fixed income bond funds 89,547 1,954 91,501
Collective short term investments 199,997 4,365 204,362
Corporate convertible bonds 16,242 354 16,596
Domestic equity 429,283 9,370 438,653
International equity 263,411 5,749 269,160
Pooled international equity 134,817 2,942 137,759
Private equity 104,027 2,271 106,298
Opportunistic - - -
Real assets (5,576) (122) (5,698)
Real estate 184,614 4,456 189,070
International currency contracts, net 488 11 499
Securities lending cash collateral investment pool 376,292 8,277 384,569
Total investments 2,691,195 59,229 2,750,424
TOTAL ASSETS 2,731,782 61,135 2,792,917
LiabilitiesPayable to brokers 80,558 1,772 82,330
Securities lending collateral due to borrowers 380,515 8,370 388,885
Other liabilities 6,659 173 6,832
TOTAL LIABILITIES 467,732 10,315 478,047
Net Assets Held In Trust For:Pension benefits 2,264,050 - 2,264,050
Postemployment healthcare benefits - 50,820 50,820
TOTAL NET ASSETS $ 2,264,050 $ 50,820 $2,314,870
2010

38 Comprehensive Annual Financial Report 2010-2011 San José Police & Fire Department Retirement Plan
Basic Financial Statements (Continued)
STATEMENTS OF CHANGES IN PLAN NET ASSETS For the Fiscal Years Ended June 30, 2011 and 2010 (In Thousands)
Defined Benefit Pension Plan
Postemployment Healthcare Plan
Total
Additions
Contributions:
Employee $ 29,629 $ 11,229 $ 40,858
Employer 77,918 17,001 94,919
Total contributions 107,547 28,230 135,777
Investment income:
Net appreciation in fair value of investments 328,588 7,439 336,027
Interest income 45,192 1,020 46,212
Dividend income 20,039 452 20,491
Net rental income 9,677 218 9,895
Less investment expense (9,604) (220) (9,824)
Net investment income before securities lending income 393,892 8,909 402,801
Securities lending income:
Earnings 3,625 83 3,708
Rebates (707) (16) (723)
Fees (433) (10) (443)
Net securities lending income 2,485 57 2,542
Net investment income 396,377 8,966 405,343
TOTAL ADDITIONS 503,924 37,196 541,120
Deductions
Retirement benefits 129,472 - 129,472
Healthcare insurance premiums - 28,273 28,273
Death benefits 7,213 - 7,213
Refund of contributions 435 - 435
Administrative expenses and other 3,127 73 3,200
TOTAL DEDUCTIONS 140,247 28,346 168,593
NET INCREASE 363,677 8,850 372,527
Net Assets Held In Trust For Pension Benefits and Postemployment Healthcare BenefitsHEALTHCARE BENEFITS:
BEGINNING OF YEAR 2,264,050 50,820 2,314,870
END OF YEAR $ 2,627,727 $ 59,670 $ 2,687,397
See accompanying notes to basic financial statements. (Continued)
2011

39 Comprehensive Annual Financial Report 2010-2011 San José Police & Fire Department Retirement Plan
Basic Financial Statements (Continued)
STATEMENTS OF CHANGES IN PLAN NET ASSETS (continued) For the Fiscal Years Ended June 30, 2011 and 2010 (In Thousands)
Defined Benefit Pension Plan
Postemployment Healthcare Plan
Total
Additions
Contributions:
Employee $ 20,097 $ 10,650 $ 30,747
Employer 52,315 11,284 63,599
Total contributions 72,412 21,934 94,346
Investment income:
Net depreciation in fair value of investments 250,701 5,475 256,176
Interest income 37,204 811 38,015
Dividend income 21,597 472 22,069
Net rental income 6,432 143 6,575
Less investment expense (9,056) (200) (9,256)
Net investment income before securities lending income 306,878 6,701 313,579
Securities lending income:
Earnings 8,522 189 8,711
Rebates (377) (8) (385)
Fees (570) (12) (582)
Net securities lending income 7,575 169 7,744
Net investment income 314,453 6,870 321,323
TOTAL ADDITIONS 386,865 28,804 415,669
DeductionsRetirement benefits 114,604 - 114,604
Healthcare insurance premiums - 20,701 20,701
Death benefits 6,519 - 6,519
Refund of contributions 196 - 196
Administrative expenses and other 2,955 66 3,021
TOTAL DEDUCTIONS 124,274 20,767 145,041
NET INCREASE 262,591 8,037 270,628
Net Assets Held In Trust For Pension Benefits and Postemployment Healthcare Benefits:BEGINNING OF YEAR 2,001,459 42,783 2,044,242
END OF YEAR $ 2,264,050 $ 50,820 $ 2,314,870
See accompanying notes to basic financial statements. (Concluded)
2010

40 Comprehensive Annual Financial Report 2010-2011 San José Police & Fire Department Retirement Plan
Notes to Financial StatementsNOTE 1 – DESCRIPTION OF THE PLAN
The following description of the City of San José Police and Fire Department Retirement Plan (Plan) is provided for financial reporting purposes only. Employees and members should refer to the City of San José Municipal Code for more complete information.
(a) General
The current Plan, consisting of a single employer Defined Benefit Pension Plan and a Postemployment Healthcare Plan, was established in 1961 and last amended by City Council Ordinance number 28915 adopted on May 24, 2011, to provide retirement benefits for certain employees of the City of San José (City). On January 27, 2011, the Plan submitted a request for compliance statement and favorable determination letter from the IRS under the streamline procedures of the voluntary compliance program for the Defined Benefit Pension Plan and a Postemployment Healthcare Plan.
The Postemployment Healthcare Plan was established under Internal Revenue Code Section 401(h) and is an account within the pension fund for retiree healthcare benefits funding and for the payment of retiree healthcare benefits. As a 401(h) plan, the healthcare plan benefits must be subordinate to the pension plan benefits. The medical benefits are considered subordinate if the actual contribution for medical benefits are no greater than 25% of actual contributions to both pension and medical benefits, ignoring contributions for past service benefit. The Plan’s actuary performs periodic reviews and projections of the Internal Revenue Code 25% subordination test.
The Plan is currently in the process of establishing a new Internal Revenue Code Section 115 trust at the request of the San Jose City Council to provide an alternative to the existing 401(h) account within the pension fund for retiree healthcare benefits funding and for the payment of retiree healthcare benefits.
The Plan is considered to be a part of the City’s financial reporting entity and is included in the City’s basic financial statements as a pension trust fund. The Plan is administered by the Director of Retirement Services, an employee of the City, under the direction of a Board of Administration. The contribution and benefit provisions and all other requirements are established by City ordinance. The Plan is responsible for all direct administrative costs except for certain support services, which are provided by the City. Total direct administrative expenses and other expenses amounted to approximately $3,200,000 and $3,021,000 for 2011 and 2010, respectively. These costs are financed through investment earnings.
All sworn officers of the City’s Police and Fire Departments are required to be members of the Plan. Participants of the Postemployment Healthcare Plan are also participants of the Defined Benefit Pension Plan.
As of June 30, 2011 and 2010, employee membership data related to the Plan was as follows:
The Plan is not subject to the provisions of the Employee Retirement Income Security Act of 1974.
(b) Pension Benefits
An employee with 10 or more years of service who resigns and leaves his/her contributions in the Plan; an employee who reaches the normal retirement age of 55 with 20 years of service; an employee of age 50 with 25 years of service; an employee of any age with 30 years of service; or an employee of age 70 with no service requirement is entitled to a monthly retirement allowance equal to the final average salary multiplied by 2.5% multiplied by years of service up to 30 years (maximum benefit, 75% of final average salary) if the employee retired prior to February 4, 1996. After February 4, 1996 but prior to February 4, 2000, the monthly allowance consists of final average salary multiplied by 2.5% for the first 20 years of service plus final average salary multiplied by 3% for the next ten years (maximum benefit, 80% of final average salary). After February 4, 2000, the monthly allowance consists of final average salary multiplied by 2.5% for the first 20 years of service, by 3% for the next 5 years of service and 4% for the next 5 years of service (maximum benefit, 85% of final average salary). Effective July 1, 2006, the monthly allowance for Police members only consists of final average salary multiplied by 2.5% for the first 20 years of service and by 4% for the next 10 years of service (maximum benefit, 90% of final average salary). Effective July 1, 2008, for Fire members only, the monthly allowance for a service retirement consists of final average salary multiplied by 2.5% for the first 20 years of service. If Fire members have more than 20 years of service, the monthly allowance consists of final average salary multiplied by 3.0% for each year of service (maximum benefit, 90% of final average salary).
Defined Benefit Pension Plan: 2011 2010
Retirees and beneficiaries currently receiving benefits*
1,889
1,790
Terminated vested members not yet receiving benefits
79
78
Active members 1,886 2,026
Total 3,854 3,894
Postemployment Healthcare Plan: 2011 2010
Retirees and beneficiaries currently receiving benefits*
1,798
1,712
Terminated vested members not yet receiving benefits
31
11
Active members 1,886 2,026
Total 3,715 3,749
*The combined domestic relations orders are not included in the count above as their benefit payment is included in the member count.

41 Comprehensive Annual Financial Report 2010-2011 San José Police & Fire Department Retirement Plan
Notes to Financial Statements (Continued)
NOTE 1 – DESCRIPTION OF THE PLAN (Continued)
Final average salary is the average monthly salary during the highest 12 consecutive months of service. However, if any of the that highest period is within the last 12 months of work, that highest year will be capped at 108% of the 12 months before the last 12 months of service. If none of the highest 12 months are in the last 12 months of service, there is no cap. In addition, retirement benefits are adjusted for an annual cost-of-living allowance (COLA). The current maximum COLA increase is 3% per year.
If employees terminate employment and elect to receive a return of contributions, the accumulated plan benefits attributable to the City’s contributions is forfeited; however, an employee’s accumulated contribution plus 2% interest per annum is refunded. Refunds are paid out on a lump-sum basis. The forfeited amount of the City’s contributions remains in the Plan.
(c) Death Benefits
Subject to a maximum of 42.5% of final average salary, the spouse or domestic partner receives the greater of 50% of the member’s benefit or 37.5% to 42.5% of the final average salary if: (1) an active employee’s death is service related; or (2) an active employee’s death is non-service related and occurs with at least 20 years of service; or (3) a retiree dies who was retired from service or who received a service related disability. Optional retirement allowances are available. Effective July 1, 2008, subject to a maximum of 45%, the surviving spouse or surviving domestic partner of Fire members only that retired after the effective date, receives the greater of 50% of the member’s benefit or 37.5% to 45% of the member’s final average salary depending on the years of services and if 1) an employee’s death is service related; or 2) an employee’s death is non-service related and occurs with at least 20 years of service; 3) a retiree dies who was retired from service or who received a service related disability.
Additionally, an annual benefit for dependent children up to 18 years of age, or up to 22 years of age if a full-time student, is paid at a rate of 25% of final average salary per child with a maximum family benefit of 75% of final average salary if death is service related.
If an active employee’s death is non-service related and the employee has at least two years of service, the Plan allows for an annual annuity of 24% of the employee’s final average salary for the first two years of service, plus 0.75% for each year thereafter, to be paid to his/her surviving spouse or domestic partner until remarriage (maximum of 37.5% of final average salary or 50% of the member’s benefit, whichever is greater). These benefits are also paid to the surviving spouse or domestic partner of a retiree on a non-service related disability.
Additionally, for situations other than for a service-related death, annual benefits for dependent children up to 18 years of age, or 22 years of age if a full-time student, are as follows:
•Onechild-25%offinalaveragesalary •Twochildren-37.5%offinalaveragesalary •Threeormorechildren-50%offinalaveragesalary
The maximum annual benefit paid to a family under any circumstances is 75% of final average salary. If the employee has no spouse or domestic partner or children, a lump sum equal to the greater of the employee’s accumulated contributions or $1,000 is paid to his/her estate.
(d) Disability Benefits
If an employee suffers a service related disability before retirement, an annual benefit is paid equal to 50% of final average salary. For members with more than 20 years of service, the monthly retirement allowance is the final average salary multiplied by 50%, plus the final average salary multiplied by 2.5% for each year over 20 if a member retired prior to February 4, 1996 (maximum benefit, 75% of final average salary). After February 4, 1996 but prior to February 4, 2000, the monthly allowance consists of the final average salary multiplied by 50%, plus final average salary multiplied by 3% for each year over 20 years of service (maximum benefit, 80% of final average salary). After February 4, 2000, the monthly allowance consists of the final average salary multiplied by 50%, plus final average salary multiplied by 3% for each year over 20 but less than 25 years of service, plus 4% of final average salary for each year over 25 up to 30 years of service (maximum benefit, 85% of final average salary). Effective July 1, 2006, the monthly allowance for Police members only consists of final average salary multiplied by 50% plus 4% for each year in excess of 20 years of service (maximum benefit, 90% of final average salary).
Effective July 1, 2008 for Fire members only, the monthly allowance consists of final average salary multiplied by 60%, plus final average salary multiplied by 3% for each full year of service in excess of 20 years (maximum 90%). For less than 20 years of service, the allowance consists of final average salary multiplied by 50%.
Retirement for a non-service connected disability with at least 2 years of service will provide the following benefit: For members with 2 to 20 years of service, the monthly retirement allowance is 32% multiplied by the final average salary for the first two years plus 1% for each additional year of service. After February 4, 1996 but prior to February 4, 2000, for members with over 20 years of service, the benefit consists of 50% of final average salary, plus final average salary multiplied by 3% for each year over 20 years of service (maximum benefit, 80% of final average salary).

42 Comprehensive Annual Financial Report 2010-2011 San José Police & Fire Department Retirement Plan
Notes to Financial Statements (Continued)
NOTE 1 – DESCRIPTION OF THE PLAN (Continued)
After February 4, 2000, the monthly allowance consists of 50% of the final average salary, plus final average salary multiplied by 3% for each year over 20 but less than 25 years of service, plus 4% of final average salary for each year over 25 (maximum benefit, 85% of final average salary). Effective July 1, 2006, the monthly allowance for Police members only consists of final average salary multiplied by 50% plus 4% for each year in excess of 20 years of service (maximum benefit, 90% of final average salary). Effective July 1, 2008, for Fire members only with at least 20 years of service, the monthly allowance consists of final average salary multiplied by 3.0% for each year of service (maximum benefit, 90% of final average salary).
(e) Postemployment Healthcare Benefits
The City of San José Municipal Code provides that retired employees with 15 years or more of service, their survivors, or those retired employees who are receiving a pension benefit of at least 37.5% of final average salary are entitled to payment of 100% of the lowest priced medical insurance plan available to an active police and fire employee. However, the Plan pays the entire premium cost for dental insurance coverage.
NOTE 2 – SUMMARY OF SIGNIFICANT ACCOUNTING POLICIES
(a) Basis of Presentation
The financial statements of the Plan present only the financial activities of the Plan and are not intended to present the financial position and changes in financial position of the City of San José in conformity with accounting principles generally accepted in the United States of America (GAAP).
(b) Basis of Accounting
The financial statements of the Plan are prepared on the accrual basis of accounting. Contributions are recognized as revenue when due pursuant to formal commitments as well as statutory and contractual commitments (at the end of the pay period). Benefits and refunds of contributions are recognized when due and payable under the provisions of the Plan. Activities of the Defined Benefit Pension Plan and the Postemployment Healthcare Plan are accounted for separately. It is required by the Municipal Code that transactions of the Defined Benefit Pension Plan be accounted for in two funds: a Retirement Fund and a Cost-of-Living Fund.
The preparation of the financial statements in conformity with generally accepted accounting principles requires management to make certain estimates and assumptions that affect certain reported amounts and disclosures. Actual results could differ from those estimates.
(c) Investments
The City of San José Municipal Code Section 3.36.530 delegates’ authority to the Board of Administration to reinvest the monies of the Plan as provided in Section 3.36.540. The Board has adopted detailed investment guidelines consistent with conditions and limitations set forth in Section 3.36.540.
In 2010, the Board adopted an asset allocation structure that reduced the equity exposure to a target allocation of 40%, increased the fixed income exposure to 25%, and increased the alternatives allocation to 35%. The Board also approved the addition of inflation-linked assets and opportunistic strategies to the alternatives asset class. This new allocation reduced risk by 10% from the prior allocation; the Plan’s investment asset allocation is as follows:
Equity – Target of 40%, minimum 30% and maximum 50% of the fair value of the aggregate portfolio.
U.S. Large Cap – Target 18% U.S. Small Cap – Target 5% Non U.S. Developed Markets – Target 12% Non U.S. Emerging Markets – Target 5%
Fixed Income – Target of 25%, minimum 15% and maximum 35% of the fair value of the aggregate portfolio.
Core Fixed Income – Target 5% U.S. Treasury Inflation Protected Securities (TIPS) Target 10% Long Duration Fixed Income – Target 5% Opportunistic Credit – Target 5%
Alternative Assets – Target of 35%, minimum of 10% and maximum 60% of the fair value of the aggregate portfolio. Funds allotted to the alternatives asset class are temporarily invested in other asset classes.
Private Equity – Target 5% Real Estate – Target 10% Inflation-Linked Assets – Target 10% Absolute Return – Target 5% Opportunistic – Target 5%
The Plan’s investment policy authorizes the Plan to invest in domestic equity, international equity, emerging market equity, domestic fixed income, global (international) fixed income, long duration fixed income, U.S. Treasury Inflation Protected Securities (TIPS), high yield/credit opportunities, international currency contracts, private equity, real estate, derivatives, securities lending, and short-term investment funds. Investments are reported at fair value. Securities traded on a national or international exchange are valued at the last reported sales price on the last business day of the fiscal year at current exchange rates, if applicable. Investments that do not have an established market, such as private equity, commingled real estate funds and certain pooled fund investments, are reported at estimated fair

43 Comprehensive Annual Financial Report 2010-2011 San José Police & Fire Department Retirement Plan
Notes to Financial Statements (Continued)
value based on the most recently available investor reports or audited financial statements issued by the manager of those funds. The fund manager provides an estimated unrealized gain/loss of the fund based on the most recently available audited financial statements and other fund information.. The fair value of derivative investments that are not exchange traded, such as swaps, and rights is determined by the Plan’s custodian based on the base market value of similar instruments. Futures contracts are marked-to-market at the end of each trading day, and the settlement of gains or losses occur on the following business day through variation margins. The fair value of international currency forwards represents the unrealized gain or loss on the related contracts, which is calculated as the difference between the specified contract exchange rate and the exchange rate at the end of the reporting period. The fair value of the separate real estate properties are based on annual independent appraisals. As of June 30, 2011 and 2010, the separate real estate properties include: apartment complexes in Houston, TX, and Colorado Springs, CO; office buildings in Denver, CO, O’Fallon, MO, San José, CA, near Chicago, IL, and in Anchorage, AK; and warehouses near Minneapolis, MN. As of June 30, 2011, the office buildings in O’Fallon, MO and Anchorage, AK had mortgage loans payable with fair values of approximately $20,200,000. The outstanding mortgage loans payable do not exceed 50% of the assets as allowed in the Plan’s Real Estate Investment Guidelines.
Purchases and sales of securities are reflected on the trade date. Investment income is recognized as earned. Rental income is recognized as earned, net of expenses.
(d) Plan Net Assets Held in Trust for Pension and Postemployment Healthcare Benefits
The Plan is required by the City of San José Municipal Code to establish various reserves in the Plan net assets. The Plan net assets are allocated between the Defined Benefit Pension Plan (which includes the Retirement Fund and the Cost-of-Living Fund) and the Postemployment Healthcare Plan. As of June 30, 2011 and 2010, the net assets, totaling $2,687,397,000 and $2,314,870,000, respectively, are allocated as follows (in thousands):
Employee Contributions Reserve is a reserve that represents the total accumulated employee contributions of current active and deferred members plus credited interest. The reserve is accounted for separately due to the possibility of their return to the member upon separation from City employment.
The Supplemental Retiree Benefit Reserve (SRBR) is a reserve that represents funds required by statute to be set aside from investment earnings to provide supplemental benefits to retirees. The SRBR was established in December 2001, upon adoption of Ordinance number 26536 of the City of San José Municipal Code. SRBR excess earnings and interest transfers are calculated by the Plan’s actuary, The Segal Company, per Ordinance number 26536 and are based on all of the Plan’s assets (including the Retirement Fund, the Cost-of-Living Fund, and the Postemployment Healthcare Plan). However, excess earnings and interest transfers to SRBR are funded only by the Retirement Fund and not the COLA or Postemployment Health reserves.
In fiscal year 2011, the Plan’s actuary, The Segal Company, prepared the excess earnings and SRBR interest amounts based on the audited June 30, 2010 financial statements.
NOTE 2 – SUMMARY OF SIGNIFICANT ACCOUNTING POLICIES (Continued)
Retirement Fund
Cost-of-Living Fund
Defined Benefit Pension Plan
Postemployment Healthcare Plan
Total
June 30, 2011:
Employee contributions $ 187,418 $ 52,155 $ 239,573 $ 16,677 $256,250
Supplemental retiree benefit
33,343 - 33,343 - 33,343
General reserve 1,541,487 813,324 2,354,811 42,993 2,397,804
TOTAL $ 1,762,248 $ 865,479 $ 2,627,727 $ 59,670 $2,687,397
June 30, 2010:
Employee contributions
$ 186,322 $ 51,885 $ 238,207 $ 6,158 $ 244,365
Supplemental retiree benefit
32,327 - 32,327 - 32,327
General reserve 1,319,108 674,408 1,993,516 44,662 2,038,178
TOTAL $ 1,537,757 $ 726,293 $ 2,264,050 $ 50,820 $2,314,870

44 Comprehensive Annual Financial Report 2010-2011 San José Police & Fire Department Retirement Plan
Notes to Financial Statements (Continued)
Segal prepared and the Board adopted and declared that there were no excess earnings for 2010. In addition, Segal computed an interest transfer to the SRBR reserve is the amount of approximately $1.0 million for 2010. An SRBR distribution of approximately $1.0 million to eligible retirees and beneficiaries as per San Jose Municipal Code was calculated for fiscal year ended June 30, 2010. However, due to San Jose City Council resolution number 28848, adopted on November 16, 2010, distribution of funds from the SRBR was suspended for fiscal year 2011.
Additionally, if the City’s contribution rate, as determined by the Board’s actuary during any actuarial valuation, will increase as a result of poor investment earnings in the retirement fund, the SRBR reserve off-set the City’s contributions in an amount equal to ten percent of the City’s increased contributions for the first twelve months following the increase in the contribution rates, but will not exceed five percent of the accrued balance in the SRBR reserve as of the date of the actuarial valuation.
General Reserve is a reserve that represents net earnings resulting from investment earnings, employer contributions, and realized and unrealized investment gains and losses.
(e) Allocation of Investment Income
Earnings on investments, excluding unrealized gains and losses, are recorded first in the general reserve category of net assets. An allocation is made bi-annually from the general reserve category to the employee contributions category of net assets based on the balance in that account at an annual rate of 2%, as specified by the City of San José Municipal Code. After the close of each fiscal year, the SRBR will be allocated, if applicable, 10% of the net investment earnings in excess of the assumed actuarial rate for the Retirement Plan. For fiscal years, 2010 and 2009, there were no excess earnings declared. .
(f) Reclassifications
Certain amounts in fiscal year 2010 have been reclassified to conform to the fiscal year 2011 presentation.
NOTE 3 – INVESTMENTS
Investments are subject to certain types of risks, including interest rate risk, custodial credit risk, credit quality risk, foreign currency risk, and concentration of credit risk. The following describes those risks:
Interest Rate Risk – The fair value of fixed income investments fluctuate in response to changes in market interest rates. Increases in prevailing interest rates generally translate into decreases in fair value of those instruments. The fair value of interest sensitive instruments may also be affected by the creditworthiness of the issuer, prepayment options, and other general interest rate conditions. Certain fixed income investments have call provisions that could result in shorter maturity periods. The Plan does not have a policy regarding interest rate risk. As of June 30, 2011, $22,695,000 of bank loan securities were floating rate securities tied to the 1 to 3 month London Interbank Offered Rate (LIBOR). As of June 30, 2010, $442,000 of asset backed securities, $30,733,000 of bank loan securities, and $400,000 of U.S. denominated convertible bonds were floating rate securities tied to the London Interbank Offered Rate (LIBOR) or the 3-month Prime rate. The Plan also had exposure of approximately $242,348,000 in commodity swaps that are tied to 3-month Treasury bill rates as described in the Note 3 - Derivatives below.
NOTE 2 – SUMMARY OF SIGNIFICANT ACCOUNTING POLICIES (Continued)

45 Comprehensive Annual Financial Report 2010-2011 San José Police & Fire Department Retirement Plan
Notes to Financial Statements (Continued)
NOTE 3 – INVESTMENTS (Continued)
The following tables provide the segmented time distribution for fixed income investments based on expected maturity (in years) as of June 30, 2011 and 2010, concerning the fair value of investments and interest rate risk:
Investments at Fair Value as of June 30, 2011
(Dollars in thousands)
0-3 Months
3-6 Months
6 Months - 1 Year
1-5 Years 5-10 YearsMore Than 10 Years
Total Fair Value
Cost
Fixed IncomeDomestic Fixed Income:
Asset Backed Securities $ - $ - $2,025 $ 4,017 $ - $ 1,367 $ 7,409 $ 7,368
Bank Loans - - - 21,743 - - 21,743 19,428
Collateralized Mortgage Obligations - - - - - 20,148 20,148 19,455
Corporate Bonds - 1,015 507 36,039 31,403 105,672 174,636 160,935
FHLMC - - - - - 15,210 15,210 14,720
FNMA - - - - 2,847 47,994 50,841 49,967
GNMA - - - - - 6,074 6,074 5,948
State and Local Obligations - - - - - 7,519 7,519 7,321
U.S. Treasury Inflation Protected Securities - - - 130,966 136,773 48,441 316,180 298,737
U.S. Treasury Securities - 12,151 - 5,486 8,993 20,279 46,909 47,162
Total Domestic Fixed Income - 13,166 2,532 198,251 180,016 272,704 666,669 631,041
International Corporate Bonds - 701 - 3,346 5,878 5,492 15,417 16,824
Pooled Fixed Income Bond Funds - - - - - 11,359 11,359 10,853
Corporate Convertible Bonds - - 3,646 52,654 6,209 9,624 72,133 67,125
Collective Short Term Investment Fund 4,106 - - - - 36,373 40,479 40,437
TOTAL FIXED INCOME $ 4,106 $ 13,867 $ 6,178 $254,251 $192,103 $335,552 $806,057 $766,280

46 Comprehensive Annual Financial Report 2010-2011 San José Police & Fire Department Retirement Plan
Notes to Financial Statements (Continued)
NOTE 3 – INVESTMENTS (Continued)
Investments at Fair Value as of June 30, 2010
(Dollars in thousands)
0-3 Months
3-6 Months
6 Months - 1 Year
1-5 Years 5-10 YearsMore Than 10 Years
Total Fair Value
Cost
Fixed IncomeDomestic Fixed Income:
Asset Backed Securities $ - $ - $ - $ 238 $ 581 $ 841 $ 1,660 $ 1,383
Bank Loans - 138 1,709 28,180 1,726 - 31,753 29,752
Collateralized Mortgage Obligations - - - 1,328 3,005 27,254 31,587 30,145
Convertible Bond - - - 18,309 532 11,046 29,887 29,369
Corporate Bonds - - 1,156 47,871 37,195 97,984 184,206 166,661
FHLMC - - - - 2,940 11,019 13,959 13,414
FNMA - - - - 4,929 36,850 41,779 40,978
State and Local Obligations - - - - - 7,596 7,596 7,321
U.S. Treasury Inflation Protected Securities (TIPS) - - - 124,935 127,106 81,765 333,806 324,654
U.S. Treasury Securities - 11,150 19,968 131,737 30,516 22,978 216,349 212,911
Total Domestic Fixed Income - 11,288 22,833 352,598 208,530 297,333 892,582 856,588
International Corporate Bonds - - 732 9,418 6,657 8,266 25,073 24,558
Pooled Fixed Income Bond Funds - - - - - 91,501 91,501 82,212
Corporate Convertible Bonds - 1,321 464 6,916 5,998 1,897 16,596 17,605
Collective Short Term Investment Fund 204,362 - - - - - 204,362 204,366
TOTAL FIXED INCOME $ 204,362 $ 12,609 $ 24,029 $ 368,932 $ 221,185 $ 398,997 $1,230,114 $1,185,329

47 Comprehensive Annual Financial Report 2010-2011 San José Police & Fire Department Retirement Plan
Notes to Financial Statements (Continued)
Custodial Credit Risk – Custodial credit risk is the risk that the Plan will not be able to recover the value of its investments or collateral securities that are in the possession of an outside party. The Plan does not have a policy regarding custodial credit risk. As of June 30, 2011 and 2010, all of the Plan’s investments, excluding invested securities lending collateral, are held in the Plan’s name, and/or are not exposed to custodial credit risk. Securities lending collateral are invested in the lending agent’s investment fund (see Note 4 – Securities Lending Program).
Credit Quality Risk – Nationally recognized statistical rating organizations provide ratings of debt securities’ quality based on a variety of factors, such as the financial condition of the issuers, which provide investors with some idea of the issuer’s ability to meet its obligations. The Plan’s investment policy dictates that all domestic and international bonds and notes in which the Plan’s assets are invested, and which mature one year or more from the date of original issues, are required to carry a rating of “BBB” or better by two of the following three services: Standard & Poor’s (S&P), Moody’s Investors’ Service (Moody’s), or Fitch Ratings (Fitch). In the event that ratings are provided by only two agencies and the third is non-rated, the more conservative (lowest) rating will be assigned. If only one agency assigns a rating, that rating will be used; or, if unrated, the security shall be of equivalent quality in the judgment of the investment manager to a similar domestic issue. Investment managers may, with prior written authorization from the Plan, invest a maximum of 20% of their fixed income portfolio in bonds or notes that are rated B or BB. If bonds are downgraded below the minimum credit quality allowable in the Plan’s investment policy at the time of purchase, the investment manager is permitted to hold up to 2% of the Plan’s portfolio managed by the individual manager, using the lower of S&P, Moody’s, and Fitch’s rating in the event of a split-rated security. The Plan may hedge against the possible adverse effects of currency fluctuations on the Plan’s portfolio of international fixed income obligations when it is considered appropriate. This is typically achieved using forward currency contracts. Short-term investments may consist of commercial paper rated at least A1 or P1, repurchase agreements, short-term U.S. securities, and other money market investments.
On August 5, 2011, S&P lowered its long-term credit rating on debt of the U.S. government from AAA to AA+. That action affected S&P’s view of U.S. public finance debt instruments that are directly or indirectly backed by the U.S. As a result, on August 8, 2011, S&P lowered its long-term credit ratings of U.S. government-sponsored enterprises and public debt issues that have credit
enhancement guarantees by those government-sponsored enterprises to AA+. These credit downgrades relate to the credit risk associated with the Retirement System’s investments in U.S. government agency securities, U.S. government bonds, and U.S. government mortgage-backed securities.
The following table provides information as of June 30, 2011 concerning credit risk. Investments issued or explicitly guaranteed by the U.S. government of $371,176,000 and $550,155,000 as of June 30, 2011 and 2010, respectively, are not considered to have credit risk and are excluded from the tables below.
NOTE 3 – INVESTMENTS (Continued)
S&P quality rating
Fair ValueFair Value as a
% of Total Fixed Income
AAA $ 81,831 18.7%
AA 33,518 7.7%
A 84,196 19.4%
BBB 69,651 16.0%
BB 28,497 6.6%
B 18,629 4.3%
CCC & Below 1,601 0.4%
Not Rated 116,958 26.9%
TOTAL $ 434,881 100.0%
RATINGS OF FIXED INCOME INVESTMENTS June 30, 2011 (Dollars In Thousands)
S&P quality rating
Fair ValueFair Value as a
% of Total Fixed Income
AAA $ 46,246 6.8%
AA 42,966 6.3%
A 84,346 12.4%
BBB 53,642 7.9%
BB 33,158 4.9%
B 22,392 3.3%
CCC & Below 3,375 0.5%
Not Rated 393,834 57.9%
TOTAL $ 679,959 100.0%
RATINGS OF FIXED INCOME INVESTMENTS June 30, 2010 (Dollars In Thousands)
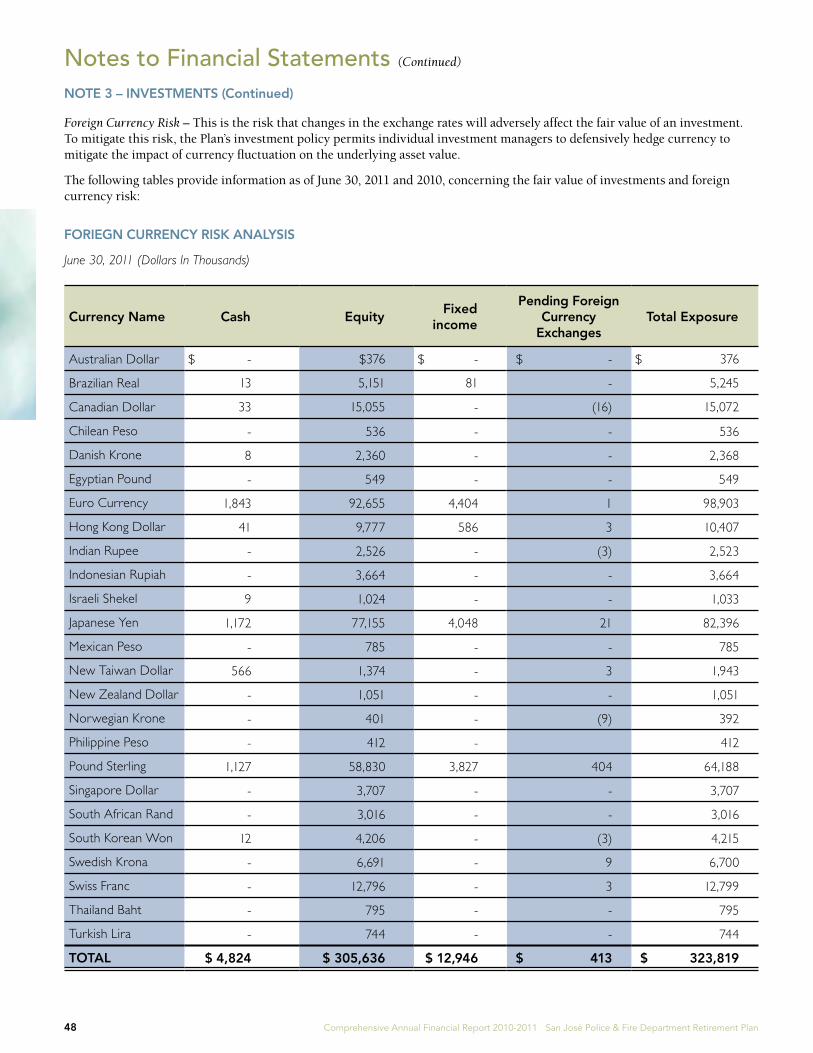
48 Comprehensive Annual Financial Report 2010-2011 San José Police & Fire Department Retirement Plan
Notes to Financial Statements (Continued)
Foreign Currency Risk – This is the risk that changes in the exchange rates will adversely affect the fair value of an investment. To mitigate this risk, the Plan’s investment policy permits individual investment managers to defensively hedge currency to mitigate the impact of currency fluctuation on the underlying asset value.
The following tables provide information as of June 30, 2011 and 2010, concerning the fair value of investments and foreign currency risk:
FORIEGN CURRENCY RISK ANALYSIS
June 30, 2011 (Dollars In Thousands)
NOTE 3 – INVESTMENTS (Continued)
Currency Name Cash EquityFixed
income
Pending Foreign Currency
ExchangesTotal Exposure
Australian Dollar $ - $376 $ - $ - $ 376
Brazilian Real 13 5,151 81 - 5,245
Canadian Dollar 33 15,055 - (16) 15,072
Chilean Peso - 536 - - 536
Danish Krone 8 2,360 - - 2,368
Egyptian Pound - 549 - - 549
Euro Currency 1,843 92,655 4,404 1 98,903
Hong Kong Dollar 41 9,777 586 3 10,407
Indian Rupee - 2,526 - (3) 2,523
Indonesian Rupiah - 3,664 - - 3,664
Israeli Shekel 9 1,024 - - 1,033
Japanese Yen 1,172 77,155 4,048 21 82,396
Mexican Peso - 785 - - 785
New Taiwan Dollar 566 1,374 - 3 1,943
New Zealand Dollar - 1,051 - - 1,051
Norwegian Krone - 401 - (9) 392
Philippine Peso - 412 - 412
Pound Sterling 1,127 58,830 3,827 404 64,188
Singapore Dollar - 3,707 - - 3,707
South African Rand - 3,016 - - 3,016
South Korean Won 12 4,206 - (3) 4,215
Swedish Krona - 6,691 - 9 6,700
Swiss Franc - 12,796 - 3 12,799
Thailand Baht - 795 - - 795
Turkish Lira - 744 - - 744
TOTAL $ 4,824 $ 305,636 $ 12,946 $ 413 $ 323,819

49 Comprehensive Annual Financial Report 2010-2011 San José Police & Fire Department Retirement Plan
Notes to Financial Statements (Continued)
FORIEGN CURRENCY RISK ANALYSIS
June 30, 2010 (Dollars In Thousands)
NOTE 3 – INVESTMENTS (Continued)
Currency Name Cash EquityFixed
income
Pending Foreign Currency
ExchangesTotal Exposure
Australian Dollar $ 1 $ 1,405 $ - $ 27 $ 1,433
Brazilian Real 4 7,156 70 226 7,456
Canadian Dollar - 6,114 - 132 6,246
Chilean Peso - 605 - - 605
Danish Krone - 2,715 - 18 2,733
Egyptian Pound - 509 - - 509
Euro Currency 1,017 65,063 3,600 (1) 69,679
Hong Kong Dollar 41 7,737 772 2 8,552
Indian Rupee - 5,032 - - 5,032
Indonesian Rupiah - 3,831 - - 3,831
Israeli Shekel 38 1,501 - - 1,539
Japanese Yen 398 59,468 2,278 33 62,177
Malaysian Ringgit - 220 - - 220
Mexican Peso 4 1,320 - - 1,324
New Taiwan Dollar 870 1,810 - - 2,680
New Zealand Dollar - 674 - - 674
Norwegian Krone - 1,801 - 18 1,819
Pound Sterling - 43,842 2,332 27 46,201
Singapore Dollar - 1,682 - 26 1,708
South African Rand - 2,712 - - 2,712
South Korean Won - 2,214 - - 2,214
Swedish Krona - 2,501 - (7) 2,494
Swiss Franc - 16,018 1,321 (2) 17,337
Thailand Baht - 338 - - 338
Turkish Lira - 1,475 - - 1,475
TOTAL $ 2,373 $ 237,743 $ 10,373 $ 499 $ 250,988

50 Comprehensive Annual Financial Report 2010-2011 San José Police & Fire Department Retirement Plan
Notes to Financial Statements (Continued)
Concentration of Credit Risk – The Plan’s investment policy does not limit the amount that can be invested in a single issuer. However, it limits the aggregate amount that can be invested in each class of investments, limits the portion of the total Plan assets that a manager can hold in a single security with the exception of government backed securities and real estate equity to 5%, and limits the Plan assets placed with an investment manager to represent no more than 10% of that manager’s total assets.
As of June, 30, 2011, the Plan did not hold investments in any one issuer, excluding U.S. government guaranteed investments that represented five percent or more of the total Plan net assets. As of June 30, 2010, the Plan held Wisconsin Treasury notes of $130,853,000, which represented 5.7% of total Plan net assets.
Derivatives – The Plan’s investment policy allows for investments in derivative instruments that comply with the Plan’s basic objective of achieving the highest return on investment funds, consistent with safety, and in accordance with accepted investment practices. Due to the level of volatility associated with certain derivative investments in general, the Plan specifically prohibits investment managers from using derivative or synthetic securities that expose the Plan to potentially high price volatility or are leveraged, or whose market-ability may become
severely limited. Derivative investments are reported at fair value. Derivative instruments traded on a national or international exchange are valued at the last reported sales price on the last business day of the fiscal year at current exchange rates, if applicable. The fair value of derivative investments that are not exchange traded, such as swaps, and rights is determined by the Plan’s custodian based on the base market value of similar instruments. Futures contracts are marked-to-market at the end of each trading day, and the settlement of gains or losses occur on the following business day through variation margins. As a result, futures have no fair value as of June 30, 2011 or 2010. The fair value of international currency forwards represents the unrealized gain or loss on the related contracts, which is calculated as the difference between the specified contract exchange rate and the exchange rate at the end of the reporting period.
The fair values and notational amounts of derivative instruments outstanding as of June 30, 2011 and 2010, classified by type, and the changes in fair value of such derivative instruments for the years then ended as reported in the 2011 and 2010 financial statements are as follows (amounts in thousands):
NOTE 3 – INVESTMENTS (Continued)
Net Appreciation (Depreciation) in Fair Value of Investments through
June 30, 2011Fair Value at June 30, 2011
Investment Derivative Instruments
Classification Amount Classification AmountNotional Amount
Commodity swaps Investment income/(loss) $ 77,183 Real assets $ - $ -
International currency forwards Investment income/(loss) (2,579) International currency contracts, net 413 82,520
Rights Investment income/(loss) 21 Global equity 1 3 Shares
Warrants Investment income/(loss) (1) Global equity - -
$ 74,624 $ 414

51 Comprehensive Annual Financial Report 2010-2011 San José Police & Fire Department Retirement Plan
Notes to Financial Statements (Continued)
Derivative investments are subject to certain types of risks, including counterparty credit risk (non-exchange traded), interest rate risk, and foreign currency risk. The following describes the risks applicable to the investment derivative instruments that are reported as of June 30, 2011 and 2010:
Counterparty Credit Risk – The Plan is exposed to credit risk on derivative instruments that are in asset positions. As of June 30, 2011, the Plan held rights with a fair value of approximately $1,000 and a notional value of $3,000 held by an unrated counterparty. As of June 30, 2010, the Plan held rights with a fair value of $8,000 and a notional value of $241,000 held by unrated counterparties. Additionally, the Plan had outstanding commodity swaps with a fair value of negative $5,698,000 and notional value of $242,348,000 held by three counterparties with AAA ratings.
The Plan’s investments in forward currency contracts bear credit risk in that parties to the contracts may fail to perform according to the terms of the contract. As of June 30, 2011, total commitments in forward currency contracts to purchase and sell international currencies were $82,520,000 and $82,520,000 respectively, with fair values of $82,566,000 and $82,153,000, respectively, held by counterparties S&P rating of at least AA-. As of June 30, 2010, total commitments in forward currency contracts to purchase and sell international currencies were $18,077,000 and $18,077,000 respectively, with fair values of $17,607,000 and $18,101,000, respectively, held by counterparties S&P rating of at least AA-.
Interest Rate Risk – The Plan had exposure to interest rate risk on its fully collateralized commodity swaps. As of June 30, 2011, the Plan did not hold commodity swaps. As of June 30, 2010, the fair value of the commodity swaps were marked-to-market daily based on the Dow Jones UBS Commodity Index values with unrealized gains and losses collateralized to minimize counterparty risk. The Plan received the total return Dow Jones UBS Commodity Index, net of the 3-month Treasury bill rate. The commodity swaps held by the Plan had a notional value of $242,348,000 that were tied to 3-month Treasury bill rates. The Plan does not have a policy regarding interest rate risk, however, the Plan does settle on a transaction plus one day basis (T+1), therefore limiting the Plan’s exposure to counterparty risk.
Foreign Currency Risk – This is the risk that changes in the exchange rates will adversely affect the fair value of underlying investments. To mitigate this risk, the Plan’s investment policy permits individual investment managers to mitigate the impact of currency fluctuation on the underlying asset value. The Plan’s investment managers enter into international forward currency contracts, which are commitments to purchase or sell stated amounts of international currency. The Plan utilizes these contracts to control exposure and facilitate the settlement of international security purchase and sale transactions. At June 30, 2011 and 2010, the Plan’s net position in these contracts is recorded at fair value as international currency contract investments. The fair values of international currency contracts are determined by quoted currency prices from national exchanges. The Plan’s commitments relating to forward currency contracts are settled on a net basis.
NOTE 3 – INVESTMENTS (Continued)
Net Appreciation (Depreciation) in Fair Value of Investments through
June 30, 2010Fair Value at June 30, 2010
Investment Derivative Instruments
Classification Amount Classification AmountNotional Amount
Commodity swaps Investment income/(loss) $ (3,096) Real assets $ (5,698) $ 242,348
Futures long/short (domestic and foreign) Investment income/(loss) 225
Fixed income (domestic and foreign) - -
Futures options bought/written Investment income/(loss) 107 Fixed income (domestic and foreign) - -
International currency forwards Investment income/(loss) 2,604 International currency contracts, net 494 7,047
Rights Investment income/(loss) 24 International equity 8 241 Shares
$ (136) $ (5,196)

52 Comprehensive Annual Financial Report 2010-2011 San José Police & Fire Department Retirement Plan
Notes to Financial Statements (Continued)
NOTE 3 – INVESTMENTS (Continued)
GASB 53
2011
Currency NamePending Foreign Currency
Exchanges
Canadian Dollar $ (16)
Euro Currency 1
Hong Kong Dollar 3
Indian Rupee (3)
Japanese Yen 21
New Taiwan Dollar 3
Norwegian Krone (9)
Pound Sterling 404
South Korean Won (3)
Swedish Krona 9
Swiss Franc 3
TOTAL $ 413
2010
Currency NamePending Foreign Currency
Exchanges
Australian Dollar $ 27
Brazilian Real 225
Canadian Dollar 132
Danish Krone 18
Hong Kong Dollar 2
Japanese Yen 33
Norwegian Krone 15
Pound Sterling 25
Singapore Dollar 26
Swedish Krona (6)
Swiss Franc (3)
TOTAL $ 494
The following tables provide information as of June 30, 2011 and 2010, concerning the fair value of forward currency contracts and foreign currency risk (dollars in thousands):

53 Comprehensive Annual Financial Report 2010-2011 San José Police & Fire Department Retirement Plan
Notes to Financial Statements (Continued)
NOTE 4 – SECURITIES LENDING PROGRAM
The Plan has a custodial agreement with State Street Corporation (State Street) which authorizes State Street to lend the securities in the Plan’s investment portfolio under such terms and conditions as State Street deems advisable and to permit the lent securities to be transferred into the name of the borrowers. The Plan does not have a threshold for securities lending. As of June 30, 2011, the Plan had no exposure to borrower credit risk related to the securities lending transactions as State Street is responsible for replacement of the lent securities with other securities of the same issuer, class and denomination, or if such securities are not available on the open market, State Street is required to credit the Plan’s account with the market value of such unreturned lent securities if the lent securities are not returned by the borrower. The Plan receives a fee from the borrower for the use of the lent securities.
Securities lending collateral represents investments in State Street’s Quality D Short-term investment Fund purchased with cash collateral, as well as securities collateral that the Plan may not pledge or sell without a borrower default. Securities lending transactions collateralized with securities that cannot be pledged or sold without borrower default are not reported as assets and liabilities in the statement of net assets. The Plan does not match the maturities of investments made with cash collateral with the securities on loan.
The loaned securities as of June 30, 2011 and 2010 consisted of U.S. Treasury securities, domestic corporate bonds, domestic equity securities, international corporate bonds, and international equity securities. In return, the Plan receives collateral in the form of cash or securities equal to 102% for domestic and 105% for international of the transferred securities plus accrued interest for reinvestment of the collateral.
The Plan authorized State Street to invest and reinvest cash collateral in State Street’s Quality D Short-term Investment Fund which, effective December 3, 2010, consists of a liquidity pool and a liquidating account known as the duration pool. The duration pool was established and allocation the asset-backed securities (regardless of maturity) and securities of any type with a remaining maturity of 91 days or greater. Each Quality D Fund owns a specified percentage interest in the duration pool which is redeemable only in kind, not cash. The Quality D duration pool will not make additional investments.
The liquidity pool investment policy guidelines provides that the State Street Investment Manager shall maintain the dollar-weighted average maturity of the fund in a manner that the Investment Manager believes is appropriate to the objective of the fund; provided (a) in no event shall any eligible security be acquired with a remaining legal final maturity (i.e., the date on which principal must be repaid) of greater than 18 months, (b) the Investment Manager
shall endeavor to maintain a dollar-weighted average maturity of the fund not to exceed 75 calendar days and (c) the Investment Manager shall endeavor to maintain a dollar-weighted average maturity to final of the fund not to exceed 180 days. At the time of purchase, all securities with maturities of 13 months or less shall be rated at least A1, P1 or F1 by at least any two nationally recognized statistical rating organizations (NRSROs), or be determined by the Investment Manager to be of comparable quality. Securities with maturities in excess of 13 months shall be rated at least A-, A3 or A- by at least any two of S&P, Moody’s, or Fitch, or be determined by the Investment Manager to be of comparable quality. The fund may invest up to 10% of its assets at time of purchase in commingled vehicles that conform with the State Street Investment Policy Guidelines. Investments made prior to the December 3, 2010, shall continue to be permissible to the extent they complied at the time of purchase.
As of June 30, 2011, the cash collateral pool for the duration and liquidity pool totaled $6.3 billion and $17.2 billion, respectively. The weighted average maturities for the duration and liquidity pool were 35.97 and 31.67 days, respectively. The cash collateral duration pool included asset backed securities (54.97%), certificates of deposit (13.56%), bank notes (23.16%), U.S. Agency (8.22%) and other securities (.09%). As of June 30, 2010, the size of the cash collateral pool was $39.8 billion and the weighted average maturity was 29.64 days. The cash collateral pool included asset backed securities (22.07%), certificates of deposit (42.41%), corporate securities (1.52%), bank notes (9.34%), asset backed commercial paper (8.84%) and other securities (15.82%).
As of June 30, 2011, the underlying securities loaned by the Plan as a whole amounted to approximately $340,802,000. The Plan received cash collateral and non-cash collateral totaling $342,973,000 and $3,527,000, respectively, at carrying cost. The Plan’s share of the cash collateral pool at June 30, 2011 was at $1.00 or $222,580,000 and $0.9767 or $117,587,000 for the liquidity and duration pools, respectively on a mark to market basis. The NAV of less than $1.00 for the duration pool is due to the decline in the fair value of assets held by the cash collateral pool. The NAV of $0.9767 of the duration cash collateral pool results in an unrealized loss of approximately $2,806,000 for the Plan. The Plan’s investment in the liquidity and duration cash collateral investment pools are presented in the statement of net plan assets at their respective NAV or $340,167,000. The unrealized loss of $2,806,000 for the duration pool is reflected in the securities lending income earnings line of the statement of changes in plan net assets. The Plan is exposed to market risk including the possible loss of principal value in the cash collateral pool due to the fluctuation in the market value of the assets held by the cash collateral pool.

54 Comprehensive Annual Financial Report 2010-2011 San José Police & Fire Department Retirement Plan
Notes to Financial Statements (Continued)
NOTE 4 – SECURITIES LENDING PROGRAM (Continued)
As of June 30, 2010, the underlying securities loaned by the Plan as a whole amounted to approximately $379,912,000. The Plan received cash collateral and the non-cash collateral totaling $388,885,000 and $1,361,000, respectively. The Plan’s share of the cash collateral pool at June 30, 2010 was at $0.9889 or $384,569,000 on a mark to market basis. The NAV of less than $1.00 is due to the decline in the fair value of assets held by the cash collateral pool. The NAV of
$0.9889 of the cash collateral pool results in an unrealized loss of approximately $4,316,000 for the Plan. The unrealized loss of $4,316,000 is reflected in the securities lending income earnings line of the statement of changes in plan net assets. The Plan is exposed to market risk including the possible loss of principal value in the cash collateral pool due to the fluctuation in the market value of the assets held by the cash collateral pool.
SECURITIES LENDING – INVESTMENT AND COLLATERAL RECEIVED (at Fair Value in thousands)
2011 2010
Type of Investment Lent
For Cash Collateral
Domestic corporate bonds $ 45,785 $ 44,856
Domestic equity securities 239,823 94,588
U.S. treasur y securities 35,864 218,541
International corporate bonds 252
International equity securities 15,590 20,605
Total Lent for Cash Collateral 337,314 $378,590
For Non-Cash Collateral:
Domestic equity securities 3,488 1,322
U.S. treasur y securities - -
International equity securities - -
Total Lent for Non-Cash Collateral 3,488 1,322
Total Securities Lent $ 340,802 $ 379,912
Type of Collateral Received
Cash Collateral $ 340,167 * $ 384,569
Non-cash Collateral
For lent domestic equity securities 3,527 1,361
For lent US treasur y securities - -
For lent International equity securities - -
Total Non-cash collateral 3,527 1,361
Total Collateral Received $ 343,694 $ 385,930
* Amount represents the mark-to-market value of the cash collateral pool at a 100.00% for the liquidity portolfio and 97.67% for the duration porfolio for fiscal year 2011. In 2010, the net asset value was 98.89%

55 Comprehensive Annual Financial Report 2010-2011 San José Police & Fire Department Retirement Plan
Notes to Financial Statements (Continued)
Pursuant to San José Municipal Code 3.36.1520, the Police and Fire Department Retirement Plan Board of Administration is authorized to determine the amount of monthly or bi-weekly contributions. On June 24, 2008, City Council adopted ordinance No. 28332 amending Chapter 3.36 of Title 3 of the San José Municipal Code to provide the City with the option to make lump sum payments of City required contributions to the Police and Fire Department Retirement Plan.
In fiscal year 2010-2011, the City paid the actuarially determined amount of $86,023,492 and $3,120,495 on July 2, 2010 and September 16, 2010, respectively, for bi-weekly pension and health contributions to be made for the 26 pay dates from July 2, 2010 through June 17, 2011. The City also received a credit of approximately $2,146,000 for the reconciliation of fiscal year 2010-2011 pension and health contributions per San José Municipal Code 3.36.1590(F), that requires the Board to determine whether the lump sum advance payment(s) and the payments that otherwise have been required in the absence of the lump sum advance payment are actuarially equivalent.
In addition, effective June 26, 2010 through June 25, 2011, the bargaining unit representing the Police Officers Association (POA) entered into a Memorandum of Agreement (MOA) with the City to make a one-time additional retirement contribution that would be applied to reduce the contributions that the City would otherwise be required to make during that time period for the
pension unfunded liability. The one-time contribution amounts all summed to 5.25%. The MOA also included language recognizing that the additional required contributions could not be implemented by June 27, 2010, and allowed for the Finance Department of the City to compute a rate that would generate the total amount of additional retirement contributions over the remaining pay periods in the fiscal year as if the contribution rate had been implemented on June 27, 2010. The City’s Finance Department calculated and implemented a contribution rate shift of 6.17% of pay for contributions effective on August 22, 2010. The contribution rates provided below do not reflect the additional retirement contributions.
Contributions to the Defined Benefit Pension Plan for both the City and the participating members are based upon an actuarially determined percentage of each member’s covered payroll sufficient to provide adequate assets to pay benefits when due. The Plan transitioned to annual valuations beginning June 30, 2010, from biennial actuarial valuations. The contribution rates for fiscal years ended June 30, 2011 and 2010 were based on the actuarial valuations performed on June 30, 2009 and June 30, 2007, respectively, except for the period of June 26 through June 30, 2011, which were based on the June 30, 2010 valuation.
The City and the participating member’s contribution rates in effect for the Defined Benefit Pension Plan during the fiscal years ended June 30, 2011 and 2010 were as follows:
NOTE 5 – DEFINED BENEFIT PENSION PLAN: CONTRIBUTIONS FUNDED STATUS AND FUNDING PROGRESS
Period City – Board Adopted * Member
Police Fire Police Fire
06/26/11 – 06/30/11 49.29% 51.05% 10.46% 10.76%
06/27/10 – 06/25/11 38.32% 40.24% 9.81% 10.09%
07/01/08 – 06/26/10 21.61% 24.12% 8.18% 8.62%
* The actual contribution rates paid by the City differed as a result of the City exercising their option to make annual lump sum payments. In addition in fiscal year 2011 the contribution rates paid by the City differed due to police members making on-time additional retirement contributions that were applied to reduce the City’s contributions.
ActuarialValuation
Date
ActuarialValue ofAssets
ActuarialAccruedLiability(AAL)
Unfunded AAL (UAAL)
FundedRatio
Annual CoveredPayroll
UAAL as aPercentage of
CoveredPayroll
(a) (b) (b-a) (a) / (b) (c) ((b-a)/c)
06/30/2010 $ 2,576,705 $ 3,230,456 $ 653,751 79.8% $ 222,699 294%
The funded status of the Defined Benefit Pension Plan as of June 30, 2010, the most recent actuarial valuation date, is as follows: (dollars in thousands)

56 Comprehensive Annual Financial Report 2010-2011 San José Police & Fire Department Retirement Plan
Notes to Financial Statements (Continued)
The UAAL of $653,751,000 does not reflect the impact of approximately $354 million of deferred pension and health investment losses resulting from unfavorable investment returns in fiscal years 2006 through 2010. The Plan’s actuarial valuation uses a five year smoothing method for investment returns. This means that the current year’s gains or losses, as calculated at year-end, are smoothed with the results from the prior four years.
Actuarial valuations of an ongoing plan involve estimates of the value of reported amounts and assumptions about the probability of occurrence of events far into the future. Examples include assumptions about future employment, mortality, and investment return. Experience studies are performed by the Board’s actuary to determine continual revision to the actuarial assumptions as actual results are compared with past expectations and new estimates are made about the future.
As of June 30, 2010, the Plan’s most recent valuation, the Plan’s AAL increased by $267 million due to experience losses and changes in actuarial assumptions as recommended by the Board’s actuary in the June 30, 2010 experience study. The Plan’s UAAL increased from $393.9 million as of June 30, 2009 to $653.7 million as of June 30, 2010. The increase in the UAAL was primarily due to the net of unfavorable investment returns, lower than expected salary increases, more deaths than expected among retirees/beneficiaries, more service retirements offset by fewer disability retirements, other actuarial experience, and a reduction in the discount rate from 8.00% (net of expenses) as of June 30, 2009 to 7.75% (net of expenses) as of June 30, 2010. In addition, the June 30, 2010 valuation reflects the Plan’s return to an 80-120% market value corridor from the one year 70-130% market value corridor increase in the June 30, 2009 valuation. The market value of assets corridor limits the smoothing of assets to be no greater than 120% and no less than 80% of the market value of assets as of June 30, 2010. Under this practice, investment gains or losses would be recognized immediately if necessary to maintain the smoothed assets within the 80-120% market value corridor. The total unrecognized investment losses, for pension and health assets, were $353.8 million before and after the application of the 120% market value of assets
corridor. A listing of significant actuarial methods and valuation assumptions for the June 30, 2007, 2009 and 2010 valuations are presented on page 56.
Additionally, the June 30, 2010 and 2009 valuations included one time 0.49% (approximately $1.3 million) and 0.45% (approximately $1.2 million), respectively, reductions in the City’s pension contribution rate effective June 26, 2011 and June 27, 2010, respectively. The one time annual reductions in the City’s contribution rates were a result of a transfer from the Supplemental Retiree Benefit Reserve (SRBR) due to poor investment earnings. Per San José Municipal code section 3.36.580(c), if the City’s contribution rate as determined by the Board’s actuary during any actuarial valuation will increase as a result of poor investment earnings in the retirement fund, the SRBR reserve will transfer an amount equal to ten percent of the City’s increased contributions for the first twelve months following the increase in the contribution rates, but the transfer will not exceed five percent of the accrued balance in the SRBR reserve as of the date of the actuarial valuation.
Projections for plan benefits are based on plan provisions as adopted and incorporated into the municipal code at the time of the valuation. The actuarial methods and assumptions used include techniques that are designed to reduce the effects of short-term volatility in actuarial accrued liabilities and the actuarial value of assets, consistent with the long-term perspective of the calculations. Actuarially determined amounts are subject to continual revision as actual results are compared with past expectations and new estimates are made about the future.
The Plan transitioned from biennial to annual valuations beginning June 30, 2010. The contribution rates for fiscal years ended June 30, 2011 and 2010 were based on the actuarial valuations performed as of June 30, 2009 and June 20, 2007, respectively, except for the period
June 26 through June 30, 2011, which were based on the June 30, 2010 valuation; the significant actuarial methods and assumptions used to compute the actuarially determined annual required contributions and the funded status are as follows:
NOTE 5 – DEFINED BENEFIT PENSION PLAN: CONTRIBUTIONS FUNDED STATUS AND FUNDING PROGRESS (Continued)

57 Comprehensive Annual Financial Report 2010-2011 San José Police & Fire Department Retirement Plan
Notes to Financial Statements (Continued)
NOTE 5 – DEFINED BENEFIT PENSION PLAN: CONTRIBUTIONS FUNDED STATUS AND FUNDING PROGRESS (Continued)
Description Method/Assumption
ACTUARIAL ASSUMPTIONS:
Assumed rate of return on investments
7.75% per annum 8% per annum 8% per annum
Post-retirement mortality RP-2000 Male Combined Healthy Mortality Table with no collar adjustment, projected 10 years. (set back 4 years)
RP-2000 Male Combined Healthy Mortality Table with no collar adjustment, projected 10 years. (set back 4 years)
RP-2000 Male Combined Healthy Mortality Table with no collar adjustment, projected 10 years. (set back 3 years)
(a) Service: RP-2000 Female Combined Healthy Mortality Table with no collar adjustment, projected 10 years.
RP-2000 Female Combined Healthy Mortality Table with no collar adjustment, projected 10 years.
RP-2000 Female Combined Healthy Mortality Table with no collar adjustment, projected 10 years. (set forward 1 year)
(b) Disability: RP-2000 combined healthy male mortality table with no collar adjustment, projected 10 years, set back 1 year.
RP-2000 combined healthy male mortality table with no collar adjustment, projected 10 years, set back 1 year.
RP-2000 combined healthy male mortality table with no collar adjustment, projected 10 years.
Rates of service retirement, withdrawal, death, disability retirements
Based upon the June 30, 2009 Actuarial Experience Analysis
Based upon the June 30, 2009 Actuarial Experience Analysis
Based upon the June 30, 2007 Actuarial Experience Analysis
Salary increases 0-5 years of service - 9.75% 0-5 years of service - 9.75% 0-6 years of service - 9.00%
6-7 years of service - 6.75% 6-7 years of service - 6.75% 6-8 years of service - 6.00%
8+ years of service - 6.00% 8+ years of service - 6.00% 8+ years of service - 5.00%
Of the total salary increase, 4.25% is for the combined inflation and real across-the-board salary increase
Of the total salary increase, 4.25% is for the combined inflation and real across-the-board salary increase
Of the total salary increase, 4% is for the combined inflation and real across-the-board salary increase
Description Method/Assumption
Valuation date June 30, 2010 June 30, 2009 June 30, 2007
Actuarial cost method Entry age normal cost method Entry age normal cost method Entry age normal cost method
Amortization method for actuarial accrued liabilities
Level percentage of payroll (assuming a 4.25% total payroll increase)
Level percentage of payroll (assuming a 4.25% total payroll increase)
Level percentage of payroll (assuming a 4.00% total payroll increase)
Remaining amortization period
(1) Outstanding balance of the unfunded actuarial accrued liability calculated through the June 30, 2003 valuation amor-tized over the next 7 years;
(2) Prior service cost for the February 4, 1996 benefit im-provement amortized over the next 7 years; and
(3) Future actuarial experi-ence gains and losses, changes in assumptions, and benefit improvements amortized over 16 years from the date of each such event, beginning with the June 30, 2005 valuation.
(1) Outstanding balance of unfunded actuarial accrued liability calculated through June 30, 2003 valuation amortized over the next 8 years;
(2) Prior service cost for the February 4, 1996 benefit im-provement amortized over the next 8 years; and
(3) Future actuarial experi-ence gains and losses, changes in assumptions, and benefit improvements amortized over 16 years from the date of each such event, beginning with June 30, 2005 valuation.
10 years, closed for unfunded pension liabilities;
16 years, closed for gains and losses between valuations
Actuarial asset valuation method
5 year smoothed market with a 80% to 120% Market Value Corridor
5 year smoothed market with a 70% to 130% Market Value Corridor
5 year smoothed market with a 80% to 120% Market Value Corridor

58 Comprehensive Annual Financial Report 2010-2011 San José Police & Fire Department Retirement Plan
NOTE 5 – DEFINED BENEFIT PENSION PLAN: CONTRIBUTIONS FUNDED STATUS AND FUNDING PROGRESS (Continued)
The schedules presented as required supplementary information following the notes to the basic financial statements, present multiyear trend information. The Schedule of Funding Progress for the Defined Benefit Pension Plan presents information about whether the actuarial values of plan assets are increasing or decreasing over time relative to the actuarial accrued liabilities for benefits. The Schedule of Employer Contributions for the Defined Benefit Pension Plan presents trend information about the amounts contributed to the plan by the City in comparison to the annual required contribution (ARC). The ARC represents a level of funding that, if paid on an ongoing basis, is projected to cover normal cost for each year and amortize any unfunded actuarial liabilities (or funding excess) over a period not to exceed thirty years.
NOTE 6 – POSTEMPLOYMENT HEALTHCARE PLAN CONTRIBUTIONS, FUNDED STATUS AND FUNDING PROGRESS
Contributions to the Postemployment Healthcare Plan are made by both the City and the participating members. Contributions to the Plan for fiscal years ended June 30,
2011 and 2010 for the Fire members of the Plan were based on the Board’s 10-year cash flow funding policy. Contributions to the Plan for Police members were based upon a five year phase-in to full funding of the GASB Statement No. 43 annual required contribution from the Board’s 10-year cash flow funding policy. Effective June 28, 2009, the Police members of the Plan entered into a Memorandum of Agreement (MOA) with the City to increase the contribution rates for retiree health and dental in order to phase-in to full funding of the GASB Statement No. 43 annual required contribution over the next five years; fiscal year 2010-2011 was the second year of the phase-in.
In the MOA the City and Police members of the Plan agreed that the Plan and member cash contribution rate shall not have an incremental increase of more than 1.25% and 1.35% of pensionable pay in each year for the members and City, respectively. Additionally, if the retiree healthcare contributions exceed 10% of member and 11% of City contributions (excluding the implicit rate subsidy) the parties shall meet and confer on how to address the contributions above 10% and 11%.
The contributions for Fire and Police members are not sufficient to provide adequate assets to pay benefits when due in accordance with the requirements of GASB Statement No. 43.
Notes to Financial Statements (Continued)
Period City – Board Adopted * Member
Police Fire Police Fire
06/26/11 – 06/30/11 7.61% 5.27% 7.01% 4.86%
06/27/10 – 06/25/11 6.26% 3.92% 5.76% 3.61%
06/28/09 – 06/26/10 5.28% 4.19% 4.78% 3.78%
* The actual contribution rates paid by the City differed as a result of the City exercising their option to make annual lump sum payments.
The funded status of the Postemployment Healthcare Plan as of June 30, 2010, the most recent actuarial valuation date, is as follows: (dollars in thousands)
ActuarialValuation
Date
ActuarialValue ofAssets
ActuarialAccruedLiability(AAL)
Unfunded AAL (UAAL)
FundedRatio
Annual CoveredPayroll
UAAL as aPercentage of
CoveredPayroll
(a) (b) (b-a) (a) / (b) (c) ((b)-(a)/c))
06/30/2010 $ 58,586 $ 946,308 $ 887,722 6% $ 222,699 399%
The City and the participating member’s contribution rates in effect during the fiscal years ended June 30, 2011 and 2010 for the Postemployment Healthcare Plan were as follows:

59 Comprehensive Annual Financial Report 2010-2011 San José Police & Fire Department Retirement Plan
Description Method/Assumption
Valuation date June 30, 2010 June 30, 2009 June 30, 2007
Actuarial cost method Entry age normal, level of percent of pay
Entry age normal, level of percent of pay
Entry age normal, level of percent of pay
Amortization method 30 years, level percent of pay 30 years, level percent of pay 30 years, level percent of pay
Remaining amortization period 30 years as of June 30, 2010, open
30 years as of June 30, 2009, open
30 years as of June 30, 2007, open
Actuarial asset valuation method
5 year smoothed market with a 80% to 120% Market Value Corridor
5 year smoothed market with a 70% to 130% Market Value Corridor
5 year smoothed market with a 80% to 120% Market Value Corridor
ACTUARIAL ASSUMPTIONS:
Discount rate 6.3% † 6.7% † 6.4% †
Inflation rate 3.5% 3.5% 3.5%
Across-the-board pay increase 0.75% 0.75% 0.5%
Projected payroll increases 4.25% 4.25% 4.0%
HEALTH CARE COST TREND RATE:
Medical Projected premiums for FY 2010-2011 and 9.75 beginning FY11-12, decreasing by 0.50% for each year for ten years until it reaches an ultimate rate of 5%
Projected premiums for FY 2009-2010 and 8.25% begin-ning FY 2010-2011, decreasing by 0.50% for each year for seven years until it reaches an ultimate rate of 5%
12% in 2007-2008 plan year, 10% in 2008-2009 fiscal year, 8.25% for 2009/2010, decreas-ing by 0.50% for each year for seven years until it reaches an ultimate rate of 5%
Dental 5% 5% 5%
† Determined as a blended rate of the expected long-term investment returns on plan assets and on the City’s investments, based on the funded level of the plan at the valuation date.
Notes to Financial Statements (Continued)
As of June 30, 2010, the Plan’s most recent valuation, the Plan’s AAL increased by $185 million due to changes in actuarial assumptions as recommended by the Board’s actuary in the June 30, 2010 experience study. The Plan’s UAAL increased from $705.9 million as of June 30, 2009 to $887.7 million as of June 30, 2010. Changes to the UAAL were due to increased health care trend rate assumptions and a decrease in the Plan’s discount rate from 8.00% (net of expenses) as of June 30, 2009 to 7.75% (net of expenses) as of June 30, 2010. In addition, the June 30, 2010 valuation reflects the Plan’s return to an 80-120% market value corridor from the one year 70-130% market value corridor increase in the June 30, 2009 valuation. A listing of significant actuarial methods and valuation assumptions for the June 30, 2007, 2009, and 2010 valuations are presented below.
Actuarial valuations of an ongoing plan involve estimates of the value of reported amounts and assumptions about the probability of occurrence of events far into the future. Examples include assumptions about future employment, mortality, and the healthcare cost trend. Actuarially
determined amounts are subject to continual revision as actual results are compared with past expectations and new estimates are made about the future.
Projections of benefits for financial reporting purposes are based on the Plan and include the types of benefits provided at the time of each valuation and the historical pattern of sharing of benefit costs between the employer and plan members to that point. The actuarial methods and assumptions used include techniques that are designed to reduce the effects of short-term volatility in actuarial accrued liabilities and the actuarial value of assets, consistent with the long-term perspective of the calculations.
The Plan’s contribution rates were based on the actuarial valuation performed as of June 30, 2009 and June 20, 2007, respectively, except for the period June 26 through June 30, 2011, which were based on the June 30, 2010 valuation; the significant actuarial methods and assumptions used to compute the actuarially determined annual required contributions and the funded status are as follows:
NOTE 6 – POSTEMPLOYMENT HEALTHCARE PLAN CONTRIBUTIONS, FUNDED STATUS AND FUNDING PROGRESS (Continued)

60 Comprehensive Annual Financial Report 2010-2011 San José Police & Fire Department Retirement Plan
Notes to Financial Statements (Continued)
NOTE 6 – POSTEMPLOYMENT HEALTHCARE PLAN CONTRIBUTIONS, FUNDED STATUS AND FUNDING PROGRESS (Continued)
The schedules presented as required supplementary information following the notes to the financial statements, present multiyear trend information. The Schedule of Funding Progress for the Postemployment Healthcare Plan presents information about whether the actuarial values of plan assets are increasing or decreasing over time relative to the actuarial accrued liabilities for benefits. The Schedule of Employer Contributions for the Postemployment Healthcare Plan presents trend information about the amounts contributed to the plan by the City in comparison to the annual required contribution (ARC) determined in accordance with the parameters of GASB Statement 43. The ARC represents a level of funding that, if paid on an ongoing basis, is projected to cover normal cost for each year and amortize any unfunded actuarial liabilities (or funding excess) over a period not to exceed thirty years
NOTE 7 – CONTINGENCY
Commitments – As of June 30, 2011, the Plan had unfunded commitments to contribute capital for private equity and direct lending investments in the amount of $115,120,000.
Contribution Overstatement – On January 14, 2009, the Plan was advised by the City’s Finance Department that a portion of non-pensionable Fair Labor Standards Act (“FLSA”) earnings for Fire members of the Plan had been erroneously transmitted and paid into the Plan by the Fire members and City for a period of approximately 10 years. The City has estimated the overstatement of member and City contributions at approximately $1,000,000. The impact of the overstated pensionable earnings, due to the FLSA transmittal error, on retirement benefits is undetermined at this time. The City has advised that as of February 2009, the transmittal error has been corrected on a go forward basis. The City’s internal auditor has completed their review of the FLSA correction. The Plan’s external accountants also performed agreed-upon procedures that identified variances in the estimated overstatements. The City’s Finance Department is currently reviewing and preparing revised overstatement amounts.

61 Comprehensive Annual Financial Report 2010-2011 San José Police & Fire Department Retirement Plan
Required Supplementary InformationSCHEDULE OF FUNDING PROGRESS – DEFINED BENEFIT PENSION PLAN (Unaudited) (In Thousands)
As of June 30, 2010, the Plan’s most recent valuation, the Plan’s AAL increased by $267 million due to experience losses and changes in actuarial assumptions as recommended by the Board’s actuary. The Plan’s UAAL increased from $393.9 million as of June 30, 2009 to $653.7 million as of June 30, 2010. The increase in the UAAL was primarily due to the net impact of unfavorable investment returns, lower than expected salary increases, more deaths than expected among retirees/beneficiaries, more service retirements offset by fewer disability retirements, other actuarial experience, and a reduction in the discount rate from 8.00% (net of expenses) as of June 30, 2009 to 7.75% (net of expenses) as of June 30, 2010. In addition, the June 30, 2010 valuation reflects the Plan’s return to an 80-120% market value corridor from the one year 70-130% market value corridor increase in the June 30, 2009 valuation. The market value of assets corridor limits the smoothing of assets to be no greater than 120% and no less than 80% of the market value of assets as of June 30, 2010. Under this practice, investment gains or losses are recognized immediately if necessary to maintain the
smoothed assets within 80-120% market value corridor. The total unrecognized investment losses, for pension and health assets, were $353.8 million before and after the application of the 120% market value of assets corridor.
As of June 30, 2009, the Plan’s AAL increased by $591 million due to demographic experience losses and changes in actuarial assumptions as recommended by the Board’s actuary in the June 30, 2009 experience study. The Plan’s UAAL increased from $6.6 million as of June 30, 2007 to $393.9 million as of June 30, 2009. Change to the UAAL were primarily the result of (a) unfavorable investment returns during the last two years, (b) higher than expected salary increases, (c) earlier than expected retirements, (d) data corrections, and (e) changes in the actuarial assumptions including the one year increase in the Plan’s 80-120% market value corridor to 70-130%; see note 5 in the notes to the financial statements for further information on the actuarial changes and their impact on the Plan’s funded status.
Actuarial Valuation
Date
Actuarial Value of Assets
(1)
Entry AgeActuarialAccruedLiability(AAL) (2)
(Overfunded)Unfunded
(AAL/UAAL)
Funded RatioAnnual Cov-
ered Payroll (3)
(OAAL)/UAAL as a % of
Covered
(a) (b) (b-a) (a/b) (c) ((b-a)/c))
06/30/2005 $ 1,983,090 $ 2,027,432 $ 44,342 97.8% $ 210,018 21%
06/30/2007 (4) 2,365,790 2,372,386 6,596 99.7% 227,734 3%
06/30/2009 2,569,569 2,963,482 393,913 86.7% 243,196 162%
06/30/2010 2,576,705 3,230,456 653,751 79.8% 222,699 294%
1 Excludes accounts payable and Postemployment Healthcare Plan assets.2 Excludes postemployment healthcare liability.3 Prior to 06/30/2009, annual covered payroll represents the actuarial estimate of annual covered payroll for the subsequent year.4 After reflection of benefit improvements effective July 1, 2006 for Police members and July 1, 2008 for Fire.
Fiscal year ended June 30, Annual required employer contributions Percentage contributed
2006 $ 43,473 100%
2007 46,625 100%
2008 56,372 100%
2009 53,103* 100%
2010 52,315* 100%
2011 77,918* 100%
* Amount represents the annual required employer contributions paid by the City based on the actuarially determined lump sum prepayment amount; see note 6 to the financial statements for more information.
SCHEDULE OF EMPLOYER CONTRIBUTIONS - DEFINED BENEFIT PENSION PLAN (Unaudited) (In Thousands)

62 Comprehensive Annual Financial Report 2010-2011 San José Police & Fire Department Retirement Plan
Required Supplementary Information (Continued)
SCHEDULE OF FUNDING PROGRESS - POSTEMPLOYMENT HEALTHCARE PLAN (Unaudited) (In Thousands)
Actuarial Valuation
Date
Actuarial Value of Assets
ActuarialAccruedLiability(AAL)
Unfunded AAL (UAAL)
Funded RatioAnnual
CoveredPayroll
UAAL as a Percentage of
Covered Payroll
(a) (b) (b-a) (a/b) (c) ((b-a)/c))
06/30/2006 $ 38,381 $ 851,217 $ 812,836 5% $ 218,521 372%
06/30/2007 45,393 666,228 620,835 7% 227,734 273%
06/30/2009 55,618 761,604 705,986 7% 243,196 290%
06/30/2010 58,586 946,308 887,722 6% 222,699 399%
Actuarial valuations have been performed biennially through June 30, 2009; effective June 30, 2010 the Plan transitioned to annual valuations.
As of June 30, 2010, the Plan’s most recent valuation, the Plan’s AAL increased by $185 million due to changes in actuarial assumptions as recommended by the Board’s actuary. The Plan’s UAAL increased from $705.9 million as of June 30, 2009 to $887.7 million as of June 30, 2010. Changes to the UAAL were due to increased health care trend rate assumptions and a decrease in the Plan’s discount rate from 8.00% (net of expenses) as of June 30, 2009 to 7.75% (net of expenses) as of June 30, 2010. In addition, the June 30, 2010 valuation reflects the Plan’s return to an 80-120% market value corridor from the one year 70-130% market value corridor increase in the June 30, 2009 valuation.
As of June 30, 2009, the Plan’s most recent valuation, the Plan’s AAL increased by $95 million due to changes in actuarial assumptions as recommended by the Board’s actuary in the June 30, 2009 experience study. The Plan’s UAAL increased from $620.8 million as of June 30, 2007 to $705.9 million as of June 30, 2009. Changes to the UAAL were primarily the result of unfavorable investment returns during the last two years and changes in the actuarial assumptions including the one year increase in the Plan’s 80-120% market value corridor to 70-130%; see note 6 in the notes to the financial statements for further information on the actuarial changes and their impact on the Plan’s funded status.
SCHEDULE OF EMPLOYER CONTRIBUTIONS - POSTEMPLOYMENT HEALTHCARE PLAN (Unaudited) (Dollars In Thousands)
Fiscal Year Ended
Annual Required Contributions (1)
Actual Contributions
Percentage Contributed
06/30/2007 $ 61,344 $ 9,082 15%
06/30/2008 61,344 10,618 17%
06/30/2009 50,119 9,888 (2) 20%
06/30/2010 50,438 11,284 (2) 22%
06/30/2011 62,322 17,001 (2) 27%
(1) Includes an interest adjustment to the end of the plan year, where actual contributions are varied due to the City’s option to elect the periodic basis on which City contributions are paid to the Plan. Also includes the actuarially determined implicit subsidy amounts of $3,006 for 2007 and 2008; $3,175 for 2009; $4,262 for 2010; and $4,939 for 2011.
(2) Amount represents the annual required employer contributions paid by the City based on the actuarially determined lump sum prepayment amount; see note 6 in the notes to financial statements for more information. .

63 Comprehensive Annual Financial Report 2010-2011 San José Police & Fire Department Retirement Plan
Other Supplementary Information
The Plan’s funded status prepared by the Plan’s actuary is based on the actuarial value of assets. The actuarial value of assets differs from the market value of the Plan’s assets in that the actuarial value of assets includes five year smoothing of investment returns and the use of a market value of assets corridor. The market value of assets corridor limits the smoothing of assets to be no greater than 120% and no less than 80% of the market value of assets as of June 30, 2010. Under this practice, investment gains or losses would be recognized immediately if necessary to maintain smoothed assets within the 80-120% market value corridor. As a result of recent investment losses the actuarial value
of assets exceeded the market value of assets by 15% as of June 30, 2010. The divergence between the actuarial value of assets and the market value of assets has caused a variance of 10.7% between the funded ratios calculated under the two bases. As of June 30, 2010, the Plan’s most recent valuation the funded ratio of the Defined Benefit Pension Plan was 79.8% compared to a funded ratio of 69.1% on a market value of assets basis. A schedule of funding progress for the Defined Benefit Pension Plan on a market value of asset basis is as follows: (dollars in thousands)
MARKET VALUE OF ASSETS SCHEDULE OF FUNDING PROGRESS – DEFINED BENEFIT PENSION PLAN (Unaudited) (In Thousands)
Plan Year Ending
Market Value of Assets
Entry Age Actuarial Accrued
Liability (AAL)
(Overfunded)Unfunded
(AAL/UAAL)Funded Ratio
Annual Covered Payroll
(OAAL)/UAAL as a % of Covered Payroll
(a) (1) (b) (2) (b-a) (a/b) (c) (3) ((b-a)/c))
6/30/2003 $ 1,632,097 $ 1,823,200 $ 191,103 89.5% $202,222 94.5%
6/30/2005 2,044,542 2,027,432 (17,110) 100.8% 210,018 -8.1%
6/30/2007 2,666,585 2,372,386 (4) (294,199) 112.4% 227,734 -129.2%
6/30/2009 1,969,132 2,963,482 994,350 66.4% 234,196 424.6%
6/30/2010 2,231,723 3,230,456 998,733 69.1% 222,699 448.5%
(1) Excludes accounts payable and postemployment healthcare plan assets. (2) Excludes postemployment healthcare liability. (3) Prior to 06/30/2009, annual covered payroll represents the actuarial estimate of annual covered payroll for the subsequent year. (4) After reflection of benefit improvements effective July 1, 2006 for Police members and July 1, 2008 for Fire.
MARKET VALUE OF ASSETS SCHEDULE OF FUNDING PROGRESS – DEFINED BENEFIT PENSION PLAN (Unaudited) (In Thousands)

64 Comprehensive Annual Financial Report 2010-2011 San José Police & Fire Department Retirement Plan
Other Supplementary Information (Continued)
COMBINING SCHEDULE OF DEFINED BENEFIT PENSION PLAN NET ASSETS June 30, 2011 (In Thousands)
Retirement Fund
Cost-of-Living Total
Assets
Receivables:
Employee contributions $ 1,028 $ 429 $ 1,457
Employer contributions 2,096 1,333 3,429
Brokers and others 7,843 3,428 11,271
Accrued investment income 5,548 2,618 8,166
Total receivables 16,515 7,808 24,323
Investments, at fair value:
Securities and other:
Domestic fixed income 437,415 214,709 652,124
International fixed income 10,115 4,966 15,081
Pooled fixed income bond funds 7,453 3,658 11,111
Collective short term investments 26,559 13,037 39,596
Corporate convertible bonds 47,328 23,231 70,559
Domestic equity 442,099 217,008 659,107
International equity 233,840 114,782 348,622
Pooled international equity 111,998 54,975 166,973
Private equity 83,430 40,952 124,382
Opportunistic 78,641 38,601 117,242
Real assets 200,933 98,629 299,562
Real estate 83,347 40,911 124,258
International currency contracts, net 271 133 404
Securities lending cash collateral investment pool 223,549 109,184 332,733
Total investments 1,986,978 974,776 2,961,754
TOTAL ASSETS 2,003,493 982,584 2,986,077
LiabilitiesPayable to brokers 14,140 6,224 20,364
Securities lending collateral due to borrowers 225,393 110,085 335,478
Other liabilities 1,712 796 2,508
TOTAL LIABILITIES 241,245 117,105 358,350
Net Assets Held In Trust For:Pension benefits 1,762,248 865,479 2,627,727
TOTAL NET ASSETS $ 1,762,248 $ 865,479 $ 2,627,727

65 Comprehensive Annual Financial Report 2010-2011 San José Police & Fire Department Retirement Plan
Other Supplementary Information (Continued)
COMBINING SCHEDULE OF CHANGES IN DEFINED BENEFIT PENSION PLAN NET ASSETS June 30, 2011 (In Thousands)
Retirement Fund
Cost-of-Living Total
Additions
Contributions
Employee $ 22,788 $ 6,841 $ 29,629
Employer 42,100 35,818 77,918
Total contributions 64,888 42,659 107,547
Investment income:
Net appreciation in fair value of investments 222,193 106,395 328,588
Interest income 30,453 14,739 45,192
Dividend income 13,501 6,538 20,039
Net rental income 6,501 3,176 9,677
Less investment expense (6,580) (3,024) (9,604)
Net investment income before securities lending income 266,068 127,824 393,892
Securities lending income:
Earnings 2,472 1,153 3,625
Rebates (477) (230) (707)
Fees (292) (141) (433)
Net securities lending income 1,703 782 2,485
Net investment income 267,771 128,606 396,377
TOTAL ADDITIONS 332,659 171,265 503,924
Deductions
Retirement benefits 101,420 28,052 129,472
Death benefits 4,228 2,985 7,213
Refund of contributions 344 91 435
Administrative expenses and other 2,176 951 3,127
TOTAL DEDUCTIONS 108,168 32,079 140,247
NET INCREASE 224,491 139,186 363,677
Net Assets Held In Trust For Pension Benefits
BEGINNING OF YEAR 1,537,757 726,293 2,264,050
END OF YEAR $ 1,762,248 $ 865,479 $ 2,627,727

66 Comprehensive Annual Financial Report 2010-2011 San José Police & Fire Department Retirement Plan
Other Supplementary Information (Continued)
2011 2010
Investment Manager’s FeesGlobal Equity $ 3,195,878 $ 4,234,748
Fixed income: 2,411,768 2,160,242
Private equity 1,537,608 1,315,034
Opportunistic 507,465 -
Real estate 945,952 544,927
TOTAL INVESTMENT MANAGERS' FEES 8,598,672 8,524,951
Other Investment Fees
Investment consultant 708,348 598,143
Proxy voting 36,489 35,489
Real estate legal fees 28,741 113,051
Real estate appraisals 137,223 46,550
Investment legal fees 114,720 10,462
Custodian 200,000 197,750
Total other investment service fees 1,225,521 1,001,445
TOTAL INVESTMENT EXPENSES $ 9,842,192 $ 9,256,396
SCHEDULES OF ADMINISTRATIVE EXPENSES AND OTHER For the Fiscal Years Ended June 30, 2011 and 2010
2011 2010
Original Budget
Actual Variance Positive
(Negative) Actual
Personal services $ 2,251,812 $ 2,021,230 $ 230,582 $ 1,802,733
Non-personal/equipment 708,732 631,814 76,918 603,829
Professional services 692,478 547,145 145,333 614,350
TOTAL ADMINISTRATIVE EXPENSES & OTHER
$ 3,653,022 $ 3,200,189 $ 452,833 $ 3,020,912
SCHEDULES OF INVESTMENT EXPENSES For the Fiscal Years Ended June 30, 2011 and 2010

67 Comprehensive Annual Financial Report 2010-2011 San José Police & Fire Department Retirement Plan
Other Supplementary Information (Continued)
SCHEDULES OF PAYMENTS TO CONSULTANTS For the Fiscal Years Ended June 30, 2011 and 2010
Firm Nature of Service 2011 2010
Financial Knowledge/Peter Sepsis Educational Services $22,529 $44,258
Ice Miller, LLC Tax Counsel 74,117 -
Levi, Ray, & Shoup Web Development and maintenance 11,753 12,064
Levi, Ray, & ShoupPrograming changes and business continuance services 11,933 17,759
Macias Gini & O’Connell LLP External Auditors 50,907 89,188
Medical Director/Other Medical Medical Consultant 143,709 147,266
Pension Benefit Information Reports on Deceased Benefit Recipients 1,722 2,051
Robert Half Mangement Resources Temporary Staff 6,090 5,535
Saltzman & Johnson Legal Counsel 43,274 42,519
The Segal Company Actuarial Consultant 181,111 247,928
Wilfred Jarvis Institute Organizational Consultant - 5,782
TOTAL $547,145 $614,350


City of San José
Comprehensive Annual Financial Report
for the Fiscal Year Ended June 30, 2011
InvestmentSection

70 Comprehensive Annual Financial Report 2010-2011 San José Police & Fire Department Retirement Plan
Report of Investment Activity
November 21, 2011
Mr. Russell U. CrosbyDirector of Retirement ServicesCity of San Jose Police and Fire Department Retirement Plan1737 North First StreetSan Jose, CA 95112
Dear Mr. Crosby, The overall objective of the City of San Jose Police and Fire Department Retirement Plan (the “Plan’) is to ensure continued access to retirement, disability and survivor benefits for current and future SJP&F participants. To insure a solid foundation for the future of the Plan, the Board of Administration carefully plans and implements an investment program designed to produce superior long term investment returns, while prudently managing the risk of the portfolio. Investment policy and asset allocation are reviewed and revised by the Board of Administration, at least annually, to reflect the Plan’s actuarial assumptions, the accrued liabilities, and the investment outlook. Following is a report on the performance of the Plan for the fiscal year ending June 30, 2011. Although investment manager performance is key in the future “success” of the Plan, the overall asset allocation policy will be the primary determinant of such “success”. Modern portfolio theory maintains that long term investors, who assume prudent levels of risk, will be rewarded with incremental returns above lower returning and risk free assets (i.e. T-Bills). The Plan, in its asset allocation policy, is required to satisfy the need to pay accumulated/earned retirement benefits today, while at the same time be prepared for “uncertain” future benefits. This balancing of short-term versus long-term needs is a key tenant in the overall construction of the portfolio. To facilitate this demand balance of short term versus long term, the Board of Administration has adopted a diversified asset allocation structure that includes traditional asset classes such as U.S. and non-U.S. equities and fixed income, as well as alternative asset classes such as private equity, absolute return strategies or hedge funds, real estate, inflation-linked assets, and opportunistic investment strategies such as senior secured direct lending.
The Board of Administration continues to work diligently on expanding the alternative investment program, which will further assist in the diversification of the portfolio. Asset classes such as hedge funds are designed to lower the overall volatility of the program, while private equity is designed to provide higher long term performance above what is expected from traditional equity markets. As the allocation strategy evolves year after year, diversification and risk mitigation will continue to be the pillars of the asset allocation structure.
NEPC provides the Plan with quarterly economic and investment market updates and performance reviews, investment manager monitoring and selection advice, and related investment services for traditional and non-traditional asset classes. In preparing our performance analysis for the Plan, we rely on the accuracy of financial data provided by the Plan’s custodian bank and investment managers. Investment performance analysis and
900 Veterans Boulevard | Ste. 340 | Redwood City, CA 94063-1741 | TEL: 650.364.7000 | www.nepc.com
CAMBRIDGE | ATLANTA | CHARLOTTE | DETROIT | LAS VEGAS | SAN FRANCISCO
ALLAN MARTINMANAGING PARTNER
November 18, 2011
Mr. Russell U. Crosby Director of Retirement Services City of San Jose Police and Fire Department Retirement Plan 1737 North First Street San Jose, CA 95112
Dear Mr. Crosby,
The overall objective of the City of San Jose Police and Fire Department Retirement Plan (the “Plan’) is to ensure continued access to retirement, disability and survivor benefits for current and future SJP&F participants. To insure a solid foundation for the future of the Plan, the Board of Administration carefully plans and implements an investment program designed to produce superior long term investment returns, while prudently managing the risk of the portfolio. Investment policy and asset allocation are reviewed and revised by the Board of Administration, at least annually, to reflect the Plan’s actuarial assumptions, the accrued liabilities, and the investment outlook. Following is a report on the performance of the Plan for the fiscal year ending June 30, 2011.
Although investment manager performance is key in the future “success” of the Plan, the overall asset allocation policy will be the primary determinant of such “success”. Modern portfolio theory maintains that long term investors, who assume prudent levels of risk, will be rewarded with incremental returns above lower returning and risk free assets (i.e. T-Bills). The Plan, in its asset allocation policy, is required to satisfy the need to pay accumulated/earned retirement benefits today, while at the same time be prepared for “uncertain” future benefits. This balancing of short-term versus long-term needs is a key tenant in the overall construction of the portfolio. To facilitate this demand balance of short term versus long term, the Board of Administration has adopted a diversified asset allocation structure that includes traditional asset classes such as U.S. and non-U.S. equities and fixed income, as well as alternative asset classes such as private equity, absolute return strategies or hedge funds, real estate, inflation-linked assets, and opportunistic investment strategies such as senior secured direct lending.
The Board of Administration continues to work diligently on expanding the alternative investment program, which will further assist in the diversification of the portfolio. Asset classes such as hedge funds are designed to lower the overall volatility of the program, while private equity is designed to provide higher long term performance above what is expected from traditional equity markets. As the allocation strategy evolves year after year, diversification and risk mitigation will continue to be the pillars of the asset allocation structure.
NEPC provides the Plan with quarterly economic and investment market updates and performance reviews, investment manager monitoring and selection advice, and related investment services for traditional and non-traditional asset classes. In preparing our performance analysis for the Plan, we rely on the accuracy of financial data provided by the Plan’s custodian bank and investment managers. Investment performance analysis and

71 Comprehensive Annual Financial Report 2010-2011 San José Police & Fire Department Retirement Plan
Report of Investment Activity (Continued)
comparisons produced by NEPC have been calculated using standard performance evaluation methodologies and are consistent with industry standards. Performance results are calculated using a time-weighted return methodology. The Plan’s goal of achieving market rates of returns, while mitigating unwarranted risk, is measured against appropriate benchmarks and comparative universes on a quarterly basis. Performance is measured on a most recent quarter, year-to-date, and accumulated trailing annual periods, as well as three and five year periods (full market cycle). Risk-adjusted performance on an absolute basis and a comparative basis is also measured. This review process allows the Plan to evaluate and determine whether established goals and objectives are being achieved. NEPC will recommend termination and replacement when individual manager goals and objectives are not being met, when there are significant changes to an investment management firm’s organizational structure, departures of key investment professionals, or when a manager deviates from the investment style for which they were hired.
Fiscal Year 2011 Market Review Fiscal year 2011 continued the recovery process that began in fiscal year 2010 from the lows experienced during fiscal year 2009. Market sentiment and macroeconomic events played key roles as drivers of global markets throughout the fiscal year. Support from governments and central banks continued for much of the fiscal year until the last quarter which saw a relenting of quantitative easing by the Federal Reserve and fiscal austerity measures across Europe being implemented in an attempt to reign in public debt. Investors flocked to riskier assets during most of the fiscal year until global concerns mounted, causing a pullback and flight to safer assets during the 2nd quarter of calendar year 2011. Sentiment began to shift negative as the European debt crisis, increased inflation concerns, and multiple geopolitical risks weighed heavily in investors’ minds. Further compounding investor sentiment was an inability of Congress to reach a deal on the U.S. debt ceiling which remained unresolved as of June 30, 2011. The broad domestic equity market, as measured by the S&P 500 Index, continued its strong recovery from fiscal year 2009, producing a +30.7% return for fiscal year 2011. The domestic bond market, as measured by the Barclays Capital U.S. Aggregate Bond Index, returned +3.9% in fiscal year 2011, representing a drop from the previous two years at +6.1% in 2009 and +9.5% in 2010. The global equity market, as measured by the MSCI All Country World Index (Net of Dividend Withholding Tax), returned +30.1% in fiscal year 2011 relative to a positive +11.8% in fiscal year 2010. The quarter ended September 30, 2010 proved to be a volatile start to the fiscal year as markets moved each month along with investor sentiment eventually rallying in September to post strong gains for the quarter. Hints of more quantitative easing from the Federal Reserve helped drive the rally as the S&P 500 posted its best September since 1939 and finished the quarter at +11.3%. These hints also helped global markets as U.S. dollar depreciation contributed heavily to the MSCI EAFE which returned +16.5% for the quarter. Foreign currency gains against the dollar contributed +9.4% to the MSCI EAFE index. The late September rally masked overall concerns in the global economy as sovereign debt levels remained unattractively high and further quantitative easing providing only a short-term measure to stimulate the market and improve liquidity. The quarter ended December 31, 2010 saw a continuation of volatile, sentiment driven markets. The Fed’s initiation of another round of quantitative easing (QE2) in November along with a tax deal that included a payroll tax cut, extension of unemployment benefits, and a tax credit for business capital expenditures helped boost equity market returns. Small cap stocks led

72 Comprehensive Annual Financial Report 2010-2011 San José Police & Fire Department Retirement Plan
the way as the Russell 2000, Russell 2000 Growth, and Russell 2000 Value each posted gains of +16.3%, +17.1%, and +15.3% for the quarter. International markets also benefitted from QE2 as it overshadowed the lingering European debt issue. Interest rates rose sharply during the quarter which caused most fixed income markets to turn negative as investors shifted to riskier assets. The first quarter of 2011 featured a plethora of external events that dominated headlines across global markets. Political turmoil in the Middle East, multiple natural disasters in Japan, a deepening civil war in Libya, and the downgrading of Greek, Portuguese, and Spanish government bonds all played a role in the volatile quarter. Though the markets continued to be volatile, equity markets, with the exception of Japan, posted positive returns for the quarter. The S&P 500 posted a +5.9% return while small cap stocks continued to outperform other indices as the Russell 2000 posted a +7.9% return. International markets fared well but were weighed down by performance in Japan as the MSCI Japan Index was down -4.9% while the MSCI EAFE Index was +3.4% for the quarter. Fixed Income markets proved to be resilient through the first quarter with U.S. credit sectors posting strong results based on improving business and unemployment indicators. Rising commodity prices and further QE2 sparked concern over high inflation causing yields on 10-year Treasuries to rise 17 basis points as investors sought safety in treasuries. The Federal Reserve also announced that it would maintain a fed funds rate near zero for an extended period. The quarter ended June 30, 2011 began on a positive trend but macroeconomic headlines dominated in May and June, wiping away most gains. The European debt crisis, growing inflation concern in China, and poor U.S. job reports fed investor sentiment that the global recovery was stalling. Fiscal austerity measures in Europe and the Fed’s decision to forgo any additional quantitative easing further reduced support systems for the global recovery. Overall, most U.S. equity markets posted relatively flat returns for the quarter with mid-cap stocks performing best. Internationally, the developed markets outperformed emerging markets as the MSCI EAFE Index posted a +1.6% return compared to -1.1% for the MSCI Emerging Markets Index. The MSCI EAFE Index was boosted by the sell-off of the dollar, which in local currency returned -0.8% for the quarter. Fixed income markets posted positive returns for the quarter as investors sought safety, driving yields downward across the yield curve. The Barclays Capital U.S. TIPS index posted a +3.7% return over the quarter highlighting increased attention towards hedging the risk against inflation. A looming concern that had yet to be addressed by the end of the quarter was the U.S. debt ceiling which Congress had yet to reach a deal on. A deal was struck on August 1st to raise the debt ceiling which averted the threat of a default by the U.S. government. However, this did not stop Standard & Poor’s from downgrading the U.S. debt rating to AA+ on August 5th. Standard & Poor’s cited “political brinkmanship” and a debt deal that did not go far enough in trying to reign in U.S. debt levels as contributing factors. While the move was anticipated, the event triggered a global sell-off with increasing volatility. The investment performance reported in this letter is in conformance with the presentation standards of the CFA Institute’s Global Investment Performance Standards (GIPS). The Plan returned 18.1% net of fees for the fiscal year ending June 30, 2011, which ranked in the 92nd percentile of the Independent Consultants Cooperative’s (ICC) Public Funds Greater than $1 Billion Universe. By comparison, the median fund in the universe returned 21.7% for the period. In a year when global equity markets returned ~30%, the Plan trailed the median fund in the universe due to its lower equity allocation. As of June 30, 2011, the Plan’s allocation to public global equity markets was 45.1%, while the median fund allocates 56.9% to public global equities. Over the past several years, we have been working with the Department of Retirement Services to reduce the Plan’s exposure to public equity markets, thereby reducing the overall volatility of the Plan, by diversifying into several new asset classes, including inflation-linked assets and opportunistic credit strategies.
Report of Investment Activity (Continued)

73 Comprehensive Annual Financial Report 2010-2011 San José Police & Fire Department Retirement Plan
Report of Investment Activity (Continued)
For the five-year period ending June 30, 2011, the Plan returned 4.3% net of fees per annum, below the actuarial target of 7.75%. On a relative basis, the Plan ranks in the 53rd percentile of the ICC Public Funds Greater than $1 Billion peer group universe. The Plan’s five-year volatility, as measured by standard deviation, ranked in the 58th percentile of its peers, while the risk-adjusted return of the portfolio as measured by the Sharpe Ratio, ranks in the 59th percentile of the universe.
ICC Public Funds Greater than $1 Billion UniverseRisk-Return Comparison (Gross of Fees)
5 Years Ending June 30, 2011
In uncertain markets such as these, diversification can help protect portfolios from experiencing significant declines. Diversification aims to reduce volatility and better equalize the contribution to overall plan risk across a variety of asset classes with uncorrelated return patterns. We continue to work with the Board of Administration and the Department of Retirement Services to diversify the Plan across additional asset classes with the goal of lowering the risk of the portfolio while maximizing the potential for capital appreciation. Sincerely,
Allan MartinManaging Partner
1 As of June 30, 2011, the ICC Public Funds Greater than $1 Billion Universe was comprised of 77 total funds with approximately $1.3 trillion in assets. Universe rankings are based on gross of fee performance. The Plan’s gross of fee performance was 18.4% and 4.6% for the one- and five-year annualized periods ending June 30, 2011, respectively.

74 Comprehensive Annual Financial Report 2010-2011 San José Police & Fire Department Retirement Plan
Statement of Investment Policy
General Environment
Investments in the San Jose Police and Fire Department Retirement Plan are subject to the restrictions specified in the San Jose Municipal Code 3.36.540. Further invest-ment management guidelines are imposed by the Board of Administration.
Investment Guidelines General
The Board Shall:
(1) Require that the Retirement System be actuarially sound to assure that all disbursement obligations will be met.
(2) Attempt to insure that investment earnings be suf-ficiently high to provide a funding source, along with contributions from City employees and the City, in order to offset liabilities in perpetuity.
(3) Strive for the highest total return on invested funds consistent with safety in accordance with accepted investment practices.
(4) Have the authority to grant specific exceptions to any part of the Investment Policy Statement where in their judgment the exception may add value to the fund without undue risk.
Asset Allocation
The following policy has been identified by the Board of Administration as having the greatest expected invest-ment return, and the resulting positive impact on asset values and funded status without exceeding a prudent level of risk. The Board determined this policy after evaluating the implications of increased investment return versus increased variability of return for a number of potential investment policies with varying commitments to stocks and bonds.
It shall be the policy of the Plan to invest its assets in accordance with the maximum and minimum range, valued at market, for each asset class as stated below:
Asset Class Minimum Target Maximum
Fixed Income 15% 25% 35%
Core Fixed Income 5%
TIPS 10%
Long Bonds 5%
Opportunistic Credit
5%
Alternative Assets
10% 35% 60%
Private Equity 0% 5% 10%
Real Estate 5% 10% 15%
Inflation-Linked Assets
5% 10% 15%
Absolute Return 0% 5% 10%
Opportunistic 0% 5% 10%
Asset Class Minimum Target Maximum
Equity 30% 40% 50%
U.S. Large Cap 18%
U.S. Small Cap 5%
Non-U.S. Developed Markets
12%
Non-U.S. Emerging Markets
5%
The Plan’s asset allocation will be reviewed relative to the targets on a semi-monthly basis and action will be taken to re-balance to within the target ranges by means of asset transfers among the categories.
When necessary and/or available, cash inflows/outflows will be deployed in a manner consistent with the strategic asset allocation of the Plan.
The general guideline for re-balancing the portfolio would be when the allocation to a particular asset class reaches 95-100% of the maximum or 100-105% of the minimum; the fund will be re-balanced to within the policy range over the following 60 days.
At any point in time, it is understood that the fund man-agers may not be fully invested. However, managers are expected to be fully funded and cash positions in excess of 7% require the manager to notify the Board of Administra-tion in writing. While the Plan’s assets may be partially invested in cash equivalents, for asset allocation purposes these funds shall be considered invested in the asset classes of the respective managers. In turn, each man-ager’s performance will be evaluated on the total amount of funds under its management.
The asset allocation ranges established by this investment policy represent the long-term perspective. As such, rapid unanticipated market shifts may cause the asset mix to fall outside the policy range. Any divergence should be of a short-term nature. The Board of Administration will review the asset mix of the Plan on a quarterly basis and cause the asset mix to be rebalanced to within the policy range as necessary.

75 Comprehensive Annual Financial Report 2010-2011 San José Police & Fire Department Retirement Plan
Statement of Investment Policy (Continued)
Investment managers may request temporary exemptions from guideline limits by submitting written requests to the Board of Administration for prior approval. For special situations, the Board of Administration can grant special exemptions from the guidelines. In no case can a man-ager actively exceed guideline limits without formal prior approval by the Board.
Diversification
Investment diversification is consistent with the intent to minimize the risk of large losses to the Plan. Conse-quently, the total fund will be constructed by the indi-vidual portfolio managers to attain prudent diversification in several asset classes. To ensure adequate diversification, no manager will hold more than 5% of its portion of the total Plan assets in any single security with the exception of government backed securities and real estate equity. As a general rule, Plan assets placed with an investment man-ager will not represent more than 10% of that manager’s total assets.
Volatility
Consistent with the desire for adequate diversification, the investment policy is based on the assumption that the volatility (the standard deviation of returns) of the portfo-lio will be relative to that of the market. Consequently, it is expected that the volatility of a commitment-weighted composite of the market indices, e.g., S&P 500 Index for stocks and Barclays Capital Aggregate Bond Index for bonds and U.S. T-Bills for cash, will be commensurate with the Plan’s volatility.
Liquidity
Presently there is not a requirement to maintain signifi-cant liquid reserves for the payment of pension benefits. The Board has authorized the Board of Administration Secretary to review the projected cash flow requirements at least annually and indicate to investment managers the required liquidity.
Contributions are expected to be in excess of net ben-efit payments over the foreseeable future, resulting in a positive cash flow, which will be reinvested by the fund manager who receives the cash flow.
Commingled Funds
Investment in any of the allowed asset classes may be implemented through an investment in a pooled or com-mingled fund. Pooled funds and other types of com-mingled investment vehicles provide, under some cir-cumstances, lower costs and better diversification than can be obtained with separately managed funds pursuing
the same investment objectives. Commingled investment funds cannot customize investment policies and guide-lines to the specific needs of individual clients. Whenever an investment is made through a pooled fund, the state-ment of investment policy of the pooled fund will override this Plan’s policy. However, the Investment Manager of the pooled fund shall advise the Investment Committee, in writing, of the sections of this policy that may be violated.
Fixed Income
The Board shall require that the majority of the fixed income portfolio be invested in high quality (investment grade) marketable bonds as provided in Section 3.36.540. Whether a global fixed income manager is employed, or separate domestic and international fixed income managers are employed, they are to invest in accordance with the following guidelines (please refer to section entitled INVESTMENT GUIDELINES, General (4) for exception policy):
(1) Portfolio investments will be composed primarily of fixed income securities (including short-term obliga-tions) denominated in either United States or foreign currencies. Securities may be issued by domestic or foreign governments, domestic or foreign government agencies and instrumentalities, international banks or other international organizations, corporations or other forms of business organizations.
(2) The investment manager may also purchase securi-ties of other categories. These investments may be used within prudent limits to manage risk, lower transaction costs, or augment returns as long as leverage is not applied. The manager will invest the assets at such times, in such amounts and in such investments as the manager shall determine in its discretion.
(3) Deposits in banks or banking institutions, domestic or foreign, may be made. Because the fundamental objective is to enhance the rate of return calculated in U.S. dollars, and currency exchange gains and losses are included in the calculation of total return, currency hedging shall be permitted, at the discre-tion of the manager, to protect the value of specific investments in U.S. dollar terms.
(4) All bonds and notes in which the assets are invested, and which mature one year or more from the date of original issues, shall carry a rating of “BBB” or better by two of the following three rating services: Stan-dard & Poors, Moody’s Investor Services, or Fitch. In the event that ratings are provided by only two agen-cies and the third is non-rated, the most conservative (lowest) rating will be assigned. If only one agency

76 Comprehensive Annual Financial Report 2010-2011 San José Police & Fire Department Retirement Plan
Statement of Investment Policy (Continued)
assigns a rating, that rating will be used; or, if unrated, shall be of equivalent quality in the judgment of the investment manager to a similar domestic issue. Managers may, with prior written authorization, invest a maximum of 20% of their fixed income portfolio in bonds or notes that are rated B or BB.
(5) If bonds are downgraded below the minimum credit quality allowable in the guidelines at the time of pur-chase, the Manager is permitted to hold up to 2% of the Plan’s portfolio managed by the individual man-ager, using the lower of S&P, Moody’s, and Fitch’s rating in the event of a split-rated security. The Manager will continue to notify staff of the downgrade and confer with staff as to whether the security will continue to be held or disposed. The Manager will also provide quarterly reporting on the downgraded securities.
(6) The fund will be valued in United States dollars on the last business day of each month and on such other “Valuation Dates” as the Board may deem appropriate. For valuation purposes, all foreign currency, foreign deposits and securities quoted in foreign currencies shall be converted into dollars pursuant to methods consistently followed and uni-formly applied.
(7) The manager may invest a portion of the assets in commingled accounts with specific mandates such as high yield trust funds with prior approval by the Board. The average credit quality of the commingled account shall be a “B” or better rating.
Domestic Common Stock
The primary emphasis of the common stock portfolio will be on high quality, readily marketable securities offering potential for above average return as protection against inflation. Common stock investments are limited to those meeting all of the following criteria (please refer to section entitled INVESTMENT GUIDELINES, General (4) for exception policy):
(1) Investment in any corporation shall not exceed 5% of the outstanding shares of the corporation.
(2) Not more than 5% of the total assets at market may be invested in preferred stocks.
(3) Not more than 5% of any Investment Manager’s port-folio at market shall be invested in the common stock of any corporation, except when:
• Thesecurityhasaweightinggreaterthan5%inthe manager’s benchmark and
• Themanagerhasreceivedpriorwrittenpermis-sion from the Director of Retirement Services. The Director will then inform the Investment Committee of any exceptions that were granted.
(4) The manager will invest the assets at such times, in such amounts and in such investments as the man-ager shall determine in its discretion.
(5) Upon the Investment Committee approval, a manager may invest in convertible securities.
International Common Stock
The following are guidelines for International Equity portfolios (please refer to section entitled INVESTMENT GUIDELINES, General (4) for exception policy):
Developed Markets
(1) The portfolio will be invested in non-U.S. common stocks. Investment in American Depository Receipts (ADR’s) is permitted but they will not be considered U.S. equities. U.S. equities are not permitted. The maximum amount of developed markets interna-tional common stock to be held is 20% of the Fund’s total assets valued at market. The Board will cause the asset mix to be rebalanced to remain within the 20% restriction. A maximum of 20% of a manager’s international equity portfolio may be invested in emerging markets.
(2) Holding cash or cash equivalents, either U.S. or non-U.S., for the purpose of protecting the portfolio against perceived adverse equity market conditions abroad, will not be permitted. However, while the manager is expected to remain fully invested over time, cash and cash equivalent holdings will be permitted up to maximum of 7% of the manager’s portfolio for the purpose of making country and security adjustments to the portfolio. Cash positions in excess of 7%, except for pending transactions, require the manager to notify the Board of Adminis-tration in writing.
(3) To ensure proper diversification, the fund will be invested in a wide variety of economic sectors and countries. No one equity position will represent more than a total of 5% of the portfolio.
(4) Upon the Investment Committee approval, a manager may invest in convertible securities.

77 Comprehensive Annual Financial Report 2010-2011 San José Police & Fire Department Retirement Plan
Statement of Investment Policy (Continued)
Emerging Markets
(1) The portfolio will be invested in non-U.S. common stocks. Investment in American Depository Receipts (ADR’s) is permitted but they will not be consid-ered U.S. equities. U.S. equities are not permitted. The maximum amount of emerging international common stock to be held is 8% of the Fund’s total assets valued at market. The Board will cause the asset mix to be rebalanced to remain within the 8% restriction.
(2) Holding cash or cash equivalents, either U.S. or non-U.S., for the purpose of protecting the portfolio against perceived adverse equity market conditions abroad, will not be permitted. However, while the manager is expected to remain fully invested over time, cash and cash equivalent holdings will be per-mitted up to maximum of 7% of the manager’s port-folio for the purpose of making country and security adjustments to the portfolio. Cash positions in excess of 7%, except for pending transactions, require the manager to notify the Board of Administration in writing.
(3) To ensure proper diversification, the fund will be invested in a wide variety of economic sectors and countries. No one equity position will represent more than a total of 5% of the portfolio, except when:
• Thesecurityhasaweightinggreaterthan5%inthe manager’s benchmark and the manager has received prior written permission from the Direc-tor of Retirement Services. The Director will then inform the Investment Committee of any excep-tions that were granted.
High Yield Bonds and Bank Loans
The High Yield Bonds and Bank Loans portion of the plan assets shall be invested predominantly in below investment grade securities and bank loans. The investment manag-ers employed to manage high yield and bank loan instru-ments will have discretion in the day-to-day management of assets under their control. The high yield and bank loan managers shall have discretion to invest in all the instru-ments allowed for investment by the domestic bond man-agers, plus the investments that meet the following criteria:
(1) At the time of purchase at least 95% of the instru-ments must have a minimum rating of B- or B3, or if unrated, of a comparable quality rating as determined by the Investment Manager. Should more than 5% of a portfolio fall below this standard, the investment manager shall notify the Board of the downgrade immediately and submit a plan for returning the portfolio to the standard.
(2) U.S. corporate bonds, including zero-coupon, step-up, convertible, toggle and pay-in-kind bonds and non-dollar corporate bonds (which should be hedged), private placement securities, bank loans, participations and assignments.
(3) U.S. dollar denominated bonds issued by entities not domiciled in the United States (Yankee bonds / euro bonds)
(4) U.S. Treasury futures, currency forward or futures contracts, and credit default swaps may be used for hedging purposes.
(5) No more than 3% of the portfolio shall be invested in obligations of a single non-governmental issuer.
(6) The number of issues held, the sector and the indus-try diversification constraints shall be detailed in each manager’s investment guidelines. The portfolio shall be appropriately diversified as consistent with the manager’s stated investment approach.
(7) Following is a summary of the manager’s investment guidelines:
(a) Following the initial investment period, man-ager anticipates minimal turnover and the manager will be expected to hold the bonds to maturity. Sales or exchanges will only occur due to credit impaired assets or defaults.
(b) Following are the benchmarks to be used:
• BankLoans: TheCSFBLeveragedLoanIndex with a maximum of 20% in High Yield Corporate Bonds.
• HighYield: MerrillLynchHighYieldBB-B Rated Index (HOA4).
(c) Bank loan securities should be purchased only from corporations that also issue high yield bonds and cannot exceed 20% of the portfolio (at the time of purchase).
(d) Diversification Requirements & Portfolio Construction:
The portfolio shall be managed within the following parameters:
• Maximum5%ofitsassetsinthesecuritiesof any single issuer;
• Maximum15%ofitsassetsinasingleindustry, with the exception of any one industry which may have up to 20% of the portfolio’s assets;

78 Comprehensive Annual Financial Report 2010-2011 San José Police & Fire Department Retirement Plan
Statement of Investment Policy (Continued)
• Maximumfinallegalmaturityofanyissueof 7 years;
• Maximumaveragelifeof4years;
• Bankloansshouldbepurchasedonly from corporations that also issue high yield bonds.
Issuer limits are set at time of funding and can and will fluctuate as the client receives distributions from the portfolio.
In a situation in which a bond or loan has a put fea-ture or is trading on a yield to call basis as a result of a potential corporate event that the manager views as a very high probability event (e.g., takeover, merger, asset sale, refinancing, etc.), the manager will treat the expected put date or event date as the final legal maturity.
(e) Concentration Allocation [Maximum, except U.S. Treasury/Agency and Bank STIF’s]:
• FixedIncomeSecuritiesMaximum: - Per Issuer – Benchmark + 3%
• Short-termInstrumentsMaximum: - Per Issuer – 4% of Portfolio
• 20%maximuminPrivatePlacementSecuritieswithout registration rights.
• 25%maximuminanyoneindustry(MerrillLynch level 4).
Convertible Bonds
The Convertible Bonds portion of the plan assets shall be invested predominantly in convertible securities. The Manager may invest in investment or non-investment grade rated U.S. and non-U.S. convertible securities, including convertible bonds; convertible preferred stock; bonds or preferred stock with warrants; and zero- and low-coupon convertibles across the entire credit quality spectrum. In addition, the investment manager can utilize convertible structured notes issued by third parties, as well as synthetic convertible securities created by the investment manager. The investment manager(s) employed to manage the convertible instruments will have discretion in the day-to-day management of assets under their control. The convertible bond manager(s) shall have discretion to invest in all the instruments allowed for investment by the domestic bond managers, plus all the investments that meet the following criteria:
(1) At the time of purchase at least 95% of the instruments must have a minimum rating of B- or
B3, or if unrated, of a comparable quality rating as determined by the Investment Manager. Should more than 5% of a portfolio fall below this standard, the investment manager shall notify the Board of the downgrade immediately and submit a plan for returning the portfolio to the standard.
(2) U.S. Treasury Securities, U.S. corporate bonds, including zero-coupon, step-up, toggle and pay-in-kind bonds and non-dollar corporate bonds (which may be hedged), private placement securities, bank loans, participations and assignments.
(3) Non-dollar and U.S. dollar denominated bonds issued by entities not domiciled in the United States (Yankee bonds/euro bonds).
(4) U.S. Treasury futures, currency forward or futures contracts, and credit default swaps may be used for hedging purposes only.
(5) Equity securities obtained as a result of conversion must be liquidated within 60 trading days after conversion. This period may be extended upon approval by the Board.
(6) No more than 5% of the portfolio shall be invested in obligations of a single non-governmental issuer at cost, and 8% at market value.
(7) The portfolio shall be appropriately diversified by number of issues, geography and sector. In general, the portfolio will hold between 60-120 issues and be generally invested in a minimum of 5 countries. In addition, the portfolio allocation to any single sector will not exceed 1½ times the sector weight of the benchmark.
(8) The general position of the portfolio is to be hedged from a currency perspective.
Real Estate
The Plan is currently moving from direct ownership of Real Estate investments to pooled funds. The transition will occur over an extended time period.
Investable InstrumentsInvestment Vehicles
Real estate investments can be made through a variety of different vehicles. The following vehicles are allowed: • Open-endpooledfunds • Close-endpooledfunds • Separateaccounts • Fundoffunds • RealEstateInvestmentTrusts

79 Comprehensive Annual Financial Report 2010-2011 San José Police & Fire Department Retirement Plan
Statement of Investment Policy (Continued)
Co-Investment and Direct Placements
Investors’ rights may include opportunities for additional capital participation such as co-investment or other side-by-side direct investments opportunities. Committing capital for exercising these rights is currently prohibited. Discretionary managers may exercise the co-investment rights with pre-approval by the Board.
Private Equity
Subject to specific approval of the Investment Committee of the Board of Administration, investments may be made for the purpose of creating a diversified portfolio of private markets. Examples of such private markets investments include, but are not limited to, venture capital partner-ships, leveraged buyout funds, private debt, and private placements. While it is expected that the majority of these assets will be invested within the United States, a portion can be allocated to non-US investments, with a primary focus on Europe. Investments may be made in secondary investments on an opportunistic basis (please refer to sec-tion entitled INVESTMENT GUIDELINES, General (4) for exception policy).
It is expected that these investments will typically be struc-tured through the use of Fund of Funds managers. Therefore, it is possible that those managers would engage in direct investments or co-investments, in which the Plan would pur-chase majority control in individual corporate entities.
Funds that are committed, but not yet drawn down, may be invested in the Plan’s small cap equity funds, as the risk/reward characteristics of these funds most closely match those of Private Equities.
The following sub-category allocations were derived to be consistent with the investable universe within private markets. The ranges reflect long-term averages, once the 5% allocation to Private Equities has been fully committed. During the initial investment period, approximately four to six years, it is expected that sub-category allocations may fall outside the approved ranges.
Opportunistic Strategies
Investment in any of the instruments or vehicles allowed in other sections is also allowed in this section. In addition, investment in the credit market is also allowed and may be implemented through:
1. Pooled funds; Separate accounts; Limited Partner-ships; or Limited Liability Company;
2. Credit linked notes;
3. Direct investment.
Direct Investment may be implemented through invest-ments in any of the following markets and securities:
1. High Yield Bonds;
2. Leveraged Bank Loans;
3. Sovereign Emerging Market debt;
4. Distressed Debt;
5. Collateralized bond, loan or debt obligations.
Absolute Return
Absolute Return Funds, also called Hedge Funds, are private investment vehicles that are not registered with the U.S. Securities and Exchange Commission (SEC); they are offered in Limited Partnerships or Limited Liability Company form.
The allowed Absolute Return Strategies are:
1. Any of the following single strategies:
a. Equity long/short including Absolute Return Strategies specializing in Emerging Markets, Market Capitalization, Regional, Sectoral or Global Market subsets;
b. Equity Market timing;
c. Short or dedicated short;
d. Distressed securities;
e. Merger Arbitrage;
f. Event driven or Risk Arbitrage;
g. Fixed Income Arbitrage;
h. Convertible Bond Arbitrage;
i. Equity Market Neutral;
j. Statistical Arbitrage;
*International allocations and secondary investments are reflected within each sub-category
Sub-Category* Minimum Target Maximum
Buyouts 40% 60% 70%
Venture Capital 20% 30% 50%
Debt-Related 0% 10% 20%

80 Comprehensive Annual Financial Report 2010-2011 San José Police & Fire Department Retirement Plan
Statement of Investment Policy (Continued)
k. Relative Value Arbitrage;
l. Global Macro or Global Tactical Asset Allocation;
m. Managed Futures and Commodity Trading Advisors (CTA’s).
2. Multi-Strategy or Fund of Funds are also allowed and combine several single Absolute Return strategies into a single portfolio. The combination provides, in some circumstances, diversification of risk in a single investment.
Real Assets
The following strategies are allowed:
a. Commodities The strategy targets liquid investments in the commodities markets via derivatives (e.g. futures and swaps). Certain strategies may also include, to a lesser extent, investment in physicals for forward delivery. Exposure includes four major commodity market sectors: Energy Agriculture/Livestock, Industrial Metals, and Precious Metals. Expected total return is due primarily to spot price appreciation; secondarily to contract roll forward dynamics, or the differential between spot and future price (between near and longer term contracts); and thirdly to modest collateral income.
The Real Asset program may employ both passive and active commodity management. Examination of cash collateral, in particular the quality of fixed income market exposure, will be considered in risk mitigation.
b. Energy The strategy targets both public and private energy-related entities. The Energy investment strategy consists of three segments: upstream, midstream, and downstream businesses. Opportunities include core diversified global conglomerates that may span across segments and specific, concentrated satellite investments that may focus on a specific Energy market segment. Investments may include both traditional (oil, natural gas, coal) and alternative (wind, solar) energy sources.
The Upstream Investment Strategy focuses on the production of oil and gas, and includes petroleum Exploration and Production (E&P) businesses and power generation.
The Midstream Investment Strategy focuses on transporting the upstream products from the source to the end user, and includes storage
and processing, as well as oilfield services (the equipment and services required to produce petroleum) and electricity transmission equipment and services. Midstream assets include pipelines, gathering and storage facilities, refining, power lines, and transformer stations. Services are also considered midstream elements, such as oilfield equipment like drill bits, drill rigs, well trees, and geologic and mapping services.
The Downstream Investment Strategy focuses on the end users of upstream production. Power generation is an end user of petroleum products, while households and businesses are the downstream users of power generation. Downstream assets can also be local distribution centers, such as home heating oil distributors or gas stations.
Each segment of the strategy has different investment characteristics, income profiles, and risks.
c. Metals & Mining Public equities in the Industrial and Precious metals-related industries investment opportunities include large core diversified global conglomerates and more specific, concentrated investments. Supply chain position may include upstream, midstream, and downstream companies. Expected total return is due primarily to appreciation and some income.
d. Public Agriculture-related Invests primarily in Agriculture-related companies. Exposure may include both traditional agriculture and livestock investments and renewable energy sources. Supply chain position may include upstream, midstream, and downstream companies. Equity-based agriculture exposure ranges from upstream producing companies (i.e. growers) or those who are closely related to them, such as seed and agricultural chemicals companies, to downstream packaged foods producers. Opportunities include core diversified global conglomerates that may span across segments and specific, concentrated satellite investments that may focus on a specific market segment. Expected total return is due primarily to appreciation and some income.
e. Timberland The strategy targets both public and private Timberland Investment Management Organizations, TIMO. The investment strategy includes investing in entities that derive their returns from the growth and harvest of timber,

81 Comprehensive Annual Financial Report 2010-2011 San José Police & Fire Department Retirement Plan
Statement of Investment Policy (Continued)
a renewable and biologically growing asset. The investments may include both plantations who utilize intensive management techniques to enhance biological growth and naturally regenerating strategies. The investment strategy has varying time horizons to liquidity, shorter term for softwoods (e.g. for pulp and lumber) to longer term time horizon (e.g. hardwoods).
f. Infrastructure Public and private investments in direct physi-cal assets, or a company that operates assets that provide essential services to society. Ranges from publicly held equities to very illiquid private part-nerships. Exposure includes toll-oriented projects (e.g. roads, bridges, tunnels), transport-focused (e.g. railroads, airports, seaports); regulated utilities (e.g. gas pipelines; water/sewer treat-ment facilities); and social services (e.g. schools, hospitals). High toll-orientation offers inflation protection. Expected total return is due primarily to current income and to a lesser extent capital appreciation. Satellite strategies typically use more leverage than core.
Typically, infrastructure assets exhibit one or more of the following qualities: monopolistic or quasi-monopolistic, high barriers to entry, long term assets, and significant regulatory or permitting constraints.
g. Emerging Sub-Strategies Growth in these sectors is expected to outpace inflation, due in part to evolving global macroeconomic trends. Investment in these emerging sectors may therefore help provide an effective hedge against inflation, as part of a well-diversified Real Asset strategy.
The Real Asset Program may seek modest exposure in these areas. Emerging sub-strategies may have a limited universe of qualified, institutional-quality managers.
h. Climate Change An investment strategy that focuses on the global political and economic momentum in favor of reducing greenhouse gas emissions.
i. Farmland/Agribusiness An investment strategy targets the market segment of agriculture. Farmland consists of two main property types: row and permanent crop properties. Row crops are harvested from soil and are categorized as commodity, (corn and soybean) and vegetable, (potatoes and lettuce). Permanent
crops grow on trees and have three categories: citrus fruit, (oranges and grapefruits); fruit, (apples and grapes); and nuts.
Investable InstrumentsInvestment Vehicles
Real Asset investments can be made through a variety of different vehicles. The Real Asset Program will make diverse use, where appropriate, of the available investment options:
a. Open-end funds
b. Closed-end funds
c. Commingled funds
d. Fund of funds
e. Separate accounts
Derivatives
Exposure to economic risk through the use of derivatives must be consistent with the Plan’s overall investment policy, as well as its individual manager specific investment guidelines. Investment managers are not authorized to use derivative securities, or strategies, that do not comply with the Plan’s basic objective of achieving the highest return on investment funds, consistent with safety, and in accordance with accepted investment practices.
Managers are specifically prohibited from using derivative or synthetic securities that expose the Plan to potentially high price volatility or are either speculative or leveraged, or whose marketability may become severely limited.
Generally, the Plan allows for the following uses of derivatives:
• EquityandBondindexfuturescontracts are permitted.
• Aninternationalmanagermaydefensivelyhedgecurrency as a part of the investment management and risk reduction process and as described in the section pertaining to the international equity and fixed income managers. Currency forward or futures contracts may be used in this process.
• NewYorkStockExchangelistedAmericanDepository Receipts (ADRs) may be used by the domestic equity managers for up to 10 % of the portfolio investments at cost. The international equity manager may use ADRs in place of the foreign securities when their research indicates the ADR issues are more attractively valued.

82 Comprehensive Annual Financial Report 2010-2011 San José Police & Fire Department Retirement Plan
Statement of Investment Policy (Continued)
• Thefixedincomeinvestmentmanagersmayhold derivative securities known as Collateral-ized Mortgage Obligations (CMOs) collateralized by GNMA, FNMA, FHLMC mortgage-backed instruments. The CMOs must possess price risk characteristics consistent with, or superior to, the risk characteristics of the underlying conventional mortgage pass-through securities. Fixed income managers may also purchase securities of other categories, including options and financial futures contracts traded over-the-counter or on organized securities exchanges. Offsetting cash positions must be maintained against all delayed settlement transactions.
• Derivativesecuritiesshouldnotbeutilizedbyportfolio managers to materially increase a port-folio’s duration or leverage as characterized by its stated investment style. Managers must be granted specific written authorization from the Plan in order to implement applications of derivative instruments not listed above.
Mini-Tender Offers
Mini-Tender offers are tender offers for less than five percent of a company’s stock. As a fiduciary, a manager will deal with mini-tender offers with the diligence and good faith expected for any investment decision. Upon approval by the Board of a written agreement with the manager that the manager will indemnify the Board against any losses to the extent such losses were the result of the manager’s negligence, a manager may participate in mini-tender offers.
Credit Unions
No retirement fund assets shall be deposited in any such institution in excess of an amount insured by an agency of the Federal Government, and shall be made only if the rate of return and degree of safety offered are competitive with other investment opportunities.
Manager Discretion
Any manager who is engaged in or has a direct pecuniary interest in a business other than investment counseling, such as a broker or dealer in securities shall not be permitted to use such business with regard to the Plan assets without prior written approval by the Board.
Subject to these guidelines and policies, the Fund’s Invest-ment Managers have full discretion to sell, substantiate, redeem or convert securities, as they deem advisable.
It is the intention of the Board to contract with an independent agency to vote domestic equity proxies according to the plan proxy voting guidelines. However, international equity proxies are to be voted by the investment managers or any agent or service selected by the investment manager.
With the consent of the Board, compliance with the foregoing guidelines may be waived, either with respect to a specific transaction or transactions, or generally. The Board will, in addition, consult with the investment manager from time to time, at the investment manager’s request, as to the continuing applicability of the guidelines and whether amendments may be appropriate.
Performance Goals
In order to insure that investment opportunities available over a specific time period are fairly evaluated, the Board of Administration will utilize comparative performance statistics to evaluate investment results. Accordingly, each investment manager is expected to achieve the following minimum performance standards over a rolling five year time period or a full market cycle.
Domestic Equity Managers
(1) Performance within the top half of the appropriate ICC Equity Style Universe.
(2) Net of fees, manager performance shall exceed the return of the appropriate benchmark by the following:
100 basis points for active large-cap equity managers,
0 basis points for passive large-cap equity managers,
150 basis points for mid-cap equity managers, and
200 basis points for small-cap equity mangers.
(3) The risk associated with the manager’s portfolio as measured by the variability of quarterly returns (standard deviation) must not exceed that of the manager’s benchmark index without a corresponding increase in performance above that index.
Domestic Fixed Income Managers
(1) Performance within the top half of ICC Bond Funds Universe.
(2) Net of fees, manager performance shall exceed by 50 basis points, the return of the Barclays Capital Aggregate Bond Index.

83 Comprehensive Annual Financial Report 2010-2011 San José Police & Fire Department Retirement Plan
Statement of Investment Policy (Continued)
(3) The risk associated with the manager’s portfolio as measured by the variability of quarterly returns (standard deviation) must not exceed that of the Barclays Capital Aggregate Bond Index without a cor-responding increase in performance above the index.
International Equity Managers
Developed Markets
(1) Performance within the top half of ICC International Developed Markets Equity Fund Universe.
(2) Net of fees, manager performance shall exceed by 150 basis points, the return of the Morgan Stanley EAFE Index for international equity managers.
(3) The risk associated with the manager’s portfolio as measured by the variability of quarterly returns (standard deviation) must not exceed that of the MSCI EAFE Index without a corresponding increase in performance above the index.
Emerging Markets
(1) Performance within the top half of ICC Emerging Markets Equity Fund Universe.
(2) Net of fees, manager performance shall exceed by 200 basis points, the return of the MSCI Emerging Market Free Index for emerging markets managers.
(3) The risk associated with the manager’s portfolio as measured by the variability of quarterly returns (standard deviation) must not exceed that of the MSCI EMF Index without a corresponding increase in performance above the index.
International Fixed Income Managers
(1) Performance above median in ICC International Bond Fund Universe.
(2) Net of fees, manager performance shall exceed by 75 basis points, the return of the Citigroup World Government Bond Index.
(3) The risk associated with the manager’s portfolio as measured by the variability of quarterly returns (standard deviation) must not exceed that of the Citigroup World Government Bond Index without a corresponding increase in performance above the index.
Real Estate Managers
(1) Performance above median in ICC Real Estate Funds Universe.
(2) Net of fees, manager performance shall exceed by 150 basis points, the return of the National Counsel of Real Estate Investment Fiduciaries (NCREIF) Classic Property Index or the NCREIF Classic Property Pacific Index for the portfolio with the majority of properties in California.
(3) The risk associated with the manager’s portfolio must not exceed that of the NCREIF or NCREIF Pacific Index without a corresponding increase in performance above the index.
Private Equity
The Private Equities portfolio is an illiquid investment with a five to ten year investment horizon. The return expectation for Private Equity managers is S&P 500 Index plus 300 basis points over time.
High Yield and Bank Loan Investments
The objective for the investment managers of the High Yield and Bank Loan component of the total portfolio are:
(1) Achieve rates of return, which exceed either the Merrill Lynch High Yield BB – B Rated Index (H0A4) or the CSFB Leveraged Loan Index by 150 basis points net of fees. If the performance history extends beyond five years, the manager will be required to exceed the index over a majority of the rolling five year periods.
(2) Achieve performance results that will rank in the top half of a broad high yield manager database.
(3) Achieve returns that will rank in the top half of investment managers which utilize a similar investment style.
Convertible Bond Investments
The objective for the investment managers of the Convertible Bond component of the total portfolio are:
(1) Achieve rates of return which exceed the Merrill Lynch Global 300 Convertible Index by 150 basis points net of fees. If the performance history extends beyond five years, the manager will be required to exceed the index over a majority of the rolling five year periods.
(2) Achieve performance results that will rank in the top half of a broad Convertible Bond manager database.

84 Comprehensive Annual Financial Report 2010-2011 San José Police & Fire Department Retirement Plan
Statement of Investment Policy (Continued)
Periodic Reviews of Manager Performance
The performance of each manager will be reviewed versus its benchmark every quarter. These benchmarks consist of both asset class indexes and peer group universes. Each manager’s performance should exceed their passive index benchmark and each manager should be above the median of an appropriate universe.
As good managers will occasionally have poor perfor-mance for several periods, there is some grace period permitted for performance to improve. Conversely, the performance will be reviewed with sufficient frequency to permit identification of substandard performance as quickly as possible.
Procedure:
1. Each manager is expected to produce performance equal to or better than their benchmark index for one year, three year, and five year cumulative periods.
Managers are considered to achieve this objective if their performance exceeds their benchmark for two of the three periods of one year or longer.
2. The expectation to produce above median perfor-mance in an appropriate peer group for one year, three year, and five year cumulative periods will be factored in only when the majority of investment managers are underperforming the benchmark.
Managers are considered to achieve this objective if they rank above the median manager for two of the three periods of one year or longer and the performance in the third period is not less than the 62nd percentile.
3. If a manager has less than five years performance, we will review the periods reported by the consultant, such as one quarter, one year and since inception. However, no action will be taken for placement on the watch list until two years after inception date.
4. If there is a failure to meet the performance objective, the following rules should be applied:
a) A manager’s (with at least two years of perfor-mance since inception) failure to meet their objective for four successive quarters will place the manager on the watch list. If a manager is consistently on the borderline, sometimes meeting objectives and sometimes failing to meet objectives, the manager may be placed on the watch list.
b) During the next four quarters, the manager’s performance will be closely monitored to see if it is warranted for the manager to be placed on probation.
c) A manager placement on probation should result in review by the Investment Committee. Upon a critical review of the manager, the Investment Committee may grant up to one year further for improvement to take place upon officially recog-nizing the substandard performance and explic-itly granting an extension of time for improve-ment. At the time of granting such extraordinary extension, the Investment Committee may del-egate to the Director of Retirement Services, the authority to direct the manager to immediately suspend all trading except as specifically directed by the Director. If there has been improvement in performance, the Investment Committee may extend the probation beyond one year.
d) During the period of any such extraordinary extension, the investment staff should monitor the portfolio and transactions of such manager to ensure that excessive risk is not being taken in an attempt to “catch up”. If in the judgment of the Director, such manager is managing the portfolio in such a manner that indicates that excessive risk is being taken, the Director should use the previ-ously delegated authority to terminate or restrict the manager’s activities.
5. In order to be taken off probation and placed on the watch list, a manager must beat their benchmark for 2 successive quarters (i.e. March and June) OR beat their benchmark at one-year following four quarters of good performance.
6. In order to be taken off the watch list, a manager must beat their benchmark for an additional 2 successive quarters (i.e. September and December) OR have an additional four quarters of good performance.

85 Comprehensive Annual Financial Report 2010-2011 San José Police & Fire Department Retirement Plan
Statement of Investment Policy (Continued)
Extraordinary Reviews of Managers
If an event occurs within a manager’s organization that is likely to impact the manager’s organization, the Direc-tor of Retirement Services, shall make a determination whether such event compromises the investment process or in any other manner might negatively impact the man-agement of the Plan’s assets.
Such events would include but are not limited to:
a) Loss of any significant investment professional directly involved with the management of Plan assets or of such significance to the manager’s overall investment process as to call into question the future efficacy of that process.
b) Sale, offer for sale, or offer to purchase the manager’s business to/by another entity.
c) Significant financial difficulty or loss of a sizable portion of the manager’s assets under management.
d) Filing or announcement of regulatory action of non-trivial nature, particularly that involv-ing violations of the Investment Advisers Act of 1940, the Securities Act of 1933, or the Securities Exchange Act of 1934, or any state Blue Sky Law to which the manager is subject.
e) Any other event which in the discretion of the Director appear to put the Plan’s assets at risk of loss, either actual or opportunity.
Any of these events may trigger a due diligence visit to the firm by the Investment Committee, being placed on the watch list, being put on probation or termination depending on the seriousness of the event and the prob-ability of impacting the management of the Plan’s assets.
Please visit http://www.sjretirement.com/PF/Investments/Investments.asp for the most current and complete State-ment of Investment Policy.

86 Comprehensive Annual Financial Report 2010-2011 San José Police & Fire Department Retirement Plan
Investment Professionals
Domestic Equity
Rhumbline AdvisersRussell 1000 IndexRussell 1000 Growth IndexSmall Cap Growth IndexBoston, MA
Robeco Investment ManagementLarge Cap ValueGreenbrae, CA
RS InvestmentsSmall Cap ValueSan Francisco, CA
Private Equity
HarbourVest PartnersBoston, MA
Pantheon Ventures, Inc. San Francisco, CA
Portfolio AdvisorsDarien, CT
Siguler Guff & Company, LLCNew York, NY
TCW/CrescentLos Angeles, CA
International Equity
Brandes Investment PartnersSan Diego, CA
William Blair & CompanyChicago, IL
Emerging Markets Equity
AllianceBernstein New York, NY
The Boston CompanyBoston, MA
Fixed Income
Income Research & ManagementLong DurationBoston, MA
MacKay ShieldsHigh Yield/Credit OpportunitiesNew York, NY
PIMCOOpportunistic Credit Newport Beach, CA
Russell Investments Transition Russell TIPSTacoma, WA
Seix Investment AdvisorsDomestic CoreHigh Yield/Credit OpportunitiesUpper Saddle River, NJ
Commodities
First QuadrantPasadena, CA
Credit SuisseSan Francisco, CA
Real Estate
American Realty AdvisorsGlendale, CA
Opportunistic
Blackstone/GSO Capital PartnersDirect LendingNew York, NY
Medley Capital LLCDirect LendingSan Francisco, CA
White Oak Global Advisors, LLCDirect LendingSan Francisco, CA
Consultant
NEPC, LLCRedwood City, CA
Custodian
State Street Bank & Trust CompanyBoston, MA
Proxy Voting
Glass Lewis & Company LLCSan Francisco, CA

87 Comprehensive Annual Financial Report 2010-2011 San José Police & Fire Department Retirement Plan
One Year Three Years Five Years Ten Years
Total Fund (gross of fees) 18.4% 3.5% 4.6% 6.5%Total fund (net of manager fees) 18.1% 3.2% 4.3% 6.2%Total Fund 17.9% 3.0% 4.0% 5.9%Total Fund Benchmark 20.5% 2.9% 4.6% 6.2%
ICC Public Funds Median 21.7% 3.6% 4.8% 5.7%
Total U.S. Equity 34.1% 4.2% 3.0% 4.0%Russell 3000 Index 32.4% 4.0% 3.4% 3.4%
ICC U.S. Equity Funds Median 34.4% 5.8% 4.9% 5.9%
Total International Equity 26.0% 0.6% 4.6% 9.7%
MSCI ACWI ex-U.S. (Net) Index 29.7% -0.3% 3.7% 7.5%
ICC International Equity Funds Median 29.9% 1.1% 4.1% 8.4%
Total Fixed Income 7.5% 9.2% N/A N/ABarclays Aggregate Index 3.9% 6.5% 6.5% 5.7%
ICC U.S. Fixed Income Median 5.9% 7.8% 7.3% 6.4%
Total Real Estate 12.4% -0.4% 4.5% 5.9%NCREIF Property Index 16.7% -2.6% 3.4% 7.6%
Total Private Equity 18.9% 4.9% N/A N/ACambridge Associates Private Equity Index (lagged one quarter) 21.1% 3.9% 10.1% 11.2%
Total Inflation-Linked Assets 25.8% N/A N/A N/ADow Jones/UBS Commodities Index 25.9% -11.9% 0.0% 6.6%
Three Months Calendar YTD One Year Three Years
Total Opportunistic Assets 2.4% 4.0% N/A N/A3-month LIBOR + 5% 1.3% 2.6% 5.3% 5.9%
Basis of Calculation: Time-Weighted Rate of Return Source: NEPC LLC’s Investment Performance Analysis Report dated June 30, 2011
(net of investment, administrative, SRBR, and securities lending expenses)
Gross Performance Summary by Asset ClassFor Periods Ending June 30, 2011

88 Comprehensive Annual Financial Report 2010-2011 San José Police & Fire Department Retirement Plan
Investment Review
$ in millionsDomestic Equity 29.1% $ 781.90 Private Equity 4.7 127.16 International Equity 11.9 320.29 Emerging Market Equity 6.4 170.70 Domestic Core Fixed Income 6.2 167.67TIPS 11.8 316.18Long Duration Fixed Income 5.1 135.43High Yield/Credit Opportunities 6.0 161.18Real Estate* 4.7 127.03Real Assets 11.4 306.24Opportunistic 1.2 32.99Short Term 1.5 40.89TOTAL 100% $ 2,687.66
Domestic Equity 23%Private Equity 5International Equity 12Emerging Market Equity 5Core Fixed Income 5Tips 10Long Bonds 5High Yield/Credit Opportunities 5Real Estate 10Opportunistic Strategies 5Absolute Return 5Real Assets 10TOTAL 100.0%
*Includes leverage
TARGET ASSET ALLOCATION As of June 30, 2011
ACTUAL ASSET ALLOCATION (Dollars in Millions) As of June 30, 2011
Non-GAAP Basis

89 Comprehensive Annual Financial Report 2010-2011 San José Police & Fire Department Retirement Plan
Investment Review (Continued)
HISTORICAL ALLOCATION (Actual) June 30, 2002- June 30, 2011
MARKET VALUE GROWTH OF PLAN ASSETS For Ten Years Ended June 30, 2011 (Dollars in Millions)
HISTORY OF GROSS PERFORMANCE FOR FISCAL YEARS 2002 - 2011 (Based on Market Value)
HISTORY OF NET PERFORMANCE FOR FISCAL YEARS 2002 - 2011 (Based on Market Net* Value)
-20
-15
-10
-5
0
5
10
15
20
02 03 04 05 06 08 09 10 1107
5.4%
16.4%
10.9%11.5%
14.3%
-5.1%
-18.0%
19.3%
-1.3%
-20
-15
-10
-5
0
5
10
15
20
02 03 04 05 06 08 09 10 1107
4.8%
15.8%
10.3% 10.9%
13.7%
-5.7%
-18.6%
18.7%
-1.9%
18.4% 17.9%
0
$500
$1000
$1500
$2000
$2500
$3000
02 03 04 05 06 07 08 09 10 11
Opportunistic 1.2%Real Assets 10.2%Short Term 0.3%Real Estate 10.3%High Yield/Credit Opportunities 7.1%Long Duration Fixed Income 7.6%TIPS 14.5%Domestic Core Fixed Income 29.5%Emerging Market Equity 5.7%International Equity 14.0%Private Equity 0.5%Domestic Equity 32.7%
0
20
40
60
80
100
11100908070605040302
*Performance is net of Investment, Administrative, Securities Lending, and SRBR expenses.

90 Comprehensive Annual Financial Report 2010-2011 San José Police & Fire Department Retirement Plan
List of Largest Assets Held
Description Country Shares Market Value (SUS)
EXXON MOBIL CORP United States 191,616 $ 15,593,710
CITIBANK United States 14,100,012 $ 13,500,000
APPLE INC United States 38,550 $ 12,940,079
MICROSOFT CORP United States 409,540 $ 10,648,040
INTL BUSINESS MACHINES CORP United States 51,827 $ 8,890,922
JP MORGAN CHASE & CO United States 205,875 $ 8,428,523
CHEVRON CORP United States 75,519 $ 7,766,374
ORACLE CORP United States 232,000 $ 7,635,120
JOHNSON & JOHNSON United States 112,705 $ 7,497,137
PFIZER INC United States 361,140 $ 7,439,484
Security Name CountryMaturity
DateInterest
RatePar Value
Market Value (SUS)
TSY INFL IX N/B United States 7/15/19 1.88% 122,297,664 $ 136,772,815
TSY INFL IX N/B United States 4/15/14 1.25% 61,773,168 $ 65,532,683
TSY INFL IX N/B United States 7/15/14 2.00% 59,859,722 $ 65,280,019
TSY INFL IX N/B United States 1/15/25 2.38% 42,145,157 $ 48,440,800
US TREASURY N/B United States 5/15/21 3.13% 9,018,000 $ 8,992,659
US TREASURY N/B United States 8/31/11 1.00% 7,844,000 $ 7,856,236
US TREASURY N/B United States 5/15/39 4.25% 6,727,000 $ 6,598,783
FNMA POOL United States 6/1/36 - 4,828,451 $ 5,321,435
US TREASURY N/B United States 2/15/41 4.75% 4,560,000 $ 4,847,143
US TREASURY N/B United States 2/15/40 4.63% 4,232,000 $ 4,412,537
LARGEST STOCK HOLDINGS (By Market Value) As of June 30, 2011
LARGEST BOND HOLDINGS (By Market Value) As of June 30, 2011
A complete list of portfolio holdings is available upon request.
A complete list of portfolio holdings is available upon request.
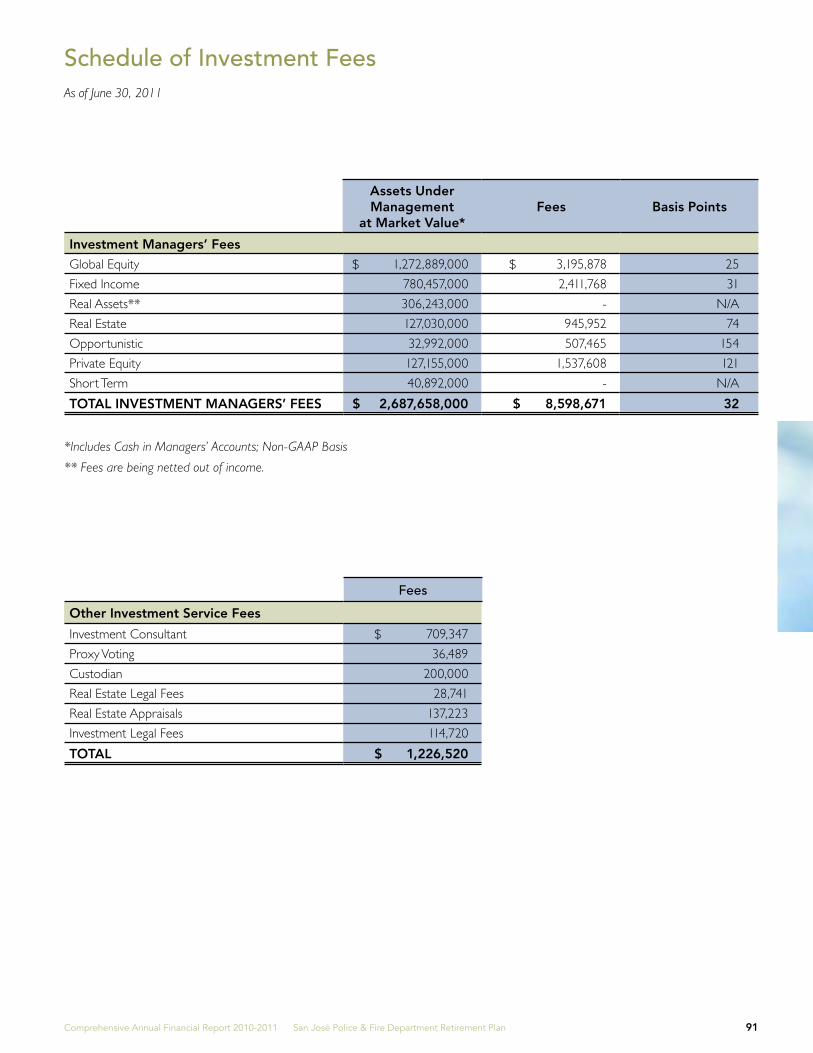
91 Comprehensive Annual Financial Report 2010-2011 San José Police & Fire Department Retirement Plan
Schedule of Investment FeesAs of June 30, 2011
Investment Managers’ Fees Global Equity $ 1,272,889,000 $ 3,195,878 25
Fixed Income 780,457,000 2,411,768 31
Real Assets** 306,243,000 - N/A
Real Estate 127,030,000 945,952 74
Opportunistic 32,992,000 507,465 154
Private Equity 127,155,000 1,537,608 121
Short Term 40,892,000 - N/A
TOTAL INVESTMENT MANAGERS’ FEES $ 2,687,658,000 $ 8,598,671 32
Other Investment Service Fees
Investment Consultant $ 709,347
Proxy Voting 36,489
Custodian 200,000
Real Estate Legal Fees 28,741
Real Estate Appraisals 137,223
Investment Legal Fees 114,720
TOTAL $ 1,226,520
Assets Under Management
at Market Value*Fees Basis Points
Fees
*Includes Cash in Managers’ Accounts; Non-GAAP Basis
** Fees are being netted out of income.

92 Comprehensive Annual Financial Report 2010-2011 San José Police & Fire Department Retirement Plan
Schedule of Commissions
Brokerage FirmNumber of
Shares TradedTotal
CommissionsCommission
Per Share
AABG SECURITIES LIMITED 1,042,361.00 $ 756.95 $ 0.0007
ABM AMRO HOARE GOVETT ASIA LTD, SEOUL 1,543.00 417.01 0.2703
ABN AMRO ASIA LIMITED 12,000.00 730.34 0.0609
ABN AMRO BANK N. V. HONG KONG 49,000.00 689.95 0.0141
AMERICAN TECHNOLOGY RESEARCH INC. 574.00 22.96 0.0400
AQUA SECURITIES LP 3,017.00 60.34 0.0200
AVONDALE PARTNERS LLC 1,831.00 73.24 0.0400
BBAIRD ROBERT W. & COMPANY INCORPORATED 3,403,678.20 2,268.37 0.0007
BANCO ITAU SA 219,744.00 4,357.73 0.0198
BANCO PACTUAL S.A. 38,000.00 597.85 0.0157
BANCO SANTANDER CENTRAL HISPANO 199,427.00 4,484.66 0.0225
BANCO SANTANDER DE NEGOCIOS 15,100.00 576.08 0.0382
BANK J.VONTOBEL UND CO. AG 6,632.00 723.22 0.1091
BANK OF NEW YORK BRUSSELS 44,586.00 855.17 0.0192
BARCLAYS CAPITAL 3,797,979.50 5,747.06 0.0015
BARCLAYS CAPITAL LE 1,942,013.00 10,152.86 0.0052
BMO CAPITAL MARKETS 20,579.00 823.16 0.0400
BNP PARIBAS BROKERAGE SERVICES 863.00 56.56 0.0655
BNP PARIBAS PEREGRINE SECURITIES 595,220.00 2,385.18 0.0040
BNP PARIBAS SECURITIES SERVICES 33,400.00 916.96 0.0275
BNY CONVERGEX 5,185.00 164.74 0.0318
BRADESCO S.A CTVM 41,200.00 920.82 0.0224
BROADCORTCAPITAL (THRU ML) 138,180.00 5,527.20 0.0400
BTIG, LLC 306,953.00 4,735.06 0.0154
CCANACCORDADAMS LIMITED 25,260.00 274.70 0.0109
CANACCORDGENUITY CORP. 11,011.00 443.42 0.0403
CANACCORDGENUITY INC. 1,792.00 71.68 0.0400
CANTOR FITZ EUR 2 8,502.00 163.29 0.0192
CANTOR FITZGERALD & CO. 65,913.00 1,516.84 0.0230
CANTOR FITZGERALD & CO. 91,000.00 40.00 0.0004
CARNEGIE BK 3,617.00 483.14 0.1336
CARNEGIE SECURITIES FINLAND 12,164.00 918.18 0.0755
CIBC MELLON 7,650.00 239.18 0.0313
CIBC WORLD MARKETS CORP 600.00 24.00 0.0400
CIBC WORLD MARKETS INC - MONEY MARKETS 2,000.00 77.67 0.0388
CIBC WORLD MKTS INC. 34,772.00 1,284.51 0.0369
CICC US SECURITIES, INC. 90,000.00 57.40 0.0006
CITATION GROUP 412,452.00 12,714.55 0.0308
CITIBANK N.A. 80,000.00 375.24 0.0047

93 Comprehensive Annual Financial Report 2010-2011 San José Police & Fire Department Retirement Plan
Schedule of Commissions (Continued)
Brokerage FirmNumber of
Shares TradedTotal
CommissionsCommission
Per Share
C (continued)
CITIGROUPGLBL MARKTET KOERA SECS LTD 13,034.00 878.16 0.0674
CITIGROUPGLOBAL MARKETS INC. 2,276,070.00 10,771.64 0.0047
CITIGROUPGLOBAL MARKETS INC. 3,156,331.00 5,857.58 0.0019
CITIGROUPGLOBAL MARKETS INDIA 32,894.00 776.47 0.0236
CITIGROUPGLOBAL MARKETS LIMITED 265,683.00 7,428.47 0.0280
CITIGROUPGLOBAL MARKETS UK EQUITY LTD. 98,661.00 1,274.39 0.0129
CLSA SECURITIES KOREA LTD. 4,321.00 2,303.41 0.5331
CLSA SINGAPORE PTE LTD. 225,836.00 4,378.60 0.0194
COLLINS STEWART LLC 12,137.00 485.48 0.0400
CORMARK SECURITIES INC. 1,219.00 49.82 0.0409
COWEN ANDCOMPANY, LLC 32,801.00 1,312.04 0.0400
CRAIG - HALLUM 1,646.00 65.84 0.0400
CREDIT AGRICLE INDOSUEZ 5,281.00 353.84 0.0670
CREDIT AGRICOLE INDOSUEZ CHEUVREUX 15,790.00 2,103.34 0.1332
CREDIT LYONNAIS SECURITIES (USA) INC. 2,288,097.00 9,794.70 0.0043
CREDIT SUISSE FIRST BOSTON (EUROPE) 19,218.00 1,391.36 0.0724
CREDIT SUISSE FIRST BOSTON SA CTVM 206,376.00 5,269.43 0.0255
CREDIT SUISSE SECS INDIA PRIVATE LTD. 25,397.00 2,525.05 0.0994
CREDIT SUISSE SECURITIES (EUROPE) LTD. 2,023,963.00 5,762.89 0.0028
CREDIT SUISSE SECURITIES (USA) LLC 150,735,743.61 43,039.93 0.0003
CUTTONE &CO INC. 46,385.00 927.70 0.0200
DD CARNEGIE AG 84,450.00 1,055.33 0.0125
DAIWA SECURITIES (HK) LTD. 1,155,464.00 2,157.57 0.0019
DAIWA SECURITIES AMERICA INC. 7,492,218.66 3,240.30 0.0004
DAIWA SECURITIES COMPANY LTD. 1,069.00 569.46 0.5327
DAVIDSON D.A. & COMPANY INC. 1,808.00 72.32 0.0400
DAVY STOCKBROKERS 1,565.00 94.38 0.0603
DBS VICKERS SECURITIES (SINGAPORE) 451,000.00 1,736.15 0.0038
DEUTSCHE BANK SECURITIES INC 111,900,855.00 23,428.82 0.0002
DEUTSCHE EQ IN PRVT LIM DB 27,779.00 1,633.98 0.0588
DEUTSCHE SECURITIES ASIA LIMITED 44,400.00 407.84 0.0092
DOWLING &PARTNERS 82,807.00 2,338.68 0.0282
DSP MERRILL LYNCH LTD. 42,300.00 1,951.87 0.0461
EEDELWEISSSECURITIES PVT. LTD. 49,935.00 1,141.53 0.0229
ELECTRONIC SPECIALIST, LLC 1,189,008.00 36,484.62 0.0307
ENAM SECURITIES PVT LTD. 57,499.00 1,099.09 0.0191
EVOLUTIONBEESON GREGORY LIMITED 47,053.00 732.07 0.0156
EXANE S.A. 82,552.00 5,574.65 0.0675
EXECUTION LIMITED 28,091.00 233.67 0.0083

94 Comprehensive Annual Financial Report 2010-2011 San José Police & Fire Department Retirement Plan
Schedule of Commissions (Continued)
Brokerage FirmNumber of
Shares TradedTotal
CommissionsCommission
Per Share
FFRIEDMAN BILLINGS & RAMSEY 51,946.00 1,708.29 0.0329
GGMP SECURITIES LTD. 18,700.00 754.17 0.0403
GOLDMAN SACHS (ASIA) LLC 2,835.00 899.25 0.3172
GOLDMAN SACHS (INDIA) 23,117.00 1,296.99 0.0561
GOLDMAN SACHS & CO 877,170,505.19 13,168.94 0.0000
GOLDMAN SACHS DO BRASIL CORRETORA 158,982.00 3,886.91 0.0244
GOLDMAN SACHS INTERNATIONAL 638,470.00 14,821.82 0.0232
GOODBODY STOCKBROKERS 53,900.00 784.48 0.0146
HHONGKONG AND SHANGHAI BANKING CORP 523,500.00 1,804.49 0.0034
HSBC BANKPLC 37,735.00 1,281.92 0.0340
HSBC SECURITIES (USA) INC. 69,900.00 277.76 0.0040
IING FINANCIAL MARKETS LLC 44,949.00 1,255.36 0.0279
INSTINET 1,457,603.00 5,151.93 0.0035
INSTINET AUSTRALIA CLEARING SRVC PTY LTD. 20,937.00 569.72 0.0272
INSTINET CANADA 6,500.00 254.34 0.0391
INSTINET PACIFIC LIMITED 1,894,900.00 4,717.59 0.0025
INSTINET SINGAPORE SERVICES PT 294,000.00 1,844.60 0.0063
INSTINET U.K. LTD. 3,494,750.00 54,943.30 0.0157
INVESTEC SECURITIES 90,832.00 1,357.12 0.0149
INVESTMENT TECHNOLOGY GROUP INC. 3,555,790.00 59,420.76 0.0167
INVESTMENT TECHNOLOGY GROUP LTD. 37,125.00 171.86 0.0046
ISI GROUPINC 122,271.00 3,639.69 0.0298
ISLAND TRADER SECURITIES INC. 9,877.00 395.08 0.0400
ITG CANADA 1,730.00 50.70 0.0293
JJ P MORGAN INDIA PRIVATE LTD. 21,892.000 1,517.42 0.0693
J P MORGAN SECURITIES INC. 756,313.00 3,745.68 0.0050
J.P. MORGAN CLEARING CORP 49,566.00 487.56 0.0098
J.P. MORGAN CLEARING CORP. 46,380,583.35 16,201.31 0.0003
J.P. MORGAN SECURITIES INC. 3,622,407.00 9,879.94 0.0027
J.P.MORGAN SECURITIES(FAR EAST)LTD SEOUL 3,501.00 3,744.11 1.0694
JANNEY MONTGOMERY, SCOTT INC. 17,002.00 680.08 0.0400
JEFFERIES & COMPANY INC. 132,343,370.00 58,807.87 0.0004
JEFFERIESINTERNATIONAL LTD. 159,383.00 1,624.15 0.0102
JM MORGANSTANLEY SECS PVT LTD. 57,761.00 2,636.53 0.0456
JMP SECURITIES 65,254.00 2,610.16 0.0400
JOH BERENBERG GOSSLER & CO 4,105.00 265.94 0.0648
JONESTRADING INSTITUTIONAL SERVICES LLC 8,010.00 224.50 0.0280

95 Comprehensive Annual Financial Report 2010-2011 San José Police & Fire Department Retirement Plan
Schedule of Commissions (Continued)
Brokerage FirmNumber of
Shares TradedTotal
CommissionsCommission
Per Share
J (continued)
JP MORGANSECURITIES AUSTRALIA LTD. 1,303.00 46.93 0.0360
JP MORGANSECURITIES LIMITED 1,106,443.60 11,444.05 0.0103
JPMORGAN SECURITIES(ASIA PACIFIC)LTD. 2,652,500.00 11,557.97 0.0044
KKBC PEEL HUNT LTD. 51,214.00 662.78 0.0129
KEEFE BRUYETTE & WOODS INC. 70,770.00 2,554.45 0.0361
KEEFE BRUYETTE AND WOOD LIMITED 24,431.00 651.75 0.0267
KEPLER EQUITIES PARIS 14,916.00 1,214.50 0.0814
KEYBANC CAPITAL MARKETS INC. 1,058,870.00 554.80 0.0005
KING, CL,& ASSOCIATES, INC. 1,548.00 61.92 0.0400
KINGSTON SECURITIES LTD 179,924.00 805.01 0.0045
KNIGHT DIRECT LLC 198,045.00 4,722.47 0.0238
KNIGHT EQUITY MARKETS L.P. 78,242.00 2,926.78 0.0374
KNIGHT SECURITIES 2,540.00 101.60 0.0400
KNIGHT SECURITIES L.P. 546,619.00 2,953.64 0.0054
KOTAK SECURITIES LTD. 37,825.00 1,300.89 0.0344
LLARRAIN VIAL 1,039,805.00 612.81 0.0006
LAZARD CAPITAL MARKETS LLC 7,771.00 200.52 0.0258
LEERINK SWANN AND COMPANY 1,257.00 50.28 0.0400
LIQUIDNETASIA LIMITED 639,449.00 1,048.45 0.0016
LIQUIDNETINC 2,125,763.00 16,411.34 0.0077
LOOP CAPITAL MKTS LLC 2,060.00 41.20 0.0200
MMACQUARIEBANK LIMITED 29,900.00 1,121.41 0.0375
MACQUARIECAPITAL (EUROPE) LTD. 307,677.00 2,363.95 0.0077
MACQUARIEEQUITIES LIMITED (SYDNEY) 75,442.00 866.42 0.0115
MACQUARIESECURITIES (INDIA) PVT LTD. 98,620.00 4,019.94 0.0408
MACQUARIESECURITIES (USA) INC. 21,567.00 862.68 0.0400
MACQUARIESECURITIES LIMITED 1,915,406.00 9,755.61 0.0051
MERRILL LYNCH INTERNATIONAL 1,579,241.00 18,293.08 0.0116
MERRILL LYNCH PEIRCE FENNER & S 2,707,961.00 12,264.53 0.0045
MERRILL LYNCH PIERCE FENNER & SMITH INC 807,065,015.45 1,251.40 0.0000
MERRILL LYNCH PROFESSIONAL CLEARING CORP 1,747,355.00 2,274.45 0.0013
MIZUHO SECURITIES USA INC. 13,625.00 1,066.69 0.0783
MORGAN KEEGAN & CO INC. 9,771.00 390.84 0.0400
MORGAN STANLEY AND CO INTERNATIONAL 9,790.00 591.86 0.0605
MORGAN STANLEY AND CO INTL TAIPEI METRO 325,000.00 1,136.26 0.0035
MORGAN STANLEY CO INCORPORATED 73,212,462.04 24,777.94 0.0003
MOTILAL OSWAL SECURITIES LIMITED 4,993.00 115.43 0.0231

96 Comprehensive Annual Financial Report 2010-2011 San José Police & Fire Department Retirement Plan
Schedule of Commissions (Continued)
Brokerage FirmNumber of
Shares TradedTotal
CommissionsCommission
Per Share
NNATIONAL FINANCIAL SERVICES LLC 94,300.00 420.29 0.0045
NBC CLEARING SERVICES INCORPORATED 35,469.00 1,445.75 0.0408
NBCN CLEARING INC. 8,900.00 356.00 0.0400
NEEDHAM &COMPANY 2,108.00 84.32 0.0400
NESBITT BURNS 54,205.00 2,174.30 0.0401
NOMURA FINANCIAL ADVISORY & SEC INDIA 18,839.00 519.37 0.0276
NOMURA INTERNATIONAL PLC 145,143,843.90 31.83 0.0000
NOMURA SECURITIES INTERNATIONAL INC. 3,700,951.00 15,704.23 0.0042
NORTHLANDSECURITIES INC. 179,828.00 3,596.56 0.0200
NUMIS SECURITIES INC. 521,330.00 4,647.51 0.0089
OODDO FINANCE 8,366.00 1,124.56 0.1344
OPPENHEIMER & CO. INC. 839,486.00 3,379.44 0.0040
PPANMURE GORDON AND CO LTD. 9,830.00 75.30 0.0077
PENSON FINANCIAL SERVICES CANADA INC. 31,458.00 1,283.28 0.0408
PENSON FINANCIAL SERVICES INC. 84,043.00 1,748.23 0.0208
PERSHING LLC 40,140,026.00 12,804.80 0.0003
PERSHING SECURITIES LIMITED 19,278.00 1,204.54 0.0625
PICKERINGENERGY PARTNERS, INC. 17,802.00 712.08 0.0400
PIPELINE TRADING SYSTEMS LLC 222,160.00 4,809.65 0.0216
PIPER JAFFRAY 7,680,382.00 77,176.60 0.0100
PULSE TRADING LLC 87,509.00 1,566.25 0.0179
RRAYMOND JAMES AND ASSOCIATES INC. 7,921.00 316.84 0.0400
RBC CAPITAL MARKETS 11,496,409.16 1,553.96 0.0001
RBC DOMINION SECURITIES INC. 91,863.00 3,755.40 0.0409
RBS SECURITIES INC. 362,916.00 5,110.41 0.0141
REDBURN PARTNERS LLP 178,652.00 6,324.89 0.0354
RIDGE CLEARING & OUTSOURCING SOLUTIONS 16,344.00 653.76 0.0400
ROYAL BANK OF CANADA 29,580.00 1,219.51 0.0412
SS.S KANTILAL ISHWARLAL SECURITIES 1,636.00 122.05 0.0746
SALOMON SMITH BARNEY INC. 79,000.00 1,852.70 0.0235
SAMSUNG SECURITIES CO LTD. 350.00 19.33 0.0552
SANFORD C. BERNSTEIN LTD. 142,254.00 932.50 0.0066
SANFORD CBERNSTEIN CO LLC 204,208.00 6,315.82 0.0309
SANTANDERINVESTMENT SECURITIES INC. 16,742.00 669.68 0.0400
SCOTIA CAPITAL (USA) INC. 11,985.00 479.40 0.0400
SCOTIA CAPITAL INC. 900.00 35.60 0.0396

97 Comprehensive Annual Financial Report 2010-2011 San José Police & Fire Department Retirement Plan
Schedule of Commissions (Continued)
Brokerage FirmNumber of
Shares TradedTotal
CommissionsCommission
Per Share
S (continued)
SCOTIA CAPITAL MKTS 59,743.00 1,753.55 0.0294
SCOTT & STRINGFELLOW, INC. 1,083,762.11 157.84 0.0001
SIDOTI & COMPANY LLC 19,715.00 788.60 0.0400
SIGNAL HILL CAPITAL GROUP LLC 1,020.00 40.80 0.0400
SIMMONS &COMPANY INTERNATIONAL 10,800.00 432.00 0.0400
SIX SIS AG 3,258.00 582.35 0.1787
SJ LEVINSON & SONS LLC 46,100.00 1,844.00 0.0400
SKANDINAVISKA ENSKILDA BANKEN LONDON 25,304.00 699.93 0.0277
SOCIETE GENERALE LONDON BRANCH 19,160.00 283.44 0.0148
SOCIETE GENERALE PARIS ZURICH BRA 71,448.00 3,644.05 0.0510
STANDARD CHARTERED BANK 39,000.00 90.54 0.0023
STANDARD CHARTERED BANK (HONG KONG) LIMI 527,406.00 1,061.26 0.0020
STATE STREET GLOBAL MARKETS, LLC 4,426.00 121.87 0.0275
STEPHENS, INC. 5,569,270.82 2,767.84 0.0005
STERNE AGEE & LEACH INC. 10,389.00 415.56 0.0400
STIFEL NICOLAUS & CO INC. 452,909.00 5,594.06 0.0124
SUNTRUST CAPITAL MARKETS, INC. 2,015.00 80.60 0.0400
SVENSKA HANDELSBANKEN 21,881.00 1,495.23 0.0683
TTD WATERHOUSE CDA 88,289.00 3,626.88 0.0411
THE BENCHMARK COMPANY, LLC 14,460.00 362.07 0.0250
THINKEQUITY PARTNERS LLC 3,170.00 126.80 0.0400
UUBS AG 1,066,758.00 16,395.87 0.0154
UBS SECURITIES ASIA LTD. 4,621,259.00 8,479.98 0.0018
UBS SECURITIES CANADA INC 1,700.00 35.58 0.0209
UBS SECURITIES LLC 792,343,876.93 1,209.28 0.0000
UBS SECURITIES PTE.LTD., SEOUL 12,786.00 709.00 0.0555
UBS WARBURG LLC 23,600.00 300.14 0.0127
WW.J. BONFANTI INC 1,246.00 24.92 0.0200
WEDBUSH MORGAN SECURITIES INC 16,040.00 641.60 0.0400
WEEDEN & CO. 191,478.00 5,280.04 0.0276
WELLS FARGO SECURITIES, LLC 4,920,513.00 1,355.60 0.0003
WILLIAM BLAIR & COMPANY LLC 445,419.00 3,816.76 0.0086
WJB CAPITAL GROUP, INC. 1,900.00 38.00 0.0200
WOORI INVESTMENT SECURITIES 2,120.00 755.03 0.3561
TOTAL 3,292,490,755 $ 904,627 $ 0.00027

98 Comprehensive Annual Financial Report 2010-2011 San José Police & Fire Department Retirement Plan
Investment SummaryAs of June 30, 2011 (Dollars in Thousands)
Type of Investment Fair Value % of Total Fair Value
Equities Domestic Large Cap $ 523,772 19.48%
Domestic Small Cap 180,689 6.72%
Emerging Markets 170,697 6.35%
International 320,292 11.92%
Global Convertibles 77,439 2.88%
Total Equities $ 1,272,889 47.35%
Fixed Income Core Fixed Income $ 167,667 6.24%
High Yield/Credit Opportunities 161,181 6.00%
Long Duration Bonds 135,429 5.04%
TIPS 316,180 11.76%
Total Fixed Income $ 780,457 29.04%
AlternativesOpportunistic $ 32,992 1.23%
Private Equity 127,155 4.73%
Real Assets 306,243 11.39%
Real Estate 127,030 4.73%
Total Alternatives $ 593,420 22.08%
Other InvestmentsShort Term $ 40,479 1.51%
International Currency Contracts 413 0.02%
Total Other Investments $ 40,892 1.53%
Total Fair Value $ 2,687,658 100.00%
Note: The amounts presented above may vary from the amounts presented in the financial statements due to the investment summary presenting amounts at the manager level and the financial statements classifying amounts by investment type.

99 Comprehensive Annual Financial Report 2010-2011 San José Police & Fire Department Retirement Plan
Investment Properties
CAMELBACK POINTE APARTMENTS258-unit luxury apartment community in Colorado Springs, CO. Acquired as sole owner in December 1997.
CITIBANK OFFICE PLAZA100,303 square-foot five-story office building located in Oak Brook, IL. Acquired as sole owner in December 1998.
THE DEERWOOD APARTMENTS186-unit mid-rise apartment community located in Houston, TX. Acquired as sole owner in January 1996.
CRESCENT VII 135,044 square-foot six-story office building located in the Denver Tech Center in Greenwood Village, CO. Acquired as sole owner in June 1998.

100 Comprehensive Annual Financial Report 2010-2011 San José Police & Fire Department Retirement Plan
Investment Properties (Continued)
EAGLE USA WAREHOUSE128,000 square-foot single-story distribution warehouse facility located in Eagan, MN. Invested as sole shareholder in January 2002. FIRST AMERICAN OFFICE PLAZA
82,596 square-foot six-story office building located in San José, CA. Invested as sole shareholder in December 1999.
CALAIS OFFICE CENTER I & IITwo office buildings totaling 198,995 square feet located in Anchorage, AK. Acquired in a joint venture with a local developer, JL Properties, in March 2006.
PROGRESS POINT123,055 square-foot three-story office building located in O’Fallon, MO. Invested in a joint venture with Kennedy Capital Investors, LLC, in December 2007.


City of San José
Comprehensive Annual Financial Report
for the Fiscal Year Ended June 30, 2011
ActuarialSection

104 Comprehensive Annual Financial Report 2010-2011 San José Police & Fire Department Retirement Plan
Actuary’s Certification Letter
THE SEGAL COMPANY100 Montgomery Street, Suite 500 San Francisco, CA 94104-4308
415.263.8200 phone415.263.8290 fax www.segalco.com
May 27, 2011
Board of RetirementCity of San JosePolice and Fire Department Retirement Plan1737 N First Street, Suite 580San Jose, CA 95112-4505
Re: City of San Jose Police and Fire Department Retirement Plan CAFR Certification for Pension Plan
Dear Members of the Board:
The Segal Company (Segal) prepared the June 30, 2010 actuarial valuation of the City of San Jose Police and Fire Department Retirement Plan. We certify that the valuation was performed in accordance with generally accepted actuarial principles and practices. In particular, it is our understanding that the assumptions and methods used for funding purposes meet the parameters of the Governmental Accounting Standards Board Statement No. 25.
As part of the June 30, 2010 actuarial valuation, Segal conducted an examination of all participant data for reasonableness. Summaries of the employee data used in performing the current and the prior actuarial valuations are provided in our valuation report. We did not audit the Plan’s financial statements. For actuarial valuation purposes, Plan assets are valued at Actuarial Value. Under this method, the assets used to determine employer contribution rates take into account market value by recognizing the differences between the total return at market value and the expected investment return over five-year periods.
One of the funding objectives of the Plan is to establish contribution rates that, over time, will remain level as a percentage of payroll unless Plan benefit provisions are changed. Actuarial funding is based on the Entry Age Normal Cost Method. Under this method, the employer contribution rate provides for current cost (normal cost) plus a level percentage of payroll to amortize any unfunded actuarial accrued liability (UAAL). Employees also contribute a portion of both the Plan’s normal cost and UAAL contribution; however, employees’ UAAL contribution rate is only with respect to the payment of certain retroactive member contributions from a benefit improvement in 1996 for all Police and Fire members and a benefit improvement in 2006 for Police members.
The UAAL is amortized as a level percentage of payroll over various periods which is equivalent to a single period of approximately 15 years.
For the Financial Section of the Comprehensive Annual Financial Report, Segal provided the trend data shown in the Required Supplementary Information. The schedules presented in the Actuarial Section have also been prepared and/or reviewed by our firm.

105 Comprehensive Annual Financial Report 2010-2011 San José Police & Fire Department Retirement Plan
Actuary’s Certification Letter (Continued)
The valuation assumptions included in the Actuarial Section were adopted by the Retirement Board based on the June 30, 2009 biennial Experience Analysis and the June 30, 2010 Review of Economic Actuarial Assumptions. Note that the investment return assumption was developed without taking into consideration the impact of a 10% allocation of excess earnings to the Supplemental Retiree Benefit Reserve (SRBR). Actuarial valuations are performed on an annual basis.
The ratio of the valuation assets to actuarial accrued liabilities decreased from 86.7% determined in the last valuation as of June 30, 2009 to 79.8% determined in the current valuation as of June 30, 2010. The employer’s rate has increased from 39.48% of payroll determined in the June 30, 2009 valuation to 50.44% of payroll determined in the June 30, 2010 valuation, while the employee’s rate has also increased from 9.91% of payroll to 10.57% between the two valuations. The 39.48% and 50.44% of payroll employer rates are calculated without reflecting one-time offsets of 0.45% and 0.49% of payroll due to charges on the SRBR for the 2010/2011 and 2011/2012 plan years, respectively.
Under the Actuarial Value of assets method, the total unrecognized investment losses are $353.8 million as of June 30, 2010. These investment losses will be recognized in the determination of the actuarial value of assets for funding purposes in the next few years, and will offset any investment gains that may occur after June 30, 2010. This implies that if the Plan earns the assumed net rate of investment return of 7.75% per year on a market value basis, it will result in investment losses on the actuarial value of assets in the next few years. So, if the actual market return is equal to the assumed 7.75% rate and all other actuarial assumptions are met, the contribution requirements would increase in each of the next few years.
The deferred losses of $353.8 million represent 15.3% of the market value of assets as of June 30, 2010. Unless offset by future investment gains or other favorable experience, the recognition of the $353.8 million market losses is expected to have a significant impact on the Plan’s future funded percentage and contribution rate requirements. This potential impact may be illustrated as follows:
➤ If the pension plan component of the deferred losses were recognized immediately in the valuation value of assets, the funded percentage would decrease from 79.8% to 69.1%.
➤ If the pension plan component of the deferred losses were recognized immediately in the
valuation value of assets, the aggregate employer rate would increase from 50.44% to 61.80% of payroll. Again, these employer rates are before applying the charge to the SRBR to reduce the contribution rate by 0.49% of pay for 2011/2012 only.
The undersigned are Members of the American Academy of Actuaries and we have satisfied the qualification requirements to render the opinion contained herein.
Sincerely,
Paul Angelo, FSA, MAAA, FCA, EA Andy Yeung, ASA, MAAA, FCA, EASenior Vice President & Actuary Vice President & Associate Actuary

106 Comprehensive Annual Financial Report 2010-2011 San José Police & Fire Department Retirement Plan
Schedule of Actuarial Methods and Assumptions
Defined Benefit Pension Plan
The following assumptions have been adopted by the Retirement Board as of June 30, 2010:
Assumptions
Valuation Interest Rate 7.75%
Inflation Rate 3.50%
Real Across-the-Board Salary Increase 0.75%
Post-Retirement Mortality
(a) Service Males RP-2000 Male Combined Healthy Mortality Table
with no collar adjustment, projected 10 years, set back 4 years
Females RP-2000 Female Combined Healthy Mortality Table with no collar adjustment, projected 10 years
(b) Disability RP-2000 Male Combined Healthy Mortality Table with no collar adjustment, projected 10 years, set back 1 year
Pre-Retirement Mortality Based upon the 6/30/2009 Experience Analysis
Withdrawal Rates Based upon the 6/30/2009 Experience Analysis
Disability Rates 1985 Pension Disability Table for Class 2 employees published by the Society of Actuaries with rates adjusted for ages 49 and above
Service Retirements Based upon the 6/30/2009 Experience Analysis
Salary Increases 0-5 years of service – 9.75% 6-7 years of service – 6.75% 8+ years of service – 6.00% Of the total salary increase, 4.25% is for the combined
inflation and real across-the-board salary increase
Percentage of Members Married 85%
Reciprocity 75% of all terminated vested members are assumed to be employed by a reciprocal entity
Assets Smoothing Method Five year smoothed recognition of total market return that differs from the 7.75% return target. In addition, total deferred losses that are in excess of 20% of market value of assets would be recognized immediately in the development of the actuarial value of assets.
Funding Method
The Plan’s liability is being funded on the Entry Age Normal Cost method with the previous Unfunded Actuarial Accrued Liability being amortized on a closed basis over the following periods:
(1) Outstanding balance of the unfunded actuarial accrued liability calculated through the June 30, 2003 valuation amortized over the next 7 years;
(2) Prior service cost for the February 4, 1996 benefit improvement amortized over the next 7 years; and
(3) Future actuarial experience gains and losses, changes in assumptions, and benefit improvements amortized over 16 years from the date of each such event, beginning with the June 30, 2005 valuation.

107 Comprehensive Annual Financial Report 2010-2011 San José Police & Fire Department Retirement Plan
Probabilities of Separation Prior to Retirement
Age/Yearsof Service
Turnover0-1
Turnover1-4
Turnover5-9
Turnover10+
Service Connected Disability
Non-Service Connected
Death
Service Connected Death
Service Retirement*
Police Fire Male Female Male Female Police Fire<=20 0.0800 0.0100 0.0050 0.0040 0.0006 0.0006 0.0001 0.0001 0.0001 0.0001 0.0000 0.0000
21 0.0800 0.0100 0.0050 0.0040 0.0007 0.0007 0.0001 0.0001 0.0001 0.0001 0.0000 0.000022 0.0800 0.0100 0.0050 0.0040 0.0007 0.0007 0.0001 0.0001 0.0001 0.0001 0.0000 0.000023 0.0800 0.0100 0.0050 0.0040 0.0008 0.0008 0.0001 0.0001 0.0001 0.0001 0.0000 0.000024 0.0800 0.0100 0.0050 0.0040 0.0009 0.0009 0.0001 0.0001 0.0001 0.0001 0.0000 0.000025 0.0800 0.0100 0.0050 0.0040 0.0009 0.0009 0.0001 0.0001 0.0001 0.0001 0.0000 0.000026 0.0800 0.0100 0.0050 0.0040 0.0010 0.0010 0.0002 0.0001 0.0002 0.0001 0.0000 0.000027 0.0800 0.0100 0.0050 0.0040 0.0011 0.0011 0.0002 0.0001 0.0002 0.0001 0.0000 0.000028 0.0800 0.0100 0.0050 0.0040 0.0012 0.0012 0.0002 0.0001 0.0002 0.0001 0.0000 0.000029 0.0800 0.0100 0.0050 0.0040 0.0013 0.0013 0.0002 0.0001 0.0002 0.0001 0.0000 0.000030 0.0800 0.0100 0.0050 0.0040 0.0013 0.0013 0.0002 0.0001 0.0002 0.0001 0.0000 0.000031 0.0800 0.0100 0.0050 0.0040 0.0015 0.0015 0.0002 0.0001 0.0002 0.0001 0.0000 0.000032 0.0800 0.0100 0.0050 0.0040 0.0016 0.0016 0.0002 0.0002 0.0002 0.0002 0.0000 0.000033 0.0800 0.0100 0.0050 0.0040 0.0017 0.0017 0.0002 0.0002 0.0002 0.0002 0.0000 0.000034 0.0800 0.0100 0.0050 0.0040 0.0018 0.0018 0.0002 0.0002 0.0002 0.0002 0.0000 0.000035 0.0800 0.0100 0.0050 0.0040 0.0020 0.0020 0.0002 0.0002 0.0002 0.0002 0.0000 0.000036 0.0800 0.0100 0.0050 0.0040 0.0022 0.0022 0.0003 0.0002 0.0003 0.0002 0.0000 0.000037 0.0800 0.0100 0.0050 0.0040 0.0024 0.0024 0.0003 0.0002 0.0003 0.0002 0.0000 0.000038 0.0800 0.0100 0.0050 0.0040 0.0026 0.0026 0.0003 0.0003 0.0003 0.0003 0.0000 0.000039 0.0800 0.0100 0.0050 0.0040 0.0029 0.0029 0.0004 0.0003 0.0004 0.0003 0.0000 0.000040 0.0800 0.0100 0.0050 0.0040 0.0031 0.0031 0.0004 0.0003 0.0004 0.0003 0.0000 0.000041 0.0800 0.0100 0.0050 0.0040 0.0035 0.0035 0.0004 0.0003 0.0004 0.0003 0.0000 0.000042 0.0800 0.0100 0.0050 0.0040 0.0038 0.0038 0.0005 0.0004 0.0005 0.0004 0.0000 0.000043 0.0800 0.0100 0.0050 0.0040 0.0042 0.0042 0.0005 0.0004 0.0005 0.0004 0.0000 0.000044 0.0800 0.0100 0.0050 0.0040 0.0046 0.0046 0.0005 0.0004 0.0005 0.0004 0.0000 0.000045 0.0800 0.0100 0.0050 0.0040 0.0051 0.0051 0.0005 0.0005 0.0005 0.0005 0.0000 0.000046 0.0800 0.0100 0.0050 0.0040 0.0056 0.0056 0.0006 0.0005 0.0006 0.0005 0.0000 0.000047 0.0800 0.0100 0.0050 0.0040 0.0062 0.0062 0.0006 0.0006 0.0006 0.0006 0.0000 0.000048 0.0800 0.0100 0.0050 0.0040 0.0068 0.0068 0.0006 0.0006 0.0006 0.0006 0.0000 0.000049 0.0800 0.0100 0.0050 0.0040 0.0075 0.0075 0.0007 0.0006 0.0007 0.0006 0.0000 0.000050 0.0800 0.0100 0.0050 0.0040 0.0214 0.0214 0.0007 0.0007 0.0007 0.0007 0.2000 0.170051 0.0800 0.0100 0.0050 0.0040 0.0353 0.0393 0.0007 0.0008 0.0007 0.0008 0.2000 0.170052 0.0800 0.0100 0.0050 0.0040 0.0491 0.0571 0.0008 0.0009 0.0008 0.0009 0.2000 0.170053 0.0800 0.0100 0.0050 0.0040 0.0630 0.0750 0.0008 0.0010 0.0008 0.0010 0.2000 0.170054 0.0800 0.0100 0.0050 0.0040 0.0769 0.0929 0.0009 0.0011 0.0009 0.0011 0.2000 0.170055 0.0800 0.0100 0.0050 0.0040 0.0908 0.1107 0.0010 0.0013 0.0010 0.0013 0.3000 0.170056 0.0800 0.0100 0.0050 0.0040 0.1046 0.1285 0.0011 0.0015 0.0011 0.0015 0.3000 0.170057 0.0800 0.0100 0.0050 0.0040 0.1185 0.1464 0.0012 0.0017 0.0012 0.0017 0.3000 0.170058 0.0800 0.0100 0.0050 0.0040 0.1324 0.1643 0.0013 0.0019 0.0013 0.0019 0.3000 0.170059 0.0800 0.0100 0.0050 0.0040 0.1463 0.1822 0.0015 0.0021 0.0015 0.0021 0.3000 0.170060 0.0800 0.0100 0.0050 0.0040 0.1500 0.2000 0.0018 0.0024 0.0018 0.0024 0.5000 0.170061 0.0800 0.0100 0.0050 0.0040 0.1500 0.2000 0.0020 0.0028 0.0020 0.0028 0.5000 0.170062 0.0800 0.0100 0.0050 0.0040 0.1500 0.2000 0.0022 0.0032 0.0022 0.0032 0.5000 0.170063 0.0800 0.0100 0.0050 0.0040 0.1500 0.2000 0.0025 0.0036 0.0025 0.0036 0.5000 0.170064 0.0800 0.0100 0.0050 0.0040 0.1500 0.2000 0.0029 0.0041 0.0029 0.0041 0.5000 0.170065 0.0800 0.0100 0.0050 0.0040 0.1500 0.2000 0.0033 0.0046 0.0033 0.0046 0.5000 0.350066 0.0800 0.0100 0.0050 0.0040 0.1500 0.2000 0.0038 0.0052 0.0038 0.0052 0.5000 0.350067 0.0800 0.0100 0.0050 0.0040 0.1500 0.2000 0.0043 0.0058 0.0043 0.0058 0.5000 0.350068 0.0800 0.0100 0.0050 0.0040 0.1500 0.2000 0.0049 0.0064 0.0049 0.0064 0.5000 0.350069 0.0800 0.0100 0.0050 0.0040 0.1500 0.2000 0.0055 0.0071 0.0055 0.0071 0.5000 0.350070 0.0000 0.0000 0.0000 0.0000 0.0000 0.0000 0.0000 0.0000 0.0000 0.0000 1.0000 1.0000
* Applied to active members eligible for unreduced benefits.

108 Comprehensive Annual Financial Report 2010-2011 San José Police & Fire Department Retirement Plan
Years of Life Expectancy After Service Retirement
Age Male Female Age Male Female
50 35.10 33.62 80 9.94 9.46
51 34.15 32.67 81 9.32 8.88
52 33.20 31.72 82 8.72 8.32
53 32.25 30.77 83 8.14 7.78
54 31.31 29.83 84 7.59 7.26
55 30.36 28.90 85 7.06 6.76
56 29.43 27.97 86 6.55 6.30
57 28.49 27.05 87 6.08 5.86
58 27.56 26.14 88 5.63 5.46
59 26.63 25.24 89 5.21 5.08
60 25.71 24.35 90 4.80 4.75
61 24.80 23.47 91 4.43 4.44
62 23.90 22.60 92 4.08 4.17
63 23.01 21.74 93 3.76 3.92
64 22.12 20.90 94 3.46 3.71
65 21.25 20.07 95 3.20 3.52
66 20.39 19.26 96 2.97 3.35
67 19.55 18.46 97 2.75 3.19
68 18.72 17.68 98 2.56 3.06
69 17.90 16.91 99 2.39 2.93
70 17.10 16.15 100 2.23 2.80
71 16.32 15.41 101 2.09 2.66
72 15.56 14.69 102 1.97 2.52
73 14.80 13.98 103 1.86 2.39
74 14.06 13.28 104 1.76 2.25
75 13.33 12.61 105 1.67 2.12
76 12.62 11.94 106 1.61 2.00
77 11.92 11.29 107 1.56 1.89
78 11.24 10.66 108 1.52 1.79
79 10.58 10.05 109 1.50 1.71
110 1.49 1.63Male
RP-2000 combined healthy male mortality table with no collar adjustment, projected 10 years (Set back 4 years)
Female
RP-2000 combined healthy female mortality table with no collar adjustment, projected 10 years, with no set back.

109 Comprehensive Annual Financial Report 2010-2011 San José Police & Fire Department Retirement Plan
Years of Life Expectancy After Disability Retirement
Age Member Age Member Age Member
20 61.32 50 32.25 80 8.14
21 60.33 51 31.31 81 7.59
22 59.35 52 30.36 82 7.06
23 58.37 53 29.43 83 6.55
24 57.39 54 28.49 84 6.08
25 56.41 55 27.56 85 5.63
26 55.42 56 26.63 86 5.21
27 54.44 57 25.71 87 4.80
28 53.46 58 24.80 88 4.43
29 52.48 59 23.90 89 4.08
30 51.50 60 23.01 90 3.76
31 50.52 61 22.12 91 3.46
32 49.54 62 21.25 92 3.20
33 48.57 63 20.39 93 2.97
34 47.59 64 19.55 94 2.75
35 46.62 65 18.72 95 2.56
36 45.65 66 17.90 96 2.39
37 44.69 67 17.10 97 2.23
38 43.72 68 16.32 98 2.09
39 42.76 69 15.56 99 1.97
40 41.80 70 14.80 100 1.86
41 40.84 71 14.06 101 1.76
42 39.88 72 13.33 102 1.67
43 38.92 73 12.62 103 1.61
44 37.96 74 11.92 104 1.56
45 37.01 75 11.24 105 1.52
46 36.05 76 10.58 106 1.50
47 35.10 77 9.94 107 1.50
48 34.15 78 9.32 108 1.50
49 33.20 79 8.72 109 1.50
RP-2000 combined healthy male mortality table with no collar adjustment, projected 10 years (Set back 1 year)

110 Comprehensive Annual Financial Report 2010-2011 San José Police & Fire Department Retirement Plan
Schedule of Active Member Valuation DataJune 30, 2001 to June 30, 2010
Changes in Retirants (Including Beneficiaries)
Valuation Date Number Annual Payroll Monthly Average Pay% Increase in
Average Pay*
June 30, 2010 2,021 $251,058,473 $10,352 1.38%
June 30, 2009 2,083 $255,222,552 $10,211 14.92%
June 30, 2007 2,136 $227,734,449 $8,885 1.68%
June 30, 2005 2,003 $210,018,219 $8,738 9.10%
June 30, 2003 2.104 $202,222,000 $8,009 17.88%
June 30, 2001 2,107 $171,799,000 $6,795 10.49%
*Reflects the increase in average salary for members at the beginning of the period versus those at the end of the period, it does not reflect the average salary increases received by members who worked the full period.
* Includes the Plan’s annual cost-of-living adjustment as well as payroll for new retirees.
Time PeriodAt
Beginning of Period
Added During Period
Removed During Period
At End of Period
Annual Retiree Payroll
as of the Beginning of Period
AnnualRetiree Payroll Added During Period*
Annual RetireePayroll
Removed DuringPeriod
Annual Retiree
Payroll as of the End of Period
% Increase in Annual Retiree Payroll
Average Annual
Allowance
6/30/1999-6/30/2001 1,060 145 41 1,164 $41,072,000 $10,272,000 $1,351,000 $49,993,000 21.72% $42,949
6/30/2001-6/30/2003 1,164 159 52 1,271 $49,993,000 $13,806,000 $1,485,000 $62,314,000 24.65% $49,028
6/30/2003-6/30/2005 1,271 161 47 1,385 $62,314,000 $15,619,000 $1,862,000 $76,071,000 22.08% $54,925
6/30/2005-6/30/2007 1,385 143 51 1,477 $76,071,000 $15,913,000 $1,923,000 $90,061,000 18.39% $60,976
6/30/2007-6/30/2009 1,477 276 53 1,700 $90,061,000 $27,537,000 $2,025,000 $115,573,000 38.33% $67,984
6/30/2009-6/30/2010 1,700 152 42 1,810 $115,573,000 $17,238,000 $1,797,000 $131,014,000 13.36% $72,383

111 Comprehensive Annual Financial Report 2010-2011 San José Police & Fire Department Retirement Plan
Actuarial Analysis of Financial Expereince(Amounts in thousands)
Solvency Test(Amounts in thousands)
2009 – 2010 2007 – 2009 2005 – 2007 2003 – 2005
Beginning of Period Unfunded Actuarial Accrued Liability $393,913 $6,596 $44,342 -$3,087
Expected Increase from Prior Valuation $49,857 -$9,912 $13,781 $124
Benefit Improvements - $70,653
Change in Methods and Procedures - -$10,408
Salary Increase Greater (Less) than Expected -$35,814 $65,256 -$52,419
Asset Return Less (Greater) than Expected $149,621 $138,383* -$97,135 $136,013
(Gain)/Loss from Mortality -$4,573 - -
(Gain)/Loss from Retirement $5,664 $39,567 -
SRBR - - -$849 -
Other Experience -$9,157 $8,672 $5,533 -$101,668
Change in Economic & Non-economic Assumptions $104,240 $145,351 $33,098 $12,960
End of Period UAAL $653,751 $393,913 $6,596 $44,342
* Includes an offset of about $200 million due to a change in the market value corridor from 80% -120% to 70% -130% used in determining the actuarial value of assets.
(1) Accumulated from member contribution account balances provided by the Retirement System(2) Calculated based on assumptions adopted by the Board(3) Calculated based on assumptions adopted by the Board and offset with Active member contribution account balances
Valuation Date
Active Member
Contributions
Retired/Vested Members
Active Members (Employer
Financed Portion)Total
Actuarial Value of Assets
Active Member Contributions
(1)
Retired/Vested Members
(2)
Active Members (Employer Financed
Portion) (3)
6/30/2001 $145,166 $699,082 $648,484 $1,492,732 $1,713,812 100% 100% 134%
6/30/2003 $167,203 $881,064 $774,934 $1,823,200 $1,826,287 100% 100% 100%
6/30/2005 $194,008 $1,062,247 $771,177 $2,027,432 $1,983,090 100% 100% 94%
6/30/2007 $227,191 $1,240,126 $905,069 $2,372,386 $2,365,790 100% 100% 99%
6/30/2009 $243,302 $1,630,914 $1,089,266 $2,963,482 $2,569,569 100% 100% 64%
6/30/2010 $246,356 $1,907,931 $1,076,169 $3,230,456 $2,576,705 100% 100% 39%
Aggregate Accrued Liabilities for Portion of Accrued Liabilities Covered by Reported Assets

112 Comprehensive Annual Financial Report 2010-2011 San José Police & Fire Department Retirement Plan
Assumption Changes
Briefly summarized below are the major provisions of the 1961 San Jose Police and Fire Department Retirement Plan, as amended through June 30, 2010.
Final Average Salary (FAS)
Final average salary is defined as the highest 12 consecutive months of compensation earned, not to exceed 108% of compensation paid to the member during the 12 months immediately preceding the last 12 months of service.
FAS excludes overtime pay and expense allowances.
Return of Contributions
If a member should resign or die before becoming eligible for retirement, his or her contributions plus 2% interest per annum will be refunded.
Service Retirement Benefit
Members with 20 years of service who have attained age 55 are eligible to retire. Members age 70 (no service requirement) and members with 30 years of service, regardless of age, are also eligible to retire.
The normal service retirement benefit for Police members is 2.5% of FAS per year of service up to 20 years of service, and 4.0% of FAS per year of service over 20, not to exceed 90% of FAS. The normal service retirement benefit for Fire members is 2.5% of FAS per year of service up to 20 years of service, and for members with 20 or more years of service, 3.0% of FAS per year of service is provided for all years of service, not to exceed 90% of FAS.
A special study was performed by the plan’s prior actuary in 1992 (and subsequently adopted by the Board) which allows members with 25 years of service to retire at age 50 with unreduced benefits. Otherwise, members age 50 with 20 years of service receive their accrued service retirement benefit, reduced for interest below age 55.
Ten years of service are required for vesting purposes.
Disability Benefit
Non-Service Connected
Members with 2 years of service, regardless of age, are eligible for non-service connected disability. The benefit is 32% of FAS for the first 2 years of service plus 1% of FAS for each successive year. The maximum benefit is 50% of FAS. For members with 20 or more years of service, the benefit is the same as that for the Service Retirement.
Service Connected
Members may retire regardless of length of service, and the benefit is 50% of FAS. For Police members with more than 20 years of service, there is an additional benefit of 4.0% of FAS per year of service over 20 (subject to a maximum of 90% of FAS). For Fire members with more than 20 years of service, there is a benefit of 3.0% of FAS per year of service for all years of service (subject to a maximum of 90% of FAS).
Major Provisions of the Retirement Plan
Economic Assumptions:
Investment of Rate Return Decrease in the net investment rate of return from 8.00% to 7.75%.

113 Comprehensive Annual Financial Report 2010-2011 San José Police & Fire Department Retirement Plan
Death Benefit (before and after retirement)
Non-Service Connected
Eligibility is based on 2 years of service, regardless of age. The spouse receives 24% of FAS for the first 2 years of service plus 0.75% of FAS for each successive year. The maximum benefit is the greater of 50% of the member’s benefit and 37.5% of FAS. For members eligible to receive the Service Retirement Benefit, the spouse receives the greater of 37.5% of FAS or 50% of the member’s Service Retirement Benefit, with a maximum continuance benefit of 42.5% of FAS for Police members and 45% of FAS for Fire members.
If a member has eligible dependent children (under age 18, or age 22 if a full time student), the benefits are as follows:
1 child 25% of FAS
2 children 37.5% of FAS
3 or more children 50% of FAS
The total benefits payable to a family shall not exceed 75% of FAS.
If a member does not have a spouse nor dependent children at death, a lump sum equal to the greater of the member’s contributions or $1,000 is paid to the estate.
These benefits are payable for active member deaths and deaths after non-service connected disability retirement.
Service Connected
The spouse receives the greater of 50% of the member’s benefit and 37.5% of FAS with a maximum continuance benefit of 42.5% of FAS for Police members and 45% of FAS for Fire members. Eligible dependent children receive 25% of FAS per child. The total benefits payable to a family shall not exceed 75% of FAS.
These benefits are payable for active member deaths and deaths after service connected disability retirement and service retirement.
Death Benefit − Inactive Members (after retirement)
The spouse receives 1.875% of FAS per year of service, not to exceed 37.5% of FAS or the continuance benefit paid under Service Retirement, if greater. Eligible dependent children receive the following:
1 child 1.25% of FAS per year of service
2 children 1.875% of FAS per year of service
3 or more children 2.5% of FAS per year of service
The total benefits payable to a family shall not exceed 75% of FAS.
Cost-of-Living
The increase in retirement allowance is a maximum of 3% per year.
Post-Retirement Health and Dental
Retirees and survivors with 15 years of service, or receiving a benefit of at least 37.5% of FAS, receive the same medical coverage that the City pays for an active member. Members must have retired from active service to be eligible.
Members’ Retirement Contributions
The members’ contribution rates are recalculated on an actuarial basis at each actuarial study and equal to 3/11ths of the Normal Cost. Police members presently contribute at the rate of 15.57% of pay and Fire members contribute at a rate of 13.70% of pay.
City’s Retirement Contributions
The City presently contributes at a rate of 44.58% of pay for Police members and 44.16% of pay for Fire members. The City rate is the percentage of salary necessary, on an actuarial basis, to provide for the payment of the benefits promised, also taking into account the contributions being made by the members and the assets on hand. These rates are changed in accordance with the results of each actuarial study.
Major Provisions of the Retirement Plan (Continued)

114 Comprehensive Annual Financial Report 2010-2011 San José Police & Fire Department Retirement Plan
Actuary’s Certification Letter Other Postemployment Benefits (OPEB)
July 21, 2011
Board of RetirementCity of San JosePolice and Fire Department Retirement Plan1737 N First Street, Suite 580San Jose, CA 95112-4505
Re: City of San Jose Police and Fire Department Retirement PlanCAFR Certification for OPEB Plan
Dear Members of the Board:
The Segal Company (Segal) performed an actuarial valuation of the Other Post Employment Benefits (OPEB) funded through the City of San Jose Police and Fire Department Retirement Plan as of June 30, 2010. We certify that the actuarial valuation was prepared in accordance with generally accepted actuarial principles and practices. In particular, it is our understanding that the assumptions and methods used for funding purposes meet the parameters of the Governmental Accounting Standards Board Statement No. 43.
As part of our valuation, Segal conducted an examination of all participant data for reasonableness. We did not audit the Plan’s financial statements. For actuarial valuation purposes, Plan assets are valued at Actuarial Value. Under this method, the assets used to determine employer and employee contribution rates take into account market value by recognizing the differences between the total return at market value and the expected investment return over five-year periods.
The Entry Age Normal Cost Method was used to determine the Annual Required Contribution (ARC) and the actuarial accrued liability. Under this method, the ARC provides for current cost (normal cost) plus a level percentage of payroll to amortize any unfunded actuarial accrued liability (UAAL). The UAAL is amortized as a level percentage of payroll over a 30-year open amortization period.
The method described above is only used for the purposes of fulfilling the Plan’s accounting requirements because for funding purposes for the 2010-2011 plan year, the cash contributions are calculated on a different basis. Prior to the 2009-2010 plan year, the cash contributions had been calculated so that the City and the employees shared in the contributions required to pay the projected benefits for the next ten years under the Aggregate Cost Method. For the members of the Police Officers Association, a transition began from the Aggregate Cost Method of 10-year projected benefits to fully funding the ARC over a 5-year period, commencing with the 2009-2010 Fiscal Year. For members of Fire Fighters Local 230, there will be a transition from the Aggregate Cost Method to fully funding the ARC, over a 5-year period, commencing with the 2011-2012 Fiscal Year. However, the annual increase in contribution rates during the phase-in period are subject to certain limits.
THE SEGAL COMPANY100 Montgomery Street, Suite 500 San Francisco, CA 94104-4308
415.263.8200 phone415.263.8290 fax www.segalco.com

115 Comprehensive Annual Financial Report 2010-2011 San José Police & Fire Department Retirement Plan
Actuary’s Certification Letter (Continued) Other Postemployment Benefits (OPEB)
The ratio of the valuation assets to actuarial accrued liabilities decreased from 7.30% determined in the last valuation as of June 30, 2009 to 6.19% determined in the current valuation as of June 30, 2010. The employer’s ARC has increased from 19.13% of payroll determined in the June 30, 2009 valuation to 24.08% of payroll determined in the June 30, 2010 valuation.
The actuarial valuation reflects a long term perspective that involves estimates of the value of reported amounts and assumptions about the probability of events far into the future. The assumptions used in this valuation were adopted by the Board based on the June 30, 2009 biennial experience analysis and the June 30, 2010 review of economic actuarial assumptions. Actuarially determined amounts are subject to continual revision as results are compared to past expectations and new estimates are made about the future.
The valuation was based upon the benefits provided under the terms of the substantive plan ineffect at the time of the valuation.
We have prepared the following supporting schedules for the Retirement Plan’s CAFR:
›Actuarial Methods and Assumptions for Other Post Employment Benefits (OPEB)
›Summary of Plan Benefits for Other Post Employment Benefits (OPEB)
›Solvency Test for Other Post Employment Benefits (OPEB)
›Schedule of retirants and beneficiaries added to and removed from rolls for Other Post Employment Benefits
(OPEB)
›Analysis of financial experience for Other Post Employment Benefits (OPEB)
›Required Supplementary Information – Schedule of Funding Progress
›Required Supplementary Information – Schedule of Employer Contributions
Please note that we have not included 6 years of experience for the exhibits because the Plan only began to prepare liabilities and other information pursuant to the Standards required by GASB 43 effective with the June 30, 2006 valuation date. All the other schedules presented in the Actuarial Section and as Required Supplementary Information in the Financial Section have been prepared and/or reviewed by our firm. The undersigned are Members of the American Academy of Actuaries and we have satisfied the qualifications requirements to render the opinion contained herein.
Sincerely,
Paul Angelo, FSA, MAAA, FCA, EA Andy Yeung, ASA, MAAA, FCA, EASenior Vice President & Actuary Vice President & Associate Actuary
TXB/bqbEnclosures

116 Comprehensive Annual Financial Report 2010-2011 San José Police & Fire Department Retirement Plan
The following assumptions have been adopted by the Retirement Board as of June 30, 2010 valuation:
AssumptionsValuation Interest Rate 6.30%Participation in Medical Plan 95% of current actives are assumed to elect coverage at retirementParticipation in Dental Plan 95% of current actives are assumed to elect coverage at retirementEligibility for Medicare 100% of retirees reaching age 65 are assumed to be eligible for MedicareHealth Care Cost Trend Rates See section below
Trend is to be applied to premium for shown fiscal year to calculate next fiscal year’s projected premium. First Fiscal Year (July 1, 2010 through June 30, 2011):
Dental Premium Trend 5.00% for all years
Medicare Part B Premium Trend The 2011-2012 fiscal year premium is assumed to increase 2.5% from the 2010-2011 fiscal year premium (based on the calendar year premium for 2011 remaining unchanged from 2010). Premiums after 2011-2012 are assumed to increase with 5% annual trend.
PlanBlue Shield PPO/POS,
Under Age 65
Blue Shield PPO/POS,
Age 65 and Over
Kaiser HMO, Under Age 65
Kaiser Senior Advantage
Blue Shield HMO, All Ages
Trend to be applied to 2010-2011 Fiscal Year premium
7.11% 7.11% 9.50% 9.04% 7.11%
Fiscal Year Trend (Approximate) Calendar YearTrend
(applied to calculate following year’s premium)
2011-2012 9.75% 2011 10.00%
2012-2013 9.25% 2012 9.50%
2013-2014 8.75% 2013 9.00%
2014-2015 8.25% 2014 8.50%
2015-2016 7.75% 2015 8.00%
2016-2017 7.25% 2016 7.50%
2017-2018 6.75% 2017 7.00%
2018-2019 6.25% 2018 6.50%
2019-2020 5.75% 2019 6.00%
2020-2021 5.25% 2020 5.50%
2021-2022 and later 5.00% 2021 and later 5.00%
The fiscal year trend rates are based on the following calendar year trend rates:
Schedule of Actuarial Methods and Assumptions OTHER POSTEMPLOYMENT BENEFITS (OPEB)
Per Capita Costs and Carrier Election Assumption under Age 65
CARRIERAssumed Election Percent
Monthly Premium
Maximum Subsidy
SubsidyMonthly Premium
Maximum Subsidy
SubsidyMonthly Premium
Maximum Subsidy
Subsidy
Kaiser 50 $505.72 $490.05 $490.05 $1,259.19 $1,220.18 $1,220.18 $505.72 $490.05 $490.05
Blue PPO/POS 25 $765.43 $490.05 $490.05 $1,967.09 $1,220.18 $1,220.18 $765.43 $490.05 $490.05
Blue Shield HMO 25 $551.30 $490.05 $490.05 $1,416.24 $1,220.18 $1,220.18 $551.30 $490.05 $490.05
2010-2011 Plan Year Single PartyMarried/with
Domestic PartnerSurviving Spouse/ Domestic Partner

117 Comprehensive Annual Financial Report 2010-2011 San José Police & Fire Department Retirement Plan
Schedule of Actuarial Methods and Assumptions (Continued)
OTHER POSTEMPLOYMENT BENEFITS (OPEB)
Implicit Subsidy Costs
CARRIERAssumed Election Percent
Monthly Premium
Maximum Subsidy
SubsidyMonthly Premium
Maximum Subsidy
SubsidyMonthly Premium
Maximum Subsidy
Subsidy
Kaiser Senior Advantage 35 $446.97 $490.05 $446.97 $893.94 $1,220.18 $893.94 $446.97 $490.05 $446.97
Blue Shield PPO or POS 60 $594.84 $490.05 $490.05 $1,189.68 $1,220.18 $1,189.68 $594.84 $490.05 $490.05
Blue Shield HMO 5 $420.94 $490.05 $420.94 $841.87 $1,220.18 $841.87 $420.94 $490.05 $420.94
2010-2011 Plan Year Single PartyMarried/with
Domestic PartnerSurviving Spouse/ Domestic Partner
AgeBlended Premium
Age-Based Cost
Implicit Subsidy
Blended Premium
Age-Based Cost
Implicit Subsidy
Blended Premium
Age-Based Cost
Implicit Subsidy
50 $6,069 $5,090 -$979 $9,185 $6,497 -$2,688 $6,616 $5,966 -$650
55 $6,069 $6,811 $742 $9,185 $8,693 -$492 $6,616 $7,984 $1,368
60 $6,069 $9,118 $3,049 $9,185 $11,638 $2,453 $6,616 $10,688 $4,072
64 $6,069 $11,510 $5,441 $9,185 $14,692 $5,507 $6,616 $13,492 $6,876
65+ N/A N/A N/A N/A N/A N/A N/A N/A N/A
Kaiser Blue Shield PPO/POS Blue Shield HMO
Per Capita Costs and Carrier Election Assumption Age 65 and Older
AgeBlended Premium
Age-Based Cost
Implicit Subsidy
Blended Premium
Age-Based Cost
Implicit Subsidy
Blended Premium
Age-Based Cost
Implicit Subsidy
50 $6,069 $7,287 $1,218 $9,185 $9,301 $116 $6,616 $8,542 $1,926
55 $6,069 $8,654 $2,585 $9,185 $11,046 $1,861 $6,616 $10,144 $3,528
60 $6,069 $10,277 $4,208 $9,185 $13,118 $3,933 $6,616 $12,047 $5,431
64 $6,069 $11,791 $5,722 $9,185 $15,050 $5,865 $6,616 $13,821 $7,205
65+ N/A N/A N/A N/A N/A N/A N/A N/A N/A
Kaiser Blue Shield PPO/POS Blue Shield HMO
Male Retirees
AgeBlended Premium
Age-Based Cost
Implicit Subsidy
Blended Premium
Age-Based Cost
Implicit Subsidy
Blended Premium
Age-Based Cost
Implicit Subsidy
50 $6,069 $8,300 $2,231 $9,185 $10,594 $1,409 $6,616 $9,729 $3,113
55 $6,069 $8,935 $2,866 $9,185 $11,404 $2,219 $6,616 $10,473 $3,857
60 $6,069 $9,630 $3,561 $9,185 $12,292 $3,107 $6,616 $11,289 $4,673
64 $6,069 $10,216 $4,147 $9,185 $13,040 $3,855 $6,616 $11,975 $5,359
65+ N/A N/A N/A N/A N/A N/A N/A N/A N/A
Kaiser Blue Shield PPO/POS Blue Shield HMO
Female Retirees

118 Comprehensive Annual Financial Report 2010-2011 San José Police & Fire Department Retirement Plan
Other Actuarial Assumptions Same as those used for the retirement plan valuation and they are based upon the June 30, 2009 experience analysis.
Actuarial Cost Method (For GASB 43/45 Purposes)
The System’s liability is being calculated under the Entry Age Normal cost method with the Unfunded Actuarial Accrued Liability being amortized on an open basis over a period of 30 years beginning on June 30, 2010.
Schedule of Actuarial Methods and Assumptions (Continued)
OTHER POSTEMPLOYMENT BENEFITS (OPEB)
Implicit Subsidy Costs
AgeBlended Premium
Age-Based Cost
Implicit Subsidy
Blended Premium
Age-Based Cost
Implicit Subsidy
Blended Premium
Age-Based Cost
Implicit Subsidy
50 $6,069 $5,090 -$979 $9,185 $6,497 -$2,688 $6,616 $5,966 -$650
55 $6,069 $6,811 $742 $9,185 $8,693 -$492 $6,616 $7,984 $1,368
60 $6,069 $9,118 $3,049 $9,185 $11,638 $2,453 $6,616 $10,688 $4,072
64 $6,069 $11,510 $5,441 $9,185 $14,692 $5,507 $6,616 $13,492 $6,876
65+ N/A N/A N/A N/A N/A N/A N/A N/A N/A
Kaiser Blue Shield PPO/POS Blue Shield HMO
Male Spouses/Domestic Partners
AgeBlended Premium
Age-Based Cost
Implicit Subsidy
Blended Premium
Age-Based Cost
Implicit Subsidy
Blended Premium
Age-Based Cost
Implicit Subsidy
50 $6,069 $6,664 $595 $9,185 $8,506 -$679 $6,616 $7,812 $1,196
55 $6,069 $7,714 $1,645 $9,185 $9,846 $661 $6,616 $9,042 $2,426
60 $6,069 $8,947 $2,878 $9,185 $11,420 $2,235 $6,616 $10,487 $3,871
64 $6,069 $10,070 $4,001 $9,185 $12,853 $3,668 $6,616 $11,804 $5,188
65+ N/A N/A N/A N/A N/A N/A N/A N/A N/A
Kaiser Blue Shield PPO/POS Blue Shield HMO
Female Spouses/Domestic Partners

119 Comprehensive Annual Financial Report 2010-2011 San José Police & Fire Department Retirement Plan
Summary of Plan Benefits
OTHER POSTEMPLOYMENT BENEFITS (OPEB)
Eligibility Retired for disability or service from active service with 15 years of service, or receiving a benefit of at least 37.5% of Final Average Salary.
If a member separates from service after July 5, 1992, with 20 years of service, the member is eligible to receive a health benefit upon receiving a retirement benefit.
Medical Subsidy For retirees not eligible for Medicare, the Plan pays the lowest non-Medicare HMO premium rate. For retirees eligible for Medicare, the Plan pays the retiree’s premium plus the Medicare Part B premium, subject to the same maximums that apply to non-Medicare retirees.
Dental Subsidy The plan pays the entire premium.
ACTIVE PLAN FUNDING:
Police
Employee’s Contribution Contribute 50% of the health premium subsidy and 25% of the dental premium subsidy as determined at each actuarial valuation based on a weighted average of:
• The cash flow requirement for the next ten years, and
• The full prefunding requirement based on: 1) 7.75% discount rate, 2) Entry Age Normal Funding Method, 3) 30-year closed amortization of the unfunded actuarial accrued liability.
For the 2010-2011 fiscal year, the contribution rate is based on 40% of the full prefunding rate and 60% of the 10-year cash flow requirement rate.
City’s Contribution Contribute 50% of the health premium subsidy and 75% of the dental premium subsidy as determined at each actuarial valuation based on a weighted average of:
• The cash flow requirement for the next ten years, and
• Thefullprefundingrequirementbasedon:1)7.75%discountrate,2)EntryAge Normal Funding Method, 3) 30-year closed amortization of the unfunded actuarial accrued liability.
For the 2010-2011 fiscal year, the contribution rate is based on 40% of the full prefunding rate and 60% of the 10-year cash flow requirement rate.
Fire
Employee’s Contribution Contribute 50% of the health premium subsidy and 25% of the dental premium subsidy as determined at each actuarial valuation based on a weighted average of:
• The cash flow requirement for the next ten years, and
• Thefullprefundingrequirementbasedon:1)7.75%discountrate,2)EntryAgeNormalFunding Method, 3) 30-year closed amortization of the unfunded actuarial accrued liability.
For the 2010-2011 fiscal year, the contribution rate is based on 0% of the full prefunding rate and 100% of the 10-year cash flow requirement rate.
City’s Contribution Contribute 50% of the health premium subsidy and 75% of the dental premium subsidy as determined at each actuarial valuation based on a weighted average of:
• The cash flow requirement for the next ten years, and
• Thefullpre-fundingbasedon1)7.75%discountrate,2)EntryAgeNormal

120 Comprehensive Annual Financial Report 2010-2011 San José Police & Fire Department Retirement Plan
Solvency TestOTHER POST-EMPLOYMENT BENEFITS (OPEB)
Valuation Date
ActiveMember
Contributions
Retired/ Vested
Members
ActiveMembers
(Employer FinancedPortion)
TotalActuarial Value ofAssets
ActiveMember
Contributions
Retired/ Vested Mem-
bers
ActiveMembers(EmployerFinancedPortion)
6/30/2006 $0 $422,456,701 $428,760,659 $851,217,360 $38,381,423 N/A 9% 0%
6/30/2007 $0 $336,899,376 $329,328,261 $666,227,637 $45,393,375 N/A 13% 0%
6/30/2009 $0 $436,249,049 $325,355,376 $761,604,425 $55,617,900 N/A 13% 0%
6/30/2010 $0 $568,610,655 $377,697,300 $946,307,955 $58,586,443 N/A 10% 0%
(1) Active member contributions are included in the solvency test exhibit provided for the pension plan.
Retirants and Beneficiaries Added To and Removed From PayrollFOR OTHER POST-EMPLOYMENT BENEFITS (OPEB)
(1) The counts shown reflect retirants and beneficiaries receiving a pension. The table below shows how many of the pensioners and survivors are receiving a medical or dental benefit:
TimePeriod
AtBeginning of Period
AddedDuring Period
Removed During Period
At End of Period(1)
Annual OPEB Payroll as of
the Beginningof Period
AnnualOPEB Payroll
AddedDuring Period
AnnualOPEB Payroll
RemovedDuring Period
Annual OPEB Payroll as of the End of Period
% Increase in Annual
OPEBPayroll
Average Annual
Allowance
6/30/06-6/30/07 1,386 142 51 1,477 $12,880,000(2) $14,794,000(3) N/A $10,016
6/30/07-6/30/09 1,477 276 53 1,700 $14,794,000(3) $18,039,000(4) 21.93% $10,611
6/30/09-6/30/10 1,700 152 42 1,810 $18,039,000(4) $20,701,000(5) 14.76% $11,437
(Combined Basis)
$1,914,000
$3,245,000
$2,662,000
DateNumber of Retirants
Receiving Medical SubsidyNumber of Beneficiaries
Receiving Medical SubsidyNumber of Retirants
Receiving a Dental SubsidyNumber of Beneficiaries
Receiving a Dental Subsidy
6/30/2007 1,220 142 1,220 N/A; Not Eligible
6/30/2009 1,392 163 1,413 N/A; Not Eligible
6/30/2010 1,504 172 1,524 N/A; Not Eligible
(2) Benefits for the 12 month period ended June 30, 2006, from the CAFR. Includes benefits for some retirants and beneficiaries who were no longer receiving benefits as of June 30, 2006.
(3) Benefits for the 12 month period ended June 30, 2007, from the CAFR. Includes benefits for some retirants and beneficiaries who were no longer receiving benefits as of June 30, 2007.
(4) Benefits for the 12 month period ended June 30, 2009, from the CAFR. Includes benefits for some retirants and beneficiaries who were no longer receiving benefits as of June 30, 2009.
(5) Benefits for the 12 month period ended June 30, 2010, from the CAFR. Includes benefits for some retirants and beneficiaries who were no longer receiving benefits as of June 30, 2010.
Aggregate Accrued Liabilities forPortion of Accrued LiabilitiesCovered by Reported Assets

121 Comprehensive Annual Financial Report 2010-2011 San José Police & Fire Department Retirement Plan
Actuarial Analysis of Financial ExperienceFOR OTHER POST-EMPLOYMENT BENEFITS (OPEB)
Change in Unfunded Actuarial Accrued Liability from July 1, 2006 to June 30, 2007
1) Unfunded actuarial accrued liability (UAAL) as of July 1, 2006 $812,835,9372) Total normal cost as of July 1, 2006 34,053,1893) Interest on UAAL and normal cost for the twelve-month period ended June 30, 2007 44,885,1244a) Employer contributions from July 1, 2006 through June 30, 2007 (cash contributions plus implicit subsidy) 16,568,9864b) Employee contributions from July 1, 2006 through June 30, 2007 (cash contributions) 7,989,0005) Interest on contributions, payable throughout the twelve-month period ended June 30, 2007 650,787
6) Expected UAAL as of June 30, 2007 (1+2+3-4a-4b-5) $866,565,4777) Actuarial experience (gain) loss 15,710,1098) Estimated impact of insurance premiums less than expected -84,022,2359) Change in assumptions and methodology -17,741,9089
10) Unfunded actuarial accrued liability as of June 30, 2007 (6 + 7 + 8 + 9) $620,834,262
Change in Unfunded Actuarial Accrued Liability from July 1, 2007 to June 30, 2009
1) Unfunded actuarial accrued liability (UAAL) as of July 1, 2007 $620,834,2622) Total normal cost as of July 1, 2007 25,357,6953) Interest on UAAL and normal cost for the twelve-month period ended June 30, 2008 41,356,2854a) Employer contributions from July 1, 2007 through June 30, 2008 (cash contributions plus implicit subsidy) 13,624,0484b) Employee contributions from July 1, 2007 through June 30, 2008 (cash contributions) 915,10005) Interest on contributions, payable throughout the twelve-month period ended June 30, 2007 717,500
6) Expected UAAL as of June 30, 2008 (1+2+3-4a-4b-5) $664,055,6947) Total normal cost as of July 1, 2008 26,372,0038) Interest on UAAL and normal cost for the twelve-month period ended June 30, 2009 44,187,3739a) Employer contributions from July 1, 2008 through June 30, 2009 (cash contributions plus implicit subsidy) 13,063,2719b) Employee contributions from July 1, 2008 through June 30, 2009 (cash contributions) 9,218,00010) Interest on contributions, payable throughout the twelve-month period ended June 30, 2009 701,944
11) Expected UAAL as of June 30, 2009 (6+7+8-9a-9b-10) $711,631,85512) Actuarial experience (gain) loss 18,788,54313) Change in assumptions -24,433,873
14) Unfunded actuarial accrued liability as of June 30, 2009 (11 + 12 + 13) $705,986,525
Change in Unfunded Actuarial Accrued Liability from July 1, 2009 to June 30, 2010
1) Unfunded actuarial accrued liability (UAAL) as of July 1, 2009 $705,986,5252) Total normal cost as of July 1, 2009 25,915,5073) Interest on UAAL and normal cost for the twelve-month period ended June 30, 2010 49,037,4364a) Employer contributions from July 1, 2009 through June 30, 2010 (cash contributions plus implicit subsidy) 15,546,4504b) Employee contributions from July 1, 2009 through June 30, 2010 (cash contributions) 10,650,0005) Interest on contributions, payable throughout the twelve-month period ended June 30, 2010 863,354
6) Expected UAAL as of June 30, 2010 (1+2+3-4a-4b-5) $753,879,664
7) Actuarial experience (gain) loss 11,242,4298) Change in assumptions a) Trends and starting costs 69,691,136 b) Discount rate 52,908,283
9) Unfunded actuarial accrued liability as of June 30, 2010 (6 + 7 + 8a + 8b) $887,721,512


City of San José
Comprehensive Annual Financial Report
for the Fiscal Year Ended June 30, 2011
The Statistical Section provides additional historical
perspective, context, and detail in order to provide a more
comprehensive understanding of this fiscal year’s financial
statements, note disclosures, and supplementary information,
which cover Pension Plan and Other Postemployment Medical.
This section also provides a multi-year trend of financial
and operating information to facilitate comprehensive
understanding of how the organization’s financial position and
performance has changed over time. More specifically, the
financial and operating information provides contextual data
for the Plan’s net assets, benefits, refunds, contribution rates,
and different types of retirement benefits. The financial and
operating trend information is located on the following pages.
StatisticalSection
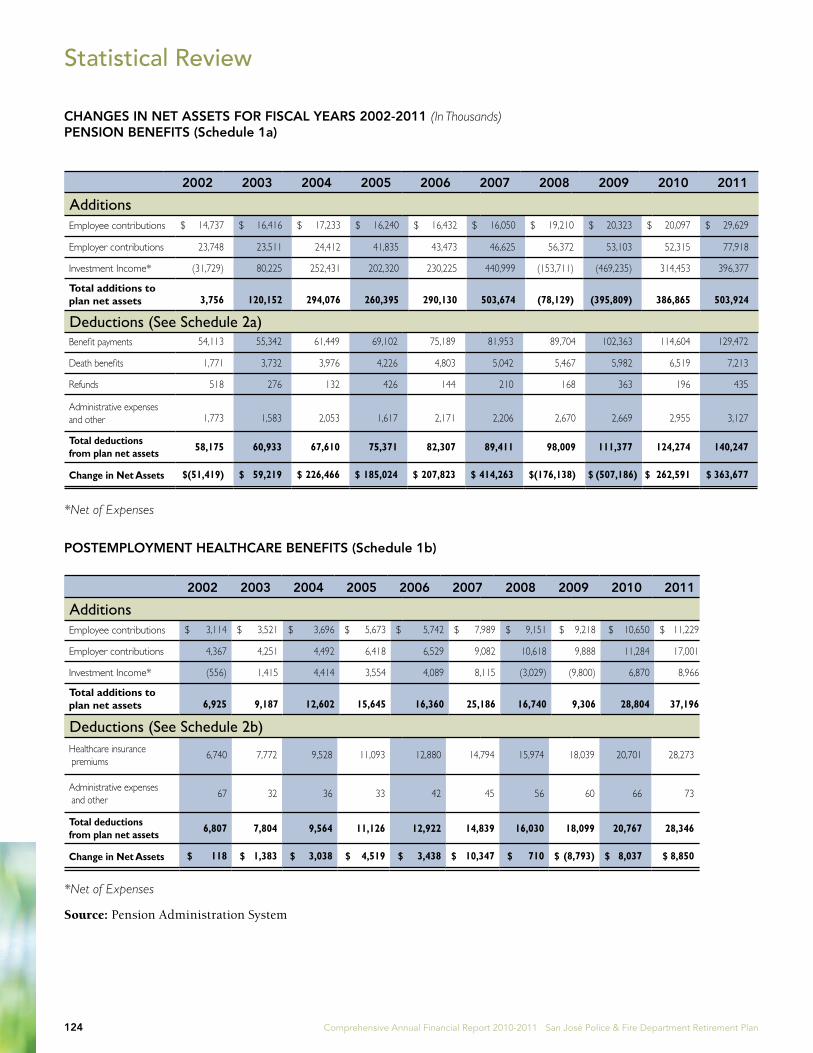
124 Comprehensive Annual Financial Report 2010-2011 San José Police & Fire Department Retirement Plan
Statistical Review
Healthcare insurance premiums
6,740 7,772 9,528 11,093 12,880 14,794 15,974 18,039 20,701 28,273
Administrative expenses and other
67 32 36 33 42 45 56 60 66 73
Total deductions from plan net assets 6,807 7,804 9,564 11,126 12,922 14,839 16,030 18,099 20,767 28,346
Change in Net Assets $ 118 $ 1,383 $ 3,038 $ 4,519 $ 3,438 $ 10,347 $ 710 $ (8,793) $ 8,037 $ 8,850
Benefit payments 54,113 55,342 61,449 69,102 75,189 81,953 89,704 102,363 114,604 129,472
Death benefits 1,771 3,732 3,976 4,226 4,803 5,042 5,467 5,982 6,519 7,213
Refunds 518 276 132 426 144 210 168 363 196 435
Administrative expenses and other 1,773 1,583 2,053 1,617 2,171 2,206 2,670 2,669 2,955 3,127
Total deductions from plan net assets 58,175 60,933 67,610 75,371 82,307 89,411 98,009 111,377 124,274 140,247
Change in Net Assets $(51,419) $ 59,219 $ 226,466 $ 185,024 $ 207,823 $ 414,263 $(176,138) $ (507,186) $ 262,591 $ 363,677
Deductions (See Schedule 2a)
Deductions (See Schedule 2b)
2002 2003 2004 2005 2006 2007 2008 2009 2010 2011
2002 2003 2004 2005 2006 2007 2008 2009 2010 2011
Employee contributions $ 14,737 $ 16,416 $ 17,233 $ 16,240 $ 16,432 $ 16,050 $ 19,210 $ 20,323 $ 20,097 $ 29,629
Employer contributions 23,748 23,511 24,412 41,835 43,473 46,625 56,372 53,103 52,315 77,918
Investment Income* (31,729) 80,225 252,431 202,320 230,225 440,999 (153,711) (469,235) 314,453 396,377
Total additions to plan net assets 3,756 120,152 294,076 260,395 290,130 503,674 (78,129) (395,809) 386,865 503,924
Employee contributions $ 3,114 $ 3,521 $ 3,696 $ 5,673 $ 5,742 $ 7,989 $ 9,151 $ 9,218 $ 10,650 $ 11,229
Employer contributions 4,367 4,251 4,492 6,418 6,529 9,082 10,618 9,888 11,284 17,001
Investment Income* (556) 1,415 4,414 3,554 4,089 8,115 (3,029) (9,800) 6,870 8,966
Total additions to plan net assets 6,925 9,187 12,602 15,645 16,360 25,186 16,740 9,306 28,804 37,196
Additions
Additions
CHANGES IN NET ASSETS FOR FISCAL YEARS 2002-2011 (In Thousands) PENSION BENEFITS (Schedule 1a)
POSTEMPLOYMENT HEALTHCARE BENEFITS (Schedule 1b)
*Net of Expenses
*Net of Expenses
Source: Pension Administration System

125 Comprehensive Annual Financial Report 2010-2011 San José Police & Fire Department Retirement Plan
Statistical Review (Continued)
Total Benefits $ 136,685 $ 121,123 $ 108,345 $ 95,171 $ 86,995 $ 79,992
Type of Refund
Separation $ 435 $ 196 $ 363 $ 168 $ 210 $ 144
Total Refunds $ 435 $ 196 $ 363 $ 168 $ 210 $ 144
Ex-Spouse Benefits 2,675 2,346 2,224 1,969
1,877 1,725
Retirees – Duty 55,998 51,218 49,100 46,654 43,713 41,134
Retirees – Non-Duty
674 680 698 697 646 610
Survivors – Duty 3,888 3,634 3,784 3,459 3,184 2,876
Survivors – Non-Duty 124 136 146 144 135 133
Death in Service Benefits 1,246 1,155 1,193 1,121 1,093 1,031
Disability Benefits
Type of Benefit 2011 2010 2009 2008 2007 2006
Retirees – Service $68,780 $ 59,455 $ 49,004 $ 39,354 $ 34,772 $ 30,828
Retirees – Deferred Vested
1,948 1,481 1,337 1,030 946 892
Survivors – Service 1,301 986 826 713 606 741
Survivors – Deferred Vested 51 32 33 30 23 22
BENEFIT AND REFUND DEDUCTIONS FROM NET ASSETS BY TYPE (In Thousands) PENSION BENEFITS (Schedule 2a)
Fiscal Year 2004-05 data not available due to system limitations.
Source: Pension Administration System
Age & Service Benefits
Statistical Review (Continued)
BENEFIT AND REFUND DEDUCTIONS FROM NET ASSETS BY TYPE (In Thousands) POSTEMPLOYMENT HEALTHCARE BENEFITS (Schedule 2b)
Death in Service Benefits
Type of Benefit 2011 2010 2009 2008 2007 2006
Retirees – Service
Medical $ 11,473 $ 8,274 $ 6,843 $ 5,366 $ 4,750 $ 3,871
Dental 1,173 855 684 589 550 492
Retirees – Deferred Vested
Medical 286 180 146 137 131 119
Dental 32 21 17 17 16 15
Survivors – Service
Medical 278 165 110 89 76 78
Dental 50 31 19 21 20 23
Survivors – Deferred Vested
Medical 13 - - 1 3 4
Dental 3 1 1 - 1 1
Retirees – Duty
Medical 11,938 8,897 8,177 7,757 7,324 6,503
Dental 1,294 977 856 885 881 854
Retirees – Non-Duty
Medical 243 199 172 173 162 147
Dental 30 26 21 22 21 21
Survivors – Duty
Medical 866 643 603 527 483 408
Dental 204 154 119 137 127 118
Survivors – Non-Duty
Medical 25 24 24 22 20 19
Dental 8 7 6 7 7 7
Ex-Spouse Benefits
Total Benefits $ 28,273 $ 20,701 $ 18,039 $ 15,974 $ 14,794 $ 12,880
Medical 306 213 208 190 186 165
Dental 51 37 33 34 36 35
Age and Service Benefits
Disability Benefits

126 Comprehensive Annual Financial Report 2010-2011 San José Police & Fire Department Retirement Plan
Statistical Review (Continued)
EMPLOYER AND EMPLOYEE CONTRIBUTION RATES FOR FISCAL YEARS 2002-2011 (Schedule 3)
Fiscal Year Employee Rate (%) Employer Rate (%) Employee Rate (%) Employer Rate (%)
2001-02 9.79 15.70 9.79 15.70
2002-03 10.25 14.22 10.25 14.22
2003-04 10.25 14.22 10.25 14.22
2004-05 11.16 24.59 11.16 24.59
2005-06 11.16 25.04 11.16 25.04
2006-07 11.67 28.51 11.26 25.22
2007-08* 11.67 28.90 11.26 25.61
2008-09 11.96 25.80 12.40 28.31
2009-10 12.96 26.89 12.40 28.31
2010-11 15.57 44.58 13.70 44.16
Police Department Rates Fire Department Rates
*Special rate change effective 12/17/2006
Source: Pension Administration System

127 Comprehensive Annual Financial Report 2010-2011 San José Police & Fire Department Retirement Plan
Retired Member by Type of BenefitPENSION BENEFITS As of June 30, 2011
Monthly Benefit Amount
Number of Retirees
& Beneficiaries 1 2 3 4 5 6 7 8 Unmodified Option 1 Option 2 Option 3 Total
Amount Monthly Benefit Health Dental
Ineligible/Deferred 242 181
$1 - 60 - 25
$61 - 250 - 1,773
$251 - 500 440 -
$501 - 1,000 174 -
$1,001 - 1,250 1,123 -
TOTAL 1,979 1,979
Type of Subsidy
Source: Pension Administration System
$1 - 1000 28 - - - - 1 4 4 19 19 2 4 3 28
$1001 - 1500 45 - - - - 8 5 5 27 22 1 16 6 45
$1501 - 2000 80 5 - 5 1 4 35 3 27 54 - 21 5 80
$2001 - 2500 105 28 - - - 10 34 13 20 73 1 31 - 105
$2501 - 3000 99 23 - 1 5 11 44 4 11 72 - 26 1 99
$3001 - 3500 89 46 - 3 1 5 22 5 7 76 4 8 1 89
$3501 - 4000 91 64 2 5 2 2 9 3 4 78 2 7 4 91
$4001 - 4500 71 49 1 1 6 1 8 3 2 58 2 4 7 71
$4501 - 5000 116 80 1 1 28 1 3 1 1 77 6 18 15 116
$5001 - 5500 109 64 1 1 38 - 3 1 1 81 7 9 12 109
$5501 - 6000 108 53 1 - 47 1 5 - 1 81 4 6 17 108
$6001 - 6500 135 68 - - 63 1 2 - 1 106 7 9 13 135
$6501 - 7000 131 65 1 - 65 - - - - 95 11 11 14 131
$7001 - 7500 110 34 1 1 72 - 1 1 - 83 - 13 14 110
$7501 - 8000 118 50 - - 67 - - 1 - 77 6 15 20 118
Over $8000 544 165 2 - 370 - 1 6 - 352 35 70 87 544
TOTAL 1,979 794 10 18 765 45 176 50 121 1,404 88 268 219 1,979
*Retirement Codes
1 Service Connected Disability2 Early Service3 Non-Service Connected Disability4 Service5 Survivor (survivor of active employee)6 Continuance (survivor of retired employee)7 Deferred Vested8 Ex-Spouse
**Option Descriptions
Unmodified Unmodified Joint & Survivorship (standard default for married)
1 Contingent Joint & Survivorship (increased percentage to survivor/reduce pension to member)
2 Unmodified/No Survivor (standard default for unmarried)
3 Joint & Survivorship Pop-Up (same as option 1 but if spouse predeceases member, pension goes back to original pension calculation)
Type of Retirement* Option Selected**
POSTEMPLOYMENT HEALTHCARE BENEFITS As of June 30, 2011

128 Comprehensive Annual Financial Report 2010-2011 San José Police & Fire Department Retirement Plan
Average Benefit Payment AmountsPENSION BENEFITS
* Monthly benefit does not include cost of living increases (“COLA”) of 3% per year.** Final Average Salary not available for those that retired prior to April 1998, except for service connected disability retirees. Those without Final Average Salary are not included in Average Monthly Benefit.*** Does not include Survivors and Ex-Spouses
Information presented in the above table is not readily available prior to fiscal year 2006.
Retirement Effective Dates 0-5 6-10 11-15 16-20 21-25 26-30 31+
Period 7/1/2010 to 6/30/2011
Years of Service Credit
Average Monthly Benefit (Incl. COLA) $ 2,199 $ 3,028 $ 3,310 $ 4,509 $ 5,872 $ 8,035 $ 8,573
Average Final Average Salary** $ 1,540 $ 3,402 $ 4,695 $ 6,818 $ 7,309 $ 8,344 $ 8,094
Number of Retired Members*** 6 44 74 102 278 714 157
Average Monthly Benefit (Incl. COLA) (for those whose FAS was unavailable)
$ -
$ 1,688
$ 1,455
$ 2,989
$ 3,956
$ 6,051
$ 6,766
Number of Retired Members*** 0 3 5 12 33 124 30
Period 7/1/2009 to 6/30/2010
Average Monthly Benefit (Incl. COLA) $ 2,152 $ 2,915 $ 3,184 $ 4,223 $ 5,372 $ 7,622 $ 8,242
Average Final Average Salary** $ 1,585 $ 3,248 $ 4,532 $ 6,515 $ 6,599 $ 7,942 $ 7,938
Number of Retired Members*** 6 46 70 96 242 653 157
Average Monthly Benefit (Incl. COLA) (for those whose FAS was unavailable)
$ - $ 1,639 $ 1,419 $ 2,854 $ 3,779 $ 5,886 $ 6,570
Number of Retired Members*** 0 3 5 12 36 129 30
Period 7/1/2008 to 6/30/2009
Average Monthly Benefit (Incl. COLA) $ 2,170 $ 2,779 $ 3,101 $ 3,937 $ 4,904 $ 7,158 $ 7,811
Average Final Average Salary** $ 1,778 $ 3,087 $ 4,498 $ 6,066 $ 6,072 $ 7,492 $ 7,600
Number of Retired Members*** 7 46 68 86 220 575 153
Average Monthly Benefit (Incl. COLA) (for those whose FAS was unavailable)
$ - $ 1,591 $ 1,381 $ 2,712 $ 3,675 $ 5,710 $ 6,327
Number of Retired Members*** 0 3 5 13 36 132 32
Period 7/1/2007 to 6/30/2008
Average Monthly Benefit (Incl. COLA) $ 2,120 $ 2,717 $ 3,068 $ 3,743 $ 4,563 $ 6,776 $ 7,319
Average Final Average Salary** $ 1,778 $ 3,060 $ 4,097 $ 5,713 $ 5,644 $ 7,129 $ 7,147
Number of Retired Members*** 7 47 64 79 204 521 140
Average Monthly Benefit (Incl. COLA) (for those whose FAS was unavailable)
$ - $ 1,549 $ 1,319 $ 2,642 $ 3,639 $ 5,560 $ 6,123
Number of Retired Members*** 0 3 5 13 36 134 32
Period 7/1/2006 to 6/30/2007
Average Monthly Benefit* $ 2,063 $ 2,618 $ 2,853 $ 3,576 $ 4,339 $ 6,461 $ 6,962
Average Final Average Salary** $ 1,799 $ 3,023 $ 3,846 $ 5,567 $ 5,419 $ 6,924 $ 6,898
Number of Retired Members*** 7 47 62 79 195 492 134
Average Monthly Benefit (for those whose FAS was unavailable)
$ - $ 1,500 $ 1,239 $ 2,561 $ 3,526 $ 5,397 $ 5,938
Number of Retired Members*** 0 3 6 13 36 137 32
Period 7/1/2005 to 6/30/2006
Average Monthly Benefit* $ 889 $ 1,424 $ 1,822 $ 2,633 $ 3,073 $ 5,092 $ 5,411
Average Final Average Salary** $ 1,778 $ 2,934 $ 3,716 $ 5,290 $ 5,164 $ 6,674 $ 6,725
Number of Retired Members*** 7 47 61 76 189 462 129
Average Monthly Benefit (for those whose FAS was unavailable)
$ - $ 414 $ 735 $ 1,741 $ 2,405 $ 3,835 $ 4,103
Number of Retired Members*** 0 3 6 14 36 137 32
Source: Pension Administration System

129 Comprehensive Annual Financial Report 2010-2011 San José Police & Fire Department Retirement Plan
Average Benefit Payment Amounts
* Does not include Survivors and Ex-Spouses
Information presented in the above table is not readily available prior to fiscal year 2006.
Source: Pension Administration System
Retirement Effective Dates 0-5 6-10 11-15 16-20 21-25 26-30 31+
Period 7/1/2010 to 6/30/2011
Average Health Subsidy $ 730 $ 918 $ 1,050 $ 1,019 $ 1,052 $ 1,086 $ 1,029
Number of Health Participants* 6 40 59 96 273 709 29
Average Dental Subsidy $ 110 $ 110 $ 110 $ 110 $ 109 $ 109 $ 110
Number of Dental Participants* 6 43 63 98 278 714 30
Period 7/1/2009 to 6/30/2010
Average Health Subsidy $ 702 $ 853 $ 991 $ 951 $ 978 $ 1,023 $ 985
Number of Health Participants* 6 42 56 91 236 649 157
Average Dental Subsidy $ 104 $ 104 $ 105 $ 104 $ 104 $ 104 $ 104
Number of Dental Participants* 6 45 60 93 239 652 157
Period 7/1/2008 to 6/30/2009
Average Health Subsidy $ 711 $ 807 $ 939 $ 898 $ 910 $ 963 $ 927
Number of Health Participants* 7 42 56 82 216 572 153
Average Dental Subsidy $ 94 $ 94 $ 94 $ 94 $ 91 $ 94 $ 94
Number of Dental Participants* 7 45 60 83 220 575 153
Period 7/1/2007 to 6/30/2008
Average Health Subsidy $ 676 $ 778 $ 888 $ 866 $ 870 $ 916 $ 885
Number of Health Participants* 7 45 58 82 234 516 139
Average Dental Subsidy $ 99 $ 99 $ 99 $ 98 $ 98 $ 98 $ 99
Number of Dental Participants* 7 49 61 83 239 520 139
Period 7/1/2006 to 6/30/2007
Average Health Subsidy $ 632 $ 736 $ 805 $ 813 $ 815 $ 861 $ 828
Number of Health Participants* 7 45 57 82 225 487 134
Average Dental Subsidy $ 98 $ 98 $ 98 $ 96 $ 97 $ 97 $ 98
Number of Dental Participants* 7 49 60 83 230 491 134
Years of Service Credit
Period 7/1/2005 to 6/30/2006
Average Health Subsidy $ 571 $ 662 $ 722 $ 735 $ 731 $ 772 $ 742
Number of Health Participants* 7 45 56 79 216 453 129
Average Dental Subsidy $ 95 $ 96 $ 95 $ 94 $ 94 $ 95 $ 95
Number of Dental Participants* 7 49 59 80 222 461 129
POSTEMPLOYMENT HEALTHCARE BENEFITS

130 Comprehensive Annual Financial Report 2010-2011 San José Police & Fire Department Retirement Plan
Retirements During Fiscal Year 2010-2011
Police Department
BENNETT, MARK
BERTELSEN, MELANIE
CHANGCO, RANDY
CLARK, KEVIN
COLON, ANTHONY
COMO, JOHN
CORREA, THOMAS
DAVIS, ROBERT
EFIGENIO, MARK
ELVANDER, MATTHEW
FAZ, DENNIS
GONZALES, WILLIAM
GRAHAM, GEORGE
GRANT, DOUGLAS
GUTIERREZ, STEVEN
HARMON, PAUL
HELLER, MARK
JOHNSON, DAVID
JONES, BYRON
KATZ, DANIEL
KENNEDY, SCOTT
KIRBY, GARY
KOZLOWSKI, JEFFREY
LEE, GILBERT
MATTOCKS, MICHAEL
MC GRADY, LARRY
MORRILL, GREGORY
MUNCY, BRET
NAVIN, THOMAS
NIEHOFF, MIKAEL
PEREZ, CYNTHIA
PISCITELLO, MICHAEL
PONTE, MICHAEL
RAMON, MARIA
REMINGTON, MARC
RUSYN, JOHN
SCANLAN, PETER
SCHAEFFER, DAVID
SMITH, JEFFREY
TANAKA, KENNETH
WERKEMA, JAMES
ZAMORA, GILBERT
Fire Department
ACKER, JAMES
ANDERSON, ALAN
BAUER, MICHAEL
BAZURTO, OSCAR
BLOOM, EVAN
BYGDNES, ERIC
CAMPOS, RALPH
CARRILLO, JOSEPH
CHABOYA, CARLOS
CHACON, LUIS
CONANT, KEVIN
COOLEY, WILLIAM
DESSERT, MARK
EDEN, PAUL
FALTERSACK, CHERYL
FILSON, MARK
GALL, KAREN
GERBINO, ALAN
GUINNANE, ANTHONY
HUBBARD, CLIFFORD
HUSEMAN, DAVID
KIM, MITCHELL
LEONG, TIMOTHY
MARTINEZ, OSCAR
MC GEHEE, STEWART
MILLER, CARLOS
MITCHELL, ARTHUR
MUNOZ, EDWARD
O’CONNOR, CHARLES
PFIRRMAN, RUSSELL
SALAZAR, DAVID
SALINGER, SUSAN
SCANLON, EDWARD
SKEEN, JOHN
SMITH, BRIAN
SNAPP, DANA
SOUZA, ALOYSIUS
SPELLMAN, TODD
STEWART, FLOYD
STUNKEL, JAMES
VAN GUNDY, WAYNE
WARDALL, RICHARD
WELLS, JOHN
WOODWORTH, MICHAEL
WYATT, JAMES
SERVICE RETIREMENTS
Source: Pension Administration System

131 Comprehensive Annual Financial Report 2010-2011 San José Police & Fire Department Retirement Plan
Retirements During Fiscal Year 2010-2011 (Continued)
Police Department
BAILEY, WILLIAM
BRICKELL, DAVID
BROWN, WILLIAM
DONALD, PEGGY
MC COURTIE, GLENN
O’DAY, DEXTER
WIDMAN, LE ROY
WILLIAMS, RONALD
Deaths During Fiscal Year 2010-2011DEATHS AFTER RETIREMENT
Police Department
THOMAS, CHRISTINA
Fire Department
CHURCHILL, DAVID
IGNO, ANTOINETTE
SCHULLER, PAUL
EARLY RETIREMENTS
Police Department
ACKEMANN, DEAN
CHAVEZ, RUBEN
CHIN, ROD MARK
DOWNING, RODOLFO
DURAN, ALFRED
GALLAGHER, STEPHEN
PAULIDES, DAVID
Fire Department
THOMAS, NICOLAS
DEFERRED VESTED RETIREMENTS
Police Department
ANDERSON, ROBERT
Fire Department
NONE
NON-SERVICE CONNECTED DISABILITY RETIREMENTS
Police Department
JACOB, SR, JOHN
Fire Department
WATKINS, JONATHAN
DEATHS BEFORE RETIREMENT
Police Department
FARQUHAR, WAYNE
GULLO, LAWRENCE
RAY, KEVIN
TOKIWA, ROBIN
VAN KEY, WILLIAM
Fire Department
NONE
SERVICE CONNECTED DISABILITY RETIREMENTS
Source: Pension Administration System
Fire Department
CANCILLA, JOSEPH
DE MERS, BRUCE
DIQUISTO, JOHN
ELDER, JAMES
FEDEROFF, GEORGE
FRATES, CHARLES
GRAY, LOREN
LESLIE, SEAN
LUCCHESI, GEORGE
MAC PHEE, KEVIN
MURRAY, WILLIAM
O’ROURKE, DALE
OZGA, JAN
PARKS, GARY
ROBERTSON, ROBERT
SALOIS, JOHN
TRANBERG, DEWITT


Department of Retirement Services
1737 North First Street, Suite 580
San José, California 95112-4505
Phone 408-794-1000 Fax 408-392-6732
www.sjretirement.com