the state police retirement system of new jersey …
TRANSCRIPT
THE STATE POLICE RETIREMENT SYSTEM
OF NEW JERSEY
REPORT ON AN INVESTIGATION OF EXPERIENCE
PREPARED AS OF JUNE 30, 2008
DOC: V02320JC.DOC
May 13, 2009
Board of Trustees
The State Police Retirement System
of New Jersey
Trenton, New Jersey 08625-0295
Members of the Board:
This year an actuarial investigation of the mortality and service experience of the members and
beneficiaries of the retirement system was made in accordance with the provisions of Section 32 of
Chapter 89, P.L. 1965. This Section specifies that such an investigation shall be made once in every
three-year period. The results of this investigation, which examined the experience of the System from
July 1, 2005 to June 30, 2008 are described in the attached report.
Please note that we have examined only the demographic and current salary increase assumptions and
have not addressed the other economic assumptions, namely the interest rate assumption and the cost-of-
living assumption.
To the best of our knowledge, this experience investigation report is complete and accurate. The experience
investigation was performed by, and under the supervision of, independent qualified actuaries who are
members of the American Academy of Actuaries with experience in performing experience investigations
for public retirement systems.
We are available at the Board’s convenience to discuss this report.
Respectfully submitted,
Janet H. Cranna, F.S.A., E.A., M.A.A.A.
Principal, Consulting Actuary
JHC:HN
DOC:V02320JC.DOC
TABLE OF CONTENTS Section Item Page No. I Introduction 1 II Examination of Experience 2 III Comments and General Recommendation of Actuaries 14 IV Summary of Proposed New Assumptions 18 V Cost Impact of the Proposed Assumptions 40 VI Complete Set of Proposed Assumptions 41
Page 1
REPORT ON AN INVESTIGATION OF THE EXPERIENCE OF THE
STATE POLICE RETIREMENT SYSTEM OF NEW JERSEY PREPARED AS OF JUNE 30, 2008
I. INTRODUCTION
Section 32 of Chapter 89, P.L. 1965 of the New Jersey Statutes provides that once in every three-year
period the actuary shall examine in detail the mortality and service experience of the members and
beneficiaries of the Retirement System. This investigation is designed to assure that the tables used for
determining expected liabilities of the Retirement System are consistent with recent experience. If tables
are not updated periodically, the liabilities of the System may be overstated or understated, and resulting
contributions either too large or too small to fund the actual accruing liabilities.
This report summarizes the Retirement System’s experience for the period from July 1, 2005 to June 30,
2008. Experience for active male and female members were examined in total. Mortality experience
among beneficiaries were examined based on gender. Please note that, in instances where the data being
examined appeared inconsistent with results of previous studies or incomplete, we made no current
recommendations. These items will be reviewed closely when the next scheduled study is prepared as of
June 30, 2011 and proposed changes, if warranted, will be recommended at that time.
Also, as noted earlier, we have included an examination of the current salary increase assumption in this
study.

Page 2
II. EXAMINATION OF EXPERIENCE
As noted earlier, the examination this year covers the period from July 1, 2005 to June 30, 2008. When
appropriate, we have made reference to trends that were first identified in prior studies.
The experience among active members has been compared with the experience expected according to the
active service tables and retirement tables adopted by the Board of Trustees following the previous study.
The actual experience among beneficiaries has also been compared with the experience expected
according to the current mortality tables.
In the case of withdrawals, since the Board has adopted different rates of withdrawal for the first four
years of service and for five to nineteen years of service, the data for employees with less than five years
of service were tabulated separately from the data for employees with five to nineteen years of service.
Similarly, incidence of service retirement were examined separately for employees with twenty, twenty-
one, twenty-two to twenty-four, twenty-five and more than twenty-five years of service. For purposes of
the analysis of experience with respect to death and disability retirement, employees were treated as one
group for each assumption.
The expected number of separations from service on account of withdrawal, death, disability and service
retirement were calculated by multiplying the rates of separation used as a basis for the active service
tables by the number of those exposed to risk. The actual number of those who had separated from
service was then compared with the expected number. If the ratio of actual to expected is 1.000, the
tables have exactly predicted what actually occurred. If the ratio of actual to expected is greater than
1.000, then the tables have underestimated actual experience. If the ratio is less than 1.000, then the
tables have overstated actual experience.
Page 3
Finally, in accordance with the current salary increase assumption, the expected salaries of those members
who remain in service from year to year were obtained and these expected salaries were compared with
the actual salaries. Again, a ratio of actual to expected of 1.000 would indicate that actual salary
increases were identical to anticipated increases while a ratio greater than 1.000 indicates that salaries
have increased faster than anticipated and a ratio less than 1.000 indicates that salaries have increased
slower than anticipated.
Page 4
(A) ACTIVE PLAN EXPERIENCE
The first portion of this section contains a summary of active plan experience, which examines the
following rates:
• Withdrawal Rates
• Ordinary Death Rates
• Accidental Death Rates
• Ordinary Disability Rates
• Accidental Disability Rates
• Service Retirement Rates
• Salary Increase Rates
Page 5
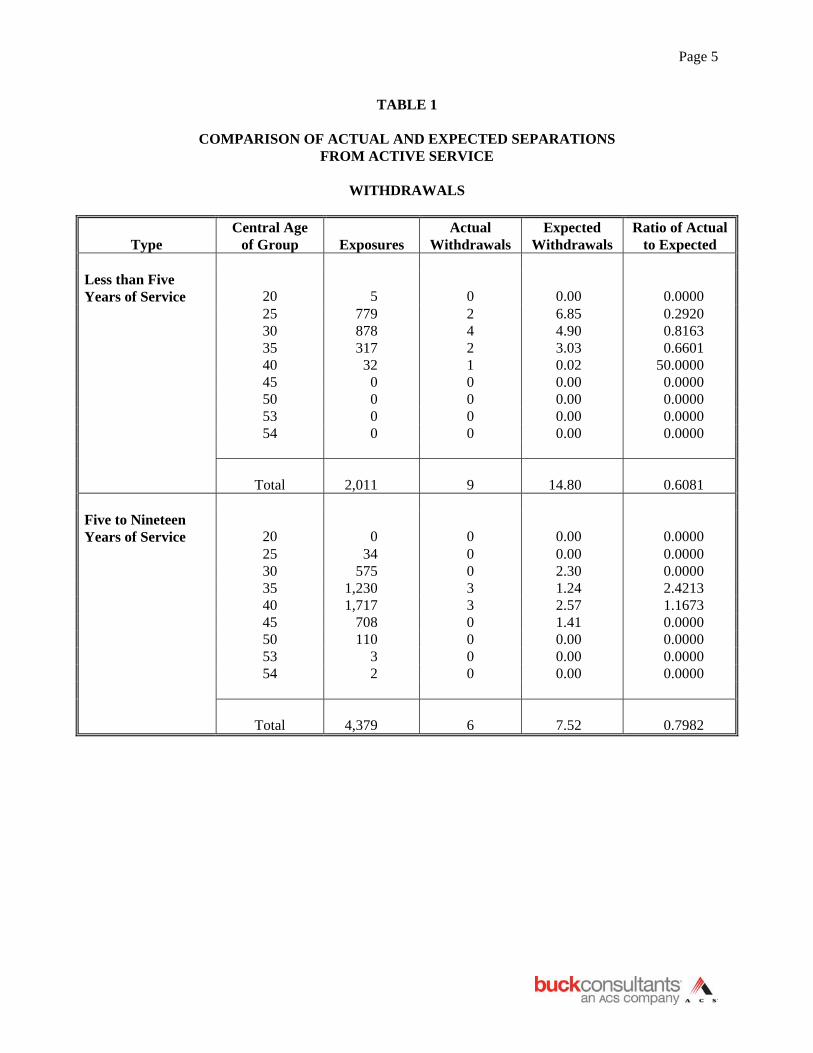
TABLE 1
COMPARISON OF ACTUAL AND EXPECTED SEPARATIONS FROM ACTIVE SERVICE
WITHDRAWALS
Type Central Age
of Group
Exposures Actual
Withdrawals Expected
Withdrawals Ratio of Actual
to Expected Less than Five Years of Service
20
5
0
0.00
0.0000
25 779 2 6.85 0.2920 30 878 4 4.90 0.8163 35 317 2 3.03 0.6601 40 32 1 0.02 50.0000 45 0 0 0.00 0.0000 50 0 0 0.00 0.0000 53 0 0 0.00 0.0000 54 0 0 0.00 0.0000
Total
2,011
9
14.80
0.6081 Five to Nineteen Years of Service
20
0
0
0.00
0.0000
25 34 0 0.00 0.0000 30 575 0 2.30 0.0000 35 1,230 3 1.24 2.4213 40 1,717 3 2.57 1.1673 45 708 0 1.41 0.0000 50 110 0 0.00 0.0000 53 3 0 0.00 0.0000 54 2 0 0.00 0.0000
Total
4,379
6
7.52
0.7982
Page 6
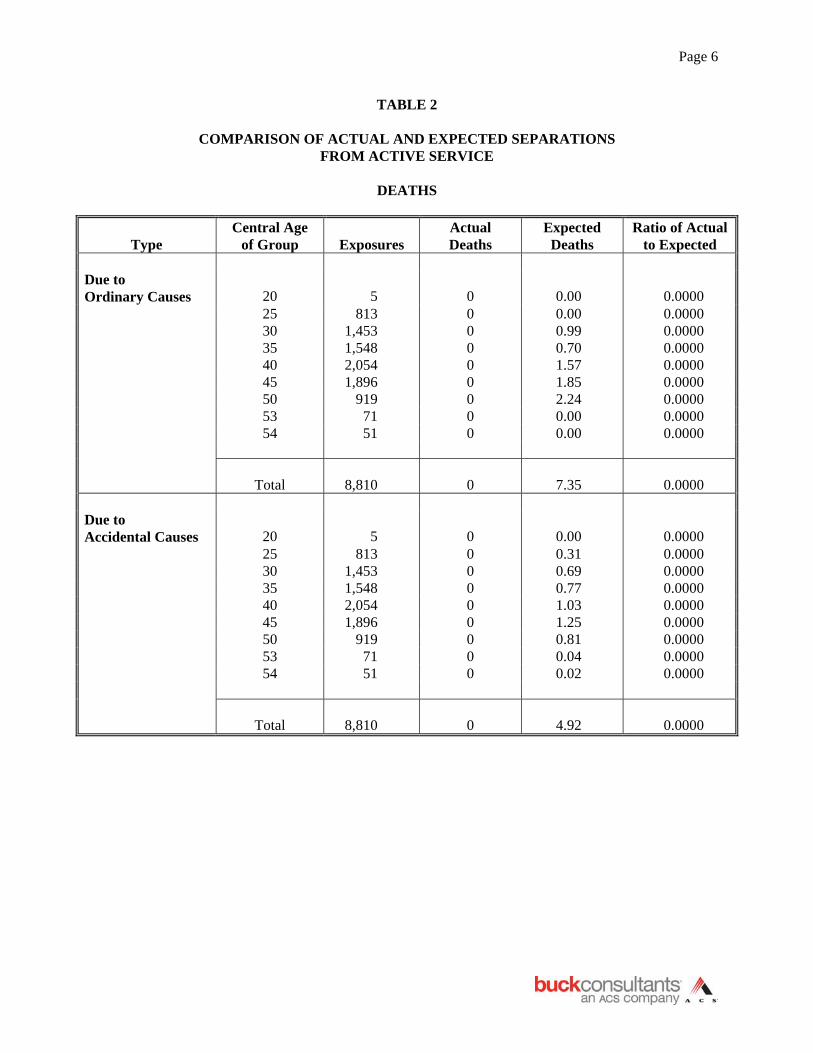
TABLE 2
COMPARISON OF ACTUAL AND EXPECTED SEPARATIONS FROM ACTIVE SERVICE
DEATHS
Type Central Age
of Group
Exposures Actual Deaths
Expected Deaths
Ratio of Actual to Expected
Due to Ordinary Causes
20
5
0
0.00
0.0000
25 813 0 0.00 0.0000 30 1,453 0 0.99 0.0000 35 1,548 0 0.70 0.0000 40 2,054 0 1.57 0.0000 45 1,896 0 1.85 0.0000 50 919 0 2.24 0.0000 53 71 0 0.00 0.0000 54 51 0 0.00 0.0000
Total
8,810
0
7.35
0.0000 Due to Accidental Causes
20
5
0
0.00
0.0000
25 813 0 0.31 0.0000 30 1,453 0 0.69 0.0000 35 1,548 0 0.77 0.0000 40 2,054 0 1.03 0.0000 45 1,896 0 1.25 0.0000 50 919 0 0.81 0.0000 53 71 0 0.04 0.0000 54 51 0 0.02 0.0000
Total
8,810
0
4.92
0.0000
Page 7
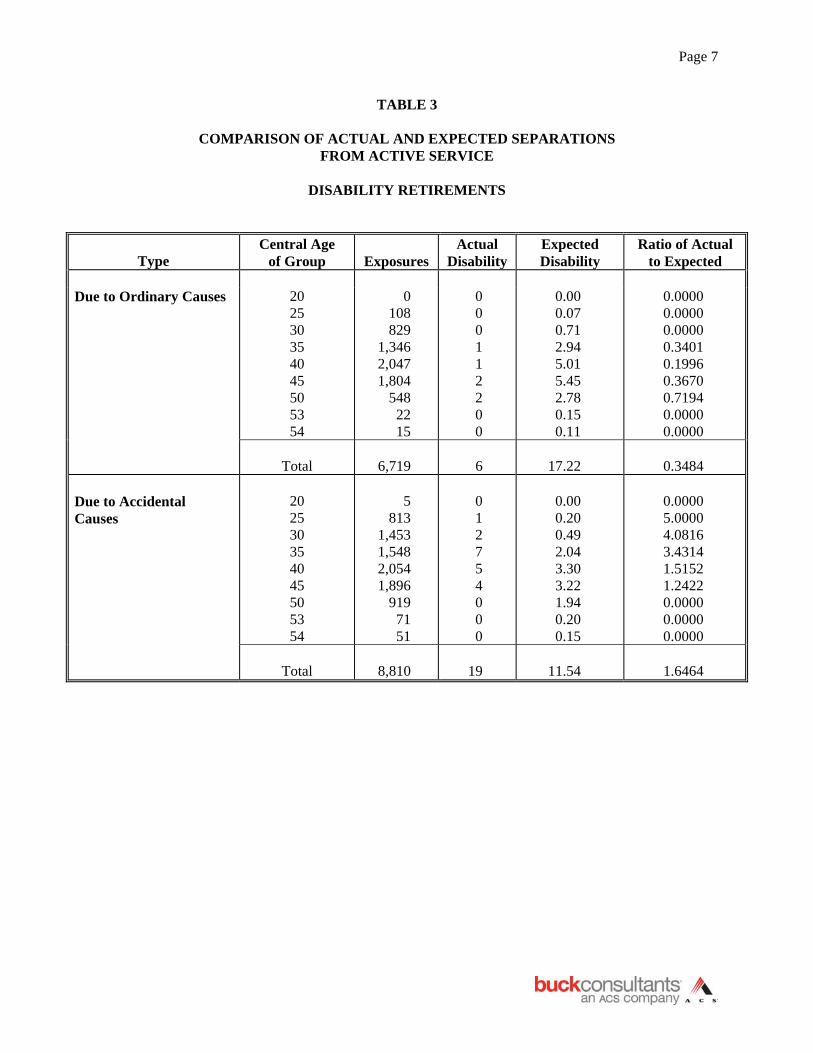
TABLE 3
COMPARISON OF ACTUAL AND EXPECTED SEPARATIONS FROM ACTIVE SERVICE
DISABILITY RETIREMENTS
Type
Central Age of Group
Exposures
Actual Disability
Expected Disability
Ratio of Actual to Expected
Due to Ordinary Causes 20
25 30 35 40 45 50 53 54
0 108 829
1,346 2,047 1,804
548 22 15
0 0 0 1 1 2 2 0 0
0.00 0.07 0.71 2.94 5.01 5.45 2.78 0.15 0.11
0.0000 0.0000 0.0000 0.3401 0.1996 0.3670 0.7194 0.0000 0.0000
Total 6,719 6 17.22 0.3484 Due to Accidental Causes
20 25 30 35 40 45 50 53 54
5
813 1,453 1,548 2,054 1,896
919 71 51
0 1 2 7 5 4 0 0 0
0.00 0.20 0.49 2.04 3.30 3.22 1.94 0.20 0.15
0.0000 5.0000 4.0816 3.4314 1.5152 1.2422 0.0000 0.0000 0.0000
Total 8,810 19 11.54 1.6464
Page 8
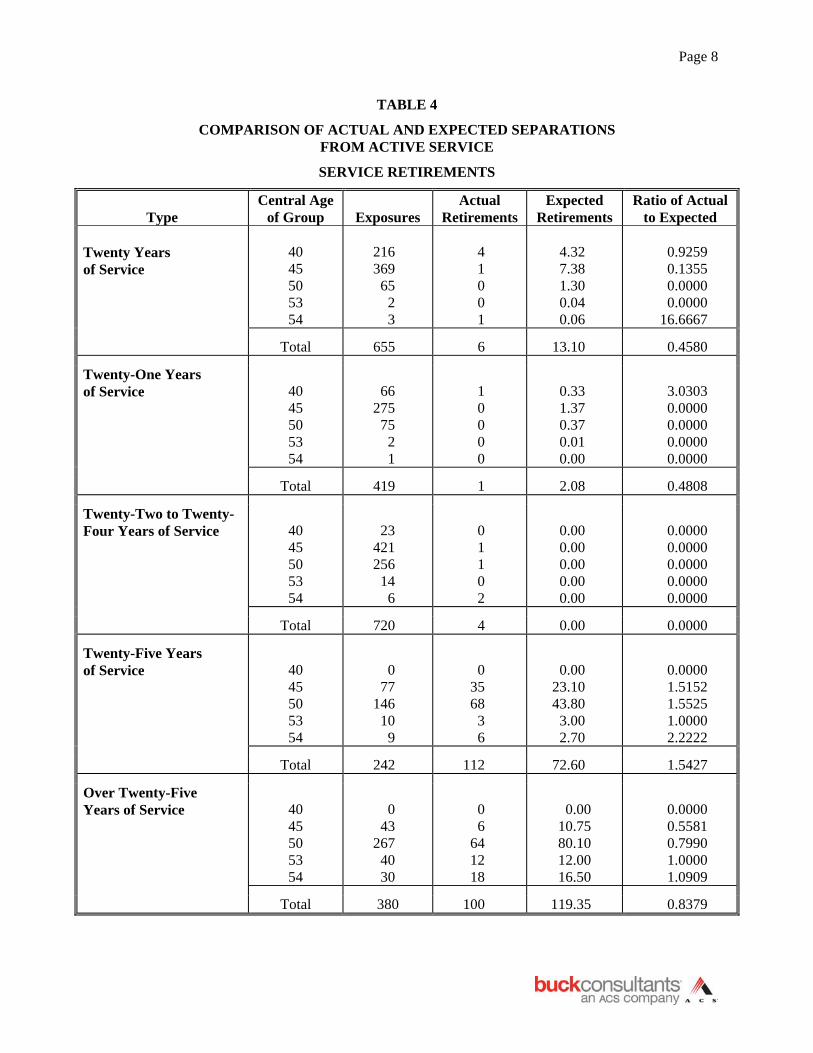
TABLE 4
COMPARISON OF ACTUAL AND EXPECTED SEPARATIONS FROM ACTIVE SERVICE
SERVICE RETIREMENTS
Type
Central Age of Group
Exposures
Actual Retirements
Expected Retirements
Ratio of Actual to Expected
Twenty Years of Service
40 45 50 53 54
216 369
65 2 3
4 1 0 0 1
4.32 7.38 1.30 0.04 0.06
0.9259 0.1355 0.0000 0.0000
16.6667 Total 655 6 13.10 0.4580 Twenty-One Years of Service
40 45 50 53 54
66
275 75
2 1
1 0 0 0 0
0.33 1.37 0.37 0.01 0.00
3.0303 0.0000 0.0000 0.0000 0.0000
Total 419 1 2.08 0.4808 Twenty-Two to Twenty-Four Years of Service
40 45 50 53 54
23
421 256
14 6
0 1 1 0 2
0.00 0.00 0.00 0.00 0.00
0.0000 0.0000 0.0000 0.0000 0.0000
Total 720 4 0.00 0.0000 Twenty-Five Years of Service
40 45 50 53 54
0
77 146
10 9
0
35 68
3 6
0.00
23.10 43.80
3.00 2.70
0.0000 1.5152 1.5525 1.0000 2.2222
Total 242 112 72.60 1.5427 Over Twenty-Five Years of Service
40 45 50 53 54
0
43 267
40 30
0 6
64 12 18
0.00
10.75 80.10 12.00 16.50
0.0000 0.5581 0.7990 1.0000 1.0909
Total 380 100 119.35 0.8379

Page 9
TABLE 5
COMPARISON OF ACTUAL AND EXPECTED
ACTIVE SALARY INCREASES
SALARY INCREASE
CENTRAL AGE
OF GROUP
Actual Salary from
Previous Year
Actual
Expected
Ratio of Actual
to Expected
25 $ 19,843,499 $ 21,439,910 $ 20,924,969 1.025 30 92,463,884 99,899,260 97,503,165 1.025 35 109,229,512 117,808,299 115,182,520 1.023 40 144,258,646 152,869,578 152,120,742 1.005 45 230,191,128 242,247,857 242,736,544 0.998 50 114,333,302 120,195,111 120,567,467 0.997
Greater than 52 21,625,069 22,740,477 22,803,635 0.997
Total $ 731,945,040 $ 777,200,492 $ 771,839,042 1.007
Page 10
(B) INACTIVE PLAN EXPERIENCE
The second portion of this section contains a summary of inactive plan experience, which examines the
following rates:
• Service Retirement Mortality Rates
• Beneficiary Mortality Rates
• Disability Mortality Rates
Page 11
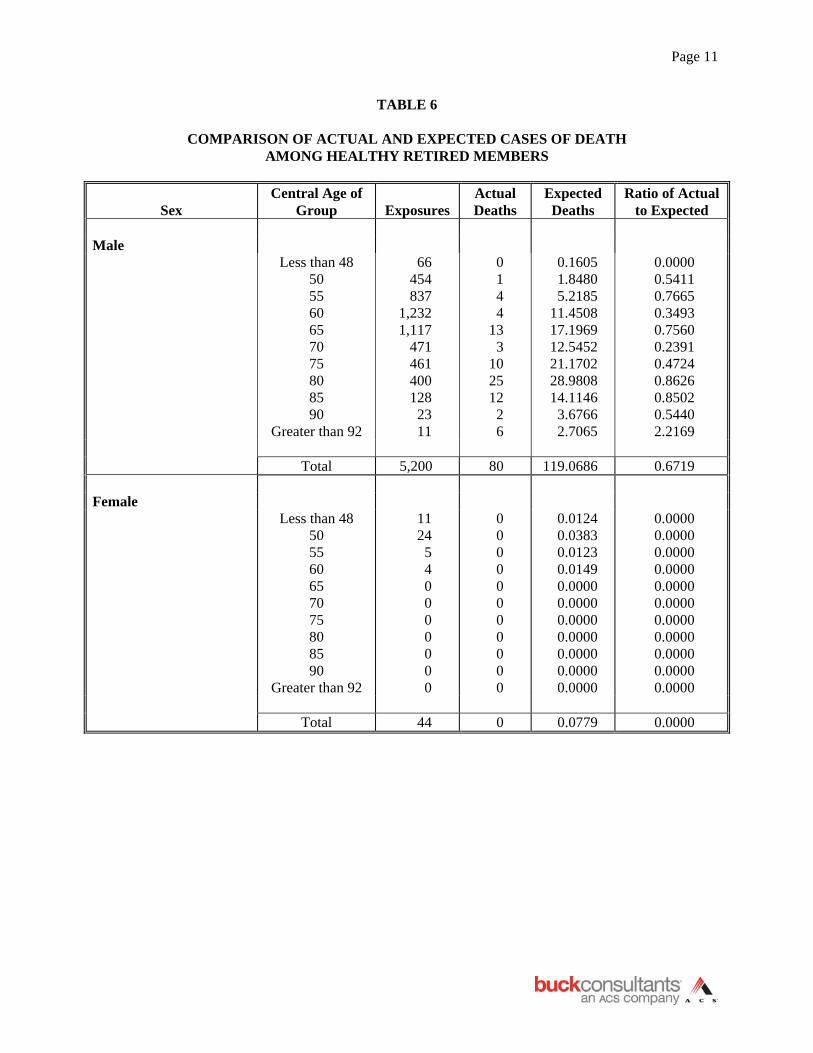
TABLE 6
COMPARISON OF ACTUAL AND EXPECTED CASES OF DEATH AMONG HEALTHY RETIRED MEMBERS
Sex Central Age of
Group
Exposures Actual Deaths
Expected Deaths
Ratio of Actual to Expected
Male Less than 48
50 55 60 65 70 75 80 85 90
Greater than 92
66 454 837
1,232 1,117
471 461 400 128
23 11
0 1 4 4
13 3
10 25 12
2 6
0.1605 1.8480 5.2185
11.4508 17.1969 12.5452 21.1702 28.9808 14.1146
3.6766 2.7065
0.0000 0.5411 0.7665 0.3493 0.7560 0.2391 0.4724 0.8626 0.8502 0.5440 2.2169
Total 5,200 80 119.0686 0.6719 Female Less than 48
50 55 60 65 70 75 80 85 90
Greater than 92
11 24
5 4 0 0 0 0 0 0 0
0 0 0 0 0 0 0 0 0 0 0
0.0124 0.0383 0.0123 0.0149 0.0000 0.0000 0.0000 0.0000 0.0000 0.0000 0.0000
0.0000 0.0000 0.0000 0.0000 0.0000 0.0000 0.0000 0.0000 0.0000 0.0000 0.0000
Total 44 0 0.0779 0.0000

Page 12
TABLE 7
COMPARISON OF ACTUAL AND EXPECTED CASES OF DEATH AMONG BENEFICIARIES OF DECEASED ACTIVE AND RETIRED MEMBERS
Sex
Central Age
of Group
Exposures
Actual Deaths
Expected Deaths
Ratio of Actual to Expected
Male Less than 48
50 55 60 65 70 75 80 85 90
Greater than 92
3 2 0 3 3 0 0 0 0 0 0
0 0 0 0 0 0 0 0 0 0 0
0.0011 0.0067 0.0000 0.0253 0.0419 0.0000 0.0000 0.0000 0.0000 0.0000 0.0000
0.0000 0.0000 0.0000 0.0000 0.0000 0.0000 0.0000 0.0000 0.0000 0.0000 0.0000
Total 11 0 0.0750 0.0000 Female Less than 48
50 55 60 65 70 75 80 85 90
Greater than 92
38 17 39 89
123 100 209 172 133
76 21
0 0 0 0 2 3 5 5
13 15
7
0.0264 0.0264 0.1027 0.3860 0.8816 1.2682 5.8577 8.7271
11.2505 9.9446 5.0199
0.0000 0.0000 0.0000 0.0000 2.2686 2.3656 0.8536 0.5729 1.1555 1.5084 1.3945
Total 1,017 50 43.4911 1.1497

Page 13
TABLE 8
COMPARISON OF ACTUAL AND EXPECTED CASES OF DEATH AMONG DISABLED MEMBERS
Central Age of Group
Exposures
Actual Deaths
Expected Deaths
Ratio of Actual to Expected
Less than 48
50 55 60 65 70 75 80 85 90
Greater than 92
301 74 51 55 82 19
5 22
0 0 0
0 2 0 3 2 0 0 2 0 0 0
1.4906 0.5173 0.4857 0.7603 1.6398 0.4992 0.2390 1.5055 0.0000 0.0000 0.0000
0.0000 3.8662 0.0000 3.9458 1.2197 0.0000 0.0000 1.3285 0.0000 0.0000 0.0000
Total 609 9 7.1374 1.2610
Page 14
COMMENTS AND GENERAL RECOMMENDATION OF ACTUARIES
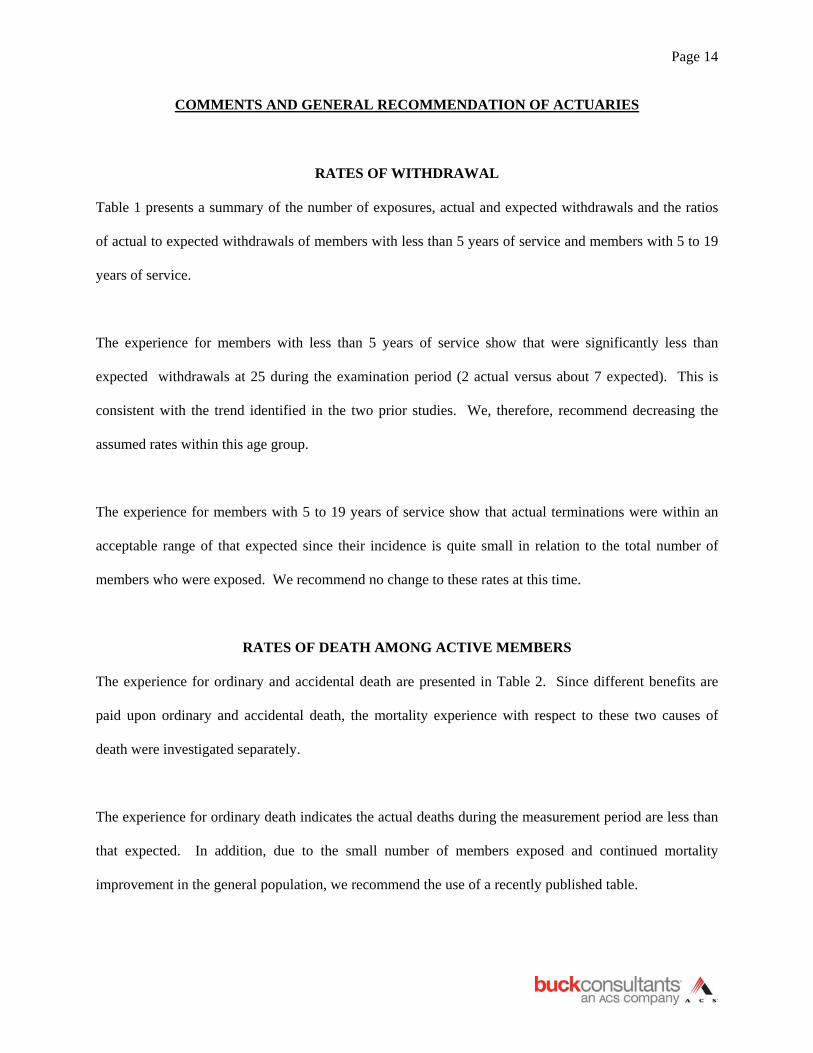
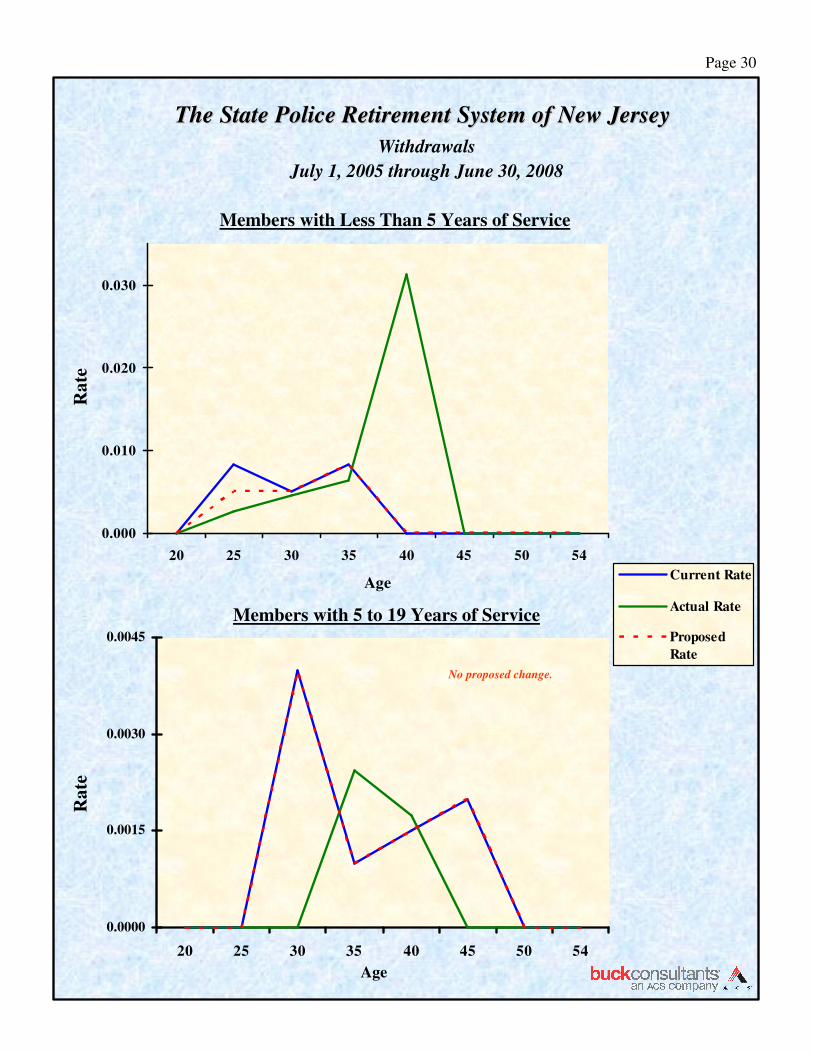
RATES OF WITHDRAWAL
Table 1 presents a summary of the number of exposures, actual and expected withdrawals and the ratios
of actual to expected withdrawals of members with less than 5 years of service and members with 5 to 19
years of service.
The experience for members with less than 5 years of service show that were significantly less than
expected withdrawals at 25 during the examination period (2 actual versus about 7 expected). This is
consistent with the trend identified in the two prior studies. We, therefore, recommend decreasing the
assumed rates within this age group.
The experience for members with 5 to 19 years of service show that actual terminations were within an
acceptable range of that expected since their incidence is quite small in relation to the total number of
members who were exposed. We recommend no change to these rates at this time.
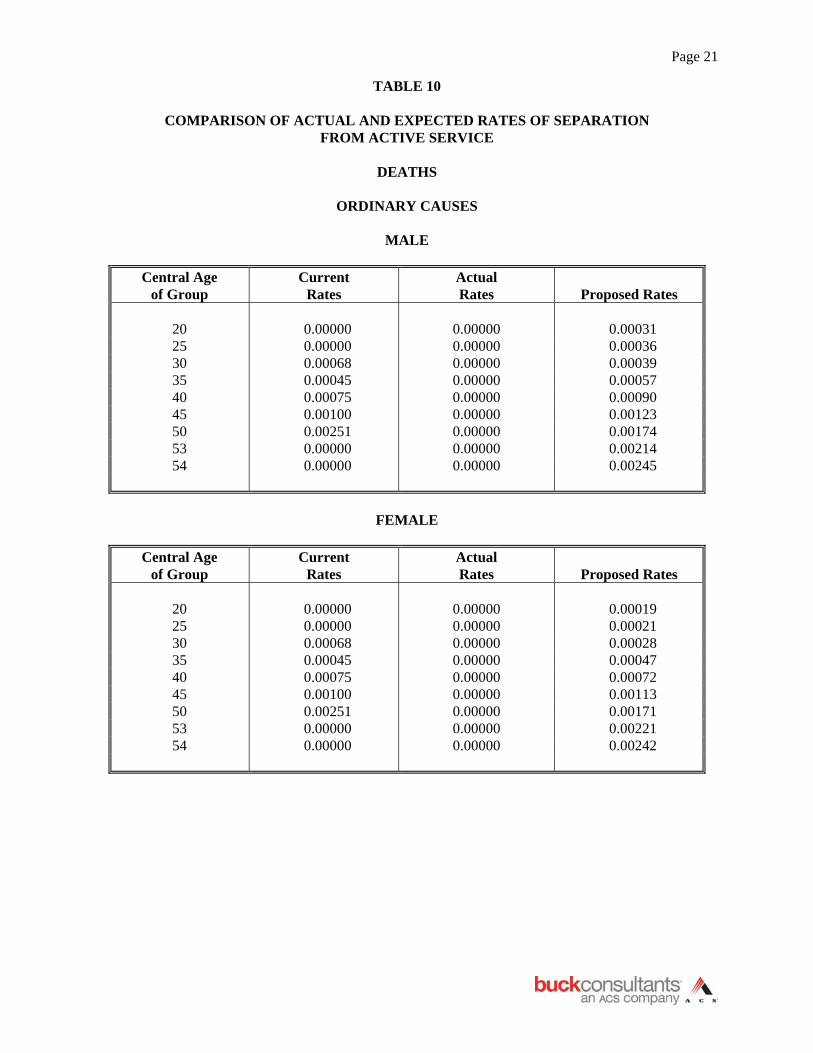
RATES OF DEATH AMONG ACTIVE MEMBERS
The experience for ordinary and accidental death are presented in Table 2. Since different benefits are
paid upon ordinary and accidental death, the mortality experience with respect to these two causes of
death were investigated separately.
The experience for ordinary death indicates the actual deaths during the measurement period are less than
that expected. In addition, due to the small number of members exposed and continued mortality
improvement in the general population, we recommend the use of a recently published table.
Page 15
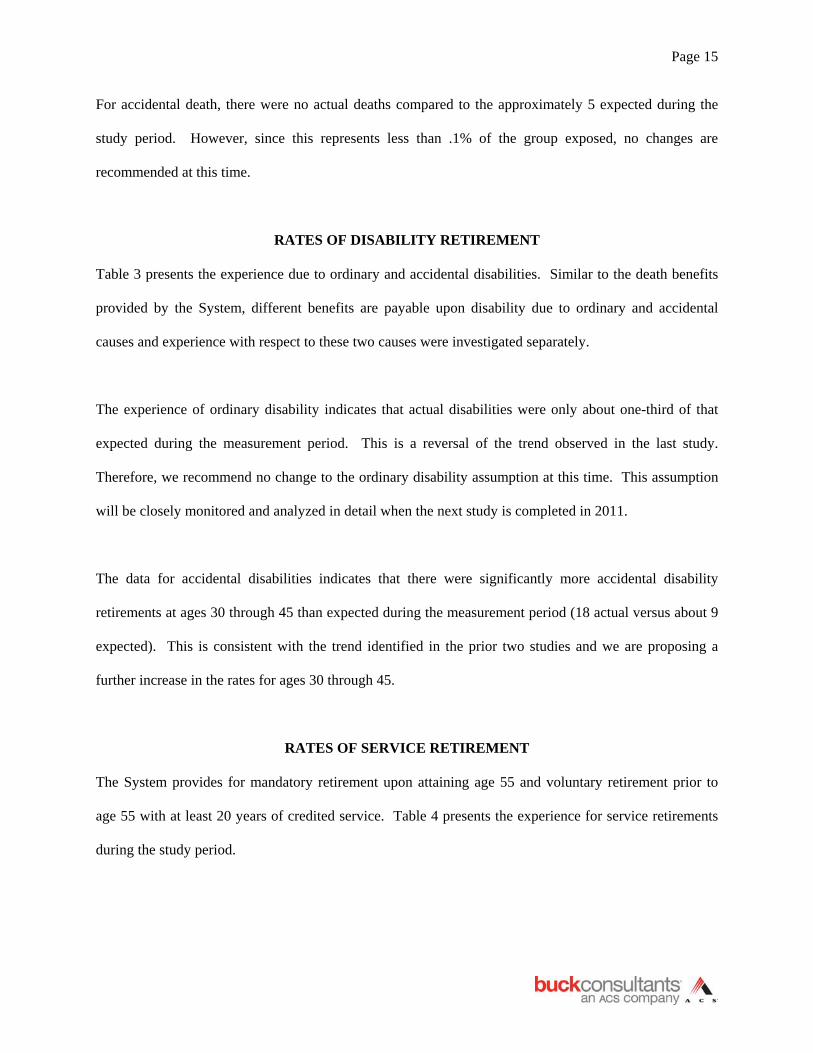
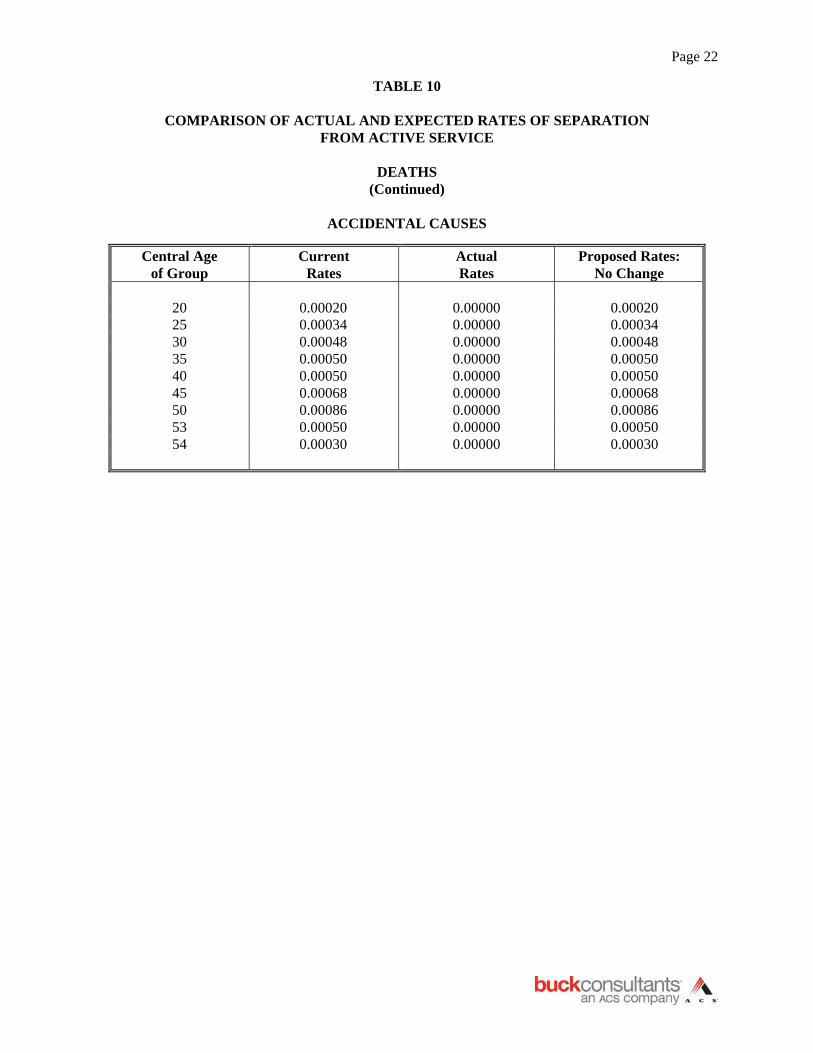
For accidental death, there were no actual deaths compared to the approximately 5 expected during the
study period. However, since this represents less than .1% of the group exposed, no changes are
recommended at this time.
RATES OF DISABILITY RETIREMENT
Table 3 presents the experience due to ordinary and accidental disabilities. Similar to the death benefits
provided by the System, different benefits are payable upon disability due to ordinary and accidental
causes and experience with respect to these two causes were investigated separately.
The experience of ordinary disability indicates that actual disabilities were only about one-third of that
expected during the measurement period. This is a reversal of the trend observed in the last study.
Therefore, we recommend no change to the ordinary disability assumption at this time. This assumption
will be closely monitored and analyzed in detail when the next study is completed in 2011.
The data for accidental disabilities indicates that there were significantly more accidental disability
retirements at ages 30 through 45 than expected during the measurement period (18 actual versus about 9
expected). This is consistent with the trend identified in the prior two studies and we are proposing a
further increase in the rates for ages 30 through 45.
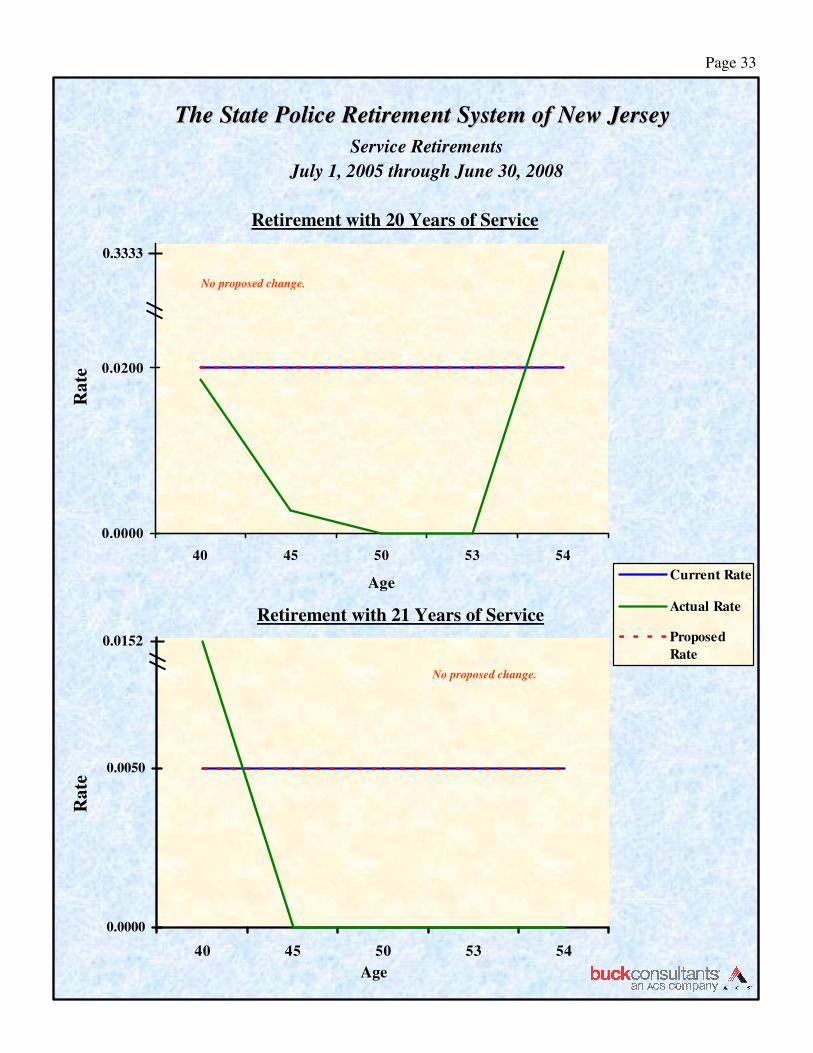
RATES OF SERVICE RETIREMENT
The System provides for mandatory retirement upon attaining age 55 and voluntary retirement prior to
age 55 with at least 20 years of credited service. Table 4 presents the experience for service retirements
during the study period.

Page 16
With regard to retirements with 20 years of service, there were 6 actual retirements compared to
approximately 13 expected retirements. This is within an acceptable range and we recommend no
changes to these rates at this time.
The results of the study show that there was 1 actual retirement among members with 21 years of service
compared to about 2 expected retirements. This is within an acceptable range and we recommend no
changes to the assumption.
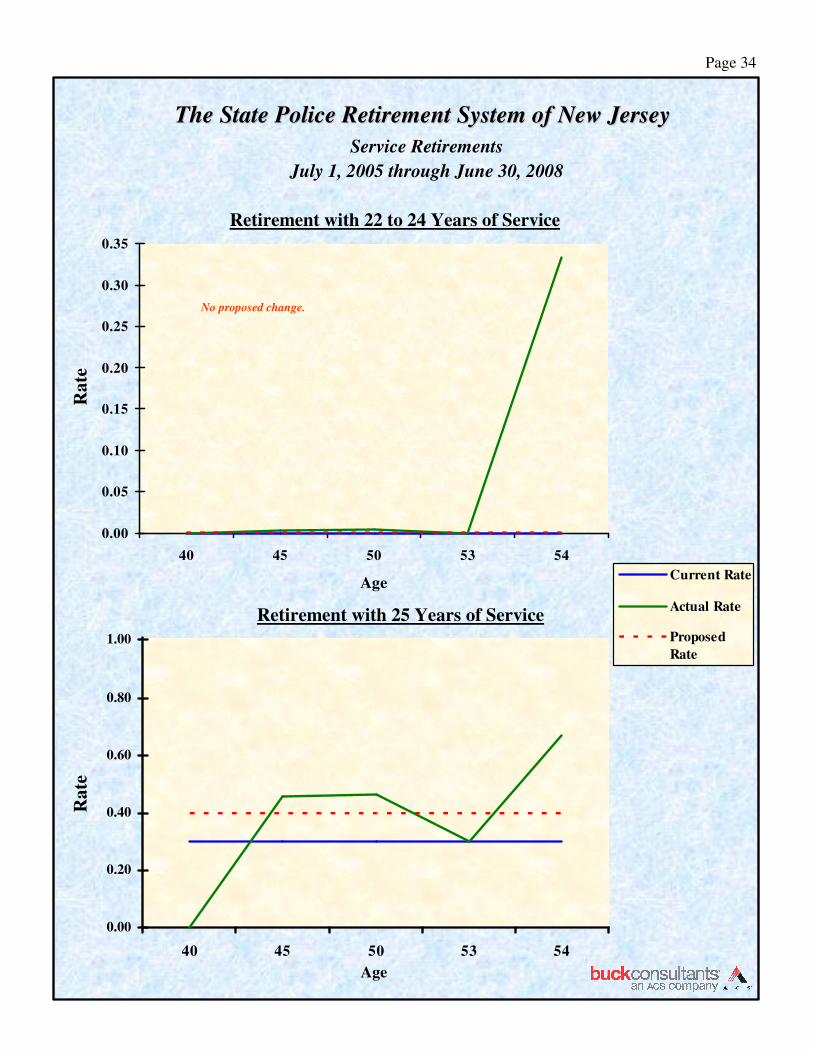
Although no retirements were assumed for members with 22 to 24 years of service, there were 4 actual
retirements during the measurement period. Since this represents less than 1% of the exposed population,
we recommend the continued use of the current rates.
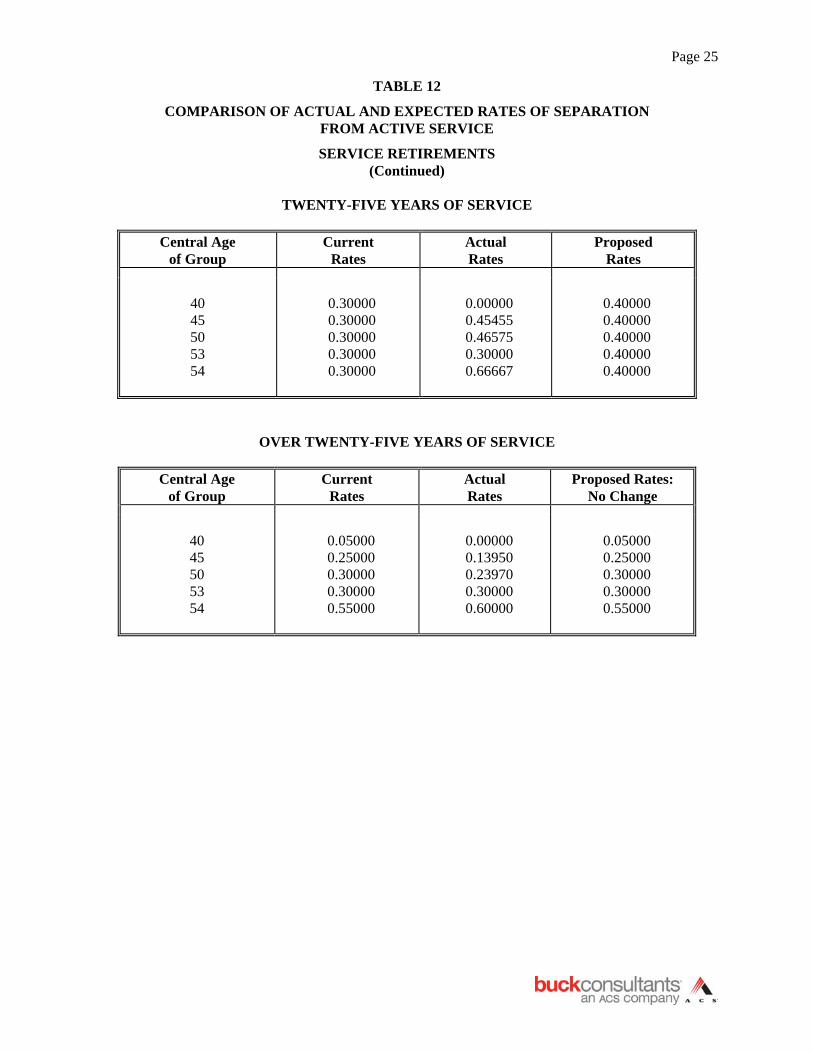
The results of the study show that actual retirements among members with 25 years of service were about
154% of those expected. This continues a trend first observed in the prior study. Due to the continued
high incidence of retirement, we recommend a further increase in these retirement rates.
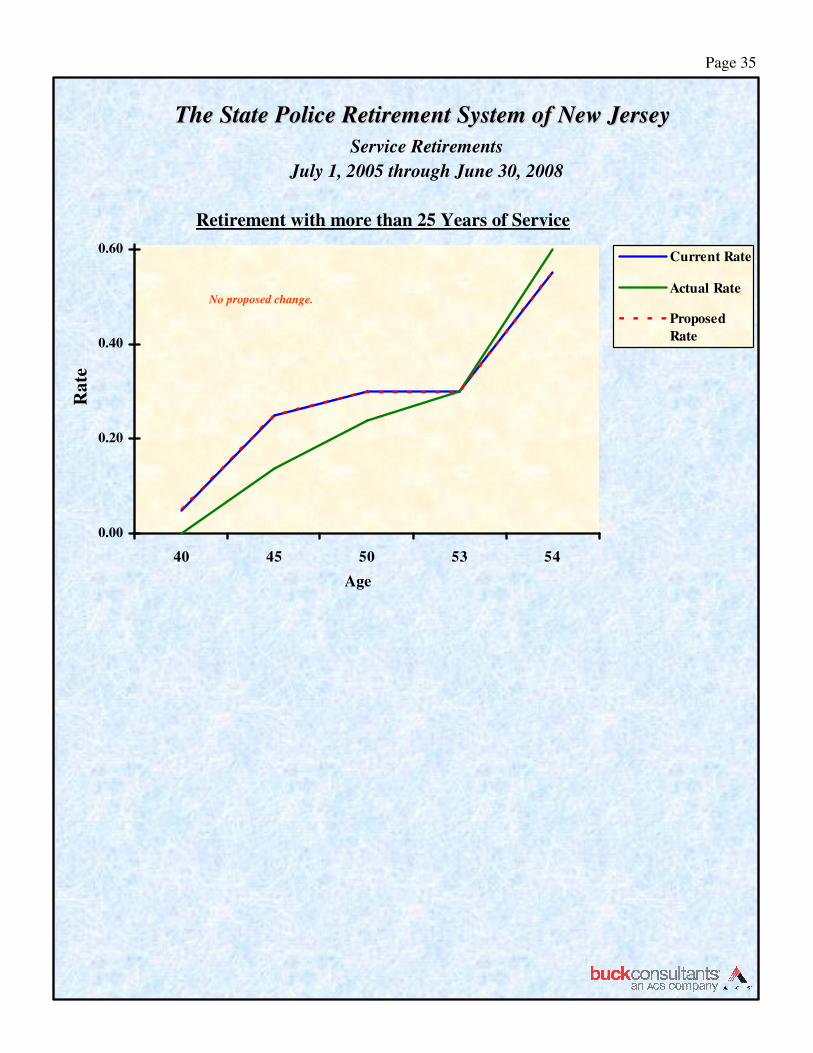
For retirements among members with more than 25 years of service, actual retirements were about 84% of
those expected, reversing the trend of the prior two studies. Since there is no clear pattern at this time, we
recommend no change to the assumption. We will continue to carefully monitor the experience in this
assumption and determine whether changes are warranted during the next experience study in 2011.
RATES OF SALARY INCREASE
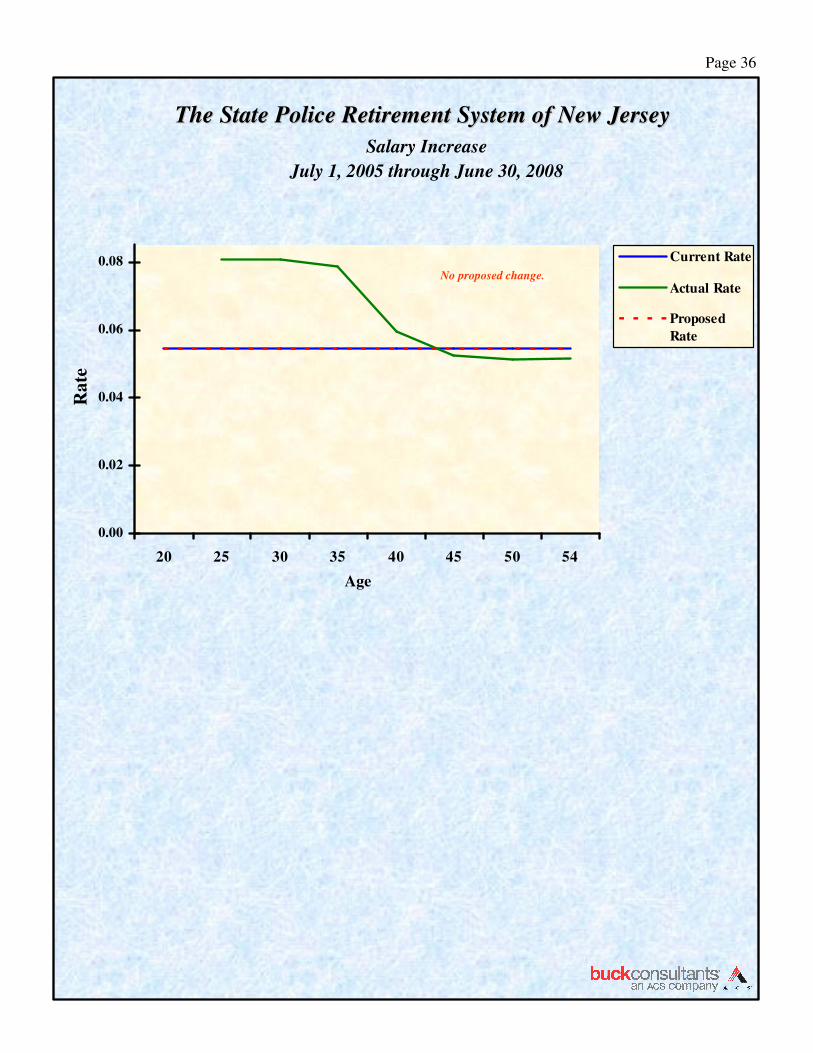
Table 5 shows that the overall actual salary experience is 0.7% greater than that expected, which is within
acceptable limits. Therefore, we recommend no changes to the current salary increase assumption of
5.45% per year.
Page 17
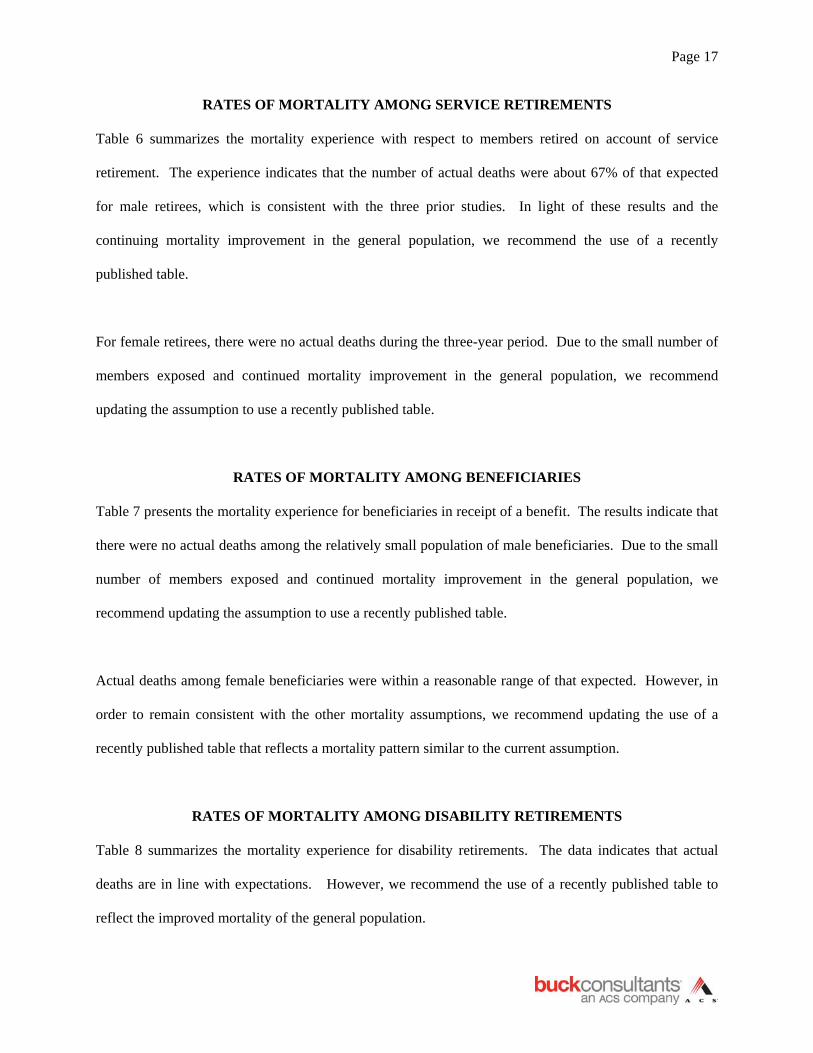
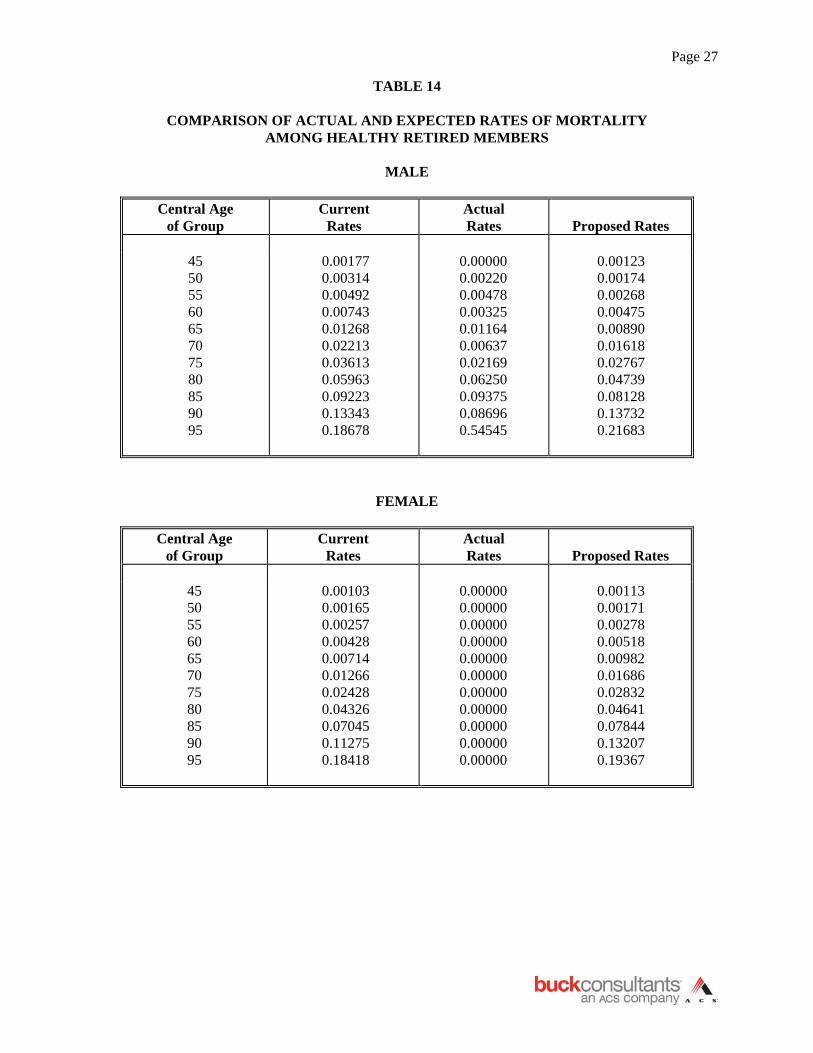
RATES OF MORTALITY AMONG SERVICE RETIREMENTS
Table 6 summarizes the mortality experience with respect to members retired on account of service
retirement. The experience indicates that the number of actual deaths were about 67% of that expected
for male retirees, which is consistent with the three prior studies. In light of these results and the
continuing mortality improvement in the general population, we recommend the use of a recently
published table.
For female retirees, there were no actual deaths during the three-year period. Due to the small number of
members exposed and continued mortality improvement in the general population, we recommend
updating the assumption to use a recently published table.
RATES OF MORTALITY AMONG BENEFICIARIES
Table 7 presents the mortality experience for beneficiaries in receipt of a benefit. The results indicate that
there were no actual deaths among the relatively small population of male beneficiaries. Due to the small
number of members exposed and continued mortality improvement in the general population, we
recommend updating the assumption to use a recently published table.
Actual deaths among female beneficiaries were within a reasonable range of that expected. However, in
order to remain consistent with the other mortality assumptions, we recommend updating the use of a
recently published table that reflects a mortality pattern similar to the current assumption.
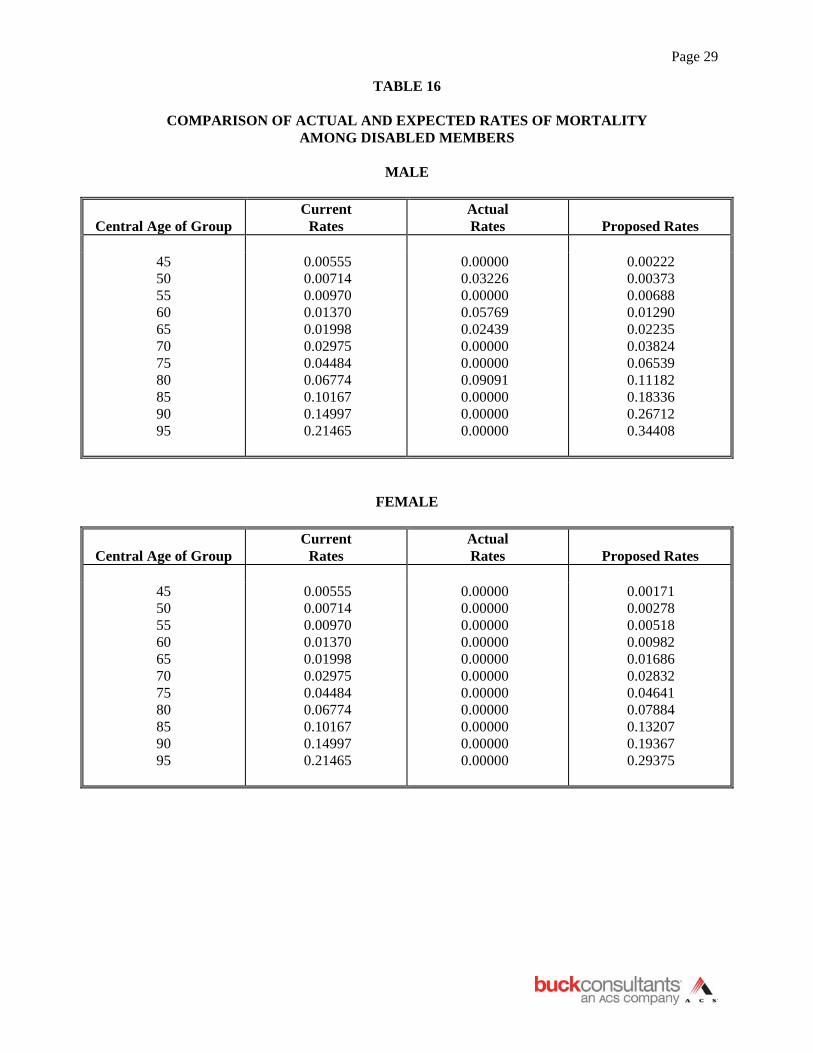
RATES OF MORTALITY AMONG DISABILITY RETIREMENTS
Table 8 summarizes the mortality experience for disability retirements. The data indicates that actual
deaths are in line with expectations. However, we recommend the use of a recently published table to
reflect the improved mortality of the general population.
Page 18
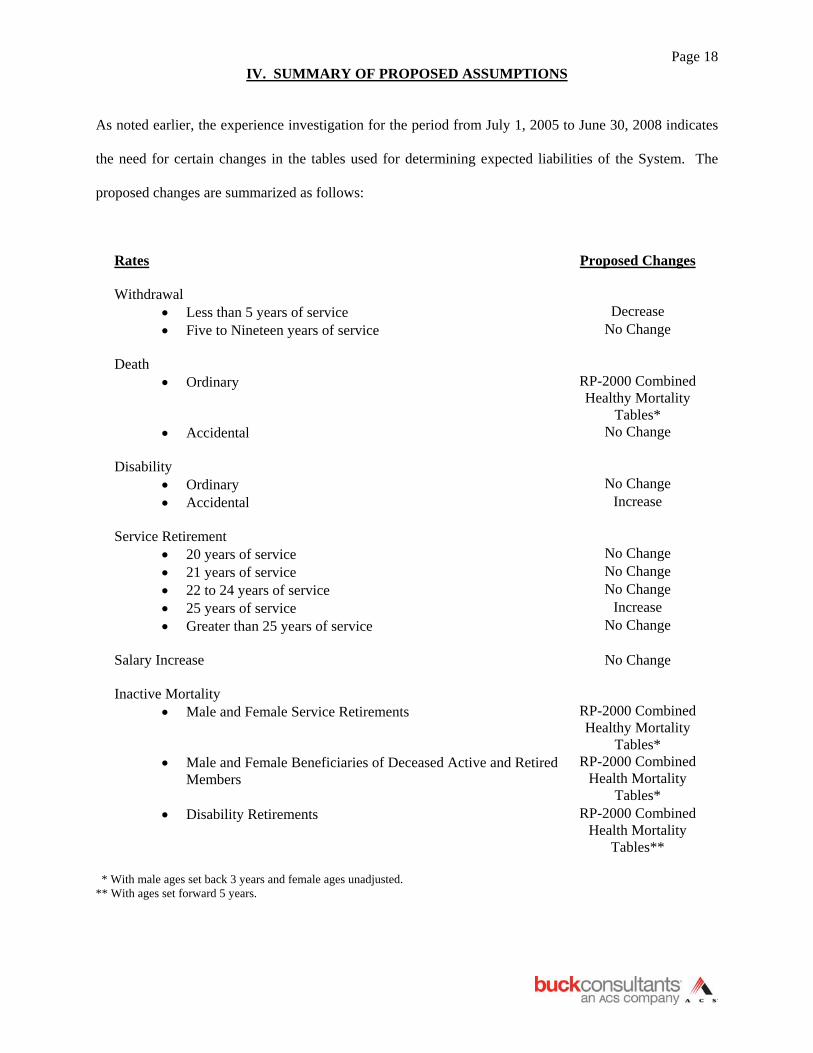
IV. SUMMARY OF PROPOSED ASSUMPTIONS As noted earlier, the experience investigation for the period from July 1, 2005 to June 30, 2008 indicates
the need for certain changes in the tables used for determining expected liabilities of the System. The
proposed changes are summarized as follows:
Rates Proposed Changes Withdrawal
• Less than 5 years of service Decrease • Five to Nineteen years of service No Change
Death
• Ordinary RP-2000 Combined Healthy Mortality
Tables* • Accidental No Change
Disability
• Ordinary No Change • Accidental Increase
Service Retirement
• 20 years of service No Change • 21 years of service No Change • 22 to 24 years of service No Change • 25 years of service Increase • Greater than 25 years of service No Change
Salary Increase No Change Inactive Mortality
• Male and Female Service Retirements RP-2000 Combined Healthy Mortality
Tables* • Male and Female Beneficiaries of Deceased Active and Retired
Members
RP-2000 Combined Health Mortality
Tables* • Disability Retirements RP-2000 Combined
Health Mortality Tables**
* With male ages set back 3 years and female ages unadjusted.
** With ages set forward 5 years.

Page 19
The following tables give a comparison of the present, actual and proposed rates of separation from active
service and rates of mortality for retired members at quinquennial ages.
In addition, we have prepared graphs that illustrate the actual, current and proposed (if applicable) rates
for each assumption. Please note that the experience for certain assumptions, such as accidental death,
which has a large population and a rather small incidence, does not graph well because of the relative size
of the numbers.

Page 20
TABLE 9
COMPARISON OF ACTUAL AND EXPECTED RATES OF SEPARATION FROM ACTIVE SERVICE
WITHDRAWALS
LESS THAN FIVE YEARS OF SERVICE
Central Age of Group
Current Rates
Actual Rates
Proposed Rates
20 0.00000 0.00000 0.00000 25 0.00825 0.00257 0.00500 30 0.00500 0.00456 0.00500 35 0.00825 0.00631 0.00825 40 0.00000 0.03125 0.00000 45 0.00000 0.00000 0.00000 50 0.00000 0.00000 0.00000 53 0.00000 0.00000 0.00000 54 0.00000 0.00000 0.00000
FIVE TO NINETEEN YEARS OF SERVICE
Central Age of Group
Current Rates
Actual Rates
Proposed Rates: No Change
20 0.00000 0.00000 0.00000 25 0.00000 0.00000 0.00000 30 0.00400 0.00000 0.00400 35 0.00100 0.00244 0.00100 40 0.00150 0.00175 0.00150 45 0.00200 0.00000 0.00200 50 0.00000 0.00000 0.00000 53 0.00000 0.00000 0.00000 54 0.00000 0.00000 0.00000
Page 21
TABLE 10
COMPARISON OF ACTUAL AND EXPECTED RATES OF SEPARATION FROM ACTIVE SERVICE
DEATHS
ORDINARY CAUSES
MALE
Central Age
of Group Current
Rates Actual Rates
Proposed Rates
20 0.00000 0.00000 0.00031 25 0.00000 0.00000 0.00036 30 0.00068 0.00000 0.00039 35 0.00045 0.00000 0.00057 40 0.00075 0.00000 0.00090 45 0.00100 0.00000 0.00123 50 0.00251 0.00000 0.00174 53 0.00000 0.00000 0.00214 54 0.00000 0.00000 0.00245
FEMALE
Central Age of Group
Current Rates
Actual Rates
Proposed Rates
20 0.00000 0.00000 0.00019 25 0.00000 0.00000 0.00021 30 0.00068 0.00000 0.00028 35 0.00045 0.00000 0.00047 40 0.00075 0.00000 0.00072 45 0.00100 0.00000 0.00113 50 0.00251 0.00000 0.00171 53 0.00000 0.00000 0.00221 54 0.00000 0.00000 0.00242
Page 22
TABLE 10
COMPARISON OF ACTUAL AND EXPECTED RATES OF SEPARATION FROM ACTIVE SERVICE
DEATHS
(Continued)
ACCIDENTAL CAUSES
Central Age of Group
Current Rates
Actual Rates
Proposed Rates: No Change
20 0.00020 0.00000 0.00020 25 0.00034 0.00000 0.00034 30 0.00048 0.00000 0.00048 35 0.00050 0.00000 0.00050 40 0.00050 0.00000 0.00050 45 0.00068 0.00000 0.00068 50 0.00086 0.00000 0.00086 53 0.00050 0.00000 0.00050 54 0.00030 0.00000 0.00030

Page 23
TABLE 11
COMPARISON OF ACTUAL AND EXPECTED RATES OF SEPARATION FROM ACTIVE SERVICE
DISABILITY RETIREMENTS
ORDINARY CAUSES
Central Age
of Group Current
Rates Actual Rates
Proposed Rates: No Change
20 25 30 35 40 45 50 53 54
0.00042 0.00057 0.00084
0.00214 0.00245 0.00318 0.00539 0.00672 0.00722
0.00000 0.00000 0.00000 0.00074 0.00049 0.00111 0.00365 0.00000 0.00000
0.00042 0.00057 0.00084
0.00214 0.00245 0.00318 0.00539 0.00672 0.00722
ACCIDENTAL CAUSES
Central Age of Group
Current Rates
Actual Rates
Proposed Rates
20 25 30 35 40 45 50 53 54
0.00017 0.00023 0.00034 0.00129 0.00160 0.00171 0.00220 0.00275 0.00295
0.00000 0.00123 0.00138 0.00452 0.00243 0.00211 0.00000 0.00000 0.00000
0.00016 0.00023 0.00051 0.00194 0.00207 0.00214 0.00220 0.00275 0.00295

Page 24
TABLE 12
COMPARISON OF ACTUAL AND EXPECTED RATES OF SEPARATION FROM ACTIVE SERVICE
SERVICE RETIREMENTS
TWENTY YEARS OF SERVICE
Central Age of
Group Current
Rates Actual Rates
Proposed Rates: No Change
40 45 50 53 54
0.02000 0.02000 0.02000 0.02000 0.02000
0.01852 0.00271 0.00000 0.00000 0.33333
0.02000 0.02000 0.02000 0.02000 0.02000
TWENTY-ONE YEARS OF SERVICE
Central Age of Group
Current Rates
Actual Rates
Proposed Rates: No Change
40 45 50 53 54
0.00500 0.00500 0.00500 0.00500 0.00500
0.01515 0.00000 0.00000 0.00000 0.00000
0.00500 0.00500 0.00500 0.00500 0.00500
TWENTY-TWO TO TWENTY-FOUR YEARS OF SERVICE
Central Age of Group
Current Rates
Actual Rates
Proposed Rates: No Change
40 45 50 53 54
0.0000 0.0000 0.0000 0.0000 0.0000
0.00000 0.00238 0.00391 0.00000 0.33333
0.00000 0.00000 0.00000 0.00000 0.00000
Page 25
TABLE 12
COMPARISON OF ACTUAL AND EXPECTED RATES OF SEPARATION FROM ACTIVE SERVICE
SERVICE RETIREMENTS (Continued)
TWENTY-FIVE YEARS OF SERVICE
Central Age
of Group Current
Rates Actual Rates
Proposed Rates
40 45 50 53 54
0.30000 0.30000 0.30000 0.30000 0.30000
0.00000 0.45455 0.46575 0.30000 0.66667
0.40000 0.40000 0.40000 0.40000 0.40000
OVER TWENTY-FIVE YEARS OF SERVICE
Central Age of Group
Current Rates
Actual Rates
Proposed Rates: No Change
40 45 50 53 54
0.05000 0.25000 0.30000 0.30000 0.55000
0.00000 0.13950 0.23970 0.30000 0.60000
0.05000 0.25000 0.30000 0.30000 0.55000

Page 26
TABLE 13
COMPARISON OF ACTUAL AND EXPECTED SALARY INCREASES
Central Age of Group
Current Rates
Actual Rates
Proposed Rates: No Change
25 5.45% 8.05% 5.45% 30 5.45% 8.04% 5.45% 35 5.45% 7.85% 5.45% 40 5.45% 5.97% 5.45% 45 5.45% 5.24% 5.45% 50 5.45% 5.13% 5.45%
Greater than 52 5.45% 5.16% 5.45%
Page 27
TABLE 14
COMPARISON OF ACTUAL AND EXPECTED RATES OF MORTALITY AMONG HEALTHY RETIRED MEMBERS
MALE
Central Age
of Group Current
Rates Actual Rates
Proposed Rates
45 50 55 60 65 70 75 80 85 90 95
0.00177 0.00314 0.00492 0.00743 0.01268 0.02213 0.03613 0.05963 0.09223 0.13343 0.18678
0.00000 0.00220 0.00478 0.00325 0.01164 0.00637 0.02169 0.06250 0.09375 0.08696 0.54545
0.00123 0.00174 0.00268 0.00475 0.00890 0.01618 0.02767 0.04739 0.08128 0.13732 0.21683
FEMALE
Central Age of Group
Current Rates
Actual Rates
Proposed Rates
45 50 55 60 65 70 75 80 85 90 95
0.00103 0.00165 0.00257 0.00428 0.00714 0.01266 0.02428 0.04326 0.07045 0.11275 0.18418
0.00000 0.00000 0.00000 0.00000 0.00000 0.00000 0.00000 0.00000 0.00000 0.00000 0.00000
0.00113 0.00171 0.00278 0.00518 0.00982 0.01686 0.02832 0.04641 0.07844 0.13207 0.19367

Page 28
TABLE 15
COMPARISON OF ACTUAL AND EXPECTED RATES OF MORTALITY AMONG BENEFICIARIES OF DECEASED ACTIVE AND RETIRED MEMBERS
MALE
Central Age of Group
Current Rates
Actual Rates
Proposed Rates
45 50 55 60 65 70 75 80 85 90 95
0.00222 0.00393 0.00615 0.00929 0.01585 0.02766 0.04516 0.07454 0.11529 0.16678 0.23348
0.00000 0.00000 0.00000 0.00000 0.00000 0.00000 0.00000 0.00000 0.00000 0.00000 0.00000
0.00123 0.00174 0.00268 0.00475 0.00890 0.01618 0.02767 0.04739 0.08128 0.13732 0.21683
FEMALE
Central Age of Group
Current Rates
Actual Rates
Proposed Rates
45 50 55 60 65 70 75 80 85 90 95
0.00103 0.00165 0.00257 0.00428 0.00714 0.01266 0.02755 0.05191 0.08453 0.13530 0.22102
0.00000 0.00000 0.00000 0.00000 0.01626 0.03000 0.02392 0.02907 0.09774 0.19737 0.33333
0.00113 0.00171 0.00278 0.00518 0.00982 0.01686 0.02832 0.04641 0.07844 0.13207 0.19367
Page 29
TABLE 16
COMPARISON OF ACTUAL AND EXPECTED RATES OF MORTALITY AMONG DISABLED MEMBERS
MALE
Central Age of Group Current
Rates Actual Rates
Proposed Rates
45 50 55 60 65 70 75 80 85 90 95
0.00555 0.00714 0.00970 0.01370 0.01998 0.02975 0.04484 0.06774 0.10167 0.14997 0.21465
0.00000 0.03226 0.00000 0.05769 0.02439 0.00000 0.00000 0.09091 0.00000 0.00000 0.00000
0.00222 0.00373 0.00688 0.01290 0.02235 0.03824 0.06539 0.11182 0.18336 0.26712 0.34408
FEMALE
Central Age of Group
Current Rates
Actual Rates
Proposed Rates
45 50 55 60 65 70 75 80 85 90 95
0.00555 0.00714 0.00970 0.01370 0.01998 0.02975 0.04484 0.06774 0.10167 0.14997 0.21465
0.00000 0.00000 0.00000 0.00000 0.00000 0.00000 0.00000 0.00000 0.00000 0.00000 0.00000
0.00171 0.00278 0.00518 0.00982 0.01686 0.02832 0.04641 0.07884 0.13207 0.19367 0.29375
0.0000
0.0015
0.0030
0.0045
20 25 30 35 40 45 50 54
Current Rate
Actual Rate
Proposed
Rate
The State Police Retirement System of New JerseyThe State Police Retirement System of New Jersey
Withdrawals
July 1, 2005 through June 30, 2008
Page 30
0.000
0.010
0.020
0.030
20 25 30 35 40 45 50 54
Age
Age
Members with 5 to 19 Years of Service
Ra
teR
ate
Members with Less Than 5 Years of Service
No proposed change.

0.00000
0.00045
0.00090
20 25 30 35 40 45 50 54
Current Rate
Actual Rate
Proposed
Rate
The State Police Retirement System of New JerseyThe State Police Retirement System of New Jersey
Death Among Active Members
July 1, 2005 through June 30, 2008
Page 31
0.0000
0.0009
0.0018
0.0027
20 25 30 35 40 45 50 54
Age
Current Rate
Actual Rate
Proposed Rate -
Males
Proposed Rate -
Females
Age
Accidental Death
Ra
teR
ate
Ordinary Death
No proposed change.
Males.
Females
.

0.0000
0.0023
0.0045
20 25 30 35 40 45 50 54
Current Rate
Actual Rate
Proposed
Rate
The State Police Retirement System of New JerseyThe State Police Retirement System of New Jersey
Disability Among Active Members
July 1, 2005 through June 30, 2008
Page 32
0.0000
0.0037
0.0074
20 25 30 35 40 45 50 54
Age
Age
Accidental Disability
Ra
teR
ate
Ordinary Disability
No proposed change.
0.0000
0.0050
40 45 50 53 54
Current Rate
Actual Rate
Proposed
Rate
The State Police Retirement System of New JerseyThe State Police Retirement System of New Jersey
Service Retirements
July 1, 2005 through June 30, 2008
Page 33
0.0000
0.0200
40 45 50 53 54
Age
Age
Retirement with 21 Years of Service
Ra
teR
ate
Retirement with 20 Years of Service
0.3333
0.0152
No proposed change.
No proposed change.
0.00
0.20
0.40
0.60
0.80
1.00
40 45 50 53 54
Current Rate
Actual Rate
Proposed
Rate
The State Police Retirement System of New JerseyThe State Police Retirement System of New Jersey
Service Retirements
July 1, 2005 through June 30, 2008
Page 34
0.00
0.05
0.10
0.15
0.20
0.25
0.30
0.35
40 45 50 53 54
Age
Age
Retirement with 25 Years of Service
Ra
teR
ate
Retirement with 22 to 24 Years of Service
No proposed change.
0.00
0.20
0.40
0.60
40 45 50 53 54
Current Rate
Actual Rate
Proposed
Rate
The State Police Retirement System of New JerseyThe State Police Retirement System of New Jersey
Service Retirements
July 1, 2005 through June 30, 2008
Page 35
Age
Ra
te
Retirement with more than 25 Years of Service
No proposed change.
0.00
0.02
0.04
0.06
0.08
20 25 30 35 40 45 50 54
Current Rate
Actual Rate
Proposed
Rate
The State Police Retirement System of New JerseyThe State Police Retirement System of New Jersey
Salary Increase
July 1, 2005 through June 30, 2008
Page 36
Age
Ra
te
No proposed change.

0.00
0.04
0.08
0.12
0.16
0.20
45 50 55 60 65 70 75 80 85 90 95
Current Rate
Actual Rate
Proposed
Rate
Page 37
0.00
0.05
0.10
0.15
0.20
0.25
0.30
45 50 55 60 65 70 75 80 85 90 95
Age
Age
Service Retirement Mortality - Female
Ra
teR
ate
The State Police Retirement System of New JerseyThe State Police Retirement System of New Jersey
Post Retirement Mortality
July 1, 2005 through June 30, 2008
Service Retirement Mortality - Male0.55

0.00
0.06
0.12
0.18
0.24
0.30
45 50 55 60 65 70 75 80 85 90 95
Current Rate
Actual Rate
Proposed
Rate
Page 38
0.00
0.05
0.10
0.15
0.20
0.25
45 50 55 60 65 70 75 80 85 90 95
Age
Age
Beneficiaries - Female
Ra
teR
ate
The State Police Retirement System of New JerseyThe State Police Retirement System of New Jersey
Post Retirement Mortality
July 1, 2005 through June 30, 2008
Beneficiaries - Male

The State Police Retirement System of New JerseyThe State Police Retirement System of New JerseyPost Retirement Mortality
July 1, 2005 through June 30, 2008
Disability
Page 39
0.00
0.10
0.20
0.30
0.40
0.50
45 50 55 60 65 70 75 80 85 90 95
Age
Current Rate
Actual Rate
Proposed Rate
- Males
Proposed Rate
- Females
Ra
te
Males.
Females

Page 40
III. COST IMPACT OF THE PROPOSED ASSUMPTIONS
The overall effect of the proposed changes in assumptions would be an increase in the accrued liability of
the System of $74,989,447 and an increase in the total contribution of the System of $6,625,499. This
increase is the net result of the proposed decrease in withdrawals prior to five years of service, increase in
the Accidental Disability and Service Retirement rates, coupled with the proposed longer life expectancy
rates for the retirees and deaths while in active service. The following chart presents a summary of the
liabilities and contributions under the current and proposed assumptions as of July 1, 2008:
Current Proposed
Actuarial Accrued Liability $ 2,609,164,869 $ 2,684,154,316 Additional Accrued Liability $ 74,989,447 Unfunded Accrued Liability/(Surplus) $ 473,158,360 $ 548,147,807 Required Contribution:
• Normal Cost $ 53,727,942 $ 55,795,818 • Accrued Liability 28,757,070 33,314,693 • Total Contribution $ 82,485,012 $ 89,110,511
Additional Annual Contribution $ 6,625,499
The calculations were based on the same data and actuarial methods, including an 8.25% interest rate, as
were used in the July 1, 2008 valuation.
Page 41
VI. COMPLETE SET OF PROPOSED ASSUMPTIONS

Page 42
TABLE 1
ACTIVE WITHDRAWAL TABLES
RATES OF WITHDRAWALLess than 5 5 to 19
AGE Years of Service Years of Service
20 0.00000 0.0000021 0.00000 0.0000022 0.00000 0.0000023 0.00500 0.0000024 0.00500 0.0000025 0.00500 0.0000026 0.00500 0.0000027 0.00500 0.0000028 0.00500 0.0040029 0.00500 0.0040030 0.00500 0.0040031 0.00500 0.0040032 0.00500 0.0040033 0.00825 0.0010034 0.00825 0.0010035 0.00825 0.0010036 0.00825 0.0010037 0.00825 0.0010038 0.00000 0.0015039 0.00000 0.0015040 0.00000 0.0015041 0.00000 0.0015042 0.00000 0.0015043 0.00000 0.0020044 0.00000 0.0020045 0.00000 0.0020046 0.00000 0.0020047 0.00000 0.0020048 0.00000 0.0000049 0.00000 0.0000050 0.00000 0.0000051 0.00000 0.0000052 0.00000 0.0000053 0.00000 0.0000054 0.00000 0.00000
Page 43
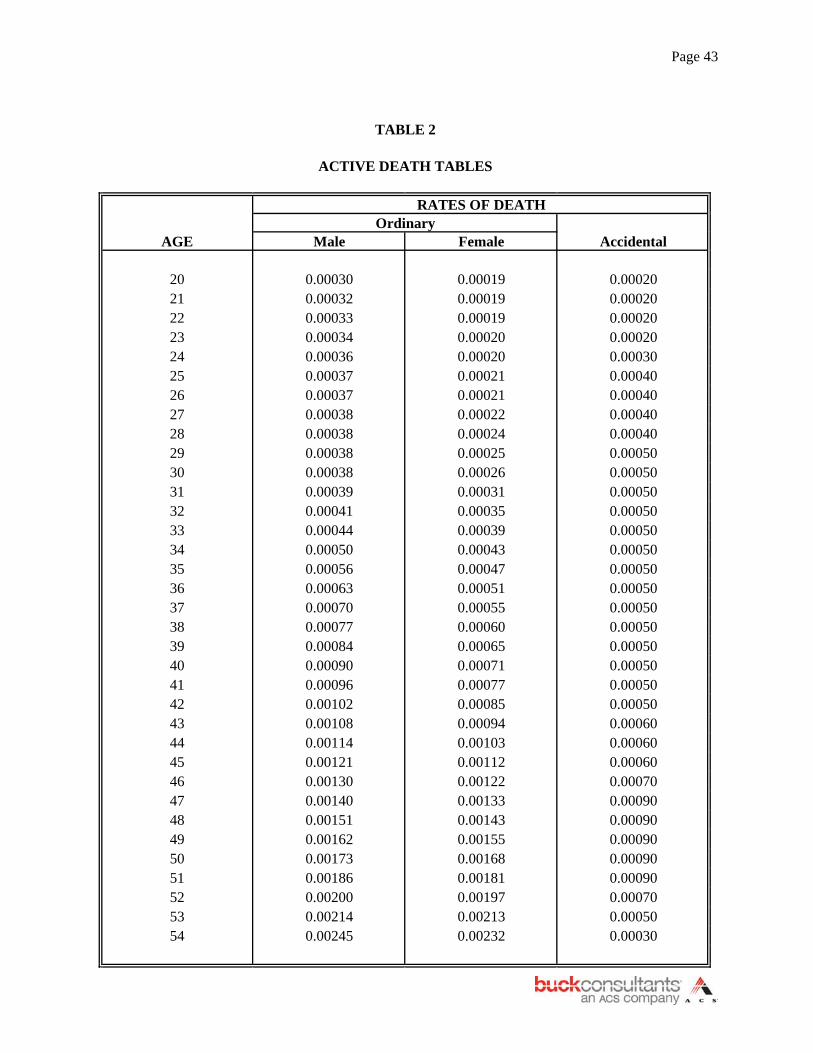
TABLE 2
ACTIVE DEATH TABLES
RATES OF DEATHOrdinary
AGE Male Female Accidental
20 0.00030 0.00019 0.0002021 0.00032 0.00019 0.0002022 0.00033 0.00019 0.0002023 0.00034 0.00020 0.0002024 0.00036 0.00020 0.0003025 0.00037 0.00021 0.0004026 0.00037 0.00021 0.0004027 0.00038 0.00022 0.0004028 0.00038 0.00024 0.0004029 0.00038 0.00025 0.0005030 0.00038 0.00026 0.0005031 0.00039 0.00031 0.0005032 0.00041 0.00035 0.0005033 0.00044 0.00039 0.0005034 0.00050 0.00043 0.0005035 0.00056 0.00047 0.0005036 0.00063 0.00051 0.0005037 0.00070 0.00055 0.0005038 0.00077 0.00060 0.0005039 0.00084 0.00065 0.0005040 0.00090 0.00071 0.0005041 0.00096 0.00077 0.0005042 0.00102 0.00085 0.0005043 0.00108 0.00094 0.0006044 0.00114 0.00103 0.0006045 0.00121 0.00112 0.0006046 0.00130 0.00122 0.0007047 0.00140 0.00133 0.0009048 0.00151 0.00143 0.0009049 0.00162 0.00155 0.0009050 0.00173 0.00168 0.0009051 0.00186 0.00181 0.0009052 0.00200 0.00197 0.0007053 0.00214 0.00213 0.0005054 0.00245 0.00232 0.00030

Page 44
TABLE 3
ACTIVE DISABILITY TABLES
RATES OF DISABILITYAGE Ordinary Accidental
20 0.00039 0.0001521 0.00039 0.0001522 0.00050 0.0002023 0.00050 0.0002024 0.00050 0.0002025 0.00059 0.0002526 0.00059 0.0002527 0.00069 0.0002528 0.00069 0.0004529 0.00078 0.0004530 0.00087 0.0005331 0.00087 0.0005332 0.00098 0.0006033 0.00146 0.0018834 0.00194 0.0019135 0.00242 0.0019436 0.00243 0.0019637 0.00244 0.0019938 0.00245 0.0020239 0.00245 0.0020540 0.00245 0.0020841 0.00245 0.0020942 0.00245 0.0021043 0.00245 0.0021144 0.00273 0.0021245 0.00312 0.0021446 0.00360 0.0021547 0.00401 0.0021648 0.00449 0.0021749 0.00488 0.0021850 0.00536 0.0022051 0.00585 0.0024052 0.00633 0.0026053 0.00672 0.0027554 0.00722 0.00295
Page 45
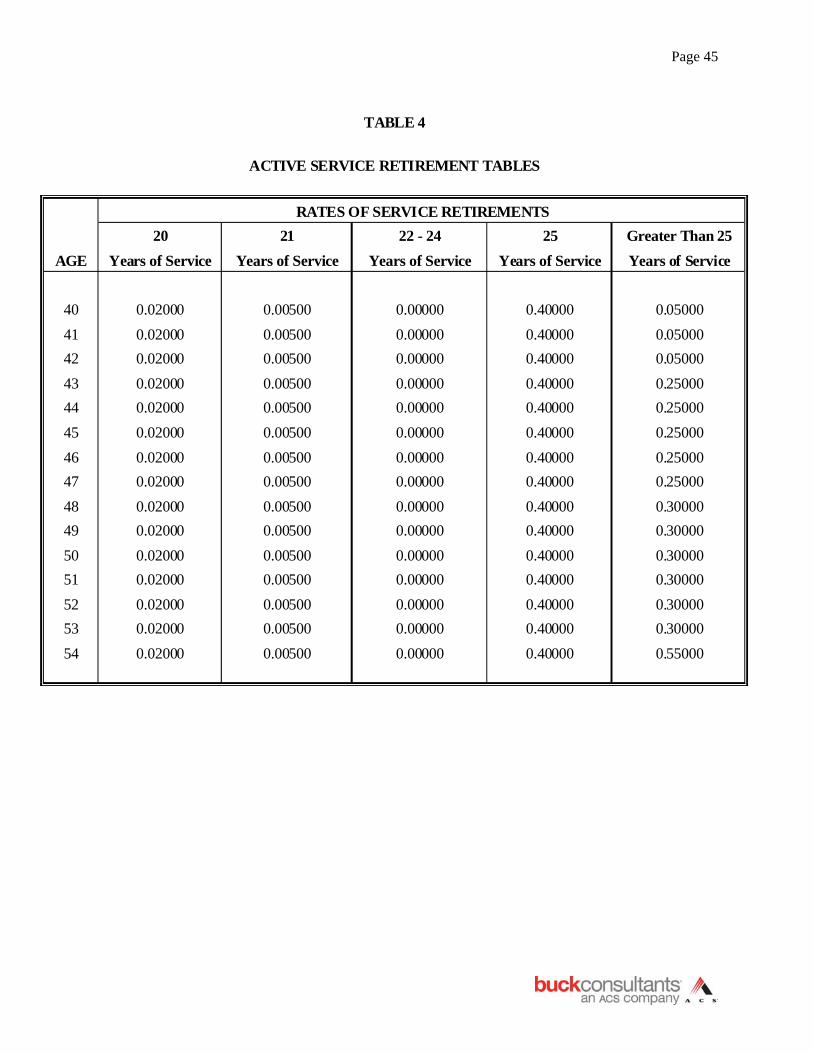
TABLE 4
ACTIVE SERVICE RETIREMENT TABLES
RATES OF SERVICE RETIREMENTS20 21 22 - 24 25 Greater Than 25
AGE Years of Service Years of Service Years of Service Years of Service Years of Service
40 0.02000 0.00500 0.00000 0.40000 0.0500041 0.02000 0.00500 0.00000 0.40000 0.0500042 0.02000 0.00500 0.00000 0.40000 0.0500043 0.02000 0.00500 0.00000 0.40000 0.2500044 0.02000 0.00500 0.00000 0.40000 0.2500045 0.02000 0.00500 0.00000 0.40000 0.2500046 0.02000 0.00500 0.00000 0.40000 0.2500047 0.02000 0.00500 0.00000 0.40000 0.2500048 0.02000 0.00500 0.00000 0.40000 0.3000049 0.02000 0.00500 0.00000 0.40000 0.3000050 0.02000 0.00500 0.00000 0.40000 0.3000051 0.02000 0.00500 0.00000 0.40000 0.3000052 0.02000 0.00500 0.00000 0.40000 0.3000053 0.02000 0.00500 0.00000 0.40000 0.3000054 0.02000 0.00500 0.00000 0.40000 0.55000

Page 46
TABLE 5
SALARY INCREASES
AGE Increase
21 0.054522 0.054523 0.054524 0.054525 0.054526 0.054527 0.054528 0.054529 0.054530 0.054531 0.054532 0.054533 0.054534 0.054535 0.054536 0.054537 0.054538 0.054539 0.054540 0.054541 0.054542 0.054543 0.054544 0.054545 0.054546 0.054547 0.054548 0.054549 0.054550 0.054551 0.054552 0.054553 0.054554 0.0545

Page 47
TABLE 6
MORTALITY TABLES FOR SEVICE RETIREMENTS ANDBENEFICIARIES OF DECEASED ACTIVE AND RETIRED MEMBERS
RATES OF MORTALITY RATES OF MORTALITYAGE MEN WOMEN AGE MEN WOMEN
30 0.00038 0.00026 70 0.01608 0.0167431 0.00039 0.00031 71 0.01787 0.0185832 0.00041 0.00035 72 0.01980 0.0206633 0.00044 0.00039 73 0.02221 0.0229734 0.00050 0.00043 74 0.02457 0.0254635 0.00056 0.00047 75 0.02728 0.0281136 0.00063 0.00051 76 0.03039 0.0309737 0.00070 0.00055 77 0.03390 0.0341138 0.00077 0.00060 78 0.03783 0.0375939 0.00084 0.00065 79 0.04217 0.0415140 0.00090 0.00071 80 0.04691 0.0458841 0.00096 0.00077 81 0.05212 0.0507842 0.00102 0.00085 82 0.05793 0.0562943 0.00108 0.00094 83 0.06437 0.0625144 0.00114 0.00103 84 0.07204 0.0695245 0.00121 0.00112 85 0.08049 0.0774546 0.00130 0.00122 86 0.08972 0.0863847 0.00140 0.00133 87 0.09978 0.0963448 0.00151 0.00143 88 0.11076 0.1073049 0.00162 0.00155 89 0.12280 0.1191550 0.00173 0.00168 90 0.13604 0.1316851 0.00186 0.00185 91 0.15059 0.1446052 0.00200 0.00202 92 0.16642 0.1576253 0.00214 0.00221 93 0.18341 0.1704354 0.00245 0.00242 94 0.19977 0.1828055 0.00267 0.00272 95 0.21661 0.1945156 0.00292 0.00309 96 0.23366 0.2053857 0.00320 0.00348 97 0.25069 0.2152458 0.00362 0.00392 98 0.26749 0.2239559 0.00420 0.00444 99 0.28391 0.2313960 0.00469 0.00506 100 0.29985 0.2374761 0.00527 0.00581 101 0.31530 0.2448362 0.00595 0.00666 102 0.33021 0.2545063 0.00675 0.00765 103 0.34456 0.2660464 0.00768 0.00862 104 0.35863 0.2790565 0.00876 0.00971 105 0.37169 0.2931266 0.01001 0.01095 106 0.38304 0.3078167 0.01128 0.01216 107 0.39200 0.3227268 0.01274 0.01345 108 0.39789 0.3374469 0.01441 0.01486 109 0.40000 0.35154

Page 48
TABLE 7
MORTALITY TABLES FOR DISABILITY RETIREMENT
RATES OF MORTALITY RATES OF MORTALITYAGE MEN WOMEN AGE MEN WOMEN
30 0.00077 0.00047 70 0.03783 0.0281131 0.00084 0.00051 71 0.04217 0.0309732 0.00090 0.00055 72 0.04691 0.0341133 0.00096 0.00060 73 0.05212 0.0375934 0.00102 0.00065 74 0.05793 0.0415135 0.00108 0.00071 75 0.06437 0.0458836 0.00114 0.00077 76 0.07204 0.0507837 0.00121 0.00085 77 0.08049 0.0562938 0.00130 0.00094 78 0.08972 0.0625139 0.00140 0.00103 79 0.09978 0.0695240 0.00151 0.00112 80 0.11076 0.0774541 0.00162 0.00122 81 0.12280 0.0863842 0.00173 0.00133 82 0.13604 0.0963443 0.00186 0.00143 83 0.15059 0.1073044 0.00200 0.00155 84 0.16642 0.1191545 0.00214 0.00168 85 0.18341 0.1316846 0.00245 0.00185 86 0.19977 0.1446047 0.00267 0.00202 87 0.21661 0.1576248 0.00292 0.00221 88 0.23366 0.1704349 0.00320 0.00242 89 0.25069 0.1828050 0.00362 0.00272 90 0.26749 0.1945151 0.00420 0.00309 91 0.28391 0.2053852 0.00469 0.00348 92 0.29985 0.2152453 0.00527 0.00392 93 0.31530 0.2239554 0.00595 0.00444 94 0.33021 0.2313955 0.00675 0.00506 95 0.34456 0.2374756 0.00768 0.00581 96 0.35863 0.2448357 0.00876 0.00666 97 0.37169 0.2545058 0.01001 0.00765 98 0.38304 0.2660459 0.01128 0.00862 99 0.39200 0.2790560 0.01274 0.00971 100 0.39789 0.2931261 0.01441 0.01095 101 0.40000 0.3078162 0.01608 0.01216 102 0.40000 0.3227263 0.01787 0.01345 103 0.40000 0.3374464 0.01980 0.01486 104 0.40000 0.3515465 0.02221 0.01674 105 0.40000 0.3646266 0.02457 0.01858 106 0.40000 0.3762567 0.02728 0.02066 107 0.40000 0.3860168 0.01274 0.02297 108 0.40000 0.3935169 0.01441 0.02546 109 0.40000 0.39831