chemical process indicators for sustainability assessment...
TRANSCRIPT
The views expressed in this presentation are those of the author and do not represent the views or policies of the U.S. Environmental Protection Agency
Chemical Process Indicators for Sustainability Assessment and Design
Gerardo J. Ruiz-Mercado, PhDU.S. Environmental Protection Agency
Office of Research & DevelopmentCincinnati, OH USA
National Academies of Sciences, Engineering and Medicine’s Roundtable on Science and Technology for Sustainability
November 12, 2015, Washington DC
• Sustainability and Chemical Processes
• Sustainability Indicators
• GREENSCOPE Sustainability Evaluation Tool
• GREENSCOPE Evaluation and Case Study
• Challenges, Needs, and Opportunities to Advance Sustainability at
Process Level
2
Agenda
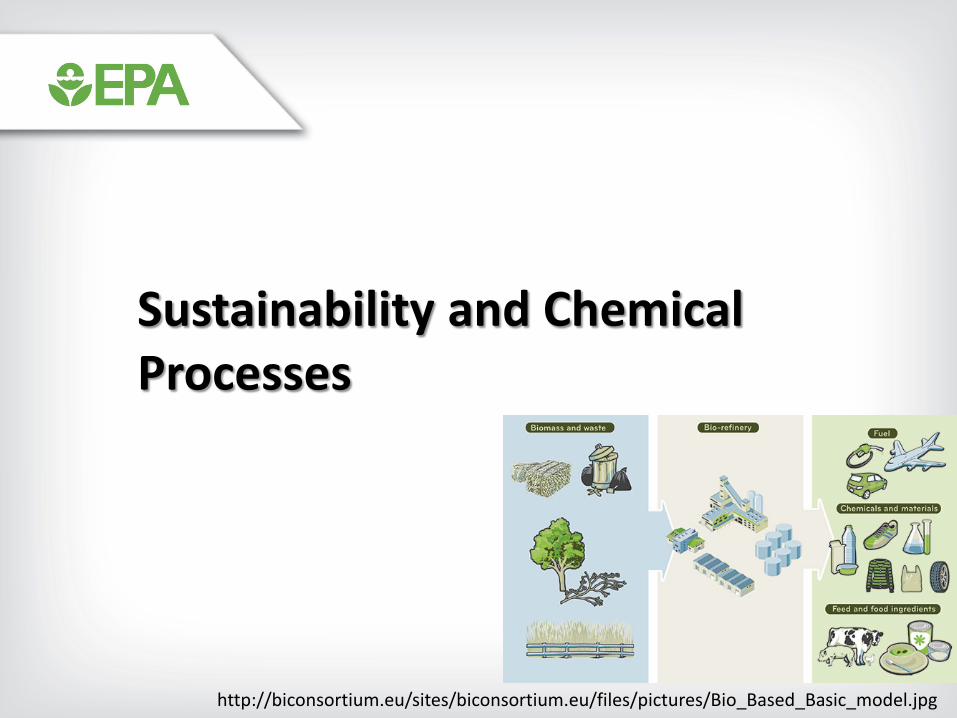
http://biconsortium.eu/sites/biconsortium.eu/files/pictures/Bio_Based_Basic_model.jpg
Sustainability and Chemical Processes
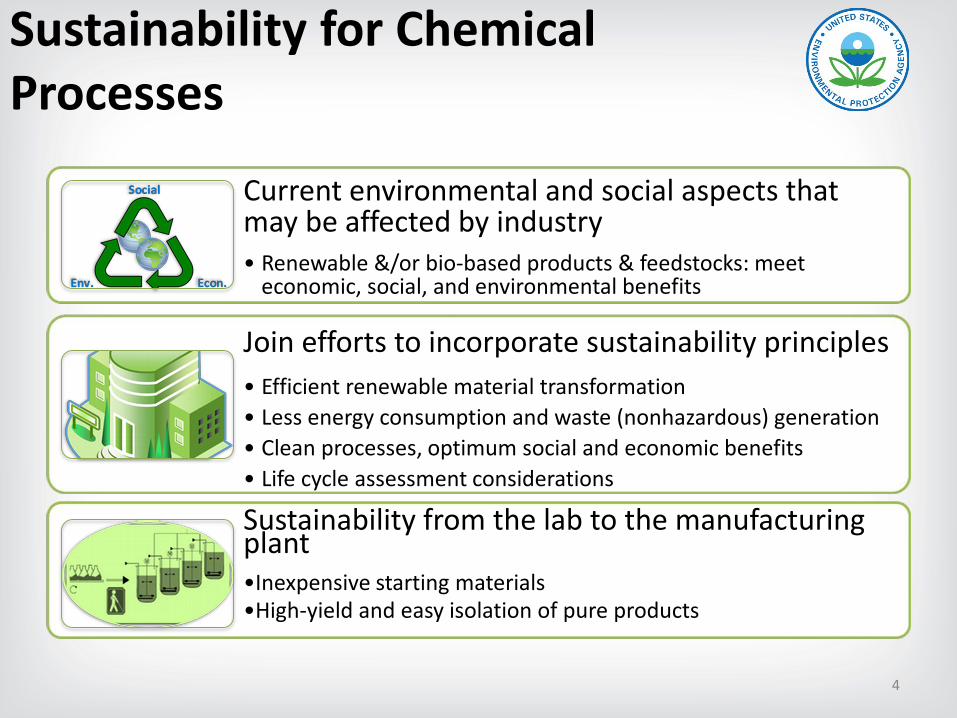
Sustainability for Chemical Processes
Current environmental and social aspects that may be affected by industry• Renewable &/or bio-based products & feedstocks: meet
economic, social, and environmental benefits
Join efforts to incorporate sustainability principles• Efficient renewable material transformation• Less energy consumption and waste (nonhazardous) generation• Clean processes, optimum social and economic benefits• Life cycle assessment considerations
Sustainability from the lab to the manufacturing plant•Inexpensive starting materials•High-yield and easy isolation of pure products
4
Quantitative Sustainability Assessment
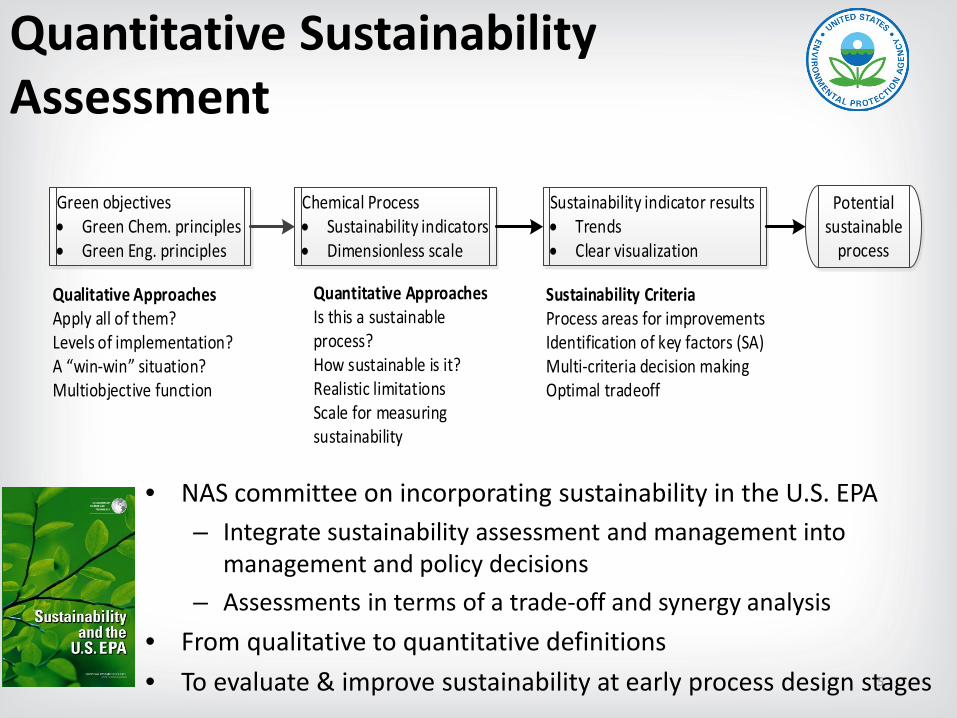
• NAS committee on incorporating sustainability in the U.S. EPA– Integrate sustainability assessment and management into
management and policy decisions– Assessments in terms of a trade-off and synergy analysis
• From qualitative to quantitative definitions• To evaluate & improve sustainability at early process design stages5
Green objectives• Green Chem. principles• Green Eng. principles
Chemical Process• Sustainability indicators• Dimensionless scale
Sustainability indicator results• Trends• Clear visualization
Potential sustainable
process
Qualitative ApproachesApply all of them?Levels of implementation?A “win-win” situation?Multiobjective function
Quantitative ApproachesIs this a sustainable process?How sustainable is it?Realistic limitationsScale for measuring sustainability
Sustainability CriteriaProcess areas for improvementsIdentification of key factors (SA)Multi-criteria decision makingOptimal tradeoff
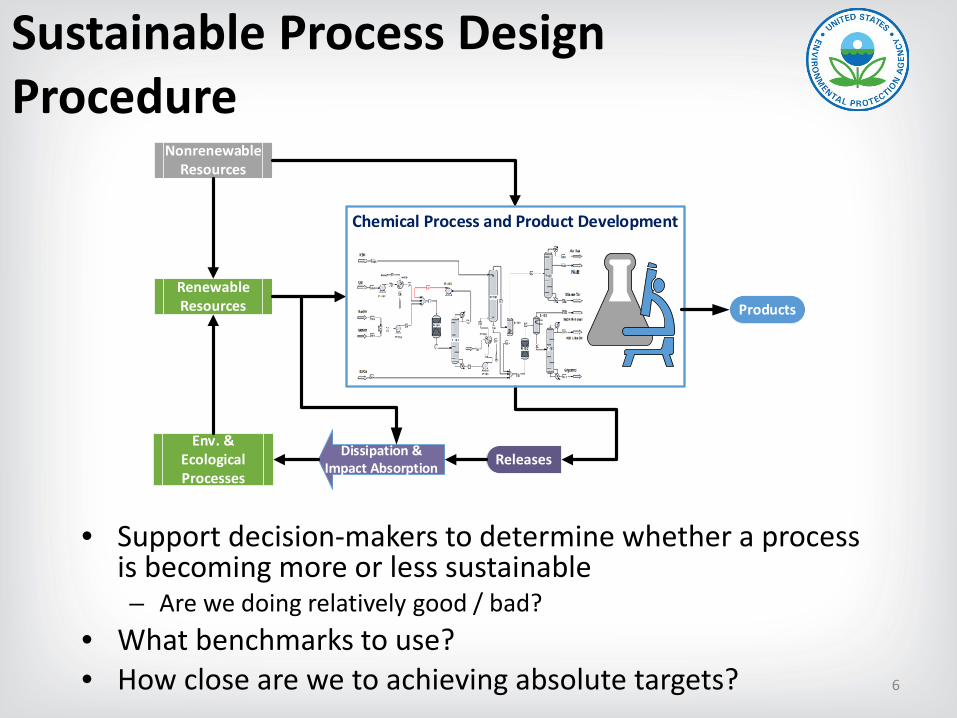
Sustainable Process Design Procedure
• Support decision-makers to determine whether a process is becoming more or less sustainable– Are we doing relatively good / bad?
• What benchmarks to use?• How close are we to achieving absolute targets? 6
Nonrenewable Resources
Env. & Ecological Processes
Dissipation & Impact Absorption
Renewable Resources Products
Releases
Chemical Process and Product Development

Sustainability Indicators
Economy
Society
Environment
Sustainable development
Eco-efficiency Socio- economic
Socio-ecology
Rel
ease
s
Ecol
. goo
ds &
ser
vice
s
Revenues
Econ
. goo
ds &
ser
vice
s
Releases
Ecol. goods & services
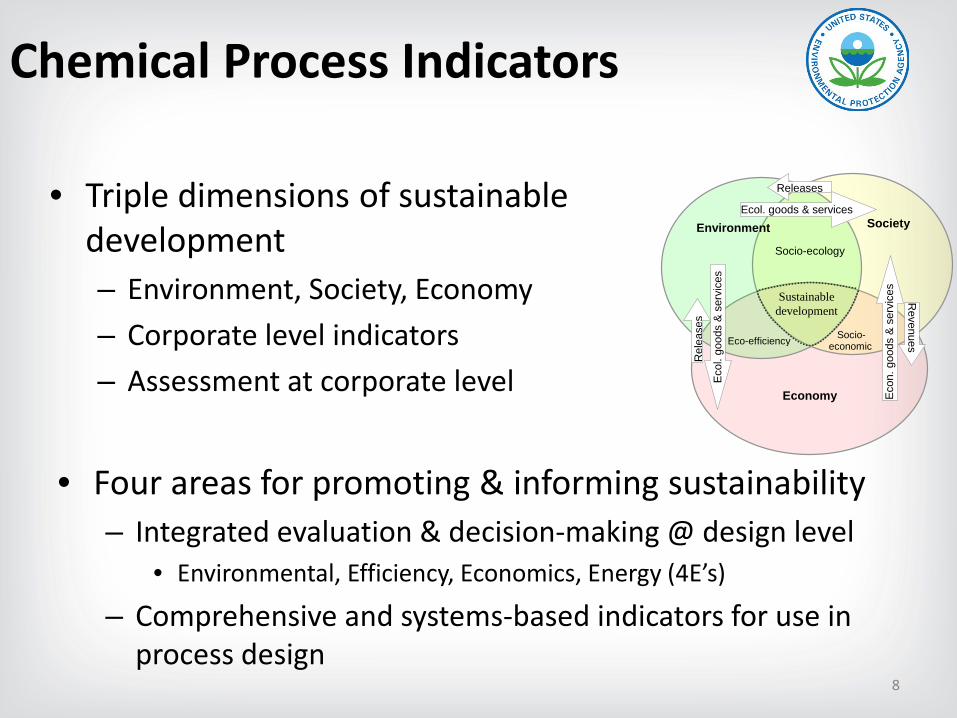
• Four areas for promoting & informing sustainability– Integrated evaluation & decision-making @ design level
• Environmental, Efficiency, Economics, Energy (4E’s)
– Comprehensive and systems-based indicators for use in process design
8
Chemical Process Indicators
Economy
Society
Environment
Sustainable development
Eco-efficiency Socio- economic
Socio-ecology
Rel
ease
s
Ecol
. goo
ds &
ser
vice
s
Revenues
Econ
. goo
ds &
ser
vice
s
Releases
Ecol. goods & services
• Triple dimensions of sustainable development– Environment, Society, Economy– Corporate level indicators– Assessment at corporate level
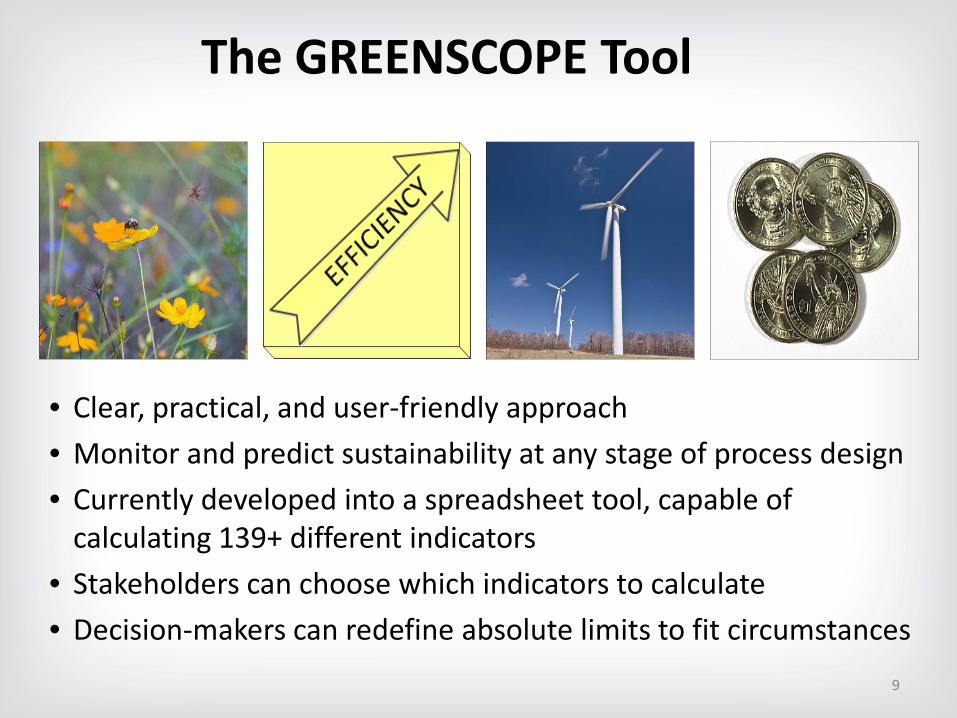
The GREENSCOPE Tool
• Clear, practical, and user-friendly approach• Monitor and predict sustainability at any stage of process design• Currently developed into a spreadsheet tool, capable of
calculating 139+ different indicators• Stakeholders can choose which indicators to calculate• Decision-makers can redefine absolute limits to fit circumstances
9
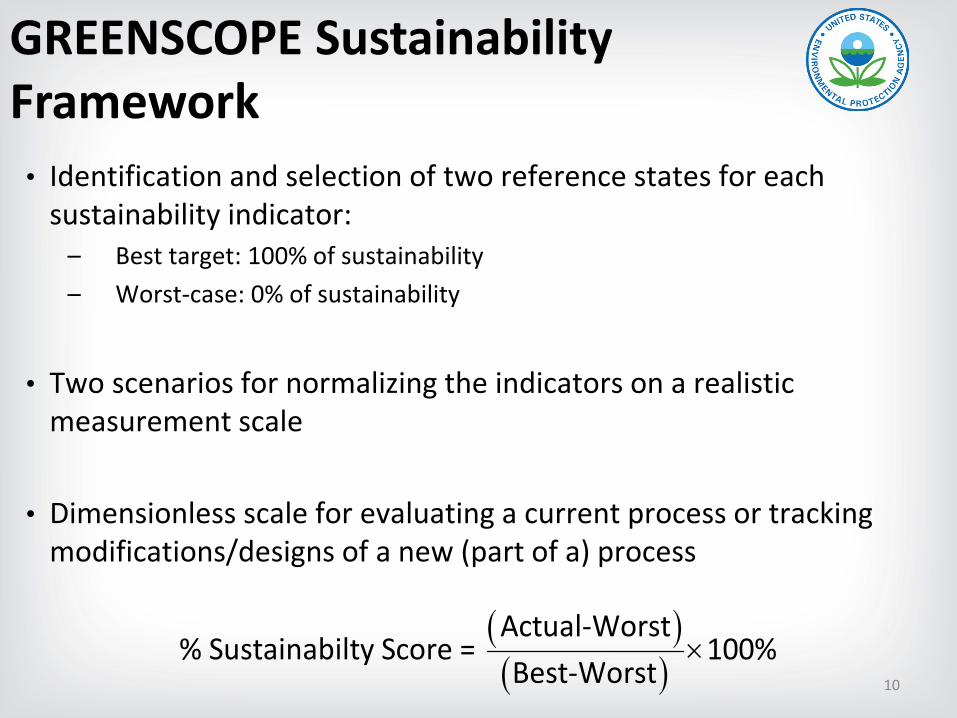
GREENSCOPE Sustainability Framework
( )( )
×Actual-Worst
% Sustainabilty Score = 100%Best-Worst 10
• Identification and selection of two reference states for each sustainability indicator:
– Best target: 100% of sustainability– Worst-case: 0% of sustainability
• Two scenarios for normalizing the indicators on a realistic measurement scale
• Dimensionless scale for evaluating a current process or tracking modifications/designs of a new (part of a) process
Environmental Indicators
• 66 indicators• Health & safety hazards: operating conditions and
operation failures• Impact of components utilized in the system and releases• Risk assessment & ecosystem services evaluation• Integrated to life cycle assessment• 100% sustainability, best target, is no releases of pollutants
and no hazardous material use or generation• 0% sustainability, worst cases, all inputs are classified as
hazardous, and/or all generated waste for each potentialEHS hazard is released out of the process
11

Environmental Indicators: Example
( )× − •
•
=
−∆ ×=
∆
− ∆ + ∆ <=
2fire/explosion
4 4c,
fire/explosionproduct
flash
flash, flash
Probable energy potential for reaction with OSHMass of product
10SH
If is known0.005 1.0 if 0< 200
iIndVali i
i
i
H mm
TT T
IndVal ∆ ≤ ∆ ≥
= == = =
−
=
flash
flash
code
code
code
code
code
1 if 00 if 200
Elseif R is known1 if R 12,15,17,180.875 if R 11,300.75 if R 100 if R other
Elseif NFPA f is known1 if NFPA-flamm=40.833 if NFPA-fl
i
i
TT
IndVal
IndVal
amm=30.667 if NFPA-flamm=20.5 if NFPA-flamm=10 if NFPA-flamm=0
end
∆Hc: combustion enthalpy, kJ/kg∆Tflash: temperature difference between the standard flash point and process temperature, ℃Rcode: Risk phrases of European communityNFPA-f: flammability hazard class according to the U.S. National Fire Protection Agency (NFPA)
Safety hazard, fire explosion
Sustainability valueBest, 100% Worst, 0%
0 kJ/kgAll combustion enthalpy of each process substance is released
12
Efficiency Indicators
• 26 indicators
• Amount of materials and inputs required to generate thedesired product (reaction) or complete a specific processtask (e.g., separation)
• Mass transfer operations have implicit influence in theamount of energy demand, equipment size, costs, rawmaterials, releases, etc.
• Efficiency indicators connect material input/output with theproduct or intermediate generated in the process oroperating unit
13
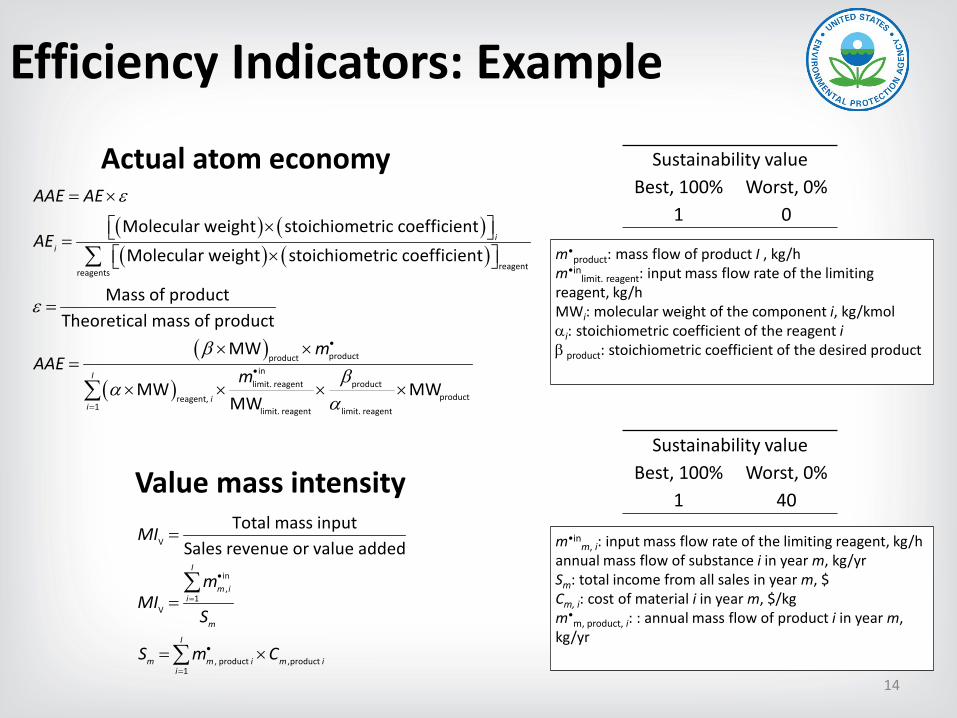
Efficiency Indicators: Example
Actual atom economy Sustainability valueBest, 100% Worst, 0%
1 0( ) ( )( ) ( )
( )
( )
reagentreagents
productproduct
reag
Molecular weight stoichiometric coefficientMolecular weight stoichiometric coefficient
Mass of productTheoretical mass of product
MW
MW
ii
AAE AE
AE
mAAE
ε
ε
β
α
•
= ×
× =×
=
× ×=
×
∑
inlimit. reagent product
productent, 1 limit. reagent limit. reagent
MWMW
I
ii
m βα
•
=
× × ×∑
m•product: mass flow of product I , kg/h
m•inlimit. reagent: input mass flow rate of the limiting
reagent, kg/hMWi: molecular weight of the component i, kg/kmolαi: stoichiometric coefficient of the reagent iβ product: stoichiometric coefficient of the desired product
Value mass intensity
V
in,
1V
, product ,product 1
Total mass inputSales revenue or value added
I
m ii
m
I
m m i m ii
MI
mMI
S
S m C
•
=
•
=
=
=
= ×
∑
∑
Sustainability valueBest, 100% Worst, 0%
1 40
m•inm, i: input mass flow rate of the limiting reagent, kg/h
annual mass flow of substance i in year m, kg/yrSm: total income from all sales in year m, $ Cm, i: cost of material i in year m, $/kgm•
m, product, i: : annual mass flow of product i in year m, kg/yr
14
Economic Indicators
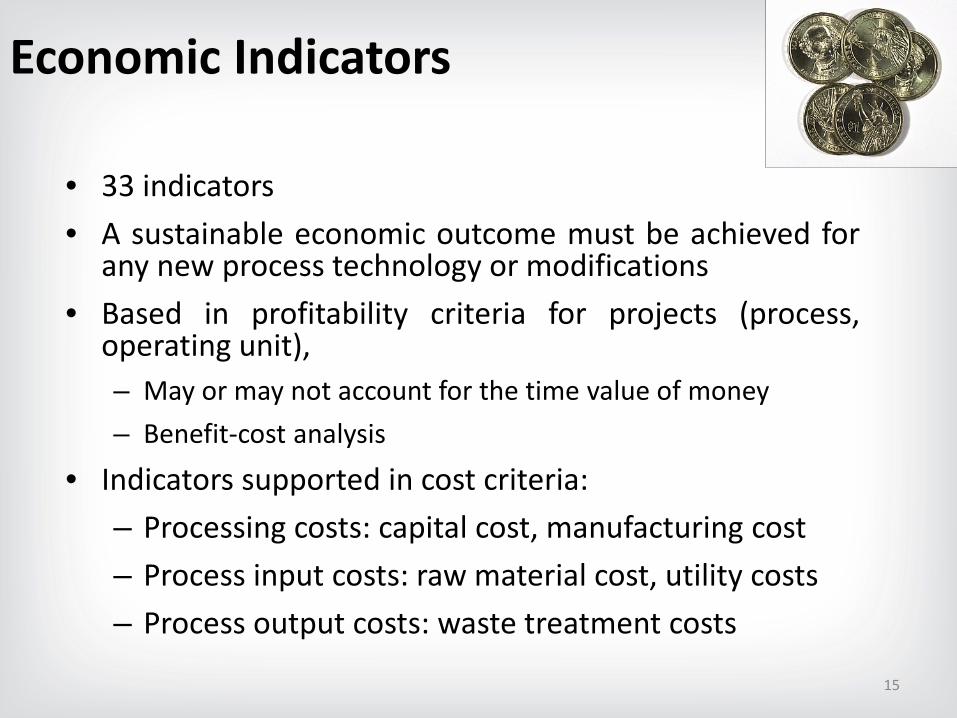
• 33 indicators• A sustainable economic outcome must be achieved for
any new process technology or modifications• Based in profitability criteria for projects (process,
operating unit),– May or may not account for the time value of money– Benefit-cost analysis
• Indicators supported in cost criteria:– Processing costs: capital cost, manufacturing cost– Process input costs: raw material cost, utility costs– Process output costs: waste treatment costs
15
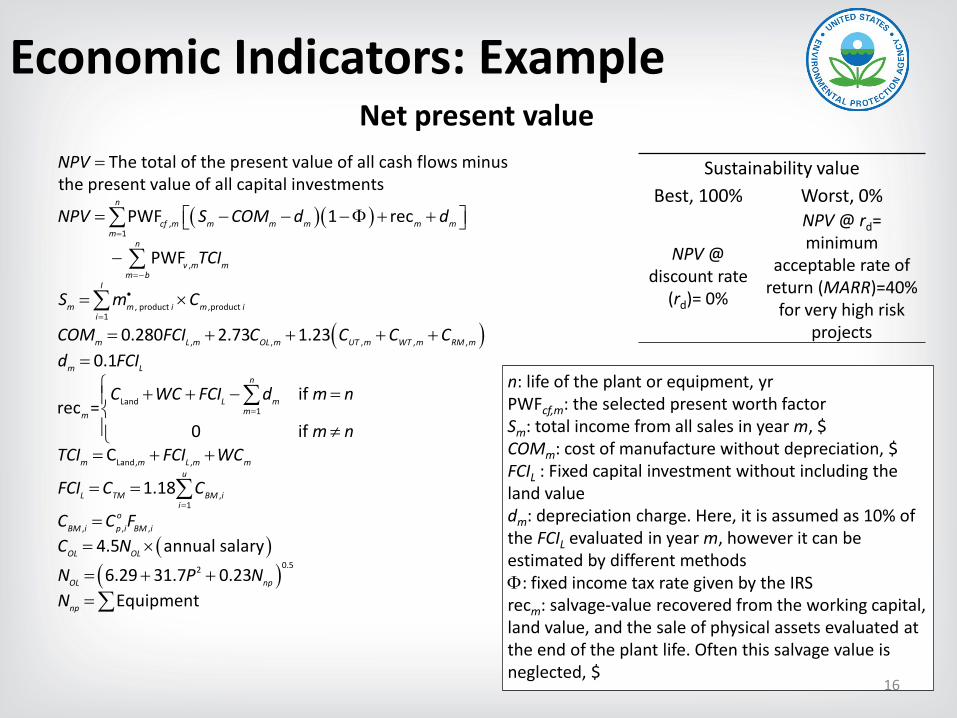
Economic Indicators: ExampleNet present value
Sustainability valueBest, 100% Worst, 0%
NPV @ discount rate
(rd)= 0%
NPV @ rd= minimum
acceptable rate of return (MARR)=40%
for very high risk projects
n: life of the plant or equipment, yrPWFcf,m: the selected present worth factorSm: total income from all sales in year m, $COMm: cost of manufacture without depreciation, $FCIL : Fixed capital investment without including the land valuedm: depreciation charge. Here, it is assumed as 10% of the FCIL evaluated in year m, however it can be estimated by different methods Φ: fixed income tax rate given by the IRSrecm: salvage-value recovered from the working capital, land value, and the sale of physical assets evaluated at the end of the plant life. Often this salvage value is neglected, $
( )( ),1
,
, product ,product 1
The total of the present value of all cash flows minusthe present value of all capital investments
PWF 1 rec
PWF
n
cf m m m m m mm
n
v m mm b
I
m m i m ii
m
NPV
NPV S COM d d
TCI
S m C
COM
=
=−
•
=
=
= − − − Φ + +
−
= ×
=
∑
∑
∑( )
( )
, , , , ,
Land1
Land, ,
,1
, , ,
2
0.280 2.73 1.230.1
if rec =
0 if C
1.18
4.5 annual salary6.29 31.7 0
L m OL m UT m WT m RM m
m Ln
L mmm
m m L m mu
L TM BM ii
oBM i p i BM i
OL OL
OL
FCI C C C Cd FCI
C WC FCI d m n
m nTCI FCI WC
FCI C C
C C FC NN P
=
=
+ + + +=
+ + − = ≠
= + +
= =
== ×
= + +
∑
∑
( )0.5.23
Equipmentnp
np
NN = ∑
16

Energy Indicators
• 14 indicators• Different thermodynamic assessments for obtaining an
energetic sustainability score– Energy (caloric); exergy (available); emergy (ecosystem services)
• Zero energy consumption per unit of product is the besttarget (more products per unit of consumed energy)
• Most of the worst cases do not have a predefined value– They depend on the particular process or process equipment– The designer has to choose which value is unacceptable– Some worst cases can be assigned by taking the lowest scores
found through comparing several sustainability corporatereports
17
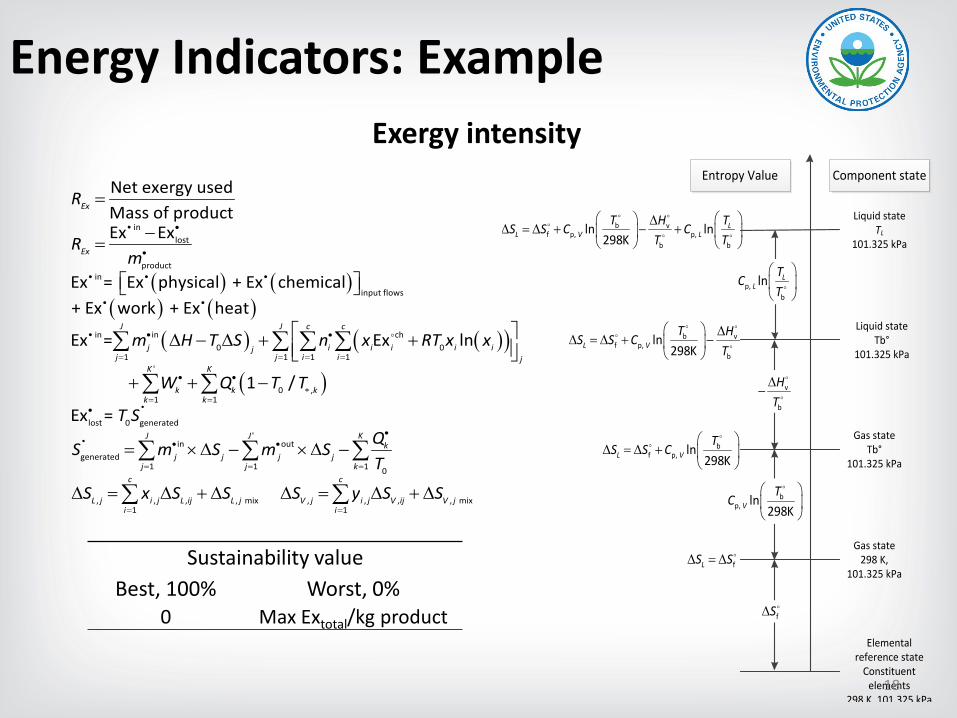
Energy Indicators: ExampleExergy intensity
Sustainability valueBest, 100% Worst, 0%
0 Max Extotal/kg product
( ) ( )( ) ( )
( ) ( )( )
• in
• in • •
input flows• •
in• in ch0 0
1 1 1
lost
pr uc
1
od t
Net exergy usedMass of productEx
Ex = Ex physical + Ex chemical+ Ex work + Ex heat
Ex = Ex l
E
n
x
Ex
Ex
J J c c
j i i i i ijj j i i j
k
R
R
m H T S n
m
x RT x x
W
• •
= = =
•
•
=
=
=
∆ − ∆ + +
−
+
∑ ∑ ∑ ∑
( )'
0 ,1 1
lost 0 generated'
in outgenerated
1 1 1 0
, , , , mix , , , , mix1 1
1 /
Ex =
K K
k kk k
J J Kk
j j j jj j k
c c
L j i j L ij L j V j i j V ij V ji i
Q T T
T SQS m S m ST
S x S S S y S S
•
•
• •∗
= =•
•• •
= = =
= =
+ −
= × ∆ − × ∆ −
∆ = ∆ + ∆ ∆ = ∆ + ∆
∑ ∑
∑ ∑ ∑
∑ ∑
b vf p, p,
b b
ln ln298K
LL V L
T H TS S C CT T
∆∆ = ∆ + − +
Entropy Value Component state
p, b
ln LL
TCT
Liquid stateTL
101.325 kPa
b vf p,
b
ln298KL V
T HS S CT
∆∆ = ∆ + −
v
b
HT
∆−
Liquid stateTb°
101.325 kPa
bf p, ln
298KL VT
S S C
∆ = ∆ +
bp, ln
298KVT
C
Gas stateTb°
101.325 kPa
fLS S∆ = ∆
fS∆
Gas state298 K,
101.325 kPa
Elemental reference state
Constituent elements
298 K, 101.325 kPa18
GREENSCOPE
GREENSCOPE Evaluation and Case Study
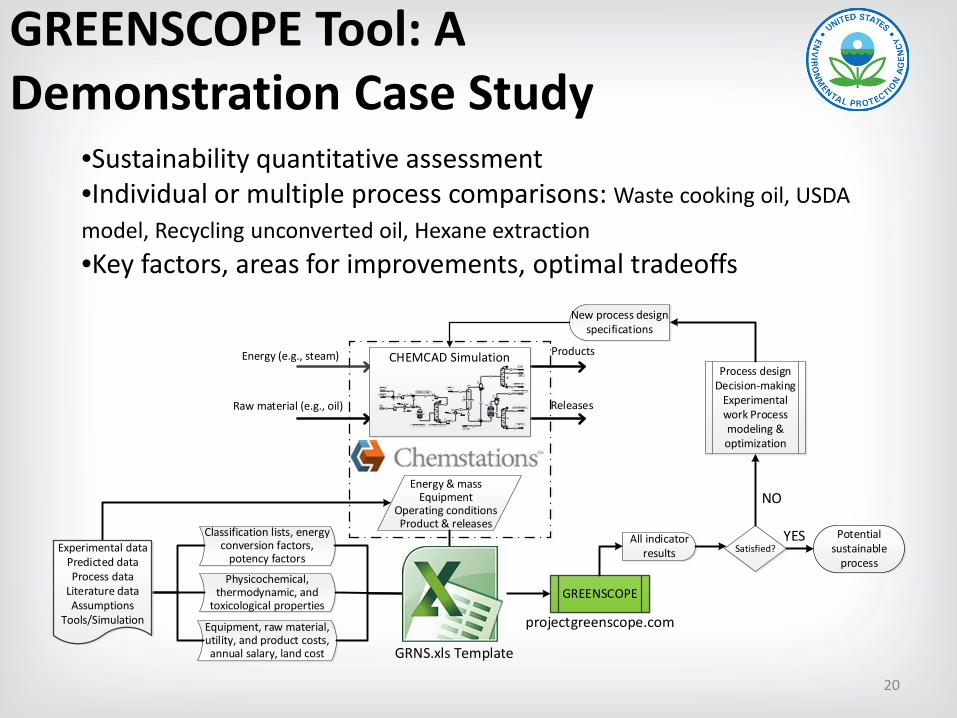
GREENSCOPE Tool: A Demonstration Case Study
20
•Sustainability quantitative assessment•Individual or multiple process comparisons: Waste cooking oil, USDA model, Recycling unconverted oil, Hexane extraction•Key factors, areas for improvements, optimal tradeoffs
Classification lists, energy conversion factors,
potency factors
Physicochemical, thermodynamic, and
toxicological properties
Equipment, raw material, utility, and product costs, annual salary, land cost
GREENSCOPE
Energy (e.g., steam) Products
ReleasesRaw material (e.g., oil)
CHEMCAD Simulation
Energy & massEquipment
Operating conditionsProduct & releases
Experimental dataPredicted dataProcess data
Literature dataAssumptions
Tools/Simulation
All indicator results Satisfied?
Potential sustainable
process
YES
NO
Process designDecision-making
Experimental work Process modeling & optimization
New process design specifications
GRNS.xls Template
projectgreenscope.com
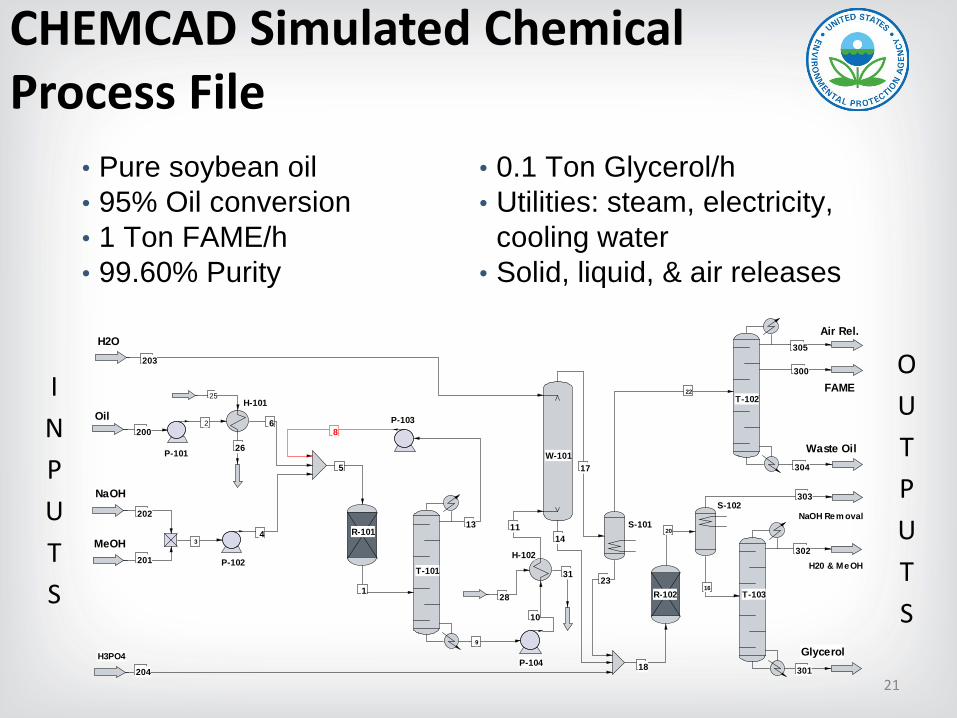
CHEMCAD Simulated Chemical Process File
21
Oil
22 FAME
NaOH Rem oval
3
20
16
9
25
2
NaOH
Air Rel.H2O
Glycerol
300
303
304
305
200
202
MeOH
T-101
T-102
T-103
R-101
R-102
P-101
P-102
P-103
P-104
H-101
H-102
S-101
S-102
W-101Waste Oil
128
203
11
17
10
31H20 & MeOH
302
301
5
8
13
H3PO418
14
23
201
4
6
26
204
INPUTS
OUTPUTS
• Pure soybean oil• 95% Oil conversion• 1 Ton FAME/h• 99.60% Purity
• 0.1 Ton Glycerol/h• Utilities: steam, electricity,
cooling water• Solid, liquid, & air releases
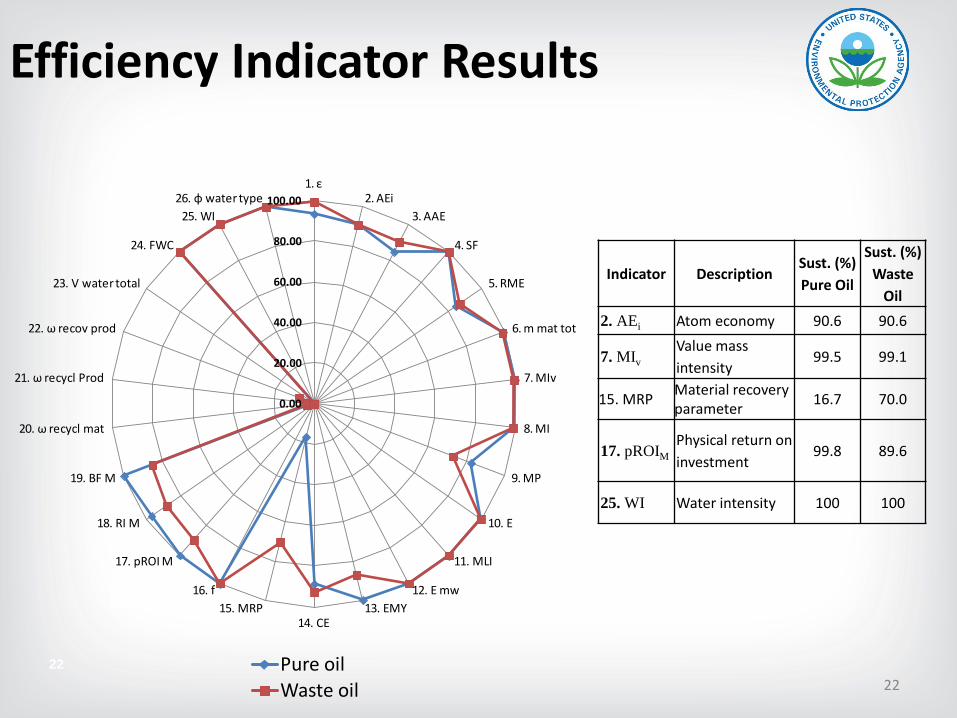
Efficiency Indicator Results
Indicator DescriptionSust. (%)Pure Oil
Sust. (%)Waste
Oil2. AEi Atom economy 90.6 90.6
7. MIvValue mass intensity
99.5 99.1
15. MRP Material recovery parameter 16.7 70.0
17. pROIMPhysical return on investment
99.8 89.6
25. WI Water intensity 100 100
22
0.00
20.00
40.00
60.00
80.00
100.001. ε
2. AEi3. AAE
4. SF
5. RME
6. m mat tot
7. MIv
8. MI
9. MP
10. E
11. MLI
12. E mw13. EMY
14. CE15. MRP
16. f
17. pROI M
18. RI M
19. BF M
20. ω recycl mat
21. ω recycl Prod
22. ω recov prod
23. V water total
24. FWC
25. WI26. φ water type
Pure oilWaste oil 22
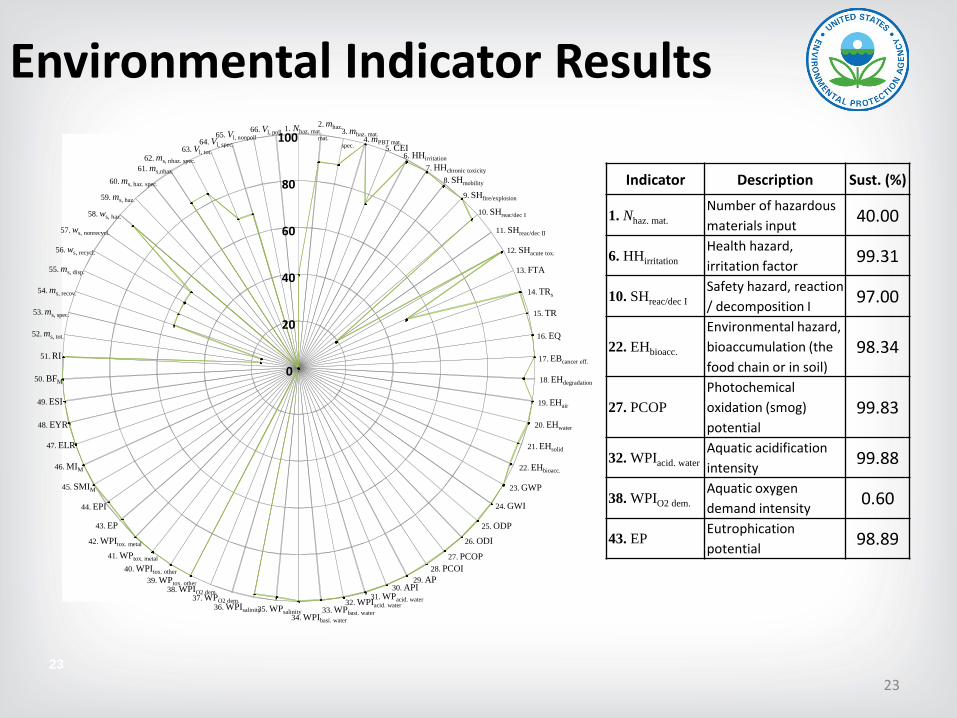
Environmental Indicator Results
23
0
20
40
60
80
1001. Nhaz. mat.
2. mhaz.
mat.3. mhaz. mat.
spec.4. mPBT mat.
5. CEI6. HHirritation
7. HHchronic toxicity8. SHmobility
9. SHfire/explosion
10. SHreac/dec I
11. SHreac/dec II
12. SHacute tox.
13. FTA
14. TRs
15. TR
16. EQ
17. EBcancer eff.
18. EHdegradation
19. EHair
20. EHwater
21. EHsolid
22. EHbioacc.
23. GWP
24. GWI
25. ODP26. ODI
27. PCOP28. PCOI
29. AP30. API
31. WPacid. water32. WPIacid. water33. WPbasi. water
34. WPIbasi. water
35. WPsalinity36. WPIsalinity
37. WPO2 dem.
38. WPIO2 dem.
39. WPtox. other
40. WPItox. other
41. WPtox. metal
42. WPItox. metal
43. EP
44. EPI
45. SMIM
46. MIM
47. ELR
48. EYR
49. ESI
50. BFM
51. RI
52. ms, tot.
53. ms, spec.
54. ms, recov.
55. ms, disp.
56. ws, recycl.
57. ws, nonrecycl.
58. ws, haz.
60. ms, haz. spec.
61. ms,nhaz.
62. ms, nhaz. spec.
63. Vl, tot.64. Vl, spec.
65. Vl, nonpoll66. Vl, poll.
59. ms, haz.
Indicator Description Sust. (%)
1. Nhaz. mat.Number of hazardous materials input 40.00
6. HHirritationHealth hazard, irritation factor 99.31
10. SHreac/dec ISafety hazard, reaction / decomposition I 97.00
22. EHbioacc.
Environmental hazard, bioaccumulation (the food chain or in soil)
98.34
27. PCOPPhotochemical oxidation (smog) potential
99.83
32. WPIacid. waterAquatic acidification intensity 99.88
38. WPIO2 dem.Aquatic oxygen demand intensity 0.60
43. EPEutrophication potential 98.89
23
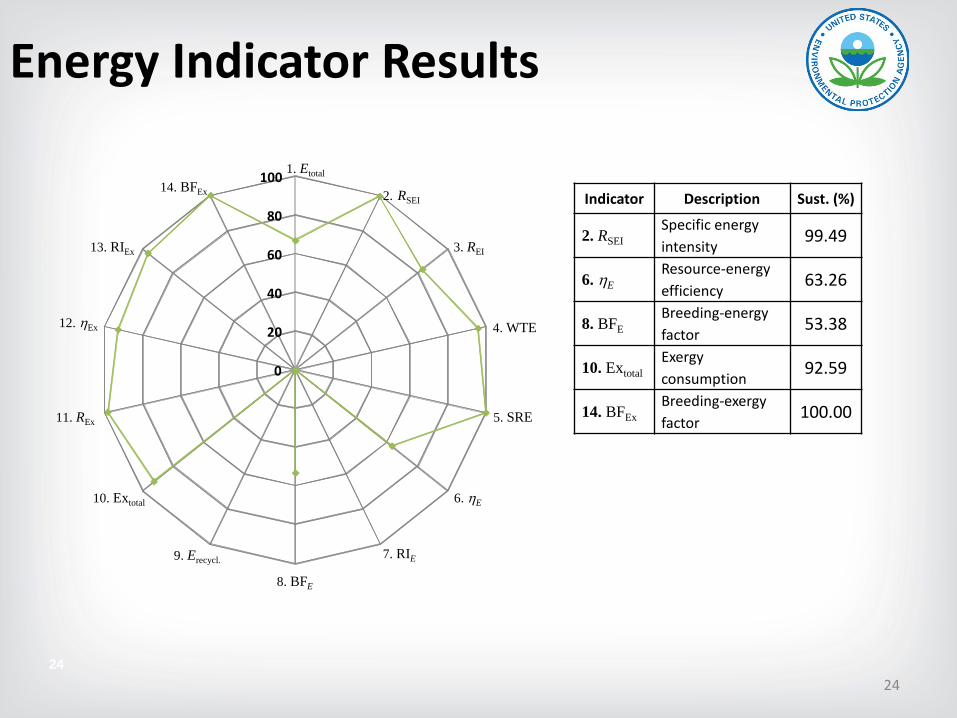
Energy Indicator Results
24
Indicator Description Sust. (%)
2. RSEISpecific energy intensity
99.49
6. ηEResource-energy efficiency
63.26
8. BFEBreeding-energy factor
53.38
10. ExtotalExergy consumption
92.59
14. BFExBreeding-exergy factor
100.00
0
20
40
60
80
100 1. Etotal
2. RSEI
3. REI
4. WTE
5. SRE
6. ηE
7. RIE
8. BFE
9. Erecycl.
10. Extotal
11. REx
13. RIEx
14. BFEx
12. ηEx
24
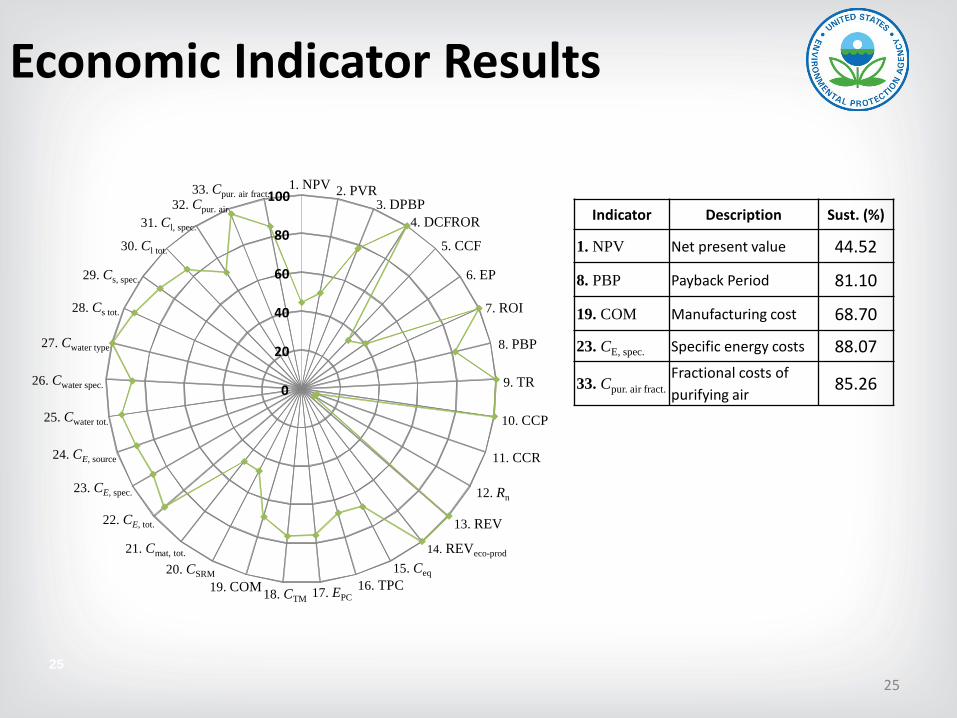
Economic Indicator Results
25
Indicator Description Sust. (%)
1. NPV Net present value 44.52
8. PBP Payback Period 81.10
19. COM Manufacturing cost 68.70
23. CE, spec. Specific energy costs 88.07
33. Cpur. air fract.Fractional costs of purifying air
85.26
17. EPC
0
20
40
60
80
1001. NPV 2. PVR
3. DPBP4. DCFROR
5. CCF
6. EP
7. ROI
8. PBP
9. TR
10. CCP
11. CCR
12. Rn
13. REV
14. REVeco-prod
15. Ceq16. TPC
18. CTM19. COM
20. CSRM
21. Cmat, tot.
22. CE, tot.
23. CE, spec.
24. CE, source
25. Cwater tot.
26. Cwater spec.
27. Cwater type
28. Cs tot.
29. Cs, spec.
30. Cl tot.
31. Cl, spec.
32. Cpur. air
33. Cpur. air fract.
25
Remaining Challenges to Advance Sustainability at Process Level
• Data availability for the calculation or prediction of sustainability using indicators
– Chemical process heterogeneity– New chemical compounds
• Physicochemical properties• Toxicity properties and classification lists
– Cost• Capital costs of unconventional equipment • Time value variations
• Quantitative social indicators
• Multiproduct allocation for processes and facilities
– Mass, energy, value• Legal foundations and the establishment of official methodologies and
standards for the assessment of sustainability 26
Needs and opportunities related to sustainability
• To incorporate sustainability at the early stages of a project life and at the early educational levels (New book Ruiz-Mercado and Cabezas (eds.), Elsevier)
– Sustainable chemical and products by design– Dynamic systems– Process control and optimization (Dr. F. Lima, WVU)
• process control with sustainability assessmenttools for the simultaneous evaluation and optimizationof process operations
– Multi-stakeholder decision-making (Dr. V. Zavala, U Wisconsin-Madison) • Design and analysis of sustainable supply chains
• To integrate life cycle considerations (assessment, inventory) at process development level
• Sustainability regulations at state, country, and international levels
– Not just greenhouse gases
27
Acknowledgments
28
Dr. Michael A. Gonzalez, GREENSCOPE Co-developer
Dr. Raymond L. Smith, GREENSCOPE Co-developer
National Academies of Sciences, Engineering, and Medicine
Dr. Jerry L. Miller, Director, Sci. & Tech. for Sustainability, NAS
References
29
Ruiz-Mercado, G. J.; Gonzalez, M. A.; Smith, R. L., Expanding GREENSCOPEbeyond the Gate: A Green Chemistry and Life-Cycle Perspective. CleanTech. & Env. Policy 2014, 16, (4), 703–713.
Ruiz-Mercado, G. J.; Gonzalez, M. A.; Smith, R. L., Sustainability Indicatorsfor Chemical Processes: III. Biodiesel Case Study. Ind. & Eng. Chem. Res.2013, 52, (20), 6747–6760.
Ruiz-Mercado, G. J.; Smith, R. L.; Gonzalez, M. A., Sustainability Indicatorsfor Chemical Processes: II. Data Needs. Ind. & Eng. Chem. Res. 2012, 51,(5), 2329-2353.
Ruiz-Mercado, G. J.; Smith, R. L.; Gonzalez, M. A., Sustainability Indicatorsfor Chemical Processes: I. Taxonomy. Ind. & Eng. Chem. Res. 2012, 51, (5),2309-2328.
