sustainability key performance indicators in supply …
TRANSCRIPT

SUSTAINABILITY KEY PERFORMANCE INDICATORS IN SUPPLY CHAIN: DEVELOPING THE CALCULATION OF CO2 EMISSIONS IN
TRANSPORTATION
Jyväskylä University School of Business and Economics
Master’s Thesis
2021
Author: Aino Metsäluoto Subject: Accounting
Supervisor: Toni Mättö

2

3
ABSTRACT
Author Aino Metsäluoto
Title Sustainability key performance indicators in supply chain: developing the calculation of CO2 emissions in transportation
Subject Accounting
Type of work Master’s thesis
Date 23.04.2021
Number of pages 90
Climate change and its challenges affect us all. Individuals, organizations and states are paying more and more attention to their activities in order to operate in environment friendly manner and to adhere to the values of sustainable development. The rise in the importance of sustainable development and the change in attitudes have led to growing consumer interest in the sustainable development and responsibility of companies. This has driven companies to measure, monitor, set goals and report their sustainability actions for example through various strategic key performance indicators (KPIs). Indeed, many organizations have taken steps e.g., to reduce greenhouse gas (GHG) emissions from their activities or to ensure the safety and fair treatment of workers. Third sector organizations provide guidance and regulation for measuring sustainable performance, e.g., GHG emis-sions but, there is no common way to report and measure emissions in the business world. This case study focuses on developing the measurement of CO2 emissions in transporta-tion at a selected case company. The case company has recently started monitoring two sustainable KPIs in their supply chain, and the aim of the study is to develop the calcula-tion of CO2 emissions in transportation further through short-term practical changes and long-term development proposals. The research follows constructive research approach and utilizes triangulation and mixed research method in data collection using both quali-tative and quantitative sources. As a result, four short-term improvements through docu-mentation, calculation refinements, visual improvements, and creation of simple calcula-tion tool were conducted. Long-term development proposals offer a good view to the fu-ture and alternative ways to proceed with the calculation. The study provides perspec-tives on measuring CO2 emissions for other organizations by presenting the most com-mon regulations, guidelines, and theory around the topic, as well as concrete ways to per-form the calculation in practice. The study includes data requirements, calculation meth-ods, and practical problems related to the measurement of transportation emissions that other organizations can benefit from. Proposals for further research include clarification of frameworks and best practices for sustainable supply chain management and sustain-able performance measurement in the future.
Key words Key Performance Indicator, KPI, Supply Chain Management, Sustainable Supply Chain Management, CO2 emissions, Constructive Research Approach, CRA
Place of storage Jyväskylä University Library

4
TIIVISTELMÄ
Tekijä Aino Metsäluoto
Työn nimi Kestävän kehityksen suorituskykymittarit toimitusketjujen hallinnassa: CO2 kuljetus-päästöjen mittaaminen
Oppiaine Laskentatoimi
Työn laji Pro gradu -tutkielma
Päivämäärä 23.04.2021
Sivumäärä 90
Ilmastonmuutos, sen vaikutus ja siihen liittyvät haasteet näkyvät kaikkialla. Yksittäiset henkilöt, organisaatiot ja valtiot kiinnittävät entistä enemmän huomiota toimintaansa toi-miakseen ympäristöystävällisesti ja noudattaakseen kestävän kehityksen arvoja. Kestä-vän kehityksen tärkeyden nousu ja asenteiden muutos on aiheuttanut sen, että kuluttajat ovat yhä enemmän kiinnostuneita yritysten kestävästä kehityksestä ja vastuullisuudesta. Tämä on ajanut yrityksiä mittaamaan, seuraamaan, asettamaan tavoitteita ja raportoi-maan vastuullisuudestaan esimerkiksi erilaisten strategisten suorituskykyindikaattorien avulla. Monet organisaatiot ovatkin ryhtyneet toimiin esimerkiksi vähentääkseen toimin-nasta aiheutuvia kasvihuonekaasupäästöjä (GHG -päästöjä) tai varmistaakseen työnteki-jöiden turvallisuuden ja oikeudenmukaisen kohtelun. Kolmannen sektorin organisaatiot ja järjestöt tarjoavat ohjeita ja sääntelyä kestävän kehityksen ja esim. GHG -päästöjen mit-taamiseen, mutta yritysmaailmassa yhteistä tapaa raportoida ja mitata päästöjä ei ole. Tämä tapaustutkimus keskittyy kehittämään kuljetuksesta syntyvien hiilidioksidipäästö-jen mittausta valitussa kohdeyrityksessä. Kohdeyritys on hiljattain aloittanut kahden vas-tuullisuus- KPI:n seurannan toimitusketjujen hallinnassa, ja tarkoituksena on kehittää las-kentaa edelleen lyhytaikaisten käytännön muutosten ja pidempiaikaisten kehitysehdotus-ten kautta. Tutkimus mukailee konstruktiivista tutkimusotetta ja hyödyntää tiedonke-ruussa triangulaatiota käyttämällä sekä kvalitatiivisia että kvantitatiivisia lähteitä. Tulok-sena tehtiin neljä lyhyen aikavälin parannusta dokumentoinnin, laskentatarkennusten, vi-suaalisten parannusten ja yksinkertaisen laskentatyökalun rakentamisen avulla. Pitkän aikavälin kehitysehdotukset tarjoavat hyvän näkymän tulevaisuuteen ja vaihtoehtoisia ta-poja edetä laskennan suhteen. Tutkimus tarjoaa muille organisaatioille näkökulmia hiili-dioksidipäästöjen mittaamiseen esittelemällä yleisimmät säännökset, ohjeet ja teorian ai-heen ympärillä sekä tapoja laskennan suorittamiseen käytännössä. Tutkimus sisältää kes-keisimmät datavaatimukset, laskentatavat ja käytännön ongelmia, jotka liittyvät kuljetus-päästöjen mittaamiseen ja joiden esittelystä muut organisaatiot voivat hyötyä. Jatkotutki-musehdotukset sisältävät kestävään toimitusketjujen hallintaan ja kestävän kehityksen suoritusmittaamiseen liittyvien viitekehysten ja parhaiden käytäntöjen selkeyttämisen.
Asiasanat Suorituskykymittaus, KPI, toimitusketjun hallinta, kestävä toimitusketjun hallinta, CO2 päästöt, konstruktiivinen tutkimusote, CRA
Säilytyspaikka Jyväskylän yliopiston kirjasto

5
CONTENTS
LIST OF TABLES AND FIGURES...................................................................... 7
KEY CONCEPTS .................................................................................................. 8
1 INTRODUCTION ....................................................................................... 9
1.1 Background ....................................................................................... 9
1.2 Purpose of the study ...................................................................... 10
1.3 Research question and objectives ................................................. 12
1.3 Scope and limitations ..................................................................... 13
1.4 Structure of the study .................................................................... 15
2 SUSTAINABLE SUPPLY CHAIN MANAGEMENT .......................... 17
2.1 Supply chain management today ................................................ 17
2.2 Sustainable supply chain management in literature ................. 19
2.3 SSCM frameworks .......................................................................... 21
2.3.1 SSCM frameworks in the future ........................................ 24
2.4 Link to strategy and values ........................................................... 26
3 SUSTAINABILITY KEY PERFORMANCE INDICATORS ................ 28
3.1 Basics of performance measurement ........................................... 28
3.2 Framework of key performance indicators ................................ 30
3.3 Reporting guidelines and standards ........................................... 34
3.3.1 Global CO2 emissions ......................................................... 34
3.3.2 Relevant frameworks, guidelines and standards............ 37
4 METHODOLOGY AND RESEARCH MATERIALS ........................... 41
4.1 Case company ................................................................................. 41
4.2 Research approach and methodology ......................................... 42
4.2.1 Constructive research approach ........................................ 42
4.2.2 CRA in the context of the study ........................................ 44
4.2.3 Research process .................................................................. 47
4.3 Research materials and data ......................................................... 48
4.3.1 Data collection ...................................................................... 48
4.3.2 Qualitative research materials ........................................... 50
4.3.3 Archival data ........................................................................ 52
5 DESCRIPTION OF THE DEVELOPMENT PROCESS ........................ 55
5.1 The formula of CO2 emissions in transportation ...................... 55
5.2 Analysis of the CO2 transportation KPI ..................................... 58
5.2.1 Sustainability KPIs in case company’s strategy .............. 58
5.2.2 Current calculation formula ............................................... 60
5.3 Calculation opportunities and challenges .................................. 69

6
5.4 Summary of the improvements .................................................... 73
5.4.1 Short-term changes .............................................................. 73
5.4.2 Long-term development ..................................................... 75
5.5 Assessing the results through the weak market test ................. 77
6 CONCLUSIONS ........................................................................................ 79
6.1 Results of the study in the light of existing theory .................... 79
6.2 Evaluation of the study ................................................................. 81
6.2.1 Validity and reliability of the study .................................. 82
6.3 Future research ............................................................................... 83
REFERENCES ..................................................................................................... 85
7
LIST OF TABLES AND FIGURES
Figure 1. Triggers for adopting sustainable supply chain (Seuring & Müller, 2008) ........................................................................................................................................ 20
Figure 2. Foundations of SSCM framework (Varsei et. al., 2014) ......................... 23
Figure 3. Six elements of sustainable supply chains (Hassini et. al., 2012) ......... 24
Figure 4. Transitions of PM and PMM (Taticchi et. al., 2013) ............................... 29
Figure 5. Four types of performance measures (Parmenter, 2010, p.2) ............... 31
Figure 6. CO2 emissions (Friedlingstein et al.: Global Carbon Budget 2020) ..... 35
Figure 7. Global CO2 emissions based on GCP data (WRI publications, 2020) . 35
Figure 8. CO2 emissions of energy sector based on CAIT data (WRI and Climate Watch Data, 2020) ........................................................................................................ 36
Figure 9. Overview of GHG Protocol scopes and emissions across the value chain (Scope 3 Standard, 2011) ............................................................................................. 38
Figure 10. Dimensions of the weak market test (Labro & Tuomela, 2003) ......... 44
Figure 11. Case company's CO2 visual in PBI ......................................................... 56
Figure 12. Accounting for emissions from transportation and distribution of products (GHG Scope 3 standard, 2011) .................................................................. 62
Figure 13. The shares of CO2 emission sources in the case company ................. 64
Figure 14. Emission factors for truck deliveries (source: VTT Lipasto website) 66
Figure 15. feasibility and value of development ideas ........................................... 70
Figure 16. The weak market test and created constructions ................................. 78
Table 1. Constructive research approach and the structure of this master's thesis ........................................................................................................................................ 46
Table 2. Description of the research process ............................................................ 47
Table 3. Conclusion of the arranged meetings ........................................................ 52
Table 4. Collected archival data ................................................................................. 54
Table 5. Case company's CO2 emission factors ...................................................... 58
Table 6. CO2 emission factor formula for truck (formula adopted from VTT Lipasto website) ........................................................................................................... 66
Table 7. CO2 emission factor with different cargo weights .................................. 67
Table 8. Illustration of the behaviour of CO2 emissions based on different emission factors ............................................................................................................ 68
Table 9. Short-term changes and long-term development .................................... 77

8
KEY CONCEPTS
Below is a list of key concepts of the study. The reason for following conceptual definitions is that they help to narrow the scope of the research topic and descrip-tion of the study and the findings are easier to understand, when key concepts use the same definition throughout the whole study. GHG PROTOCOL = Greenhouse Gas (GHG) protocol is a joint product of the World Resources Institute (WRI) and the World Business Council for Sustainable Development (WBCSD). The protocol provides accounting and reporting stand-ards, sector guidance, calculation tools and trainings for business and govern-ment. The protocol has published comprehensive and globally useable frame-works for managing emissions in public and private sector. KPI= Key Performance Indicator is a metric or measurable value that is used for measuring the success of an organization in some important activity. MEASURE = Measure is the extent, quantity, amount, or degree of something as determined by measurement or calculation. In this context a measure means cal-culating the distances of transporting products and volumes of how much prod-ucts are transported. SCM= Supply Chain Management means the management of the flow of goods and services moving between different stakeholders. Supply chains cover every-thing from purchased raw materials to finished products and product develop-ment to the information systems needed to direct these undertakings. SSCM= Sustainable supply chain management (SSCM) is the strategic, transpar-ent integration and achievement of an organization's social, environmental, and economic goals in the coordination and flow of key organizational business pro-cesses for improving the long-term economic performance of the individual com-pany and its supply chains. SCOPE 3 STANDARD= Scope 3 Standard is a part of GHG protocol framework which includes all indirect emissions that occur in company’s value chain, ex-cluding emissions from direct sources owned and controlled by the reporting company and purchased electricity, steam, heating and cooling consumed by the reporting company. TBL= Triple Bottom Line is an accounting framework which consists of three di-mensions of performance: environmental, social and financial. The framework can be adopted to evaluate organizational performance in a broader perspective to create greater business value.

9
1 INTRODUCTION
1.1 Background
Today, organizations measure their performance and evaluate their success in various ways. Many stakeholders in- and outside the organization are interested in organization’s performance, both in a longer term and in daily operations. Es-pecially private sector corporations are viewed through a magnifying glass by their owners and investors. For a long time, a common understanding has been, that gaining value for shareholders is one of the key principles that corporations have. In fact, shareholder value is a widely used as a success indicator itself (Matzler, Hinterhuber, Daxer & Huber, 2005), when evaluating the performance of an organization.
Within the last decade, there is a growing consensus, that organizations and especially corporations, should not only be efficiently managed, but also act in a sustainable way (Koh et. al., 2013). Organizations’ stakeholders place more and more emphasis on the importance of environmental management topics (Hen-riques & Sadorsky, 1999) and in addition to economic evaluation and planning, firms must consider different social and environmental issues, when they are as-sessing their performance (Koh et al., 2013.) All in all, both business and academic world are highly interested in green and sustainable supply chain management and its development (Vachon& Klassen, 2007; Bai & Sarkis, 2012).
Later, the idea of creating value for shareholders has evolved to creating value for all stakeholders, such as employees, customers, partners, and consum-ers. Stakeholder value reflects companies’ responsibilities and commitments es-pecially from a broad perspective, which in addition to investors and owners of the company includes also employees, customers, suppliers, and environment (Mathur and Kenyon, 1997). The relationship between customer satisfaction and stakeholder value has been raised as an important topic in academic world, and many studies have been conducted about the topic in the 21st century (e.g., Matzler et. al., 2005; Anderson, Fornell & Mazvancheryl, 2004). If the value crea-tion for different stakeholders is at least one of the key aspects why companies exist, sustainable supply chain management can be argued to play a key role in that picture, since it contributes to value creation in a broad way (e.g., Freeman, 1984; Banerjee, Iyer & Kashyap, 2003).
As stated in the previous section, sustainability as a wider topic is increas-ingly important to all kinds of companies when suppliers, partners, investors, and consumers want to know more and more about companies’ ethical and en-vironmental performance. To be able to answer internal and/or external ques-tions related to sustainability and environmental friendliness, it would be bene-ficial for companies to know the state of their sustainability performance. The

10
ability to communicate about sustainability performance also includes defining targets for the future and measuring how those goals are progressed.
Furthermore, as a background for this case study, KPI measurement and sustainability performance as separate topics come straight from the case com-pany’s recently renewed strategy. Sustainability is linked to the core of case com-pany’s values and sustainability partly guides the business towards the future. Starting point for this study was the state of current sustainability key perfor-mance indicators (KPIs) of the case company, that have been selected to indicate the sustainability performance in company’s supply chain area. The company has two recently created sustainability KPIs in supply chain, which have been intro-duced as official key performance indicators. Since the selected indicators are first of their kind for the case company, further investigation and comprehensive development of the measures is warranted. Consistency of the targets over time, estimation values included in the calculation of the measures, and the fit to the market of the KPIs are the things to look on when the possibilities to develop the indicators further are identified. Due to the possible use of sensitive information related to the case company, the study recognizes the case company as an anon-ymous company X.
1.2 Purpose of the study
The case company has two main KPIs measuring sustainability in the supply chain area. These KPIs are measuring the use of plastic in their products and company’s logistic efficiency through 500km radius and CO2 emissions. The plastic usage is reported as a share of products using plastic in packaging and CO2 emissions as a total amount of CO2 caused by transportation of products. To be able to have consistent study with sufficient level of detail and information, this master’s thesis concentrates only to one of the two sustainability KPIs. The purpose of the study is to evaluate the functionality of one of the created KPI measures, and to form a documented view of the current calculation method and ideology behind it. Furthermore, suggestions how to develop the measure fur-ther through short-term improvements and long-term ideas are introduced dur-ing the study. The research problem of the study is the potential for improving the KPI for measuring CO2 emissions during the development process.
Relevance and novelty value of the study can be argued by pointing out at least a few things supporting the suggestion that the research topic is interesting and important. First, innovations related to sustainable development in all oper-ations and also in the field of supply chain area part of the future. The talk and concept of corporate sustainability or business sustainability has grown in recog-nition and importance (Labuschagne, Brent & Van Erck, 2005) and the value of sustainability knowledge probably continues to increase in the future. Further-more, transportation of goods is one of the most significant and cost-intensive

11
activity in supply chain and according to Kumar et. al. (2019) freight transporta-tion is one of the major contributors to total CO2 emission. It is reasonable to try to develop the transportation towards more environmental friendly transporta-tion activities. According to Pathak et. al. (2019) transportation plays a key role in the sustainable economy, because it contributes to one-fifth of greenhouse gas emissions alone in European Union countries.
Second, when looking at the bigger picture of greenhouse gas (GHG) emis-sions in a global level, the accuracy to concentrate to one greenhouse gas, Carbon dioxide (CO2), is valid. Several global research institutes, programs and projects, e.g., World Resource Institute (WRI), Global Carbon Budget (Friedlingstein et. al., 2020) and Climate Watch Data (CWD) have been publishing GHG emission data for years, and the trend of growing emissions is rising in every publication. The main sources of CO2 emissions are in general energy consumption, deforestation, industry, traffic, agriculture, waste disposal and transportation. According to all previously mentioned research institutes, CO2 emissions have significant effect on the global warming and there is a real need to reduce CO2 emissions in the future.
Furthermore, when looking at the research topic from a smaller perspective, it is justified to examine the issue precisely from the point of view of supply chain management (SCM). By searching research studies with key words like Supply Chain KPIs, CO2 transportation emissions, CO2 Measurement, SSCM and Sup-ply Chain Management, several recently conducted studies and research papers (e.g., Vachon & Klassen, 2007; Arora & Kaur, 2015; Badawy et. al., 2016, Arif-Uz-Zaman & Ahsan, 2013; Melnyk et. al., 2009; Chae, 2009; Koh et. al., 2013; Bai & Sarkis, 2012, 2014; Taticchi et. al., 2013, 2015; Ahi & Searcy, 2015) can be found. The fact that many researchers have recently studied topics related to sustainable supply chain (SSCM) indicates the academic importance of the topic. According to most of the studies listed in the examples, the trend of studying sustainability issues has been rising in the 21st century and that partly supports the researcher’s assumption that both sustainability, and key performance indicator measure-ment in supply chain increase their importance towards the future.
Sustainable development is also a topical issue in the news and there is a lot of talk about private sector corporate responsibility. Also, the study provides new information value for the case company. Novelty value for the case company is created by creating practical solutions for improving the current KPI, and by presenting long-term development ideas for the future actions. The development work is executed in tight collaboration with the case company’s personnel and development process follows the structure of constructive research approach (CRA) (Kasanen, Lukka & Siitonen, 1993; Labro & Tuomela, 2003; Lukka, 2000, 2002, 2003; Jönsson & Lukka, 2005). Empirical study of this master’s thesis builds as the actual research process progresses, and the work evolves throughout the research period. As such, the study follows the form of abductive reasoning method (Modell, 2009; Anttila, 2014) and empirical data has been collected by using mixed research method (Modell, 2009; Schoonenboom & Johnson, 2017).

12
1.3 Research question and objectives
This study has two main objectives. First is to assess the accuracy and reliability of the current calculation method of the CO2 KPI, which measures the emissions caused by transportation of finished products. Based on this information, the sec-ond objective is to execute all development proposals in practice that are cur-rently possible, and introduce improvement ideas that could be executed later in the future. Development ideas are divided into more practical, short-term im-provement proposals and long-term development actions.
Based on the above discussion about study’s objectives; this study employs the constructive research approach (CRA). CRA means an interventionist re-search method, where the researcher makes practical innovations based on the contribution of theory (Labro & Tuomela, 2003). CRA resembles consulting in a way that the aim is to solve a real-life problem by conducting changes in practice, but the difference comes from the incorporation of theory. Westbrook (1995) identified features that differentiate CRA and consulting. In addition to only re-porting success as usually in consulting, constructive approach concentrates to the paths and obstacles leading to the result and makes comparison with other relevant research studies. Furthermore, like consultants, CRA also shares the same goal with selected case company but it is only a one part of larger primary goal, which can have value to other parties than the case company as well. In this master’s thesis the common goal with the case company is the development of chosen sustainability KPI, but the larger goal also involves the current way to measure sustainability in supply chain and possibilities towards the future in general.
Research questions, objectives and scope of the study have been developed and specified throughout the planning and starting phase of this master’s thesis process. This research has been carried out by listening to the needs of the case company, so limiting the research and finding suitable research questions brought up their own challenges. However, after successful clarification and suit-able limitations, the study focused only to validate and develop the calculation of CO2 emissions in transportation and following research question was created:
1. How the case company’s CO2 emission KPI in transportation could be val-
idated and developed further in practice? In the previous section 1.2 several arguments were listed on behalf of the rele-vance and importance of the selected research topic and it was pointed out that quite many recent academic studies have been conducted about SSCM and sus-tainable performance measurement. Although, most of these studies focus on the SSCM from the overall sustainability perspective, so more precise and very prac-tical issues and limitations concerning e.g. only environmental side of the sus-tainability through SSCM are warranted.

13
In addition, that precise and practical sustainability performance measurement issues are topical to investigate in today’s academic literature, the selected re-search question can be considered to be suitable for this particular case study. The research question approaches the topic from future-driven perspective and tries to create good KPI measure through development work process. The two objectives of the study fit to a practical research question and they are both rep-resented well in same sentence. Furthermore, one research question is easy to understand from reader’s perspective and clear to answer from researcher’s per-spective. When the study has a clear research problem which is limited to only one research question, it is also easier to make suitable limitations and dive deep in the selected topic from many perspectives.
The selected research question includes academic contribution in a way, that other organisations can use the study as a base for their own sustainability measurement and compare different ways to execute the measurement of CO2 emissions. The research question consists of two main parts, validation of the current measure and development of it. Validation is created through the combi-nation of academic research and regulation and guidelines of third party organi-zations. Development in practice is executed jointly with case company’s person-nel in supply chain. A question about the ideology behind the calculation method was not set as a separate research question, but, to be able to answer to the re-search question properly, a clarification of the current calculation method needs to be conducted in the beginning of the study. The reason being, that the case company would benefit if the logic behind the measure is documented and clar-ified. To be able to develop the calculation towards a stage where the KPI num-bers could be communicated outside the organization, company’s personnel need to know where the numbers are coming from and how they can be affected. Also, target setting for future years gets easier and the set targets may reflect the reality better.
1.3 Scope and limitations
When evaluating the validity and development possibilities of sustainability key performance indicators and their calculation, the study should start from the ac-tual purpose of the KPIs and the strategy behind them. What sustainable trans-portation and sustainable supply chain management (SSCM) mean and how can they be described? When the basics of SSCM are clear, the question is how to measure the success related to them? When a calculation is performed and the result is e.g., a value of 50 kilos in total CO2 emissions per delivered tonne, is the amount good or bad, high, or low? How much is the calculated 50 kilos in the light of product’s lifecycle and sustainability in general? Furthermore, when the amount of CO2 emissions has been calculated, is the calculated number compa-rable to competitors and guidelines?

14
As mentioned earlier, the scope of the research changed a couple of times in the beginning, before one research question could be specified. During the first dis-cussions with the company personnel, who have expertise in controlling, product portfolio management, sustainability, and business development, the fact, that both sustainability KPIs in Supply Chain require closer observation became clear. Even though both KPI measures belong under the same function and the same topic, their nature is very different.
After the first-round comments in August and September, the study con-centrated only to the calculation of CO2 emissions in transportation. Due to dif-ferences in supply chain sustainability KPIs, it is hard to approach them from the same perspective. Thorough investigation of both KPIs does not fit into one mas-ter’s thesis and it probably would not be even wise to do so. CO2 emission meas-ure is very data driven and the accuracy depends highly on the quality of the data or estimated numeric values. Same logic applies to the localization of trans-portation. On the other hand, the share of plastic free products is more funda-mental and qualitative KPI, and the nature of the plastic KPI is more future-driven and ideological. Also, the possible actions of the case company are highly dependent on their suppliers product development because e.g., with the plastic wrapping foils, the case company cannot decide to develop alternative foil mate-rials alone.
Furthermore, the current calculation methods of the sustainability KPIs are fairly new, and they can be described as the first draft versions that the case com-pany has created. The strategy of the case company was recently renewed, and due to that, the sustainability targets were moved to the core of the business ide-ology and values. The calculation models were built based on data that was avail-able at the time, and a lot of estimated values were included in the actual formula of CO2 emissions. Now, it is necessary to check the suitability and accuracy of these values, which are not considered as actual data coming straight from the company’s ERP system.
Second, after the KPI measure was built and tested in daily operations and monthly reporting, problems related to validity of the calculation method and visualization in PowerBI were recognized. After already mentioned pre-work discussions with the case company’s personnel it was recognized, that the devel-opment of both indicators can be divided into the measure itself (1), the calcula-tion method and data (2) and the accuracy of targets set for the future (3). If all these aspects are combined, the work considering only one indicator requires a lot of effort and time of many people. If both two indicators were included to this development process, the scope of the study would be too wide.
Furthermore, sustainability in supply chain can have different dimension when more targets are included in the scope, and sustainability as a topic affects to every function of the whole organization. Triple bottom line (TBL) framework in the context of supply chain (Biswas et al., 2018) divides the framework in three different dimensions: social, economic and environmental. This study concen-trates only to discuss supply chain in the context of environmental issues, and

15
the other two dimensions are left out. Also, to be even more precise, the study highlights only those environmental topics within sustainability, which are rele-vant mainly from the product transportation and logistics perspective. Of course, within the transportation perspective for example financial perspective and cus-tomer cooperation perspective are very important, but this study leaves other more specific perspectives with less attention.
In conclusion, limitations of the study concern the amount of KPIs included in the scope and the generalization of the selected method. Even though the study can be used to reflect sustainability KPIs in general, the study tries to identify the best way to measure this specific KPI for the case company. Furthermore, this means that the proposed measure may look different in some other organization with different data possibilities, targets and ways to work. Despite of that, the study provides general information and useful guidance about calculating CO2 emissions in product transportation, which can be utilized in many kinds of or-ganizations due to same basic principles introduced in the research.
1.4 Structure of the study
This study has six separate chapters, which include sections and further sub-sec-tions. The first chapter consists of introduction to the topic, general background, and basic information about the master’s thesis work. Furthermore, the purpose of the study, research questions and the main objectives are explained and de-fined, and lastly, the scope and limitations are recognized. After the first intro-duction chapter, two following chapters introduce the theoretical framework of the study, which consists of explanations, concepts and theories in the literature regarding the research topic. The aim is to build a base for sustainability key per-formance indicator (KPI) measurement in supply chain area and in general.
Theoretical framework starts with one of the key concepts, supply chain management (SCM) and its basic aspects. In the next section, SCM is expanded to include sustainability with the explanation of sustainable supply chain man-agement (SSCM). Furthermore, SSCM is tied together with organizational strat-egy and values and common guidelines and relevant standards related to sus-tainability KPIs and reporting provided by third party organizations are intro-duced. The second theoretical framework is linked to performance measurement by explaining the nature and purpose of KPIs in general, and also from sustain-ability point of view. The chapter starts with general explanation of performance measurement and expands to concentrate to KPIs in more detail. Furthermore, a discussion of global CO2 emissions and introduction of relevant standards and guidelines are introduced.
Furthermore, the case company, methodological framework, and research materials are introduced in chapter four. After the introduction of methodologi-cal approaches and collected archival and qualitative materials, the actual devel-opment process is described. The current ways to calculate, present and measure

16
transportation emissions are presented and evaluated in the light of current lit-erature and other studies. Knowledge collected from the field helps to validate the calculation method, so arguments based on researcher’s benchmarking work are also presented. The link between research and empirical data is built through investigating the latest trends and suggestions how to perform the measurement first, related to CO2 emission calculation and second, in industrial companies in general. Lastly, the results based on the analysis are put together by describing the short-term changes and long-term development suggestions. The develop-ment process chapter goes hand in hand with the structure of the main theoretical framework process, constructive research approach (CRA). Finally, the master’s thesis ends with an evaluation of reliability and validity of the study and the whole case is summarized into short conclusions.

17
2 SUSTAINABLE SUPPLY CHAIN MANAGEMENT
2.1 Supply chain management today
In the academic literature, several definitions of supply chain management (SCM) have evolved over the years. Sukati et. al. (2012) define supply chain as “the set of value adding activities by connecting the enterprise’s suppliers and its cus-tomers” and according to Lambert & Cooper (2000) “Supply Chain Management is the integration of key business processes from end user through original sup-pliers that provides products, services and information that add value for cus-tomers and other stakeholders.” According to Melnyk et. al. (2009) the roots of term supply chain management can be traced back to the work of Forrester (1958) and system dynamics theory, where he attempted to understand the product de-livery system as a whole chain that can be modelled. The use of term supply chain management in the academic literature increased in the early 1980’s and since then, the importance of it has increased rapidly (Lummus & Vokrurka, 1999). Successful SCM can improve firm’s competitiveness (Lummus & Vokurka, 1999) and today, one part of realising the vision and goals through the corporate strat-egy is to have aligned supply chain strategy supporting the overall strategy of an organization (Schnetzler, Sennheiser & Schönsleben, 2007).
SCM has been under major transformation and it has been increasing its importance as a competitive advantage creator for organizations’ business (Sukati et. al., 2012; Melnyk et. al., 2009). In today’s literature, supply chain man-agement refers to a logic that comprises different dependent parties, activities, actors, and resources together. It comprises dependencies in, between and across companies, for example from manufacturers and suppliers to customers and con-sumers (Svensson, 2007). According to Mentzer et. al. (2001) SCM can be divided into three main categories: it is a management philosophy, implementation of that philosophy and a set of actual management processes. These three categories include systematic and strategic coordination of business functions and the pur-pose to improve long-term performance in both ways: the company as an indi-vidual and the whole supply chain including all or part of the included depend-encies.
Traditionally as cost- and order-oriented, delivery-based and tactical de-scribed supply chain has changed towards more strategic nature. Often SCM re-sembles only logistics and transportation of products and materials, but lately it has been raised into discussion, that SCM is a lot more than just a logistical chain of transported items. Future supply chains are actually strategic assets for organ-izations and very strategically-focused, design-oriented, dynamic, and driven by customer objectives (Melnyk et. al., 2009). SCM consists of the whole value chain of the company and is very widespread. The new philosophy of supply chain

18
management emphasizes the integration and collaboration of internal and exter-nal activities and parties of the whole value chain (Tan, Lyman & Wisner, 2002). SCM is more and more design-oriented, dynamic and customer driven field where firms and managers find opportunities and face new challenges (Melnyk et. al., 2009).
In the nature of effective SCM it is important to build and sustain competi-tive advantage in total among SCM area. Lean and agile way of managing supply chains has become a key factor in defining and designing today’s supply chain strategies. According to Schnetzler et. al. (2007) a supply chain strategy means a set of SCM related targets which are focusing on improving business success and organizational performance, and measures to achieve them. Common SCM tar-gets are e.g., meeting customer demands, flexibility, on-time deliveries, cutting costs and lead-time (Schnetzler et al., 2007). Furthermore, according to Sukati et. al. (2012) lean supply chain employs continuous improvement and focus on elim-inating wastes across the supply chain operators. In addition, innovative prod-ucts require new and complex technology and agile management of supply chains. Agile supply chain responds to rapid changes in global markets by being dynamic and flexible across different organizations within the supply chain. When supply chains are required to be lean and agile at the same time, a term hybrid supply chain can be used. Hybrid supply chains combine the capabilities of lean and agile supply chains by combining features from both of them (Sukati et. al., 2012).
The future supply chain is linked to and driven by organizations strategy (Melnyk. et. al., 2009; Tan et. al., 2002) and an integrated supply chain requires a massive commitment of all parties within the whole value chain (Tan et. al., 2002). Nowadays, SCM is an important strategic tool for companies, and it has a signif-icant strategic role for companies in evolving and improving their actions in cus-tomer service, quality and competitive success (Tan et al. 2002).When Melnyk et. al. (2009) mapped the future of SCM, they concluded that “the goal of future sup-ply chain is not simply efficiency (doing things for less); it is effectiveness (doing the right things). It has become a strategic asset, not simply a function for storing boxes and moving products.” Later, e.g., Garcia and You (2015) identify supply chains as large and complex entities, and in addition to Sukati et. al. (2012) they recognize the need to design supply chains with optimized way.
Because of the rapidly changing nature of supply chains (Melnyk et. al., 2009) researchers have identified challenges towards the future considering the changing SCM area. According to Garcia and You (2015) the growing area of or-ganization-wide optimization and the growing importance of energy and sus-tainability issues provide plenty of opportunities for supply chain design re-search but it also creates major complexity and challenges in the future. First, there are three major multi-chain areas where knowledge gaps can be addressed in supply chain design. In addition to sustainability challenges, areas concern multi-objective and multi-player challenges (Garcia and You, 2015) which make SCM even more challenging and complex in the future. Furthermore, Melnyk et.

19
al. (2009) conducted a study where they identified issues considering the future of SCM together with researchers and supply chain professionals. Their findings include five topics which are considered as the most important issues in the fu-ture. According to Melnyk et. al. (2009) there is a need to pay more attention to supply chain risks and disruptions, the nature of leadership within supply chain, time management of delivered goods and services, management of product in-novations by drawing on the capabilities of the supply chain, and implementa-tion of appropriate technology to allow seamless exchange of information within the whole supply chain. To retain competitiveness, realise operational and finan-cial performance and minimize unacceptable risk organizations and managers need to face these issues in the coming years by transitioning to a more strategic approach to SCM (Melnyk et. al., 2009).
2.2 Sustainable supply chain management in literature
Sustainable supply chain (SSCM) emphasizes the ecological, economical, and so-cial aspects of companies and business practices combined with theory. SCM in general is an old topic in academic literature (Melnyk et. al., 2009), but the con-cept of SSCM is relatively new and raised into to academic literature in the mid-90’s (Seuring & Müller, 2008). The term of SSCM is obviously tied to SCM, but according to Svensson (2007) it requires a broadened approach of traditional SCM. Svensson (2007) points out that many theoretical views in literature are somewhat bound together ideologically, even if the concepts are isolated. By that Svensson (2007) means aspects such as corporate social responsibility, sustaina-ble supply network management, green purchasing strategies and life-cycle as-sessment. All these explain and emphasize the same kind of topics e.g., recycling, waste disposal, material substitution, source reduction and returns of products from different approaches. As a broadened approach, SSCM could be a common fundament to glue these topics together for more comprehensive approach.
Sustainability as a common topic has increased its importance among SCM and there has been a particular focus on the areas of green supply chain manage-ment and reverse logistics (Taticchi et. al., 2013). Both, academic and corporate world have recognized the growing interest related to sustainability issues (Seuring & Müller, 2008) and key contributions have emerged to touch many ar-eas including strategy, finance, environmental operations and policy-making, product design, supplier relationship management and after-sale customer ser-vice (Taticchi et. al. 2013). According to Cazeri et. al. (2017), the reason sustaina-bility has become more important in the area supply chain management, is the rapid over-consumption of raw materials, dystrophy of environment and in-creased level of global pollution.
Sustainability includes the social, economic, and environmental aspects in companies’ business operations, in other words the TBL approach (Biswas et al.,

20
2018). In order to maintain competitiveness, supply chain members should con-sider all of them to be able to fulfil stakeholder requirements (Taticchi et. al., 2015) and from the SCM point of view, these three pillars indicate the managerial prac-tises to achieve sustainability. Taticchi et. al. (2013) identify them as the impera-tive to reduce negative environmental and social impacts, the consideration of all stages of the value chain and a multi-disciplinary perspective which recognizes the entire lifecycle of each product.
There are several incentives driving companies to adopt the ideology of SSCM, but there is no clear definitions or listing of them in the literature that can help practitioners set their sustainability goals and focus their sustainability-re-lated actions according to the priority established by different stakeholders and drivers of SSCM (Saeed & Kersten, 2019). According to Seuring & Müller (2008) the starting points are the external pressure towards two different strategies: sus-tainable products or supplier and partner evaluation to eliminate risks. Corpo-rate regulation, such as ISO standards, is followed by requirements from other stakeholders than regulative parties, such as customers, environmental groups, and consumers. Companies need to response to stakeholders’ questions and con-tribute an open communication, but they also want to prevent negative things, such as reputation loss, to happen. In addition, Seuring & Müller (2008) also point out, that the idea of adopting SSCM ideology can be based on the motivation to bring competitive business advantages.
Figure 1. Triggers for adopting sustainable supply chain (Seuring & Müller, 2008)
The multidimensional nature of SSCM is more and more visible in the future when operators in the whole value chain have an effect to the sustainability of the supply chain. The triggers for adopting SSCM framework into the organiza-tion are presented in the figure above (Seuring & Müller, 2008). Seuring and Mül-ler (2008) address in their study, that when the focal company in question is pres-sured e.g., to communicate the sustainability of product lifecycle, it passes the responsibility also to its suppliers. The pressure emerges among different parties

21
and while the company might e.g., want some data from their product transport-ers to perform a lifecycle calculation, at the same time they need to provide in-formation e.g., to their retailers. In this sense, when it comes to SSCM, companies often have two or more roles —they are receiving and providing information at the same time.
Also Saeed & Kersten (2019) conducted a study where they identified and analysed drives for companies to adopt the sustainability initiatives and imple-ment sustainable solutions throughout their supply chains. According to Saeed & Kersten (2019) “Organizations are now compelled to identify and implement innovative and sustainable solutions, not only within their organizations’ bound-aries, but also across the whole supply chain network”. They identified alto-gether 40 individual drivers for SSCM which they categorized into external and internal drivers and based on their level of access to supply chain knowledge and value-contribution to primary and secondary drivers. Based on the literature, ex-ternal drivers play a bigger role in adopting SSCM than internal ones, and regu-latory drivers are the most essential ones. In the internal driver category Saeed & Kersten (2019) identified, that the corporate strategy and the organizational re-sources clusters are the most important ones.
Furthermore, especially customers’ and consumers’ interests are highly to-wards the lifecycle management of products and their sustainability (Seuring & Müller, 2008). Biswas et. al. (2018) studied the context of supply chain through three different TBL dimensions and concluded, that organizations’ social and en-vironmental effort improves supply chain performance and consumers are will-ing to pay extra for environment friendly and socially responsible produced and provided products. Biswas et. al. (2018) addressed in their paper, that there is a widespread belief that often greening investment might lead to reduction in prof-itability of an organization, but their results indicate that implementation of TBL framework actually increases organizations’ profit. Therefore, they suggest, that managers should be motivated to put more and more efforts for both greening and corporate social responsibility (CSR) dimensions, also within supply chain area.
2.3 SSCM frameworks
Sustainability in the supply chain management context presents challenges as well as opportunities for organizations and their supply chains (Saeed & Kersten, 2019). Because of the increased interest towards sustainability in supply chain context and the widely recognized change in the nature of SCM (Seuring & Mül-ler, 2008; Garcia & You, 2015; Taticchi et. al., 2013, 2015; Saeed & Kersten, 2019; Varsei et. al., 2014, Hassini et. al., 2012), researchers have defined and developed scientifical frameworks to describe the nature of SSCM today. To introduce a few examples, for instance Ahi & Searcy (2013, 2015), Hassini et. al. (2012) and Varsei

22
et. al., (2014) have created frameworks describing the sustainability performance measurement in supply chains.
In 2013, Ahi & Searcy summarised 13 key characteristics of SSCM to inte-grate current understanding about the complex nature of the SCM and in 2014 they collected and evaluated the existing performance measurement metrics that were published in the field of SSCM. After an extensive review on existing met-rics in 2013, they created an original conceptual framework for structuring the development of metrics in green supply chain management (GSCM) and sustain-able supply chain management. Later, they came to a conclusion, that there is a clear need for metrics that address the broader sustainability context in SCM and for metrics that address the entire spectrum of SSCM. The conceptual framework of Ahi & Searcy (2015) describes the SSCM framework as round-shaped figure, where the outer line includes different aspects, such as “efficiency”, “value”, “stakeholder” and all dimensions of TBL. The second layer is the context of sus-tainability within supply chain, which includes similar operators in supply chain as in the framework of Seuring & Müller (2008). Ahi & Searcy (2013) identified six operators: the focal firm, supplier, end of life management, end-user, retailer and distributer. Operators are in two-dimensional relationship with each other, and operate all in the same area of sustainability and supply chain management.
In addition, Varsei et. al. (2014) present a framework with multidimensional indicators for designing supply chains. They bound the framework of SSCM to strategical planning and long-term organisational objectives. The framework can serve as a tool for research scholars and supply chain practitioners in identifying and assessing various economic, environmental and social performance indica-tors. Their findings included that development and assessment of SSCM is being increasingly incorporated as part of traditional SCM. They developed the frame-work based on the metrics available in the literature on sustainable supply chain management as well as the broadly adopted GRI sustainability guidelines. The foundation framework created by Varsei et. al. (2014) is presented below and it separates two groups, drivers and enablers, affecting the three dimensions of sus-tainability. Eventually, performance measurement in SSCM is conducted through these three TBL dimensions.

23
Figure 2. Foundations of SSCM framework (Varsei et. al., 2014)
Final framework example is created by Hassini, Surti and Searcy (2012), who fo-cused on combining SSCM and performance measurement based on literature from 2000-2010 in their framework. The framework consist of six elements in-cluding sourcing, transformation, delivery, value proposition, customers and product use along with reuse, recycle and return. Hassini et. al. (2012) completed and specified their framework by specific aspects within every identified element of the framework. Below presented Hassini’s, Surti’s and Searcy’s (2012) figure consists of the six elements of their original framework and separates also single aspects within each element, e.g., GHG emissions and transportation.

24
Figure 3. Six elements of sustainable supply chains (Hassini et. al., 2012)
2.3.1 SSCM frameworks in the future
Even though many frameworks concerning sustainability performance measure-ment and sustainable supply chain management have been published in the lit-erature, many researchers have concluded, that more studies and research

25
should be conducted in that area. Sustainability topics and environmental per-formance measurement have increased their importance during the recent dec-ades and increased importance have also triggered states and third party organ-izations to create multiple guidelines and standards to guide and unify sustaina-bility performance measurement. According to Taticchi et. al. (2015) regulation and guidelines for measuring sustainability performance tend to focus on the en-vironmental side of the sustainability, and several studies on the environmental performance measurement of SSCM have been conducted.
Later, Ahi & Searcy (2015) identified and reviewed over 2500 published metrics in the literature on green supply chain management (GSCM) and sustain-able supply chain management (SSCM). Their findings suggest as well, that the majority of the published metrics were focusing on the environmental side of the SSCM. The amount of 2500 different metrics in the SSCM area indicate that there are plenty of different ways to perform the measurement in practice depending on the field and the nature of organization. The number of metrics also indicates, that many organizations have adopted the idea to measure their sustainability performance in supply chain, but it also tells how scattered the area of measuring sustainability performance already is.
According to recent study from 2018, authors Büyüközkan & Karabulut made the same notification than all the other researchers previously have con-cluded: sustainability is a trending topic in the literature. Despite of that, they address that the majority of the thousands of identified publications related to sustainability are actually “extensively environment-focused, interchanging sus-tainability with low ecological impacts and ignoring its economic and social di-mensions”. Furthermore, in addition to e.g., Ahi & Searchy (2015) and Taticchi et. al. (2015), Büyüközkan & Karabulut (2018) discovered, that the literature usually pays little attention to what to exactly measure and how to integrate and perform the measures in order to identify the sustainability performance. They also state, that sustainability performance as a new term is often ignored despite of the large amount of created literature. Taticchi et. al. (2015) summarised, that in the future sustainable performance measurement area there is a need for:
• A holistic framework including triple bottom line (TBL) approach for integrating decision-support tools (DST) with performance measurement (PM) and supply chain management (SCM)
• More research on sector specific measures and indicators for all sus-tainability dimensions of SCM
• More DSTs for incorporating inter-organisational aspects of SSCM which enable good decision-making in solving complex problems
• Exploration of issues related to the implementation of the inte-grated approach for SSCM, regarding difficulties, its usefulness and the implications for policy research

26
• More research focusing on implementing holistic frameworks and learning from industry/practice by conducting inductive, explora-tory and longitudinal studies
• More research on methods and approaches that could be adopted from other disciplines, such as conjoint analysis and discrete choice experiments
2.4 Link to strategy and values
Many organizations report to include sustainable values into the core of their strategy and to act in a sustainable and environmental friendly manner. Overall, sustainability is very trending and it is becoming a key topic among academics, regulators, and businesses (e.g., Büyüközkan & Karabulut, 2018). Still, the ques-tion why and how organizations operationalize sustainability in organizational strategy, systems and activities remains sometimes unclear. According to Sroufe (2017) the understanding of integration of sustainability, corporate strategy and organizational change management is based on multiple drives. Lozano (2015) identified a number of external and internal drivers behind the integration of cor-porate sustainability. The external drivers he found include organizational repu-tation, customer demand for transparency, regulation, societal awareness, access to resources and collaboration with external parties. Internal drivers of sustaina-bility according to Lozano (2015) are the ability to have proactive leadership, a business case for change, the precautionary principle of not harming the environ-ment, company culture, moral obligations, sustainability reporting, and avoiding risk.
Drivers to adopt corporate sustainability are very much comparable to the drivers of adopting the SSCM ideology to the company. As stated before, the supply chain strategy should be aligned with the corporate strategy (Schnetzler et al., 2007) and the corporate strategy, top management commitment and the organization strategy are among the most important internal factors that encour-age organizations to initiate and implement sustainability initiatives (Saeed & Kersten, 2019). Drivers e.g., regulation, requirements from customers, employees, consumers, environmental groups and cooperation partners, preventing nega-tive consequences, and even increased competitive business advantages (Seuring & Müller, 2008; Saeed & Kersten, 2019; Cazeri, et al., 2017) are reasons to include sustainability as a part of organizational strategies. As concluded in the begin-ning of the study, gaining value for shareholders is one of the key principles that today’s corporations have. If an organization is not responding to the require-ments coming from in- and outside the organization, it cannot fulfil the purpose of gaining shareholder value (Taticchi et. al., 2015).

27
Furthermore, in the private sector organizations, in addition to shareholder value, profitable growth is usually another important goal of the business. According to Cazeri et al. (2017) today’s highly competitive business environment drives companies to differentiate from their competitors by continuously searching and adopting ways to gain better environmental performance. In other words, to re-main competitive, organizations must implement sustainable practices without compromising the economical results. Many researchers (Seuring & Müller, 2008; Saeed & Kersten, 2019; Sukati et. al., 2012) state, that by implementing sustaina-bility values into organizations’ businesses, companies are able to gain competi-tive advantage, i.e. prevent compromising the economical results.
According to Bai & Sarkis (2014) evaluation and improvement of sustaina-bility performance requires identifying and developing suitable and measurable performance measurement system (PSM) for the organization. Furthermore, ac-cording to Sangwa & Sangwan (2018) the created PMS and the KPIs measuring the performance need to be aligned with the organizational targets and strategy. If sustainability is in the core of the corporate strategy, it is natural, or even re-quired to include suitable metrics to follow the sustainability performance of the business. Although, by adding sustainability dimensions on measuring, the com-plexity and size of the measure set grows, making it challenging to measure the sustainability (Bai & Sarkis, 2014).
Sroufe (2017) concluded, that integration and change management are crit-ical success factors for the advancement of strategic sustainability initiatives. In-tegration takes place through the alignment of performance metrics within and across business units and functions throughout organizations and value chains to inform management decision-making, transparency, and external reporting. Sroufe (2017) continues, that the internal motivations also include the need for management to synthesize complex paradigms such as sustainability and shared value into actionable performance metrics for the organization. The purpose of the performance metrics comes from the need to know the success in the area of sustainability. Without identifying the most important strategical objects and knowing the current state of them, it is impossible to set targets for the future or follow the progress of the performance. Furthermore, this leads to difficulties in reporting the performance for any stakeholder of the organization, which again weakens the trustworthiness of the organization and the relationships between stakeholders.

28
3 SUSTAINABILITY KEY PERFORMANCE INDICA-TORS
3.1 Basics of performance measurement
Business world has offered lots of different options for measuring whether the organization, its specific function or individual process is successful or not. Through performance measurement (PM) and performance measurement sys-tems (PMS) companies can track and follow their success and performance. Per-formance evaluation is the capability of actions and systems to obtain the objec-tives and the process of evaluating efficiency and effectiveness (Al-Ashaab et.al., 2016). PM is used to plan, design, implement and monitor proposed systems in organizations and is has many uses including the determination of the efficiency and effectiveness of an existing system or to compare competing alternative sys-tems (Hervani, Helms & Sarkis, 2005). Usually, when measuring performance, meaning the efficiency and effectiveness of action, it is measured with metrics and indicators (Ahi & Searcy, 2015). Metrics are quantitative performance measures and indicators more qualitative nature, with broadened focus.
There are more than one descriptions of performance measurement in the academic literature, but PM can be described e.g., as the process of quantifying the systems and actions of performance measurement and management (PMM) (Neely et. al., 1995) and it has notably increased its popularity within the 21st cen-tury (Taticchi et al., 2013). PM and PMM have been changing throughout the years and the perspective has shifted from management accounting through fi-nancial perspective eventually to integrated perspective which complements strategy, quality and excellence to financial perspective (Taticchi et. al., 2013). The evaluation of PM and PMM has been described in the figure below.

29
Figure 4. Transitions of PM and PMM (Taticchi et. al., 2013)
According to Choong (2013) many companies are investing resources to imple-ment extensive measures, which reflect all dimensions of their performance. Good example of these type of new dimensions are sustainability metrics and indicators, that have increased rapidly during the past years (Bai & Sarkis, 2014; Sroufe, 2017). Choong (2013) continues, that nowadays it is essential for all or-ganizations seeking for high-performance to be interested in developing and de-ploying effective performance measurement systems, in order to remain efficient and competitive. Furthermore, Taticchi et. al. (2013) underline, that changes in business emphasize the need for value creation and developing competitive ad-vantages. They continue, that in this rapidly changing business environment, the adoption of appropriate performance management and measurement frame-work has been also realized as one of the major challenges. According to Sangwa & Sangwan (2018) the dynamic changes in the field of PM have made organiza-tions to understand, that to stay competitive, organizations must focus on the continuous assessment of organizational performance.
According to Neely et. al. (2000) there are two basic approaches for design-ing PMSs for organizations: the systems approach and the organizational struc-ture approach. They also identified, that the creation process of detailed and prac-tical PMS can be a complex process. Many researchers have created different per-formance measurement tools and frameworks to understand better the best prac-tices among PM. One widely known performance measurement framework is the balanced scorecard (BSC) by Kaplan and Norton from the year 1992 which can be seen as a revolutionary framework from integrated perspective point of

30
view (Taticchi et. al. 2013), because they combined the financial measures with operational and strategical ones. As already mentioned —today’s business ecol-ogy and PMs among it are changing (e.g., Bai & Sarkis, 2014; Sroufe, 2017; Choong, 2013, 2014; Ahi & Searcy, 2015) so multiple performance measurement frameworks exist in the academic literature, and depending on the field in ques-tion, frameworks have different appearance and emphasis is on different metrics and processes to implement them. What seems to be common for all performance measurement systems and processes today, the integrated view of combining dif-ferent business dimensions together, seems to lead today’s PM discussion in ac-ademic and business world.
3.2 Framework of key performance indicators
An example of the kind of performance measurement and success evaluation tools mentioned in the previous section are key Performance Indicators (KPIs). Key performance indicator is one type of performance measure and an important performance metrics tool in management control systems. KPIs tell organizations what to do to highly increase performance by focusing on those sides of organi-zational performance that are critical for the success of the organization (Badawy, El-Aziz, Idress, Hefny & Hossam, 2016). Furthermore, KPIs as mostly quantita-tive (Badawy et. al., 2016) and measurable indicators help organizations to follow their internal processes and compare success over time. KPIs usually represent the indicators, that organizations think are the most important for them and the success and continuous of business. KPI is a component that represents the basis for evaluating the performance in organizational or individual level and it tells you what to do to increase performance (Arora & Kaur, 2015.) KPI is an indicator to set the targets for the future, but the indicator itself or the result value gener-ated through the measurement is not a goal or target. KPI does not measure atti-tude or ability to do something, it indicates just the actual performance.
Parmenter (2015, p. 4) recognizes four types (1-4) of performance measure-ment indicators. Key result indicator (KRI) tells you how you have achieved in a perspective of a critical success factor (1), result indicator (RI) tells you what you have done in the past (2), performance indicator (PI) tells what you must do in the future (3) and finally as stated before, key performance indicator tells you what to do in the future to increase performance when comparing it to past or present situation (4). Parmenter (2010, p. 2) is using onion analogy to describe the relationship between the performance measurement indicators and based on the picture below following can be argued: KPIs are in the centre of performance measurement and they tie other three performance indicators together. Also, KPI, or at least successful KPIs cannot be created, if aspects related to other three per-formance indicators are not cleared, since the KPI combines the past performance and future targets together.

31
Figure 5. Four types of performance measures (Parmenter, 2010, p.2)
KPIs can be categorized in many ways. They can be qualitative or quantitative, strategic, or operational and static or dynamic. A common way to categorize KPIs is to divide them into lagging and leading measure groups. Lagging KPIs mean indicators that are reactive, and outcome based (Zhou et. al., 2020). In general, they indicate the results and outcomes from past efforts. An example of lagging indicator in case company’s case is the number of active products in each month, as it indicates the numbers from the past and reflects the history. On the contrary, leading KPIs represent the type of measures, that are forward-looking, and input based (Zhou et. al., 2020). They drive the future performance of the company and its business operations. Lagging indicators in a way drive the future as well, be-cause based on their results one can draw conclusions, but the leading indicators point strongly towards the future by themselves. For example, if company’s stock level has increased, that can indicate too big supply towards the market or ex-pected increase in future’s demand.
Also, yet another way to group KPIs especially in sustainability perfor-mance measurement context is to divide the indicators in absolute and relative measure groups (McElroy & Van Engelen, 2012). Absolute indicators are meas-uring operational performance in a certain level and in one specific area. The level of CO2 emissions has been used as an example of absolute indicator in literature. Absolut measure measures the amount or number of something and the result is in a way very straightforward. Absolute indicators are not dependable on other measures because they tell just the actual status in time. Absolut measures be-come dynamic if the time perspective is added to the calculation, e.g., by com-paring last quartet to the current one. Relative measures on the other hand rep-resent the operational performance from correlation point of view. Correlation means that two independent measures are tied together. When thinking about

32
CO2 emissions from relative measure’s perspective, total CO2 emissions per de-livered tonne of transported goods is a good example. Correlation comes from comparing total amount of CO2 emissions to the total amount of delivered tonnes and through them calculating the average per each delivered tonne of products.
Furthermore, according to international standards ISO 22400-1 (2014) and ISO 22400-2 (2014) it is very important for organizations to be familiar with their KPIs to improve and understand their organizational performance. That is why the selection of right KPIs is also very important feature. Sangwa & Sangwan (2018) studied the development of an integrated performance measurement framework for lean organizations. They identified criteria with eight guidelines for KPI selection. These criteria are applicable also from case company’s point of view because the ideology of lean organization and streamlined processes fits well to the case company’s ideology.
First, Sangwa & Sangwan (2018) identified that KPIs should be dedicated to organizational goals. KPIs should be aligned with the strategic objectives and the improvement of every KPI should reflect organizational goals and targets. If em-ployees understand the linkage of KPIs and strategy, the chances of lean success is high. Second, the main purpose behind creating KPIs is the collection of suita-ble and reliable data. If the data is unreliable, the diagnosis are wrong and solving totally wrong problems. Also, higher complexity leads to higher chances to col-lection of unreliable and bad quality data.
Furthermore, KPIs should reflect the consistency of organizational structure and they cannot be independent from it. According to Sangwa’s & Sangwan’s (2018) criteria, good KPIs also need to reflect the timeline of the measurement and depending on that they need to be created as static or dynamic. Dynamic measures measure the real time performance and are more flexible and, in that sense, are also easier to adopt as a part of strategic changes. Time horizon is the fifth guideline for the selection of good KPIs. The performance indicators must be fitted either in the short-term or long-term performance strategies. Short-term indicators reflect the operational performance and long-term indicators are used to measure corporate level performance. Related to time horizon guideline, Sangwa & Sangwan (2018) also state, that a good performance measurement sys-tem (PMS) has both, lagging and leading KPIs in use.
The sixth criterion in Sangwa's & Sangwan's (2018) paper is that selected KPIs need to be defined in a way that they are easy to measure, monitor, analyse and understand. Usually, the more the PMS has indicators, the more complex it gets. Sangwa & Sangwan (2018) point out, that due to associated technicalities, it might be hard for managers to understand the KPIs they are working towards. To be able to utilize KPIs in daily business, they should not be very complex to build and later explain for the users. If the selected indicators are hard to under-stand, one is not able to do any decisions or improvements based on them to-wards the future.
The last two points in the criteria are socio-technical aspects and duplication. Socio-technicality is related to idea that a PMS should consider both, social and

33
technical aspects of the organization (Sangwa & Sangwan, 2018). The ideology of integrating different types of KPIs is aligned with TBL framework and support the idea of multi-dimensional and comprehensive PMS system. In that way, both hard and soft practice indicators are represented. Furthermore, duplication in this context means measuring the same indicator in different forms. Performance measurement system should not include a lot of duplicate measures (Sangwa & Sangwan, 2018) because they increase the complexity of the PMS system and in opposite reduce user-friendliness and understanding of the measures.
Sangwa & Sangwan (2018) listed a group of recommendations when imple-menting a performance measurement framework to the company. They suggest, that KPIs should be measured against predefined targets and they should be used for continuous improvement rather than only for examination purposes. Accord-ing to them, it is also very essential to review existing KPIs as a part of the target and objective setting for the future. Required changes to existing KPIs should be conducted as objectives change over time. Also, redundant KPIs should be de-leted, and valid and appropriate new KPIs introduced.
Sangwa & Sangwan (2018) highlighted also the importance of target setting in creating a suitable PSM for organization with KPI measures. The relationship between KPIs and targets can be described for example by separating the KPI, target value and timeframe. Basically, these three aspects together form an objec-tive for the organization, but to have an objective with reasonable target values and current timeframe, previously stated aspects of KPIs need to be first in place. The aspects of a good KPI were for example simple, measurable, actionable and understandable. After the KPI or set of KPIs have been created based e.g., on the criteria of a good PMS (e.g. Sanga & Sangwan, 2018), targets for created KPIs can be set accordingly. This is indeed an important part of the creation process of good KPIs, but the target setting as a separate topic does not fit into the context of this master’s thesis. Still, target setting is touched from time to time during the results, as it is an important topic from a future perspective, but a comprehensive target assessment will remain to be completed in the future.
In conclusion, KPI is an important tool for organization’s management con-trol system that obtains valuable feedback for planning and control (Arora and Kaur, 2015). With the help of measurable KPIs, organization can measure their performance in many different functions. Usually, the measurement of KPIs is executed in information system (e.g., PowerBI) that gives information about sev-eral KPIs (Badawy et. al., 2016). These information systems are supporting over-all business monitoring, which is a critical activity of the organization. Further-more, supply chain department is one part of organization, where KPIs are uti-lized quite often. In SCM, the organization can measure for example line effi-ciency, capacity and use of various raw materials. They can also decide to con-centrate to delivery time in relation to received orders or the number of inquiries during deliveries. PMS in SCM context was touched during the supply chain management section.

34
3.3 Reporting guidelines and standards
3.3.1 Global CO2 emissions
Before introducing the most important sustainability guidelines and standards from this thesis’s point of view, a quick round look on global CO2 emissions and CO2 emission reporting is presented. Next presented statistics strengthen the idea, that the research topic is important and topical to investigate, and that it is important for individual companies to understand the bigger purpose behind their actions to act more environment friendly. For example, the Paris Agreement by United Nations Framework Convention on Climate Change (UNFCCC), which is a legally binding international treaty on climate change was adopted by 196 parties, and bounds the nations that have agreed to the terms of the agree-ment starting from 2016. The reason to link the Paris Agreement to the context of this study is because to achieve the long-term temperature goal of limiting global warming to well below 2, preferably 1,5 degrees, countries need to focus on heav-ily reducing their GHG emissions. The following introduction to global GHG sta-tistics show the current status of the emissions today.
Annually published and updated Global Carbon Budget (GCB) by Friedlingstein et. al., collects emission data from multiple verified sources such as the Carbon Dioxide Information Analysis Center (CDIAC), the United Nations Framework Convention on Climate Change (UNFCCC) and the BP Statistical Re-view of World Energy. GCB is produced by 76 scientists from 57 research insti-tutions in 15 countries working under the umbrella of the Global Carbon Project (GCP). The latest publication is from 2020, and the paper describes the compo-nents of the global carbon cycle over the historical period. GCP is a global re-search project formed together with World Climate Research Programme by the international science community and it provides information, data, and calcula-tions about global GHG emissions. Furthermore, previously introduced World Resource Institute (WRI) uses the Global Carbon Budget and Global Carbon Pro-ject as base data sources for their publications and figures.
According to WRI and Climate Watch Data, which collect data from all pre-viously introduced sources, CO2 emissions created the largest part of GHG emis-sions in 2019 by total amount of 74 % and many parties (WRI, GCB, GCP, GHG Protocol) conclude that the number rises every year. Friedlingstein et. al. (2020) have been collecting global CO2 data for years and the rising trend of fossil-based CO2 emissions can be seen from their chart below.

35
Figure 6. CO2 emissions (Friedlingstein et al.: Global Carbon Budget 2020)
As previously presented GCB chart, the trend chart of Global Carbon Project from 2020 is showing the same direction. The figure published by the WRI and Climate Watch Data in 2020, is based on data from 2018 and it is collected by the Global Carbon Project. The chart shows the rising trend of CO2 emissions di-vided to different sectors. According to the chart, the most emissions come from coal sector, followed by oil sector and gas sector. The chart shows, that especially the amount of CO2 emissions coming from gas sector have been rapidly increas-ing between the year 1961 and 2018.
Figure 7. Global CO2 emissions based on GCP data (WRI publications, 2020)

36
The share of transportation in CO2 emissions is globally on a high level compared to other emission sources. Transportation is not the biggest climate polluter, but it still has a significant role as it produces the second largest amount of the emis-sions of energy sector. WRI has published annual figures based on International Energy Agency (IEA) data from 2016. The energy sector is the biggest source of human-caused greenhouse gas (GHG) emissions and it produced 73 % of total emissions globally. According to WRI’s blog publication in 2020, 15,9 % of energy sector’s emissions came from transportation based on 2016 data. When changing the base data to e.g., Climate Data Explorer (CAIT), total emissions of the energy sector are divided as presented in the next figure. According to the next chart, the biggest polluter in the energy sector is electricity and heat usage, followed by transportation. Transportation creates 8,08 gigatons out of total 33 gigatons of CO2 (24,5 %) and creates globally more CO2 emissions in energy sector than for example manufacturing.
The share of emissions caused by transportation vary a little when changing the base data. Regardless of that, the primary message and a common conclusion is that according to every data source referred in this master’s thesis, the energy sector creates the most of GHG and CO2 emissions and transportation causes the second highest amount of CO2 within the energy sector.
Figure 8. CO2 emissions of energy sector based on CAIT data (WRI and Climate Watch Data, 2020)

37
3.3.2 Relevant frameworks, guidelines and standards
CO2 emissions are a typical example of environmental performance measure. Be-cause many metrics, frameworks and guidelines related to emission calculation and reporting have already been published by several third party organizations, it is reasonable to introduce the most common and used ones in the context of this study. This strengthens also the etic perspective, meaning the outsider point of view of the master’s thesis (Jönsson & Lukka, 2005). When approaching the research topic with wider outsider perspective before introducing the actual de-velopment process, the reader might better get started with sustainability perfor-mance measurement in her own organization, when the ideology and bigger pic-ture behind the sustainability performance measurement becomes more familiar. Also, by introducing the most common parties giving sustainability measure-ment and reporting guidance, the study provides useful information about the important operators in the field of sustainability performance measurement.
First, greenhouse gas protocol (GHG protocol) and Scope 1,2 and 3 calcula-tion guidelines within the protocol are introduced. Greenhouse Gas (GHG) pro-tocol is a worldwide standard for carbon accounting. It provides standards, guid-ance and mitigation actions to measure and manage greenhouse gas (GHG) emis-sions in private and public sector operations and value chains. GHG protocol is a joint product of the World Resources Institute (WRI) and the World Business Council for Sustainable Development (WBCSD). The protocol organization works regularly with governments, industry associations, non-government or-ganizations and businesses to improve and update the published framework. GHG protocol was first published in the year 2001 as The Greenhouse Gas Protocol: A Corporate Accounting and Reporting Standard and since then, many updates and extensions have been conducted to the framework. According to GHG website, they supply the world's most widely used greenhouse gas accounting standards. In addition to being widely used GHG reporting tool, the protocol has served as a basis for many other greenhouse gas calculation and reporting programs, e.g., ISO 14064-1, Specification with Guidance at the Organization Level for Quantification and Reporting of GHG Emissions and Removals from the year 2006 (Hickmann, 2017). The protocol has published comprehensive and globally useable frame-works for managing emissions in public and private sector. GHG protocol pro-vides reporting requirements and guidance for companies and other organiza-tions preparing a corporate-level GHG emissions inventory by Corporate Ac-counting and Reporting Standard -document. The standard covers the account-ing and reporting over seven greenhouse gases, covered by the Kyoto protocol and it is latest updated in 2015. Many organizations are reporting their emissions according to the standard and it is the most common global framework guiding the carbon accounting. In addition to Corporate Accounting and reporting Stand-ard, the protocol provides other accounting and reporting standards, sector guid-ance, calculation tools and trainings for business and governments in three dif-ferent emission scopes.

38
GHG protocol framework consists of three different scope standards. The over-view of the GHG scopes and emissions in the whole value chain is presented below. The relevant standard for this study is the Corporate Value Chain (Scope 3) Standard, first published in 2011. Technical guidance for calculating scope 3 emissions has been published in 2013. Scope 1 in the GHG framework means direct emissions caused by the reporting company. The sources for GHG emis-sions in Scope 1 are owned or managed by the reporting company as for example company’s own vehicles and production. The second scope, Scope 2 emissions mean the emissions coming from purchased electricity, steam, heating and cool-ing for reporting company’s own use. Lastly, Scope 3 emissions mean the emis-sion caused by various upstream and downstream activities in the value chain, that are not owned or controlled totally by the reporting company. Scope 3 emis-sions usually create the most of the total emissions, depending on what activities are included in the calculation.
Figure 9. Overview of GHG Protocol scopes and emissions across the value chain (Scope
3 Standard, 2011)
According to GHG Scope 3 Standard (2011), companies have earlier focused on emissions from their own operations under scope 1 and scope 2 of the GHG Pro-tocol. Today, companies understand also the increasing need to include Scope 3

39
GHG emissions along their value chains and product portfolios to comprehen-sively manage GHG related risks and opportunities. Emphasis in this study is on the Scope 3 Standard (2011) and its calculation guidance (2013) since they are the most relevant from the case company’s point of view. The case company does not own the transportation modes driving its products, so the emissions coming from the transportation are categorized under indirect upstream emissions which belong under the scope 3 category.
Furthermore, International Organization for Standardization (ISO) stand-ards, e.g., ISO 14031 (2021), provide key environmental calculation guidelines when companies want to develop their sustainability performance. ISO 14031 is designed to be used in environmental performance evaluation in three key areas, environmental condition indicators, operational performance indicators and management performance indicators (Hervani, et. al., 2005). According to ISO website e.g., the 14031 standard gives guidance on the design and use of envi-ronmental performance evaluation (EPE). EPE enables organizations to measure, evaluate and communicate their environmental performance using key perfor-mance indicators (KPIs), based on reliable and verifiable information. ISO 14031 (2021) is applicable to all organizations, regardless of type, size, location and complexity. That makes it a good common standard to follow, because the ap-plicability is not limited to only certain type of organizations or specific fields. Compared to previously introduced GHG protocol, ISO standards are not that specific in the actual practicalities to perform the calculation, but they are very know standards and used widely in relation to all operations. As an organization, ISO is globally well known and used by multiple organizations and states, so it can be seen as reliable party giving guidance. Use of ISO standards also increases the comparability to other organizations because many organizations are calcu-lating and reporting their emissions based on the same framework.
Other parties that provide guidance for sustainability performance meas-urement are for example Science based targets initiative (SBTi) and Global Re-porting Initiative (GRI). Both these parties develop guidelines for companies to include sustainability reporting in their annual reports. Science based targets in-itiative (SBTi) is one provider of sustainability measurement guidance. The SBTi is a partnership between Carbon disclosure project CDP, the United Nations Global Compact (UNGC), World Resources Institute (WRI) and the Worldwide Fund for Nature (WWF). According to SBTi website, they provide a clearly-de-fined pathway for companies to reduce greenhouse gas (GHG) emissions, help-ing prevent the worst impacts of climate change and future-proof business growth. To be able to report according to STBi criteria, companies must get their targets officially validated by the STBi organization. GRI is an independent, in-ternational organization that helps businesses and other organizations to manage and report their sustainability actions by providing them with the global com-mon language to communicate those impacts. GRI has created a list of standards for sustainability reporting, called the GRI standards. GRI has published the re-porting standards in three sections which are aligned with the TBL framework.

40
GRI’s social, economic and environmental standard sections are accessible through GRI websites.
Lastly, VTT is a research institution owned by Finnish state and according to their website (www.vttresearch.com) they are one of the leading research in-stitutions in Europe. VTT offers comprehensive research on engine and vehicle emissions, focusing on measures for reducing energy use in transportation as well as the negative environmental impacts. VTT has published emission data-base called Lipasto, which covers emission factors for road, rail, waterborne and air transport as well as working machines. Both passenger and freight transport in Finland, and for waterborne and air transport also international traffic to or from Finland, are included in the database. In addition to numeric data, VTT pro-vides also support for calculating the emissions in individual organizations by public examples and calculation formulas.
The most used reporting guidelines from the point of view of this master’s thesis are the VTT database and GHG protocol. Many numbers and exact calcu-lation formulas or examples can be straight adopted from, or at least referenced to VTT’s Lipasto database in the case company’s CO2 calculation. In addition, GHG protocol is an important guideline in the study, because it directly provides guidance how to calculate particularly GHG emissions in various operating areas. Also, the case company utilizes the GHG protocol in their scope 1 and 2 reporting, Still, as stated before, sustainability performance measurement is a lot more than calculating environmental effects and for those even the GHG protocol does not give straight answers. Companies can integrate features into their performance measurement and reporting from all these guidelines, but most of them are not designed to be used directly in the supply chain context. Specifically, in the con-text of SSCM the difficulties come along when trying to receive a consensus of the right measures and indicators to measure sustainability performance (Ahi & Searcy, 2015). That is why also many researchers have underlined the need for common scope and frameworks in reporting and measuring sustainability in SCM (Taticchi et. al., 2015; Ahi & Searcy, 2015, Hassini et. al. 2012; Varsei et. al., 2014).

41
4 METHODOLOGY AND RESEARCH MATERIALS
4.1 Case company
The case company is a large industrial company operating in the international markets. The company has production in five European countries and the head-quarters is based in Finland. Based on the Finnish accounting act, the company X belongs to a group of large undertakings (Finnish accounting act, 1336/1997, 4 §). Large undertaking is defined as a company which has two out of three of the following features: total assets of financial year are 20 000 000 euros or over, net turnover is 40 000 000 euros or over and average number of employees during the financial year is more than 250. The case company provides finished products for consumer and professional use under several brands and in many different geographical sales areas. End users of the products are consumers, but sales are done directly to business-to-business (B2B) customers.
Sustainability targets and sustainability related success stories are increas-ingly in the core of all operations, and the field where the company operates is moving towards more open sustainability reporting habits. Environment friendly operations and sustainability are in the core of case company’s strategy, which was renewed in 2019 concerning the whole corporation which the case company is part of. When renewing the strategy, the concern defined also new strategic long-term sustainability objectives, and the target is to achieve them by 2030. In addition to long-term strategic objectives, which come straight from the concern’s strategy, the case company has two focus areas as its own sustainability objectives. Case company’s own goals related to sustainability includes plastic-free offering and development of more efficient logistics.
The primary message from the case company to its stakeholders is, that the company wants to openly communicate the results they have achieved in sus-tainable development areas. The company uses multiple environmental and eco-labels in their products and it aims that all products are in the top segment of their product category in terms of environmental performance. They also report their sustainability performance in several sustainability platforms and have par-ticipated to a field specific environmental index for years. The operationalization of the targets through roadmaps has begun in all business areas, and the progress against the targets is measured and disclosed regularly.
Case company actively tries to influence their environmental performance by its basic functionalities and even though they do not own the means of trans-portation moving their products, they want to track the amount of that impact. Company’s production units are placed on local markets and in company’s sus-tainability report it is addressed, that products are manufactured as close to con-sumers as possible, reducing carbon dioxide emissions and transportation costs.

42
4.2 Research approach and methodology
4.2.1 Constructive research approach
This study is an empirical case study that follows the constructive research ap-proach (CRA) method (Kasanen et. al., 1993). The study can generally be de-scribed as interventionist case study which has characteristics of CRA. Yin (1994) defined case study as an empirical inquiry, that investigates a phenomenon in its real-life context. In addition, the boundaries between the phenomena itself and the context where phenomena occur, are not separate. According to Rowley (2002) case studies are often used because they may offer the type of understanding and solutions that might not be achieved through other methodological approaches. Rowley (2002) states, that especially the ability of a case study to undertake an investigation into a phenomenon in its context is an important strength of this method. Case studies can also be described as valuable way of looking at the world we are living in from different approaches. In case of an interventionist research, the researcher also looks for an opportunity to change the world in or-der to gain knowledge (Jönsson & Lukka, 2005). Impact on the world can be made by crossing the borders from insider and outsider perspectives by using emic and etic logics. According to Jönsson and Lukka (2005) this shift between perspectives provides opportunities for new insights of the same topic and strengthens the achievement of feasible solutions.
Constructive approach can be described as a methodology that produces innovative constructs that seek to solve real-world problems, and thus generate contributions to the discipline in which it is applied (Lukka, 2002 & 2003). The use of constructive study as a methodological approach has been increasing throughout the years (Lukka, 2003) and several researchers have touched the topic within last 20 years (e.g., Lukka 2000-2003; Rowley, 2002; Labro & Tuomela, 2003; Baard, 2010; Oyegoke, 2010). CRA is one of the three interventionist study methods. Other two methods belonging into interventionists studies are action research and design-based research (Kananen, 2017, p. 14). The roots of interven-tionists methods are in action research, when in the middle of 20th century Kurt Lewin introduced the idea of doing change experiments in the field, instead of laboratory circumstances (Baard, 2010). Generally, an interventionist study method belongs under case study research methods, where the researcher ac-tively participates to the whole study process (Labro & Tuomela, 2003; Jönsson & Lukka, 2005). Baard (2010) describes the primary tasks behind intervention theory as the generation of valid and useful information, informed choice that maintains interventionist behaviour and client system integrity, and internal commitment to decision implementation.
In the core of CRA is the idea to develop a practical solution to identified problem (Labro & Tuomela, 2003). This innovative solution idea is called con-struction. In CRA, developed and implemented construction of the study is sort of a test instrument when attempting to illustrate, test or refine theories (Lukka,

43
2003). Kasanen, Lukka and Siitonen (1993) approached the usability of construc-tive approach by trying to identify the role of management accounting research in the field of constructive method. They concluded that it is not easy to draw the line between traditional observations and analyses used in management account-ing, and participative problem-solving approach.
The external validity of the study in the context of CRA is evaluated through the weak market test (Labro & Tuomela, 2003). Labro & Tuomela (2003) conclude, that specifically in the last two phases of constructive work, the researcher should become detached from the empirical details and consider the external validity of the study and created solution of the case study. Earlier, the test was passed, if the managers in the organization were willing to apply the solution to the case organization (Kasanen et. al., 1993) but later Lukka (2000, 2002) specified, that the weak market test evaluates the actual implementation of the solution rather than only the willingness to implement that in the future. In addition to the weak mar-ket test, created construction can be evaluated through the semi-strong market and strong market test. Semi-strong test requires that the solution is widely adopted by companies, in plural, and the strong market test requires that the businesses applying the construct systematically produce better results com-pared to those organizations that have not applied the created construction (Labro & Tuomela, 2003).
The market test consists of different dimensions that tells if the test is passed or not and according to Lukka (2000), should be considered as early as the re-search design phase. In this way it is possible to increase external validity by cre-ating a construction that could be more easily applied to other companies in other business contexts (Labro & Tuomela, 2003). Since it somewhat hard to pass the semi-strong and strong market tests within a short time span, also applicable in this master’s thesis, Labro & Tuomela (2003) suggest more detailed dimensions within the weak market test in order to analyse the level of progress of the con-struct better. The weak market test by Labro & Tuomela (2003) is illustrated be-low and the constructions of the study are evaluated against it later in the study.

44
Figure 10. Dimensions of the weak market test (Labro & Tuomela, 2003)
4.2.2 CRA in the context of the study
In the context of this thesis , it took a while to find a suitable way to show the link between constructive method approach and the comprehensive idea behind this case study. In short, the nature of an experimental, practical, and innovative CRA suits to a development driven case study like this very well. As described earlier, CRA is an interventionist research method where the researcher is an active actor in the real-time work and can gain knowledge from the emic perspective of the research topic (Jönsson & Lukka, 2005). Benefits of using the CRA as a research method are pragmatism and ability to use data from various sources, which is crucial feature from this study’s point of view, since the mixed research method is used in the data collection. The main reasons to use CRA as a methodological

45
framework in this master’s thesis are the researcher’s ability to participate ac-tively to the development work and the development of new, practical solution for the case company. In addition, seamless collaboration and development work with the case company personnel and the nature of abductive and case company driven study made the CRA the best theoretical framework to fit in the purpose of this thesis.
Applicability of the constructive research method to this master’s thesis has been described in the next table. The process of the constructive approach is de-scribed on the left side, and on the right is shown the fit to this master’s thesis. Table refers to the way that Kasanen et. al. (1993), Lukka (2003) and Labro & Tuomela (2003) describe the process steps of CRA in case studies.

46
Table 1. Constructive research approach and the structure of this master's thesis

47
4.2.3 Research process
Research design of a case study can be presented as an action plan, through which we go from the questions to final conclusions (Rowley, 2002). A clear view of the targets should be defined and a decision “What would we like to achieve?” clarified. One way to structure the components inside a research design is: ques-tions, propositions, unit of analysis, logic linking the data to the propositions and criteria for interpreting findings (Rowley, 2002). Yin (1994) links the questions how and why to case study methodology and when comparing this ideology to the study, they are converging. The link between common case study research design and the basic idea behind this master’s thesis is described below with the same idea than the structure of constructive approach earlier in this chapter.
According to Rowley (2002) a descriptive or explanatory study needs proposi-tions, which are translated from the original research questions. Basically, this means that the researcher needs to assume what the result is going to be and then, the data collection and analysis can be structured to support already made prop-ositions. In this study, propositions translated from the research questions are that the calculation of the selected sustainability KPI, CO2 emissions in transpor-tation, need to be validated and developed in the future if possible. The result is, that by collecting scattered data in- and outside the organization and by ap-proaching the topic from more than one angles, comprehensive understanding about the current situation can be achieved. Furthermore, based on that under-standing the KPI can be developed further, but to make the right development actions, different development ideas need to be gathered, investigated and eval-uated before making the decision which will be executed.
After translating questions to proposition, the base of the case, unit analysis, needs to be defined. It can for example be a leader, a programme, or a department within the organization. (Rowley, 2002.) Sometimes it is hard to draw the lines around the unit of analysis and this study was not an exception. When the study began with the assumption, that sustainability KPIs need to be validated in gen-eral, the unit of measure was set to be too wide for thesis work. When this was
Table 2. Description of the research process

48
noted, it was specified and suggested to the case company, that the study should concentrate to ask questions only related to CO2 calculation instead of both sus-tainability KPIs. By that move, the unit of analysis went from several to only one specific measure in the supply chain department. Therefore, the unit of analysis is the case company’s supply chain department and especially the work area re-lated to sustainability performance measurement and targets. This unit of analy-sis is emphasised through one KPI.
As mentioned earlier in the introduction, the study evolves in time and among the development process. Abductive reasoning recognizes the reality as an at least partly mind-independent entity and that entity is built through abduc-tive reasoning (Modell, 2009). The method describes the logic of inquiry in re-search studies where a guiding principle guides the forming of theory (Anttila, 2014). The guiding principle in this study is that the CO2 emission KPI needs to be revised and based on that, developed further. In the centre of abductive rea-soning is thinking of and looking into the topic from many different angles. When the researcher collects material, new and even surprising things can come up. After approaching the topic based on different data and evidence, some things can also be left out from the final scope (Modell, 2009). Important is, that when the guiding principle is in the centre of thinking throughout the whole study, theories behind the empiric world work as a source of inspiration and ideas (Anttila, 2014).
4.3 Research materials and data
4.3.1 Data collection
The data collection in this master’s thesis has been conducted using mixed re-search method where both qualitative and quantitative data sources are utilized. Mixed research method combines qualitative and quantitative approaches and according to Modell (2009) it has increasingly attracted attention in the 21st cen-tury among many researchers, also in the field of management accounting re-search. Mixed method can be used in multiple research fields and it is used to strengthen study’s conclusions, and in that way, to contribute to the published literature (Schoonenboom & Johnson, 2017).
Triangulation through multiple data sources and mixed research methods is argued to provide increased validity for the research. An advantage of using both, qualitative and quantitative methods in the same research process is, that it helps to gain a deeper understanding of context-specific meanings. To collect all meaningful data to get the best understanding of the researched phenomena and its context, the research can utilize e.g., direct detailed observations, inter-views and discussions, various documents and data gathered inside or outside the organization. Multiple evidence and data sources can be argued as a good

49
feature from case studies’ validity perspective. This suits well case study pur-poses, because the context plays a key role when looking deep into one organi-zation, topic, or research area. (Modell, 2009)
Rowley (2002) lists three key principles for gathering data in a case study. The main principles are triangulation, case study database and the chain of evi-dence. Triangulation implies to the use of multiple different sources. According to triangulation logic different methods are combined to connect multiple in-sights into the same empirical phenomenon and the aim is to enhance the validity of representations (Modell, 2009). By using many different sources, the data is not fulfilling only one side of the story and it does not remain too thin. According to both Rowley (2002) and Modell (2009), the combination of different research data sources is an advantage if the researcher wants to gather a holistic picture around specific topic or research area. Multiple evidence sources and triangula-tion have been utilized in this thesis work as well. By combining interviews, writ-ten materials and notes from development meetings, a holistic picture around the CO2 emissions have been reached.
Because the aim of this study is to create concrete development solutions and put them to use as widely as possible in the future, the natural way to de-scribe the analysis, development process and the actual results of the study is in chronological order. Chronological order is justifiable also because in the nature of interventionist research, a chronological field diary of gathered data and ar-ranged meetings (Jönsson & Lukka, 2005) have been held during the develop-ment work process. By documenting and gathering data and presenting results in chronological order, the changes during the conducted study can be described clearly and the description of the development process is easier to follow. In ad-dition, the other two key principles by Rowley (2002), case study database and chain of evidence, are represented clearly in the study.
Following the nature of abductive research method (Modell, 2009; Anttila, 2014) the study started with an informal query to company’s personnel about development needs. Based on the answers the study concentrated to the supply chain sustainability KPIs, because they were considered as the most “grey area” in the KPI measurement. Interviews and development meetings were arranged along when the study proceeded further, and all of them were executed based on the assumption, that the interviewee or the participant knows something im-portant about the topic and can contribute through his or her own expertise. Some meetings were for example arranged based on the owners of received doc-uments and other material, e.g., in sustainability report or a KPI model presenta-tion to the management team.
Another feature following the abductive reasoning method is, that the par-ticipants to the development meetings or interview discussions were not decided when the case study started and research questions were confirmed. If the par-ticipants were decided in the early phases before getting to know the organiza-tion and the topic in more detail, all necessary people may not have given their contribution to the study and therefore, some needed information could have left out from the scope of the research. All participants in this process were chosen as

50
the development work progressed and the final state of participants revealed in the end of development work. Of course, e.g., the controller who owns the KPI was involved from the beginning to the end, but for example marketing views came a bit unexpected during one development meeting regarding the life cycle analysis (LCA) calculation of products. Every meeting around the research topic was arranged to get more information, to discuss issues or uncertainties or to develop the ideas further together with the company personnel. This case study required relatively many discussions and deep interaction between people, even though the topic itself is quite quantitative and requires handling of numeric data.
4.3.2 Qualitative research materials
The collection of empirical data from the case company is mainly based on eth-nographical data collection methods, in other words, qualitative methods. In the recent years, ethnographical methods have meant for example interviewing, ob-servation and document analysis (Kawulich, 2005). In this master’s thesis the pri-mary data collection methods were participative observation during the devel-opment meetings with the case company’s personnel, two one-to-one theme in-terview meetings with relevant people from the case company and various doc-ument and data analysis. In interventionist studies observation in the role of strong participant often leads the collection of empiric research materials (Jöns-son & Lukka, 2005).
In the context of the study, development meetings are remote work meet-ings arranged with relevant people regarding the issues, possibilities and changes in action related to efficient logistics KPI and especially the amount CO2 emissions. The researcher and other participants participated to the meetings re-motely and discussions and possible concrete changes were conducted during the development meetings. Relevant observations were written down and visual phases of the measures were captured and stored as screenshot pictures. The re-searcher recorder notes and materials in chronological order, which also is char-acteristic for conducting case study with CRA method (Jönsson & Lukka, 2005) and good data collection practises in a case study (Rowley, 2002).
In the early phase of the study, between August and October, four one-on-one discussion meetings with relevant personnel were arranged to specify the scope of the study and the importance of the topic from company’s point of view. These one-on-one meetings were non-structured discussions around the topic of CO2 emission calculation and the state of supply chain KPIs in the case company in general. The information from these meetings were utilized to contact new persons regarding this study and they helped to get to the roots of the calculation and to understand the meaning of the topic for the case company. One-on-one meetings were not recorded because at that time it was not clear what is their information value concerning the final study, but written comments and notes were made.

51
Collected materials also include two semi-structured theme interviews with case company’s professionals in logistic and global offering. Theme interviews are based on the idea, that interviews are built around certain themes but the discus-sion itself is not planned in advance. A theme interview can be identified as a semi-structured or semi-standardized interview. Typical for semi-structured in-terview is, that some of the topics are decided in advance, but a part of the struc-ture and discussion themes are left open. One feature of theme interviews is also a possibility to tie them in both, qualitative and quantitative research methods. (Hirsjärvi & Hurme, 2000, s. 47-48.) In the beginning of the study the researcher thought, that semi-structured theme interviews would fit best to the data collec-tion of this master’s thesis, because with them, it is possible to gather detailed information around specific topic. Also, during the discussion around certain themes, some important facts and points can come up, that the interviewer did not plan to be discussed. On the contrary, some planned themes might not be in the scope of the interview because they do not naturally have link to other dis-cussed points. (Hirsjärvi & Hurme, 2000, s. 47-48.)
This in mind, recorded remote theme interviews were arranged concerning case company’s strategy and values, the state of logistic data and supplier coop-eration today and possibilities in the future. Prospects of emission reporting and measurement in the future in the field where the company is operating were also discussed during the theme interviews. Theme interviews were transcribed from word to word, but when the research work developed further, it became clear that theme interviews actually do not create significant value to the development when compared to the arranged development meetings. During the theme inter-views any concrete progress did not happen and some of the information from the theme interviews were not useful in the context of the development work, even though they concentrated to the research topic. After this observation, fur-ther theme interviews were not arranged.
A new feature for the collection of empirical data emerged through the cur-rent times of remote working, due to covid-19 pandemic. All planned meetings, workshops and informal or ad-hoc discussions between colleagues have moved to a virtual world and they now take place through Teams, phone, or e-mail. Par-ticipant observation is now lacking the interaction in a real world between two or more people, which has been seen as one of the great advantages of using par-ticipant observation (Kawulich, 2005). All arranged meetings were conducted in organization’s Teams via remote connection. Regardless of the remote work era, all necessary comments, statements, e-mails, meetings, and discussions were able to be collected and noted for data analysis.
Other meetings than the arranged theme interviews were not recorded due to other sensitive information handled among the research topic. In addition, re-searcher’s opinion is that recording with a tape recorder would not even made sense, because the meetings included several people and discussion happened around data and/or measure e.g., in PowerBI and actual modifications to data were made. Every participant were able to participate with the same level of in-

52
formation, because the computer screen was shared for all, even though tradi-tional face-to-face workshop circumstances were not possible. All in all, develop-ment process involved twelve (12) people from the organization. Conclusion of the meeting types, number of meetings and overall time used to the meetings is presented in the table below.
Table 3. Conclusion of the arranged meetings
4.3.3 Archival data
As described earlier, a case study allows the use of quantitative and qualitative approaches in a same study by using multiple data sources (Rowley, 2002) and triangulation (Modell, 2009). In addition to multiple meetings, archival material collected for the study consists of numeric data from company’s Enterprise Re-source Management (ERP) -system, different versions of CO2 emission measures in PowerBI, reports, documents, presentations, and calculation guidelines. Ar-chival materials are collected from internal and external sources. Internal archival materials which were used to build the KPIs as they are today provided a lot of useful information and helped to set the tone for the study and the final research questions. Materials concern widely the whole organization and not just supply chain or finance. Information and data have been also collected from sales and business intelligence departments. External sources consist of public documents such as public presentations and company’s sustainability reports from 2019 and 2020, benchmarking materials collected from case company’s competitors’ web-sites and reports and guideline documents of GHG protocol Scope 3 Standard.
The data available for calculation and measurement has been downloaded from the case company’s ERP system. Possibilities to measure with data include basically all attributes linked to specific products i.e. sales items. Attributes be-hind products can be categorized to serve the purpose in every function of the company and this study utilizes the information related to transporting and sell-ing products. One specific product is produced somewhere, packed, bought, and transported to the requested location by someone. In other words, the logistic chain of one product can be pulled out from the delivery and sales information and freight reports. The exactness of the data depends on how much verified in-formation the calculation includes and how much we need to rely on the common assumptions.

53
As mentioned earlier in this chapter, Rowley (2002) lists three key principles for gathering data in a case study: triangulation, case study database and the chain of evidence. The use of triangulation was already explained in the beginning of chapter 4. Furthermore, a case study database means well organized base for all evidence, to support the transparency and reliability of the study (Rowley, 2002). In this master’s thesis, all archival materials are stored and documented in a com-puter document folder in various formats. Stored materials include PowerPoint presentations, internal data from SAP Business Warehouse (BW) reports in Excel format, e-mails, Word documents, PDF reports, Excel and PowerBI calculations and OneNote notes from all meetings where researcher used participant obser-vation technique in data collection. Around 30 different documents where up-loaded to computer folder for analysis in addition to researcher’s own notes.
Lastly, a chain of evidence (Rowley, 2002) refers for example to appropriate citation of documents and interviews during the study. In addition, the actual evidence gathered during the study needs to be accessible in the databases. Parts of the documentation are either attached in this thesis as figures and tables, or referred during the text. Although, in this case study the case company is consid-ered as an anonymous organization, so naturally specific documents or e.g., in-terviewees’ and development meeting participants’ names are not presented. Fi-nal points stating the results and conclusions of this study are presented with a different detail level for the case company and for this public thesis document. For the case company, other presentations have also been prepared during the study as a discussion base for the development work. In the end of the develop-ment work, a summary presentation and a handover of simple calculation tool was provided to the management level personnel of the case company. In addi-tion to these, the researcher conducted a lot of individual development work with case company’s ERP data. A summary list of collected archival data formats is presented below.

54
Table 4. Collected archival data
After seven months of evidence gathering process during August and April, it could be noted, that the collection work was conducted successfully, and the combination of participant observation, mixed research method, triangulation and abductive research method led to good result to fulfil the purpose of con-structive research. Gathered data enabled the researcher to gain deep under-standing of the topic and in cooperation with case company personnel to make concrete improvements to the KPI.

55
5 DESCRIPTION OF THE DEVELOPMENT PROCESS
The fifth chapter describes the actual development process of the study in prac-tice by following the conceptual structure of the constructive research method process described in the section 4.2 (Kasanen, 1993; Lukka, 2000, 2003; Labro & Tuomela, 2003). The chapter starts with an explanation of the current CO2 emis-sion formula, followed by link to strategy and values and analysis of the current calculation method. The analysis section includes the steps 1-3 of CRA process by deep analysis of the current calculation method. Step 4, coming up with an innovative solution idea is discussed in the section 5.3, when possible develop-ment ideas are assessed through feasibility and value for the organization. Fur-thermore, step 5 is tied to concrete short term changes and long term develop-ment scenarios. Step 6, the demonstration of theoretical connections, is partly tied to the final section of chapter five, when the applicability of the created construc-tion in the case company is evaluated by assessing the results with the weak mar-ket test. This in a way fulfils the emic perspective (Jönsson & Lukka, 2005) of the results.
The etic perspective (Jönsson & Lukka, 2005) of the theoretical connections (step 6) and the assessment of the scope of the study (step 7) (Labro & Tuomela, 2003) are described in the chapter six during the final conclusion of the case and the evaluation of the study.
5.1 The formula of CO2 emissions in transportation
Next, the original calculation formula of the case company’s CO2 emissions in transportation is introduced more thoroughly. The focus is on the question “Where the estimated emission factors, information and dataset come from and how they affect to the measure?”. The effect to the whole measure is important from the result point of view, and it is also interesting from the target setting point of view. By looking each part of the formula more thoroughly one is able to tell which parts of the measure can be affected by concrete changes in case company’s actions in the future. Additionally it reveals if there are possible con-crete actions, that are left out from the formula and opens a discussion to how to take them into account.
Case company’s top management follows several key performance indica-tors in every function of the organization. For example, sales, supply chain and operations have different targets which are set in advance. Ways to measure the current performance related to these KPI targets vary. Targets are usually pre-sented as percentage values to reduce or increase something, or higher or smaller single values, that the organization is trying to achieve. An example of this type of KPI is e.g., the number of produced products in every factory or the percentage

56
amount of plastic free products within the product offering. The current way to measure sustainability in case company’s supply chain management is through the percentage of plastic free products of the whole portfolio and through effi-cient logistics, which includes the prioritization of local deliveries and the amount of CO2 emissions caused by the transportation of finished goods. The actual calculation formula of CO2 emissions in transportation plays a key role in this study, because the used dataset, current estimated emission values, future targets and the development work all culminates in the calculation formula. Every part of the formula is demonstrated separately to give reader a compre-hensive picture about the so called as is -situation. With the help of measuring volumes and distance the final goal is to calculate the CO2 emissions per trans-ported tonne of finished goods and the total amount of CO2. CO2 transportation emission formula is described in the case company the following way:
CO2 emissions= Transport volume by transport mode x average transport distance by transport mode x average CO2-emission factor g per tonne-km by transport mode
And in short, the formula is expressed as follows:
Kg CO2 emissions = tonnes x km x g CO2 per tonne-km/ 1000
First, when looking at the whole formula it needs to be clarified, that what is the current formula measuring. Kg CO2 emissions -part means the CO2 emissions coming from transportation of company’s finished goods between the produc-tion factories and also form factories to end customers. In other words, internal and external deliveries are considered in the same calculation. The amount of emissions is calculated through the amount of tonnes delivered and here marked to be expressed in kilos. In reality, the amount is converted to kilotons in com-pany’s PowerBI (PBI) visualization board.
Figure 11. Case company's CO2 visual in PBI

57
Current CO2 visual in PBI is presented above. To retain the anonymity of case company, the names of sales and operation (S&OP) areas have been removed from the visual, but each green bar represents one of the five S&OP areas. Case company’s emission rate is thousands of tonnes yearly, and the calculation is made on year-to-date (YTD) basis. This means in practice, that each year the num-bers are smaller in January and bigger in December.
Tonnes -part means the total delivery volumes of finished products moving between shipment party locations and the data is generated from company’s ERP system. Tonnes are the only value in the calculation, that are based on actual data with no high risk of mistakes in the numbers. The first result value on the left-hand side is the total amount of CO2 emissions. The total amount is calculated through all delivered tonnes and all driven kilometres of the company. The sec-ond result value, the amount of CO2 emissions per one delivered tonne, is expressed in kilos and measured against each delivered tonne of products. In the visual this means the bar figure on the right-hand side of the PBI page. PowerBI calculates the average number against all previous months and shows current situation at the time. For example, average emissions of the uppermost S&OP area are 51 kilos of CO2 against every delivered tonne of products and the total of CO2 emis-sions from measured timespan is 29000 tons.
Kilometres are also generated based on case company’s ERP data, but com-pany’s SAP solution includes only the shipping point and ship-to party infor-mation. Kilometres for each route are generated by combining a data source providing coordinates to information in the ERP-system based on country and postal code of the shipping point in SAP. By this way the company is able to have exact coordinates for each shipping point, i.e. customer. Kilometres do not de-scribe the actual route of transport modes, because kilometres are calculated from point A to point B by straight line distance. Always the correct coordinates are not generated to the system, and since the kilometres are based only to coordinate information, this requires manual corrections made by company’s personnel. This means searching the right coordinates from internet and uploading them manually to the system.
Three most used transportation modes of the case company are truck ship-ment, train shipment by rail and transportation by ferry. The calculation in Pow-erBI does not rely on the types of different transportation methods, but the dif-ference between these methods have been tied to the delivery route by straight line distance. For example, it is known in the case company, that all deliveries from Finland to United Kingdom require ship as a shipment method in one trans-portation leg, so all volumes moving between Finland and United Kingdom have emission factor suitable for ship delivery. One might say that the basic idea is, that every delivery leg is transported by truck, if alternative transportation method have not been created manually to the measure with if -expression.
In addition to transportation kilometres, the most interesting part of the for-mula is the CO2 emission factor, described as average CO2-emission factor g per tonne-km by transport mode. CO2 emission factor tells how much each transport mode creates CO2 emissions when delivering one tonne of products. Original

58
emission factors included in the company’s calculation are presented in the table below. Emission factor for each transport mode can be calculated through the type of transportation vehicle, vehicle’s net weight and cross weight and weight of payload capacity. Guidance for setting the factors have been taken from VTT Lipasto emission database introduced in the section 3.3.2. Lipasto database does not provide a ready list factors for all different payloads, so current factors are rough estimations made based on Lipasto’s factors that are calculated for fully loaded and empty transportation modes.
Table 5. Case company's CO2 emission factors
5.2 Analysis of the CO2 transportation KPI
5.2.1 Sustainability KPIs in case company’s strategy
Based on the previous discussion, during the theoretical framework introduced drivers of corporate sustainability and SSCM ideology have an effect from stra-tegical point of view. It is very important for organizations to be familiar with their KPIs to improve and understand their organizational performance (ISO 22400-1, 2014) and KPIs should be aligned with the strategic objectives and the improvement of every KPI should reflect organizational goals and targets (Sangwa & Sangwan, 2018). The sustainability performance measurement in sup-ply chain area and other business areas is highly strategy-driven in the case com-pany and the purpose of the sustainability KPI measurement starts with organi-zation’s strategy and values.
“Our suppliers operating in our supply chain are expected to share our sustain-ability expectations and to work towards improving their own practices, where needed.” -Case company’s sustainability report 2020
Recently, when the new strategy was released, all KPIs were set according to or-ganization’s strategical targets, including many on the sustainability perfor-mance area. The case company started also to communicate strongly about the new priority areas outside the organization, even though sustainability as a wider topic have been a big part of the case company for years.

59
“We share the same values within the whole [concern name]. Our values include responsible profitability, which in practice mean that we want to do profitable business but not at any cost. We want to act as a sustainable operator of the soci-ety in every area.” -Vice President Global Offering
Company’s vision is to be the preferred partner in developing sustainable busi-ness and stakeholder cooperation is a key thing in their business and strategy. Case company’s stakeholders can roughly be divided into internal and external parties, for example to company’s employees and customers. Similarly, com-pany’s management represents internal stakeholders and third-party organiza-tions belong to external stakeholders. Even though organizations are expected to report and communicate more and more on sustainable development themes in an open way (Labuschagne et. al., 2005), and the case company is very open re-garding its actions increasing sustainability and environment friendliness, the ac-tual CO2 emission result that comes from the KPI measure, is not the one the company desires to communicate outside the organization. The reason being, that it is not reasonable to publish any vague numbers as facts for public audience.
“Trustworthiness means simply that we keep what we promise. We want to en-courage the cooperation within all stakeholders and that is visible in the way we execute the communication.” -Vice President Global Offering
The problem with communicating straight the calculated numbers is, that no standardized way for all companies to calculate and communicate about sustain-ability performance and emission indicators exists, at least in the field where the case company operates. The CO2 KPI measure can be seen as first estimation, and comparability of the measure is lacking towards competitors’ calculations. Still, what strengthens the idea, that sustainability is extremely important to the case company is the fact that they continuously want to reform and develop their ac-tions in organizational level. This includes also sustainability related topics and the company is actively starting new smaller development actions and bigger project to improve their actions in sustainability area.
“…we talk about sustainability, but also overall development and improvements in e.g., production technology, products, processes and IT-systems, which all strengthen the path towards sustainable business.” -Vice President Global Offer-ing “Our corner stones related to sustainability are well descried in the vision, strat-egy and values. In the background of our sustainability objectives we share the initiatives coming from YK, which are globally and commonly accepted as sus-tainability objectives. Of course sustainability is a multi-dimensional topic and there is a lot more than just environmental friendliness. We try to recognize that as a whole in all business operations.” -Vice President Global Offering

60
Furthermore, the case organization wants to be able to answer the questions com-ing from stakeholders and be prepared to provide facts e.g., numeric calculations to support their vision in being the sustainable and trustworthy partner. During the theoretical framework introduced phenomenon about moving information and receiving sustainability related queries from multiple stakeholders (Seuring & Müller, 2008) has recently increased also within case company’s stakeholders. The pressure to calculate GHG emissions and follow product lifecycle comes from outside the organization. Within the year 2020 case companies’ customers have shown increased interest towards product’s environmental effects and they are asking for more detailed information from the case company.
As described before, there is no standardized way to calculate e.g., the CO2 emissions related the type of products that case company produces. This can be seen in lacking comparability of numbers across organizations operating in the same field. As much as the Lifecycle assessment (LCA) or Environmental Product Declarations (EPD) calculations are an opportunity, they also from challenges, which the case company is willing to meet. The case company have started LCA calculations with the help of an external organization, who can verify the calcu-lated results from outsider point of view. In the scope of the LCA in these early phases is only the production emissions of each product and transportation is left out, but the organization is willing to develop also other areas outside the current LCA reviews. That is why the organization started a organization-wide sustain-able offering project, where the opportunities and challenges related to product sustainability topics are identified, and the direction for future actions is decided.
5.2.2 Current calculation formula
In September 2020, a couple of discussions with supply chain personnel on man-ager and expert level were arranged to discuss about possible development areas on company’s reporting and analytics in the supply chain area and topics related to sustainable performance measurement at any organizational area. Meetings were informal Teams discussions, and the main topic of discussions was opinions and insider perspectives about development requirements. This topic was also discussed in both theme interviews that were arranged later in the study. During these discussions, the perceived challenge was the way of calculating transporta-tion CO2 emissions and documenting them. The company has one measure built in the end of 2019, but there are many uncertainties related to questions like “How the CO2 emissions should be calculated?” and “What are the actions in practice affecting to emission number?”. This leads to a situation, where the case company’s personnel are not very familiar with the measured KPI, and the KPI does not actually drive any actions in practice, even if it is namely a strategic KPI.
“When annual reduction targets for upcoming years were set, S&OP regions im-mediately commented that this is not just an organic reduction by amount x per year. Deduction must definitely be based on development and positive changes; the figure is not just an absolute metric that we follow only for the sake of the

61
number. To this end, there should be clear steps as to what activities and targets can be identified for CO2 reduction.” -Global Offering Vice President
Uncertainties of the measure come from the actual numbers within the calcula-tion, as introduced in the end of the previous chapter. In addition, the fact that the common way to perform such calculations in the field where the company operates does not yet exist, the case company cannot rely on the number to be totally correct and correctly calculated in stakeholders eyes. Even if the company would get a well calculated number with high reliability, the comparability of the calculations cannot be assured. In practice this can be seen e.g., when the case company decides to calculate the emission in a certain way and include selected parts to their method, every company in the field may not do the same assump-tions and calculate the measure same way. The question about e.g., including the return route of the transport method to the calculation instead of one-way route is reasonable, but cannot be solved alone.
“Of course we do not want to include the return route to our number, if that is not a standard way to calculate the emissions. If we would include the return and competitors calculate only one-way emissions, our number is naturally much higher. To consumers this might show as we are not that environment friendly compared to other companies, even if that would not be the case in reality. ” -Global Offering Vice President
First, when seeking validation to the calculation method, it is good to review the whole formula in use. This is of course important for the case company to under-stand, but they need to know the origin of the formula also for external purposes. The case company need to document the calculation methods for third-party or-ganizations whom they report to. From future perspective, it is also good to doc-ument the idea behind the measure, because one day it might be mandatory for some organizations to report about emissions, in the same way they nowadays report about financial figures. Companies competing in the global markets have been increasingly required to commit to and report about their sustainability per-formances in all operations already over 15 years (Labuschagne et. al., 2005). If reporting about CO2 emissions in transportation touches the case company as well in the future, the adoption of new requirements is much easier, when there is a point where to start and for example datasets are clear.
“The problem with verifying the calculation is, that we don’t know how our com-petitors calculate their values, what do they include and what do they leave out. If the customers do not know what they are asking for, that might cause issues for us.”-Supply Chain controller
The questions asked at this point of the development process were: “Where the formula is adopted from?” and “How it fits to the existing guidelines and com-

62
petitors’ calculation methods?” As introduced before in this thesis work, for ex-ample GHG protocol provides international guidance for calculating different emissions and they also have a guideline formula for CO2 emissions. Usually, CO2 emission calculation methods can be divided as energy based -method and activity based -method. In the deliverable presentation materials of the case com-pany, method used by the case company is described as activity-based calcula-tion model, also introduced previously during the study. Activity based model means that the emission rate is calculated based on driven kilometres and the weight of the cargo, because the fuel consumption is not available. The GHG method for calculating CO2 emissions is described as follows:
Figure 12. Accounting for emissions from transportation and distribution of products
(GHG Scope 3 standard, 2011)
The case company utilizes activity-based method in calculating CO2 emissions for each transportation mode and the method is based on the payload of the transportation vehicle and calculated emission factor. Activity-based method is chosen because as stated earlier, the case company has outsourced the transpor-tation for other partners and the data availability is very limited. This means, that the case company has no access e.g., to fuel consumption or real delivery kilome-tres, so the emissions belong to Scope 3 under category 4. According to GHG Scope 3 Standard (2011) the formula for calculating the emissions is described as:
emissions from downstream transport: Σ (quantity of goods sold (tonnes) × distance travelled in transport legs (km) × emission factor of transport mode or vehicle type (kg CO2e/tonne-km))
The calculation formula consists of same parts as the formula of the case com-pany, so it is reliable to say that they are aligned and the case company follows

63
the same calculation method that GHG protocol advices. This finding also in-creases the reliability of the calculation from external stakeholder perspective, because the case company can argue, that they are calculating at least informally based on the GHG protocol guidance.
Next, the researcher wanted to understand the meaning of the calculation from the internal perspective. When trying to position the CO2 emissions in transportation to the right magnitude and to give it the right weight, it is reason-able to make comparisons to other emissions. The researcher wanted to clarify the role of this particular KPI in the overall KPI portfolio and its importance to the company as a separate value. Given the status of the current KPI, it will be easier to propose future development ideas that are in balance between input and benefit. Even though major development actions could be made in theory, e.g., by collecting a bigger amount of detailed data from transport companies, it does not make sense for the case company, if the KPI is not having a bigger impact for stakeholders or the company itself.
The position of CO2 emissions in transportation KPI was clarified by com-paring the total CO2 emissions from transportation in 2020 to the total amount of CO2 emissions coming from other operations within scope 1 and 2 in 2020. The company reports publicly the amount of CO2 emissions in manufacturing and has set a strategic target to have CO2 fossil free factories by the end of 2030. The greenhouse gas effects are calculated according to STBi and GHG protocol scope 1 and 2 calculation methods. According to case company’s 2020 sustainability report, the calculation of scope 2 emissions is conducted by using market based method and location based method. The CO2 emissions in transportation are cal-culated as presented earlier in the study.
Below the numbers from all emission classes are calculated together to il-lustrate the shares of every scope in total emissions. Because the exact amount of CO2 in transportation is not public information, the tonnes are illustrated with percentage shares. In this master’s thesis, the total emissions consist of direct case company emissions (Scope 1), purchased electricity and heat (Scope 2) and trans-portation emissions from transporting finished goods (Scope 3). In real life, scope 3 could include a lot more emissions, but they are not included in the next pre-sented emission comparison chart or case company’s CO2 emission calculations.

64
Figure 13. The shares of CO2 emission sources in the case company
As one can see from the figure above, CO2 emissions from direct emissions (Scope 1) create 38% of the total and emissions from purchased heat and electric-ity (scope 2) 58% of the total. The case company’s direct emissions from scope 1 are published as a part of concern’s annual sustainability report which is a public document in the company’s website. Starting from 2020, the company calculates also the scope 2 emissions according to GHG protocol guidelines and scope 2 emissions are also reported in the public sustainability report. Furthermore, the case company does not publish annually the number of scope 3 emissions but the case company recognizes in the sustainability report, that the most important cat-egories in that class are raw material and product transport, purchased pigment and chemical production. The reason not to publish annual numbers from scope 3 is purely that the calculation needs to be first validated, and carefully investi-gate its reliability and comparability against e.g., competitors.
Based on the current internal calculation method of CO2 emissions in trans-portation, the total number in 2020 create 4% of all CO2 emissions of the case company. The emissions caused by transportation can clearly be identified from all emissions with 4%, but they are not the biggest polluter from the total per-spective. Still, the participation to reduce the CO2 emissions in the state and global level is important, and organizations should not rely on the idea, that their emissions are not creating huge amount of the emissions and due to that, the reduction is not worthy. According to Pathak et. al. (2019) by implementing sus-tainable practises into freight transportation at any level, the integrity has signif-icant positive impact on the environment. The comparison made by the re-searcher gives good perspective for the case company to observe, where their

65
CO2 emissions come from and what kinds of emission causes they have. Further-more, this leads to suitable actions that are taken to reduce CO2 emissions when the company knows what causes them and with what magnitude.
Also, when asked from company’s personnel, the growing potential of the measure could be seen, but the importance in today’s KPI portfolio was minor. Sustainability performance measurement as a wider topic was seen as very im-portant area in the future strategy period targets, but both plastic free and CO2 KPIs are currently seen as grey area in annual planning and actual target setting. This also strengthened the researcher’s idea that the sustainability KPIs in supply chain are quite far from the actual activities of the company’s personnel.
“Sustainability is in a core of concern’s and also in our company’s business for sure. Although, the CO2 measurement of transportation is only a part of our stra-tegic KPI portfolio and it was introduced because we set the strategic target of reducing CO2 emissions also in transportation. “ -Supply Chain controller
Importance of environment friendliness or sustainability in strategy was not un-derrated from the previous assumption, but the importance of this calculation formula is not huge, because development work participants recognized, that it is not possible to affect to the amount of CO2 in the KPI with those actions they have planned to reduce the CO2 emissions. Of course planned and partially al-ready executed actions, e.g., loading more products into a truck affects the CO2 emissions in real life, but because the measure includes an static estimation of 5 ton loads, it does not matter if the load weight is much higher in real life. Simi-larly, by localizing production and producing the right products to targeted mar-kets, the transportation kilometres reduce significantly. Still, this action is not rec-ognized to be a part of CO2 emission reduction, it is more likely executed as a part of streamlining the product portfolio.
If the crucial parts of the CO2 emission formula are delivered volumes, driven kilometres and the CO2 emission factors, the focus to improve the meas-ure is on either of these part of the CO2 emission calculation. Datasets behind the volumes and kilometres are clear but, because the calculation of the factors was not documented in detail to any of the materials, researcher wanted to check if they could be validated by the help of external support. When discussion around the measure was arranged with concern’s environmental professional, it was also noted, that by recognizing and documenting the origins of each factor, validity of the numbers may increase because they can be argued to be in line with guid-ance of external and verified parties. Also, if it would be noticed, that case com-pany’s factors differ from the ones that come outside the organization, it would be necessary to recognize and argument why different factors have been chosen.
During the development work the researcher did an exercise in Excel to il-lustrate, how different parts of the measure behave and affect to the CO2 emis-sions. The researcher knew, that case organization have used VTT Lipasto factors as guidelines for setting the factors, but it was unclear, whether the numbers were adopted straight from VTT database. Public Lipasto website reference values for

66
each transportation mode can be found from the table below. Example illustrates the values concerning truck deliveries, because that is the primary transportation mode in use.
Figure 14. Emission factors for truck deliveries (source: VTT Lipasto website)
Lipasto database offers reference values for empty and fully loaded vehicles and an example of partial load factor. Case company has relatively light weighted products compared to their volume, so the assumption is that 33 product pallets fit into one truck and the average load is 5 tonnes of finished products. For cases like this, where full load factor cannot be used, Lipasto offers a formula for cal-culating the emission factor for partial loads with selected load weight. The for-mula is attached below. It was recognized, that the weakness of used emission factors is, that if they are not adopted straight from the Lipasto database, they are made as estimations based on the knowledge of the company’s personnel at the time.
Table 6. CO2 emission factor formula for truck (formula adopted from VTT Lipasto web-
site)
When calculating the CO2 emission factor with different load weights based on VTT Lipasto formula, it can be seen how the load weight affects to the factor itself quite significantly. Excel comparison of 5 ton, 9,5 ton and 15 ton truck loads is presented below.
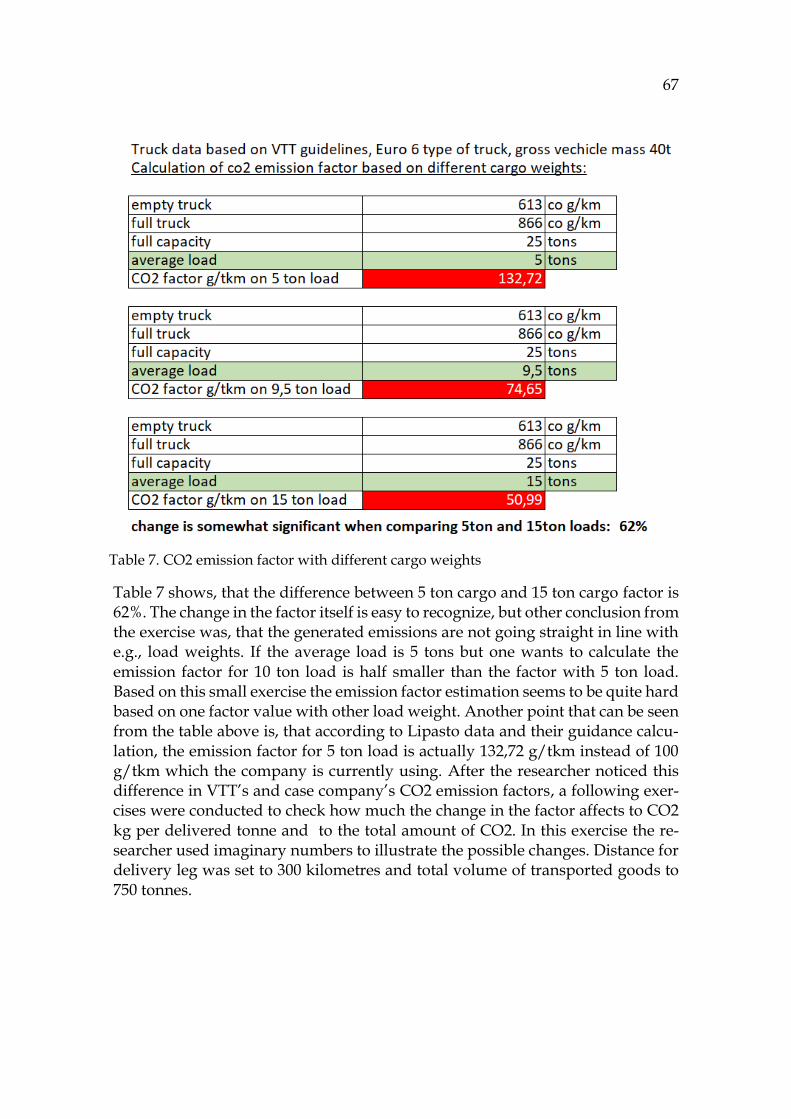
67
Table 7 shows, that the difference between 5 ton cargo and 15 ton cargo factor is 62%. The change in the factor itself is easy to recognize, but other conclusion from the exercise was, that the generated emissions are not going straight in line with e.g., load weights. If the average load is 5 tons but one wants to calculate the emission factor for 10 ton load is half smaller than the factor with 5 ton load. Based on this small exercise the emission factor estimation seems to be quite hard based on one factor value with other load weight. Another point that can be seen from the table above is, that according to Lipasto data and their guidance calcu-lation, the emission factor for 5 ton load is actually 132,72 g/tkm instead of 100 g/tkm which the company is currently using. After the researcher noticed this difference in VTT’s and case company’s CO2 emission factors, a following exer-cises were conducted to check how much the change in the factor affects to CO2 kg per delivered tonne and to the total amount of CO2. In this exercise the re-searcher used imaginary numbers to illustrate the possible changes. Distance for delivery leg was set to 300 kilometres and total volume of transported goods to 750 tonnes.
Table 7. CO2 emission factor with different cargo weights

68
Table 8. Illustration of the behaviour of CO2 emissions based on different emission fac-
tors
The totals vary between almost 3000 kgs to approximately 11500 kgs and CO2 emissions per delivered tonne between almost 40 kgs/tkm to 15 kgs/tkm. From this can be concluded, that the set CO2 factor affects a lot to the total amount of CO2 as well as the CO2 per delivered tonne of products. Furthermore, if the fac-

69
tor would be changed from 0,1 kg/CO2/tkm to 0,132 kg/CO2/tkm, the re-searcher calculated, that the total amount of case company’s CO2 emissions in 2020 would be 32% higher than today’s number and 5% of the total emissions.
Furthermore, in addition to the CO2 emission KPI, the company follows separately the amount of deliveries under 500 kilometre range but it is not an official KPI with annual target values. The case company has built a set of rules to deliveries from point A to point B, and apart from few exceptions, deliveries over 500 km by straight line distance are not allowed. This ruling affects directly also to the amount of total CO2 and CO2 per delivered tonne when deliveries can be localized by localizing production, but the visibility of localizing the transpor-tation is better with that separate measure than as a part of CO2 emission rate.
Conclusion, that can be made from the calculation exercise described above is that the kilometres are also affecting to the amount of CO2 per delivered tonne. If the factor is static and does not change, the kilometre number is the one setting the result for CO2 per delivered tonne. When the kilometres are 300km, with 100g emission factor, the CO2/ delivered tonne is 30kgs of CO2, and with 100km route, the the CO2/delivered tonne is 10kgs of CO2. The driven kilometres affect straight to the amount of transportation emissions and by reducing them, actual decrease in the emissions can be seen. Even if the 500 km range measure is sepa-rated from the CO2 KPI, from the researcher’s perspective it seems, that the 500km kilometre range measure is supporting the measurement of CO2 emis-sions by setting rules to delivered kilometres. This relationship between these two measures could and even should be recognized and utilized more.
5.3 Calculation opportunities and challenges
As mentioned during the theoretical framework of the study, KPIs should be cre-ated and developed further to match the organizational targets and strategy (Sangwa & Sangwan, 2018). When desired KPIs for the organization are identi-fied, feasibility of the KPIs in practice need to be checked (Sangwa & Sangwan, 2018) as a part of their implementation or development process. Also, in the con-text of this master’s thesis, the feasibility of developing current CO2 emission measure needs to be evaluated. During development meetings arranged between September and December of 2020, views on possible ways to develop the calcu-lation further were discussed with the development work participants. Consid-ered ideas were:
1. to start collecting more precise and actual data from our transpor-
tation partners 2. to create alternative measures to support the current calculation 3. to investigate the magnitude of total CO2 in transportation and po-
sition the KPI by comparing it to other emissions 4. to re-calculate the current CO2 number

70
5. to validate the parts of the formula by documenting them properly 6. to make changes in the visualization of the KPI 7. to check and strengthen the link between the KPI and annual tar-
gets 8. to check how and what actions in practice can affect to the CO2
number and based on the results execute modifications From all the ideas identified during the development meetings (1-8), the re-searcher started to narrow down those that might be feasible in practice. In prac-tice, the assessment of the ideas was executed by comparing ideas to other col-lected data and discussion notes from the arranged meetings. Also, after investi-gating the current data possibilities and benchmarking CO2 emission trends from the field, certain assumptions could be made concerning today’s calculation practicalities etc. After assessing the ideas by this method, further development meetings from January 2021 onwards focused on the ideas that were considered as most feasible and valuable by the researcher. Researcher confirmed the will-ingness to adopt the most beneficial ideas with the case company’s personnel, because the development work continued together with the participants. Feasi-bilities of the ideas are illustrated with a simple value-feasibility matrix tool that is introduced below. Furthermore, explanation of the placement of the ideas is provided, and every idea gone through more thoroughly after the figure.
Figure 15. feasibility and value of development ideas

71
This type of 2x2 grid matrixes are used in the consultant and project management world to assess the feasibility and value of e.g., projects, investments, innovations and ideas. Feasibility-value matrix may also help to compare development ideas to each other, and clarify which ones might be most beneficial if executed in prac-tice. By searching feasibility-value matrix from the internet search engine Google, results lead also to similar tools called prioritization matrix, impact-effort matrix and complexity-value matrix. Same type of matrixes can be used under different names but the basic idea of comparing the feasibility and the added value re-mains the same. Value-feasibility matrix is based on similar idea than the Eisen-hower matrix (Eisenhower, Peters & Woolley, 1954), SWOT-analysis (Learned et. al., 1969) and the Ansoff matrix (Ansoff, 1957, cited in Meldrum & McDonald, 1995). The idea of the matrix is to place introduced ideas (1-8) on the figure, based on how complex or hard it would be for the organization to implement them, and how much the organization would benefit or gain value if the idea was imple-mented. Similar matrix tools are also used e.g., in risk assessment and market studies.
The evaluation starts with the least beneficial idea at this point, re-calculat-ing the CO2 emissions (4). At this point, it would not make sense to try to recreate the formula, because as introduced before, the company is calculating transpor-tation emissions partly based on widely known GHG protocol calculation meas-ure and when the most common calculation methods were investigated, the ac-tivity-based idea is similar to other guidelines as well. There is publicly no com-mon way to calculate the emissions in the field where the case company operates, and after benchmarking reports and sites of five competitor companies, one can-not say how they specifically ended up with such numbers. After checking the origins of adopted values in the measure and possibly correcting them, there is no reason to try to calculate the emissions with totally different method.
Second idea that is not going be executed during the study is the data col-lection from transportation partners (1). It would require a lot more effort com-pared to the other suggested ideas, and the idea would also affect in crucial way to the nature of this study. If the idea of gathering more data from transportation partners would be considered as good, it would be reasonable for the case com-pany to test this type of arrangement with one supplier first, before adopting the process to whole organization. The case company should start completely new pilot project with some supplier, and start the process by searching a possible partner to execute the test with. The amount of work compared to the value that the case company might overall gain, is at this point too high.
Eventually if the pilot would be seen as successful project, totally new pro-cess for collecting the data should be established in cooperation with multiple international transportation partners and datasets should be re-arranged to adopt the new data from them. Also, the case company should have some loca-tion for storing and processing the data. As stated previously in the study, trans-portation emissions create only a small share (4%) of the total CO2 and the com-pany is currently using the KPI only for internal purposes. It is not mandatory

72
for the case company to follow or report the emissions very precisely outside the organization and the concern which the case company is part of, is only starting to investigate the possibility to create concern-wide guidelines for scope 3 emis-sion calculations. The case company can wait the decision and investigation of the calculation of CO2 transportation emissions form the concern, and based on their view, start radical modifications, if they are seen as value adding and nec-essary acts in the future.
Furthermore, the ideas that potentially have good value for the organiza-tion but are somewhat hard to execute are the link between annual targets and the KPI (7), to check what practical actions may affect to the measure (8) and to create alternative measure to support the current CO2 emission rate (2). During the development work it was identified, that the actions planned to reduce the CO2 emissions in real world, are not actually very visible in the calculation. This leads to the conclusion, that by doing current actions the case company is not able to reach the set targets best way, and actually it is hard to set the right target for the KPI in the first place. The researcher came to a conclusion, that by execut-ing the idea 8, it would be easier also to execute the ideas 7 and 2 and by doing this, strengthen the relationship between targets, actions and the actual KPI measure.
The lack of action visibility comes partially from the assumption, that every truck is loaded with 5 tons of finished goods and the emission factor stays the same. This indicates, that it would be good to create additional measure to sup-port the current method, that would show the development of loading more products into one truck or, if possible, to even include this aspect to the current calculation measure. Also, the case company is continuously negotiating with transportation partners about alternative vehicle modes to diesel-trucks, so the development is ongoing in a smaller perspective than collecting actual data from transportation partners, but this action is not visible in the calculation either. Nat-urally, these alternative vehicle types running with gas or electricity create smaller emissions than diesel vehicles, so even if the share of them is not huge today, it might be recognizable in a few years.
Furthermore, the kilometres are calculated by straight line distance, so the accuracy of them is not comparable to actual kilometres, but currently the straight line distance gives a good estimation of the length of the routes. Kilome-tres are also partly generated from SAP data but in the arrangement that is cre-ated to get the kilometres for each route, there are a couple of things why the data coming from the system is not 100% actual. First, the coordinates for each ship-ping point can be created only if a ship-to-party has postal code in the system. Sometimes a ship-to-party has a postal code, but it is marked e.g., as “LT-53304” or “K67 N4T2” and the coordinates are not generated accordingly in the system. This means, that the system generates the coordinates as 0. This issue needs to be corrected with manual changes e.g., on monthly or quarterly basis. Second, as mentioned, the kilometres are only directive kilometres based on straight line distance and not actual driven kilometres.

73
Earlier it was recognized, that kilometres and CO2 emission factor have straight effect on the CO2 emissions caused by transportation, and because the actual load weights are not visible in the current calculation, one possible way to improve the calculation would be to replace the straight line distance kilometres with ac-tual kilometres from each transportation route. During the study it was identified, that by efficient route-planning and by reducing the kilometres outside the set 500km radius, CO2 emissions can be efficiently decreased. If the kilometres are straight comparable to the amount caused emissions, it would make sense to specify them closer to actual data. This again, would require replacement of the current NASA coordinate based dataset, and a bit more work when the datasets need to be changed. Still, the added value at least for comparing current straight line distance kilometres and actual kilometres is very good, and that could be executed in a similar way than some smaller modifications to the measure have been executed and results compared during the study.
Lastly, development ideas to investigate the magnitude of the CO2 emis-sions and position the KPI to the right place (3), to make changes to the visuali-zation of the KPI measure (5) and to validate the parts of the formula by docu-menting them properly (6) are quite easy to realise and they create some value if executed. The reason why the value is not huge if they are executed is, that they do not fix the most important issues related to the calculation that were identified e.g., among the possibilities to affect the CO2 emissions and targets by various actions. Still, to make the KPI more user-friendly and to gain proper understand-ing of the current measure to secure the right development actions in the future, it is good to realise all three ideas in the scope of this study.
5.4 Summary of the improvements
Based on the gathered evidence and previously introduces feasibility-value ma-trix, the researcher can form a development path that fits for the case company, and that is the desired outcome of this CRA study. Gathered evidence ap-proaches the research topic from various perspectives and at different times, so it gives a solid base for concrete short-term changes and suggested long-term de-velopment actions. Following sub-sections summarize the most suitable action ideas from the feasibility-value matrix presented in the previous chapter.
5.4.1 Short-term changes
First short term change executed during the study was comprehensive investiga-tion of the current formula, benchmarking of regulative parties and competitors and eventually, a documented view about the current calculation. Documenta-tion was created in many layers. Calculations were conducted in Excel and spec-ified in the PowerBI formula and the materials were summarized in PowerPoint presentations. The final summary was presented to the responsible persons in

74
the case company’s management levels, and a simple Excel tool to illustrate and calculate the emissions e.g., among various business cases was created. The cal-culation summary material and Excel calculation tool were shared further to other personnel as well to be utilized in the future.
Second short term change that was executed was actual modifications to the calculation formula in PowerBI. In the beginning of January, a logistic profes-sional from one of the S&OP areas pointed out, that they have arranged a new deal with one transportation operator and changed the mode of transport from truck transport to intermodal transportation. According to the transportation company the arrangement reduces crucially the CO2 emissions from that route and it was questioned, that would this be visible in the calculation of the CO2 emissions today. If the improvement is not visible in the current method, it needs to be investigated how to include the changes in the calculation to show the real reduction in emissions. The researcher collected needed data from the company personnel to calculate the correct emission factor for the new transportation mode. After that, the calculation of the factor was documented and presented to responsible personnel. The factor was changed to be included in the formula starting from the beginning of 2021 to retain the comparability to previous year, and since it was the first modification to the actual formula, the effect to the total CO2 emissions were investigated and documented. The CO2 did not change cru-cially on the company level, but the emissions from the S&OP area in question reduced visibly.
Furthermore, changes to the visual appearance of the CO2 emission KPI (Figure 10) were executed. The visual is not in heavy use in the organization, and one reason might be that it is not very informative to possible users.
“From the perspective of a person that is using the visuals in PowerBI on monthly or even less than monthly basis, it is quite hard to understand how the emissions have evaluated in time and compared e.g., to previous months.” – Global Offer-ing Vice President
First, the unit of the emissions could be changed from kilotons in order to make the numbers more understandable. The number in kilotons might look confusing for the users when talking about 13 tons as 0.13 kilotons. When searching other companies’ ways to report emissions, they are usually expressed in tonnes if the number is less than one kiloton. In cases, where the amount is hundreds of thou-sands of tonnes, it would make sense to mark the number as e.g., 290 kilotons. Also, the visual could include more explanations on what the charts are actually describing. Instead of only YTD, it should be described with little more detail, how the number for each month is generated.
Also, one important feature to understand the development of the emis-sions in time is the use of time perspective in the visual. Because the target is to reduce the CO2 emissions locally in every S&OP area and also in company level, it would be good to describe the monthly emission numbers e.g., with line chart

75
to create historical perspective to the measure. Also, the total numbers of com-pany level performance are missing from the chart. At least for yearly reporting purposes it would be good to see the company level numbers without a need to calculate them manually. Visual changes related to the KPI were executed by adding the total amounts to the KPI page, by adding historical time-perspective, by specifying what the figures are describing and by changing the amount to tonnes.
Lastly, as many improvement opportunities related to alternative measures (idea 2) and practical actions affecting to the measure (idea 7) were identified, the work to create supportive measures was started. Researcher surveyed data pos-sibilities and identified, that alternative calculation to measure the development of load weights could be executed with only minor changes to the current master data. When the follow-up for load weights is created, it is possible to frequently check if there is a need to change the static 5 ton load factor. Furthermore, the comparison of the actual transportation kilometres and current straight line kil-ometres will be executed. Based on that comparison, the database for kilometres might be changed. This work partially belongs to long-term development, be-cause the data corrections will be executed during the starting sustainability pro-ject in the case company in 2021 even if the work was already started by the re-searcher.
5.4.2 Long-term development
As stated, sustainability and environment friendliness as measurable KPI objec-tives are relatively recent changes in the case company, and the development work related to sustainability topics is heavily increasing during the years. That is why it is reasonable to leave some of the identified possibilities to be executed in the future, partly based on findings and identified opportunities from this study. First of all, evaluation of the previously set targets and actions to reach them was discussed in the context of the study, but comprehensive company level targets and regional S&OP area action roadmaps belong to the starting sus-tainability project. The upcoming sustainability project aims to form a clear vi-sion of the sustainability targets and create actionable and tangible roadmaps to reach them. The executed investigation of the present state works as a good base for the future discussion and work around targets and practical roadmaps in the following year.
Another future development in the context of calculation formula, is the data quality and its level of details. Digitalisation opens many new windows to develop performance measurement when more data can be uploaded from more intelligent and competitive systems. The case company is heavily investing in implementing new systems handling product data. Case company’s current ERP system is planned to be changed during the next five years and new product in-formation system is going to be built during next two years. In the light of this information, possibilities to specify and automatize the calculation even more by

76
improving data quality need to be reviewed. To be able to take all important at-tributes in account when implementing new data management systems, the com-pany must know the data quality requirements for their desired calculation method. The study revealed the state of current data related to CO2 KPI, and the development work could be executed based in that in the future.
As mentioned earlier in the current calculation formula section, concern which the case company is part of, is investigating the calculation possibilities of the whole concern related to CO2 emissions in transportation. Comprehensive comparisons of the importance of CO2 factors were executed during the study. If the calculation needs to be based on calculated and externally guided numbers, it is possible to change the CO2 factor according to VTT’s or other regulative party’s factor model. Because of this study, future changes in implementing the payload aspect to the measure or if that is not possible, at least to create a sup-portive measure, are easier to execute, because comparative calculations and comprehensive documentation are already executed, and the scope of the factors in the case company is investigated.
As addressed several times during this master’s thesis, sustainability in-creases its importance in all operations, including supply chain. Furthermore, freight transportation has a key role in the environmental development in the supply chain area, because of its significance in the environmental dimension in supply chain and TBL context. To reduce the environmental impact of transpor-tation at any level, there are several tools to make the transportation more effi-cient through optimization. Transportation optimization can be defined as the process of finding the most efficient ways of moving goods while maintaining a desired service level. Product innovations are straight related to SSCM and opti-mized transportation in a way, that they enable the lowering of CO2 emissions caused by delivered tonnes in company’s calculation.
Furthermore, more seamless cooperation with different transportation stakeholders would be beneficial, because the driven kilometres or caused CO2 emissions are not directly in case company’s hands. If they want to follow the CO2 measure as one of their own targets, tight cooperation with suppliers must exist. By this is meant for example following the evaluation of availability of bio-fuel-based or electricity trucks and their use, because it has an effect directly to transportation emissions in a positive way. The cooperation work with transpor-tation companies is in fact already ongoing in many S&OP areas of the case com-pany, but those practical action sand results from the cooperation work should be recognized better in the future. As described earlier, many actions that reduce the CO2 emissions in transportation in practice are executed, but they are not tied to the KPI measuring the CO2 emissions. Good KPI qualities include that they are easy to measure and understand (Sangwa & Sangwan, 2018) and that the KPI drives action in practice. By strengthening the relationship with the CO2 KPI and practical actions, positive results can be reached.

77
5.5 Assessing the results through the weak market test
As discussed during the theoretical framework of the study, the researcher should consider the value of external validity of the results and created solution through weak market test (Labro & Tuomela, 2003). In this chapter, all previously presented short-term changes and long term development actions are assessed through the study. Originally, Kasanen et. al. (1993) stated, that the weak market test is passed if the organization is willing to utilize the created construction in practice, but later Lukka (2000, 2002) specified, that the weak market test should test the actual implementation of the construct, rather than just willingness to do it. In this study, the willingness to implement the created construction in practice is taken into account regarding those long-term actions, that are not executed in the scope of the study, but in today’s knowledge will be within the next year. The dimensions of the weak market test according to figure 10 are described in the table below and reflected to the short-term changes and long-term development actions listed in the table below. Green bullets represent already executed changes and red bullets development actions that are decided to be executed in the future. Their evaluation is based on today’s plans and willingness to execute them.
Short-term changes Long-term development
1. Summary presentation 1. Supportive payload measure
2. Excel calculation tool 2. Kilometre database change
3. Visual changes to the measure 3. Refined targets
4. Formula modifications 4. Action roadmaps Table 9. Short-term changes and long-term development

78
Figure 16. The weak market test and created constructions
From the above figure can be concluded, that in the light of the weak market test the study is successful in a sense, that the target organization was willing to im-plement the planned changes as a part of their daily operations, and that the re-search topic was meaningful and the conducted study important to the organi-zation. Based on the research work conducted in this study, the case organization decided to focus on specifying the CO2 emission KPI during the next year as a primary sustainability action of the organization.
The summary presentation and Excel calculation tool was shared to be used within people working with sustainability questions and the visual changes and modifications to the measure replaced the old way to present and calculate the CO2 emissions in the KPI portfolio. Supportive payload measure will be finalised within the sustainability project and used in parallel or combined with the actual CO2 KPI calculation, depending on the possibilities to combine required data to-gether. Regional S&OP action roadmaps are created when the target setting is clarified first on the company level. Kilometre database change is investigated within the next year on the case company and also on the whole concern level. In conclusion, the weak market test is passed and the created solutions are applica-ble in practice and fairly easy to execute within reasonable timeframe (under one year) in the case organization.

79
6 CONCLUSIONS
6.1 Results of the study in the light of existing theory
The objectives of the study are first to assess the accuracy and reliability of the current calculation method of the CO2 KPI and second to execute all develop-ment proposals in practice that are currently possible, and introduce improve-ment ideas that could be executed later in the future. Created construction are divided into short-term changes and long-term development ideas based on the timeframe of implementing the identified solutions. As a result, four short-term changes considering the KPI documentation, supportive Excel calculation tool, visual changes in PowerBI and modifications to the formula were conducted as part of the study. Long-term development actions were started during the study and they will be finished during the year 2021 as part of the started sustainability project in the case company. Long-term development ideas consider specifying the measure with payloads or adding a supportive payload measure to the KPI portfolio, changes in kilometre database, refining the KPI targets and based on targets creating tangible action roadmaps for the case company.
In interventionist research like CRA, it is important to show the contribu-tion to existing theory (Jönsson & Lukka, 2005), i.e., the final step of the CRA structure (Labro & Tuomela, 2003). The results of the study show that it is possi-ble to successfully develop the KPI portfolio along with the changes in organiza-tion's strategy. KPIs should be aligned with the strategic objectives and the im-provement of every KPI should reflect organizational goals and targets (Sangwa & Sangwan, 2018). This requirement is fulfilled from the case company's perspec-tive, because when the new strategy with high interest on sustainability was re-leased, the case organization started to develop their sustainability performance measurement, and the development is ongoing. By this, the case organization is able to strengthen their lean success (Sangwa & Sangwan, 2018), when the KPIs are driving actions in practice and the employees understand the linkage of KPIs and strategy. The study also strengthens the idea that sustainability topics are increasing their importance among businesses and in academic world, which was the conclusion made by several researchers. Many recently conducted studies about the sustainability performance measurement and SSCM were introduced ( e.g., Taticchi et. al., 2013, 2015; Ahi & Searcy, 2013, 2015; Hassini et. al. 2012; Varsei et. al., 2014) and by investigating the existing guidelines and standards and the case company and its competitors, it can be argued, that the business world is recognizing the need to include sustainability aspects into companies operations.
Partly, the study also participates to the discussion of future practices within supply chain management. According to many researchers, the field on SCM has been under major transformation towards more strategic and complex

80
nature (e.g., Melnyk et. al., 2009; Sukati et. al., 2012; Svensson, 2007; Schnetzler et. al., 2007). The importance of SCM is also considered in the case company, and the changes towards more sustainable business is highly driven by the supply chain area. Furthermore, Melnyk et. al. (2009) identified key issues in future SCM and two of them are managing product innovation by drawing on the capabilities of the supply chain and implementing appropriate technology to allow seamless exchange of information within the supply chain. These two issues were raised also in this study’s context, because they are relevant from case company’s point of view. Product innovations and technology systems are closely tied together with sustainable performance measurement themes, and the discussion in the long-term development chapter concentrates to close cooperation with the whole supply chain, data opportunities enabled by digitalisation and the meaning of lean organization and innovative products.
Furthermore, many researchers (e.g., Taticchi et. al., 2013, 2015; Ahi & Searcy, 2015; Büyüközkan & Karabulut, 2018, Melnyk et. al., 2009) argue, that the field of SSCM is scattered and there is no common way to measure sustainability in organizations. Based on this study, the same conclusion can be made. Many third party organizations are providing guidelines and standards and several SSCM frameworks have been identified in the academic world, but the best prac-tices in real life cannot be argued very easily. Taticchi et. al. (2015) concluded, that more research focusing on learning from industry/practice by conducting inductive, exploratory and longitudinal studies is needed, and to this need this master's thesis responds well. Because the thesis is very concrete development study and conducted by listening to the organization's needs and with tight co-operation of the case company's personnel, insights from the field and business world are well included. The study describes the actual issues and uncertainties, and on the other hand also opportunities related to sustainable performance measurement and willingness to implement sustainability KPIs from business perspective
Lastly, the sixth step of CRA structure consists of those aspects of the cre-ated solutions which could be transferable to other organizations (Labro & Tuomela, 2003). As already stated, the results and findings of the study work as a validation point for current situation and they steer the sustainability develop-ment work in the future for the case company. Because the case organization is able to widely utilize the created constructions and they were easy to execute within short timeframe in practice, the researcher argues, that they support the assumption that other organizations can reflect their sustainability KPI develop-ment well to this study, at least with small organization-specific modifications. The study provides useful information for other organizations as well from that perspective, that how the development process for sustainable KPIs can be con-ducted in real life and what needs to be considered when sustainability KPIs are created. This study can give perspective for other companies when they are cre-ating their own performance measurement models for sustainability in supply

81
chain area, or exploring the needs and possibilities to expand their performance measurement systems to consider also sustainability topics.
6.2 Evaluation of the study
To be able to validate the actual study to fit in methodological forms, it is good to include evaluation of the results in the study. The results of the study were discussed in the last section, but because the study followed the CRA method, also evaluation of the development process in the light of CRA is beneficial to conduct. This study includes the traditional features of an interventionist case study, because the combination of conventional ethnographic methods e.g., ob-servation and interviews, supported by archival data, were used in the collection of empirical research materials. According to Jönsson & Lukka (2005) these are the common aspects in most if the interventionist case studies in management accounting research. The study describes the steps of the CRA method in detail and shows how they are conducted in practice. In addition to the results of the study, the actual development process adds valuable information to the existing literature by demonstrating a development work conducted with the CRA method (Kasanen et. al., 1993; Labro & Tuomela, 2003) and complemented with emic/etic perspectives (Jönsson & Lukka, 2005), abductive reasoning (Modell, 2009) and the use mixed research method (Modell, 2009; Schoonenboom & John-son, 2017).
At first, the idea of this study was to reflect, evaluate and develop the KPIs the case company has chosen for measuring sustainability in supply chain. The first discussions around this topic were conducted in August and after a few kick-off discussions with the company SCM personnel, it became clear, that there is a need for more thorough investigation of both two sustainability KPIs. In conclu-sion, the calculation methods for both KPIs and the base for target setting for further years need to be reviewed again separately. Following this conclusion, the study focused on only one of the sustainability indicators of the supply chain department, i.e. CO2 emissions coming from product transportation. The re-search question was built around the validation and practical improvements of the current calculation and the research topic was discussed through two theo-retical framework and academic literature. Development work was conducted jointly with the case company personnel and concrete improvements executed as results.
When the ideology behind the measure, future opportunities, and possible challenges and limitations related to the calculation method are identified, the validation and development are done by tying the practical case and the structure of CRA together. The measure and standardized values included to the formula are handled separately and the aim is that target setting for the future years would become easier, doable and more understandable. Furthermore, ideology

82
behind the measure and link to strategy and values are presented as comprehen-sively as possible to support the assumption, that the measure is important for the case organization. Also, challenges, opportunities and open questions related to the topic as such are presented, and discussion around them is executed at the end of the study. The evaluation of the result follows the methodology of weak market test, which is tied to the success of constructive research approach. In the light of weak market test, part of the constructions were implemented success-fully and others will be in the near future. This indicates, that the weak market test was passed and the study succeeded in creating practical solutions to a con-crete problem for the case organization. Finally, the contribution to theory was argued from many perspectives and possible future research were suggested in the end.
6.2.1 Validity and reliability of the study
Like in any other research, reliability, generalisation, and validity are three basic fundaments of a case study. It is important to consider these topics whenever conducting a new study, no matter what the methodology behind it is. (Rowley, 2002.) Generalisation can only be performed if the study design follows the cur-rent theory. Leading theories in this study are the structure of CRA, combination of considering both emic and etic perspectives, use of abductive reasoning and the mixed research method, and the nature of interventionist study and partici-pant observation. Furthermore, a comprehensive theoretical framework and other SSCM studies were first introduced and later combined with this particular master's thesis.
According to Jönsson and Lukka (2005) the researcher needs to gain deep understanding about the case organisation and the research topic within it, but the emic -perspective is only a starting point for the further inquiry. After build-ing and preferably executing the construction developed together with the case company, the researcher must also argue the links of theoretical constructions to her study. Usually emic logic leads the actual research process in interventionist study like CRA is, but Jönsson & Lukka (2005) point out, that eventually re-searcher must include etic -perspective to the study as well. This can be done by discussing validity, reliability and theory constructions of the study and by tying the results of the study to the previous literature in the same research area. The emic and etic perspectives are both represented and considered in the study by changing perspectives within insider and outsider perspective during many chapters.
Reliability and validity in case studies are often proved through four tests, which show the construct validity, internal validity, external validity, and repli-cability. These four features can be assured e.g., by using multiple sources of ev-idence, by explaining and analysing through time series, by using case study pro-tocol and by developing a case study database. All these features have a link to data, either through collection or its analysis (Rowley, 2002.) This study is a single
83
case study with a holistic view of the research object, meaning the CO2 transpor-tation emission measurement in the case company. The study provides precise information about this case with illustrative tables and figures, citations from in-terviews and comprehensive explanation of documentation. The fifth chapter de-scribes the whole development process with many details and the conclusion chapter tie the existing literature to the results of the study. The description of the study and its benefits to the case organization, and usability in other organi-zations have been included into the discussion throughout the whole study.
Replication on the other hand does not play a key role in this study, since it is hard to show replication with a single case study. For generalising the propo-sitions of this particular study, further studies need to be conducted with same type of methodological approach and different organization. Although, like stated in the beginning, for other organizations which desire to measure their sustainable performance especially in supply chain, the study provides real-life views to SSCM and sustainability KPI measurement. The study covers the whole KPI process from the strategical reasons to start measuring certain values and building the actual formula, to evaluating the final KPI by introducing future scenarios by recognizing upcoming opportunities and challenges. The study combines valuable information about the topic from in and outside the organiza-tion, and by that it ensures that the dimensions of the current situation can be clearly identified from the case company perspective. Because the study is a case study looking deeply into one organization and the world from its point of view, it cannot generalize the validation of the calculation in every market, field, or company. Regardless of that, this study provides relevant information to the case company about their way to include sustainability in target setting and perfor-mance measurement.
6.3 Future research
As addressed several times during this master’s thesis, sustainability increases its importance in all operations, including supply chain area. Furthermore, freight transportation has a key role in the environmental development in the supply chain, because of its significance in the environmental dimensions of sup-ply chain and the TBL context, and by implementing sustainable practises into freight transportation organizations are able to make positive impact on the en-vironment (Pathak et. al., 2019). This study provided a comprehensive and before all, a practical perspective for creating and developing KPIs in the context of SSCM. Still, the study left a lot of room for further research in the same area. As already stated previously, the aspects of SSCM are increasing their importance in the future, and researchers who have already contributed to today’s academic discussion, hope more clarity and unified frameworks in the area of green or sus-tainable supply chain management (e.g., Taticchi et. al., 2013, 2015; Ahi & Searcy, 2015; Büyüközkan & Karabulut, 2018, Melnyk et. al., 2009).

84
To find out and summarize the best practices and frameworks in real life, more studies bringing practical insights and examples from the field are warranted in the future. Similar exploratory studies should be conducted to find out issues and challenges in implementing created frameworks and measures identified in the literature. Also, the rapid changes within SCM area require more research in ex-ploring the future key aspects and issues related to SCM and SSCM. Furthermore, more interventionist research could be conducted within the management ac-counting context to bring more practicality and organizational knowledge in the academic world.
Also, other aspect that was left out from this master’s thesis and is defi-nitely an interesting part of the whole KPI scene, is defining and setting reason-able and achievable targets for the future. The KPIs themselves do not drive any actions or make difference for example in the CO2 emissions, but the reduction comes through the actions executed by the organization. In the future, the re-search suggests that more studies related to setting suitable targets and evaluat-ing them afterwards might strengthen the link between the measurable KPIs and actual actions executed based on them. Lastly, a natural following study for this particular master’s thesis could investigate the creation of KPI targets based on the created measures. The study should also consider how well the set targets are achieved when the years go by, and how they served their purpose during these years or was there a need to refine them and why.

85
REFERENCES
Ahi, P., & Searcy, C. (2015). An analysis of metrics used to measure performance in green and sustainable supply chains. Journal of Cleaner Production, 86, 360-377.
Ahi, P., and C. Searcy. (2013). A Comparative Literature Analysis of Definitions of Green and Sustainable Supply Chain Management. Journal of Cleaner Production 52: 329–341.
Al-Ashaab, Ahmed, et al. (2016). Development and application of lean product development performance measurement tool. International Journal of Computer Integrated Manufacturing 29.3: 342-354.
Anderson, E., Fornell, C. & Mazvancheryl, S. (2004). Customer satisfaction and shareholder value. Journal of Marketing, vol. 68, No. 4.
Anttila, P. (2014). Tutkimisen taito ja tiedon hankinta. Read 28.12.2020. Available at www.metodix.com. Menetelmäartikkelit
Arif-Uz-Zaman, K. & Ahsan, N. (2014). Lean supply chain performance measure-ment. International Journal of Productivity and Performance Management. Vol. 63. No. 5.
Arora, A. & Kaur, S. (2015). Performance assessment model for management ed-ucators based on KRA/KPI. In: International conference on technology and business management March, vol. 23.
Baard, V. (2010). A critical review of interventionist research. Qualitative Re-search in Accounting & Management.
Badawy, M., El-Aziz, A., Idress, A., Hefny, H. & Hossam, S. (2016). A survey on exploring key performance indicators. Future Computing and Informatics Journal, 1(1), 47-52.
Bai, C., & Sarkis, J. (2014). Determining and applying sustainable supplier key performance indicators, Supply Chain Management: An International Jour-nal, Vol. 19 Issue: 3, pp.275-291.
Bai, C. and Sarkis, J. (2012). Supply-chain performance-measurement system management using neighbourhood rough sets. International Journal of Pro-duction Research, Vol. 50 No. 9, pp. 2484-2500.
Banerjee, S., Iyer, E. & Kashyap, R. (2003). Corporate environmentalism: anteced-ents and influence of industry type. Journal of Marketing, vol. 67.
Biswas, I., Raj, A. & Srivastava, S. K. (2018). Supply chain channel coordination with triple bottom line approach. Transportation Research Part E: Logistics and Transportation Review, 115, 213-226.
Büyüközkan, G. & Karabulut, Y. (2018). Sustainability performance evaluation: Literature review and future directions. Journal of Environmental Manage-ment, 217, 253-267.
Cazeri, G. T., Anholon, R., Ordoñez, R. E. C., & Novaski, O. (2017). Performance
86
measurement of green supply chain management: a literature review and gaps for further research. Brazilian Journal of Operations & Production Manage-ment, 14(1), 60-72.
Chae, B. (2009). Developing key performance indicators for supply chain: An in-dustry perspective. Supply Chain Management: An International Journal.
Choong, K. (2013). Understanding the features of performance measurement sys-
tem: a literature review. Measuring Business Excellence. 102-121.
Choong, K. (2014). The fundamentals of performance measurement systems: a systematic approach to theory and a research agenda. International Journal of Productivity and Performance Management, Vol. 63 No. 7, pp. 879-922.
Climate Watch Data. Read 23.01.2021. Global Historical Emissions. Available at https://www.climatewatchdata.org/ghg-emissions?breakBy=gas&chart-Type=percentage&gases=201&sec-tors=618%2C616%2C617%2C620%2C619
Eisenhower, D., Peters, G., & Woolley, T. (1954). Address at the second assembly of the world council of churches, Evanston, Illinois. August, 19, 1954.
Eurostat, Carbon dioxide emissions. Read 12.01.2021. Available at https://ec.eu-ropa.eu/eurostat/statistics-explained/index.php/Glossary:Carbon_diox-ide_emissions
Finnish Accounting Act 1336/30.12.1997, 4 a-c §. Read 08.12.2020. Available at https://www.finlex.fi/fi/laki/kaannokset/1997/en19971336.pdf
Forrester, J. W. 1958. Industrial Dynamics: A Major Breakthrough for Decision Makers. Harvard Business Review 36 (4):37-66.
Friedlingstein, P., O'Sullivan, M., Jones, M. W., Andrew, R. M., Hauck, J., Olsen, A., ... & Zaehle, S. (2020). Global carbon budget 2020. Earth System Science Data, 12(4), 3269-3340.
Freeman, R. (1984). Strategic management: A stakeholder approach, Pitman, Lon-don/Boston, MA.
Garcia, D. J. & You, F. (2015). Supply chain design and optimization: Challenges and opportunities. Computers & Chemical Engineering, 81, 153-170.
Ge, M. & Friedrich, J. 2020. 4 charts explain greenhouse gas emissions by
countries and sectors. Published 6.2.2020 in WRI blog. Read 10.1.2020 from https://www.wri.org/blog/2020/02/greenhouse-gas-emissions-by-coun-try-sector
GHG Protocol. (2011). Corporate value chain (Scope 3) accounting and reporting standard. World Resources Institute and World Business Council for Sus-tainable Development, Washington, DC.
GRI (Global Reporting Initiative). (2020). Consolidated set of GRI
Sustainability reporting standards 2020. Read 13.3.2021. Available at https://www.globalreporting.org/how-to-use-the-gri-standards/gri-standards-english-language/

87
Hassini, E., Surti, C. & Searcy, C. (2012). A Literature Review and a Case Study of Sustainable Supply Chains with a Focus on Metrics. International Journal of Production Economics 140 (1): 69–82.
Henriques, I. & Sadorsky, P. (1999). The relationship between environmental commitment and managerial perceptions of stakeholder importance. Acad-emy of Management Journal 42 (1), 87–99.
Hervani, A., Helms, M., & Sarkis, J. (2005). Performance measurement for green supply chain management. Benchmarking: An international journal.
Hickmann, T. (2017). Voluntary global business initiatives and the international climate negotiations: A case study of the Greenhouse Gas Protocol, Journal of Cleaner Production vol.169.
Hirsjärvi, S. & Hurme, H. (2000). Tutkimushaastattelu: Teemahaastattelun teoria ja käytäntö. Helsinki: Yliopistopaino.
International Organization for Standardization (ISO). ISO 14031:2021. Environ-mental management —Environmental performance evaluation —Guide-lines. Available at https://www.iso.org/standard/81453.html
International Organization for Standardization (ISO). (2014). ISO 22400-1:2014. Automation systems and integration – Key performance indicators (KPIs) for manufacturing operations – Part 1: Overview, concepts and terminology. Available at: https://www.iso.org/standard/56847.html
International Organization for Standardization (ISO). (2014). ISO 22400-2:2014. Automation systems and integration – Key performance indicators (KPIs) for manufacturing operations – Part 2: Definitions and descriptions. Avail-able at: https://www.iso.org/standard/54497.html
Jönsson, S., & Lukka, K. (2005). Doing interventionist research in management accounting (No. 2005: 6). University of Gothenburg, Gothenburg Research Institute GRI.
Kananen, J. (2017). Kehittämistutkimus interventiotutkimuksen muotona: opas opinnäytetyön ja pro gradun kirjoittajalle. Jyväskylä: Jyväskylän ammatti-korkeakoulu. Jyväskylän ammattikorkeakoulun julkaisuja.
Kaplan, S. & Norton, P. (1992). The balanced scorecard – measures that drive per-formance. Harvard Business Review, Vol. 70 No. 1, pp. 71‐9.
Kasanen, E., Lukka, K. & Siitonen, A. (1993). The constructive approach in man-agement accounting research. Journal of management accounting research.
Kawulich, B. (2005). Participant observation as a data collection method. Quali-tative social research, vol. 6. No. 2, Art. 43.
Koh L., Genovese, A., Acquaye, A., Barratt, P., Rana, N., Kuylenstierna, J. & Gibbs, D. (2013). Decarbonising product supply chains: Design and development of an integrated evidence-based decision support system – the supply chain environmental analysis tool (SCEnAT). International Journal of Production Research, 51(7), 2092-2109. doi:10.1080/00207543.2012.705042
Kumar, A., Calzavara, M., Velaga, N. R., Choudhary, A., & Shankar, R. (2019). Modelling and analysis of sustainable freight transportation.

88
Labuschagne, C., Brent, A. C. & Van Erck, R. P. (2005). Assessing the sustainabil-ity performances of industries. Journal of Cleaner Production, 13(4), 373-385.
Lambert, D.M. & Cooper, M.C. (2000). Issues in Supply Chain Management, In-dustrial Marketing Management, vol. 29, no. 1, pp. 65-83.
Learned, P., Christensen, R., Andrews, R., & Guth, D. (1969). Business policy: Text and cases. RD Irwin.
Levin, K. & Lebling, K. (2019). CO2 emissions climb to an all-time high (again) in 2019: 6 takeaways from the latest climate data. Published 3.11.2019 in WRI blog. Read 10.1.2020 from https://www.wri.org/blog/2019/12/co2-emis-sions-climb-all-time-high-again-2019-6-takeaways-latest-climate-data
Lozano, R. (2015). A holistic perspective on corporate sustainability drivers. Cor-porate social responsibility and environmental management, 22(1), 32-44.
Lummus, R., & Vokurka, J. (1999). Defining supply chain management: a histor-ical perspective and practical guidelines. Industrial management & data systems.
Lukka, K. (2000). The key issues of applying the constructive approach to field
research, in Reponen, T. (ed.) Management Expertise for the New Millen-nium: In Commemoration of the 50th Anniversary of the Turku School of Economics and Business Administration.
Lukka, K. (2002). Konstruktiivinen tutkimusote. Read 28.11.2020. Available at www.metodix.com. Menetelmäartikkelit
Lukka, K. (2003). The constructive research approach. In book: Case study re-search in logistics, p. 83-101.
Mathur, S. & Kenyon, A. (1997). Creating Value: Shaping tomorrow’s business. Butterworth-Heinemann, Oxford.
Matzler, K., Hinterhuber, H., Daxer C. & Huber, M. (2005). The relationship be-tween customer satisfaction and shareholder value. Total Quality Manage-ment& Business Excellence, vol. 15. Issue 5.
McElroy, M. W., & Van Engelen, J. M. (2012). Corporate sustainability manage-ment: The art and science of managing non-financial performance. Routledge.
Melnyk, S., Lummus, R., Vokurka, R., Burns L. & Sandor, J. (2009). Mapping the future of supply chain management: a Delphi study. International Journal of Production Research. Vol 47. Issue 16.
Mentzer, J., DeWitt, W., Keebler, J., Min, S., Nix, N., Smith, C. & Zacharia Z. (2001). Define supply chain management. Journal of Business Logistics, vol. 22, No. 2, pp. 1-25.
Meldrum, M., & McDonald, M. (1995). The Ansoff Matrix. In Key Marketing Con-cepts (pp. 121-126). Palgrave, London.
Modell, S., (2009). Mixed methods research in management accounting: opportu-nities and obstacles. In: Granlund, M. (Ed.), Total Quality in Academic Ac-counting. Essays in Honour of Kari Lukka. Publications of Turku School of Economics and Business Administration, Turku.

89
Neely, A., M. Gregory, and K. Platts. (1995). Performance Measurement System Design: A Literature Review and Research Agenda. International Journal of Operations & Production Management 15 (4): 80–116.
Neely, A., Bourne, M. and Kennerley, M. (2000). Performance measurement sys-tem design: developing and testing a process-based approach. International Journal of Operations & Production Management, Vol. 20 No. 10, pp. 1119-1145.
Oyegoke, A. (2011). The constructive research approach in project management research, International Journal of Managing Projects in Business, Vol. 4 Iss 4 pp. 573–595.
Parmenter, D. (2015). Key performance indicators: developing, implementing, and using winning KPIs. John Wiley & Sons Inc.
Parmenter, D. (2010). Key performance indicators: developing, implementing, and using winning KPIs. John Wiley & Sons Inc.
Pathak, D., Thakur, L., & Rahman, S. (2019). Performance evaluation framework for sustainable freight transportation systems. International Journal of Pro-duction Research, 1-21.
Rowley, J. (2002). Using case studies in research. Management research news, vol. 25. No. 1.
Saeed, A., & Kersten, W. (2019). Drivers of Sustainable Supply Chain Manage-ment: Identification and Classification. Institute of Business Logistics and General Management, Hamburg University of Technology. Sustainability, 11(4), 1137.
Sangwa, R., & Sangwan, S. (2018). Development of an integrated performance measurement framework for lean organizations. Journal of Manufacturing Technology Management.
Schoonenboom, J., & Johnson, B. (2017). How to Construct a Mixed Methods Re-search Design. Kolner Zeitschrift fur Soziologie und Sozialpsychologie, Vol. 69, issue 2, 107–131.
Schnetzler, M.J., Sennheiser, A., Schönsleben, P. (2007). A decomposition-based
approach for the development of a supply chain strategy. International Journal of Production Economics 105, 21–42.
Seuring, S., & Müller, M. (2008). From a literature review to a conceptual frame-work for sustainable supply chain management. Journal of cleaner produc-tion, 16(15), 1699-1710.
Sroufe, R. (2017). Integration and organizational change towards sustainabil-ity. Journal of Cleaner Production, 162, 315-329.
Sukati, I., Hamid, A. B., Baharun, R. & Yusoff, R. M. (2012). The study of supply chain management strategy and practices on supply chain performance. Procedia -Social and Behavioral Sciences, 40, 225-233.
Svensson, G. (2007). Aspects of sustainable supply chain management (SSCM) : conceptual framework and empirical example. Supply Chain Management: An international Journal, vol. 12.

90
Tan, C., Lyman, B., & Wisner, D. (2002). Supply chain management: a strategic perspective. International journal of operations & production management.
Taticchi, P., Garengo P., Nudurupati S.,Tonelli, F. & Pasqualino R. (2015). A re-view of decision-support tools and performance measurement and sustain-able supply chain management, International Journal of Production Re-search, 53:21,6473-6494, DOI: 10.1080/00207543.2014.939239
Taticchi, P., Tonelli F., and Pasqualino, R. (2013). Performance Measurement of Sustainable Supply Chains. A Literature Review and a Research Agenda. International Journal of Productivity and Performance Management 62 (8): 782–804.
UNFCCC. Read 11.04.2021. The Paris Agreement. Available at
https://unfccc.int/process-and-meetings/the-paris-agreement/the-paris-
agreement
Varsei, M. & Soosay, C. & Fahimnia, B. & Sarkis, J. (2014). Framing sustainability performance of supply chains with multidimensional indicators. Supply Chain Management. 19. pp.242 - 257.
VTT. Read 23.01.2021. Lipasto Unit Emissions. Available at
http://lipasto.vtt.fi/yksikkopaastot/indexe.htm
Vachon, S., & Klassen, D. (2007). Supply chain management and environmental technologies: the role of integration. International journal of production re-search, 45(2), 401-423.
Westbrook, R. (1995). Action research: a new paradigm for research in production and operations management, International Journal of Operations and Pro-duction Management, 15(12): 6–20.
Yin, K. (1994) Case study research: design and methods. 2nd edition.
Thousand Oaks, CA: Sage.
Zhou, Y., Zhang, M., Zhou, Y., & Long, Z. (2020). Development and Weight of Leading and Lagging KPIs for Offshore Structural Integrity.