oregon indicators of forest sustainability
TRANSCRIPT

Oregon Indicators of Forest Sustainability
Brandon Kaetzel, PhDPrincipal Forest Economist
Forest Resources Planning Program
Kevin BirchKevin BirchProgram Director
Forest Resources Planning Program
AGENDA ITEM 8 Attachment 12 Page 1 of 21
Background
• Board adopted the concepts of sustainability as p p yguiding principles in 2003
• Feedback on whether FPFO goals and objectives bare being met
• Basic information on changes in conditions and trendstrends
• Early warning system• Presented to the Board in Sept Odd years asPresented to the Board in Sept. Odd years as input into planning process
• Do the indicators meet the Board’s needs?
AGENDA ITEM 8 Attachment 12 Page 2 of 21

Presentation Outline
• SustainabilitySustainability– What is sustainability?
– Sustainability and the Board
• Indicators– How do we measure sustainability?
– Indicators and the Board
– Summary of the indicators• Current
• Characteristics of good indicators
• Caveats
• Recommendation(s)
AGENDA ITEM 8 Attachment 12 Page 3 of 21

Sustainability
•What is sustainability?•Sustainability and the Board
AGENDA ITEM 8 Attachment 12 Page 4 of 21

What is sustainability?ySustainability is:
“Meeting the needs of the present without compromising the ability of future generations to meet their own needs” (BrundtlandCommission Report)Commission Report)
In the context of Forest Management
“Sustainable forest management” means . . .Forest resources are used, developed, and protected at a rate and in a manner that enables people to meet their current environmentala manner that enables people to meet their current environmental, economic, and social needs, and also provides that future generations can meet their own needs (based on ORS 184.421)
AGENDA ITEM 8 Attachment 12 Page 5 of 21

What is sustainability?
SpeciesDiversityEcosystem
Di itGeneticDi it
yA visual aid:
Legal/Institutional/Economic Framework Productive
Biological Diversity
Diversity
Legal
Diversity
AvailableForestland
GrowingStock
Economic
Monitoring
SUSTAINABLE
Capacity
Natural
Harvest Vs.Sustainable
Production/ConsumptionWood Products
Cultural/SpiritualV l
R & D
SUSTAINABLE FOREST
MANAGEMENTEcosystem Health
Socio‐economicBenefits
Processes
EcologicalInvestment
Wood ProductsValues
Employment/Community
N d
AirPollution
Soil andWater
Global CarbonCycles
Water
ProcessesNeeds
WaterQualityCarbon
BudgetErosionCarbon
PoolGeneral
Protection
Example from Montreal Process
AGENDA ITEM 8 Attachment 12 Page 6 of 21

Sustainability and the Board
From the 2011 FPFO, the Board is trying to achieve “the triple
y
, y g pbottom line”.
From the previous definition of Sustainability, the triple bottom line is managing for environmental, economic, and
i l dsocial needs
The Montreal Process’ seven criteria provide a framework for the Board to organize and understand Oregon forest issuesBoard to organize and understand Oregon forest issues.
AGENDA ITEM 8 Attachment 12 Page 7 of 21
Indicators
•How do we measure sustainability?•Indicators and the Board•Summary of the indicators
•Current•Characteristics of good indicators•Caveats
AGENDA ITEM 8 Attachment 12 Page 8 of 21

How do we measure sustainability?
Goal A: Promote a fair legal system, effective and adequately funded government leading edge research and education and publicly
yForestry Program for Oregon Goals:
government, leading‐edge research and education, and publicly‐supported environmental, economic, and social policies.
Goal B: Ensure that Oregon's forests make a significant contribution towards meeting the nation’s wood product needs and provide diverse social and economic outputs and benefits valued by the public in a fairsocial and economic outputs and benefits valued by the public in a fair, balanced, and efficient manner
.Goal C: Protect and improve the productive capacity of Oregon's forests.
Goal D: Protect and improve the physical and biological quality of the soil and water resources of Oregon's forests.
Goal E: Conserve diverse native plant and animal populations andGoal E: Conserve diverse native plant and animal populations and protect and improve their habitats in Oregon's forests.
Goal F: Protect and improve the health and resiliency of Oregon's dynamic forest ecosystems, watersheds, and airsheds.
Goal G: Improve carbon sequestration and storage and reduce carbon emissions in Oregon's forests and forest products.
AGENDA ITEM 8 Attachment 12 Page 9 of 21
Indicators and the BoardThe purpose:
The goals and their associated indicators are meant to serve as a metric for measuring sustainability and to serve as a calculus that the Board uses to identify pertinent issues, measure performance, and make policy regulatory and management decisionspolicy, regulatory, and management decisions.
The nineteen indicators gives the Board a metric to assess whether they are achieving the Triple Bottom Linethey are achieving the Triple Bottom Line.
AGENDA ITEM 8 Attachment 12 Page 10 of 21
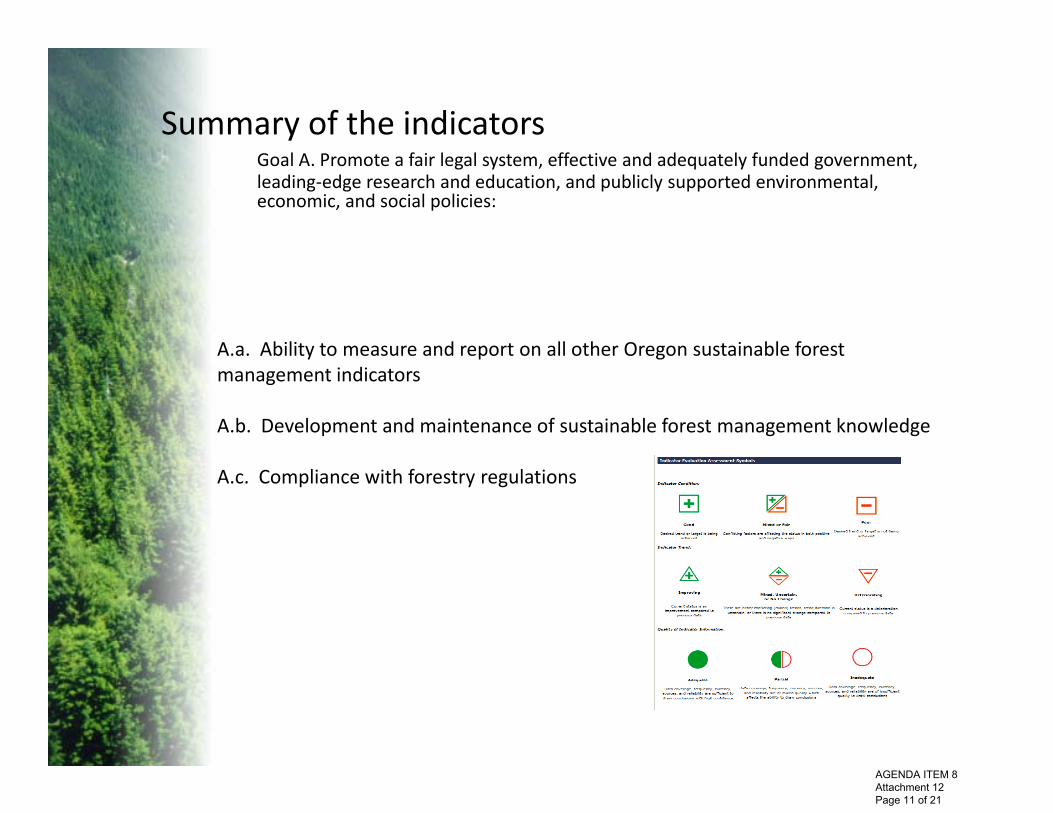
Summary of the indicators Goal A. Promote a fair legal system, effective and adequately funded government, leading‐edge research and education, and publicly supported environmental, economic, and social policies:
A.a. Ability to measure and report on all other Oregon sustainable forestA.a. Ability to measure and report on all other Oregon sustainable forest management indicators
A.b. Development and maintenance of sustainable forest management knowledge
A.c. Compliance with forestry regulations
AGENDA ITEM 8 Attachment 12 Page 11 of 21

Summary of the indicators G l B E th t O ' f t k i ifi t t ib ti t dGoal B. Ensure that Oregon's forests make a significant contribution towards meeting the nation’s wood product needs and provide diverse social and economic outputs and benefits valued by the public in a fair, balanced, and efficient manner:
B.a. Forest revenues supporting state and local government public services
B.b. Forest‐related employment and wages
B.c. Forest ecosystem services contributions to society
B.d. Forest products sector vitality
AGENDA ITEM 8 Attachment 12 Page 12 of 21

Summary of the indicators
Goal C. Protect and improve the productive capacity of Oregon’s forests:
C.a. Area of non‐federal forestland and development trends
C.b. Timber harvest trends compared to planned and projected harvest levels, and h i l dthe potential to grow wood
AGENDA ITEM 8 Attachment 12 Page 13 of 21

Summary of the indicators Goal D. Protect and improve the physical and biological quality of the soil and water resources in Oregon’s forests:
D W li f fD.a. Water quality of forest streams
D.b. Biological integrity of forest streams
D F d i k il dD.c. Forest road risks to soil and water resources
AGENDA ITEM 8 Attachment 12 Page 14 of 21

Summary of the indicators Goal E. Conserve diverse native plant and animal populations and protect and improve their habitats in Oregon’s forests:
E.a. Composition, diversity, and structure of forest vegetation
E.b. Extent of area by forest cover type in protected categories
E.c. Forest plant and animal species at risk
The specific reports for this indicator focus on 1) diversity of forest plant species and, 2) th t t f f t t ti i l di2) the structure of forest vegetation including canopy cover
and average tree size. This indicator provides maps and summary statistics for the diversity of tree species within the major ecoregions of Oregon.
AGENDA ITEM 8 Attachment 12 Page 15 of 21

Summary of the indicators Goal F. Protect and improve the health and resiliciency of Oregon’s dynamic forest ecosystems, watersheds, and airsheds:
F.a. Tree mortality from insects, diseases, and other damaging agents
F b Invasive species trends on forestlandsF.b. Invasive species trends on forestlands
F.c. Forest fuel conditions and trends related to wildfire risks
AGENDA ITEM 8 Attachment 12 Page 16 of 21

Summary of the indicators Goal G. Improve carbon sequestration and storage and reduce carbon emissions in Oregon’s forests and forest products:
G.a. Carbon stocks on forestland and forest products
AGENDA ITEM 8 Attachment 12 Page 17 of 21

Summary of the indicators yCurrent update matrix:
Leader Data Schedule CommentsSustainabilitya Report on indicators Updated accordingly as indicators are updatedb Maintenance of data/knowledge Updated accordingly as indicators are updatedc Compliance w/ regulations Data not available FACTS system is not updated and Federal system discontinued Social/Economicsa Revenues to government BK Forest Revenues Report Annual Data from Counties, State, and Federal. Up to date.b Forest employment and wages BK Department of Employment Annual Preparing to update.c Ecosystem services to society Data not available Preliminary data is available on Gales Creek Project ‐ but nothing definitive
B
ABased on Data from Goals B through G
Indicator
c Ecosystem services to society Data not available Preliminary data is available on Gales Creek Project ‐ but nothing definitived Forest products sector vitality BK Mill Study Annual Data from Paul Ehinger and Associates.Production Capacitya Area of non‐fed forestland and development BK Land Use Study Periodic (5 yrs) Data is in shop. Preparing to update.b Harvest trends BK Timber Harvest Report Annual Data from Federal, State, and Native American governments. Up to date.Water Quality
These indicators are currently on hold while assessing classification of DEQ ambient water stations. There is concern that water quality issues attributed to forestry are in fact not forestry related.
OWQI Results & Land Use Layer (GIS)OWQI Results & L d U L (GIS)
a Water quality of forest streams
b Biological integrity of forest streams
D
C
c Forest road risks to resources Data not available This can not be done currently due to funding issues.Forest Biodiversity
a Composition, diversity, structure of vegetation AYForest Inventory Analysis & Gradient Nearest Neighbor mapping
FIA = Annual ; GNN < 5 yrs
GNN analysis is based on FIA data. FIA collects 1/10 of all sampling sites each year. GNN analysis can perform modeling and mapping at 1 yr intervals but probably at 5 yrs. There is uncertainty about funding for long‐term maintenance of GNN program
b Extent of area by cover type in protected areas AHGIS Spatial data: Ownership & USFS Wilderness boundaries
Periodic (5 yrs)Cover type relies on GNN veg data from USFS. Concern of whether this will continue into the future.
c Forest plant and animal specis at risk AYOregon Biodiversity Information C (ORBIC)
Periodic (3 yrs)D d f ORBIC
Land Use Layer (GIS)
E
p pCenter (ORBIC)
( y )Data and support from ORBIC
Forest Healtha Tree mortality from insects/diseases/etc RF/AK Aerial Photos (ODF & FIA) Data is in shop. Up to Date.b Invasive species trends RF/AKc Fuel conditions AH LANDFIRECarbon
a Carbon stocks AY LandCarb analysis AnnualThe existing information is based on a one‐time analysis that has the potential to be updated annually. Current research focuses on integrating LandCarb with LandTrndr analysis‐OSU/NASA
G
F
AGENDA ITEM 8 Attachment 12 Page 18 of 21

Summary of the indicators
Characteristics of good indicators:
– Relevant– Understandable– Practical and feasible– Measurable– Sufficient to the purposeSufficient to the purpose– Compatible– Scientific merit– Linkable to environmental, economic, and social models, forecasting, and
information systemsinformation systems
AGENDA ITEM 8 Attachment 12 Page 19 of 21

Summary of the indicators
Caveats:
• Is data readily available?y– Costs– Consistency of collection– Is the right data being utilized?
• Are current indicators answering the right questions?– Are they “good” indicators?– Are the effectively adding to the Board’s calculus for making decisions?Are the effectively adding to the Board s calculus for making decisions?
• What information would the Board like to see presented to help advise their decision making‐process?
AGENDA ITEM 8 Attachment 12 Page 20 of 21
Recommendation(s)( )Where do we go from here?:
Staff recommends that revising the indicators be added to the Board’s gnew Emerging and Crosscutting Issues work plan
Staff will periodically revisit the Board to discuss:Usefulness of current indicatorsAlternatives to measuring Goals in FPFO
AGENDA ITEM 8 Attachment 12 Page 21 of 21