characterization of wake-sport wakes
TRANSCRIPT
0
Characterization of Wake-Sport Wakes and their Potential Impact on Shorelines
WATER SPORTS INDUSTRY ASSOCIATION
November 2015
1
Characterization of Wake-Sport Wakes and their Potential Impact on Shorelines
by Clifford A. Goudey and Lewis G. Girod
C.A. Goudey & Associates 21 Marlboro Street
Newburyport, MA 01950
24 November 2015
Prepared for the Water Sports Industry Association
P.O. Box 568512, Orlando, FL 32856-8512

2
Table of Contents
Foreword ............................................................................................................................ i
Executive Summary .......................................................................................................... ii
Introduction ....................................................................................................................... 1
Background on wakes ....................................................................................................... 1
Study objectives ................................................................................................................ 2
Methodology ..................................................................................................................... 2
Results .............................................................................................................................. 9 Discussion ........................................................................................................................ 21
Conclusions ..................................................................................................................... 25
Acknowledgements ......................................................................................................... 26
References ....................................................................................................................... 27
i
Foreword
With a goal to scientifically measure the wakes produced by wave-sport towboats, the first-ever Towed Water Sports Wave Energy Study was conducted in the Spring of 2015 in Orlando, Florida. The research was commissioned by the Water Sports Industry Association (WSIA) and conducted by engineering consultants from C.A. Goudey & Associates of Newburyport, Massachusetts. The study was lead by founder and principal Clifford A. Goudey who holds master's degrees from MIT in naval architecture and marine engineering and in mechanical engineering and is an expert in waves, vessel performance, and the conduct of instrumented field tests. Assisting was Lewis D. Girod, a software and sensing engineer who holds a master's degree from MIT in electrical engineering and computer science and a PhD in computer science from UCLA.
The tests were conducted from March 20 to 27, 2015 on the Conway Chain of Lakes at two sites chosen to represent shallow-water and deep-water conditions. Precise measurements of wave height by an array of sensors have provided the first rigorous measure of wakes produced by this type of boat. The results and the authors’ conclusions are offered here in hopes that they begin to clarify issues related to the role of towed water sport wakes in the larger context of other human and natural activities that occur on bodies of water.
John Archer, WSIA President Larry Meddock, WSIA Executive Director
ii
Executive Summary
The effect of boat wakes on a shoreline varies depending on boat size, speed, water depth, and distance from shore. With the growing popularity of wake sports there has been a rise in concern over the potential effect of the associated wakes on shorelines. A study has been completed and reported here aimed at building an understanding of wake-sport wakes and how they fit into the spectrum of boat wakes in general as well as how those wakes compare to wind-driven waves.
A shallow and a deep-water test venue were used within the Conway Lake chain in Orlando, Florida. Both locations had sandy beaches and were surveyed for their depth profile to determine locations for wave-height probes within an array running perpendicular to the shore. At the four stations closest to shore, capacitance-wire wave probes were used. Due to the close passage of the boat to the outer probe, a submerged pressure probe was used. Each sensor was connected by underwater cable to a PC-based data acquisition system where the data was displayed and logged for post processing.
The vessel used for the tests was a Nautique G-23 wake-sport boat with an overall length of 23’, a maximum beam of 102”, and a light displacement of 5,900 lbs. This is considered typical of the fleet of wake-sport boats available from various manufacturers. The boat has factory-installed ballast tanks that were filled to capacity with 2,850 pounds of water for the wakeboarding tests. For the wakesurfing runs, an additional 1,400 pounds of water was added, yielding a total displacement of 10,150 pounds.
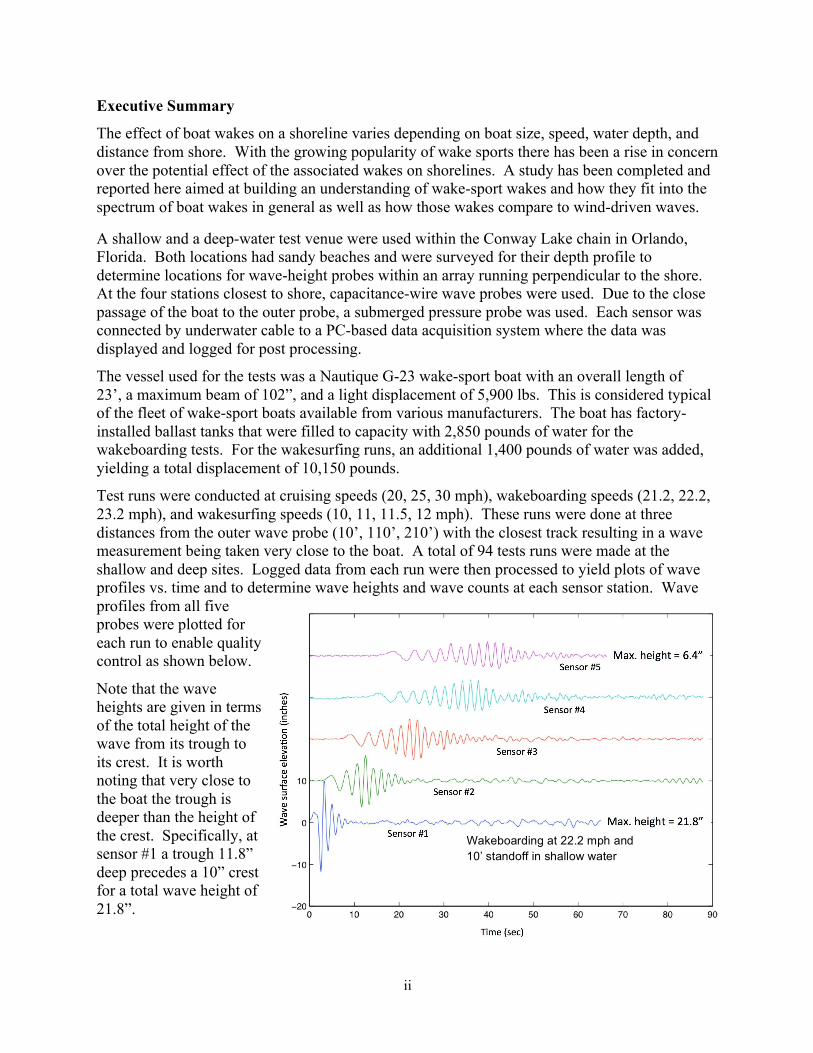
Test runs were conducted at cruising speeds (20, 25, 30 mph), wakeboarding speeds (21.2, 22.2, 23.2 mph), and wakesurfing speeds (10, 11, 11.5, 12 mph). These runs were done at three distances from the outer wave probe (10’, 110’, 210’) with the closest track resulting in a wave measurement being taken very close to the boat. A total of 94 tests runs were made at the shallow and deep sites. Logged data from each run were then processed to yield plots of wave profiles vs. time and to determine wave heights and wave counts at each sensor station. Wave profiles from all five probes were plotted for each run to enable quality control as shown below.
Note that the wave heights are given in terms of the total height of the wave from its trough to its crest. It is worth noting that very close to the boat the trough is deeper than the height of the crest. Specifically, at sensor #1 a trough 11.8” deep precedes a 10” crest for a total wave height of 21.8”.
Wakeboarding at 22.2 mph and 10’ standoff in shallow water
iii
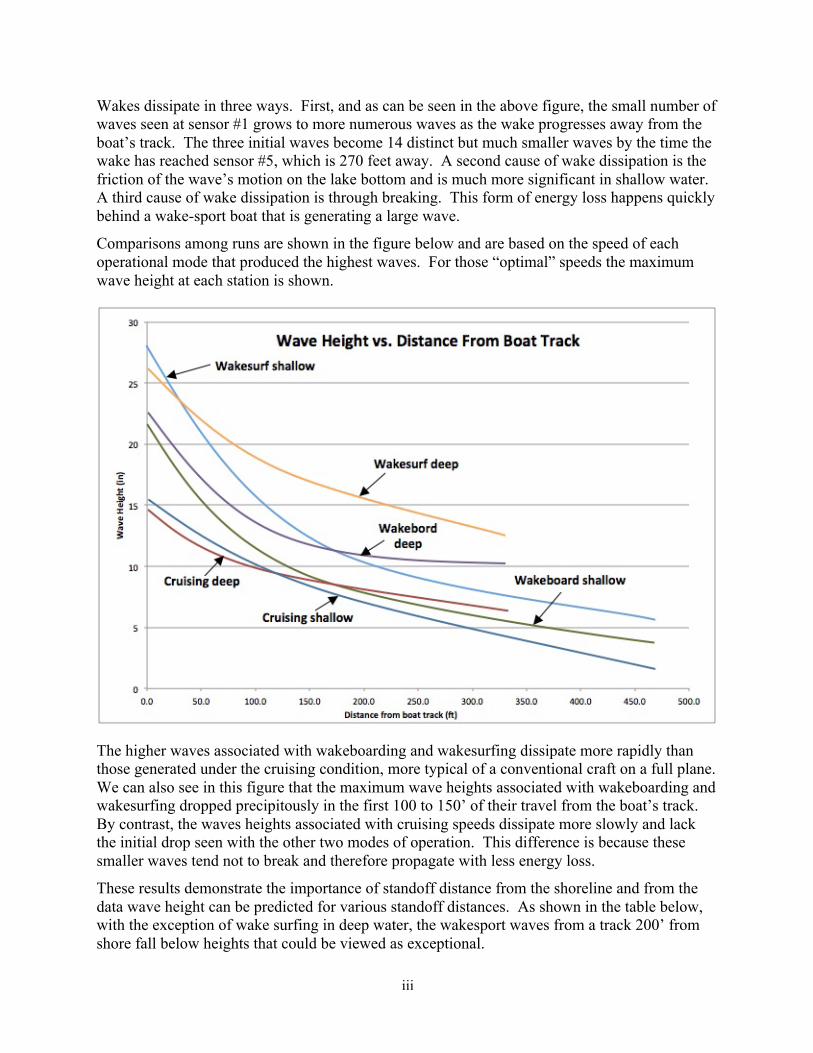
Wakes dissipate in three ways. First, and as can be seen in the above figure, the small number of waves seen at sensor #1 grows to more numerous waves as the wake progresses away from the boat’s track. The three initial waves become 14 distinct but much smaller waves by the time the wake has reached sensor #5, which is 270 feet away. A second cause of wake dissipation is the friction of the wave’s motion on the lake bottom and is much more significant in shallow water. A third cause of wake dissipation is through breaking. This form of energy loss happens quickly behind a wake-sport boat that is generating a large wave.
Comparisons among runs are shown in the figure below and are based on the speed of each operational mode that produced the highest waves. For those “optimal” speeds the maximum wave height at each station is shown.
The higher waves associated with wakeboarding and wakesurfing dissipate more rapidly than those generated under the cruising condition, more typical of a conventional craft on a full plane. We can also see in this figure that the maximum wave heights associated with wakeboarding and wakesurfing dropped precipitously in the first 100 to 150’ of their travel from the boat’s track. By contrast, the waves heights associated with cruising speeds dissipate more slowly and lack the initial drop seen with the other two modes of operation. This difference is because these smaller waves tend not to break and therefore propagate with less energy loss.
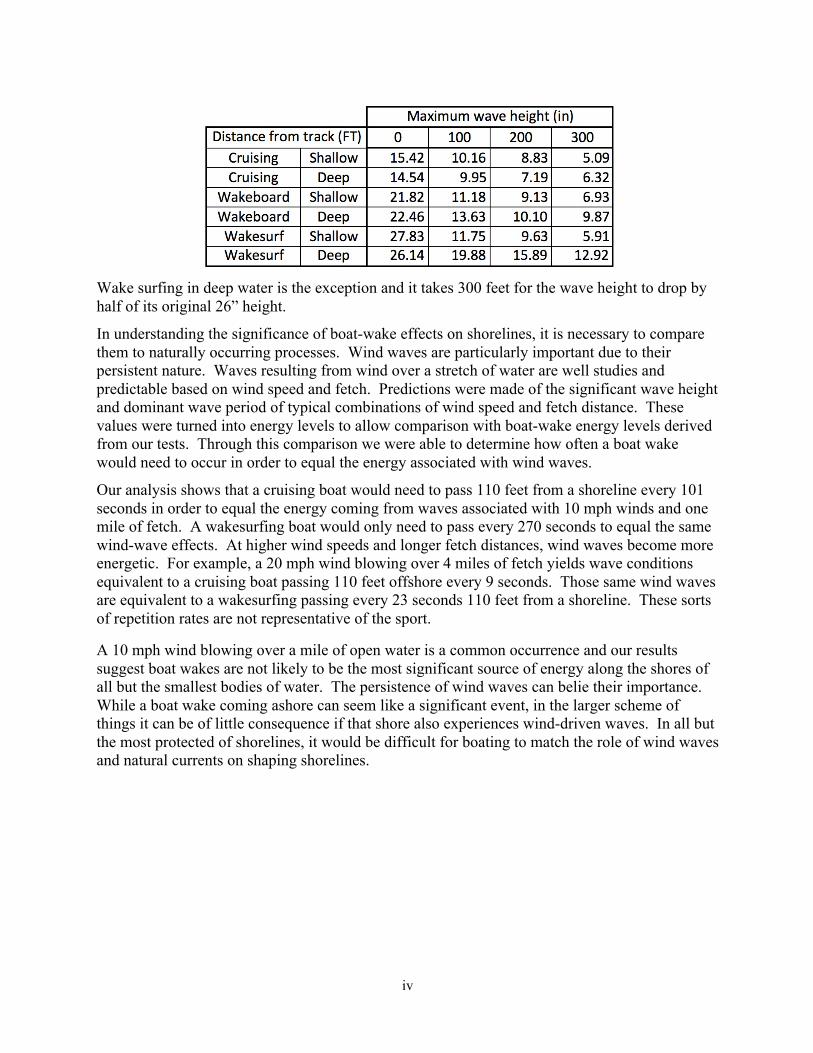
These results demonstrate the importance of standoff distance from the shoreline and from the data wave height can be predicted for various standoff distances. As shown in the table below, with the exception of wake surfing in deep water, the wakesport waves from a track 200’ from shore fall below heights that could be viewed as exceptional.
iv
Wake surfing in deep water is the exception and it takes 300 feet for the wave height to drop by half of its original 26” height.
In understanding the significance of boat-wake effects on shorelines, it is necessary to compare them to naturally occurring processes. Wind waves are particularly important due to their persistent nature. Waves resulting from wind over a stretch of water are well studies and predictable based on wind speed and fetch. Predictions were made of the significant wave height and dominant wave period of typical combinations of wind speed and fetch distance. These values were turned into energy levels to allow comparison with boat-wake energy levels derived from our tests. Through this comparison we were able to determine how often a boat wake would need to occur in order to equal the energy associated with wind waves.
Our analysis shows that a cruising boat would need to pass 110 feet from a shoreline every 101 seconds in order to equal the energy coming from waves associated with 10 mph winds and one mile of fetch. A wakesurfing boat would only need to pass every 270 seconds to equal the same wind-wave effects. At higher wind speeds and longer fetch distances, wind waves become more energetic. For example, a 20 mph wind blowing over 4 miles of fetch yields wave conditions equivalent to a cruising boat passing 110 feet offshore every 9 seconds. Those same wind waves are equivalent to a wakesurfing passing every 23 seconds 110 feet from a shoreline. These sorts of repetition rates are not representative of the sport.
A 10 mph wind blowing over a mile of open water is a common occurrence and our results suggest boat wakes are not likely to be the most significant source of energy along the shores of all but the smallest bodies of water. The persistence of wind waves can belie their importance. While a boat wake coming ashore can seem like a significant event, in the larger scheme of things it can be of little consequence if that shore also experiences wind-driven waves. In all but the most protected of shorelines, it would be difficult for boating to match the role of wind waves and natural currents on shaping shorelines.
1
Introduction
The effect of boat wakes on shorelines varies greatly depending on boat size, its speed, and where and how it is operated. Factors such as speed, length, and displacement determine the characteristics of a wake as it propagates outward from the boat’s track line. Meanwhile, factors such as distance to shore and water depth determines how that wake changes as it moves. Finally, the nature of the shoreline and the other environmental stressors it experiences determines the significance of the wake’s arrival.
With the increase in popularity of wakeboarding and wakesurfing, there has been a rise in concern over the potential effect of the associated wakes. In some cases, targeted regulations have been suggested as a way to keep those activities away from certain areas or to exclude them from entire bodies of water. Unfortunately, such advocacy is seldom based on a complete knowledge of the situation, reflecting instead a knee-jerk reaction to either an isolated incident or the irresponsible behavior of one or a few operators.
The fact remains, when engaging in wake sports these boats are intentionally operated to produce a large wake that is an important component of wakeboarding and essential to the sport of wakesurfing. Understandably, as the sport grows, conflicts among the users of a body of water can grow. The purpose of this report is to add to the understanding of wake-sport wakes and how they fit into the spectrum of boat wakes in general as well as how they compare to naturally occurring waves and other coastline disturbances.
Background on wakes
Wave and wakes are well-studied phenomena, as they relate directly to the survivability of coastal structures and the processes affecting coastal environments (USACE 2002). Specific research on the effect of boat wakes has occurred for many years (Dorava 1997, Asplund 2000, NRC 2007). While boat wakes are but one source of impact on our coastal environments (Klein 2007), in some situations they become a significant concern (Macfarlane 2008, Watterson 2012).
The methods for studying wakes generally involve the measurement associated wave heights as a wake approaches a shore (Fonseca 2012, Macfarlane 2012). Results from such investigations can be used to compare the characteristics of wakes generated by various size vessels operating in various modes (Gourlay 2010). The methods can also be used to compare the role of boat wakes on shoreline with that of wind waves (Zabawa 1980).
It has been found by some that boat wakes complaints are often used to mask other community concerns such as the noise generated by high-speed craft and the loss of amenity (Macfarlane 2008). It has also been found that wave height alone can be poor indicator of erosion potential and energy is considered a better indicator of potential shoreline impact (Ibid).
Absent in the literature are data specific to the wake effects of wake-sport boats and the purpose of this study is to fill that gap and use rigorous field-collected data to assess potential wave impacts of wake-boat operation at various speeds, operating conditions, and distances from shore. These findings can then be compared with naturally occurring wind waves associated with different wind speeds and fetch distances.
2
Study objectives
The objectives of this study were to:
1. Develop methods and instrumentation to accurately measure waves generated by the passage of a wake boat.
2. Measure the wakes produced by a wake-sport boat at cruising, wakeboarding, and wavesurfing speeds and loading conditions at deep and shallow test sites.
3. Determine the wave energy from these wakes and how it varies with mode of operation and distance from the boat track.
4. Compare the experimental findings with the wave energy associated with wind waves.
5. Use the finding to assist WSIA is developing guidelines for wake boat operation to minimize any negative impacts of wake sports.
Methodology
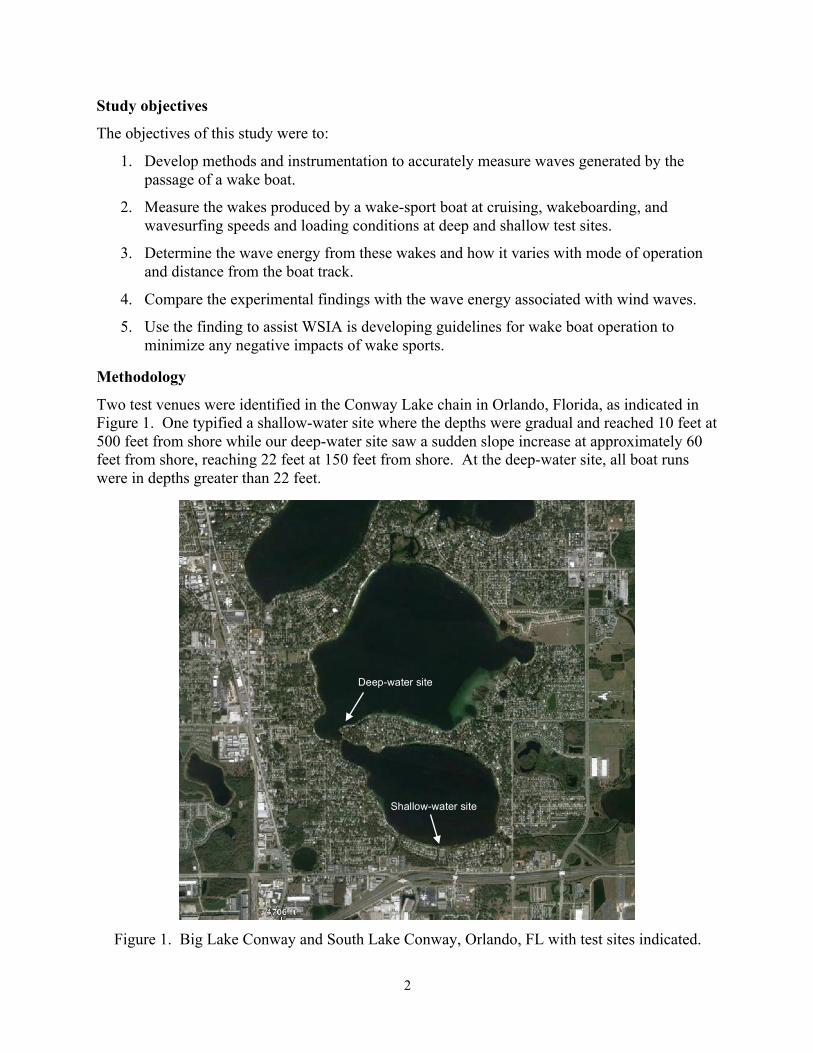
Two test venues were identified in the Conway Lake chain in Orlando, Florida, as indicated in Figure 1. One typified a shallow-water site where the depths were gradual and reached 10 feet at 500 feet from shore while our deep-water site saw a sudden slope increase at approximately 60 feet from shore, reaching 22 feet at 150 feet from shore. At the deep-water site, all boat runs were in depths greater than 22 feet.
Figure 1. Big Lake Conway and South Lake Conway, Orlando, FL with test sites indicated.
Deep-water site
Shallow-water site
3
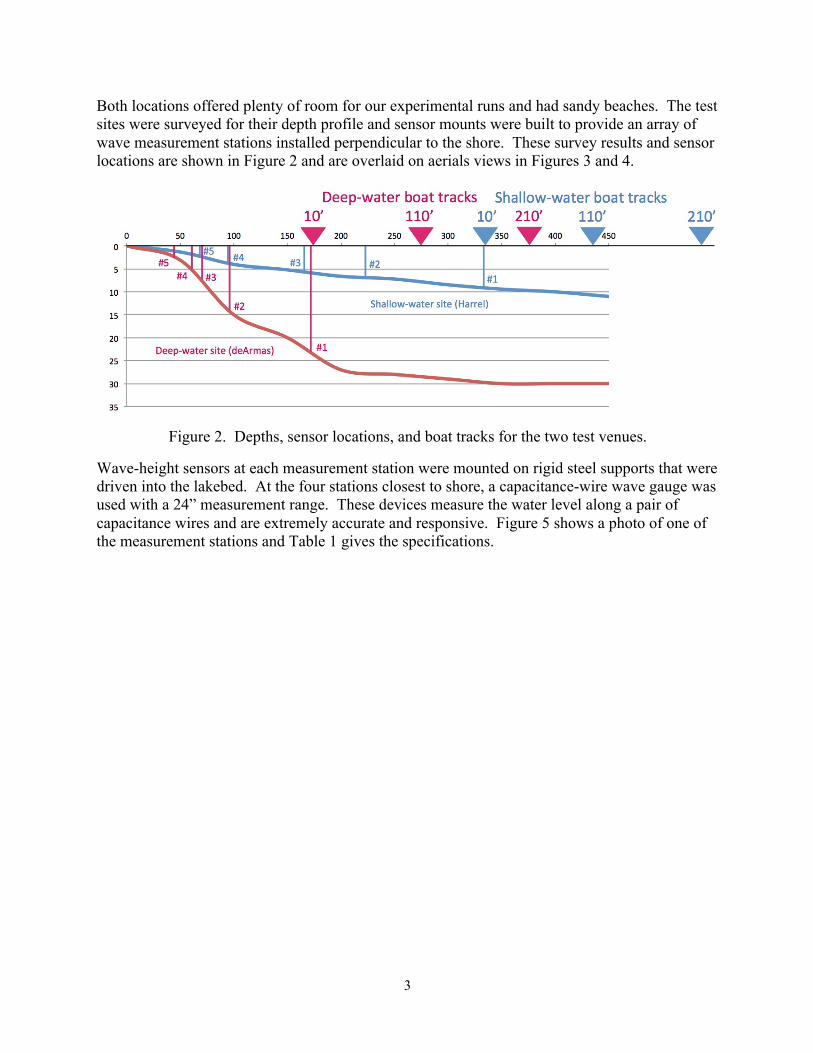
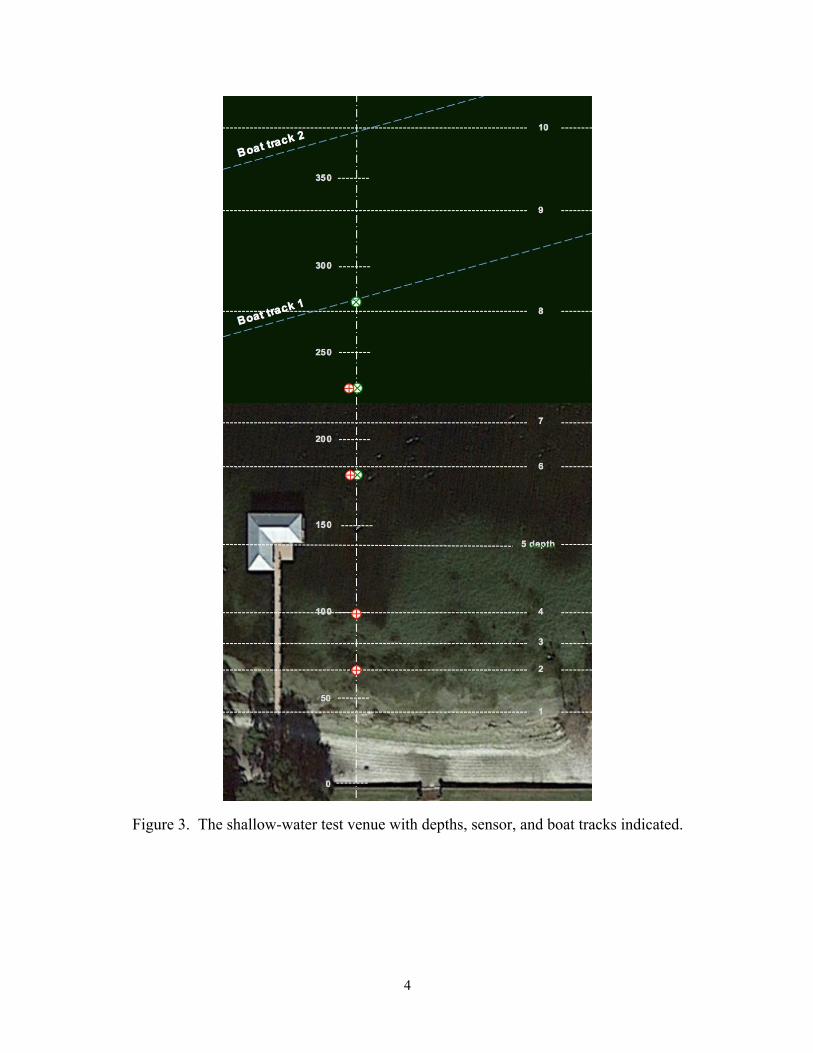
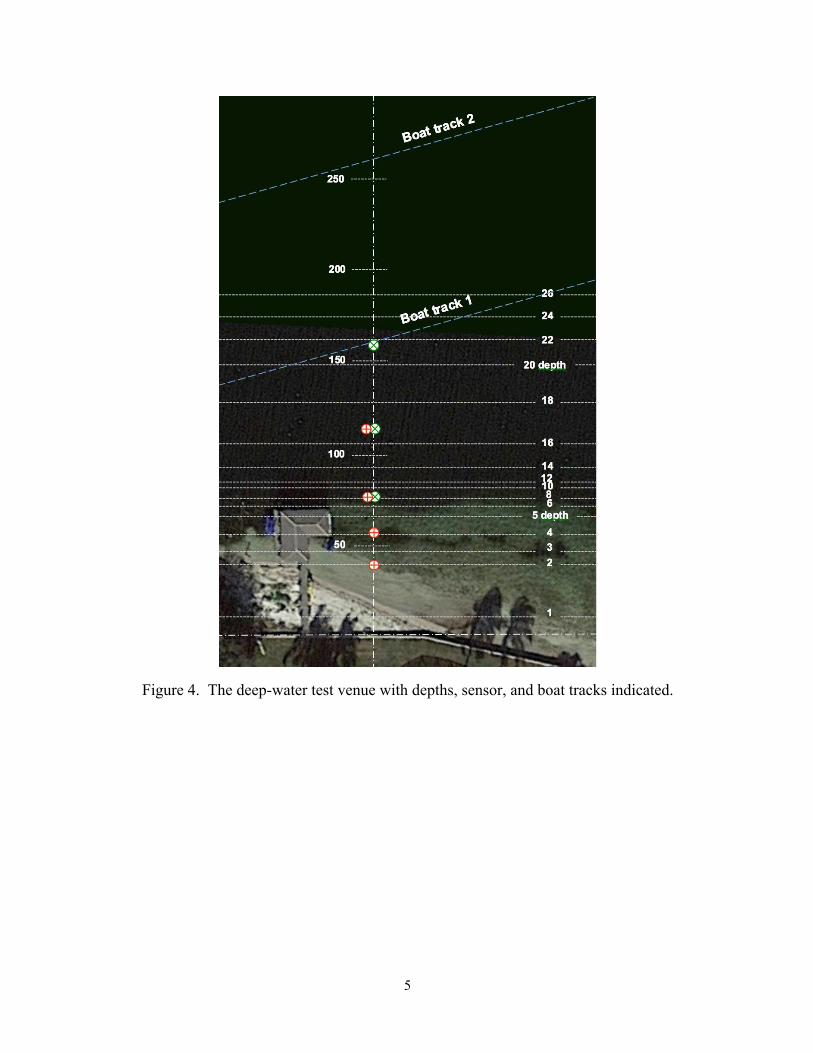
Both locations offered plenty of room for our experimental runs and had sandy beaches. The test sites were surveyed for their depth profile and sensor mounts were built to provide an array of wave measurement stations installed perpendicular to the shore. These survey results and sensor locations are shown in Figure 2 and are overlaid on aerials views in Figures 3 and 4.
Figure 2. Depths, sensor locations, and boat tracks for the two test venues.
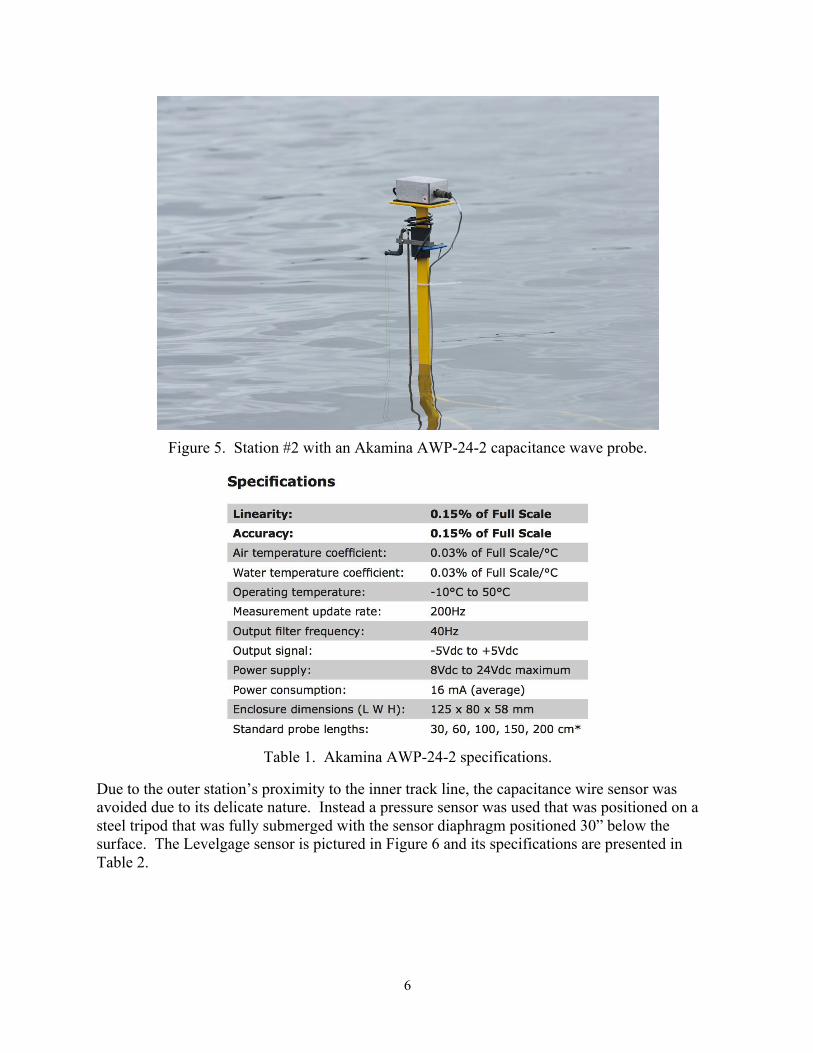
Wave-height sensors at each measurement station were mounted on rigid steel supports that were driven into the lakebed. At the four stations closest to shore, a capacitance-wire wave gauge was used with a 24” measurement range. These devices measure the water level along a pair of capacitance wires and are extremely accurate and responsive. Figure 5 shows a photo of one of the measurement stations and Table 1 gives the specifications.
4
Figure 3. The shallow-water test venue with depths, sensor, and boat tracks indicated.
5
Figure 4. The deep-water test venue with depths, sensor, and boat tracks indicated.
6
Figure 5. Station #2 with an Akamina AWP-24-2 capacitance wave probe.
Table 1. Akamina AWP-24-2 specifications.
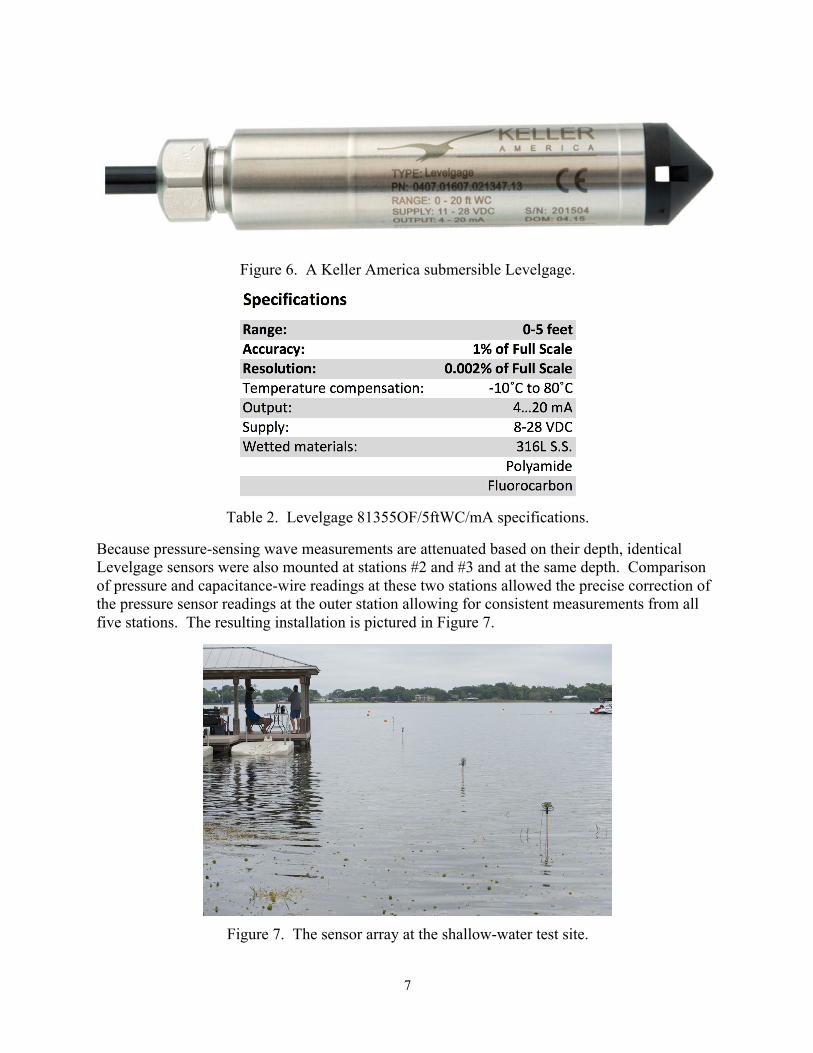
Due to the outer station’s proximity to the inner track line, the capacitance wire sensor was avoided due to its delicate nature. Instead a pressure sensor was used that was positioned on a steel tripod that was fully submerged with the sensor diaphragm positioned 30” below the surface. The Levelgage sensor is pictured in Figure 6 and its specifications are presented in Table 2.
7
Figure 6. A Keller America submersible Levelgage.
Table 2. Levelgage 81355OF/5ftWC/mA specifications.
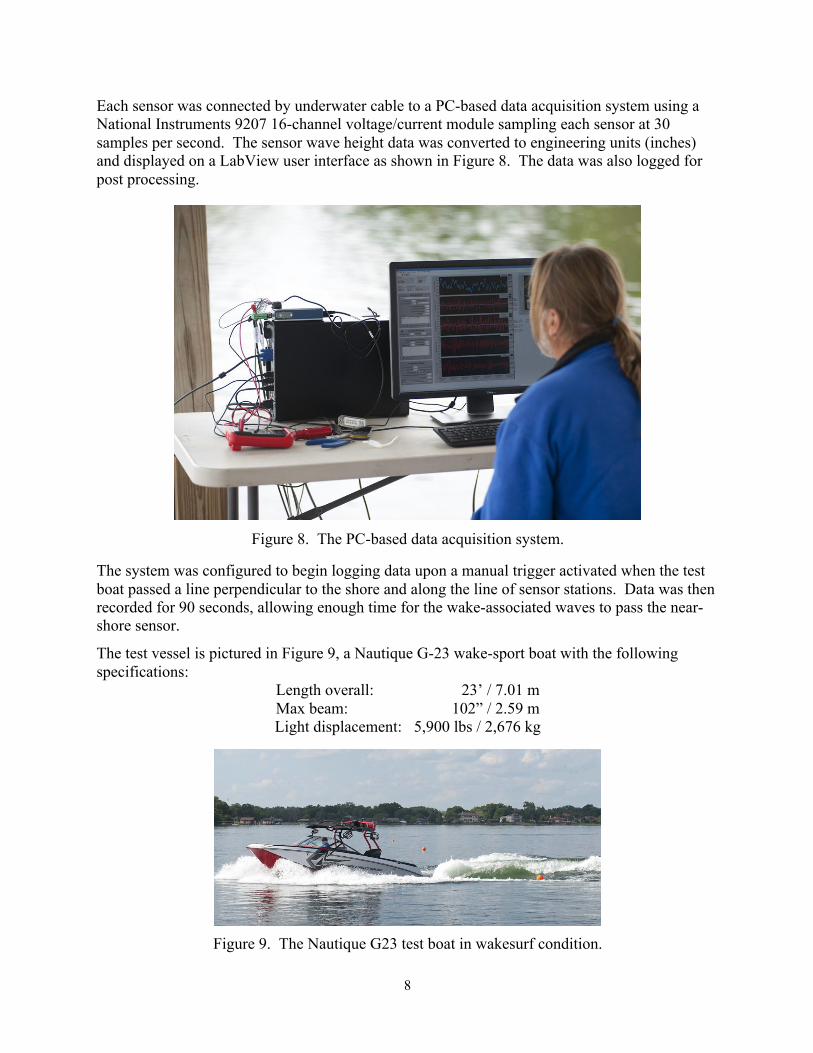
Because pressure-sensing wave measurements are attenuated based on their depth, identical Levelgage sensors were also mounted at stations #2 and #3 and at the same depth. Comparison of pressure and capacitance-wire readings at these two stations allowed the precise correction of the pressure sensor readings at the outer station allowing for consistent measurements from all five stations. The resulting installation is pictured in Figure 7.
Figure 7. The sensor array at the shallow-water test site.
8
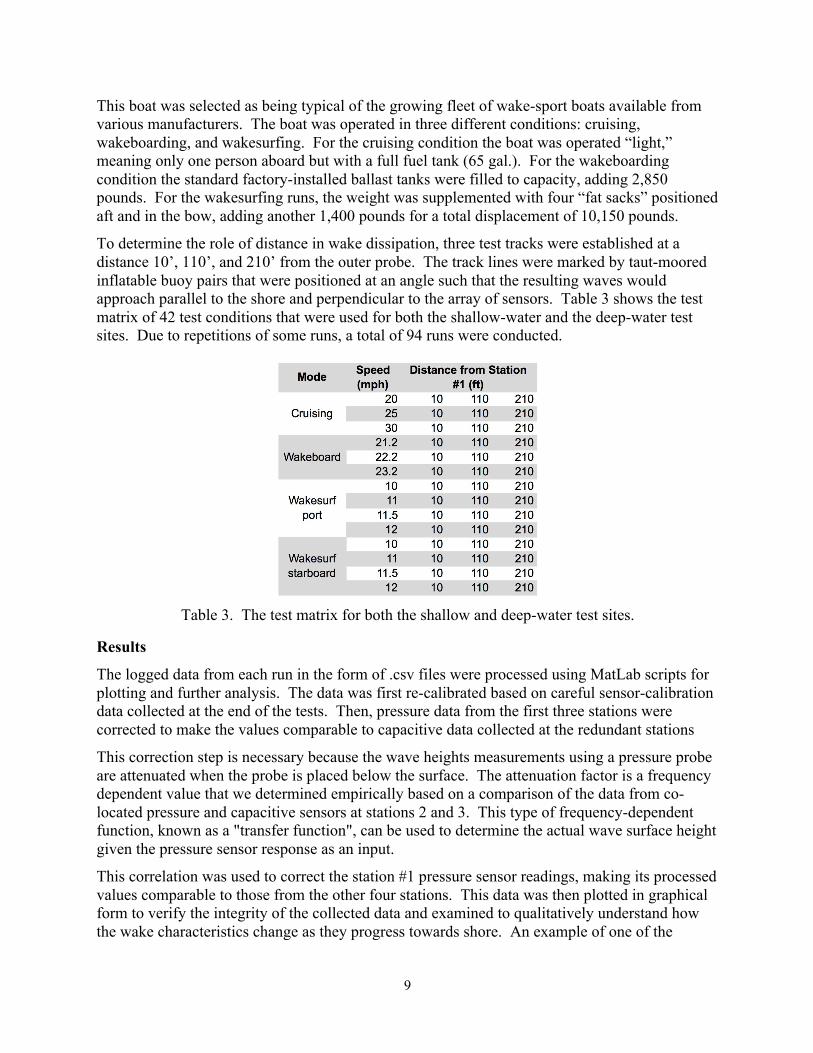
Each sensor was connected by underwater cable to a PC-based data acquisition system using a National Instruments 9207 16-channel voltage/current module sampling each sensor at 30 samples per second. The sensor wave height data was converted to engineering units (inches) and displayed on a LabView user interface as shown in Figure 8. The data was also logged for post processing.
Figure 8. The PC-based data acquisition system.
The system was configured to begin logging data upon a manual trigger activated when the test boat passed a line perpendicular to the shore and along the line of sensor stations. Data was then recorded for 90 seconds, allowing enough time for the wake-associated waves to pass the near-shore sensor.
The test vessel is pictured in Figure 9, a Nautique G-23 wake-sport boat with the following specifications:
Length overall: 23’ / 7.01 m Max beam: 102” / 2.59 m Light displacement: 5,900 lbs / 2,676 kg
Figure 9. The Nautique G23 test boat in wakesurf condition.
9
This boat was selected as being typical of the growing fleet of wake-sport boats available from various manufacturers. The boat was operated in three different conditions: cruising, wakeboarding, and wakesurfing. For the cruising condition the boat was operated “light,” meaning only one person aboard but with a full fuel tank (65 gal.). For the wakeboarding condition the standard factory-installed ballast tanks were filled to capacity, adding 2,850 pounds. For the wakesurfing runs, the weight was supplemented with four “fat sacks” positioned aft and in the bow, adding another 1,400 pounds for a total displacement of 10,150 pounds.
To determine the role of distance in wake dissipation, three test tracks were established at a distance 10’, 110’, and 210’ from the outer probe. The track lines were marked by taut-moored inflatable buoy pairs that were positioned at an angle such that the resulting waves would approach parallel to the shore and perpendicular to the array of sensors. Table 3 shows the test matrix of 42 test conditions that were used for both the shallow-water and the deep-water test sites. Due to repetitions of some runs, a total of 94 runs were conducted.
Table 3. The test matrix for both the shallow and deep-water test sites.
Results
The logged data from each run in the form of .csv files were processed using MatLab scripts for plotting and further analysis. The data was first re-calibrated based on careful sensor-calibration data collected at the end of the tests. Then, pressure data from the first three stations were corrected to make the values comparable to capacitive data collected at the redundant stations
This correction step is necessary because the wave heights measurements using a pressure probe are attenuated when the probe is placed below the surface. The attenuation factor is a frequency dependent value that we determined empirically based on a comparison of the data from co-located pressure and capacitive sensors at stations 2 and 3. This type of frequency-dependent function, known as a "transfer function", can be used to determine the actual wave surface height given the pressure sensor response as an input.
This correlation was used to correct the station #1 pressure sensor readings, making its processed values comparable to those from the other four stations. This data was then plotted in graphical form to verify the integrity of the collected data and examined to qualitatively understand how the wake characteristics change as they progress towards shore. An example of one of the
10
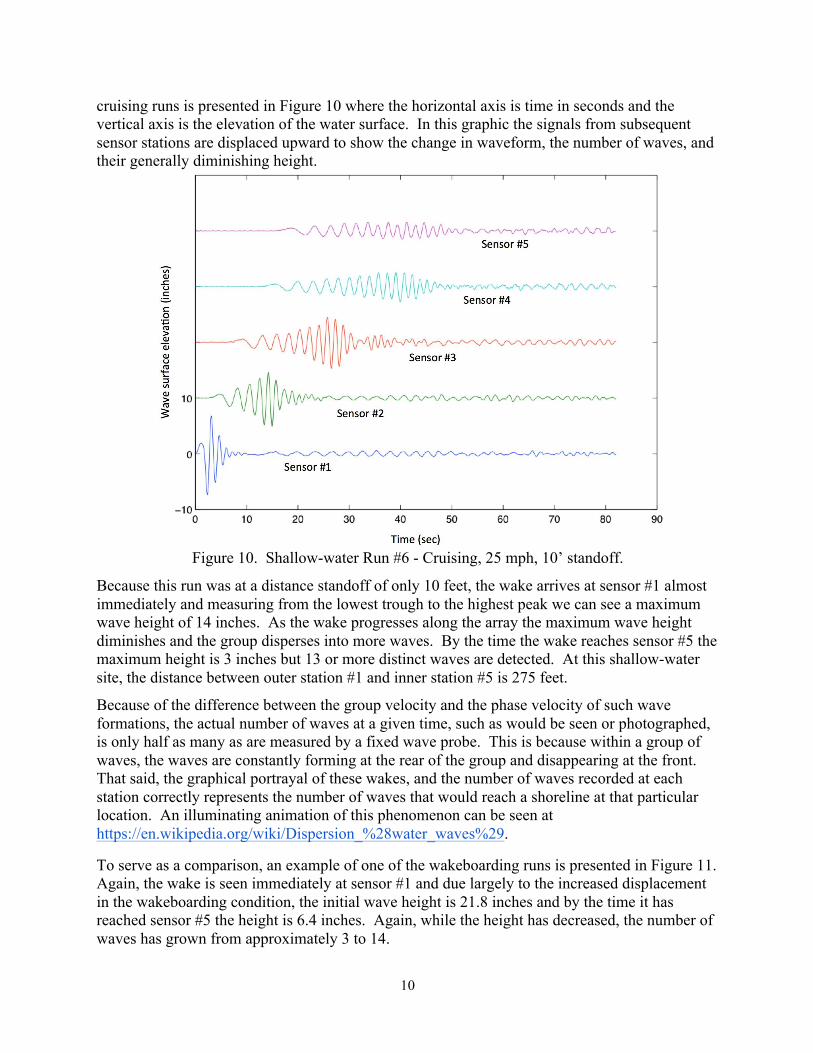
cruising runs is presented in Figure 10 where the horizontal axis is time in seconds and the vertical axis is the elevation of the water surface. In this graphic the signals from subsequent sensor stations are displaced upward to show the change in waveform, the number of waves, and their generally diminishing height.
Figure 10. Shallow-water Run #6 - Cruising, 25 mph, 10’ standoff.
Because this run was at a distance standoff of only 10 feet, the wake arrives at sensor #1 almost immediately and measuring from the lowest trough to the highest peak we can see a maximum wave height of 14 inches. As the wake progresses along the array the maximum wave height diminishes and the group disperses into more waves. By the time the wake reaches sensor #5 the maximum height is 3 inches but 13 or more distinct waves are detected. At this shallow-water site, the distance between outer station #1 and inner station #5 is 275 feet.
Because of the difference between the group velocity and the phase velocity of such wave formations, the actual number of waves at a given time, such as would be seen or photographed, is only half as many as are measured by a fixed wave probe. This is because within a group of waves, the waves are constantly forming at the rear of the group and disappearing at the front. That said, the graphical portrayal of these wakes, and the number of waves recorded at each station correctly represents the number of waves that would reach a shoreline at that particular location. An illuminating animation of this phenomenon can be seen at https://en.wikipedia.org/wiki/Dispersion_%28water_waves%29.
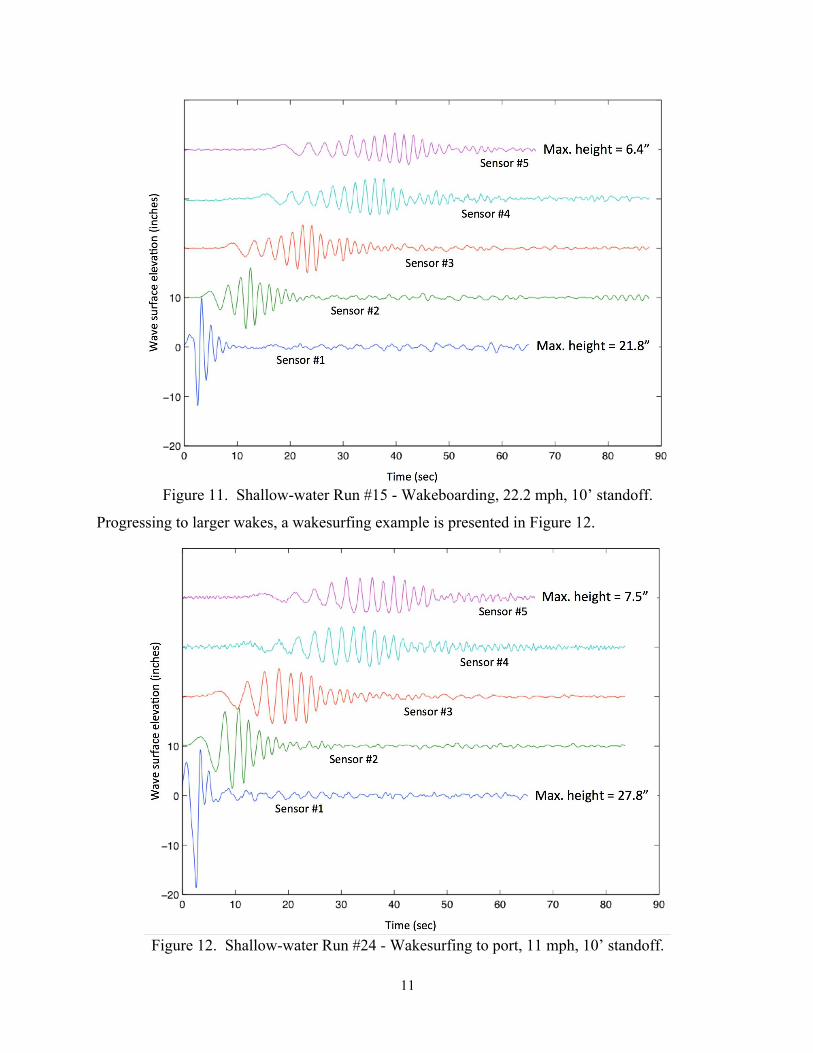
To serve as a comparison, an example of one of the wakeboarding runs is presented in Figure 11. Again, the wake is seen immediately at sensor #1 and due largely to the increased displacement in the wakeboarding condition, the initial wave height is 21.8 inches and by the time it has reached sensor #5 the height is 6.4 inches. Again, while the height has decreased, the number of waves has grown from approximately 3 to 14.
11
Figure 11. Shallow-water Run #15 - Wakeboarding, 22.2 mph, 10’ standoff.
Progressing to larger wakes, a wakesurfing example is presented in Figure 12.
Figure 12. Shallow-water Run #24 - Wakesurfing to port, 11 mph, 10’ standoff.
12
Here, due to a further displacement increase and a lower operating speed, the maximum wave height at sensor #1 measures 27.8 inches. At shoreward sensor #5 the height is 7.5 inches and twelve waves were detected.
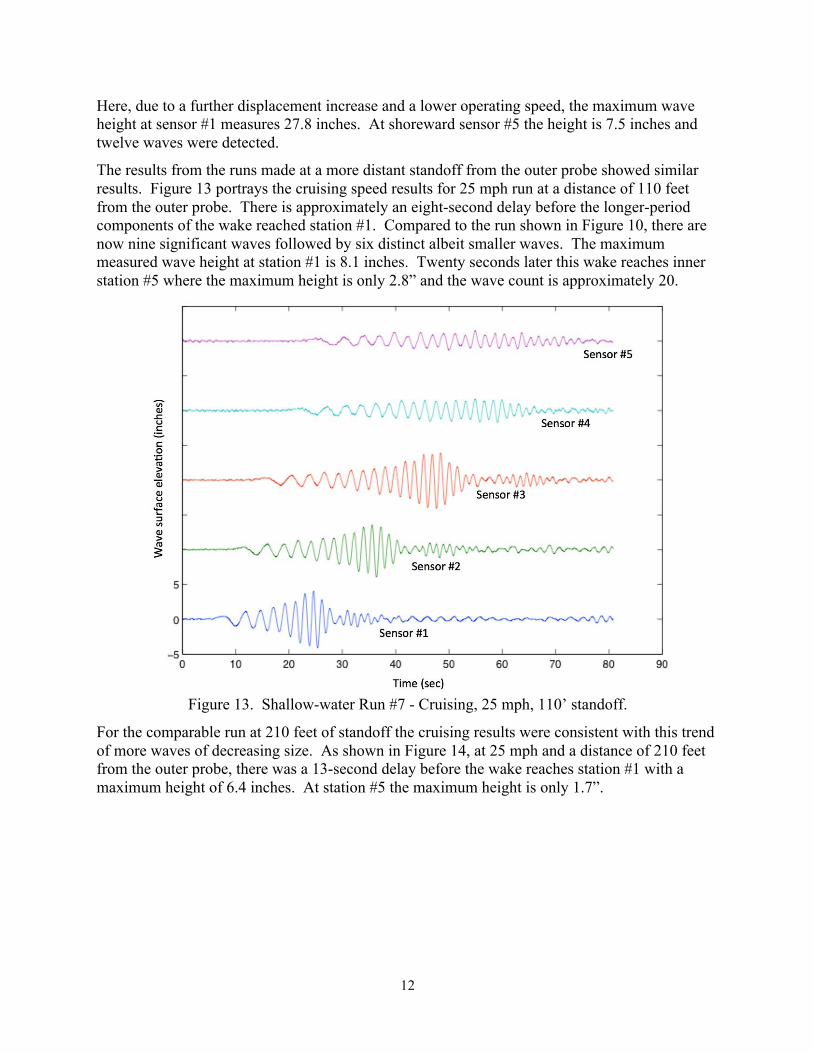
The results from the runs made at a more distant standoff from the outer probe showed similar results. Figure 13 portrays the cruising speed results for 25 mph run at a distance of 110 feet from the outer probe. There is approximately an eight-second delay before the longer-period components of the wake reached station #1. Compared to the run shown in Figure 10, there are now nine significant waves followed by six distinct albeit smaller waves. The maximum measured wave height at station #1 is 8.1 inches. Twenty seconds later this wake reaches inner station #5 where the maximum height is only 2.8” and the wave count is approximately 20.
Figure 13. Shallow-water Run #7 - Cruising, 25 mph, 110’ standoff.
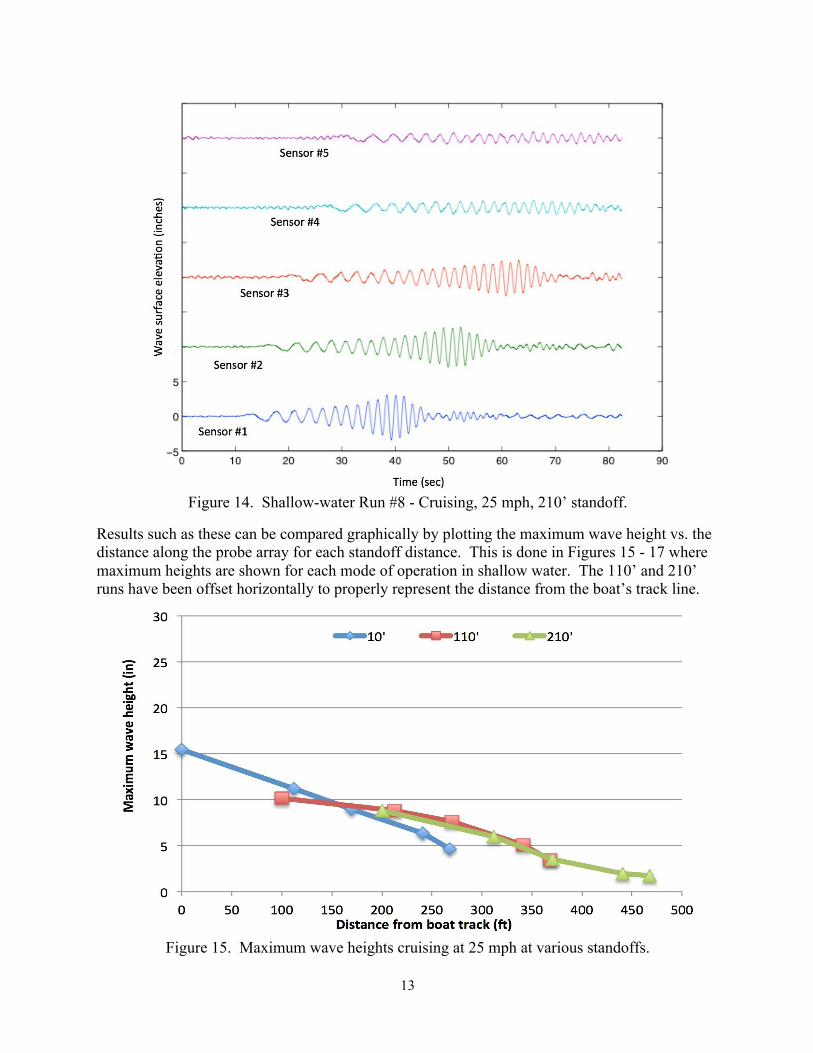
For the comparable run at 210 feet of standoff the cruising results were consistent with this trend of more waves of decreasing size. As shown in Figure 14, at 25 mph and a distance of 210 feet from the outer probe, there was a 13-second delay before the wake reaches station #1 with a maximum height of 6.4 inches. At station #5 the maximum height is only 1.7”.
13
Figure 14. Shallow-water Run #8 - Cruising, 25 mph, 210’ standoff.
Results such as these can be compared graphically by plotting the maximum wave height vs. the distance along the probe array for each standoff distance. This is done in Figures 15 - 17 where maximum heights are shown for each mode of operation in shallow water. The 110’ and 210’ runs have been offset horizontally to properly represent the distance from the boat’s track line.
Figure 15. Maximum wave heights cruising at 25 mph at various standoffs.
14
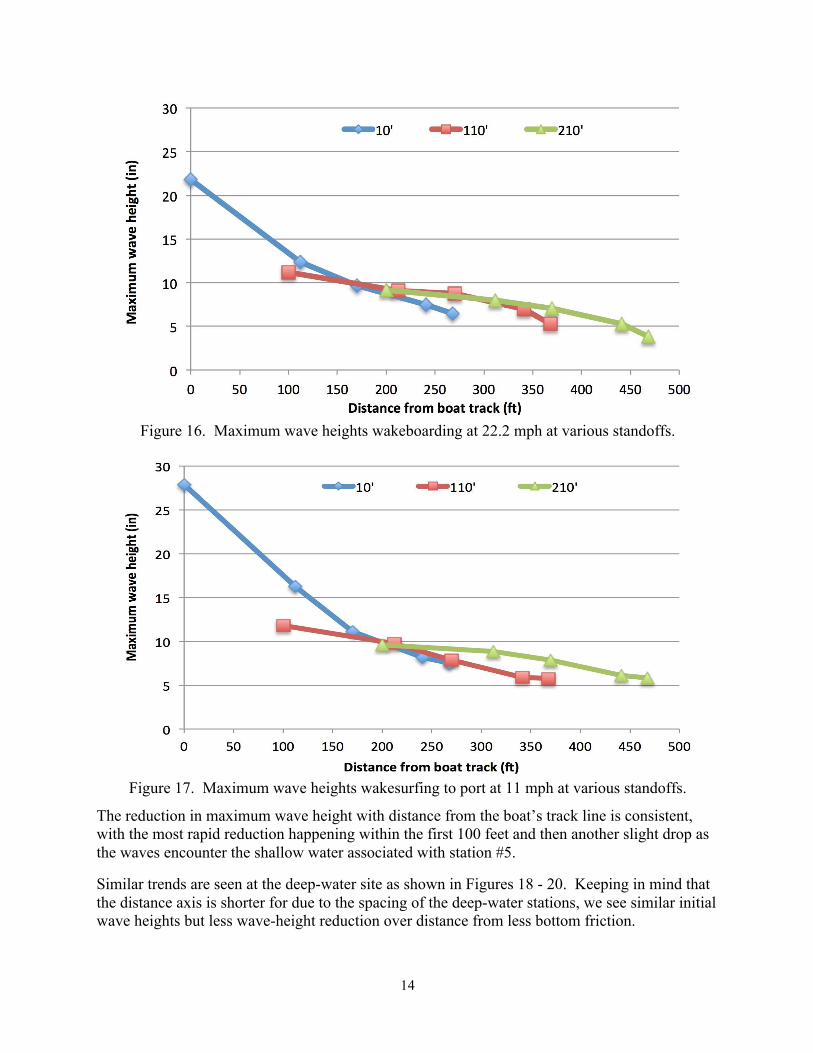
Figure 16. Maximum wave heights wakeboarding at 22.2 mph at various standoffs.
Figure 17. Maximum wave heights wakesurfing to port at 11 mph at various standoffs.
The reduction in maximum wave height with distance from the boat’s track line is consistent, with the most rapid reduction happening within the first 100 feet and then another slight drop as the waves encounter the shallow water associated with station #5.
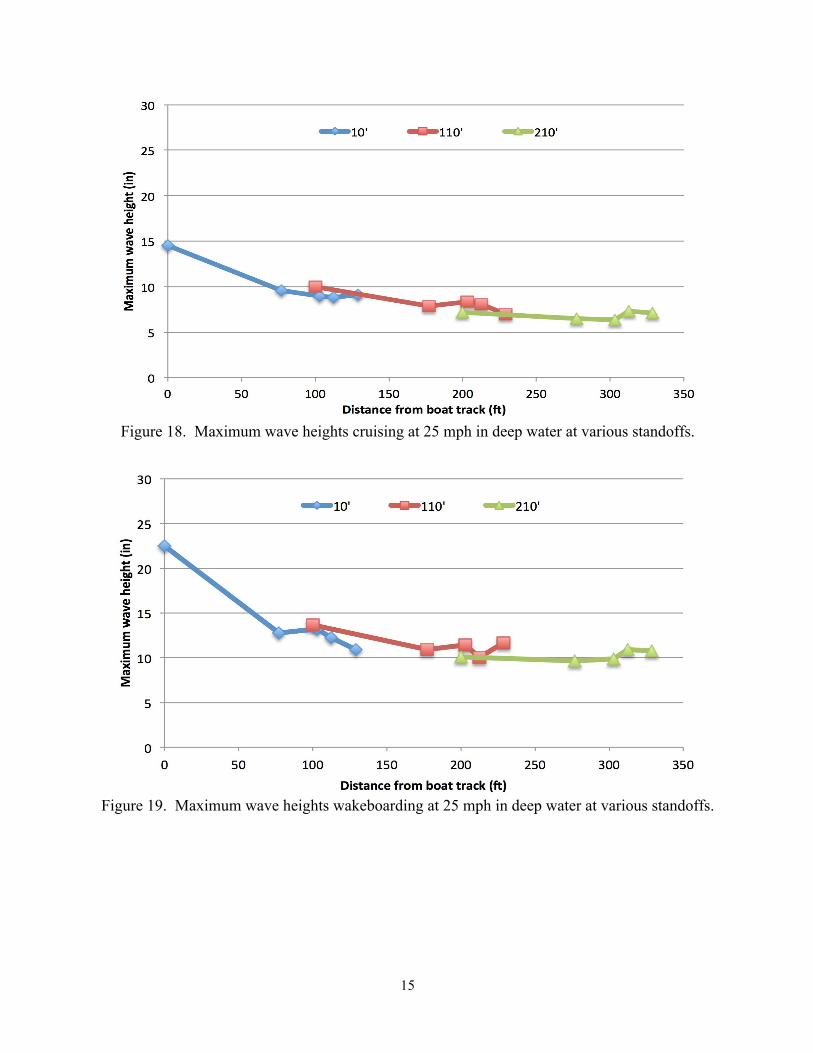
Similar trends are seen at the deep-water site as shown in Figures 18 - 20. Keeping in mind that the distance axis is shorter for due to the spacing of the deep-water stations, we see similar initial wave heights but less wave-height reduction over distance from less bottom friction.
15
Figure 18. Maximum wave heights cruising at 25 mph in deep water at various standoffs.
Figure 19. Maximum wave heights wakeboarding at 25 mph in deep water at various standoffs.
16
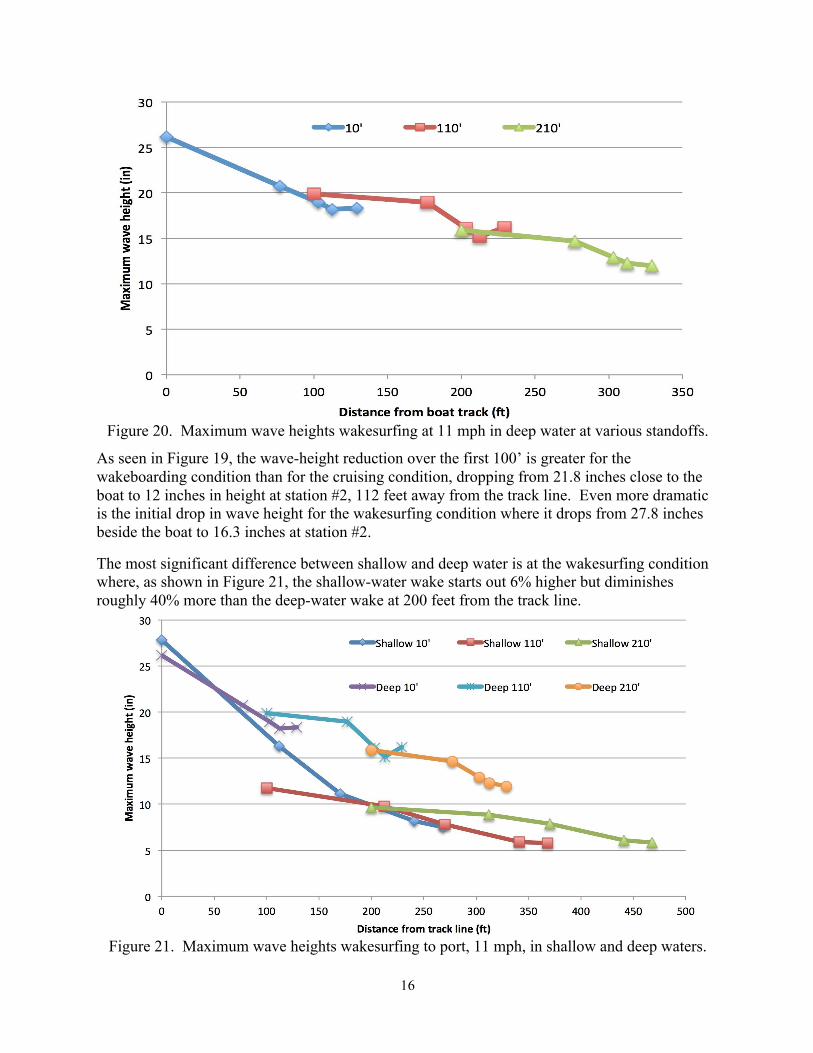
Figure 20. Maximum wave heights wakesurfing at 11 mph in deep water at various standoffs.
As seen in Figure 19, the wave-height reduction over the first 100’ is greater for the wakeboarding condition than for the cruising condition, dropping from 21.8 inches close to the boat to 12 inches in height at station #2, 112 feet away from the track line. Even more dramatic is the initial drop in wave height for the wakesurfing condition where it drops from 27.8 inches beside the boat to 16.3 inches at station #2.
The most significant difference between shallow and deep water is at the wakesurfing condition where, as shown in Figure 21, the shallow-water wake starts out 6% higher but diminishes roughly 40% more than the deep-water wake at 200 feet from the track line.
Figure 21. Maximum wave heights wakesurfing to port, 11 mph, in shallow and deep waters.
17
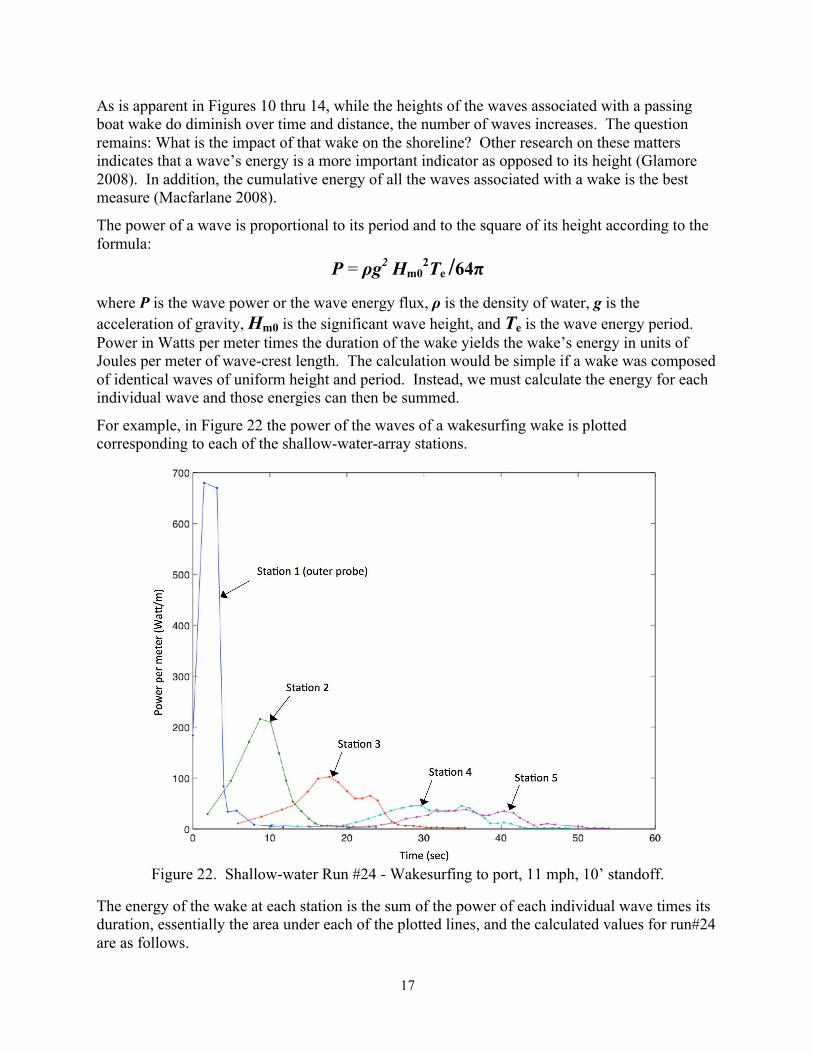
As is apparent in Figures 10 thru 14, while the heights of the waves associated with a passing boat wake do diminish over time and distance, the number of waves increases. The question remains: What is the impact of that wake on the shoreline? Other research on these matters indicates that a wave’s energy is a more important indicator as opposed to its height (Glamore 2008). In addition, the cumulative energy of all the waves associated with a wake is the best measure (Macfarlane 2008).
The power of a wave is proportional to its period and to the square of its height according to the formula:
P = ρg2 Hm02Te /64π
where P is the wave power or the wave energy flux, ρ is the density of water, g is the acceleration of gravity, Hm0 is the significant wave height, and Te is the wave energy period. Power in Watts per meter times the duration of the wake yields the wake’s energy in units of Joules per meter of wave-crest length. The calculation would be simple if a wake was composed of identical waves of uniform height and period. Instead, we must calculate the energy for each individual wave and those energies can then be summed.
For example, in Figure 22 the power of the waves of a wakesurfing wake is plotted corresponding to each of the shallow-water-array stations.
Figure 22. Shallow-water Run #24 - Wakesurfing to port, 11 mph, 10’ standoff.
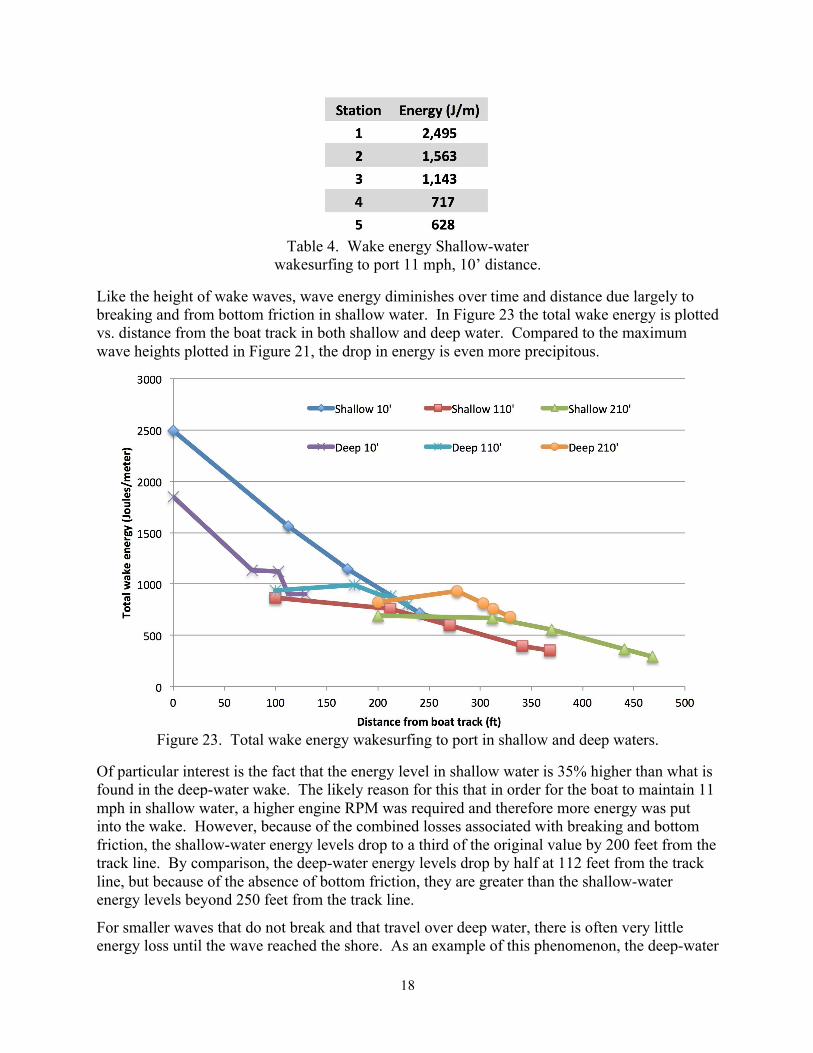
The energy of the wake at each station is the sum of the power of each individual wave times its duration, essentially the area under each of the plotted lines, and the calculated values for run#24 are as follows.
18
Table 4. Wake energy Shallow-water
wakesurfing to port 11 mph, 10’ distance.
Like the height of wake waves, wave energy diminishes over time and distance due largely to breaking and from bottom friction in shallow water. In Figure 23 the total wake energy is plotted vs. distance from the boat track in both shallow and deep water. Compared to the maximum wave heights plotted in Figure 21, the drop in energy is even more precipitous.
Figure 23. Total wake energy wakesurfing to port in shallow and deep waters.
Of particular interest is the fact that the energy level in shallow water is 35% higher than what is found in the deep-water wake. The likely reason for this that in order for the boat to maintain 11 mph in shallow water, a higher engine RPM was required and therefore more energy was put into the wake. However, because of the combined losses associated with breaking and bottom friction, the shallow-water energy levels drop to a third of the original value by 200 feet from the track line. By comparison, the deep-water energy levels drop by half at 112 feet from the track line, but because of the absence of bottom friction, they are greater than the shallow-water energy levels beyond 250 feet from the track line.
For smaller waves that do not break and that travel over deep water, there is often very little energy loss until the wave reached the shore. As an example of this phenomenon, the deep-water
19
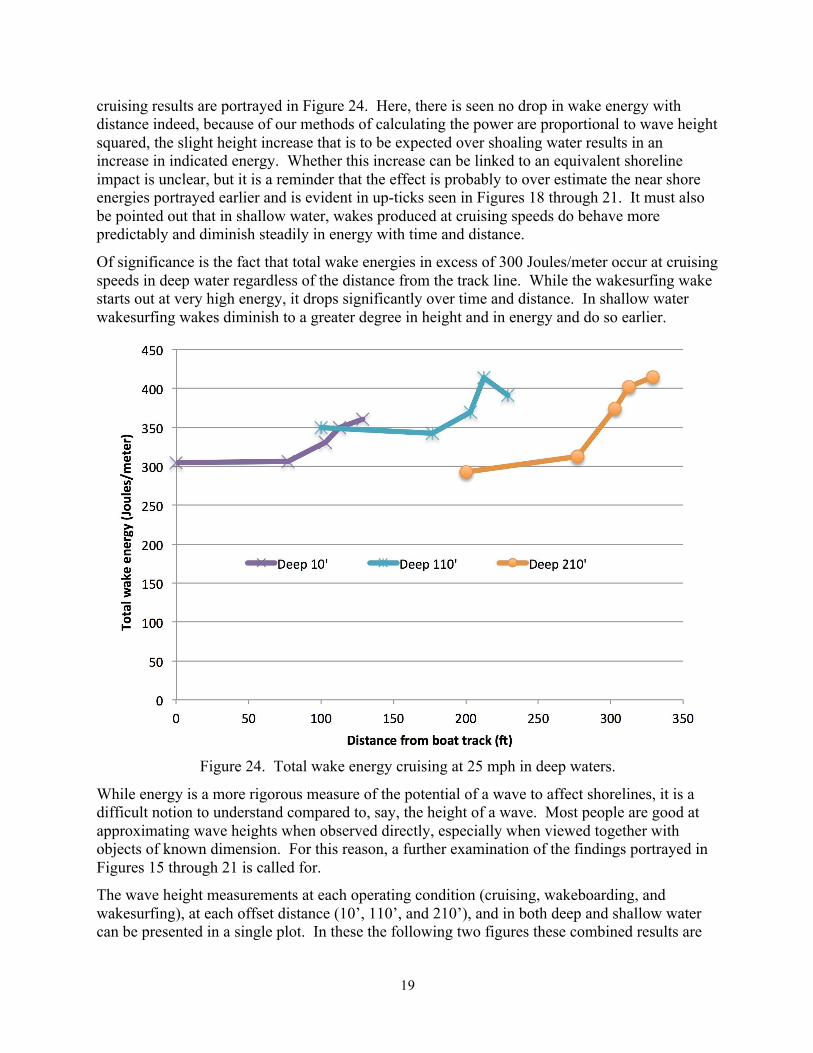
cruising results are portrayed in Figure 24. Here, there is seen no drop in wake energy with distance indeed, because of our methods of calculating the power are proportional to wave height squared, the slight height increase that is to be expected over shoaling water results in an increase in indicated energy. Whether this increase can be linked to an equivalent shoreline impact is unclear, but it is a reminder that the effect is probably to over estimate the near shore energies portrayed earlier and is evident in up-ticks seen in Figures 18 through 21. It must also be pointed out that in shallow water, wakes produced at cruising speeds do behave more predictably and diminish steadily in energy with time and distance.
Of significance is the fact that total wake energies in excess of 300 Joules/meter occur at cruising speeds in deep water regardless of the distance from the track line. While the wakesurfing wake starts out at very high energy, it drops significantly over time and distance. In shallow water wakesurfing wakes diminish to a greater degree in height and in energy and do so earlier.
Figure 24. Total wake energy cruising at 25 mph in deep waters.
While energy is a more rigorous measure of the potential of a wave to affect shorelines, it is a difficult notion to understand compared to, say, the height of a wave. Most people are good at approximating wave heights when observed directly, especially when viewed together with objects of known dimension. For this reason, a further examination of the findings portrayed in Figures 15 through 21 is called for.
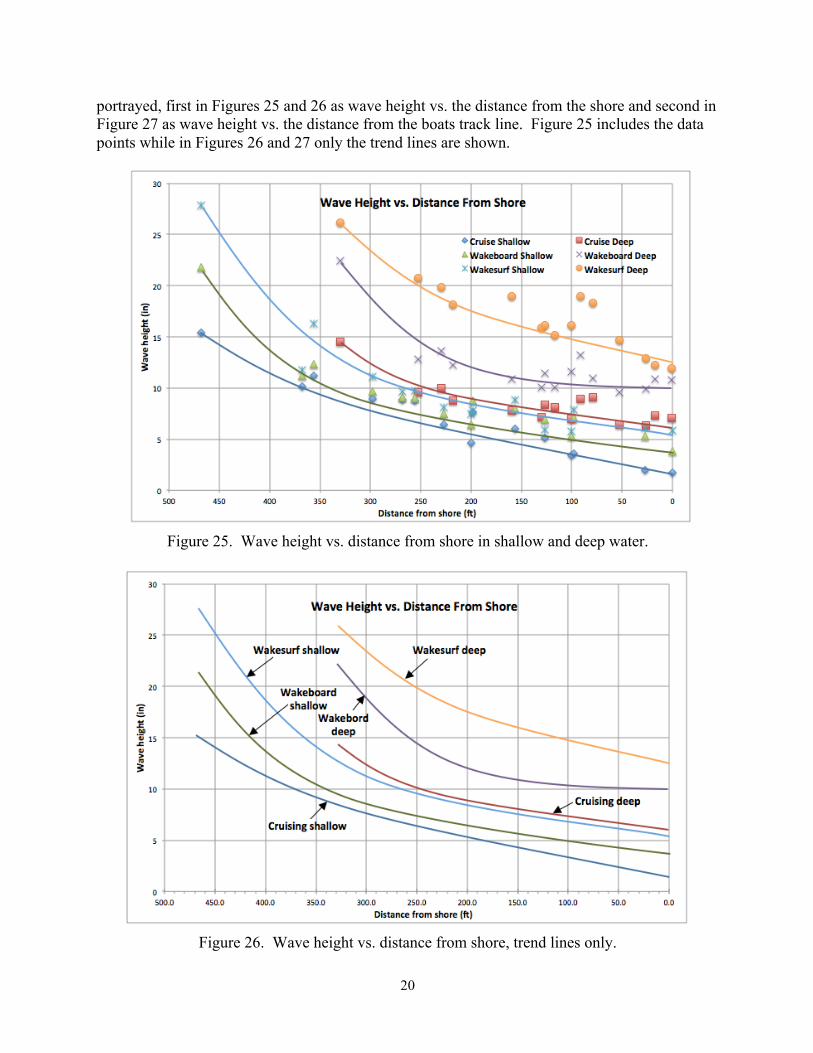
The wave height measurements at each operating condition (cruising, wakeboarding, and wakesurfing), at each offset distance (10’, 110’, and 210’), and in both deep and shallow water can be presented in a single plot. In these the following two figures these combined results are
20
portrayed, first in Figures 25 and 26 as wave height vs. the distance from the shore and second in Figure 27 as wave height vs. the distance from the boats track line. Figure 25 includes the data points while in Figures 26 and 27 only the trend lines are shown.
Figure 25. Wave height vs. distance from shore in shallow and deep water.
Figure 26. Wave height vs. distance from shore, trend lines only.
21
In these figures we see more clearly the role of distance in wave height dissipation and how the larger waves of wake sports tend to dissipate more rapidly than the smaller waves at cruising speeds. While the wave heights start out very different due to the boat’s speed and ballasting, the difference at the shoreline is less, especially in shallow water where more damping occurs.
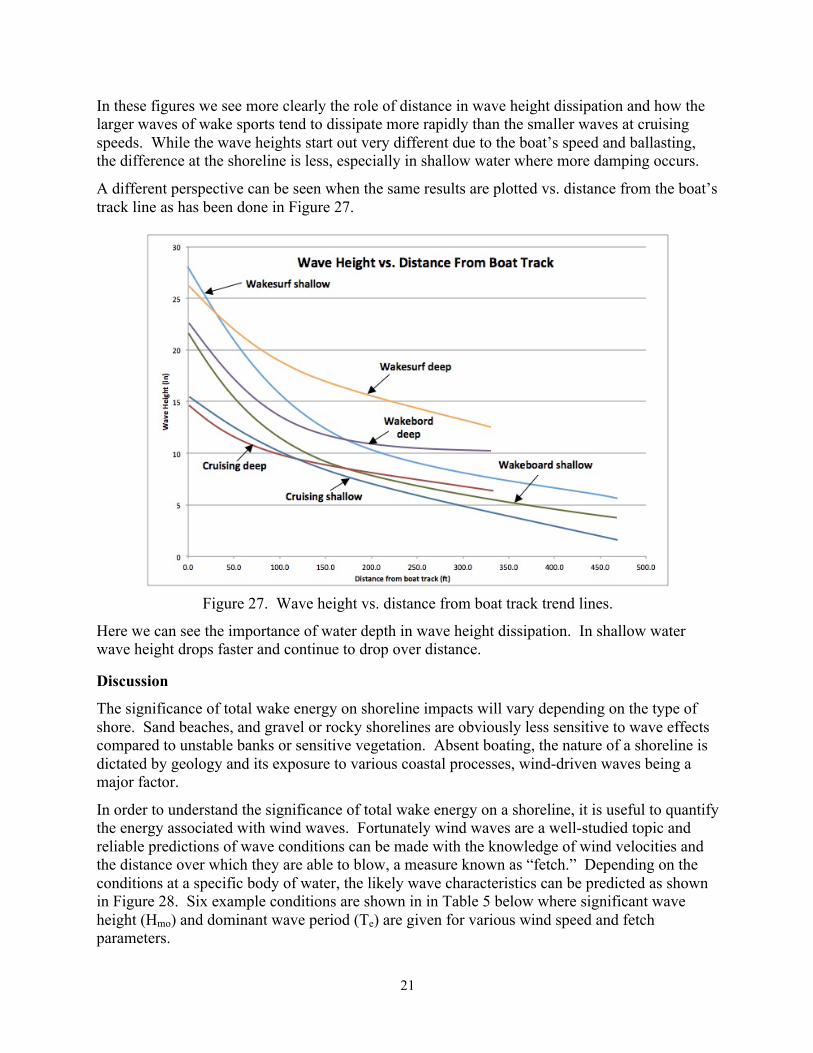
A different perspective can be seen when the same results are plotted vs. distance from the boat’s track line as has been done in Figure 27.
Figure 27. Wave height vs. distance from boat track trend lines.
Here we can see the importance of water depth in wave height dissipation. In shallow water wave height drops faster and continue to drop over distance.
Discussion
The significance of total wake energy on shoreline impacts will vary depending on the type of shore. Sand beaches, and gravel or rocky shorelines are obviously less sensitive to wave effects compared to unstable banks or sensitive vegetation. Absent boating, the nature of a shoreline is dictated by geology and its exposure to various coastal processes, wind-driven waves being a major factor.
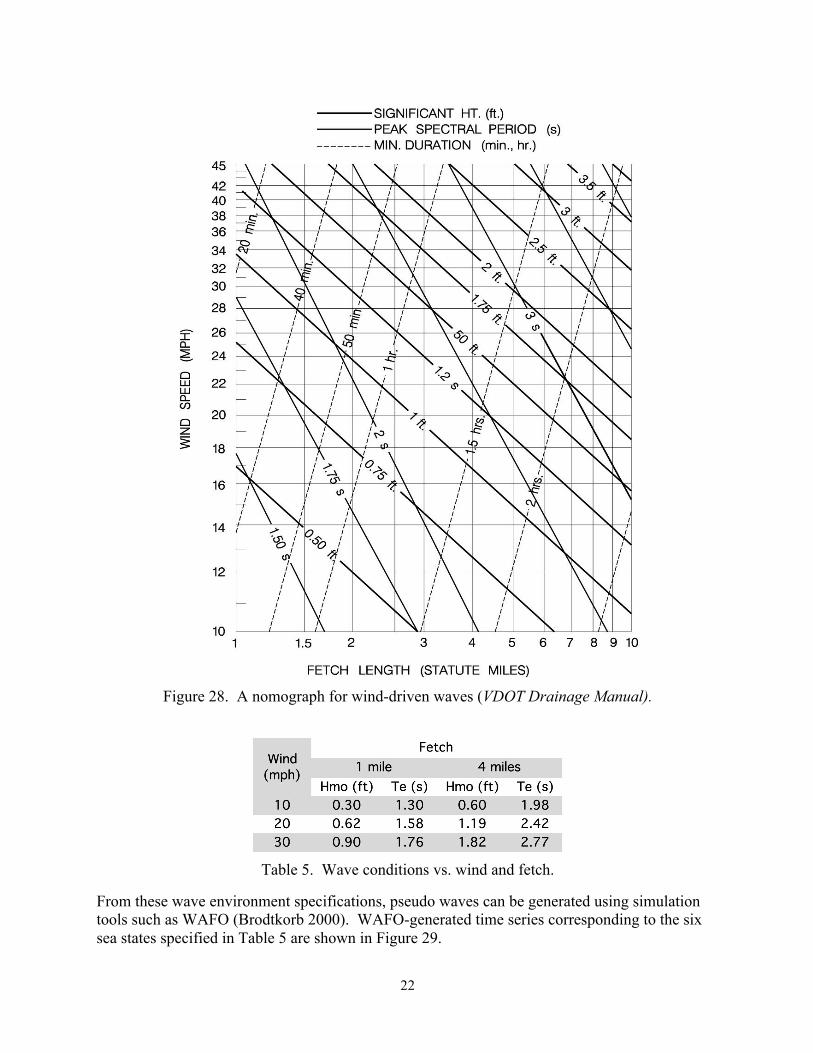
In order to understand the significance of total wake energy on a shoreline, it is useful to quantify the energy associated with wind waves. Fortunately wind waves are a well-studied topic and reliable predictions of wave conditions can be made with the knowledge of wind velocities and the distance over which they are able to blow, a measure known as “fetch.” Depending on the conditions at a specific body of water, the likely wave characteristics can be predicted as shown in Figure 28. Six example conditions are shown in in Table 5 below where significant wave height (Hmo) and dominant wave period (Te) are given for various wind speed and fetch parameters.
22
Figure 28. A nomograph for wind-driven waves (VDOT Drainage Manual).
Table 5. Wave conditions vs. wind and fetch.
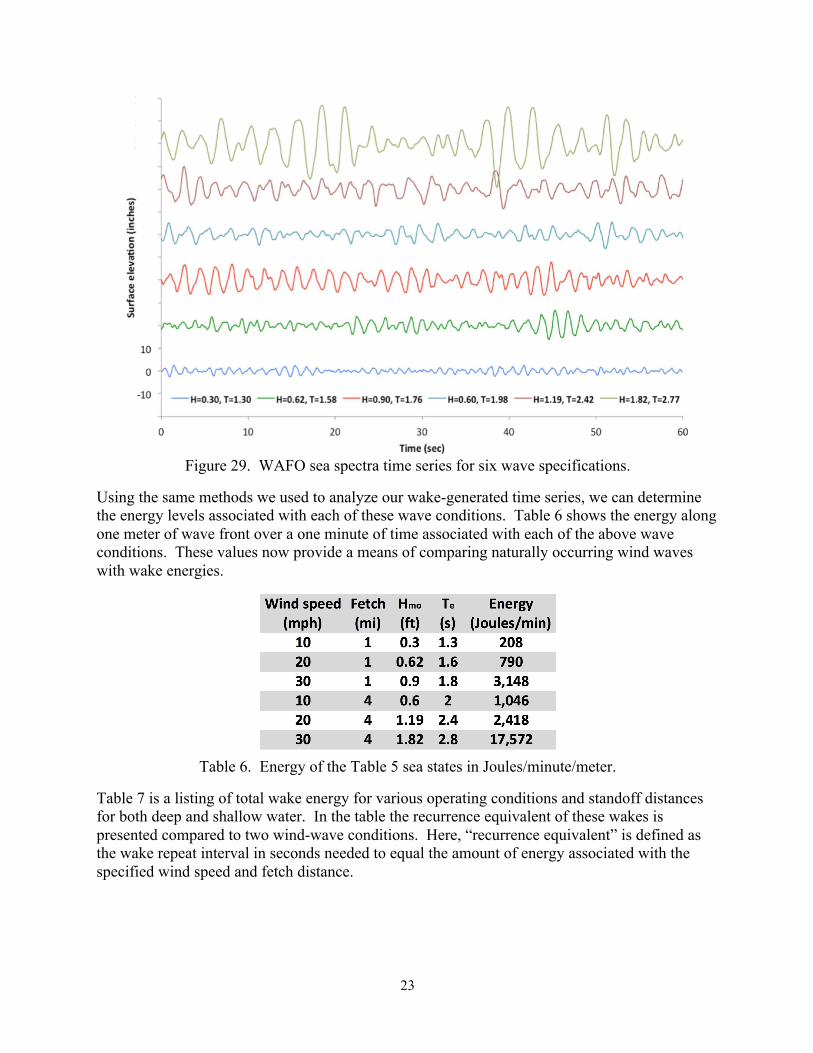
From these wave environment specifications, pseudo waves can be generated using simulation tools such as WAFO (Brodtkorb 2000). WAFO-generated time series corresponding to the six sea states specified in Table 5 are shown in Figure 29.
23
Figure 29. WAFO sea spectra time series for six wave specifications.
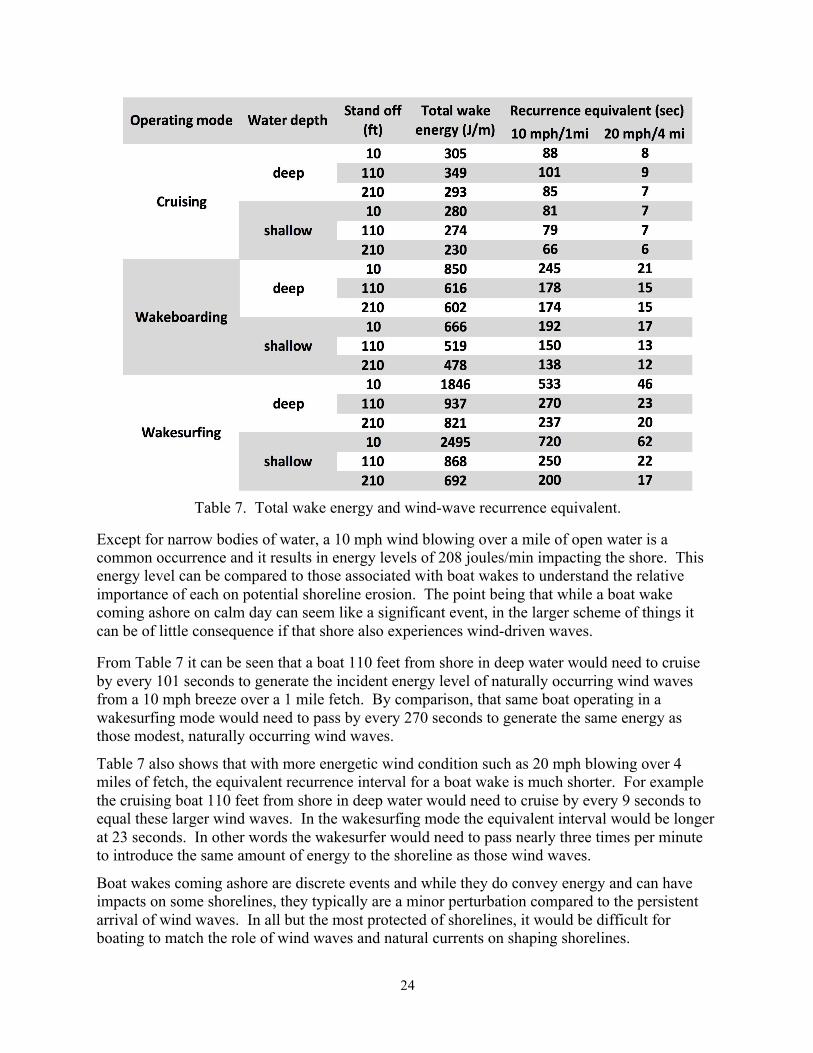
Using the same methods we used to analyze our wake-generated time series, we can determine the energy levels associated with each of these wave conditions. Table 6 shows the energy along one meter of wave front over a one minute of time associated with each of the above wave conditions. These values now provide a means of comparing naturally occurring wind waves with wake energies.
Table 6. Energy of the Table 5 sea states in Joules/minute/meter.
Table 7 is a listing of total wake energy for various operating conditions and standoff distances for both deep and shallow water. In the table the recurrence equivalent of these wakes is presented compared to two wind-wave conditions. Here, “recurrence equivalent” is defined as the wake repeat interval in seconds needed to equal the amount of energy associated with the specified wind speed and fetch distance.
24
Table 7. Total wake energy and wind-wave recurrence equivalent.
Except for narrow bodies of water, a 10 mph wind blowing over a mile of open water is a common occurrence and it results in energy levels of 208 joules/min impacting the shore. This energy level can be compared to those associated with boat wakes to understand the relative importance of each on potential shoreline erosion. The point being that while a boat wake coming ashore on calm day can seem like a significant event, in the larger scheme of things it can be of little consequence if that shore also experiences wind-driven waves.
From Table 7 it can be seen that a boat 110 feet from shore in deep water would need to cruise by every 101 seconds to generate the incident energy level of naturally occurring wind waves from a 10 mph breeze over a 1 mile fetch. By comparison, that same boat operating in a wakesurfing mode would need to pass by every 270 seconds to generate the same energy as those modest, naturally occurring wind waves.
Table 7 also shows that with more energetic wind condition such as 20 mph blowing over 4 miles of fetch, the equivalent recurrence interval for a boat wake is much shorter. For example the cruising boat 110 feet from shore in deep water would need to cruise by every 9 seconds to equal these larger wind waves. In the wakesurfing mode the equivalent interval would be longer at 23 seconds. In other words the wakesurfer would need to pass nearly three times per minute to introduce the same amount of energy to the shoreline as those wind waves.
Boat wakes coming ashore are discrete events and while they do convey energy and can have impacts on some shorelines, they typically are a minor perturbation compared to the persistent arrival of wind waves. In all but the most protected of shorelines, it would be difficult for boating to match the role of wind waves and natural currents on shaping shorelines.
25
Conclusions
Based on both maximum wave height and total wake energy measurements it is clear that the same boat under different operating conditions can produce very different wakes. As with all boats, factors such as speed and total displacement have large and explainable influences on the initial size and the propagation characteristics of its wake.
Our findings show that as a wake progress away from the boat’s track line it undergoes important transformations both in height and the number of associated waves. The increase in the number of waves in a wake is a result of the initial large wave decomposing into a series of waves of different frequency. The longer-period wave components travel faster while the shorter-period waves travel slower. This results in a wake composed of an increasing number of waves and, from a simple conservation of energy perspective, these multiple waves must be smaller in height than the original wake as it leaves the boat.
In our tests, waves were shown to lose height and energy rapidly if they are large such as those formed during wakesurfing. This is due to a sudden energy loss, as it first breaks close behind the boat. In deep water subsequent reductions in wave height are due to continued decomposing into more waves. Once the wake reached shallow water, energy becomes dissipated due to bottom friction. As depths become shallower closer to shore, wave velocities decrease and, as a result, waves become steeper and slightly higher and can break even prior to reaching the shoreline.
Through this combination of factors (the initial wake breaking behind the boat, bottom friction, and shoal-water breaking) the energy of a wake is dissipated over time and distance. In shallow water, dissipation due to bottom friction becomes a more significant factor.
Shallow water has other effects in that it adds to the resistance of the boat requiring additional propulsive power to achieve a specified speed compared to deep water. As a result, for the same speeds, the shallow-water runs generated higher initial wakes but they dissipated more rapidly. At the shoreline, the energy remaining was significantly less in shallow water compared to those from the same operating conditions in deep water where waves progress with fewer losses.
Total wake energy from cruising conditions in shallow water at 110’ of offset had only dissipated 2% compared to runs 10’ from the array. By contrast, the total wake energy from wakesurfing dropped by 65% with the same standoff distance. An additional 100’ standoff yielded a further 20% reduction. Deep-water operations yielded less dramatic results with the total wake energy of wakesurfing dropping by 49% for the first 100 feet of standoff and a 12% reduction for the next 100 feet.
Distance from shore has an important effect on the amount of wake energy that reaches the shoreline. The significance of waves coming ashore depends on the nature of the shoreline. Those shorelines that routinely experience wind-driven waves are clearly more tolerant of wakes from all types of boating activity. By comparing boat-wave energy with the energy of wind waves associated with various combinations of wind speed and fetch distance, equivalent recurrence intervals can be determined, i.e. the frequency of wake events that would equal a specified wind condition. Because wind waves are persistent, in many settings they represent a more significant source of shoreline impact than boat wakes.
26
Acknowledgements
This research was supported by the Water Sports Industry Association (WSIA). The findings and opinions are those of the authors and do not necessarily represent the views of WSIA. Nautique Boats provided the G-23 test boat and a driver for all the testing. The shallow-water test venue in South Lake Conway was provided by Robert Harrel. The deep-water test venue in Big Lake Conway was provided by David DeArmas.
The authors wish to thank Larry Meddock, the Executive Director of WSIA and Kevin Michael, Assistant Director of WSIA, whose logistic support and field-test assistance was essential to the success of this study.

27
References
U.S. Army Corps of Engineers. 2002. Coastal Engineering Manual. Engineer Manual 1110-2-1100, U.S. Army Corps of Engineers, Washington, D.C. (in 6 volumes). http://chl.erdc.usace.army.mil/cem
Dorava, J.M. & G.W. Moore. 1997. Effects of Boatwakes on Streambank Erosion Kenai River, Alaska, U.S. Geological Survey Water-resources Investigations Report 97-4105. http://ak.water.usgs.gov/Publications/Abstracts/1997.Abstracts/boatwake_abs.htm
Asplund, T.R. 2000. The Effects of Motorized Watercraft on Aquatic Ecosystems, Wisconsin Department of Natural Resources, Publication SS-948-00. http://dnr.wi.gov/topic/ShorelandZoning/documents/201301041052.pdf
NRC. 2007. Mitigating Shore Erosion along Sheltered Coasts, http://www.nap.edu/catalog/11764/mitigating-shore-erosion-along-sheltered-coasts
Klein, R. 2007. The Effects Of Marinas & Boating Activity Upon Tidal Waterways, http://www.ceds.org/pdfdocs/Marinas.pdf
Macfarlane, G.J., G. Cox, J. Bradbury, 2008. Bank erosion from small craft wave wake in sheltered waterways, International Journal of Small Craft Technology, The Royal Institution of Naval Architects, Vol. 150, Part B2, pp. 33-48. http://www.swanrivertrust.wa.gov.au/docs/technical-reports/stage-1-report-investigation-into-the-effect-of-wash-of-boats-and-wind-waves-on-the-swan-river.pdf
Watterson, E. 2012. Impact of Wake on Tweed River Bank Erosion Study, SMEC Australia project #3001906 for Tweed Shire Council. http://www.riverfoundation.org.au/admin/multipart_forms/mpf__resource_44_1___Ref-21_Tweed_Wake_Investigation.pdf
Fonseca, M.S. & Malhotra, A. 2012. Boat wakes and their influence on erosion in the Atlantic Intracoastal Waterway, North Carolina. NOAA Technical Memorandum NOS NCCOS # 143. 24p. http://aquaticcommons.org/14939/
Macfarlane, G.J. 2012. Marine Vessel Wave Wake: Focus on Vessel Operations within Sheltered Waterways. 2012. PhD thesis, Australian Maritime College, University of Tasmania. http://eprints.utas.edu.au/14774/
WC Glamore, W.C. 2008. A Decision Support Tool for Assessing the Impact of Boat Wake Waves on Inland Waterways, Conference on Coastal and Port Engineering. www.pianc.org/downloads/dwa/Wglamore_DPWApaper.pdf
Gourlay, T. 2010. Full-scale Boat Wake and Wind Wave Trials on the Swan River. Final Report prepared for Swan River Trust. http://www.swanrivertrust.wa.gov.au/docs/technical-reports/stage-2-report-full-scale-boat-wake-and-wind-wave-trials.pdf
Zabawa, C. & C. Ostrom. 1980. Final Report on the Role of Boat Wakes in Shore Erosion in Anne Arundel County, MD, Coastal Resources Division, Tidewater Administration, MD Dept. of Natural Resources, Annapolis. http://boatwakes.homestead.com/files/zabawa7-8.pdf

28
VDOT. 2002. Drainage Manual, Chap. 13 Shore Protection, App. 13B-1,Virginia Dept. of Trans. http://www.virginiadot.org/business/resources/LocDes/DrainageManual/drain-manual-chapter-13.pdf
Brodtkorb, P.A., et al. 2000. "WAFO - a Matlab toolbox for analysis of random waves and loads", Proc. 10th Int. Offshore and Polar Eng. Conf., Seattle, USA, Vol. III, pp. 343-350. http://www.maths.lth.se/matstat/wafo.