characterization of sip470, a family 1 lipid transfer
TRANSCRIPT

East Tennessee State UniversityDigital Commons @ East
Tennessee State University
Electronic Theses and Dissertations Student Works
8-2016
Characterization of SIP470, a Family 1 LipidTransfer Protein and its Role in Plant StressSignalingTimothy Ndagi AudamEast Tennessee State Universtiy
Follow this and additional works at: https://dc.etsu.edu/etd
Part of the Biology Commons, Molecular Biology Commons, Plant Biology Commons, and thePlant Pathology Commons
This Thesis - Open Access is brought to you for free and open access by the Student Works at Digital Commons @ East Tennessee State University. Ithas been accepted for inclusion in Electronic Theses and Dissertations by an authorized administrator of Digital Commons @ East Tennessee StateUniversity. For more information, please contact [email protected].
Recommended CitationAudam, Timothy Ndagi, "Characterization of SIP470, a Family 1 Lipid Transfer Protein and its Role in Plant Stress Signaling" (2016).Electronic Theses and Dissertations. Paper 3103. https://dc.etsu.edu/etd/3103
Characterization of SIP470, a Family 1 Lipid Transfer Protein and its Role in Plant Stress
Signaling
A thesis
Presented to
The faculty of the Department of Biological Sciences
East Tennessee State University
In partial fulfillment
Of the requirement for the degree
Master of Science in Biology
by
Timothy Ndagi Audam
August 2016
Dhirendra Kumar, Chair, PhD
Ranjan Chakraborty, PhD
Karl Joplin, PhD
Keywords: ltp12, ltp2, SA, SABP2, SIP470, Lipid Transfer Proteins (LTP), TNS

2
ABSTRACT
Characterization of SIP470, a Family 1 Lipid Transfer Protein and its Role in Plant Stress
Signaling
by
Timothy Ndagi Audam
SIP470, a putative tobacco lipid transfer protein, was identified in a yeast two-hybrid screen to
interact with SABP2. SABP2 is a critical role in SA-mediated signaling in tobacco and other
plants. In vitro studies using purified recombinant SIP470 confirmed that it is a lipid binding
protein. In an attempt to determine its role in mediating stress responses, Arabidopsis T-DNA
insertion knockout lines lacking SIP470 homolog were used for the analysis. These mutant plants
were defective in basal resistance against microbial pathogens. Expression of defense gene PR-1
was also delayed in these mutant plants. Interestingly, these mutant plants were not defective in
inducing systemic acquired resistance. Besides biotic stress, these mutant plants also showed
increased susceptibility to abiotic stresses. To directly study the role of SIP470 in tobacco plants,
transgenic tobacco lines, with reduced levels of SIP470 expression, were generated using RNAi
and transgenic lines overexpressing SIP470 were also generated.

3
DEDICATION
This work is dedicated to God almighty, for without Him I am nothing.
To my wonderful parents, Mr. and Mrs. Audam for their love and their all-round support.

4
ACKNOWLEDGEMENTS
I would like to express my profound gratitude to members of my committee, Dr.
Dhirendra Kumar, Dr. Ranjan Chakraborty, and Dr. Karl Joplin, for their guidance, support, and
constructive criticisms. I would like to especially thank Dr. Dhirendra Kumar for his constant
support, tutelage, guidance and for always pushing me to bring out the best in me. I would also
like to thank the staff and faculty of the Department of Biological Sciences, ETSU for their
kindness and support. I would like to acknowledge the support of my colleagues in the lab, both
graduates, and undergraduates including past members. Special thanks to Bal Krishna Chand
Thakuri, Behzad Alinejad, Keerthi Ganapenani, and Mackenzie Davenport for helping me out
with my experiments whenever I couldn’t make it to the lab. I will also like to thank the ETSU
School of Graduate Studies for the graduate assistantship. This research was supported by a grant
from the National Science Foundation (MCB#1022077) and major RDC grant (RDC 14-021) to
DK and funds from the Department of Biological Sciences, ETSU, and Sigma Xi Grant- in-aid
of Research Program and William Harvey and Nina M. Fraley Memorial Research Award.
Thanks to CSIRO Australia for pHELLSGATE plasmids, Dr. Nam Hai Chua, Rockefeller
University, for pER8 plasmid, Arabidopsis Biological Research Center for T-DNA insertion
mutants. I will also like to extend my special thanks to my wife Opeyemi Adetola for her love
and support and to all my family and friends both in the USA and back home for supporting me
throughout my stay at ETSU.

5
TABLE OF CONTENTS
Page
ABSTRACT .................................................................................................................................... 2
ACKNOWLEDGEMENTS ............................................................................................................ 4
LIST OF FIGURES ........................................................................................................................ 9
Chapter
1. INTRODUCTION .................................................................................................................... 11
The Plant Immune System ........................................................................................................ 11
Abiotic Stresses ......................................................................................................................... 13
Biotic Stresses ........................................................................................................................... 15
Salicylic Acid Binding Protein (SABP2) .......................................................................... 18
SABP2 Interacting Proteins (SIP) ..................................................................................... 20
SA, SABP2, and SAR ....................................................................................................... 20
Lipids as Signals in SAR .................................................................................................. 21
Plant Lipid Transfer Proteins (PLTP) ....................................................................................... 22
Role of LTPs in Plants Defense ........................................................................................ 23
Role of LTPs in Plant Growth and Development ............................................................. 24
Role of LTPs in the Adaptation of Plants to Various Environmental Conditions ............ 24
Arabidopsis LTP12 ........................................................................................................... 25
Arabidopsis LTP2 ............................................................................................................. 25
Previous Studies on SIP470 ...................................................................................................... 26
Gene Expression of SIP470 upon Pathogen Infection ...................................................... 26
Growth Phenotype Analysis of ltp12 and ltp2 Mutants .................................................... 26
Cloning, Expression, Purification and Lipid Binding Assay of Recombinant SIP470 .... 27
Hypothesis ................................................................................................................................. 27
Hypothesis 1: Tobacco SIP470 has a role in the stress signaling of plants (biotic and
abiotic Stress) .................................................................................................................... 27
Hypothesis 2: Tobacco SIP470 is a Lipid Transfer Protein .............................................. 28
2. MATERIALS AND METHODS .............................................................................................. 29
Plant Material ............................................................................................................................ 29
Chemicals and Reagents............................................................................................................ 29
6
Other Materials/Instruments ...................................................................................................... 30
Oligonucleotides (Primers) ....................................................................................................... 31
Role of SIP470 in Plant Stress Signaling .................................................................................. 32
Generating Transgenic Tobacco Lines Silenced in SIP470 Expression ........................... 32
Design of Primers Used for SIP470 Silencing .................................................................. 33
PCR Amplification of SIP470 Silencing and Homolog Silencing Fragment .................. 33
Agarose Gel Electrophoresis............................................................................................. 34
Gel Extraction and Purification ........................................................................................ 34
Transformation of Recombinant pDONR221-SIP470 Constructs into Top10 Cells ....... 34
Screening of Transformed Colonies Using Colony PCR ................................................. 35
Isolation of Recombinant pDONR221-SIP470 Plasmid DNA ......................................... 35
Sequencing of Recombinant Plasmid ............................................................................... 36
Cloning of SIP470 Silencing Construct into pHELLSGATE 8........................................ 36
Transforming Agrobacterium tumefaciens LBA 4404 cells with pHELLSGATE-SIP470
Silencing Construct ........................................................................................................... 37
Cloning SIP470 to Generate Overexpression Clone ................................................................. 38
Cloning SIP470 Overexpressing PCR Amplified cDNA into the pGEMT ...................... 39
Cloning of SIP470 into pER8. .......................................................................................... 39
Transformation of pER8-SIP470 to LBA 4404 Competent Cells .................................... 41
Transient Expression of pER8-SIP470 in Nicotiana benthamiana .................................. 41
SDS-PAGE ....................................................................................................................... 42
Western Blot Analysis ...................................................................................................... 42
Transformation of Tobacco with Agrobacterium LBA 4404 containing pER8-SIP470 and
pHELLSGATE8-SIP470 ........................................................................................................... 43
Screening of Transgenic lines for SIP470 silencing ................................................................. 44
Total RNA Isolation and cDNA Synthesis ....................................................................... 45
First Strand cDNA Synthesis ............................................................................................ 46
Reverse Transcriptase-Polymerase Chain Reaction (RT-PCR) ........................................ 46
Screening of SIP470 Overexpressor Transgenic lines .............................................................. 46
Role of SIP470 in Biotic Stress ................................................................................................. 47
Role of SIP470 in systemic acquired resistance (SAR) .................................................... 47
Role of SIP470 homologs in Basal Resistance ................................................................. 48

7
Role of SIP470 Homolog in Abiotic Stress .............................................................................. 48
Gene Expression Studies .................................................................................................. 48
Tobacco SIP470 is a Lipid Transfer Protein (Hypothesis 2) .................................................... 49
Expression of Recombinant SIP470 in E.coli ................................................................... 49
Purification of Recombinant SIP470 by Ni-NTA Column Affinity Chromatography ..... 50
In vitro Lipid Binding Assay ..................................................................................................... 51
Effect of SABP2 on Lipid Binding Activity of SIP470 .................................................... 51
3. RESULTS ................................................................................................................................. 52
Role of SIP470 in Plant Stress Signaling (Hypothesis 1) ......................................................... 52
Generating SIP470 RNAi Silenced Transgenic Tobacco Lines ....................................... 52
PCR Amplification of SIP470 Silencing Fragment .......................................................... 53
Purification of Resulting PCR Product ............................................................................. 55
BP Recombination Reaction ............................................................................................. 55
Screening of Transformed Cells Using Colony PCR ....................................................... 56
Sequencing of Recombinant Plasmid ............................................................................... 57
LR Recombination Reaction ............................................................................................. 57
Screening of Transformed Cells Using Colony PCR ....................................................... 58
Recombinant pHELLSGATE 8-SIP470 Plasmid DNA Isolation .................................... 58
Transformation of pHELLSGATE8-SIP470 into LBA 4404 ........................................... 59
Generating SIP470 Overexpression Transgenic Tobacco Lines ............................................... 60
PCR amplification of SIP470 Coding Sequence .............................................................. 61
Screening of Transformed Cells in pGEMT using Colony PCR ...................................... 62
Sequencing of Recombinant pGEMT-SIP470 Plasmid .................................................... 62
Ligation of Digested pGEMT-470-4 and pER8................................................................ 63
Sequencing of Recombinant SIP470-pER8 Plasmid ........................................................ 64
Transient Expression of SIP470-pER8 in Nicotiana benthamiana .................................. 65
Screening of Transgenic Line for Silencing and Homolog Silencing ............................. 66
Homologs of SIP470 in Arabidopsis are not Defective in Systemic Acquired Resistance
(SAR) ................................................................................................................................ 68
Homologs of SIP470 in Arabidopsis are Defective in Basal Resistance. ........................ 70
Role of SIP470 in Abiotic Stress............................................................................................... 71

8
Ltp12 mutant in Arabidopsis is Susceptible to Salt Stress (NaCl) ................................... 71
Ltp12 Mutant in Arabidopsis Susceptible to Oxidative Stress (H2O2) ............................. 72
Ltp12 Mutant in Arabidopsis is Susceptible to Abscisic Acid (ABA) ............................. 73
Ltp12 Mutant in Arabidopsis is Susceptible to Drought .................................................. 74
Expression of PR1 Defense Gene on Exposure to Virulent pathogen .............................. 75
Tobacco SIP470 is a Lipid Transfer Protein (Hypothesis 2) .................................................... 76
Expression of Recombinant SIP470 in E. coli .................................................................. 76
Solubility Test ................................................................................................................... 77
Purification of Recombinant SIP470 using Ni-NTA Column Affinity Chromatography 78
Biochemical Characterization ................................................................................................... 79
Lipid Binding Assay ......................................................................................................... 79
Effect of SABP2 on Binding Affinity ............................................................................... 80
4. DISCUSSION ........................................................................................................................... 82
Future Directions ....................................................................................................................... 89
REFERENCES .......................................................................................................................... 90
APPENDICES ........................................................................................................................... 99
APPENDIX A- Abbreviations .......................................................................................... 99
APPENDIX B – Buffers and Reagents ........................................................................... 102
APPENDIX C – Sequence Analysis for Silencing and Homolog Silencing .................. 108
VITA ....................................................................................................................................... 112

9
LIST OF FIGURES
Figure Page
1. Chemical Structure of Abscisic Acid ........................................................................................ 14
2. Chemical Structure of Jasmonates. ........................................................................................... 16
3. Chemical Structure of Ethylene ................................................................................................ 17
4. Chemical Structure of Salicylates. ............................................................................................ 18
5. Structure of SABP2 in complex with SA. ................................................................................ 19
6. Predicted protein structure of SIP470. ...................................................................................... 20
7. Plants systemic immune response ............................................................................................. 21
8. Various steps involved in generating transgenic RNAi plants ................................................. 44
9. Vector Map of pHELLSGATE 8 used in generating SIP470 transgenic lines. ........................ 53
10. Verified Sequence of SIP470 showing 60bp long sequence selected for silencing ............... 54
11. Verified Sequence of SIP470 showing the sequence selected for homolog silencing ........... 54
12. Agarose gel electrophoresis of amplified silencing construct. ............................................... 54
13. Agarose gel electrophoresis of purified fragment.. ................................................................. 55
14. Agarose gel of colony PCR..................................................................................................... 56
15. Sequence Alignment of silencing fragment in entry clone pDONR221 ................................. 57
16. Agarose gel of colony PCR..................................................................................................... 58
17. Agarose gel of silencing constructs in destination vector. ...................................................... 59
18. Agarose gel showing the presence of pHELLSGATE8-SIP470 ............................................ 59
19. Vector Map of pER8 used in generating overexpressed SIP470 transgenic lines. ................. 60
20. Verified Sequence of SIP470 showing the sequence selected for overexpression. ................ 61
21. Agarose gel showing the PCR amplified fragment for overexpression .................................. 61
22. Agarose gel showing the presence SIP470 in pGEMT ........................................................... 62
23. Sequence Alignment of overexpression sequence in entry clone (TM1-pGEMT) ................ 63
24. Agarose gel showing the presence of ligated SIP470-pER8 ................................................. 64
25. Translated protein sequence of SIP470 in frame ................................................................... 65
26. Western blot analysis of transient expression. ........................................................................ 66
27. Agarose gel of silencing and homolog silencing screening .................................................... 67
28. SDS page and western blot for overexpression screening…………………………………...68

10
29. SAR is not affected in ltp2 and ltp12 mutants of Arabidopsis thaliana plants. ...................... 69
30. Growth of Ps maculicola in wild-type Col 0, ltp2 and ltp12 ................................................. 70
31. Effect of NaCl on 15 days old seedlings from ltp12 mutant and Col 0. ................................. 72
32. Effect of 3mM H2O2 on 15 days old seedling of ltp12 mutant and Col 0. ............................. 73
33. Effect of 20 µM ABA on 15 days old seedling of ltp12 mutant and Col 0. ........................... 74
34. Effect of drought on seedling of ltp12 mutant and Col 0. ...................................................... 75
35. SIP470 Gene Expression upon P.s. Dc3000 and P.s. AvrRpt................................................. 76
36. Expression of recombinant SIP470. ........................................................................................ 77
37. Expression of recombinant SIP470 ......................................................................................... 78
38. Purification of recombinant SIP470 using NI-NTA affinity chromatography ....................... 79
39. Recombinant purified SIP470 binds the Lipophilic Probe TNS ............................................. 80
40. Effect of SABP2 on the binding affinity of SIP470 to TNS. .................................................. 81

11
CHAPTER 1
INTRODUCTION
Control of plant diseases is very important to the agriculture of the 21st century because
of the steady increase in the world’s population (Alzadi et al. 2015). Different methods have
been used to control plant diseases in the past although the principal and basic theme in plant
control is similar in all organisms which include immunization, avoidance, exclusion, protection
and immunization (Maloy 2005). The overall control of plant infection/infestation using
pesticides has raised serious concerns about the food safety, environmental quality and pesticide
resistance which have necessitated the need for an alternative pest/disease management system
(Dordas 2009). Biological control has also been used and they offer a more environmentally
friendly and safe alternative for controlling plant diseases but it has not been very effectively
deployed on the fields (Emmert and Handelsman 1999). The most common practices of
controlling plant diseases largely focus on genetic resistance of the host plants to pathogens and
the effective management of plant and its environment. There is, however, a need for a new and
effective solution to plant disease problems that provide effective control while minimizing
negative consequences for human health and environment (Emmert and Handelsman 1999).
It is, therefore, important to understand the mechanisms by which plants defend themselves
from various biotic and abiotic stress in order to offer a possible solution to the rising concerns on
food security globally.
The Plant Immune System
For plants to grow and reproduce, they must be able to overcome colonization by many
plant microbes which are detrimental to their growth and survival. Plants generally use their

12
innate immune system to resist pathogens (Jones and Dangl 2006) which includes massive
transcription of defense genes (Eulgem 2005). The first phase which is usually very quick and it
is efficient in detecting microbial invaders is achieved indirectly by sensing wounds and injury
related structures in the plants that signals danger (Matzinger 2002) or directly by detecting
pathogen-associated molecular pattern (PAMPs) (Jones and Dangl 2006) such as flagellin and
elicitins (Zipfel and Felix 2005). This process leads to the development of a PAMP-triggered
immunity (PTI) (Jones and Dangl 2006). Through evolution, some pathogens have been able to
suppress the PTI by producing several effector proteins (Block et al. 2008; Göhre and Robatzek
2008) which lead to effector-triggered susceptibility (ETS) (Jones and Dangl 2006). Plants have
evolved to protect themselves by recognizing these effectors by deploying the proteins like
nucleotide binding-leucine rich repeat (NB-LRR) proteins resulting in the second phase of plant
immunity known as the effector-triggered immunity (Jones and Dangl 2006). Ultimately, the
final outcome, whether the plants are susceptible to pathogens dependent on a balance between
the ability of plants to recognize and mount an effective response to the pathogen or the ability of
the pathogen to suppress the host defense systems (Pieterse et al. 2009).
Studies have revealed that both PTI and ETI stimulate various pathways in plants.
Besides local defense signaling, ETI and PTI activate various long distance defense reactions
such as systemic acquired resistance (SAR) and salicylic acid biosynthesis (Durrant and Dong
2004), basal resistance (Jones and Dangl 2006), ethylene biosynthesis (Felix et al. 1999).
Different pathways have been found to interact to bring about resistance against pathogens but
not much is known about how PTI and ETI interact to bring about plant resistance. Recently,
studies revealed that both PTI and ETI receptors reside in the same protein complex which
makes it possible for the possible interaction of ETI and PTI signals at the very beginning (Qi et

13
al. 2011). However, global gene expression studies reveal that there is a temporal/quantitative
difference between various players in plant immune system like PTI, ETI, basal resistance, or
SAR rather than being qualitative (Katagiri 2004). This is highly suggestive of the fact that many
pathogens trigger an interconnecting/common plant signaling network (Eulgem and Somssich
2007). The importance of phytohormones such as salicylic acid (SA), jasmonic acid (JA),
abscisic acid (ABA) and ethylene as crucial primary signals in local as well as systemic acquired
resistance has been well documented (Van loon et al. 2006; Loake and Grant 2007). Changes in
the hormone levels are induced by a variety of biotic and abiotic stress condition and they
mediate a variety of adaptive plant response (Pieterse et al. 2009).
Abiotic Stresses
Plant response to different stresses is a very complex process and it involves changes
from the transcriptome, cellular, and physiological levels (Atkinson and Urwin 2012). Recent
studies have shown that plants respond differently to multiple stresses as compared to the way
they would respond to individual stress, activating a specific cascade of gene expression which
relates to the exact environmental conditions encountered (Atkinson and Urwin 2012; Kumar et
al. 2014). Abiotic stresses are majorly controlled by the hormone abscisic acid (ABA) (Figure 1),
while defense against different biotic stresses are controlled by an antagonistic mechanism
between the salicylic acid (SA), jasmonic acid (JA) and ethylene signaling pathways creating a
complex network of interacting pathways (Atkinson and Urwin 2012). During vegetative growth
of plants, conditions of water stress lead to an increase in the endogenous levels of ABA which
helps to prevent water loss through transpiration by controlling the stomata aperture (Atkinson
and Urwin 2012). ABA is also very crucial in triggering how plants respond to other adverse
environmental stimuli (Zeevaart and Creelman 1988). The role of ABA in signaling abiotic stress

14
conditions using molecular approach have been extensively documented and it has been
established that ABA-dependent mutants are affected in the regulation of various genes by cold,
salt and drought (Zhu 2002).
Figure 1: Chemical Structure of Abscisic Acid
The biosynthesis of ABA is regulated by osmotic stress at multiple levels. ABA-
dependent and ABA–independent osmotic stress signaling first modify the vitally expressed
transcriptional factors, which leads to the early expression of a transcriptional activator and this
subsequently results in the activation of downstream stress tolerance gene (Zhu 2002). Salt and
drought stress signal transduction consists of three pathways namely: ionic and osmotic
homeostasis signaling pathways, detoxification (damage control and repair) response pathway,
and pathways for growth and regulation. The ionic aspect of salt stress is signaled via the SOS
(salt overly sensitive) genes (Zhu 2000) where a calcium-responsive SOS3-SOS2 protein kinase
complex controls the expression and activity of ion transporters such as SOS1 (Zhu 2002).
Osmotic stress then activates various protein kinases and phospholipid systems, generating an
array of messenger molecules some which may function upstream of the activated osmotic stress
protein kinase (Zhu 2002).
There is also cross-talks between the different plant hormones (SA, ABA, and JA or
ethylene). Studies have shown that ABA is a negative regulator of the salicylic acid-dependent
defense transcript PR1 (Asselbergh et al. 2007), represses the systemic acquired resistance

15
(SAR) (Mohr and Cahill 2007) and prevents the accumulation of crucial defense compounds
such as lignin and phenylpropanoids (Yasuda et al. 2008). Studies have also shown that SA can
interfere with abiotic stress (Nemeth et al. 2002).
Biotic Stresses
Plant response to biotic stress starts from the point of recognizing pathogen-derived/
insect-derived proteins by activating some receptors, and this response leads to the synthesis and
transport of three major defense hormones, salicylic acid (SA), jasmonic acid (JA) and ethylene
(ET) (Howe and Jander 2008; Spoel and Dong 2008). While there are many other signaling
molecules like calcium, which participate in defense signaling, these three hormones are the
integral part of a coordinated defense against pathogens (Bilgin et al. 2010). SA helps mediate
defense response to biotrophic pathogens while JA and ET generally help mediate defense
against necrotrophic pathogens (Koornneef and Pieterse 2008).
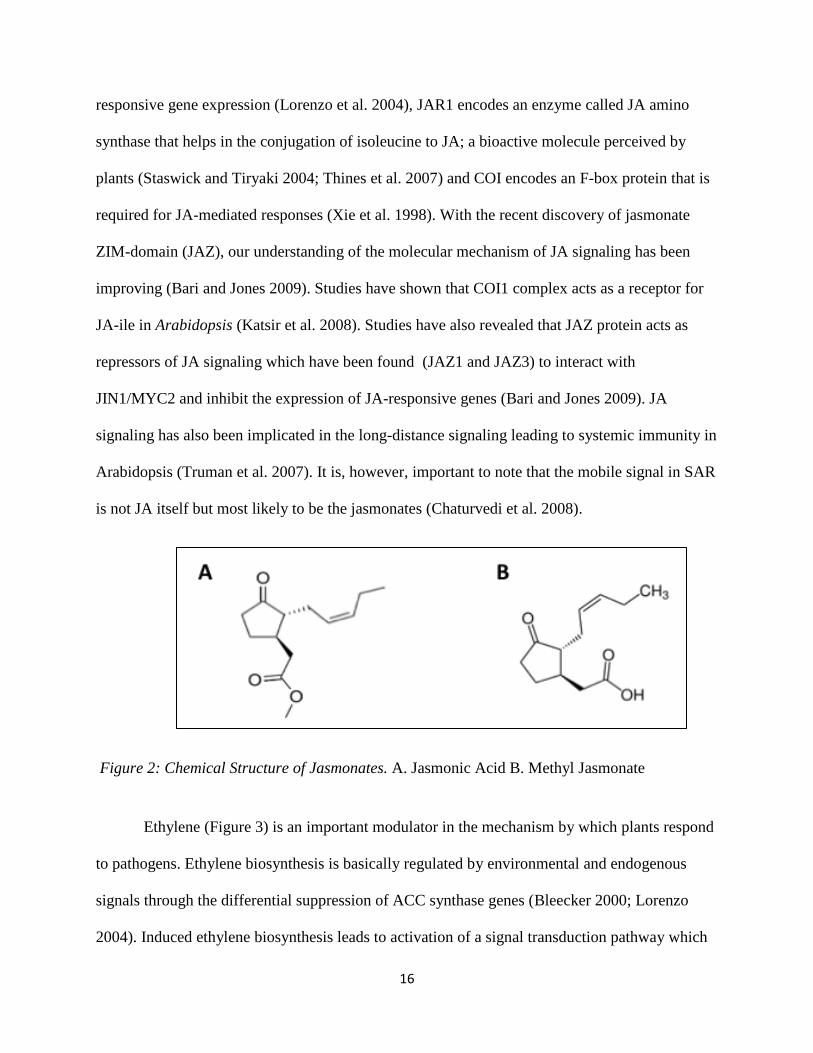
JA (figure 2A) and its methyl ester, methyl jasmonate (MeJA) (Figure 2B) are plant lipid
derivatives that resemble mammalian eicosanoids in structure and biosynthesis. Jasmonic acid is
distributed throughout higher plants and they are synthesized from linolenic acid via the
octadecanoic pathway. Even though JAs are involved in diverse processes such as stomatal
opening, root growth, tuber formation, fruit ripening and leaf senescence, they play very
important roles plant defense against insects and microbial pathogens (Bari and Jones 2009). JA
acts as a ‘’master switch’’ responsible for turning on a cascade on signals in response to
pathogen attack (Wasternack and Parthier 1997). Studies involving mutants affected in JA
transduction reveals that there are three main components of JA signaling: coronatine insensitive
1 (COI1), jasmonate resistant 1 (JAR1) and jasmonate insensitive 1/MYC2 (JIN1/MYC2) (Bari
and Jones 2009). The JIN1/MYC encodes a transcriptional factor that regulates some JA-
16
responsive gene expression (Lorenzo et al. 2004), JAR1 encodes an enzyme called JA amino
synthase that helps in the conjugation of isoleucine to JA; a bioactive molecule perceived by
plants (Staswick and Tiryaki 2004; Thines et al. 2007) and COI encodes an F-box protein that is
required for JA-mediated responses (Xie et al. 1998). With the recent discovery of jasmonate
ZIM-domain (JAZ), our understanding of the molecular mechanism of JA signaling has been
improving (Bari and Jones 2009). Studies have shown that COI1 complex acts as a receptor for
JA-ile in Arabidopsis (Katsir et al. 2008). Studies have also revealed that JAZ protein acts as
repressors of JA signaling which have been found (JAZ1 and JAZ3) to interact with
JIN1/MYC2 and inhibit the expression of JA-responsive genes (Bari and Jones 2009). JA
signaling has also been implicated in the long-distance signaling leading to systemic immunity in
Arabidopsis (Truman et al. 2007). It is, however, important to note that the mobile signal in SAR
is not JA itself but most likely to be the jasmonates (Chaturvedi et al. 2008).
Figure 2: Chemical Structure of Jasmonates. A. Jasmonic Acid B. Methyl Jasmonate
Ethylene (Figure 3) is an important modulator in the mechanism by which plants respond
to pathogens. Ethylene biosynthesis is basically regulated by environmental and endogenous
signals through the differential suppression of ACC synthase genes (Bleecker 2000; Lorenzo
2004). Induced ethylene biosynthesis leads to activation of a signal transduction pathway which

17
consists of primary EIN3-like (Ethylene Insensitive 3) regulators and downstream ERF-like
transcriptional factors (Broekaert et al. 2006). The ERF-like factor controls the expression of
various effector genes involved in various aspect of plants ability to induce a systemic defense
response (Broekaert et al. 2006). Studies have shown that there is a synergistic relationship
between JA- and ET-signaling pathways to induce the effector genes of defense response (Ellis
and Turner 2001). There are also reports that there is a significant cross-talk between the ET
signaling and SA. This cross-talk which is majorly controlled by SA and jasmonate brings about
a differentiated disease response.
Figure 3: Chemical Structure of Plant Hormone Ethylene
Salicylic acid (SA) (figure 4A) is a natural phenolic compound present in plants which
induces the production of pathogen-related (PR) proteins. When plants are infected by a
pathogen, the endogenous level of SA increases (Malamy et al. 1990). This is made possible by
de novo synthesis of SA via the isochorismate pathway and/or the phenylpropanoid pathway
(Halim et al. 2006). After synthesis, SA is subjected to various modifications such as amino acid
conjugation, methylation, and glycosylation (Loake and Grant 2007; Kumar et al. 2015). All
these modifications lead to an effective functional use of SA in plants. For instance,
glycosylation inactivates SA but allows a high amount of SA to be stored in the vacuoles.
Methylation of SA is very important for long distance signaling during pathogen infections and it
also plays a role in systemic acquired resistance of plants (as well as signaling innate immunity

18
in plants (Kumar and Klessig 2003; Dempsey et al. 2011). Methylated SA (MeSA) (Figure 4B)
is a volatile ester that is normally not present in plants but is surprisingly induced when plants
are infected with a pathogen (Huang et al. 2003). MeSA is synthesized by SA carboxyl
methyltransferase (SAMT) (Loake and Grant 2007). A study has shown that Arabidopsis plants
that are overexpressing Oryza sativa OsBSMT1 accumulated MeSA and MeBA (methyl benzoic
acid) and infecting this mutant with Pseudomonas syringae resulted in a reduced accumulation
of SA, the inactive glycoside (SAG) (Koo et al. 2007). It is important to note that MeSA alone is
ineffective in inducing a defense response but can function as a volatile signaling molecule
during infections by pathogens (Loake and Grant 2007; Park et al. 2007). in tobacco plants,
conversion of MeSA to SA acid appears to be catalyzed by a methylesterase enzyme with high
affinity for salicylic acid known as SABP2 (salicylic acid binding protein 2). SABP2-silenced
tobacco plants were compromised in inducing both local and systemic acquired resistance
(Kumar and Klessig 2003).
Figure 4: Chemical Structure of Salicylates. A. Salicylic Acid B. Methyl Salicylate
Salicylic Acid Binding Protein (SABP2)
In an attempt to identify the full function of how SA function in plants, several putative
effectors were identified which including catalase (Chen et al. 1993), ascorbate peroxidases
(Chen et al. 1993) and carbonic anhydrase which all binds to SA with relatively low affinity

19
(Durner and Klessig 1995; Slaymaker et al. 2002; Kumar and Klessig 2003). Recently, several
other SA-binding proteins were have been identified through high-throughput screens, which are
glyceraldehyde 3-phosphate dehydrogenase (GAPDH) and high mobility group box 1 (HMGB1)
(Klessig 2016). SABP2 (figure 5) is a very low abundance (10 fmol/mg) soluble protein of 29
kDa (Kilo Daltons) that exhibit a high affinity for SA (KD=90 nM). The binding to SABP2 to
SA is generally reversible and specific to SA and its SAR inducing analogs (Kumar and Klessig
2003). Crystal structures of SABP2 confirmed that it belongs is a member if the α/β hydrolase
superfamily of enzymes (Forouhar et al. 2005). Being a member of the α/β be hydrolase
superfamily, the active site of SABP2 (figure 5) is defined by the presence of a catalytic triad,
Ser-81, His-238, and Asp-210 (Forouhar et al. 2005). A study showed that SABP2 silenced plant
in tobacco disrupted the local as well as the SAR against tobacco mosaic virus (Kumar and
Klessig 2003; Park et al. 2007).
Figure 5: Structure of SABP2 in complex with SA. This figure shows the stereo view of SABP2
monomer in complex with SA. The core and the CAP domains are labeled. The secondary
structure elements, α helices, β strands and loops are colored in yellow, cyan and magenta
respectively. SA (in green is located in the active site as well as another site on the surface of the
enzyme (Adopted from Forouhar et al. 2005).

20
SABP2 Interacting Proteins (SIP)
In order to learn more about the role of SABP2 in protecting plants against pathogens
through its role in SAR, a yeast two-hybrid screening was performed using SABP2 as a bait and
tobacco leaf proteins as preys. It was discovered that SABP2 interacts with several tobacco leaf
proteins such as SIP470 (SABP2-Interacting Protein 470) (Figure 6) (Kumar et al. unpublished).
Nucleotide analysis of SIP470 reveals that it belongs to a non-specific lipid transfer protein type
1 (nsLTP1) subfamily (Chapagai 2014).
Figure 6: Predicted protein structure of SIP470. SIP470 has 5 alpha helices.
SA, SABP2 and SAR
As mentioned earlier, SA can be synthesized from both phenylalanine and chorismate
pathways but the major pathway for de novo synthesis during an active pathogen infection is
through the chorismate pathway that is catalyzed by the isochorismate synthase (ICS)
(Wildermuth et al. 2001). Arabidopsis mutants lacking ICS are compromised in SAR when
challenged with pathogens (Wildermuth et al. 2001). Studies suggest that an alternative and rapid
way to generated SA is through the activity of SABP2 (Grant and Lamb 2006). Since SABP2
converts MeSA back to SA in vitro (Figure 7), this suggests that SABP2 might generate SA from
signal-competent MeSA during SAR (Kumar et al. 2006).

21
Figure 7: Plants systemic immune response. Development of SAR. SABP2 is an important
component in SAR signal (Redrawn from Klessig: http://bti.cornell.edu/)
Lipids as Signals in SAR
Pathogen and host lipids, as well as lipid metabolites, have very important roles to play in
pathogenesis as well as in the expression of defense genes in plants (Shah 2005). Lipid signals as
well as Nitric Oxide (NO), SA, JA, and ethylene have all been implicated in SAR signaling
(Grant and Lamb 2006). A possible role of lipid signaling in SAR is seen in a study in which
mutants of the Arabidopsis stearoyl-acyl carrier protein desaturase (SSI2) suppressor of fatty
acid desaturase 1 (sfd1) were compromised of SAR and had defective growth phenotype (Nandi
et al. 2003). SFD1 encodes for an enzyme called dihydroxyacetone phosphate reductase that
helps in forming the glycerol-3-phosphate backbone in glycerolipids (Grant and Lamb 2006).
Even though SFD1 is required for the accumulation of SA locally and in distal parts of the
plants, sfd1 mutant plants do not show compromise in basal resistance which suggests that they
may be involved in the generation and translocation of SAR signals (Grant and Lamb 2006).
This suggests the importance of lipid a signal transfer protein in plants defense. Plant lipid

22
transfer proteins (LTPs) are potential candidates that are involved in transporting these lipid
signal molecules.
Plant Lipid Transfer Proteins (PLTP)
Due to the hydrophobic nature of lipids or lipid derivatives involved in long-distance
signaling of plants, they have to be transported by some soluble macromolecule structure
(Moreau 1998). Lipid-protein complexes are an important component in many metabolic
pathways but they can still function in different manners in cell signaling (Blein et al. 2002). An
attempt to describe the role of these water-soluble complex in plants led to the discovery of non-
specific lipid transfer proteins (nsLTPs). Lipid transfer proteins (LTPs) are a group of small,
basic, conserved, 9kDa proteins that are found in high amounts in higher plants (Kader 1996).
LTPs have been characterized by their ability to bind to fatty acids in-vitro and in tier ability to
transfer phospholipids between membranes (Garcia-Olmedo 1995). LTPs have been classified
into two major families based on their biochemical properties. Despite the fact that both families
of LTPs have several similarities like having a very high PI (approximately 9), conserved 8
cysteine residues and a structure which consist of a hydrophobic cavity that is enclosed by four
alpha helices, they differ generally in having a low sequence similarity and different molecular
weight ranging from 9 kDa in family 1 LTP to 7 kDa in family 2 LTP (Yeats and Rose 2008).
Family 1 lipid transfer proteins generally have three amphiphilic alpha helixes that are
parallel to the hydrophobic lipid binding pocket (Yeats and Rose 2008). In addition to the 8
conserved cysteine residues that is present in all LTPs, the family 1 LTPs have small
hydrophobic amino acids such as Ile, Val, Leu and Ala that are predominant in the LTP sequence
and functions in defining the hydrophobic binding tunnel (Yeats and Rose 2008). Family 1 LTP
have a semi-conserved Tyr 79 that is responsible for an enhanced intrinsic fluorescence upon

23
lipid binding experimentally (Lullien-pellerin et al. 1999). Studies also show that this residue is
responsible for forming hydrogen bonds with the polar heads of lipids (Charvolin et al. 1999;
TassinMoindrot et al. 2000). Studies using family 1 LTP isolated from rice (Oryza sativa) and
wheat (Triticum aestivum) reveals that it binds to palmitic acid and L-a-phosphatidylcholine
(Harvolin et al. 1999; Cheng et al. 2004).
Family 2 lipid transfer proteins have four-alpha helix that is bound by four disulfide
bonds that enclose a hydrophobic cavity that binds to lipids (Yeats and Rose 2008). One major
difference between family 1 LTPs and family 2 LTPs is the nature of pairing between cysteines 5
and 6 which makes the hydrophobic cavity of Family 2 LTPs smaller but more flexible, allowing
for a variety of lipids including sterols to bind (Hoh et al. 2005).
LTPs have been implicated in number biological roles like cell signaling, antimicrobial
defense, cutin synthesis, and cell wall loosening but these functions have not been well
correlated with their in-vitro activity or structure (Yeats and Rose 2008).
Role of LTPs in Plants Defense
In an attempt to identify novel proteins and genes responsible defense of plants against
pathogens, the antimicrobial property of LTPs was discovered (Garcia-Olmmedo et al. 1995). In
vitro screening of protein extracts from barley, Arabidopsis, spinach and onion suggested that it
has a direct effect against fungal and bacterial pathogens (Cammue et al. 1995; Molina et al.
1993; Segura et al. 1993). The mechanism of action of LTP that brings about its toxicity is not
well understood, but it is most likely linked to the fact that LTPs promote membrane
permeability in pathogens but not in the host cells (Regente et al. 2005). Analysis of the
expression pattern of LTPs revealed that most isoforms are expressed upon pathogen challenge;
this gave the first support for a defensive role for this group of proteins (Van Loon and Van

24
Strien 1999). Another evidence of the role of LTPs on defense has been using transgenic lines
overexpressing LTPs (Yeats and Rose 2008). A study showing that a family 1 LTP from tobacco
could act as a binding competitor and the strength of the binding was increased by LTP-jasmonic
acid complex suggests an evidence for its role in defense signaling (Buhot et al. 2004).
Role of LTPs in Plant Growth and Development
LTPs are also implicated in vegetative growth and development of plants (Yeats and
Rose 2008). Studies have shown that a family 1 LTP from lily styles along with pectin
polysaccharides is necessary for pollen tube adhesion (Park et al. 2000; Park and Lord 2003).
Family 1 LTP has also been shown to have an important role in cell expansion and growth by
promoting cell wall loosening, but the mechanism of action is not well understood but it most
likely depends on the presence of a hydrophobic cavity on LTPs (Nieuwlan et al. 2009). LTPs
are also indicated in cutin synthesis by acting as a carrier of a lipid precursor required for cutin
formation. While there is no direct evidence to support this, studies have shown the LTP 1 are
expressed in the epidermis (Suh et al. 2005) and an increase in LTP expressing leads to the
accumulation of wax (Hollenbach et al. 1997) supports the hypothesis that LTPs are involved in
cutin synthesis.
Role of LTPs in the Adaptation of Plants to Various Environmental Conditions
LTPs could also play a role in helping the plant survive adverse conditions. Genes
induced by cold treatment have been found to code for LTP-like proteins (Hughes et al. 1992).
Other LTP genes have been found to respond to salt and drought stress (Kader 1996). Barley
plants were found to express LTP gene in the roots and stems during drought stress (White et al.
1994). A gene encoding for LTP-like protein in tomato is expressed in the stem when treated
25
with NaCl, mannitol, high temperature or ABA (Hughes et al. 1992). Just recently, a study
involving overexpressed LTP 3 in Arabidopsis showed that the mutant had an increased
tolerance to cold and drought (Guo et al. 2013).
Arabidopsis LTP12
LTP12 are members of the PR-14 family that are highly expressed in inflorescences
while their expression in seedlings and leaves of plants are relatively low (Huang 2013).
Microarray study on the Arabidopsis genome transcript expression revealed that LTP12 are
induced upon pathogen challenge (Kilian et al. 2007). Arabidopsis mutant ltp12 with a seed
stock number CS736658 was used in this research. It has a T-DNA insertion in the intron of the.
LTP12 gene of wild-type Arabidopsis (Colombia-0). Binary vector (pAC161) that contains the
sulfadiazine open reading frame was transformed into the plant by Agrobacterium-mediated
transformation. The mutant is selected in the greenhouse by a sulfadiazine resistant marker
(Rosso et al. 2013; Chapagai 2014). Not much is known about this mutant so far.
Arabidopsis LTP2
Promoter analysis of LTP2 shows the presence of a box 3 and 10 base pair sequences
TCATCTTCTT (Thoma et al. 1994). Box 3 is generally conserved in promoters of Arabidopsis
phenylalanine ammonia lyase (PAL) and bean chalcone synthase (CHS) genes. PAL is involved
in phenylpropanoid pathway which is found to be involved in defense (Bagal et al. 2012) while
the CHS is involved in the accumulation of a stress metabolite called isoflavonoid phytoalexins
and is also involved in the SA-mediated defense pathway (Dao et al. 2011). LTP2 is highly
expressed in developing seeds, leaves and in flowering plants (Arondel et al. 2000). It also shows
some expression in the epidermis and sub-epidermis of the flower and embryo organs (Clark and

26
Bohnert 1999). Microarray study on the Arabidopsis genome transcript expression revealed that
LTP2 are also induced upon pathogen challenge (Kilian et al. 2007). Arabidopsis ltp2 mutant
with a stock number CS736752 was used in this research. It has a T-DNA insertion in the intron
of the LTP 2 gene of the wild-type Arabidopsis (Columbia-0). Binary vector (pAC161) that
contains the sulfadiazine open reading frame was transformed into the plant by Agrobacterium-
mediated transformation. The mutant is selected in the greenhouse by a sulfadiazine resistant
marker (Rosso et al. 2013; Chapagai 2014). Not much is known about this mutant so far.
Previous Studies on SIP470
Gene Expression of SIP470 upon Pathogen Infection
The changes in expression of SIP470 in tobacco plants infected with various plant
pathogens, for example, TMV, Pseudomonas syringae pv. tabaci (P.s. tabaci) (a host-pathogen),
Pseudomonas syringae pv. tomato DC3000 (Pst DC3000) and Pseudomonas syringae pv.
phaseolicola (P.s. pv. phaseolicola) was carried out (Simo and Kumar unpublished). Results
revealed that SIP470 is induced upon exposure to both host and nonhost pathogens (Simo and
Kumar unpublished).
Growth Phenotype Analysis of ltp12 and ltp2 Mutants
In order to study the putative role of SIP470 in plants, the closest homologs of SIP470 in
Arabidopsis, T-DNA insertion mutants LTP12, and LTP2 were used. Both Arabidopsis LTP2
and LTP12 show 53% and 46% similarity to SIP470 respectively (Chapagai 2014). Growth
phenotype analysis of these mutants revealed that both mutants had a defective growth
phenotype when compared to the wild-type (Col-0) with ltp12 having the most significant

27
defective in height, the number of leaves, bolting time, inflorescence emergence time and silique
formation time (Chapagai 2014).
Cloning, Expression, Purification and Lipid Binding Assay of Recombinant SIP470
SIP470 without its signal peptide was successfully cloned using gateway cloning system
and expressed in E. coli. Recombinant SIP470 (recSIP470) was then purified using Ni-NTA
affinity chromatography and ion exchange chromatography (Q-sepharose column) (Chapagai
2014). Purified recSIP470 was then used to assay for lipid binding and transfer activity using the
PIP Strip membrane and the PLTP transfer assay kit respectively. Results showed that recSIP470
failed to transfer or bind to lipids under that experimental conditions (Chapagai 2004).
Hypothesis
Hypothesis 1: Tobacco SIP470 has a role in the stress signaling of plants (biotic and abiotic
Stress)
Based on the preliminary findings it is hypothesized that tobacco SIP470 has an
important role to play during the biotic and abiotic stress of plants. The role of various lipid
transfer protein in biotic and abiotic stress has been well studied. The first evidence of the role of
LTPs in biotic stress was observed in the in vitro screening of protein extracts from barley,
Arabidopsis, spinach, and onion. Results showed that the extracts from these plants had a direct
effect on the growth of fungal and bacterial pathogens (Cammue et al. 1995; Molina et al. 1993;
Segura et al. 1993). Several LTPs have also been implicated in abiotic stress signaling.
Arabidopsis LTP3, when overexpressed, showed an increased tolerance to cold and drought in
(Guo et al. 2013). Despite the evidence on the role LTPs in both biotic and abiotic stress

28
signaling, their mode of action in-vivo is still widely unknown. In order to study the functional
role of SIP470 in tobacco plants, the following approach will be followed:
1. Generating transgenic SIP470 tobacco plant using the RNA interference (RNAi) and
Overexpression of SIP470 using an inducible plant expression system.
2. Assess the Systemic Acquired Resistance (SAR) and Basal resistance response in SIP470
transgenic plants.
3. Study the resistance (both the basal and SAR) response and defense gene expression in
SIP470 transgenic plants as well as the Arabidopsis mutant plant upon exposure to biotic
(pathogen), and abiotic (drought and salinity) stress.
Hypothesis 2: Tobacco SIP470 is a Lipid Transfer Protein
Based on the nucleotide analysis of SIP470 sequences obtained from yeast-2-hybrid
screening that predicted that SIP470 belongs to a non-specific lipid-transfer protein 1 (nsLTP1)
subfamily (Chapagai 2014), we are hypothesizing the SIP470 binds and transfers lipids in-vivo.

29
CHAPTER 2
MATERIALS AND METHODS
Plant Material
Two mutant Arabidopsis mutant lines, ltp12 and ltp2 in the Col-0 background were used
for this study. The wild-type (Col-0) was used as a control. Various tobacco plants, a wild-type
Nicotiana tabacum cv. Xanthi-nc NN (XNN) (Resistant to TMV), Nicotiana tabacum XS
(Susceptible to TMV) and Nicotiana benthamiana were also used for this study. All Arabidopsis
and tobacco plants were grown in a controlled environment. Arabidopsis seeds were sown on
autoclaved soil (Fafard F-15, Agawam, MA) in a 4 x 4-inch square pots and transferred to a
growth chamber (PGW 36, Conviron, Canada) set at 22°C and a 16-hour light cycle and a light
intensity of about 200 μmol m-2 sec-1. After 5 days, individual seedlings were transferred to a 4
x 4-inch square pots and allowed to grow for 3 to 4 weeks under a 9-hour light cycle at 150 μmol
m-2 sec-1 light intensity. Tobacco seeds were similarly grown in the growth chamber set at 22°C
and a 16-hour light cycle and a light intensity of about 200 μmol m-2 sec-1. After 7-10 days, 1-2
seedlings were transferred into 4 x 4-inch square pots and maintained for 3 weeks. Plants were
then transferred to single 8-inch pots (1 plant per pot) and grown for ~2 weeks before they were
used for the experiments.
Chemicals and Reagents
Sodium dodecyl sulfate (SDS), ß-mercaptoethanol (ß-ME), tetramethylethylenediamine
(TEMED), ammonium persulfate (APS), coomassie brilliant blue R-250, ponceau-S,
phenylmethylsulfonyl fluoride (PMSF), magnesium chloride (MgCl2), sodium chloride (NaCl),
sodium phosphate monobasic (NaH2PO4), sodium phosphate dibasic (Na2HPO4), agar (Acros

30
organics), sucrose (Bioworld), immobilon-PSQ Membrane (0.2 µm) (Millipore), 30% acrylamide,
imidazole, methanol, ethanol, ECL western blotting substrate (Thermo Scientific), ß-estradiol,
Bleach, mouse monoclonal anti poly-Histidine antibody, mouse anti c-myc monoclonal antibody
and Goat anti-Mouse conjugate for western (Sigma), Oligo dT-20, Taq DNA polymerase
(Invitrogen, CA), Dithiothreitol (DTT), Low Molecular Weight (LMW) protein ladder (GE life
Sciences), RNAse free DNAse (Promega), gel loading dye (Bio-Rad), QIAprep Spin Miniprep
Kit, Qiagen Plasmid Midi Kit, and Gel extraction kit (Qiagen, CA), Gateway cloning kit with
entry vector, pDONR221(Invitrogen). Entry vector for overexpression (pGEM-T) was purchased
from Promega. Inducible overexpression vector (pER8) was obtained from Dr. Nam Hai Chua,
Rockefeller University, NY. For RNAi silencing was done using gateway based cloning where
pDONR221 was the entry vector used and pHELLSGATE8 was used as the destination vector
(obtained from CSIRO, Australia).
Other Materials/Instruments
SYNERGY HT multi-mode microplate reader (Biotek), Master cycler (Eppendorf, NY),
spectrophotometer, Electroporator (Biorad), French press (Thermos scientific), ND-1000
Nanodrop spectrophotometer (Thermo scientific), pH meter (Beckman), LI-COR C-DIGIT
Western blot imager (LI-COR), UV imaging system (UVP Bioimaging Systems), centrifuge
(Beckman, model J2-21 or Sorvall RC5B), microcentrifuge (Eppendorf), Agarose (Fisher
Scientific) and Polyacrylamide gel electrophoresis apparatus (Biorad), Transblot (Biorad), 1 ml
syringes (BD Syringes), ultrasonicator (Fisher Scientific) and every other regular laboratory
accessories (e.g. pipettes, water bath, balances) were used for this research.

31
Oligonucleotides (Primers)
All primers used for generating the transgenic lines were synthesized by Eurofins MWG
(Huntsville, AL). Lyophilized primers were re-suspended to a final concentration of 10 µM by
re-suspending and diluting it in nuclease free water. Primers used for RNAi silencing of SIP470
and its homologs as well as overexpress SIP470 are listed in the table below:
Table 1: List of primers used for this study
SN Primer Sequence (5’ 3’) Purpose
1
DK670 (Gateway att
B1 forward primer)
GGGGACAAGTTTGTACAAAAAAGCAGG
CTATTGTGGCGGCGTTAAAGGT Silencing SIP470
2 DK671 (Gateway att
B2 reverse primer)
GGGGACCACTTTGTACAAGAAAGCTGGG
TATGCAGTCTTGCGGTCAGC Silencing SIP470
3 DK685 (Gateway att
B1-24 forward primer)
GGGGACAAGTTTGTACAAAAAAGCAGG
CTCGACTGCATGCACTTGCCTG
Homolog silencing of
SIP470
4 DK686 (Gateway att
B2-24 reverse primer)
GGGGACCACTTTGTACAAGAAAGCTGGG
TTACTGGACCTTGGAGCAGTCA
Homolog silencing
of SIP470
5 DK674(Forward primer
with Avr II site) CCTAGGTATGGAAATGGTTGGCAAG
Overexpressing
SIP470
6 DK675 (Reverse
primer with Spe 1 site) ACTAGTTCACTGGACCCTGGAGCA
Overexpressing
SIP470
7 DK672 (Forward
primer) GGCCCTCTAGGGAGGTGT Screening/detection
8 DK673(Reverse
primer) TCACTGGACCCTGGAGCA Screening/detection
32
Role of SIP470 in Plant Stress Signaling
Generating Transgenic Tobacco Lines Silenced in SIP470 Expression
Transgenic lines silenced in SIP470/ homologs expression were generated via RNA
interference (RNAi). RNAi is a posttranscriptional gene silencing that involves the degradation
of mRNA (Montgomery et al. 1998). The RNAi pathway is exploited in molecular biology to
study the functions of genes (Bertile 2006). SABP2 was successfully silenced in tobacco plants
using RNAi (Kumar and Klessig 2003). To generate transgenic lines using RNAi, primers were
designed and synthesized with attB1 and attB2 flanking sites to amplify a region of SIP470
coding sequence that is conserved in SIP470 gene (silencing fragment) and regions that are
common to the homologs of SIP470 (homolog silencing fragment). The template used for
amplification was a previously sequenced clone, pDEST-17-SIP-470-25. The amplified fragment
was then gel purified and cloned into the entry vector (pDNOR221) using BP clonase enzyme
following manufacturer’s instructions (Invitrogen). The reaction product was transformed into
competent E. coli (DH5). The plasmid DNA was prepared and DNA sequenced. The SIP470
was then subcloned into the destination vector (pHELLSGATE 8) using LR clonase following
manufacturer’s instructions (Invitrogen). The destination vector containing SIP470 construct was
then transformed into electrocompetent Agrobacterium tumefaciens LBA4404 which was then
used to transform wild-type tobacco plants. Expression of the destination vector in the plants
genome produces an intron-spliced hairpin RNA. Transformed cells were then selected using
appropriate antibiotics that will be discussed later in the thesis.
33
Design of Primers Used for SIP470 Silencing
SIP470 nucleotide sequence was used in the BLAST tool of Sol genomics
(https://solgenomics.net/ ) to query the Nicotiana tabacum database and identify nucleotide
sequences conserved in SIP470 gene when compared to its homologs (see appendix C). A
sequence of 60 base pair (bp) was identified and primers were designed to incorporate the attB1
and attB2 sites in primer sequence flanking the SIP470 nucleotide sequence for cloning into the
entry vector. A similar approach was followed to search for conserved sequence present in
SIP470 gene and its homolog, a sequence of 139 bp was identified and was used cloning (see
appendix C).
PCR Amplification of SIP470 Silencing and Homolog Silencing Fragment
PCR amplification of silencing and homolog silencing fragments with the attB1 and
attB2 flanking sides was done using PCR separately. Full-length SIP470 verified clone was used
as a template (pDONR221+470 clone number P2, box 4). A 30 µl PCR reaction mixture was
made which consisted 22.2 µl of sterilized water, 3 µl of PCR buffer (10 x), 0.6 µl of dNTP (50
x), and 3 µl of template (1ng-1pg / 50ml reaction), 0.6 µl of Advantage HF polymerase (50 x)
and 0.6 µl of forward and reverse primer. The PCR reaction was done for 30 cycles with the
denaturation temperature set at 94 °C for 30 seconds, the annealing temperature of 55 °C for 30
seconds, an extension temperature of 72 °C for 30 seconds and a final extension temperature of
72 °C for 7 minutes after 30 cycles. The amplified product was stored on ice at 4 °C and was
used for further experiments.

34
Agarose Gel Electrophoresis
The PCR amplified product was run and detected on a 1.5 % EtBr (ethidium bromide)
stained agarose gel. The gel was then used for extraction and purification of the expected
fragment.
Gel Extraction and Purification
The expected amplified fragments based on the sizes for silencing and homolog silencing
were excised from the gel using a clean blade and the DNA extracted using the Qiagen gel
extraction kit according to manufacturer’s instructions. The bound DNA from the columns were
eluted using 50 µl of warm (50 °C) TE buffer and quantified using a Nanodrop.
Cloning of SIP470 Silencing Fragments into Gateway Entry Plasmid pDONR221
The gel purified SIP470 DNA was then used for cloning into pDONR221 via gateway
technology following manufacturer’s instructions. The reaction mixture consisted of 1 µl of the
entry plasmid (pDNOR221), 1 µl of BP clonase enzyme, 1 µl of the purified fragment (50 fmol)
and 7 µl of TE buffer to make a final volume of 10 µl. The reaction was then incubated at 37 °C
for two hours after which it was terminated by adding 1 µl proteinase K (provided in the kit).
The reaction was then maintained on the ice at 4 °C and was used for transformation into
competent top10 cells.
Transformation of Recombinant pDONR221-SIP470 Constructs into Top10 Cells
One µl of the product from the BP reaction (pDONR221-SIP470) was added to 200 µl of
competent Top10 E. coli cells. The resulting mixture was incubated on ice for 30 minutes.
Following incubation, the mixture was incubated for 45 seconds by placing it in a 42 °C water
bath and immediately transferred to ice for 2 minutes. To the mixture 800 µl LB broth (room

35
temperature) was later added to the mixture and incubated in a 37°C shaker (250 rpm) for 1 hour.
After one hour, transformed cells were selected by plating the mixture on an LB agar plate
containing ampicillin (100 µg/ml) and incubated at 37°C overnight.
Screening of Transformed Colonies Using Colony PCR
Bacterial colonies from the plates were screened for the presence of pDONR221-SIP470
entry clone using colony PCR. Single colonies were picked using a sterile toothpick or yellow
tip, streaked on a fresh LB plate containing the appropriate antibiotics as mentioned earlier and
the tip washed in 40 ul of sterile water. The tip was washed thoroughly to release traces of the
bacterial colony in the water by pipetting up/down 5-10 times. Ten µl of the water was used as a
template for PCR amplifications. The colony PCR mix contained of transformed bacterial cell
dissolved in sterile water (10 µl), 2 µl of PCR buffer (10 x), 2 µl of dNTP, 0.2 µl of Taq DNA
polymerase, 0.2 µl of M13 forward primer (vector specific), 0.2 µl of gene specific reverse
primer and 4.2 µl of sterile water to make a final volume of 20 µl. The PCR reaction was done
for 30 cycles in a thermocycler using the settings, 94 °C for 30 seconds, the annealing
temperature of 62 °C for 30 seconds, an extension temperature of 72 °C for 80 seconds and a
final extension temperature of 72 °C for 7 minutes after 30 cycles. The PCR amplified products
were analyzed on 1.5% agarose gel electrophoresis as described earlier.
Isolation of Recombinant pDONR221-SIP470 Plasmid DNA
Five positive clones for silencing and homolog silencing respectively that were verified
by PCR analysis were inoculated into a 5ml LB broth containing the appropriate antibiotic and
incubated in a 37 °C shaker (250 rpm) overnight. The recombinant pDONR221-SIP470 plasmid
DNA was purified using QIAprep Spin MiniPrep Kit (Qiagen) according to the manufacturers’

36
instruction. The resulting plasmid was quantified using a Nanodrop spectrophotometer and
stored at -20 °C.
Sequencing of Recombinant Plasmid
Eight µl of the purified plasmid DNA (~800ng) was transferred to a PCR tube containing
2 µl of M13 forward primer. The mixture was sent for DNA sequencing to the DNA analysis
facility at Yale University. Sanger method of sequencing was used.
Cloning of SIP470 Silencing Construct into pHELLSGATE 8
The verified pDONR221_SIP470 construct was used for subcloning SIP470 into the
destination vector pHELLSGATE 8. The reaction mixture consisted of 1 µl of destination vector,
1 µl of LR clonase enzyme, 1 µl of recombinant plasmid DNA of pDONR221 and 7 µl of TE
buffer (pH 8.0) to make a final volume of 10 µl reactions. The reaction was then incubated at 37
°C for two hours after which it was terminated by adding 1 µl proteinase K. The reaction was
then maintained on the ice at 4 °C and was used for transformation into competent Top10 cells.
One µl of the product from the LR reaction (pHELLSGATE8-SIP470) was transformed into
competent E. coli as described earlier. The transformed cells were selected on LB agar plates
containing spectinomycin (50 µg/ml) and incubated at 37 °C. Bacterial cells from the
transformation were screened for the presence of pDONR221-SIP470 entry clone using colony
PCR as earlier described. The PCR amplified products were analyzed on 1.5% agarose gel
electrophoresis as described earlier. Five positive clones for silencing and homolog silencing
respectively that were verified from the colony PCR analysis was inoculated into a 5ml fresh LB
broth containing the appropriate antibiotic and incubated in a 37 °C shaker (250 rpm) overnight.
The recombinant pHELLSGATE8-470 plasmid was isolated and purified using QIAprep Spin

37
MiniPrep Kit (Qiagen) according to the manufacturers instruction. The resulting plasmid was
quantified using a Nanodrop spectrophotometer and stored at -20 °C.
Transforming Agrobacterium tumefaciens LBA 4404 cells with pHELLSGATE-SIP470
Silencing Construct
To revive the LBA 4404 strain of Agrobacterium, it was streaked from -80 °C glycerol
stocks onto an LB plate containing streptomycin and spectinomycin antibiotics (100 µg/ml) and
incubated for 2 days at 28 °C. A single colony was then added to 5 ml tube of LB with the
appropriate antibiotics and grown overnight on a 28 °C rotating shaker. The overnight culture
was then diluted (1:100) in 100ml LB and incubated at 28 °C with shaking until an OD600= 1.0
was reached. The cells were then centrifuged at 4000rpm for 10 minutes at 4 °C. The supernatant
was then discarded and the pellet was resuspended in 5ml of ice-cold 20mM sterile calcium
chloride. The cells were again centrifuged at 4000rpm for 5 minutes at 4 °C. Resulting pellets
were resuspended in 1ml of ice-cold 20mM calcium chloride and 100 µl were aliquoted into 2 ml
Eppendorf tubes containing 100 µl 50% glycerol and snap frozen in liquid nitrogen. For
electroporation, 1 µl of plasmid DNA for silencing construct (247ng/l) and homolog silencing
construct (150 ng/l) was added to 20 µl each of electrocompetent LBA 4404 cells respectively.
This mixture was then transferred to ice chilled 0.2 cm electroporation cuvette (Biorad). The
cells were electroporated using a pulse of 2.20 kV (kilovolts) for 5.4 milliseconds and 1 ml of
SOC media (appendix B) was added to the electroporated cells. The cells were then transferred
into a sterile Eppendorf tube and incubated at 28 °C for 3 hours. Cells (50 µl) were plated on an
LB agar containing appropriate antibiotics and incubated at 28 °C for 1-2 days for colonies to
develop. Transformed Agrobacterium colonies were screened for the presence of
pHELLSGATE8-SIP470 clone using colony PCR as earlier described. Gene specific primers
38
were used to verify the presence of an insert of interest. Verified clones were used for plant
transformations (both transient and stable).
Cloning SIP470 to Generate Overexpression Clone
To overexpress SIP470 in transgenic tobacco plants, the full-length SIP470 cDNA was
cloned into pER8 plasmid. pER8 is an estradiol-inducible plant expression vector. Using an
inducible system allows flexibility for studying the functions of genes whose expression is
developmental or regulated to a specific tissue (Zuo et al. 2000). pER8 is an estrogen receptor-
based chemical inducible system that comprises of a chimeric transcriptional activator XVE
which was assembled by fusion with a DNA binding domain of the bacterial repressor LexA (X),
transactivating domain and human estrogen receptor (E; ER) regulatory region. Estrogen highly
regulates the transactivating activity of the chimeric XVE factor whose expression is controlled
by the strong constitutive promoter G10-90 (Zuo et al. 2000).
Primers were designed to incorporate restriction sites Avr II and Spe I at the 3’and 5’ end
of SIP470 gene respectively. Full-length SIP470 gene was amplified from (pDONR221+470
clone#P2). A 30 µl PCR reaction mixture was made which consisted 22.2 µl of sterile water, 3 µl
of PCR buffer (10 x), 0.6 µl of dNTP (50 x), and 3 µl of template (1ng-1pg / 50ml reaction), 0.6
µl of Advantage HF polymerase (50 x) and 0.6 µl of forward and reverse primer. The PCR
reaction was done for 30 cycles with the denaturation temperature set at 94 °C for 30 seconds,
the annealing temperature of 55 °C for 30 seconds, an extension temperature of 72 °C for 30
seconds and a final extension temperature of 72 °C for 7 minutes after 30 cycles. The PCR
amplified products were analyzed on 1.5% agarose and the SIP470 amplified DNA band was
excised from the gel. The DNA was purified using the Qiagen gel extraction kit according to

39
manufacturer’s instructions. The purified product was eluted using 50 µl of 50 °C TE buffer and
quantified using a Nanodrop spectrophotometer.
Cloning SIP470 Overexpressing PCR Amplified cDNA into the pGEMT
The ligation reaction was done following the manufacturer's instruction (Promega). The
ligation reaction mixture consisted of incubating pGEMT vector (50 ng/µl) with 5 µl of purified
SIP470, 1 µl of T4 DNA ligase (3 Weiss units/ µl) and 2 µl of buffer (1x). The mixture was
incubated at 28 °C for 1 hour and the resulting product was used for further experiments. Two µl
of the ligation mixture (pGEMT-SIP470) was added and mixed gently to 200 µl of chemically
competent E.coli Top10 cells. The transformation was then done according to the method
described earlier. Transformed cells were plated on LB plates containing Ampicillin (50µg/ml).
Bacterial colonies were screened for the presence of SIP470 using colony PCR as earlier
described earlier. The primers used were T7 forward primer (plasmid specific) and a gene
specific primer. The PCR product was analyzed by agarose gel electrophoresis. Five positive
colonies were used for plasmid DNA isolation as described earlier. The resulting plasmid was
quantified sequenced.
Cloning of SIP470 into pER8.
Verified clone (pGEMT-SIP470-4) (210.5 ng/µl) was used for cloning into pER8. First,
SIP470 was excised out of pGEMT by restriction digestion. A total 20 µl digestion mix was
prepared that consisted of 10 µl pGEMT-SIP470-4, 2 µl of the NEB cutsmart buffer, 7 µl sterile
water, 0.5 µl Avr II and 0.5 µl of Spe I. The mixture was incubated for 3 hours at 37 °C.
Similarly, the pER8 vector was also digested. The digestion mixture consisted of 3 µl of the
pER8 vector, 1 µl of cut smart buffer (2), 5 µl of sterile water, 0.5 µl Avr II and 0.5 µl of Spe I.

40
The mixture was incubated for 15 minutes at 37 °C and 1 µl was added to the reaction mix. Both
the SIP470 fragment and the pER8 were excised out and used for gel extraction as described
earlier. The purified product was eluted and quantified. For overexpressing SIP470, the pER8
vector and pGEMT-SIP470 were ligated. The ligation mixture consisted of 1.5 µl of digested
pER8 vector (45ng/ml), 0.5 µl of digested pGEMT-470-4 (14.4ng/ml), 3 µl of sterile distilled
water and 5 µl buffer and T4-DNA ligase enzyme. The mixture was incubated at 25 °C for 1
hour. Two µl of the ligation mixture (pER8-SIP470) was added to 200 µl of chemically
competent E. coli Top10 cells. The transformation was done as described earlier and the
transformed cells plated on LB plates containing spectinomycin (50 µg/ml) and incubated at
37°C overnight. Bacterial colonies were screened for the presence of pER8-SIP470 using colony
PCR as earlier described. pER8 vector forward primer and the reverse primer was used for
detection of expected band. The PCR product was run on a 1.5% EtBr stained agarose gel
electrophoresis for verification of inserts. The recombinant pER8-SIP470-Overexpression
plasmid was purified using the boiling method. Five positive colonies were inoculated into a 5
ml fresh LB broth containing the appropriate antibiotic and incubated in a 37 °C shaker (250
rpm) overnight. The overnight grown culture (1.5 ml) was then transferred to a microcentrifuge
tube, and centrifuged for 60 seconds at 12,000rpm at 4°C. The pellets were resuspended in 500
µl of ice cold STE (appendix B) buffer and centrifuged 60 seconds at 12,000rpm in 4°C.
Resulting pellets were again resuspended 350 µl of ice cold STET solution (appendix B) and 25
µl of lysozyme was added to the suspension and boiled for 50 seconds. After boiling, the
solution was then centrifuged for 10 minutes at 14000 rpm at 4 °C. The supernatant was
transferred into a new microcentrifuge tube and precipitated with equal volume of isopropanol.
The solutions were mixed by inverting the tubes and centrifuged for 30 minutes at 14000 rpm at
41
4 °C. The supernatant was discarded and the pellet was washed using 70% ethanol by inverting
the tubes and centrifuging it for 10 minutes at 14000rpm at 25°C. The resulting pellet was
resuspended in 25 µl of TE buffer, quantified and DNA sequenced as described earlier.
Transformation of pER8-SIP470 to LBA 4404 Competent Cells
To transform the electro-competent LBA 4404 Agrobacterium tumefaciens cells, 1 µl of
pER8-SIP470 plasmid DNA (142ng/ml) was added to 20 µl of cells pre-thawed on the ice. The
mixture was then transferred to 0.2 cm electroporation cuvette (Biorad). The cells were
electroporated and 1 ml of SOC media (Appendix B) was added to the electroporated cells. The
cells were then transferred into a sterile Eppendorf tube and incubated at 28 °C for 3 hours. Fifty
µl of the cells were plated on LB plates containing spectinomycin and streptomycin (50 µg/ml).
The plates were incubated at 28 °C overnight.
Transient Expression of pER8-SIP470 in Nicotiana benthamiana
To check if the verified clone is expressing correctly upon induction, a transient
expression was done in N. benthamiana. The verified pER8-SIP470 clone was inoculated into a
5ml LB broth containing the appropriate antibiotics and incubated in a 28 °C shaker overnight.
The overnight culture was sub-cultured in a 20 ml LB with appropriate antibiotics, containing 20
µM acetosyringone (3’5’-dimethoxy-4’hydroxyacetophenine, Aldrich) and 500 µl of 10 mM
MES (pH 5.5). The culture was incubated in a 28 °C shaker overnight. The overnight grown cells
were then harvested by centrifugation. The cells were resuspended in 10mM (MES) and 10mM
MgCl2. The process was repeated. The cells were then suspended in buffer containing 10mM
MES pH 5.5, 10mM MgCl2 and 150 µM acetosyringone. The concentration of cells was adjusted
to OD600=0.5 and incubated at room temperature on a shaker overnight. Next day the bacterial
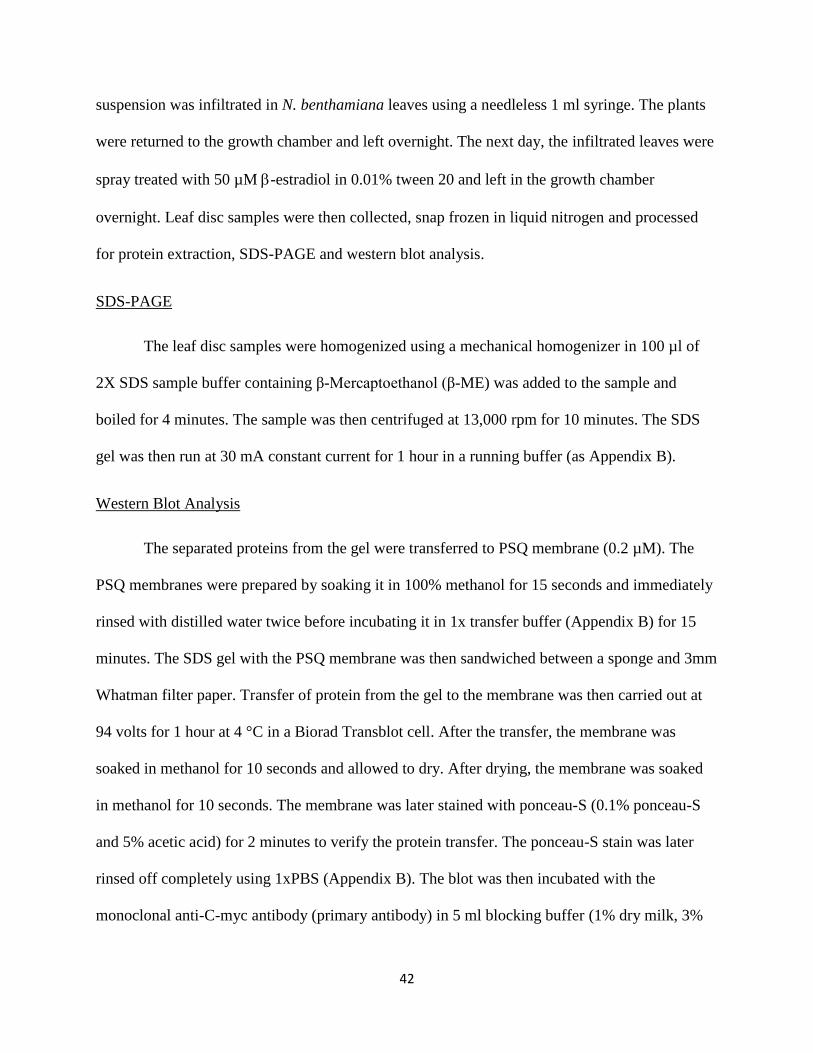
42
suspension was infiltrated in N. benthamiana leaves using a needleless 1 ml syringe. The plants
were returned to the growth chamber and left overnight. The next day, the infiltrated leaves were
spray treated with 50 µM -estradiol in 0.01% tween 20 and left in the growth chamber
overnight. Leaf disc samples were then collected, snap frozen in liquid nitrogen and processed
for protein extraction, SDS-PAGE and western blot analysis.
SDS-PAGE
The leaf disc samples were homogenized using a mechanical homogenizer in 100 µl of
2X SDS sample buffer containing β-Mercaptoethanol (β-ME) was added to the sample and
boiled for 4 minutes. The sample was then centrifuged at 13,000 rpm for 10 minutes. The SDS
gel was then run at 30 mA constant current for 1 hour in a running buffer (as Appendix B).
Western Blot Analysis
The separated proteins from the gel were transferred to PSQ membrane (0.2 µM). The
PSQ membranes were prepared by soaking it in 100% methanol for 15 seconds and immediately
rinsed with distilled water twice before incubating it in 1x transfer buffer (Appendix B) for 15
minutes. The SDS gel with the PSQ membrane was then sandwiched between a sponge and 3mm
Whatman filter paper. Transfer of protein from the gel to the membrane was then carried out at
94 volts for 1 hour at 4 °C in a Biorad Transblot cell. After the transfer, the membrane was
soaked in methanol for 10 seconds and allowed to dry. After drying, the membrane was soaked
in methanol for 10 seconds. The membrane was later stained with ponceau-S (0.1% ponceau-S
and 5% acetic acid) for 2 minutes to verify the protein transfer. The ponceau-S stain was later
rinsed off completely using 1xPBS (Appendix B). The blot was then incubated with the
monoclonal anti-C-myc antibody (primary antibody) in 5 ml blocking buffer (1% dry milk, 3%

43
BSA in 1X PBS) and incubated overnight (~16h) at 4°C on a shaker. The next day, primary
antibody was removed and the membrane was washed for 3 times (5 min each) using 1x PBS
first, followed by 1x PBS containing 3% tween 20, and finally rinsed with 1x PBS. The
membrane was then incubated with anti-mouse IgG peroxidase conjugate (1:10,000 in 5 ml of
blocking buffer) at room temperature for 1 hour on a shaker. The membrane was subjected to
washing as described above. Following washing, the membrane was incubated in the ECL
substrate (1:1) for 5 minutes and scanned using the C-DiGiT blot scanner (LiCOR) as described
by the manufacturer. The blot was later stained with coomassie blue to visualize total loaded
proteins.
Transformation of Tobacco with Agrobacterium LBA 4404 containing pER8-SIP470 and
pHELLSGATE8-SIP470
Verified Agrobacterium clones for silencing and overexpression were grown in LB media
with the appropriate antibiotics at 28 °C for 2 days to until stationary phase was reached. The
culture was then diluted using an equal volume of LB and 20 ml of the diluted culture was
transferred to a sterile 50 ml tube. Whole leaves from wild-type tobacco plant (XNN) was
collected and surfaced sterilized by treated it with 20% (v/v) commercial bleach containing 0.1%
tween-80. The leaves were later rinsed about 3 times using sterilized water to remove beach.
Leaf disc was punched from the sterilized leafs using a sterile cork borer and about 50 leaf disc
were incubated with the Agrobacterium cultures respectively. The bacteria cultures were left on
the shaker at room temperature for 30 minutes before plating the leaf disc inverted on the shoot
inducing media (SIM) (Appendix B) with no antibiotics. The plates were later incubated at 23 °C
in the dark for 2 days. After incubation for 2 days, the leaf disc was incubated in 20 ml of LB
media containing carbenicillin (100 µg/ml) and 3% sucrose and kept on the shaker for 2 hours.
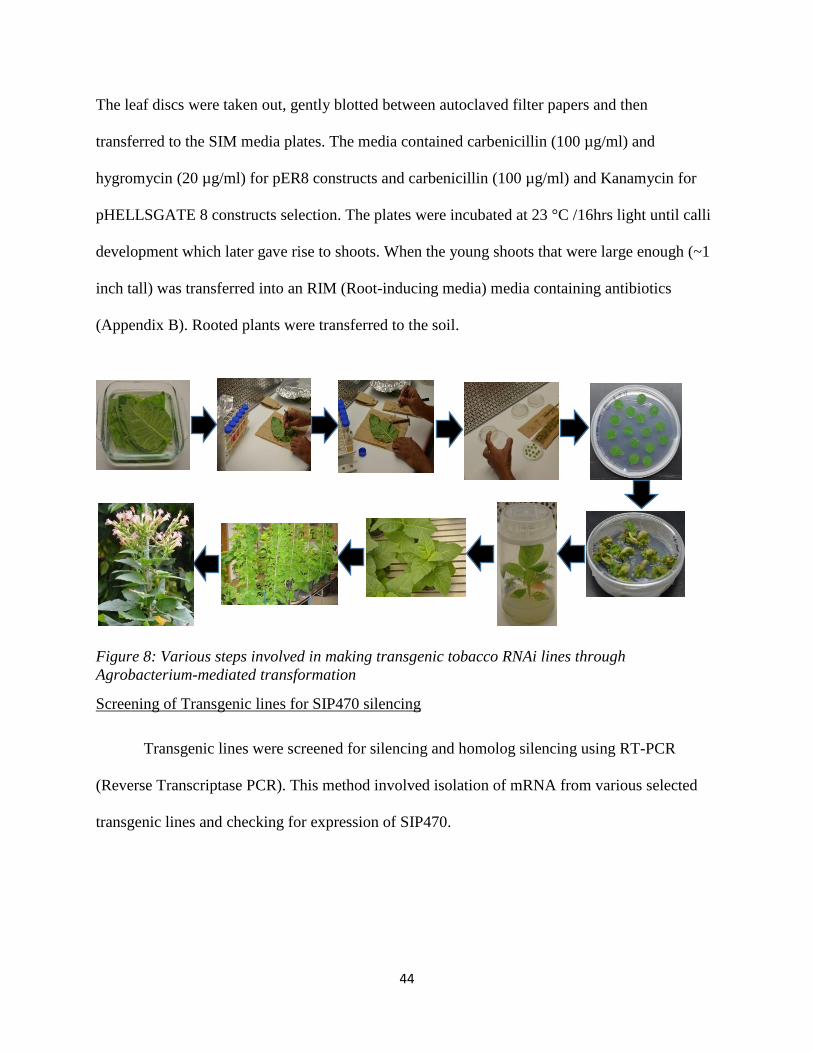
44
The leaf discs were taken out, gently blotted between autoclaved filter papers and then
transferred to the SIM media plates. The media contained carbenicillin (100 µg/ml) and
hygromycin (20 µg/ml) for pER8 constructs and carbenicillin (100 µg/ml) and Kanamycin for
pHELLSGATE 8 constructs selection. The plates were incubated at 23 °C /16hrs light until calli
development which later gave rise to shoots. When the young shoots that were large enough (~1
inch tall) was transferred into an RIM (Root-inducing media) media containing antibiotics
(Appendix B). Rooted plants were transferred to the soil.
Figure 8: Various steps involved in making transgenic tobacco RNAi lines through
Agrobacterium-mediated transformation
Screening of Transgenic lines for SIP470 silencing
Transgenic lines were screened for silencing and homolog silencing using RT-PCR
(Reverse Transcriptase PCR). This method involved isolation of mRNA from various selected
transgenic lines and checking for expression of SIP470.

45
Total RNA Isolation and cDNA Synthesis
A total 3 to 4 leaf discs were frozen in liquid nitrogen and homogenized to a fine powder
using a blue pestle and a mechanical grinder. To the homogenized leaf powder, 0.5 ml Trizol
was added and mixed by vortexing. An additional 500 µl of trizol was added to the sample and
then transferred into a 2 ml screw-cap tubes containing ~0.2ml of 2 mm autoclaved zirconia
beads. Samples were immediately homogenized for 45 seconds at 4.5 power setting using
FastPrep 24. To the homogenized sample, 200 µl of chloroform was added and mixed by
inverting the tubes vigorously for 15 seconds before incubating the samples at room temperature
for 10 minutes. After incubation, the samples were centrifuged at 12000 x g for 15 minutes at 4
°C and the upper aqueous phase was transferred to new 1.5 ml tube. 500 µl of isopropanol was
immediately added to the tube and the tube was incubated for 10 minutes at 30 °C. Samples were
then centrifuged at 12000 x g for 10 minutes at 4 °C and the supernatant was discarded. To the
resulting pellet, 75% cold ethanol was added and the samples were mixed by vortexing. Samples
were then centrifuged at 7500 x g for 5 minutes at 4°C and the supernatant was air dried for 10
minutes. Air dried pellets were resuspended in 40 µl of DEPC treated water
(diethylpyrocarbonate) (appendix B), vortexed few times and incubated at 55 °C for 10 min. To
the fully resuspended RNA, 10 µl of RNAse free DNase-buffer mix (2 µl DNase + 5 µl DNase
buffer + 3 µl DEPC treated water) was added and incubated at 37 °C for 20 minutes. To remove
the DNase, the sample was treated again with trizol reagent, chloroform, isopropanol, and
chloroform using half the volume described above. The resulting pellet was then collected and
then air dried for 10 minutes. The air dried sample were then resuspended using 20 µl of DEPC
water and incubated for 5-10 minutes at 55 °C to ensure that the pellets were dissolved. RNA

46
concentration (ng/µl) was measured using Nanodrop spectrophotometer (Nanodrop Technologies
ND-1000). Samples were stored at -80ºC until ready for cDNA synthesis.
First Strand cDNA Synthesis
Reverse transcriptase enzyme was used to synthesize first-strand complementary DNA
(cDNA) from the isolated total RNA. A two-step process was used for this experiment. In the
first step, 2 µl of oligo-dT (0.5 µg/ml) was added to 1 µg of total RNA (diluted to a total volume
of 8 µl with depc treated water) and the mixture was incubated at 75ºC for 10 min followed by
immediate cooling to 4 ºC in the thermocycler (Eppendorf). The samples were the cooled to 4 ºC.
10 µl mixture that consisted of 1 µl reverse transcriptase (RT) (MMLV), 4 µl 5X RT buffer, 1 µl
RNAsin (RNAase inhibitor), 1 µl 10 mM dNTPs mix, and 3 µl DEPC treated water was added to
the sample. The samples were then immediately vortexed and incubated for 60 minutes at 42 ºC
and then at 70 ºC for 10 minutes in the thermocycler. The newly synthesized cDNA samples
were then stored at -20 ºC until further experiments.
Reverse Transcriptase-Polymerase Chain Reaction (RT-PCR)
The synthesized cDNA were used to screening for the expression of SIP470 in the
silenced and homolog silenced transgenic lines. A 10 µl PCR reaction mixture that contained 6
µl of DEPC water, 1 µl 10 X dNTP, 1 µl 10X Taq polymerase buffer, 0.2 µl Taq DNA
polymerase, 0.4 µl of 10 µM forward primer, 0.4 µl of 10 µM reverse primers and 1 µl of cDNA
sample.
Screening of SIP470 Overexpressor Transgenic lines
Overexpressor transgenic lines were screened for successful expression of SIP470 protein
in the plants by inducing leaf disc samples using β- estradiol (50µM) and detecting the
47
overexpressed SIP470 using western blot and SDS-PAGE. Leaf disc samples were collected
using a cork borer (#6). Each leaf disc was placed in a 24 well cell culture cluster plate
containing 50 µM -estradiol in 0.01% tween 20 and left overnight. The samples were then
homogenized in liquid nitrogen. 100µl of SDS buffer was added to the samples and analyzed
using western blot as earlier described.
Role of SIP470 in Biotic Stress
Role of SIP470 in systemic acquired resistance (SAR)
To assess the role of SIP470 in the induction of SAR, Arabidopsis mutants (ltp 12 and ltp
2) were used. Bacterial growth was measured in the leaves by homogenizing the leaves, diluting
the extract and plating it on selective antibiotic media (LB) and counting the bacterial colonies to
determine the colony forming units (cfu/ml) (Kiefer and Slusarenko 2003). SAR was
investigated based on a modified protocol from Kiefer and Slusarenko (2003). To induce SAR,
the two lower leaves of control (A.t. col 0) and mutant Arabidopsis plants were the first syringe
infiltrated with avirulent pathogen (OD=0.002) (P.S tomato DC3000 AvrRPT2) or 10 mM MgCl2
(control). After 2 days post infection (2 DPI), three upper leafs were challenged with a virulent
pathogen (OD=0.0002) Pseudomonas syringe pv. maculicola. Leaf discs (5mm) were collected
from the treated upper leaves using a cork borer and homogenized in 1ml distilled water using
FastPrep 24 for 5 seconds at least twice. A 10-fold serial dilutions was prepared in sterile water,
and an aliquot of 20 µl was spotted on an LB agar containing rifampicin 100 µg/ml. Plates were
incubated at 28 ºC until the bacterial colonies developed and were large enough to be counted.
All the bacterial colonies were counted, multiplied by the dilution factor to get cfu/ml. The
experiments were done in triplicates.

48
Role of SIP470 homologs in Basal Resistance
To assess the role of SIP470 in basal resistance, the bacteria growth was quantified from
an infected leaf. Arabidopsis mutant and control plants were infiltrated with virulent pathogen
(OD=0.0002) Pseudomonas syringe Pv. maculicola. At 3 days post inoculations (DPI), Leaf
discs (5mm) were collected and processed for plating as described for SAR experiment.
Experiments were done in triplicates.
Role of SIP470 Homolog in Abiotic Stress
To assess the role of SIP470 in abiotic stress, ltp12, and Col 0 seeds surfaced sterilized by
incubating it in 70% ethanol for 5 minutes. The seeds were then incubated in 20% (v/v)
commercial bleach containing 0.1% Tween 20. After surface sterilization, the seeds were then
washed with sterile distilled water at least 4 times and plated on half strength MS media
containing Gamborg vitamins. Plated seeds were then kept at 4ºC for 2 days before transferring
to the lighted racks. Seedlings (~5-7 days old) were then transferred to MS media plates
containing various concentrations of stress-inducing chemicals (NaCl, Hydrogen Peroxide, and
Abscisic Acid) (See appendix for media composition).
Gene Expression Studies
To understand at the molecular level the possible function of Arabidopsis LTP12, a gene
expression study was conducted. Arabidopsis wild-type plant (Col 0) and mutant plants were
infiltrated with virulent pathogen (OD=0.001) Pseudomonas syringe Pv. maculicola. 2 Leaf disc
samples were collected at 0, 3, 6, 9, 12, 24 and 48 hours post-infection from mutant and wild-
type plants using a cork borer of size 2. Leaf disc samples were then homogenized in liquid

49
nitrogen and RNA was extracted, resulting cDNA was synthesized and RT-PCR was carried out
as described earlier.
Tobacco SIP470 is a Lipid Transfer Protein (Hypothesis 2)
Expression of Recombinant SIP470 in E.coli
The SIP470 clone, pDEST17-SIP-470-25 was used for recombinant protein expression.
The chemically competent BL21 (DE3) pLysE cells (100 µl) were transformed with the
pDEST17-SIP-470-25 construct and selected on antibiotics plate as described earlier. Expression
of recombinant SIP470 was done according to the method described by Chapagai (2014).
In order to determine the appropriate temperature that resulted in a more soluble form of
recombinant SIP470, an overnight culture from a single colony was grown in LB media
containing 100 µg/ml ampicillin and 10 µg/ml kanamycin at 17 ºC and 37 ºC respectively. The
overnight culture was diluted 100 times into fresh LB media containing the appropriate
antibiotics and then incubated at 37 ºC until OD600= 0.6. Protein expression was induced by
adding 10 µM IPTG (Isopropyl β-D-1-Thiogalactopyranoside (IPTG) to the bacteria culture and
incubating it at 37 ºC for 3 hours and 17 ºC overnight respectively in a shaker. The bacterial
pellet was collected by centrifugation at 13,000 rpm for 3 minutes at room temperature. The
pellet was suspended in 1X Ni-NTA binding buffer (50 mM sodium phosphate monobasic, 300
mM sodium chloride, 10 mM imidazole, pH 8.0) and cells were broken by sonication with 20%
amplitude for 15 seconds. The process was repeated 3 times. The supernatant (soluble) and pellet
(insoluble) were separated by centrifugation at 13,000 rpm for 15 minutes in 4C. The pellet was
resuspended in 1X Ni-NTA binding buffer. Proteins from both soluble and insoluble fractions

50
were run on SDS gel and western blotting was performed to determine the solubility of
recombinant SIP470.
Purification of Recombinant SIP470 by Ni-NTA Column Affinity Chromatography
An overnight culture from a single colony was grown at 37C in 5 ml LB media
containing 100 µg/ml ampicillin and 10 µg/ml kanamycin. Then, the overnight culture was
diluted 100 times into fresh LB media containing 100 µg/ml ampicillin and 10 µg/ml kanamycin
and then incubated at 37C until the OD600 = 0.6. The bacterial culture was induced with 10 µM
IPTG as a final concentration and then incubated at 37ºC overnight in a shaker. The bacterial
pellet was collected by centrifugation at 8,000 rpm for 15 minutes at 4ºC and 42 then
resuspended in 1X Ni-NTA buffer. Protease Inhibitor (PI) (10 µl/ml) was added to the suspended
bacterial pellet. Bacterial cells were lysed in a French press (Thermo Electron Corporation; cell
type 20 K) and the soluble fraction (supernatant) was collected by centrifugation at 13, 000 rpm
for 15 minutes at 4ºC. The soluble fraction was then incubated overnight with 1x Ni-NTA resin
(Qiagen) at 4ºC. The unbound proteins were removed by washing with washing buffer
containing 10 mM Imidazole in 1x Ni-NTA buffer. The bound recSIP470 was then eluted with
elution buffer containing 250 mM Imidazole in 1x Ni-NTA buffer at room temperature. The
presence of recSIP470 was confirmed by western blotting using monoclonal anti-polyHistidine
antibody. SDS-PAGE analysis and Western Blot analysis was performed a described earlier.
The primary antibody used was an anti-polyHistidine antibody (1:3000).

51
In vitro Lipid Binding Assay
In order to test if SIP470 is a lipid transfer protein, an in vitro lipid binding assay was
performed using soluble NI-NTA purified SIP470 and TNS (p-toluidinonaphthalene-6-
sulfonate), a fluorescent lipid binding substrate (Debono et al. 2009). TNS fluoresces intensely
when bound in a hydrophobic environment but weakly in aqueous solution (Debono et al. 2009).
TNS binding assay was performed from a protocol adopted from Debono et al. (2009) with slight
modifications. 250 nM of recSIP470 (final concentration) and assay buffer (175 mM mannitol,
0.5 mM K2SO4 0.5 mM CaCl2, and 5 mM MES, pH 7.0) was incubated in a 96 well plate to a
final assay volume of 100 µl. To the mixture, 250 µM of TNS solution was then added
incrementally (1-20 µM) and fluorescence was read using a Synergy HT microplate reader at an
excitation and emission wavelength of 320 and 437 nm respectively. Fluorescence was then read
by subtracting the fluorescence values from the control which contained no protein but contains
the elution buffer (see appendix) used for purifying the recombinant protein.
Effect of SABP2 on Lipid Binding Activity of SIP470
To investigate the possible effect of SABP2 on the binding activity of a lipid-binding
assay in the presence of SABP2 was carried out. The purified recombinant SIP470 (250 nM,
final concentration) and 500 nM of SABP2 were incubated together for 10 minutes. The mixture
was then mixed with assay buffer (175 mM mannitol, 0.5 mM K2SO4, 0.5 mM CaCl2, and 5 mM
MES, pH 7.0) to a final volume of 100 µl in a microplate. To the mixture, TNS solution (250
µM) was then added incrementally (1-20 µM). The fluorescence was read using a Synergy HT
microplate reader at an excitation and emission wavelength of 320 and 437 nm respectively.

52
CHAPTER 3
RESULTS
Role of SIP470 in Plant Stress Signaling (Hypothesis 1)
Generating SIP470 RNAi Silenced Transgenic Tobacco Lines
In order to investigate the possible roles of SIP470 in biotic as well as abiotic plant stress
signaling, there was a need to generate transgenic lines in tobacco that are silenced in the
expression of SIP470. Similar, we speculated that there was also a need to equally silence the
homologs of SIP470 in other to avoid a functional complementation using one of SIP470
homologs in silenced plants. Transgenic lines that are silenced in SIP470 were generated as
explained in the methods section. A gateway based plasmid, pDONRR221 was used to generate
an entry clone which facilitated recombination with the destination vector pHELLSGATE 8
(Figure 9). The destination vector was transformed into competent Agrobacterium tumefaciens
LBA4404 cells which were used for the plant transformation.

53
Figure 9: Vector Map of pHELLSGATE 8 used in generating SIP470 transgenic lines.
PCR Amplification of SIP470 Silencing Fragment
To generate silencing and homolog silencing construct, selected fragments in SIP470
coding sequences for silencing (Figure 10) and homolog silencing (Figure 11) was amplified
from a verified template (pDONR221+470 clone number P2) using a primer that has flanking
attB1 and attB2 flanking sites. PCR was then performed as earlier described in the methods
section. Results show a successful amplification of silencing fragment (Figure 12A) and
homolog silencing fragment (figure 12B). The resulting fragments were used for subsequent
clonings.

54
ATGGAAATGGTTGGCAAGATTGCGTGCTTTGTGTTACTTTGCATGGTGGTGGTTGCACCCCA
TGCAGAGGCACTGAGCTGCGGCCAGGTTCAGTCTGGCCTGGCTCTTTGCCTCCCTTATCTGC
AGAGTCGCGGCCCTCTAGGGAGGTGTTGTGGCGGCGTTAAAGGTGTGTTGGGTGCTGCCCGG
ACCCCAGCTGACCGCAAGACTGCATGCACTTGCCTGAAATCAGCTGCTTATGCTATTAAGGG
TATTAATATGGGCAAAGCCGCTGGACTTCCTAGTGCTTGTGGCGTTAACATTCCCTACAAGA
TCAGTCCCTCTACTGACTGCTCCAGGGTCCAGTGA
Figure 10: Verified Sequence of SIP470 showing 60bp long sequence selected for silencing
(underlined).
ATGGAAATGGTTGGCAAGATTGCGTGCTTTGTGTTACTTTGCATGGTGGTGGTTGCACCCCAT
GCAGAGGCACTGAGCTGCGGCCAGGTTCAGTCTGGCCTGGCTCTTTGCCTCCCTTATCTGCAG
AGTCGCGGCCCTCTAGGGAGGTGTTGTGGCGGCGTTAAAGGTGTGTTGGGTGCTGCCCGGACC
CCAGCTGACCGCAAGACTGCATGCACTTGCCTGAAATCAGCTGCTTATGCTATTAAGGGTATT
AATATGGGCAAAGCCGCTGGACTTCCTAGTGCTTGTGGCGTTAACATTCCCTACAAGATCAGT
CCCTCTACTGACTGCTCCAGGGTCCAGTGA
Figure 11: Verified Sequence of SIP470 showing 141bp long sequence selected for homolog
silencing (Underlined).
Figure 12: Agarose gel electrophoresis of the amplified silencing construct. A. PCR amplified
fragment for the silencing fragment. B. PCR amplified fragment for homolog silencing. Asterisk
shows the expected size of the band expected.
*
* 1000 bp
500 bp
300 bp
200 bp
100 bp
1000 bp
500 bp
300 bp
200 bp
100 bp
A B
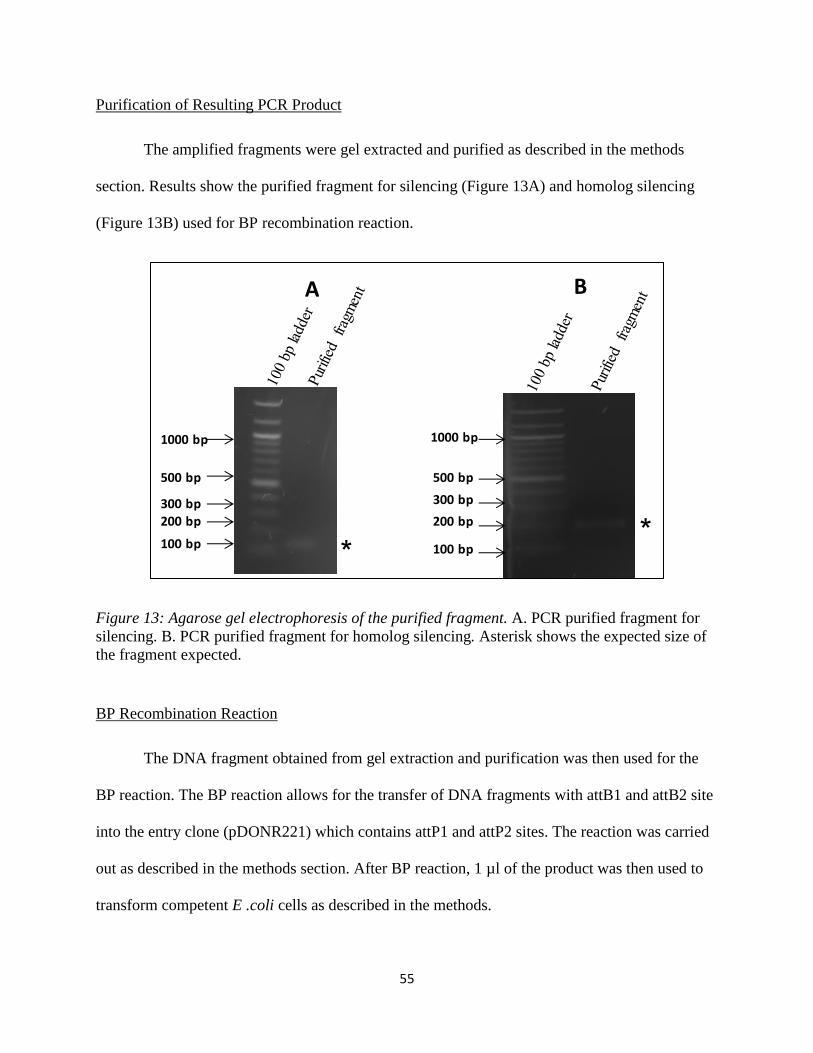
55
Purification of Resulting PCR Product
The amplified fragments were gel extracted and purified as described in the methods
section. Results show the purified fragment for silencing (Figure 13A) and homolog silencing
(Figure 13B) used for BP recombination reaction.
Figure 13: Agarose gel electrophoresis of the purified fragment. A. PCR purified fragment for
silencing. B. PCR purified fragment for homolog silencing. Asterisk shows the expected size of
the fragment expected.
BP Recombination Reaction
The DNA fragment obtained from gel extraction and purification was then used for the
BP reaction. The BP reaction allows for the transfer of DNA fragments with attB1 and attB2 site
into the entry clone (pDONR221) which contains attP1 and attP2 sites. The reaction was carried
out as described in the methods section. After BP reaction, 1 µl of the product was then used to
transform competent E .coli cells as described in the methods.
1000 bp
500 bp
300 bp
200 bp
100 bp
1000 bp
500 bp
300 bp
200 bp
100 bp
A B
*
*

56
Screening of Transformed Cells Using Colony PCR
Transformed colonies were selected and screened for the presence of SIP470 silence
fragment in the entry clone (pDNOR221) before further cloning steps. Results show the presence
of SIP470 fragment in the entry clone for silencing (Figure 14A) and homolog silencing (Figure
14B) respectively.
Figure 14 : 1.5% EtBr stained agarose gel of colony PCR. A. Shows the presence of entry vector
and silencing fragment for SIP470. B. shows the presence of entry vector and homolog silencing
fragment for SIP470
1000 bp
500 bp
300 bp
200 bp
100 bp
1000 bp
500 bp
300 bp
200 bp
100 bp
B
A
*
*

57
Sequencing of Recombinant Plasmid
Plasmids from Five bacterial clones that were positive from colony PCR each from
silencing and homolog silencing was isolated (as described in the methods section) and sent for
sequencing. Results show a 100 percent match of the silencing fragment in the vector when
aligned with a verified template (Figure 15).
Figure 15: Sequence Alignment of the silencing fragment in entry clone pDONR221 with the
selected 60bp sequence for silencing. Perfectly matching sequences are indicated with a star
below the sequence. The M13 forward primer was used for DNA sequencing.
LR Recombination Reaction
The verified sequence in the entry clone was then ligated into the destination vector
pHELLSGATE 8. The LR reaction allows the transfer of DNA sequences of interest flanked by
attL1 and attL2 in the entry vector into the destination vector pHELLSGATE 8 with attR1 and
attR2. The reaction was carried out as described in the methods section. After LR reaction, 1 µl
of the product was then used to transform competent E.coli cells as described in the methods.
SEQUENCE ALIGNMENT
SBIP470 -------TGTGGCGGCGTTAAAGGTGTGTTGGGTGCTGCCCGGACCCCAG 43
SILENCING1PDONOR221FORWARDM13 AGGCTATTGTGGCGGCGTTAAAGGTGTGTTGGGTGCTGCCCGGACCCCAG 50
*******************************************
SBIP470 CTGACCGCAAGACTGCA--------------------------------- 60
SILENCING1PDONOR221FORWARDM13 CTGACCGCAAGACTGCAGGGAAGAGCTTCTTCCGCTGCCTAGAATCTGCA 100
*****************
SBIP470 --
SILENCING1PDONOR221FORWARDM13 TT 102

58
Screening of Transformed Cells Using Colony PCR
Transformed colonies were selected and screened for the presence of SIP470 silencing
fragment in the destination vector (pHELLSGATE 8). Results show the presence of SIP470
fragment in the destination clone for silencing (Figure 16). The same procedure as followed for
homolog silencing but gel pictures were not taken because the results from silencing experiments
validated the process.
Figure 16: 1.5% EtBr stain agarose gel of colony PCR. Figure showing the presence of
destination vector and silencing fragment for SIP470.
Recombinant pHELLSGATE 8-SIP470 Plasmid DNA Isolation
Colony # 4 (Figure 16) was subcultured in LB media with the appropriate antibiotics
overnight and the plasmid was extracted (as described in the methods section). To further verify
the presence of silencing fragment in the destination vector (pHELLSGATE 8), a PCR
amplification was done using the extracted plasmid as a template and result shows the presence
of the silencing fragment of interest (Figure 17). One µl of plasmid DNA for silencing
(247ng/ml) and homolog silencing (150 ng/ml) was later used to transform electrocompetent
LBA 4404 cells respectively.
1000 bp
500 bp
300 bp
200 bp
100 bp
*

59
Figure 17: 1.5% EtBr stained Agarose Gel. Figure showing the PCR silencing fragment for
SIP470. DNA fragment of interest.
Transformation of pHELLSGATE8-SIP470 into LBA 4404
Transformed LBA4404 was screened for the presence of pHELLSGATE8-SIP470 using
colony PCR as earlier described. The result shows the presence of pHELLSGATE8-SIP470 in
Agrobacterium (Figure 18).
Figure 18: Agarose gel showing the presence of pHELLSGATE8-SIP470 in Agrobacterium.
1000 bp
500 bp
300 bp200 bp
100 bp
1000 bp
500 bp
300 bp
200 bp
100 bp

60
Generating SIP470 Overexpression Transgenic Tobacco Lines
In order to characterize the functional role of SIP470 in plants in biotic and abiotic
stresses, there was a need to generate a transgenic line that overexpresses SIP470 protein of
interest in order to study the possibility of a reversed and even enhanced role in the silenced
plants (complementation). Overexpressed lines of SIP470 were generated using an inducible
system as explained in the material and methods section. We used pGEMT as the entry vector
and pER8 (Figure 19) as the destination vector. Verified clone in the destination vector was
transformed into competent Agrobacterium tumefaciens LBA4404 cells which were used for the
plant transformation.
Figure 19: Vector Map of pER8 used in generating overexpressed SIP470 transgenic lines.

61
PCR amplification of SIP470 Coding Sequence
To generate the overexpression transgenic lines, SIP470 coding sequences (Figure 20)
was amplified from a verified template (pDONR221+470 clone number P2, box 4) using a
primer designed to incorporate an Avr II and Spe I enzyme site at the C and N terminal of
SIP470 gene respectively. PCR amplification was then performed as earlier described in the
methods section. Results show a successful amplification of SIP470 coding sequence (Figure
21).
Figure 20: Verified Sequence of SIP470 showing 345bp long coding sequence selected for
overexpression (underlined).
Figure 21:Agarose gel showing the PCR amplified fragment for SIP470 overexpression.
ATGGAAATGGTTGGCAAGATTGCGTGCTTTGTGTTACTTTGCATGGTGGTGGTTGCA
CCCCATGCAGAGGCACTGAGCTGCGGCCAGGTTCAGTCTGGCCTGGCTCTTTGCCTC
CCTTATCTGCAGAGTCGCGGCCCTCTAGGGAGGTGTTGTGGCGGCGTTAAAGGTGTG
TTGGGTGCTGCCCGGACCCCAGCTGACCGCAAGACTGCATGCACTTGCCTGAAATCA
GCTGCTTATGCTATTAAGGGTATTAATATGGGCAAAGCCGCTGGACTTCCTAGTGCT
TGTGGCGTTAACATTCCCTACAAGATCAGTCCCTCTACTGACTGCTCCAGGGTCCAG
TGA
1000 bp
500 bp
300 bp
200 bp
100 bp

62
Screening of Transformed Cells in pGEMT Using Colony PCR
The amplified fragment was purified as described in the methods section. The purified
fragment was then ligated into pGEMT entry vector as described in the materials section. The
ligation mixture was then used to transform competent E.coli Top10 cells. Transformed colonies
were selected and screened for the presence of SIP470 coding sequence and the result shows the
presence of SIP470 coding sequence in the pGEMT vector (Figure 22).
Figure 22: 1.5% EtBr stain agarose gel. Figure showing the presence SIP470 in pGEMT
Sequencing of Recombinant pGEMT-SIP470 Plasmid
Plasmids from three bacterial clones that were positive from colony PCR each for
overexpression was isolated (as described in the methods section) and sent for sequencing.
Results show a 100 % match of the silencing fragment in the vector when aligned with a verified
template (Figure 23).
1000 bp
500 bp
300 bp
200 bp
100 bp

63
Figure 23: Sequence Alignment of SIP470 overexpression clone in pGEMT (TM1-pGEMT).
Perfectly matching nucleotides are indicated with a star below the sequence.
Ligation of Digested pGEMT-470-4 and pER8
Sequence verified clone (pGEMT-SIP470-4) and pER8 plasmid were then restricted
digested as described in the methods section. The ligated mixture was then transformed into E.
coli and incubated overnight. Plasmid from transformed bacteria was isolated and analyzed on a
1.5% EtBr agarose gel. The result shows successful ligation of SIP470-pER8 (Figure 24).

64
Figure 24: 1.5% EtBr stain agarose gel. Figure showing the presence of ligated SIP470-pER8
having a higher size approximately 800bp than the pER8 empty vector.
Sequencing of Recombinant SIP470-pER8 Plasmid
SIP470-pER8 clone from the above was then sent for sequencing. Analysis of the
sequence obtained shows that the translated protein of SIP470 is in the right frame of the pER8
vector as seen in Figure 25.
SIP470-
pER8
+ve
Control
pER8
Vectore
100bp
ladder
1000 bp
500 bp
300 bp
200 bp
100 bp

65
Figure 25: Figure shows a translated protein sequence of SIP470 (in red) in the frame as
indicated by the translated sequence upstream (in black).
Transient Expression of SIP470-pER8 in Nicotiana benthamiana
The verified SIP470-pER8 clone was transformed into competent Agrobacterium cells as
described in the methods section. In order to verify whether SIP470-pER8 clone was able to
express SIP470 protein when induced, transient expression was carried out as described in the
methods section. Figure 26 shows a western blot detection of SIP470 transiently expressed in the
leaves of the tobacco plant. This process was important to determine the successful expression of
the protein of interest after plant transformation.

66
Figure 26: Western blot analysis. This shows SIP470 protein from transient expression in
Nicotiana benthamiana. Protein was detected by using myc tag antibody.
Screening of Transgenic Line for Silencing and Homolog Silencing
Plant transformation was carried out as described in the materials and methods section.
Leaf tissues were collected from transformed plants to check the relative expression of SIP470 in
the transgenic silenced and homolog silenced lines respectively when compared to the wild type
plant. mRNA was extracted from the leaf tissues collected from silenced as well as homolog
silenced lines as described in the methods section. The corresponding cDNA was synthesized
from the resulting mRNA and an RT-PCR was done using the screening primer. Results from
RT-PCR shows a successfully silenced SIP470 (Figure 27A) as well as its homologs (Figure
27B) as seen by the inability to detect the screening sequence in the transgenic lines.

67
Figure 27: 1.5% EtBr stain agarose gel. A. shows RT-PCR results for silenced plants and their
relative level of expression of SIP470 with XNN having a relatively higher expression level
when compared to the silenced lines. B. shows RT-PCR results for homolog silenced plants and
their relative level of expression of SIP470
Plants lost
1000 bp
500 bp
300 bp200 bp100 bp
100bp 1 2 3 4 5 6 7 8 9 10 11
A
ACTIN
SIP470
100bp 1 2 3 4 5 6 7 8 9 10 11
1000 bp
500 bp
300 bp200 bp100 bp
SIP470
B
ACTIN
Plants lost
1000 bp
500 bp
300 bp200 bp100 bp
100bp 1 2 3 4 5 6 7 8 9 10 11
A
ACTIN
SIP470
100bp 1 2 3 4 5 6 7 8 9 10 11
1000 bp
500 bp
300 bp200 bp100 bp
SIP470
B
ACTIN

68
Plant transformation was done as earlier described. Successfully transformed plants for
overexpression were subjected to screening by inducing leaf disc samples to express SIP470
using β estradiol solution. Overexpression of SIP470 was not detected using this method of
screening as shown by the inability to detect SIP470 protein from the western blot analysis using
C-myc tag (Figure 28A and Figure 28B)
Figure 28: SDS-PAGE and western blot analysis. A. Coomassie stained blot showing various
leaf disc samples screened for SIP470 overexpression B. Western blot analysis various leaf disc
samples screened for SIP470 overexpression.
Homologs of SIP470 in Arabidopsis are not Defective in Systemic Acquired Resistance (SAR)
In order to investigate the role of SIP470 in inducing SAR in plants, Tobacco SIP470
translated protein sequence was used to search for similar proteins in Arabidopsis species.
Arabidopsis ltp2 has the highest similarity with SIP470 with a 53% match while ltp12 has a 46%
similarity with SIP470 (Chapagai, 2014). Knockout mutants for ltp12 and ltp2 were obtained
from the Biological Resource Center, OH, USA, screened (Chapagai, 2014) and was used for
investigating the possible role of ltp12 and ltp2 in inducing SAR. SAR experiments were carried
out as described in the materials and methods section. Results show that both ltp12 (Figure 29A)
and ltp2 (Figure 29B) were capable of inducing acquired resistance to pathogens.
97664530
20.1
14.4
97664530
20.1
14.4
1 2 3 4 5 6 7 8 9 10 11 12LMW 1 2 3 4 5 6 7 8 9 10 11 12LMW
A B
**

69
Figure 29: SAR is not affected in ltp2 and ltp12 mutants of Arabidopsis thaliana plants. A. SAR
was not affected in ltp12 mutant Arabidopsis thaliana plants. B. SAR was not affected in ltp2
mutant Arabidops thaliana plants. A significant difference was observed between mock and
avirulent treated samples (t-test, P <0.05). 2 lower leaves of mutant Arabidops plants were first
treated with avirulent pathogen (OD=0.002) (P.S tomato DC3000 AvrRPT2). After 2 days post
infection (2 DPI), three upper leafs were challenged with a virulent pathogen (OD=0.0002)
Pseudomonas syringe pv. maculicola. Control plants were infiltrated using 10mM MgCl2.

70
Homologs of SIP470 in Arabidopsis are Defective in Basal Resistance.
The role of SIP470 homologs was also investigated for the basal resistance to pathogens
in comparison to the wild type plant col-0 as described in the materials and methods section.
Results show that ltp12 mutant plants are significantly more susceptible to bacteria pathogen
(Figure 30A and 30B) allowing more growth of bacteria at 3 dpi while ltp2 didn’t show a
significant difference in susceptibility to the pathogen (Figure 29C).
Figure 30: Basal Resistance in Arabidopsis wild-type col 0, ltp12 and ltp2. A. shows the serial
dilution of leaf extract of P.s. maculicolia infected plants at 3 days post infection for ltp12 and
Col 0. B Growth of P.s. maculicola in ltp12 and Col 0 at 3 days post infection. A significant
difference was observed between the growth of bacteria in ltp12 and Col 0 (t-test, P <0.05). C.
The growth of Ps maculicola in ltp2 and Col 0 at 3 days post infection. No significant difference
was observed.

71
Role of SIP470 in Abiotic Stress
Ltp12 mutant in Arabidopsis is Susceptible to Salt Stress (NaCl)
To determine if SIP470 could play a role in abiotic stress, a ltp12 mutant that was
defective in basal resistance was grown in the presence of varying concentration of NaCl as
described in the materials and method section. Results show that ltp12 mutants are more
susceptible to salt stress at 150mM concentration when compared to the control (Col 0) as seen
by the bleaching leaves (Figure 31C). No leave bleaching effect was observed at 50mM NaCl
concentration (Figure 31B) but the plants appeared to be growth retarded when comparing the
growth with the control plates (Figure 31A) while the 200mM concentration affected both ltp12
mutant and Col 0 with both plant type showing a lot of leave bleaching but ltp12 being more
affected by salt stress (Figure 31C).

72
Figure 31: Effect of NaCl on 15 days old seedlings from ltp12 mutant and Col 0. 10-day old
seedlings of Arabidopsis ltp12 mutant and Col 0 were transferred into a half strength MS plate
containing A. no NaCl incorporated in half MS. B. Plates containing 50mM NaCl. C. plates
containing 150mM NaCl. D. plates containing 200mM NaCl.
Ltp12 Mutant in Arabidopsis Susceptible to Oxidative Stress (H2O2)
The effect of oxidative stress on the ltp12 mutant plant was also investigated using
hydrogen peroxide H2O2 incorporated in the MS media. The experiment was carried out as
described in the materials and methods section. Results show that ltp12 mutant was affected by
3mM hydrogen peroxide as seen by the bleaching in the leafs when compared to the control
(Figure 32).
A B
D

73
Figure 32: Effect of 3mM H2O2 on 15 days old seedling of ltp12 mutant and Col 0. 10-day old
seedlings of Arabidopsis ltp12 mutant and Col 0 were transferred into a half strength MS plate
containing 3mM hydrogen peroxide.
Ltp12 Mutant in Arabidopsis is Susceptible to Abscisic Acid (ABA)
The effect of ABA incorporated in the growth media was also investigated. The
experiment was carried out as describe in the methods section. Results show that ltp12 mutants
are hypersensitive to 20 µM ABA as seen by the bleaching of its leaves when compared to Col 0
with no visible bleaching on the leaves (Figure 33).
Ltp12Col 0

74
Figure 33: Effect of 20 µM ABA on 15 days old seedling of ltp12 mutant and Col 0. 10-day old
seedlings of Arabidopsis ltp12 mutant and Col 0 were transferred into a half strength MS plate
containing 3mM hydrogen peroxide.
Ltp12 Mutant in Arabidopsis is Susceptible to Drought
The effect of drought on the survival of SIP470 homologs (ltp12 and ltp2) were also
investigated as described in the methods section. Figure 34C shows that ltp12 mutants are
susceptible to drought stress when compared to wild type Col 0 as ltp12 mutant plants were not
able to survive drought even after subsequent exposure to water. Col 0 and ltp2 mutants were
able to survive drought stress.
Ltp12Col 0

75
Figure 34: Effect of drought on seedlings of ltp12 mutant and Col 0. Seedlings of Arabidopsis
ltp12 mutants were subjected to drought and then later watered.
Expression of PR1 Defense Gene on Exposure to Virulent pathogen
In order to understand at the molecular level what potential role ltp12 plays in basal
defense signaling, gene expression studies of a defense gene (PR1 ) was carried out as outlined
in the materials and methods section to determine if pathogenesis-related protein 1 (PR1) is up-
regulated or down-regulated in ltp12 mutant Col 0 plants. Figure 35 shows the expression level
of PR1 was delayed in ltp12 mutant plants but not in wild type (col 0) Plants on exposure to the
virulent pathogen.
ltp12ltp2Col 0
Col 0 ltp2 ltp12
A B C

76
Figure 35: PR1 Gene Expression upon P.s. maculicola exposure. Expression of PR1 on exposure
to P.s maculicola. 0, 3, 6, 12, 24 and 48 represents the different time points of sample collection.
cDNA was made from total RNA and used as a template to amplify PR1 and ubiquitin (internal
control).
Tobacco SIP470 is a Lipid Transfer Protein (Hypothesis 2)
Expression of Recombinant SIP470 in E. coli
In order to determine if SIP470 is a lipid transfer protein as predicted from bioinformatics
analysis, recombinant SIP470 was expressed in E. coli as described in the materials and methods
section. Expression of recombinant SIP470 was detected by SDS-PAGE and western blot
analysis using monoclonal Anti-polyhistidine antibody. There was a higher expression of
recombinant SIP470 in pDest17-470 transformed in pLysE cells (Figure 36A and 36B). This
clone was chosen for further experiments.
0 3 6 12 24 48 0 3 6 12 24 48
Col 0
PR1
UBIQUITIN
Ltp12
Time points (hrs)

77
Figure 36: Expression of recombinant SIP4670. A. SDS page analysis of different clones of
SIP470 in different protein expression cell lines. B Western blot analysis of recombinant SIP470
detected using poly-Histidine antibody. Lanes 1, 3 and 5 are un-induced, lanes 2, 4 and 6 are
induced using 10 µM IPTG. Asterisk represent the expected position of SIP470 protein on the
blot
Solubility Test
In order to get soluble fractions of recombinant SIP470 for biochemical assay, a
solubility test was done as described in the methods section. Resulting pellet collected from a
1ml overnight culture grown at different temperatures (17oC and 37oC) were re-suspended in 1X
Ni-NTA binding buffer and the cells were broken by centrifugation. Both the soluble
(supernatant) and insoluble (pellet) fractions were collected and analyzed using SDS page and
western blot. From the result, it was clear that recombinant SIP470 was more expressed at 37oC
in its insoluble and soluble form compared to 17oC (Figure 37).
976645
30
20.1
14.4
976645
30
20.1
14.4
A B
* *
Mar
ker
1 2 3 4 5 6
pDest17 pDest17 pET
Ril pLyase Ril
Mar
ker
1 2 3 4 5 6
pDest17 pDest17 pET
Ril pLyase Ril
Cont
rol

78
Figure 37: Expression of recombinant SIP470. A. SDS page analysis of SIP470 in pLysE cell
line at a different temperature of expression. B. Western blot analysis of recombinant SIP470
detected using poly-Histidine antibody. ‘UI’ in this figure stands for un-induced, ‘TP’ for total
protein, ‘IP’ for induced pellet, IS for induced supernatant and the asterisk represent the expected
position of SIP470 protein on the blot
Purification of Recombinant SIP470 using Ni-NTA Column Affinity Chromatography
Expressed recombinant SIP470 was purified using Ni-NTA affinity chromatography as
described in the materials and methods section. Samples were eluted with 250mM imidazole.
Eluted fractions were mixed with 6X SDS loading dye, boiled for 6 minutes and centrifuged.
Resulting supernatant from the centrifugation was analyzed using SDS page and western blot.
Result shows the successful detection of recombinant SIP470 using western blot (Figure 38)
976645
30
20.1
14.4
37oC17oC
10 µM IPTG
37oC17oC
10 µM IPTG
976645
30
20.1
14.4
A B
**

79
Figure 38: Purification of recombinant SIP470 using NI-NTA affinity chromatography. A. SDS
page analysis of purified recombinant SIP470 with eluted fractions E1-E11. B Western blot
analysis of recombinant SIP470 detected using poly-Histidine antibody. The asterisk represents
the expected position of SIP470 on the blot, E1-E11 represents each eluted fractions.
Biochemical Characterization
Lipid Binding Assay
In order to test if SIP470 is a lipid transfer protein, an in vitro lipid binding assay was
performed using soluble Ni-NTA purified SIP470 and a fluorescent lipid binding substrate called
TNS (p-toluidinonaphthalene-6-sulfonate) as described in the material and method section.
Under experimental conditions, recombinant SIP470 binds to TNS lipophilic probe as indicated
by the increasing fluorescence with an increasing concentration of TNS (Figure 39).
Fluorescence data was measured by subtracting from the control.
976645
30
20.1
14.4
976645
30
20.1
14.4
A B
* *

80
Figure 39: Recombinant purified SIP470 binds the Lipophilic Probe TNS. Recombinant SIP470
was expressed without the signal peptide and then purified in E. coli using NI-NTA affinity
chromatography. Purified SIP470 incubated with increasing concertation of TNS shows an
increasing fluorescence activity
Effect of SABP2 on Binding Affinity
The effect of SABP2 on lipid binding activity of SIP470 was also carried out as described
in the materials and methods section. A 100µl reaction which was composed of a fix
concentration of SIP470 and varying concentrations of SABP2 was made. Results show a
reduction in the binding affinity of SIP470 in the presence of SABP2 (Figure 39)
-0.5
0
0.5
1
1.5
2
2.5
3
3.5
1 5 10 15 20 25
∆ F
luo
resc
ence
TNS (uM)

81
Figure 40: Effect of SABP2 on the binding affinity of SIP470 to TNS. Recombinant SABP2 and
SIP470 were incubated together and used for TNS assay. Presence of SABP2 leads to a reduction
in TNS fluorescence in the presence of SIP470
0
1
2
3
4
5
6
SBIP470 SABP2
(500nM)
SABP2
(1000nM)
SABP2
(2000nM)
SABP2
(500uM)
+ SIP470
SABP2
(1000uM)
+SIP470
SABP2
(2000uM)
+ SIP470
TNS
Flo
ure
sce
nce

82
CHAPTER 4
DISCUSSION
Salicylic acid (SA) plays an important role in mediating plant defense responses to both
biotic and abiotic stress. Plants respond to pathogen attack by producing high amounts of SA
which is converted to methyl salicylate; an important lipid mobile signal in plant resistance (Park
et al. 2007). Methyl salicylate is converted back to SA by the methylesterase activity of salicylic
acid-binding protein 2 (SABP2) to trigger the systemic acquired response (SAR) in plants by
increasing the endogenous level of SA in distal plant tissues (Forouhar et al. 2005). This whole
process leads to the activation of signaling network through the non-expression of pathogenesis
related 1 (NPR1) proteins (Spoel et al. 2003). SA is required for both basal and induced
resistance (SAR) response in plants. RNAi-mediated silencing of tobacco SABP2 renders plants
defective in inducing SAR (Kumar and Klessig 2003). To learn more about this network
involving SABP2, a yeast two-hybrid screening using SABP2 as bait resulted in the
identification of several putative SABP2-interacting proteins (SIPs). SIP470 (SABP2 Interacting
Protein 470) is one of such protein. Bioinformatics analysis of the nucleotide sequence of SIP470
obtained from the yeast-two hybrid screening predicted it to belong to a non-specific Lipid
Transfer Protein 1 subfamily (nsLTP1) (Chapagai 2014). Plant lipid transfer proteins (PLTPs)
are a group of small, soluble, basic and highly conserved proteins primarily responsible for the
shuttling of phospholipids and other fatty acids between cell membranes. A number of studies
reveal that PLTPs play a very important role in the defense against phytopathogens (Maldonado
et al. 2002; Jung et al. 2009), cell signaling, antimicrobial defense, cutin synthesis, and cell wall

83
loosening but these functions have not been well correlated with their in-vitro activity or
structure (Yeats and Rose 2008).
In an attempt to determine if SIP470 also plays a significant role in mediating stress
responses in plants, Arabidopsis T-DNA insertion knockout plants lacking SIP-470 homolog
(LTP12 and LTP2) was identified and used for analysis. Arabidopsis LTP2 and LTP12 are the
most similar proteins to SIP470. Preliminary studies involving these two mutants indicated that
they are both defective in growth phenotype as well as susceptible to pathogens (Chapagai
2014). These preliminary findings ignited further interest towards understanding the following
questions: 1) what role does SIP470 play in the SA-mediated defense pathway? 2) What role
does SIP470 play in biotic and abiotic response in plants? 3) Biochemical characterization of
lipid binding activity of SIP470?. To answer these question, we hypothesized that SIP470 is a
lipid transfer protein that facilitates the transfer of lipid-like signals during biotic and abiotic
stress and thus has a role to play in the biotic and abiotic stress of plants. An attempt to
characterize SIP470 based on its lipid transfer activity was not successful in previous studies
(Chapagai 2014). The main aim of this study was to determine the possible role of SIP470 and its
homolog in Arabidopsis during the abiotic and biotic stress as well as its role in the SA-mediated
response of plants and also characterize SIP470 in its ability to bind to lipids.
In order to characterize SIP470 as a lipid transfer protein as predicted by the
bioinformatics analysis of its coding sequence, a lipid binding assay with minor modifications
using a lipophilic probe 2-p-toluidinonaphthalene-6-sulfonate (TNS) was performed (Buhot et al
2004). Generally, proteins are annotated as a lipid transfer protein by the presence of 8 conserved
cysteine amino acids which is also present in SIP470 but this does not predict its lipid binding
activity because the conserved 8 cysteine motif is not unique to only LTPs and can be found in

84
several other plant proteins like the proteases and amylase inhibitor as well as in other proteins
whose functions are not known (Jose´-Estanyol et al. 2004; Debono et al 2009). To perform the
lipid binding assay, soluble recombinant SIP470 without the signal peptide was overexpressed in
E. coli at 37oC. The recombinant SIP470 protein was then purified using NI-NTA affinity
chromatography which removed a number of unwanted proteins. Purified SIP470 was then
incubated with TNS (see materials and methods). Under experimental conditions, SIP470 binds
to TNS as indicated by the increasing fluorescence as shown in Figure 39. To validate the lipid
binding assay, various concentration of SIP470 (250-1250 nM) were used in an assay with a
fixed concentration of TNS. Increased fluorescence was observed (data not shown) suggesting
that it is the soluble SIP470 that is responsible for the observed fluorescence. This finding
confirms that SIP470 is an LTP. This finding is in line with previous findings which suggests
that family 1 LTPs have a conserved Tyr79 amino acid that is responsible for intrinsic
fluorescence that is observed experimentally and it is normally enhanced upon lipid binding
(Lullien-Pellerin et al. 1999). This finding provides evidence which suggests that SIP470 is a
lipid binding protein.
To examine the relationship between SABP2 and SIP470, we performed a lipid binding
assay in the presence of SABP2. The result from the experiment showed a decrease in the
fluorescence of SIP470 in the presence of SABP2 (Figure 40). SABP2 alone showed no
fluorescence in the presence of TNS. This finding suggests a possible interaction between
SABP2 and SIP470 which affects the ability of SIP470 to bind to TNS. This could provide
another evidence that SIP470 is an SABP2 interacting protein.
To test the possible role of SIP470 in biotic stress, T-DNA insertional knockout mutants
for LTP12 and LTP2 (SIP470 closest homologs in Arabidopsis) were obtained from the

85
Biological Resource Center, OH, USA, and screened (Chapagai 2014). Pathogen growth assay
was performed using these mutants (see methods section). The ltp12 mutants were more
susceptible to virulent pathogens (DC3000) compared to the wild-type Col 0 (figure 30A and
Figure 30B) suggesting that they are defective in basal resistance to pathogens. There wasn’t a
significant difference in the susceptibility of ltp2 mutants to the virulent pathogen (DC3000)
when compared to Col 0 (figure 30C). Collectively, this result suggests that Arabidopsis ltp12
mutant is a positive regulator of basal resistance or plays a role in protecting the plants from
pathogens. To investigate at the molecular level what gene/s might be affected in the knockout
ltp12 mutant plant, we conducted a gene expression studies of plant defense gene (PR1) in the
presence of both virulent pathogens (see methods section). Results showed that the expression of
PR1 genes was delayed in the ltp12 mutant plants but not in the wild-type plants on exposure to
the virulent pathogen (figure 35). This delay in the induction of PR1 gene in ltp12 mutant plants
could be the reason they are more susceptible to the virulent pathogen as compared to the wild-
type plants. To test if SIP470 has a role to play in the systemic acquired resistance (SAR) of
plants, we conducted a study using both ltp12 and ltp2 mutants. Results showed that ltp12 and
ltp2 mutants were not affected in induced resistance (figure 29). Plant defense system is very
complex and does not follow a linear pattern (Katagiri 2004), it involves many players such as
plants hormones such as SA and JA as well as transcriptional factors (Chen 2002). Studies on
Arabidopsis revealed that ltp12 gene is induced upon pathogen attack (Kilian et al. 2007).
Similarly, studies on the gene expression studies of SIP470 shows that it is also expressed upon
viral and bacterial pathogens (Simo and Kumar unpublished). These various data collectively
suggests that SIP470 and its ltp12 homolog are involved in biotic stress signaling involving
innate immunity in plants. This finding has raised the question on what the exact function of

86
ltp12 in plants? Evidence that a lipid-based signal is necessary for plants to adequately fight
against pathogens was revealed through the characterization of several defective lipase-like
proteins (EDS1 and PAD4). Eds1 mutants are compromised in basal resistance which is
mediated by resistance (R) genes. Interestingly, the weakened local resistance of pad4 is also
mediated by same R genes. These genes encode the TIR-NB-LRR-type proteins (Durant 2004).
SABP2 was identified as a lipase whose lipase activity is modulated by salicylic acid (Kumar
and Klessig 2003). Maybe SIP470 and its Arabidopsis homolog ltp12 function in a similar
manner to transfer some lipid signals generated by the lipase activity of SABP2 since they are
interacting proteins.
In order to fully delineate the full functional potential of SIP470, we subjected its
Arabidopsis homolog mutant, ltp12 to abiotic stress. Abiotic stresses in general leads to
excessive production of reactive oxygen species (ROS) such as hydrogen peroxide (H2O2) which
caused extensive tissue damage and also affects photosynthesis (Ciarmiello et al. 2011). Plants
normally respond to these stress by antioxidant mechanisms but the response to these stress can
be impaired by stresses themselves (Allan and Fluhr 2007). Plants use a complex defense system
which involves quite a number of antioxidant stress-related genes that causes a biochemical
change in response to such stress (Ciarmiello et al. 2011). Studies also suggest that ROS requires
additional molecules along this pathway to amplify and transduce defense signals (Ciarmiello et
al. 2011). The ability of plants to respond to abiotic stresses does not follow a linear pathway but
involves a very complex integrated circuits involving many other pathways to coordinate a
specific response to a given stimulus (Dombrowski 2009). Studies also suggest that there is a
similar mechanism by which plants of response to various abiotic stressors (Ciarmiello et al.
2011) because many drought-inducible genes are also induced by exposure to salt stress and cold
87
stress. Exposure of plants to high salinity (NaCl) creates an ionic stress in addition of disturbing
the water balance. Accumulation of salt can affect plasma membrane lipids in the plant cell (Fujii
and Zhu 2009). Since various abiotic stressors lead to the induction of a common signaling
pathway for abiotic stress, we used different abiotic stressors to study the possible role of
Arabidopsis LTP12 gene in abiotic stress response using ltp12 mutants. Germinated seedlings
(on MS media) were transferred to a half strength MS media with various concentration of NaCl,
ABA, and H2O2. At 50mM NaCl, both wild type and ltp12 mutant did not show much effect
(figure 31B). At 150mM NaCl, both ltp12 mutants were affected, but clearly, ltp12 mutant
showing a more extensive bleaching of its leaves (figure 31C). At 300mM, both ltp12 and col 0
showed similar bleaching effect (figure 31D).
In the presence of 3mM H2O2, several ltp12 mutant plants showed bleaching of their
leaves but no bleaching effect was noticed in Col 0 plants (figure 32).
Similarly, 20µM ABA had almost the same effect observed in 3mM H2O2 (figure 33).
There is, however, a need to repeat this experiment with varying concentration of ABA and H2O2
in order to possibly observe a clear phenotypic effect. We also tested the effect of drought on the
survival of ltp12 mutants. Results revealed that ltp12 mutants failed to recover after prolong
drought but col 0 plants were able to survive (figure 34). Together, this result correlates with
several findings that suggest that LTPs are involved in plants response to drought, salt stress and
low temperature (Hughes tor-Toro 1992; Molina and Garcia-Olmedo 1993; Trevino and
O’ onnell 1998). Arabidopsis ltp3 has been reported to be induced during abiotic stress (Seo et
al. 2011). The ability of LTPs to be involved in abiotic stress could be linked to their
involvement in epicuticular wax layer and cuticle biosynthesis (Clark and Bohnert 1999).

88
The other aspect of this research was focused on generating transgenic tobacco lines that
are silenced in SIP470 expression and overexpressor lines that overexpress SIP470. The
generated transgenic lines will be used for complementation studies. Complementation studies
using Arabidopsis mutant with functional tobacco SIP470 is necessary to determine if the
defective phenotype and the susceptibility to pathogens and abiotic stress could be
complemented. This complementation assay would be another way to characterize SIP470.
RNAi method was employed in generating our transgenic line that is silenced in the expression
of SIP470. Analysis of various independent transgenic lines shows a successful silencing of
SIP470 (Figure 27).
Transgenic lines that are overexpressing SIP470 were generated using an inducible
system. Generating overexpressor lines was accomplished by cloning the full-length SIP470 into
the pER8 vector. Successful clones in pER8 were transiently expressed in Nicotiana
benthamiana plant (figure 26). Plants normally tend to suppress the expression of foreign lethal
proteins, HcPro is a silencing suppressor that helps for successful expression of foreign proteins
in plants. From our results (figure 26) it is clear that expression of SIP470 wasn’t suppressed in
the absence of HcPro. However, transgenic lines for overexpression needs to be screened for an
initial trial to screen plants wasn’t successful (figure 28)

89
Future Directions
A significant effort has been put to understand the functional role of SIP470 in plants by
using its closest homologs (ltp12 and ltp2) in Arabidopsis. So far, we have established that
SIP470 homolog, ltp12 mutants are defective in growth phenotype (Chapagai 2014), defective in
basal resistance and affected by abiotic stress. We have also established that SIP470 is a lipid
transfer protein by its ability to bind to TNS in vitro. We also successfully generated transgenic
tobacco plants that are silenced in SIP470 and homologs of SIP470 as well as an inducible
overexpression line.
To further study the function of SIP470 in plants defense signaling, the generated
transgenic plants (silenced and overexpression) should be used for complementation studies to
determine if the defect in growth phenotype, as well as susceptibility to pathogens, can be
complimented. Similarly, the nature of SABP2 and SIP470 interaction should be pursued to
determine they work antagonistically or synergistically in terms of their gene regulation during
biotic or abiotic stress. Results from the aforementioned experiments will help enhance our
understanding of the functional role of SIP470 in plants.

90
REFERENCES
Allan AC, Fluhr R. 2007. Ozone and Reactive Oxygen Species. Encyclopedia of Life Sciences,
DOI: 10.1038/npg.els.0001299
Asselbergh B, Curvers K, França SC, Audenaert K, Vuylsteke M, Van Breusegem F, Höfte M.
2007. Resistance to Botrytis cinerea in sitiens, an abscisic acid-deficient tomato mutant,
involves timely production of hydrogen peroxide and cell wall modifications in the
epidermis. Plant Physiology. 144(4):1863-1877.
Atkinson NJ, Urwin PE. 2012. The interaction of plant biotic and abiotic stresses: from genes to
the field. Journal of experimental botany. 63(10):3523-3543.
Azadi H, Ghanian M, Ghoochani OM, Rafiaani P, Taning CN, Hajivand RY, Dogot T. 2015.
Genetically Modified Crops: Towards Agricultural Growth, Agricultural Development, or
Agricultural Sustainability?.Food Reviews International. 31(3):195-221.
Bagal UR, Leebens-Mack JH, Lorenz WW, Dean JFD. 2012. The phenylalanine ammonia lyase
(PAL) gene family shows a gymnosperm-specific lineage. BMC Genomics 13:1-9.
Bari R, Jones JD. 2009. Role of plant hormones in plant defence responses. Plant molecular
biology. 69(4):473-488
Bertil D. 2006. Advanced information: RNA interference. The Nobel Prize in Physiology or
Medicine.
Bilgin DD, Zavala JA, Zhu JIN, Clough SJ, Ort DR, DeLUCIA EVAN. 2010. Biotic stress
globally downregulates photosynthesis genes. Plant, cell & environment. 33(10):1597-
1613.
Bleecker AB, Kende H. 2000. Ethylene: a gaseous signal molecule in plants. Annual review of
cell and developmental biology. 16(1):1-18.
Blein JP, Coutos-Thévenot P, Marion D, Ponchet M. 2002. From elicitins to lipid-transfer
proteins: a new insight in cell signaling involved in plant defence mechanisms. Trends in
plant science. 7(7):293-296.
Block A, Li G, Fu ZQ, Alfano JR. 2008. Phytopathogen type III effector weaponry and their plant
targets. Current opinion in plant biology. 11(4): 396-403.
Broekaert WF, Delauré SL, De Bolle MF, Cammue BP. 2006. The role of ethylene in host-
pathogen interactions. Annu. Rev. Phytopathol. 44:393-416.
Buhot N, Gomes E, Milat ML, Ponchet M, Marion D, Lequeu J, Delrot S, Coutos-Thevenot P,
Blein JP. 2004. Modulation of the biological activity of a tobacco LTP1 by lipid
complexation. Mol. Biol. Cell 15: 5047–5052

91
Cammue BPA, Thevissen K, Hendriks M, Eggermont K, Goderis IJ, Proost P, Broekaert WF.
1995. A potent antimicrobial protein from onion seeds showing sequence homology to
plant lipid transfer proteins. Plant Physiology. 109(2):445-455.
Chapagai DP. 2014. Biochemical Characterization of SBIP-470 and its role in SA-mediated
Signaling in Plants. Electronic Theses and Dissertations. Paper 2428.
Charvolin D, Douliez JP, Marion D, Cohen-Addad C, Pebay-Peyroula E. 1999. The crystal
structure of a wheat nonspecific lipid transfer protein (ns-LTP1) complexed with two
molecules of phospholipid at 2.1 Å resolution. Eur. J. Biochem. 264:562–568.
Chaturvedi R, Krothapalli K, Makandar R, Nandi A, Sparks AA, Roth MR, Shah J. 2008. Plastid
ω3‐fatty acid desaturase‐dependent accumulation of a systemic acquired resistance
inducing activity in petiole exudates of Arabidopsis thaliana is independent of jasmonic
acid.The Plant Journal. 54(1):106-117.
Chen Z, Ricigliano JW, Klessig DF. 1993. Purification and characterization of a soluble salicylic
acid-binding protein from tobacco.Proceedings of the National Academy of Sciences.
90(20):9533-9537.
Cheng CS, Samuel D, Liu YJ, Shyu JC, Lai SM, Lin KF, Lyu PC. 2004. Binding mechanism of
nonspecific lipid transfer proteins and their role in plant defense. Biochemistry 43:13628–
13636.
Ciarmiello LF, Woodrow P, Fuggi A, Pontecorvo G, Carillo P. 2011. Plant genes for abiotic
stress. Abiotic Stress in Plants–Mechanisms and Adaptations.
Clark AM, Bohnert HJ. 1999. Cell-specific expression of genes of the lipid transfer protein
family from Arabidopsis thaliana. Plant and Cell Physiology. 40(1):69-76
Dao TTH, Linthorst HJM, Verpoorte R. 2011. Chalcone synthase and its functions in plant
resistance. Phytochem. Rev. 10:397–412.
DeBono A, Yeats TH, Rose JK, Bird D, Jetter R, Kunst L,Samuels L. 2009. Arabidopsis LTPG
is a glycosylphosphatidylinositol-anchored lipid transfer protein required for export of
lipids to the plant surface. The Plant Cell, 21(4):1230-1238.
Dempsey DMA, Vlot AC, Wildermuth MC, Klessig DF. 2011. Salicylic acid biosynthesis and
metabolism. The Arabidopsis Book. Pp0156.
Dordas C. 2009. Role of nutrients in controlling plant diseases in sustainable agriculture: a review.
In Sustainable agriculture. Pp443-460. Springer Netherlands.
Dodds PN, Rathjen JP. 2010. Plant immunity: Towards an integrated view of plant-pathogen
interactions. Nature Reviews. Genetics 11(8):539-548.
Dombrowski JE. 2003. Salt Stress Activation of Wound-Related Genes in Tomato Plants. Plant
Physiology, 132:2098-2107

92
Durner J, Klessig DF. 1995. Inhibition of ascorbate peroxidase by salicylic acid and 2, 6-
dichloroisonicotinic acid, two inducers of plant defense responses. Proceedings of the
National Academy of Sciences 92(24):11312-11316.
Durrant WE, Dong X. 2004. Systemic acquired resistance. Annu. Rev. Phytopathol. 42:185-209.
Ellis C, Turner JG. 2001. The Arabidopsis mutant cev1 has constitutively active jasmonate and
ethylene signal pathways and enhanced resistance to pathogens. The Plant
Cell. 13(5):1025-1033.
Emmert EA B, Handelsman J. 1999. Biocontrol of plant disease: A (gram-) positive perspective.
FEMS Microbiology Letters. 171(1):1-9
Eulgem T. 2005. Regulation of the Arabidopsis defense transcriptome.Trends in plant
science. 10(2): 71-78
Eulgem T, Somssich IE. 2007. Networks of WRKY transcription factors in defense
signaling. Current opinion in plant biology. 10(4):366-371.
Felix G, Duran JD, Volko S, Boller T. 1999. Plants have a sensitive perception system for the
most conserved domain of bacterial flagellin. Plant J. 18:265–276.
Forouhar F, Yang Y, Kumar D, Chen Y, Fridman E, Park SW, Klessig DF. 2005. Structural and
biochemical studies identify tobacco SABP2 as a methyl salicylate esterase and implicate
it in plant innate immunity. Proceedings of the National Academy of Sciences of the
United States of America. 102(5):1773-1778
Freeman BC, Beattie GA. 2008. An Overview of Plant Defenses against Pathogens and
Herbivores. The Plant Health Instructor
Fujii H, Zhu JK. 2009. An autophosphorylation site of the protein kinase SOS2 is important for
salt tolerance in Arabidopsis. Mol. Plant, 2, 183–190
García-Olmedo F, Molina A, Segura A, Moreno M. 1995. The defensive role of nonspecific
lipid-transfer proteins in plants. Trends in microbiology. 3(2):72-74.
García-Olmedo F, Molina A, Segura A, Moreno M. 1995. The defensive role of nonspecific
lipid-transfer proteins in plants. Trends in microbiology. 3(2):72-74.
Göhre V, Robatzek S. 2008. Breaking the barriers: microbial effector molecules subvert plant
immunity. Annu. Rev. Phytopathol. 46:189-215.
Grant M, Chris L. 2006. Systemic immunity. Current opinion in plant biology. 9(4): 414-420.
Guo L, Yang H, Zhang X, Yang S. 2013. Lipid transfer protein 3 as a target of MYB96 mediates
freezing and drought stress in Arabidopsis.Journal of experimental botany. 64(6):1755-
1767.

93
Halim VA, Vess A, Scheel D, Rosahl S. 2006. The role of salicylic acid and jasmonic acid in
pathogen defence. Plant Biology. 8(3):307-313.
Hoh F, Pons JL, Gautier MF, de Lamotte F, Dumas C. 2005. Structure of a liganded type 2
nonspecific lipid-transfer protein from wheat and the molecular basis of lipid binding. Acta
Crystallogr. D Biol. Crystallogr. 61:397–406.
Hollenbach B, Schreiber L, Hartung W, Dietz KJ. 1997. Cadmium leads to stimulated expression
of the lipid transfer protein genes in barley: Implications for the involvement of lipid
transfer proteins in wax assembly. Planta. 203:9–19.
Howe GA, Jander G. 2008. Plant immunity to insect herbivores.Annu. Rev. Plant Biol. 59:41-66.
Huang J, Cardoza YJ, Schmelz EA, Raina R, Engelberth J, Tumlinson JH. 2003. Differential
volatile emissions and salicylic acid levels from tobacco plants in response to different
strains of Pseudomonas syringae. Planta, 217(5):767-775.
Huang MD, Chen TLL, Huang AHC. 2013. Abundant type III lipid transfer proteins in
Arabidopsis tapetum are secreted to the locule and become a constituent of the pollen
exine. Plant Physiol. 163:1218–1229.
Hughes MA, Dunn MA, Pearce RS, White AJ, Zhang L. 1992. An abscisic‐acid‐responsive, low
temperature barley gene has homology with a maize phospholipid transfer protein. Plant,
Cell & Environment. 15(7):861-865.
Jones JD, Dangl JL. 2006. The plant immune system. Nature. 444(7117):323-329.
Kader JC. 1996. Lipid-transfer proteins in plants. Annual review of plant biology, 47(1):627-
654.
Katagiri F. 2004. A global view of defense gene expression regulation–a highly interconnected
signaling network. Current opinion in plant biology.7(5):506-511.
Katsir L, Schilmiller AL, Staswick PE, He SY, Howe GA. 2008. COI1 is a critical component of
a receptor for jasmonate and the bacterial virulence factor coronatine. Proceedings of the
National Academy of Sciences. 105(19):7100-7105.
Kiefer IW., Slusarenko, AJ. 2003. The pattern of systemic acquired resistance induction within
the Arabidopsis rosette in relation to the pattern of translocation. Plant
physiology. 132(2):840-847.
Kilian J, Whitehead D, Horak J, Wanke D, Weinl S, Batistic OD, Angelo C, Bornberg BE, Kudla
J, Harter K. 2007. The AtGenExpress global stress expression data set: protocols,
evaluation and model data analysis of UV-B light, drought and cold stress responses. Plant
J. 50:347–363.
Klessig DF. 2016. Newly identified targets of aspirin and its primary metabolite, salicylic
acid. DNA and cell biology, 35(4):163-166.
94
Koo YJ, Kim MA, Kim EH, Song JT, Jung C, Moon JK, Lee JS. 2007. Overexpression of
salicylic acid carboxyl methyltransferase reduces salicylic acid-mediated pathogen
resistance in Arabidopsis thaliana. Plant molecular biology. 64(1-2):1-15.
Koornneef A, Pieterse CM. 2008. Cross talk in defense signaling. Plant physiology. 146(3):839-
844.
Kumar D, Klessig DF. 2003. High-affinity salicylic acid-binding protein 2 is required for plant
innate immunity and has salicylic acid-stimulated lipase activity. Proceedings of the
National Academy of Sciences. 100(26):16101-16106.
Kumar D, Gustafsson C, Klessig DF. 2006. Validation of RNAi silencing specificity using
synthetic genes: salicylic acid‐binding protein 2 is required for innate immunity in
plants. The Plant Journal. 45(5):863-868
Kumar, D, Haq I, Chapagai, D, Tripathi, D, Donald, D, Hossain, M, and Devaiah, S. 201)
“Hormonal Signaling: urrent Perspective on the Role of Salicylic Acid and its
Derivatives in Plants”. Recent Advances in Phytochemistry, Springer, ISBN: 978-3-319-
20397-3.
Kumar, D, Chapagai, D., Dean, P, and Mackenzie, D. 2014 “Biotic and Abiotic Stress Signaling
Mediated by Salicylic Acid.” Elucidation of Abiotic Stress Signaling in Plants, pp 329-
346. Springer, New York.
Loake G, Grant M. 2007. Salicylic acid in plant defence-the players and protagonists. Curr.
Opin. Plant Biol. 10:466–472.
Lorenzo O, Chico JM, Sánchez-Serrano JJ, Solano R. 2004. JASMONATE-INSENSITIVE1
encodes an MYC transcription factor essential to discriminate between different
jasmonate-regulated defense responses in Arabidopsis. The Plant Cell. 16(7):1938-1950.
Lullien-Pellerin V, Devaux C, Ihorai T, Marion D, Pahin V, Joudrier P, Gautier, MF. 1999.
Production in Escherichia coli and site-directed mutagenesis of a 9-kDa nonspecific lipid
transfer protein from wheat. Eur. J. Biochem. 260:861–868.
Malamy J, Carr JP, Klessig DF, Raskin I. 1990. Salicylic acid: a likely endogenous signal in the
resistance response of tobacco to viral infection. Science. 250(4983):1002-1004.
Maloy OC. 2005. Plant disease management. The Plant Health Instructor 10.
Matzinger P. 2002. The danger model: a renewed sense of self. Science. 296(5566):301-305.
Mohr PG, Cahill DM. 2007. Suppression by ABA of salicylic acid and lignin accumulation and
the expression of multiple genes in Arabidopsis infected with Pseudomonas syringae pv.
tomato. Functional and Integrative Genomics 7, 181–191.

95
Molina A, Segura A, Garcia-Olmedo F. 1993. Lipid transfer proteins (nsLTPs) from barley and
maize leaves are potent inhibitors of bacterial and fungal plant pathogens. FEBS Lett.
316:119–122.
Montgomery M K., Xu S., Fire A. 1998. RNA as a target of double-stranded RNA-mediated
genetic interference in Caenorhabditis elegans.Proceedings of the National Academy of
Sciences. 95(26):15502-15507.
Nandi A, Krothapalli K, Buseman CM, Li M, Welti R, Enyedi A, Shah J. 2003. Arabidopsis sfd
mutants affect plastidic lipid composition and suppress dwarfing, cell death, and the
enhanced disease resistance phenotypes resulting from the deficiency of a fatty acid
desaturase. The Plant Cell, 15(10):2383-2398.
Nemeth M, Janda T, Horvath E, Paldi E, Szalai G. 2002. Exogenous salicylic acid increases
polyamine content but may decrease drought tolerance in maize. Plant Science 162, 569–
574
Ollis DL, heah E, ygler M, Dijkstra B, Frolow F, Franken SM, Sussman JL. 1992. The α/β
hydrolase fold. Protein engineering. 5(3):197-211
Nieuwland J, Feron R, Huisman BA, Fasolino A, Hilbers CW, Derksen J, MarianiC. 2005. Lipid
transfer proteins enhance cell wall extension in tobacco. Plant Cell. 17:2009–2019.
Park SY, Lord EM. 2003. Expression studies of SCA in lily and confirmation of its role in pollen
tube adhesion. Plant Mol. Biol. 51:183–189.
Park SW, Kaimoyo E, Kumar D, Mosher S, Klessig DF. 2007. Methyl salicylate is a critical mobile
signal for plant systemic acquired resistance. Science, 318(5847):113-116
Pieterse CM, Leon-Reyes A, Van der Ent S, Van Wees SC. 2009. Networking by small-molecule
hormones in plant immunity. Nature chemical biology. 5(5):308-316.
Pieterse CM, Leon-Reyes A, Van der Ent S, Van Wees SC. 2009. Networking by small-molecule
hormones in plant immunity. Nature chemical biology, 5(5):308-316.
Qi Y, Tsuda K, Glazebrook J, Katagiri F. 2011. Physical association of pattern‐triggered immunity
(PTI) and effector‐triggered immunity (ETI) immune receptors in Arabidopsis. Molecular
plant pathology, 12(7):702-708
Regente MC, Giudici AM, Villalain J, de la Canal L. 2005. The cytotoxic properties of a plant
lipid transfer protein involve membrane permeabilization of target cells. Lett. Appl.
Microbiol. 40: 183–189
Rosso MG, Li Y, Strizhov N, Reiss B, Dekker K, Weisshaar B. 2003. An Arabidopsis thaliana
T-DNA mutagenized population (GABI-Kat) for flanking sequence tag-based reverse
genetics. Plant Mol. Biol. 53:247–259.

96
Segura A, Moreno M, Garcia-Olmedo F. 1993. Purification and antipathogenic activity of lipid
transfer proteins (LTPs) from the leaves of Arabidopsis and spinach. FEBS Lett. 332: 243–
246
Seo PJ, Lee SB, Suh MC, Park MJ, Go YS, Park CM. 2011. The MYB96 transcription factor
regulates cuticular wax biosynthesis under drought conditions in Arabidopsis. The Plant
Cell. 23(3):1138-1152.
Shah, J. 2005. Lipids, lipases, and lipid-modifying enzymes in plant disease resistance. Annu.
Rev. Phytopathol. 43:229-260.
Singh, RP. et al. in Advances in Agronomy (ed. Sparks, D. L.) Vol. 98 Ch. 5, 271–309 (Elsevier,
London, 2008).
Slaymaker, DH, Navarre, DA, Clark, D, Del Pozo, O, Martin, GB, & Klessig, DF. 2002. The
tobacco salicylic acid-binding protein 3 (SABP3) is the chloroplast carbonic anhydrase,
which exhibits antioxidant activity and plays a role in the hypersensitive defense
response. Proceedings of the National Academy of Sciences, 99(18), 11640-11645.
Spoel SH, Dong X. 2008. Making sense of hormone crosstalk during plant immune
responses. Cell Host & Microbe. 3(6):348-351.
Staswick PE, Tiryaki I. 2004. The oxylipin signal jasmonic acid is activated by an enzyme that
conjugates it to isoleucine in Arabidopsis. The Plant Cell 16(8):2117-2127.
Suh MC, Samuels AL, Jetter R, Kunst L, Pollard M, Ohlrogge J, Beisson F. 2005. Cuticular lipid
composition, surface structure, and gene expression in Arabidopsis stem epidermis. Plant
Physiol. 139:1649–1665.
Tassin-Moindrot S, Caille A, Douliez JP, Marion D, Vovelle F. 2000. The wide binding
properties of a wheat nonspecific lipid transfer protein. Solution structure of a complex
with prostaglandin B2. Eur. J. Biochem. 267:1117–1124.
Thines B, Katsir L, Melotto M, Niu Y, Mandaokar A, Liu G, Browse, J. 2007. JAZ repressor
proteins are targets of the SCFCOI1 complex during jasmonate
signalling. Nature, 448(7154):661-665.
Thoma S, Hecht U, Kippers A, Botella J, De Vries S, Somerville C. 1994. Tissue-specific
expression of a gene encoding a cell wall-localized lipid transfer protein from
Arabidopsis. Plant Physiology, 105(1):35-45.
Expression of a gene encoding a cell wall-localized lipid transfer protein from Arabidopsis. Plant
Physiol. 105:35–45.
Torres-Schumann S, Godoy JA, Pintor-Toro JA. 1992. A probable lipid transfer protein gene is
induced by NaCl in stems of tomato plants. Plant molecular biology. 18(4):749-757.

97
Treviño MB, O'Connell MA. 1998. Three Drought-Responsive Members of the Nonspecific
Lipid-Transfer Protein Gene Family in Lycopersicon pennelliiShow Different
Developmental Patterns of Expression. Plant Physiology. 116(4):1461-1468.
Truman W, Bennett MH, Kubigsteltig I, Turnbull C, Grant M. 2007. Arabidopsis systemic
immunity uses conserved defense signaling pathways and is mediated by
jasmonates. Proceedings of the national academy of sciences. 104(3):1075-1080.
Van Loon LC, Van Strien EA. 1999. The families of pathogenesis-related proteins, their
activities, and comparative analysis of PR-1 type proteins. Physiol. Mol. Plant Pathol. 55:
85–97.
Van Loon LC, Geraats BPJ, Linthorst HJM. 2006 Ethylene as a modulator of disease resistance in
plants. Trends Plant Sci. 11:184–191.
Wasternack C, Parthier B. 1997. Jasmonate-signalled plant gene expression. Trends in Plant
Science, 2(8):02-307.
White AJ, Dunn MA, Brown K, Hughes M.A. 1994. Comparative analysis of genomic sequence
and expression of a lipid transfer protein gene family in winter barley. Journal of
Experimental Botany, 45(12):1885-1892.
Wildermuth MC, Dewdney J, Wu G, Ausubel FM. 2001. Isochorismate synthase is required to
synthesize salicylic acid for plant defence. Nature, 414(6863), 562-565.
Xie DX, Feys BF, James S, Nieto-Rostro M, Turner JG. 1998. COI1: an Arabidopsis gene
required for jasmonate-regulated defense and fertility. Science, 280(5366):1091-1094.
Yasuda M, Ishikawa A, Jikumaru Y, Seki M, Umezawa T, Asami T, Nakashita H. 2008.
Antagonistic interaction between systemic acquired resistance and the abscisic acid–
mediated abiotic stress response in Arabidopsis. The Plant Cell. 20(6):1678-1692.
Yeats TH, Rose JK. 2008. The biochemistry and biology of extracellular plant lipid‐transfer
proteins (LTPs). Protein Science, 17(2):191-198.
Zeevaart JAD, Creelman RA. 1988. Metabolism and physiology of abscisic acid. Annual review
of plant physiology and plant molecular biology. 39(1):439-473.
Zhou ML, Ma JT, Pang JF, Zhang ZL, Tang YX, Wu YM. 2015. Regulation of plant stress
response by dehydration responsive element binding (DREB) transcription factors. African
Journal of Biotechnology. 9(54):9255-9269
Zhu JK. 2000. Genetic analysis of plant salt tolerance using Arabidopsis. Plant
Physiology. 124(3): 941-948.
Zhu JK. 2002. Salt and drought stress signal transduction in plants.Annual review of plant
biology. 53:247.

98
Zipfel C, Felix G. 2005. Plants and animals: a different taste for microbes? Current opinion in
plant biology. 8(4):353-360.
Zuo J, Niu QW, Chua NH. 2000. An estrogen receptor‐based transactivator XVE mediates
highly inducible gene expression in transgenic plants. The Plant Journal. 24(2):265-273

99
APPENDICES
APPENDIX A- Abbreviations
ABA- Abscisic Acid
APS – Ammonium Persulfate
COI1- Coronatine Insensitive 1
Col-0 – Columbia 0
EIN3 - Ethylene Insensitive 3
ET – Ethylene
EtBr – Ethidium Bromide
ETI – Effector Triggered Susceptibility
ETS – Effector Triggered Susceptibility
ICS – Isochorismate Synthase
IPTG - Isopropyl β-D-1-Thiogalactopyranoside
JA- Jasmonic Acid
JAR1 – Jasmonate Resistance 1
KDa – Kilo Dalton
LMW – Low Molecular Weight
LTP12 – Lipid Transfer Protein 12
LTP2 – Lipid Transfer Protein 2

100
MeJA- Methyl Jasmonate
MeSA – Methyl Salicylate
NB-LRR – Nucleotide Binding Leucine Rich Repeat
Ni-NTA – Nickel-Nitrilotriacetic Acid
nsLTP1 – Non-Specific Lipid Transfer Protein 1
PAL – Phenylalanine Ammonia-Lyase
PAMPS – Pathogen Associated Molecular Pattern
PCR – Polymerase Chain Reaction
PLTP – Plant Lipid Transfer Protein
PR- Pathogenesis-Related
PR1- Pathogenesis-Related Protein 1
PTI – PAMP-Triggered Immunity
RecSIP470 – Recombinant SABP2 Interacting Protein 470
RNAi – RNA Interference
SA – Salicylic Acid
SABP2 - Salicylic Acid Binding Protein 2
SAG – Salicylic Acid beta-Glucoside
SAMT –Salicylic Acid Methyl Transferase

101
SAR – Systemic Acquired Resistance
SDS – Sodium Dodecyl Sulfate
SDS-PAGE - Sodium Dodecyl Sulfate Polyacrylamide Gel Electrophoresis
SFD – Suppressor of Fatty Acid Desaturase LTPs
SIP – SABP2 Interacting Protein
SIP470 - SABP2 Interacting Protein-470
SOS – Salt Overly Sensitive gene
ß-ME - βeta mercaptoethanol
T-DNA - Transfer DNA
TNS - 2-p-toluidino naphthalene-6-sulfonate
μg – Microgram
μl – Microlitre
ng/l – Nanogram/Microliter

102
APPENDIX B – Buffers and Reagents
1.5 % Agarose Gel
0.75 g of Agarose
50 ml of 1x TAE Buffer
Add the agarose in TAE buffer and heat in the microwave for 60 seconds to dissolve.
Cool the mixture by placing it in a 50oC water bath
Add 2.5 μl (10 mg/mL) ethidium bromide before pouring in gel casting tray.
0.1% DEPC (Diethyl Pyrocarbonate) Treated Water (0.1 L)
0.1 ml of Diethyl pyrocarbonate was added to 100ml of milli-Q water
Mixture was incubated at 37°C for ~12 hours
Then autoclave at 121°C and 15 psi atmospheric pressure for 20 minutes
20% APS (Ammonium Persulfate) (0.5ml)
0.1 g of Ammonium persulfate
0.5 ml of water
Ni-NTA Binding Buffer (1 L)
6.89g of sodium phosphate monobasic (M.W: 137.99 g/mol), final concentration 50 mM
17.53g of Sodium chloride (M.W: 58.44 g/mol), final concentration 300 mM
0.6808g of Imidazole (M.W: 68.08), final concentration10 mM
103
Ni-NTA Elution Buffer (1 L)
6.896g sodium phosphate monobasic (M.W: 137.99 g/mol), final concentration 50mM
17.53g sodium chloride (M.W: 58.44 g/mol), final concentration 300 mM
17.02g imidazole (M.W: 68.08), final concentration 250 mM
Western Blotting Blocking Buffer (100 ml)
100 ml 1X PBS buffer
1g Fat-free Milk Powder
3g BSA
10x Western Blotting Transfer Buffer 1L
30.3g tris base (M.W: 121.1 g/mol), final concentration 125 mM
72.06g glycine (M.W: 75.07 g/mol), final concentration 960 mM
Dissolve in 500 ml distilled water and adjust to 1000 ml.
1x Western Blotting Transfer Buffer 1L
100 ml 10x western blotting transfer buffer
100 ml 100% methanol
800 ml cold distilled water
TE Buffer 1L
1.576g tris-HCl (M.W: 157.60 g/mol), final concentration 10 mM/L
Adjust pH to 8
Adjust volume to 1 liter with water
2x SDS-PAGE Loading Dye (100 mL)
10 mL of 1M Tris-Cl, pH 6.8, final concentration 100mM
0.4g SDS, final concentration 0.4% (v/v)
104
20 ml of glycerol, final concentration 20% (v/v)
0.2 g bromophenol blue, final concentration 0.2% (v/v)
Add 5 mL of βME before use
10 mM Magnesium Chloride (1 L)
Magnesium Chloride = 0.952 g
Adjust the volume to 1 liter with distilled water
Ni-NTA Binding Buffer (1 L)
6.89 g sodium phosphate monobasic (M.W: 137.99 g/mol), final concentration 50mM/L
17.53 g sodium chloride (M.W: 58.44 g/mol), final concentration 300 mM/L
Imidazole (M.W: 68.08) = 0.6808, final concentration 10 mM/L
Ni-NTA Elution Buffer (1 L)
6.896g sodium phosphate monobasic (M.W: 137.99 g/mol), final concentration 50 mM/L
17.53g sodium chloride (M.W: 58.44 g/mol), final concentration 300 mM/L
17.02 g imidazole (M.W: 68.08), final concentration 250 mM/L
LB Medium (1 L)
25g LB Broth
Make up to 1000 ml with distilled water
Sterilize by autoclaving for 15 minutes on liquid cycle
Store at 4oC temperature
Lipid Binding Assay Buffer 100ml
175 mM mannitol
0.5 mM K2SO4
0.5 mM CaCl2,
105
5 mM MES,
Adjust pH to 7.0
SOC MEDIA 100ml
80ml LB media
Add 20ml of 1M glucose
Autoclave and store at 4oC
STE Buffer 50ml
100mM NaCl
10mM Tris-HCl,
Adjust to pH 8
1mM EDTA
STET solution 50ml
10mM Tris-HCl
1mM EDTA
100mM NaCl
5% Triton X-100
Half Strength MS media
2.155g/L of MS salt
Add 1% sucrose
Adjust pH to 5.9 using 1M KOH
Add 0.9% Agar.
Autoclave

106
1X PBS (1 L)
100 ml 10X PBS
900 ml distilled water
1X PBS Plus 3% Tween Twenty (1 L)
100 ml 10X PBS
870 ml distilled water
30 ml tween 20
Shoot Inducing Media (SIM) 1L
4.31g of MS salts
Add 3% Sucrose
Adjust pH to 5.9 with 1M KOH
Add 0.9% Agar
Add Vitamins
+0.1mg/litre alpha NAA
+1mg/litre BAP
+1ml 1000X vitamin solution
SIM with antibiotics
To SIM media, add:
Carbenicillin 250mg/litre
Kanamycin 300mg/litre
Cefatoxim 100mg/ml

107
Root Inducing Media (RIM)
4.31g of MS salts
Add 1% Sucrose
Adjust pH to 5.9 with 1M KOH
Add 0.9% Agar
Add Vitamins
+0.1mg/litre alpha NAA
+1mg/litre BAP
+1ml 1000X vitamin solution

108
APPENDIX C – Sequence Analysis for Silencing and Homolog Silencing
Sequence Analysis for Silencing SIP470

109
>mRNA_102807
ATGGAAATGGTAGGCAAGATTGCATGTTTCGTGGTTTTGTGCATGGTGGTGGTTGCACCTCATGCAGAGGCACT
AAGCTGCGGCCAGGTTCAGTCTGGCCTGGCTCCTTGCCTCCCTTATCTACAGGGCCGTGGCCCTCTCGGAGGCT
GTTGTGGTGGTGTTAAAGGTCTGTTAGGTGCAGCCAAGTCCCCAGCTGACCGCAAGACTGCATGCACTTGCCTG
AAATCGGCCGCTAATGCTATTAAGGGTATTGACATGGGCAAAGCCGCTGGACTCCCTAGTGCTTGTGGCGTTAA
CATTCCATACAAGATCAGTCCCTCCACTGATTGCTCCAAGGTCCAGTGA
>mRNA_87105
ATGGAAATGGTAGGTAAGATTGCATGCTTTGTGGTTTTGTGCATGGTGGTGGTTGCACCCCATGCAGAGGCACT
GAGCTGCGGCCAAGTTCAGTCCGGCTTGGCTCCTTGTCTCCCTTATTTGCAGGGCCGCGGCCCTTTGGGGAGCT
GTTGTGGTGGTGTTAAAGGTCTGTTGGGTGCAGCCAAGTCCCCATCTGACCGGAAGACTGCATGCACTTGCCTG
AAATCGGCTGCTAATGCTATTAAGGGTATTGATATGGGCAAAGCCGCTGGTCTCCCTGGTGCTTGTGGTGTCAA
CATTCCTTACAAGATCAGCCCCTCCACAGACTGCTCTAAGGTCCAGTAA
>mRNA_30771
ATGGAAATGGTTGGCAAGATTGCATATTTCTTGGTTTTGTGCGTGGTGGTGATTGCACCCCATGCCGAGGCACT
GAGTTGTGGCCAGGTTCAGTCTGGCCTGGCTCCTTGCCTCCCTTATCTACAAGGCCGTGGCCCTCTCGGAGGCT
GTTGTGGTGGTGTTAAAGGTCTGTTGGGTGCAGCCAAGTCCCCAGCTGACCGCAAGACTGCATGCACTTGCCTA
AAATCAGCCGCTAATGCTATTAAGGGCATTGATATGGGCAAAGCTGCTGGACTTCCTAGTGCTTGTGGCGTTAA
CATTCCGTACAAGATCAGTCCCTCCACTGACTGCTCTAAGGTCCAGTAA
>mRNA_37999
ATGTCCAATAATTCTCTCTCTATAAAAAACCCTAAGGTCTCACTAGCTTTTGTACACAACACTCAAGGCAATAA
CATTTGTAGTACTATCCCCCTCTACTTTGTCCAAACTACTCTCTATTGTTCTCTAATTTTTCTTTTAAGAATGG
AAATGGTAAGCAAGATTGCATGTTTCGTGGTTTTGTGCATGGTGGTGGTTGCACCCCATGCAGAGGCACTGACC
TGCGGCCAGGTTCAGTCTAGCCTGGCTCCTTGCGTCCCTTATTTGCTGGGCCGCGGCCCTTTGGGGGGTTGTTG
TGGCGGCGTTAAACGTCTGTTGGGTGCTGCTCGCACCCCAGCGGACCGAAAGACTGCATGCAATTGCCTGAAAT
CAGCCGCTAATACTTTTAAGGGCATTGATATGGGCAACGCCGCTCGTCTCCCTGGTACTTGTGGCGTTAACATT
CCCTACAAGATCAGTCCCTCCACTGACTGCTCCAAGGTCCAGTGA
>SIP470
ATGGAAATGGTTGGCAAGATTGCGTGCTTTGTGTTACTTTGCATGGTGGTGGTTGCACCCCATGCAGAGG
CACTGAGCTGCGGCCAGGTTCAGTCTGGCCTGGCTCTTTGCCTCCCTTATCTGCAGAGTCGCGGCCCTCT
AGGGAGGTGTTGTGGCGGCGTTAAAGGTGTGTTGGGTGCTGCCCGGACCCCAGCTGACCGCAAGACTGCA
TGCACTTGCCTGAAATCAGCTGCTTATGCTATTAAGGGTATTAATATGGGCAAAGCCGCTGGACTTCCTA
GTGCTTGTGGCGTTAACATTCCCTACAAGATCAGTCCCTCTACTGACTGCTCCAGGGTCCAGTGA

110
CLUSTAL O(1.2.2) multiple sequence alignment
mRNA_30771_cds CTTTTAAGAATGGAAATGGTAAGCAAGATTGCATGTTTCGTGGTTTTGTGCATGGTGGTG
SIP470 ---------ATGGAAATGGTTGGCAAGATTGCGTGCTTTGTGTTACTTTGCATGGTGGTG
mRNA_37999_cds CTTTTAAGAATGGAAATGGTAAGCAAGATTGCATGTTTCGTGGTTTTGTGCATGGTGGTG
mRNA_102807_cds ---------ATGGAAATGGTAGGCAAGATTGCATGTTTCGTGGTTTTGTGCATGGTGGTG
mRNA_87105_cds ---------ATGGAAATGGTAGGTAAGATTGCATGCTTTGTGGTTTTGTGCATGGTGGTG
***********:.* ********.** ** *** *: * ************
mRNA_30771_cds GTTGCACCCCATGCAGAGGCACTGACCTGCGGCCAGGTTCAGTCTAGCCTGGCTCCTTGC
SIP470 GTTGCACCCCATGCAGAGGCACTGAGCTGCGGCCAGGTTCAGTCTGGCCTGGCTCTTTGC
mRNA_37999_cds GTTGCACCCCATGCAGAGGCACTGACCTGCGGCCAGGTTCAGTCTAGCCTGGCTCCTTGC
mRNA_102807_cds GTTGCACCTCATGCAGAGGCACTAAGCTGCGGCCAGGTTCAGTCTGGCCTGGCTCCTTGC
mRNA_87105_cds GTTGCACCCCATGCAGAGGCACTGAGCTGCGGCCAAGTTCAGTCCGGCTTGGCTCCTTGT
******** **************.* *********.******** .** ****** ***
mRNA_30771_cds GTCCCTTATTTGCTGGGCCGCGGCCCTTTGGGGGGTTGTTGTGGCGGCGTTAAACGTCTG
SIP470 CTCCCTTATCTGCAGAGTCGCGGCCCTCTAGGGAGGTGTTGTGGCGGCGTTAAAGGTGTG
mRNA_37999_cds GTCCCTTATTTGCTGGGCCGCGGCCCTTTGGGGGGTTGTTGTGGCGGCGTTAAACGTCTG
mRNA_102807_cds CTCCCTTATCTACAGGGCCGTGGCCCTCTCGGAGGCTGTTGTGGTGGTGTTAAAGGTCTG
mRNA_87105_cds CTCCCTTATTTGCAGGGCCGCGGCCCTTTGGGGAGCTGTTGTGGTGGTGTTAAAGGTCTG
******** *.*:*.* ** ****** * **..* ******** ** ****** ** **
mRNA_30771_cds TTGGGTGCTGCTCGCACCCCAGCGGACCGAAAGACTGCATGCAATTGCCTGAAATCAGCC
SIP470 TTGGGTGCTGCCCGGACCCCAGCTGACCGCAAGACTGCATGCACTTGCCTGAAATCAGCT
mRNA_37999_cds TTGGGTGCTGCTCGCACCCCAGCGGACCGAAAGACTGCATGCAATTGCCTGAAATCAGCC
mRNA_102807_cds TTAGGTGCAGCCAAGTCCCCAGCTGACCGCAAGACTGCATGCACTTGCCTGAAATCGGCC
mRNA_87105_cds TTGGGTGCAGCCAAGTCCCCATCTGACCGGAAGACTGCATGCACTTGCCTGAAATCGGCT
**.*****:** .. :***** * ***** *************.************.**
mRNA_30771_cds GCTAATACTTTTAAGGGCATTGATATGGGCAACGCCGCTCGTCTCCCTGGTACTTGTGGC
SIP470 GCTTATGCTATTAAGGGTATTAATATGGGCAAAGCCGCTGGACTTCCTAGTGCTTGTGGC
mRNA_37999_cds GCTAATACTTTTAAGGGCATTGATATGGGCAACGCCGCTCGTCTCCCTGGTACTTGTGGC
mRNA_102807_cds GCTAATGCTATTAAGGGTATTGACATGGGCAAAGCCGCTGGACTCCCTAGTGCTTGTGGC
mRNA_87105_cds GCTAATGCTATTAAGGGTATTGATATGGGCAAAGCCGCTGGTCTCCCTGGTGCTTGTGGT
***:**.**:******* ***.* ********.****** *:** ***.**.*******
mRNA_30771_cds GTTAACATTCCCTACAAGATCAGTCCCTCCACTGACTGCTCCAAGGTCCAGTGA
SIP470 GTTAACATTCCCTACAAGATCAGTCCCTCTACTGACTGCTCCAGGGTCCAGTGA
mRNA_37999_cds GTTAACATTCCCTACAAGATCAGTCCCTCCACTGACTGCTCCAAGGTCCAGTGA
mRNA_102807_cds GTTAACATTCCATACAAGATCAGTCCCTCCACTGATTGCTCCAAGGTCCAGTGA
mRNA_87105_cds GTCAACATTCCTTACAAGATCAGCCCCTCCACAGACTGCTCTAAGGTCCAGTAA
** ******** *********** ***** **:** ***** *.********.*
The sequence in red is the unique 60bp sequence used for gene silencing.

111
mRNA_30771_cds CTTTTAAGAATGGAAATGGTAAGCAAGATTGCATGTTTCGTGGTTTTGTGCATGGTGGTG
SIP470 ---------ATGGAAATGGTTGGCAAGATTGCGTGCTTTGTGTTACTTTGCATGGTGGTG
mRNA_37999_cds CTTTTAAGAATGGAAATGGTAAGCAAGATTGCATGTTTCGTGGTTTTGTGCATGGTGGTG
mRNA_102807_cds ---------ATGGAAATGGTAGGCAAGATTGCATGTTTCGTGGTTTTGTGCATGGTGGTG
mRNA_87105_cds ---------ATGGAAATGGTAGGTAAGATTGCATGCTTTGTGGTTTTGTGCATGGTGGTG
***********:.* ********.** ** *** *: * ************
mRNA_30771_cds GTTGCACCCCATGCAGAGGCACTGACCTGCGGCCAGGTTCAGTCTAGCCTGGCTCCTTGC
SIP470 GTTGCACCCCATGCAGAGGCACTGAGCTGCGGCCAGGTTCAGTCTGGCCTGGCTCTTTGC
mRNA_37999_cds GTTGCACCCCATGCAGAGGCACTGACCTGCGGCCAGGTTCAGTCTAGCCTGGCTCCTTGC
mRNA_102807_cds GTTGCACCTCATGCAGAGGCACTAAGCTGCGGCCAGGTTCAGTCTGGCCTGGCTCCTTGC
mRNA_87105_cds GTTGCACCCCATGCAGAGGCACTGAGCTGCGGCCAAGTTCAGTCCGGCTTGGCTCCTTGT
******** **************.* *********.******** .** ****** ***
mRNA_30771_cds GTCCCTTATTTGCTGGGCCGCGGCCCTTTGGGGGGTTGTTGTGGCGGCGTTAAACGTCTG
SIP470 CTCCCTTATCTGCAGAGTCGCGGCCCTCTAGGGAGGTGTTGTGGCGGCGTTAAAGGTGTG
mRNA_37999_cds GTCCCTTATTTGCTGGGCCGCGGCCCTTTGGGGGGTTGTTGTGGCGGCGTTAAACGTCTG
mRNA_102807_cds CTCCCTTATCTACAGGGCCGTGGCCCTCTCGGAGGCTGTTGTGGTGGTGTTAAAGGTCTG
mRNA_87105_cds CTCCCTTATTTGCAGGGCCGCGGCCCTTTGGGGAGCTGTTGTGGTGGTGTTAAAGGTCTG
******** *.*:*.* ** ****** * **..* ******** ** ****** ** **
mRNA_30771_cds TTGGGTGCTGCTCGCACCCCAGCGGACCGAAAGACTGCATGCAATTGCCTGAAATCAGCC
SIP470 TTGGGTGCTGCCCGGACCCCAGCTGACCGCAAGACTGCATGCACTTGCCTGAAATCAGCT
mRNA_37999_cds TTGGGTGCTGCTCGCACCCCAGCGGACCGAAAGACTGCATGCAATTGCCTGAAATCAGCC
mRNA_102807_cds TTAGGTGCAGCCAAGTCCCCAGCTGACCGCAAGACTGCATGCACTTGCCTGAAATCGGCC
mRNA_87105_cds TTGGGTGCAGCCAAGTCCCCATCTGACCGGAAGACTGCATGCACTTGCCTGAAATCGGCT
**.*****:** .. :***** * ***** *************.************.**
mRNA_30771_cds GCTAATACTTTTAAGGGCATTGATATGGGCAACGCCGCTCGTCTCCCTGGTACTTGTGGC
SIP470 GCTTATGCTATTAAGGGTATTAATATGGGCAAAGCCGCTGGACTTCCTAGTGCTTGTGGC
mRNA_37999_cds GCTAATACTTTTAAGGGCATTGATATGGGCAACGCCGCTCGTCTCCCTGGTACTTGTGGC
mRNA_102807_cds GCTAATGCTATTAAGGGTATTGACATGGGCAAAGCCGCTGGACTCCCTAGTGCTTGTGGC
mRNA_87105_cds GCTAATGCTATTAAGGGTATTGATATGGGCAAAGCCGCTGGTCTCCCTGGTGCTTGTGGT
***:**.**:******* ***.* ********.****** *:** ***.**.*******
mRNA_30771_cds GTTAACATTCCCTACAAGATCAGTCCCTCCACTGACTGCTCCAAGGTCCAGTGA
SIP470 GTTAACATTCCCTACAAGATCAGTCCCTCTACTGACTGCTCCAGGGTCCAGTGA
mRNA_37999_cds GTTAACATTCCCTACAAGATCAGTCCCTCCACTGACTGCTCCAAGGTCCAGTGA
mRNA_102807_cds GTTAACATTCCATACAAGATCAGTCCCTCCACTGATTGCTCCAAGGTCCAGTGA
mRNA_87105_cds GTCAACATTCCTTACAAGATCAGCCCCTCCACAGACTGCTCTAAGGTCCAGTAA
** ******** *********** ***** **:** ***** *.********.*
The sequence in red is the unique 141bp sequence used for Homolog silencing.

112
VITA
TIMOTHY NDAGI AUDAM
Education: East Tennessee State University, Johnson City, TN, USA,
MS. Biology, July 2016.
University of Abuja, Abuja, Nigeria,
B.S., Microbiology, 2012.
Professional Experience: Graduate Assistant, East Tennessee State University, Department
of Biological Science, Johnson City, TN, USA, 2014-2016.
Research Assistant (NYSC), Ladoke Akintola University of
Technology, Ogbomoso, Oyo, Nigeria, 2012-2013
Presentations: Audam T, and Kumar D. (2016). “Characterization of SIP470, a
Family 1 lipid Transfer Protein and its role in Plant Stress
Signaling”, Appalachian Student Research Forum. Johnson
City, TN.
Audam T, and Kumar D. (2015) Characterization of SIP470, a
Family 1 lipid Transfer Protein and its role in Plant Stress
Signaling. Poster presentation at 53rd Annual Meeting of
the Phytochemical Society of North America. Urbana-
Champagne, IL, USA.

113
Audam T, and Kumar D. (2015). “Characterization of SIP470, a
Family 1 lipid Transfer Protein and its role in Plant Stress
Signaling”, Appalachian Student Research Forum. Johnson
City, TN.
Honors and Awards: William Harvey Fraley and Nina M. Fraley Memorial Research
Award (2016)
Sigma Xi Grant-in-Aid of research (2016)
Frank and Mary Loews Travel Award by the Phytochemical
Society of North America (2015)