lipid nanodispersions as drug carrier systems - a ... nanodispersions as drug carrier systems - a...
TRANSCRIPT

Lipid nanodispersions as drug carrier systems -
a physicochemical characterization
Dissertation
zur Erlangung des akademischen Grades
doctor rerum naturalium (Dr. rer. nat.)
vorgelegt der
Mathematisch-Naturwissenschaftlich-Technischen Fakultät
der Martin-Luther-Universität Halle-Wittenberg
von
Katja Jores
geboren am 10. Juni 1972 in Mainz
Gutachter:
1. Prof. Dr. rer. nat. habil. Karsten Mäder
2. Prof. Dr. rer. nat. habil. Reinhard Neubert
3. Prof. Dr. rer. nat. habil. Martin Wahl
Halle (Saale), den 8. Juni 2004
urn:nbn:de:gbv:3-000007006[http://nbn-resolving.de/urn/resolver.pl?urn=nbn%3Ade%3Agbv%3A3-000007006]


I dedicate this thesis to all the people who have supported me.


A
Table of contents
1 Introduction..............................................................................................................1
1.1 Need of colloidal drug carriers ................................................................................ 1
1.2 Overview of colloidal drug carrier systems ............................................................. 4 1.2.1 Nanosuspensions ............................................................................................ 4 1.2.2 Liposomes ...................................................................................................... 5 1.2.3 Mixed micelles ............................................................................................... 5 1.2.4 Colloidal liquid crystalline structures ............................................................ 7 1.2.5 Microemulsions .............................................................................................. 8 1.2.6 Nanoemulsions............................................................................................... 9 1.2.7 Nanocapsules ............................................................................................... 10 1.2.8 Polymer nanoparticles.................................................................................. 10 1.2.9 Solid lipid nanoparticles (SLN) and nanostructured lipid carriers (NLC)... 11
1.3 Research objectives ............................................................................................... 13
2 Materials..................................................................................................................14
2.1 Lipids and waxes ................................................................................................... 14 2.1.1 Glyceryl behenate ........................................................................................ 14 2.1.2 Hardfat ......................................................................................................... 14 2.1.3 Medium chain triglycerides ......................................................................... 14 2.1.4 Cera perliquida ............................................................................................. 15
2.2 Tensides ................................................................................................................. 15 2.2.1 Poloxamer .................................................................................................... 15 2.2.2 Polysorbate................................................................................................... 15
2.3 Water ..................................................................................................................... 16
2.4 Other ingredients ................................................................................................... 16
3 Methods ....................................................................................................................17
3.1 Preparation of lipid dispersions ............................................................................. 17
3.2 Particle size determination .................................................................................... 19 3.2.1 Photon correlation spectroscopy (PCS) ....................................................... 19 3.2.2 Laser diffraction (LD) .................................................................................. 19
3.3 Field-flow fractionation (FFF) .............................................................................. 20
3.4 Nuclear magnetic resonance (NMR) spectroscopy of protons .............................. 20
3.5 Electron spin resonance (ESR) spectroscopy........................................................ 20 3.5.1 In vitro determination of spin probe distribution......................................... 20 3.5.2 Ascorbic acid assay...................................................................................... 21 3.5.3 Ex vivo measurements on human skin......................................................... 21
B
3.6 Fluorescence spectroscopy.....................................................................................21
3.7 Raman spectroscopy ..............................................................................................22
3.8 X-ray diffraction ....................................................................................................22 3.8.1 By copper radiation ......................................................................................22 3.8.2 By synchrotron radiation..............................................................................22
3.9 Differential scanning calorimetry (DSC)...............................................................23
3.10 Densimetrie ............................................................................................................23
3.11 Refractometry.........................................................................................................24
3.12 Cryo transmission electron microscopy (Cryo-TEM) ...........................................24
4 Results and discussion..........................................................................................25
4.1 Particle size measurements by PCS and LD ..........................................................25
4.2 Field-flow fractionation (FFF) ...............................................................................29
4.3 Nuclear magnetic resonance (NMR) spectroscopy of protons ..............................32
4.4 Electron spin resonance (ESR) spectroscopy.........................................................37 4.4.1 In vitro determination of spin probe distribution .........................................37 4.4.2 Ascorbic acid assay ......................................................................................41 4.4.3 Ex vivo measurements on human skin .........................................................42
4.5 Fluorescence spectroscopy.....................................................................................47
4.6 Raman spectroscopy ..............................................................................................54
4.7 X-ray diffraction ....................................................................................................56 4.7.1 By copper radiation ......................................................................................56 4.7.2 By means of synchrotron radiation...............................................................57
4.8 Differential scanning calorimetry (DSC)...............................................................58
4.9 Densimetrie ............................................................................................................60
4.10 Refractometry.........................................................................................................60
4.11 Cryo transmission electron microscopy (Cryo-TEM) ...........................................62
5 Summary and conclusions...................................................................................66
5.1 English version.......................................................................................................66
5.2 German version......................................................................................................71
Bibliography.....................................................................................................................77

List of abbreviations
1H-NMR (spectroscopy) nuclear magnetic resonance (spectroscopy) of protons
AA ascorbic acid
CMC critical micellar concentration
CMT critical micellar temperature
CTFA The Cosmetic, Toiletry and Fragrance Association, Inc.
DSC differential scanning calorimetry
EAB europäisches Arzneibuch (European pharmacopeia)
e.g. exempli gratia (for example)
EPR electron paramagnetic resonance
ESR electron spin resonance
FFF field-flow fractionation
GB glyceryl behenate
GIT gastrointestinal tract
HF hardfat
HLB hydrophile- lipophile balance
i.e. id est (that means)
INCI international cosmetic ingredients
K Kelvin
LD laser diffraction
MALS multi-angle light scattering
MCT medium chain triglycerides
MM mixed micelle
NEmu nanoemulsion
NMR nuclear magnetic resonance
NLC nanostructured lipid carriers
NR Nile red
P3 2,2,3,5,5-pentamethyl-4-phenyl- imidazolidine-1-yloxy
PCS photon correlation spectroscopy
PEG polyoxyethylene glycol

PI polydispersity index
PIDS polarization intensity differential scattering
PMMA poly(methyl methacrylate)
RMS root mean square
SALATRIM short- and long-chain acyl triglyceride molecules
SLN solid lipid nanoparticles
TB TEMPOL benzoate
(4-hydroxy-TEMPO benzoate,
4-benzoyloxy-2,2,6,6-tetramethyl-piperidine-1-oxyl)
TEM transmission electron microscopy
TMS trimethylsilylpropionic acid sodium salt-2,2,3,3-D4
USP United States pharmacopeia

1 Introduction
1
1 Introduction
1.1 Need of colloidal drug carriers
High-throughput screening technologies in drug discovery present an efficient way to find
new powerful substances. But in recent years it has become evident that the development
of new drugs alone is not sufficient to ensure progress in drug therapy. Poor water
solubility of drug molecules, insufficient bioavailability, fluctuating plasma levels or high
food dependency are the main and common problems. Major efforts have been spent for
the development of customized drug carriers to overcome the disappointing in vivo fates of
the drug. For carriers non-toxicity (acute and chronic), sufficient drug loading capacity,
possibility of drug targeting, controlled release characteristics, chemical and physical
storage stability (for both drug and carrier) and feasibility of scaling up production with
reasonable overall costs are requested [1-3]. Colloidal carriers have attracted the main
interest because they are promising systems to fulfill the requirements mentioned above.
But in the first place, nanosized carriers are treated as hopeful means to increase the
solubility and therefore the bioavailability of poorly water-soluble active ingredients
belonging to the classes II and IV in the biopharmaceutical classification system (BCS)
[4-6].
The common characteristic of all colloidal carriers is the submicron particle size.
Nanometric carriers might differ in materials, composition, drug loading and application
spectrum (see chapter 1.2). Corresponding to the broad diversity of colloidal carriers, the
possible administration routes vary. Dermal [7-9], peroral [10,11], parenteral [12], ocular
[13] and pulmonary [14] applications are known for nanocarriers. As upper limit for
intravenous administration to avoid embolism in blood vessels no particles above five
micrometers and only few particles between one and five micrometers are accepted. Solid
particular systems are limited to either the subcutaneous or intramuscular routes of
administration, intravenous administration may result in vaso-occlusion [15].
Although biodistribution studies to organs were performed with radiolabeled carriers [16],
little is known about the detailed fate of the carrier in vivo, especially concerning the
uptake mechanisms, exchange processes with the physiological environment and
degradation rates. Without particle modifying the phagocyte system recognizes circula ting

1 Introduction
2
colloidal particles in the blood as foreign material and captures them rapidly after
intravenous administration [16]. While drug delivery keeps difficult to realize as long as
carriers are rapidly phagocytized and drug molecules are accumulated in liver and spleen,
nowadays first success was achieved for passive drug targeting to solid tumors. Tumor
blood vessels present several abnormalities in comparison with normal physiological
vessels. In an unspecific way, PEGylated (polyoxyethylene glycolated) particles penetrate
the leaky endothelium and deliver drug inside the tumor [17-20]. These small hydrophilic
carriers were found to have longer circulating half- lives in the blood than large and
hydrophobic particles [21,22], due to their “water- like” aspect they are more or less
invisible for the phagocytes. However, PEG-coated particles are passive systems because
their modification in tissue distribution is basically a result of the difference in micro
vascular permeability between healthy and altered tissue and of their long circulating
properties. Active targeting has not yet been successfully established. Ideas rise up
proposing new steps on the way to active targeting. E.g., polysaccharide-decoration of the
surface of polymer nanoparticles should serve as anchor to cell surfaces of humans and/or
bacteria and virus [23,24]. There, oligo- and polysaccharides are universally exposed and
often they play a role in biologic activity which is hoped to get influenced by novel
carriers.
Focusing on the biofate of lipid-containing drug carriers after peroral application, short-
chain and medium-chain liquid lipids are known to be easily hydrolyzed and to be readily
absorbed in the gastrointestinal tract (GIT) [25-27]. Crystalline lipids are poorly attacked
by lipases and very long chains (from C18 up) in solid state are poorly absorbed [28]. But
not only the types of fatty acids in triglycerides, even their stereo specific distribution on
triacylglyceryl structures influences the absorption fate [29]. To make use of caloric
reduction to the half of conventional fats and oils, SALATRIM (short- and long-chain acyl
triglyceride molecules) as fat substitute has been developed. These structured
triacylglycerols are composed of at least one long-chain fatty acid (predominantly stearic)
and at least one short-chain aliphatic acid (acetic, propionic, and/or butyric) [30,31].
Often penetration and uptake of entire colloidal particles in cell tissues is not probable to
explain the in vivo effects of colloidal carriers [11]. More likely, due to the extremely
increased surface area of nanoparticles compared to microparticles, e.g. improved drug
solubility and therefore better bioavailability is given. A short calculation will demonstrate
1 Introduction
3
the tremendous increase in surface area: If a substance of 1 cm3 of volume is cut into small
cubes of 10 µm in length, the obtained surface area will amount to 0.6 m2. Cutting the
substance into cubes of only 100 nm in length, 60 m2 of surface area can get in contact
with the surrounding phase. Thereby, the extent of solubility of solid or liquid particles
increases with their enlarging surface area (the logarithm calculated from the quotient of
solubility of small and large particles correlates indirectly proportional to the particle
radius [32]). Less compact particle shape may favor solubility additionally [32].
Nanosizing of a bulk material may also lead to dramatic changes of the physical properties
of the substance, i.e. the depression of the melting point which results in the existence of
supercooled melts [33]. In case of much decreased particle sizes the propertie s of the
material are determined by the surface properties. Therefore colloids are no t trivial
systems. Furthermore, different colloidal structures might coexist.
Of course, nanometric systems have to fulfill the requests for save drug delivery systems
mentioned above. Most of all, precautions against aggregation, coalescence or Ostwald
ripening [34] have to be attempted by optimized stabilization. Additionally, incorporation
of sensitive drug molecules in some carrier matrices is claimed as protection against
enzymatic degradation, hydrolysis or light [35-39]. That is remarkable, knowing the
diffusion constant for solid materials at approximately 10-15 cm2*s-1 at room temperature.
According to the Einstein-Smoluchowski equation [40], within 14 h a molecule could be
able to diffuse over a distance of 100 nm, what is diminished in amorphous materials to
50 s. Great attention should be paid to proposed storage stabilities of sensitive drugs in
nanoparticles as far as contact to the particle surface and rapid degradation by the outer
environment is rapidly possible [41]. Despite of their small size, colloidal carriers have to
guarantee controlled drug release. Burst release [1,42,43] can be explained by this
Einstein-Smoluchowski equation, too.
Chapter 1.2 is dedicated to several colloidal drug carriers. Entire physicochemical
characterization and evaluation is not trivial because systems in the nanometric range do
not offer the whole variety of investigative methods [44]. Remarkable efforts must be
make to avoid artifacts due to invasive analyzing techniques [45] or only to avoid dilution
which is required by many analytical methods. Special attention should be paid to other,
competitive nanocompartments for the drug within a formulation [1], i.e. mixed micelles in
a tenside-stabilized nanoparticle dispersion. Concerning the choice of a drug formulation,

1 Introduction
4
it should be remembered that none delivery system per se meets all desired requirements
for overall/general problem solution. Moreover, optimal formulations have to be chosen
carefully for each drug, according to the features of the nanocarriers. The aim is to achieve
desired drug release profiles in vivo by minimizing undesired side effects.
1.2 Overview of colloidal drug carrier systems
1.2.1 Nanosuspensions
In a narrower sense, by the term “nanosuspensions” poorly water-soluble drug crystals in
the nanometric range are described [46-51]. Nanosuspensions are saturated solutions.
Therefore, they represent the simplest colloidal carriers with respect to composition. Their
drug payload amounts to nearly 100 %. In an aqueous environment, the drug is pearl
milled, precipitated or high pressure homogenized to a particle distribution mostly below
one micrometer. Despite of the use of tensides, particle growth up to micrometric drug
crystals may occur when the drug molecules of small particles dissolve in the outer
environment and precipitate later on the surface of larger particles (Ostwald ripening).
According to the Kelvin equation [52], the increased dissolution is an effect of strong
particle curvature, so smaller particles are more affected than larger ones. Intravenous
application of nanosuspensions stands for a risk [15].
Due to tremendous interface areas between drug and environment, solubilization velocity
of the drug is increased according to the Noyes-Whitney equation [32,53]. Corresponding
to the equation of Thomson-Gibbs-Freundlich, even the solubility of active substances may
be increased in nanometric carriers. Attention has to be paid on drugs with small safety
margins where burst release has to be avoided. But controlled release and reproducible
blood levels are not easily achievable because as a release controlling barrier only the
tenside layer may serve in these nanosuspensions. Suspensions of crystals in the
micrometer range are already established in the market (i.e. PrednigalenTM). The only two
registered nanosuspensions are RapamuneTM and EmendTM for immediate delivery.
Attention should be paid to the polymorphism of the drug, too. In contrast to the crystalline
state, amorphous drug is solubilized fast. Sometimes, crystallization of the drug is retarded.

1 Introduction
5
Due to the high surface-to volume ratio and due to the presence of emulsifiers supercooled
melts with different physical properties are formed [54].
1.2.2 Liposomes
Liposomes [55-61] consist of one or more lipid bilayers of amphiphilic lipids (i.e.
phospholipids, cholesterol, glycolipids). The lipophilic moiety of the bilayers is turned
towards each other and creates an inner hydrophobic environment in the membrane.
Lipophilic or amphiphilic drugs can be associated with the non-polar parts of lipid bilayers
if they fit in size and geometry [55]. The hydrophilic molecular head groups face the outer
water phase and the inner aqueous core of the vesicles. Water-soluble compounds can be
included within the aqueous compartments.
Liposomes are classified as large multilamellar liposomes (MLV), large unilamellar
vesicles (LUV), small unilamellar vesicles (SUV), oligolamellar large vesicles (OLV), and
multivesicular vesicles (MVV), depending on their size, the number of bilayers and the
existence of inner vesicles in a vesicle. The size of liposomes varies from 20 nm to few
micrometers, with lipid membranes of approximately 5 nm [56].
Marketed products [62] are i.e. AmBisomeTM, DaunoXomeTM, and PevarylTM-Lipogel,
indicating the parenteral and topical administration as main application routes for
liposomes. Liposomes often suffer rapid degradation by the pH of the stomach, by
intestinal enzymes and bile salts when they are given perorally. Further instability
problems can arise during storage when the unsaturated fatty acids and the ester bindings
of phospholipids are hydrolyzed and oxidized, respectively.
To overcome this last mentioned drawback, niosomes [56,63,64] were invented. Niosomes
are non- ionic surfactant vesicles (NSV), resemble in their constitution to liposomes and
consist of synthetic surface active molecules, i.e. alkyl polyoxyethylene ethers. Saturated
hydrocarbon chains and intramolecular ether bindings increase the chemical stability of the
niosomes. Whether niosomes are superior to liposomes in vivo is under investigation
[63,65].
1.2.3 Mixed micelles
As long-chain phospholipids are known to form bilayers when dispersed in water (see
chapter 1.2.2), the preferred phase of short-chain analogues is the micellar phase [66]. The

1 Introduction
6
prediction of the arrangement keeps demanding, because it is related with chemical
structure, temperature and water content [67,68]. In general, amphiphilic ionic, anionic or
ampholytic molecules, which are able to decrease the surface tension of a solvent, arrange
in micelles, as TweenTM or sodium dodecylsulfate above a certain critical concentration.
A micellar solution is a thermodynamically stable system formed spontaneously in water
[69], and also in organic solvents. The latter is of less interest in pharmaceutical
technology. Micelle formation can only occur above a certain solute concentration, the
critical micellar concentration (CMC), and at solution temperatures above the critical
micellar temperature (CMT). The small colloidal aggregates (micelles) are in rapid
thermodynamic equilibrium with a measurable concentration of monomers. The size
(mostly around 5 to 10 nm [70]) and shape of micelles depend ultimately on the chemical
structure of the detergent. According to Small [69], spherical, rod-shaped, and discoidal
micelles exist in water.
Micellar solutions exhibit solubilization phenomena. The micelle solubilizes host
molecules (i.e. drugs) in any zone of the micelle volume, but the penetration into the
micelle depends over all on the inner space of the micelle (as mentioned, diameter of entire
micelle often below 10 nm), on the hydrophobicity of the drug and on the charge of the
incorporated molecule [71,72]. The interaction between micelles and lipophilic drugs leads
to the formation of mixed micelles (MM), often called swollen micelles, too. The addition
of salt, alcohol etc. can vary the degree of penetration into the micelle (co-solubilization).
In mixed micelles, the mobility of the micellar phase was found to be decreased due to
incorporated molecules [73]. Considerably, swollen micelles are larger than the analogous
“free micelles” because solubilization may result mostly from the increase in micellar size
[74].
Micelles of common surfactants usually have relatively high CMC and are unstable upon
strong dilution, e.g. in the blood volume. Toxic side effects of some tensides on human
cells have to be considered beside bad taste of tensides in peroral liquids. Furthermore,
investigations have to be focused on drug-tenside incompatibilities and on initial
oversaturation [70] what would lead to later drug expulsion from the micelle. The kinetics
of micelles are driven by both rapid micelle-monomer exchanges and by dissolution and
new formation of micelles [75], but nevertheless the extent of water-amphiphile contact is
discussed controversially [75,76]. Newer findings indicate an extensive contact between

1 Introduction
7
water and methylene and methyl groups and an extreme disorder of the micelle interior.
But simultaneously recent discovery excludes water penetration into the micelle although
surfactants move constantly in and out of micelles [76].
Swollen micelles are fluid systems, but sufficiently stable to be used as delivery systems
for stable drugs (i.e. Valium MMTM, Konakion MMTM) [77]. The hemolytic activity of bile
salts is not longer present in MM, therefore they are parenterally applicable [78,79]. Latest
developments for mixed micelles are presented in [80-83]. Nowadays, polymeric micelles
[82,84] as pharmaceutical carriers with high solubilization capacity and rather low CMC
value (to refer to arising monomer toxicity after dilution) are proposed.
1.2.4 Colloidal liquid crystalline structures
Liquid crystalline phases [53,70,85,86] share features from both liquids and crystalline
substances. Due to their intermediate state they are named “mesophases”, too. On one
hand, referring to crystals mesophases are viewed as defective crystals. Orientational order
and periodicity are essential, common to all liquid crystalline states. For all liquid crystals,
except cubic phases [87-89], anisometry is given. By the crystal-related phenomena they
can by characterized by differential scanning calorimetry (DSC), X-ray diffraction and
polarization microscopy, the latter in case of anisometry only. On the other hand, liquid
crystals match partially self-organized melts in providing remarkable viscosity and
diffusion characteristics.
Two liquid crystalline trans itions have to be distinguished, the lyotropic and the
thermotropic. Materials that form liquid crystals by addition of solvents are lyotropic liquid
crystals, i.e. when in aqueous solutions the concentration of water-soluble amphiphiles is
increased. The amphiphilic molecules must exhibit some chemical complexity, or
otherwise the solvent will simply dissolve them [85]. Liquid crystals are typically organic
molecules, ranging from small molecules, i.e. detergents, to polyelectrolytes, i.e. DNA,
vegetable gums [85]. The formation of lyotropic mesophases is driven by the chemical
structure of the organic molecule(s), the ratio of water to amphiphile(s), and the
temperature. With decreasing concentration of water, firstly hexagonal (similar to many
cylinder- like micelles) and then lamellar phases (similar to stacked bilayers, discoid) are
formed. In case of very polar head groups of the molecules, together with high water
binding capacities, cubic phases (“balls”) may be formed instead of hexagonal

1 Introduction
8
arrangement. Drug of adequate distribution coefficient can be incorporated in between the
fluid lamellar phase [53,90]. Cubosomes are submicron particles of bicontinuous cubic
phases for lipophilic or amphiphilic active ingredient incorporation [91,92]. For these
drugs, cubosomes have been proposed as a delivery system which may provide both a
solubilization benefit (increased drug payload) and also a means for controlled or sustained
release [93]. ElyzolTM as an in situ forming liquid crystalline dispersion is commercially
available.
Beside the lyotropic mesophase a thermotropic transition exists. A chemically pure
material does not show a clear melting point, but forms liquid crystals within a certain
temperature range [85]. If the liquid crystalline state (i.e. of a drug) is maintained at lower
temperatures as supercooled liquid crystals, pharmaceutical use seems to be interesting
[94].
Liquid crystals as delivery systems should be able to improve the dissolution of poorly
water-soluble drugs. Lyotropic liquids crystals incorporate relatively high drug amounts,
but only few drugs themselves tend to build thermotropic mesophases. Disadvantageous is
that the tenside concentrations are high and that colloidal dispersions of liquid crystals
occur only in a thin range of parameters. Mesophases are thermodynamically stable and
self-assembling, but they form reversibly the former basic micellar or molecular dispersed
state by adding water.
1.2.5 Microemulsions
Microemulsions are optically isotropic, transparent or translucent, low-viscous, single-
phasic and thermodynamically stable liquid solutions [95-98]. Critical solution is a term
microemulsions are described with, reflecting their strong optical fluctuation and their
solubilization capacity. As self- forming system the manufacture keeps simple.
Microemulsions are bicontinuous systems that are essentially composed of water and oil,
separated by surfactant and co-surfactant [34,70,95,99,100]. Microemulsions provide ultra-
low interfacial tensions towards 0 mN/m despite of large oil-water interfacial areas. It is
often very difficult to achieve the required interfacial area with the use of a single
surfactant, hence a co-surfactant is essential.
The distinction between solubilized micellar systems (chapter 1.2.3) and microemulsions is
not clear-cut since there is no well-defined transition point [101] between inverted

1 Introduction
9
micelles, followed by microemulsions with comparable amounts of oil and water, and
afterwards micelles if water is added continuously. Nevertheless, in this text
microemulsions will be treated as bicontinuous structures only. The concept excludes
aqueous surfactant solutions without added solubilizate, liquid-crystalline systems, and
normal emulsions, too.
Their characterization can be done by electron microscopy and scattering methods (X-ray
diffraction [102], static and dynamic light scattering) although microemulsions are unable
to dilute (loss of microemulsion character in favor of micelles after dilution) and therefore
size determination sometimes is difficult. Nonetheless, structures below 100 nm were often
found [11,70].
Due to large interfacial areas microemulsions typically show much greater solubilizing
capacities for both hydrophilic and lipophilic drugs than micellar solutions. A prominent
example is Sandimmun OptoralTM/NeoralTM preconcentrate [11]. As reasons for better
bioavailability above all the highly dispersed systems with good drug accessibility and
secondary a better penetration into tissues are discussed [103].
Microemulsions are usually limited to dermal and peroral application because of their high
surfactant concentration [70]. They exist in narrow regions of phase diagrams; therefore
they are very restricted in tolerance to quantitative formulation changes.
1.2.6 Nanoemulsions
In contrast to microemulsions, emulsions are heterogeneous systems comprised of two
immiscible liquids in which one liquid is dispersed as droplets in another liquid [34,104-
108]. For the production [109,110] an energy input is necessary and the obtained liquid- in
liquid dispersion is thermodynamically unstable [111-115].
Oil- in water nanoemulsions present the most important parenteral drug carrier systems
where lipophilic drugs are dissolved in the inner phase of the emulsion [104], i.e.
Diazepam LipuroTM, DisoprivanTM, StesolidTM and LipotalonTM [116,117]. Once drug-free
introduced as parenteral nutrition, the ingredients of nanoemulsions are known to be
physiologically well tolerable in human bodies. Degradation of the droplets containing
lipophilic drug occurs very fast when administered intravenously, so retarded release is not
realized [16]. After entering the blood circulation, fat emulsions would are treated as
naturally-occurring fat and are therefore rapidly hydrolyzed by lipases. The phagocyte

1 Introduction
10
system is only activated when certain lipids are recognized as foreign. Rapid degradation
for oil droplets takes place in GIT, too, if given perorally. For topical use enhanced drug
penetration is described [118].
With regard to the mobility of the oil a protection of sensitive drug molecules from
hydrolysis is hindered. Moreover, sustained release and incorporation of hydrophilic
components in conventional oil- in water is not realizable. Multiple emulsions (water- in oil-
in water) are proposed to resolve these problems [119-121]. It has to be considered that
these novel nanoemulsions again are fluid, unstable systems where the production is not
easy to handle.
1.2.7 Nanocapsules
Oil containing nanocapsules differ from (oil- in water) nanoemulsions in providing a barrier
made from polymers between the core and the surrounding environment, but as well
nanoparticles with aqueous cores in an aqueous outer phase are published [122]. Suitable
polymeric materials are listed in chapter 1.2.8. Often, for the preparation of nanocapsules
the ways of solvent displacement [123,124] and interfacial polymerization [125] are
applied.
According to the lipophilicity of the capsule content, hydrophilic and lipophilic drugs,
respectively, can be dissolved [126]. Additionally, the polymeric particle surface may
serve as compartment where hydrophilic drugs can be adsorbed [126]. Some encapsulated
lipophilic drugs have already shown to be released in a controlled manner [127].
Encapsulation may decrease the toxicity of drugs after peroral or parenteral [2] application
inasmuch as the exhibition to cells is diminished. Encapsulation saves sensitive drugs from
rapid degradation. With the aim to reduce the interactions with reticuloendothelial system
and to alter body distribution, the surface of nanocapsules was modified by certain
materials such as surfactants (i.e. length and density of PEG chains) [128]. The complex
biofate of nanocapsules is not entirely understood yet.
1.2.8 Polymer nanoparticles
Depending on the desired properties for polymer nanoparticles, polymers can be
synthesized in a wide range of chain length, type and number. Polymers suitable for the
preparation of nanoparticles include cellulose derivatives, poly(alkylcyanoacrylates),

1 Introduction
11
poly(methylidene malonate), polyorthoesters, polyanhydrides and polyesters such as
poly(lactid acid), poly(glycolic acid) and poly(ε-caprolactone) and their copolymers [2].
Obviously, toxicity of the substances, of radical starters or of solvent residues [37] has to
be taken into calculation. Polymers used for parenteral delivery have to be biodegradable,
they mostly belong to polyesters (i.e. polylactides) [129,130] or to the group of
polyacrylates (i.e. polycyanoacrylates) [37,131]. For peroral administration, non-
degradable polymers such as acrylate- and cellulose-derivatives can be used for
nanoparticles designed not be absorbed [3,129]. In analogy to nanocapsules, attempts are
done to modify the surface of the carriers. But again, little is known about the detailed in
vivo fate of polymer nanoparticles [10,132].
For the production of polymer nanoparticles monomers can be built up to polymer particles
or preformed polymers are reduced to nanoparticles. Various procedures are applied: the
coacervation technique, the solvent evaporation [133] and solvent diffusion methods, the
production by interfacial polymerization [37], the denaturation or desolvation of natural
proteins or carbohydrates [37], and the degradation by high-shear forces (i.e. by high
pressure homogenization [134] or by micro fluidization [135]). Often, particles based on
polymers are reproducible to manufacture and some systems show remarkable storage
stability [136]. Colloidal particles are either left as aqueous dispersion or they are
converted into solid form, usually by lyophilization [129].
Nanoparticles serve as carriers for a broad variety of ingredients (i.e. conventional drugs,
antigens, vaccines or enzymes). The active components may be either dissolved in the
polymeric matrix or entrapped or adsorbed onto the particle surface. Depending on
polymer, drug and polymer interaction and production procedure, drug release differs
[137]. Polymer erosion, drug diffusion through the matrix or desorption from the surface
may occur. Whereas polymeric microparticles entered the market (e.g. Enantone DepotTM),
no polymeric nanocarrier is available yet.
1.2.9 Solid lipid nanoparticles (SLN) and nanostructured lipid carriers (NLC)
Melt-emulsified nanoparticles based on lipids (or waxes) solid at room temperature have
been developed [138-142]. Advantages of these solid lipid nanoparticles (SLN) are the use
of physiological well-tolerable lipids [143], the avoidance of organic solvents in some
preparation processes, a wide potential application spectrum (dermal, peroral, intravenous)

1 Introduction
12
and high pressure homogenization [144] as an established production method which allows
large scale production. To manufacture SLN, the hot high pressure homogenization above
the melting point of the lipid and subsequent recrystallization [145] is recommended (melt-
emulsification), but the cold high pressure homogenization [146] (high pressure milling of
lipid suspensions) for thermo labile drugs exists, too. Other production methods for SLN as
the production from microemulsions [147], the precipitation [148-150] and dispersing by
ultrasound [151,152] are published and differ normally in obtained particle size
distribution. Noteworthy basic information concerning the structure of lipids [69,153-155]
and the influence of stabilizers during production process [156-158] are provided in the
literature. Additionally, for SLN improved bioavailability, protection of sensitive drug
molecules from the environment (water, light) [36] and controlled release characteristics
[139,141,159] have been claimed. Successful incorporation not only of lipophilic, but even
of hydrophilic drug molecules has been postulated [160,161].
Common disadvantages of SLN include particle growth, particle aggregation,
unpredictable gelation tendency, unexpected dynamics of polymorphic transitions, burst
drug release and inherently low incorporation capacities due to the crystalline structure of
the solid lipid [1,162,163]. It has been proposed that this last mentioned drawback can be
overcome by oil loaded solid lipid nanoparticles (also described as nanostructured lipid
carriers or NLC) [164,165]. Liquid lipids solubilize drugs to a much higher extent than
solid lipids. In a preferred scenario, the liquid lipids form droplets within the solid lipid
particles matrix. According to this model, the NLC nanoparticles would provide a high
incorporation capacity (due to the liquid lipid) and control of drug release (due to the
encapsulating solid lipid). It has been postulated that medium chain triglyceride (MCT)
molecules can replace glyceryl behenate (GB) molecules in the crystal lattice in a random
distribution up to a MCT load of 16 % (weight % of total lipid) [164,166]. Even higher oil
loads up to 38 % have been described to be incorporated as MCT clusters inside the solid
matrix. Thereby, the solid particles are described to be spherical [7,165,167,168] what
should offer a maximal volume for oil and drug incorporation.
Despite of reinforced investigation efforts, until today neither SLN nor NLC are clinically
used.

1 Introduction
13
1.3 Research objectives
On the one hand, for SLN nearly 100 % incorporation rate, controlled release and
protection from the outer environment were claimed. On the other hand, laws of nature i.e.
restricted incorporation capacities for host molecules in crystalline matrices and very short
diffusion times for drugs in colloidal carriers, lead to call the SLN testimonies into
question.
To clarify the contradictions, the topic of the present thesis is the physicochemical
characterization of lipid nanodispersions. The work is focused especially on SLN and
NLC, but corresponding lipid systems as nanoemulsion or microemulsion have to be
always under investigation, too, as far as comparisons of novel carriers to already
established systems are important for final judgments.
By a physicochemical characterization detailed knowledge will be gained concerning the
• Drug localization in SLN
• Drug and oil localization in NLC
• Particle shape of SLN and NLC
• Accessibility of surrounding aqueous phase to the incorporated (model) drug, closely
related to drug stability in the nanometric carriers
• Behavior of lipid nanodispersions on human skin (ex vivo).
The appropriate characterization of SLN and NLC is highly challenging due to their small
particle sizes. Any particle separation from the aqueous environment or only dissolution
with water could easily lead to misleading results due to particle aggregation and changed
samples if stabilizers are removed from the particle surface. Therefore, non- invasive
investigation techniques without the need of dilution have been applied whenever possible.
Nuclear magnetic resonance (1H-NMR) and electron spin resonance spectroscopy (ESR),
fluorescence spectroscopy, X-ray diffraction, measurements of refractive index and
density, Raman spectroscopy were used beside invasive methods (transmission electron
microscopy (TEM), field-flow fractionation (FFF), photon correlation spectroscopy (PCS)
and laser diffraction (LD)). Moreover, the broad variety of techniques should help to
minimize artifacts linked to many techniques. Combining the results gained by different
methods, the data provide a more complete understanding of lipid nanodispersions.

2 Materials
14
2 Materials
2.1 Lipids and waxes
2.1.1 Glyceryl behenate
Compritol 888 ATO (INCI: tribehenin, USP: glyceryl behenate, GB) is a mixture of
approximately 15 % mono-, 50 % di- and 35 % triglycerides of behenic acid (C22) while
other fatty acids than behenic acid account for less than 20 %. The melting point lies
between 69 and 74 °C. It was a gift of Gattefossé (D-Weil am Rhein) where it is offered as
product with lubricant and binding properties in tablets and capsules.
According to the lipid classification of Small [69], all mono-, di- and triglycerides belong
to the group of polar lipids. Both di- and triglycerides are regarded to class I which stands
for insoluble non-swelling amphiphiles. These non-swelling amphiphiles in water form a
stable monolayer at the water-air interface as well as monoglycerides in water do. But
monoglycerides additionally tend to form liquid crystals in water, they are grouped in class
II (insoluble swelling amphiphiles). Monoglycerides provide already stabilizing capacities
for water- insoluble components.
2.1.2 Hardfat
Witepsol W25, donated by Condea (D-Witten), is a hardfat mixture (65-80 % tri-, 10-35 %
di- and 1-5 % monoglycerides, fatty acid chain lengths 12-18, hydroxyl value between 20
and 30; HF) with a melting interval from 33.5 to 35.5 °C.
2.1.3 Medium chain triglycerides
Miglyol 812 (DAC: oleum neutrale; CTFA: caprylic/capric triglyceride (caprylic acid: C8,
capric acid: C10), medium chain triglycerides; MCT) is an at room temperature liquid lipid
(oil) of low viscosity. Usually, fatty acid composition in MCT is dominated by C8 fatty
acids (50 to 65 %), followed by C10 (30 to 45 %), C12 (max. 5 %) and C6 (max. 3 %) [169].
The oil is known to be faster biodegradable than lipids with longer fatty acid chains. Due
to missing toxicity on skin and mucous membrane MCT found use as in dermal product

2 Materials
15
where it enhances permeation and spreading, as lubricant and drug solvent in peroral
products, as solution enhancer in parenteral formulations [169]. MCT was purchased at
Caelo (D-Hilden).
2.1.4 Cera perliquida
Cera perliquida is used for the preparation of the microemulsion (used as reference in
chapter 4.4.3). It is a thin liquid wax consisting of iso-octyllaureate and iso-octylmyristate
and was obtained from Pharma GmbH (D-Pößneck) by the name Onicetan 148TM. Cera
perliquida shows good tolerance on skin [169].
2.2 Tensides
2.2.1 Poloxamer
Lutrol F 68 (poloxamer 188; a water-soluble non- ionic polyoxyethylene-polyoxypropylene
polymer) was donated by BASF (D-Ludwigshafen). Its value in the HLB system
(hydrophile-lipophile balance) amounts to 29. The stabilizer and solution enhancer does
not cause toxic reactions after parenteral, dermal or peroral administration [169].
Moreover, the transition time of gut is not influenced in GIT of rats [169]. Tenside
micelles are not likely to occur in the concentration range of poloxamer used in this study.
Poloxamer 188 arranges only at higher concentrations and temperatures in form of micellar
structures [68,170].
2.2.2 Polysorbate
TweenTM 80V Pharma is the trade name of polysorbate 80 (polyoxyethylene sorbitan fatty
acid ester) and was a gift from Uniqema (B-Everberg). Its HLB value is 15. It was used for
the microemulsion which was applied on human skin, where polysorbate does not provoke
irritations [169].

2 Materials
16
2.3 Water
By means of double reverse osmosis (Milli-Q plus, Millipore, USA-Billerica) water
corresponding to the monograph for highly purified water (EAB 4) was obtained.
Immediately before the preparation of lipid dispersions the water was micro-organism-
reduced by boiling for one minute.
2.4 Other ingredients
For 1H-NMR deuterized water, chloroform-D1 and UvasolTM (tetramethylsilane) were
obtained from Merck (D-Darmstadt). Trimethylsilylpropionic acid sodium salt-2,2,3,3-D4
(TMS) from Deutero (D-Kastellaun) with its sharp signal at 0 ppm served as a NMR
reference.
For ESR lipophilic spin probes were used as model drugs: TEMPOL-benzoate (4-hydroxy-
TEMPO-benzoate, 4-benzoyloxy-2,2,6,6-tetramethyl-piperidine-1-oxyl, TB; melting point:
99–101 °C, partition coefficient for octanol/water >> 100 [171]) was obtained from
Aldrich Chemicals (USA-Milwaukee) and 2,2,3,5,5-pentamethyl-4-phenyl- imidazolidine-
1-yloxy (P3; melting point: 45-46 °C) from Magnettech (D-Berlin). They are both
crystalline paramagnetic nitroxyl radicals of strong red-orange color. Ascorbic acid (AA)
reduces the ESR-active probes to ESR-silent hydroxylamines. AA sodium salt for the
reduction assay was ordered from Fluka (D-Steinheim).
For spectrofluorometric studies Nile red (Nile blue A oxazone; 9-diethylamino-5H-
benzo[α]phenoxazine-5-one; NR) was obtained from Sigma (USA-St. Louis). The
intensively pink-colored dye exhibits a sharp melting point at 192/193 °C. The partition
coefficients of NR in several organic solvents (e.g. chloroform, xylene) relative to water
were found to be approximately 200 at 4 °C.
For the preparation of the microemulsion propylenglycol (1,2-propylenglycol) and dodecyl
alcohol (n-dodecenal, lauryl alcohol) were needed. Both were provided by Merck (D-
Darmstadt).
Human skin was obtained from the abdomen of a female person (32 years old) during a
plastic surgery. Immediately after the fat layer was cut and the skin was cryo-conserved
and stored at −22 °C.

3 Methods
17
3 Methods
3.1 Preparation of lipid dispersions
Table 1 gives an overview of the prepared samples.
Usually, the total lipid concentration in our dispersions amounts to 10 % (w/w). For TEM
measurements, the total lipid concentration was reduced to 1.5 %. To prepare solid lipid
nanoparticles GB was melted in a water bath at 85 °C and HF at 65 °C, respectively. In
general, it is recommended to destroy any crystal center of the bulk material by a long
heating phase clearly over the melting point with the aim to avoid the lipid memory effect
and to make new crystallization possible [172]. In the case of NLC, different fractions of
the GB were replaced by MCT (2 %, 4 %, 10 %, 15 %, 20 %, 25 %, 30 %, 40 %, 50 % and
75 % (w/w) MCT, referred to the total lipid phase). For ESR measurements, in the hot lipid
1 mmol TB, referred to TB end concentration in the sample (corresponding 0.276 %
(w/wlipids)), or 5 mmol P3, respectively (corresponding 1.167 % (w/wlipids)), were dissolved
and for fluorescence spectroscopy 8.75 µg NR per 35 g sample (corresponding 0.00025 %
(w/wlipids)).
The hot lipid phase was given to an aqueous solution of 2.5 % poloxamer 188 (0.5 % for
TEM samples) of the same temperature and a dispersion was formed using a rotor-stator
mixer (ultra turrax, IKA, D-Staufen) for 30 s at 8,000 rpm. The premix was passed three
times through a Lab 40 high pressure homogenizer (APV Gaulin, D-Lübeck) [173] at 85
°C (65 °C for HF-sample) and 500 bar. The hot dispersions were filled in silanized glass
vials and cooled to room temperature by placing them in a water bath at 22 °C.
The nanoemulsions (NEmu-0.2%, NEmu-0.4%, NEmu-1%, NEmu-2.5%, NEmu-5%,
NEmu-7.5%, NEmu-10%) were prepared in exactly the same manner with MCT instead of
GB as the lipid phase. Mixed dispersions (MIX) were prepared by mixing of separately
prepared solid (SLN) and liquid (NEmu-10%) lipid nanodispersions. Through simple
dispersion by means of an ultra turrax at 8,000 rpm for 30 s microparticles (Micro-GB and
Micro-MCT) are obtained, according to the procedure for the above mentioned premix. If
necessary, recrystallized melts made from MCT and GB bulk mixtures were prepared by
simple heating up to 85 °C in a water bath under shaking, followed by a cooling step in
water of 22 °C.

3 Methods
18
Table 1: Sample composition. Sample %
lipid* (w/w)
% GB** (w/w)
% MCT (w/w)
% poloxamer*
(w/w)
Production Procedure
SLN 10 10 0 2.5 NLC-0.2 10 9.8 0.2 2.5 NLC-0.4 10 9.6 0.4 2.5 NLC-1.0 10 9 1 2.5 NLC-1.5 10 8.5 1.5 2.5 NLC-2.0 10 8 2 2.5 NLC-2.5 10 7.5 2.5 2.5 NLC-3.0 10 7 3 2.5 NLC-4.0 10 6 4 2.5 NLC-5.0 10 5 5 2.5 NLC-7.5 10 2.5 7.5 2.5 NEmu-0.2% 0.2 0 0.2 2.5 NEmu-0.4% 0.4 0 0.4 2.5 NEmu-1% 1 0 1 2.5 NEmu-2.5% 2.5 0 2.5 2.5 NEmu-5% 5 0 5 2.5 NEmu-7.5% 7.5 0 7.5 2.5 NEmu-10% 10 0 10 2.5
Homogenization of hot dispersions composed of single lipid or mixture of lipids and aqueous poloxamer solution
Mix-0.2 10 9.8 0.2 2.5 Mix-0.4 10 9.6 0.4 2.5 Mix-1.0 10 9 1 2.5 Mix-1.5 10 8.5 1.5 2.5 Mix-2.0 10 8 2 2.5 Mix-2.5 10 7.5 2.5 2.5 Mix-3.0 10 7 3 2.5 Mix-4.0 10 6 4 2.5 Mix-5.0 10 5 5 2.5 Mix-7.5 10 7.5 2.5 2.5
Separate preparation of SLN and
MCT-nanoemulsion (NEmu-10%); followed by mixing of
both dispersions in desired ratio
Micro-GB 10 10 0 2.5 Micro-MCT 10 0 10 2.5
Preparation by ultra turrax
Bulk mixture 100 98 2 0 Melting and recrystallizing of lipid bulk ware melt
* for TEM measuring 1.5 % lipid and 0.5 % poloxamer ** in case of HF-SLN use of hardfat instead of GB
The microemulsion was prepared by adding two components. Component I of the
microemulsion consists of 34.5 % polysorbate 80, 44.8 % propylenglycol, 10.35 %

3 Methods
19
dodecanol and 10.35 % cera perliquida. Dissolution is given by lukewarm conditions. To
component I (70 % (w/w)) component II (30 % (w/w)), water) was added under soft
shaking.
All samples were stored at 22 °C, protected from light. The measurements described below
were performed one day after sample preparation and within one month in case of TEM
studies.
3.2 Particle size determination
3.2.1 Photon correlation spectroscopy (PCS)
As an estimate for the size of the lipid particles the intensity weighted mean diameter
(often called effective diameter or z-average diameter) and the polydispersity index were
determined by photon correlation spectroscopy (PCS; Zetasizer 4, Malvern Instruments,
UK-Malvern; He-Ne-laser of 633 nm) at 25 °C under an angle of 90°. All samples were
diluted with demineralized particle- free water to an adequate scattering intensity prior to
the measurement.
Each dimensional information gained by PCS is expressed as median plus/minus range of
three experiments, each performed in triplicate.
3.2.2 Laser diffraction (LD)
Beside PCS, the dispersions were investigated by laser diffraction (LD; Coulter LS 230,
USA-Miami; He-Ne-laser of 633 nm) after dilution with particle- free water. By its
additional polarization intensity differential scattering (PIDS) technology this instrument is
capable to measure particles down to 40 nm. For the calculation of PIDS data and for the
evaluation with the Mie theory refraction has to be estimated for the particles. 1.456 as real
and 0.01 as imaginary refractive index were assumed for the particles. The average particle
size is expressed as the median volume diameter (50 % of the particle volume are below
this value). LD 99 % values indicate the percentage of particle volume below a certain
size.
Each dimensional information gained by LD is expressed as median plus/minus range of

3 Methods
20
three experiments, each performed in triplicate.
3.3 Field-flow fractionation (FFF)
Symmetric FFF was performed in a FFF PMMA channel of 30 cm length and 350 µm
height, constructed with an trapezoidal spacer of maximal width of 25 mm at the inlet
(Eclipse F, Wyatt Technology Europe, D-Woldert), lined with a membrane made from
regenerated cellulose (cut off 10,000) at the bottom side. 20 µl of water-diluted sample
(1:100) were injected. Elution medium was particle-free water. The channel flow
amounted to 1 ml/min. The cross flow was set to 3 ml/min and was stopped after 26 min.
The MALS detector (DAWN EOS, Wyatt Technology, USA-St. Barbara) was coupled
online with the FFF channel and eluting fractions were analyzed according to the average
mass weighted radius (RMS radius). The MALS detector is equipped with a He-Ne-laser
of 690 nm and the scattered light is recorded with detector elements in eighteen different
angles. The result is given in mean RMS radii. Errors are taken from ASTRA analysis
report (Version 4.9.07).
3.4 Nuclear magnetic resonance (NMR) spectroscopy of protons
1H-NMR spectra were recorded by an Avance DPX 400 spectrometer (Bruker, D-
Rheinstätten), operating at 400 MHz and 20 °C. An aliquot of each aqueous
nanodispersion was filled in a NMR-tube. Accurately weighted quantities of deuterized
water (for all aqueous samples) or chloroform-D1 (for measurement of MCT/GB bulk
ware) were added for field login and TMS was added as reference for 0 ppm.
3.5 Electron spin resonance (ESR) spectroscopy
3.5.1 In vitro determination of spin probe distribution
An ESR (synonymously EPR, electron paramagnetic resonance) equipment of 1.5 GHz (L-
band) from Magnettech (D-Berlin) was used. The measurements were done at room
temperature. The following typical parameters were used: modulation frequency, 100 kHz;
microwave power, 50 mW; modulation amplitude, 0.01 mT; time constant, 0.06 s; scan

3 Methods
21
time, 1 min; scan range, 10 mT. Localization of spin probe in different nanocompartments
was determined on probe containing samples. Further information on distribution of TB in
the samples were obtained by adding spin probe to probe-free dispersions and following
ESR measurements.
Simulation of the ESR spectra was performed by means of the PEST-software from NIH,
USA.
3.5.2 Ascorbic acid assay
The used equipment and measurement conditions were the same as declared in chapter
3.5.1. The reduction kinetics of the spin probe in the samples were gained by time
depending ESR measurements after mixing (1:1 (V/V)) with 1.6 mmolar aqueous solution
of sodium ascorbate.
3.5.3 Ex vivo measurements on human skin
Again, the equipment mentioned in chapter 3.5.1 was used. The measurements were done
at room temperature. The following typical parameters were used: modulation frequency,
100 kHz; microwave power, 50 mW; modulation amplitude, 0.1 mT; time constant, 0.06 s;
scan time, 3 min; scan range, 8 mT. In contrast to viable epidermis, enzymatic activity and
enzymatic metabolism of cryo-conserved skin are decreased, but no differences in
penetration and permeability are expected for cryo-conserved skin [174]. Three weeks after
surgery experiments on the skin were carried out. Circular pieces of 2 cm in diameter were
stamped out; rests of disinfectants (due to surgery) were dabbed away by water soaked
wads of cotton wool and stuck on a glass plate by instant adhesive to avoid artificial
wrinkles due to drying of the skin during the experiment. 10 µl of formulation were
applied on 1 cm2 human skin and immediately the measurements were started non-
invasively. During the experiments storage took place at 32 °C over a saturated solution of
sodium chloride (corresponding approximately 40-44 % relative humidity of air).
3.6 Fluorescence spectroscopy
Emission fluorescence spectra were determined with a Perkin Elmer luminescence
spectrometer LS 50 equipped with a 50 Hz xenon flash lamp and a concave grating

3 Methods
22
monochromator. Perkin Elmer names wavelength accuracy for +/− 1 nm. The spectra were
recorded at room temperature with both slit widths set at 4 nm. The excitation wavelength
was fixed at 546 nm and the emission spectra were recorded from 550 to 700 nm with a
scanning speed of 100 nm/min. Simulation of the fluorescence spectra was performed by
means of the Origin software from OriginLab Corporation, USA.
3.7 Raman spectroscopy
Raman scattering at an angle of 180° relative to the incident beam was recorded by an
Fourier transform Raman spectrometer RFS 100/S (Bruker, D-Karlsruhe). The excitation
source was a diode-pumped Nd:YAG laser with an operating wavelength of 1064 nm.
Spectra were acquired with 200 scans and a laser power of 350 mW at sample location.
The interferograms were treated with the Black-Harris four term function and Fourier
transformed to give spectra with a resolution of 4 cm-1.
The samples were placed in glass tubes (diameter 5 mm) and non- invasively analyzed at
room temperature. Spectra processing was carried out using the Bruker OPUS software.
Raman intensities were determined as integrated band intensities.
3.8 X-ray diffraction
3.8.1 By copper radiation
Wide angle X-ray scattering (WAXS; 2 Theta = 4 – 40°) was done by a Philips X-ray
generator PW 1830 (Philips, NL-Amelo), equipped with a copper anode (40 kV, 25 mA,
wavelength 0.154178 nm) and a mobile counting tube (Goniometer PW 1820). Steps of 20
s per 0.04° were chosen, so the measurement time amounts to approximately four hours.
Against loss of water, liquid samples were hold in the carrier by a Mylar film. Its own
narrow diffraction signal could be eliminated mathematically by subtraction of a blank.
3.8.2 By synchrotron radiation
Hard X-rays with wavelengths in the range from 0.01 nm to 0.1 nm are available from
synchrotron sources. They have penetration depths in matter in the order of several

3 Methods
23
centimeters as compared with those of conventional X-rays which are in the order of 10 to
100 µm. Synchrotron radiation also has a very small angular divergence which is necessary
to obtain well resolved diffraction diagrams of crystalline materials with lattice constants
as studied in this investigation. The high penetration depth allows obtaining diffraction
patterns of crystalline materials in an aqueous environment and even in a glass container.
This makes this radiation an excellent tool for the investigation of materials as studied in
this work.
We used the beam line BW5 at the storage ring DORIS in HASYLAB (Hamburger
Synchrotron Laboratorium) at DESY (Deutsches Elektronen Synchrotron) in Hamburg.
The diffractometer at this beam line is equipped with a two-dimensional, position sensitive
detector (area detector) as described by Wcislak et al. [175]. The detector is about 1 m
behind the sample. The sample was exposed to the radiation in a conventionally used glass
vial, at room temperature. As the used wavelength was about ten times smaller than the
wavelength of a copper X-ray tube, the corresponding diffraction angles are in the order of
< ~ 5° so that the detector, in this distance, catches the complete diffraction diagram.
The synchrotron data obtained from the channel numbers of the detector had to be
calibrated to the value of scattering vector. The value of scattering vector is the main
parameter which characterizes the position of a diffraction peak. Furthermore, for the
correct evaluation of reflection positions the non- linear background had to be subtracted.
By use of the software PeakFit calculations were done.
3.9 Differential scanning calorimetry (DSC)
Differential scanning calorimetry (DSC) was performed by a Mettler DSC 821 (Mettler
Toledo, D-Gießen). In 40 µl aluminum pans accurately weighted dispersions (around
15 mg) were filled. Then, the pans were hermetically closed. DSC scans were recorded at a
heating and cooling rate of 5 K/min, in comparison with an empty pan. It was made use of
nitrogen as flush gas (80 ml/min). Melting points correspond to the maxima of the DSC
curves.
3.10 Densimetrie
Density was analyzed by an Anton Paar DMA 5000 (AU-Graz), an instrument based on
the detection of density dependent shifts in the resonance frequency of a flexural resonator

3 Methods
24
filled with the undiluted sample liquid. Each formulation was measured three times at
25 °C. Each densimetric data point is expressed as median plus/minus range of three
experiments.
3.11 Refractometry
Refractive indices were determined with a refractometer of Zeiss (D-Oberkochen). As light
source an electric light bulb served. Other wavelengths except the wavelength of sodium
vapor lamp (589 nm) are filtered. Measurements were done at 20 °C with the original
undiluted nanodispersions and each data point was performed five times. The data are
expressed as median plus/minus range of the five experiments
3.12 Cryo transmission electron microscopy (Cryo-TEM)
A drop of dispersion prepared for TEM measurements was placed on a bare copper grid
and plunge frozen in liquid ethane at approximately 100 K. The sample was transferred
into a cryoelectron microscope (CEM902a, Zeiss, D-Oberkochen, Philips CM120, NL-
Eindhoven) operated at 80 kV respectively 120 kV. Samples were viewed under low-dose
conditions at a constant temperature around 77-100 K. Images were acquired by a Dage
SIT low intensity TV camera system and processed by a Kontron IBAS image processing
system in the case of the Zeiss CEM902A and a Tietz Fastscan CCD camera system for the
Philips CM120.

4 Results and discussion
25
4 Results and discussion
4.1 Particle size measurements by PCS and LD
Particle size was determined by photon correlation spectroscopy (PCS), a dynamic particle
size measurement technique [176,177]. Smaller isometric particles in a liquid diffuse faster
than bigger ones, causing faster fluctuations in the intensity of scattered light, which is
recorded in the experiment. PCS measures the diffusion coefficients of particles, and under
the assumption of spherical particle shape autocorrelation analysis yields a mean particle
diameter. Sedimentation of particles sets the upper size limit because for particles large
enough to sedimentate (e.g. often microparticles), sedimentation is superimposed on
diffusion. Weak intensities of scattered light and the required ability of fast data processing
determine the lower size limit. Anisometric particles have smaller diffusion coefficients in
comparison to spherical particles of the same volume and therefore their hydrodynamic
diameter determined by PCS is larger. Information concerning the size homogeneity of the
particles within the sample is provided by PCS in term of polydispersity index (PI).
As a further technique to obtain information on the particle size laser diffraction (LD) was
employed. Diffraction patterns of particles are recorded. According to the Mie theory, the
particle radius is calculated from the diffraction angle, the optical properties of the particle
and the suspension medium. Larger particles scatter light at smaller angles. Mie theory
provides a complete solution of the scattering problem for spherical particles. For non-
spherical particles the theory yields the equivalent sphere diameter. LD was mainly used in
this study to prove the absence of microparticles what can not clearly be evaluated by PCS.
The particle sizes obtained by static (LD, PIDS included) and dynamic light scattering (PCS)
methods are in the same range but the LD median diameters are always smaller than the
diameters obtained by PCS (table 2). Usually, differences in the results of two methods are
not unexpected when they rely on different measurement principles. In this context, the
differences can be elucidated. Particle sizes obtained by LD are always a bit smaller than
those of PCS (and FFF), because the latter determine the hydrodynamic radii which are larger
than the real radii of the spheres. Furthermore, intensity-weighted particle distribution (PCS)
result always in larger particle sizes than volume-weighted distributions (LD) because larger
particles provoke higher intensities in the particle analysis and no strong linearity is given

4 Results and discussion
26
Table 2: Dependence of particle size on the oil load of the dispersions, determined by LD and PCS, expressed as median x (xmin; xmax). Sample
LD: 50 % (V) of all particles smal-ler than [nm]
LD: 99 % (V) of all particles smal-ler than [nm]
PCS: Average par-ticle size [nm]
PCS: Polydispersity index (PI) [ ]
SLN 163 (140;216) 614 (591;711) 250 (215;287) 0.334 (0.290;0.381)
NLC-0.2 181 (133;209) 618 (509;652) 274 (206;301) 0.332 (0.252;0.370)
NLC-0.4 162 (114;185) 575 (528;607) 271 (218;305) 0.292 (0.243;0.331)
NLC-1.0 173 (148;205) 572 (532;634) 276 (241;338) 0.209 (0.180;0.225)
NLC-1.5 155 (112;202) 519 (493;576) 260 (249;325) 0.177 (0.153;0.226)
NLC-2.0 142 (121;149) 538 (482;568) 266 (238;310) 0.165 (0.149;0.181)
NLC-2.5 139 (102;173) 568 (480;550) 262 (238;311) 0.162 (0.126;0.191)
NLC-3.0 125 (114;170) 586 (447;518) 242 (241;295) 0.159 (0.104;0.181)
NLC-4.0 166 (133;190) 550 (489;575) 216 (210;281) 0.155 (0.107;0.181)
NLC-5.0 168 (145;200) 544 (515;562) 217 (212;244) 0.171 (0.128;0.189)
NLC-7.5 175 (120;214) 585 (558;610) 211 (200;276) 0.184 (0.130;0.192)
NEmu-10% 139 (128;144) 571 (508;593) 178 (170;185) 0.143 (0.120;0.150)
Mix-0.2 193 (127;227) 598 (509;659) 277 (224;281) 0.362 (0.313;0.379)
Mix-0.4 176 (137;215) 595 (511;647) 266 (222;270) 0.334 (0.307;0.370)
Mix-1.0 165 (125;192) 600 (552;672) 269 (218;272) 0.350 (0.299;0.390)
Mix-1.5 184 (133;228) 604 (587;624) 246 (220;268) 0.337 (0.318;0.354)
Mix-2.0 162 (144;187) 596 (560;607) 235 (216;288) 0.331 (0.322;0.345)
Mix-2.5 154 (128;188) 554 (536;649) 225 (207;262) 0.307 (0.257;0.331)
Mix-3.0 154 (132:192) 558 (542;574) 222 (210;247) 0.275 (0.265;0.292)
Mix-4.0 159 (135;202) 579 (550;601) 235 (199;269) 0.318 (0.258;0.325)
Mix-5.0 153 (105;187) 578 (514;640) 208 (185;219) 0.224 (0.200;0.236)
Mix-7.5 149 (106;180) 566 (518;579) 199 (172;211) 0.209 (0.193;0.228)
Micro-GB 15,830 43,310 2,404* 1.000*
Micro-MCT 19,320 32,390 8,177* 0.634*
Wi-SLN** 112 375 181 0.165
* PCS is not a suitable method for particles in the micrometer range. ** The data of a nanoemulsion are captured (measurements done at room temperature).
4 Results and discussion
27
between intensity and particle size.
As all measurements are done at room temperature, colloidal dispersions made from HF are
not crystallized at room temperature (no melting event in DSC recordable) and represent
supercooled melts, therefore the particle sizes of an emulsion are captured.
Owing to increased homogenization efficiency, however, the samples used for TEM in this
study showed PCS and LD particle sizes in general 50 to 60 nm below the sizes of
conventionally high concentrated SLN and NLC, maintaining the same PI values.
The presence of considerable amounts of micrometer particles can be excluded for all
samples under investigation from the LD results (apart from the microparticles, of course).
LD indicated that more than 99 % (V) of the particles were smaller than 620 nm in all cases.
Comparing the SLN, NLC and NEmu formulations there is no clear correlation between LD
particle size and oil load. And again, in PCS, only a trend towards smaller particle size with
increasing oil content of the dispersions seems to be given, but has to be carefully discussed
against the background of wide data ranges and high PIs. The PCS method is not sensitive
enough to characterize clearly differences in these demanding, similarly composed samples.
But the differences found by PCS between SLN and NEmu-10% are reliable. They are
correlated to differences in particle shape – if a comparable particle volume for both can be
assumed.
As the viscosity of MCT and melted GB at temperatures above 70 °C is similar [178],
differences in homogenization efficiency as a result of different viscosities can be excluded as
a cause for different size phenomena. Directly after hot high pressure homogenization all
lipids should form droplets of similar size. The subsequent crystallization should, however,
influence the shape of the nanoparticles.
Anisometric particles have smaller diffusion coefficients than spherical particles of the same
volume [179-181] and - since slower Brownian motion is correlated to apparently larger
sphere sizes - their hydrodynamic diameter is larger. Assuming similar particle volumes after
homogenization, the faster diffusion (and thus apparently smaller size) of NEmu-10%
droplets compared to SLN indicates an anisometric shape of SLN. By inversion of an
argument, the larger sizes of SLN should reflect their anisometric shape.
Only if oil loading amounts to 40 % (NLC-4.0) the particle size approaches the size of the
nanoemulsion. The particle character seems to turn more and more towards the spherical
shape of the oil droplets (see results of TEM measurements in chapter 4.11).

4 Results and discussion
28
The reflection of differences in particle shape in PCS results has already been reported
previously for triglyceride nanoparticles in the solid and liquid state, respectively [181-183].
For GB nanoparticles, a direct comparison of the PCS particle size in the solid and liquid state
was not possible since, in contrast to triglyceride nanoparticles, they cannot be maintained in
the liquid state at temperatures much below their melting point.
The droplets of the nanoemulsion have a much smaller polydispersity index (as a
characteristic parameter for the width of the particle size distribution) than all of the GB-
containing dispersions. For anisometric particles - but presumably comparable in volume - a
more non-monodisperse autocorrelation has to underlie for the measured data. The PI
describes the deviation of the measured autocorrelation function from that of a dispersion of
monodisperse spheres with the same diameter. Summarizing, the width of the particle size
distribution as reflected by the PI is strongly driven by the anisometry of particles.
Comparatively high PI values of SLN and NLC could support the idea of non-spherical
platelets, if presupposing that mainly the viscosity of lipids during emulsification drives the
particle sizes of the final formulations.
For the dispersions from the MIX series (made from physical mixtures of NEmu-10% and
SLN) there is a trend towards decreasing particle size and increasing homogeneity with
increasing oil load in all particle size measurement results. The mixing ratio determines size
and PI data. The higher the amount of NEmu-10% the more the particles resemble pure
NEmu-10% in all PCS and LD 50 % data while LD 99 % as indicator for maximal size
always shows the presence of SLN despite of high NEmu-10% admixture.
Comparing the MIX series with NLC different PI data are determined whereas differences in
particle sizes are small. Despite the same sample composition more homogeneous particle
distributions (smaller PI values) are characteristic for NLC, especially in case of high MCT
loading. This result indicates that co-processed MCT and GB form the mixed NLC particles
after lipid crystallization whereas in MIX samples they remain as separate MCT and GB
particles, respectively, after mixing.
Real or potential influences on the particle sizing results should be considered. LD data are
valuable, but uncertainty remains on the optical properties of the particles needed for PIDS
measurements; these particle parameters are not easy to obtain. No influence should be
present in the investigated samples due to surfactant micelles which “disturb” as competitive
nanocompartments because poloxamer 188 is known to arrange in micellar structures only at

4 Results and discussion
29
higher concentrations and temperatures [68,170]. But the high dilution of the samples in
water required for both LD and PCS measurements may result in surfactant diffusion from
the particle surface. A lack of stabilizing surfactant may cause the particles to aggregate.
Particle sizes and polydispersity index should thus not be taken as absolute.
Attempts to characterize dispersions of solid lipid nanoparticles without any dilution by a
HPPS-ET (High performance particle sizer, Malvern Instruments, UK-Malvern) yielded
interesting additional data. While the results for latex particles differed only by 30 nm when
measured with/without dilution, e.g. for SLN 198 nm in diluted samples (1:100, with water)
and 735 nm in undiluted samples were found. Dilution did also affect the measured particle
size of the nanoemulsion, but to a smaller extent (undiluted: 267 nm; diluted: 156 nm). The
PCS method bases on particle diffusion. If free diffusion is hindered due to high
concentration of the dispersions, a shorter diffusion length will result. As a result, the PCS
algorithm translates this into a higher particle size. The restriction is larger for anisometric
particles. One hundred-fold dilution leads to a low particle concentration in which particles
are able to diffuse independently. Moreover, our findings support the superposed SLN
arrangements which are already described in the literature [184].
Particle sizes remained unchanged over a period of at least four weeks. During long-term
storage for more than one month sometimes unpredictable gelation occurred in solid lipid
containing samples. Gels are more structured than liquids. Again, SLN are able to organize
themselves in superstructures.
4.2 Field-flow fractionation (FFF)
Field-flow fractionation (FFF) separates particles due to their Stokes radius [185,186]. The
Stokes radius drives their diffusion coefficient (in analogy to PCS). In the FFF-technique
particles are placed in a parabolic flow profile such that smaller particles are transported
faster and eluted earlier. This is achieved by applying a force field perpendicular to the
transport direction [187]. Injecting particles of equal volume and different shape, the
isometric particles will be eluted earlier than the asymmetric particles.
Looking more into detail, FFF forces all particles to suffer the same cross flow and to move
in direction to the accumulation wall with the same velocity. According to the individual
diffusion behavior of a particle, it will be relocalized and after various equilibria (between
cross flow and diffusion forces) eluted from the channel. This retention time is indirectly

4 Results and discussion
30
proportional to the diffusion coefficient.
All eluted fractions were continuously analyzed by multi-angle light scattering (MALS)
where a photometer records the scattering signals of the particles and where the result is given
in average size-weighted radius (RMS (root mean square) radius) [180]. MALS allows to
measure particle radii from 10 nm up to approximately one micrometer. MALS works
parameter- free, i.e. knowledge of particle shape or refraction index is not needed.
Figure 1 provides information about the laser light intensity arising from the samples SLN,
NLC-1.0 and NEmu-10% after elution from the FFF channel. Sample NEmu-10% is eluted
earlier and the RMS radius is smaller compared to the other two samples at the same retention
time below 19 ml. This is an indication of smaller particles (as seen by PCS, e.g.) and
different shape. For spheres the RMS radius is expected to be smaller compared to an
anisotropic shaped particle of the same volume. Because of their compact shape the droplets
of NEmu-10% are less retarded than the particles of the solid dispersions.
When the cross flow was stopped after 26 min solid particles are still localized in the channel
and start to move out whereas the elution of the droplets is nearly completed at this time. The
SLN and NLC are anisometric with higher hydrodynamic radius. Until this time, due to the
cross flow especially platelets with lower diffusion coefficients were hold more effectively in
the channel than the nanodroplets. The equilibrium between diffusion and retardation is
shifted in favor of retardation. The MCT load on NLC-1.0 seems to lead to slightly less
irregular particles compared to SLN but NLC-samples with oil loads different from NLC-1.0
should be investigated by FFF before this fact can be stated clearly.
The particle size data plotted in the upper part of figure 1 and evaluated in the table below are
in good correlation to the values found by PCS for NLC and SLN (table 2). The measuring
principle of both FFF and PCS bases on particle diffusion. The high MALS value for NEmu-
10%, especially detectable in the second part of the run, is remarkable. Even few particles in
the upper nanometer range or even in the micrometer range increase the LS diameter
drastically. This phenomenon is probably an artifact due to coalescence of MCT droplets.
Coalescence may occur due to focusing of the sample at the channel inlet and due to particle-
particle interactions on the membrane, respectively. Washing off the poloxamer molecules
from the particle surface by the elution medium may facilitate droplet growth. SLN and NLC
suffer the same conditions, but they are solid and maintain their particulate character.

4 Results and discussion
31
Fig. 1: Elution behavior of lipid nanodispersions in cross flow FFF, subsequently detected by MALS (top curves: RMS radii; bottom curves: intensities of scattered light). Table at the bottom: z-average particle sizes of the nanodispersions obtained from the upper graphic.
Formulation Z-average radius [nm] (elution by FFF and
subsequent LS measurements of elutes
gained in between 8th and 26th minute)
Z-average radius [nm] (elution by FFF and subsequent
LS measurements of elutes gained in between 8th and 32nd
minute)
SLN 185 +/− 4 300 +/− 9
NLC-1.0 160 +/− 3 198 +/− 5
NEmu-10% 273 +/− 9 723 +/− 18
1
10
100
1000
10000
3 7 11 15 19 23 27 31elution volume [ml]
root
mea
n sq
uare
radi
us [n
m]
0.0
0.1
0.2
0.3
0.4
0.5
0.6
0.7
0.8
0.9
1.0
90°
MA
LS
sign
al [v
olt]
NEmu-10%
NLC-1.0
NLC-1.0
SLN
SLN
void peaks
cross flow = 0 ml/min

4 Results and discussion
32
In FFF analysis, the width of the particle size distribution is reflected in milliliters of elution
volume in which particles can be detected. The results confirm the increased polydispersity
observed by PCS for SLN and NLC-1.0 (table 2). Of course, retardation favors peak
broadening additionally, but particle size distribution should be mirrowed well by the elution
volume.
4.3 Nuclear magnetic resonance (NMR) spectroscopy of protons
1H-NMR spectra of the colloidal GB nanosuspension (formulation SLN) and the
nanoemulsion made from MCT (formulation NEmu-10%) are shown in figure 2. In the SLN
sample only poloxamer derived, but no GB related signals are observed. This finding
indicates that the nanoparticles have crystallized. The presence of supercooled melts, which
have been observed by NMR for other “SLN”-samples [163,182] and which may exist even
twenty and more Kelvin below the melting temperature of the lipid bulk phase [188] can
therefore be excluded.
In order to facilitate the assignment of the peaks to the ingredients in the complex colloidal
mixtures, NMR spectra of aqueous poloxamer solution, of poloxamer-free homogenized
MCT-water mixtures and of GB-water mixtures were recorded (figure 3). Despite the absence
of poloxamer, both lipid dispersions showed a remarkable short term stability (LD 99 % < 3
microns after 1 day), which permitted the NMR measurements. The absence of -CH2- and
-CH3 NMR signals in GB-water mixture was expected, because solid ingredients are not
detected under the experimental conditions due to very short relaxation times. The ppm-
values of the MCT methyl and methylene protons (-CH3 : 0.9 and -CH2-: 1.3) are typical for
alkyl chains of triglycerides. Protons located near or at the glycerol part of the lipid have
higher ppm values. The ppm values for methyl and methylene groups of poloxamer can easily
be distinguished from MCT signals, because they are shifted to higher values (-CH3 : 1.2 and
-CH2-: 3.7) due to the presence of oxygen in the polymer backbone. The assignment of the
NMR signals of MCT and poloxamer are in agreement with the literature (e.g. NMR
databases and [189]).
The samples NEmu-0.2, NEmu-0.4 and NEmu-1.0 are pure nanoemulsions with very low oil
load (0.2, 0.4 and 1 % (w/w) MCT and 2.5 % poloxamer). NMR spectra were recorded
without any sens itivity problem, which demonstrates that even such little oil amounts are

4 Results and discussion
33
Fig. 2: 1H-NMR spectra of the SLN formulation made from GB (below) and of the MCT nanoemulsion (above). All signals are signed corresponding to the positions of the protons in the chemical formula above.
H OH O CH 2 CH 2 O C CH 2 H
CH 3 O CH 2 CH 2
x y x δ
β γ α α
poloxamer 188 (x = 79 and y = 28, approximately)
C
C
C
H
H
H
H
H
O
O
O
CO
CO
CO
CH 2
CH 2
CH 2
CH 2
CH 2
CH 2
CH 3
CH 3
CH 3
(CH 2 ) 4-6
(CH 2 ) 4-6
(CH 2 ) 4-6
a
cd e f gb
MCT
SLN
NEmu-10%
0.0 0.5 1.0 1.5 2.0 2.5 3.0 3.5 4.0 4.5 5.0 5.5 6.0
a
TMS
δ
δ γ
γ
H2O
b
α+β
0.0 0.5 1.0 1.5 2.0 2.5 3.0 3.5 4.0 4.5 5.0 5.5 6.0
[ppm]
c
d
e
f
g
TMS

4 Results and discussion
34
detectable by means of NMR (spectra not shown). It was surprisingly found that the line
widths of the MCT methylene protons in nanoemulsions are slightly smaller than those of
MCT bulk, because broader lines due to restricted mobility of MCT molecules on the
nanodroplet interface and line broadening caused by phase boundaries could be expected.
Different viscosities could be one possible explanation. MCT formulated as nanodroplets
experiences lower viscosity of the surrounding outer phase (viscosity of water: 1 mPa*s)
whereas MCT bulk is more viscous (30 mPa*s). Moreover, for methylene protons of the bulk
a very slightly more asymmetric signal was detected. Traces of water in the bulk could
structure the oil and broaden the signal due to superposition of different species. Additionally,
phase boundaries with different magnetic susceptibilities might increase the NMR line width
due to the introduction of local non-homogeneities of the magnetic field.
The NMR spectra of NLC and MIX samples are quite different, although the chemical
composition is the same and the sizes of the colloidal particles are comparable (figure 4). The
MCT alkyl signals in NLC samples have much lower signal amplitudes due to broader lines,
especially at lower oil loads. In contrast, alkyl signals of the MIX samples are comparable to
pure nanoemulsions and the line width is equal for all MCT loads. The reason for increasing
line widths and decreasing maximum amplitudes in the NLC samples is due to strong
interaction of the oil molecules with solid GB what leads to an increased immobilization of
the MCT molecules. Their relaxation is faster than that of unbound oil in the mixtures
[190,191]. Furthermore, the increase in line widths was more pronounced for the methyl end
group of the lipid chain. The oil should be adhered on the solid lipid surface mainly by
molecular affinities between lipophilic groups.
Previously described chemical shifts [166] of the fatty acids in GB-MCT systems can not be
confirmed. The chemical environment of the oil molecules does not differ in particles with
either high or low oil load. In this way, it can not be assumed that for low oil supplementation
the oil molecules are surrounded by a matrix of solid GB, just as little higher oil loads form
clusters inside the particle. Most probable is the localization of the oil at the particle surface
between solid glyceride and tenside layer [192,193]. The extent of immobilization of the alkyl
signals can be quantified by means of the widths at half height of the signal amplitude
(table 3).
Attempts to quantify the immobilization of the MCT protons by adding the signal amplitude
of the internal standard trimethylsilylpropionic acid sodium salt-D4 (TMS, signal at 0 ppm)

4 Results and discussion
35
[ppm]
Mix-0.2
0.00.4 0.81.2 1.6 2.0 2.4
Mix-1.0
Mix-0.4
NLC-1.0
NLC-0.2
δ d
g
e
f
NLC-0.4
f d
poloxamer-free MCT emulsion
0.0 0.4
[ppm]
poloxamer-free GB suspension dispersion
poloxamer solution
0.8 1.2 1.6 2.0 2.4 2.8
δ
g e
TMS TMS
Fig. 3: 1H-NMR spectra of a non-stabilized GB dispersion, of a non-stabilized MCT emulsion and of an aqueous poloxamer solution (from the bottom to the top).
Fig. 4: 1H-NMR spectra of hybrid lipid nanoparticles (formulations NLC-0.2, NLC-0.4, NLC-1.0), and mixtures from GB-SLN and MCT nanoemulsions (Mix-0.2, Mix-0.4, Mix-1.0) (from the bottom to the top).

4 Results and discussion
36
Table 3: Increased widths at half height of 1H-NMR signals as a feature of immobilized chemical groups.
NMR-line width at half amplitude [Hz]
LIPID-Protons POLOX-AMER
Formulation
“f”-signal 1.3 ppm
“g”-signal 0.9 ppm
“δ ”-signal 1.15 ppm
SLN - - 3.9
NLC-0.2 approx. 96 approx. 21 3.9
NLC-0.4 96.0 20.2 3.8
NLC-1.0 89.6 18.6 3.6
NEmu-10% 15.2 3.5 3.5
NEmu-0.2% 13.2 1.1 2.9
NEmu-0.4% 13.2 1.1 2.9
NEmu-1.0% 13.2 1.1 3.0
Mix-0.2 14.8 2.8 4.0
Mix-0.4 13.6 1.2 3.7
Mix-1.0 14.0 1.5 3.7
GB-dispersion without poloxamer - - -
MCT-dispersion without poloxamer 13.2 1.4 -
MCT bulk (oil) 20.8 3.4 -
aqueous solution of poloxamer - - 2.9
recrystallized melt of GB containing
2 % oil (bulk-mixture)
signals unseparated: 296 -
failed due to the line broadening of TMS in solid lipid containing samples. This line
broadening is caused by adsorption and magnetization transfer processes similar to processes
described by Mayer [194]. The line broadening was considerable less pronounced in samples
containing no solid lipid material. We attribute the higher increase in line width due to an
increased surface area (platelet structure) and the higher rigidity of the interface.
The NMR line widths of the MCT protons in the MIX samples are in the range of the
nanoemulsion. The NMR spectra of the mixed samples represent – in contrast to NLC – a

4 Results and discussion
37
superposition of the NMR spectra of SLN and NEmu. The small line widths of the MCT
protons indicate no interaction of the liquid oil with the solid lipid. It can be concluded that
steric stabilization stabilizes the particles very efficiently.
The recrystallized melt of GB bulk containing 2 % MCT is of great interest. A strong
immobilization of MCT is given due to the rigid solid lipid matrix. In comparison even to the
2 % oil loaded SLN, the bulk system let to broadened unseparated alkyl signals.
Concerning the tenside, slightly lower values for the widths at half height were obtained
through increasing MCT load on the SLN. The reason can be found in different particle
shapes: Higher oil content leads to more spherical particles and therefore less surfactant
molecules are needed to stabilize the decreased surface area. During crystallization of the
melt-emulsified glycerides poloxamer is able to stabilize the new areas efficiently enough to
prevent particle agglomeration. In pure emulsions of absolutely low oil amounts the mobility
of poloxamer is equal to an aqueous poloxamer solution. Furthermore, higher lipid content
requires more tenside molecules which causes a higher level of immobilized molecules. In
mixtures, the influence of the SLN on the widths at half height is predominant because of
SLN´s higher quantitative mixing ratios. Last of all, poloxamer seems to immobilize partly
the alkyl groups of oil droplets what is shown in the comparison of a unstabilized
nanoemulsion with its stabilized counterpart.
Briefly, the NMR results show an immobilization of the oil in the NLC formulations. The
immobilization in MCT-GB particles (formulations NLC-0.2, NLC-0.4, NLC-1.0) is not at all
comparable to high immobilization extent of the recrystallized melt of GB bulk containing
2 % oil. This is a strong indication that MCT molecules are not well fixed in the solid matrix
of the particles. But clear statements if the liquid lipid molecules stay in the inner part of the
solid matrix or stick on its outer surface finally will not can be done by NMR. For further
information ESR studies were carried out.
4.4 Electron spin resonance (ESR) spectroscopy
4.4.1 In vitro determination of spin probe distribution
In the ESR spectra only paramagnetic (e.g. TB) but not diamagnetic substances as the used
lipid or tenside provoke signals [195]. TB (4-Hydroxy-2,2,6,6-tetramethylpiperidin-1-oxyl;

4 Results and discussion
38
figure 5) belongs to the group of stable nitroxyl radicals. It is an at room temperature solid
crystalline red substance of high lipophilicity (distribution coefficient n-octanol/water
approximately 300).
Fig. 5: Chemical structure of TEMPOL benzoate. ESR permits the measurement of the molecular mobility (spectral shape) and the polarity of
the molecular environment of the probe TB (hyperfine splitting constant aN). The ESR spectra
indicate that TB experiences different environments in nanoemulsions, SLN- and NLC-
dispersions (figure 6).
Spectral simulation (figure 7) permits a
quantitative characterization (figure 8) of
the ESR spectra. The spectrum of the
nanoemulsion can be simulated with a
single species of high mobility in a
lipophilic environment. This result agrees
well with the expectation. Due to the high
lipophilicity, the nitroxide almost
completely dissolves in the oil. The ESR
spectra of the SLN can be simulated by
three different species. Species I (aN
between 1.51 mT and 1.58 mT is
molecular solubilized in a lipophilic
environment and has considerable
mobility despite the use of a solid lipid. It can be attributed to TB molecules molecular
dissolved in the lipid alkyl chains. Species II has a very small line width and a large hyperfine
splitting of 1.72 mT. It has exactly the same spectral pattern as TB solubilized in water or in
N.
OOC
O
TB
NEmu-10%
SLN
NLC-1.0
Fig. 6: GHz ESR spectra of TB in NEmu-10%, in NLC-1.0 and in SLN (from the bottom to the top).

4 Results and discussion
39
2.5 % aqueous poloxamer solutions.
Therefore, species II can be attributed to
TB molecules which are molecular
solubilized in the aqueous phase. A
competitive nanocompartment for TB in
form of tenside micelles can be excluded
because poloxamer 188 is known to
arrange in micellar structures only at
higher concentrations and temperatures
[68,170].
A further species (III) has large line widths
indicative of spin exchange processes due
to a high local concentration. The
hyperfine splitting constant (ranges from
1.65 mT to 1.68 mT) indicates a polar
environment. Species III represents TB molecules which are localized in a high local
concentration on the surface of the SLN particles. It can be concluded that crystallization of
the molten lipid nanodroplets (obtained after high pressure homogenization) leads to an
expulsion of the majority of TB molecules (about 70 %) onto the particle surface and into the
aqueous phase. The ESR spectra of the TB-loaded NLC represent also the three different
species. Increasing oil loads lead to decreasing concentrations of species II (TB in the outer
aqueous phase). However, increased concentrations of lipid-solubilized TB are only observed
at 10% oil load of the lipid phase (NLC-1.0). At lower oil loads (NLC-0.2 and NLC-0.4), TB
is preferentially localized in high local concentrations at the particle surface in a more polar
environment (species II).
Changes in the ESR patterns during storage could not be observed, neither for samples stored
at room temperature nor for them at 8 °C. Following these ESR results annealing might not
play an important role for GB because of its high melting point and its high solidification
degree in nanodispersions.
Additional experiments were performed where TB was added to the TB-free lipid
nanodispersions after the homogenization and tempering steps. The majority of the TB
remained as non-dissolved crystals and diffusion of TB through the water phase is the
I
II
III
Fig. 7: Simulated compartments for TB in NLC-1.0 (lipophilic (I), very hydrophilic (II), moderate hydrophilic (III)).

4 Results and discussion
40
velocity determining factor in this experiment. But after seven days some TB molecules were
dissolved and distributed in the sample. The recorded ESR spectra were comparable to the
regular produced samples at this time point. This indicates that TB can access all
compartments if it is added after the production of the nanodispersion.
A non- invasive determination technique for model drug localization offers superior
information as long as separation of colloidal particles and following quantitative analysis of
the drug often is a challenge [37,44]. For the investigated lipid dispersions common
separation techniques let to disappointing results. (Ultra-) centrifugation did not show sharp
separation because lipid platelets and aqueous environment do not provide distinct difference
in densities. The use of CentrisartTM tubes did not allow drug-only composed particles or even
large unbound molecules as poloxamer or drug to cross the inner filter and favors aggregation
due to concentration effects at the filter membrane. In case of GB particles there was no
possibility to redisperse agglomerates to solitaire particles. Incomplete drug capture, drug
inclusion in the lipid agglomerates or uncontrolled drug release due to carrier changing are
thinkable. Dialysis was found to be time consuming and requires particle dilution with
unknown consequences for the carrier fate.
0
20
40
60
80
100
NEmu-10% NLC-1.0 NLC-0.4 NLC-0.2 SLN
Pres
ence
of T
B [%
]
I: lipophilic compartmentII: very hydrophilic compartment (TB molecular dissolved in water, mobile)III: compartment of moderate hydrophilicity (TB connected on the particle surface)
Fig. 8:. Localization of TB in lipid nanodispersions – results of simulation of the ESR spectra by means of NIH-pest software.

4 Results and discussion
41
4.4.2 Ascorbic acid assay
The hydrophilic ascorbic acid reduces accessible TB to an ESR-silent hydroxylamine. The
ascorbic acid assay with aqueous ascorbic acid solution demonstrates that the examined SLN
are not able to protect the lipophilic TB molecule from aqueous reduction medium as it would
be expected if liquid lipid domains are surrounded by a solid lipid matrix (figure 9). The best
protection for the probe is given in a nanoemulsion which generally is not known as an most
favorable system of prolonged release. The fastest reduction was observed for SLN, which
agrees with the results of the spectral
simulation, where the highest amount of
TB was attributed to nitroxide molecules
localized in polar environments.
Generally, diffusion of TB inside the
particle is rapidly possible due to the
very short diffusion length and due to the
considerable mobility the TB molecules
inside the lipid. Reaching the surface, TB
becomes access to the reducing AA (see
figure 9: the remaining TB concentration
in SLN after only 8.5 minutes is very
low). Therefore, the packaging lattice of
the small GB platelets must be very loose
and incompact, and, above all, diffusion
over nanometric distances is always very
fast (see chapter 1.1).
Changes of the spectral shape were
observed during the reduction
experiments. The signal intensities of the
TB species localized in a polar environment (species II and III) decrease faster than the signal
intensity of species I (non-polar lipid compartment). Interesting conclusions concerning the
distribution processes of TB between the polar and the non-polar microenvironment can be
drawn. In a first scenario, no changes would be seen if distribution happens very fast (e.g.
0
20
40
60
80
100
0 10 20 30 duration of reduction assay [min]
SLN NLC-0.2 NLC-0.4 NLC-1.0 NEmu-10%
rela
tive
sign
al in
tens
ity [%
]
Fig. 9: Decrease of ESR signal intensity (time against changes in the signal area) of different nanocarrier systems during the ascorbic acid reduction assay.

4 Results and discussion
42
within milliseconds). If the distribution of TB between the different compartments would
occur very slowly (e.g. hours), a rapid decrease of the hydrophilic species would be seen and
the lipophilic species would remain and dominate the ESR spectrum (scenario two). Our
findings correspond to an intermediate scenario where we can clearly detect changes in the
spectral shape, but we do not see a dominating signal of the lipophilic species. So the
distribution process of TB between the polar and the non-polar microenvironment must be
comparable to the reduction kinetics of the hydrophilic species and therefore in the order of
seconds to minutes.
It is noteworthy, that classical release experiments can not be performed on SLN and NLC
due to their colloidal size. Determination of release kinetics for nanodispersions can be done
either by Franz flow-through diffusion cells (initially developed for skin permeation studies)
or by diluting the formulation in the medium of conventional tablet dissolution testers and
later separation of the particles from the medium. Loss of water, choose of membranes/cell
layers/media, dilution and separation processes often do not lead to meaningful and
comparable data [196] or can even cause artifacts [1,196]. So long as these problems exist,
ESR spectroscopy at least provides interesting information concerning the accessibility to the
drug molecules contained in colloidal carriers, even in a non-invasive way.
4.4.3 Ex vivo measurements on human skin
Beside peroral and parenteral application routes for SLN often a dermal administration is
proposed. For effective topical treatment of skin diseases and transdermal drug therapy, it is
imperative that the topically applied drug enters the epidermis or the dermis of the skin or the
peripherical blood, respectively. Skin penetration and permeation of the drug after topical
administration depend on the physicochemical properties of the drug molecule and on the
function of the skin as a transport barrier (stratum corneum, above all) and can be influenced
by the applied formulation. Formulations with supersaturated drug concentrations, with
penetration enhancers or with moisturizer favor the diffusion of lipophilic drugs into deeper
skin layers. In addition, the bioavailability of an active substance may be influenced by first
pass metabolism.
Up to now, the dermal application of SLN was investigated by skin-destructive methods or by
in vitro models [38,197,198]. Penetration of active substances into the skin can only be
determined by the tape stripping method or by skin slicing in e.g. steps of 100 nm. Occlusion

4 Results and discussion
43
tests work on pure in vitro models without use of skin when the loss of water from a beaker
glass covered with filter containing samples is determined. Dissolution tests are performed
membrane-free as diffusion into an appropriate acceptor medium [199] or by Franz cell
experiments. The latter can be conducted by a filter membrane, by viable skin or by
reconstructed epidermis onto which the test formulation is given. Released drug
concentrations are analyzed in the elution media floating at the bottom side of the barrier.
Often problems arise from poor drug diffusion into the acceptor medium or bad
reproducibility of the results. Special equipments are on the market for skin characterization
(e.g. viscoelasticity by cutometer, humidity by corneometer), but each determine one certain
parameter only.
ESR spectroscopy should allow following the fate of lipid systems on ex vivo skin in a non-
invasive way, by a more simultaneous view on drug distribution, sample changes or possibly
pH changes. The method could be applied on in vivo test conditions easily.
Before starting the skin experiments the ESR spectrum
of P3 (figure 10) loaded SLN sample was recorded
(figure 11). P3 was used instead of TB because less
reduction to ESR silent hydroxylamines is expected.
The spectrum indicates a low incorporation rate of P3 in
the solid lipid and the localization of the probe in a
rather polar environment. These conclusions are drawn
from considerations as described in chapter 4.4.1. In
good agreement to the results gained on the lipophilic
spin probe TB, the results are not unexpected.
After application of the SLN on human skin, water starts to evaporate. Spectral changes are
observed (figure 11, above). The immobilization of P3 increases what is indicated by a
decrease in signal intensity (figure 11, on the right, above). Furthermore, P3 distributes to a
more lipophilic environment, seen by smaller coupling constants and broader lines. Lipids of
the skin create this lipophilic environment. That is proven by SLN applied on a glass surface
(figure 12), no lipophilic compartment is available and immobilization increases drastically.
Spin-spin exchanges occur due to high local concentrations on the glass panel and the spectra
demonstrate a superposition of aggregated P3. For SLN on human skin no further changes are
detected after 90 minutes due to a nearly completed water loss from the SLN formulation.
P3
N
N
O .Fig. 10: Chemical structure of P3.

4 Results and discussion
44
Fig. 11: In-vitro ESR spectra (on the left) and their integrations (on the right) of P3-loaded SLN (on the top) and of NEmu-10% (at the bottom), gained on human skin.
46.8 48.8 50.8 52.8 54.846.8 48.8 50.8 52.8 54.8
SLN
5 min
35 min
65 min
120 min
150 min
90 min
180 min
210 min
240 min
SLN
65 min
90 min
35 min
120 min
150 min 180 min
210 min 240 min
5 min
[mT]
46.8 48.8 50.8 52.8 54.8
NEmu
46.8 48.8 50.8 52.8 54.8
90 min
240 min
35 min65 min
120 min
210 min
150 min
180 min
5 min
[mT]
NEmu
240 min
5 min
90 min
35 min
65 min
120 min
180 min 210 min
150 min

4 Results and discussion
45
Fig. 12: ESR spectra (on the left) and their integrations (on the right) of P3-loaded SLN, applied on a glass surface.
Comparing to the nanoemulsion NEmu-10% (figure 11, below) the mobility of P3 is
maintained in spite of water evaporation (constant signal intensity). The hydrophobic spin
probe is still localized in oil (smaller coupling constant and broader lines) where it is not
affected from changes in the outer phase, i.e. evaporation.
SLN and NEmu-10% are compared to a conventional microemulsion described in chapter
3.1. Microemulsions are systems known for good dermal penetration because their high
tenside content interacts with cell barriers; supersaturated microemulsions work even more
[200,201]. Reliable simulations of P3 localization in different compartments of the three
formulations are not possible since loss of water in SLN leads to probe aggregation. But
comparing the aspects of other spectra, the investigated microemulsion showed the same
results as the nanoemulsion, due to a high liquid lipid content where P3 is preferentially
localized.
Important information is obtained from the experiments where the sample has been removed
from the skin surface after 1 h by dabbing with cotton wool. For all samples SLN, NEmu-
46.8 48.8 50.8 52.8 54.846.8 48.8 50.8 52.8 54.8[mT]
SLN
SLN
5 min
30 min
60 min
90 min
120 min
150 min
180 min
5 min
30 min
60 min 90 min
180 min 150 min 120 min

4 Results and discussion
46
10% and microemulsion the signal intensity decreases, but a medium amount of model drug
is already distributed to deeper skin areas of higher lipophilicity (figure 13). Again,
simulations are not possible, the low spin probe concentrations left after dabbing can not be
calculated with acceptable error range. But the total integrated areas after dabbing could be
compared by subtraction (data not shown). The interesting result was that SLN are not
superior in penetrating deeper skin layers compared to the formulations NEmu-10% and
microemulsion.
Fig. 13: ESR spectra gained on human skin (on the left) and their integrations (on the right) after incubation (1 h) and subsequent removing of P3-loaded samples (from the bottom to the top: SLN, NEmu-10% and microemulsion).
To find an explanation for these data one should remark that even from microemulsion and
NEmu-10% not all P3 molecules are released and delivered to the skin because P3 remains in
an oily film which is easily removed from the skin surface. When starting the SLN
experiments, P3 is localized on the surface of SLN, in accordance to the former conducted
simulations in chapter 4.4.1. From there, high thermodynamic activity leads to distribute the
46.8 48.8 50.8 52.8 54.846.8 48.8 50.8 52.8 54.8[mT]
SLN
SLN
NEmu-10%
NEmu-10%
micro-emulsion
micro-emulsion

4 Results and discussion
47
hydrophobic probe to skin compartments of better solubility. But thereby, the finely and
highly distributed model on the large surface area of the solid lipid platelets does not
correspond to an increase in drug release (as expected). Solid lipid film building on the skin
after water evaporation hinders drug transport.
Summarizing, the “net P3 amount” contained in human skin after incubation (1 h) and after
removing of excessive formulation from the skin surface show that SLN do not release a
higher amount of the model drug than already established nanoemulsion or microemulsion
systems. The human stratum corneum could not be entered significantly by SLN.
4.5 Fluorescence spectroscopy
Similar to in vitro ESR analysis, fluorescence spectroscopy offers a non- invasive
determination possibility for the distribution of a model drug [37].
The lipophilic benzophenoxazone dye NR (figure 14) is known to show strong fluorescence
in a wide range of organic solvents. Its partition coefficient is noted at 196 for
chloroform/water (4 °C) and less than1 µg NR is soluble in 1 mL of water [202]. However,
fluorescence is totally quenched in aqueous medium. NR dispersed into a poloxamer solution
looses its fluorescence and becomes a clear colorless solution. Distribution experiments
where NR was added to NR-free lipid
nanodispersions failed because of the irreversible
quenching phenomenon before reaching the lipid
matrix. Therefore, the disappearance of the
fluorescence can not – in contrast to the claims
made by Olbrich et al. [203] – be discussed as an
absence of the Nile red in the water phase.
The emission spectra of many fluorescent substances are dependent on the physicochemical
properties of the solvents. NR shows solvatochromism [204], its absorption band varies in
spectral position, shape and intensity with the nature of the solvent. As a rule, in
solvatochromism the spectrum preserves its essential form, merely shifting to longer or
shorter wavelengths if the quantitative relation in a solvent mixture is changed [205].
Alterations in the spectral curves can not only be found in organic solvents of different
dielectric constants and refractive indices, but also in various structured colloid lipid
preparations like liposomes and microemulsions [202].
O
N
O ( H 5 C 2 ) 2 N
NR
Fig. 14: Chemical structure of Nile red.

4 Results and discussion
48
The emission spectra of NR shift to
shorter wavelengths with decreasing
environmental polarity. Moreover,
the fluorescence maxima exhibit the
blue shift even proportional to the
hydrophobicity of the environment.
The blue shift, the quenching
phenomenon in water and the
preferential solubility of the dye in
lipids account for the selective
staining of the colloidal lipid phase
and enable to determine the chemical
environment of the dye in a non-
invasive way.
Confirming this notion, NR-doped
SLN made from HF were
0
50
100
150
200
550 600 650 700wavelength [nm]
inte
nsity
[arb
itrar
y un
its]
HF SLN: stored at room temperature
HF SLN: stored at 8 °C
0
100
200
300
400
550 600 650wavelength [nm]
inte
nsity
[arb
itrar
y un
its]
MCT bulk
HF bulk
GB bulk
A B
0
50
100
150
200
250
300
350
400
550 600 650wavelength [nm]
inte
nsity
[arb
itrar
y un
its]
Micro-MCT
NEmu-10%Micro-GB
SLN
C
Fig. 15: Fluorescence spectra of NR (A) in HF SLN stored at different temperatures, (B) in HF bulk ware, and (C) in aqueous dispersions containing particles of different sizes.

4 Results and discussion
49
investigated. Due to the low melting point of HF and due to the colloidal size of the carrier
[33,206] at room temperature HF-SLN possess a liquid lipid matrix [207] what causes the
lack of signals by X-ray and differential scanning calorimetry measurements (data not
shown). Temperatures well below room temperature (8 °C) are required to solidify the lipid
matrix within hours to days. The emission maximum moves to a longer wavelength (figure 15
(A)), indicating a more hydrophilic environment for NR. Furthermore, a reduction of the
fluorescence intensity is observed, which indicates that more NR molecules interact with
water and loose there fluorescent properties. Both from the shift of the fluorescence spectra
and the loss of fluorescence intensity it is to conclude that the solidification of the lipid matrix
leads to the expulsion of NR from the lipid matrix to the surface of a crystalline particle.
For a better understanding, the fluorescence properties of NR in bulk ware was examined
(figure 15 (B)). The triglyceride MCT creates a more hydrophobic environment than the
partial glycerides contained in HF and GB, above all (see lipid composition described in
chapter 2.1). Intensities decrease in solid lipids, the higher melting GB bulk pronounces even
less solubility for NR than the crystal lattice of HF.
The influence of the particle size on the fluorescence properties was investigated by
comparing lipid nanoparticles (GB-SLN) with lipid microparticles (Micro-GB). Micro-GB
accommodates slightly higher numbers of NR molecules in a more hydrophobic compartment
than the nanoparticles can do (figure 15 (C)). Both, the Micro-GB and the SLN provide a
crystalline matrix with low incorporation capacity and therefore the model drug is exposed to
water. This finding is consistent with the fact that GB-SLN crystallize as very thin platelets
with a thickness of very few lipid layers: In this thesis on hand, for the first time GB
containing nanoparticles are reported to be platelets instead of spheres. It will be later
demonstrated by TEM images (chapter 4.11), e.g. In contrast, the environment for the dye in
both kinds of MCT particles is less changed. Micro-MCT protects more NR molecules
against quenching than NEmu-10% with considerable larger size dependent surface area.
The emission spectra of the nanoparticle formulations with varying oil loads are shown in
figure 16 (upper graphic). Even small changes in the MCT:GB ratio lead to remarkable
different spectra in the fluorimeter. The intensive signal at 546 nm arises from the reflection
of the entering excitation light on the particle surfaces. To get exact figures from the shifted
peaks fits are drawn to describe the experimental spectra as good as possible. On closer
inspection two simulated curves will be necessary to describe the data exactly in case of
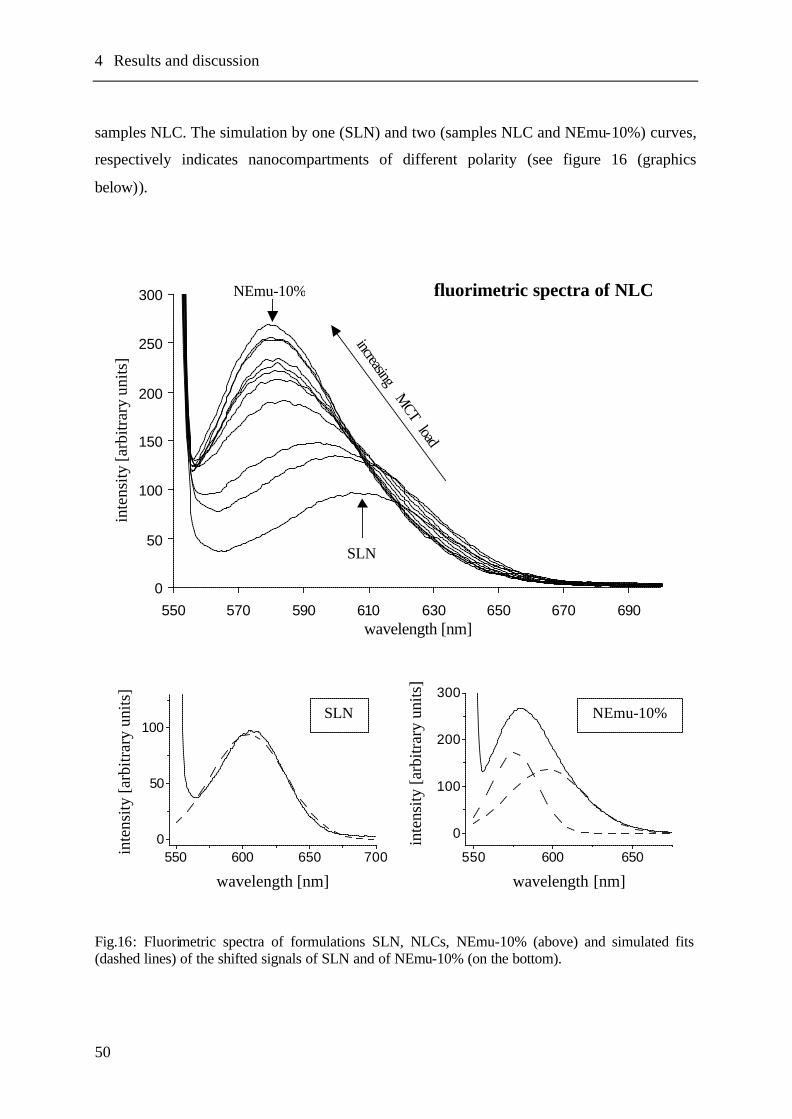
4 Results and discussion
50
samples NLC. The simulation by one (SLN) and two (samples NLC and NEmu-10%) curves,
respectively indicates nanocompartments of different polarity (see figure 16 (graphics
below)).
Fig.16: Fluorimetric spectra of formulations SLN, NLCs, NEmu-10% (above) and simulated fits (dashed lines) of the shifted signals of SLN and of NEmu-10% (on the bottom).
fluorimetric spectra of NLC
0
50
100
150
200
250
300
550 570 590 610 630 650 670 690wavelength [nm]
inte
nsity
[arb
itrar
y un
its]
SLN
NEmu-10%
increasing M
CT load
fluorimetric spectra of NLC
0
50
100
150
200
250
300
550 570 590 610 630 650 670 690wavelength [nm]
inte
nsity
[arb
itrar
y un
its]
SLN
NEmu-10%
increasing M
CT load
550 600 650 7000
50
100
inte
nsity
[arb
itrar
y un
its]
wavelength [nm]550 600 650
0
100
200
300
inte
nsity
[arb
itrar
y un
its]
wavelength [nm]
SLN NEmu-10%

4 Results and discussion
51
The following conclusions can be drawn by closer look on the peak fits:
• The fluorescence spectra of pure SLN can be simulated with one fitting curve with a
wavelength maximum in a range of 604 nm, which indicates an remarkable polarity (for
comparison: NR in acetone yields an emission maximum at 608 nm [202]). NR should be
localized on the particle surface of SLN!
• Oil load creates always an additional second (apolar) compartment at approximately
578 nm for the fluorescent marker (for comparison: NR in chloroform yields an emission
maximum at 595 nm and in xylene at 565 nm [202]). NR is either localized on the solid
particle surface or accommodated in an oily compartment. The expressive polar
compartment known from SLN disappears suddenly if oil load amounts to more than
20 %. 20 % oil load and more correspond to an oil concentration enough to host
preferentially nearly all marker molecules of the sample. But even in NEmu-10% a small
compartment with medium polarity (at 585 nm) remains where always some NR is
localized on the droplet surface whereas the majority of NR is dissolved in the droplets
(578 nm).
• It can be proven that protecting incorporation characteris tics in the solid matrix are failed.
The dye is exposed to an aqueous environment where approximately 2/3 of the marker are
quenched (see loss in intensity in figure 16 at SLN in contrast to NEmu-10%, quantified
in figure 17). Best protection from the outer environment is given in the nanoemulsion.
• The same quantification of peak areas was performed for MIX samples (figure 17).
Again, increasing MCT content in the MIX samples increases quenching protection.
Above all, regarding samples with low oil content, peak areas were diminished up to
20 %, i.e. up to 20 % less protected NR in MIXes were found in comparison with NLC.
Decreased NR protection in MIXes confirm the short diffusion pathways and rapid
distribution of NR into oily compartments of NLC. In MIXes diffusion possibility from
GB to MCT is failed (due to the presence of the aqueous diffusion barrier between liquid
and solid particles and due to quenching effects in water).
It is very important to mention the relation between fluorescence properties and concentration
of NR. In figure 18 both the emission maxima and the fluorescence intensities vary with the
concentration of NR employed. A general rule is that a linear response will be obtained until
the concentration of the fluorescent substance is sufficiently large so as to absorb significant

4 Results and discussion
52
amounts of the exciting light [208]. Non- linear response would provoke artifacts because
peak shifting and quenching phenomena could not be correlated accurately to changed sample
composition. The employed concentration of 0.25 µg NR per 1 g formulation combines
linearity with sufficient fluorescence intensity.
Summarizing, spectrofluorometric studies show a poor incorporation capacity of the marker
NR in SLN and NLC. Even the bulk ware of solid lipids can not accommodate reasonable
amounts of the dye. Concerning incorporation capacity and protection from the outer water
phase SLN and NLC are surpassed by a common nanoemulsion. It should be clearly pointed
out that the concentration of NR was 0.25 µg/g formulation, so the nanoparticles are only
negligibly loaded.
5800
7800
9800
11800
13800
15800
0 20 40 60 80 100oil load [%]
peak
are
a [a
rbit
rary
uni
ts]
SLN, NLC, NEmu-10%MIXes
Fig. 17: Dependency of the peak area on the oil content of the samples.

4 Results and discussion
53
Fig. 18: Dependency of peak area and of peak maxima on the Nile red concentration in GB-SLN (upper graphics) and in MCT nanoemulsion (after fitting; lower graphics).
peak area
0
2000
4000
6000
8000
10000
12000
0 2 4 6 8conc. of NR [µg/g]
area
[arb
itrar
y un
its]
peak maximum
570
575
580
585
590
595
600
605
610
615
0 2 4 6 8conc. of NR [µg/g]
wav
elen
gth
[nm
]
peak maximum
600
605
610
615
620
625
0 2 4 6 8conc. of NR [µg/g]
wav
elen
gth
[nm
]
peak area
0
2000
4000
6000
8000
10000
0 2 4 6 8conc. of NR [µg/g]
area
[arb
itrar
y un
its]
NEmu-10% NEmu-10%
SLN SLN

4 Results and discussion
54
4.6 Raman spectroscopy
In analogy to the infrared absorption spectroscopy (IR spectroscopy), the Raman
spectroscopy detects vibrations of molecules after excitation by an intensive laser beam [209-
212]. Characteristic Raman bands were obtained from apolar functional groups (e.g. C-C
bindings) which are inaccessible for IR measuring. Instead of providing a dipole
(indispensable for IR spectroscopy), molecular groups have to show polarizability of
electrons as the key factor for Raman spectroscopy. Both techniques, the IR and the Raman
spectroscopy give often complementary information.
In a non- invasive way, the sample is exposed to the laser beam. Approximately less than 1 %
of the exciting light quants donor a certain part of their energy to the sample molecules to
activate molecular vibrations. The scattered light is recorded and the donated energy is
expressed in form of
smaller wave numbers.
In a Raman spectrum the
differences in wave
numbers are correlated to
specific molecular
vibrations. The position
and widths of the bands
are sensitive to the
conformation of the
molecule.
Figure 19 represents the
Raman spectra of SLN,
NLC-0.2, NLC-0.4,
NLC-1.0, NLC-3.0, NLC-5.0 and NEmu-10%. SLN show a similar pattern as the formulation
NLC, but NEmu-10% is found to differ. In table 4 the bands are assigned to different
molecular vibrations. Water and poloxamer solution, respectively cause only broad peaks at
3,500 cm-1 (data not shown) and they are well separated from the interesting lipid signals.
Regarding the aspect of oil incorporation in the crystal lattice, bands indicating the order of
lipid chains are of high interest. The symmetric stretching of the methylene groups
1000 1500 2000 2500 3000 35000.00
0.01
0.02
0.03
0.04
0.05
0.06
NEmu-10%NLC-5.0NLC-3.0NLC-1.0NLC-0.4
NLC-0.2
SLN
inte
nsity
[Ram
an U
nits
]
wavenumber [cm-1]
Fig. 19: Raman spectra of different lipid nanodispersions.

4 Results and discussion
55
(at 2,842 cm-1) is an indicator for the degree of chain order and occurs in SLN and in all
formulations NLC. In contrast NEmu-10%: For the liquid lipid the signal at 2,842 cm-1 is
completely missed and less pronounced concerning the factor splitting group. Moreover the
band at 2,852 cm-1 occurs which indicates failing order. Oil loading did not lead to changed
lipid chain arrangement and oil incorporation could not be confirmed by these data.
Table 4: Observed Raman bands and assignments to molecular vibrations.
No significant differences have been found between the experimental spectra of NLC-0.2 and
the superposition of the corresponding NEmu-10% and SLN spectra. NLC-0.2 reacts in
Raman spectroscopy as it would be composed of a nanoemulsion and of a nanosuspension,
without interaction of both lipids.
Despite of DSC, NMR, ESR and X-ray measurements which did not show remarkable
changes in the solid lipid dispersions, Raman spectroscopy seems to indicate further lipid
ordering during storage (figure 20). The signal at 1,420 cm-1 becomes more pronounced, i.e.
the packaging density is changed. Often the more pronounced signals are accompanied by
gelation of the samples. At the investigated sample on hand (NLC-1.0), gelation has already
begun after 49 days, seen by slightly increased viscosity. While storage over nearly five
months took place, NLC-1.0 solidified totally.
Band position [cm-1] Assignment “Diagnostic value”
between 800 to 900 CH3 rocking Sharp band indicates 3 consecutive trans
1060 C-C asymmetric stretching Sharp band indicates 3 consecutive trans
1130 C-C symmetric stretching Sharp band indicates 3 consecutive trans
1295 CH2 twisting
1420/1440/1465 CH2 scissoring Indicator of packing behavior
2842/2852 CH2 symmetric stretching Low band position and high intensity indicate trans
2880 CH2 antisymmetric stretching Sharp band indicates 3 consecutive trans

4 Results and discussion
56
4.7 X-ray diffraction
4.7.1 By copper radiation
Triglycerides occur in three main modifications α, ß´ and ß which differ in the arrangement
of the fatty acids. The arrangement of fatty acid chains can be determined by X-ray
measurements. X-ray diffraction patterns [213] of the investigated samples result in constant
reflexes with their maxima at the angles 2 Theta 21.2 and 23.3 (figure 21). This corresponds
to short spacings of the chains at 0.42 and 0.38 nm what is attributed to the ß´-modification of
the solid lipid [69,214]. The presence of diglycerides is known to favor the ß´-modification of
the lipid [215,216]. MCT did not lead to changed patterns, so the lipid crystal structure in X-
ray measurements do not seem to be disturbed by the oil adding. Even after six months of
storage the X-ray patterns remain unchanged.
800 1000 1200 1400 16000.000
0.005
0.010
0.015
0.020
0.025
0.030
0.035
141 d
1 d
14 d
49 d
Ram
an u
nits
[arb
itrar
y un
its]
wavenumber [cm-1]
Fig. 20: Raman spectra of the formulation NLC-1.0 during storage process. After 49 d, the sample has already started to build a gel, and after 141 d, it was solid.

4 Results and discussion
57
For the sake of completeness it should be
mentioned that attempts failed to modify
the ß´-modification in favor of the α-
modification. The α-modification has a
comparatively higher incorporation
capacity for host molecules due to more
irregular lipid structure, but is less
thermodynamically stable. Therefore,
attempts have been made to stabilize the
alpha-modification by additives. Cocoa
butter containing GB nanoparticles
remained in ß´-modification (ad-mixture
of 3 or 4 % cocoa butter to food lipids is
a common mean to stabilize the lower
melting α-modification in chocolate [217] or after producing with the α-tending substance
polyglycerol-polyricinoleate [120]. Rapid crystallization forced at 5 °C resulted in ß´-
modification. By shock cooling in liquid nitrogen the GB-SLN directly after melt-
emulsification transformed into a gel. Moreover, it is doubtful if, firstly, the concept of α-
lipids realizes a remarkable increase in drug or oil incorporation. Still, the lipid is an
structured crystal what usually hinders an uptake of foreign molecules. Secondly, the α-
modification is thermodynamically unstable and tends to build the more stable ß-
modifications. It will be difficult to guarantee α-modification over long-term storage. Also,
the possible advantage of the higher incorporation rate is probably paid of by the enhanced
diffusion coefficients [162].
4.7.2 By means of synchrotron radiation
During conventional X-ray analysis the samples are faced to high energetic radiation over
long exposure times of approximately four hours. It is thinkable that lipid modifications are
changed due to calorific input. Synchrotron measurements are fast-recording X-ray
diffraction measurements. They should elucidate this possibility of modification change.
Synchrotron radiation is a very intensive beam of high parallelism in spreading direction of
15 17 19 21 232 Theta
Fig. 21: X-ray (copper anode) diffraction patterns of formulations SLN, NLC-0.2, NLC-0.4, NLC-1.0, Mix-0.2, Mix-0.4 and Mix-1.0 oil load (from the bottom to the top). Formulation NEmu-10% does not provoke reflexes.

4 Results and discussion
58
the rays. In contrast to the measurements performed with copper radiation, synchrotron
measurements were performed within seconds.
Synchrotron results are
presented in figure 22. As the
used wavelength is about ten
times smaller than the
wavelength of the copper X-ray
tube (approximately 0.15 nm),
the corresponding diffraction
angles are ten times smaller and
lie below 0.5 nm. The
diffraction patterns of the
samples SLN, NLC-0.4 and
NLC-5.0 resemble the patterns
previously gained by copper X-
ray measurements. Therefore,
the former conducted X-ray
experiments are reliable. Above
all, with the accuracy smaller than 1 % all synchrotron reflections are unchanged for
synchrotron samples among themselves (SLN, NLC-0.4 and NLC-5.0). Once again, oil load
did not lead to changed crystal lattices what must be assumed as prerequisite for oil
incorporation. The short spacings of the lipid chains were found at 0.42 nm and 0.39 nm,
again indicating the ß -́modification. [218-220].
4.8 Differential scanning calorimetry (DSC)
Liquids as water, supercooled glyceride fractions and MCT can not be registered using the
described temperatures and analyzing conditions. As melting events of GB were detected
(figure 23), supercooled GB particles can be excluded (in agreement with the NMR results
presented in this thesis ) [206]. Measurements one day and four weeks after production let to
the same melting pattern.
While the later from a nanoemulsion and from SLN mixed formulations did not differ in their
melting behavior compared to formulation SLN, the MCT loaded samples did. Firstly, a
0.125 0.150 0.1750
100
200
300
400
500
600
700
inte
nsity
[ar
bitr
ary
units
]
wavelength [nm]
Fig. 22: Synchrotron diffraction patterns after background subtraction of formulations NLC-5.0, NLC-0.4 and SLN (from the bottom to the top; SLN curve shifted by +100 units on the y-axis). Formulation NEmu-10% did not provoke reflexes.

4 Results and discussion
59
depression of the GB melting point can be mentioned which keeps nearly linear even with oil
loads up to 75 % (figure 24). Secondly, the difference between the onset point and the peak
maxima increased with higher oil load, a signal for more irregular arrangement of molecules
(values range from 2.6 K at
formulation SLN to 3.9 K at
formulation NLC-1.0). These two
phenomena show an interaction of
oily molecules with the crystalline
matrix, but an incorporation can not
be claimed necessarily. A
depression of the melting point in
these fine GB platelets can be
provoked even through oil spots or
layers on their surface. Just particle
shape, colloidal character and
particle environment have a big
impact on the melting point [33] as
particle size distribution [221,222],
too.
It was claimed that MCT localization inside GB particles could be characterized by freezing
out the dispersion downwards to temperatures of approximately minus 60 °C [223].
Interrelated MCT molecules should result in an endothermic crystallization event whereas
statistically over the whole GB matrix distributed oil molecules should not be able to form
MCT crystals with specific crystallization energy due to the hindering GB barrier. This
method was found to be unsuitable for the given measuring problem. Freezing let to
crystallize the outer water phase of the dispersion first and unpredictably other components
were precipitated in this step. DSC results should be always discussed carefully because the
method is invasive and the recorded measuring signals may come from a sample possibly
changed by the temperature regimen.
30 40 50 60 70 80
10
15
20
25
enth
alpy
[arb
itrar
y un
its]
temperature [°C]
Fig. 23: DSC heating curves (5 K/min) of formulations SLN, NLC-0.2, NLC-0.4, NLC-1.0, NEmu-10%, Mix-0.2, Mix-0.4 and Mix-1.0 (from the bottom to the top).

4 Results and discussion
60
4.9 Densimetrie
Density is known to vary with the different modifications of a lipid. From earlier
examinations [224] we know that oil load does not change the modification of GB.
Increasing MCT content lowered in strong linearity the density of the samples (figure 25).
Due to the linearity it can be assumed that the packing density of the GB lattices is not
disturbed or changed. MCT molecules are not incorporated in between the chains of the solid
matrix. Moreover, because of the similarity to the densities gained with MIXes separated
nanocompartments consisting of MCT or of GB make more sense. A disturbed packing
density was claimed in [223] due to wrong interpretations of imprecise measurements.
4.10 Refractometry
Further results on the interaction of the oil with the solid lipid matrix were obtained by
refractometry (figure 26). Increasing MCT loads lower the refractive indices linearly
correlated. For both samples NLC and MIX separated nanocompartments (MCT and GB) can
be observed. Particles in the given nanometric range interact less pronounced but clearly
detectable with light of 589 nm. Advantageous is the bright color of the thin lipid particles for
the detection of light refraction.
58
60
62
64
66
68
70
72
0 15 30 45 60 75
oil load [%]
GB
mel
ting
poin
t [°C
]
Fig. 24: Decrease in GB melting point with increasing MCT load of NLC (experiments done with oil loads from 0 to 75 %).

4 Results and discussion
61
1.335
1.337
1.339
1.341
1.343
1.345
1.347
1.349
1.351
1.353
0 2 4 6 8 10
MCT [% (w/w)]
refr
activ
e in
dex
[ ]
Fig. 26: Dependence of the refractive index on the oil content at 20 °C (legend: circle for formulations of different oil loads (SLN, NLCs and NEmu-10%); cross for MIXES; triangle for samples NEmu; horizontal dashed line for a lipid-free poloxamer solution). The maximal range for a median amounts to +/− 0.0003 what makes possible differences between the two upper curves negligible, but what is too small to be drawn in the graphic.
0.9945
0.9955
0.9965
0.9975
0.9985
0.9995
1.0005
1.0015
0 2 4 6 8 10
MCT [% (w/w)]
dens
ity [g
/cm
3 ]
Fig. 25: Dependence of the density on the oil content at 25 °C (legend: circle for formulations of different oil loads (SLN, NLCs and NEmu-10%); cross for MIXES; triangle for samples NEmu; upper dashed line for a lipid-free poloxamer solution; lower dashed line for water). The density for MCT bulk was determined at 0.941569 g/cm3. Statistical ranges of each measuring p oint are too small to be drawn in the figure.

4 Results and discussion
62
To proceed on the rough assumption based on the claims in the literature that incorporated oil
molecules are covered by the solid lipid matrix and that oil (and sensitive drug molecules
inside the oily domains of NLC) are protected from rays of light, oil should not contribute to
the refractive index. But the opposite was found, MCT contributes to the refractive index.
Hence, light-sensitive drug molecules are not protected by NLC.
Failing light protection can be stated clearly. Nevertheless, by refractometry the model of
expelled MCT from the solid core can not be confirmed for certain because little is known on
light-particle interaction. Artifacts could be possible since a high penetration depth of light
may capture incorporated oil in the solid core itself.
4.11 Cryo transmission electron microscopy (Cryo-TEM)
The ultra structure of single lipid particles is revealed in the electron microscopic studies
(figure 27).
The micrograph of NEmu-10% shows only circular dark structures which are attributed to
spherical nanodroplets (figure 27, image A). The SLN dispersion has a completely different
electron microscopic appearance (image B): weak circular and ellipsoidal structures represent
thin platelets in top view. If the particles are viewed edge-on, they appear as dark rods or
“needles” since, in this position, the increased thickness of the structures leads to a darker
appearance. The rod- or needle- like particles in the electron micrographs were typically of a
thickness of about 10 nm and below. It should be noted, however, that very large and thus
potentially thicker particles may not be detected in this position since their dimensions may
exceed the thickness of the sample film. Generally, cryoelectron micrographs tend to be
strongly biased towards small particles as a result of the preparation technique. After applying
the liquid sample to the microscopic grid excess liquid is removed with a piece of filter paper
until only an extremely thin sample film remains in the holes of the grid, particularly in their
center. Structures larger than the thickness of this film are either removed or relocated to
thicker film areas (which are usually too sensitive towards the electron beam to be reliably
investigated) during this process. Anisometric particles - such as platelets - may align in such
a way that their largest dimension is stretched out in the plane of the film. As a result, a direct
comparison of particle sizes observed in cryo TEM with the results of particle sizing
techniques such as PCS or LD should not be performed for the dispersions under
investigation.
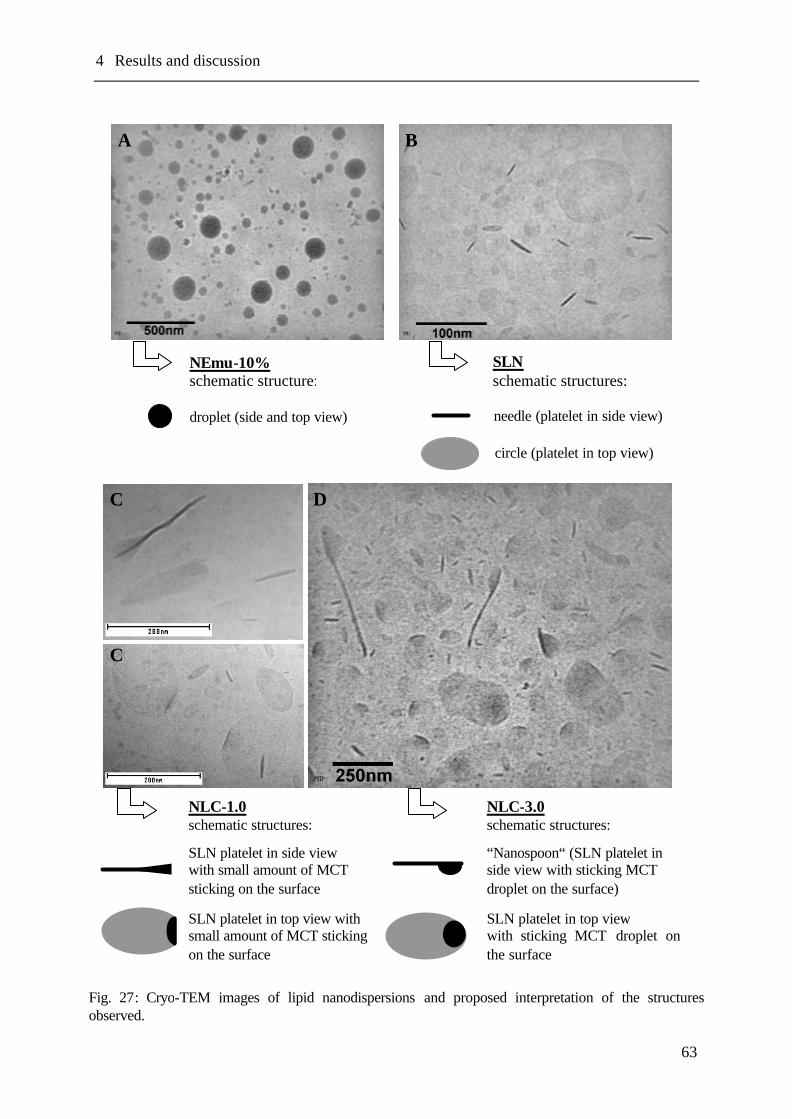
4 Results and discussion
63
.
SLN schematic structures:
needle (platelet in side view)
circle (platelet in top view)
NEmu-10% schematic structure:
droplet (side and top view)
SLN platelet in side view with small amount of MCT sticking on the surface
SLN platelet in top view with small amount of MCT sticking on the surface
NLC-3.0 schematic structures:
“Nanospoon“ (SLN platelet in side view with sticking MCT droplet on the surface)
SLN platelet in top view with sticking MCT droplet on the surface
NLC-1.0 schematic structures:
Fig. 27: Cryo-TEM images of lipid nanodispersions and proposed interpretation of the structures observed.
A B
C
C
D

4 Results and discussion
64
NLC-particles with an oil- load of 10, 30 and 50 % of the lipid phase were also under
investigation. Examples of the results are shown in images C and D. From these micrographs,
which show quite heterogeneous structures, it has to be concluded that GB-nanoparticles
loaded with MCT represent “hybrid” structures between NEmu and SLN. As in the SLN
dispersion (image B), “needles” and circular structures characteristic of crystalline, platelet-
shaped particles can be detected. But compared to SLN, these structures are of modified
appearance, e.g., with darker spots on the circular structures, or “caps” on the needles
projected in side view. These spots and caps can be attributed to the presence of liquid oil on
the surface of the crystalline GB particles. In some cases, the darker, crystalline lipid in side-
view seems to be slightly bent around the oil fraction or even folded up. Already at a low oil
load of only 10 % (image C) there are indications for the presence of two-phase particles. At
an increased MCT load of 30 % (image D) among others a characteristic “nanospoon”
structure can be observed where the liquid oil is localized as distinctive droplet with lower
contrast on the solid lipid platelet projected in side view. In top view, the MCT spots appear
darker than the platelet itself since their presence increases the thickness of the structure.
Even though some particles seem to contain liquid oil on both platelet surfaces the
localization on one side of the particle only seems to be energetically favorable compared to
an even distribution over the whole particle surface as was previously also been observed for
triglyceride nanoparticles loaded with the supercooled liquid drug ubidecarenone [192].
The question if the low MCT load of 10 % leads to asymmetric and non-spherical GB circles
in top view and if the liquid MCT enables the platelet to fold up will require further
investigations on these novel structures. The most important result of the electron
microscopic investigations seems to be the oil separation as own nanocompartment within the
nanoparticles. Moreover, the TEM analysis clearly reveals the anisometric shape of the
particles with a high amount of solid lipid with particle sizes being in the range of that
indicated by the light scattering techniques (table 2).
In contrast to some literature reports, where SLN are often assumed to be spherical
[7,165,167,168] GB nanoparticles without oil load are imaged as thin platelets with circular
to irregular contours (figure 27, image B). Particles with thicknesses as low as about 10 nm
and below were observed in the GB dispersion. This corresponds to one or two molecular
layers assuming a short spacing of 6.16 nm as reported for the β’-modification of GB [162].
Platelet- like particles consisting of a few molecular layers only have already been observed in
4 Results and discussion
65
dispersions of saturated monoacid triglycerides in the β-modification [221,225]. Our present
results lead to the conclusion that they can also form in dispersions of a complex glyceride
mixture with comparatively low triglyceride content.
5 Summary and conclusions
66
5 Summary and conclusions
5.1 English version
The aim of the present study was a physicochemical characterization of lipid
nanodispersions, especially focused on colloidal solid lipid particles. The experiments
should lead to a better understanding of structure and behavior of these very complex drug
carrier systems.
SLN and nanoemulsions are easily to produce at small and large scale. All prepared
samples are very well short-time stable over at least one month with respect to particle
size, DSC, X-ray, NMR and ESR characteristics. Especially for GB particles strong ageing
effects could not be observed in the studies, too, only by Raman spectroscopy slight
changes in the spectra are detected during storage. But sometimes unpredictable gelation of
SLN occurred during long-term storing what – in contrast - was never seen for
nanoemulsions.
The NMR results show an immobilization of the oil in the NLC formulations. The
immobilization in MCT GB particles is not at all comparable to high immobilization extent
of the recrystallized melt of GB bulk containing 2 % oil. This is a strong indication that
MCT molecules are not well fixed in the solid matrix of the particles. But clear statements
if the liquid lipid molecules stay in the inner part of the solid matrix or stick on its outer
surface finally will not can be done by NMR. For further information ESR studies were
carried out.
The current in vitro ESR experiments on the nanoemulsion and on oil loaded GB-SLN
demonstrate a preferable localization of the lipophilic model drug in the oil where it is
better dissolved than in the solid lipid. Only decreasing MCT loads in the samples force
TB molecules to concentrate on the lipid particle surface or to be dissolved in water. In
pure SLN only a third of all TB molecules is located in a lipophilic compartment.
ESR reduction experiments show that all TB molecules in any compartment of SLN
systems (including the more lipophilicly localized molecules) are rapidly reduced from
aqueous AA. NEmu-10% offered the best protection capacities for TB, a carrier which in
general is known for immediate drug release! The inner volume of the droplets is better
protected against water than the inner volume of SLN. NLC were found to lay in-between

5 Summary and conclusions
67
SLN and NEmu-10%, according their amount of oil content. The results of the ESR
reduction experiments clearly show that the accommodation and protection of foreign
lipophilic molecules is poor for SLN and NLC with low oil load.
By a further non- invasive technique, the fluorescence spectroscopy, the hydrophobic
fluorescent marker NR indicates the polarity of its environment due to solvatochromism.
SLN offered only one polar compartment for NR molecules, defined by water contact.
Increasing MCT creates a hydrophobic compartment for NR. Spectrofluorometric studies
show a poor incorporation capacity of the marker NR in SLN and NLC of low MCT load.
Even the bulk ware of solid lipids can not accommodate reasonable amounts of the dye.
Concerning incorporation capacity and protection from the outer water phase SLN and
NLC are surpassed by a common nanoemulsion.
Measurements performed by X-ray and synchrotron radiation, densimetrie, refractometry
and Raman spectroscopy confirm the idea of intact GB lattices in spite of oil loading. The
lipid crystals are not disturbed in their structure as it could be suggested in case of oil
incorporation.
Beside incorporation capacity particle shape was investigated. Until now, solid lipid
particles were described to be spherical [7,165,167,168] what should offer a maximal
volume for drug and oil incorporation. Particle size analysis by PCS indicated differences
between SLN and nanoemulsion. Assuming similar particle volumes after homogenization
due to comparable homogenization efficiency and due to the same viscosity at the
homogenization temperature for both lipid melts, the diffusion of anisometric shaped
carriers in the PCS equipment is slower than for isometric particles. By inversion of an
argument, the larger sizes obtained for SLN should reflect their anisometric shape.
In contrast to LD (and partly PCS) measurements, flow FFF discriminates between SLN,
NLC and nanoemulsion. The droplets of the nanoemulsion are less retarded than NLC and
SLN, above all. NEmu-10% eluted therefore earlier and showed smaller sizes. Together, it
is a clear indication that the investigated solid lipid containing particles in general do not
possess a spherical compact shape.
Finally, the ultra structure of the dispersions was revealed in TEM studies. The micrograph
of the nanoemulsion shows only circular dark structures which are attributed to spherical
nanodroplets. SLN present themselves as dark needle-shaped or weak ellipsoidal
structures, i.e. platelets are viewed either in side or top view. For oil loaded solid particles

5 Summary and conclusions
68
hybrid structures between nanoemulsion and SLN were found. Indeed, onto platelet-shaped
particles oil spots or even little oil droplets (“nanospoons”) were found. In conclusion, the
results on thin SLN platelets disprove the common assumption of incorporation of drug
molecules or liquid oil compartments in voluminous SLN spheres. Liquid lipids adhere to
the surface of thin crystalline lipid matrix particles forming clearly detectable droplets even
at oil loads claimed to be completely incorporated [164,166].
The interesting thin platelet character of SLN combined with good drug access due to
localization on the tremendous large particle surface area makes SLN attractive to be tested
on ex vivo human skin by ESR. But SLN were not found to be superior to the established
systems nanoemulsion and microemulsion. SLN platelets formed a wall made from solid
lipid after water evaporation. This wall made further drug transport into the skin
impossible. Although the drug is presented predominately on a large carrier surface, this
did not correlate to a better bioavailability.
Summarizing, this thesis reveals the common theory of drug localization in the solid lipid
particle core (SLN) as well as the incorporation of oily domains of high drug content in the
particles (NLC) (figure 28 (a)). The results indicate that the studied colloidal lipid matrices
show neither a protection from aqueous environment (what could be expected due to the
solid matrix), nor retardation capacities, nor a sufficient incorporation rate. Instead of the
postulated inner oil droplets (NLC) or incorporated drug molecules (SLN) in the solid
matrix, the existence of drug or MCT molecules, respectively, presented on the solid
particle surface is more probable in this complex system. Distribution of drug or oil (i.e. oil
as molecules or as clusters) inside a crystallized matrix of a nanoparticle is not probable
because crystals with their regular structures only tolerate rare defects to incorporate host
molecules: Drug or oil, respectively, are ejected from the molten lipid mix during the lipid
crystallization process at the cooling step. Even in case of 2 % oil loading (formulation
NLC-0.2) oil expulsion happens, so the postulated oil incorporation rates up to 16 or 38 %,
respectively [164,166], can not be confirmed. In case that it would have been successfully
to incorporate at least this low amount of oil (what could not be found!) it would never be
possible to reach a reasonable drug incorporation rate because of low drug solubility
capacity in these few MCT molecules.
However, the liquid lipid in NLC remain adhered to the solid lipid particle surface. It
forms spots on the particle surface (figure 28 (b)). Additionally, increasing oil rates (from

5 Summary and conclusions
69
approximately 10 % up) lead to the formation of oily droplets sticking on comparatively
small GB platelets (figure 28 (b)). Very short diffusion pathways in platelets, increased
water-lipid interphases and low drug incorporation in crystalline lipids are the drawbacks
of SLN and NLC compared to conventional nanoemulsions.
It should be remembered that all measurements were performed with a lipid consisting of
glyceride mixtures with a less ordered matrix in ß´-modification. X-ray diffraction patterns
prove the ß´-modification of SLN and NLC. By its numerous defects in crystal lattice GB
should facilitate drug incorporation [35,182,226], i.e. show better accommodation than
more regular structured triglycerides.
For all investigations lipophilic model drugs were used (TB, P3, NR). Even lipophilic
substances did not show satisfactory incorporation in solid lipid carriers. It should be
clearly pointed out that the concentrations of TB and NR amounted to 0.276 mg TB/g
formulation or 0.25 µg NR/g formulation, so the nanoparticles are only negligible loaded.
It can be followed that attempts for higher loading rates or even the incorporation of
hydrophilic molecules will be unsuccessful, although the latter is claimed in the literature
[161].
Missing protection and failed incorporation of considerable drug amounts as well as
solemn long-term stability problems (gelation, particle growth) will hinder the entrance of
SLN and NLC into the industrial market in the future, too. Intravenous application is
claimed but offers high potential risks due to particle size and platelet shape. Because of
low incorporation rates in most cases SLN are not attractive to be given perorally,
moreover, protection of drug molecules against acid or enzymes is not realizable.
The best opportunities for solid lipid nanoparticles are seen as compounds in cosmetic
products. E.g. synergistic effects are known for sun blocker milks containing SLN where
both sun rays are reflected at the particle surface and the sun blocking active substance
absorbs ultraviolet radiation [227]. Disadvantageous is the use of lipids in sun screeners,
modern formulations avoid the use of acne provoking ingredients. Skin caring creams with
SLN promise an improved skin hydration due to occlusive effects of the SLN platelets
[228].
In all key properties SLN are surpassed by a common nanoemulsion. The drawbacks of
SLN are inherent due to the crystalline state of the nanocarrier. I.e., the crystalline state of
SLN and NLC is the underlying idea of these nanocarriers, but in the same time the reason

5 Summary and conclusions
70
for the above mentioned drawbacks. Modification changes or ad-mixtures of other
lipophilic substances can not resolve the basic carrier conflict.
In general, lipid based drug carriers are very well tolerated in contact with human cells and
there are worthy to be further investigated in the future - despite the disappointing results
gained for SLN and NLC. Colloidal systems proposed as drug carriers do not at all present
trivial systems. In the context of this thesis, their complexity is reflected in the choice of
various, mostly non- invasive analyzing techniques. Drug delivery systems designed by
nanotechnology are not a priori superior to conventional systems because of their colloidal
size. Critical discussions on drug carriers which are basing on nanotechnology keep on
being indispensable and highly fruitful.
Fig. 28: Schematic structures of NLC, (a) model proposed in the literature, (b) models developed due to current experiments, varying with increasing amount of oil loading ( oil (MCT), solid lipid (GB), stabilizer (poloxamer)).
(a)
(b)

5 Summary and conclusions
71
5.2 German version
Zielsetzung der vorliegenden Arbeit war, Lipidnanodispersionen physikochemisch zu
charakterisieren, wobei der Schwerpunkt der Untersuchungen auf kolloidalen festen
Lipidpartikeln lag. Struktur und Dynamik dieser komplexen Arzneiträgersysteme sollten
besser verstanden werden.
SLN und Nanoemulsionen lassen sich sowohl in kleinem Maßstab als auch großtechnisch
herstellen. Alle im Rahmen dieser Arbeit hergestellten Proben erwiesen sich als sehr stabil
innerhalb eines kurzen Zeitraumes von einem Monat, da sich Partikelgröße, DSC-
Verhalten, Röntgendiffraktogramme, NMR- und ESR-Spektren nicht änderten.
Ausgeprägte Alterungseffekte konnten für GB-Partikel nicht beobachtet werden, nur die
Ramanspektroskopie wies leichte Spektrenveränderungen über den Lagerungszeitraum auf.
Zudem trat über längere Lagerzeiträume gelegentlich und unvorhersehbar Gelierung der
SLN auf - was jedoch im Gegensatz dazu für Nanoemulsionen nie feststellbar war.
NMR-Messungen zeigten eine Immobilisierung des Öls in den NLC-Formulierungen. Das
Ausmaß der Immobilisierung von MCT in GB-Partikeln war jedoch unvergleichbar
niedriger als die starke Immobilisierung von 2 % MCT-Zusatz in rekristallisiertem GB-
Rohmaterial. Das ist ein deutlicher Hinweis darauf, daß die MCT-Moleküle nicht fest in
der festen Matrix der Partikel verankert sind. Durch NMR-Messungen allein ist nicht
eindeutig unterscheidbar, ob sich die Flüssiglipidmoleküle im Inneren oder an der
Oberfläche der SLN aufhalten. ESR-Messungen sollten Klarheit schaffen.
Durch in vitro-ESR-Experimente an der Nanoemulsion und an ölbeladenen GB-SLN
wurde der bevorzugte Aufenthalt des lipophilen Modellarzneistoffes im Öl nachgewiesen,
wo er im Vergleich zum Festlipid besser gelöst wird. Lediglich abnehmende Ölbeladungen
in den Proben zwingen die TB-Moleküle zu einer Aufkonzentrierung an der
Lipidoberfläche oder zu einem Aufenthalt in Wasser. In konventionellen SLN ohne
Ölbeladung fand sich nur ein Drittel aller TB-Moleküle in einem lipophilen Kompartiment
lokalisiert.
ESR-Reduktionsexperimente zeigten, daß alle TB-Moleküle, unabhängig von ihrem
Aufenthalt sort innerhalb der SLN-Dispersion, schnell von wäßriger Ascorbatlösung
reduziert wurden. Das galt auch für TB-Moleküle in einem lipophilen SLN-Kompartiment.
NEmu-10%, die Nanoemulsion, die im Allgemeinen für schnelle Arzneistofffreisetzung

5 Summary and conclusions
72
bekannt ist, schützte TB am besten vor Reduktion! Das Innere der Emulsionstropfen hat
weniger Kontakt zu der umgebenden Wasserphase als das Innere der SLN. NLC lagen
bezüglich der Reduktionsgeschwindigkeit zwischen SLN und NEmu-10%, in der
Reihenfolge ihres Ölgehaltes. Klar zeigten die ESR-Reduktionsexperimente, daß SLN und
NLC mit geringer Ölbeladung nur wenige lipophile Fremdmoleküle aufzunehmen und
kaum vor Reduktion/Wasserkontakt zu schützen vermögen.
Die Fluoreszenzspektroskopie als weitere Analysenmethode nutzt den Effekt der
Solvatochrochromie. Das bedeutet, daß der hydrophobe Marker NR in
Fluoreszenzspektren durch Wellenlängenverschiebung Auskunft über die Polarität seiner
Umgebung gibt. SLN boten den NR-Molekülen nur eine polare Aufenthaltsmöglichkeit an,
geprägt durch starken Wasserkontakt. Zunehmende Ölbeladung schuf ein stark
hydrophobes Kompartiment für NR. Durch Spektrofluorometrie konnte zudem das geringe
Inkorporierungsvermögen des Markers NR in SLN and NLC geringer Ölbeladung bestätigt
werden. Sogar das Ausgangsmaterial der kristallinen Festfette duldete keine nennenswerte
Einlagerung des Fluoreszenzfarbstoffes. Wiederum zeigte sich die Überlegenheit der
Nanoemulsion gegenüber SLN und NLC in Bezug auf Inkorporierungsvermögen und
Schutz vor umgebender Wasserphase.
Ergebnisse, die durch Röntgen- und Synchrotronmessungen, Densimetrie, Refraktometrie
und Raman-Spektroskopie gewonnen wurden, bekräftigen die Idee intakter GB-
Gitterstrukturen trotz vorhandener Ölbeladungen. Die Lipidkristalle sind in ihrem Aufbau
nicht gestört, wie man es im Fall einer Ölinkorporierung erwarten könnte.
Neben der Inkorporierungskapazität wurde die Partikelform untersucht. Bis heute sind
SLN in der Literatur als kugelförmig beschrieben [7,165,167,168], was maximalen Raum
für Arzneistoff- und Öleinbettung bieten sollte. Partikelgrößenmessungen mittels PCS
zeigten jedoch Unterschiede zwischen SLN und der Nanoemulsion. Unter der
Voraussetzung, daß vergleichbare Homogenisierungskräfte auf beide Lipidschmelzen
wirken und ihre Viskositäten bei der Homogenisationstemperatur übereinstimmen, sollten
die Partikelvolumina annähernd vergleichbar sein. Die PCS-Methode detektierte für
anisometrisch geformte Partikel eine langsamere Diffusion als für isometrische Teilchen.
Im Umkehrschluß sollten die für SLN gemessenen höheren Partikelgrößen die
anisometrische Form der Partikel widerspiegeln.
Im Gegensatz zu LD (und zum Teil PCS) vermag FFF zwischen SLN, NLC und

5 Summary and conclusions
73
Nanoemulsion zu unterscheiden. Die Nanoemulsionströpfchen wurden weniger stark als
NLC und SLN retardiert. Die Probe NEmu-10% wurde deswegen früher eluiert und zeigte
kleinere Partikelgrößen. Zusammengefaßt wird deutlich, daß die untersuchten Partikel,
sofern sie festes Lipid enthalten, keine kompakte Kugelform aufweisen.
Letzte Gewißheit über die Feinstruktur der Dispersionen wurde durch TEM-Studien
erhalten. Die Aufnahmen der Nanoemulsion zeigten ausschließlich dunkle runde
Strukturen, die kugelförmigen Nanotröpfchen zugeordnet werden konnten. SLN dagegen
präsentierten sich als dunkle nadelförmige oder als leicht ellipsoide Gebilde, das heißt als
Plättchen, die entweder von der Seite oder von oben betrachtet wurden. Für ölbeladene
feste Teilchen wurden Mischformen zwischen Nanoemulsion und SLN gefunden. In der
Tat saßen auf plättchenförmigen Partikeln punktförmig Ölansammlungen oder sogar kleine
Öltropfen („Löffelstruktur“). In der Schlußfolgerung verwerfen die gewonnenen
Ergebnisse (SLN als dünne Plättchen) die gängige Vorstellung voluminöser SLN-Kugeln,
die Arzneistoff oder gar Ölkompartimente einbetten sollen. Flüssiglipide haften an der
Oberfläche der dünnen kristallinen Lipidmatrix, wo sie klar abgegrenzte Tröpfchen
formen. Das war selbst bei Ölbeladungen zu beobachten, für die eine vollständige
Inkorporierung postuliert wird [164,166].
Der dünne Plättchencharakter der SLN korreliert mit einer großen Oberfläche. Die große
Oberfläche wiederum unterstützt eine Lokalisation von Arzneistoff auf der Oberfläche,
was hervorragende Zutrittsmöglichkeit der umgebenden wäßrigen Phase bedeutet. Das
interessante Aussehen der SLN macht sie attraktiv für ex vivo-ESR-Untersuchungen mit
Humanhaut. Dort zeigten sie sich allerdings nicht überlegen im Vergleich zu bereits
etablierten Systemen Nanoemulsion und Mikroemulsion. Die Plättchen formten nach
Wasserverdunstung eine feste Lipidwand, die eine weitere Arzneistofffreisetzung
verhinderte. Die starke Arzneistoffpräsentation an der Trägeroberfläche korrelierte nicht
mit einer verbesserten Bioverfügbarkeit.
Zusammenfassend deckt die vorliegende Dissertation auf, daß die bis heute gängige
Vorstellung einer Arzneistofflokalisation im Festlipidkern (SLN) ebenso wie die
Einbettung von Öldomänen mit erhöhtem Arzneistoffgehalt in den Partikeln (NLC)
revidiert werden muß (Abbildung 1 (a)). Die Ergebnisse zeigen, daß die untersuchten
kolloidalen Lipidmatrices weder einen Schutz vor umgebender Wasserphase bieten (was
aufgrund der festen Matrix hätte erwartet werden können), noch retardierende

5 Summary and conclusions
74
Eigenschaften oder ausreichende Inkorporierungskapazitäten aufweisen. Statt der
postulierten inneren Öltröpfchen (NLC), beziehungsweise statt der inkorporierten
Arzneistoffmoleküle (SLN) in der festen Lipidmatrix ist die Existenz von Arzneistoff-
und/oder MCT-Molekülen auf der Partikeloberfläche dieser komplexen Systeme
wahrscheinlicher. Die Arzneistoff- oder Ölverteilung (sei es als Ölmoleküle oder als
Ölcluster) innerhalb des Kristallgitters eines Nanopartikels ist nicht wahrscheinlich, da
Kristalle aufgrund ihrer regelmäßigen Strukturen nur wenige Fehlstellen zur potentiellen
Einlagerung von Fremdmolekülen dulden: Arzneistoff beziehungsweise Öl werden
während des Abkühlprozesses durch beginnende Kristallisation aus der (Misch-)
Lipidschmelze herausgestoßen. Diese Ausstoßung findet sogar im Fall von nur 2 %
Ölbeladung statt (Formulierung NLC-0.2), so daß die postulierten Ölinkorporierungsraten
von 16 oder sogar 38 % [164,166] nicht bestätigt werden können. Selbst unter der
Annahme, daß dieser geringe Anteil von 2 % Öl hätte eingebettet werden können (was
nicht gefunden wurde!), so wäre es doch niemals möglich, in diesen wenigen Ölmolekülen
eine ausreichend hohe Arzneistoffmenge zu lösen.
Festzuhalten bleibt, daß das flüssige Lipid in NLC an der Oberfläche der festen
Lipidpartikel anhaftet, wobei es sich dort punktförmig ansammelt (Abbildung 1 (b)). Erst
steigende Ölbeladungen (beginnend ab circa 10 %) führen zur Ausbildung von
Öltröpfchen, die an vergleichsweise kleinen GB-Plättchen kleben (Abbildung 1 (b)). Die
erforschten SLN und NLC zeigen Nachteile im Vergleich zu gewöhnlichen
Nanoemulsionen, da der Plättchencharakter sehr kurze Diffusionswege bedingt, die
Grenzfläche Wasser-Lipid erhöht wird und die Kristallinität der Lipide zu geringer
Arzneistoffinkorporierung führt.
Zur Vollständigkeit sei daran erinnert, daß alle Untersuchungen an einem Lipid
durchgeführt wurden, das ein Mischglycerid in relativ ungeordneter ß´-Modifikation
darstellt. Röntgendiffraktogramme bestätigen die ß´-Modifikation von SLN und NLC.
Durch die zahlreichen Kristallgitterdefekte sollte GB eine Arzneistoffeinlagerung
erleichtern [35,182,226], in jedem Fall bessere Aufnahmekapazitäten als regelmäßiger
strukturierte Triglyceride zeigen.
Für alle Untersuchungen wurden lipophile Modellarzneistoffe (TB, P3, NR) herangezogen.
Sogar diese lipophilen Substanzen erreichten keine zufriedenstellende Inkorporierung in
den festen Lipidpartikeln. Es muß klargestellt werden, daß die Konzentrationen 0,276 mg

5 Summary and conclusions
75
TB/g Formulierung beziehungsweise 0,25 µg NR/g Formulierung betrugen, so daß die
Nanopartikel nur vernächlässigbar beladen waren. Daraus ist zu folgern, daß Bemühungen
um eine höhere Arzneistoffbeladung oder gar die Inkorporierung hydrophiler Moleküle
scheitern werden, obwohl letztere in der Literatur postuliert ist [161].
Fehlender Schutz, unzureichende Inkorporierung nennenswerter Arzneistoffkonzen-
trationen und bedenkliche Langzeitstabilitätsprobleme (Gelierung, Partikelwachstum) von
SLN und NLC werden auch zukünftig eine erfolgreiche pharmazeutisch- industrielle
Markteinführung verhindern. Die intravenöse Applikation der SLN wurde postuliert, birgt
allerdings gefährliche Risiken aufgrund von Partikelgröße und –form. Perorale Gabe ist
aufgrund der niedrigen Arzneistoffbeladungskapazität in den meisten Fällen nicht
interessant, auch ist kein Schutz Arzneimoleküle vor Säure oder Enzymen realisierbar.
Als Zusatzstoffe in kosmetischen Produkten aber könnten SLN ihre besten
Einsatzmöglichkeiten aufweisen. So sind synergistische Effekte bei Sonnenschutzmitteln
beschrieben worden, bei denen die ultraviolette Strahlung sowohl an der Partikeloberfläche
reflektiert als auch durch UV-Blocker absorbiert wird [227]. Nachteilig ist wiederum die
Verwendung von Lipiden in den Sonnenschutzzubereitungen, moderne Mittel vermeiden
den Zusatz dieser akneauslösenden Zusatzstoffe. Pflegende Hautcremes mit SLN
versprechen eine verstärkte Hydratisierung der Haut, bedingt durch die okklusiven Effekte
der SLN-Plättchen [228].
In allen Schlüsselparametern sind SLN einer gewöhnlichen Nanoemulsion unterlegen. Die
Nachteile der SLN sind systembedingt aufgrund des kristallinen Zustands dieses
Arzneistoffträgersystems. Der kristalline Zustand von SLN und NLC ist die
zugrundeliegende Idee dieser Partikel, doch zugleich ist er der Hauptgrund für die oben
angeführten Nachteile. Modifikationsänderungen oder Zumischung anderer lipophiler
Substanzen können diesen Basiskonflikt nicht lösen.
Generell sind Arzneistoffträgersysteme auf Basis von Lipiden sehr gut humanverträglich,
und sie lohnen zukünftige Forschungsaktivitäten – trotz der enttäuschenden Ergebnisse, die
für SLN und NLC im Rahmen der vorliegenden Dissertation erhalten wurden. Kolloidale
Arzneistoffträgersysteme stellen auf keinen Fall triviale Systeme dar. Ihrer Komplexität
wurde im Rahmen der vorliegenden Arbeit durch Verwendung vielfältiger, meist nicht-
invasiver Untersuchungsmethoden Rechnung getragen. Nanotechnologische Systeme sind
konventionellen Systemen keinesfalls a priori überlegen, nur weil sie kolloidalen Charakter

5 Summary and conclusions
76
aufweisen. Kritische Diskussionen über Arzneistoffträger, die auf Nanotechnologie
basieren, bleiben unerläßlich und sind äußerst wertvoll.
Abb. 1: Schematisch dargestellte Strukturen von NLC, (a) postuliertes Modell der Literatur, (b) aufgrund eigener Untersuchungen entwickelte Modelle, variierend durch zunehmende Ölbeladung ( Öl (MCT), festes Lipid (GB), Stabilisator (Poloxamer)).
(a)
(b)

Bibliography
77
Bibliography
1. W. Mehnert and K. Mäder. Solid lipid nanoparticles: production, characterization
and applications. Adv. Drug Delivery Rev. 47:165-196 (2001).
2. G. M. Barratt. Therapeutic applications of colloidal drug carriers. Pharm. Science
and Technol. Today 3:163-169 (2000).
3. P. Couvreur, C. Dubernet, and F. Puisieux. Controlled drug delivery with
nanoparticles: current possibilities and future trends. Eur. J. Biopharm. 41:2-13
(1995).
4. G. L. Amidon, H. Lennernas, V. P. Shah, and J. R. Crison. A theoretical basis for a
biopharmaceutic drug classification: the correlation of in vitro drug product
dissolution and in vivo bioavailablility. Pharm. Res. 12:413-420 (1995).
5. R. Löbenberg and G. L. Amidon. Modern bioavailability, bioequivalence and
biopharmaceutics classification system. New scientific approaches to international
regulatory standards. Eur. J. Biopharm. 50:3-12 (2000).
6. J. B. Dressman and C. Reppas. In vitro-in vivo correlations for lipophilic, poorly
water-soluble drugs. Eur. J. Pharm. Sci. 11:S73-S80 (2000).
7. R. H. Müller, M. Radtke, and S. A. Wissing. Solid lipid nanoparticles (SLN) and
nanostructured lipid carriers (NLC) in cosmetic and dermatological preparations.
Adv. Drug Delivery Rev. 54:131-155 (2002).
8. Z. Cui and R. J. Mumper. Topical immunization using nanoengineered genetic
vaccines. J. Controlled Release 81:173-184 (2002).
9. R. Schubert. Liposomes in topical application and their mode of action in the skin.
Arch. Pharm. 324:627-633 (1991).
10. E. Allémann, J.-C. Leroux, and R. Gurny. Polymeric nano- and microparticles for
the oral delivery of peptides and peptidomimetics. Adv. Drug Delivery Rev. 34:171-
189 (1998).
11. A. Meinzer, E. Müller, and J. Vonderscher. Perorale Mikroemulsionsformulierung -
Sandimmun Optoral®/Neoral®. In: R. H. Müller and G. E. Hildebrand (eds),
Pharmazeutische Technologie: Moderne Arzneiformen, Wissenschaftliche
Verlagsgesellschaft mbH, Stuttgart, 1998, pp. 169-177.
12. A. K. Singla, A. Garg, and D. Aggarwal. Paclitaxel and its formulations. Int. J.
Pharm. 235:179-192 (2002).

Bibliography
78
13. M. Merodio, J. M. Irache, F. Valamanesh, and M. Mirshahi. Ocular disposition and
tolerance of ganciclovir- loaded albumin nanoparticles after intravitreal injection in
rats. Biomaterials 23:1587-1594 (2002).
14. R. Abu-Dahab, U. F. Schäfer, and C.-M. Lehr. Lectin-functionalized liposomes for
pulmonary drug delivery: effect of nebulization on stability and bioadhesion. Eur.
J. Pharm. Sci. 14:37-46 (2000).
15. J. B. Boyett and C. W. Davis. Injectable emulsions and suspensions. In: H. A.
Lieberman, M. M. Rieger, and G. S. Banker (eds), Pharmaceutical dosage forms -
disperse systems, Vol. 2, Marcel Dekker Inc., New York, 1989, pp. 379-416.
16. M. Nishikawa, Y. Takakura, and M. Hashida. Biofate of fat emulsions. In: S.
Benita (ed), Submicron emulsions in drug targeting and delivery, Vol. 9, Drug
targeting and delivery, Harwood academic publishers, Amsterdam, 1998, pp. 99-
118.
17. A. N. Lukyanov, Z. G. Gao, L. Mazzola, and V. P. Torchilin. Polyethylene glycol-
diacyllipid micelles demonstrate increased accumulation in subcutaneous tumors in
mice. Pharm. Res. 19:1424-1429 (2002).
18. K. K. Merdan, T. Hegener, O. Haberlein, and T. Kissel. Integrin targeting using
RGD-PEI conjugates for in vitro gene transfer. J. Gene Med. 5:588-599 (2003).
19. I. Brigger, J. Morizet, G. Aubert, H. Chacun, M.-J. Terrier-Lacombe, P. Couvreur,
and G. Vassal. Poly(ethylene glycol)-coated hexadecylcyanoacrylate nanospheres
display a combined effect for brain tumor targeting. J. Pharmacol. Exp. Ther.
303:928-936 (2002).
20. A. N. Lukyanov, Z. Gao, and V. P. Torchilin. Micelles from polyethylene
glycol/phosphatidylethanolamine conjugates for tumor drug delivery. J. Controlled
Release 91:97-102 (2003).
21. V. C. Mosqueira, P. Legrand, J. L. Morgat, M. Vert, E. Mysiakine, R. Gref, J. P.
Devissaguet, and G. Barratt. Biodistribution of long-circulating PEG-grafted
nanocapsules in mice: effects of PEG chain length and density. Pharm. Res.
18:1411-1419 (2001).
22. G. Barratt. Colloidal drug carriers: achievements and perspectives. Cell. Mol. Life
Sc. 60:21-37 (2003).
23. C. Chauvierre, D. Labarre, P. Couvreur, and C. Vauthier. Novel polysaccheride-
decorated poly(isobutyl cyanoacrylate) nanoparticles. Pharm. Res. 20:1786-1793

Bibliography
79
(2003).
24. C. Vauthier, C. Dubernet, C. Chauvierre, I. Brigger, and P. Couvreur. Drug
delivery to resistant tumors: the potential of poly(alkyl cyanoacrylate)
nanoparticles. J. Controlled Release 93:151-160 (2003).
25. B. P. C. Chow, E. A. Shaffer, and H. G. Parsons. Absorption of triglycerides in the
absence of lipase. Canadian J. Phys. Pharmacol. 68:519-523 (1990).
26. J. Clement. Digestion and absorption of dietary triglycerides. J. Physiologie
72:137-170 (1976).
27. N. D. Gallagher and M. R. Playoust. Absorption of saturated and unsaturated fatty
acids by rat jejunum and ileum. Gastroenterology 57:9-18 (1969).
28. G. Livesey. The absorption of stearic acid from triacylglycerols: an inquiry and
analysis. Nutrition Res. Rev. 13:185-214 (2000).
29. U. Bracco. Effect of triglyceride structure on fat absorption. Am. J. Clinical
Nutrition 66:1002S-1009S (1994).
30. L. P. Klemann, J. W. Finley, and G. A. Leveille. Estimation of the absorption
coefficient of stearic acid in SALATRIM fats. J. Agric. Food Chem. 42:484-488
(1994).
31. J. W. Finley, L. P. Klemann, G. A. Leveille, M. S. Otterburn, and C. G. Walchak.
Caloric availability of SALATRIM in rats and humans. J. Agric. Food Chem.
42:495-499 (1994).
32. H. Stricker. Physikalische Pharmazie, Wissenschaftliche Verlagsgesellschaft mbH,
Stuttgart, 1987.
33. B. Siekmann and K. Westesen. Thermoanalysis of the recrystallization process of
melt-homogenized glyceride nanoparticles. Coll. Surfaces B 3:159-175 (1994).
34. L. H. Block. Emulsions and microemulsions. In: H. A. Lieberman, M. M. Rieger,
and G. S. Banker (eds), Pharmaceutical dosage forms - disperse systems, Vol. 2,
Marcel Dekker Inc., New York, 1989, pp. 335-378.
35. V. Jenning and S. Gohla. Comparison of wax and glyceride solid lipid
nanoparticles (SLNTM). Int. J. Pharm. 196:219-222 (2000).
36. A. Dingler, Feste Lipid-Nanopartikel als kolloidale Wirkstoffträgersysteme zur
dermalen Applikation, PhD thesis, Berlin, 1998.
37. J. Kreuter. Nanoparticles. In: J. Kreuter (ed), Colloidal drug delivery systems, Vol.
66, Drugs and the pharmaceutical sciences, Marcel Dekker Inc., New York, Basel

Bibliography
80
and Hong Kong, 1994, pp. 219-342.
38. V. Jenning, M. Schäfer-Korting, and S. Gohla. Vitamin A-loaded solid lipid
nanoparticles for topical use: drug release properties. J. Controlled Release 66:115-
126 (2000).
39. J. Kristl, B. Volk, M. Gasperlin, M. Sentjurc, and P. Jurkovic. Effect of colloidal
carriers on ascorbyl palmitate stability. Eur. J. Pharm. Sci. 19:181-189 (2003).
40. P. W. Atkins. Physikalische Chemie, VHC Verlagsgesellschaft mbH, Weinheim,
1990.
41. T. Okubo and K. Kiriyama. Sructural and dynamic properties in the complex fluids
of colloidal crystals, liquids and gases. J. Mol. Liquids 72:347-364 (1997).
42. A. z. Mühlen, C. Schwarz, and W. Mehnert. Solid lipid nanoparticles (SLN) for
controlled drug delivery - drug release and release mechanism. Eur. J. Biopharm.
45:149-155 (1998).
43. A. Lamprecht, N. Ubrich, M. H. Pérez, C.-M. Lehr, M. Hoffmann, and P.
Maincent. Biodegradable monodispersed nanoparticles prepared by pressure
homogenization-emulsification. Int. J. Pharm. 184:97-105 (1999).
44. B. Magenheim and S. Benita. Nanoparticle characterization: a comprehensive
physicochemical approach. S.T.P. Pharma Sciences 1:221-241 (1991).
45. T. A. Barber. Pharmaceutical particulate matter: analysis and control, Interpharm
Press Inc., Buffalo Grove, 1993.
46. R. H. Müller. Nanosuspensionen - eine neue Formulierung für schwerlösliche
Arzneistoffe. In: R. H. Müller and G. Hildebrand (eds), Pharmazeutische
Technologie: Moderne Arzneiformen, Wissenschaftliche Verlagsgesellschaft mbH,
Stuttgart, 1998, pp. 393-400.
47. K. P. Krause and R. H. Müller. Production and characterisation of highly
concentrated nanosuspensions by high pressure homogenisation. Int. J. Pharm.
214:21-24 (2001).
48. C. Jacobs, O. Kayser, and R. H. Müller. Production and characterisation of
mucoadhesive nanosuspensions for the formulation of bupravaquone. Int. J. Pharm.
214:3-7 (2001).
49. E. Merisko-Liversidge, G. G. Liversidge, and E. R. Cooper. Nanosizing: a
formulation approach for poorly-water-soluble compounds. Eur. J. Pharm. Sci.
18:113-120 (2003).

Bibliography
81
50. A. T. Serajuddin. Solid dispersion of poorly water-soluble drugs: early promises,
subsequent problems, and recent breakthroughs. J. Pharm. Sciences 88:1058-1066
(1999).
51. R. H. Müller, C. Jakobs, and O. Kayser. Nanosuspensions for the formulation of
poorly soluble drugs. In: F. Nielloud and G. Marti-Mestres (eds), Pharmaceutical
emulsions and suspensions, Marcel Dekker Inc., New York and Basel, 2000.
52. A. E. Johnson. Analysis of the Young equation and use of the Kelvin equation in
calculating the Gibbs excess. Coll. Surfaces A 202:33-39 (2002).
53. K. H. Bauer, K.-H. Frömming, and C. Führer. Lehrbuch der pharmazeutischen
Technologie, Wissenschaftliche Verlagsgesellschaft mbH, Stuttgart, 1999.
54. B. Siekmann and K. Westesen. Preparation and physicochemical characterization
of aqueous dispersions of coenzyme Q10 nanoparticles. Pharm. Res. 12:201-208
(1995).
55. Y. Barenholz and D. J. Crommelin. Liposomes as pharmaceutical dosage forms. In:
J. Swarbrick and J. C. Boylan (eds), Encyclopedia of pharmaceutical technology,
Vol. 9, Marcel Dekker Inc., New York, Basel and Hong Kong, 1994, pp. 1-39.
56. R. Schubert. Liposomen in Arzneimitteln. In: R. H. Müller and G. E. Hildebrand
(eds), Pharmazeutische Technologie: Moderne Arzneiformen, Wissenschaftliche
Verlagsgesellschaft mbH, Stuttgart, 1998, pp. 219-242.
57. M. Ghyczy. Arzneimittel mit Phosphatidylcholin und Liposomen: Entwicklung,
Bewertung, Perspektiven. In: R. H. Müller and G. E. Hildebrand (eds),
Pharmazeutische Technologie: Moderne Arzneiformen, Wissenschaftliche
Verlagsgesellschaft mbH, Stuttgart, 1998, pp. 207-218.
58. D. D. Lasic. Liposomes: from physics to applications, Elsevier Science B.V.,
Amsterdam, 1993.
59. M. J. Otto. Liposomes: from biophysics to therapeutics, Marcel Dekker Inc., New
York and Basel, 1987.
60. G. Gregoriadis, A. T. Florence, and H. M. Patel. Liposomes in drug delivery. A. T.
Florence and G. Gregoriadis (eds), Drug targeting and delivery, Harwood
Academic Publishers GmbH, Chur, 1993.
61. D. J. A. Crommelin and H. Schreier. Liposomes. In: J. Kreuter (ed), Colloidal drug
delivery systems, Vol. 66, Drugs and the pharmaceutical sciences, Marcel Dekker
Inc., New York, Basel and Hong Kong, 1994, pp. 73-190.

Bibliography
82
62. F. J. Martin. Pharmaceutical manufacturing of liposomes. In: P. Tyle (ed),
Specialized drug delivery systems, Vol. 41, Drugs and the pharmaceutical sciences,
Marcel Dekker Inc., New York and Basel, 1990, pp. 267-316.
63. A. T. Florence and C. Cable. Non-ionic surfactant vesicles (niosomes) as vehicles
for doxorubicin delivery. In: G. Gregoriadis, A. T. Florence, and H. M. Patel (eds),
Liposomes in drug delivery, Harwood Academic Publishers GmbH, Chur, 1993, pp.
239-253.
64. J. A. Bouwstra and H. E. J. Hofland. Niosomes. In: J. Kreuter (ed), Colloidal drug
delivery systems, Vol. 66, Drugs and the pharmaceutical sciences, Marcel Dekker
Inc., New York, Basel and Hong Kong, 1994, pp. 191-217.
65. H. Schreier and J. Bouwstra. Liposomes and niosomes as topical drug carriers:
dermal and transdermal drug delivery. J. Controlled Release 30:1-15 (1994).
66. H. Hauser. Short-chain phospholipids as detergents. Biochim. Biophys. Acta
1508:164-181 (2000).
67. S. Segota, D. Tezak, and N. Ljubesic. Formation of vesicles in diluted aqueous
solutions of surfactant investigated by direct analysis of light scattering. Adv. Coll.
Interface Sci. 89-90:283-291 (2001).
68. P. Alexandridis and T. A. Hatton. Poly(ethylene oxide)-poly(propylene oxide)-
poly(ethylene oxide) block copolymer surfactants in aqueous solutions and at
interfaces: thermodynamics, structure, dynamics, and modeling. Coll. Surfaces B
96:1-46 (1995).
69. D. M. Small. The physical chemistry of lipids: from alkanes to phospholipids,
Plenum Press, New York, 1986.
70. R. Voigt. Pharmazeutische Technologie: für Studium und Beruf, Deutscher
Apotheker Verlag, Stuttgart, 2000.
71. I. Capek. Fate of excited probes in micellar systems. Adv. Coll. Interface Sci.
97:89-147 (2002).
72. A. Meziani, A. Zradba, D. Touraud, M. Clausse, and W. Kunz. Can aldehydes
participate in the nanostructuration of liquids containing charged micelles? J. Mol.
Liquids 73, 74:107-118 (1997).
73. A. M. Wasserman, V. A. Kasaikin, Y. A. Zakharova, I. I. Aliev, V. Y. Baranovsky,
V. Doseva, and L. L. Yasina. Molecular organization and dynamics of micellar
phase of polyelectrolyte-surfactant complexes: ESR spin probe study.

Bibliography
83
Spectrochimica Acta Part A 58:1241-1255 (2002).
74. K. Shinoda. Solvent properties of nonionic surfactants in aqueous solutions. In: K.
Shinoda (ed), Solvent properties of surfactant solutions, Vol. 2, Surfactant science
series, Marcel Dekker Inc., New York, 1967, pp. 27-63.
75. H. Wennerström and B. Lindman. Micelles. Physical chemistry of surfactant
association. Physics Reports 52:1-86 (1979).
76. R. Zana. Micellization of amphiphiles: selected aspects. Coll. Surfaces A 123-
124:27-35 (1997).
77. M. A. Hammad and B. W. Müller. Solubility and stability of tetrazepam in mixed
micelles. Eur. J. Biopharm. 7:49-55 (1998).
78. R. H. H. Neubert and M. Schwarz. Stable mixed micelles: a new efficient vehicle
system for drugs. Pharm. Res. 14:S707 (1997).
79. A. Supersaxo, W. R. Hein, and H. Steffen. Mixed micelles as a proliposomal,
lymphotropic drug carrier. Pharm. Res. 8:1286-1291 (1991).
80. G. A. Husseini, G. D. Myrup, W. G. Pitt, D. A. Christensen, and N. Y. Rapoport.
Factors affecting acoustically triggered release of drugs from polymeric micelles. J.
Controlled Release 69:43-52 (2000).
81. A. Marin, M. Muniruzzaman, and N. Rapoport. Mechanism of the ultrasonic
activation of micellar drug delivery. J. Controlled Release 75:69-81 (2001).
82. V. P. Torchilin. Structure and design of polymeric surfactant-based drug delivery
systems. J. Controlled Release 73:137-172 (2001).
83. A. Krishnadas, I. Rubinstein, and H. Önyüksel. Sterically stabilized phospholipid
mixed micelles: in vitro evaluation as a novel carrier for water-insoluble drugs.
Pharm. Res. 20:297-302 (2003).
84. N. Rapoport, W. G. Pitt, H. Sun, and J. L. Nelson. Drug delivery in polymeric
micelles. J. Controlled Release 91:85-95 (2003).
85. S. T. Hyde. Identification of lyotropic liquid crystalline mesophases. In: K.
Holmberg (ed), Handbook of applied surface and colloid chemistry, John Wiley &
Sons Ltd., Chichester, 2001.
86. S. Kutsumizu. The thermotropic mesophase: a curious mesophase. Current opinion
in solid state and materials science 6:537-543 (2002).
87. K. Larsson. Aqueous dispersions of cubic lipid-water phases. Current opinion in
colloid and interface science 5:64-69 (2000).

Bibliography
84
88. P. Garstecki and R. Holyst. Scattering patterns of self-assembled cub ic phases. I.
The model. Langmuir 18:2519-2528 (2002).
89. P. Garstecki and R. Holyst. Scattering patterns of self-assembled cubic phases. II.
Analysis of the experimental spectra. Langmuir 18:2529-2537 (2002).
90. M. G. Carr, J. Corish, and O. I. Corrigan. Drug delivery from a liquid crystalline
base across Visking and human stratum corneum. Int. J. Pharm. 157:35-42 (1997).
91. B. Siekmann, H. Bunjes, M. H. J. Koch, and K. Westesen. Preparation and
structural investigations of colloidal dispersions prepared from cubic
monoglyceride-water phases. Int. J. Pharm. 244:33-43 (2002).
92. M. L. Lynch, A. Ofori-Boateng, A. Hippe, K. Kochvar, and P. T. Spicer. Enhanced
loading of water-soluble actives into bicontinuous cubic phase liquid crystals using
cationic surfactants. J. Coll. Interface Science 260:404-413 (2003).
93. B. J. Boyd. Characterisation of drug release from cubosomes using the pressure
ultrafiltration method. Int. J. Pharm. 260:239-247 (2003).
94. J. Patterson, A. Bary, and T. Rades. Physical stability and solubility of the
thermotropic mesophase of fenoprofen calcium as pure drug and in a tablet
formulation. Int. J. Pharm. 247:147-157 (2002).
95. I. Danielsson and B. Lindman. The definition of microemulsion. Coll. Surfaces B
3:391-392 (1981).
96. G. M. Eccleston. Microemulsions. In: J. Swarbrick and J. C. Boylan (eds),
Encyclopedia of pharmaceutical technology, Vol. 9, Marcel Dekker Inc., New
York, Basel and Hong Kong, 1994, pp. 375-421.
97. H. Wennerström, J. Daicic, U. Olsson, G. Jerke, and P. Schurtenberger. Sponge
phases and balanced microemulsions: What determines their stability? J. Mol.
Liquids 72:15-30 (1997).
98. S. P. Moulik and B. K. Paul. Structure, dynamics and transport properties of
microemulsions. Adv. Coll. Interface Sci. 78:99-195 (1998).
99. R. Cortesi and C. Nastruzzi. Liposomes, micelles and microemulsions as new
delivery systems for cytotoxic alkaloids. Pharm. Science and Technol. Today
2:288-298 (1999).
100. L. M. Prince. Microemulsions: theory and practice, Academic Press Inc., New
York, San Francisco and London, 1977.
101. D. Attwood. Microemulsions. In: J. Kreuter (ed), Colloidal drug delivery systems,
Bibliography
85
Vol. 66, Drugs and the pharmaceutical sciences, Marcel Dekker, New York, Basel
and Hong Kong, 1994, pp. 31-71.
102. M. Fanun, E. Wachtel, B. Antalek, A. Aserin, and N. Garti. A study of the
microstructure of four-component sucrose ester microemulsions by SAXS and
NMR. Coll. Surfaces A 180:173-186 (2001).
103. M. Kreilgaard. Influence of microemulsions on cutaneous drug delivery. Adv. Drug
Delivery Rev. 54:S77-S98 (2002).
104. S. Klang and S. Benita. Design and evaluation of submicron emulsions as colloidal
drug carriers for intravenous administration. In: S. Benita (ed), Submicron
emulsions in drug targeting and delivery, Vol. 9, Drug targeting and delivery,
Harwood academic publishers, Amsterdam, 1998, pp. 119-152.
105. P. Sherman. Emulsion science, Academic Press, London and New York, 1968.
106. E. Manegold. Emulsionen, Straßenbau, Chemie und Technik Verlagsgesellschaft
mbH, Heidelberg, 1952.
107. P. Becher. Emulsions: theory and practice, New York, 1965.
108. K. Westesen and T. Wehler. Physicochemical characterization of a model
intravenous oil- in-water emulsion. J. Pharm. Sciences 81:777-786 (1992).
109. S. E. Tabibi. Production of disperse drug delivery systems. In: P. Tyle (ed),
Specialized drug delivery systems, Marcel Dekker Inc., New York and Basel, 1990,
pp. 317-331.
110. M. B. Schulz and R. Daniels. Hydroxypropylmethylcellulose (HPMC) as emulsifier
for submicron emulsions: influence of molecular weight and substitution type on
the droplet size after high-pressure homogenization. Eur. J. Biopharm. 49:231-236
(2000).
111. M. Jumaa and B. W. Müller. The effect of oil components and homogenization
conditions on the physicochemical properties and stability of parenteral fat
emulsions. Int. J. Pharm. 163:81-89 (1998).
112. I. B. Ivanov and P. A. Kralchevsky. Stability of emulsions under equilibrium and
dynamic conditions. Coll. Surfaces A 128:155-175 (1997).
113. H. Karbstein and H. Schubert. Simulation der Langzeitstabilität von O/W-
Emulsionen. Chem.-Ing.-Tech. 66:97-99 (1994).
114. D. Rousseau. Fat crystals and emulsion stability - a review. Food Res. Internat.
33:3-14 (2000).

Bibliography
86
115. S. E. Friberg and K. Larsson. Food emulsions, Food science and technology,
Marcel Dekker Inc., New York, Basel and Hong Kong, 1997.
116. J. Schmitt. Parenterale Fettemulsionen als Arzneistoffträger. In: R. H. Müller and
G. Hildebrand (eds), Pharmazeutische Technologie: Moderne Arzneiformen,
Wissenschaftliche Verlagsgesellschaft mbH, Stuttgart, 1998, pp. 137-142.
117. L. C. Collins-Gold, R. T. Lyons, and L. C. Bartholow. Parenteral emulsions for
drug delivery. Adv. Drug Delivery Rev. 5:189-208 (1990).
118. S. Amselem and D. Friedman. Submicron emulsions as drug carriers for topical
administration. In: S. Benita (ed), Submicron emulsions in drug targeting and
delivery, Vol. 9, Drug targeting and delivery, Harwood academic publishers,
Amsterdam, 1998, pp. 153-173.
119. S. Gohla. Multiple Emulsionen vom Typ Wasser- in-Öl- inWasser (W/OW) in
Kosmetika. In: R. H. Müller and G. Hildebrand (eds), Pharmazeutische
Technologie: Moderne Arzneiformen, Wissenschaftliche Verlagsgesellschaft mbH,
Stuttgart, 1998, pp. 195-206.
120. N. Garti, A. Aserin, I. Tiunova, and H. Binyamin. Double emulsions of water- in-
oil- in-water stabilized by alpha-form fat microcrystals. Part 1: selection of
emulsifiers and fat microcrystalline particles. J. Am. Oil. Chem. 76:383-389 (1999).
121. N. Garti and A. Aserin. Double emulsions stabilized by macromolecular
surfactants. Adv. Coll. Interface Sci. 65:37-69 (1996).
122. P. Couvreur, P. Tulkens, M. Roland, A. Trouet, and P. Speiser. Nanocapsules: a
new type of lysosomotropic carrier. Fed. Eur. Biochem. Soc. Letters 84:323-326
(1977).
123. R. Alvarez-Román, G. Barré, R. H. Guy, and H. Fessi. Biodegradable polymer
nanocapsules containing a sunscreen agent: preparation and photoprotection. Eur.
J. Biopharm. 52:191-195 (2001).
124. H. Fessi, F. Puisieux, N. Ammoury, and S. Benita. Nanocapsule formation by
interfacial polymer deposition following solvent displacement. Int. J. Pharm.
55:R1-R4 (1989).
125. M. Aboubakar, F. Puisieux, P. Couvreur, and C. Vauthier. Physico-chemical
characterization of insulin- loaded poly(isobutylcyanoacrylate) nanocapsules
obtained by interfacial polymerization. Int. J. Pharm. 183:63-66 (1999).
126. T. Pitaksuteepong, N. M. Davies, I. G. Tucker, and T. Rades. Factors influencing

Bibliography
87
the entrapment of hydrophilic compounds in nanocapsules prepared by interfacial
polymerisation of water- in-oil microemulsions. Eur. J. Biopharm. 53:335-342
(2002).
127. A. Lamprecht, Y. Bouligand, and J. P. Benoît. New lipid nanocapsules exhibit
sustained release properties for amiodarone. J. Controlled Release 84:59-68 (2002).
128. J. Kreuter. Nanoparticle-based dmg delivery systems. J. Controlled Release
16:169-176 (1991).
129. E. Allémann, R. Gurny, and E. Doelker. Drug- loaded nanoparticles - preparation
methods and drug targeting issues. Eur. J. Biopharm. 39:173-191 (1993).
130. L. Brannon-Peppas. Recent advances on the use of biodegradable microparticles
and nanoparticles in controlled drug delivery. Int. J. Pharm. 116:1-9 (1995).
131. P. Couvreur and C. Vauthier. Polyalkylcyanoacrylate nanoparticles as drug carrier:
present state and perspectives. J. Controlled Release 17:187-198 (1991).
132. J. Kreuter. Peroral administration of nanoparticles. Adv. Drug Delivery Rev. 7:76-
86 (1991).
133. M. C. Venier-Julienne and J. P. Benoît. Preparation, purification and morphology
of polymeric nanoparticles as drug carriers. Pharm. Acta Helvetiae 71:121-128
(1996).
134. R. Gurny, N. A. Peppas, D. D. Harrington, and G. S. Banker. Development of
biodegradable and injectable latices for controlled release of potent drugs. Drug
Dev. Ind. Pharm. 7:1-25 (1981).
135. R. Bodmeier and H. Chen. Indomethacin polymeric nanosuspensions prepared by
microfluidization. J. Controlled Release 12:223-233 (1990).
136. D. Lemoine, C. Francois, F. Kedzierewicz, V. Preat, M. Hoffman, and P. Maincent.
Stability study of nanoparticles of poly(epsilon-caprolactons), poly(D,L-lactide)
and poly(D,L-lactide-co-glycolide). Biomaterials 17:2191-2197 (1996).
137. L. Illum, M. A. Khan, E. Mak, and S. S. Davis. Evaluation of carrier capacity and
release characteristics for poly(butyl 2-cyanoacrylate) nanoparticles. Int. J. Pharm.
30:17-28 (1986).
138. B. Siekmann and K. Westesen. Submicron-sized parenteral carrier systems based
on solid lipids. Pharm. Pharmacol. Lett. 1:123-126 (1992).
139. R. H. Müller, W. Mehnert, J.-S. Lucks, C. Schwarz, A. z. Mühlen, H. Weyhers, C.
Freitas, and D. Rühl. Solid lipid nanoparticles (SLN) - an alternative colloidal

Bibliography
88
carrier system for controlled drug delivery. Eur. J. Biopharm. 41:62-69 (1995).
140. R. H. Müller and J. S. Lucks, Arzneistoffträger aus festen Lipidteilchen (Feste
Lipidnanosphären (SLN)), European Patent EP 0 605 497 B1, 1996.
141. R. H. Müller, K. Mäder, and S. Gohla. Solid lipid nanoparticles (SLN) for
controlled drug delivery - a review of the state of the art. Eur. J. Biopharm. 50:161-
177 (2000).
142. K. Westesen and B. Siekmann, Solid lipid particles, particles of bioactive agents
and methods for the manufacture and use thereof, United States Patent 5,785,976,
1998.
143. R. H. Müller, S. Maaßen, H. Weyhers, F. Specht, and J. S. Lucks. Cytotoxicity of
magnetite- loaded polylactide, polylactide/glycolide particles and solid lipid
nanoparticles. Int. J. Pharm. 138:85-94 (1996).
144. R. Lander, W. Manger, M. Scouloudis, A. Ku, C. Davis, and A. Lee. Gaulin
homogenization: a mechanistic study. Biotechnol. Prog. 16:80-85 (2000).
145. N. Rodriguez-Hornedo. Crystallization and the properties of crystals. In: J.
Swarbrick and J. C. Boylan (eds), Encyclopedia of pharmaceutical technology,
Vol. 3, Marcel Dekker Inc., New York and Basel, 1990, pp. 399-434.
146. S. Liedtke, S. Wissing, R. H. Müller, and K. Mäder. Influence of high pressure
homogenisation equipment on nanodispersions characteristics. Int. J. Pharm.
196:183-185 (2000).
147. M. R. Gasco, Method for producing solid lipid microspeheres having a narrow size
distribution, United States Patent 5,250,236, 1993.
148. B. Siekmann and K. Westesen. Investigations on solid lipid nanoparticles prepared
by precipitation in o/w emulsions. Eur. J. Biopharm. 43:104-109 (1996).
149. M. Trotta, F. Debernardi, and O. Caputo. Preparation of solid lipid nanoparticles by
a solvent emulsification-diffusion technique. Int. J. Pharm. 257:153-160 (2003).
150. F. Q. Hu, H. Yuan, H. H. Zhang, and M. Fang. Preparation of solid lipid
nanoparticles with clobetasol propionate by a novel solvent diffusion method in
aqueous system and physicochemical characterization. Int. J. Pharm. 239:121-128
(2002).
151. P. Speiser, Lipidnanopellets als Trägersystem für Arzneimittel zur peroralen
Anwendung, European Patent EP 0167825, 1990.
152. A. J. Domb, Lipospheres for controlled delivery of substances, United States Patent
Bibliography
89
5,188,837, 1993.
153. K. Sato. Solidification and phase transformation behaviour of food fats - a review.
Fett/Lipid 101:467-474 (1999).
154. F. D. Gunstone, J. L. Harwood, and F. B. Padley. The lipid handbook, Chapman
and Hall, London and New York, 1986.
155. R. J. Hamilton and J. Cast. Spectral properties of lipids, Sheffield Academic Press
Ltd, Sheffield, 1999.
156. S. Brösel and H. Schubert. Investigations on the role of surfactants in mechanical
emulsification using a high-pressure homogenizer with an orifice valve. Chem.
Engin. Proc. 38:533-540 (1999).
157. K. Taiwo, H. Karbstein, and H. Schubert. Einfluß von Temperatur und
Zusatzstoffen auf die Adsorptionskinetik von Lebensmittelemulgatoren. Wiss.
Abschlußberichte/Int. Sem. f. Forsch. u. Lehre in Chemieing.-Wiss., Techn. u. Phys.
Chem. d. Univ. Karlsruhe 28:125-136 (1993).
158. H. Schubert and H. Armbruster. Principles of formation and stability of emulsions.
Int. Chem. Engin. 32:14-28 (1992).
159. E. Ugazio, R. Cavalli, and M. R. Gasco. Incorporation of cyclosporin A in solid
lipid nanoparticles (SLN). Int. J. Pharm. 241:341-344 (2002).
160. M. García-Fuentes, D. Torres, and M. J. Alonso. Design of lipid nanoparticles for
the oral delivery of hydrophilic macromolecules. Coll. Surfaces B 27:159-168
(2003).
161. W. Mehnert, A. z. Mühlen, A. Dingler, H. Weyhers, and R. H. Müller. Solid lipid
nanoparticles - ein neuartiger Wirkstoff-Carrier für Kosmetika und Pharmazeutika.
2. Mitteilung: Wirkstoff-Inkorporation, Freisetzung und Sterilisierbarkeit. Pharm.
Ind. 59:511-514 (1997).
162. K. Westesen, H. Bunjes, and M. H. J. Koch. Physicochemical characterization of
lipid nanoparticles and evaluation of their drug loading capacity and sustained
release potential. J. Controlled Release 48:223-236 (1997).
163. K. Westesen and B. Siekmann. Investigation of the gel formation of phospholipid-
stabilized solid lipid nanoparticles. Int. J. Pharm. 151:35-45 (1997).
164. V. Jenning, A. F. Thünemann, and S. H. Gohla. Characterisation of a novel solid
lipid nanoparticle carrier system based on binary mixtures of liquid and solid lipids.
Int. J. Pharm. 199:167-177 (2000).
Bibliography
90
165. R. H. Müller, M. Radtke, and S. A. Wissing. Nanostructured lipid matrices for
improved microencapsulation of drugs. Int. J. Pharm. 242:121-128 (2002).
166. V. Jenning, K. Mäder, and S. H. Gohla. Solid lipid nanoparticles (SLNTM) based on
binary mixtures of liquid and solid lipids: a 1H-NMR study. Int. J. Pharm. 25:15-21
(2000).
167. A. Dingler, R. P. Blum, H. Niehus, R. H. Müller, and S. Gohla. Solid lipid
nanoparticles (SLNTM/LipopearlsTM) - a pharmaceutical and cosmetic carrier for the
application of vitamin E in dermal products. J. Microencapsulation 16:751-767
(1999).
168. A. z. Mühlen, Feste Lipidnanopartikel mit prolongierter Wirkstoffliberation -
Herstellung, Langzeitstabilität, Charakterisierung, Freisetzungsverhalten und -
mechanismen, PhD thesis, Berlin, 1996.
169. H. P. Fiedler. Lexikon der Hilfsstoffe für Pharmazie, Kosmetik und angrenzende
Gebiete, Editio Cantor Verlag, Aulendorf, 1996.
170. BASF. Technical information for Lutrol F 68TM, Ludwigshafen, Germany, 1997.
171. C. Kroll, Analytik, Stabilität und Biotransformation von Spinsonden sowie deren
Einsatz im Rahmen pharmazeutisch-technologischer und biopharmazeutischer
Untersuchungen, PhD thesis, Berlin, 1999.
172. M. Bockisch. Nahrungsfette und -öle, Ulmer, Stuttgart, 1993.
173. S. Jahnke. The theory of high-pressure homogenization. In: R. H. Müller and B. H.
L. Böhm (eds), Dispersion techniques for laboratory and industrial scale
processing, Vol. 42, paperback APV, Wissenschaftliche Verlagsgesellschaft mbH,
Stuttgart, 2001, pp. 7-30.
174. U. Schäfer and H. Loth. An ex vivo model for the study of drug penetration into
human skin. Pharm. Res. 13:S399 (1996).
175. L. Wcislak, H. Klein, H. J. Bunge, U. Garbe, T. Tschentscher, and J. R. Schneider.
Texture analysis with high-energy synchrotron radiation. J. Applied
Crystallography 35:82-95 (2002).
176. R. H. Müller and R. Schuhmann. Teilchengrößenmessung in der Laborpraxis,
Wissenschaftliche Verlagsgesellschaft mbH, Stuttgart, 1996.
177. R. J. Haskell, J. R. Shifflett, and P. A. Elzinga. Particle-sizing technologies for
submicron emulsions. In: S. Benita (ed), Submicron emulsions in drug targeting
and delivery, Vol. 9, Drug targeting and delivery, Harwood academic publishers,
Bibliography
91
Amsterdam, 1998, pp. 21-98.
178. A. Fischer-Carius, Untersuchungen an extrudierten und sphäronisierten
Matrixpellets mit retardierter Wirkstofffreigabe, PhD thesis, Berlin, 1998.
179. C. R. Cantor and P. R. Schimmel. Biophysical chemistry: techniques for the study
of biological structure and function, Freeman, San Francisco, 1980.
180. B. Sjöström, A. Kaplun, Y. Talmon, and B. Cabane. Structures of nanoparticles
prepared from oil- in-water emulsions. Pharm. Res. 12:39-48 (1995).
181. K. Westesen, M. Drechsler, and H. Bunjes. Colloidal dispersions based on solid
lipids. In: E. Dickinson and R. Miller (eds), Food colloids: fundamentals of
formulation, Royal society of chemistry, Cambridge, 2001, pp. 103-115.
182. H. Bunjes, K. Westesen, and M. H. J. Koch. Crystallization tendency and
polymorphic transitions in triglyceride nanoparticles. Int. J. Pharm. 129:159-173
(1996).
183. H. Bunjes, Einflußnahme unterschiedlicher Faktoren auf Struktur und
Eigenschaften von Nanopartikeln aus festen Triglyceriden, PhD thesis, Jena, 1998.
184. A. Lippacher, R. H. Müller, and K. Mäder. Semisolid SLNTM dispersions for
topical application: influence of formulation and production parameters on
viscoelastic properties. Eur. J. Biopharm. 53:155-160 (2002).
185. M. Schimpf, K. Caldwell, and J. C. Giddings. Field-flow fractionation handbook,
Wiley-Interscience, New York, Chichester, Weinheim, Brisbane, Singapore,
Toronto, 2000.
186. L. Dulog and T. Schauer. Field-flow fractionation for particle size determination.
Prog. Org. Coatings 28:25-31 (1996).
187. J. C. Giddings. Field-flow fractionation: analysis of makromolecular, colloidal, and
particulate mater. Science 260:1456-1465 (1993).
188. B. Siekmann and K. Westesen. Submicron lipid suspensions (solid lipid
nanoparticles) versus lipid nanoemulsions: similarities and differences. In: S.
Benita (ed), Submicron emulsions in drug targeting and delivery, Vol. 9, Drug
targeting and delivery, Harwood academic publishers, Amsterdam, 1998, pp. 205-
218.
189. M. Wohlgemuth, Diffusionsexperimente an Nanokapseldispersionen:
Größenverteilung, Wirkstoffreisetzung und andere dynamische Phänomene, Ph. D.
thesis, Duisburg, 2002.
Bibliography
92
190. A. A. Ribeiro and E. A. Dennis. Structure and dynamics by NMR and other
methods. In: M. J. Schick (ed), Nonionic Surfactants, Physical Chemistry, Marcel
Dekker Inc., New York, 1987, pp. 971-1009.
191. K. Jores, S. Liedtke, W. Mehnert, and K. Mäder. Characterization of solid lipid
nanoparticles (SLNTM) - how to optimize the quantity of surfactants, 27th Intern.
Symp. Control. Rel. Bioact. Mater., Vol. 27, Controlled release society, Paris, 2000,
1092-1093.
192. H. Bunjes, M. Drechsler, M. H. J. Koch, and K. Westesen. Incorporation of the
model drug ubidecarenone into solid lipid nanoparticles. Pharm. Res. 18:287-293
(2001).
193. H. Bunjes, B. Siekmann, and K. Westesen. Emulsions of supercooled melts - a
novel drug delivery system. In: S. Benita (ed), Submicron emulsions in drug
targeting and delivery, Vol. 9, Drug targeting and delivery, Harwood academic
publishers, Amsterdam, 1998, pp. 175-204.
194. C. Mayer, D. Hoffmann, and M. Wohlgemuth. Structural analysis of nanocapsules
by nuclear magnetic resonance. Int. J. Pharm. 242:37-46 (2002).
195. K. Mäder, H. M. Swartz, R. Stösser, and H.-H. Borchert. The application of EPR
spectroscopy in the field of pharmacy. Pharm. Unserer Zeit 49:97-101 (1994).
196. A. Haberland, C. S. Maia, K. Jores, M. Dürrfeld, W. Mehnert, I. Schimke, B.
Christ, and M. Schäfer-Korting. Albumin effects on drug absorption and
metabolism in reconstructed epidermis and excised pig skin. Altex 20:3-9 (2003).
197. V. Jenning, A. Gysler, M. Schäfer-Korting, and S. H. Gohla. Vitamin A loaded
solid lipid nanoparticles for topical use: occlusive properties and drug targeting to
the upper skin. Eur. J. Biopharm. 49:211-218 (2000).
198. C. Santos-Maia, W. Mehnert, and M. Schäfer-Korting. Solid lipid nanoparticles as
drug carriers for topical glucocrticoids. Int. J. Pharm. 196:165-167 (2000).
199. R. Neubert and W. Wohlrab. In vitro methods for the biopharmaceutical evaluation
of topical formulations. Act. Pharm. Technol. 36:197-206 (1990).
200. B. W. Müller and P. Kleinebudde. Investigations of so-called microemulsions. Part
2. Investigations of drug-containing systems. Pharmind 50:1301-1306 (1988).
201. J. Kemken, A. Ziegler, and B. W. Müller. Investigations into the pharmacodynamic
effects of dermally administered microemulsions containing beta-blockers. J.
Pharm. Pharmacol. 43:679-684 (1991).

Bibliography
93
202. P. Greenspan and S. D. Fowler. Spectrofluorometric studies of the lipid probe nile
red. J. Lipid Res. 26:781-789 (1985).
203. C. Olbrich, O. Kayser, A. Lamprecht, C. Kneuer, C. M. Lehr, and R. H. Müller.
Interactions of fluorescent solid lipid nanoparticles (SLN) with macrophage- like
cells visualized by CLSM, International Meeting on Pharmaceutics,
Biopharmaceutics and Pharmaceutical Technology, APV/APGI, Berlin, 2000, 331-
332.
204. A. Hantzsch. Über die Halochromie und "Solvatochromie" des Dibenzalacetons
und einfacherer Ketone, sowie ihrer Ketochloride. Chem. Ber. 55:953-979 (1922).
205. M. M. Davis and H. B. Hetzer. Titrimetric and equilibrium studies using indicators
related to nile blue A. Anal. Chem. 38:451-461 (1966).
206. K. Westesen and H. Bunjes. Do nanoparticles prepared from lipids solid at room
temperature always possess a solid lipid matrix? Int. J. Pharm. 115:129-131
(1995).
207. S. Liedtke, K. Jores, W. Mehnert, and K. Mäder. Possibilities of non- invasive
physicochemical characterisation of colloidal drug carriers, 27th Intern. Symp.
Control. Rel. Bioact. Mater., Vol. 27, Controlled release society, Paris, 2000, 1088-
1089.
208. S. Udenfriend. Fluorescence assay in biology and medicine, Academic press, New
York, San Francisco, London, 1962.
209. S. Wartewig and R. Neubert. Nicht- invasive Analysenmethoden der
Schwingungsspektroskopie in der pharmazeutischen Forschung. Pharm. Ind.
64:863-869 (2002).
210. G. Rücker, M. Neugebauer, and G. G. Willems. Instrumentelle pharmazeutische
Analytik: Lehrbuch zu spektroskopischen, chromatographischen und
elektrochemischen Analysenmethoden, Wissenschaftliche Verlagsgesellschaft mbH,
Stuttgart, 1992.
211. P. Tandon, R. Neubert, and S. Wartewig. Thermotropic phase behaviour of sodium
oleate as studied by FT-Raman spectroscopy and X-ray diffraction. J. Mol.
Structure 526:49-57 (2000).
212. P. Pallas, S. Wartewig, I. Zimmermann, and H. Richter. Characterization of
dimethyldiacyloxysilanes by differential scanning calorimetry, Raman scattering
and X-ray diffraction. Pharmazie 55:503-507 (2000).

Bibliography
94
213. C. Beyer and J. Maasz. Röntgendiffraktometrie in der Pharmazie. Pharm. Unserer
Zeit 1:12-29 (1987).
214. K. Larsson. Classification of glyceride crystal forms. Act. Chem. Scand. 20:2255-
2260 (1966).
215. J. W. Hagemann. Thermal behavior and polymorphism of acylglycerides. In: K.
Sato and N. Garti (eds), Crystallization and polymorphism of fats and fatty acids,
Marcel Dekker Inc., New York and Basel, 1988, pp. 9-95.
216. L. Hernqvist. Crystal structures of fats and fatty acids. In: K. Sato and N. Garti
(eds), Crystallization and polymorphism of fats and fatty acids, Marcel Dekker Inc.,
New York and Basel, 1988, pp. 97-137.
217. D. Thiele. Personal communication on the role of cocao butter in chocolate,
Laboratories of Nestlé, Berlin, 2001.
218. M. J. Ruocco and G. G. Shipley. Characterization of the sub-transition of hydrated
dipalmitoylphosphatidylcholine bilayers. Biochim. Biophys. Acta 691:302-320
(1982).
219. M. A. Kiselev, P. Lesieur, A. M. Kisselev, and M. Olivon. Ice formation in model
biological membranes in the presence of cryoprotectors. Nuclr. Inst. Method. A
448:255-260 (2000).
220. M. A. Kiselev, P. Lesieur, A. M. Kisselev, D. Lombardo, M. Killany, S. Lesieur,
and M. Ollivon. A sucrose solutions application to the study of model biological
membranes. Nuclr. Inst. Method. A 470:409-416 (2001).
221. H. Bunjes, M. H. J. Koch, and K. Westesen. Effect of particle size on colloidal
solid triglycerides. Langmuir 16:5234-5241 (2000).
222. M. Y. Efremov, F. Schiettekatte, M. Zhang, E. A. Olson, A. T. Kwan, R. S. Berry,
and L. H. Allen. Discrete periodic melting point observations for nanostructure
ensembles. Physical Review Letters 85:3560-3563 (2000).
223. V. Jenning, Feste Lipid-Nanopartikel (SLNTM) als Trägersystem für die dermale
Applikation von Retinol: Wirkstoffinkorporation, -freisetzung und Struktur, PhD
thesis, Berlin, 1999.
224. K. Jores, W. Mehnert, and K. Mäder. Physicochemical invstigations on solid lipid
nanoparticles (SLN) and on oil- loaded solid lipid nanoparticles: a nuclear magnetic
resonance and electron spin resonance study. Pharm. Res. 20:1274-1283 (2003).
225. T. Unruh, H. Bunjes, K. Westesen, and M. H. J. Koch. Observation of size-

Bibliography
95
dependent melting in lipid nanoparticles. J. Phys. Chem. B 103:10373-10377
(1999).
226. D. Precht. Fat crystal structure in cream and butter. In: N. Garti and K. Sato (eds),
Crystallization and polymorphisms of fats and fatty acids, Marcel Dekker Inc., New
York and Basel, 1988, pp. 305-361.
227. S. A. Wissing and R. H. Müller. Solid lipid nanoparticles as carrier for sunscreens:
in vitro release and in vivo skin penetration. J. Controlled Release 81:225-233
(2002).
228. S. A. Wissing and R. H. Müller. The influence of solid lipid nanoparticles on skin
hydration and viscoelasticity - in vivo study. Eur. J. Biopharm. 56:67-72 (2003).

Publications
Publications
Oral presentations
• K. Jores, S. Liedtke, K. Mäder, and W. Mehnert. Characterization of tensides in
colloidal drug carrier systems. Jahrestagung der Deutschen Pharmazeutischen
Gesellschaft, Münster, October 5th to 7th, 2000.
• K. Jores, W. Mehnert, and K. Mäder. A physicochemical characterization of drug
containing lipid nanosuspensions. Bayer AG, Leverkusen, April 16th, 2003.
• K. Jores, W. Mehnert, and K. Mäder. Lipid nanodispersions as drug carrier systems –
a physicochemical characterization. Novartis Pharma AG, Basel, June 20th, 2003.
• K. Jores, W. Mehnert, and K. Mäder. Visions and reality of solid lipid nanoparticles
(SLNTM). Novartis Pharma AG, Basel, February 5th, 2004.
• K. Jores, W. Mehnert, and K. Mäder. From solid lipid nanoparticles (SLN) to
nanospoons. Visions and reality of colloidal lipid dispersions. International Meeting
on Pharmaceutics, Biopharmaceutics and Pharmaceutical Technology, APV/APGI,
Nuremberg, March 15th to 18th, 2004.
Poster presentations
• K. Jores, S. Liedtke, W. Mehnert, and K. Mäder. Characterization of solid lipid
nanoparticles (SLNTM) - how to optimize the quantity of surfactants, 27th Intern.
Symp. Control. Rel. Bioact. Mater., Controlled release society, Paris, July 7th to 13th,
2000.
• S. Liedtke, K. Jores, W. Mehnert, and K. Mäder. Possibilities of non- invasive
physicochemical characterisation of colloidal drug carriers, 27th Intern. Symp.
Control. Rel. Bioact. Mater., Controlled release society, Paris, July 7th to 13th, 2000.
• K. Jores, W. Mehnert, and K. Mäder. Incorporation of drug model substances in
colloidal lipid carrier systems, Jahrestagung der Deutschen Pharmazeutischen
Gesellschaft, Halle, October 10th to 13th, 2001.
• K. Jores, W. Mehnert, and K. Mäder. Non- invasive determination of the fate of
colloidal lipid nanodispersions on human skin, Jahrestagung der Deutschen
Pharmazeutischen Gesellschaft, Berlin, October 9th to 12th, 2002.

Publications
• K. Mäder, K. Jores, W. Mehnert, W. Herrmann, and T. Plauschin. Non- invasive
characterization of drug release processes by low frequency ( 1GHz) EPR imaging,
Jahrestagung der Deutschen Pharmazeutischen Gesellschaft, Berlin, October 9th to
12th, 2002.
• W. Mehnert, K. Jores, and K. Mäder. Lipid nanoparticles as possible drug carriers: a
physicochemical characterization by spectrofluorometric studies, Jahrestagung der
Deutschen Pharmazeutischen Gesellschaft, Berlin, October 9th to 12th, 2002.
• K. Jores, W. Mehnert, H. Bunjes, M. Drechsler, and K. Mäder. From solid lipid
nanoparticles (SLN) to nanospoons. Visions and reality of colloidal lipid dispersions,
30th Intern. Symp. Control. Rel. Bioact. Mater., Controlled release society, Glasgow,
July 19th to 23th, 2003.
Conference proceedings
• K. Jores, S. Liedtke, W. Mehnert, and K. Mäder. Characterization of solid lipid
nanoparticles (SLNTM) - how to optimize the quantity of surfactants, 27th Intern.
Symp. Control. Rel. Bioact. Mater., Vol. 27, Controlled release society, Paris, 2000,
1092-1093.
• S. Liedtke, K. Jores, W. Mehnert, and K. Mäder. Possibilities of non- invasive
physicochemical characterisation of colloidal drug carriers, 27th Intern. Symp.
Control. Rel. Bioact. Mater., Vol. 27, Controlled release society, Paris, 2000, 1088-
1089.
• K. Jores, S. Liedtke, K. Mäder, and W. Mehnert. Characterization of tensides in
colloidal drug carrier systems, Arch. Pharm. Pharm. Chem. 333, Suppl. 2:21 (2000).
• K. Jores, W. Mehnert, and K. Mäder. Incorporation of drug model substances in
colloidal lipid carrier systems, Arch. Pharm. Pharm. Chem. 334, Suppl. 2:77 (2001).
• K. Jores, W. Mehnert, and K. Mäder. Non- invasive determination of the fate of
colloidal lipid nanodispersions on human skin, Arch. Pharm. Pharm. Chem. 335,
Suppl. 1:113 (2002).
• K. Mäder, K. Jores, W. Mehnert, W. Herrmann, and T. Plauschin. Non- invasive
characterization of drug release processes by low frequency ( 1GHz) EPR imaging,
Arch. Pharm. Pharm. Chem. 335, Suppl. 1:115 (2002).

Publications
• W. Mehnert, K. Jores, and K. Mäder. Lipid nanoparticles as possible drug carriers: a
physicochemical characterization by spectrofluorometric studies, Arch. Pharm.
Pharm. Chem. 335, Suppl. 1:117 (2002).
• K. Jores, W. Mehnert, H. Bunjes, M. Drechsler, and K. Mäder. From solid lipid
nanoparticles (SLN) to nanospoons. Visions and reality of colloidal lipid dispersions,
30th Intern. Symp. Control. Rel. Bioact. Mater., Vol. 29, Controlled release society,
Glasgow, 2003, 181.
• K. Jores, W. Mehnert, and K. Mäder. From solid lipid nanoparticles (SLN) to
nanospoons. Visions and reality of colloidal lipid dispersions. Proc. International
Meeting on Pharmaceutics, Biopharmaceutics and Pharmaceutical Technology,
APV/APGI, Nuremberg, 2004.
Research articles
• K. Jores, W. Mehnert, and K. Mäder. Physicochemical investigations on solid lipid
nanoparticles (SLN) and on oil- loaded solid lipid nanoparticles: a nuclear magnetic
resonance and electron spin resonance study. Pharm. Res. 20:1274-1283 (2003).
• K. Jores, W. Mehnert, M. Drechsler, H. Bunjes, C. Johann, and K. Mäder.
Investigations on the structure of solid lipid nanoparticles (SLN) and oil- loaded solid
lipid nanoparticles by photon correlation spectroscopy, field-flow fractionation and
transmission electron microscopy. J. Controlled Release 95:217-227 (2004).
• K. Jores, W. Mehnert, and K. Mäder. Non- invasive determination of the fate of solid
lipid nanoparticles (SLN) on human skin. (Submitted).
• K. Jores, A. Haberland, S. Wartewig, H. Rudolf, W. Mehnert, and K. Mäder. Non-
invasive investigations on solid lipid nanoparticles (SLN) and on oil- loaded SLN by
spectrofluorometric studies and by Raman spectroscopy. (Submitted).
• A. Haberland, C. S. Maia, K. Jores, M. Dürrfeld, W. Mehnert, I. Schimke, B. Christ,
and M. Schäfer-Korting. Albumin effects on drug absorption and metabolism in
reconstructed epidermis and excised pig skin. Altex 20:3-9 (2003).

Acknowledgements
I wish to express my gratitude to my supervisor, Prof Dr Karsten Mäder, for his valuable
advice and continued kindness. His insightful suggestions and comments have provided the
necessary progress of this thesis, even over the long distance between Freiburg/Breisgau
and Berlin.
I thank my co-supervisor and leader of the DFG project, Dr Wolfgang Mehnert, for his
support, kindness and patience I daily experienced in our small work group in Berlin.
My special thanks go to Deutsche Forschungsgemeinschaft (DFG) for the scholarship
which has enabled these investigations.
Many different techniques for physicochemical characterization were used for this work.
For support I would like to thank
• Mrs. S. Liedtke, Luisen Hospital, Aachen (introduction into the field of SLN)
• Dr H. Bunjes, Friedrich Schiller University, Jena, and Dr M. Drechsler, University of
Bayreuth (TEM measurements)
• Mr. T. Plauschin, Magnettech GmbH, Berlin (technical ESR support)
• Mrs. H. Rudolf and Prof Dr S. Wartewig, Martin Luther University, Halle-Wittenberg
(Raman spectroscopy)
• Mrs. T. Gartz, Free University, Berlin (NMR measurements)
• Dr C. Johann, Wyatt Technology Europe, Woldert (FFF measurements)
• Prof Dr H. Bunge, Technical University, Clausthal, and Dr M. A. Kiselev, Joint
Institute for Nuclear Research, Dubna, Russia (synchrotron measurements)
• Dr A. Haberland, Free University, Berlin (advice in fluorescence measurements)
• Mr. S. Anger, Free University, Berlin (discussion on particle size measurements), and
• Dr U. Schäfer, University of Saarland, Saarbrücken (supply with human skin).
I thank all colleagues in the Institute of Pharmacy at Free University, Berlin for the
friendly working atmosphere.
Most of all, I deeply thank my husband Thomas for his positive support, continued
encouragement and appreciation of what I do.


Curriculum vitae
PERSONAL INFORMATION
Name JORES, KATJA
Nationality German Marital status married, no children Date of birth 1972-06-10
Place of birth Mainz, Germany
WORK EXPERIENCE
Since 08/2003 position as Laboratory Head in Pharmaceutical Research and Development Employer Novartis Pharma AG, Basel, Switzerland
11/1999 to 07/2003 PhD study in Pharmaceutical Technology Employer Deutsche Forschungsgemeinschaft (DFG)
Place of work Free University of Berlin, Institute of Pharmacy, Berlin, Germany Supervisors Prof Karsten Mäder (PhD) and Wolfgang Mehnert (PhD)
11/1999 to 07/2003 sidelines as pharmacist and as pharmaceutical consultant Employers Albrecht Apotheke and Schildhorn Apotheke, Berlin; Alpha Care, Celle, Germany
EDUCATION AND TRAINING
03/2003 examination and certification for further education in Pharmaceutical Technology (“Fachapothekerin für Pharmazeutische Technologie”)
From 11/1999 to 11/2002 further training measure in Pharmaceutical Technology (“ Weiterbildung zur Fach- apothekerin für Pharmazeutische Technologie”)
07/1999 license to practice as pharmacist (“Approbation als Apothekerin”)
07/1999 third pharmaceutical state examination, Regensburg, Germany
From 11/98 to 04/99 second half of the practical year for pharmaceutical students Employer Universitäts Apotheke, Heidelberg; Germany
From 05/98 to 10/98 first half of the practical year for pharmaceutical students Employer Boehringer Ingelheim, Pharm. Development and Analytics, Buenos Aires, Argentina
From 04/94 to 04/98 pharmaceutical studies at Bayerische Julius Maximilian University, Würzburg, Germany 04/1998 second pharmaceutical state examination 04/1996 first pharmaceutical state examination
From 04/95 to 04/98 scholarship of Begabtenförderung Bischöfliche Studienstiftung Cusanuswerk
From 10/93 to 03/94 professional training Technical college Naturwissenschaftliches Technikum, Landau/Pfalz, Germany
Job title technical assistant for environmental analytics (“Umwelt- technische Assistentin”)
From 08/91 to 07/93 professional training Technical college Berufsbildende Schule Naturwissenschaften, Ludwigshafen, Germany
Job title technical assistant for chemistry (“Chemisch- technische Assistentin”)
From 08/78 to 05/91 elementary school and high school Schools Karmeliter Grundschule and Altsprachliches Rudi Stephan Gymnasium, Worms, Germany
Certificate (05/91) Abitur


Erklärung
Hiermit erkläre ich gemäß §5 (2) der Promotionsordnung der Mathematisch-
Naturwissenschaftlich-Technischen Fakultät der Martin-Luther-Universität Halle-
Wittenberg, daß ich die Ergebnisse der vorliegenden Dissertationsarbeit
Lipid nanodispersions as drug carrier systems –
a physicochemical characterization
am Institut für Pharmazie der Freien Universität Berlin und an der Martin-Luther-
Universität Halle-Wittenberg unter Anleitung von Herrn Prof. Dr. Karsten Mäder
selbständig erarbeitet bzw. im Rahmen der angegebenen Kooperationen erhalten habe und
nur die in der Dissertation angegebenen Literaturstellen und Hilfsmittel verwendet habe.
Weiterhin habe ich diese Arbeit bisher an keiner in- oder ausländischen Fakultät als
Dissertationsschrift vorgelegt.
Halle (Saale), den 8. Juni 2004 Katja Jores