molecular complexes in the isolation and characterization of · j. lipid research, april, 1961...
TRANSCRIPT
J . Lipid Research, April, 1961 Volume 2 , Number 2
Molecular complexes in the isolation and characterization of plasma lipoproteins*
DAVID G. CORNWELL and FRED A. KRUGER
Departments of Physiological Chemistry and Medicine, The Ohio State University, Columbus 10, Ohio [Received for publication Ilecember 16, 19601
T h e formation of insoluble complexes be- tween sulfated polysaccharides and certain plasma lipo- proteins was independently described by several in- vestigators in 1955 (1, 2, 3). These complexes are formed a t neutral pH and in the absence of organic solvents, and are readily dissociated by increasing ionic strength or by the addition of chelating agents which remove certain metal ions that appear to be necessary for the formation of the complex. Precipita- tion methods for the isolation and purification of plasma lipoproteins and turbidimetric procedures for their quantitative estimation based on this phenomenon have been developed. These methods satisfy many of the criteria proposed by Lindgren and Nichols (4) for the evaluation of lipoprotein isolation techniques. The mild conditions required for complex formation and dissociation, as well as the convenience and repro- ducibility of the methods, make them particularly attractive for the investigation of plasma lipoproteins. Comparable isolation procedures involving the forma- tion of complexes between lipoproteins and the neutral polymer polyvinylpyrrolidone have also been described recently (5). In this review the formation of complexes between lipoproteins and macromolecules will be dis- cussed and methods employing complex formation for the isolation and quantitation of plasma lipopro- teins evaluated. Since the turbidimetric procedures are comparable in some ways to the older thymol (6) and phenol (7) turbidity tests for the estimation of y-globulins and lipoproteins, a discussion of these is also included in this review. Fractionation procedures such as the Cohn cold-ethanol Methods 6 and 9 and Method 10, although frequently employed in lipoprotein studies,
* Supported in part by Grants H-2807 and A-2031 from the National Institutes of Health.
are not included since they have already been thor- oughly discussed in the literature (4,8 to 16).
Before discussing lipoprotein complex formation, it is appropriate to describe the kinds and properties of the lipoproteins which have been isolated from the plasma of human beings and other animal species in both normal and abnormal states. Plasma lipoprotein fractions represent classes of related, though not iden- tical, molecules. Although these fractions are not homogeneous, their chemical and physical properties and metabolic interrelationships indicate that they do indeed represent distinct classes of related molecules rather than arbitrary fractions defined by the methods used in their isolation. This is most clearly demon- strated by the isolation of the same lipoprotein classes by different fractionation procedures from normal human plasma. However, distinct differences have been found between plasma lipoproteins isolated from normal humans and those isolated from human subjects in certain disease states. Also, the plasma lipoproteins isolated from other animal species are characteristic of the species and may differ considerably from species to species as well as from those in the human. In spite of this, the nomenclature employed to describe human lipoproteins has frequently been indiscriminately applied to animal lipoproteins simply because they correspond by one parameter. The methods which have been developed to separate and characterize human plasma lipoproteins are not generally applicable without modi- fication to other lipoprotein systems. In the sections to follow an attempt is made to correlate the various nomenclature schemes which have resulted from the application of different fractionation procedures to the lipoproteins in normal human plasma. Some of the difficulties involved in applying a classification based on normal plasma to the lipoproteins found in certain disease states are then discussed. Finally, similarities
110
by guest, on Septem
ber 7, 2018w
ww
.jlr.orgD
ownloaded from
PLASMA LIPOPROTEINS 111
and differences between the plasma lipoproteins of various animal species are enumerated to emphasize the problems involved in generalizing fractionation procedures from one species to another.
PLASMA LIPOPROTEIN FRACTIONS ISOLATED FROM NORMAL SUBJECTS
When the flotation rate in an ultracentrifugal field is employed as the defining parameter, the normal human plasma lipoproteins fall into three major cate- gories: the chylomicrons, the low density lipoproteins, and the high density lipoproteins. For reasons to be discussed, the flotation rate, S,, at density 1.063 has been used most frequently in the characterization of low density lipoproteins. Though perhaps somewhat arbitrary, the choice of this density as the dividing line between the low and high density lipoproteins is corroborated by other parameters of these two groups. Further subdivision of the low density lipoproteins into S, 0-10 (average density 1.035) and Sf 10-400 (average density 0.98) fractions, though again appear- ing somewhat arbitrary, also can be justified by other considerations. In this review we shall classify the lipoproteins of normal human plasma as follows: (a) chylomicrons; (b) S , 10-400 lipoproteins; (c) S , 0-10 lipoproteins; and (d) high density lipoproteins.
Chylomicrons. Chylomicrons were originally defined as the fat particles in chyle or plasma which are visible by dark-field microscopy (17). A precise operational definition based on the isolation of pure chylomicrons has not yet been achieved because of the difficulty in attaining clear-cut separations from the upper S, spectrum of the low density lipoproteins. Neverthe- less, it is felt that true chylomicrons represent an entity distinct from very low density lipoproteins by virtue of their metabolic origin and fate (18). The term chylomicron, in this sense, refers to the vehicle for transport of exogenous triglyceride from the alimentary tract to the blood via the chyle. Chylomicrons are composed mainly of triglycerides, and contain only small amounts of cholesterol, phospholipid, and protein (13, 19 to 24). Part of the protein appears to be similar to, if not identical with, high density lipoprotein (25, 26). Upon entering the blood from the lymph, chylomicrons may acquire additional protein at the ex- pense of high density lipoprotein in the plasma. It is of interest to note here that intravenously infused synthetic fat emulsions similarly associate with high density lipoproteins as demonstrated by ultracen- trifugal flotation. Chylomicrons have a density near
F. A. Kruger, D. G. Cornwell, G. J. Hamwi, and J. B. Brown, unpublished ohservatione.
0.94 (12) and an Sf greater than 400 (4). Oncley has recently estimated the chylomicron flotation distribu- tion as S, 10,000 f 5000 (27). Several flotation pro- cedures a t a density of 1.006 have been employed €or the isolation of chylomicrons: 9500 X g for 10 minutes (28); 9300 X g for 30 minutes (18); 26,000 X g for 30 minutes (29); and 100,OOO X g for 30 minutes (23, 25, 29, 30, 31). Some discrepancies in the literature concerning the metabolism of chylomicrons are prob- ably attributable to differences in isolation technique. For example, Dole et al. (31) isolated postprandial chylomicrons by centrifugation at 100,000 X g for 30 minutes and concluded that dietary fats had little influence on their fatty acid composition. Bragdon and Kannen (29), on the other hand, found that chylo- microns isolated by centrifugation at 26,000 X g for 30 minutes did reflect the fatty acid composition of the dietary fat. The chylomicron fraction isolated at 100,000 X g probably contained appreciable amounts of S, 10400 lipoproteins.
Postprandial lactescence in the Serum of normal individuals is caused by chylomicrons (17, 23) ; how- ever, the assumption that all lactescence in the serum of hyperlipemic subjects is caused by these particles is probably not valid (18, 32). It has been reported that lymph chylomicrons migrate with the mobility of albumin in free electrophoresis (20, 32), whereas plasma chylomicrons have the electrophoretic mobility of a2-globulins (19, 32, 33, 34). The turbid or lac- tescent region of the electrophoretic pattern of ali- mentary lipemic serum differs from that seen in es- sential, diabetic, or nephrotic hyperlipemic sera. In the former the turbidity is confined to the a2 region, whereas in the latter it extends across the a2 and p regions (32). While zone electrophoresis on paper has proved unsatisfactory for the study of chylomicrons because of adsorption, some interesting results have been obtained using starch blocks (34) or columns. Employing the latter, Carlson and Olhagen (35) ob- served the migration of chylomicrons, as detected by turbidity, from the serum of a patient with essential hyperlipemia as two distinct fractions, one an a- and the other a /%globulin. On the other hand, Kunkel and Trautman (34), employing the starch block tech- nique, observed almost all of the visible lipemia in the a2 region of normal postprandial serum. These results certainly suggest that more than one type of Iipoprotein molecule can contribute to visible lipemia, but the significance of these variants remains to be elucidated. Another method which has been emplo.yed to isolate chylomicrons is flocculation with toluidine blue (19) or protamine (20) ; however, Laurel1 (33) has recently shown that other lipoproteins are precipitated together
by guest, on Septem
ber 7, 2018w
ww
.jlr.orgD
ownloaded from
112 CORNWELL AND KRUGER
with chylomicrons by protamine in the presence of fatty acid anions.
Sl 10-400 Lipoproteins. These lipoproteins are defined as molecules having flotation rates between 10 and 400 in a medium of density 1.063. They are gen- erally isolated in the preparative ultracentrifuge by flotation a t 100,000 X g for 18 to 24 hours in a medium of density 1.006 or 1.019 after preliminary removal of the chylomicron fraction. The fraction isolated under these conditions has been variously designated S,
S , 20400 (4, 41), and more recently, SI 16400 (42). Oncley et al. (37) originally suggested that this lipo- protein was concentrated in the SI 10-100 region with a maximum near Sf 35, and had a mean density of 0.98. In a later paper Oncley (27) suggested that the fraction consisted of two subfractions: SI 100 f 60 with a den- sity of 0.958, and S, 30 f 8 wit'h a density of 0.990. Lipoproteins with a density near 1.02 and a flotation distribution approximated by Sl 10-17 (22, 381, S, 5-15 (37), SI 12-20 (4, 41), or Sf 10 f 3 (27) are found in normal plasma at a very low concentration. This accounts for the somewhat arbitrary choice by different investigators of the S , value separating the two main low density lipoprotein groups. It remains to be established whether the observation of lipoproteins in the Sf 10 region represents incomplete separation be- tween these two groups, or actually represents part of a continuum embracing both groups.
The SI 10400 lipoprotein fraction contains 49% to 52% triglyceride, 18% to 19% phospholipid, 6% to 7% free cholesterol, 14% to 16% esterified cholesterol, and 7% to 10% protein (22, 37, 43). The cholesterol to phospholipid ratio varies from 0.78 to 0.90 (18, 22, 37, 38, 40). The fatty acid (44, 45), phospholipid (46, 47), and amino acid (48, 49, 50) compositions of the S , 10400 lipoproteins have been investigated. These lipoproteins have been reported to migrate as a2-globulins by starch block electrophoresis (34) ; how- ever, in view of the results which have been reported for chylomicrons, it would appear that this should be investigated further.
Both S , 0-10 and S, 10300 lipoproteins are found in fraction I + 111 of cold-ethanol Method 10 (9, 12, 15, 16). Metabolically the S, 10400 lipoproteins represent the main vehicle for endogenous triglyceride transport (18, 36). Newly absorbed triglycerides are transported secondarily by them (36). They are synthesized in the liver (51, 52), and converted to S, 0-10 lipoproteins (53) with the concomitant removal of triglyceride, presumably in the reticuloendothelial system (18, 36, 54, 55). Immuno- chemical studies indicate that the protein moieties of the
10-400 (18, 22, 36, 37, 38), S, 12-400 (4, 39, 40, 41),
SI 10400 and Sl 0-10 lipoproteins are closely related, if not identical (56, 57). Sf 0-10 Lipoproteins. These low density lipopro-
teins, defined as having an ultracentrifugal flotation rate in the range from 0 to 10 in a medium of density 1.063, are usually isolated by centrifugation a t 100,000 X g for 18 to 24 hours in a medium of this density (18, 22, 36, 37, 41 to 49, 53, 57, 58, 59). The S , 10400 lipoproteins are separated by a preliminary or final centrifugation a t density 1.006 or 1.019. Oncley et al. (37) isolated and characterized three arbitrary subfractions within the S , 0-10 spectrum and found a small increase in protein content with decreasing flota- tion rate. The Sl 0-10 lipoproteins are concentrated in the Sf 3-9 region (37), with a peak a t Sf 6 f 2 (27). These molecules have a mean density of 1.032 (27). Different investigators have used several SI distribu- tions to describe this lipoprotein fraction: S , 0-10
Sf 0-20 (4,41,59), and S,0-16 (42). These lipoproteins have the electrophoretic mobility
of a &globulin in moving boundary and zone electro- phoresis (34, 37). They are found in fraction 111-0 of cold-ethanol Methods 6 and 9 (58), and fraction I + 111 of cold-ethanol Method 10 (9, 12, 15, 16) along .with the S, 10400 lipoproteins. They differ markedly from the latter in chemical composition containing 9.0% to 12.5% triglyceride, 19% to 32% phospholipid, 7.5% to 9.5% free cholesterol, 37.0% to 39.4% esterified choles- terol, and 21.9% protein (22, 37, 43). The cholesterol to phospholipid ratio varies from 1.30 to 1.45 (18, 22, 37, 38, 40). The protein moiety has the same immuno- chemical specificity (56,57) and amino acid composition (48,49,50) as that of the Sf 10-400 lipoprotein fraction.
The S , 0-10 lipoproteins may arise either as the products of S , 10400 lipoprotein metabolism (53) or directly from the liver (18, 36, 51, 52). Although they constitute the largest lipoprotein group, their metabolic role, except as the end products of Sf 10400 lipoprotein metabolism, remains obscure.
The high density lipo- proteins may be distinguished operationally from the low density lipoproteins by virtue of the fact that they sediment along with other plasma proteins a t density 1.063. They may be isolated from the remaining plasma proteins by ultracentrifugal flotation at 100,OOO X g for 22 hours in a medium of density 1.21 (4, 8 to 14, 22, 34, 41, 43 to 50, 59, 60). Some investigators (4, 12, 41, 59) have distinguished between two high density lipoprotein classes with mean densities of 1.09 and 1.14. Although these two fractions differ in chem- ical composition (61), they may not represent more than arbitrary fractions of a continuum. Oncley (27) has
(22, 38), S,3-9 (18, 36, 37, 57), S, 0-12 (4, 39, 40, 41),
High Density Lipoproteins.
by guest, on Septem
ber 7, 2018w
ww
.jlr.orgD
ownloaded from
PLASMA LIPOPROTEINS 113
recently suggested that only a single high density lipo- protein class exists ivith a mean density of 1.12. We shall consider these lipoproteins as a single class in this review. These lipoproteins differ from the lww density lipoproteins in their amino acid (48, 49, 50) and phos- pholipid (46, 47) composition as well as immunochem- ical specificity (57, 62, 63). They contain 4% to 8% triglyceride, 20% to 21% phospholipid, 2% to 3% free cholesterol, 13% to 15% esterified cholesterol, and 46% to 58% protein (22, 43, 61). Cholesterol to phos- pholipid ratios betqeen 0.38 and 0.58 have been re- ported (18, 22, 38, 40, 60, 64). The high density lipoproteins exhibit the electrophoretic mobility of al-globulins (4, 8 to 14, 34), and are found in fraction IV + V + V I of cold-ethanol Method 10 (9,12, 15, 16). They have also keen separated from l o w density lipo- proteins by paper chromatography (65).
As mentioned in the section on chylomicrons, the latter appear to contain a protein constituent similar in many ways to high density lipoprotein. It has been suggested that this lipoprotein may be liberated as such during the metabolism of chylomicrons in the reticuloendothelial system (36). High density lipo- proteins have been shown to be synthesized in the liver (66). At least part of the protein of chylomicrons appears to be synthesized in the intestinal wall (23). The relation of this synthesis to the high density lipo- proteins is not known.
A lipoprotein with a density greater than 1.21 has been isolated and partially characterized (22, 40, 61, 67). It contains only a small part of the total plasma phospholipid but is rich in lysolecithin (67). A more thorough investigation of this lipoprotein is necessary before the methods for its isolation and its significance in lipoprotein metabolism can be assessed.
The isolation and characterization of plasma lipo- proteins is complicated by the rapid equilibration or exchange of lipid components including cholesterol (68, 69), phospholipid (70, 71, 72), and tocopherol (73) between the different lipoprotein fractions. Ex- change between the triglyceride (36) or protein (53, 74) moieties of different lipoprotein fractions has not been demonstrated ; however, a very rapid equilibra- tion between the lipid-free protein moiety of the high density lipoprotein fraction and other lipoproteins has been reported (60).
PLASMA LIPOPROTEIN FRACTIONS ISOLATED FROM HUMAN
SUBJECTS IN DlSEASE STATES
Many disease states are accompanied by marked These altera- alterations in the plasma lipoproteins.
tions may involve the elevation or diminution of normal lipoprotein fractions, changes in the S , distribution within a lipoprotein fraction, or the appearance of atypical lipoproteins. Methods established for the fractionation of lipoproteins in normal human plasma can be applied in disease states where a normal fraction is elevated or depressed. This is illustrated in the investigation of plasma from hypercholesterolemic sub- jects. While the S , 0-10 lipoprotein fraction is mark- edly elevated (4, 10, 18, 40, 59, 75, 76), it is charac- terized by normal cholesterol to phospholipid and fatty acid ester to cholesterol ratios (18, 76). The elevated S , 0-10 fraction does not affect the isolation and characterization of other lipoprotein fractions (18, 76). The concentration of the high density lipo- proteins is diminished in hyperlipemia and biliary cir- rhosis (18, 38, 40, 76, 77). Fractionation at a density of 1.063 indicated that these lipoproteins had a low cholesterol to phospholipid ratio (18, 40). Baxter et al. (38), in a study of hyperlipemic sera from ne- phrotic individuals, found, however, that the choles- terol to phospholipid ratio of the high density lipo- protein fraction was normal when lipoproteins with n density greater than 1.21 were not included in the frac- tion.
It is more difficult to apply standard isolation pro- cedures to plasma from hyperlipemic subjects. The S , 10400 lipoprotein fraction isolated from these is lactescent and contains molecules rich in triglyceride (18, 38), and with an elevated flotation rate (4, 53, 75). A large lipoprotein fraction is frequently isolated from lactescent sera by ultracentrifugal flotation a t 9300 X g for 30 minutes (18). This procedure isolates postprandial chylomicrons from normal plasma ; how- ever, the composition of the “chylomicron fraction” from normal postprandial plasma is different than that of the “chylomicron fraction” from the plasma of hyperlipemic individuals (18). Jobst and Schettler (78) isolated chylomicrons by ultracentrifugal flotation at 22,000 X g for 60 minutes and found significant differences in composition between the L‘chylomicr~n fraction” from the serum of individuals with essential hyperlipemia as compared to alimentary chylomicrons. The “chylomicron fraction’’ from subjects with es- sential hyperlipemia contained less triglyceride and was generally similar in composition to S , 10-400 lipo- proteins (18, 78). Thus ultracentrifugal flotation may not distinguish between chylomicrons of alimentary origin and large low density lipoproteins with an en- hanced flotation rate.
Elevated S , 10400 lipoprotein fractions isolated from hyperlipemic individuals do not represent a simple proportional elevation of lipoproteins normally present
by guest, on Septem
ber 7, 2018w
ww
.jlr.orgD
ownloaded from
114 CORNWELL AND KRUGER
in this part of the SI spectrum. They show a wide variation in chemical composition (18, 38, 40, 76). Cholesterol to phospholipid and fatty acid ester to cho- lesterol ratios may be increased or decreased from the normal range (18, 38,76). In nephrosis the cholesterol to phospholipid ratio increases with increasing lactes- cence (38) ; this ratio is sometimes diminished in the corresponding lipoprotein fraction isolated from mark- edly lactescent sera from individuals with idiopathic hyperlipemia (18). An elevated S , 10-20 lipoprotein, intermediate in composition and properties between the S 0-10 and S 10400 lipoproteins of normal serum, has been found in some hyperlipemic sera (18, 38, 75, 76). Thus different hyperlipemias may involve elevations in specific regions of the S , 10400 lipoprotein spectrum, extension of the range beyond Sf 400 (75), or perhaps even the appearance of atypical lipoproteins not normally present in the low density lipoprotein spectrum. Sf 0-10 lipoprotein fractions isolated from the sera
of hyperlipemic subjects also differ from those isolated from normal sera. Cholesterol to phospholipid ratios are lower than normal, while fatty acid ester to cho- lesterol ratios are increased (18, 38, 76). These altera- tions in composition are most significant when the S, 0-10 lipoprotein concentration is very low, as it is in markedly lipemic sera (18, 38, 76). These lipoproteins may represent a small residual fraction remaining after the disappearance of the major S, 0-10 fraction, or they may represent atypical molecules synthesized in the hyperlipemic state.
The isolation and characterization of the lipoproteins from the sera of subjects with biliary cirrhosis present special difficulties. Whereas high density lipoproteins are greatly diminished or even absent (40, 77, 79), low density lipoproteins within the Sf 0-20 range are greatly increased (40, 75, 79, 80). However, these low density lipoproteins are atypical. Although they migrate electrophoretically as @-lipoproteins (77), their cholesterol to phospholipid ratio is more like that of the high density lipoproteins (77). Russ et al. (77) subjected the plasma of a biliary cirrhotic to cold- ethanol Method 10 and found @-lipoproteins in fraction I + 111, IV + V, and VI. Normally, fraction VI contains only traces of lipid; in this case it represented the largest fraction. Of the three fractions, only I + I11 reacted immunochemically with antisera to normal low density lipoprotein. The unfractionated plasma, upon analytical ultracentrifugation, revealed three lipoprotein species : S , 13 representing two-thirds of the total, and S , 10 and S , 7 equally representing the remainder.
It is thus evident that even within the human species
the characterization of lipoprotein classes by a single parameter is inadequate and may lead to erroneous identification, especially in abnormal states. The relationships established between the various param- eters of the lipoproteins in normal human plasma do not necessarily hold in abnormal conditions.
PLASMA LIPOPROTEIN FRACTIONS ISOLATED FROM OTHER
ANIMAL SPECIES
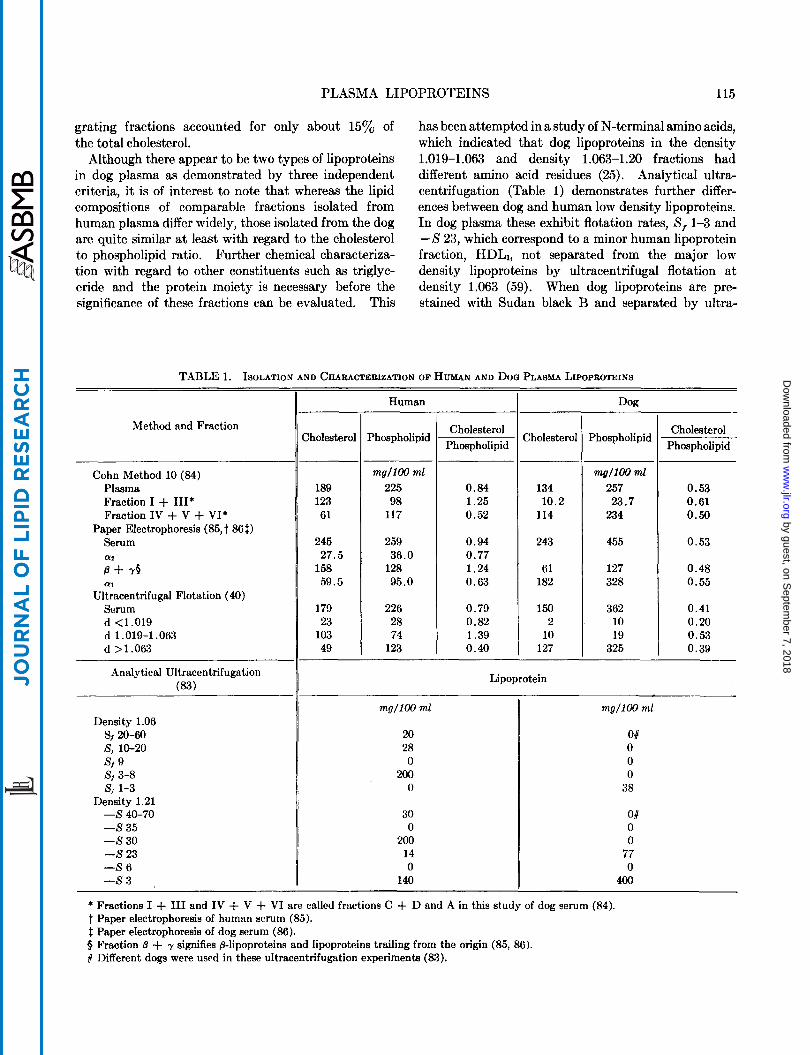
Pedersen (81) first demonstrated the existence of the low density lipoproteins in human plasma by ultra- centrifugation, which he designated by the term “X- protein,” and also noted that a comparable protein was absent from other animal plasmas. This finding was substantiated by the use of cold-ethanol frac- tionation procedures (82). When applied to human plasma, a major portion of the lipoproteins appeared in fraction I1 + 111; these were identified as @- or low density lipoproteins. By contrast, comparable fractions from animal plasmas contained very little lipoprotein (82). Most of the lipoproteins of animal sera appear in fractions IV-1 and IV-2, and are a-lipoproteins by electrophoresis (82). Both analyticaland preparative ultracentrifugation have demonstrated that many animal species contain large amounts of high density and only small amounts of low density lipoproteins (40, 83). The correlation between low density, @, and fraction I1 + I11 lipoproteins on the one hand, and high density, a, and fraction IV lipoproteins on the other, which has been observed in human plasma, has not been established generally for the plasma of other animals. Only in the case of dog plasma have the lipo- proteins been isolated and characterized by a variety of methods. Lipoprotein fractions obtained from human and dog plasma by cold-ethanol Method 10 (84), paper electrophoresis (85. 86), ultracentrifugal flotation (40), and analytical ultracentrifugation (83) are compared in Table 1. The agreement of the distribution of dog plasma lipids between the low density lipoproteins (fraction I + I11 and those with density 1.019-1.063) and the high density lipoproteins (fraction IV + V + VI and those with density >1.063) by procedures dependent upon solubility and ultra- centrifugal properties would seem to indicate that the dog lipoprotein fractions correspond with the human. The paper electrophoretic data indicate a larger pro- portion of @-lipoprotein in the dog plasma than is indicated by the ultracentrifugal and solubility data. However, i t may be noted that the dog serum cholesterol levels reported here are somewhat higher than usual (less than 150 mg/100 ml). In a paper electrophoretic study of dog serum by Fasoli et al. (87), the slow-mi-
by guest, on Septem
ber 7, 2018w
ww
.jlr.orgD
ownloaded from
PLASMA LIPOPROTEINS 115
259
128 36.0
95.0
226 28 74
123
grating fractions accounted for only about 15% of the total cholesterol.
Although there appear to be two types of lipoproteins in dog plasma as demonstrated by three independent criteria, it is of interest to note that whereas the lipid compositions of comparable fractions isolated from human plasma differ widely, those isolated from the dog are quite similar at least with regard to the cholesterol to phospholipid ratio. Further chemical characteriza- tion with regard to other constituents such as triglyc- eride and the protein moiety is necessary before the significance of these fractions can be evaluated. This
0.94 0.77 1.24 0.63
0.79 0.82 1.39 0.40
has been attempted in a study of N-terminal amino acids, which indicated that dog lipoproteins in the density 1.019-1.063 and density 1.063-1.20 fractions had different amino acid residues (25). Analytical ultra- centrifugation (Table 1) demonstrates further differ- ences between dog and human low density lipoproteins. In dog plasma these exhibit flotation rates, S, 1-3 and - S 23, which correspond to a minor human lipoprotein fraction, HDLI, not separated from the major low density lipoproteins by ultracentrifugal flotation at density 1.063 (59). When dog lipoproteins are pre- stained with Sudan black B and separated by ultra-
TABLE 1. ISOLATION AND CHARACTERIZATION OF HUMAN AND DOQ PLASMA LIPOPBOTEINS
Method and Fraction
Cohn Method 10 (84) Plasma Fraction I + III* Fraction IV + V + VI*
Serum
8 + YO
Paper Electrophoresis (85,t 863)
f f z
ffl
Ultracentrifugal Flotation (40) Serum d <1.019
d >1.063 d 1.019-1.063
Analytical Ultracentrifugation (83)
Density 1.06 SJ 20-60 s, 10-20 SJ 9 Sj 3-8 Si 1-3
Density 1.21 -S 40-70 -s 35 -S 30 -S 23 -S 6 -s 3
2holesterol
189 123 61
245
158 27.5
59.5
179 23
103 49
Human I
Cholesterol Phospholipid
Phospholipid
md100 225 98
117
ml 0.84 1.25 0.52
mg/100 ml
20 28 0
200 0
30 0
200 14 0
140
Cholestero
134
114
243
61 182
150 2
10 127
10.2
Lipoprotein
Dog
Phospholipid
mg/100 ml
23.7 257
234
455
127 328
362 10 19
325
Cholesterol Phospholipid'
0.53 0.61 0.50
0.53
0.48 0.55
0.41 0.20 0.53 0.39
mg/lOO ml
O# 0 0 0
38
O# 0 0
77 0
400
* Fractions I + I11 and IV + V + VI are called fractions C + D and A in this study of dog serum (84). t Paper electrophoresis of human serum (85). 1 Paper electrophoresis of dog serum (86). Q Fraction 8 + y signifies 8-lipoproteins and lipoproteins trailing from the origin (85, 80). # Different dogs were used in these ultracentrifugation experiments (83).
by guest, on Septem
ber 7, 2018w
ww
.jlr.orgD
ownloaded from

116 CORNWELL AND KRUGER
centrifugal flotation in a density gradient,2 a lipoprotein continuum is found instead of the separation into dis- crete low and high density fractions observed with human serum (88,89).
As in the human, thyroid deficiency in dogs leads to alterations in the plasma lipoprotein pattern. These changes are quite different, however. In the human there is a marked increment in the SI 0-10 lipoproteins, a small increment in the S , 10400 lipoproteins, and essentially no change in the high density lipoproteins (18). Milch et al. (go), studying 113'-thyroidectomized dogs, observed marked elevations in high density lipoproteins as well as in the S, 0-12, S, 12-20, and S, 20-400 lipoproteins. In addition, they noted an almost twofold increase in the cholesterol to phospholipid ratio of the total serum lipids. This would indicate a change in the nature of at least some of the lipoproteins since, as indicated in Table 1, none of the lipoproteins isolated from normal dog plasma exhibit cholesterol to phos- pholipid ratios this high. The lipoproteins of thyroid- deficient dogs fed cholesterol have also been studied, and similar elevations in the various lipoprotein frac- tions found by cold-ethanol Method 10 (91) and elec- trophoresis (92). The cholesterol to phospholipid ratios of the total serum lipids (91,92), as well as of both the high and low density fractions (91), were markedly elevated. An investigation of N-terminal amino acids in the lipoprotein fractions of hypercholesterolemic dogs, similar to the recent study by Shore and Shore (93) on hypercholesterolemic rabbits, would be highly significant.
In some respects the study of lipoprotein metabolism in animals like the dog is less complicated than it is in the human. For example, chylomicron metabolism can be followed in the dog with little chance of inter- ference by low density lipoproteins in fractionation procedures (31, 94, 95). The guinea pig may offer certain advantages in the study of low density lipo- proteins since there is a virtual absence of high density lipoproteins in guinea pig plasma (83). However, as has been pointed out, plasma lipoproteins differ from species to species in their physical and chemical prop- erties, and perhaps also in their metabolic behavior. It should also always be kept in mind that lipoprotein fractionation procedures may require modification before they are applied to the plasma of a given species.
THE NATURE OF THE INTERACTIONS OF PLASMA
LIPOPROTEINS WITH OTHER SUBSTANCES
The complexes formed by the interaction of plasma lipoproteins with certain sulfated polysaccharides bear
* 11. G. Cornwell and F. A. Kruger, unpublished observations.
a t least a formal resemblance to those complexes iso- lated from biological systems which contain a protein bound to one of a variety of polyanions such as hetero- polysaccharides, nucleic acids, or phosphoproteins. Polysaccharide anions such as hyaluronic acid in syn- ovial fluid and chondroitin sulfate in cartilage form complexes with proteins in which electrostatic attrac- tions between cationic groups on the protein and anionic (sulfate and carboxyl) groups probably play a major stabilizing role since the complexes are broken by the addition of alkali or increasing the ionic strength of the medium (96). It has been suggested that the anionic groups of mucopolysaccharides in connective tissue are in ion exchange equilibrium with metal ions and the cationic groups of the protein (97, 98). In a study of the various factors involved in the binding of protein to mucopolysaccharide in connective tissue, Loeven (99) concluded that although charge considerations are of primary importance, structural factors may alter the degree of binding. Partridge and Davis (loo), studying chondroitin sulfate complexes in carti- lage, arrived a t similar conclusions, attributing the more specific aspects of the binding to hydrogen bonding and other short-range forces.
Nucleoproteins containing nucleic acid polyanions and either protamines or histones are undoubtedly stabilized mainly by electrostatic forces since the com- plexes are readily disrupted by increasing either the pH or the ionic strength of the medium (101, 102, 103). The situation is somewhat more complicated when the interaction between nucleic acids and other proteins is considered (101). High ionic strength alone does not suffice to disrupt these complexes. However, the components can be caused to separate by the use of protein denaturants such as urea, guanidine hydro- chloride, or sodium dodecylsulfate. Conversely, the interaction between a given globular protein and nu- cleate polyanion to form a complex is generally weaker after denaturation of the protein than before denatura- tion. This is true even after the denaturing agent is removed, and also for heat denatured proteins. It therefore appears that certain structural features of the native protein in addition to net charge, which remains essentially unchanged with denaturation, contribute to the binding of globular proteins to nucleic acid polyanions. Recent studies on the formation of soluble and insoluble complexes between spermine and soluble ribonucleic acid (104) and spermine and syn- thetic polynucleotides (105) show that polynucleotide structure is also important in determining the type of complex formed.
Molecular complexes between proteins and phos- phoprotein polyanions have not been studied as thor-
by guest, on Septem
ber 7, 2018w
ww
.jlr.orgD
ownloaded from
PLASMA LIPOPROTEINS 117
oughly as the heteropolysaccharide and nucleic acid complexes ; however, a phosphoprotein complex ob- tained during the fractionation of hen egg yolk has been partially characterized. Yolk, diluted with 10% sodium chloride, exhibits two sedimenting fractions in the ultracentrifuge (106). Although the major sedimenting fraction, isolated and dissolved in 10% sodium chloride, is homogeneous by sedimentation and electrophoresis, it has been shown to contain three proteins : lipovitellin (lipoprotein), phosvitin (phos- phoprotein), and y-livetin (globulin) (107). The y- livetin component may be separated by sedimentation or electrophoresis in alkaline solution (pH 9) at low ionic strength (p = 0.3) or may be partially purified by precipitation from a 40% saturated ammonium sulfate solution (107, 108). The molecular complex is also disrupted in 0.4 M magnesium sulfate and phosvitin precipitated from this medium as a magnesium com- plex (109, 110). Dissociation in alkali or in mag- nesium sulfate both indicate that electrostatic bonding is important in stabilizing this complex system isolated from egg yolk. Its stability in 10% sodium chloride suggests that other factors assist in holding the mo- lecular complex together. The structure of naturally occurring molecular complexes between phosphopro- teins and lipoproteins in the whole yolk is more difficult to ascertain. The molecular complex containing lipovitellin, phosvitin, and y-livetin may be an isolation artifact. Schjeide and Urist (111) have isolated granules or giant yolk complexes from egg yolk which contain only phosphoprotein (phosvitin) and dense and light lipoprot,eins (lipovitellin and lipovitellenin, respec- tively). Livetins were found only in the yolk fluid. Calcium ions are bound to the naturally occurring phos- phoprotein, and the removal ol these ions during isola- tion liberates anionic groups (112). These groups may then form electrostatic bonds with the cationic groups of a livetin and form the complex described by Joubert and Cook (107).
Other examples of complex formation between op- positely charged macromolecules include the association of protamine and heparin (113), the formation of a heparin-albumin precipitate below the isoelectric point of albumin (114, 115), the formation of an albumin- polylysine precipitate above the isoelectric point of albumin (1 16), and the coprecipitation of y-globulins and low density lipoproteins in their interisoelectric region (1 17). Protein-protein and protein-synthetic polyelectrolyte interactions have been reviewed by Waugh (118) and Sela and Katchalski (119). Since these complexes are readily disrupted by altering the pH or increasing the ionic strength, it is difficult to establish the cont,ribution of binding forces other than
electrostatic forces. Furthermore, their formation is relatively nonspecific and does not appear to require unique structural relationships. Phytic acid, for example, precipitates most extracellular proteins in the region between pH 2 and pH 4 (1 20).
Although it was originally believed that heparin formed complexes with plasma proteins only in the pH region where the proteins were positively charged (121), evidence was obtained by Jaques (122), from considerations of solubility behavior, that complexes existed between heparin and proteins even under con- ditions where both macromolecular species carried a negative charge. A number of investigators have subsequently demonstrated that heparin forms molec- ular complexes with both albumin and low density lipoproteins in Serum at hydrogen ion concentrations where the proteins carry a net negative charge (114, 115, 123 to 126). Complexes between fibrinogen and sulfated polysaccharides have been described in which protein and polyanion specificity at a pH above the isoelectric point would appear to indicate that polymer configuration and other secondary valence forces as well as electrostatic bonds contribute to the formation and stability of the complexes (127 to 130). Complex formation as determined by either electrophoretic behavior or precipitation is nevertheless very sensitive to changes in pH and ionic strength, generally decreas- ing with increases in either. However, Smith and Von Korff (129) have described the “salting-out” pre- cipitation of fibrinogen-heparin complexes from con- centrated sodium chloride solutions as well as the (‘salt- ing-in” effect found at lower ionic strengths. Other evidence for nonelec trostatic interactions bet ween proteins and polysaccharides has been obtained from studies on complex formation between glycogen and concanavalin-A (131, 132), between albumin and dex- tran (133), and between fibrinogen and dextran (134, 135). Glycogen which has been methylated no longer forms complexes with concanavalin-A (132). Cifonelli et al. (136) observed that whereas heparin precipitated concanavalin-A more efficiently than glycogen, no pre- cipitation occurred with chondroitin sulfate or hy- aluronic acid under similar conditions. These ob- servations indicate that polymer structure and hydro- gen bonding are important factors in complex formation. It is of interest to note here that Peterson and Sober (137) implicate nonionic bonding forces as contributing to departures from electrophoretic order in the elution of proteins from polyelectrolyte cellulosic absorbants. The neutral polymers polyvinylpyrrolidone3 and poly-
PVP. Technical Bulletin, hntara Chemicals, New York 1-1. x. Y.
by guest, on Septem
ber 7, 2018w
ww
.jlr.orgD
ownloaded from

118 CORNWELL AND KRUGER
~-vinyl-5-methyl-2-oxazolidinone4 have recently been shown to exhibit rather unique and specific complexing capacities for certain organic compounds as well as certain proteins. Interactions with the latter are discussed more completely later in this review.
The complexes formed by the interactions between polyanions and lipoproteins are comparable in many ways to the colloid complexes described by Bungenberg de Jong (138). We have already considered the inter- action of polyanions with proteins below their isoelec- tric point; these result in the formation of dicomplex systems. In many instances, however, the presence of certain metal ions is essential for the formation of a complex. Bungenberg de Jong refers to these as tri- complex systems, amphion-cation-anion, in which the amphion may be a protein or other ampholyte such as egg lecithin, the cation a di- or trivalent metal ion, and the anion either a polyanion or a micro anion. Typical examples are : egg lecithin-La(II1)-arabinate; isoelectric gelatin-Zn(I1)-chondroitin sulfate; isoelec- tric gelatin-Cd(I1)-thiocyanate. The role of metal ions in the formation of lipoprotein-polyanion complexes is discussed in the section on lipoprotein-polysaccharide complexes.
Albumin and the low density lipoproteins form com- plexes with simple anions above their isoelectric points. Albumin-anion interactions have been studied by a number of investigators and are discussed in reviews by Klotz (139) and Foster (140). The literature on low density lipoprotein-anion interactions is less ex- tensive, but several important studies have appeared on the binding of free fatty acids (141, 142) and methyl orange (143). Goodman and Shafrir (142) showed that both SI 10400 and S , 0-10 lipoprotein fractions bind a small number of fatty acid anions a t strong binding sites, and a large number a t weaker binding sites. While binding affinities are somewhat greater with the S, 10400 lipoproteins, they both bind the same number of fatty acid anions (142). These interactions may be compared with the binding of fatty acid anions by plasma albumin studied under the same conditions (144). Albumin binds more fatty acid anions a t two somewhat stronger classes of binding sites than do the low density lipoproteins. However, more fatty acid anions are bound more strongly a t the weaker binding sites of the low density lipoproteins than at the weakest class of binding sites of albumin. Rosenberg et al. (143) found that methyl orange binding corresponded rather closely in low density lipoprotein and albumin systems. These similarities in anion binding would appear to indicate that similar mechanisms are involved
Technical 4 Molecular Complexing with Devlex@ Resins. Bulletin, Dow Chemical Company, Midland, Mich.
in anion interactions with albumin and the low density lipoproteins. Foster (140) has summarized the results of many studies on the binding by albumin of dyes and detergents and concluded that the tendency for water molecules to form a maximum number of hydrogen bonds with each other is a major factor in promoting protein- anion interactions. Aggregation of anions into mi- celles and the association of anions with proteins permit increased hydrogen bonding between solvent molecules, since hydrophobic groups constitute discontinuities in the surrounding hydrogen-bonded aqueous environment. These discontinuities may be minimized by the associa- tion of protein and anion hydrophobic groups (145). Foster (140) further suggests that albumin may assume a structural configuration in which hydrophobic groups are oriented toward the aqueous phase and are therefore available for nonionic bonding. Goodman and Shafrir (142) state that the large number of weaker binding sites on the lipoprotein molecule may result from hydro- phobic interactions. The relative availability of hydro- phobic groups may be characteristic of both albumin and low density lipoprotein molecules, and this structural feature influences the formation and specificity of protein-anion and protein-polyanion complexes.
The interaction of phenols with proteins has been attributed to the formation of hydrogen bonds between the phenolic hydroxyl groups and the peptide linkages in proteins (145 to 148). Mej baum-Katzenellenbogen (149) studied the interaction of several proteins with naturally occurring phenolic polymers, the tannins, and found that insoluble complexes were formed at or below the isoelectric points of the proteins. These complexes did not dissociate a t high ionic strength; however, they were dissociated by the addition of caffeine (150). Hydrogen bonding between phenols and caffeine may explain this phenomenon. The inter- action of monomeric phenols, thymol and phenol, with proteins is somewhat more specific and will be discussed in the next section. It would appear, how- ever, that considerations similar to those discussed above with reference to albumin and lipoprotein inter- actions with fatty acid and other anions may also apply to the interactions of proteins with phenols.
THE TURBIDIMETRIC ESTIMATION OF PLASMA
LIPOPROTEINS WITH PHENOLS
In 1944, Maclagan (6) described a thymol turbidity test for the estimation of serum globulins in liver disease. He analyzed the precipitate formed on adding buffered aqueous thymol to human serum and found that it con- tained protein nitrogen, lipid phosphorus, and cholesterol as well as thymol. Cholesterol to phospholipid ratios
by guest, on Septem
ber 7, 2018w
ww
.jlr.orgD
ownloaded from
PLASMA LIPOPROTEINS 119
calculated from these data (average 1.43) indicate that the precipitate contained low density lipoproteins. Kunkel and Hoagland (151) found that thymol reacted with both y-globulins and serum lipids. They also noted that the turbidity resulting from the y-globulin did not occur at elevated ionic strengths, whereas that due to the serum lipids was unaffected by increased ionic strength. However, prior extraction of lipids from hepatitis serum with ether prevented the pro- duction of turbidity with y-globulins. Reintroduction of serum lipid in the form of serum giving little thymol turbidity itself restored the turbidity (151, 152). It thus appears that the presence of serum lipoproteins is essential in the thymol turbidity reaction. Electro- phoretic studies also indicate that y-globulins are neces- sary in the production of thymol turbidity (151, 153). Albumin has an inhibitory effect on the production of turbidity (6, 154) ; however, this observation has been questioned by Albertsen et al. (155), who studied the effect of several purified protein fractions on turbidity. Thymol turbidity seems to depend on complex inter- actions between thymol, y-globulins, low density lipoproteins, and perhaps albumin. Nevertheless, several investigators have used thymol turbidity (156) to estimate serum lipids and lipoproteins, es- pecially the neutral fat and chylomicron concen- trations (157 to 161). Walther (162) found that thymol turbidity was useful in following serum lipid alterations in a given individual, but it was difficult to correlate with the serum lipid levels of different individuals. The thymol test has been discussed in several reviews (163, 164).
Maclagan (6) investigated a number of phenolic compounds in his study of liver function tests. Kunkel et al. (7) subsequently used one of these, phenol, in a turbidimetric method for the estimation of serum lipids. Since the turbidity produced with y-globulins is sup- pressed at elevated ionic strengths (7, 10, 151), the test was made more specific for serum lipids by the addition of 12% sodium chloride to the phenol reagent (7). This test was later modified by Polonovski et al. (165), who used 6% sodium chloride in their phenol reagent. These reagents have been used by a number of investigators and the turbidity produced appears to correlate to some degree with the total lipid and total cholesterol of serum (7, 165 to 181). Attempts have also been made, with some measure of success, to correlate the results of these methods with data ob- tained by paper electrophoretic procedures for the estimation of serum lipoproteins (167, 168, 177, 180, 182). It is possible that the phenol reagent which con- tains 6% sodium chloride is more sensitive to abnormal lipoproteins (165, 172) ; however, this observation
should be investigated further with ultracentrifugal flotation procedures. Turbidity in a modified phenol test has been reported to be enhanced by the addition of heparin, and suppressed by the presence of free fatt,y acids (183). On the other hand, thymol turbidity appears to be suppressed by heparin (184).
The principal advantages of the thymol and phenol turbidity methods are simplicity, the small volume of serum required, and the availability of reagents. While temperature does affect the turbidity, the data can be readily corrected for this variable (185, 186). The major disadvantage of both phenol and thymol turbidity procedures is their incomplete specificity. They yield little information on the composition and concentration of the specific lipoprotein fractions altered in different disease states. Although they have been reported to yield results comparable to those obtained by methods employing sulfated polysaccharides (170, 178, 187), this correlation has been questioned (188). Furthermore, the turbidity obtained may be affected by the con- centration of albumin (6, 154, 182), and fibrinogen and the products of fibrinolysis present in serum (189). Nevertheless, these procedures may have some applica- tion, within the limitations described, for following serum lipid levels in individuals during therapy.
PLASMA LIPOPROTEIN-SULFATED POLYSACCHARIDE
COMPLEXES
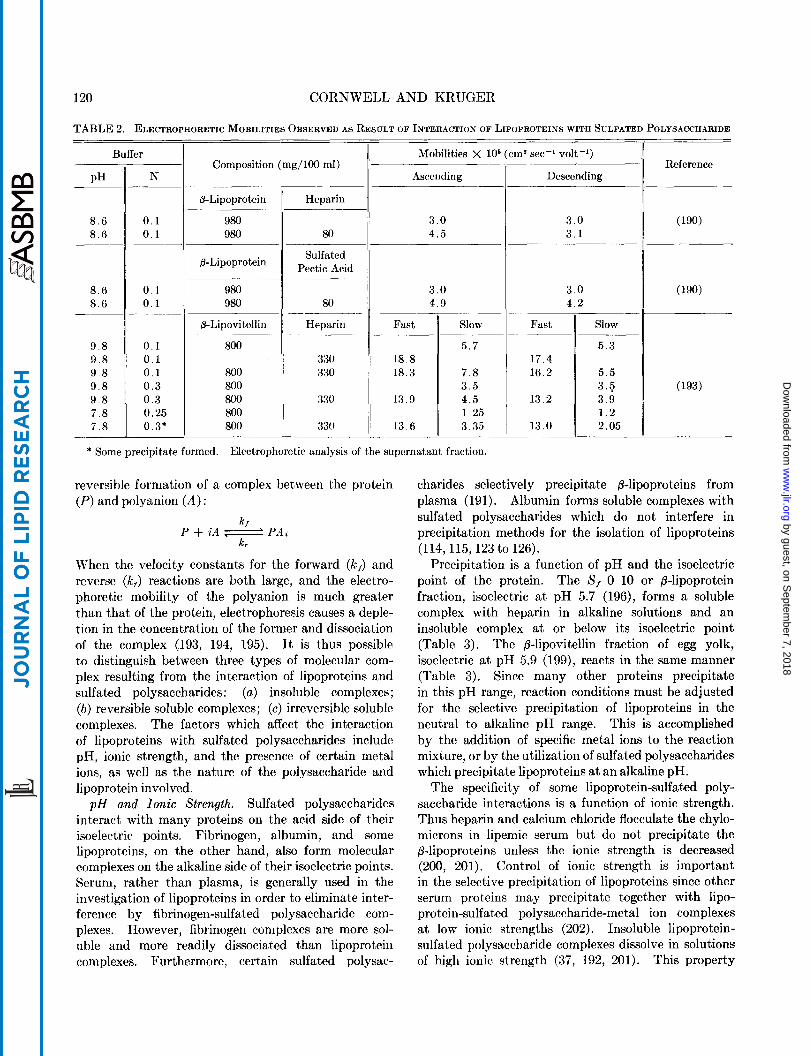
The interaction of lipoproteins with sulfated poly- saccharides may result in' the formation of either soluble or insoluble complexes. Insoluble complexes have been studied by observing the development of turbidity or by the actual isolation and chemical analysis of the precipitate. Soluble complexes have been studied by moving boundary electrophoresis since the electro- phoretic mobility of the lipoprotein-sulfated poly- saccharide complex is greater than that of the free lipoprotein (190 to 193). Bernfeld et al. (190) found that the ascending and descending boundaries were both altered by the formation of a P-lipoprotein-sulfated pectic acid complex, whereas only the ascending bound- ary was altered with the formation of a B-lipoprotein- heparin complex (Table 2). These differences in electrophoretic behavior characterize complexes with little tendency to dissociate (irreversible complexes) and complexes with considerable tendency to dissociate (reversible complexes), respectively. Sugano (193) investigated soluble P-lipovitellin-heparin complexes and also found a tendency for complex dissociation in the descending limb during electrophoresis (Table 2). This tendency for dissociation may be expressed as the
by guest, on Septem
ber 7, 2018w
ww
.jlr.orgD
ownloaded from
120 CORNWELL AND KRUGER
TABLE 2. ELECTROPHORETIC MOBILITIES OBSERVED AS RESULT OF INTERACTION OF LIPOPROTEINS WITH SULFATED POLYSACCHARIDE
Slow
Buffer
I Fast I/ Slow
Mobilities x los (cmz sec-1 volt-') Reference Coniposition (mg/100 ml)
N Descending Ascending PH
8 . 6 8 . 6
8 . 6 8 . 6 _-
9 . 8 9 . 8 9 . 8 9 . 8 9 . 8 7 . 8 7 . 8
0-Lipoprotein Heparin
80 0 . 1 0 .1
980 980
3 . 0 4 . 5
3 . 0 3 . 1
@-Lipoprotein Sulfated Pectic Acid
980 980
3 . 0 4 . 9
3 . 0 4 . 2
0 . 1 0 . 1
0 . 1 0 .1 0 . 1 0 . 3 0 . 3 0 .25 0 . 3 *
80
@-Lipovitellin Heparin Fast
800
800 800 800 800 800
5 . 7
7 . 8 3 . 5 4 . 5 1 .25 3 .35
5 . 3
5 . 5
3 . 9 1 . 2 2.05
3.5
330 330
330
330
17 .4 16 .2
13 .2
13 .0
18 .8 18 .3
13.9
13 .6
(193)
* Some precipitate formed. Electrophoretic analysis of the supernatant fraction.
reversible formation of a complex between the protein ( P ) and polyanion ( A ) :
k f
k, P + iA e P A ,
When the velocity constants for the forward (k,) and reverse (k,) reactions are both large, and the electro- phoretic mobility of the polyanion is much greater than that of the protein, electrophoresis causes a deple- tion in the concentration of the former and dissociation of the complex (193, 194, 195). It is thus possible to distinguish between three types of molecular com- plex resulting from the interaction of lipoproteins and sulfated polysaccharides : (a) insoluble complexes; (b) reversible soluble complexes; (c) irreversible soluble complexes. The factors which affect the interaction of lipoproteins with sulfated polysaccharides include pH, ionic strength, and the presence of certain metal ions, as well as the nature of the polysaccharide and lipoprotein involved.
p H and Ionic Strength. Sulfated polysaccharides interact with many proteins on the acid side of their isoelectric points. Fibrinogen, albumin, and some lipoproteins, on the other hand, also form molecular complexes on the alkaline side of their isoelectric points. Serum, rather than plasma, is generally used in the investigation of lipoproteins in order to eliminate inter- ference by fibrinogen-sulfated polysaccharide com- plexes. However, fibrinogen complexes are more sol- uble and more readily dissociated than lipoprotein complexes. Furthermore, certain sulfated polysac-
charides selectively precipitate @-lipoproteins from plasma (191). Albumin forms soluble complexes with sulfated polysaccharides which do not interfere in precipitation methods for the isolation of lipoproteins (114,115, 123 to 126).
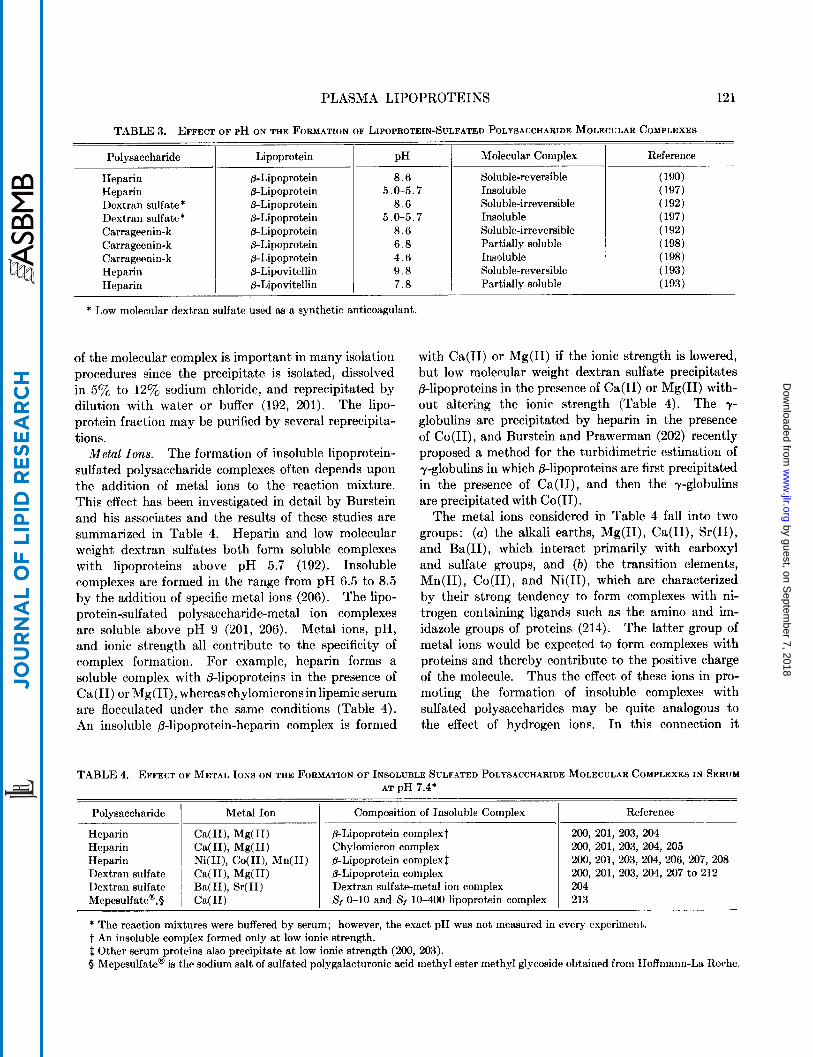
Precipitation is a function of pH and the isoelectric point of the protein. The S , 0-10 or @-lipoprotein fraction, isoelectric a t pH 5.7 (196), forms a soluble complex with heparin in alkaline solutions and an insoluble complex at or below its isoelectric point (Table 3). The p-lipovitellin fraction of egg yolk, isoelectric at pH 5.9 (199), reacts in the same manner (Table 3). Since many other proteins precipitate in this pH range, reaction conditions must be adjusted for the selective precipitation of lipoproteins in the neutral to alkaline pH range. This is accomplished by the addition of specific metal ions to the reaction mixture, or by the utilization of sulfated polysaccharides which precipitate lipoproteins a t an alkaline pH.
The specificity of some lipoprotein-sulfated poly- saccharide interactions is a function of ionic strength. Thus heparin and calcium chloride flocculate the chylo- microns in lipemic serum but do not precipitate the @-lipoproteins unless the ionic strength is decreased (200, 201). Control of ionic strength is important in the selective precipitation of lipoproteins since other serum proteins may precipitate together with lipo- protein-sulfated polysaccharide-metal ion complexes a t low ionic strengths (202). Insoluble lipoprotein- sulfated polysaccharide complexes dissolve in solutions of high ionic strength (37, 192, 201). This property
by guest, on Septem
ber 7, 2018w
ww
.jlr.orgD
ownloaded from
PLASMA LIPOPROTEINS 121
Polysaccharide Lipoprotein PH Molecular Complex
Heparin &Lipoprotein 8 . 6 Soluble-reversible Heparin &Lipoprotein 5.0-5.7 Insoluble Dextran sulfate* &Lipoprotein 8 . 6 Soluble-irreversible Dextran sulfate* p-Lipoprotein 5.0-5.7 Insoluble Carrageenin-k &Lipoprotein 8 . 6 Soluble-irreversible Carrageenin-k p-Lipoprotein 6 . 8 Partially soluble Carrageenin-k @-Lipoprotein 4 . 6 Insoluble Heparin @-Lipovitellin 9 . 8 Soluble-reversible Heparin I p-Lipovitellin 7 . 8 Partially soluble
Reference
(190) (197)
(197)
(198) (198) (193) (193)
(192)
(192)
* Low molecular dextran sulfate used as a synthetic anticoagulant.
of the molecular complex is important in many isolation procedures since the precipitate is isolated, dissolved in 5% to 12% sodium chloride, and reprecipitated by dilution with water or buffer (192, 201). The lipo- protein fraction may be purified by several reprecipita- tions.
The formation of insoluble lipoprotein- sulfated polysaccharide complexes often depends upon the addition of metal ions to the reaction mixture. This effect has been investigated in detail by Burstein and his associates and the results of these studies are summarized in Table 4. Heparin and low molecular weight dextran sulfates both form soluble complexes with lipoproteins above pH 5.7 (192). Insoluble complexes are formed in the range from pH 6.5 to 8.5 by the addition of specific metal ions (206). The lipo- protein-sulfated polysaccharide-metal ion complexes are soluble above pH 9 (201, 206). Metal ions, pH, and ionic strength all contribute to the specificity of complex formation. For example, heparin forms a soluble complex with @-lipoproteins in the presence of Ca(I1) or Mg(II), whereas chylomicrons in lipemic serum are flocculated under the same conditions (Table 4). An insoluble p-lipoprotein-heparin complex is formed
Metal Ions .
with Ca(I1) or Mg(I1) if the ionic strength is lowered, but low molecular weight dextran sulfate precipitates @-lipoproteins in the presence of Ca(I1) or Mg(I1) with- out altering the ionic strength (Table 4). The y- globulins are precipitated by heparin in the presence of Co(II), and Burstein and Prawerman (202) recently proposed a method for the turbidimetric estimation of y-globulins in which @-lipoproteins are first precipitated in the presence of Ca(II), and then the y-globulins are precipitated with Co(I1).
The metal ions considered in Table 4 fall into two groups: (a) the alkali earths, Mg(II), Ca(II), Sr(II), and Ba(II), which interact primarily with carboxyl and sulfate groups, and ( b ) the transition elements, Mn(II), Co(II), and Ni(II), which are characterized by their strong tendency to form complexes with ni- trogen containing ligands such as the amino and im- idazole groups of proteins (214). The latter group of metal ions would be expected to form complexes with proteins and thereby contribute to the positive charge of the molecule. Thus the effect of these ions in pro- moting the formation of insoluble complexes with sulfated polysaccharides may be quite analogous to the effect of hydrogen ions. In this connection it
TABLE 4. EFFECT OF METAL IONS ON THE FORMATION OF INSOLUBLE SULFATED POLYSACCHARIDE MOLECULAR COMPLEXES IN SERUM AT pH 7.4*
Polysaccharide
Heparin Heparin Heparin Dextran sulfate Dextran sulfate MepesulfateB,Q
_ _ _ _ ~ Metal Ion Composition of Insoluble Complex
@-Lipoprotein complext Chylomicron complex @-Lipoprotein complex @-Lipoprotein complex Dextran sulfate-metal ion complex 8, 0-10 and 8, 10-400 lipoprotein complex
Reference -~
200, 201, 203, 204 200, 201, 203, 204, 205 200, 201, 203, 204, 206, 207, 208 200, 201, 203, 204, 207 to 212 204 213
* The reaction mixtures were buffered by serum; however, the exact pH was not measured in every experiment. t An insoluble complex formed only at low ionic strength. 3 Other serum proteins also precipitate at low ionic strength (200, 203). Q Mepesulfate@ is the sodium salt of sulfated polygalacturonic acid methyl ester methyl glycoside obtained from Hoffmann-La Rorhe.
by guest, on Septem
ber 7, 2018w
ww
.jlr.orgD
ownloaded from
122 CORNWELL AND KRUGER
Hyaluronic acid sulfate
should be noted (Table 4) that heparin in the presence of these ions precipitates other serum proteins as well as @-lipoproteins at low ionic strength.
Although the addition of metal ions may be necessary for the precipitation of @-lipoproteins by some sulfated polysaccharides, their presence does not appear neces- sary for precipitation by others. Bernfeld et al. (190, 191, 192) precipitated lipoproteins from serum with several sulfated polysaccharides without adding metal ions; however the Ca(I1) already present in serum might have been sufficient. Florsheim and Gonzales (213) found that whereas i t was necessary to add calcium ions to effect the precipitation of @-lipoproteins with Mepesulfate@, no addition of calcium ions was necessary with rice starch sulfate. Oncley et aZ. (37) precipitated low density lipoproteins from resin col- lected plasma with a high molecular weight dextran sulfate. Although the calcium ion concentration was probably very low in this case, analytical data on this point are not available. Insoluble lipoprotein-sulfated polysaccharide-metal ion complexes are readily dis- sociated by the addition of chelating agents such as oxalate or citrate (201, 206), by increasing the ionic strength (37, 192, 202, 204, 206), and by selectively precipitating the sulfated polysaccharide as a Ba(II), Sr(II), or protamine salt (192, 202, 204, 206). It is of interest to note here that Hoch and Chanutin (126) found that chelating agents did not affect the formation of soluble protein-heparin complexes as studied electro- phoretically.
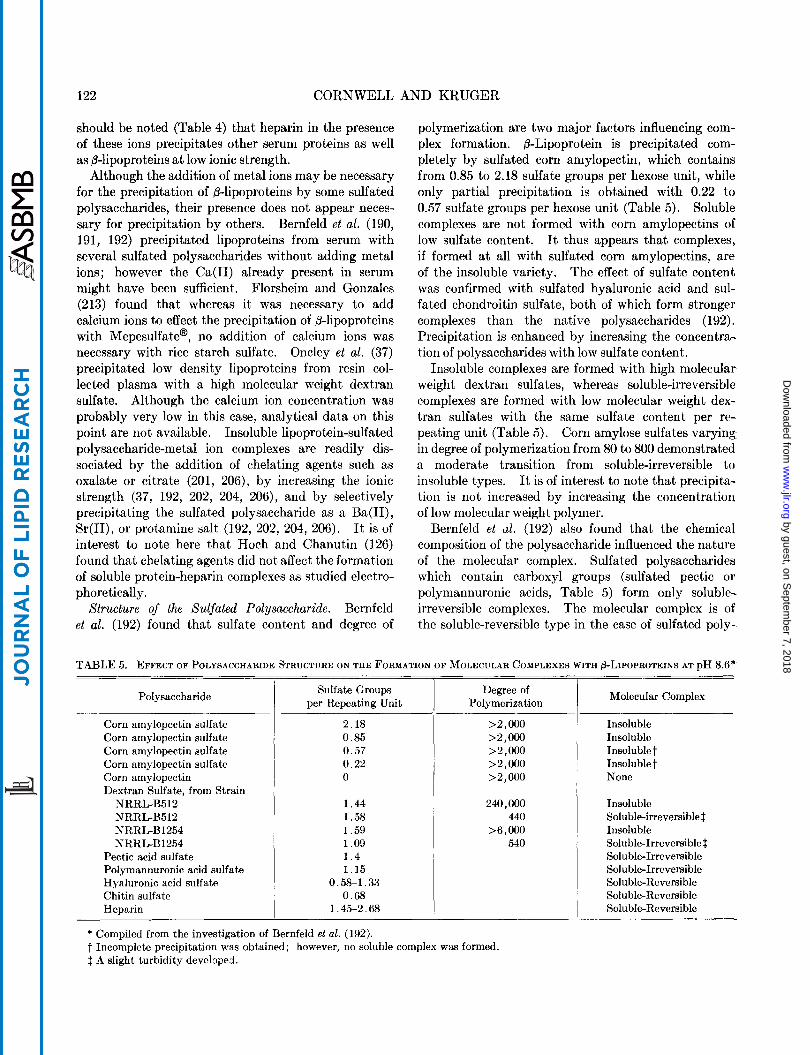
Bernfeld et al. (192) found that sulfate content and degree of
Structure of the Sulfated Polysaccharide.
0.58-1.33
polymerization are two major factors influencing com- plex formation. @-Lipoprotein is precipitated com- pletely by sulfated corn amylopectin, which contains from 0.85 to 2.18 sulfate groups per hexose unit, while only partial precipitation is obtained with 0.22 to 0.57 sulfate groups per hexose unit (Table 5 ) . Soluble complexes are not formed with corn amylopectins of low sulfate content. It thus appears that complexes, if formed a t all with sulfated corn amylopectins, are of the insoluble variety. The effect of sulfate content was confirmed with sulfated hyaluronic acid and sul- fated chondroitin sulfate, both of which form stronger complexes than the native polysaccharides (192). Precipitation is enhanced by increasing the concentra- tion of polysaccharides with low sulfate content.
Insoluble complexes are formed with high molecular weight dextran sulfates, whereas soluble-irreversible complexes are formed with low molecular weight dex- tran sulfates with the same sulfate content per re- penting unit (Table 5). Corn amylose sulfates varying in degree of polymerization from 80 to 800 demonstrated a moderate transition from soluble-irreversible to insoluble types. It is of interest to note that precipita- tion is not increased by increasing the concentration of low molecular weight polymer.
Bernfeld et d, (192) also found that the chemical composition of the polysaccharide influenced the nature of the molecular complex. Sulfated polysaccharides which contain carboxyl groups (sulfated pectic or polymannuronic acids, Table 5) form only soluble- irreversible complexes. The molecular complex is of the soluble-reversible type in the case of sulfated poly-
TABLE 5. EFFECT OF POLYSACCHARIDE STRUCTURE ON THE FORMATION OF MOLECULAR COMPLEXES WITH @-LIPOPROTEINS AT pH 8.6*
Polysaccharide
Corn amylopectin sulfate Corn amylopectin sulfate Corn amylopectin sulfate Corn amylopectin sulfate Corn amylopectin Dextran Sulfate, from Strain
NRRL-B512 NRRLB512 NRRL-B 1254 NRRL-B 1254
Pectic acid sulfate Polvmannuronic acid sulfate
Sulfate Groups per Repeating Unit
2.18 0.85 0.57 0.22 0
1.44 1.58 1.59 1.09 1 . 4 1.15
Degree of Polymerization
>2,000 >2,000 >2,000 >2,000 >2,000
240,000 440
>6,000 540
Molecular Complex
Insoluble Insoluble Insoluble t Insoluble t None
Insoluble Soluble-irreversible 1 Insoluble Soluble-Irreversible $ Soh ble-Irreversible Soluble-Irreversible Soluble-Reversible Soluble-Reversible Soluble-Reversible
* Compiled from the investigation of Bernfeld et al. (192). t Incomplete precipitation was obtained; however, no soluble complex was formed. $ A slight turbidity devclgped.
by guest, on Septem
ber 7, 2018w
ww
.jlr.orgD
ownloaded from
PLASMA LIPOPROTEINS 123
saccharides containing N-acetyl and N-sulfatyl hexosa- mine residues. This is illustrated by sulfated hyalu- ronic acid, sulfated chitin, and heparin in Table 5.
The polysaccharides suitable for complex formation have no apparent specific requirement for degree of branching, branching points, configuration of glycosidic linkages, or hexose composition (192). However, this investigation was limited to a single pH, and metal ion interactions were not considered. Other relation- ships may become apparent when pH, ionic strength, and metal ion effects are considered along with poly- saccharide structure.
Many of the experimental results obtained in the study of plasma lipoprotein- sulfated polysaccharide interactions are difficult to interpret because the criteria used to establish specificity were inadequate. In precipitation experiments speci- ficity was usually demonstrated by paper electrophoresis (200 to 212). Paper electrophoresis may show the absence of @-lipoproteins from the supernatant solution. However, chylomicrons and S f 10400 lipoproteins may not be differentiated from one another by this tech- nique. Groulade et al. (215) were able to correlate turbidity or precipitation with paper electrophoretic data by combining the @-lipoproteins and the less mobile lipoproteins as one fraction. This indicates that precipitation involves both S , 0-10 and Sf 10-400 lipoproteins, though the correlation was less apparent with lipemic sera (215). Moving boundary electro- phoresis indicates that serum lipoprotein-sulfated polysaccharide interactions involve the @-lipoprotein or Sf 0-10 lipoprotein fraction (190, 191, 192, 216). Starch gel and agar electrophoretic data are difficult to interpret since molecular size affects protein mobility in a starch gel (217), and agar, a sulfated polysaccharide, interacts with the low density lipoproteins (218).
Analytical and preparative ultracentrifugation have been used by several investigators to determine lipo- protein specificity in sulfated polysaccharide inter- actions. Oncley et al. (37) fractionated the lipopro- teins from a high molecular weight dextran sulfate complex by ultracentrifugation in a density gradient. Analytical ultracentrifugation was then used to measure the S , distribution in the lipoprotein fractions. These fractions contained S , 3-9, S , 5-15, and S , 10-100 lipoproteins; however, the quantitative recovery of the different low density lipoproteins from serum was not measured. Flor'sheim and Gonzales (213) compared serum and the lipoproteins obtained as an insoluble rice starch sulfate complex by analytical ultracentrifugation. The precipitate contained the S, 0-12 lipoproteins and most of the S , 12400 lipoproteins. Boyle and Moore (198) fractionated serum by preparative ultracentrifu-
Lipoprotein Specificity.
gation into the lipoprotein-free infranate (d > 1.21), high density lipoproteins (d 1.063-1.21), S f 0-16 lipoproteins (d 1.006-1.063), and Sf > 17 lipoproteins (d < 1.006). Only the Sf 0-16 lipoprotein fraction formed an insol- uble complex with the carrageenin used in their study. Sulfated corn amylopectin precipitated S f 2-12 lipo- proteins from serum, according to a study by Bernfeld et al. (192). In an earlier study Bernfeld et al. (216) found the turbidity with sulfated corn amylopectin to be specific for the 0-lipoprotein fraction as isolated by zone electrophoresis on a starch block.
An insoluble complex has been obtained by the flocculation of lipemic serum with heparin and Ca(I1) ions, and attributed to the chylomicron fraction (201, 203, 204, 207, 208). Since the chylomicron fraction is often poorly defined, and since lactescent serum also contains increased amounts of S l H 0 0 lipoproteins, ultracentrifugation studies are necessary to confirm this important observation. Burstein and Samaille (205) prepared antibodies against this chylomicron fraction and found them to flocculate chylomicrons, whereas they only reacted weakly with 0-lipoproteins. However, the chylomicrons employed in the production of antibodies were subject to centrifugation during the isolation procedure from the heparin complex and may therefore have been separated from any S , 10-400 lipoproteins coprecipitated with them. Burstein and Samaille (201) also found that the protein content of the lipoprotein-heparin-Ca(I1) ion precipitates was altered by varying the ionic strength of the reaction mixture. The fraction isolated at low ionic strength contained more protein than the fraction isolated directly from serum. To what extent this difference indicates con- tamination by nonlipoprotein protein or selectivity between precipitation conditions for the chylomicrons, S 10400 lipoproteins, and S 3-9 lipoproteins remains to be investigated.
Electrophoretic and ultracentrifugal techniques in- dicate that the sulfated polysaccharide interactions with respect to human serum are specific for chylo- microns and low density lipoproteins. This is further substantiated by the more sensitive immunochemical techniques. Burstein and Oudin (219) prepared anti- bodies against the lipoproteins precipitated from serum as a dextran-Ca(I1) complex, and demonstrated the immunochemical homogeneity of the lipoprotein frac- tion. Antibodies to this fraction have been used to estimate the @-lipoprotein content of serum (220, 221). The antibodies are probably not strictly specific for @-lipoproteins alone, since S , 0-10 lipoproteins and S , 10-400 lipoproteins do not differ immunochemically (57). As discussed earlier, there is some question con- cerning the electrophoretic behavior of S, 10-100 lipo-
by guest, on Septem
ber 7, 2018w
ww
.jlr.orgD
ownloaded from

124 CORNWELL AND KRUGER
proteins; a t least some portions of this fraction do not migrate as @-lipoproteins. Briner et al. (57) isolated low density lipoproteins by precipitation with high molecular weight dextran sulfate, fractionated the precipitated lipoproteins in a saline density gradient into Sf 0-10 and Sf 10400 lipoproteins, and prepared antibodies against the two fractions. These two frac- tions cross-reacted completely, and therefore cannot be distinguished by immunochemical means.
Although the composition of different lipoprotein fractions isolated from normal sera by other procedures has been studied in detail, chemical analysis has not been used extensively in the characterization of lipoprotein-sulfated polysaccharide precipitates. This is due in part to the fact that the precipitates often contain mixtures of Sf 0-10 and S, 10400 lipoproteins, and the composition of the precipitate may vary, de- pending on the relative concentration of these two lipoproteins in the serum. The total lipid content of sulfated amylopectin precipitates (190) and the range in protein, sterol, phosphatide, and glycerol content for a low molecular weight dextran sulfate precipitate (206) have been reported. Polonovski et al. (211) studied the total lipid, cholesterol, and phospholipid composition of a dextran sulfate precipitate and the corresponding supernatant solution. Cholesterol to phospholipid ratios calculated from this study indicate that the precipitate contained low density lipoproteins and the supernatant contained the high density lipo- protein fraction. Castaigne and Amselem (212) meas- ured the total cholesterol, esterified cholesterol, and free cholesterol in similar fractions and found the ap- propriate esterified to total cholesterol ratios for low and high density lipoproteins in the precipitate and supernatant, respectively. Oncley et al. (37) isolated Sf 10-100 and Sf 3-9 lipoprotein fractions from a high molecular weight dextran sulfate precipitate by ultra- centrifugal flotation and showed that the composition of these fractions was identical with that of lipoprotein fractions isolated directly by ultracentrifugation. The cholesterol distribution between lipoprotein-sulfated polysaccharide precipitate and supernatant solution has been measured in several studies (178, 206, 208, 209, 222), and is similar to the cholesterol distribution between low and high density lipoproteins as determined by ultracentrifugal, electrophoretic, and cold-ethanol fractionation methods. However, Beaumont and Beau- mont (223) found an appreciable quantity of vitamin A in lipoprotein-dextran sulfate-Ca(I1) precipitates, whereas Krinsky el al. (224) found only traces of vita- min A in lipoprotein-dextran sulfate precipitates further purified by ultracentrifugal flotation.
Sulfated polysaccharide precipitation methods have
been used to investigate the plasma lipoprotein dis- tribution in disease states associated with hypercho- lesterolemia and hyperlipemia (170, 172, 173, 178, 180, 181, 198, 208, 209, 211, 212, 216, 222, 225, 226, 227). These studies are difficult to evaluate since the methods are usually standardized with sera from normal sub- jects, or lipoprotein fractions isolated from normal subjects. Since the S , distribution and composition of lipoprotein fractions show wide variation in many diseases, direct extrapolation from normal to patho- logical sera may be misleading. The cholesterol dis- tribution between precipitate and supernatant observed in hyperlipemic sera is generally similar to that ob- tained by other methods, although in some cases the cholesterol content of the supernatant (high density lipoprotein) is greater than would be expected from other studies (178, 209, 211, 212, 222). It is possible that all portions of the low density lipoprotein spectrum are not precipitated under the conditions employed. It is also important to be certain that the concentration of precipitating polyanion is adequate for quantitative precipitation.
The investigation of plasma lipoproteins in different animal species by sulfated polysaccharide precipitation methods presents special problems. Castaigne and Amselem (212) used dextran sulfate to investigate the cholesterol distribution in a number of animal species. Their results were similar to those obtained by other methods; however, the characterization of animal lipoproteins is as yet too incomplete for a significant correlation between methods. Burstein and Samaille (228) studied lipoprotein-dextran sulfate complexes in several animal species by paper electrophoresis and were able to demonstrate precipitation of @-lipoproteins. However, Florsheim and Gonzales (213) obtained var- iable precipitation of different animal @-lipoproteins with rice starch sulfate, a polyanion which precipitates human low density lipoproteins quantitatively. These workers found that Mepesulfate@' precipitated many animal ,&lipoproteins in a quantitative manner. The use of sulfated polysaccharides will undoubtedly con- tribute to the characterization of animal serum lipo- proteins, but it is most important that they be initially employed in conjunction with electrophoretic and ultracentrifugal techniques.
Concentration. The solubility of lipoprotein-sulfated polysaccharide complexes is influenced by the relative concentration of lipoprotein and sulfated polysac- charide. Soluble complexes are formed if either lipo- protein or sulfated polysaccharide is present in large excess. Oncley et al. (37) suggested that a serum aliquot be titrated to maximum turbidity in order to establish the optimal sulfated polysaccharide concentration for
by guest, on Septem
ber 7, 2018w
ww
.jlr.orgD
ownloaded from
PLASMA LIPOPROTEINS 125
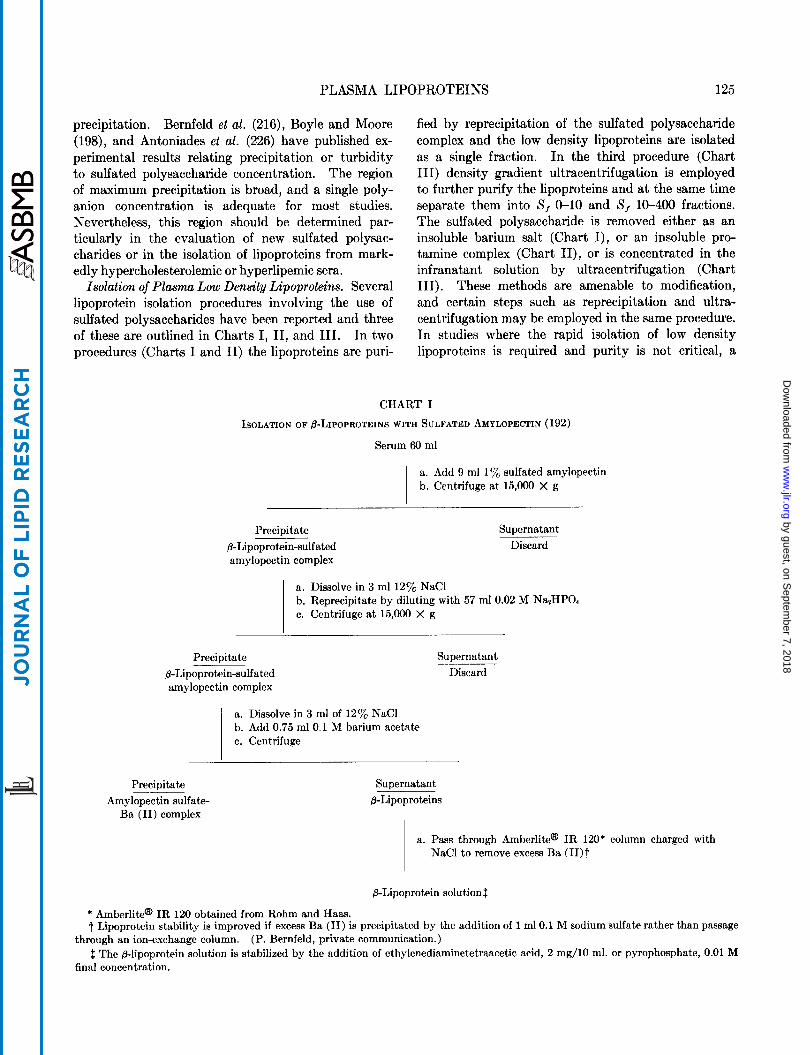
precipitation. Bernfeld et al. (216), Boyle and Moore (198), and Antoniades et ul. (226) have published ex- perimental results relating precipitation or turbidity to sulfated polysaccharide concentration. The region of maximum precipitation is broad, and a single poly- anion concentration is adequate for most studies. Nevertheless, this region should be determined par- ticularly in the evaluation of new sulfated polysac- charides or in the isolation of lipoproteins from mark- edly hypercholesterolemic or hyperlipemic sera.
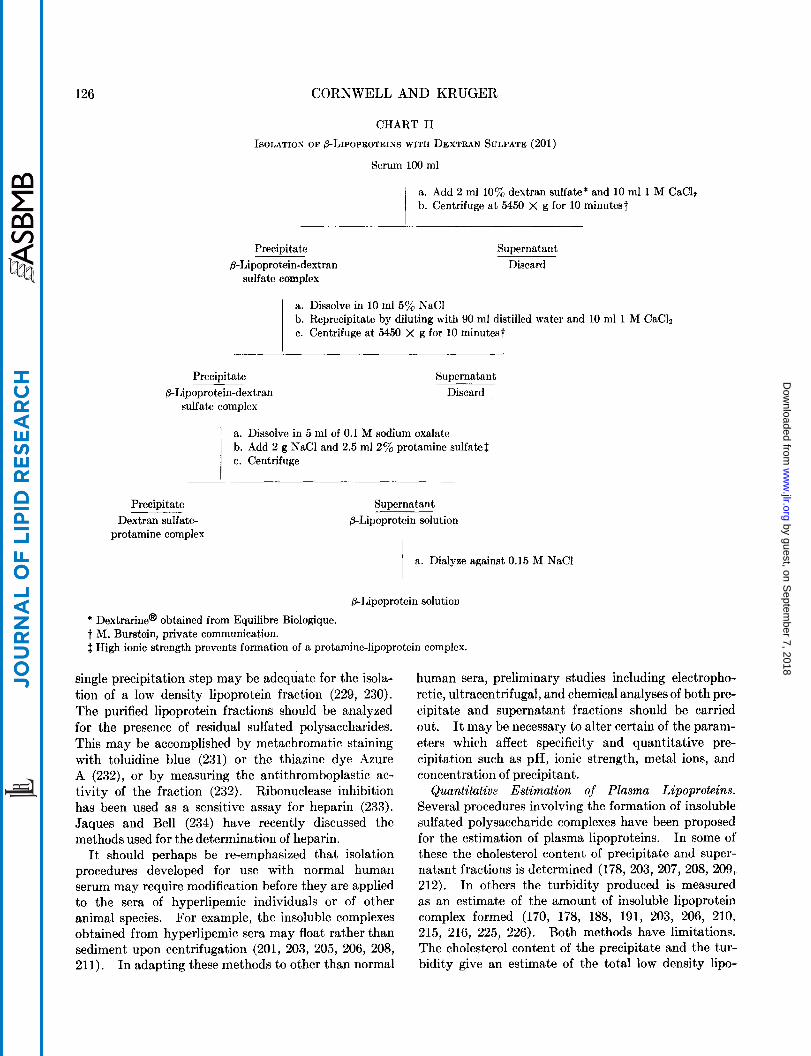
IsoEation of Plasma Low Density Lipoproteins. Several lipoprotein isolation procedures involving the use of sulfated polysaccharides have been reported and three of these are outlined in Charts I, 11, and 111. In two procedures (Charts I and 11) the lipoproteins are puri-
fied by reprecipitation of the sulfated polysaccharide complex and the low density lipoproteins are isolated as a single fraction. In the third procedure (Chart 111) density gradient ultracentrifugation is employed to further purify the lipoproteins and at the same time separate them into S , 0-10 and Sf 10-400 fractions. The sulfated polysaccharide is removed either as an insoluble barium salt (Chart I), or an insoluble pro- tamine complex (Chart II), or is concentrated in the infranatant solution by ultracentrifugation (Chart 111). These methods are amenable to modification, and certain steps such as reprecipitation and ultra- centrifugation may be employed in the same procedure. In studies where the rapid isolation of low density lipoproteins is required and purity is not critical, a
CHART I
ISOLATION OF &LIPOPROTEINS WITH SULFATED AMYLOPECTIN (192)
Serum 60 ml
a. Add 9 ml 1% sulfated amylopectin b. Centrifuge at 15,000 X g
PreciDitate @-Lipoprotein-sulf ated amylopectin complex
Supernatant Discard
a. Dissolve in 3 ml 12% NaCl b. Reprecipitate by diluting with 57 mlO.02 M Na2HP04 c. Centrifuge at 15,000 X g
Precipitate 8-Lipoprotein-sulfated amylopectin complcx
a. Dissolve in 3 ml of 12% NaCl b. Add 0.75 ml 0.1 M barium acetate c. Centrifuge
Supernatant Discard
___-
Precipitate Amylopectin sulfate-
Ba (11) complex
____ SuDernatant 8-Lipoproteins
a. Pass through Amberliten I R 120* column charged with NaCl to remove excess Ba (1I)t
p-Lipoprotein solution $
* Amberlit@ I R 120 obtained from Rohm and Ham. t Lipoprotein stability is improved if excess Ba (11) is precipitated by the addition of 1 mlO.1 M sodium sulfate rather than passage
$ The @-lipoprotein solution is stabilized by the addition of ethylenediaminetetraacetic acid, 2 mg/lO ml. or pyrophosphate, 0.01 M through an ion-exchange column.
final concentration.
(P. Bernfeld, private communication. )
by guest, on Septem
ber 7, 2018w
ww
.jlr.orgD
ownloaded from
126 CORNWELL AND KRUGER
CHART I1 ISOLATION OF LIPOPROTEINS WITH DEXTRAN SULFATE (201)
Serum 100 ml
a. Add 2 ml 10% dextran sulfate* and 10 ml 1 M CaClz b. Centrifuge at 5450 X g for 10 minutest
Precipitate B-Lipoprotein-dextran
sulfate complex
Supernatant Discard
a. Dissolve in 10 ml 5% NaCl b. Reprecipitate by diluting with 90 ml distilled water and 10 ml 1 M CaC1, c. Centrifuge at 5450 X g for 10 minutest
Precipitate @-Lipoprotein-dextran
sulfate complex
Supernatant Discard
a. Dissolve in 5 ml of 0.1 M sodium oxalate b. Add 2 g NaCl and 2.5 ml2% protamine sulfate$ c. Centrifuge
Precipitate Dextran sulfate-
protamine complex
Supernatant &Lipoprotein solution
a. Dialyze against 0.15 M NaCl
&Lipoprotein solution
* DextrarineB obtained from Equilibre Biologique. t M. Burstein, private communication. 1 High ionic strength prevents formation of a protamine-lipoprotein complex.
single precipitation step may be adequate for the isola- tion of a low density lipoprotein fraction (229, 230). The purified lipoprotein fractions should be analyzed for the presence of residual sulfated polysaccharides. This may be accomplished by metachromatic staining with toluidine blue (231) or the thiazine dye Azure A (232), or by measuring the antithromboplastic ac- tivity of the fraction (232). Ribonuclease inhibition has been used as a sensitive assay for heparin (233). Jaques and Bell (234) have recently discussed the methods used for the determination of heparin.
It should perhaps be re-emphasized that isolation procedures developed for use with normal human serum may require modification before they are applied to the sera of hyperlipemic individuals or of other animal species. For example, the insoluble complexes obtained from hyperlipemic sera may float rather than sediment upon centrifugation (201, 203, 205, 206, 208, 211). In adapting these methods to other than normal
human sera, preliminary studies including electropho- retic, ultracentrifugal, and chemical analyses of both pre- cipitate and supernatant fractions should be carried out. It may be necessary to alter certain of the param- eters which affect specificity and quantitative pre- cipitation such as pH, ionic strength, metal ions, and concentration of precipitant.
Quantitative Estimation of Plasma Lipoproteins. Several procedures involving the formation of insoluble sulfated polysaccharide complexes have been proposed for the estimation of plasma lipoproteins. In some of these the cholesterol content of precipitate and super- natant fractions is determined (178, 203, 207, 208, 209, 212). In others the turbidity produced is measured as an estimate of the amount of insoluble lipoprotein complex formed (170, 178, 188, 191, 203, 206, 210, 215, 216, 225, 226). Both methods have limitations. The cholesterol content of the precipitate and the tur- bidity give an estimate of the total low density lipo-
by guest, on Septem
ber 7, 2018w
ww
.jlr.orgD
ownloaded from
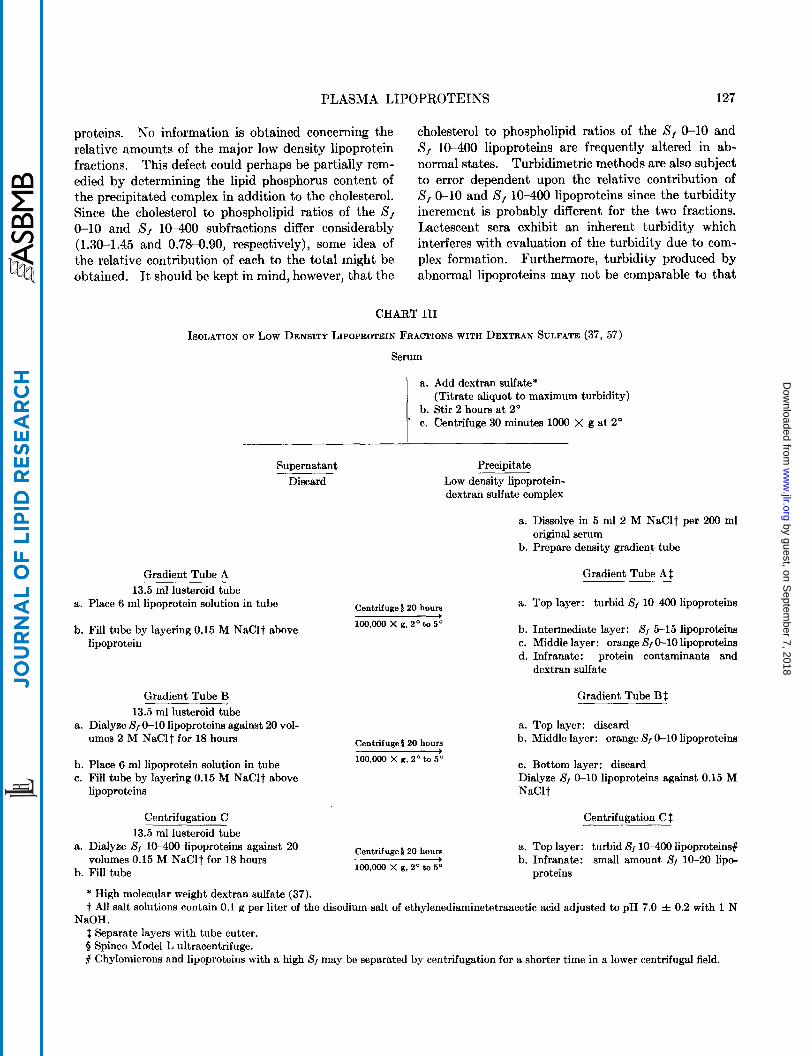
PLASMA LIPOPROTEINS 127
proteins. No information is obtained concerning the relative amounts of the major low density lipoprotein fractions. This defect could perhaps be partially rem- edied by determining the lipid phosphorus content of the precipitated complex in addition to the cholesterol. Since the cholesterol to phospholipid ratios of the Sf 0-10 and S , 1 M O O subfractions differ considerably (1.30-1.45 and 0.784.90, respectively), some idea of the relative contribution of each to the total might be obtained. It should be kept in mind, however, that the
cholesterol to phospholipid ratios of the 8, 0-10 and S, 10-400 lipoproteins are frequently altered in ab- normal states. Turbidimetric methods are also subject to error dependent upon the relative contribution of S, 0-10 and S, 1 0 4 0 0 lipoproteins since the turbidity increment is probably different for the two fractions. Lactescent sera exhibit an inherent turbidity which interferes with evaluation of the turbidity due to com- plex formation. Furthermore, turbidity produced by abnormal lipoproteins may not be comparable to that
CHART I11
ISOLATION OF Low DENSITY LIPOPROTEIN FRACTIONS WITH DEXTRAN SULFATE (37, 57)
Serum
a. Add dextran sulfate*
b. Stir 2 hours at 2' c. Centrifuge 30 minutes lo00 X g at 2"
(Titrate aliquot to maximum turbidity)
Supernatant Discard
Precipitate Low density lipoprotein- dextran sulfate complex
a. Dissolve in 5 ml 2 M NaClt per 200 ml
b. Prepare density gradient tube original serum
Gradient Tube A 13.5 ml lusteroid tube
Gradient Tube AS
a. Top layer: turbid S f 1W00 lipoproteins a. Place 6 ml lipoprotein solution in tube Centrifuge 5 20 hours
b. Intermediate layer: S f 5-15 lipoproteins lipoprotein c. Middle layer: orange Sf 0-10 lipoproteins
d. Infranate: protein contaminants and
100,Ooo x g, 20 to 50 b. Fill tube by layering 0.15 M NaClt above
dextran sulfate
Gradient Tube B 13.5 ml lusteroid tube
a. Dialyze S, 0-10 lipoproteins against 20 vol- umes 2 M NaClt for 18 hours
Gradient Tube BS
a. Top layer: discard b. Middle layer: orange Sf 0-10 lipoproteins Centrifuge! 20 hours
c. Bottom layer: discard Dialyze S f 0-10 lipoproteins against 0.15 M
100,000 x g, 20 to 50 b. Place 6 ml lipoprotein solution in tube c. Fill tube by layering 0.15 M NaClt above
lipoproteins NaClt
Centrifugation C 13.5 ml lusteroid tube
a. Dialyze Sf 10-400 lipoproteins against 20 Centrifuge5 20 hours >
100,Ooo x g, 20 to 50 volumes 0.15 M NaClt for 18 hours
b. Fill tube
Centrifugation CS
a. Top layer : turbid Sf 10400 lipoproteins# b. Infranate: small amount S f 10-20 lipo-
proteins
* High molecular weight dextran sulfate (37). t All salt solutions contain 0.1 g per liter of the disodium salt of ethylenediaminetetraacetic acid adjusted to pH 7.0 f 0.2 with 1 N
NaOH. 1 Separate layers with tube cutter. 5 Spinco Model L ultracentrifuge. # Chylomicrons and lipoproteins with a high Sf may be separated by centrifugation for a shorter time in a lower centrifugal field.
by guest, on Septem
ber 7, 2018w
ww
.jlr.orgD
ownloaded from

128 CORNWELL AND KRUGER
produced by a like amount of normal lipoprotein. Fi- nally, it should be pointed out that purified lipoproteins have not proved satisfactory as standards for the tur- bidimetric analysis of serum lipoproteins, largely be- cause a number of substances present in serum enhance turbidity (192).
Molecular Complexes in Plaque Formation. The demonstration of synthetic lipoprotein-sulfated poly- saccharide complexes led Gero et al. (235) to suggest that lipid deposition in the aorta resulted from the formation of a plasma lipoprotein-mucopolysaccharide complex a t the site of plaque formation. Atheroscle- rosis is accompanied by an elevation in aortic mucopoly- saccharides (235, 236, 237), and there may be a focal increase in metachromatic material in the area of plaque formation (238). Farquhar et ul. (239) have suggested that atheroma and plasma fatty acids are in a dynamic equilibrium; however, the net deposition of lipid or preformed plasma lipoprotein in the aorta has not been demonstrated. Also, lipid synthesis has been shown to occur in arterial tissue (240). The relative contribution of plasma lipid and synthesis of lipid, in situ, to the lipid in the atherosclerotic lesion, as well as the nature of the binding of the lipid therein, remains obscure (241).
THE INTERACTION OF LIPOPROTEINS WITH NEUTRAL
POLYMERS
Polyvinylpyrrolidone (PVP) is a neutral polymer which has been used as a plasma extender.6 Although PVP preparations are available in several molecular weight ranges, the one studied most contains between 150 and 170 monomer units and has a mean molecular weight of about 40,000 (242). PVP as obtained from the manufacturer migrates in an electric field and exhibits two types of ionizable groups (pK 4.3 and 10) on titration with alkali (243). However, it has been shown that these groups are associat,ed with a low molecular weight inpurity and PVP which has been sub- jected to exhaustive dialysis is essentially nonionogenic throughout the pH range 2.5 to 10 (244). Also, ultra- violet absorption indicates that the structure of the polymer remains essentially unaltered over a wide pH range (245, 246). PVP forms molecular complexes with a number of compounds (242, 244, 245, 247, 248). Higuchi and Kuramoto (247) have suggested that complex formation is effected by hydrogen bonding. Another neutral polymer, poly-N-vinyl-5-methy1-2- oxazolidinone (DevlexQ) , has binding properties similar
to PVP, and this has been attributed to the formation of resonance complexes.6
The literature on the interactions between PVP and serum proteins appears to be contradictory. May et al. (242), Ardry (249), and Hirsch and Cattaneo (250) found no evidence of interaction by electro- phoretic techniques. However, Grabar (251) con- cluded from the results of hemagglutination studies that PVP did interact with serum proteins. Further- more, Ramos (252) reported that PVP altered the electrophoretic mobilities of albumin and ?-globulins. Banerjee (253) studied the interaction between PVP and fibrinogen by measuring viscosity effects and found that high molecular weight PVP formed complexes with fibrinogen, whereas low molecular weight PVP did not, appear to do so. It is therefore possible that some of the apparent discrepancies are due to differ- ences in the PVP preparations used by the several investigators.
In 1957 Burstein (5) reported that PVP formed an insoluble complex with the P-lipoproteins. Burstein and eo-workers (5, 254, 255, 256) have studied this interaction in detail. Precipitation with PVP is a function of pH, ionic strength, and PVP concentration. Only chylomicrons complex above pH 9.5, whereas @-lipoproteins also form precipitates in the intermediate pH range, and both lipoproteins and ?-globulins pre- cipitate when the pH is lowered to 4 (5 , 254, 255). The formation of insoluble complexes with P-lipo- proteins and 7-globulins is inhibited in hypertonic sodium chloride solutions (5, 254, 255). Hypertonic salt solutions do not inhibit PVP interaction with chylomicrons or the flocculation of chylomicron-PVP complexes (254, 255). Only chylomicrons are floc- culated when the final PVP concentration is 5%, both chylomicrons and @-lipoproteins are precipitated when the concentration is raised to 8%, and other globulins are also precipitated in 12y0 PVP (5, 254, 256). The lipovitellenin or rising lipoprotein fraction of egg yolk may be flocculated as a Devlex-130@ ~omplex .~
PVP has been employed in a turbidimetric method for the estimation of chylomicrons and lipoproteins in serum (256). Burstein and Prawerman (255) re- cently developed a method for the isolation of low density lipoproteins from hyperlipemic sera which in- volves varying ionic strength and PVP concentration for the selective formation of insoluble lipoprotein- PVP complexes (Chart IV). The lipoprotein fractions are further purified as heparin complexes, and the chylomicrons isolated by a final ultracentrifugal flota-
See footnote 3. 6 See footnote 4 , 7 D. A. Wolfe and D. G. Cornwcll, unpublished observations.
by guest, on Septem
ber 7, 2018w
ww
.jlr.orgD
ownloaded from

PLASMA LIPOPROTEINS
a. Suspend in 20 ml 0.15 M NaCl buffered at pH 7.6
a. Dialyze against 0.15 M NaCl buffered at pH 7.6
129
a. Add 10 ml2% sodium citrate
b. Dialyze against 0.15 M NaCl buffered at pH 7.6
CHART IV
ISOLATION OF Low DENSITY LIPOPROTEINS FROM HYPERLIPEMIC SERUM WITH PVP (255)
Serum 200 ml
a. Add 20 g NaCl b. Add 50 m l % % PVP* c. Centrifuge 6OOO rpm for 10 minutes
Surface Layer Infranatant Lipoprotein-PVP complex
a. Washt b. Suspend in 50 ml
0.025 M CaClz c. Add 1 m l 5 %
heparin
Infranatant Discard
d. Centrifuge 6000 rpm for 10 minutes
a. Add 50 ml. 25% PVP* b. Stand 2 hours
c. Centrifuge 6OOO rpm for 10 minutes
Surface Layer Lipoprotein-PVP
complex
a. Wash$ b. Suspend in 50 ml
0.025 M CaCL I c. Add 1 m l 5 % Surface Layer Infranatant
Lipoprotein-heparin Discard complex
heparin
rpm for 10 minutes
d. Centrifuge 6000
tion step. The composition of the three fractions ob- tained is summarized in Table 6. The lactescence of the three fractions (comparing aliquots with equal lipid content) decreases from fraction I to fraction 111. Fraction I11 is more opalescent than the /%lipoprotein fraction obtained from normal serum. It would appear from this study that considerable specificity can be attained within the low density lipoprotein spectrum with precipitation techniques employing neutral poly-
mers. However, much work remains to be done in defining conditions and characterizing the fractions obtained.
In summary, the fractionation, estimation, and char- acterization of lipoproteins by complex formation with a variety of high molecular weight substances is an active area of research. However, although the formation of insoluble molecular complexes has proved valuable in the initial concentration and purification of certain
by guest, on Septem
ber 7, 2018w
ww
.jlr.orgD
ownloaded from
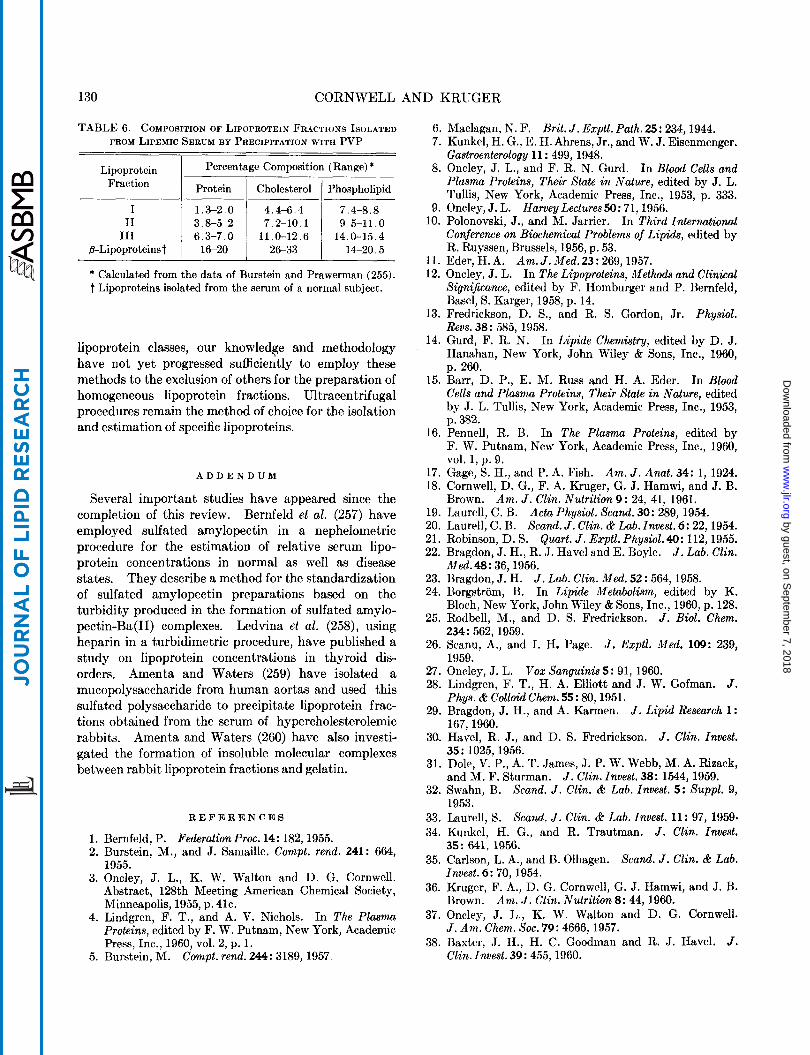
130 CORNWELL AND KRUGER
Lipoprotein Fraction
TABLE 6. COMPOSITION OF LIPOPROTEIN FRACTIONS ISOLATED FROM LIPEMIC SERUM BY PRECIPITATION WITH PVP
Percentage Composition (Range) *
Protein I Cholesterol 1 Phospholipid
I I1
I11 @-Lipoproteinst
1.3-2.0 4.4-6.4 7.4-8.8 3.8-5.2 7.2-10.1 9.5-11.0 6.3-7.0 11.0-12.6 14.0-15.4
16-20 26-33 14-20.5
* Calculated from the data of Burstein and Prawerman (255). t Lipoproteins isolated from the serum of a normal subject.
lipoprotein classes, our knowledge and methodology have not yet progressed sufficiently to employ these methods to the exclusion of others for the preparation of homogeneous lipoprotein fractions. Ultracentrifugal procedures remain the method of choice for the isolation and estimation of specific lipoproteins.
A D D E N D U M
Several important studies have appeared since the completion of this review. Bernfeld et al. (257) have employed sulfated amylopectin in a nephelometric procedure for the estimation of relative serum lipo- protein concentrations in normal as well as disease states. They describe a method for the standardization of sulfated amylopectin preparations based on the turbidity produced in the formation of sulfated amylo- pectin-Ba(I1) complexes. Ledvina et al. (258), using heparin in a turbidimetric procedure, have published a study on lipoprotein concentrations in thyroid dis- orders. Amenta and Waters (259) have isolated a mucopolysaccharide from human aortas and used this sulfated polysaccharide to precipitate lipoprotein frac- tions obtained from the serum of hypercholesterolemic rabbits. Amenta and Waters (260) have also investi- gated the formation of insoluble molecular complexes between rabbit lipoprotein fractions and gelatin.
R E F E R E N C E S
1. Bernfeld, P. Federation Proc. 14: 182,1955. 2. Burstein, M., and J. Samaille. Compt. rend. 241: 664,
1955. 3. Oncley, J. L., K. W. Walton and D. G. Cornwell.
Abstract, 128th Meeting American Chemical Society, Minneapolis, 1955, p. 41c.
4. Lindgren, F. T., and A. V. Nichols. In The Plasma Proteins, edited by F. W. Putnam, New York, Academic Press, Inc., 1960, vol. 2, p. 1.
5. Burstein, M. Compt. rend. 244: 3189, 1957.
6. Maclagan, N. F. Brit. J . Exptl. Path. 25: 234,1944. 7. Kunkel, H. G., E. H. Ahrens, Jr., and W. J. Eisenmenger.
Gastroenterology 11 : 499, 1948. 8. Oncley, J. L., and F. R. N. Gurd. In Blood Cells and
Plasma Proteins, Their State in Nature, edited by J. L. Tullis, New York, Academic Press, Inc., 1953, p. 333.
9. Oncley, J. L. Harvey Lectures50: 71, 1956. 10. Polonovski, J., and M. Jarrier. In Third International
Conference on Biochemical Problems of Lipids, edited by R. Ruyssen, Brussels, 1956, p. 53.
11. Eder, H. A. Am. J . Med. 23 : 269,1957. 12. Oncley, J. L. In The Lipoproteins, Methods and Clinical
13.
14.
15.
16.
17. 18.
19. 20. 21. 22.
23. 24.
25.
26.
27. 28.
29.
30.
31.
32.
33. 34.
35.
36.
37.
38.
Signijcance, edited by F. Homburger and P. Bernfeld, Basel, S. Karger, 1958, p. 14. Fredrickson, D. S., and R. S. Gordon, Jr. Physwl. Revs. 38: 585, 1958. Gurd, F. R. N. In Lipide Chemistry, edited by D. J. Hanahan, New York, John Wiley & Sons, Inc., 1960, p. 260. Barr, D. P., E. M. Russ and H. A. Eder. In Blood Cells and Plasma Proteins, Their State in Nature, edited by J. L. Tullis, New York, Academic Press, Inc., 1953, p. 382. Pennell, R. B. In The Plasma Proteins, edited by E’. W. Putnam, New York, Academic Press, Inc., 1960, vol. 1, p. 9. Gage, S. H., and P. A. Fish. Am. J . Anat. 34: 1, 1924. Cornwell, D. G., F. A. Kruger, G. J. Hamwi, and J. B. Brown. Am. J . Clin. Nutrition 9: 24, 41, 1961. Laurell, C. B. Acta Physwl. Scand. 30: 289, 1954. Laurell, C. B. Scand. J . Clin. & Lab. Invest. 6: 22, 1954. Robinson, D. S. Quart. J . Xxptl. Physiol.40: 112,1955. Bragdon, J. H., R. J. Havel and E. Boyle. J . Lab. Clin. Med.48: 36,1956. Bragdon, J. H. J . Lab. Clin. Med. 52: 564, 1958. Borgstrom, B. In Lipide Metabolism, edited by K. Bloch, New York, John Wiley & Sons, Inc., 1960, p. 128. Rodbell, M., and D. S. Fredrickson. J . Biol. Chem. 234: 562,1959. Scanu, A., and I. H. Page. J . Ezptl. Med. 109: 239, 1959. Oncley, J. L. Lindgren, F. T., H. A. Elliott and J. W. Gofman. J . Phys. & Colloid Chem. 55: 80,1951. Bragdon, J. H., and A. Karmen. J . Lipid Research 1: 167,1960. Havel, R. J., and D. S. Fredrickson. J . Clin. Invest. 35: 1025,1956. Dole, V. P., A. T. James, J. P. W. Webb, M. A. Rizack, and M. F. Sturman. Swahn, B. Scand. J . Clin. & Lab. Invest. 5 : Suppl. 9, 1953. Laurell, S. Scand. J . Clin. & Lab. Invest. 11: 97, 1959- Kunkel, H. G., and R. Trautman. J . Clin. Invest. 35: 641, 1956. Carlson, L. A., and B. Olhagen. Scand. J . Clin. & Lab. Invest. 6: 70, 1954. Kruger, F. A., D. G. Cornwell, G. J. Hamwi, and J. B. Brown. Am. J . Clin. Nutrition 8: 44, 1960. Oncley, J. L., K. W. Walton and D. G. Cornwell. J . Am. Chem. SOC. 79: 4666,1957. Baxter, J. H., H. C. Goodman and R. J. Havel. J. Clin. Invest. 39: 455, 1960.
Voz Sanguinis 5: 91, 1960.
J . Clin. Invest. 38: 1544, 1959.
by guest, on Septem
ber 7, 2018w
ww
.jlr.orgD
ownloaded from
PLASMA LIPOPROTEINS 131
39. Del Gatto, L., F. T. Lindgern and A. V. Nichols. Anal. Chem. 31 : 1397,1959.
40. Havel, R. J., H. A. Eder and J. H. Bragdon. J . Clin. Invest. 34: 1345, 1955.
41. De Lalla, 0. F., and J. W. Gofman. In Methods of Bioch,emical Analysis, edited by D. Glick, New York, Interscience Publishers, Inc., 1954, vol. 1, p. 459.
42. Tamdin. A. R.. and R. K. Tandv. J . Avvl . Phwsiol.
43.
44.
45.
46. 47.
48. 49. 50.
51.
52.
53.
54. 55. 56.
57.
58.
59.
60.
61.
62.
63.
64.
65.
66.
67.
68. 69.
.. 15: i45, isso. ’
Lindgren, F. T., A. V. Nichols and N. K. Freeman. J . Phys. Chem. 59: 930,1955. Gillies, G. A., F. T. Lindgren and J. Cason. J . Am. Chem. Soe. 78: 4103, 1956. Green, C., J. L. Oncley and M. L. Karnovsky. J . Biol. Chem. 235: 2884,1960. Phillips, G. B. J . Clin. Invest. 38: 489, 1959. Nelson, G. J., and N. K. Freeman. J . Biol. Chem. 235: 578,1960. Shore, B., and V. G. Shore. Plasma 2: 621, 1954. Shore, B. Arch. Biochem. Biophys. 71 : 1, 1957. Brown, R. K., R. E. Davis, B. Clark, and H. Van Vunakis. In Third International Conference on Bio- c h i c a l Problems of Lipids, edited by R. Ruyssen, Brussels, 1956, p. 104. Radding, C., E. Feigelson and D. Steinberg. Federa- tion Proc. 18: 123, 1959. Marsh, J. B., and A. F. Whereat. J . Bwl. Chem. 234: 3196, 1959. Gitlin, D., D. G. Cornwell, D. Nakasato, J. L. Oncley, W. L. Hughes, Jr., and C. A. Janeway. J . Clin. Invest. 37: 172, 1958. Byers, S. 0. Ann. N . Y . Acad. Sci. 88: 240, 1960. Di Luzio, N. R. Ann. N . Y . Acad. Sci. 88: 244, 1960. Levine, L., D. L. Kauffman and R. K. Brown. J . Exptl. Med. 102: 105, 1955. Briner, W. W., J. W. Riddle and D. G. Cornwell. J . Exptl. Med. 110: 113,1959. Oncley, J. L., F. R. N. Gurd and M. Melin. J . Am. Chem. SOC. 72: 458, 1950. Lindgren, F. T., N. K. Freeman, A. V. Nichols, and J. W. Gofman. In Third International Conference on Biochemical Problems of Lipids, edited by R. Ruyssen, Brussels, 1956, p. 224. Scanu, A., and W. L. Hughes. J . Biol. Chem. 235: 2876, 1960. Hillyard, L. A., C. Entenman, H. Feinberg, and I. L. Chaikoff. J . Biol. Chem. 214: 79, 1955. De Lalla, L., L. Levine and R. K. Brown. J . Ezptl. Med. 106: 261, 1957. Aladjem, F., M. Lieberman and J. .W. Gofman. J . Exptl. Med. 105: 49, 1957. Scanu, A., L. A. Lewis and F. M. Bumpus. Arch. Bwchem. Biophys. 74: 390, 1958. McDonald, H. J., L. J. Banaszak and J. Q. Kissane. Anal. Bwchem. 1: 44, 1960. Radding, C. M., and D. Steinberg. J . Clin. Invest. 39: 1560,1960. Phillips, G. B. Proc. SOC. Exptl. Biol. Med. 100: 19, 1959. Gould, R. G. Am. J . Med. 11 : 209,1951. Fredrickson, D. S., D. L. McCollester, R. J. Havel, and K. Ono. In Chemistry of Lipids as Related to Athero- sclerosis, edited by I. H. Page, Springfield, Ill., Charles C Thomas, 1958, p. 205.
70. Kunkel, H. G., and A. G. Bearn. Proc. SOC. Exptl.
71. Florsheim, W. H., and M. E. Morton. J . Appl. Physiol.
72. Ott, H. 2. Nalurfursch. 13: 365, 1958. 73. McCormick, E. C., D. G. Cornwell and J. B. Brown.
J . Lipid Research 1 : 221, 1960. 74. Avigan, J., H. A. Eder and D. Steinberg. Proc. SOC.
Exptl. Biol. Med. 95: 429, 1957. 75. Gofman, J. W. In The Lipoproteins, Methods and
Clinical SigniJicance, edited by F. Homburger and P. Bernfeld, Basel, S. Karger, 1958, p. 47.
76. Furman, R. H., R. P. Howard, K. Lakshmi, and L. R. Norcia. Am. J . Clin. Nutrition 9 : 73, 1961.
77. RUSS, E. M., J. Raymunt and D. P. Barr. J . Clin. Invest. 35: 133,1956.
78. Jobst, H., and G. Schettler. In Third Internutiow2 Conference on Biochemical Problems of Lipids, edited by R. Ruyssen, Brussels, 1956, p. 136.
79. Furman, R. H., and L. L. Conrad. J . Clin. Invest. 36: 713, 1957.
80. McGinley, J., H. Jones and J. Gofman. J . Invest. D e m t o l . 19: 71, 1952.
81. Pedersen, K. 0. Ultracentrifugal Studies on Serum and Serum Fractions, Upsala, Almquist and Wiksells, 1945.
82. Edsall, J. T. Advances in Protein Chem. 3 : 383, 1947. 83. Lewis, L. A., A. A. Green and I. H. Page. Am. J .
Physiol. 171 : 391, 1952. 84. Russ, E. M., and J. Raymunt. Circulation Research 3:
194, 1955. 85. Nikkila, E. Scand. J . Clin. & Lab. Invest. 5: Suppl.
8, 1953. 86. Mondini, S., and M. Venturoli. Att i . SOC. ital. sci.
vet. 11 : 341, 1957. 87. Fasoli, A., E. B. Magid, M. D. Glassman, and P. P. Foa.
Proc. SOC. Exptl. Biol. Med. 85: 609, 1954. 88. Cornwell, D. G., and F. A. Kruger. Abstract, 135th
Meeting American Chemical Society, Boston, 1 959, p. 35c.
89. Light, S., and F. R. N. Gurd. Vox Sanguinis 5: 92, 1960.
90. Milch, L. J., A. A. Renzi, N. Weiner, L. G. Robinson, and S. S. Wilson. Proc. SOC. Exptl. Biol. Med. 97: 56, 1958.
91. Barr, D. P., E. M. Russ, H. A. Eder, F. E. Kendall, and L. L. Abell. Circulation Research 3: 199, 1955.
92. Marmorston, J., S. Rosenfeld and J. Mehl. In Hor- mones and Atherosclerosis, edited by G. Pincus, New York, Academic Press, lnc., 1959, p. 213.
93. Shore, B., and V. Shore. J . Lipid Research 1: 321, 1960.
94. Hillyard, L. A., I. L. Chaikoff, C. Entenman, and W. 0. Reinhardt. J . Biol. Chem. 233: 838, 1958.
95. Bragdon, J. H. Ann. N . Y . Acad. Sci. 72: 845, 1959. 96. Bettelheim-Jevons, F. R. Advances in Protein Chem.
13 : 35,1958. 97. Boyd, E. S., and W. F. Neuman. J . Biol. Chem. 193:
243, 1951. 98. Gersh, I., and H. R. Catchpole. Perspectives in Bwl.
Med. 3: 282, 1960. 99. Loeven, W. A. Acta Physiol. et Pharmacol. Neerl.
5: 121, 1956. 100. Partridge, S. M., and H. F. Davis. In Chemistry and
Biology of Mucopolysaccharioks, edited by G. E. W.
Biol. Med. 86: 887, 1954.
10: 301, 1957.
by guest, on Septem
ber 7, 2018w
ww
.jlr.orgD
ownloaded from

132 CORNWELL AND KRUGER
Wolstenholme and M. O’Connor, Boston, Little, Brown and Co., 1958, p. 93.
101. Greenstein, J. P. Advances in Protein Chem. 1: 209, 1944.
102. Chargaff, E. In The Nucleic Acids, edited by E. Chargaff and J. N. Davidson, New York, Academic Press, Inc.,1955, vol. 1, p. 307.
103. Magasanik, B. In The Nucleic Acids, edited by E. Chargaff and J. N. Davidson, New York, Academic Press, Inc., 1955, vol. 1, p. 373.
104. Cantoni, G. L. Nature 188: 300, 1960. 105. Huang, S. L., and G. Felsenfeld. Nature 188: 301, 1960. 106. Vandegaer, J. E., M. E. Reichmann and W. H. Cook.
Arch. Biochem. Biophys. 62 : 328, 1956. 107. Joubert, F. J., and W. H. Cook. Can. J . Biochem. and
Physiol. 36: 389, 1958. 108. Martin, W. G., and W. H. Cook. Can. J . Biochem.
and Physiol. 36: 153, 1958. 109. Joubert, F. J., and W. H. Cook. Can. J . Biochem. and
Physiol. 36: 399,1958. 110. Sugano, H. J . Biochem. (Tokyo) 45: 393,1958. 111. Schjeide, 0. A., and M. R. Urist. Exptl. Cell Research
112. Schjeide, 0. A., and M. R. Urist. Nature 188: 291,1960. 113. Chargaff, E., and K. B. Olson. J . Biol. Chem. 122: 153,
114. Gorter, E., and L. Nanninga. Discussions Faraday Soc.
115. Clarke, D. W., and F. C. Monkhouse. Can. J . Ilfed.
116. Rice, R. V., M. A. Stahmann and R. A. Alberty. J .
117. Oncley, J. L., E. Ellenbogen, D. Gitlin, and F. R. N.
118. Waugh, D. F. Advances in Protein Chem. 9: 325, 1954. 119. Sela, M., and E. Katchalski. Advances in Protein Chem.
14: 391, 1959. 120. I3arr6, R., and J. Labat. Ann. biol. clin. (Paris) 17:
309, 1959. 121. Fischer, A. Biochem. 2.278: 133, 1935. 122. Jaques, L. B. Biochem. J . 37: 189,1943. 123. Chargaff, E., M. Ziff and D. H. Moore. J . Biol. Chem.
139: 383,1941. 124. Nikkila, E. A. Scand. J . Clin. & Lab. Invest. 4: 369,
1952. 125. Blasius, R., and W. Seitz. Klin. Wochschr. 30: 905,
1952. 126. Horh, H., and A. Chanutin. J . Biol. Chem. 197: 503,
1952. 127. Astrup, T., and J. Piper. Acta Physiol. Scand. 11: 211,
1946. 128. Walton, K. W. 129. Smith, R. T., and R. W. Von Korff.
596, 1957. 130. Sasaki, S., and H. Noguchi.
1959. 131. Sumner, J. B., and S. F. Howell.
583, 1936. 132. Cifonelli, J. A., R. Montgomery and F. Smith.
Chem. SOC. 78: 2485, 1956. 133. Ponder, E., and R. V. Ponder.
753,1959. 134. Ricketts, C. R.
17: 84,1959.
1937.
13: 205, 1953.
Sci. 31: 394, 1953.
Biol. Chem. 209: 105, 1954.
Gurd. J . Phys. Chem. 56: 85, 1952.
Brit. J . Pharmacol. 7: 370, 1952. J . Clin. Inoest. 36:
J . Gen. Physiol. 43: 1,
J . Biol. Chem. 115:
J . Am.
J . Gen. Physiol. 43:
Nature, 169, 970, 1952.
135. Fletcher, F., L. E. Martin and A. H. Ratcliffe. Nature 170: 319, 1952.
136. Cifonelli, J. A., R. Montgomery and F. Smith. J . Am. Chem. SOC. 78: 2488,1956.
137. Peterson, E. A., and H. A. Sober. In The P l m Pro- teins, edited by F. W. Putman, New York, Academic Press, Inc., 1960, vol. 1, p. 105.
138. Bungenberg de Jong, H. G. In Colloid Science, edited by H. R. Kruyt, Amsterdam, Elsevier Publishing Co., 1949, vol. 2, p. 335.
In The Proteins, edited by H. Neurath and K. Bailey, New York, Academic Press, Inc., 1953, vol. IB, p. 727.
140. Foster, J. F. In The Plasma Proteins, edited by F. W. Putnam, New York, Academic Press, Inc., 1960, vol. 1, p. 179.
139. Klotz, I. M.
141. Gordon, R. S., Jr. J . Clin. Invest. 34: 477, 1955. 142. Goodman, D. S., and E. Shafrir. J . Am. Chem. SOC.
81: 364, 1959. 143. Rosenberg, R. M., W. F. Lever and M. E. Lyons. J .
Am. Chem. SOC. 77: 6502,1955. 144. Goodman, D. S. J . Am. Chem. SOC. 80: 3892, 1958. 145. Gurd, F. R. N. In Lipide Chemistry, edited by D. J.
Hanahan, New York, John Wiley & Sons, Inc., 1960,
146. Grassmann, W., and G. Deffner. 2. physiol. Chem., Hoppe-Seyler’s 293 : 89, 1953.
147. Grassmann, W. H. Hormann and A. Hartle. Ilfakromol. Chem. 21 : 37,1956.
148. Pankhurst, K. G. A. In Surface Phenomena in Chem- istry and Biology, edited by J. F. Danielli, K. G. A. Pankhurst, and A. C. Riddiford, New York, Pergamon Press, 1958, p. 100.
149. Mejbaum-Katzenellenbogen, W. Acta Biochim. Polon. 6: 375,1959.
150. Mejbaum-Katzenellenbogen, W. Acta Biochim. Polon. 6: 385, 1959.
151. Kunkel, H. G., and C. L. Hoagland. J . Clin. Invest. 26: 1060, 1947.
152. Recant, L., E. Chargaff and F. M. Hanger. Proc. Soc. Exptl. Biol. Med. 60: 245, 1945.
153. Cohen, P. P., and F. L. Thompson. J . Lab. Clin. Med. 32: 475, 1947.
154. Maclagan, N. F., and D. Runn. Biochem. J . 41: 580, 1947.
155. Albertsen, K., N. R. Christoferssen and F. Heintzelmann. Acta Med. Scand. 136: 302,1950.
156. Shank, R. E., and C. L. Hoagland. J . Biol. Chem. 162: 133,1946.
157. Shay, H., J. E. Berk and H. Siplet. Gastroenterology 9: 641, 1947.
158. Popper, H., F. Steigman, H. Dyniewicz, and A. Dubin. J . Lab. Clin. Med. 34: 105, 1949.
159. Bubb, W., and A, Pedrazzini. Schweiz. med. Wochschr. 79: 167, 1949.
160. Horlick, L. 161. Keler-Bacoka, M. Clin. Chim. Acta5: 482, 1960. 162. Walther, J. 163. Popper, H., and F. Schaffner.
164. Reinhold, J. G. 165. Polonovski, J., C. Dupuy and M. F. Jayle. Ann. biol.
p. 208.
Circulation Research 5: 368, 1957.
Arzt. Forsch. 14: 36, 1960. Advances in Internal
Med. 4: 357, 1950. Advances in Clin. Chem. 3: 83, 1960.
clin. (Paris) 15: 411, 1957.
by guest, on Septem
ber 7, 2018w
ww
.jlr.orgD
ownloaded from
PLASMA LIPOPKOTElNS 133
166. Jayle, M. P., (4. Lagrue aid G. Boussier. Yresse
167. Lemaire, A., J. Cottet axid R. Joyeuse. Presve inid.
168. Bonomo, L., and V. Minerva. Sett. nied. 45: 3, 1957. 169. Revolledo, I. M. Laboratorio (Granuda, Spain) 26:
101, 1958. 170. Beaumont, J. L., V. Beaumont and J. LenCgre. Rev.
franc. itudes din. et biol. 3 : 852, 1958. 171. Beaumont, J. L., R. Ardaillou and J. LenBgre. Rev.
franc. ttudes clin. et biol. 3: 1045, 1958. 172. Walter, H., P. Nepveux and F. Nepveux. Presse mid.
66: 851, 1958. 173. DeGennes, J. L., P. Laudat and J. Truffert. Presse
mid. 66: 1108, 1958. 174. Azerad, E., J. Ghata and J. Lewin. Presse mid. 66:
995,1958. 175. Beaumont, J. L., and J. LenBgre. Arch. maladies coeur
et vaisseaux 52 : 26, 1959. 176. De Gennes, J. L., and P. Laudat. Clin. Chim. Acta
4: 231, 1959. 177. Vincent, D., J. Polonovski and R. Wald. Clin. Chim.
Acta 5: 14, 1960. 178. Amselem, A. Pharmacien biologiste 11 : 177, 1960. 179. De Gennes, L., M. H. Laudat, J. Carlotti, M. S. Moukh-
tar, and J. Baillet. Presse mid. 68: 1283, 1960. 180. Bour, H., and H. Solignac. Presse mtd. 68: 143, 1960. 181. Lagrue, G., L. Hartmann and P. Milliez. Presse mtd.
182. Lagrue, G., and J. Truffert. Semaine 6 p , 33: 659,
183. Scanu, A., L. A. Lewis and M. C. Schotz. J . Appl.
184. Albertsen, K., and F. Heintzelmann. Acta Med.
185. Yonan, V. L., and J. G. Reinhold. Am. J . Clin. Path.
186. Juret, P. Ann. biol. din. (Paris) 17: 268, 1959. 187. Beaumont, V., J. L. Beaumont and J. LenBgre. Rev.
franc. itudes din. et biol. 3 : 746, 1958. 188. Burstein, M., and J. Samaille. Seniaine h6p. 34: 541,
1958. 189. Badin, J., and F. Schmitt. Ann. biol. din. (Paris) 15:
421, 1957. 190. Bernfeld, P., V. &I. Donahue and M. E. Berkowitz.
J . Biol. Chem. 226: 51, 1957. 191. Bernfeld, P. In The Lipoproteins, Methods and Clin-
ical Significance, edited by F. Homburger and P. Bern- feld, Basel, S. Karger, 1958, p. 24.
1 9 2 Bernfeld, P., J. S. Nisselbaum, B. J. Berkeley, and R. W. Hanson. J . Biol. Chem. 235: 2852,1960.
193. Sugano, H. J . Biochem. (Tokyo) 46: 549,1959. 194. Longsworth, L. G.
mid . 62: 1246, 1954.
62 : 1699,1954.
68: 33, 1960.
1957.
Physiol. 11 : 17, 1957.
Scand. 136: 316,1950.
24: 232, 1954.
In Electrophoresis, Theory, Methods, and Applications, edited by M. Bier, New York, Aca- demic Press, Inc., 1959, p. 91.
195. Brown, R. A., and S. N. Timasheff. In Electrophoresis, Theory, Xethods, and Applications, edited by M. Bier, Sew York, Academic Press, Inc., 1959, p. 317.
196. Ayrault-Jarrier, M. Thesis, Faculty of Medicine, Paris, 1959.
197. Burstein, M. Compt. rend. 245: 586, 1957. 198. Boyle, E., and R. V. Moore.
199. Yugano, H. J . Biochem. (Tokyo) 46: 417, 1959.
J . Lab. Clin. X e d . 53: 272, 1959.
200. Burstein, M., and A. Praverman. Comyt. rend. 245:
201. Burstein, M., and J. Bmaille. J. Phgsiol. (Paris)
202. Burstein, M., and A. Prawerman. Rev. franc. itude
203. Burstein, M., and J. Samaille. Presse mid. 66: 974,
204. Burstein, M. Seventh Congress IrLtern. SOC. Blood Trans.,
205. Burstein, M., and J. Samaille. Compt. rend. 248:
206. Burstein, M., and J. Samaille. Ann. biol. clin. (Paris)
207. Burstein, M., and J. Samaille. Clin. Chim. Acta 5:
208. Burstein, M. Path. Bid. 8: 1247, 1960. 209. Burstein, M., and J. Samaille. Clin. Chim. Acta 3:
320, 1958. 210. Badin, J., and F. Schmitt. Ann. biol. clin. (Paris)
15: 469,1957. 211. Polonovski, J., M. Jarrier, M. Petit, and C. Dupuy.
Ann. biol. din. (Paris) 16: 69, 1958. 212. Castaigne, A., and A. Amselem. Ann. biol. clin. (Paris)
17: 336, 1959. 213. Florsheim, W. H., and C. Gonzales. Proc. SOC. BxpU.
Biol. Med. 104: 618, 1960. 214. Gurd, F. R. N., and P. E. Wilcox. Advances in Protein
Chem. 11: 311, 1956. 215. Groulade, J., F. Jacqueline and C. Ollivier. Ann.
bioi. din. (Pa&) 17: 377, 1959. 216. Bernfeld, P., M. E. Berkowitz and V. M. Donahue.
J . Clin. Invest. 36: 1363,1957. 217. Fine, J. M., and M. Burstein. Ezperientiu 14: 411,
1958. 218. Wieme, R. J. In Protides of the Biological Fluids,
edited by H. Peeters, Amsterdam, Elsevier Publishing Co., 1960, p. 18.
219. Burstein, M., and J. Oudin. Compt. rend. 246: 2187, 1958.
220. Burstein, &I., and J. Samaille. Rev. franc. Wu&s din. et biol. 3 : 624, 1958.
221. Burstein, M., and J. Samaille. Rev. franc. itudes din. et biol. 3 : 780, 1958.
222. Burstein, M., and A. Praverman. Reu. Midicdhiru- gicale mal. du foie 1 : 21, 1958.
223. Beaumont, J. L., and V. Beaumont. Rev. franc. itudes din. et biol. 5: 593, 1960.
224. Krinsky, N. I., D. G. Cornwell and J. L. Oncley. Arch. Biochem. Biophys. 73 : 233, 1958.
225. Burstein, M., and J. M. Fine. Rev. h6matol. 14: 380, 1959.
226. Antoniades, H. N., J. L. Tullis, L. H. Sargeant, R. B. Pennell, and J. L. Oncley. J . Lab. Clin. fi led. 51: 630, 1958.
227. Weismann-Netter, R., and H. Hirsch-Marie. Presse mid. 66: 1787, 1958.
228. Burstein, M., and J. Samaille. Rev. hhatol. 12: 679, 1957.
229. Lovelock, J. E., A. T. James and C. E. Rowe. Biochem. J . 74: 137, 1960.
230. Rowe, C. E. Biochem. J . 76: 471,1960. 231. Ricketts, C. R., K. W. Walton and S. M. Saddington.
2588,1957.
49: 83,1957.
din. et biol. 4: 918, 1959.
1958.
Rome, 1958, p. 792.
3234,1959.
17: 23,1959.
609,1960.
Biochem. J . 58: 532, 1954.
by guest, on Septem
ber 7, 2018w
ww
.jlr.orgD
ownloaded from

134 CORN WELL ANL) KltUGElt
232. Ellis, H. A., and K. W. Walton. J. Clin. Pathol. 12: 467, 1959.
233. Lorenz, B., R. Lorenz and N. Zollner. Z. ges. ezptl. Med. 133: 144, 1960.
234. Jaques, L. B., and H. J. Bell. In Methods of Biochewi- ical Analysis, edited by D. Glick, New York, Inter- science Publishers, Inc., 1959, vol. 7, p. 253.
235. Gero, S., J. Gergely, T. DBvhji, L. Jakab, J. SzBkely, and S. Vir&. Nature 187: 152,1960.
236. Moon, H. D. In Connective Tissue, Thrombosis, and Atherosclerosis, edited by I. H. Page, New York, Aca- demic Press, 1959, p. 33.
237. Buddecke, E. Z. physiol. Chem., HoppeSeyler's 318:
238. Schwartz, C. J., J. A. Peters and A. J. Day. Australian J. Exptl. Biol. Med. Sci. 36: 109, 1958.
239. Farquhar, J. W., R. L. Hirsch and E. H. Ahrens. Jr. J. Clin. Invest. 39: 984, 1960.
240. Zilversmit, D. B., and E. L. McCandless. J. Lipid Research 1 : 118, 1959.
241. Page, I. H. In Connective Tissue, Thrombosis, and Atherosclwosis, edited by I. H. Page, New York, Aca- demic Press, 1959, p. 1.
242. May, L., M. Hines, L. Weintraub, J. Scudder, and S. Graff. Suraerv 35: 191, 1954.
33,1960.
245. Oster, G., and E. H. Inimergut. J. Am. C'hem. SOC.
246. Saidel, L. J. J. Awl. Chem. SOC. 77: 3892, 1955. 247. Higuchi, T., and R. Kuramoto. J. Am. Pharm. Asuoc.
248. Frank, H. P., S. Barkin and F. R. Eirich. J . Phys.
249. Ardry, R. Ann. bwl. clin. (Paris) 11: 67, 1953. 250. Hirsch, A., and C. Cattaneo. Giorn. biochim. 5: 135,
1956. 251. Grabar, P. Ann. inst. Pasteur 88: 11, 1955. 252. Ramos, A. 0. Rev. b r a d biol. 17: 59, 1957. 253. Banerjee, R. P. Bull. Calcutta School Trop. dled.
254. Burstein, M., and A. Prawerman. Rev. hhatol . 13:
255. Burstein, M., and A. Prawerman. Pathl . Biol. 7: 1035,
256. Burstein, M., and M. Berlinski. Rev. franc. ludes
257. Bernfcld, P., C. D. Bonner and €3. J. Berkeley. J.
258. Ledvina, M., S. Coufalov4 and V. SouEek. Clin. Chim.
76: 1393, 1954.
43: 398,1954.
Chem. 61 : 1375, 1957.
3: 21, 1955.
329, 1958.
1959.
clin. et bwl. 5: 193, 1960.
Clin. Invest. 39 : 1864, 1960.
Acta. 5 : 818, 1960. 243. McDonald, YH." J., and R. H. Spitzer. Circulation R e
244. Spitzer, R. H., and H. J. McDonald. Clin. Chim. Acta
259. Amenta, J. S., and L. L. Waters.
260. Amenta, J. S., and L. L. Waters.
Yale J . Biol. Med. 33 :
Yale J . Biol. Med. 33 : search 1 : 396,1953. 112,1960.
1: 545, 1956. 122,1960.
by guest, on Septem
ber 7, 2018w
ww
.jlr.orgD
ownloaded from