characteristics of canteens at elementary schools, upper
TRANSCRIPT

General rights Copyright and moral rights for the publications made accessible in the public portal are retained by the authors and/or other copyright owners and it is a condition of accessing publications that users recognise and abide by the legal requirements associated with these rights.
Users may download and print one copy of any publication from the public portal for the purpose of private study or research.
You may not further distribute the material or use it for any profit-making activity or commercial gain
You may freely distribute the URL identifying the publication in the public portal If you believe that this document breaches copyright please contact us providing details, and we will remove access to the work immediately and investigate your claim.
Downloaded from orbit.dtu.dk on: Feb 22, 2022
Characteristics of Canteens at Elementary Schools, Upper Secondary Schools andWorkplaces that Comply with Food Service Guidelines and Have a Greater Focus onFood Waste
Lassen, Anne Dahl; Christensen, Lene M; Spooner, Max Peter; Trolle, Ellen
Published in:International Journal of Environmental Research and Public Health
Link to article, DOI:10.3390/ijerph16071115
Publication date:2019
Document VersionPublisher's PDF, also known as Version of record
Link back to DTU Orbit
Citation (APA):Lassen, A. D., Christensen, L. M., Spooner, M. P., & Trolle, E. (2019). Characteristics of Canteens atElementary Schools, Upper Secondary Schools and Workplaces that Comply with Food Service Guidelines andHave a Greater Focus on Food Waste. International Journal of Environmental Research and Public Health,16(7), [1115]. https://doi.org/10.3390/ijerph16071115

International Journal of
Environmental Research
and Public Health
Article
Characteristics of Canteens at Elementary Schools,Upper Secondary Schools and Workplaces thatComply with Food Service Guidelines and Have aGreater Focus on Food Waste
Anne D. Lassen 1,* , Lene M. Christensen 1, Max P. Spooner 2 and Ellen Trolle 1
1 Division of Risk Assessment and Nutrition, National Food Institute, Technical University of Denmark,DK-2800 Lyngby, Denmark; [email protected] (L.M.C.); [email protected] (E.T.)
2 Department of Applied Mathematics and Computer Science, Technical University of Denmark,DK-2800 Lyngby, Denmark; [email protected]
* Correspondence: [email protected]; Tel.: +45-9351-8943
Received: 19 February 2019; Accepted: 26 March 2019; Published: 28 March 2019�����������������
Abstract: Policy actions to improve the nutritional environment include the provision of officialfood service guidelines. This study aimed to examine compliance with food service guidelines forhot meals as well as self-evaluated focus on food waste reduction across settings, i.e., elementaryschools, upper secondary schools and workplaces, and different canteen characteristics. The samefive criteria for hot meals were applied for all settings with regard to serving of fruit and vegetables,fish, wholegrain product and high fat meat and dairy products. A self-administered questionnairesurvey was conducted as a cross-sectional study among 680 Danish canteens. Canteens havinga high degree of organic food procurement were more likely to comply with the five criteria forhot meals combined (OR 2.00 (Cl 1.13,3.53)). Also, the use of organic food together with havinga meal policy was associated with reported focus on food waste reduction (OR 1.91 (CI 1.12,3.25)and 1.84 (Cl 1.31,2.59), respectively). Compliance with individual criteria varied across settingswith elementary schools being more likely to comply with criteria on, e.g., maximum serving ofnon-wholegrain products, whereas workplaces were more likely to comply with criteria on, e.g.,minimum fruit and vegetable content and serving of fish. In addition, specific characteristics, e.g.,serving system, were found to predict compliance with some of the criteria. These findings highlightthe need to address differences in canteen characteristics when planning implementation support forboth guideline and food waste reduction initiatives.
Keywords: workplace; upper secondary schools; elementary schools; hot meals; food and nutritionalenvironment; organic food; UN Sustainable Development Goals
1. Introduction
Improving diet quality while simultaneously reducing environmental impact and achievingsustainable development outcomes is a critical focus globally, both at the individual and institutionallevels [1–3]. This includes the food service sector that plays a significant role in relation to manypeople’s everyday food intake. An increased availability of healthier food options has been found topositively impact dietary intake among both primary school children [4–6] and employees having lunchat the canteen [7,8]. Moreover, implementation and maintenance of a healthy nutritional environmenthas been found to be less expensive than nutrition education interventions [9].
Policy actions to improve the nutritional environment include the provision of official foodservice guidelines. Many countries have introduced policies and official guidelines that support
Int. J. Environ. Res. Public Health 2019, 16, 1115; doi:10.3390/ijerph16071115 www.mdpi.com/journal/ijerph
Int. J. Environ. Res. Public Health 2019, 16, 1115 2 of 16
the provision of healthier food and beverage options and restrict unhealthy options at canteens atschools [10,11], and to a lesser extent, also at workplaces [12,13], either voluntary or obligatory. Despitethe introduction of such policies and guidelines, the reported adherence to the policies and guidelinesis mixed [14–16], suggesting a need for research on strategies and factors underlying the success of suchpolicies to increase adherence to food service policies and guidelines [10,17,18]. Also, this highlightsthe need to monitor the food environment to inform about points of progress or lack of progresstowards meeting the policy goals in the different settings. In recent guidelines from Germany andEngland, more emphasis is put on food-based recommendations for school meals rather than focusingon the nutrient content of the meals [19,20]. For example, the UK revised standards to include fiverequirements in relation to the food group of meat, fish, eggs, beans and non-dairy sources of protein,primarily to ensure adequate provision of protein, iron and zinc while limiting the amount of fat,saturated fat and salt [21]. This approach might be easier for the food service operators to understandand apply in practice because it does not require access to nutrient calculation programs and up-to-datefood composition data [14,22,23]. In line with this, the Danish Veterinary and Food Administrationdeveloped a new concept for food-based guidelines in 2017 directed at food service operators inelementary schools, after-school care, upper secondary schools and workplaces [24–27]. Further,in 2018, new food-based guidelines directed at daycare institutions were launched [28]. The guidelines,that are voluntary to follow, contain criteria for serving fruit and vegetables, wholegrain products andfish, and limiting high fat and high sugar products for different food categories at breakfast and lunch,e.g., hot meals, sandwiches and salads, as well as snacks, beverages and afternoon meals. Canteens thatcomply with all these guidelines, and in addition reduce salt and sugar content, can brand themselveswith the Danish Meal Label [29]. The present study focused on hot meals served at lunch, which is afood category served by both schools and workplace canteens and therefore comparable across settings.
In Denmark, there has not been a tradition of providing food in either elementary or uppersecondary schools. Around half of Danish elementary schools is estimated to offer lunch options thatthe pupils can buy at lunch time [30]. A typical school hot meal might consist of chicken, a wholegrainroll, and salad. Besides hot meals, many elementary schools offer sandwiches and snack meals and toa lesser extent salad bars. Sandwiches and snack meals are likewise offered by most upper secondaryschools as well as a salad bar [31]. With regard to workplaces, around a third is estimated to have anin-house canteen that offers lunch options for sale. Workplaces with more than 50 employees moreoften have a canteen [32]. A typical workplace hot meal might consist of roasted meat with potatoesand vegetables. In addition, most workplace canteens offer a salad bar and an open-faced sandwichbuffet [31].
To the best of our knowledge, no studies have been conducted until now on compliance with foodservice guidelines across the different settings or whether compliance differs by canteen characteristics,including the use of organic food. However, some studies have examined compliance within individualsettings, e.g., in other Nordic countries, the UK and Australia [14–16].
The market for organic food products is growing worldwide [33]. In Denmark, the use of organicfood procurement in public kitchens has a long history of implementation and development [34].In 2009, The Ministry of Food Agriculture and Fisheries introduced the Organic Cuisine Label for themarketing of organic food in kitchens. In 2012, The Danish Organic Action Plan 2020 was launched,and updated in 2015, to establish political support for organic food conversion projects targeting publickitchens [35]. Currently, nearly 2700 places in Denmark use the Organic Cuisine Label [36]. Increasinguse of organic food has been suggested to result in meal compositions more in line with food-basedrecommendations both among professional kitchens [37,38] and among the general population [39].Also, organic food procurement levels have been suggested to result in a greater focus on food wastereduction in Danish public kitchens [38]. Food waste may include waste generated in the kitchenwhen preparing and cooking the food, during serving and from customer plate leftovers. In a Danishstudy, two workplace canteens were found to waste about one-fifth of all food prepared in servingfrom a self-service buffet. This is in line with results found in the Finnish food service sector [40].
Int. J. Environ. Res. Public Health 2019, 16, 1115 3 of 16
In the Danish study, the canteens almost halved their food waste during an organic food conversionproject [41].
Environmental sustainability issues related to food waste have been an increasing concern duringrecent years [42,43], and the food waste issue is a key part of the UN Sustainable Development Goalnumber 12, “Ensure sustainable consumption and production patterns” [44]. Also, the EAT-Lancetcommission concludes that “A radical transformation towards healthy diets from sustainable foodsystems is urgently needed”. This requires the active involvement of actors in all sectors, including thefood service sector. Chefs and other culinary professionals are well positioned to minimize food wasteand make healthy and sustainable foods delicious [2]. Studies on food waste in the food service sectorare, however, limited. Kinasz et al. points out that more research is needed to identify the factorscontrolling food waste generation [45]. Martin-Rios et al. argues that reducing food waste is a keysustainability challenge for the food service industry that requires a whole new set of managementpractices [46].
The primary aim of the present study was to measure whether the compliance with food servicecriteria on hot meals at lunch varies according to setting (elementary schools, upper secondaryschools and workplaces), and characteristics of the canteens. A secondary aim was to examine theself-evaluated focus on food waste reduction across settings and different canteen characteristics.The canteen characteristics include the use of organic food, having a meal policy, number of dailylunch meals served, serving system and outsourced to external contractors vs. those operated by theworkplace/school.
2. Materials and Methods
2.1. Study Design and Recruitment of Canteens
The survey was conducted as a cross-sectional study. Data were collected through three onlineself-administered questionnaires using the LimeSurvey open source system directed at public andprivate elementary schools (enrolling children aged 5–16 years), public upper secondary schools(enrolling students aged 15–19 years) and public and private workplaces. The questionnaires were alikein order to be comparable, with the exception of a few questions that only applied to, e.g., elementaryschools or workplaces. An e-mail invitation with a link to the survey was sent to the canteen managers.Canteen managers not responding were e-mailed one reminder. Moreover, managers at canteens atupper secondary schools not responding also got a phone call from a member of the project staff urgingthem to participate due to an initial low number of canteens in this group. The questionnaire surveywas carried out between September and November 2017.
The recruitment of canteens was performed on the basis of a register of Danish canteens usedby the Danish Food Inspections and held by the Danish Veterinary and Food Administration. By law,all restaurants and other enterprises selling food and beverages to the public are obliged to register atthe Danish Veterinary and Food Administration. In the study, canteens preparing food in-house atelementary schools, upper secondary schools or workplaces were eligible for inclusion. The registerhad e-mail addresses for one third of these canteens. The remaining e-mail addresses were obtainedvia phone or e-mail inquiry to the workplace/schools or to the canteen operator companies. A total of1995 canteens (367 elementary schools, 208 upper secondary schools and 1420 workplaces) across thewhole country were invited to participate in the survey.
The study was performed in accordance with the ethical standards of the Helsinki Declaration of1975, as revised in 2008. The Danish National Committee on Health Research Ethics has decided that,according to Danish Law, this kind of study does not require approval.
2.2. Questionnaire Development and Content
The questionnaires were designed to evaluate the compliance of the meals in the canteens withthe guidelines (see Table 1 regarding criteria for hot meals) as well as to measure the self-evaluated

Int. J. Environ. Res. Public Health 2019, 16, 1115 4 of 16
focus of food waste reduction. The questionnaires were developed through different phases in aniterative process, each phase and version gradually informing the next through repeated adjustmentsperformed by the research group. Questions were initially developed based on a literature review andknowledge on content of Danish canteen meals [47–51]. Feedback on the initial questionnaire wasacquired from nine food and nutrition professionals, i.e., representatives from the Danish Veterinaryand Food Administration, food service representatives, food service nutritional consultants andnutritional researchers, including researchers in dietary assessment methods. They were asked toadd comments and suggestions for overall content and relevance, comprehensibility of questions andresponse options, clarity of wording, missing items or any additional comments. To evaluate contentvalidity and acceptability, the questionnaires were further tested among 13 canteens chosen to representcanteens with different characteristics and different settings (five elementary schools, three uppersecondary schools and five workplaces). “Think-aloud” interviewing was conducted as they filled inthe questionnaire. This is a cognitive interviewing technique wherein survey respondents are asked toactively verbalize their thoughts as they attempt to answer the evaluated survey questions [52]. In afew cases, “retrospective probing” was used due to busy time schedules among canteen managers.This is a verbal probing technique wherein the interviewer administers the probe questions after therespondent has completed the entire survey [52]. In both cases the interviewer visited the food serviceunit beforehand at lunch-time to be able to compare actual servings of meals and their ingredientswith the respondents’ answers to the questionnaire. The actual servings were recorded by observingthe food production, i.e., the ingredients and amounts used were registered in templates. Recipes andnutrition labelling of the food products used were also collected. The actual servings registered bythe interviewer were compared with the answers of the questionnaire made by the canteen manager.Comparison were conducted in Excel and evaluated case by case. The feedback on the questionnairewas reviewed by one member of the project staff and checked by another. Some minor differencesin the registration made by the interviewer and the canteen managers were found, however themeasure of compliance to the criteria of hot meals was found to be practically similar. Finally, revisedquestionnaires were tested among a sample of 40 canteens using the same procedure and methodas used in the final survey to test how long it took to fill out the questionnaire and to make a finalevaluation of the questions. On the basis of this, some of the questions not necessary for evaluationof compliance to the guideline criteria were made non-compulsory. The respondents then had theopportunity to skip these questions and thereby shorten the response time, if this was perceived as aproblem. In total, the questionnaires contained 88 (elementary schools), 89 (secondary schools) and87 questions (workplaces) of which about 80% were compulsory. The number of questions that theindividual school or workplace needed to answer depended on the number of food categories theyoffered. The three questionnaires including the questions on hot meals and canteen characteristics areshown in Supplementary Materials S1–S3. The response time was 25 min on average in the final survey.
Table 1. Danish food service guidelines for hot meals served at lunch in elementary schools,upper secondary schools and workplaces [24,25].
Criteria Description
Minimum fruit and vegetable content in the mealsFruit and vegetables account for at least 1/3 of the whole hot meal. Once aweek 1, fruit and vegetables can account for less than 1/3 of the hot meals if abuffet of salad is offered as part of the lunch options.
Minimum frequency of serving fish and fish products Fish must be served at least once a week 1
Maximum frequency of serving high-fat meat (mainprotein component) 2
Meat products with a high content of fat (>10% fat) can be served in up to 1 of5 hot meals as main protein component of the meal.
Maximum frequency of serving non-wholegrainproducts
Grain products with little or no wholegrain (non-wholegrain products) can beserved in up to 1 of 5 hot meals.
Maximum frequency of using high-fat dairy/meatproducts in the meals (limited quantities) 2
High-fat meat and dairy based products (meat > 10% fat, cheese > 17% fat,milk > 5% fat) in limited quantities can be served in up to 2 of 5 hot meals.
1 As most canteens serve hot meals 5 days a week this most often equals 1 in 5 days; 2 There are two criteria forserving high-fat meat. One for meat as a main protein component and one for meat used in limited quantities,e.g., bacon.

Int. J. Environ. Res. Public Health 2019, 16, 1115 5 of 16
Information regarding the compliance with hot meals guidelines was obtained through fourquestions on hot meal contents during the last week. The criteria regarding fish and meat productswere evaluated with the question: “What was the main source of protein in the hot meals (for eachday last week)?” with the following answering categories: “Poultry (e.g., chicken, turkey)”, “Red meatwith more than 10% fat (e.g., pork loin with rind, lamb leg, beef chuck)”, “Red meat less than 10% fat(e.g., tenderloin trimmed, minced meat lean)”, “Fish and shellfish”, “Eggs”, “Legumes (e.g., beans,lentils)” or “Other” (Monday to Friday). The criteria regarding wholegrain was evaluated with thequestion: “What was the main source of starch in the dish (for each day last week)?” with the followinganswering categories: “Potatoes”, “White rice, couscous etc.”, “Brown rice, kernels etc.”, “Pasta etc.without wholegrain”, “Wholegrain pasta etc.”, “White bread etc.”, “Wholegrain bread”, “Other”(Monday to Friday). To evaluate the criteria regarding fruit and vegetable content, the followingquestion was asked: “What was the proportion of fruit and vegetables compared with the served hotmeal in total (for each day last week)?” A scale of figures showing six amounts of fruit and vegetableswere developed illustrating “Nothing or a little bit” (less than 10%), “A minor part” (about 20%),“A good deal” (about 25%), “A significant part” (about 33%), “Over half” (about 50%), “The majority”(about 75% or more) (Figure 1).
Int. J. Environ. Res. Public Health 2019, 16, x 5 of 16
Information regarding the compliance with hot meals guidelines was obtained through four questions on hot meal contents during the last week. The criteria regarding fish and meat products were evaluated with the question: “What was the main source of protein in the hot meals (for each day last week)?” with the following answering categories: “Poultry (e.g., chicken, turkey)”, “Red meat with more than 10% fat (e.g., pork loin with rind, lamb leg, beef chuck)”, “Red meat less than 10% fat (e.g., tenderloin trimmed, minced meat lean)”, “Fish and shellfish”, “Eggs”, “Legumes (e.g., beans, lentils)” or “Other” (Monday to Friday). The criteria regarding wholegrain was evaluated with the question: “What was the main source of starch in the dish (for each day last week)?” with the following answering categories: “Potatoes”, “White rice, couscous etc.”, “Brown rice, kernels etc.”, “Pasta etc. without wholegrain”, “Wholegrain pasta etc.”, “White bread etc.”, “Wholegrain bread”, “Other” (Monday to Friday). To evaluate the criteria regarding fruit and vegetable content, the following question was asked: “What was the proportion of fruit and vegetables compared with the served hot meal in total (for each day last week)?” A scale of figures showing six amounts of fruit and vegetables were developed illustrating “Nothing or a little bit” (less than 10%), “A minor part” (about 20%), “A good deal” (about 25%), “A significant part” (about 33%), “Over half” (about 50%), “The majority” (about 75% or more) (Figure 1).
Finally, the questionnaires also included questions on food waste reduction: “To what extent does the canteen focus on food waste?” with responses on a 5-point scale from “A very low degree” to “A very high degree”. This question was used as an indication of the canteens' awareness and attitudes towards food waste reduction. Respondents from canteens answering “to some degree”, “to a high degree” or “to a very high degree” had the opportunity to select from a list of pre-defined options about how they work with reducing food waste. These pre-defined options were identified and selected on the basis of literature [53,54]: “Optimize the use of raw foods”(i.e., using the entire product), “place less food on the table or buffet (and rather refill it more times)”, “using smaller serving bowls”, “adapting portion sizes”, “reuse of excess production/leftovers”, “sells leftovers to employees etc.” and “Other”. The answering options represent food waste generated during the preparation of the food, serving and from customer plate leftovers.
Questions regarding the characteristics of the settings included number of lunch meals served on a daily basis with six answering categories from “below 25” to “more than 1000”; the use of serving system for lunch—either “buffet style/self-service”, where a variety of food choices are offered at a fixed price, “a cash á la carte system”, where the customers select and purchase the items for lunch, as individually served portions or finally “served in bowls at the table”; canteen outsourced or operated by the setting; presence of a formal written canteen meal policy (yes or no); and percentage use of organic food with ten answering options from “about 0%” to “about 100%”.
Figure 1. Question on the relative content of fruit and vegetables in the hot meals (Monday to Friday).
2.3. Outcome and Explanatory Variables
Compliance and non-compliance with each of the five hot meal criteria were defined, and in addition a combined category for compliance with all five criteria. Compliance with the fruit and vegetable criteria was defined as canteens answering “A significant part”, “More than half” or “The majority” (about 1/3 of the serving or more) for at least four out of five meals. Compliance with the fish criteria was defined as canteens serving fish or shellfish at least 1 of 5 days. Compliance with the high-fat meat criteria (as main protein component) and the wholegrain criteria was defined as
Figure 1. Question on the relative content of fruit and vegetables in the hot meals (Monday to Friday).
Finally, the questionnaires also included questions on food waste reduction: “To what extentdoes the canteen focus on food waste?” with responses on a 5-point scale from “A very low degree”to “A very high degree”. This question was used as an indication of the canteens’ awareness andattitudes towards food waste reduction. Respondents from canteens answering “to some degree”,“to a high degree” or “to a very high degree” had the opportunity to select from a list of pre-definedoptions about how they work with reducing food waste. These pre-defined options were identifiedand selected on the basis of literature [53,54]: “Optimize the use of raw foods”(i.e., using the entireproduct), “place less food on the table or buffet (and rather refill it more times)”, “using smaller servingbowls”, “adapting portion sizes”, “reuse of excess production/leftovers”, “sells leftovers to employeesetc.” and “Other”. The answering options represent food waste generated during the preparation ofthe food, serving and from customer plate leftovers.
Questions regarding the characteristics of the settings included number of lunch meals servedon a daily basis with six answering categories from “below 25” to “more than 1000”; the use ofserving system for lunch—either “buffet style/self-service”, where a variety of food choices are offeredat a fixed price, “a cash á la carte system”, where the customers select and purchase the items forlunch, as individually served portions or finally “served in bowls at the table”; canteen outsourced oroperated by the setting; presence of a formal written canteen meal policy (yes or no); and percentageuse of organic food with ten answering options from “about 0%” to “about 100%”.
2.3. Outcome and Explanatory Variables
Compliance and non-compliance with each of the five hot meal criteria were defined, and inaddition a combined category for compliance with all five criteria. Compliance with the fruit andvegetable criteria was defined as canteens answering “A significant part”, “More than half” or

Int. J. Environ. Res. Public Health 2019, 16, 1115 6 of 16
“The majority” (about 1/3 of the serving or more) for at least four out of five meals. Compliancewith the fish criteria was defined as canteens serving fish or shellfish at least 1 of 5 days. Compliancewith the high-fat meat criteria (as main protein component) and the wholegrain criteria was definedas canteens serving meat with more than 10% fat maximum up to one of five meals, and servingeither white rice, white bread or non-wholegrain varieties of pasta maximum up to one of five meals.Compliance with the criteria on high-fat meat and dairy products (besides the main protein component)was defined as using cheese over 17% fat, dairy product over 5% fat, high-fat meat to flavor the meal orsolid fats up to two of five meals. Only canteens serving hot meals at least 3 days a week were includedin the analysis. If hot meals were served three or four days a week the criteria for compliance werechanged proportionally. With regard to food waste reduction, participants who responded “A veryhigh degree” were included as outcome variable.
Explanatory variables were defined as number of lunches served on a daily basis over or below100 servings a day, serving system being either a buffet system or other serving systems, canteenoutsourced to an external contractor or operated by the setting, the presence of a written canteen mealpolicy or not and the use of organic food over or below 50%.
2.4. Statistical Analysis
Statistical analyses were performed using the statistical software package SAS version 9.4.Descriptive statistics were used to describe the characteristics of the canteens participating in thestudy. Multiple logistic regression models were used to investigate factors associated with fulfilment ofguidelines and food waste reduction. Six variables of interest were identified: Setting, number of dailylunch meals, outsourced to external contractors, written canteen meal policy, serving system, organicfood procurement. For each criteria and for food waste reduction, an initial model was fitted consistingof the six main effects. Backward model selection was then applied to sequentially remove the leastsignificant variable, until only significant (p < 0.05) variables remained in the model. Potential two-wayinteractions between the remaining explanatory variables were then tested using the same procedure.The goodness of fit was assessed using the Hosmer-Lemeshow goodness of fit test. The sample sizewas considered adequate for fitting these models, according to the widely used guideline for multiplelogistic regression that there should be a minimum of 10 events per investigated covariate [55,56].
3. Results
A total of 680 canteens out of 1995 invited answered the questionnaire, corresponding to a totalresponse rate of 34%. The proportion of canteens participating across different Danish Regions werecomparable with those invited as shown in the Supplementary Material (Table S1). In total, 86% of therespondents reported that they were canteen managers or canteen employees. The rest were managersin general or teachers at the schools.
3.1. Canteen Characteristics
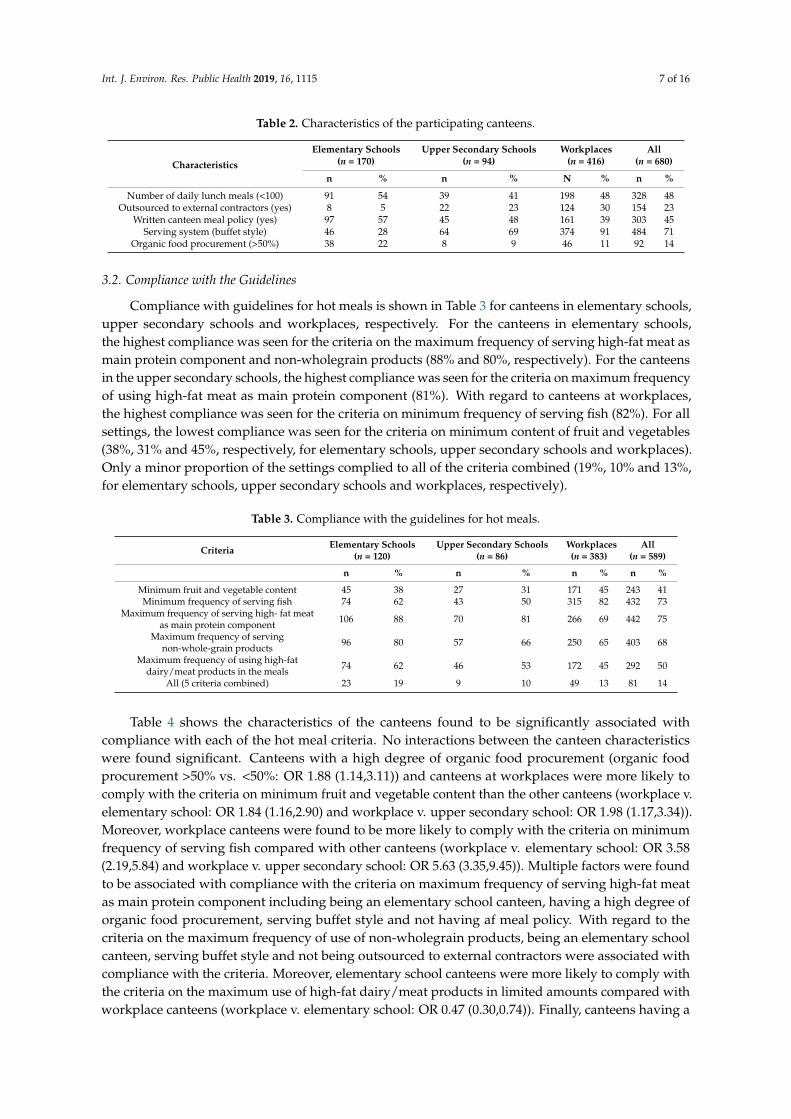
Table 2 shows the characteristics of the participating canteens. The proportion of canteens havinga written meal policy was 45%. In total, 14% of the canteens used more than 50% of organic foodprocurement, with the elementary schools and the upper secondary schools having the highest andlowest proportions of canteens that used more than 50% organic food procurement, respectively (22%and 9%, respectively).
Int. J. Environ. Res. Public Health 2019, 16, 1115 7 of 16
Table 2. Characteristics of the participating canteens.
Characteristics
Elementary Schools(n = 170)
Upper Secondary Schools(n = 94)
Workplaces(n = 416)
All(n = 680)
n % n % N % n %
Number of daily lunch meals (<100) 91 54 39 41 198 48 328 48Outsourced to external contractors (yes) 8 5 22 23 124 30 154 23
Written canteen meal policy (yes) 97 57 45 48 161 39 303 45Serving system (buffet style) 46 28 64 69 374 91 484 71
Organic food procurement (>50%) 38 22 8 9 46 11 92 14
3.2. Compliance with the Guidelines
Compliance with guidelines for hot meals is shown in Table 3 for canteens in elementary schools,upper secondary schools and workplaces, respectively. For the canteens in elementary schools,the highest compliance was seen for the criteria on the maximum frequency of serving high-fat meat asmain protein component and non-wholegrain products (88% and 80%, respectively). For the canteensin the upper secondary schools, the highest compliance was seen for the criteria on maximum frequencyof using high-fat meat as main protein component (81%). With regard to canteens at workplaces,the highest compliance was seen for the criteria on minimum frequency of serving fish (82%). For allsettings, the lowest compliance was seen for the criteria on minimum content of fruit and vegetables(38%, 31% and 45%, respectively, for elementary schools, upper secondary schools and workplaces).Only a minor proportion of the settings complied to all of the criteria combined (19%, 10% and 13%,for elementary schools, upper secondary schools and workplaces, respectively).
Table 3. Compliance with the guidelines for hot meals.
Criteria Elementary Schools(n = 120)
Upper Secondary Schools(n = 86)
Workplaces(n = 383)
All(n = 589)
n % n % n % n %
Minimum fruit and vegetable content 45 38 27 31 171 45 243 41Minimum frequency of serving fish 74 62 43 50 315 82 432 73
Maximum frequency of serving high- fat meatas main protein component 106 88 70 81 266 69 442 75
Maximum frequency of servingnon-whole-grain products 96 80 57 66 250 65 403 68
Maximum frequency of using high-fatdairy/meat products in the meals 74 62 46 53 172 45 292 50
All (5 criteria combined) 23 19 9 10 49 13 81 14
Table 4 shows the characteristics of the canteens found to be significantly associated withcompliance with each of the hot meal criteria. No interactions between the canteen characteristicswere found significant. Canteens with a high degree of organic food procurement (organic foodprocurement >50% vs. <50%: OR 1.88 (1.14,3.11)) and canteens at workplaces were more likely tocomply with the criteria on minimum fruit and vegetable content than the other canteens (workplace v.elementary school: OR 1.84 (1.16,2.90) and workplace v. upper secondary school: OR 1.98 (1.17,3.34)).Moreover, workplace canteens were found to be more likely to comply with the criteria on minimumfrequency of serving fish compared with other canteens (workplace v. elementary school: OR 3.58(2.19,5.84) and workplace v. upper secondary school: OR 5.63 (3.35,9.45)). Multiple factors were foundto be associated with compliance with the criteria on maximum frequency of serving high-fat meatas main protein component including being an elementary school canteen, having a high degree oforganic food procurement, serving buffet style and not having af meal policy. With regard to thecriteria on the maximum frequency of use of non-wholegrain products, being an elementary schoolcanteen, serving buffet style and not being outsourced to external contractors were associated withcompliance with the criteria. Moreover, elementary school canteens were more likely to comply withthe criteria on the maximum use of high-fat dairy/meat products in limited amounts compared withworkplace canteens (workplace v. elementary school: OR 0.47 (0.30,0.74)). Finally, canteens having a

Int. J. Environ. Res. Public Health 2019, 16, 1115 8 of 16
high degree of organic food procurement (>50%) were more likely to comply with the 5 criteria for hotmeals combined (OR 2.00 (1.13,3.53)).
Table 4. Variables significantly (P ≤ 0.05) associated with compliance with guidelines for hot meals 1.
Criteria Significant Variables OR(95% CI) p Value 2
Minimum fruit andvegetable content
(n = 514)
Setting overall 0.004Workplace v. elementary school 1.84 (1.16,2.90) 0.009
Workplace v. upper secondary school 1.98 (1.17,3.34) 0.011Elementary school v. upper
secondary school 1.08 (0.58,2.01) 0.818
Organic food procurement >50% v. <50% 1.88 (1.14,3.11) 0.014
Minimum frequency ofserving fish as mainprotein component
(n = 566)
Setting overall <0.0001Workplace v. elementary school 3.58 (2.19,5.84) <0.0001
Workplace v. upper secondary school 5.63 (3.35,9.45) <0.0001Elementary school v. upper
secondary school 1.57 (0.87,2.84) 0.133
Maximum frequency ofserving high-fat meat asmain protein component
(n = 511)
Setting overall 0.000Workplace v. elementary school 0.18 (0.08,0.43) <0.0001
Workplace v. upper secondary school 0.50 (0.26,0.97) 0.042Elementary school v. upper
secondary school 2.77 (1.08,7.11) 0.035
Organic food procurement >50% v. <50% 2.78 (1.27,6.09) 0.011Meal policy v. no meal policy 0.62 (0.40,0.96) 0.033
Buffet v. no buffet style 2.06 (1.08,3.92) 0.029
Maximum frequency ofserving non-wholegrain
products (n = 562)
Setting overall 0.005Workplace v. elementary school 0.34 (0.18,0.66) 0.001
Workplace v. upper secondary school 0.89 (0.52,1.53) 0.681Elementary school v. upper
secondary school 2.62 (1.28,5.37) 0.009
Buffet v. no buffet style 2.47 (1.44,4.24) 0.001Outsourced v. not outsourced 0.50 (0.33,0.75) 0.001
Maximum frequency ofusing high-fat
dairy/meat products inthe meals (n = 535)
Setting overall 0.004Workplace v. elementary school 0.47 (0.30,0.74) 0.001
Workplace v. upper secondary school 0.73 (0.45,1.19) 0.210Elementary school v. upper
secondary school 1.56 (0.86,2.84) 0.144
All (5 guidelinescombined) (n = 542) Organic food procurement >50% v. <50% 2.00 (1.13,3.53) 0.017
OR, odds ratio; CI, confidence interval; 1 Canteens serving hot meals at lunch at least 3 times a week were included inthe analysis (n = 589); 2 Tested using multiple logistic regression. Variables included: Setting, number of daily lunchmeals, outsourced to external contractors, written canteen meal policy, serving system, organic food procurement.
3.3. Food Waste Reduction
Table 5 shows answers to the question on the canteens’ focus on reducing food waste. The vastmajority of the canteens reported that they had “somewhat”, “a high degree” or “a very high degree” offocus on food waste reduction (93% on average). The proportion of elementary schools reporting thatthey focus on food waste reduction to “a very high degree” was 62%, while 59% of upper secondaryschools and 58% of workplaces reported to focus on food waste reduction “to a very high degree”.

Int. J. Environ. Res. Public Health 2019, 16, 1115 9 of 16
Table 5. Canteens’ focus on food waste reduction.
Response Categories Elementary Schools(n = 170)
Upper Secondary School(n = 94)
Workplaces(n = 416)
All(n = 680)
n % n % n % n %
To what extent does the canteen focus on food waste reduction?To a very low degree 6 4 3 3 11 3 20 3
To a low degree 2 1 0 0 4 1 6 1Somewhat 13 8 7 7 35 8 55 8
To a high degree 35 21 28 30 117 28 180 26To a very high degree 106 62 55 59 242 58 403 59
Do not know 5 3 0 0 0 0 5 1Unanswered 3 2 1 1 7 2 11 2
As seen in Table 6, canteens with a high degree of organic food procurement were found to havesignificantly higher odds of focusing on food waste reduction to a very high degree, than the canteenswith less than 50% organic food procurement (OR 1.91 (CI 1.12,3.25)). Also, canteens with a mealpolicy were found to have significantly higher odds of focusing on food waste reduction to a very highdegree compared with canteens without a meal policy (OR 1.84 (CI 1.31,2.59)).
Table 6. Variables significantly (p ≤ 0.05) associated with a very high focus on food waste reduction.
Focus Point Significant Variables OR (95% CI) p Value 1
Food waste (n = 584)Organic food procurement >50% v. <50% 1.91 (1.12,3.25) 0.017Meal policy v. no meal policy 1.84 (1.31,2.59) 0.000
OR, odds ratio; CI, confidence interval; 1 Tested using multiple logistic regression. Variables included: Setting,number of daily lunch meals, outsourced to external contractors, written canteen meal policy, serving system,organic food procurement.
Figure 2 shows how the canteens reported to work with reducing food waste. The single mostused strategy to reduce food waste was reported to be reuse of excess production/leftovers (84%).In total, 55% answered that they optimize the use of raw foods and 47% that they place less food onthe table or buffet. Adapting portion sizes and using smaller bowls were reported to be used to reducefood waste by 34% and 27%, respectively. Selling leftovers to employees was a strategy used by 29% ofthe canteens. Finally, 5% of the canteens had other strategies with giving away the leftovers for free,being the most often mentioned.
Int. J. Environ. Res. Public Health 2019, 16, x 9 of 16
As seen in Table 6, canteens with a high degree of organic food procurement were found to have significantly higher odds of focusing on food waste reduction to a very high degree, than the canteens with less than 50% organic food procurement (OR 1.91 (CI 1.12,3.25)). Also, canteens with a meal policy were found to have significantly higher odds of focusing on food waste reduction to a very high degree compared with canteens without a meal policy (OR 1.84 (CI 1.31,2.59)).
Table 6. Variables significantly (p ≤ 0.05) associated with a very high focus on food waste reduction.
Focus point Significant variables OR (95% CI) p value 1
Food waste (n = 584) Organic food procurement >50% v. <50% 1.91 (1.12,3.25) 0.017
Meal policy v. no meal policy 1.84 (1.31,2.59) 0.000 OR, odds ratio; CI, confidence interval; 1 Tested using multiple logistic regression. Variables included: Setting, number of daily lunch meals, outsourced to external contractors, written canteen meal policy, serving system, organic food procurement.
Figure 2 shows how the canteens reported to work with reducing food waste. The single most used strategy to reduce food waste was reported to be reuse of excess production/leftovers (84%). In total, 55% answered that they optimize the use of raw foods and 47% that they place less food on the table or buffet. Adapting portion sizes and using smaller bowls were reported to be used to reduce food waste by 34% and 27%, respectively. Selling leftovers to employees was a strategy used by 29% of the canteens. Finally, 5% of the canteens had other strategies with giving away the leftovers for free, being the most often mentioned.
Figure 2. Food waste reduction priorities among canteens in elementary schools, upper secondary schools and workplaces that focus on food waste reduction “somewhat”, to “a high degree” or “a very high degree” (%) (n = 638).
A very similar pattern in food waste reduction priorities was seen among upper secondary schools and workplaces. With regard to elementary schools, small differences were seen, e.g., more schools reported to reduce food waste by adapting portion sizes (40%). Canteens using organic food procurement were found to have more priorities in optimizing the use of raw foods (72%) compared with those not using organic food procurement to the same extent (52%), whereas canteens having a written canteen meal policy were found to have more priorities in adapting portion sizes (42%) and using smaller serving bowls (34%) compared with priorities among other canteens not having a written meal policy (28 and 21%, respectively).
4. Discussion
The present study, examining the availability of hot meals complying with the official Danish food service guidelines, shows that canteens at elementary schools, upper secondary schools and workplaces have room for improvement in order to promote healthier food choices, since only 14% of the canteens fulfilled all five criteria for hot meals over a week. Higher compliance was seen with regard to the five individual hot meal criteria from 41% (minimum fruit and vegetable content) to 75% (maximum frequency of serving high-fat meat as main protein component).
0% 10% 20% 30% 40% 50% 60% 70% 80% 90%
Other
Sells leftovers to employees etc
Reuse of excess production/leftovers
Adapting portion sizes
Using smaller serving bowls
Place less food on the table or buffet(and rather refill it more times)
Optimize the use of raw foods
Figure 2. Food waste reduction priorities among canteens in elementary schools, upper secondaryschools and workplaces that focus on food waste reduction “somewhat”, to “a high degree” or “a veryhigh degree” (%) (n = 638).
A very similar pattern in food waste reduction priorities was seen among upper secondaryschools and workplaces. With regard to elementary schools, small differences were seen, e.g.,

Int. J. Environ. Res. Public Health 2019, 16, 1115 10 of 16
more schools reported to reduce food waste by adapting portion sizes (40%). Canteens using organicfood procurement were found to have more priorities in optimizing the use of raw foods (72%)compared with those not using organic food procurement to the same extent (52%), whereas canteenshaving a written canteen meal policy were found to have more priorities in adapting portion sizes(42%) and using smaller serving bowls (34%) compared with priorities among other canteens nothaving a written meal policy (28 and 21%, respectively).
4. Discussion
The present study, examining the availability of hot meals complying with the official Danishfood service guidelines, shows that canteens at elementary schools, upper secondary schools andworkplaces have room for improvement in order to promote healthier food choices, since only 14%of the canteens fulfilled all five criteria for hot meals over a week. Higher compliance was seen withregard to the five individual hot meal criteria from 41% (minimum fruit and vegetable content) to 75%(maximum frequency of serving high-fat meat as main protein component).
Looking overall at the characteristics of the canteens, especially the type of setting (elementaryschool, upper secondary school or workplace) and the use of organic food (over or below 50%) wereassociated with compliance with the criteria. The type of setting was associated with compliance withall five criteria individually, and the use of organic food was associated with compliance with two ofthe criteria (i.e., criteria on minimum fruit and vegetable content and maximum frequency of servinghigh-fat meat as main protein component) as well as the five criteria combined. Besides, serving buffetstyle and the presence of a written meal policy, as well as serving buffet style and being outsourced toexternal contractors were found to be associated with compliance with two of the criteria (frequency ofserving high-fat meat as main protein component, and maximum frequency of serving non-wholegrainproducts, respectively). Moreover, a high use of organic food and the presence of a written meal policywere found to be associated with reporting a very high degree of focus on food waste reduction.
Compliance of the individual criteria for hot meals was highly variable across the different settings.Some of the criteria for hot meals were more likely to be fulfilled by elementary schools comparedwith both workplaces and upper secondary schools, e.g., maximum frequency of serving high-fatmeat as main protein component (88%), using high-fat dairy/meat products in the meals (62%) andfrequency of serving non-wholegrain products (80%), whereas workplaces were found to be morelikely to comply with the criteria of minimum serving of fish in accordance with the guidelines (82%)compared with both elementary school and upper secondary school canteens. Also workplaces weremore likely to comply with the criteria on minimum fruit and vegetables content of the meals (45%)compared with both canteens at elementary schools and upper secondary schools.
Other studies in the school setting have reported mixed results with regard to compliance withfood service policies and guidelines. Juniusdottir et al. found that the guidelines and recommendationson the availability of different foods were generally quite well followed, but only 61% of the mealssatisfied the recommendation of minimum energy content among the 24 participating elementaryschools from three Nordic countries [14]. Lower levels of compliance were found in a study among263 primary and secondary Australian school menus, where the proportion of schools compliant withhealthy canteen policies in each state was from 5% and up to 62%. In the majority of states, 35% ofschools achieved compliance [15,16].
In the present study, elementary schools were more likely to comply with criteria on minimumfrequency of serving high-fat meat as the main protein component and maximum frequency ofserving non-wholegrain products when compared with upper secondary schools. In line withthis, Girano et al. found that compliance was higher in primary schools compared with secondaryschools [18]. Young people/adolescents are at a transition stage between a childhood eating pattern,mainly controlled by parents, and an independent adulthood eating pattern. The changes in foodconsumption that occur during this transition often lead to a decrease in the overall diet quality.

Int. J. Environ. Res. Public Health 2019, 16, 1115 11 of 16
Maintaining a healthy food environment during this transition, especially at schools, may help youngpeople to keep or adopt healthy dietary behaviours [57].
There are few studies on compliance with food service guidelines in workplace canteens. A studyby Miller et al. found that 25% out of 278 Australian health facility managers providing food and drinksto staff, visitors and the general public reported full implementation of A Better Choice, that classifiesfoods and drinks into three colour-coded categories: “Green” (best choices), “Amber” (choose carefully)and “Red” (limit), in all food supply areas in which it applied [58].
Similarly, the present study showed that 13% complied to all five criteria leaving room forimprovement in the workplace canteens with regard to compliance with the food service guidelines.Nevertheless, workplace canteens were found to be more likely to comply with the criteria of minimumserving of fish and minimum fruit and vegetable content compared with both elementary school andupper secondary school canteens. This might partly be explained by a longer tradition in workplaceshaving a weekly day with fish, combined with the more challenging task of promoting intake offish among children in schools in Denmark [59]. Results from the present study on compliancewith fruit and vegetable content in hot meals among workplaces are comparable with the studyby Thorsen et al. with regard to the evaluation of the nutritional quality of hot meals offered at553 workplace canteens. A total of 58% of the canteens reported to serve hot meals according to theDanish “Plate model” illustrating a recommended meal composition with 40% fruit and vegetables [51].In addition, the ‘6-a-day’ campaign, since the year 2000, regarding increasing the fruit and vegetableconsumption in Denmark, targeted workplace canteens [60]. Thorsen et al. also suggested a positiverelationship between corporate financial support and the availability of healthy meal options [51].Many workplaces may be willing to support in-house canteens in order to promote workers’ goodhealth and to enhance employees’ productivity and the corporate image [48]. Serving system wasfound to be associated with compliance with regard to frequency of serving non-wholegrain. Buffetserving as a serving system is widely used at workplaces in Denmark. Buffet serving was in across-sectional study among 15 workplace canteens also found to be associated with a significantlyhigher fruit and vegetable consumption compared with an a la carte system [50].
The present study shows that canteens using a high degree of organic food procurement atelementary schools, upper secondary school and workplaces were more likely to serve healthy hotmeals according to the food service guidelines with regard to fruit and vegetables, high-fat meatas main protein component and all five criteria combined. These findings are comparable with astudy from 2005 that showed a strong correlation between caterers’ use of organic products, and thenutritional quality of the menu options offered [37]. On the other hand, the present study showedthat higher odds of compliance were not seen with regard to the criteria on minimum frequency ofserving fish, maximum frequency of serving high-fat dairy/meat products nor maximum frequency ofserving non-wholegrain indicating that organic food may be linked to some healthier dietary patternsin favour of plant-based foods, but not all.
In the present study, the vast majority of canteens reported to have a strong or very strong focuson food waste reduction activities. This is in line with results found in a newly published study ofSwedish municipal food service organizations [61]. This possibly reflects that food waste reduction hasattracted increasing attention in recent years due to both sustainability and economic incentives [61].Other former studies have shown different results [62]. It is worth noting that canteens using a highdegree of organic food procurement in the present study were significantly more likely to report thatthey had a very high focus on reducing food waste compared with canteens with a lower use of organicfood procurement. Sørensen et al. suggest that food-waste management is necessary to optimize thefood production in the kitchens and save resources that may cover the premium prices of organicfood [38]. This possibly indicates that canteens with higher organic procurement are first moverson more comprehensive waste reduction. In the present study, canteens using organic procurementwere found to have more priorities in optimizing, especially in the use of raw foods compared withthose not using organic food procurement to the same extent. Steen et al. found in a study among

Int. J. Environ. Res. Public Health 2019, 16, 1115 12 of 16
177 Swedish school and pre-school catering units that the main factors influencing serving waste andtotal waste per portion were type of kitchen (production or satellite units) and rate of overproduction,while plate waste was mainly influenced by children’s age and factors indicating a stressful diningenvironment [45]. Betz et al. points out on the basis of a study of two Swiss companies in the educationand business sectors that serving losses, which was the main group of losses and almost completelyavoidable, could be minimized by adapting portion size to the customers’ requirements and preferredportion sizes and using smaller serving bowls [53]. A study at an Italian school canteen showedthat food waste could be reduced through meal planning and leftover re-use schemes [63]. In linewith this, food waste was in the present study mainly reported to be reduced by the canteens byreusing of excess production/leftovers (84%) and by optimizing the use of raw products (i.e., usingthe entire product, 47%), but also by adapting portion size (34%) and using smaller serving bowls(27%). The EAT-Lancet commission suggests in order to increase sustainability of food consumptionthat food service operators should minimize food waste through careful planning and portioning andbe proactive by using the entire product at every chance [2].
When developing food service guidelines, it is important to consider the environmental impact.The Danish food service guidelines were originally pilot tested in seven canteens, including canteensusing organic foods to make sure that fulfilling the guidelines was not hampered by the use of organicfoods [64]. Moreover, to prevent that adoption of guidelines would lead to an increase of food waste,the guidelines allow food leftovers to be offered, for example, on the buffet the following day withoutaffecting the evaluation of fulfilling the food service guidelines.
The study has both strengths and limitations to consider. A strength of the present survey isthat the data collection was conducted nationwide, which increases generalizability of our studyfindings. In addition, it allows for a comparison of compliance with hot meal guidelines in differentsettings, as the criteria for this meal category is the same across settings. This study also presents somelimitations. First, the relatively low participation rate (34%) might lead to, e.g., an overestimationof compliance as a result of participants being more health conscious than the rest of the canteens.The willingness to participate in surveys might be limited due to canteen managers being very busy,and a similar low response rate, 29%, was reported in a former canteen survey from Denmark [51].Furthermore, our results are limited by the self-reported nature of all the information obtained, whichare susceptible to recall and social desirability bias. Importantly, the subjective question regarding focuson food waste cannot provide information about actual amounts of food waste but rather on awarenessand attitudes towards food waste reduction. Also, it is acknowledged that implementing food serviceguidelines is a process that may take time. Food offerings need to be adapted to customers’ preferences,and selections offered from retailers can be inadequate [65]. Since the food service guidelines havebeen established only quite recently in Denmark, it is possible that compliance will increase over time.Future research could include in-depth interviews with the canteen managers from different settingsto gain a better understanding of challenges faced by them in complying with food service guidelines.
5. Conclusions
This study is the first, to our knowledge, to determine compliance with food service guidelinesand to focus on food waste across both the school and workplace settings. The majority of the canteensdid not report fully complying with the guidelines on hot meals. Overall, compliance with theguideline was more likely among canteens with a high degree of organic food procurement. Moreover,compliance with the individual hot meal criteria varied widely across settings, with elementary schoolsbeing more likely to comply with the criteria on, e.g., maximum serving of non-wholegrain productsand high-fat meat, whereas workplaces were more likely to comply with the criteria on minimumfruit and vegetable content of the meals and serving of fish. The study moreover showed that a vastmajority of the canteens have a strong self-evaluated focus in food waste reducing activities. Canteenswith a high degree of organic food procurement and a written meal policy were more likely to have avery high degree of focus in food waste reduction than other canteens. These findings highlight the

Int. J. Environ. Res. Public Health 2019, 16, 1115 13 of 16
need to address differences in canteen characteristics when planning implementation support for bothfood service guidelines and initiatives on food waste reduction to contribute to the achievement of theUN’s Sustainable Development Goals.
Supplementary Materials: The following are available online at http://www.mdpi.com/1660-4601/16/7/1115/s1, S1–S3: Survey questionnaires for elementary schools, upper secondary schools and workplaces. Table S1:Distribution on the Danish regions by invited and participating schools and workplaces in the survey.
Author Contributions: Conceptualization, A.D.L, L.M.C. and E.T.; Methodology, L.M.C. and A.D.L; Statisticalanalysis, M.P.S. E.T. and A.D.L.; Writing, A.D.L., L.M.C. and all.
Funding: The study was funded by the Ministry of Food, Agriculture and Fisheries and the Technical Universityof Denmark.
Acknowledgments: The authors would like to thank the canteen managers who took part in this survey. Specialthanks to Jeffrey Edward Skiby and Anne Vibeke Thorsen for proofreading and scientific feedback.
Conflicts of Interest: The authors declare no conflicts of interest. The funders had no role in the design of thestudy; in the collection, analyses, or interpretation of data; in the writing of the manuscript, and in the decision topublish the results.
References
1. Conrad, Z.; Niles, M.T.; Neher, D.A.; Roy, E.D.; Tichenor, N.E.; Jahns, L. Relationship between food waste,diet quality, and environmental sustainability. PLoS ONE 2018, 13. [CrossRef] [PubMed]
2. EAT-Lancet Commission. EAT-Lancet Commission brief for Food Service Professionals. Lancet 2019.Available online: https://eatforum.org/content/uploads/2019/01/EAT_brief_food-service-professionals.pdf (accessed on 1 February 2019).
3. EAT-Lancet Commission. Food in the Anthropocene: The EAT-Lancet Commission on healthy diets fromsustainable food systems. Lancet 2019. [CrossRef]
4. Clinton-McHarg, T.; Janssen, L.; Delaney, T.; Reilly, K.; Regan, T.; Nathan, N.; Wiggers, J.; Yoong, S.L.;Wyse, R.; Grady, A.; et al. Availability of food and beverage items on school canteen menus and associationwith items purchased by children of primary-school age. Public Health Nutr. 2018, 21, 2907–2914. [CrossRef]
5. Wolfenden, L.; Nathan, N.; Janssen, L.M.; Wiggers, J.; Reilly, K.; Delaney, T.; Williams, C.M.; Bell, C.; Wyse, R.;Sutherland, R.; et al. Multi-strategic intervention to enhance implementation of healthy canteen policy:A randomised controlled trial. Implement. Sci. 2017, 12. [CrossRef] [PubMed]
6. Micha, R.; Karageorgou, D.; Bakogianni, I.; Trichia, E.; Whitsel, L.P.; Story, M.; Penalvo, J.L.; Mozaffarian, D.Effectiveness of school food environment policies on children’s dietary behaviors: A systematic review andmeta-analysis. PLoS ONE 2018, 13. [CrossRef]
7. Lassen, A.D.; Beck, A.; Leedo, E.; Andersen, E.W.; Christensen, T.; Mejborn, H.; Thorsen, A.V.; Tetens, I.Effectiveness of offering healthy labelled meals in improving the nutritional quality of lunch meals eaten ina worksite canteen. Appetite 2014, 75, 128–134. [CrossRef]
8. Pechey, R.; Cartwright, E.; Pilling, M.; Hollands, G.J.; Vasiljevic, M.; Jebb, S.A.; Marteau, T.M. Impact ofincreasing the proportion of healthier foods available on energy purchased in worksite cafeterias: A steppedwedge randomized controlled pilot trial. Appetite 2018, 133, 286–296. [CrossRef]
9. Fitzgerald, S.; Kirby, A.; Murphy, A.; Geaney, F.; Perry, I.J. A cost-analysis of complex workplace nutritioneducation and environmental dietary modification interventions. BMC Public Health 2017, 17. [CrossRef]
10. Reilly, K.L.; Reeves, P.; Deeming, S.; Yoong, S.L.; Wolfenden, L.; Nathan, N.; Wiggers, J. Economic analysisof three interventions of different intensity in improving school implementation of a government healthycanteen policy in Australia: Costs, incremental and relative cost effectiveness. BMC Public Health 2018, 18.[CrossRef]
11. Storcksdieck genannt Bonsmann, S. Comprehensive mapping of national school food policies across theEuropean Union plus Norway and Switzerland. Nutr. Bull. 2014, 39, 369–373. [CrossRef]
12. Onufrak, S.J.; Zaganjor, H.; Moore, L.V.; Carlson, S.; Kimmons, J.; Galuska, D. Nutrition Standards for FoodService Guidelines for Foods Served or Sold in Municipal Government Buildings or Worksites, United States,2014. Prev. Chronic. Dis. 2016, 13. [CrossRef] [PubMed]

Int. J. Environ. Res. Public Health 2019, 16, 1115 14 of 16
13. Rice, L.; Benson, C.; Podrabsky, M.; Otten, J.J. The development and adoption of the first statewidecomprehensive policy on food service guidelines (Washington State Executive Order 13-06) for improvingthe health and productivity of state employees and institutionalized populations. Transl. Behav. Med. 2019, 9,48–57. [CrossRef] [PubMed]
14. Juniusdottir, R.; Hoernell, A.; Gunnarsdottir, I.; Lagstrom, H.; Waling, M.; Olsson, C.; Talvia, S.;Olafsdottir, A.S. Composition of School Meals in Sweden, Finland, and Iceland: Official Guidelines andComparison with Practice and Availability. J. Sch. Health 2018, 88, 744–753. [CrossRef] [PubMed]
15. Reilly, K.; Nathan, N.; Grady, A.; Wu, J.H.Y.; Wiggers, J.; Yoong, S.L.; Wolfenden, L. Barriers to implementationof a healthy canteen policy: A survey using the theoretical domains framework. Health Promot. J. Aust. 2018.[CrossRef] [PubMed]
16. Woods, J.; Bressan, A.; Langelaan, C.; Mallon, A.; Palermo, C. Australian school canteens: Menu guidelineadherence or avoidance? Health Promot. J. Aust. 2014, 25, 110–115. [CrossRef]
17. Caldeira, S.; Storksdieck genannt Bonsmann, S.; Bakogianni, I.; Gauci, C.; Calleja, A.; Furtado, A.Public Procurement of Food for Health. Technical Report on the School Setting. Luxembourg, Joint Publicationof the Maltese Presidency and the European Union, 2017. Available online: https://ec.europa.eu/jrc/sites/jrcsh/files/public-procurement-food-health-technical-report.pdf (accessed on 1 February 2019).
18. Girona, A.; Iragola, V.; Alcaire, F.; Curutchet, M.A.R.; Pereira, P.; Magnani, D.; Barreto, P.; Petingi, S.A.;Allegue, G.; Conzalo, G.; et al. Factors underlying compliance with a healthy snacking initiative in the schoolenvironment: Accounts of school principals in Montevideo (Uruguay). Public Health Nutr. 2018. [CrossRef]
19. German Nutrition Society (DGE). DGE Quality Standards for School Meals, 4th ed.; German Nutrition Society(DGE): Bonn, Germany, 2014. Available online: https://www.schuleplusessen.de/fileadmin/user_upload/medien/DGE_QS_SchoolMeals.pdf (accessed on 1 February 2019).
20. The Independent School Food Plan: The School Food Standards. Available online: http://www.schoolfoodplan.com/actions/school-food-standards/ (accessed on 2 January 2019).
21. Mucavele, P.; Nicholas, J.; Sharp, L. Development and Pilot Testing of Revised Food-Based Standardsfor School Lunches in England; Children’s Food Trust: Sheffield, UK, 2014. Available online:http://www.schoolfoodplan.com/wp-content/uploads/2014/02/School-Food-Plan-Pilot-study-EVALUATION-REPORT-Final-V3.pdf (accessed on 1 February 2019).
22. McIsaac, J.L.; Ata, N.; Kirk, S.F.L. Describing Food Availability in Schools Using Different Healthy EatingGuidelines: Moving Forward with Simpler Nutrition Recommendations. Can. J. Diet. Pract. Res. 2018.[CrossRef]
23. 2010 DGAC Membership. Report of the Dietary Guidelines Advisory Committee on the Dietary Guidelinesfor Americans, 2010; USDA Press Release: Washington, DC, USA, 2010. Available online: https://www.nutriwatch.org/05Guidelines/dga_advisory_2010.pdf (accessed on 1 February 2019).
24. Danish Veterinary and Food Administration. Guide to Healthier Food in Elementary Schools. Availableonline: https://altomkost.dk/fileadmin/user_upload/altomkost.dk/Maaltidsmaerket/Guide_skole.pdf(accessed on 2 January 2019).
25. Danish Veterinary and Food Administration. Guide to Healthier Food at the Higher Education Institutionsand the Workplaces. Available online: https://altomkost.dk/fileadmin/user_upload/altomkost.dk/Maaltidsmaerket/Guide_kantine_online.pdf (accessed on 2 January 2019).
26. Lassen, A.; Trolle, E.; Bysted, A.; Knuthsen, P.; Andersen, E. The Salt Content of Lunch Meals Eaten at DanishWorksites. Nutrients 2018, 10, 1367. [CrossRef]
27. Nordic Council of Ministers. Solutions Menu—A Nordic Guide to Sustainable Food Policy; Nordic Council ofMinisters: Copenhagen, Denmark, 2018. Available online: http://urn.kb.se/resolve?urn=urn:nbn:se:norden:org:diva-5265 (accessed on 1 February 2019).
28. Danish Veterinary and Food Administration. Guide to Healthier Food in the Daycare Institution. Availableonline: https://altomkost.dk/fileadmin/user_upload/altomkost.dk/Maaltidsmaerket/Daginstitutioner/Materialer/Maaltidsmaerket_daginstitutioner_Guide.pdf (accessed on 2 January 2019).
29. Danish Veterinary and Food Administration. Eating healthy in Denmark. Available online:https://altomkost.dk/publikationer/publikation/pub/hent-fil/publication/factsheet-guides-to-healthier-meals-in-denmark (accessed on 15 Martch 2019).

Int. J. Environ. Res. Public Health 2019, 16, 1115 15 of 16
30. Moerk, T.; Tsalis, G.; Aachmann, K.; Groenhoej, A. Food and Meals in School—Inspiration and Experiencel;DCA—Danish Centre For Food and Agriculture, Aarhus University: Tjele, Denmark, 2015. Available online:http://web.agrsci.dk/djfpublikation/djfpdf/DCArapport53.pdf (accessed on 1 February 2019).
31. Lassen, A.D.; Christensen, L.M.; Trolle, E.; Christensen, T. Food Offered at Workplaces, Upper SecondarySchools and Elementary Schools 2017. National Food Institute, Technical University of Denmark, 2018.Available online: www.food.dtu.dk (accessed on 1 February 2019).
32. Joergensen, M.S.; Arsky, G.H.; Brandhoej, M.; Nyberg, M.; Roos, E.; Mikkelsen, B.E. Eating at worksites inNordic countries: National experiences and policy initiatives. Int. J. Workplace Health Manag. 2010, 3, 197–210.[CrossRef]
33. Brantsaeter, A.L.; Ydersbond, T.A.; Hoppin, J.A.; Haugen, M.; Meltzer, H.M. Organic Food in the Diet:Exposure and Health Implications. Annu. Rev. Public Health 2017, 38, 295–313. [CrossRef] [PubMed]
34. Sørensen, N.N.; Sørensen, M.L.K.; Trolle, E.; Lassen, A.D. Organic Food in Public Catering: How the DanishOrganic Cuisine Label May Maintain Organic Food Production in the Longer Term. J. Culin. Sci. Technol.2019, 1–15. [CrossRef]
35. Ministry of Environment and Food of Denmark. Organic Plan Denmark: Together Towards More Organic.Copenhagen, Denmark, 2015. Available online: https://mfvm.dk/fileadmin/user_upload/FVM.dk/Dokumenter/Landbrug/Indsatser/Oekologi/OekologiplanDanmark.pdf (accessed on 1 February 2019).
36. Ministry of Environment and Food of Denmark. The Organic Cuisine Label. Available online:https://www.oekologisk-spisemaerke.dk/horeca-en (accessed on 10 March 2019).
37. Mikkelsen, B.; Bruselius-Jensen, M.; Andersen, J.; Lassen, A. Are green caterers more likely to serve healthymeals than non-green caterers? Results from a quantitative study in Danish worksite catering. Public HealthNutr. 2006, 9, 846–850. [CrossRef] [PubMed]
38. Sorensen, N.N.; Tetens, I.; Loje, H.; Lassen, A.D. The effectiveness of the Danish Organic Action Plan 2020 toincrease the level of organic public procurement in Danish public kitchens. Public Health Nutr. 2016, 1–8.[CrossRef]
39. Denver, S.; Christensen, T. Organic food and health concerns: A dietary approach using observed data.NJAS Wagening. J. Life Sci. 2015, 74–75, 9–15. [CrossRef]
40. Silvennoinen, K.; Heikkilä, L.; Katajajuuri, J.M.; Reinikainen, A. Food waste volume and origin: Case studiesin the Finnish food service sector. Waste Manag. 2015, 46, 140–145. [CrossRef] [PubMed]
41. Thorsen, A.V.; Sabinsky, M.; Trolle, E. Food Waste in Connection With Organic Conversion in Public KitchensNational Food Institute, Technical University of Denmark, 2014. Available online: www.food.dtu.dk(accessed on 1 February 2019).
42. Boschini, M.; Falasconi, L.; Giordano, C.; Alboni, F. Food waste in school canteens: A reference methodologyfor large-scale studies. J. Clean. Prod. 2018, 182, 1024–1032. [CrossRef]
43. Sun, Y.; Liu, B.; Du, Y.; Snetselaar, L.; Sun, Q.; Hu, F.; Bao, W. Inverse Association between Organic FoodPurchase and Diabetes Mellitus in US Adults. Nutrients 2018, 10. [CrossRef]
44. Grosso, M.; Falasconi, L. Addressing food wastage in the framework of the UN Sustainable DevelopmentGoals. Waste Manag. Res. 2018, 36, 97–98. [CrossRef]
45. Steen, H.; Malefors, C.; Roos, E.; Eriksson, M. Identification and modelling of risk factors for food wastegeneration in school and pre-school catering units. Waste Manag. 2018, 77, 172–184. [CrossRef]
46. Martin-Rios, C.; Demen-Meier, C.; Gössling, S.; Cornuz, C. Food waste management innovations in thefoodservice industry. Waste Manag. 2018, 79, 196–206. [CrossRef]
47. Lassen, A.D.; Thorsen, A.V.; Sommer, H.M.; Fagt, S.; Trolle, E.; Biltoft-Jensen, A.; Tetens, I. Improving thediet of employees at blue-collar worksites: Results from the ’Food at Work’ intervention study. Public HealthNutr. 2011, 14, 965–974. [CrossRef] [PubMed]
48. Lassen, A.; Bysted, A.; Knuthsen, P.; Andersen, E. The Nutritional Quality of Lunch Meals Eaten at DanishWorksites. Nutrients 2018, 10, 1518. [CrossRef]
49. Christensen, L.M.; Hansen, K.S.; Sabinsky, M. Quality of School Lunch—Study of Schoolchildren’s LunchMeals. National Food Institute, Technical University of Denmark, 2009. Available online: www.food.dtu.dk(accessed on 1 February 2019).
50. Lassen, A.; Hansen, K.; Trolle, E. Comparison of buffet and a la carte serving at worksite canteens on nutrientintake and fruit and vegetable consumption. Public Health Nutr. 2007, 10, 292–297. [CrossRef] [PubMed]

Int. J. Environ. Res. Public Health 2019, 16, 1115 16 of 16
51. Thorsen, A.V.; Lassen, A.D.; Andersen, J.S.; Mikkelsen, B.E. Workforce gender, company size and corporatefinancial support are predictors of availability of healthy meals in Danish worksite canteens. Public HealthNutr. 2009, 12, 2068–2073. [CrossRef] [PubMed]
52. Willis, G.B.; Artino, A.R. What Do Our Respondents Think We’re Asking? Using Cognitive Interviewing toImprove Medical Education Surveys. J. Grad. Med. Educ. 2013, 5. [CrossRef] [PubMed]
53. Betz, A.; Buchli, J.; Goebel, C.; Mueller, C. Food waste in the Swiss food service industry—Magnitude andpotential for reduction. Waste Manag. 2015, 35, 218–226. [CrossRef]
54. Marthinsen, J.; Sundt, P.; Kaysen, O.; Kirkevaag, K. Prevention of Food Waste in Restaurants, Hotels, Canteensand Catering. Copenhagen, TemaNord 2012:537, Nordic Council of Ministers, 2012. Available online:http://www.diva-portal.org/smash/get/diva2:701203/FULLTEXT01.pdf (accessed on 1 February 2019).
55. Hosmer Jr, D.W.; Lemeshow, S.; Sturdivant, R.X. Applied Logistic Regression, 3rd ed.; John Wiley & Sons, Inc.:Hoboken, NJ, USA, 2013; ISBN 978-0-470-58247-3.
56. Peduzzi, P.; Concato, J.; Kemper, E.; Holford, T.R.; Feinstem, A.R. A simulation study of the number of eventsper variable in logistic regression analysis. J. Clin. Epidemiol. 1996, 49, 1373–1379. [CrossRef]
57. Dubuisson, C.; Lioret, S.; Calamassi-Tran, G.; Volatier, J.L.; Lafay, L. School meals in French secondary stateschools with regard to the national recommendations. Br. J. Nutr. 2009, 102, 293–301. [CrossRef] [PubMed]
58. Miller, J.; Lee, A.; Obersky, N.; Edwards, R. Implementation of A Better Choice Healthy Food and DrinkSupply Strategy for staff and visitors in government-owned health facilities in Queensland, Australia. PublicHealth Nutr. 2015, 18, 1602–1609. [CrossRef]
59. Andersen, R.; Biltoft-Jensen, A.P.; Andersen, E.W.; Ege, M.; Christensen, T.; Ygil, K.H.; Thorsen, A.V.;Damsgaard, C.T.; Astrup, A.; Michaelsen, K.F.; et al. Effects of school meals based on the New Nordic Dieton intake of signature foods: A randomised controlled trial. The OPUS School Meal Study. Br. J. Nutr. 2015,114, 772–779. [CrossRef]
60. Lassen, A.; Thorsen, A.V.; Trolle, E.; Elsig, M.; Ovesen, L. Successful strategies to increase the consumptionof fruits and vegetables: Results from the Danish ’6 a day’ Work-site Canteen Model Study. Public HealthNutr. 2004, 7, 263–270. [CrossRef]
61. Eriksson, M.; Lindgren, S.; Osowski, C.P. Mapping of food waste quantification methodologies in the foodservices of Swedish municipalities. Resour. Conserv. Recycl. 2018, 137, 191–199. [CrossRef]
62. Halloran, A.; Clement, J.; Kornum, N.; Bucatariu, C.; Magid, J. Addressing food waste reduction in Denmark.Food Policy 2014, 49, 294–301. [CrossRef]
63. Lagorio, A.; Pinto, R.; Golini, R. Food waste reduction in school canteens: Evidence from an Italian case.J. Clean. Prod. 2018, 199, 77–84. [CrossRef]
64. Lassen, A.D.; Christensen, L.M.; Trolle, E. Behind the Danish Meal Label: Development and Testing of theCriteria for Healthy Canteen Food; National Food Institute, Technical University of Denmark: Kongens Lyngby,Denmark, 2017; pp. 1–10. Available online: www.food.dtu.dk (accessed on 1 February 2019).
65. Pitts, S.J.; Schwartz, B.; Graham, J.; Warnock, A.L.; Mojica, A.; Marziale, E.; Harris, D. Best Practices forFinancial Sustainability of Healthy Food Service Guidelines in Hospital Cafeterias. Prev. Chronic Dis. 2018, 15.[CrossRef]
© 2019 by the authors. Licensee MDPI, Basel, Switzerland. This article is an open accessarticle distributed under the terms and conditions of the Creative Commons Attribution(CC BY) license (http://creativecommons.org/licenses/by/4.0/).