chapter no. 9 external and domestic debt - finance.gov.pkfinance.gov.pk/survey/chapters/09-external...
TRANSCRIPT
9.1 INTR
The debt across reglike Pakifluctuationmacroecoanalyze dperiodic capacity oin both econcern tin debt hpast, whilthe econmanagempresent deto projecobligationcould notfiscal anmanagemin case of
The currefiscal anddeficits, hdwindlingcarried oDepreciathas causedenominaborrowingcontinues inflation bdebt. TheEconomicstability. by the gov
Chapte
RODUCTION
tolerance andgions and couistan are mons becausenomic funda
debt sustainabasis to d
of the economexternal and o debt managave caused ple imprudent nomy during
ment is requirebt levels are ct consequenns. Prudent t undermine
nd monetaryment may not f poor macroe
ent fiscal yead current ac
high inflation,g reserves wover from tion of the Red substantiaated public dg from the
to fuel incrbut also addine governmentc StabilizatioThe measurevernment hav
ED
er No. 9
N
d debt carryinuntries. Develore vulnerable of relatamentals. Thebility of suc
determine shmy. Therefore
domestic degement. Exce
problems for domestic bor
g 2007-08. red not only kept under re
nces of futdebt managethe importa
y policy. Evby itself ave
economic poli
ar carried the ccount defici, a depreciatin
were all lingthe previou
Rupee againstal rise in fodebt. On the
State Banreases not onng to the shot embarked un to regain m
es taken undeve placed the
ExterDome
ng capacity valoping countrle to economtively weakere is a need ch countries hock absorbie, developmeebt are of kessive increasPakistan in t
rrowing plaguVigilant deto ensure th
estraint, but ature repaymeement practicance of prudeven best dert any upheavicy sequencin
legacy of hiits. Large twng currency aering proble
us fiscal yet the US doloreign currene internal frok of Pakistnly in domesort-run domesupon a plan macroeconomer this prograeconomy on t
rnal aestic
ary ries mic ker to on
ing nts
key ses the ued ebt hat
also ent ces ent ebt val
ng.
igh win and ms
ear. llar ncy ont, tan stic stic
of mic am the
path toat the governand thethe last
The suis a keeffects currenthemorrarrestedthe rese
9.2 EX
Gross eamounresidenuse extdesiredavailabforeigncommikey incheavilybut docertain
The gothe reqlowest consistmanageprivateinsolveto previdentifyformul
and Debt
o recovery. Neend of ever
nment’s borroe governmentt two quarters
upport from they impetus to
of the stabilt account harhage to foreid but around erves.
XTERNAL D
external debtt of disburse
nts of a counternal debt in
d expenditurble resourcen currency ditment to stabcentive for goy is that it moing so leav
risks.
overnment maquired amoun
possible mtent with a prement poses
e sectors in thency, debt disvent such eveny the variouate strategies
t
et zero borrowry quarter puowing appetit successfullys (October-M
he Internationo this stabilizalization starteas recovered ign exchange$3.4 billion h
DEBT AND L
t at a given pd and outstan
ntry to non-ren order to filre levels a
es. Governmdebt in ordeble exchange rovernments t
minimizes currves the coun
anages its debnt of resourcedium to lorudent degree
risks for bohe form of ecostress, and fisntuality, a go
us risks to its to counter
1
wing from theut restraint oite from the y met this tararch).
nal Monetary ation processed accruing a
substantiallye reserves nothave been add
LIABILITIE
point of time nding liabilitesidents. Coull the gap betand domest
ments also er to signal rates and pricto use foreignrent interest
ntry vulnerab
bt in order toces subject t
ong-term coste of risk. Pooroth the publiconomic instabscal crisis. In overnment neets debt stockor minimize
139
e SBP on the
SBP get in
Fund s. The as the y and t only ded to
ES
is the ies of
untries tween tically
issue their
ces. A n debt costs,
ble to
o raise to the t and r debt c and bility, order
eds to k, and
these

Economic Survey 2008-09
140
risks. Risks can be classified into two main categories; market risk, and country specific risk. The stock of outstanding debt of any country is vulnerable to market risks regardless of the origin, size, average tenure, and other characteristics of the debt. Market risk is measured in terms of potential increases in debt servicing costs associated with changes in market conditions such as interest rate risk, exchange rate risk, and credit risk. Country specific factors include the economic, social, and political stability of the country, and general investor sentiment about the economy.
In addition to risk management, governments need to constantly monitor, sustain, and even enhance their debt carrying capacity. Furthermore, the borrowed resources must be utilized effectively and productively so that they generate economic activity. Prudent debt management is therefore, essential for preventing debt crisis. Empirical evidence suggests that external debt slows growth only if it crosses the threshold level of 50 percent of GDP or in net present value terms, 20-25 percent of GDP. Pakistan has experienced serious debt problems in the recent past and accordingly witnessed deterioration in the macroeconomic environment, leading to deceleration in investment rate and economic growth and the associated rise in the incidence of poverty.
The beginning of the current decade saw a sustained reduction of Pakistan’s external debt
burden. Even though total External Debt & Liabilities (EDL) was rising throughout the period, the growth of the economy was far greater than growth of the debt stock, leading to a reduction in the debt burden. In absolute terms, EDL increased from US $ 37.9 billion at end-June 2000, to $ 46.3 billion by the end of June 2008. During the same period, EDL as a percentage of GDP decreased by 24 percentage points of GDP, falling from 51.7 percent to 28.1 percent by end-June 2007 as shown in Fig-9.1. However, the last two years have seen an increase in the rate of growth of EDL, as external debt and liabilities have been increasing not only in absolute terms, but also as a percentage of some major economic indicators. This shift in momentum has highlighted the crucial role played by current account deficit and exchange rate stability on a country’s debt burden. Pakistan benefited from fiscal discipline imposed in the beginning of the decade as well as a relatively stable rupee and significant foreign inflows all of which facilitated a reduction in the debt burden. However, deterioration of these same fundamentals is responsible for the increasing debt burden seen in the last two years. Measures taken in order to steer Pakistan towards economic recovery have meant that the country’s stock of outstanding EDL has taken a hit. Entering into the International Monetary Fund Stand By Arrangement (IMF SBA) program has enabled Pakistan to shore up foreign exchange reserves and prevent the economy from any further depreciation, but it has also translated into a significant increase in outstanding external debt. Focusing on the absolute increase in the outstanding stock of EDL can be misleading for two main reasons. Firstly, the outstanding stock of debt must be analyzed in relation to the size of the economy and its repayment capacity (in terms of GDP and other macroeconomic indicators). Secondly, the absolute change in EDL neglects classification between an actual increase in stock and increases caused by fluctuations in international exchange rates.
Fig-9.1: External Debt & Liabilities (% of GDP)
2 8 . 3 2 8 .1
3 0 . 22 9 . 5
3 6 . 1
3 2 . 7
2 0 . 0
2 2 . 0
2 4 . 0
2 6 . 0
2 8 . 0
3 0 . 0
3 2 . 0
3 4 . 0
3 6 . 0
3 8 . 0
2004
2005
2006
2007
2008
2009*
* End March

141
Table-9.1: Pakistan: External Debt and Liabilities
End-June 2004 2005 2006 2007 2008 2009*
(In billions of U.S. dollars) 1. Public and Publically Guaranteed debt 29.94 31.08 32.90 35.35 40.24 40.48
A. Medium and long term(>1 year) 29.91 30.81 32.73 35.32 39.53 39.75 Paris club 13.63 13.01 12.79 12.69 13.93 13.66 Multilateral 14.35 15.36 16.82 18.69 21.58 21.84 Other bilateral 0.69 0.81 0.92 1.00 1.19 1.94 Euro bonds/Saindak Bonds 0.82 1.27 1.91 2.71 2.67 2.15 Military debt 0.20 0.19 0.13 0.08 0.04 0.01 Commercial Loans/credits 0.22 0.18 0.17 0.15 0.12 0.17
B. Short Term (<1 year) 0.02 0.27 0.17 0.03 0.71 0.73 2. Private Non-guaranteed Debt (>1 yr) 1.67 1.34 1.59 2.25 2.89 3.30 3. IMF 1.76 1.61 1.49 1.41 1.34 4.19 Total External Debt (1 through 3) 33.4 34.0 36.0 39.0 44.5 48.0
Of Which Public 31.3 32.1 33.9 36.5 40.7 43.8 4. Foreign Exchange Liabilities 2.0 1.8 1.6 1.5 1.8 2.2 Total External Debt & Liabilities (1 through 4) 35.3 35.8 37.6 40.5 46.3 50.1
(In percent of GDP) Total External Debt (1 through 3) 34.1 31.1 28.2 27.3 27.0 28.9 1. Public and Publically Guaranteed debt 30.6 28.4 25.8 24.7 24.5 24.4
A. Medium and long term(>1 year) 30.5 28.1 25.7 24.7 24.0 23.9 B. Short Term (<1 year) 0.0 0.2 0.1 0.0 0.4 0.4
3. IMF 1.8 1.5 1.2 1.0 0.8 2.5 Total External Debt 34.1 31.1 28.2 27.3 27.0 28.9 4. Foreign Exchange Liabilities 2.0 1.6 1.2 1.0 1.1 1.3 Total External Debt & Liabilities (1 through 4) 36.1 32.7 29.5 28.3 28.1 30.2 Memo: GDP (in billions of U.S. dollars) 98.0 109.5 127.4 143.0 164.4 166.1 * End March Source: State Bank of Pakistan 9.2.1 Outstanding External Debt and Liabilities
During the first nine months of the current fiscal year 2008-09, Pakistan’s total external debt increased from $ 46.3 billion at end-June 2008 to $ 50.1 billion by end-March 2009 — an increase of US $ 3.8 billion or 8.2 percent. A high and persistent current account deficit implies greater financing requirement by the economy. A global environment plagued by the economic slowdown has hampered non-debt creating inflows like FDI and in constricted availability of the non-debt creating inflows; the government has to resort to multilateral and bilateral sources for its financing requirement and thus leading to the stock of outstanding external debt. In relative terms, EDL as percentage of GDP increased from 28.1 percent at end-June 2008 to 30.2 percent by end-March 2009— an increase of 2.1 percentage points. This is the highest ever rise in a single year for almost one decade [See Table-9.1]. A significantly
depressed economic growth and massive depreciation of rupee against dollar partially explains this increase in EDL as a percentage of GDP.
The big chunk of Pakistan’s outstanding external debt is classified as public and publically guaranteed debt and accounts for 78.9 percent of the total outstanding EDL stock [See Table 9.2]. Out of the remaining amount 8.4 percent debt is owed to the IMF which is a leap forward from last year’s stake of 3.1 percent of total EDL mainly due to disbursement of the first two trenches of the Stand By Arrangement (SBA). Private non-guaranteed debt contributes 6.6 percent to the stock of EDL and another 4.3 percent contribution came from foreign exchange liabilities.

Economic Survey 2008-09
142
Table 9.2: Structure of EDL (End-March 2009) Component Percent Public and Publicly Guaranteed 78.9
Paris club 27.2 Multilateral 43.5 Other bilateral 3.9 Short Term 4.3
Private Non-Guaranteed 6.6 IMF 8.4 Foreign Exchange Liabilities 4.3 Memo: Total EDLs 100.0 * EDL: External Debt and Liabilities Source: SBP The following section highlights the developments in the various components of EDL during the first nine months of the outgoing fiscal year.
9.2.1.i Public and Publicly Guaranteed Debt
Public and publicly guaranteed debt accounts for the largest share of 78.9 percent in EDL. This component is further classified into medium to long-term debt and short term debt. During the first nine months of 2008-09, public and publicly guaranteed debt has increased by 0.6 percent or $ 233 million, rising from $ 40.2 billion at end-June 2008 to $ 40.5 billion by end-March 2009. Medium and long-term debt increased marginally by $ 54 million during the same period. Out of multilateral debt, Paris club debt registered a slight reduction of $ 273 million, and the stock of outstanding Paris club debt is currently at $ 13.6 billion. Repayment of $ 500 million on account of a Eurobond issued by the government in 2004 caused a reduction in the outstanding stock of Eurobond debt. Military debt also registered a slight decrease of $ 34 million. The stock of multilateral debt increased by $ 252 million, rising from $ 21.6 billion at the end-June 2008 to $ 2I.8 billion by end-March 2009. Short term debt increased from $ 713 million at end-June 2008 to $ 728 by end-March 2009. This increase of $ 15 million is on account of short term financing provided by the Islamic Development Bank (IDB). The first nine months of the current fiscal year have seen a very limited amount of new disbursements of Public and publicly guaranteed debt, and most of the changes in outstanding stock are due to movements in international exchange rates or disbursement from the IMF.
9.2.1.ii IMF Debt
In November 2008, Pakistan entered into a 23-month stand-by loan agreement with the IMF. The total financing approved by the IMF is approximately $ 7.6 billion. The objective of the agreement is to support the stabilization program of the government. The first tranche of $ 3.1 billion was released in November 2008, and after a successful first review of the program, a second tranche of approximately $ 847 million was disbursed by the end of March 2009. In the absence of non-debt creating inflows the SBA has provided much needed funds required to stabilize the economy by bridging the financing gap. However, the financing provided by the IMF is also the major reason behind the increase in the stock of outstanding EDL. Between June 2008 and March 2009, the outstanding IMF debt stock piled up from $ 1.34 billion to $ 4.19 billion. This implies a whopping net addition of $ 2.85 billion. The increase in the stock of IMF debt is responsible for 78 percent of the total increase in outstanding EDLs.
9.2.1.iii Private non-guaranteed debt and Foreign Exchange Liabilities
The share of private non-guaranteed debt in Pakistan’s total EDLs has historically been very small. Continuing with this trend, private non-guaranteed debt accounted for 6.9 percent of the outstanding stock of EDL by March 2009. The stock of private non-guaranteed debt increased by $ 412 million; rising from $ 2.89 billion in June 2008 to $3.3 billion by end-March 2009. This category consists of private non-guaranteed loans worth $ 3 billion and non-guaranteed private sector bonds worth $ 275 million.
9.2.1.iv Foreign exchange liabilities are persistently declining since 1999 but witnessed a slight increase in 2008-09 on account of higher level of Central Bank Deposits received from friendly countries which are increasing for a second consecutive year. The outstanding stock of foreign exchange liabilities increased from $ 1.8 billion at end-June 2008 to $ 2.2 billion by end-March 2009. The increase is solely because of receipt of $ 500 million from China in the Central Bank Deposits. The rise in Central Bank Deposits

External Debt and Liabilities
143
has more than offset a decrease in Special $ Bonds and Foreign Currency Bonds. Foreign exchange liabilities now account for 4.3 percent of total EDL as compared to a share of 3.9 percent in 2007-08.
9.3 Composition of Foreign Economic Assistance
The total amount of foreign economic assistance received in the first nine months of 2008-09 stood at $ 7,193 million. The composition of this assistance is as follows:
9.3.i Commitments
The commitments of foreign economic assistance were $3,570 million during 2007-08, while during the first nine months of the current fiscal year i.e., July-March 2008-09, total commitments amounted to $3,896 million. About 45.4 percent of the total commitments during July-March 2008-09 were in the shape of project aid and 54.6 percent non-project aid. The share of BOP/budgetary support in total non-project aid was 90 percent, Non-food (5 percent) and Afghan Refugees & earthquake relief assistance (4 percent).
9.3.ii Disbursements
Disbursement of foreign economic assistance during 2007-08 stood at $3,580 million but decreased to $3,297 million during July-March, 2008–09. During this period, disbursement for the project aid amounted to $ 623 million or about 18.9 percent of the total disbursements. An amount of $2,674 million was disbursed for non-project aid, claiming about 81.1 percent of total disbursements, comprising $ 308 million for Non-Food aid, $2,306 million for BOP/budgetary support and $59 million for Afghan Refugees & earthquake relief assistance.
9.3.iii Sources of Aid
The major sources of foreign economic assistance to Pakistan are Bilateral and Multilateral donors. Bilateral sources provided 37.8 percent during 2007-08 and multilateral 62.2 percent of the total commitments. Contribution of bilateral and multilateral sources was 25.1 percent and 74.9 percent of total commitments, respectively during July-March 2008-09. An amount of $735.9 million was disbursed from the bilateral sources and
$2,844.6 million from multilateral sources during 2007-08. Disbursement from the bilateral and multilateral sources amounted to $981.5 million and $2,315.8 million, respectively during July-March, 2008-09.
9.3.iv Project Vs Non-Project Aid
There has been a significant change in the pattern of commitments for the project and non-project aid. The share of project aid was 55.6 percent during 2007-08 which reduced to 45.4 percent by July-March 2008-09. The share of project aid in the total commitments has declined as compared to non-project aid after 1990’s. Project aid was 71.5 percent and 71.7percent during the1980’s and the 1990’s respectively, compared to 42.8 percent during 2001-09.
9.3.v Grants and Loans
The composition of foreign economic assistance has considerably changed over the years from grants and grant-like assistance to hard-term loans. The share of grants and grant-like foreign assistance in total commitments dropped from 80 percent during the First Five Year Plan (1955-60) to 9 percent only during the year 2000-01. It, however, surged again to 20 percent of total foreign aid contracted during 2001-02 but declined to 10.6 percent in July-March 2008-09
9.3.vi Debt Servicing during 2008-09
Debt inflows are useful in supporting a country’s balance of payments position and financing current account deficits. However, they pose an obligation to make payments in the future, thus producing a strain on the economy. The annual debt servicing payments made during the period 1999-2000 to 2003-04 on average hovered around $ 5 billion per annum. Owing largely to a combination of re-profiling of Paris Club bilateral debt on a long-term horizon, the substantial write-off of the US bilateral debt stock, the prepayment of expensive debt and the relative shift in contracting new loans on concessional terms, this amount was drastically reduced to around $ 3 billion by 2007-08. As the debt burden of an economy rises, so do the obligations to make debt service payments. An amount of $ 3.65 billion has been paid during July-March 2008-09 which implies an increase of $ 650

Economic Survey 2008-09
144
million in one year. Out of this amount, $ 2.83 billion was paid on account of repayment of principal amounts. A significant proportion of this increase is due to repayment of Eurobond amounting to $ 500 million made in February 2009 while $ 818 million were paid on account of interest payments. The amount rolled over increased from $ 1.2 billion in 2007-08 to $ 1.65 billion in July-March 2008-09 [See Table 9.3]
Table-9.3: Pakistan’s External Debt and Liabilities Servicing
($ Million)
Years Actual
Amount Paid
Amount Rolled Over
Total
1999-00 3756 4081 7837 2000-01 5101 2795 7896 2001-02 6327 2243 8570 2002-03 4349 1908 6257 2003-04 5274 1300 6574 2004-05 2965 1300 4265 2005-06 3115 1300 4415 2006-07 2977 1300 4277 2007-08 3161 1200 4361 2008-09* 3654 1650 5304 * July-March Source: State Bank of Pakistan 9.4 External Debt Sustainability
The idea of debt sustainability links the debt stock of a country to its repayment ability as gauged by various macroeconomic indicators. The difference between the total financing needs on the balance of payments and the projected capital inflows is known as the financing gap. In crude terms, if the financing gap is approaching zero in the long-term, debt is considered to be sustainable. Whereas if a financing gap exists, it can be filled by resorting to additional borrowing, rescheduling and debt reduction, or by accumulating arrears. Such measures lead to an escalating debt burden and eventual un-sustainability of debt.
In order to ensure sustainability, developing countries can place limits on debt obligations, given the level of capital inflows. These limits are set by assigning threshold levels to the debt stock as a ratio of economic indicators that represent the repayment capacity of the economy, such as GDP, foreign exchange reserves and foreign exchange earnings. Calculation of these indicators and subsequent comparison with international
thresholds provides insight into a country’s debt position. They can be used to monitor the sustainability of debt as well as an early warning system for debt distress and sustainability issues. The indicators can be divided into two groups, nominal indicators which are useful in analyzing the debt position at any given time as well as historical trends, and present value indicators which are useful in measuring current and future debt payments. By using present value indicators, it is possible to analyze future debt obligations in current terms, and project the impact they will have on the country’s debt burden and sustainability.
Table-9.4: External Debt Sustainability Indicators
Year EDL/ GDP EDL/ FEE EDL/ FER STD/EDL(Percent) Ratio (Percent)
FY00 51.7 297.2 19.3 3.2 FY01 52.1 259.5 11.5 3.7 FY02 50.9 236.8 5.8 1.4 FY03 43.1 181.2 3.3 1.2 FY04 36.7 165.0 3.0 0.6 FY05 32.7 134.3 2.7 0.8 FY06 29.4 121.6 2.9 0.4 FY07 28.3 122.6 3.0 0.1 FY08 28.1 124.3 4.2 1.5 FY09* 30.2 144.3 5.1 1.5
Source: EA Wing and SBP Bulletins* End March 2009 EDL: External Debt and Liabilities, FEE: Foreing Exchange Earnings, FER: Foreign Exchange Reserves, STD: Short-term Debt. Most of the indicators of Pakistan’s debt have been exhibiting a declining trend since 2001-02 onwards, with a trivial u-turn in the most difficult year of recent economic history i.e. 2007-08, especially indicators that analyze debt in relation to foreign exchange reserves. Due to sustainable debt policies and favorable rescheduling of debt, external debt and liabilities (EDL) as a percentage of GDP declined from 51.7 percent in end-June 2000 to 28.3 percent by the end of June 2007; a decline of 23.4 percentage points. Substantial external debt inflows in 2007-08, magnified by depreciation of the US dollar caused EDL to remain at 28.1 percent of GDP in the previous fiscal year. By end-March 2009, EDL as a percent of GDP stood at 30.2 percent, increasing by 2.1 percentage points.

External Debt and Liabilities
145
EDL as a percentage of Foreign Exchange Earnings (FEE) gives a measure of a country’s debt repayment capacity by comparing levels of external debt to the sum of exports, services receipts, and private unrequited transfers. EDL as a percent of FEE stood at 297.2 percent by the end of 1999-2000, and witnessed a sustained decline till end-June 2006 where it reached 121.6 percent; a reduction of 60 percentage points in 6 years. The pendulum swung to other side and EDL in relation to FEE surged gradually in 2006-07 and 2007-08 with EDL increased to 122.6 percent by end-June 2007 and further to 124.3 percent by end-June 2008. The abrupt rise came in the period July-March 2008-09, when it escalated to 144.3 percent mainly because of very weak growth in foreign exchange earnings and substantially higher net debt inflows. The deterioration of this ratio suggests that Pakistan’s stock of external debt and liabilities is growing at a faster rate than its foreign exchange earnings [See Table 9.4].
As a proportion of Foreign Exchange Reserves (FER), EDL witnessed a sustained decrease from 1750 percent in 1999-2000 to 267.5 percent by end-June 2006-07. The improvement of this ratio was due to a reduction in the stock of external debt from 1999-2000 to 2003-04 coupled with a significant increase in reserves. However, EDL as a percentage of FER has increased from 267.5 percent by the end of 2006-07 to 407.3 percent in 2007-08 and further to 510 percent by end-March 2009. This increase in debt as a ratio of foreign
exchange reserves can be primarily attributed to a sharp decline in the latter rather than an increase in the stock of debt. Even though financing provided by the IMF has assisted in stabilizing Pakistan’s reserve position, foreign exchange reserves are significantly lower than 2007-08 while the stock of debt has been increasing at considerable pace. Regardless of the origins of the increase, it must be taken as a warning sign. Given the current domestic and international financial environment, any sustained increase in debt of the magnitude observed during 2007-08 and 2008-09 needs to be in conjunction with a growth of reserves which guarantees the country’s capacity to repay the debt. Failure to match further increases in debt stock with higher reserves will bring Pakistan’s level of external debt close to unsustainable levels.
Pakistan’s level of Short Term Debt (STD) as a percentage of EDL has historically been lower than most other developing countries. The previous fiscal year 2007-08 has seen an increase in STD as a percentage of EDL to 1.5 percent as compared to historical value of around 0.5 percent. This was due to an increase of $ 688 million in short-term financing provided by the Islamic Development Bank. STD-to-EDL ratio remains unchanged for the first nine months of 2008-09. STD as a percentage of FER stood at 6.9 percent in March 2009 as against 6.2 percent at end-June 2008. This sustained increase is mostly due to a drawdown of reserves as increase in short term debt (short-term financing provided by the IDB) has been marginal.
Debt service as a percentage of GDP measures the extent to which a country’s output is absorbed by payment of interest and principal on debt obligations. This ratio has been steadily declining, with the exception of 2003-04 where larger than usual repayments including a $ 1.17 billion repaid to the Asian Development Bank (ADB) caused the ratio to increase from 5.2 percent to 5.4 percent of GDP for the past five years. Debt Service-to-GDP ratio declined from 8.6 percent in 2001-02 to 1.9 percent by 2007-08. However, it reached 2.1 percent of GDP during July-March 2008-09. This slight increase can be attributed to repayment of $
Fig-9.2: EDL as % of Foreign Exchange Earnings
10 0
12 5
15 0
17 5
2 0 0
2 2 5
2 5 0
2 7 5
3 0 0
* End March

Economic Survey 2008-09
146
500 million Eurobond in February 2009. As a percentage of FER, debt service declined from 173.8 percent of FER in 1999-2000 to 19.7 percent of FER by 2006-07, but registered an increase to 26.7 percent of FER in 2007-08. This ratio has significantly increased to 34.7 percent in the first nine months of 2008-09 due to depletion of foreign exchange reserves and higher debt service payments. An increasing ratio implies a growing strain on the economy’s resources to make payments on its debt obligations. Keeping in mind the maturity profile of additions to the debt stock, the foreign exchange reserve position of Pakistan needs to be strengthened in order to prevent repayment difficulties in the future.
9.5 Pakistan’s Link with International Capital Market
The crisis gripping financial markets worldwide has meant that capital flows have all but dried up. As uncertainty about risk prevails and investors look to shore up their losses, capital flows to emerging markets have been curtailed. Sovereigns have, in most cases, been deterred from new issuances by market sentiment and the increase in costs. Global bond issuances in 2008 totaled $ 106 billion as compared to $ 184 billion in the previous year. Sovereign issuances in Asia are also down by 40 percent as Asian countries have been forced to seek alternative methods of financing. Spreads on emerging market sovereign bonds have also widened substantially, making access to financing through capital markets, if available at all, very costly. The Emerging Market Bond Index, a benchmark index for measuring the total return performance of international government bonds issued by emerging market countries, has increased by 400 bps in one year, implying an increase in costs for tapping international debt capital markets. As negative sentiments prevail, the situation for Pakistan is compounded by weaker economic performance in 2008-09 and a highly volatile domestic security situation. The spread on Pakistani sovereign bonds as given by the EMBI have gone up by 1550 bps and have a rating of B3/CCC+. Given the severity of the crisis in international markets, and hesitance with respect to investor confidence, Pakistan has not issued any new instruments in 2008-09. However, following
the government’s stabilization program and a restoration of economic fundamentals, signs of recovery are visible, just as the global economy has exhibited momentum in the revival process. The government plans to continue to tap the global capital markets, when conditions are more favorable, with the aim of establishing a benchmark for Pakistan and to assure global investors of Pakistan’s commitment to the development of its capital market. By regaining investor confidence and being active in international debt capital markets, spreads on Pakistani paper can be narrowed, providing the government with greater financing options.
9.5.i Recent Performance of 2017 and 2036 Eurobonds
In line with developments in global debt capital markets, Pakistan has witnessed an increase in spreads on its 2016, 2017 and 2036 Eurobonds in the first nine months of FY09. Though some stability has been regained due to initiatives taken by the government and financing provided by the IMF, it has not been enough to overcome the negative sentiment surrounding markets in general and the socio-political risk associated with Pakistan. In the absence of a credit rating upgrade for Pakistan, as compared to the issue spread of UST + 200bps, the 2017 bond is trading currently at a spread of UST +1504 bps, with the spread widening by 875 bps since 2007-08 [Table 9.5].
The 2036 bond, as compared to the issue spread of UST + 302bps and a spread of 507 bps last year, is trading currently at a spread of UST + 1361 bps. The 2036 bond was the longest ever tenor achieved by Pakistan. Both the 10 and 30 year offerings were debut offerings for Pakistan which extended the yield curve to 30 years in just 2 years. Most emerging market sovereign issuers have taken longer time to extend their yield curve from 5 to 30 years. It took Philippines 4 years and Brazil and Turkey 3 years to lengthen their yield curve to 30 years.

147
Table-9.5: Selected Secondary Market Benchmarks (as of May 2009)
Issuer Ratings (Moody’s/S&P) Details (Coupon/Maturity) Spread over UST
(bps) Bid - Yield (%)
Pakistan B3/CCC+ 7.125%/Oct 2016 +1519 18.360 Pakistan B3/CCC+ 6.875%/Jan 2017 +1504 18.210 Pakistan B3/CCC+ 7.875%/Jun 2036 +1361 17.720 Colombia Ba1/BBB- 7.375%/Jan 2017 +461 6.08 Turkey Ba3/BB- 7.000%/Sept2016 423 6.61 Indonesia Ba3/BB- 6.875%/Mar 2017 411 8.03 Venezuela B2/BB- 8.500%/Oct 2014 639 17.45
Source: Bloomberg 9.5.ii Repayment of 2009 Eurobond
On the 19th of February 2009, the Government of Pakistan successfully repaid the maturing $ 500 million eurobond as well as $17 million on account of interest payments. This successful payment laid to rest any fears of Pakistan debt repayment capacity, and shored up investor confidence about Pakistan’s ability to successfully manage its outstanding external debt obligations. The ability to make successful repayments even under adverse conditions both domestically and in international markets is testament to the resilience of the Pakistani economy.
9.6 PUBLIC DEBT
Public debt refers to all debt owed directly by the government originating from domestic and external sources. It consists of debt denominated in Rupees as well as foreign currency. Public debt is directly linked to the government’s fiscal operations through the domestic component. The gap between a government’s resources, i.e. tax and non-tax revenues, and its expenditure is mostly financed by mobilizing domestic debt instruments. The external position of an economy also influences the stock of public debt outstanding. External debt creating inflows acquired to finance current account deficits are reflected in the foreign currency component of public debt.
Management of public debt poses policymakers with key challenges and trade-offs. Debt is an essential tool in ensuring required levels of investment and expenditure on programs aimed at boosting productivity, economic growth, economic and social development, and the alleviation of poverty. However, accruing an excessive amount of debt has dire consequences for any economy not
least of which is the future obligation to make repayments. Increases in public debt can lead to inflationary pressures on the economy if the source of the increase is domestic borrowing. Excessive public sector borrowing may squeeze available credit in the economy and have a crowding out effect on the private sector which may lead to a fall in productivity. Additionally, increasing proportions of government resources directed towards debt servicing in the future hinder allocation of funds to other sectors of the economy.
Prudent management of public debt requires that fiscal operations be carefully planned, placing a limit on present and future fiscal deficits in order to reduce borrowing requirements. Similarly, non-debt creating foreign inflows need to be encouraged to keep the foreign currency component of public debt in check. Additionally, exchange rate stability is crucial as depreciation of domestic currency increases the foreign currency component of public debt significantly.
In the midst of the financial crisis and global economic slowdown, public debt burdens of most countries have been increasing at a rapid pace. Slowdown in economic activity has reduced the amount of funds available on the one hand, while unprecedented fiscal stimuli and recovery packages have increased government expenditures exponentially on the other. According to a recent study by the IMF, “The increase in government debt ratios will be even more sizable. The debt-to-GDP ratio of advanced countries is expected to rise by 14½ percentage points over 2008–09, the most pronounced upturn in the last few decades. The one-year increase in government debt in 2009 is twice as large as that experienced during the 1993 recession. A third of this increase is due to
Economic
148
financial for the avshows a 2002.” Tadvanced current cexpenditu
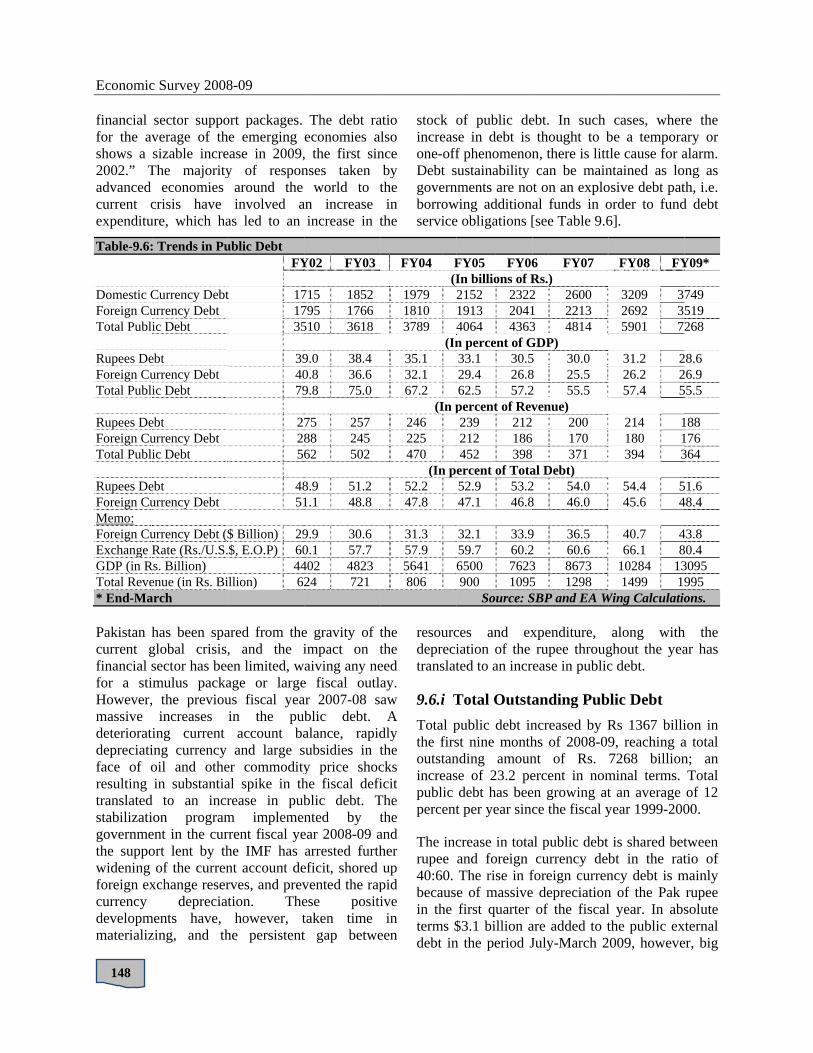
Table-9.6:
Domestic CForeign CuTotal Publi Rupees DeForeign CuTotal Publi Rupees DeForeign CuTotal Publi Rupees DeForeign CuMemo: Foreign CuExchange RGDP (in RTotal Reve* End-Ma Pakistan hcurrent gfinancial sfor a stiHowever,massive deterioratdepreciatiface of oresulting translatedstabilizatigovernmethe suppowidening foreign excurrency developmmaterializ
c Survey 2008
sector suppoverage of thsizable incre
The majorityeconomies
crisis have ure, which ha
: Trends in Pu
Currency Debturrency Debt ic Debt
ebt urrency Debt ic Debt
ebt urrency Debt ic Debt
ebt urrency Debt
urrency Debt ($Rate (Rs./U.S.
Rs. Billion) enue (in Rs. Biarch
has been spaglobal crisis,sector has beeimulus packa, the previou
increases ing current ing currency oil and othein substantia
d to an incrion programent in the curort lent by th
of the currenxchange reser
depreciatments have, zing, and th
8-09
ort packages. e emerging
ease in 2009,y of respon
around the involved a
as led to an
ublic Debt FY
t 171735
394079
27256
4851
$ Billion) 29$, E.O.P) 60
44llion) 62
ared from the, and the ien limited, wage or largeus fiscal yeain the pub
account baand large s
er commodityal spike in threase in pubm implemenrrent fiscal yehe IMF has nt account derves, and prevtion. Thehowever, t
he persistent
The debt raeconomies a, the first sinnses taken
world to tan increase
increase in t
Y02 FY03
715 1852 795 1766 510 3618
9.0 38.4 0.8 36.6 9.8 75.0
75 257 88 245 62 502
8.9 51.2 1.1 48.8
9.9 30.6 0.1 57.7 402 4823 24 721
e gravity of timpact on taiving any ne
e fiscal outlar 2007-08 sblic debt. alance, rapidsubsidies in ty price shoche fiscal defiblic debt. Tnted by t
ear 2008-09 aarrested furth
eficit, shored vented the rapese posititaken time t gap betwe
atio lso nce by the in
the
stock oincreasone-offDebt sgovernborrowservice
FY04 F(I
1979 1810 3789
(In35.1 32.1 67.2
(In p246 225 470
(In p52.2 47.8
31.3 57.9 5641 806
the the eed ay. aw A
dly the cks icit
The the and her up
pid ive in
een
resourcdeprecitranslat
9.6.i TTotal pthe firsoutstanincreaspublic percent
The incrupee 40:60. becausin the terms $debt in
of public dese in debt is f phenomenonsustainability nments are nowing additione obligations [
FY05 FY06In billions of R2152 23221913 20414064 4363n percent of G33.1 30.529.4 26.862.5 57.2percent of Rev239 212212 186452 398ercent of Tota52.9 53.247.1 46.8
32.1 33.959.7 60.26500 7623900 1095
Source: S
ces and exiation of the ted to an incr
Total Outstapublic debt inst nine monthnding amounse of 23.2 pedebt has beet per year sinc
crease in totaand foreign The rise in fe of massivefirst quarter
$3.1 billion an the period J
ebt. In such thought to b
n, there is littcan be maint on an exploal funds in o[see Table 9.6
6 FY07 Rs.) 2 2600 1 2213 3 4814 GDP) 5 30.0 8 25.5 2 55.5 venue) 200 170 371 al Debt) 2 54.0 8 46.0
9 36.5 2 60.6 3 8673 5 1298 SBP and EA W
xpenditure, rupee throug
rease in public
anding Pubncreased by Rhs of 2008-09nt of Rs. ercent in nomen growing atce the fiscal y
al public debt currency deb
foreign currene depreciation
of the fiscalare added to tJuly-March 2
cases, wherbe a temporatle cause for antained as loosive debt patorder to fund6].
FY08 FY
3209 32692 35901 72
31.2 226.2 257.4 5
214 1180 1394 3
54.4 545.6 4
40.7 466.1 8
10284 131499 1
Wing Calculatio
along withghout the yeac debt.
blic Debt Rs 1367 billi9, reaching a7268 billion
minal terms. t an average year 1999-200
is shared betbt in the ratncy debt is mn of the Pak l year. In absthe public ex
2009, howeve
re the ary or alarm. ng as
th, i.e. d debt
Y09*
749 519 268
28.6 26.9 55.5
188 176 364
51.6 48.4
43.8 80.4 3095 995 ons.
h the ar has
ion in a total n; an Total of 12 00.
tween tio of
mainly rupee solute
xternal er, big

External Debt and Liabilities
149
chunk of Rs. 246 billion has come from depreciation. In the first nine months of 2008-09, the depreciation of the rupee against the dollar has been responsible for approximately 18 percent addition to total increase in public debt and 30 percent to public external component. The rupee has lost 20 percent of its value against the dollar in just nine months.
The structure of public debt has also experienced subtle changes since 2001-02. The focus has been shifted more towards domestic borrowings which inched up its share from 48.9 percent in 2001-02 to 54.4 percent in 2007-08. The massive borrowing from the SBP has not only fueled inflationary pressures in the economy but also responsible for fiscal indiscipline resulting in dire consequences for debt management. The government has placed a restraint of net zero quarterly borrowing from the State Bank of Pakistan (SBP).
9.6.ii Dynamics of Public Debt Burden
In order to view debt burden in relation to the resources of an economy and the government, it is useful to analyze the debt burden in the context of other macroeconomic indicators. Changes in the public debt burden of an economy are influenced by the cost associated with borrowing funds, the rate of inflation, and the real growth rates of pubic debt and government revenues. Periods of higher cost of borrowing coupled with higher growth rates of public debt in periods where growth of revenues was relatively stagnant have yielded an increase in the public debt burden.
A look at some of the main factors behind the surge in public debt over the last two decades reveals some important structural follies. The rise appears to be largely contributed by the high real cost of borrowing and stagnant government revenue. Total public debt consists of debt payable in rupees and debt payable in foreign exchange. The real cost of borrowing for these two components of public debt is measured differently. [as shown in Table-9.7], the real cost of Pakistan’s domestic debt has varied substantially over time. The inflation is a crucial component in the determinant of real cost of borrowing while depreciation affects positively to real cost of borrowing on external debt. During the first five years of the decade (2000-05), the real cost of borrowing for domestic debt was 4. 2 percent owing to lower inflation but in the last four years (2005-09) the real cost of borrowing declined to negative 0.3 percent partly due to rising inflationary pressures in the economy as well as the declining nominal cost of borrowing.
Table 9.7: Real Cost of Borrowing (Percent)
External
Debt Domestic
Debt Public Debt
1980s 3.4 1.0 2.3 1990s 2.7 3.2 2.9 1990-I -3.0 -1.9 -2.4 1990-II -5.5 5.7 5.6 2000-05 0.2 4.2 2.9 2005-2009* -2.7 -0.3 -0.9
Source: EA Wing calculations * Jul. 2005 - end Mar. 2009
During the first five years of the current decade (2000-05), the real cost of borrowing for foreign exchange denominated loan increased to 0.2 percent mainly because of lower inflation and rupee appreciation. However, it turned to negative 2.7 percent in the last four years (2005-09). During 2004-09, the depreciation of rupee along-with higher inflation contributed to negative incidence of real cost of borrowing. The low implied cost of external borrowing has contributed to overall declining trend in real cost of borrowing during the last nine years.
79.875.0
67.262.5
57.2 55.5 57.4 55.5
40
50
60
70
80
90
FY02 FY03 FY04 FY05 FY06 FY07 FY08 FY09*
(In pe
cent
of G
DP)
Years
Figure-9.3: Publich Debt (In percent of GDP)
* End March

Economic Survey 2008-09
150
As a result of the sharp fluctuation in the real cost of borrowing for both domestic and foreign debt, the dynamics of the growth in public debt also changed over the last two decades. The changing dynamics of public debt is well-documented in Table-9.8. The economy generated primary fiscal surplus in the first five years (2000-05) owing to lower interest payments in the period. However, it turned into deficit in the period (2005-09). The encouraging thing is that during 2008-09, the economy is going to generate modest primary surplus of 0.5 percent of GDP. The real growth of debt registered an increase of 0.3 percent in 2000-05 which accelerated to 1.4 percent in 2005-09. The revenues kept healthy average growth rate of 5.8 and 5.9 percent in these two time periods. The combined effect of healthy growth in revenues and modest growth in real debt growth resulted in a sharp decline in the country’s debt burden during the last nine years. In order to assess the cost of
borrowing, an implied interest rate is calculated as interest payments in 2007-08 divided by the stock at the end of previous financial year. In the 2007-08 the real revenue witnessed modest growth of 2.5 percent against 5.5 percent real growth in public debt. Both revenue and public debt grew fractionally by 0.4 and 0.7 percent in 2008-09. An analysis of the dynamics of the public debt burden provides useful lessons for policy-makers to manage the country’s public debt. First, every effort should be made to maintain a primary surplus in the budget. Second, the interest rate and inflation environment should remain benign. Third, the pace of revenue growth must continue to rise to increase the debt carrying capacity of the country. Center to all these lessons is the pursuance of prudent monetary, fiscal and exchange rate policies which are complementary in nature for prudent debt management in any country.
Table-9.8: Dynamics of Public Debt Burden
Primary Fiscal Balance
Real Cost of Borrowing
Real Growth of Debt
Real Growth of Revenues
Real Growth of Debt Burden
(Percent of GDP) (Percent per year) 1980s -3.7 2.3 10.6 7.6 3.0 1990s -0.3 2.9 4.9 2.9 2.0 1990-I -1.8 -2.4 3.6 3.2 0.4 1990-II 1.1 5.6 6.2 2.5 3.7 2000-05 1.0 2.9 0.3 5.8 -5.5 2005-09* -1.1 -0.9 1.4 4.9 -4.5
Source: EA Wing calculations* Jul. 2005 - end Mar 2009.
In order for the public debt to GDP ratio to increase, the growth in public debt needs to exceed the nominal growth of GDP. This implies that inflation is a key factor in determining the movements of this ratio. If the price level is high, nominal GDP is inflated, and the accumulation of debt is outpaced by the nominal growth rate of GDP. In inflationary times, real interest rates are also lower, leading to a further reduction in the debt burden. For 2008-09, the nominal growth rate of GDP has been 28 percent, whereas growth in the stock of public debt was 16.5 percent, leading to a reduction in the public debt-to-GDP ratio by 1.9 percentage points.
9.7 Domestic Debt
Domestic debt has always been fundamental part of a government’s borrowing strategy. A government faces an inter-temporal trade-off between short-term and long-term costs that should be managed carefully. Excessive reliance on short-term paper may leave a government vulnerable to volatile debt service costs in the event of rising interest rates, and the risk of default in case a government cannot roll over its debts at any cost. It may also constrain the central bank from raising interest rates to address inflation or support the exchange rate because of concerns about the short-term impact on the government’s financial

External Debt and Liabilities
151
position. As in the case of Pakistan the SBP exercises its independence and hiked the interest rates several times which proved too costly for servicing debt. On the other hand, over reliance on longer-term fixed rate financing also carries risks, because it tempts governments to deflate the value of such debt in real terms by initiating surprise inflation. The government in the current fiscal year benefited from enormous surge in inflation as debt-to-GDP ratio went down instead of absolute nominal borrowing of just below half a trillion.
Over the medium term, a strategy for developing the market for government securities can relieve constraints and permit the issuance of a less risky debt structure, and this should be reflected in the overall debt management strategy. In the 2007-08, the failure of the debt management compelled to borrow excessively from the SBP. The diversification of domestic debt may also lessen pressure on external borrowing as well. In this context, gradual increases in the maturity of new fixed rate domestic currency debt issues may raise cost in the short run, but they reduce rollover risk and often constitute important steps in developing domestic debt markets.
In Pakistan, borrowing from domestic and external sources account for almost same stake in overall debt. In fact, government has increasingly focused on the domestic part over the last few years. This tendency is portrayed by a growing contribution of domestic debt mainly because of non-availability of the external financing. The outstanding stock of domestic debt accounts for 51.6 percent of total public debt by end-March 2008-09.
9.7.1 Outstanding Domestic Debt
The total domestic debt is positioned at Rs 3758.6 billion at end-March 2009 which implies net addition of Rs.541.4 billion in the nine months of the current fiscal year. In relation to GDP the domestic debt stood at 28.7 percent of GDP which is lower than end-June 2008 level at 31.3 percent. The domestic debt grew by 16.8 percent which lower than last years’ growth of 23.3 percent. The increase in domestic debt is lower than nominal GDP growth which helped reduction of 2.6
percentage points of GDP and augurs well in order to foster private investment, maintain fiscal sustainability and ultimately promote economic growth.
The composition of major components shaping the domestic debt portfolio has undergone a complete transformation from a high dominance of unfunded debt to an increasing dependence on floating component of domestic debt. Since 2004, the unfunded category comprising about 45 percent of the aggregate debt stock has declined to 31.2 percent of the total. The share of permanent debt has also decreased over the same period and it stood at 17.1 percent by end-March 2009 (See Fig -9.4). Contrary to this, the share of floating debt increased by a whopping 26.2 percentage points in the period 2004 to March 2009. A detailed explanation of each section follows:
9.7.1.i Permanent Debt
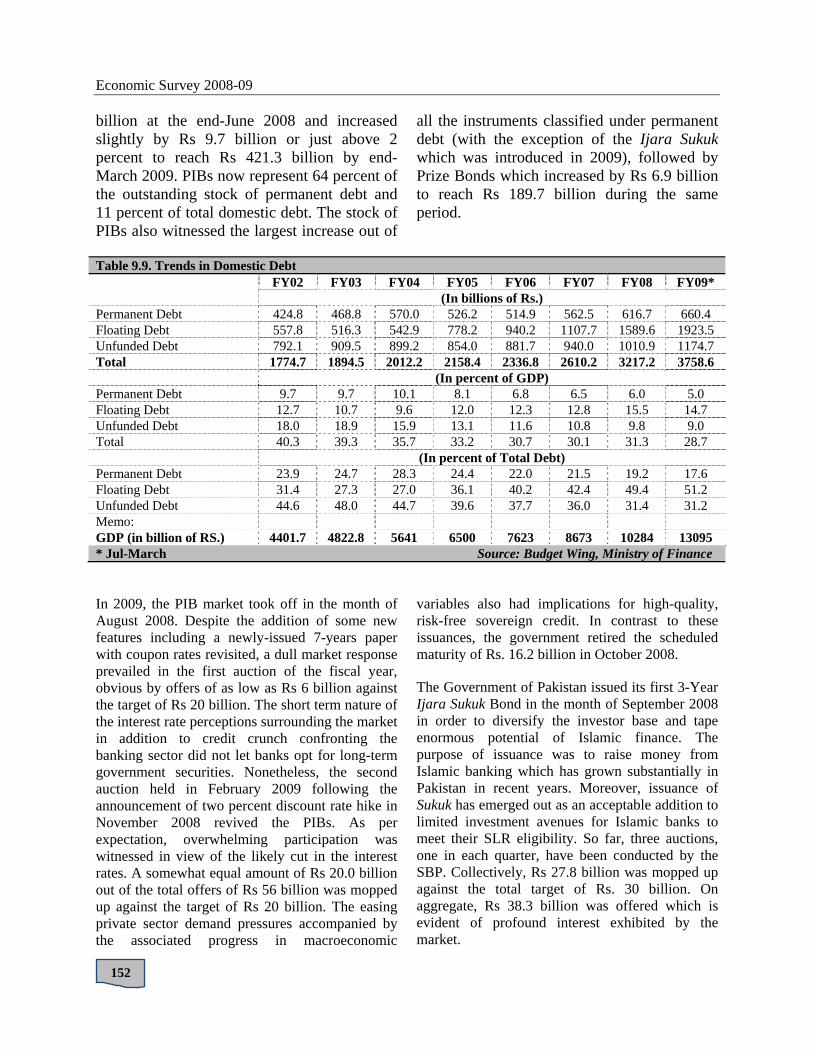
The stock of permanent debt consists of various medium to long term instruments at the government’s disposal outside the National Savings Scheme. These include Pakistan Investment Bonds (PIBs), Prize Bonds, and Ijara Sukuk apart from such discontinued schemes as Federal Investment Bonds. At the end of March 2009, permanent debt stood at Rs 660.4 billion, exhibiting an increase of Rs. 43.7 billion or 7.1 percent up from the previous fiscal year [See Table-9.9].
A large volume of the government’s permanent debt originates from PIBs. The outstanding stock of PIBs stood at Rs 411.6
15
25
35
45
55
FY02
FY03
FY04
FY05
FY06
FY07
FY08
FY09*
(In
perc
ent)
Financal Year
Figure-9.4: Structure of Domestic Debt(In percent of total domestic debt)
Unfunded Debt
Permanent Debt
Floating Debt
Economic Survey 2008-09
152
billion at the end-June 2008 and increased slightly by Rs 9.7 billion or just above 2 percent to reach Rs 421.3 billion by end-March 2009. PIBs now represent 64 percent of the outstanding stock of permanent debt and 11 percent of total domestic debt. The stock of PIBs also witnessed the largest increase out of
all the instruments classified under permanent debt (with the exception of the Ijara Sukuk which was introduced in 2009), followed by Prize Bonds which increased by Rs 6.9 billion to reach Rs 189.7 billion during the same period.
Table 9.9. Trends in Domestic Debt
FY02 FY03 FY04 FY05 FY06 FY07 FY08 FY09*
(In billions of Rs.) Permanent Debt 424.8 468.8 570.0 526.2 514.9 562.5 616.7 660.4 Floating Debt 557.8 516.3 542.9 778.2 940.2 1107.7 1589.6 1923.5 Unfunded Debt 792.1 909.5 899.2 854.0 881.7 940.0 1010.9 1174.7 Total 1774.7 1894.5 2012.2 2158.4 2336.8 2610.2 3217.2 3758.6
(In percent of GDP) Permanent Debt 9.7 9.7 10.1 8.1 6.8 6.5 6.0 5.0 Floating Debt 12.7 10.7 9.6 12.0 12.3 12.8 15.5 14.7 Unfunded Debt 18.0 18.9 15.9 13.1 11.6 10.8 9.8 9.0 Total 40.3 39.3 35.7 33.2 30.7 30.1 31.3 28.7
(In percent of Total Debt) Permanent Debt 23.9 24.7 28.3 24.4 22.0 21.5 19.2 17.6 Floating Debt 31.4 27.3 27.0 36.1 40.2 42.4 49.4 51.2 Unfunded Debt 44.6 48.0 44.7 39.6 37.7 36.0 31.4 31.2 Memo: GDP (in billion of RS.) 4401.7 4822.8 5641 6500 7623 8673 10284 13095 * Jul-March Source: Budget Wing, Ministry of Finance
In 2009, the PIB market took off in the month of August 2008. Despite the addition of some new features including a newly-issued 7-years paper with coupon rates revisited, a dull market response prevailed in the first auction of the fiscal year, obvious by offers of as low as Rs 6 billion against the target of Rs 20 billion. The short term nature of the interest rate perceptions surrounding the market in addition to credit crunch confronting the banking sector did not let banks opt for long-term government securities. Nonetheless, the second auction held in February 2009 following the announcement of two percent discount rate hike in November 2008 revived the PIBs. As per expectation, overwhelming participation was witnessed in view of the likely cut in the interest rates. A somewhat equal amount of Rs 20.0 billion out of the total offers of Rs 56 billion was mopped up against the target of Rs 20 billion. The easing private sector demand pressures accompanied by the associated progress in macroeconomic
variables also had implications for high-quality, risk-free sovereign credit. In contrast to these issuances, the government retired the scheduled maturity of Rs. 16.2 billion in October 2008.
The Government of Pakistan issued its first 3-Year Ijara Sukuk Bond in the month of September 2008 in order to diversify the investor base and tape enormous potential of Islamic finance. The purpose of issuance was to raise money from Islamic banking which has grown substantially in Pakistan in recent years. Moreover, issuance of Sukuk has emerged out as an acceptable addition to limited investment avenues for Islamic banks to meet their SLR eligibility. So far, three auctions, one in each quarter, have been conducted by the SBP. Collectively, Rs 27.8 billion was mopped up against the total target of Rs. 30 billion. On aggregate, Rs 38.3 billion was offered which is evident of profound interest exhibited by the market.

External Debt and Liabilities
153
9.7.1.ii Floating Debt
Floating debt consists of short term domestic borrowing instruments such as Treasury Bills and central bank borrowing through the purchase of Market Related Treasury Bills (MRTBs). The high fiscal deficit incurred by the government in 2007-08 led to an unprecedented increase in the stock of floating debt, with borrowing from the SBP being the instrument of choice to finance the significant gap between government expenditure and revenues. The fiscal year 2007-08 saw floating debt to increase to Rs 1589 6 billion; more than double the amount outstanding five years ago. At the end of March 2009, floating debt increased to Rs 1923.5 billion, registering an enlargement of Rs 286 billion or 17.4 percent in nine months. The slowdown in the rate of increase of floating debt can be credited to the policy of zero quarterly borrowing from the SBP followed by the government on top of successful Treasury Bills auctions in the third quarter of 2008-09. The reduction in this type of borrowing is advantageous as it not only halts the massive increase in the stock of domestic debt, but also reduces inflationary pressures on the economy.
The outstanding stock of MRTBs grew from Rs 1052.6 billion at the end of 2007-08 to Rs 1227.3 billion by end-March 2009 — an increase of Rs 175 billion or 14 percent in nine months. By comparing this growth rate to an increase of 133 percent last year, the impact of the zero quarterly borrowing strategy is clearly visible. The T-bills increased by Rs 159.2 billion or 30 percent during the first nine months of the current fiscal year and the stock as of March 31, 2009 rested at Rs 695.6 billion as against Rs 536.4 billion at end-June 2008. This positive position is a complete reversal of the negative growth of 18 percent in the T-bills stock witnessed previous year.
Persistent monetary tightening to curtail skyrocketing inflation resulted in a shift to short-term views of the market, more so post-May 2008. Banks, in anticipation of further raise in interest rates, displayed complete concentration of bids in 3-months T-bills. Another factor supplementing subdued auction results was the liquidity constraints faced by banks due to foreign exchange
outflows, increase in reserve requirements, and slower growth in their deposit base. Put it another way, it was the slump in external financing and inability of the government to mop up ample money from non-SBP sources, that explicate the higher dependence on borrowings from the central bank.
However in the second quarter of 2008-09, the policy discount rate was sharply moved up by 200 bps on November 12, 2008 as part of the prior action under IMF macroeconomic stabilization program. This measure boosted interest in government papers in the latter part of the year. Enhanced liquidity and declining credit demand are reasons for better input to these auctions. Banks’ inclination to government papers over private sector lending truly echoes their shift towards quality, given the thorny problem of mounting non-performing loans. In order to lock-in higher rates on the back of expectations of a peak-out in the interest rate cycle, banks switched to a long view and offered huge bids in longer-tenor MTBs. This profound interest, consecutively, allowed the government to restrain its borrowings from the central bank through MRTBs.
9.7.1.iii Unfunded Debt
The wide array of instruments that fall under the National Savings Scheme is referred to as unfunded debt. The stock of unfunded debt stood at Rs 1174.7 billion on end-March 2009, having increased by Rs 163.8 billion or 16.2 percent in nine months. This huge magnitude of accrual depicted a rise in retail investors’ interest in the non-marketable funding source to reap optimal return in uncertain environment. A quarterly review of the profit rates on various schemes augmented to this trend.
The largest investment was in Special Saving Certificates and Accounts which increased by Rs 82 billion or 36 percent to reach a total amount outstanding of Rs 310 billion by end-March 2009. Significant investments were made in Bahbood Savings Certificates as well, with the outstanding stock increasing by Rs 57.6 billion or 25 percent to reach a total of Rs 286.6 billion. Significant increases were also seen in Pensioners Benefit

Economic
154
Accounts stock of DAccounts
9.7.2 D
During 19soaring greasons be
Table-9.10
Year
1990-91 1994-95 1999-20002001-02 2002-03 2003-04 2004-05 2005-06 2006-07 2007-08 2008-09* * End Ma Interest pas well acapacity interest parevenues resulting percent of2000, to 2interest paattenuatedpercentagdecreasedpercent inhave growyears, amand 22.1 Interest preaching Rof tax rev
c Survey 2008
and Regular Defence Savinboth witness
Domestic Deb
999-2000 to growth rates ehind shrinka
0: Domestic D
DomestOutstand
Debt
(In b448.2 807.7
0 1642.41774.71894.52012.22158.42336.82610.23217.23758.6
rch
ayments as aas total reveof governm
ayments on doutperformedin a diminutif tax revenue25.2 percent inayments as a d from 41 pege of total expd from 29.6 pn 2005-06. Hwn rapidly
mounting to 3percent of
ayments grewRs. 443.1 bilvenue and 29
8-09
Income Schengs Certificated reductions
bt Burden
2005-06, fissurfaced ou
age in interes
Debt & Domest
tic ding Intere
Payme
illions of Rs.) 35.777.9
4 210.7 189.5 166.2 161.4 176.8 191.42 287.2 443.6 551.
a percentage enue) gauge
ment revenuedomestic debtd that of interion of interese from 51.8 pn 2005-06. Inpercentage o
ercent to 18.8penditure, intercent in 199However, intin the previ
32.3 percent total revenu
w by 19 perclion which w.6 percent of
eme whereas ttes and Savins.
scal control aut to be primst payments a
tic Interest Pa
est ents Tax
Reven
7 27.59 30.22 51.85 39.69 30.05 26.43 26.7
4† 25.25 32.31 42.20 41.8
of revenue (tthe absorbi
s in terms t. The growthrest obligatiost payment apercent in 199n the same speof total revenu8 percent. Asterest payme
99-2000, to 14terest paymeious two fisof tax reven
ue in 2006-0cent in 2007-0was 42.6 percef total revenu
the ngs
and me
as a
percentanalogo07, domthe relaand enexpendSupplea policdeficit
ayments BurdDomesti
x nue
TotalRevenu
5 20.82 24.18 41.06 30.40 23.24 20.37 19.62 18.83 22.12 29.68 30.5
tax ing of
h in ns, s a 99-ell, ues s a nts 4.4 nts cal
nue 07. 08, ent
ues.
Interes16.0 pe19.5 ppercentof trenterms d2.7 perto 3.3 p08 [See
For the2008-0which 30.5 pe09. As for 200percentstood 2008-0
tage of majous to a cut inmestic debt wated interest pnormous sli
diture targetementing to thcy overhangthrough centren ic Interest Pay
l ue
TotalExpenditure(Perc13.718.229.622.918.616.915.814.416.019.523.0
Source: Bud
t payments oercent of totaercent in 20tage of GDP ds. The aforedecreased frorcent in 2005percent and ine Table 9.10]
e first nine m09, interest pa
sums to 41.ercent of totaa percentage
08-09, interest. The intereat 4.2 perce
09.
or macro-econ the external
witnessed a shpayments. Hiippages in ts remainedhe intensity o
and the moral bank borro
yment (in percl n-e
CurrExpend
cent) 18.22.33.27.21.20.20.19.20.23.29.
dget Wing (Mo
on domestic dal expenditur
007-08. Intereobserved a p
e-mentioned rom 5.5 percen5-06, then incncreased to 4..
months of the ayments stood8 percent of
al revenues ese of total expst payments
est payments ent of the pr
onomic indicl debt. Since 2
harp rise alongigher fiscal dethe revenue
d key probof the situationonetization oowings.
cent of)
rent diture GD
2 35 45 51 41 38 24 26 29 39 44 4
oF) and EA Wi
debt accountere in 2006-07est paymentsparallel turnarratio in percent in 1999-20creased in 20.3 percent in 2
current fiscad at Rs 551 bf tax revenuestimated for penditure budare currentlyon domestic
rojected GD
cators 2006-g with eficits
e and blems. n was
of the
DP
.5 4.2 5.5 4.3
.4 2.9 2.7 2.7
.3 4.3 4.2 ing
ed for 7, and s as a round
entage 000 to 06-07 2007-
l year billion s and 2008-
dgeted y 23.0 c debt P for

155

TABLE 9.1
(US $ million)S.No. Country/Creditor Debt Outstanding
as on 31-03-2009I. Bilateral a. Paris Club Countries1 Austria 70.6202 Belgium 34.9003 Canada 450.2904 Finland 5.9405 France 2,180.6006 Germany 1,808.5207 Italy 104.6208 Japan 6,377.2409 Korea 484.37010 Netherlands 116.56011 Norway 23.22012 Russia 123.18013 Spain 80.12014 Sweden 155.45015 Switzerland 100.03016 United Kingdom 9.11017 USA 1,530.370
Sub-Total I.a. Paris Club Countries 13,655.140 b. Non-Paris Club Countries19 China (including Defense) 1,456.50020 Kuwait 97.50021 Libya 5.00022 Saudi Arabia 262.00023 United Arab Emirates 121.000
Sub-Total I.b. Non-Paris Club Countries 1,942.000Total I. (a+b) 15,597.140
II. Multilateral & Others24 ADB 10,261.00025 EIB 67.00026 IBRD 1,888.00027 IDA 9,244.00028 IDB 160.00029 IFAD 165.00030 NORDIC Development Fund 16.00031 NORDIC Investment Bank 9.20032 OPEC Fund 25.100
Total II: Multilateral & Others 21,835.300III. Bonds33 Eurobonds 2,150.000
Total III: Bonds 2,150.000IV. Commercial Banks 166.500 Grand Total (I+II+III+IV) 39,748.940
Source:Economic Affairs Division
PUBLIC AND PUBLICLY GUARANTEED MEDIUM AND LONG TERM EXTERNAL DEBT DISBURSED AND OUTSTANDING As on 31-03-2009

(US $ million)Project Aid Non-Project Aid Total Total
Non-Food Food BOP Relief ReliefPlan/ Commit- Disburse- Commit- Disburse- Commit- Disburse- Commit- Disburse- Commit- Disburse- Commit- Disburse-Fiscal Year ments ments ments ments ments ments ments ments ments ments ments mentsVI. 5th Plan1978-79 1,064 599 190 213 55 50 86 86 - - 1,395 9481979-80 1,002 808 121 161 55 21 419 419 61 61 1,658 1,4701980-81 591 676 182 103 73 66 16 16 111 111 973 9721981-82 887 536 320 174 110 89 10 10 293 293 1,620 1,1021982-83 1,115 744 174 299 120 80 - - 178 178 1,587 1,301Sub-Total 4,659 3,363 987 950 413 306 531 531 643 643 7,233 5,793VII. 6th Plan1983-84 1,580 695 166 149 88 177 - - 155 155 1,989 1,1761984-85 1,804 903 161 125 196 79 - - 150 150 2,311 1,2571985-86 1,810 1,055 186 93 163 245 - - 135 135 2,294 1,5281986-87 2,035 1,006 331 205 130 57 - - 130 130 2,626 1,3981987-88 1,903 1,223 390 219 230 218 - - 164 164 2,687 1,824Sub-Total 9,132 4,882 1,234 791 807 776 - - 734 734 11,907 7,183VIII. 7th Plan1988-89 1,979 1,262 663 537 392 542 146 @ 146 @ 132 132 3,312 2,6191989-90 2,623 1,312 201 386 258 287 217 @ 217 @ 140 140 3,439 2,3421990-91 1,935 1,408 346 451 134 136 50 50 111 111 2,576 2,1561991-92 2,219 1,766 43 316 322 284 - - 105 105 2,689 2,4711992-93 1,204 1,895 182 232 454 309 - - 57 57 1,897 2,493Sub-Total 9,960 7,643 1,435 1,922 1,560 1,558 413 413 545 545 13,913 12,081IX. 8th Plan1993-94 1,822 1,961 - 15 329 251 411 303 19 19 2,581 2,5491994-95 2,714 2,079 3 23 279 258 - 211 29 29 3,025 2,6001995-96 2,219 2,151 57 21 395 383 - - 10 10 2,681 2,5651996-97 1,351 1,821 1 1 405 409 - - 2 2 1,759 2,2331997-98 776 1,552 1 1 578 622 750 625 1 1 2,106 2,801Sub-Total 8,882 9,564 62 61 1,986 1,923 1,161 1,139 61 61 12,152 12,748
1998-99 1,382 1,620 - - 185 270 650 550 2 2 2,219 2,4421999-00 456 2,045 284 130 564 64 0 0 0.2 2 1,305 2,2412000-01 433 1,042 469 340 0 13 658 687 2 3 1,562 2,0832001-02 1,013 825 332 333 40 31 2,259 1,546 0 21 3,644 2,7552002-03 811 845 47 192 22 9 1,085 867 8 8 1,973 1,9212003-04 1,176 575 350 8 12 0 913 743 0 3 2,451 1,3302004-05 2,379 880 115 296 0 0 1,087 1,531 0 2 3,581 2,7092005-06 1,213 878 25 169 22 10 1,186 1,069 1,949 1,040 4,395 3,1672006-07 923 865 225 25 0 12 2,152 2,007 550 388 3,850 3,2972007-08 1,710 697 353 500 0 0 957 1,512 550 871 3,570 3,5802008-09July-Mar 1,770 623 100 308 18 0 1,913 2,306 95 59 3,896 3,297
Source: Economic Affairs Division- nil @ IMF Loan.
TABLE 9.2
COMMITMENTS AND DISBURSEMENTS OF LOANS AND GRANTS (BY TYPE)
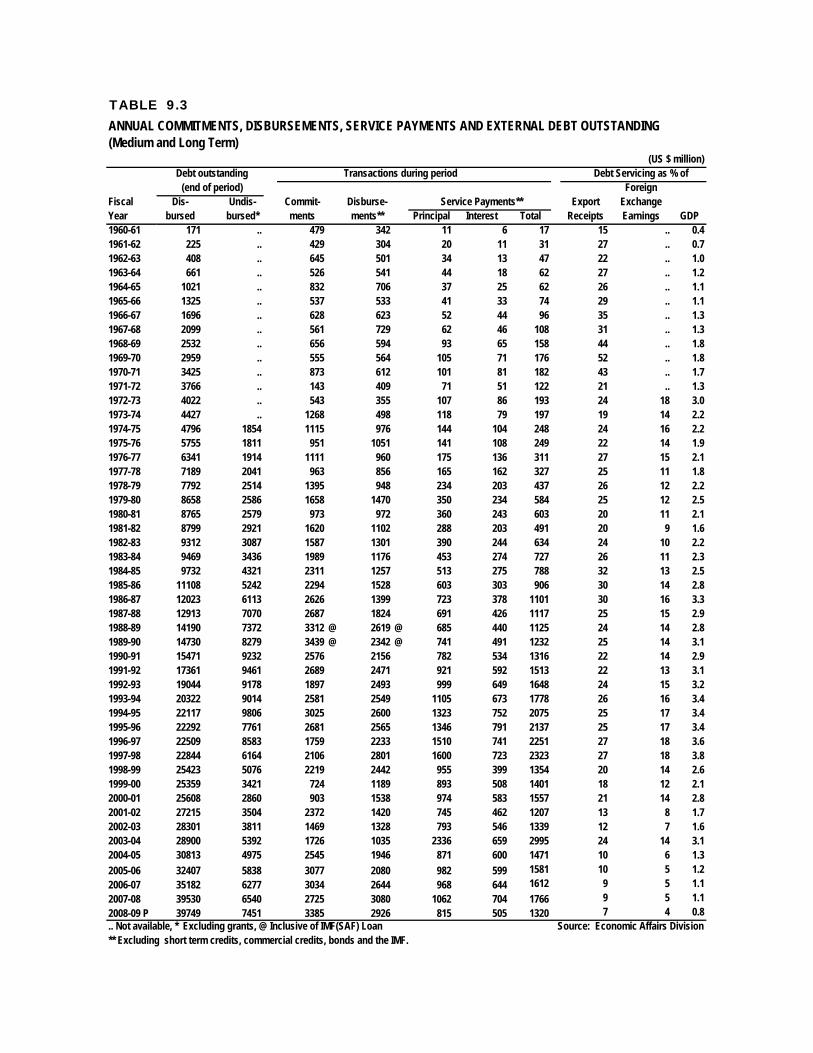
TABLE 9.3
(US $ million)Debt outstanding Transactions during period Debt Servicing as % of
(end of period) ForeignFiscal Dis- Undis- Commit- Disburse- Service Payments** Export ExchangeYear bursed bursed* ments ments** Principal Interest Total Receipts Earnings GDP1960-61 171 .. 479 342 11 6 17 15 .. 0.41961-62 225 .. 429 304 20 11 31 27 .. 0.71962-63 408 .. 645 501 34 13 47 22 .. 1.01963-64 661 .. 526 541 44 18 62 27 .. 1.21964-65 1021 .. 832 706 37 25 62 26 .. 1.11965-66 1325 .. 537 533 41 33 74 29 .. 1.11966-67 1696 .. 628 623 52 44 96 35 .. 1.31967-68 2099 .. 561 729 62 46 108 31 .. 1.31968-69 2532 .. 656 594 93 65 158 44 .. 1.81969-70 2959 .. 555 564 105 71 176 52 .. 1.81970-71 3425 .. 873 612 101 81 182 43 .. 1.71971-72 3766 .. 143 409 71 51 122 21 .. 1.31972-73 4022 .. 543 355 107 86 193 24 18 3.01973-74 4427 .. 1268 498 118 79 197 19 14 2.21974-75 4796 1854 1115 976 144 104 248 24 16 2.21975-76 5755 1811 951 1051 141 108 249 22 14 1.91976-77 6341 1914 1111 960 175 136 311 27 15 2.11977-78 7189 2041 963 856 165 162 327 25 11 1.81978-79 7792 2514 1395 948 234 203 437 26 12 2.21979-80 8658 2586 1658 1470 350 234 584 25 12 2.51980-81 8765 2579 973 972 360 243 603 20 11 2.11981-82 8799 2921 1620 1102 288 203 491 20 9 1.61982-83 9312 3087 1587 1301 390 244 634 24 10 2.21983-84 9469 3436 1989 1176 453 274 727 26 11 2.31984-85 9732 4321 2311 1257 513 275 788 32 13 2.51985-86 11108 5242 2294 1528 603 303 906 30 14 2.81986-87 12023 6113 2626 1399 723 378 1101 30 16 3.31987-88 12913 7070 2687 1824 691 426 1117 25 15 2.91988-89 14190 7372 3312 @ 2619 @ 685 440 1125 24 14 2.81989-90 14730 8279 3439 @ 2342 @ 741 491 1232 25 14 3.11990-91 15471 9232 2576 2156 782 534 1316 22 14 2.91991-92 17361 9461 2689 2471 921 592 1513 22 13 3.11992-93 19044 9178 1897 2493 999 649 1648 24 15 3.21993-94 20322 9014 2581 2549 1105 673 1778 26 16 3.41994-95 22117 9806 3025 2600 1323 752 2075 25 17 3.41995-96 22292 7761 2681 2565 1346 791 2137 25 17 3.41996-97 22509 8583 1759 2233 1510 741 2251 27 18 3.61997-98 22844 6164 2106 2801 1600 723 2323 27 18 3.81998-99 25423 5076 2219 2442 955 399 1354 20 14 2.61999-00 25359 3421 724 1189 893 508 1401 18 12 2.12000-01 25608 2860 903 1538 974 583 1557 21 14 2.82001-02 27215 3504 2372 1420 745 462 1207 13 8 1.72002-03 28301 3811 1469 1328 793 546 1339 12 7 1.62003-04 28900 5392 1726 1035 2336 659 2995 24 14 3.12004-05 30813 4975 2545 1946 871 600 1471 10 6 1.32005-06 32407 5838 3077 2080 982 599 1581 10 5 1.22006-07 35182 6277 3034 2644 968 644 1612 9 5 1.12007-08 39530 6540 2725 3080 1062 704 1766 9 5 1.12008-09 P 39749 7451 3385 2926 815 505 1320 7 4 0.8.. Not available, * Excluding grants, @ Inclusive of IMF(SAF) Loan Source: Economic Affairs Division** Excluding short term credits, commercial credits, bonds and the IMF.
ANNUAL COMMITMENTS, DISBURSEMENTS, SERVICE PAYMENTS AND EXTERNAL DEBT OUTSTANDING (Medium and Long Term)

(US $ million)Kind 1998-99 1999-00 2000-01 2001-02 2002-03 2003-04 2004-05 2005-06 2006-07 2007-08 2008-09
I.Principal 147.880 147.891 105.534 0.000 0.000 0.000 0.000 0.000 0.000 0.000 -Interest 5.431 6.692 4.680 0.000 0.000 0.000 0.000 0.000 0.000 0.000 -Principal 0.000 0.000 0.030 0.000 0.000 0.695 0.376 1.223 1.145 2.680 1.698Interest 0.000 0.656 0.703 0.353 2.072 3.207 4.212 3.637 3.634 4.483 2.153Principal 0.000 0.000 0.000 0.000 0.000 0.000 0.000 0.000 4.623 10.326 0.281Interest 0.000 1.267 1.654 0.864 3.102 1.413 1.767 1.859 2.003 2.266 0.952Principal 15.947 15.318 8.097 0.000 0.000 0.000 0.302 0.841 1.289 1.662 0.833Interest 2.360 1.302 1.073 0.740 1.317 1.438 2.766 4.436 5.584 5.359 4.257Principal 0.000 0.000 0.000 0.000 0.000 0.000 0.000 0.000 0.000 0.000 0.000Interest 0.000 0.000 0.000 0.000 0.000 0.000 0.000 0.000 0.000 0.000 0.000Principal 7.018 0.000 0.203 0.034 0.000 28.766 10.636 24.921 31.366 35.983 14.355Interest 4.477 8.767 15.315 16.508 47.516 61.557 82.615 81.489 87.430 99.483 42.720Principal 0.000 0.000 0.000 0.000 0.000 0.000 0.024 0.055 0.084 0.108 0.041Interest 0.000 0.131 0.307 0.157 0.111 0.088 0.164 0.286 0.364 0.360 0.104Principal 38.726 9.551 5.741 0.854 3.834 7.925 2.64 12.749 15.294 16.202 6.846Interest 11.406 6.532 7.493 7.403 18.903 17.575 20.981 29.826 32.225 36.354 15.070Principal 0.512 3.121 2.262 1.115 2.136 0.316 0.541 0.642 21.415 24.039 0.205Interest 0.270 0.620 1.778 0.982 2.718 2.753 3.605 2.331 1.168 1.294 0.465Principal 14.796 0.538 38.689 46.279 70.319 396.646 48.114 65.577 49.280 46.528 42.547Interest 11.725 59.970 73.006 28.445 36.224 129.721 149.982 86.805 91.573 103.564 137.479Principal 0.000 0.000 0.123 0.000 0.000 44.834 45.272 96.485 55.725 56.254 29.886Interest 0.000 5.063 13.040 5.232 0.000 24.884 23.787 38.168 40.759 22.623 9.770Principal 0.401 1.874 2.938 0.000 2.125 2.124 3.877 4.064 12.124 12.124 1.251Interest 0.287 1.314 2.577 0.543 1.797 1.537 1.321 2.196 0.598 0.460 0.580Principal 0.000 0.936 1.016 0.710 1.102 0.000 0.221 0.528 0.679 0.654 0.275Interest 0.043 0.630 0.952 0.637 1.337 2.419 1.894 3.050 3.223 3.656 3.130Principal 0.000 0.000 0.000 0.000 0.000 0.000 0.937 18.958 2.751 2.859 1.364Interest 0.000 0.000 3.098 3.457 0.000 0.000 3.367 23.375 6.566 6.436 3.165Principal 0.591 0.000 1.737 0.000 0.000 0.000 0.412 0.957 1.862 2.768 1.434Interest 1.689 2.207 3.407 4.693 1.987 1.962 3.553 7.063 9.262 9.042 2.711Principal 0.000 0.000 0.000 0.000 0.000 0.098 0.580 1.369 1.051 0.857 0.392Interest 0.041 0.659 1.185 0.860 1.681 1.753 2.372 2.911 3.222 3.149 1.249Principal 4.790 0.000 0.000 0.000 0.000 0.000 0.253 0.555 0.943 1.467 0.725Interest 1.081 0.000 1.541 0.867 0.941 0.803 1.319 1.530 2.244 3.363 1.631Principal 275.138 125.515 43.244 7.839 11.402 1.721 10.492 19.645 28.396 20.261 9.500Interest 24.907 17.825 59.906 33.115 61.619 56.098 64.334 61.191 63.618 62.136 27.542Principal 0.000 2.644 6.470 3.845 5.643 36.203 0.959 1.916 1.076 0.110 0.072Interest 0.000 1.129 8.954 2.153 2.552 6.537 0.545 0.598 0.655 0.382 0.256Principal 505.799 307.388 216.084 60.676 96.561 519.328 125.636 250.485 229.103 234.882 111.705Interest 63.717 114.764 200.669 107.009 183.877 313.745 368.584 350.751 354.128 364.410 253.234
Contd..
11
13 Netherlands
6 France
Denmark
7
12 Norway
10
4 Canada
5
Korea
8 Germany
14 Russia
Finland
TABLE 9.4
DEBT SERVICE PAYMENTS OF FOREIGN MEDIUM AND LONG TERM LOANS (Paid in foreign exchange)
3 Belgium
2 Austria
Fiscal YearPARIS CLUB COUNTRIES
1 Australia
Japan
9 Italy
17 Switzerland
18 USA
15 Sweden
16 Spain
19 UK
TOTAL (I)

(US $ million)Kind 1998-99 1999-00 2000-01 2001-02 2002-03 2003-04 2004-05 2005-06 2006-07 2007-08 2008-09
TABLE 9.4
DEBT SERVICE PAYMENTS OF FOREIGN MEDIUM AND LONG TERM LOANS (Paid in foreign exchange)
Fiscal YearII.
Principal 0.958 11.932 163.019 90.810 35.228 14.798 13.868 18.967 14.148 14.148 13.074Interest 0.000 8.136 29.702 20.699 25.661 13.980 13.310 7.377 11.623 10.060 8.473Principal 0.000 0.000 3.767 0.000 0.000 0.000 0.000 0.000 0.000 0.000 0.000Interest 0.000 0.000 0.000 0.000 0.000 0.000 0.000 0.000 0.000 0.000 0.000Principal 0.262 0.000 1.478 1.226 3.030 5.395 5.733 7.054 7.079 7.408 5.355Interest 0.058 0.000 0.000 0.000 0.900 2.195 2.032 2.203 2.369 2.438 1.800Principal 1.156 0.000 0.000 0.000 0.000 0.000 0.000 0.000 14.229 1.823 0.100Interest 0.185 0.000 0.000 0.000 0.000 0.000 0.000 0.000 1.789 0.060 0.029Principal 1.230 0.000 0.000 0.000 13.079 5.424 5.373 3.383 0.000 0.000 0.833Interest 0.037 0.000 0.466 0.057 2.900 1.285 1.122 1.162 1.168 1.171 0.584Principal 3.606 0.000 0.000 0.000 1.000 1.000 0.000 0.000 0.000 0.000 0.000Interest 2.297 0.000 0.000 0.336 0.824 0.824 0.678 1.015 1.784 2.122 2.123Principal 7.212 11.932 168.264 92.036 52.337 26.617 24.974 29.404 35.456 23.379 19.362Interest 2.577 8.136 30.168 21.092 30.285 18.284 17.142 11.757 18.733 15.851 13.009
III.Principal 198.963 237.655 247.044 241.442 265.981 1370.429 245.272 236.757 261.303 330.746 290.259Interest 142.195 156.565 151.188 151.668 172.738 179.919 75.061 74.020 89.089 119.058 97.158Principal 169.766 222.773 227.914 233.789 249.499 287.173 322.704 294.377 273.293 296.781 243.627Interest 156.640 182.812 153.780 132.161 110.541 94.797 77.419 99.280 110.839 111.589 64.652Principal 53.737 62.631 66.534 72.592 83.452 97.926 112.724 118.566 127.293 143.618 126.149Interest 28.138 28.850 27.935 30.054 39.885 45.063 51.049 50.918 59.761 73.878 64.170Principal 6.300 8.245 7.685 7.354 7.504 7.712 7.962 7.468 8.362 8.413 7.188Interest 2.457 2.376 2.206 1.996 1.751 2.106 2.043 1.802 1.827 1.951 1.433Principal 4.090 23.213 23.246 23.083 9.679 3.208 2.956 3.504 4.066 6.942 4.544Interest 0.363 5.040 3.955 2.061 1.046 0.731 0.612 0.795 1.690 3.726 4.126Principal 0.000 0.000 0.000 0.000 0.000 0.000 0.000 0.000 0.000 25.000 791.501Interest 0.000 0.000 0.000 0.000 0.000 0.000 0.000 0.000 0.000 22.866 28.026Principal 432.856 554.517 572.423 578.260 616.115 1766.448 691.618 660.672 674.317 811.500 1463.268Interest 329.793 375.643 339.064 317.940 325.961 322.616 206.184 226.815 263.206 333.068 259.565
IV.Principal 0.914 1.755 1.918 2.023 2.232 2.375 2.519 2.442 2.482 2.562 1.281Interest 1.594 1.806 2.087 1.065 0.723 0.565 0.685 0.917 1.007 0.875 0.281Principal 8.417 8.098 8.003 6.597 6.504 5.178 4.800 4.561 4.204 4.935 2.849Interest 0.919 0.804 0.749 0.754 0.707 0.595 0.546 0.591 0.571 0.495 0.387Principal 0.000 0.000 0.000 0.000 9.959 0.000 12.900 25.800 12.900 0.000 0.000Interest 0.000 4.797 5.981 2.514 0.388 0.000 1.875 2.776 0.648 0.000 0.000Principal 0.000 0.000 0.000 0.000 0.000 0.637 0.679 1.345 2.094 2.600 1.583Interest 0.000 0.118 0.254 0.234 0.939 1.722 2.592 3.324 4.262 3.847 1.626Principal 9.331 9.853 9.921 8.620 18.695 8.190 20.898 34.148 21.680 10.097 5.713Interest 2.513 7.525 9.071 4.567 2.757 2.882 5.698 7.608 6.488 5.217 2.294
V.Principal 17.650 0.000 0.200 0.000 155.458 155.459 155.458 155.459 0.000 0.000 500.000Interest 56.619 62.237 62.685 62.340 62.023 39.181 57.644 91.561 145.000 207.667 151.439
2 Principal 0.000 0.000 0.000 7.716 4.526 0.000 0.000 0.000 0.000 4.527 0.000Interest 0.000 0.000 0.000 1.533 6.544 0.000 0.000 0.000 0.000 0.282 0.000
3 Principal 0.000 0.000 0.000 21.903 21.903 21.903 21.903 21.903 0.000 21.903 21.963Interest 0.000 0.000 0.000 16.573 7.118 4.594 3.326 4.414 0.000 5.684 3.680Principal 17.650 0.000 0.200 29.619 181.887 177.362 177.361 177.362 0.000 26.430 521.963Interest 56.619 62.237 62.685 80.446 75.685 43.775 60.970 95.975 145.000 213.633 155.119
Total 74.269 62.237 62.885 110.065 257.572 221.137 238.331 273.337 145.000 240.063 677.082Contd..
1 China
2 Czecho -slovakia
NON-PARIS CLUB COUNTRIES
TOTAL (II)
MULTILATERAL
1
3 Kuwait
3 IDA
ADB
2 IBRD
4 Libya
5 Saudi Arabia
6 UAE
TOTAL (III)
DEVELOPMENT FUNDS
1 NORDIC
IFAD
5 IDB
7 IDB (ST)
4
Euro Bonds
US Dollar Bonds
Saindak Bonds
2 OPEC Fund
3 Turkey (EXIM Bank)
4 E.I. Bank
TOTAL (IV)
TOTAL (I+II+III+IV+V)
GLOBAL BONDS
1

(US $ million)Kind 1998-99 1999-00 2000-01 2001-02 2002-03 2003-04 2004-05 2005-06 2006-07 2007-08 2008-09
TABLE 9.4
DEBT SERVICE PAYMENTS OF FOREIGN MEDIUM AND LONG TERM LOANS (Paid in foreign exchange)
Fiscal YearV.
Principal 0.000 0.000 0.000 0.000 0.000 0.000 3.111 2.945 2.979 3.016 2.988Interest 0.000 0.000 0.000 0.000 0.870 0.866 0.981 1.118 1.077 0.804 0.335Principal 0.000 3.810 5.130 3.195 9.585 6.245 0.000 0.000 0.000 0.000 0.000Interest 0.000 0.473 2.262 0.975 1.012 0.213 0.000 0.000 0.000 0.000 0.000Principal 0.000 5.000 0.000 0.000 0.000 9.286 4.286 0.000 0.000 4.286 3.571Interest 0.000 1.240 0.000 8.500 1.410 0.621 0.983 0.469 0.000 0.474 0.111Principal 0.000 0.000 2.500 2.500 0.000 0.000 0.000 4.286 4.286 0.000 0.021Interest 0.000 0.000 1.392 1.535 0.000 0.000 0.000 0.552 0.856 6.657 4.048Principal 16.280 16.280 17.280 16.280 66.280Interest 7.416 10.370 11.370 9.105 5.766Principal 0.000 8.810 7.630 5.695 9.585 15.531 23.677 23.511 24.545 23.582 72.860Interest 0.000 1.713 3.654 11.010 3.292 1.700 9.380 12.509 13.303 17.040 10.260Principal 955.198 892.500 974.322 745.287 793.293 2336.114 886.803 998.220 985.101 1103.440 2194.871Interest 398.600 507.781 582.626 461.618 546.172 659.227 606.988 609.440 655.858 735.586 693.481
1353.798 1400.281 1556.948 1206.905 1339.465 2995.341 1493.791 1607.660 1640.959 1839.026 2888.352Source: Economic Affairs Division
OTHERS
1 NBP's
2 Bank of Indosuez
TOTAL (V)
TOTAL (I+II+III+IV+V)
Grand Total (P+I)
5 Cash (ST)
3 NBP Bahrain
4 ANZ Bank

TABLE 9.5
Lending Country/Agency Amount Interest Rate/ Amortization Amount Interest Rate/ Amortization(US $ Million) Commission(%) (years) (US $ Million) Commission(%) (years)
A. Paris Club Countries1. Germany 5.8 0.75 402. Korea 17.3 2 30 - - 303. Japan 244.7 1.3 30 198.2 1.3 304.France 50.2 LiborEuro months-200bps 20
Sub-Total (A): 262.0 254.2B. Non-Paris Club
1. China 322.3 1.5 5_202. Kuwait 38.1 2.5 ,243.Saudi Arabia 133.1 Libor6month+60bps 24.U.A.E
Sub-Total (B): 322.3 171.2C Multilateral
1. Islamic Development Bank 146.0 1.25 & 5.1 15-25 425.0 LIBOR 6 months '+ 60 bps 22. IDA 1165.8 0.75 35 912.1 0.75 353. ADB 832.8 1 & 1.5 15-40 1386.1 1 & 1.5 15-324.OPEC - - - 10 1.25 205. IBRD 319.2 LIBOR+50bps 15-20 100.0 LIBOR6months+60bps 206. IFAD 53.6 0.8 35.0 - 0.75 35
Sub-Total (C): 2517.4 2833.2 Total (A+B+C) 3101.7 3258.6
Lending Country/Agency Amount Interest Rate/ Amortization Amount Interest Rate/ Amortization(US $ Million) Commission(%) (years) (US $ Million) Commission(%) (years)
A. Paris Club Countries1. Germany 460.4 0.2-1.3 30-40 262.1 0.75 402.Japan 12.1 0 39
Sub-Total (A) 472.5 262.1
B. Non-Paris Club
1. Saudi Arabia 40.0 2 26 125.0 3.25 32. China 327.7 3 15 - - -3. Korea 20.0 1 30 205.0 0.1 30-40Sub-Total (B) 387.7 330.0
C Multilateral 1. IDA 259.3 0.75+4.9 35 605.7 0.75 352. ADB 1436.0 1-1.5&Libor+60bps 15-24 1259.1 Libor+0.6 24
3. OPEC 5.3 2.5 20 15.0 Libor+1.85 204. Islamic Development Bank 127.1 3.8 15 243.2 Libor+0.55&3.825
5. IDB Stort-term 352.8 5.8 1 596.5 LIBOR+2.5&1 1
6. IBRD 173.6 0.75 30
7.IFAD 36.3 0.75 40
Sub-Total (C) 2,216.8 2,893.1 Total (A+B+C) 3077.0 3485.2
Source: Economic Affairs Division
TERMS OF FOREIGN LOANS/CREDITS CONTRACTED BY PAKISTAN
2005-06 2006-07
2007-08 2008-09
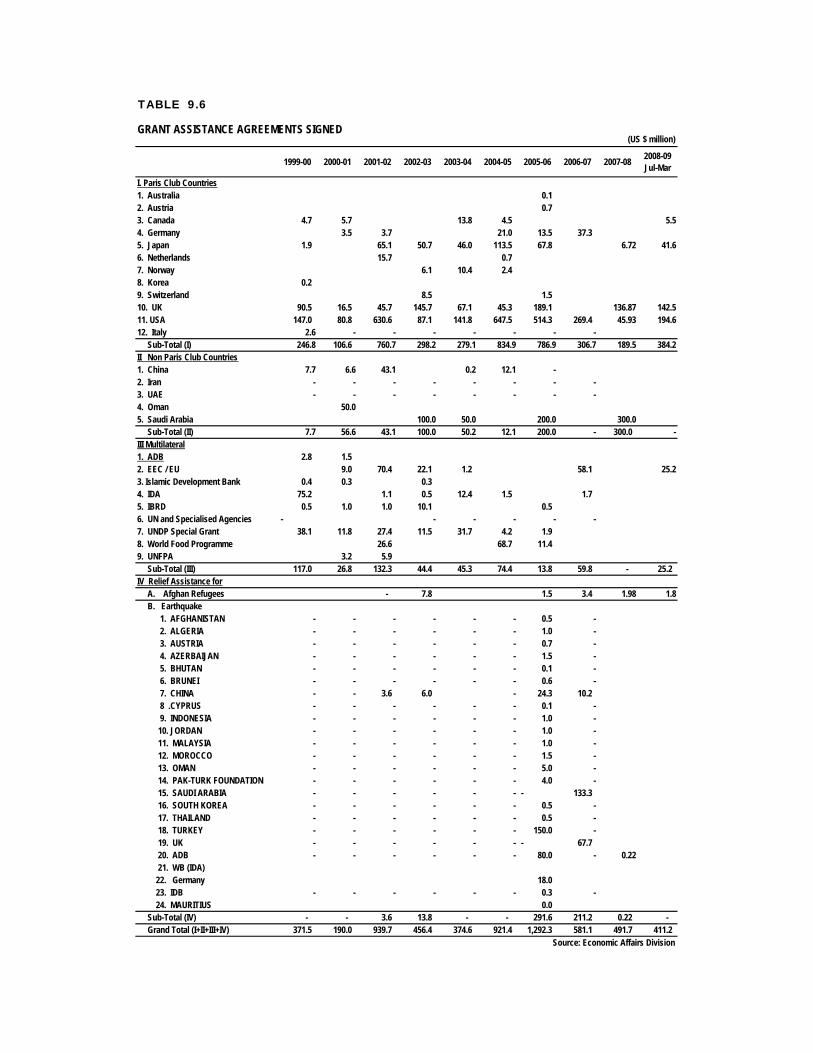
TABLE 9.6
(US $ million)
1999-00 2000-01 2001-02 2002-03 2003-04 2004-05 2005-06 2006-07 2007-08 2008-09Jul-Mar
I. Paris Club Countries1. Australia 0.1 2. Austria 0.7 3. Canada 4.7 5.7 13.8 4.5 5.54. Germany 3.5 3.7 21.0 13.5 37.3 5. Japan 1.9 65.1 50.7 46.0 113.5 67.8 6.72 41.66. Netherlands 15.7 0.7 7. Norway 6.1 10.4 2.4 8. Korea 0.2 9. Switzerland 8.5 1.5 10. UK 90.5 16.5 45.7 145.7 67.1 45.3 189.1 136.87 142.511. USA 147.0 80.8 630.6 87.1 141.8 647.5 514.3 269.4 45.93 194.612. Italy 2.6 - - - - - - - Sub-Total (I) 246.8 106.6 760.7 298.2 279.1 834.9 786.9 306.7 189.5 384.2II Non Paris Club Countries1. China 7.7 6.6 43.1 0.2 12.1 - 2. Iran - - - - - - - - 3. UAE - - - - - - - - 4. Oman 50.05. Saudi Arabia 100.0 50.0 200.0 300.0 Sub-Total (II) 7.7 56.6 43.1 100.0 50.2 12.1 200.0 - 300.0 - III Multilateral1. ADB 2.8 1.5 2. EEC / EU 9.0 70.4 22.1 1.2 58.1 25.23. Islamic Development Bank 0.4 0.3 0.3 4. IDA 75.2 1.1 0.5 12.4 1.5 1.7 5. IBRD 0.5 1.0 1.0 10.1 0.5 6. UN and Specialised Agencies - - - - - - 7. UNDP Special Grant 38.1 11.8 27.4 11.5 31.7 4.2 1.9 8. World Food Programme 26.6 68.7 11.4 9. UNFPA 3.2 5.9 Sub-Total (III) 117.0 26.8 132.3 44.4 45.3 74.4 13.8 59.8 - 25.2 IV Relief Assistance for A. Afghan Refugees - 7.8 1.5 3.4 1.98 1.8 B. Earthquake 1. AFGHANISTAN - - - - - - 0.5 - 2. ALGERIA - - - - - - 1.0 - 3. AUSTRIA - - - - - - 0.7 - 4. AZERBAIJAN - - - - - - 1.5 - 5. BHUTAN - - - - - - 0.1 - 6. BRUNEI - - - - - - 0.6 - 7. CHINA - - 3.6 6.0 - 24.3 10.2 8 .CYPRUS - - - - - - 0.1 - 9. INDONESIA - - - - - - 1.0 - 10. JORDAN - - - - - - 1.0 - 11. MALAYSIA - - - - - - 1.0 - 12. MOROCCO - - - - - - 1.5 - 13. OMAN - - - - - - 5.0 - 14. PAK-TURK FOUNDATION - - - - - - 4.0 - 15. SAUDI ARABIA - - - - - - - 133.3 16. SOUTH KOREA - - - - - - 0.5 - 17. THAILAND - - - - - - 0.5 - 18. TURKEY - - - - - - 150.0 - 19. UK - - - - - - - 67.7 20. ADB - - - - - - 80.0 - 0.22 21. WB (IDA) 22. Germany 18.0 23. IDB - - - - - - 0.3 - 24. MAURITIUS 0.0 Sub-Total (IV) - - 3.6 13.8 - - 291.6 211.2 0.22 - Grand Total (I+II+III+IV) 371.5 190.0 939.7 456.4 374.6 921.4 1,292.3 581.1 491.7 411.2
Source: Economic Affairs Division
GRANT ASSISTANCE AGREEMENTS SIGNED

TOTAL LOANS AND CREDITS CONTRACTED (US $ million)
1999-00 2000-01 2001-02 2002-03 2003-04 2004-05 2005-06 2006-07 2007-08 2008-09 (Jul-Mar)
A. Paris Club Countries 1. Austria - 16.0 - - - -
2. Australia 63.7 - - - - - - 3. Belgium - - - - - - -
4. Canada - - - - - - - 5. France (Regular)) (Earthquake) - - - - - - 50.2 6. Germany 4.4 102.6 6.0 262.1 7. Japan (Regular) 32.6 26.0 245.0 198.0 460.4 596.5
- - - - - - -8. Netherlands - - - - - - -9. Norway - - - - - - -10. Spain 1.911. Sweden 2.0 - - - - - -12. UK - - - - - - -13. USA 500.0 - 9.0 - - - -14. Italy 12.1Sub-Total (A) 565.7 0.0 63.8 26.0 0.0 102.6 245.0 254.2 472.5 858.6
B. Non-Paris Club Countries: 1. China (Regular) 18.1 44.4 280.0 118.2 683.1 322.0 328.0 (Earthquake) - - - - - - -2. Korea (Earthquake) 17.0 20.0 205.03. Kuwait - - - - - 34.0 38.14. Saudi Arabia - - - - 25.0 - 133.1 40.0 125.05. Turkey (EXIM Bank) - - - - - - -6. Abu Dhabi Fund - - 265.0 - - -Sub-Total (B) 18.1 44.4 545.0 118.2 25.0 717.1 339.0 171.2 388.0 330.0
C. Multilateral: 1. IBRD (Regular) - - - - 53.0 349.3 319.0 100.0 173.6 (Earthquake) - - - - - - 2. IDA (Regular) 88.5 347.6 833.5 269.4 690.7 601.8 1166.0 772.1 259.1 605.7 (Earthquake) 139.9 3. ADB (Regular) 51.8 411.9 876.1 1040.9 885.3 765.4 832.9 1386.0 1436.4 1259.1 (Earthquake) - - - - - - - 4. IFAD (Regular) 17.4 14.2 22.3 54.0 36.3 (Earthquake) - - - - - - - 5. European Investment Bank 50.0 6. OPEC Fund 10.0 15.0 15.0 10.0 5.1 15.0 7. IDB (Regular) 284.3 502.6 356.3 47.3 350.0 123.4 146.0 200.0 127.1 243.2 (Earthquake) 225.18. KPC 38.09. IDB (ST) 352.5Sub-Total (C) 424.6 1917.8 3185.9 1372.6 2051.3 1839.8 2517.9 2833.1 2216.5 2296.6Grand-Total (A+B+C) 1008 1962 3795 1517 2076 2660 3102 3259 3077.0 3485.2
Source: Economic Affairs Division
Lending Country/Agency
TABLE 9.7