india’s external debt - department of economic affairsdea.gov.in/sites/default/files/external debt...
TRANSCRIPT
INDIA’S EXTERNAL DEBTA Status Report
2016-17
GOVERNMENT OF INDIAMINISTRY OF FINANCE
DEPARTMENT OF ECONOMIC AFFAIRSEXTERNAL DEBT MANAGEMENT UNIT
SEPTEMBER 2017www.finmin.nic.in
INDIA’S EXTERNAL DEBTA Status Report
2016-17
GOVERNMENT OF INDIAMINISTRY OF FINANCE
DEPARTMENT OF ECONOMIC AFFAIRSEXTERNAL DEBT MANAGEMENT UNIT
SEPTEMBER 2017www.finmin.nic.in
FOREWORD
This is the twenty-third issue of 'India's External Debt: A Status Report 2016-17'. India'sexternal debt stock stood at US$ 471.9 billion at end-March 2017 as against US$ 485.0 billion atend-March 2016. While external debt has decreased over 2016-17 by 2.7 per cent, important debtindicators such as external debt-GDP ratio, debt service ratio and foreign exchange reserves to totalexternal debt improved. External debt of the country continues to be dominated by long termborrowings. India continues to be among the less vulnerable countries with its external debt indicators,comparing well with other indebted developing countries. Among BRICS economies, India is atfourth position after China, Brazil, and Russia in terms of the total debt stock and in third positionin terms of the share of short term debt to total debt. The prudent external debt policy pursued by theGovernment has helped in maintaining external debt within manageable limits.
I am confident that the Report would be useful for the Hon'ble Members of Parliament,research scholars, policy makers and the general public.
New DelhiSeptember 11, 2017
Arun JaitleyMinister of Finance and
Corporate AffairsIndia
+ÉâóhÉ VÉä]ãÉÉÒÉÊ´ÉkÉ A´ÉÆ BÉEÉ{ÉÉäÇ®ä] BÉEɪÉÇ àÉÆjÉÉÒ
£ÉÉ®iÉ
(ARUN JAITLEY)
INDIA’S EXTERNAL DEBTA Status Report
2016-17
GOVERNMENT OF INDIAMINISTRY OF FINANCE
DEPARTMENT OF ECONOMIC AFFAIRSEXTERNAL DEBT MANAGEMENT UNIT
SEPTEMBER 2017www.finmin.nic.in
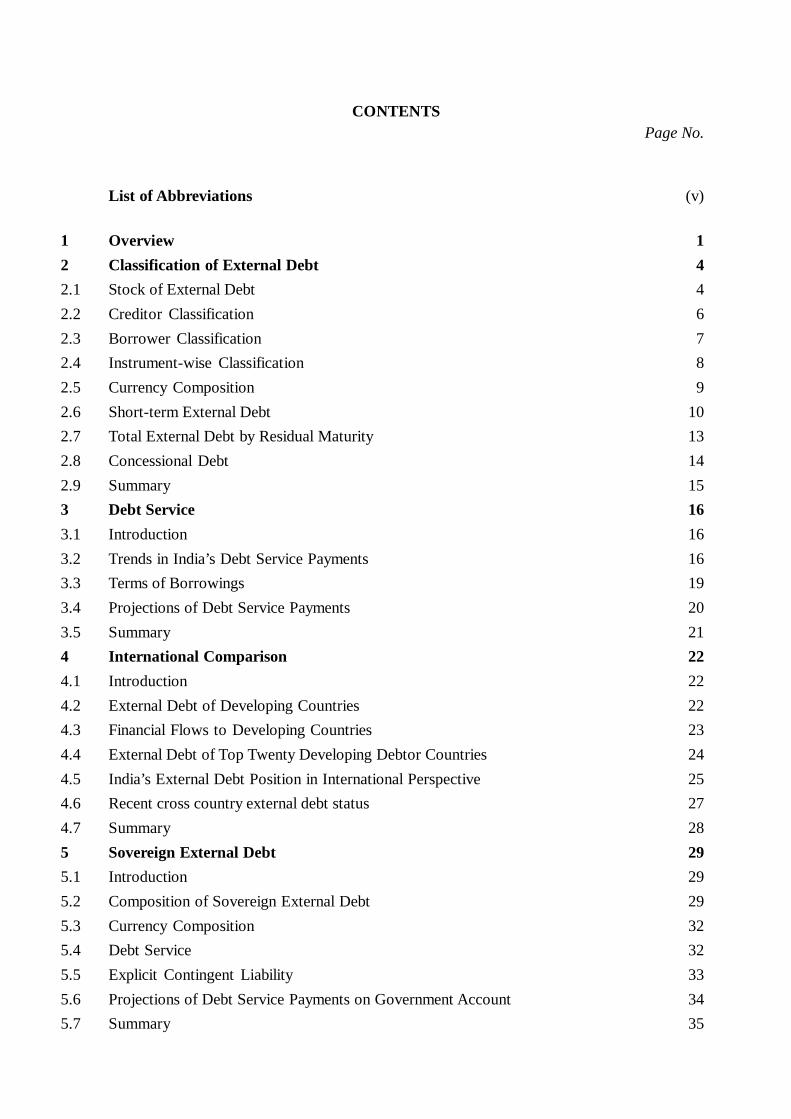
CONTENTSPage No.
List of Abbreviations (v)
1 Overview 12 Classification of External Debt 42.1 Stock of External Debt 42.2 Creditor Classification 62.3 Borrower Classification 72.4 Instrument-wise Classification 82.5 Currency Composition 92.6 Short-term External Debt 102.7 Total External Debt by Residual Maturity 132.8 Concessional Debt 142.9 Summary 153 Debt Service 163.1 Introduction 163.2 Trends in India’s Debt Service Payments 163.3 Terms of Borrowings 193.4 Projections of Debt Service Payments 203.5 Summary 214 International Comparison 224.1 Introduction 224.2 External Debt of Developing Countries 224.3 Financial Flows to Developing Countries 234.4 External Debt of Top Twenty Developing Debtor Countries 244.5 India’s External Debt Position in International Perspective 254.6 Recent cross country external debt status 274.7 Summary 285 Sovereign External Debt 295.1 Introduction 295.2 Composition of Sovereign External Debt 295.3 Currency Composition 325.4 Debt Service 325.5 Explicit Contingent Liability 335.6 Projections of Debt Service Payments on Government Account 345.7 Summary 35
Page No.(ii)
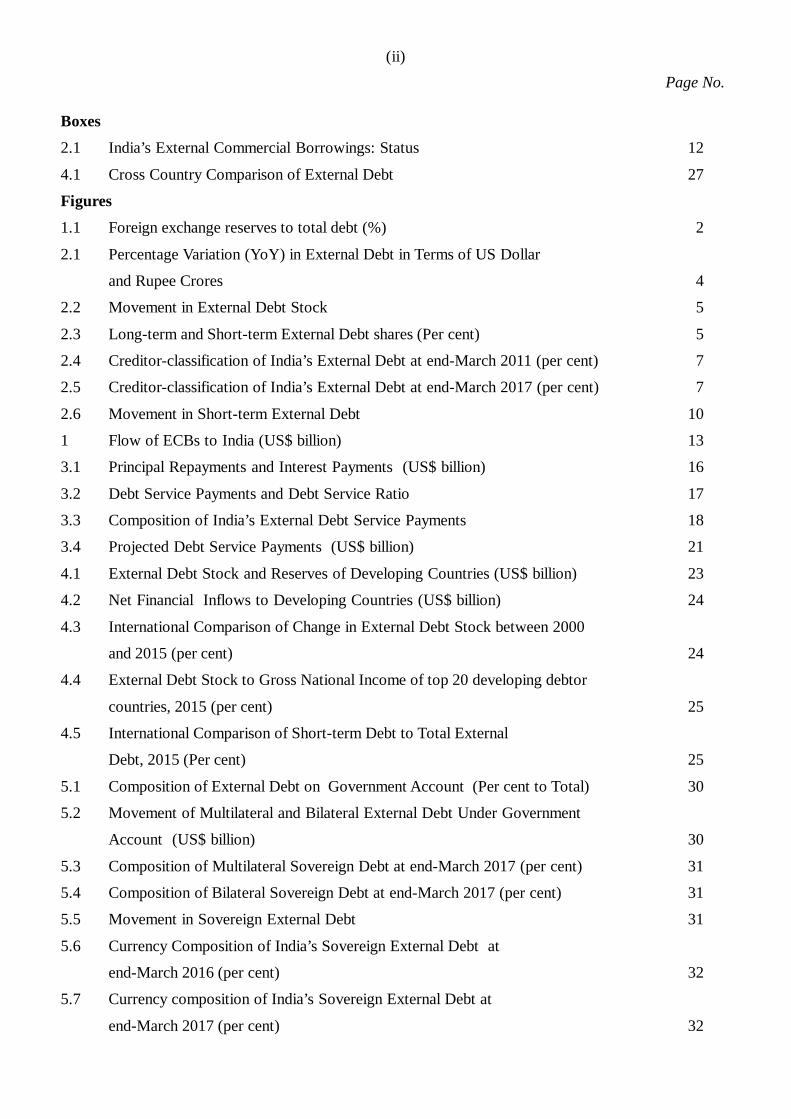
Boxes
2.1 India’s External Commercial Borrowings: Status 12
4.1 Cross Country Comparison of External Debt 27
Figures
1.1 Foreign exchange reserves to total debt (%) 2
2.1 Percentage Variation (YoY) in External Debt in Terms of US Dollar
and Rupee Crores 4
2.2 Movement in External Debt Stock 5
2.3 Long-term and Short-term External Debt shares (Per cent) 5
2.4 Creditor-classification of India’s External Debt at end-March 2011 (per cent) 7
2.5 Creditor-classification of India’s External Debt at end-March 2017 (per cent) 7
2.6 Movement in Short-term External Debt 10
1 Flow of ECBs to India (US$ billion) 13
3.1 Principal Repayments and Interest Payments (US$ billion) 16
3.2 Debt Service Payments and Debt Service Ratio 17
3.3 Composition of India’s External Debt Service Payments 18
3.4 Projected Debt Service Payments (US$ billion) 21
4.1 External Debt Stock and Reserves of Developing Countries (US$ billion) 23
4.2 Net Financial Inflows to Developing Countries (US$ billion) 24
4.3 International Comparison of Change in External Debt Stock between 2000
and 2015 (per cent) 24
4.4 External Debt Stock to Gross National Income of top 20 developing debtor
countries, 2015 (per cent) 25
4.5 International Comparison of Short-term Debt to Total External
Debt, 2015 (Per cent) 25
5.1 Composition of External Debt on Government Account (Per cent to Total) 30
5.2 Movement of Multilateral and Bilateral External Debt Under Government
Account (US$ billion) 30
5.3 Composition of Multilateral Sovereign Debt at end-March 2017 (per cent) 31
5.4 Composition of Bilateral Sovereign Debt at end-March 2017 (per cent) 31
5.5 Movement in Sovereign External Debt 31
5.6 Currency Composition of India’s Sovereign External Debt at
end-March 2016 (per cent) 32
5.7 Currency composition of India’s Sovereign External Debt at
end-March 2017 (per cent) 32
Page No.
(iii)
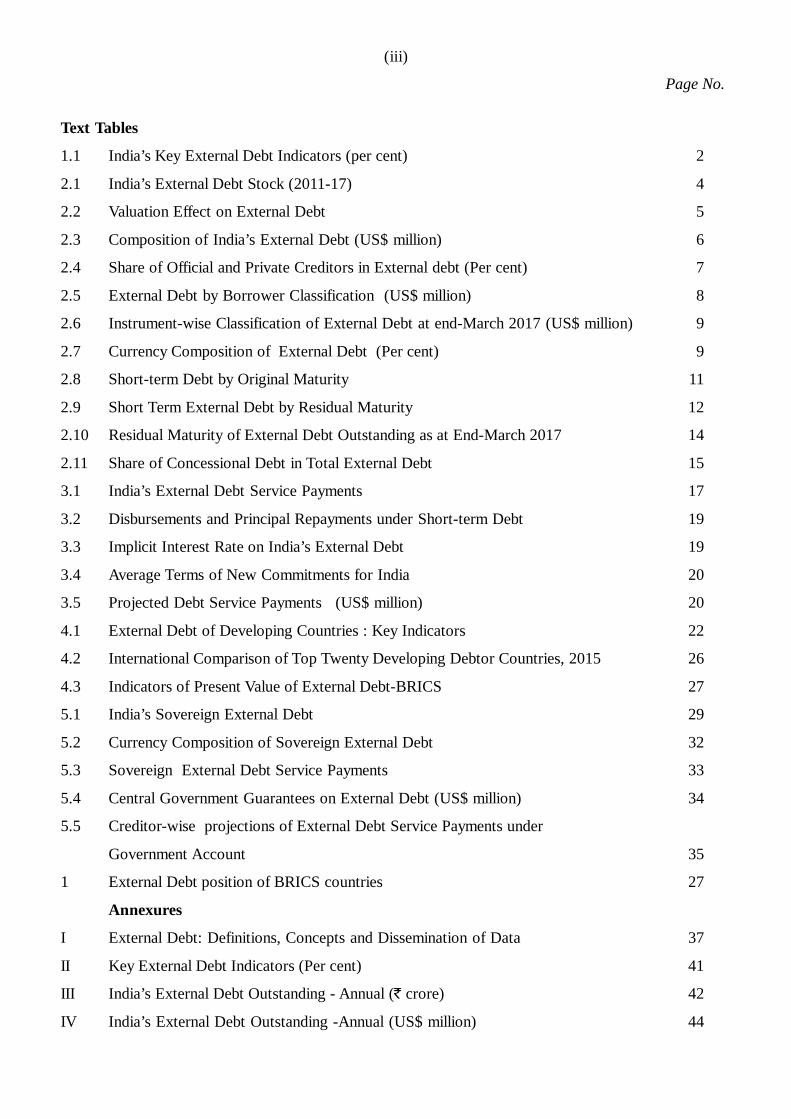
Text Tables
1.1 India’s Key External Debt Indicators (per cent) 2
2.1 India’s External Debt Stock (2011-17) 4
2.2 Valuation Effect on External Debt 5
2.3 Composition of India’s External Debt (US$ million) 6
2.4 Share of Official and Private Creditors in External debt (Per cent) 7
2.5 External Debt by Borrower Classification (US$ million) 8
2.6 Instrument-wise Classification of External Debt at end-March 2017 (US$ million) 9
2.7 Currency Composition of External Debt (Per cent) 9
2.8 Short-term Debt by Original Maturity 11
2.9 Short Term External Debt by Residual Maturity 12
2.10 Residual Maturity of External Debt Outstanding as at End-March 2017 14
2.11 Share of Concessional Debt in Total External Debt 15
3.1 India’s External Debt Service Payments 17
3.2 Disbursements and Principal Repayments under Short-term Debt 19
3.3 Implicit Interest Rate on India’s External Debt 19
3.4 Average Terms of New Commitments for India 20
3.5 Projected Debt Service Payments (US$ million) 20
4.1 External Debt of Developing Countries : Key Indicators 22
4.2 International Comparison of Top Twenty Developing Debtor Countries, 2015 26
4.3 Indicators of Present Value of External Debt-BRICS 27
5.1 India’s Sovereign External Debt 29
5.2 Currency Composition of Sovereign External Debt 32
5.3 Sovereign External Debt Service Payments 33
5.4 Central Government Guarantees on External Debt (US$ million) 34
5.5 Creditor-wise projections of External Debt Service Payments under
Government Account 35
1 External Debt position of BRICS countries 27
Annexures
I External Debt: Definitions, Concepts and Dissemination of Data 37
II Key External Debt Indicators (Per cent) 41
III India’s External Debt Outstanding - Annual (` crore) 42
IV India’s External Debt Outstanding -Annual (US$ million) 44
(iv)
Page No.
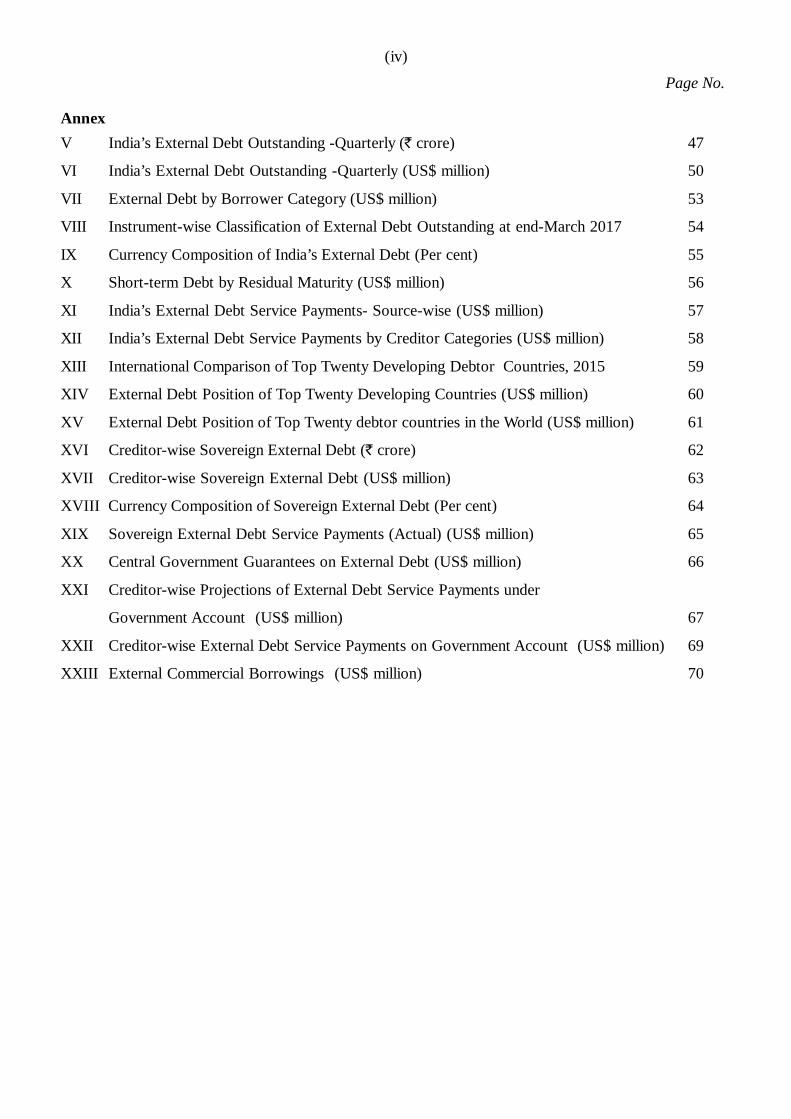
AnnexV India’s External Debt Outstanding -Quarterly (` crore) 47
VI India’s External Debt Outstanding -Quarterly (US$ million) 50
VII External Debt by Borrower Category (US$ million) 53
VIII Instrument-wise Classification of External Debt Outstanding at end-March 2017 54
IX Currency Composition of India’s External Debt (Per cent) 55
X Short-term Debt by Residual Maturity (US$ million) 56
XI India’s External Debt Service Payments- Source-wise (US$ million) 57
XII India’s External Debt Service Payments by Creditor Categories (US$ million) 58
XIII International Comparison of Top Twenty Developing Debtor Countries, 2015 59
XIV External Debt Position of Top Twenty Developing Countries (US$ million) 60
XV External Debt Position of Top Twenty debtor countries in the World (US$ million) 61
XVI Creditor-wise Sovereign External Debt (` crore) 62
XVII Creditor-wise Sovereign External Debt (US$ million) 63
XVIII Currency Composition of Sovereign External Debt (Per cent) 64
XIX Sovereign External Debt Service Payments (Actual) (US$ million) 65
XX Central Government Guarantees on External Debt (US$ million) 66
XXI Creditor-wise Projections of External Debt Service Payments under
Government Account (US$ million) 67
XXII Creditor-wise External Debt Service Payments on Government Account (US$ million) 69
XXIII External Commercial Borrowings (US$ million) 70
LIST OF ABBREVIATIONS
ADB Asian Development BankBoP Balance of PaymentsCAAA Controller of Aid Accounts and AuditCAD Current Account DeficitCUB Committed Undisbursed BalanceDEA Department of Economic AffairsECB External Commercial BorrowingsEDMU External Debt Management UnitFCCB Foreign Currency Convertible BondFCNR(A) Foreign Currency Non-Resident AccountFCNR(B) Foreign Currency Non-Resident Bank DepositFDI Foreign Direct InvestmentFIIs Foreign Institutional InvestorsFOREX Foreign Exchange ReservesFRBM Fiscal Responsibility and Budget ManagementGDP Gross Domestic ProductGDDS General Data Dissemination SystemGNI Gross National IncomeIBRD International Bank for Reconstruction and DevelopmentIDA International Development AssociationIDB India Development BondIFAD International Fund for Agricultural DevelopmentIFC (W) International Finance Corporation (Washington DC)IMD India Millennium DepositIMF International Monetary FundMOF Ministry of FinanceNRE Non Resident External AccountNRI Non-Resident IndianNR(E)RA Non-Resident (External) Rupee AccountNRO Non-Resident Ordinary AccountOECD Organisation for Economic Cooperation and Development
(v)
PR Partially RevisedPV Present ValueQE Quick EstimatesQEDS Quarterly External Debt StatisticsRBI Reserve Bank of IndiaRIB Resurgent India BondsSDDS Special Data Dissemination StandardsSDR Special Drawing RightsSED Sovereign External DebtSEBI Securities and Exchange Board of IndiaUS United StatesYOY Year onYear
(vi)
LIST OF ABBREVIATIONS
1
CHAPTER 1 OVERVIEW
1.1 India’s external debt stock, declined by US$ 13.1 billion (2.7 per cent) to US$ 471.9 billion at end-March 2017 over end-March 2016. The external debt-GDP ratio fell to 20.2 per cent at end-March 2017, from 23.5 per cent at end-March 2016.
1.2 Long-term external debt also decreased by 4.4 per cent to US$ 383.9 billion at end-March 2017 over end-March 2016. The share of long-term external debt in total external debt declined to 81.4 per cent at end-March 2017 from 82.8 per cent at end-March 2016. 1.3 Commercial borrowings followed by NRI deposits continue to be the major components of long-term debt with shares of 36.7 per cent and 24.8 per cent respectively at end-March 2017. The decrease in long-term external debt during end-March 2017 was mainly due to decline in two major components - NRI deposits, which in turn was due to the redemption of FCNR(B) deposits and decline in commercial borrowings. 1.4 Short-term external debt (original maturity) increased by 5.5 per cent to US$ 88.0 billion and its share in total external debt increased by 1.4 percentage points to 18.6 per cent at end-March 2017 over end-March 2016. This is mainly due to the increase in trade related credits, a major component of short-term debt with a share of 98.3 per cent. 1.5 However, the ratio of short term debt (residual maturity) to total external debt fell to 41.5 per cent at end-March 2017 from 42.7 per cent in the previous year as the increase in short term debt (original maturity) was more than offset by the fall in FCNR (B) deposits reflecting their redemption. 1.6 Government (sovereign) external debt increased from US$ 93.4 billion at end-March 2016 to US$ 95.8 billion at end-March 2017, and constituted 20.3 per cent of the total external debt, as compared to 19.3 per cent in the previous year. 1.7 The currency composition of India’s external debt shows that debt denominated in US dollar continues to remain the major component accounting for 52.1 per cent of total external debt at end-March 2017, followed by debt denominated in Indian rupee (33.6 per cent), SDR (5.8 per cent), Japanese yen (4.6 per cent) and Euro (2.9 per cent). 1.8 Valuation loss due to depreciation of the US dollar vis-à-vis the Indian rupee and some other currencies was at US$ 1.5 billion. Excluding the valuation effect, the decline in external debt would have been US$ 14.6 billion instead of US$ 13.1 billion at end-March 2017 over the previous year. 1.9 Most of the external debt indicators (Table 1.1) improved at end-March 2017 compared to end-March 2016 as given below.
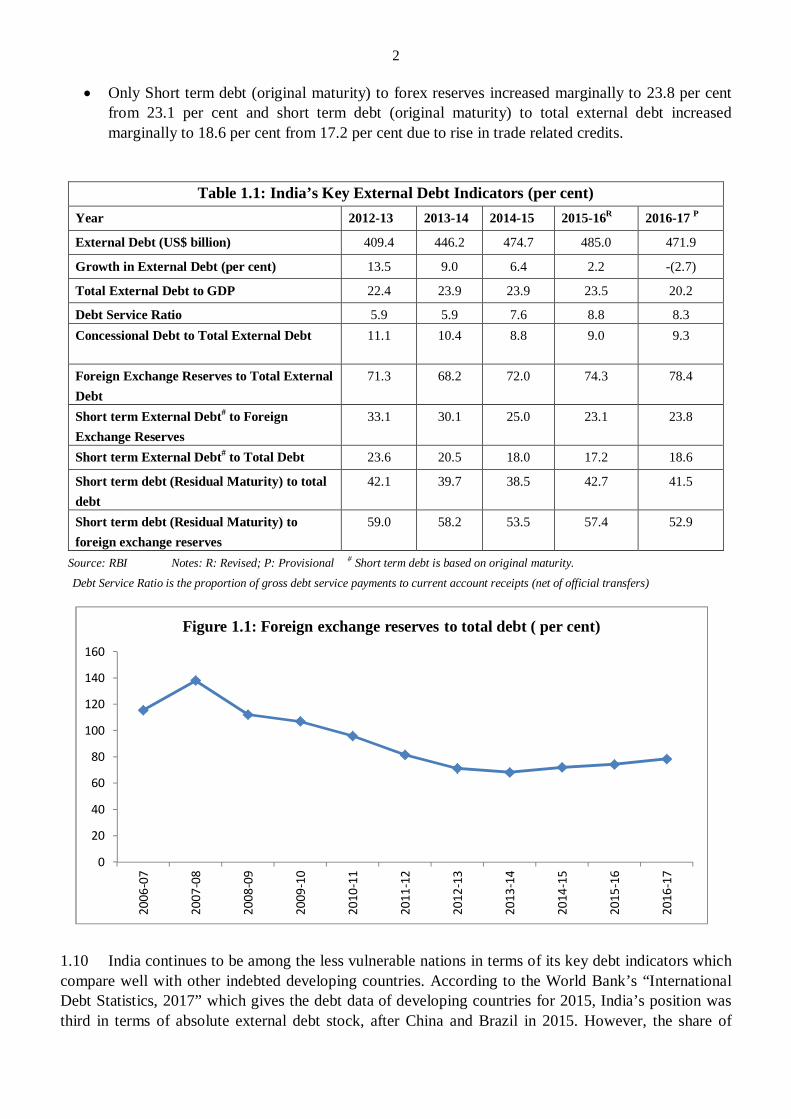
Ratio of external debt to GDP fell to 20.2 per cent from 23.5 per cent. Debt service ratio fell to 8.3 per cent from 8.8 per cent. Ratio of foreign exchange reserves to total external debt increased to 78.4 per cent from 74.3 per
cent (Figure 1.1). Ratio of concessional debt to total external debt increased to 9.3 per cent from 9.0 per cent. Short term debt (residual maturity) to total external debt fell to 41.5 per cent from 42.7 per cent.
This is because the increase in short term debt (original maturity) was more than offset by the fall in FCNR (B) deposits reflecting their redemption.
Short term debt (residual maturity) to forex reserves also fell to 52.9 per cent from 57.4 per cent.
2
Only Short term debt (original maturity) to forex reserves increased marginally to 23.8 per cent from 23.1 per cent and short term debt (original maturity) to total external debt increased marginally to 18.6 per cent from 17.2 per cent due to rise in trade related credits.
Table 1.1: India’s Key External Debt Indicators (per cent) Year 2012-13 2013-14 2014-15 2015-16R 2016-17 P
External Debt (US$ billion) 409.4 446.2 474.7 485.0 471.9
Growth in External Debt (per cent) 13.5 9.0 6.4 2.2 -(2.7)
Total External Debt to GDP 22.4 23.9 23.9 23.5 20.2
Debt Service Ratio 5.9 5.9 7.6 8.8 8.3 Concessional Debt to Total External Debt 11.1
10.4 8.8 9.0 9.3
Foreign Exchange Reserves to Total External Debt
71.3 68.2 72.0 74.3 78.4
Short term External Debt# to Foreign Exchange Reserves
33.1 30.1 25.0 23.1 23.8
Short term External Debt# to Total Debt 23.6 20.5 18.0 17.2 18.6
Short term debt (Residual Maturity) to total debt
42.1 39.7 38.5 42.7 41.5
Short term debt (Residual Maturity) to foreign exchange reserves
59.0 58.2 53.5 57.4 52.9
Source: RBI Notes: R: Revised; P: Provisional # Short term debt is based on original maturity.
Debt Service Ratio is the proportion of gross debt service payments to current account receipts (net of official transfers) 1.10 India continues to be among the less vulnerable nations in terms of its key debt indicators which compare well with other indebted developing countries. According to the World Bank’s “International Debt Statistics, 2017” which gives the debt data of developing countries for 2015, India’s position was third in terms of absolute external debt stock, after China and Brazil in 2015. However, the share of
0
20
40
60
80
100
120
140
160
2006
-07
2007
-08
2008
-09
2009
-10
2010
-11
2011
-12
2012
-13
2013
-14
2014
-15
2015
-16
2016
-17
Figure 1.1: Foreign exchange reserves to total debt ( per cent)
3
short term external debt to total external debt is only 18.4 per cent and 18.6 per cent in 2016 Q4 (end-December) and 2017 Q1 (end-March), respectively compared to the top debtor country, China’s 56.4 per cent and 59.0 per cent for these periods. The ratio of India’s external debt stock to gross national income (GNI) at 23.4 per cent was the fifth lowest and in terms of the cover provided by foreign exchange reserves to external debt, India’s position was sixth highest at 69.7 per cent in 2015. Among BRICS countries, in terms of indebtedness, India is at fourth position after China, Brazil and Russian Federation. Internationally the top 20 debtor countries in the world are the developed countries with the US at the top. India is not among the top 20 debtor countries in the world and is at 24th position.
4
CHAPTER 2 CLASSIFICATION OF EXTERNAL DEBT
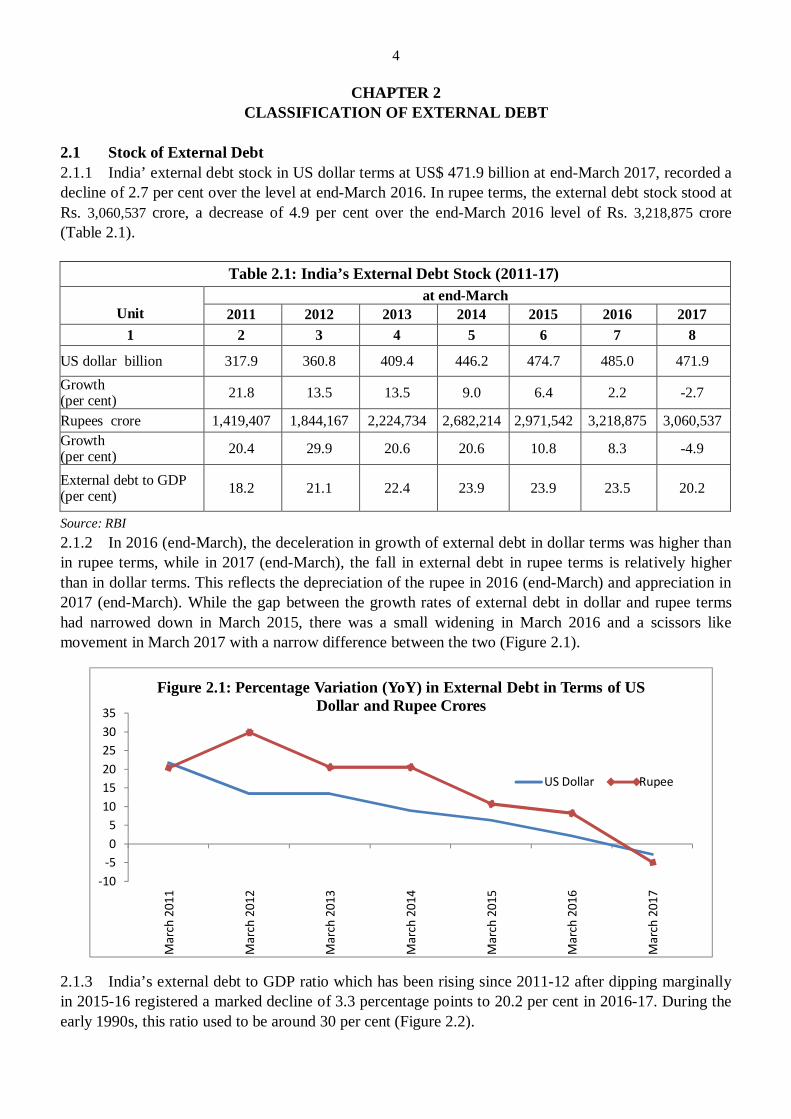
2.1 Stock of External Debt 2.1.1 India’ external debt stock in US dollar terms at US$ 471.9 billion at end-March 2017, recorded a decline of 2.7 per cent over the level at end-March 2016. In rupee terms, the external debt stock stood at Rs. 3,060,537 crore, a decrease of 4.9 per cent over the end-March 2016 level of Rs. 3,218,875 crore (Table 2.1).
Table 2.1: India’s External Debt Stock (2011-17)
Unit at end-March
2011 2012 2013 2014 2015 2016 2017 1 2 3 4 5 6 7 8
US dollar billion 317.9 360.8 409.4 446.2 474.7 485.0 471.9 Growth (per cent) 21.8 13.5 13.5 9.0 6.4 2.2 -2.7
Rupees crore 1,419,407 1,844,167 2,224,734 2,682,214 2,971,542 3,218,875 3,060,537 Growth (per cent) 20.4 29.9 20.6 20.6 10.8 8.3 -4.9
External debt to GDP (per cent) 18.2 21.1 22.4 23.9 23.9 23.5 20.2
Source: RBI 2.1.2 In 2016 (end-March), the deceleration in growth of external debt in dollar terms was higher than in rupee terms, while in 2017 (end-March), the fall in external debt in rupee terms is relatively higher than in dollar terms. This reflects the depreciation of the rupee in 2016 (end-March) and appreciation in 2017 (end-March). While the gap between the growth rates of external debt in dollar and rupee terms had narrowed down in March 2015, there was a small widening in March 2016 and a scissors like movement in March 2017 with a narrow difference between the two (Figure 2.1). 2.1.3 India’s external debt to GDP ratio which has been rising since 2011-12 after dipping marginally in 2015-16 registered a marked decline of 3.3 percentage points to 20.2 per cent in 2016-17. During the early 1990s, this ratio used to be around 30 per cent (Figure 2.2).
-10-505
101520253035
Mar
ch 2
011
Mar
ch 2
012
Mar
ch 2
013
Mar
ch 2
014
Mar
ch 2
015
Mar
ch 2
016
Mar
ch 2
017
Figure 2.1: Percentage Variation (YoY) in External Debt in Terms of US Dollar and Rupee Crores
US Dollar Rupee
5
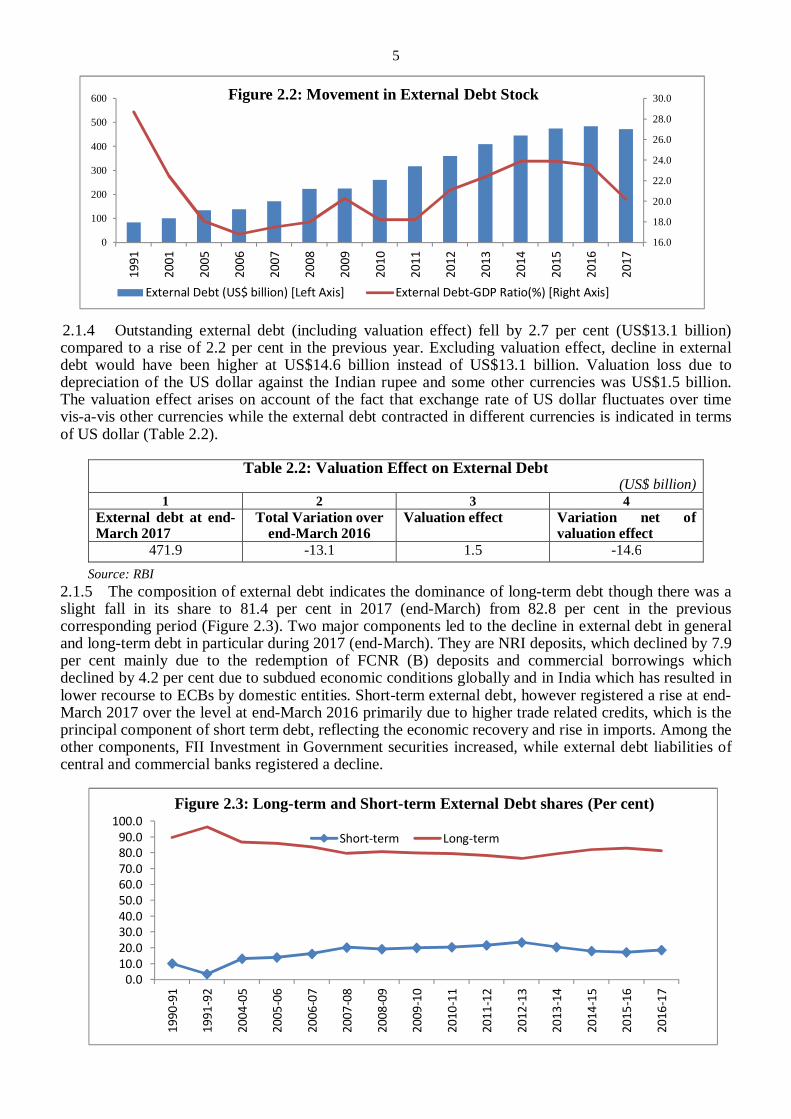
2.1.4 Outstanding external debt (including valuation effect) fell by 2.7 per cent (US$13.1 billion) compared to a rise of 2.2 per cent in the previous year. Excluding valuation effect, decline in external debt would have been higher at US$14.6 billion instead of US$13.1 billion. Valuation loss due to depreciation of the US dollar against the Indian rupee and some other currencies was US$1.5 billion. The valuation effect arises on account of the fact that exchange rate of US dollar fluctuates over time vis-a-vis other currencies while the external debt contracted in different currencies is indicated in terms of US dollar (Table 2.2).
Table 2.2: Valuation Effect on External Debt (US$ billion)
1 2 3 4 External debt at end-March 2017
Total Variation over end-March 2016
Valuation effect Variation net of valuation effect
471.9 -13.1 1.5 -14.6 Source: RBI 2.1.5 The composition of external debt indicates the dominance of long-term debt though there was a slight fall in its share to 81.4 per cent in 2017 (end-March) from 82.8 per cent in the previous corresponding period (Figure 2.3). Two major components led to the decline in external debt in general and long-term debt in particular during 2017 (end-March). They are NRI deposits, which declined by 7.9 per cent mainly due to the redemption of FCNR (B) deposits and commercial borrowings which declined by 4.2 per cent due to subdued economic conditions globally and in India which has resulted in lower recourse to ECBs by domestic entities. Short-term external debt, however registered a rise at end-March 2017 over the level at end-March 2016 primarily due to higher trade related credits, which is the principal component of short term debt, reflecting the economic recovery and rise in imports. Among the other components, FII Investment in Government securities increased, while external debt liabilities of central and commercial banks registered a decline.
16.0
18.0
20.0
22.0
24.0
26.0
28.0
30.0
0
100
200
300
400
500
600
1991
2001
2005
2006
2007
2008
2009
2010
2011
2012
2013
2014
2015
2016
2017
Figure 2.2: Movement in External Debt Stock
External Debt (US$ billion) [Left Axis] External Debt-GDP Ratio(%) [Right Axis]
0.010.020.030.040.050.060.070.080.090.0
100.0
1990
-91
1991
-92
2004
-05
2005
-06
2006
-07
2007
-08
2008
-09
2009
-10
2010
-11
2011
-12
2012
-13
2013
-14
2014
-15
2015
-16
2016
-17
Figure 2.3: Long-term and Short-term External Debt shares (Per cent)
Short-term Long-term
6
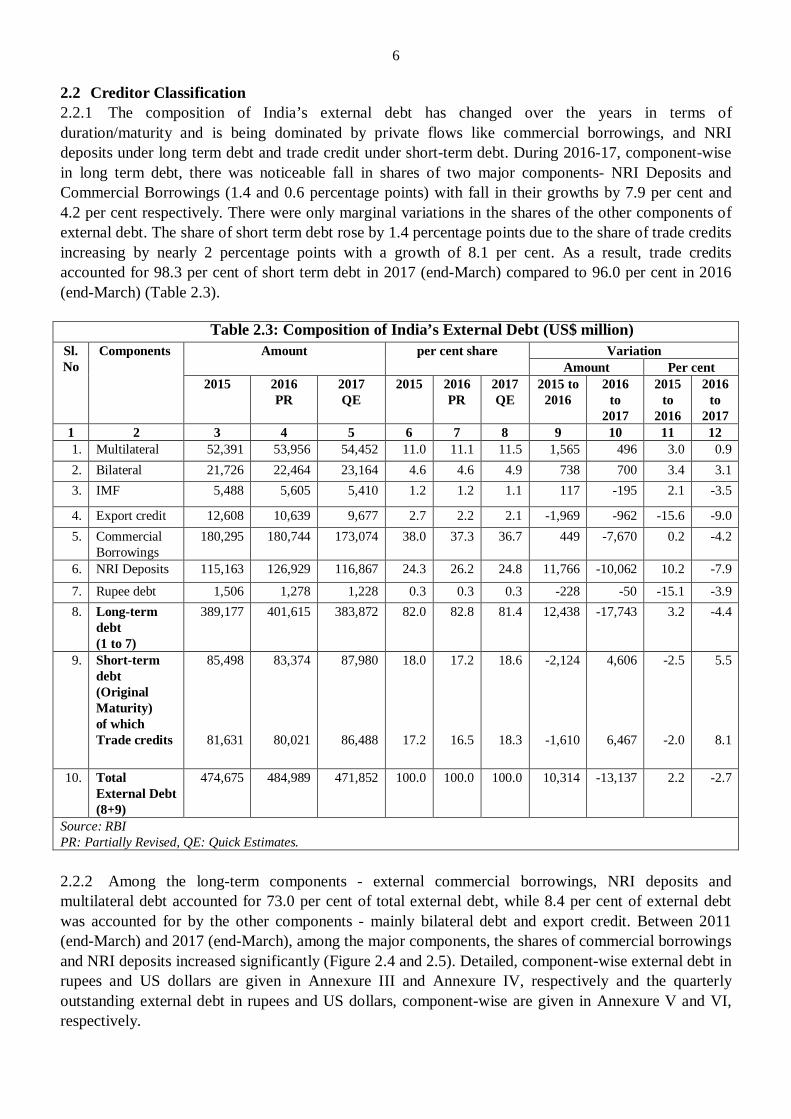
2.2 Creditor Classification 2.2.1 The composition of India’s external debt has changed over the years in terms of duration/maturity and is being dominated by private flows like commercial borrowings, and NRI deposits under long term debt and trade credit under short-term debt. During 2016-17, component-wise in long term debt, there was noticeable fall in shares of two major components- NRI Deposits and Commercial Borrowings (1.4 and 0.6 percentage points) with fall in their growths by 7.9 per cent and 4.2 per cent respectively. There were only marginal variations in the shares of the other components of external debt. The share of short term debt rose by 1.4 percentage points due to the share of trade credits increasing by nearly 2 percentage points with a growth of 8.1 per cent. As a result, trade credits accounted for 98.3 per cent of short term debt in 2017 (end-March) compared to 96.0 per cent in 2016 (end-March) (Table 2.3).
Table 2.3: Composition of India’s External Debt (US$ million) Sl. No
Components Amount per cent share Variation Amount Per cent
2015 2016 PR
2017 QE
2015
2016 PR
2017 QE
2015 to 2016
2016 to
2017
2015 to
2016
2016 to
2017 1 2 3 4 5 6 7 8 9 10 11 12 1. Multilateral 52,391 53,956 54,452 11.0 11.1 11.5 1,565 496 3.0 0.9 2. Bilateral 21,726 22,464 23,164 4.6 4.6 4.9 738 700 3.4 3.1 3. IMF 5,488 5,605 5,410 1.2 1.2 1.1 117 -195 2.1 -3.5
4. Export credit 12,608 10,639 9,677 2.7 2.2 2.1 -1,969 -962 -15.6 -9.0 5. Commercial
Borrowings 180,295 180,744 173,074 38.0 37.3 36.7 449 -7,670 0.2 -4.2
6. NRI Deposits 115,163 126,929 116,867 24.3 26.2 24.8 11,766 -10,062 10.2 -7.9
7. Rupee debt 1,506 1,278 1,228 0.3 0.3 0.3 -228 -50 -15.1 -3.9 8. Long-term
debt (1 to 7)
389,177 401,615 383,872 82.0 82.8 81.4 12,438 -17,743 3.2 -4.4
9. Short-term debt (Original Maturity) of which Trade credits
85,498
81,631
83,374
80,021
87,980
86,488
18.0
17.2
17.2
16.5
18.6
18.3
-2,124
-1,610
4,606
6,467
-2.5
-2.0
5.5
8.1
10. Total External Debt (8+9)
474,675 484,989 471,852 100.0 100.0 100.0 10,314 -13,137 2.2 -2.7
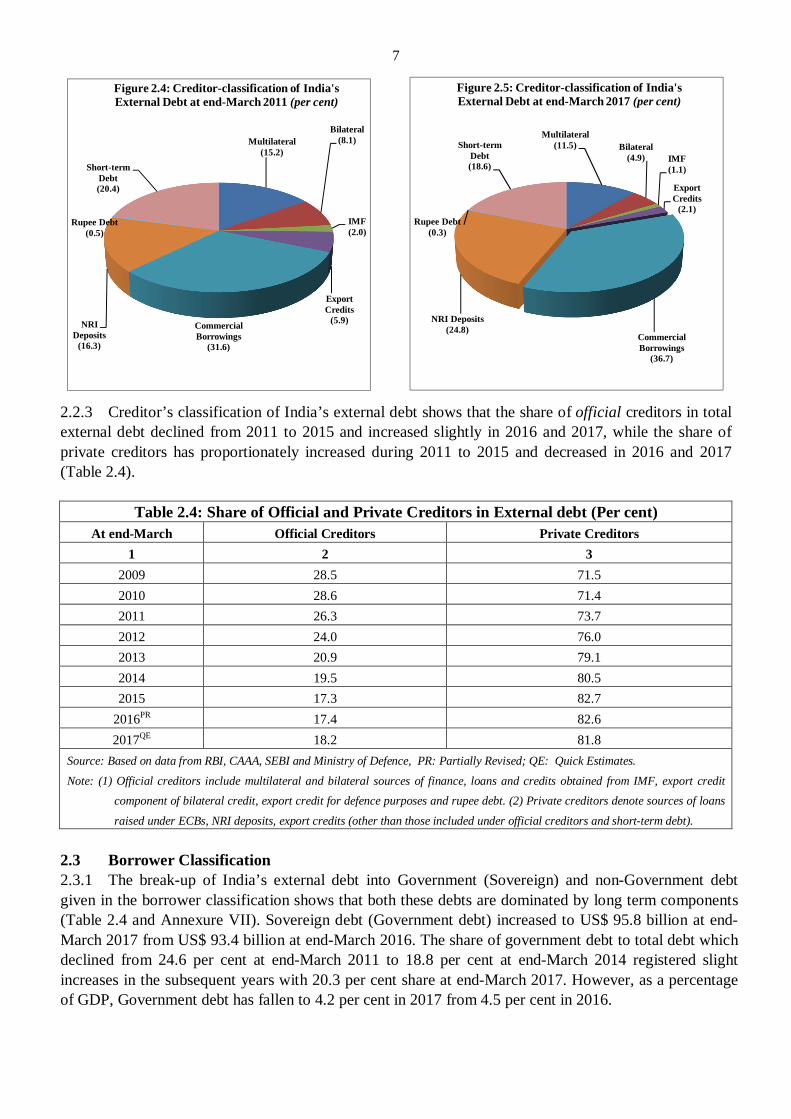
Source: RBI PR: Partially Revised, QE: Quick Estimates. 2.2.2 Among the long-term components - external commercial borrowings, NRI deposits and multilateral debt accounted for 73.0 per cent of total external debt, while 8.4 per cent of external debt was accounted for by the other components - mainly bilateral debt and export credit. Between 2011 (end-March) and 2017 (end-March), among the major components, the shares of commercial borrowings and NRI deposits increased significantly (Figure 2.4 and 2.5). Detailed, component-wise external debt in rupees and US dollars are given in Annexure III and Annexure IV, respectively and the quarterly outstanding external debt in rupees and US dollars, component-wise are given in Annexure V and VI, respectively.
7
2.2.3 Creditor’s classification of India’s external debt shows that the share of official creditors in total external debt declined from 2011 to 2015 and increased slightly in 2016 and 2017, while the share of private creditors has proportionately increased during 2011 to 2015 and decreased in 2016 and 2017 (Table 2.4).
Table 2.4: Share of Official and Private Creditors in External debt (Per cent) At end-March Official Creditors Private Creditors
1 2 3 2009 28.5 71.5 2010 28.6 71.4 2011 26.3 73.7 2012 24.0 76.0 2013 20.9 79.1 2014 19.5 80.5 2015 17.3 82.7
2016PR 17.4 82.6 2017QE 18.2 81.8
Source: Based on data from RBI, CAAA, SEBI and Ministry of Defence, PR: Partially Revised; QE: Quick Estimates.
Note: (1) Official creditors include multilateral and bilateral sources of finance, loans and credits obtained from IMF, export credit component of bilateral credit, export credit for defence purposes and rupee debt. (2) Private creditors denote sources of loans
raised under ECBs, NRI deposits, export credits (other than those included under official creditors and short-term debt).
2.3 Borrower Classification 2.3.1 The break-up of India’s external debt into Government (Sovereign) and non-Government debt given in the borrower classification shows that both these debts are dominated by long term components (Table 2.4 and Annexure VII). Sovereign debt (Government debt) increased to US$ 95.8 billion at end-March 2017 from US$ 93.4 billion at end-March 2016. The share of government debt to total debt which declined from 24.6 per cent at end-March 2011 to 18.8 per cent at end-March 2014 registered slight increases in the subsequent years with 20.3 per cent share at end-March 2017. However, as a percentage of GDP, Government debt has fallen to 4.2 per cent in 2017 from 4.5 per cent in 2016.
Multilateral(15.2)
Bilateral(8.1)
IMF(2.0)
Export Credits
(5.9)Commercial Borrowings
(31.6)
NRI Deposits
(16.3)
Rupee Debt(0.5)
Short-term Debt(20.4)
Figure 2.4: Creditor-classification of India's External Debt at end-March 2011 (per cent)
Multilateral(11.5) Bilateral
(4.9) IMF(1.1)
Export Credits
(2.1)
Commercial Borrowings
(36.7)
NRI Deposits(24.8)
Rupee Debt(0.3)
Short-term Debt(18.6)
Figure 2.5: Creditor-classification of India's External Debt at end-March 2017 (per cent)
8
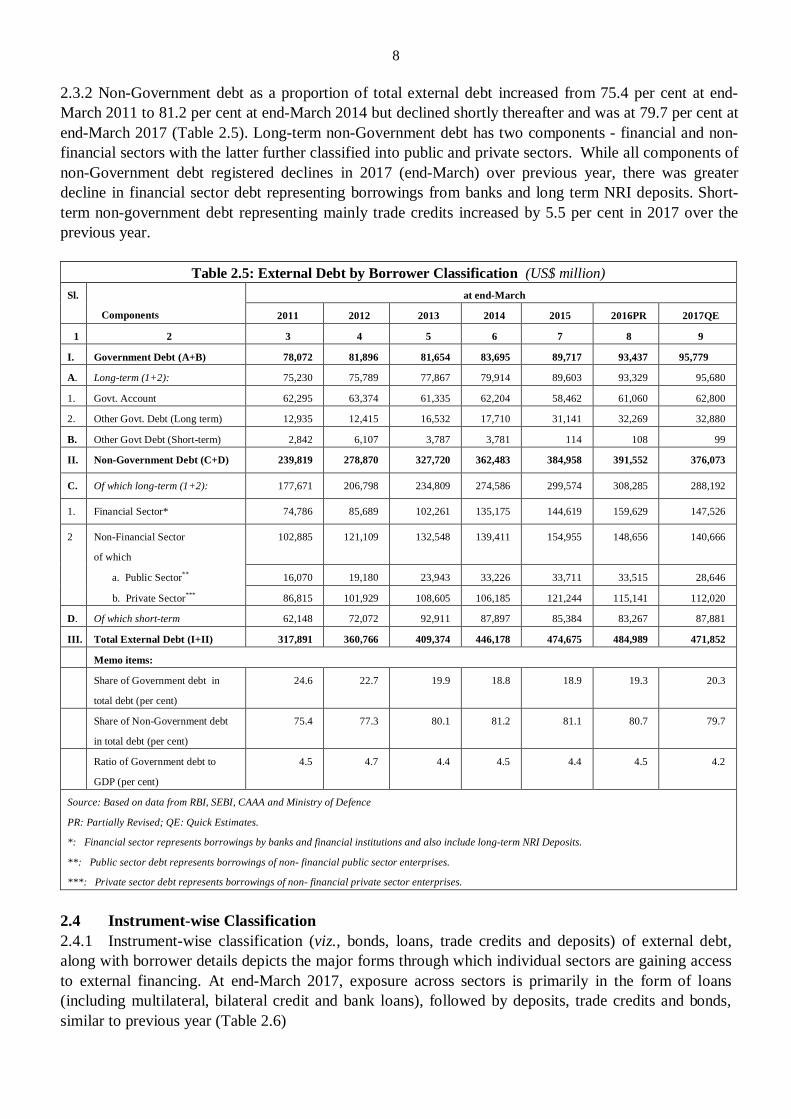
2.3.2 Non-Government debt as a proportion of total external debt increased from 75.4 per cent at end-March 2011 to 81.2 per cent at end-March 2014 but declined shortly thereafter and was at 79.7 per cent at end-March 2017 (Table 2.5). Long-term non-Government debt has two components - financial and non-financial sectors with the latter further classified into public and private sectors. While all components of non-Government debt registered declines in 2017 (end-March) over previous year, there was greater decline in financial sector debt representing borrowings from banks and long term NRI deposits. Short-term non-government debt representing mainly trade credits increased by 5.5 per cent in 2017 over the previous year.
Table 2.5: External Debt by Borrower Classification (US$ million) Sl.
Components
at end-March
2011 2012 2013 2014 2015 2016PR 2017QE
1 2 3 4 5 6 7 8 9
I. Government Debt (A+B) 78,072 81,896 81,654 83,695 89,717 93,437 95,779
A. Long-term (1+2): 75,230 75,789 77,867 79,914 89,603 93,329 95,680
1. Govt. Account 62,295 63,374 61,335 62,204 58,462 61,060 62,800
2. Other Govt. Debt (Long term) 12,935 12,415 16,532 17,710 31,141 32,269 32,880
B. Other Govt Debt (Short-term) 2,842 6,107 3,787 3,781 114 108 99
II. Non-Government Debt (C+D) 239,819 278,870 327,720 362,483 384,958 391,552 376,073
C. Of which long-term (1+2): 177,671 206,798 234,809 274,586 299,574 308,285 288,192
1. Financial Sector* 74,786 85,689 102,261 135,175 144,619 159,629 147,526
2 Non-Financial Sector
of which
102,885 121,109 132,548 139,411 154,955 148,656 140,666
a. Public Sector** 16,070 19,180 23,943 33,226 33,711 33,515 28,646
b. Private Sector*** 86,815 101,929 108,605 106,185 121,244 115,141 112,020
D. Of which short-term 62,148 72,072 92,911 87,897 85,384 83,267 87,881
III. Total External Debt (I+II) 317,891 360,766 409,374 446,178 474,675 484,989 471,852
Memo items:
Share of Government debt in
total debt (per cent)
24.6 22.7 19.9 18.8 18.9 19.3 20.3
Share of Non-Government debt
in total debt (per cent)
75.4 77.3 80.1 81.2 81.1 80.7 79.7
Ratio of Government debt to
GDP (per cent)
4.5 4.7 4.4 4.5 4.4 4.5 4.2
Source: Based on data from RBI, SEBI, CAAA and Ministry of Defence
PR: Partially Revised; QE: Quick Estimates.
*: Financial sector represents borrowings by banks and financial institutions and also include long-term NRI Deposits.
**: Public sector debt represents borrowings of non- financial public sector enterprises.
***: Private sector debt represents borrowings of non- financial private sector enterprises.
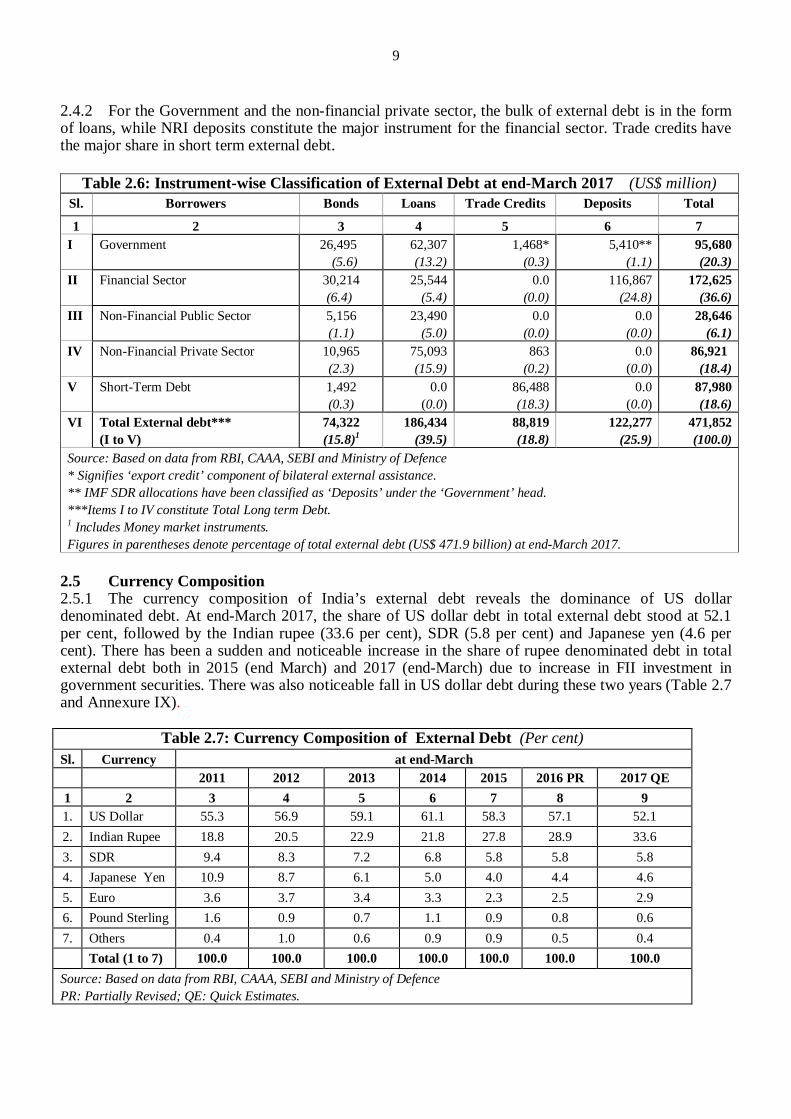
2.4 Instrument-wise Classification 2.4.1 Instrument-wise classification (viz., bonds, loans, trade credits and deposits) of external debt, along with borrower details depicts the major forms through which individual sectors are gaining access to external financing. At end-March 2017, exposure across sectors is primarily in the form of loans (including multilateral, bilateral credit and bank loans), followed by deposits, trade credits and bonds, similar to previous year (Table 2.6)
9
2.4.2 For the Government and the non-financial private sector, the bulk of external debt is in the form of loans, while NRI deposits constitute the major instrument for the financial sector. Trade credits have the major share in short term external debt.
Table 2.6: Instrument-wise Classification of External Debt at end-March 2017 (US$ million) Sl. Borrowers Bonds Loans Trade Credits Deposits Total
1 2 3 4 5 6 7 I Government 26,495
(5.6) 62,307 (13.2)
1,468* (0.3)
5,410** (1.1)
95,680 (20.3)
II Financial Sector 30,214 (6.4)
25,544 (5.4)
0.0 (0.0)
116,867 (24.8)
172,625 (36.6)
III Non-Financial Public Sector 5,156 (1.1)
23,490 (5.0)
0.0 (0.0)
0.0 (0.0)
28,646 (6.1)
IV Non-Financial Private Sector 10,965 (2.3)
75,093 (15.9)
863 (0.2)
0.0 (0.0)
86,921 (18.4)
V Short-Term Debt 1,492 (0.3)
0.0 (0.0)
86,488 (18.3)
0.0 (0.0)
87,980 (18.6)
VI Total External debt*** (I to V)
74,322 (15.8)1
186,434 (39.5)
88,819 (18.8)
122,277 (25.9)
471,852 (100.0)
Source: Based on data from RBI, CAAA, SEBI and Ministry of Defence * Signifies ‘export credit’ component of bilateral external assistance. ** IMF SDR allocations have been classified as ‘Deposits’ under the ‘Government’ head. ***Items I to IV constitute Total Long term Debt. 1 Includes Money market instruments. Figures in parentheses denote percentage of total external debt (US$ 471.9 billion) at end-March 2017.
2.5 Currency Composition 2.5.1 The currency composition of India’s external debt reveals the dominance of US dollar denominated debt. At end-March 2017, the share of US dollar debt in total external debt stood at 52.1 per cent, followed by the Indian rupee (33.6 per cent), SDR (5.8 per cent) and Japanese yen (4.6 per cent). There has been a sudden and noticeable increase in the share of rupee denominated debt in total external debt both in 2015 (end March) and 2017 (end-March) due to increase in FII investment in government securities. There was also noticeable fall in US dollar debt during these two years (Table 2.7 and Annexure IX).
Table 2.7: Currency Composition of External Debt (Per cent) Sl. Currency at end-March 2011 2012 2013 2014 2015 2016 PR 2017 QE 1 2 3 4 5 6 7 8 9 1. US Dollar 55.3 56.9 59.1 61.1 58.3 57.1 52.1 2. Indian Rupee 18.8 20.5 22.9 21.8 27.8 28.9 33.6 3. SDR 9.4 8.3 7.2 6.8 5.8 5.8 5.8 4. Japanese Yen 10.9 8.7 6.1 5.0 4.0 4.4 4.6 5. Euro 3.6 3.7 3.4 3.3 2.3 2.5 2.9 6. Pound Sterling 1.6 0.9 0.7 1.1 0.9 0.8 0.6 7. Others 0.4 1.0 0.6 0.9 0.9 0.5 0.4 Total (1 to 7) 100.0 100.0 100.0 100.0 100.0 100.0 100.0
Source: Based on data from RBI, CAAA, SEBI and Ministry of Defence PR: Partially Revised; QE: Quick Estimates.
10
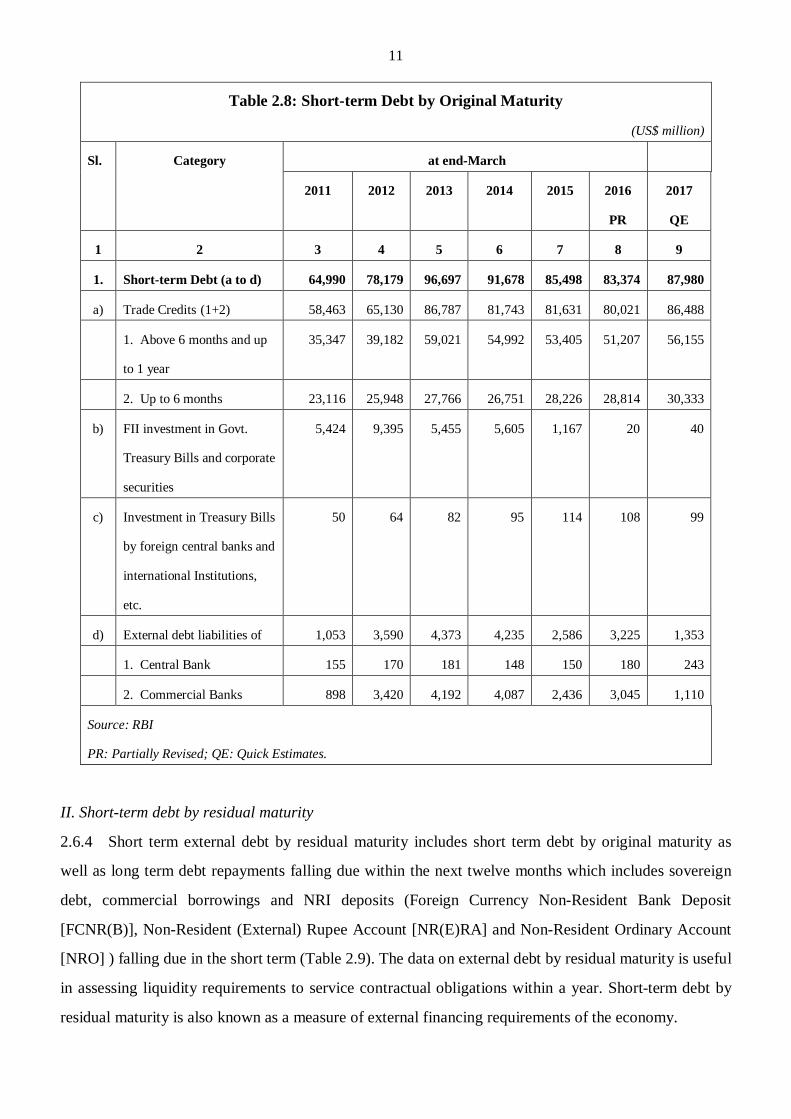
2.6 Short-term External Debt I. Short-term debt based on original maturity
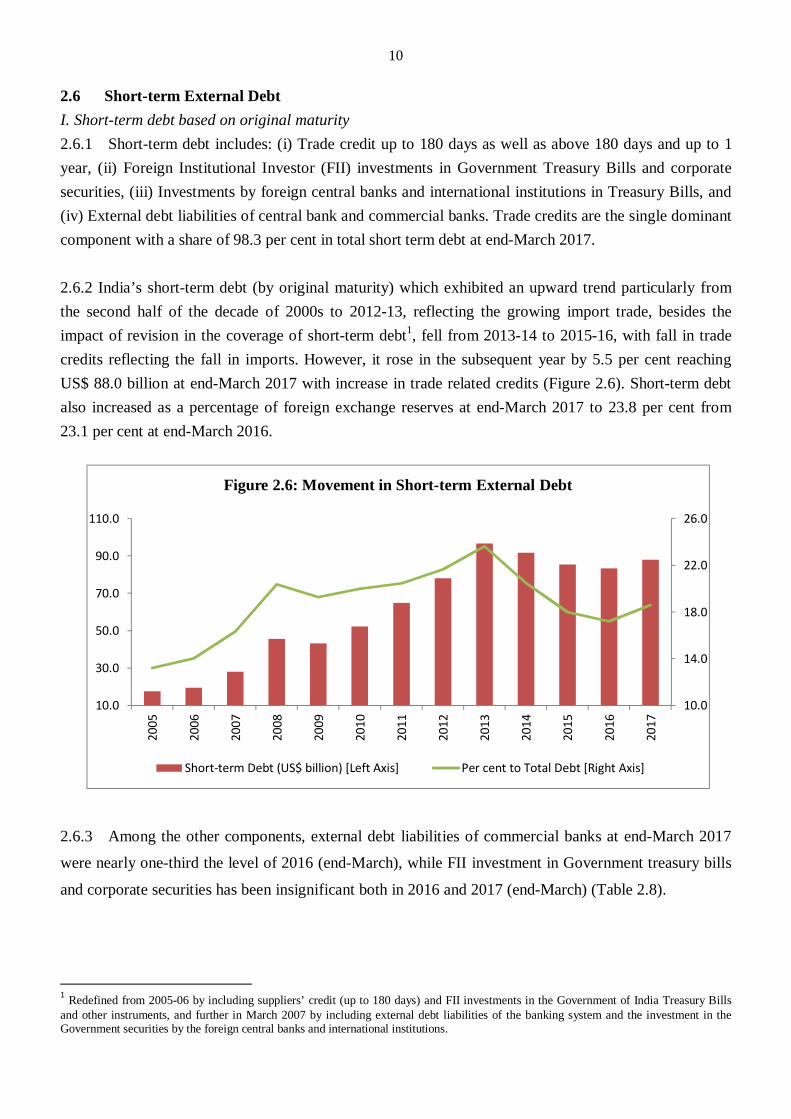
2.6.1 Short-term debt includes: (i) Trade credit up to 180 days as well as above 180 days and up to 1 year, (ii) Foreign Institutional Investor (FII) investments in Government Treasury Bills and corporate securities, (iii) Investments by foreign central banks and international institutions in Treasury Bills, and (iv) External debt liabilities of central bank and commercial banks. Trade credits are the single dominant component with a share of 98.3 per cent in total short term debt at end-March 2017. 2.6.2 India’s short-term debt (by original maturity) which exhibited an upward trend particularly from the second half of the decade of 2000s to 2012-13, reflecting the growing import trade, besides the impact of revision in the coverage of short-term debt1, fell from 2013-14 to 2015-16, with fall in trade credits reflecting the fall in imports. However, it rose in the subsequent year by 5.5 per cent reaching US$ 88.0 billion at end-March 2017 with increase in trade related credits (Figure 2.6). Short-term debt also increased as a percentage of foreign exchange reserves at end-March 2017 to 23.8 per cent from 23.1 per cent at end-March 2016. 2.6.3 Among the other components, external debt liabilities of commercial banks at end-March 2017
were nearly one-third the level of 2016 (end-March), while FII investment in Government treasury bills
and corporate securities has been insignificant both in 2016 and 2017 (end-March) (Table 2.8).
1 Redefined from 2005-06 by including suppliers’ credit (up to 180 days) and FII investments in the Government of India Treasury Bills and other instruments, and further in March 2007 by including external debt liabilities of the banking system and the investment in the Government securities by the foreign central banks and international institutions.
10.0
14.0
18.0
22.0
26.0
10.0
30.0
50.0
70.0
90.0
110.0
2005
2006
2007
2008
2009
2010
2011
2012
2013
2014
2015
2016
2017
Figure 2.6: Movement in Short-term External Debt
Short-term Debt (US$ billion) [Left Axis] Per cent to Total Debt [Right Axis]
11
Table 2.8: Short-term Debt by Original Maturity
(US$ million)
Sl. Category at end-March
2011 2012
2013
2014
2015
2016
PR
2017
QE
1 2 3 4 5 6 7 8 9
1. Short-term Debt (a to d) 64,990 78,179 96,697 91,678 85,498 83,374 87,980
a) Trade Credits (1+2) 58,463 65,130 86,787 81,743 81,631 80,021 86,488
1. Above 6 months and up
to 1 year
35,347 39,182 59,021 54,992 53,405 51,207 56,155
2. Up to 6 months 23,116 25,948 27,766 26,751 28,226 28,814 30,333
b) FII investment in Govt.
Treasury Bills and corporate
securities
5,424 9,395 5,455 5,605 1,167 20 40
c) Investment in Treasury Bills
by foreign central banks and
international Institutions,
etc.
50 64 82 95 114 108 99
d) External debt liabilities of 1,053 3,590 4,373 4,235 2,586 3,225 1,353
1. Central Bank 155 170 181 148 150 180 243
2. Commercial Banks 898 3,420 4,192 4,087 2,436 3,045 1,110
Source: RBI
PR: Partially Revised; QE: Quick Estimates.
II. Short-term debt by residual maturity
2.6.4 Short term external debt by residual maturity includes short term debt by original maturity as
well as long term debt repayments falling due within the next twelve months which includes sovereign
debt, commercial borrowings and NRI deposits (Foreign Currency Non-Resident Bank Deposit
[FCNR(B)], Non-Resident (External) Rupee Account [NR(E)RA] and Non-Resident Ordinary Account
[NRO] ) falling due in the short term (Table 2.9). The data on external debt by residual maturity is useful
in assessing liquidity requirements to service contractual obligations within a year. Short-term debt by
residual maturity is also known as a measure of external financing requirements of the economy.
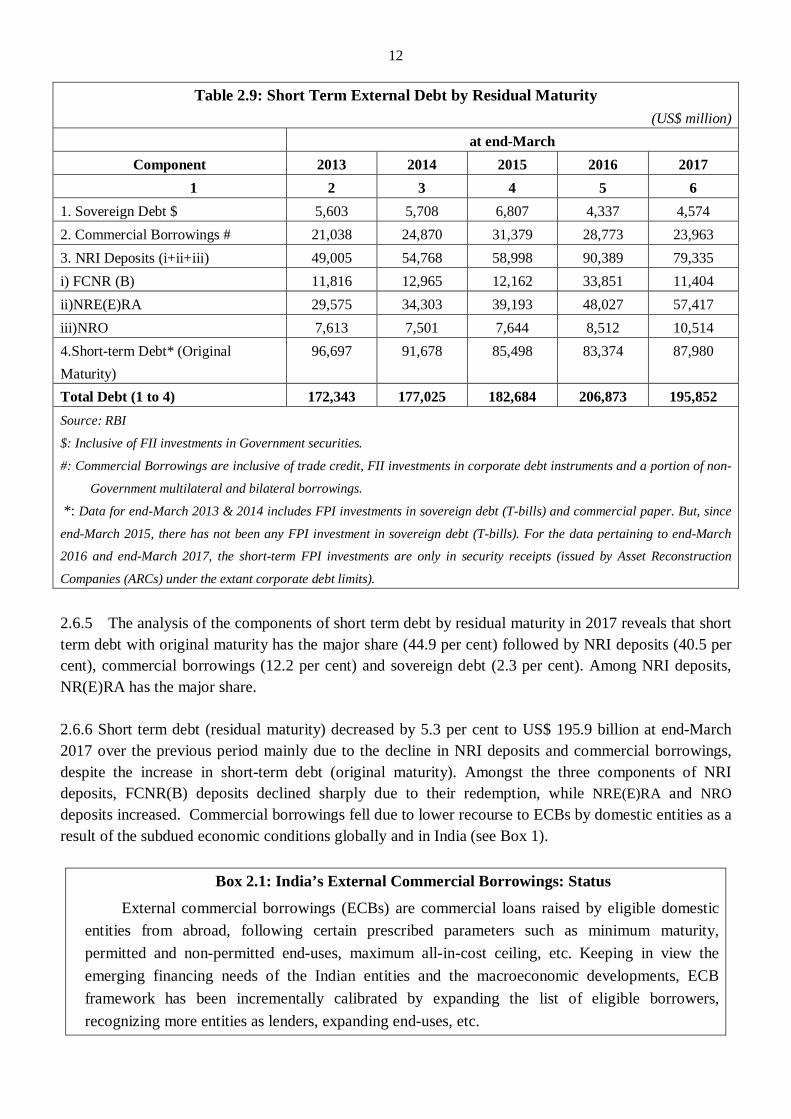
12
Table 2.9: Short Term External Debt by Residual Maturity (US$ million)
at end-March Component 2013 2014 2015 2016 2017
1 2 3 4 5 6 1. Sovereign Debt $ 5,603 5,708 6,807 4,337 4,574 2. Commercial Borrowings # 21,038 24,870 31,379 28,773 23,963 3. NRI Deposits (i+ii+iii) 49,005 54,768 58,998 90,389 79,335 i) FCNR (B) 11,816 12,965 12,162 33,851 11,404 ii)NRE(E)RA 29,575 34,303 39,193 48,027 57,417 iii)NRO 7,613 7,501 7,644 8,512 10,514 4.Short-term Debt* (Original Maturity)
96,697 91,678 85,498 83,374 87,980
Total Debt (1 to 4) 172,343 177,025 182,684 206,873 195,852 Source: RBI
$: Inclusive of FII investments in Government securities.
#: Commercial Borrowings are inclusive of trade credit, FII investments in corporate debt instruments and a portion of non-
Government multilateral and bilateral borrowings.
*: Data for end-March 2013 & 2014 includes FPI investments in sovereign debt (T-bills) and commercial paper. But, since
end-March 2015, there has not been any FPI investment in sovereign debt (T-bills). For the data pertaining to end-March
2016 and end-March 2017, the short-term FPI investments are only in security receipts (issued by Asset Reconstruction
Companies (ARCs) under the extant corporate debt limits).
2.6.5 The analysis of the components of short term debt by residual maturity in 2017 reveals that short term debt with original maturity has the major share (44.9 per cent) followed by NRI deposits (40.5 per cent), commercial borrowings (12.2 per cent) and sovereign debt (2.3 per cent). Among NRI deposits, NR(E)RA has the major share. 2.6.6 Short term debt (residual maturity) decreased by 5.3 per cent to US$ 195.9 billion at end-March 2017 over the previous period mainly due to the decline in NRI deposits and commercial borrowings, despite the increase in short-term debt (original maturity). Amongst the three components of NRI deposits, FCNR(B) deposits declined sharply due to their redemption, while NRE(E)RA and NRO deposits increased. Commercial borrowings fell due to lower recourse to ECBs by domestic entities as a result of the subdued economic conditions globally and in India (see Box 1).
Box 2.1: India’s External Commercial Borrowings: Status
External commercial borrowings (ECBs) are commercial loans raised by eligible domestic entities from abroad, following certain prescribed parameters such as minimum maturity, permitted and non-permitted end-uses, maximum all-in-cost ceiling, etc. Keeping in view the emerging financing needs of the Indian entities and the macroeconomic developments, ECB framework has been incrementally calibrated by expanding the list of eligible borrowers, recognizing more entities as lenders, expanding end-uses, etc.
13
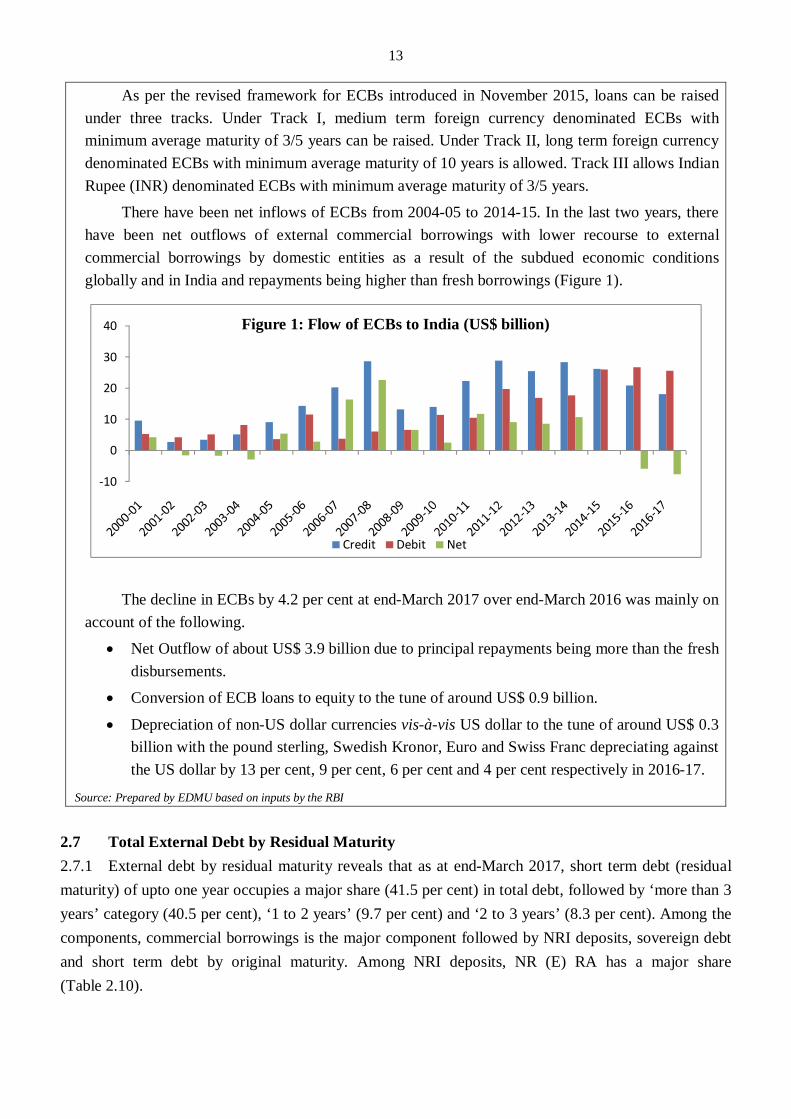
As per the revised framework for ECBs introduced in November 2015, loans can be raised under three tracks. Under Track I, medium term foreign currency denominated ECBs with minimum average maturity of 3/5 years can be raised. Under Track II, long term foreign currency denominated ECBs with minimum average maturity of 10 years is allowed. Track III allows Indian Rupee (INR) denominated ECBs with minimum average maturity of 3/5 years.
There have been net inflows of ECBs from 2004-05 to 2014-15. In the last two years, there have been net outflows of external commercial borrowings with lower recourse to external commercial borrowings by domestic entities as a result of the subdued economic conditions globally and in India and repayments being higher than fresh borrowings (Figure 1).
The decline in ECBs by 4.2 per cent at end-March 2017 over end-March 2016 was mainly on account of the following.
Net Outflow of about US$ 3.9 billion due to principal repayments being more than the fresh disbursements.
Conversion of ECB loans to equity to the tune of around US$ 0.9 billion.
Depreciation of non-US dollar currencies vis-à-vis US dollar to the tune of around US$ 0.3 billion with the pound sterling, Swedish Kronor, Euro and Swiss Franc depreciating against the US dollar by 13 per cent, 9 per cent, 6 per cent and 4 per cent respectively in 2016-17.
Source: Prepared by EDMU based on inputs by the RBI
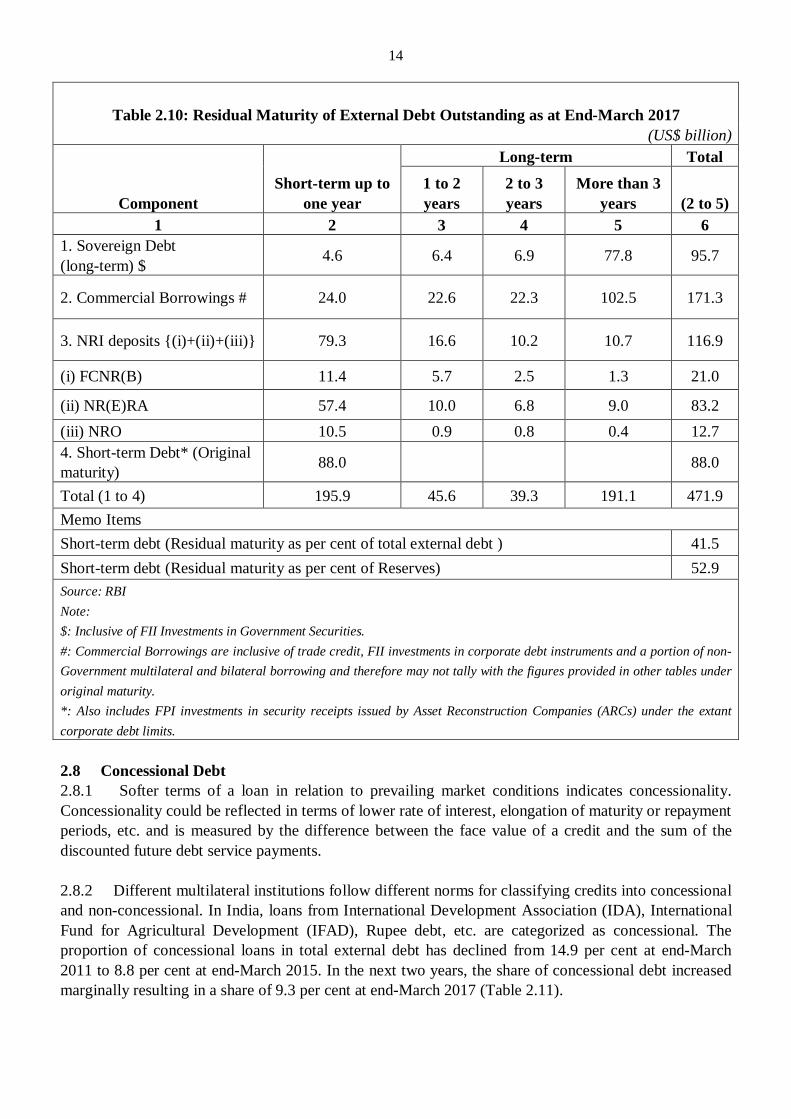
2.7 Total External Debt by Residual Maturity 2.7.1 External debt by residual maturity reveals that as at end-March 2017, short term debt (residual maturity) of upto one year occupies a major share (41.5 per cent) in total debt, followed by ‘more than 3 years’ category (40.5 per cent), ‘1 to 2 years’ (9.7 per cent) and ‘2 to 3 years’ (8.3 per cent). Among the components, commercial borrowings is the major component followed by NRI deposits, sovereign debt and short term debt by original maturity. Among NRI deposits, NR (E) RA has a major share (Table 2.10).
-10
0
10
20
30
40 Figure 1: Flow of ECBs to India (US$ billion)
Credit Debit Net
14
Table 2.10: Residual Maturity of External Debt Outstanding as at End-March 2017 (US$ billion)
Component Short-term up to
one year
Long-term Total
1 to 2 years
2 to 3 years
More than 3 years (2 to 5)
1 2 3 4 5 6 1. Sovereign Debt (long-term) $ 4.6 6.4 6.9 77.8 95.7
2. Commercial Borrowings # 24.0 22.6 22.3 102.5 171.3
3. NRI deposits {(i)+(ii)+(iii)} 79.3 16.6 10.2 10.7 116.9
(i) FCNR(B) 11.4 5.7 2.5 1.3 21.0
(ii) NR(E)RA 57.4 10.0 6.8 9.0 83.2 (iii) NRO 10.5 0.9 0.8 0.4 12.7 4. Short-term Debt* (Original maturity) 88.0 88.0
Total (1 to 4) 195.9 45.6 39.3 191.1 471.9 Memo Items Short-term debt (Residual maturity as per cent of total external debt ) 41.5 Short-term debt (Residual maturity as per cent of Reserves) 52.9 Source: RBI Note: $: Inclusive of FII Investments in Government Securities. #: Commercial Borrowings are inclusive of trade credit, FII investments in corporate debt instruments and a portion of non-Government multilateral and bilateral borrowing and therefore may not tally with the figures provided in other tables under original maturity. *: Also includes FPI investments in security receipts issued by Asset Reconstruction Companies (ARCs) under the extant corporate debt limits. 2.8 Concessional Debt 2.8.1 Softer terms of a loan in relation to prevailing market conditions indicates concessionality. Concessionality could be reflected in terms of lower rate of interest, elongation of maturity or repayment periods, etc. and is measured by the difference between the face value of a credit and the sum of the discounted future debt service payments.
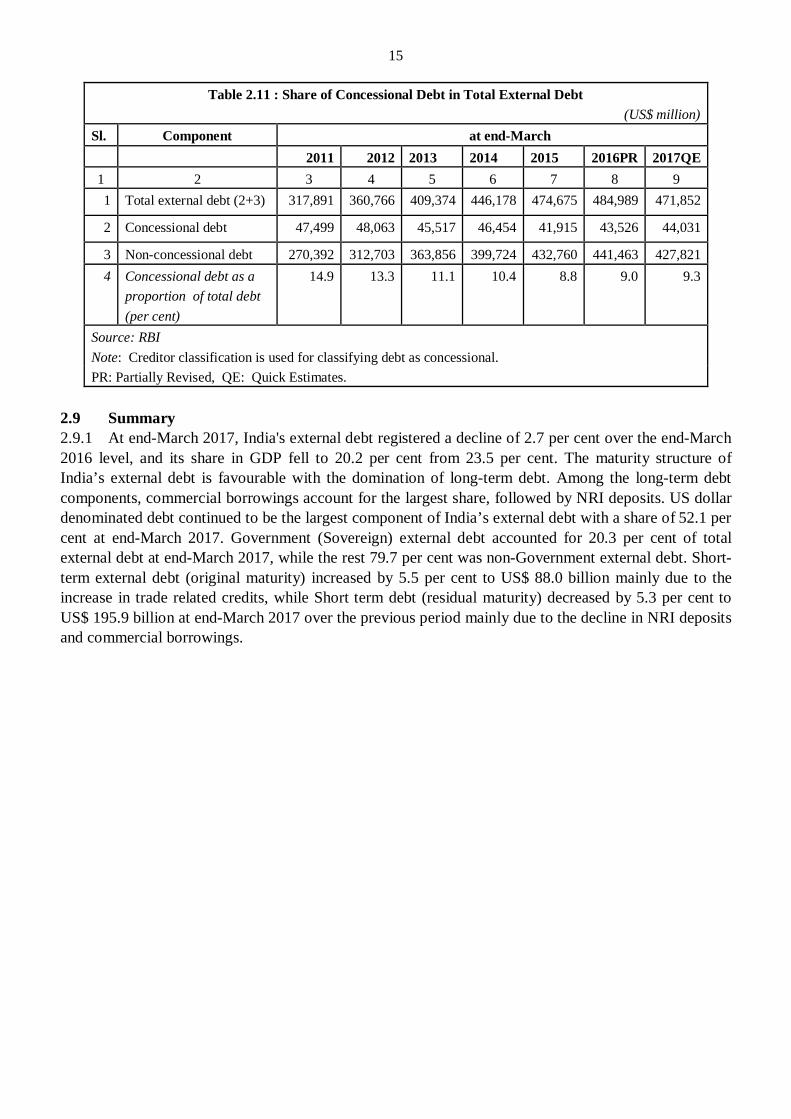
2.8.2 Different multilateral institutions follow different norms for classifying credits into concessional and non-concessional. In India, loans from International Development Association (IDA), International Fund for Agricultural Development (IFAD), Rupee debt, etc. are categorized as concessional. The proportion of concessional loans in total external debt has declined from 14.9 per cent at end-March 2011 to 8.8 per cent at end-March 2015. In the next two years, the share of concessional debt increased marginally resulting in a share of 9.3 per cent at end-March 2017 (Table 2.11).
15
Table 2.11 : Share of Concessional Debt in Total External Debt (US$ million)
Sl. Component at end-March 2011 2012 2013 2014 2015 2016PR 2017QE 1 2 3 4 5 6 7 8 9 1 Total external debt (2+3) 317,891 360,766 409,374 446,178 474,675 484,989 471,852
2 Concessional debt 47,499 48,063 45,517 46,454 41,915 43,526 44,031
3 Non-concessional debt 270,392 312,703 363,856 399,724 432,760 441,463 427,821 4 Concessional debt as a
proportion of total debt (per cent)
14.9 13.3 11.1 10.4 8.8 9.0 9.3
Source: RBI Note: Creditor classification is used for classifying debt as concessional. PR: Partially Revised, QE: Quick Estimates.
2.9 Summary 2.9.1 At end-March 2017, India's external debt registered a decline of 2.7 per cent over the end-March 2016 level, and its share in GDP fell to 20.2 per cent from 23.5 per cent. The maturity structure of India’s external debt is favourable with the domination of long-term debt. Among the long-term debt components, commercial borrowings account for the largest share, followed by NRI deposits. US dollar denominated debt continued to be the largest component of India’s external debt with a share of 52.1 per cent at end-March 2017. Government (Sovereign) external debt accounted for 20.3 per cent of total external debt at end-March 2017, while the rest 79.7 per cent was non-Government external debt. Short-term external debt (original maturity) increased by 5.5 per cent to US$ 88.0 billion mainly due to the increase in trade related credits, while Short term debt (residual maturity) decreased by 5.3 per cent to US$ 195.9 billion at end-March 2017 over the previous period mainly due to the decline in NRI deposits and commercial borrowings.
16
CHAPTER 3
DEBT SERVICE
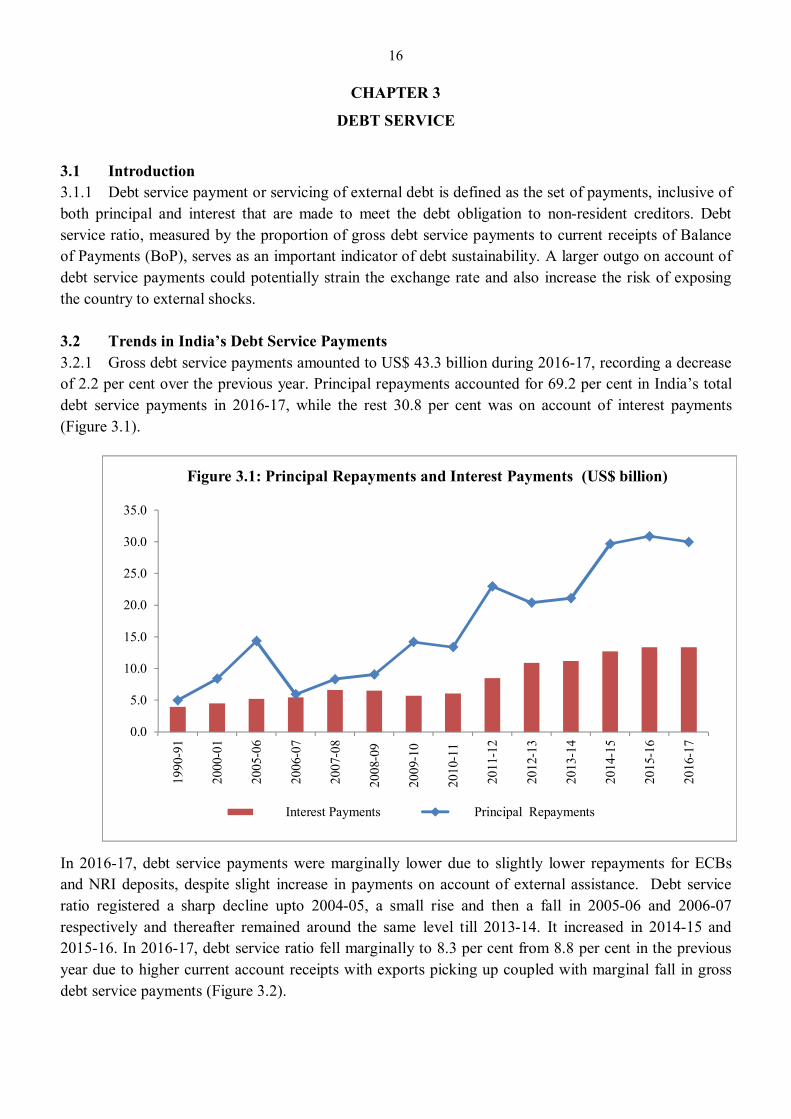
3.1 Introduction 3.1.1 Debt service payment or servicing of external debt is defined as the set of payments, inclusive of both principal and interest that are made to meet the debt obligation to non-resident creditors. Debt service ratio, measured by the proportion of gross debt service payments to current receipts of Balance of Payments (BoP), serves as an important indicator of debt sustainability. A larger outgo on account of debt service payments could potentially strain the exchange rate and also increase the risk of exposing the country to external shocks. 3.2 Trends in India’s Debt Service Payments 3.2.1 Gross debt service payments amounted to US$ 43.3 billion during 2016-17, recording a decrease of 2.2 per cent over the previous year. Principal repayments accounted for 69.2 per cent in India’s total debt service payments in 2016-17, while the rest 30.8 per cent was on account of interest payments (Figure 3.1).
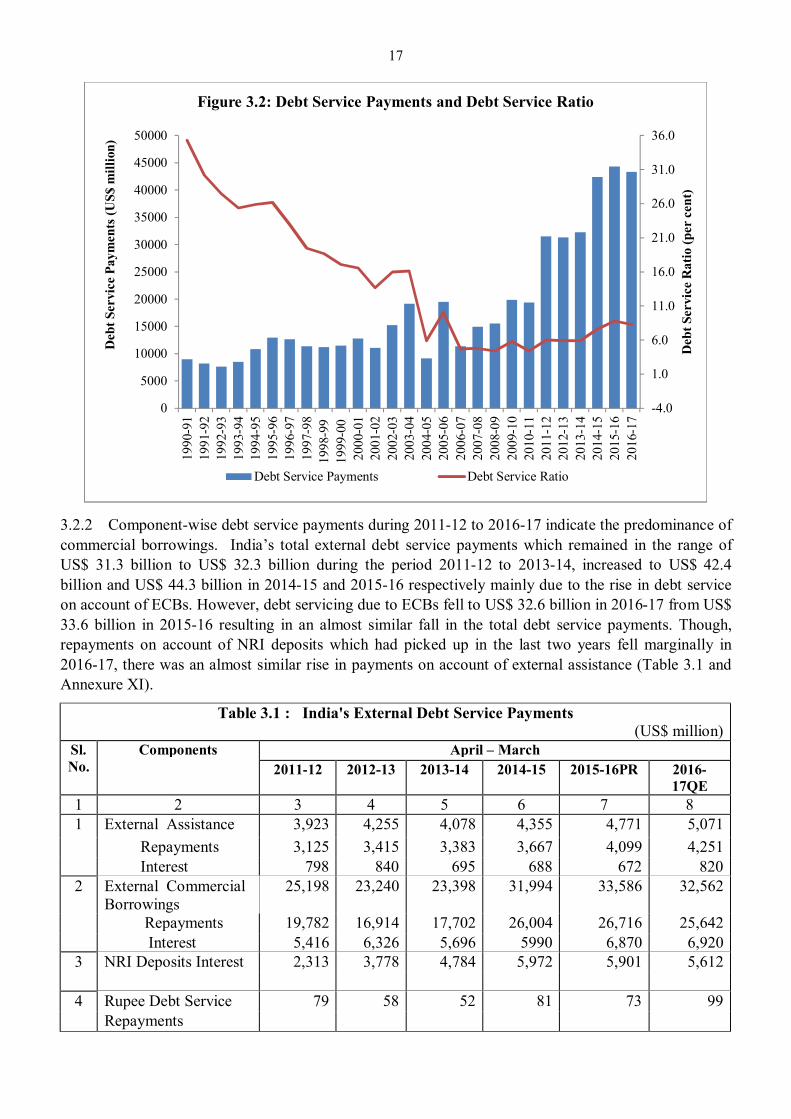
In 2016-17, debt service payments were marginally lower due to slightly lower repayments for ECBs and NRI deposits, despite slight increase in payments on account of external assistance. Debt service ratio registered a sharp decline upto 2004-05, a small rise and then a fall in 2005-06 and 2006-07 respectively and thereafter remained around the same level till 2013-14. It increased in 2014-15 and 2015-16. In 2016-17, debt service ratio fell marginally to 8.3 per cent from 8.8 per cent in the previous year due to higher current account receipts with exports picking up coupled with marginal fall in gross debt service payments (Figure 3.2).
0.0
5.0
10.0
15.0
20.0
25.0
30.0
35.0
1990
-91
2000
-01
2005
-06
2006
-07
2007
-08
2008
-09
2009
-10
2010
-11
2011
-12
2012
-13
2013
-14
2014
-15
2015
-16
2016
-17
Figure 3.1: Principal Repayments and Interest Payments (US$ billion)
Interest Payments Principal Repayments
17
3.2.2 Component-wise debt service payments during 2011-12 to 2016-17 indicate the predominance of commercial borrowings. India’s total external debt service payments which remained in the range of US$ 31.3 billion to US$ 32.3 billion during the period 2011-12 to 2013-14, increased to US$ 42.4 billion and US$ 44.3 billion in 2014-15 and 2015-16 respectively mainly due to the rise in debt service on account of ECBs. However, debt servicing due to ECBs fell to US$ 32.6 billion in 2016-17 from US$ 33.6 billion in 2015-16 resulting in an almost similar fall in the total debt service payments. Though, repayments on account of NRI deposits which had picked up in the last two years fell marginally in 2016-17, there was an almost similar rise in payments on account of external assistance (Table 3.1 and Annexure XI).
Table 3.1 : India's External Debt Service Payments (US$ million)
Sl. No.
Components April – March 2011-12 2012-13 2013-14 2014-15 2015-16PR 2016-
17QE 1 2 3 4 5 6 7 8 1 External Assistance 3,923 4,255 4,078 4,355 4,771 5,071 Repayments 3,125 3,415 3,383 3,667 4,099 4,251 Interest 798 840 695 688 672 820 2 External Commercial
Borrowings 25,198 23,240 23,398 31,994 33,586 32,562
Repayments 19,782 16,914 17,702 26,004 26,716 25,642 Interest 5,416 6,326 5,696 5990 6,870 6,920 3 NRI Deposits Interest 2,313 3,778 4,784 5,972 5,901 5,612 4 Rupee Debt Service 79 58 52 81 73 99 Repayments
-4.0
1.0
6.0
11.0
16.0
21.0
26.0
31.0
36.0
0
5000
10000
15000
20000
25000
30000
35000
40000
45000
50000
1990
-91
1991
-92
1992
-93
1993
-94
1994
-95
1995
-96
1996
-97
1997
-98
1998
-99
1999
-00
2000
-01
2001
-02
2002
-03
2003
-04
2004
-05
2005
-06
2006
-07
2007
-08
2008
-09
2009
-10
2010
-11
2011
-12
2012
-13
2013
-14
2014
-15
2015
-16
2016
-17
Deb
t Ser
vice
Rat
io (p
er c
ent)
Deb
t Ser
vice
Pay
men
ts (U
S$ m
illio
n)Figure 3.2: Debt Service Payments and Debt Service Ratio
Debt Service Payments Debt Service Ratio
18
5 Total Debt Service (1 to 4)
31,513 31,331 32,312 42,402 44,331 43,344
Repayments 22,986 20,387 21,137 29,752 30,888 29,992 Interest 8,527 10,944 11,176 12,650 13,443 13,351
Memo items: Current Receipts* 445,999 528,372 551,410 557,868 500,972 520,848 Debt Service Ratio (per cent)
4.4 6.0 5.9 7.6 8.8 8.3
Interest payments /current receipts (per cent)
1.4 1.6 2.0 2.3 2.7 2.6
Source: RBI PR: Partially Revised; QE: Quick Estimates. *: Current Receipts minus Officials Transfers.
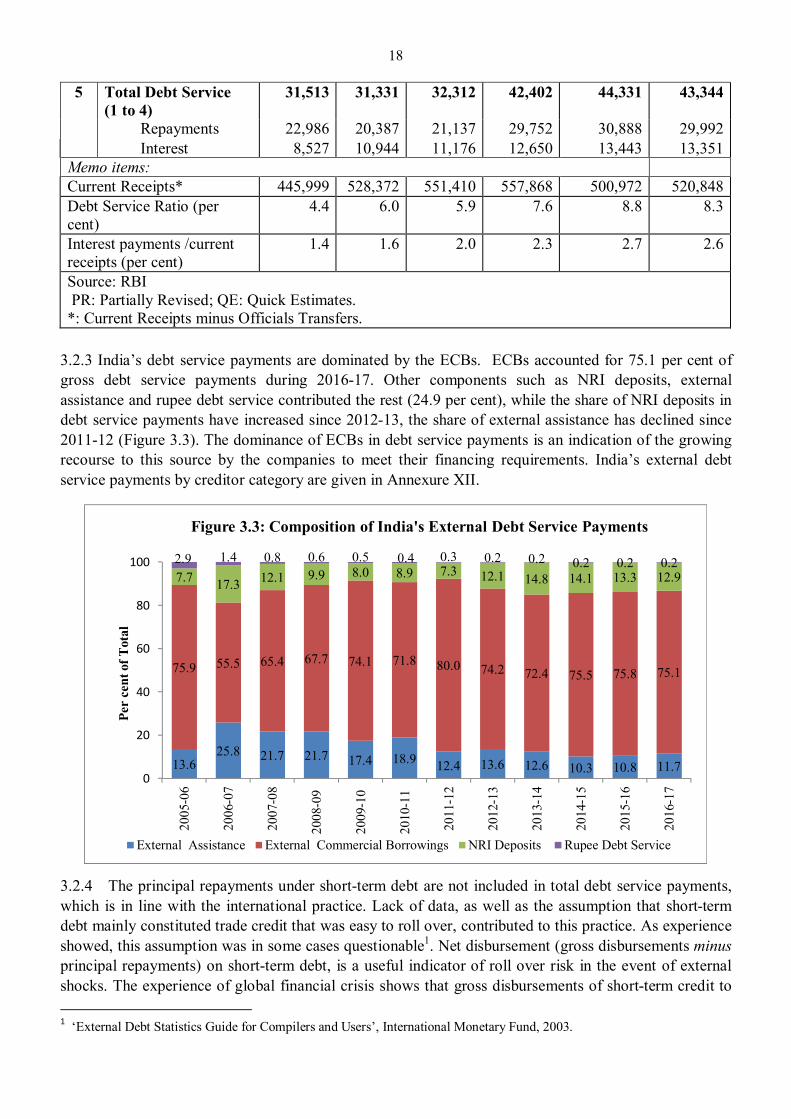
3.2.3 India’s debt service payments are dominated by the ECBs. ECBs accounted for 75.1 per cent of gross debt service payments during 2016-17. Other components such as NRI deposits, external assistance and rupee debt service contributed the rest (24.9 per cent), while the share of NRI deposits in debt service payments have increased since 2012-13, the share of external assistance has declined since 2011-12 (Figure 3.3). The dominance of ECBs in debt service payments is an indication of the growing recourse to this source by the companies to meet their financing requirements. India’s external debt service payments by creditor category are given in Annexure XII.
3.2.4 The principal repayments under short-term debt are not included in total debt service payments, which is in line with the international practice. Lack of data, as well as the assumption that short-term debt mainly constituted trade credit that was easy to roll over, contributed to this practice. As experience showed, this assumption was in some cases questionable1. Net disbursement (gross disbursements minus principal repayments) on short-term debt, is a useful indicator of roll over risk in the event of external shocks. The experience of global financial crisis shows that gross disbursements of short-term credit to 1 ‘External Debt Statistics Guide for Compilers and Users’, International Monetary Fund, 2003.
13.625.8 21.7 21.7 17.4 18.9 12.4 13.6 12.6 10.3 10.8 11.7
75.9 55.5 65.4 67.7 74.1 71.8 80.0 74.2 72.4 75.5 75.8 75.1
7.7 17.3 12.1 9.9 8.0 8.9 7.3 12.1 14.8 14.1 13.3 12.92.9 1.4 0.8 0.6 0.5 0.4 0.3 0.2 0.2 0.2 0.2 0.2
0
20
40
60
80
100
2005
-06
2006
-07
2007
-08
2008
-09
2009
-10
2010
-11
2011
-12
2012
-13
2013
-14
2014
-15
2015
-16
2016
-17
Per
cent
of T
otal
Figure 3.3: Composition of India's External Debt Service Payments
External Assistance External Commercial Borrowings NRI Deposits Rupee Debt Service
19
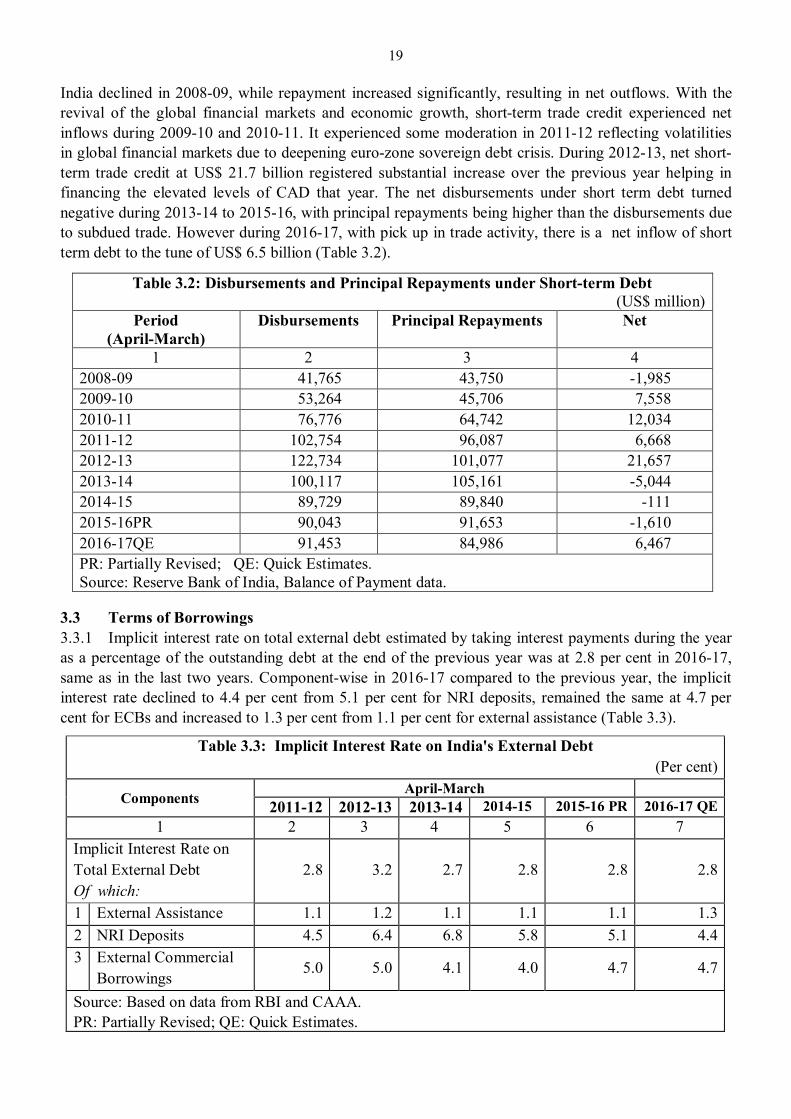
India declined in 2008-09, while repayment increased significantly, resulting in net outflows. With the revival of the global financial markets and economic growth, short-term trade credit experienced net inflows during 2009-10 and 2010-11. It experienced some moderation in 2011-12 reflecting volatilities in global financial markets due to deepening euro-zone sovereign debt crisis. During 2012-13, net short-term trade credit at US$ 21.7 billion registered substantial increase over the previous year helping in financing the elevated levels of CAD that year. The net disbursements under short term debt turned negative during 2013-14 to 2015-16, with principal repayments being higher than the disbursements due to subdued trade. However during 2016-17, with pick up in trade activity, there is a net inflow of short term debt to the tune of US$ 6.5 billion (Table 3.2).
Table 3.2: Disbursements and Principal Repayments under Short-term Debt (US$ million)
Period (April-March)
Disbursements Principal Repayments Net
1 2 3 4 2008-09 41,765 43,750 -1,985 2009-10 53,264 45,706 7,558 2010-11 76,776 64,742 12,034 2011-12 102,754 96,087 6,668 2012-13 122,734 101,077 21,657 2013-14 100,117 105,161 -5,044 2014-15 89,729 89,840 -111 2015-16PR 90,043 91,653 -1,610 2016-17QE 91,453 84,986 6,467 PR: Partially Revised; QE: Quick Estimates. Source: Reserve Bank of India, Balance of Payment data.
3.3 Terms of Borrowings 3.3.1 Implicit interest rate on total external debt estimated by taking interest payments during the year as a percentage of the outstanding debt at the end of the previous year was at 2.8 per cent in 2016-17, same as in the last two years. Component-wise in 2016-17 compared to the previous year, the implicit interest rate declined to 4.4 per cent from 5.1 per cent for NRI deposits, remained the same at 4.7 per cent for ECBs and increased to 1.3 per cent from 1.1 per cent for external assistance (Table 3.3).
Table 3.3: Implicit Interest Rate on India's External Debt (Per cent)
Components April-March 2011-12 2012-13 2013-14 2014-15 2015-16 PR 2016-17 QE
1 2 3 4 5 6 7 Implicit Interest Rate on Total External Debt Of which:
2.8
3.2
2.7
2.8
2.8
2.8
1 External Assistance 1.1 1.2 1.1 1.1 1.1 1.3 2 NRI Deposits 4.5 6.4 6.8 5.8 5.1 4.4 3 External Commercial
Borrowings 5.0 5.0 4.1 4.0 4.7 4.7
Source: Based on data from RBI and CAAA. PR: Partially Revised; QE: Quick Estimates.
20
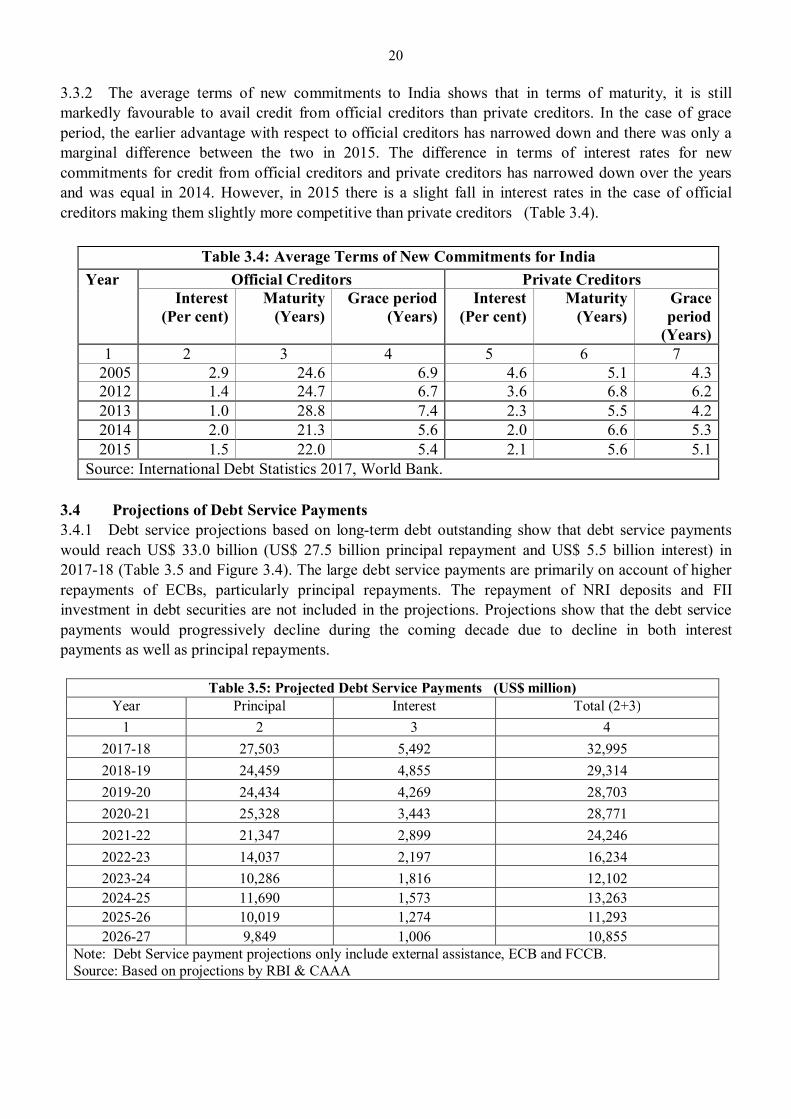
3.3.2 The average terms of new commitments to India shows that in terms of maturity, it is still markedly favourable to avail credit from official creditors than private creditors. In the case of grace period, the earlier advantage with respect to official creditors has narrowed down and there was only a marginal difference between the two in 2015. The difference in terms of interest rates for new commitments for credit from official creditors and private creditors has narrowed down over the years and was equal in 2014. However, in 2015 there is a slight fall in interest rates in the case of official creditors making them slightly more competitive than private creditors (Table 3.4).
Table 3.4: Average Terms of New Commitments for India Year Official Creditors Private Creditors
Interest (Per cent)
Maturity (Years)
Grace period (Years)
Interest (Per cent)
Maturity (Years)
Grace period
(Years) 1 2 3 4 5 6 7
2005 2.9 24.6 6.9 4.6 5.1 4.3 2012 1.4 24.7 6.7 3.6 6.8 6.2 2013 1.0 28.8 7.4 2.3 5.5 4.2 2014 2.0 21.3 5.6 2.0 6.6 5.3 2015 1.5 22.0 5.4 2.1 5.6 5.1
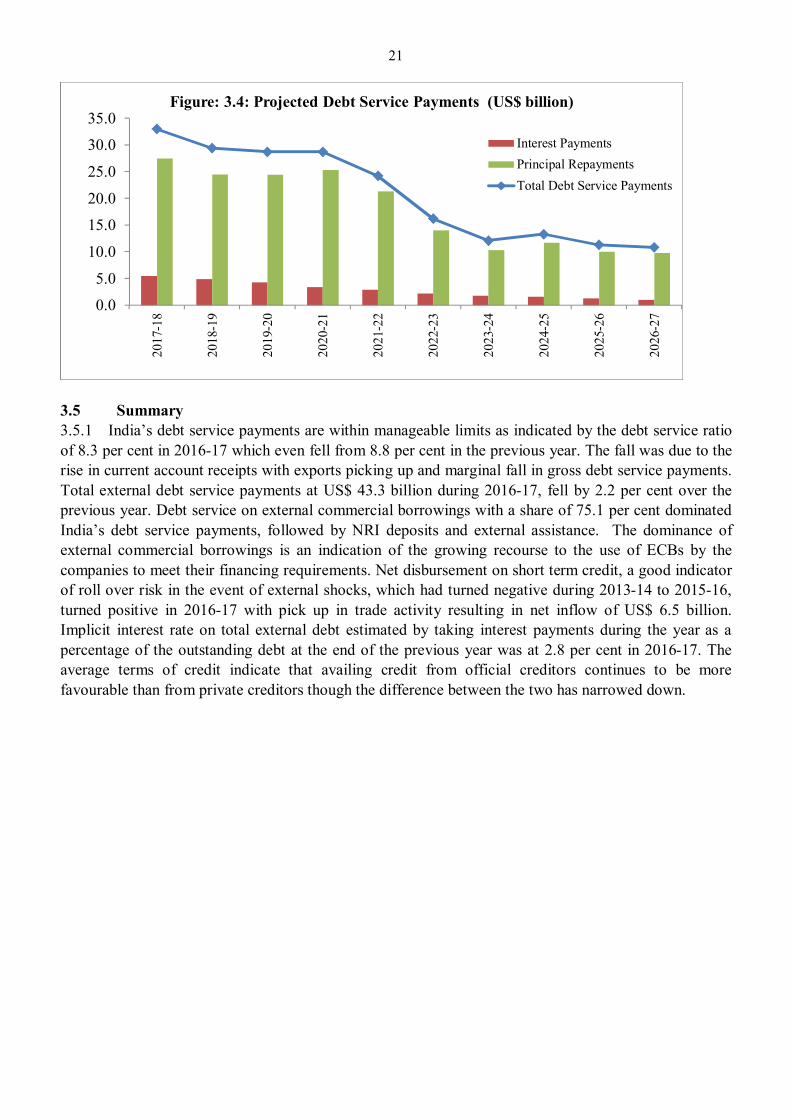
Source: International Debt Statistics 2017, World Bank. 3.4 Projections of Debt Service Payments 3.4.1 Debt service projections based on long-term debt outstanding show that debt service payments would reach US$ 33.0 billion (US$ 27.5 billion principal repayment and US$ 5.5 billion interest) in 2017-18 (Table 3.5 and Figure 3.4). The large debt service payments are primarily on account of higher repayments of ECBs, particularly principal repayments. The repayment of NRI deposits and FII investment in debt securities are not included in the projections. Projections show that the debt service payments would progressively decline during the coming decade due to decline in both interest payments as well as principal repayments.
Table 3.5: Projected Debt Service Payments (US$ million) Year Principal Interest Total (2+3)
1 2 3 4 2017-18 27,503 5,492 32,995 2018-19 24,459 4,855 29,314 2019-20 24,434 4,269 28,703 2020-21 25,328 3,443 28,771 2021-22 21,347 2,899 24,246 2022-23 14,037 2,197 16,234 2023-24 10,286 1,816 12,102 2024-25 11,690 1,573 13,263 2025-26 10,019 1,274 11,293 2026-27 9,849 1,006 10,855
Note: Debt Service payment projections only include external assistance, ECB and FCCB. Source: Based on projections by RBI & CAAA
21
3.5 Summary 3.5.1 India’s debt service payments are within manageable limits as indicated by the debt service ratio of 8.3 per cent in 2016-17 which even fell from 8.8 per cent in the previous year. The fall was due to the rise in current account receipts with exports picking up and marginal fall in gross debt service payments. Total external debt service payments at US$ 43.3 billion during 2016-17, fell by 2.2 per cent over the previous year. Debt service on external commercial borrowings with a share of 75.1 per cent dominated India’s debt service payments, followed by NRI deposits and external assistance. The dominance of external commercial borrowings is an indication of the growing recourse to the use of ECBs by the companies to meet their financing requirements. Net disbursement on short term credit, a good indicator of roll over risk in the event of external shocks, which had turned negative during 2013-14 to 2015-16, turned positive in 2016-17 with pick up in trade activity resulting in net inflow of US$ 6.5 billion. Implicit interest rate on total external debt estimated by taking interest payments during the year as a percentage of the outstanding debt at the end of the previous year was at 2.8 per cent in 2016-17. The average terms of credit indicate that availing credit from official creditors continues to be more favourable than from private creditors though the difference between the two has narrowed down.
0.0
5.0
10.0
15.0
20.0
25.0
30.0
35.0
2017
-18
2018
-19
2019
-20
2020
-21
2021
-22
2022
-23
2023
-24
2024
-25
2025
-26
2026
-27
Figure: 3.4: Projected Debt Service Payments (US$ billion)
Interest PaymentsPrincipal RepaymentsTotal Debt Service Payments
22
CHAPTER 4
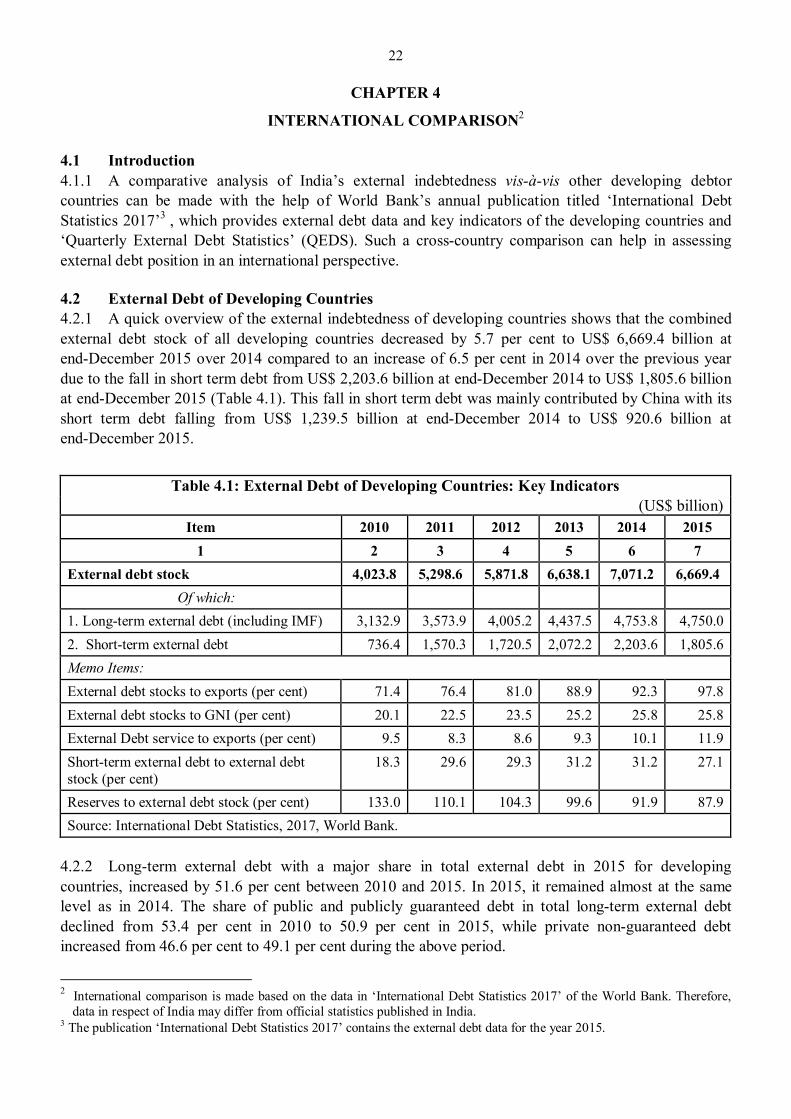
INTERNATIONAL COMPARISON2 4.1 Introduction 4.1.1 A comparative analysis of India’s external indebtedness vis-à-vis other developing debtor countries can be made with the help of World Bank’s annual publication titled ‘International Debt Statistics 2017’3 , which provides external debt data and key indicators of the developing countries and ‘Quarterly External Debt Statistics’ (QEDS). Such a cross-country comparison can help in assessing external debt position in an international perspective. 4.2 External Debt of Developing Countries 4.2.1 A quick overview of the external indebtedness of developing countries shows that the combined external debt stock of all developing countries decreased by 5.7 per cent to US$ 6,669.4 billion at end-December 2015 over 2014 compared to an increase of 6.5 per cent in 2014 over the previous year due to the fall in short term debt from US$ 2,203.6 billion at end-December 2014 to US$ 1,805.6 billion at end-December 2015 (Table 4.1). This fall in short term debt was mainly contributed by China with its short term debt falling from US$ 1,239.5 billion at end-December 2014 to US$ 920.6 billion at end-December 2015.
Table 4.1: External Debt of Developing Countries: Key Indicators (US$ billion)
Item 2010 2011 2012 2013 2014 2015 1 2 3 4 5 6 7
External debt stock 4,023.8 5,298.6 5,871.8 6,638.1 7,071.2 6,669.4 Of which:
1. Long-term external debt (including IMF) 3,132.9 3,573.9 4,005.2 4,437.5 4,753.8 4,750.0 2. Short-term external debt 736.4 1,570.3 1,720.5 2,072.2 2,203.6 1,805.6 Memo Items: External debt stocks to exports (per cent) 71.4 76.4 81.0 88.9 92.3 97.8 External debt stocks to GNI (per cent) 20.1 22.5 23.5 25.2 25.8 25.8 External Debt service to exports (per cent) 9.5 8.3 8.6 9.3 10.1 11.9 Short-term external debt to external debt stock (per cent)
18.3 29.6 29.3 31.2 31.2 27.1
Reserves to external debt stock (per cent) 133.0 110.1 104.3 99.6 91.9 87.9 Source: International Debt Statistics, 2017, World Bank.
4.2.2 Long-term external debt with a major share in total external debt in 2015 for developing countries, increased by 51.6 per cent between 2010 and 2015. In 2015, it remained almost at the same level as in 2014. The share of public and publicly guaranteed debt in total long-term external debt declined from 53.4 per cent in 2010 to 50.9 per cent in 2015, while private non-guaranteed debt increased from 46.6 per cent to 49.1 per cent during the above period.
2 International comparison is made based on the data in ‘International Debt Statistics 2017’ of the World Bank. Therefore,
data in respect of India may differ from official statistics published in India. 3 The publication ‘International Debt Statistics 2017’ contains the external debt data for the year 2015.
23
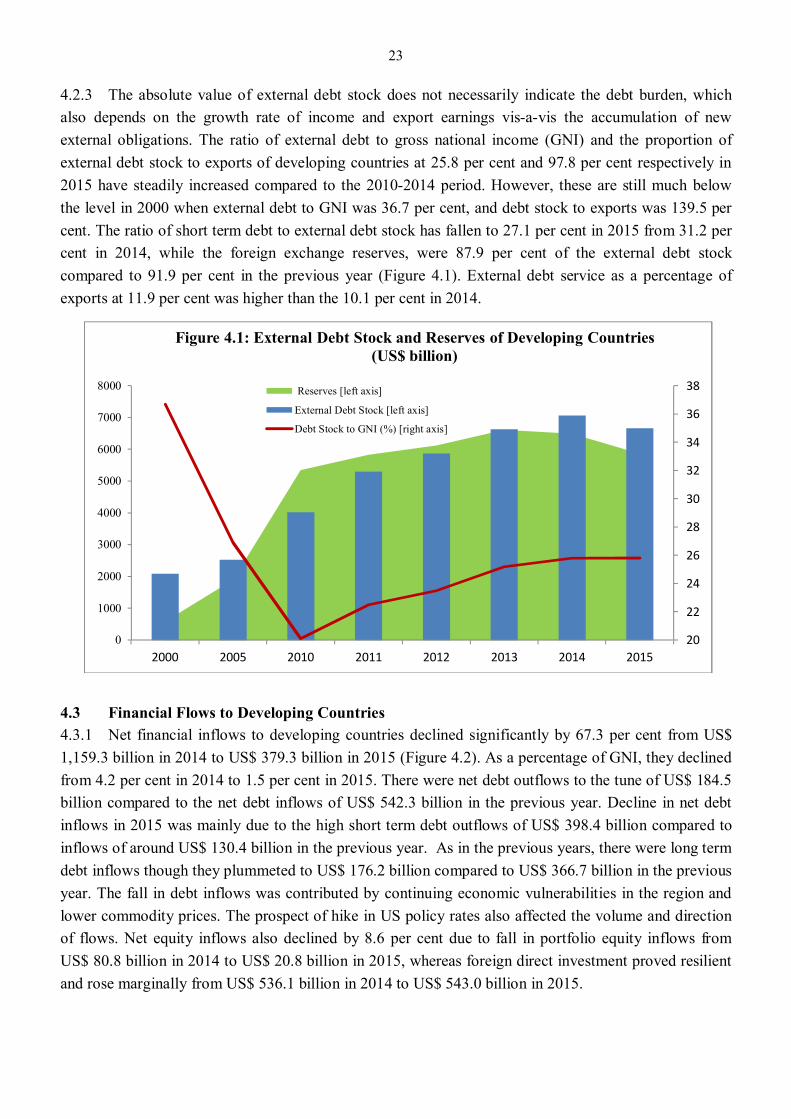
4.2.3 The absolute value of external debt stock does not necessarily indicate the debt burden, which also depends on the growth rate of income and export earnings vis-a-vis the accumulation of new external obligations. The ratio of external debt to gross national income (GNI) and the proportion of external debt stock to exports of developing countries at 25.8 per cent and 97.8 per cent respectively in 2015 have steadily increased compared to the 2010-2014 period. However, these are still much below the level in 2000 when external debt to GNI was 36.7 per cent, and debt stock to exports was 139.5 per cent. The ratio of short term debt to external debt stock has fallen to 27.1 per cent in 2015 from 31.2 per cent in 2014, while the foreign exchange reserves, were 87.9 per cent of the external debt stock compared to 91.9 per cent in the previous year (Figure 4.1). External debt service as a percentage of exports at 11.9 per cent was higher than the 10.1 per cent in 2014.
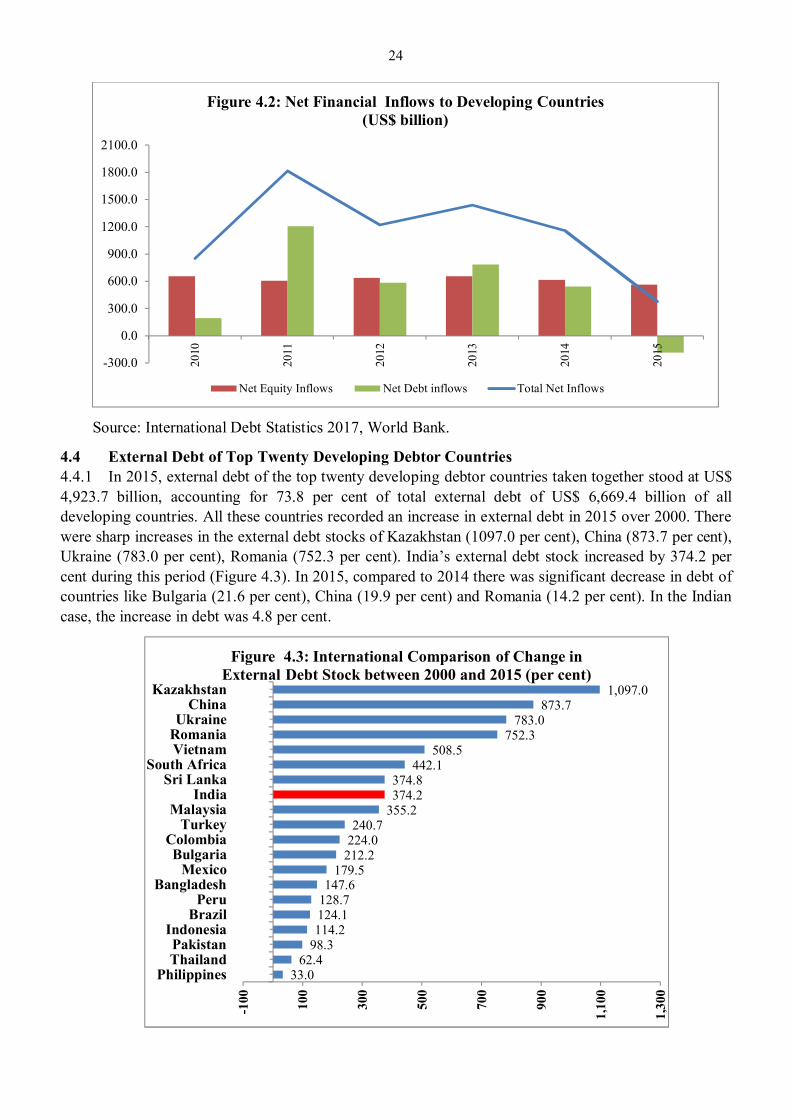
4.3 Financial Flows to Developing Countries 4.3.1 Net financial inflows to developing countries declined significantly by 67.3 per cent from US$ 1,159.3 billion in 2014 to US$ 379.3 billion in 2015 (Figure 4.2). As a percentage of GNI, they declined from 4.2 per cent in 2014 to 1.5 per cent in 2015. There were net debt outflows to the tune of US$ 184.5 billion compared to the net debt inflows of US$ 542.3 billion in the previous year. Decline in net debt inflows in 2015 was mainly due to the high short term debt outflows of US$ 398.4 billion compared to inflows of around US$ 130.4 billion in the previous year. As in the previous years, there were long term debt inflows though they plummeted to US$ 176.2 billion compared to US$ 366.7 billion in the previous year. The fall in debt inflows was contributed by continuing economic vulnerabilities in the region and lower commodity prices. The prospect of hike in US policy rates also affected the volume and direction of flows. Net equity inflows also declined by 8.6 per cent due to fall in portfolio equity inflows from US$ 80.8 billion in 2014 to US$ 20.8 billion in 2015, whereas foreign direct investment proved resilient and rose marginally from US$ 536.1 billion in 2014 to US$ 543.0 billion in 2015.
20
22
24
26
28
30
32
34
36
38
0
1000
2000
3000
4000
5000
6000
7000
8000
2000 2005 2010 2011 2012 2013 2014 2015
Figure 4.1: External Debt Stock and Reserves of Developing Countries (US$ billion)
Reserves [left axis]
External Debt Stock [left axis]
Debt Stock to GNI (%) [right axis]
24
Source: International Debt Statistics 2017, World Bank.
4.4 External Debt of Top Twenty Developing Debtor Countries 4.4.1 In 2015, external debt of the top twenty developing debtor countries taken together stood at US$ 4,923.7 billion, accounting for 73.8 per cent of total external debt of US$ 6,669.4 billion of all developing countries. All these countries recorded an increase in external debt in 2015 over 2000. There were sharp increases in the external debt stocks of Kazakhstan (1097.0 per cent), China (873.7 per cent), Ukraine (783.0 per cent), Romania (752.3 per cent). India’s external debt stock increased by 374.2 per cent during this period (Figure 4.3). In 2015, compared to 2014 there was significant decrease in debt of countries like Bulgaria (21.6 per cent), China (19.9 per cent) and Romania (14.2 per cent). In the Indian case, the increase in debt was 4.8 per cent.
-300.0
0.0
300.0
600.0
900.0
1200.0
1500.0
1800.0
2100.0
2010
2011
2012
2013
2014
2015
Figure 4.2: Net Financial Inflows to Developing Countries (US$ billion)
Net Equity Inflows Net Debt inflows Total Net Inflows
33.062.4
98.3114.2124.1128.7147.6
179.5212.2224.0240.7
355.2374.2374.8
442.1508.5
752.3783.0
873.71,097.0
-100 10
0
300
500
700
900
1,10
0
1,30
0
PhilippinesThailandPakistan
IndonesiaBrazil
PeruBangladesh
MexicoBulgaria
ColombiaTurkey
MalaysiaIndia
Sri LankaSouth Africa
VietnamRomaniaUkraine
ChinaKazakhstan
Figure 4.3: International Comparison of Change in External Debt Stock between 2000 and 2015 (per cent)
25
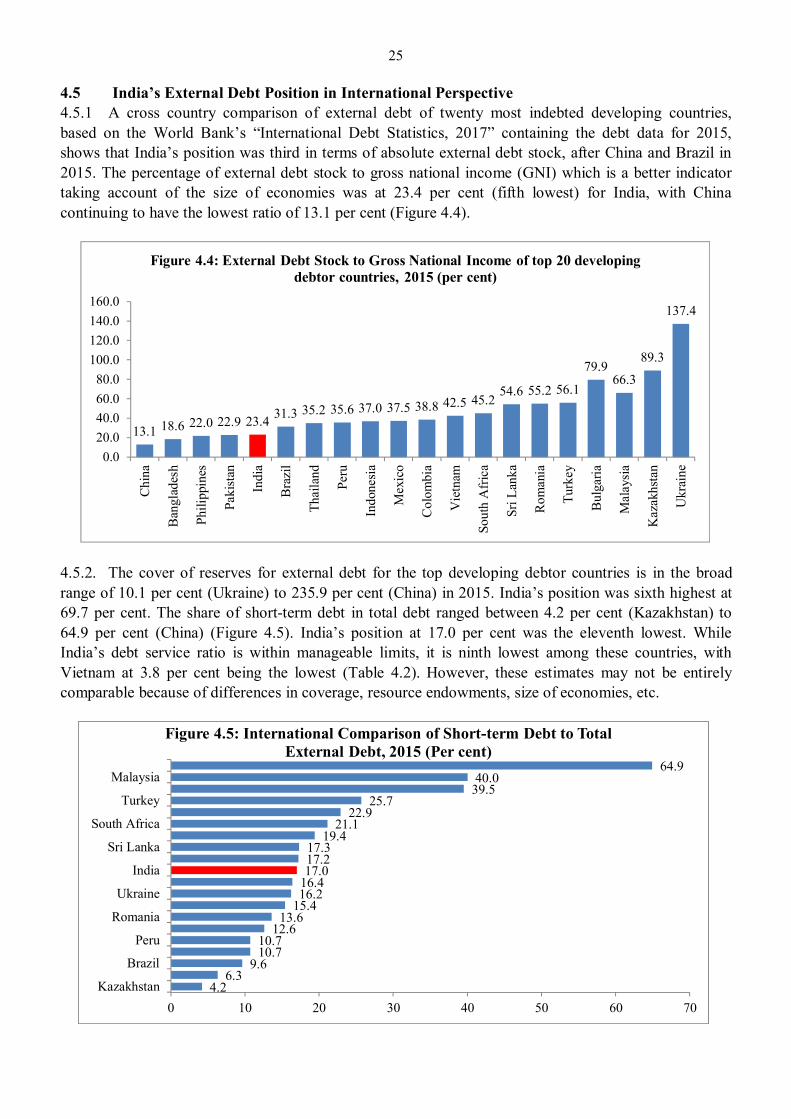
4.5 India’s External Debt Position in International Perspective 4.5.1 A cross country comparison of external debt of twenty most indebted developing countries, based on the World Bank’s “International Debt Statistics, 2017” containing the debt data for 2015, shows that India’s position was third in terms of absolute external debt stock, after China and Brazil in 2015. The percentage of external debt stock to gross national income (GNI) which is a better indicator taking account of the size of economies was at 23.4 per cent (fifth lowest) for India, with China continuing to have the lowest ratio of 13.1 per cent (Figure 4.4).
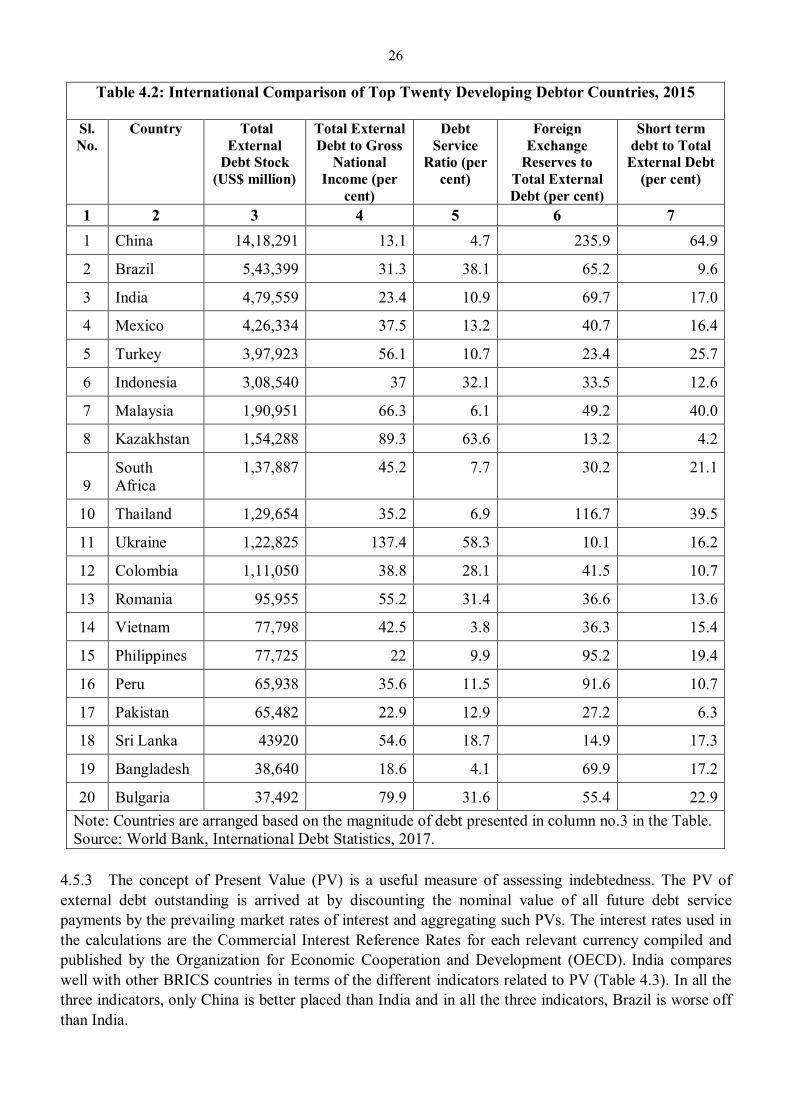
4.5.2. The cover of reserves for external debt for the top developing debtor countries is in the broad range of 10.1 per cent (Ukraine) to 235.9 per cent (China) in 2015. India’s position was sixth highest at 69.7 per cent. The share of short-term debt in total debt ranged between 4.2 per cent (Kazakhstan) to 64.9 per cent (China) (Figure 4.5). India’s position at 17.0 per cent was the eleventh lowest. While India’s debt service ratio is within manageable limits, it is ninth lowest among these countries, with Vietnam at 3.8 per cent being the lowest (Table 4.2). However, these estimates may not be entirely comparable because of differences in coverage, resource endowments, size of economies, etc.
13.1 18.6 22.0 22.9 23.4 31.3 35.2 35.6 37.0 37.5 38.8 42.5 45.254.6 55.2 56.1
79.966.3
89.3
137.4
0.020.040.060.080.0
100.0120.0140.0160.0
Chi
na
Ban
glad
esh
Phili
ppin
es
Paki
stan
Indi
a
Bra
zil
Thai
land
Peru
Indo
nesi
a
Mex
ico
Col
ombi
a
Vie
tnam
Sout
h A
fric
a
Sri L
anka
Rom
ania
Turk
ey
Bul
garia
Mal
aysi
a
Kaz
akhs
tan
Ukr
aine
Figure 4.4: External Debt Stock to Gross National Income of top 20 developing debtor countries, 2015 (per cent)
4.26.3
9.610.710.7
12.613.6
15.416.216.417.017.217.3
19.421.1
22.925.7
39.540.0
64.9
0 10 20 30 40 50 60 70Kazakhstan
Brazil
Peru
Romania
Ukraine
India
Sri Lanka
South Africa
Turkey
Malaysia
Figure 4.5: International Comparison of Short-term Debt to Total External Debt, 2015 (Per cent)
26
Table 4.2: International Comparison of Top Twenty Developing Debtor Countries, 2015
Sl. No.
Country Total External
Debt Stock (US$ million)
Total External Debt to Gross
National Income (per
cent)
Debt Service
Ratio (per cent)
Foreign Exchange
Reserves to Total External Debt (per cent)
Short term debt to Total
External Debt (per cent)
1 2 3 4 5 6 7 1 China 14,18,291 13.1 4.7 235.9 64.9
2 Brazil 5,43,399 31.3 38.1 65.2 9.6
3 India 4,79,559 23.4 10.9 69.7 17.0
4 Mexico 4,26,334 37.5 13.2 40.7 16.4
5 Turkey 3,97,923 56.1 10.7 23.4 25.7
6 Indonesia 3,08,540 37 32.1 33.5 12.6
7 Malaysia 1,90,951 66.3 6.1 49.2 40.0
8 Kazakhstan 1,54,288 89.3 63.6 13.2 4.2
9 South Africa
1,37,887 45.2 7.7 30.2 21.1
10 Thailand 1,29,654 35.2 6.9 116.7 39.5
11 Ukraine 1,22,825 137.4 58.3 10.1 16.2
12 Colombia 1,11,050 38.8 28.1 41.5 10.7
13 Romania 95,955 55.2 31.4 36.6 13.6
14 Vietnam 77,798 42.5 3.8 36.3 15.4
15 Philippines 77,725 22 9.9 95.2 19.4
16 Peru 65,938 35.6 11.5 91.6 10.7
17 Pakistan 65,482 22.9 12.9 27.2 6.3
18 Sri Lanka 43920 54.6 18.7 14.9 17.3
19 Bangladesh 38,640 18.6 4.1 69.9 17.2
20 Bulgaria 37,492 79.9 31.6 55.4 22.9 Note: Countries are arranged based on the magnitude of debt presented in column no.3 in the Table. Source: World Bank, International Debt Statistics, 2017.
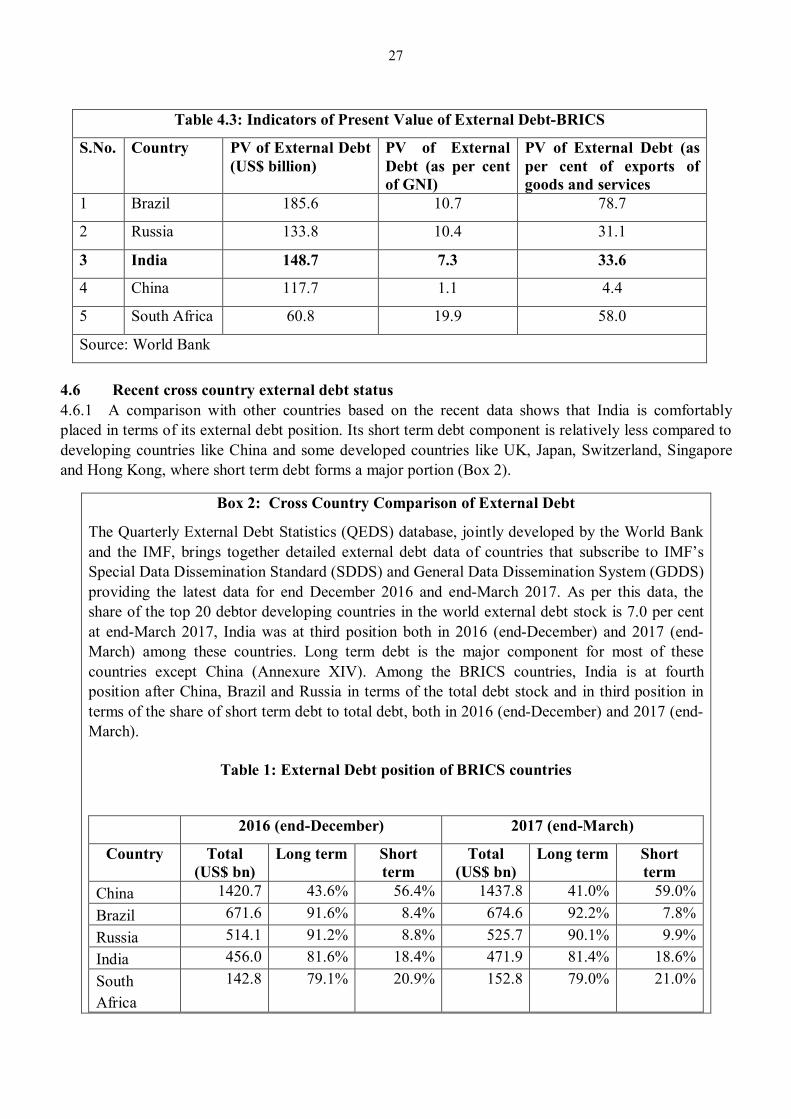
4.5.3 The concept of Present Value (PV) is a useful measure of assessing indebtedness. The PV of external debt outstanding is arrived at by discounting the nominal value of all future debt service payments by the prevailing market rates of interest and aggregating such PVs. The interest rates used in the calculations are the Commercial Interest Reference Rates for each relevant currency compiled and published by the Organization for Economic Cooperation and Development (OECD). India compares well with other BRICS countries in terms of the different indicators related to PV (Table 4.3). In all the three indicators, only China is better placed than India and in all the three indicators, Brazil is worse off than India.
27
Table 4.3: Indicators of Present Value of External Debt-BRICS
S.No. Country PV of External Debt (US$ billion)
PV of External Debt (as per cent of GNI)
PV of External Debt (as per cent of exports of goods and services
1 Brazil 185.6 10.7 78.7
2 Russia 133.8 10.4 31.1
3 India 148.7 7.3 33.6
4 China 117.7 1.1 4.4
5 South Africa 60.8 19.9 58.0
Source: World Bank
4.6 Recent cross country external debt status 4.6.1 A comparison with other countries based on the recent data shows that India is comfortably placed in terms of its external debt position. Its short term debt component is relatively less compared to developing countries like China and some developed countries like UK, Japan, Switzerland, Singapore and Hong Kong, where short term debt forms a major portion (Box 2).
Box 2: Cross Country Comparison of External Debt
The Quarterly External Debt Statistics (QEDS) database, jointly developed by the World Bank and the IMF, brings together detailed external debt data of countries that subscribe to IMF’s Special Data Dissemination Standard (SDDS) and General Data Dissemination System (GDDS) providing the latest data for end December 2016 and end-March 2017. As per this data, the share of the top 20 debtor developing countries in the world external debt stock is 7.0 per cent at end-March 2017, India was at third position both in 2016 (end-December) and 2017 (end-March) among these countries. Long term debt is the major component for most of these countries except China (Annexure XIV). Among the BRICS countries, India is at fourth position after China, Brazil and Russia in terms of the total debt stock and in third position in terms of the share of short term debt to total debt, both in 2016 (end-December) and 2017 (end-March).
Table 1: External Debt position of BRICS countries
2016 (end-December) 2017 (end-March)
Country Total (US$ bn)
Long term Short term
Total (US$ bn)
Long term Short term
China 1420.7 43.6% 56.4% 1437.8 41.0% 59.0% Brazil 671.6 91.6% 8.4% 674.6 92.2% 7.8% Russia 514.1 91.2% 8.8% 525.7 90.1% 9.9% India 456.0 81.6% 18.4% 471.9 81.4% 18.6% South Africa
142.8 79.1% 20.9% 152.8 79.0% 21.0%
28
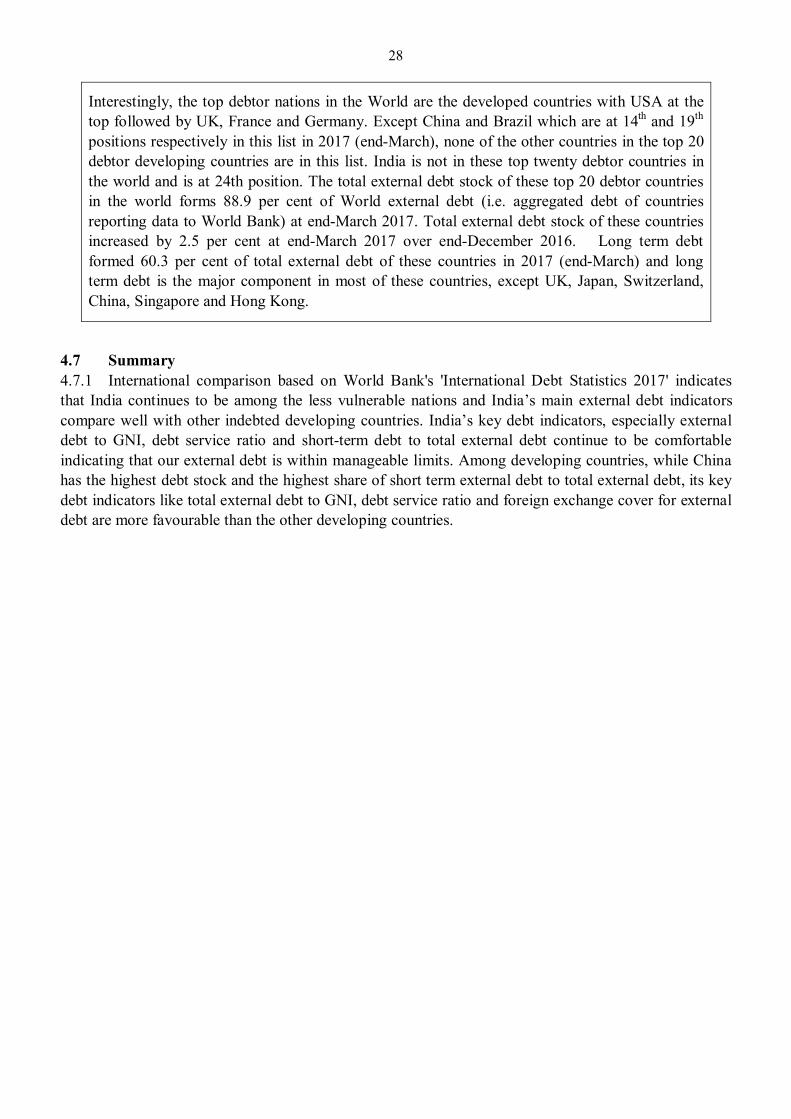
Interestingly, the top debtor nations in the World are the developed countries with USA at the top followed by UK, France and Germany. Except China and Brazil which are at 14th and 19th positions respectively in this list in 2017 (end-March), none of the other countries in the top 20 debtor developing countries are in this list. India is not in these top twenty debtor countries in the world and is at 24th position. The total external debt stock of these top 20 debtor countries in the world forms 88.9 per cent of World external debt (i.e. aggregated debt of countries reporting data to World Bank) at end-March 2017. Total external debt stock of these countries increased by 2.5 per cent at end-March 2017 over end-December 2016. Long term debt formed 60.3 per cent of total external debt of these countries in 2017 (end-March) and long term debt is the major component in most of these countries, except UK, Japan, Switzerland, China, Singapore and Hong Kong.
4.7 Summary 4.7.1 International comparison based on World Bank's 'International Debt Statistics 2017' indicates that India continues to be among the less vulnerable nations and India’s main external debt indicators compare well with other indebted developing countries. India’s key debt indicators, especially external debt to GNI, debt service ratio and short-term debt to total external debt continue to be comfortable indicating that our external debt is within manageable limits. Among developing countries, while China has the highest debt stock and the highest share of short term external debt to total external debt, its key debt indicators like total external debt to GNI, debt service ratio and foreign exchange cover for external debt are more favourable than the other developing countries.
29
CHAPTER 5
SOVEREIGN EXTERNAL DEBT 5.1 Introduction 5.1.1 Sovereign external debt or the extent of external liabilities of the Government has assumed importance in the context of sovereign debt crisis in the euro zone. Sovereign external debt refers to foreign debt contracted by the Government. As per Article 292 of the Indian Constitution, the Central Government can borrow abroad upon the security of the Consolidated Fund of India within limits (if any) specified by the Parliament from time to time, while Article 293 of the Indian Constitution mandates that State Governments can borrow only from internal sources. 5.1.2 Government of India, unlike many other economies, and in pursuance of its prudent external debt management policy has been borrowing mainly from multilateral and bilateral sources. These borrowings are also long-term in nature. This chapter provides an overview of the emerging trends in the country’s sovereign external debt, explicit contingent liabilities of the Government, debt service payments and projected debt service obligations under Government Account.
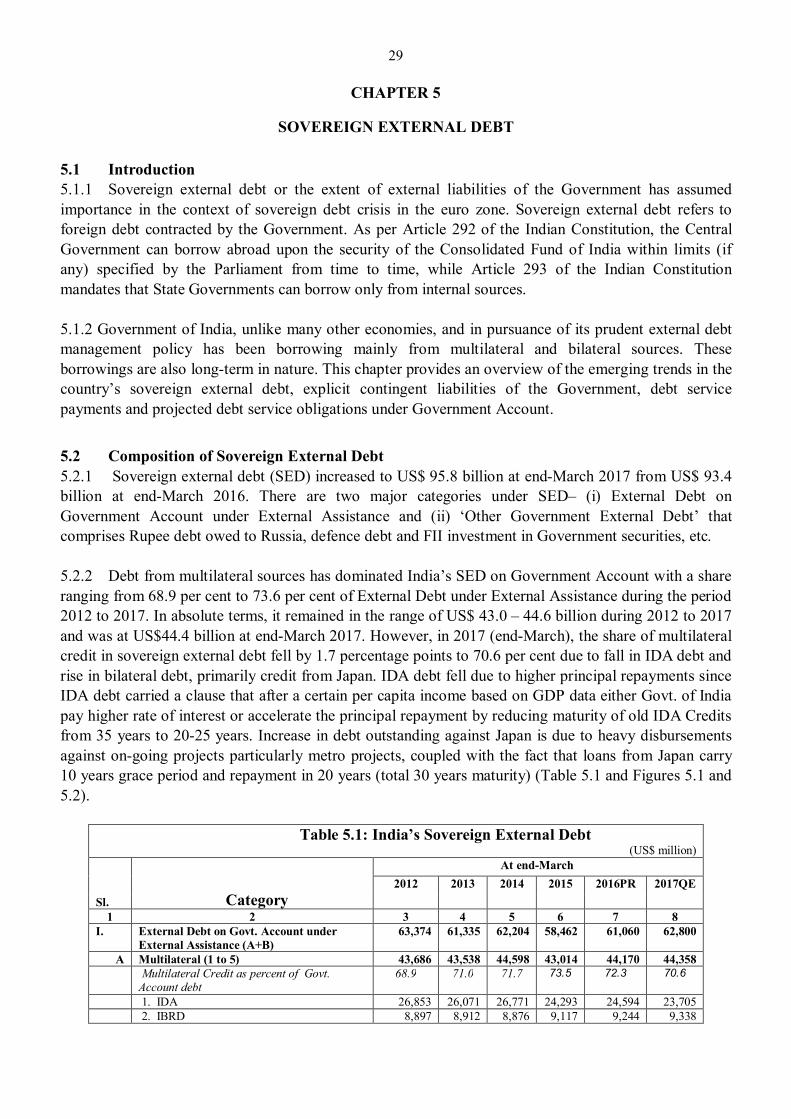
5.2 Composition of Sovereign External Debt 5.2.1 Sovereign external debt (SED) increased to US$ 95.8 billion at end-March 2017 from US$ 93.4 billion at end-March 2016. There are two major categories under SED– (i) External Debt on Government Account under External Assistance and (ii) ‘Other Government External Debt’ that comprises Rupee debt owed to Russia, defence debt and FII investment in Government securities, etc. 5.2.2 Debt from multilateral sources has dominated India’s SED on Government Account with a share ranging from 68.9 per cent to 73.6 per cent of External Debt under External Assistance during the period 2012 to 2017. In absolute terms, it remained in the range of US$ 43.0 – 44.6 billion during 2012 to 2017 and was at US$44.4 billion at end-March 2017. However, in 2017 (end-March), the share of multilateral credit in sovereign external debt fell by 1.7 percentage points to 70.6 per cent due to fall in IDA debt and rise in bilateral debt, primarily credit from Japan. IDA debt fell due to higher principal repayments since IDA debt carried a clause that after a certain per capita income based on GDP data either Govt. of India pay higher rate of interest or accelerate the principal repayment by reducing maturity of old IDA Credits from 35 years to 20-25 years. Increase in debt outstanding against Japan is due to heavy disbursements against on-going projects particularly metro projects, coupled with the fact that loans from Japan carry 10 years grace period and repayment in 20 years (total 30 years maturity) (Table 5.1 and Figures 5.1 and 5.2).
Table 5.1: India’s Sovereign External Debt (US$ million)
Sl. Category
At end-March 2012 2013 2014 2015 2016PR 2017QE
1 2 3 4 5 6 7 8 I. External Debt on Govt. Account under
External Assistance (A+B) 63,374 61,335 62,204 58,462 61,060 62,800
A Multilateral (1 to 5) 43,686 43,538 44,598 43,014 44,170 44,358 Multilateral Credit as percent of Govt.
Account debt 68.9 71.0 71.7 73.5 72.3 70.6
1. IDA 26,853 26,071 26,771 24,293 24,594 23,705 2. IBRD 8,897 8,912 8,876 9,117 9,244 9,338
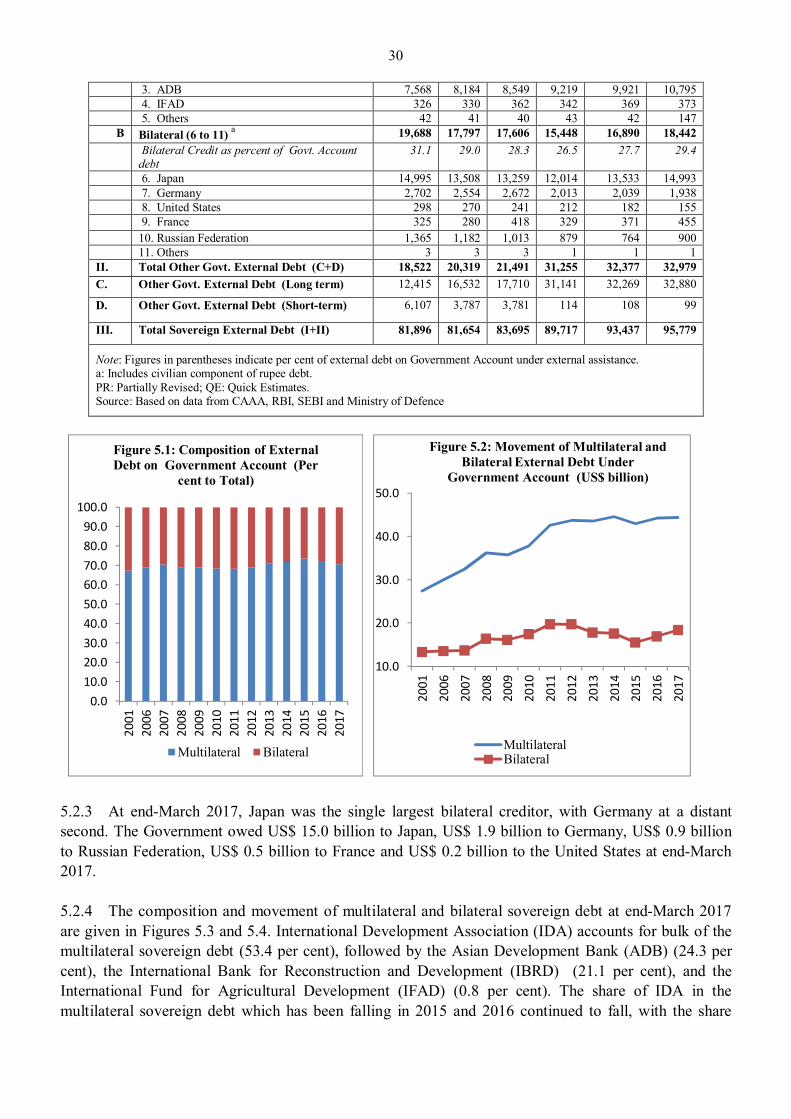
30
3. ADB 7,568 8,184 8,549 9,219 9,921 10,795 4. IFAD 326 330 362 342 369 373 5. Others 42 41 40 43 42 147
B Bilateral (6 to 11) a 19,688 17,797 17,606 15,448 16,890 18,442 Bilateral Credit as percent of Govt. Account
debt 31.1 29.0 28.3 26.5 27.7 29.4
6. Japan 14,995 13,508 13,259 12,014 13,533 14,993 7. Germany 2,702 2,554 2,672 2,013 2,039 1,938 8. United States 298 270 241 212 182 155 9. France 325 280 418 329 371 455 10. Russian Federation 1,365 1,182 1,013 879 764 900 11. Others 3 3 3 1 1 1
II. Total Other Govt. External Debt (C+D) 18,522 20,319 21,491 31,255 32,377 32,979 C. Other Govt. External Debt (Long term) 12,415 16,532 17,710 31,141 32,269 32,880
D. Other Govt. External Debt (Short-term) 6,107 3,787 3,781 114 108 99
III. Total Sovereign External Debt (I+II) 81,896 81,654 83,695 89,717 93,437 95,779
Note: Figures in parentheses indicate per cent of external debt on Government Account under external assistance. a: Includes civilian component of rupee debt. PR: Partially Revised; QE: Quick Estimates. Source: Based on data from CAAA, RBI, SEBI and Ministry of Defence
5.2.3 At end-March 2017, Japan was the single largest bilateral creditor, with Germany at a distant second. The Government owed US$ 15.0 billion to Japan, US$ 1.9 billion to Germany, US$ 0.9 billion to Russian Federation, US$ 0.5 billion to France and US$ 0.2 billion to the United States at end-March 2017. 5.2.4 The composition and movement of multilateral and bilateral sovereign debt at end-March 2017 are given in Figures 5.3 and 5.4. International Development Association (IDA) accounts for bulk of the multilateral sovereign debt (53.4 per cent), followed by the Asian Development Bank (ADB) (24.3 per cent), the International Bank for Reconstruction and Development (IBRD) (21.1 per cent), and the International Fund for Agricultural Development (IFAD) (0.8 per cent). The share of IDA in the multilateral sovereign debt which has been falling in 2015 and 2016 continued to fall, with the share
0.010.020.030.040.050.060.070.080.090.0
100.0
2001
2006
2007
2008
2009
2010
2011
2012
2013
2014
2015
2016
2017
Figure 5.1: Composition of External Debt on Government Account (Per
cent to Total)
Multilateral Bilateral
10.0
20.0
30.0
40.0
50.0
2001
2006
2007
2008
2009
2010
2011
2012
2013
2014
2015
2016
2017
Figure 5.2: Movement of Multilateral and Bilateral External Debt Under
Government Account (US$ billion)
MultilateralBilateral
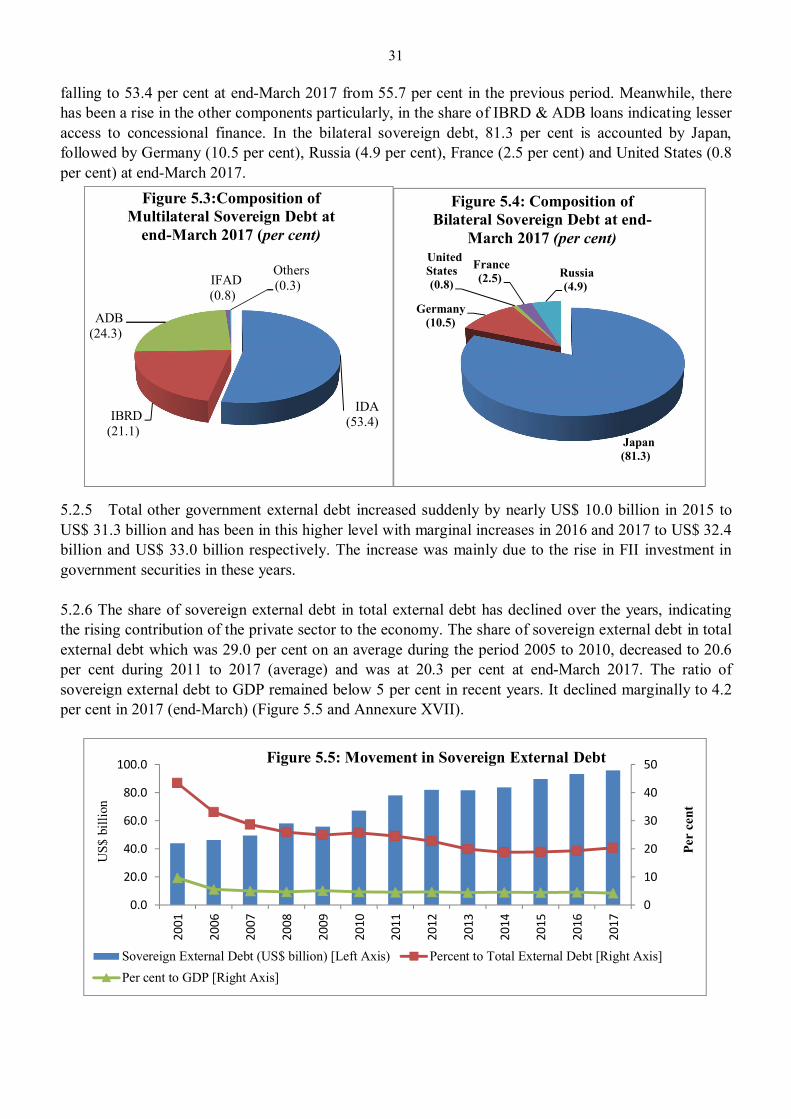
31
falling to 53.4 per cent at end-March 2017 from 55.7 per cent in the previous period. Meanwhile, there has been a rise in the other components particularly, in the share of IBRD & ADB loans indicating lesser access to concessional finance. In the bilateral sovereign debt, 81.3 per cent is accounted by Japan, followed by Germany (10.5 per cent), Russia (4.9 per cent), France (2.5 per cent) and United States (0.8 per cent) at end-March 2017.
5.2.5 Total other government external debt increased suddenly by nearly US$ 10.0 billion in 2015 to US$ 31.3 billion and has been in this higher level with marginal increases in 2016 and 2017 to US$ 32.4 billion and US$ 33.0 billion respectively. The increase was mainly due to the rise in FII investment in government securities in these years. 5.2.6 The share of sovereign external debt in total external debt has declined over the years, indicating the rising contribution of the private sector to the economy. The share of sovereign external debt in total external debt which was 29.0 per cent on an average during the period 2005 to 2010, decreased to 20.6 per cent during 2011 to 2017 (average) and was at 20.3 per cent at end-March 2017. The ratio of sovereign external debt to GDP remained below 5 per cent in recent years. It declined marginally to 4.2 per cent in 2017 (end-March) (Figure 5.5 and Annexure XVII).
IDA(53.4)IBRD
(21.1)
ADB(24.3)
IFAD(0.8)
Others(0.3)
Figure 5.3:Composition of Multilateral Sovereign Debt at
end-March 2017 (per cent)
Japan (81.3)
Germany(10.5)
United States(0.8)
France(2.5) Russia
(4.9)
Figure 5.4: Composition of Bilateral Sovereign Debt at end-
March 2017 (per cent)
0
10
20
30
40
50
0.0
20.0
40.0
60.0
80.0
100.0
2001
2006
2007
2008
2009
2010
2011
2012
2013
2014
2015
2016
2017
Per
cent
US$
bill
ion
Figure 5.5: Movement in Sovereign External Debt
Sovereign External Debt (US$ billion) [Left Axis) Percent to Total External Debt [Right Axis]Per cent to GDP [Right Axis]
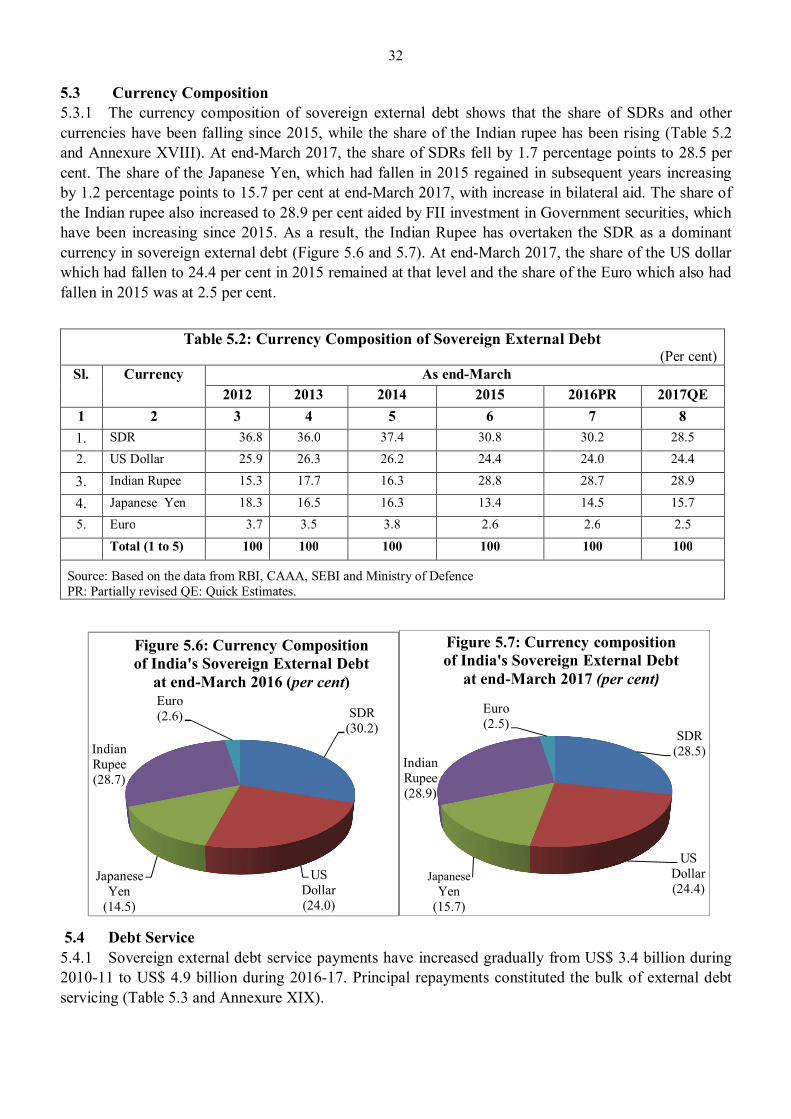
32
5.3 Currency Composition 5.3.1 The currency composition of sovereign external debt shows that the share of SDRs and other currencies have been falling since 2015, while the share of the Indian rupee has been rising (Table 5.2 and Annexure XVIII). At end-March 2017, the share of SDRs fell by 1.7 percentage points to 28.5 per cent. The share of the Japanese Yen, which had fallen in 2015 regained in subsequent years increasing by 1.2 percentage points to 15.7 per cent at end-March 2017, with increase in bilateral aid. The share of the Indian rupee also increased to 28.9 per cent aided by FII investment in Government securities, which have been increasing since 2015. As a result, the Indian Rupee has overtaken the SDR as a dominant currency in sovereign external debt (Figure 5.6 and 5.7). At end-March 2017, the share of the US dollar which had fallen to 24.4 per cent in 2015 remained at that level and the share of the Euro which also had fallen in 2015 was at 2.5 per cent.
Table 5.2: Currency Composition of Sovereign External Debt (Per cent)
Sl. Currency As end-March 2012 2013 2014 2015 2016PR 2017QE
1 2 3 4 5 6 7 8 1. SDR 36.8 36.0 37.4 30.8 30.2 28.5 2. US Dollar 25.9 26.3 26.2 24.4 24.0 24.4
3. Indian Rupee 15.3 17.7 16.3 28.8 28.7 28.9
4. Japanese Yen 18.3 16.5 16.3 13.4 14.5 15.7 5. Euro 3.7 3.5 3.8 2.6 2.6 2.5 Total (1 to 5) 100 100 100 100 100 100
Source: Based on the data from RBI, CAAA, SEBI and Ministry of Defence PR: Partially revised QE: Quick Estimates.
5.4 Debt Service 5.4.1 Sovereign external debt service payments have increased gradually from US$ 3.4 billion during 2010-11 to US$ 4.9 billion during 2016-17. Principal repayments constituted the bulk of external debt servicing (Table 5.3 and Annexure XIX).
SDR(30.2)
US Dollar(24.0)
Japanese Yen
(14.5)
Indian Rupee(28.7)
Euro(2.6)
Figure 5.6: Currency Composition of India's Sovereign External Debt
at end-March 2016 (per cent)
SDR(28.5)
US Dollar(24.4)
Japanese Yen
(15.7)
Indian Rupee(28.9)
Euro(2.5)
Figure 5.7: Currency composition of India's Sovereign External Debt
at end-March 2017 (per cent)
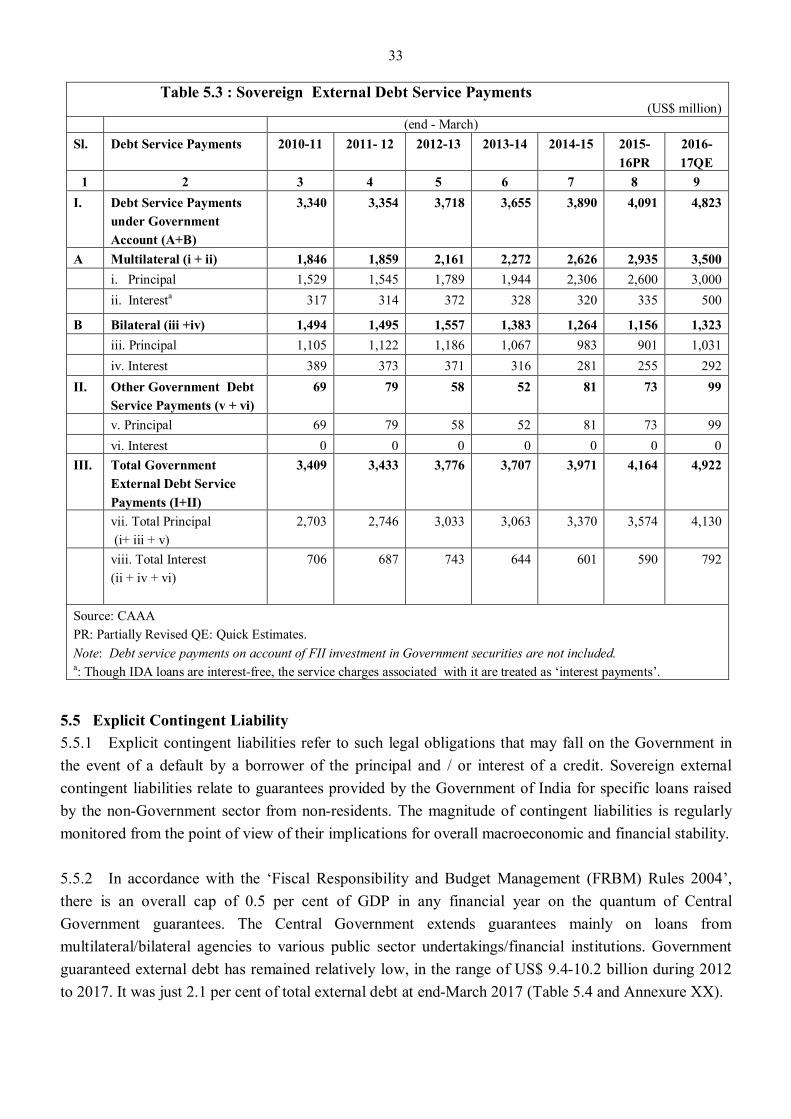
33
Table 5.3 : Sovereign External Debt Service Payments (US$ million)
(end - March) Sl. Debt Service Payments 2010-11 2011- 12 2012-13 2013-14 2014-15 2015-
16PR 2016-17QE
1 2 3 4 5 6 7 8 9 I. Debt Service Payments
under Government Account (A+B)
3,340 3,354 3,718 3,655 3,890 4,091 4,823
A Multilateral (i + ii) 1,846 1,859 2,161 2,272 2,626 2,935 3,500 i. Principal 1,529 1,545 1,789 1,944 2,306 2,600 3,000 ii. Interesta 317 314 372 328 320 335 500
B Bilateral (iii +iv) 1,494 1,495 1,557 1,383 1,264 1,156 1,323 iii. Principal 1,105 1,122 1,186 1,067 983 901 1,031 iv. Interest 389 373 371 316 281 255 292 II. Other Government Debt
Service Payments (v + vi) 69 79 58 52 81 73 99
v. Principal 69 79 58 52 81 73 99 vi. Interest 0 0 0 0 0 0 0 III. Total Government
External Debt Service Payments (I+II)
3,409 3,433 3,776 3,707 3,971 4,164 4,922
vii. Total Principal (i+ iii + v)
2,703 2,746 3,033 3,063 3,370 3,574 4,130
viii. Total Interest (ii + iv + vi)
706 687 743
644 601 590 792
Source: CAAA PR: Partially Revised QE: Quick Estimates. Note: Debt service payments on account of FII investment in Government securities are not included. a: Though IDA loans are interest-free, the service charges associated with it are treated as ‘interest payments’.
5.5 Explicit Contingent Liability 5.5.1 Explicit contingent liabilities refer to such legal obligations that may fall on the Government in the event of a default by a borrower of the principal and / or interest of a credit. Sovereign external contingent liabilities relate to guarantees provided by the Government of India for specific loans raised by the non-Government sector from non-residents. The magnitude of contingent liabilities is regularly monitored from the point of view of their implications for overall macroeconomic and financial stability. 5.5.2 In accordance with the ‘Fiscal Responsibility and Budget Management (FRBM) Rules 2004’, there is an overall cap of 0.5 per cent of GDP in any financial year on the quantum of Central Government guarantees. The Central Government extends guarantees mainly on loans from multilateral/bilateral agencies to various public sector undertakings/financial institutions. Government guaranteed external debt has remained relatively low, in the range of US$ 9.4-10.2 billion during 2012 to 2017. It was just 2.1 per cent of total external debt at end-March 2017 (Table 5.4 and Annexure XX).
34
Table 5.4 : Central Government Guarantees on External Debt (US$ million) At end-March
Sl. Component 2012 2013 2014 2015 2016 PR
2017
QE
1 2 3 4 5 6 7 8
1. Government Debt 81,896 81,654 83,695 89,717 93,437 95,779
2. Non-Government Debt 278,870 327,720 362,483 384,958 391,552 389,835
3. of which with Government Guaranteed*: (a+b+c)
9,361 9,536 9,913 9,577 10,086 10,171
a. Financial Sector 2,794 2,748 2,741 2,448 2,657 3,791
b. Public Sector 6,534 6,777 7,172 7,129 7,411 6,236
c. Private Sector 33 11 0 0 18 144
4. Total External Debt (1+2) 360,766 409,374 446,178 474,675 484,989 485,614
5. Government and Government Guaranteed Debt (1+3)
91,257 91,190 93,608 99,294 103,523 105,950
6. Govt. and Government Guaranteed Debt to Total External Debt (Per cent)
25.3 22.3 21.0 20.9 21.3 21.8
7. Govt. Guaranteed Debt to Total External Debt (Per cent)
2.6 2.3 2.2 2.0 2.1 2.1
8. Govt. Guaranteed to Total Non-Govt. Debt (Per cent)
3.4 2.9 2.7 2.5 2.6 2.6
Source: Based on the data from RBI, CAAA, SEBI and Ministry of Defence
PR: Partially Revised; QE: Quick Estimates.
* Direct Credit guarantees on non-government external debt provided by the Central Government.
5.5.3 The share of Government and Government guaranteed debt in total external debt has generally been declining over the years though there were marginal increases in the last two years. At end-March 2017, the share was 21.8 per cent, slightly higher than at end-March 2016 due to increase in Government debt which in turn is due to FII investment in Govt. securities. Bulk of the non-Government debt guaranteed by the Government, is public sector debt with a share of 61.3 per cent, while the share of the financial sector (that represents borrowings by banks and financial institutions) was 37.3 per cent at end-March 2017. 5.6 Projections of Debt Service Payments on Government Account 5.6.1 Total sovereign external debt service payments, based on disbursed outstanding debt at end March 2017, are estimated to rise gradually from US$ 5.5 billion in 2017-18 to US$ 7.4 billion in 2022-23 and then gradually fall over the years to US$ 6.8 billion in 2026-27 (Table 5.5). Multilateral debt accounts for a major portion in sovereign external debt service payments. The institution wise break-up of both multilateral and bilateral components of debt service is given in Annexure XXII. Principal repayments forms the bulk of debt service payments under government account.
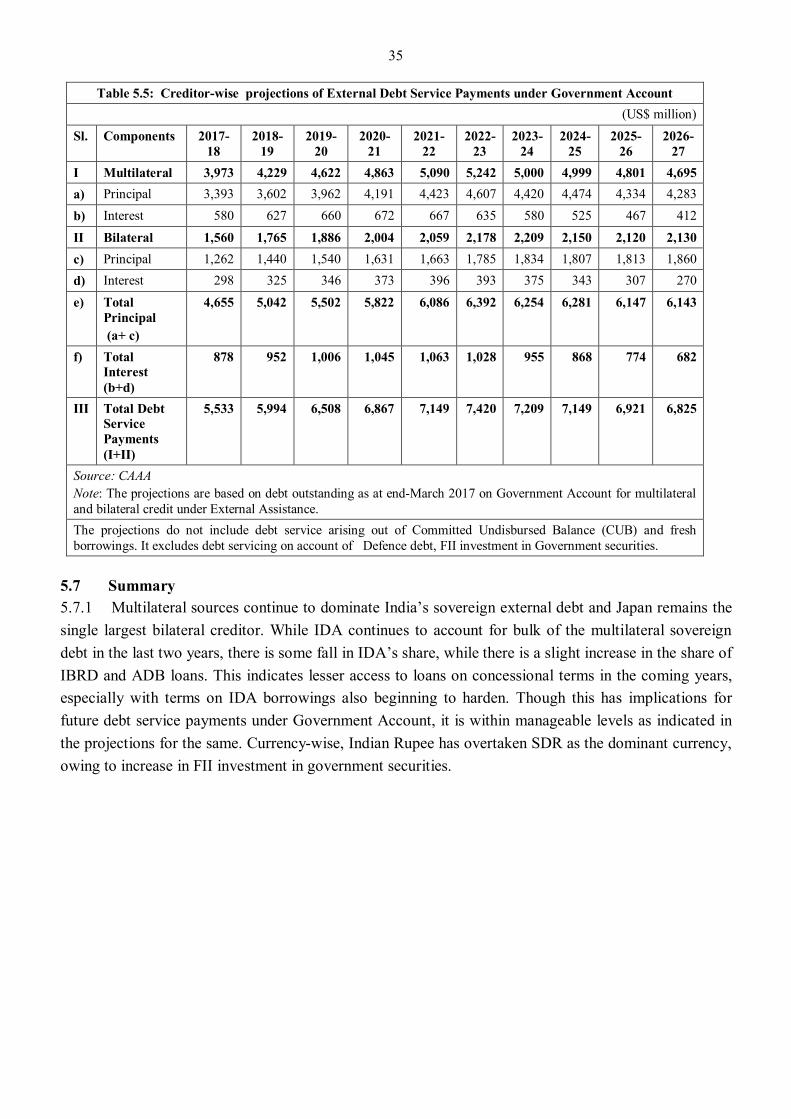
35
Table 5.5: Creditor-wise projections of External Debt Service Payments under Government Account (US$ million)
Sl. Components 2017-18
2018-19
2019-20
2020-21
2021-22
2022-23
2023-24
2024-25
2025-26
2026-27
I Multilateral 3,973 4,229 4,622 4,863 5,090 5,242 5,000 4,999 4,801 4,695 a) Principal 3,393 3,602 3,962 4,191 4,423 4,607 4,420 4,474 4,334 4,283
b) Interest 580 627 660 672 667 635 580 525 467 412
II Bilateral 1,560 1,765 1,886 2,004 2,059 2,178 2,209 2,150 2,120 2,130 c) Principal 1,262 1,440 1,540 1,631 1,663 1,785 1,834 1,807 1,813 1,860 d) Interest 298 325 346 373 396 393 375 343 307 270
e) Total Principal (a+ c)
4,655 5,042 5,502 5,822 6,086 6,392 6,254 6,281 6,147 6,143
f) Total Interest (b+d)
878 952 1,006 1,045 1,063 1,028 955 868 774 682
III Total Debt Service Payments (I+II)
5,533 5,994 6,508 6,867 7,149 7,420 7,209 7,149 6,921 6,825
Source: CAAA Note: The projections are based on debt outstanding as at end-March 2017 on Government Account for multilateral and bilateral credit under External Assistance. The projections do not include debt service arising out of Committed Undisbursed Balance (CUB) and fresh borrowings. It excludes debt servicing on account of Defence debt, FII investment in Government securities.
5.7 Summary 5.7.1 Multilateral sources continue to dominate India’s sovereign external debt and Japan remains the single largest bilateral creditor. While IDA continues to account for bulk of the multilateral sovereign debt in the last two years, there is some fall in IDA’s share, while there is a slight increase in the share of IBRD and ADB loans. This indicates lesser access to loans on concessional terms in the coming years, especially with terms on IDA borrowings also beginning to harden. Though this has implications for future debt service payments under Government Account, it is within manageable levels as indicated in the projections for the same. Currency-wise, Indian Rupee has overtaken SDR as the dominant currency, owing to increase in FII investment in government securities.
37
Annex I
External Debt: Definition, Concepts and Dissemination of Data
I. Definitions and Concepts
1. External Debt
Gross external debt, is a stock variable and is measured at a point in time. External debt is definedas “the outstanding amount of those actual current, and not contingent, liabilities that require payment(s) ofprincipal and/or interest by the debtor at some point(s) in the future and that are owed to non-residents byresidents of an economy” {External Debt Statistics - Guide for Compilers and Users, International MonetaryFund (IMF), 2003}.
2. Original and Residual Maturity
(i) Original maturity is defined as the period encompassing the precise time of creation of thefinancial liability to its date of final maturity.
(ii) Debt by residual maturity (or remaining maturity) includes short term debt by original maturityof up to one year, combined with medium to long term debt repayment by original maturity falling duewithin the twelve month period following a reference date. External debt is commonly expressed in termsof original maturity.
3. Long and Short-term
One way of classifying external debt is the two-way scheme based on duration-long and short-term.Long term debt is defined as debt with an original maturity of more than one year, while short term debt isdefined as debt repayments on demand or with an original maturity of one year or less.
The coverage of short-term was redefined in 2005-06 by including supplier's credit upto 180 daysand FII investment in the Government Treasury Bills and other instruments and further in March 2007 byincluding external debt liabilities of the banking system and the investment in the Government securitiesby the foreign central banks and the international institutions.
4. Multilateral and Bilateral Debt
Multilateral creditors are primarily multilateral institutions such as the International DevelopmentAssociation (IDA), International Bank for Reconstruction and Development (IBRD), Asian Developmentbank (ADB) etc. Bilateral creditors are sovereign countries with whom sovereign and non-sovereign entitiesenter into one-to-one loan arrangements. Some of India's bilateral creditors who extend loans to bothsovereign and non-sovereign debtors include Japan, Germany, United States, France, Netherlands andRussian Federation.
5. Sovereign (Government) and Non-Sovereign (Non-Government) debt
Sovereign debt includes (i) external debt outstanding on account of loans received by Governmentof India under the ‘external assistance’ programme, and civilian component of Rupee Debt; (ii) otherGovernment debt comprising borrowings from IMF, defence debt component of Rupee debt as well asforeign currency defence debt and (iii) FII investment in Government Securities. Non-sovereign includesthe remaining components of external debt.
6. Trade Credits/Export Credits
Trade credits/Export credits refer to loans and credits extended for imports directly by overseas
38
supplier, bank and financial institution to sovereign and non-sovereign entities. Depending on the sourceof finance, such credits can be either suppliers’ credit or buyers’ credit.
(i) Suppliers’ Credit: Such credit is extended by the overseas supplier of goods in the form ofdeferred payments.
(ii) Buyers’ Credit: Such credit is provided by a bank or financial institution and is generallygoverned by OECD consensus terms and carries insurance from export credit agency of theconcerned country.
7. External Commercial Borrowings
The definition of commercial borrowing includes loans from commercial banks, other commercialfinancial institutions, money raised through issue of securitized instruments like bonds (including IndiaDevelopment Bonds (IDBs) and Resurgent India Bonds (RIBs)), Floating Rate Notes (FRN) and securitizedborrowings of commercial banks, etc. It also includes borrowings through buyers' credit & supplier creditmechanism of the concerned countries, International Finance Corporation, Washington [IFC (W)], NordicInvestment Bank and private sector borrowings from Asian Development Bank (ADB).
8. NRI Deposits
Non-Resident Indian (NRI) deposits are of three types:
(i) Non Resident (External) Rupee Account {NR(E)RA} Deposits were introduced in 1970.Any NRI can open an NRE account with funds remitted to India through a bank abroad. ANRE account maintained in Indian rupee may be opened as current, savings or term deposit.The amount held in these deposits together with the interest accrued can be repatriated.
(ii) Foreign Currency (Non Resident) (Banks) Deposits {FCNR (B)} were introduced witheffect from May 15, 1993. These are term deposits maintained only in Pound Sterling, U.S.dollar, Japanese Yen, Euro, Canadian dollar and Australian dollar. The minimum maturityperiod of these deposits was raised from six months to 1 year effective October 1999. FromJuly 26, 2005, banks have been allowed to accept FCNR (B) deposits up to a maximummaturity period of five years against the earlier maximum limit of three years.
(iii) Non-Resident Ordinary Rupee (NRO) Accounts – Any person resident outside India mayopen and maintain NRO account with an Authorised Dealer or in authorised bank for thepurpose of putting through bonafide transactions denominated in Indian Rupees. NROAccounts may be opened/maintained in the form of current, saving, recurring or fixeddeposits. NRI/Persons of Indian Origin (PIO) may remit an amount not exceeding USD 1million per financial year out of the balances held in NRO Accounts.
9. Concessional Debt
Generally, a loan is defined as 'concessional' when it carries a grant element of 25 per cent or more.In India, loans from multilateral (the International Development Association (IDA), International Fund forAgricultural Development (IFAD)) and bilateral sources (including rupee debt that is serviced throughexports) is categorized as 'concessional', based on their terms of long maturity and less-than-market rate ofinterest charged on them.
10. External Debt from Official and Private Creditors
External debt from multilateral and bilateral sources of finance, export credit component of bilateralcredit, export credit for defence purposes and rupee debt, etc, is called as official debt. External debt fromprivate creditor denotes sources of loans raised under ECBs, NRI deposits, export credits (other than thoseincluded under official creditors), and short-term debt.
39
11. External Debt to GDP Ratio
The ratio of the external debt stock to GDP is derived by scaling the total outstanding debt stock (inrupees) at the end of the financial year by the GDP (in rupees at current market prices) during the financialyear.
12. Debt Service Ratio
Debt service ratio is measured by the proportion of total debt service payments (i.e., principalrepayment plus interest payment) to current receipts (minus official transfers) of Balance of Payments(BoP). It indicates the claim that servicing of external debt makes on current receipts and is, therefore, ameasure of strain on BoP due to servicing of debt service obligations.
13. Borrower Classification of External Debt
The borrower classification of external debt provides breakup into Government (Sovereign) andnon-Government debt. The latter is further categorized into financial, public and private sectors. Financialsector represents borrowings by banks and financial institutions including long-term NRI Deposits. Publicsector debt represents borrowings of non- financial public sector enterprises and private sector debt representsborrowings of non- financial private sector enterprises.
14. External Debt Denominated in Rupee Currency
Unlike foreign currency denominated external debt, where the currency (exchange rate) risk isborne by the borrower, the characteristic feature of domestic currency denominated debt is that the exchangerate risk is borne by the creditor. The contractual liability, however, is settled in terms of the designatedforeign currency (Exports in case of Rupee debt owed to Russia).This implies that the borrower gains (andthe creditor loses) when the local currency depreciates since less has to be repaid in foreign currency termsand vice versa.
India’s External Debt denominated in Rupees consist of the following categories:-
i. Rupee Debt; The outstanding state credits (both defence and civilian) extended to India bythe erstwhile Union of Soviet Socialist Republic (USSR). The debt is denominated in Rupeesand repayment of such debt is made primarily through the export of goods to Russia;
ii. Rupee Denominated NRI Deposits viz. the Non-Resident (External) Rupee Account{NR(E)RA} and the Non-Resident Ordinary Rupee (NRO) Accounts. The NR(E)RA iscategorized as an external debt liability since the principal amount held in such accounts aswell as the interest accrued are repatriable;
iii. Foreign Institutional Investor’s (FII) Investments in Government Treasury Bills (TBs) anddated securities; and
iv. FII Investments in corporate debt securities.
15. Dissemination of External Debt Statistics in India
(i) The Government of India has been publishing the Status Report on India's external debtannually since 1993. The coverage of external debt statistics has been expanded over the years to alignit with the best international practices and make it more comprehensive. India has also been disseminatingdata on external debt under IMF's Special Data Dissemination Standards (SDDS) and Quarterly ExternalDebt Statistics (QEDS) database jointly developed by the World Bank and the International MonetaryFund.
(ii) The external debt statistics of India are disseminated with a lag of three months from the end ofthe reference quarter in both the country specific and SDDS format and are accessible at www.finmin.nic.in
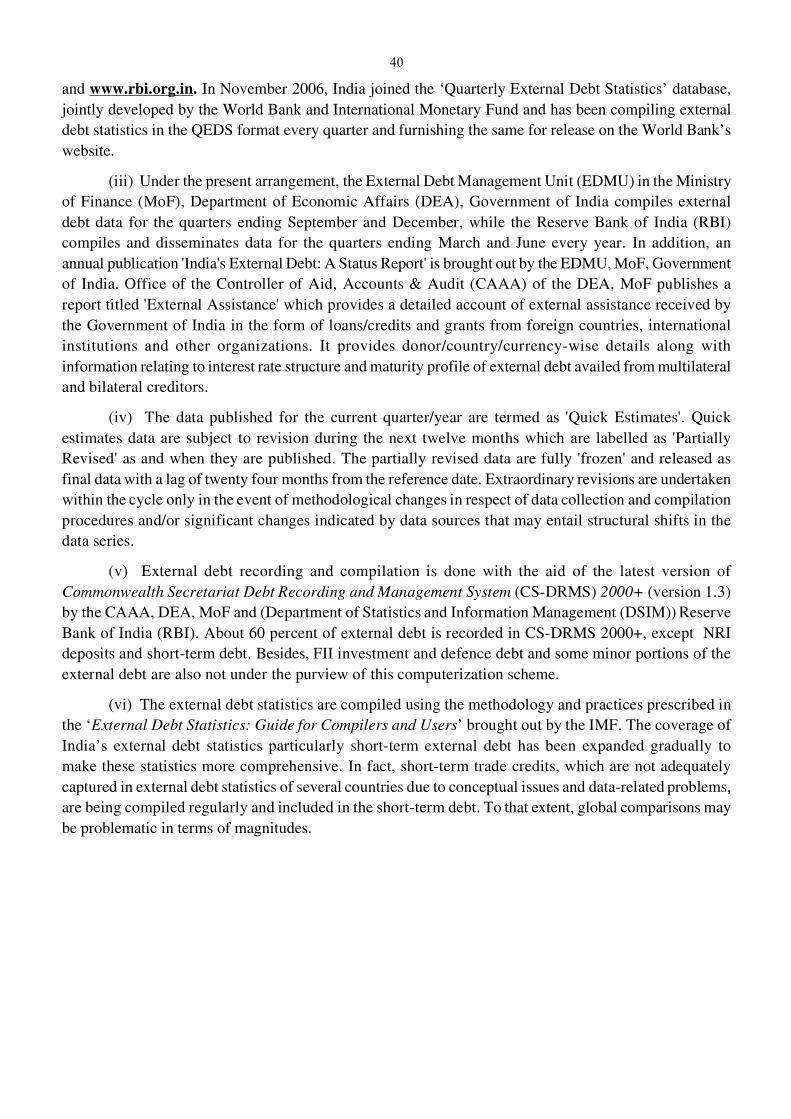
40
and www.rbi.org.in. In November 2006, India joined the ‘Quarterly External Debt Statistics’ database,jointly developed by the World Bank and International Monetary Fund and has been compiling externaldebt statistics in the QEDS format every quarter and furnishing the same for release on the World Bank’swebsite.
(iii) Under the present arrangement, the External Debt Management Unit (EDMU) in the Ministryof Finance (MoF), Department of Economic Affairs (DEA), Government of India compiles externaldebt data for the quarters ending September and December, while the Reserve Bank of India (RBI)compiles and disseminates data for the quarters ending March and June every year. In addition, anannual publication 'India's External Debt: A Status Report' is brought out by the EDMU, MoF, Governmentof India. Office of the Controller of Aid, Accounts & Audit (CAAA) of the DEA, MoF publishes areport titled 'External Assistance' which provides a detailed account of external assistance received bythe Government of India in the form of loans/credits and grants from foreign countries, internationalinstitutions and other organizations. It provides donor/country/currency-wise details along withinformation relating to interest rate structure and maturity profile of external debt availed from multilateraland bilateral creditors.
(iv) The data published for the current quarter/year are termed as 'Quick Estimates'. Quickestimates data are subject to revision during the next twelve months which are labelled as 'PartiallyRevised' as and when they are published. The partially revised data are fully 'frozen' and released asfinal data with a lag of twenty four months from the reference date. Extraordinary revisions are undertakenwithin the cycle only in the event of methodological changes in respect of data collection and compilationprocedures and/or significant changes indicated by data sources that may entail structural shifts in thedata series.
(v) External debt recording and compilation is done with the aid of the latest version ofCommonwealth Secretariat Debt Recording and Management System (CS-DRMS) 2000+ (version 1.3)by the CAAA, DEA, MoF and (Department of Statistics and Information Management (DSIM)) ReserveBank of India (RBI). About 60 percent of external debt is recorded in CS-DRMS 2000+, except NRIdeposits and short-term debt. Besides, FII investment and defence debt and some minor portions of theexternal debt are also not under the purview of this computerization scheme.
(vi) The external debt statistics are compiled using the methodology and practices prescribed inthe ‘External Debt Statistics: Guide for Compilers and Users’ brought out by the IMF. The coverage ofIndia’s external debt statistics particularly short-term external debt has been expanded gradually tomake these statistics more comprehensive. In fact, short-term trade credits, which are not adequatelycaptured in external debt statistics of several countries due to conceptual issues and data-related problems,are being compiled regularly and included in the short-term debt. To that extent, global comparisons maybe problematic in terms of magnitudes.
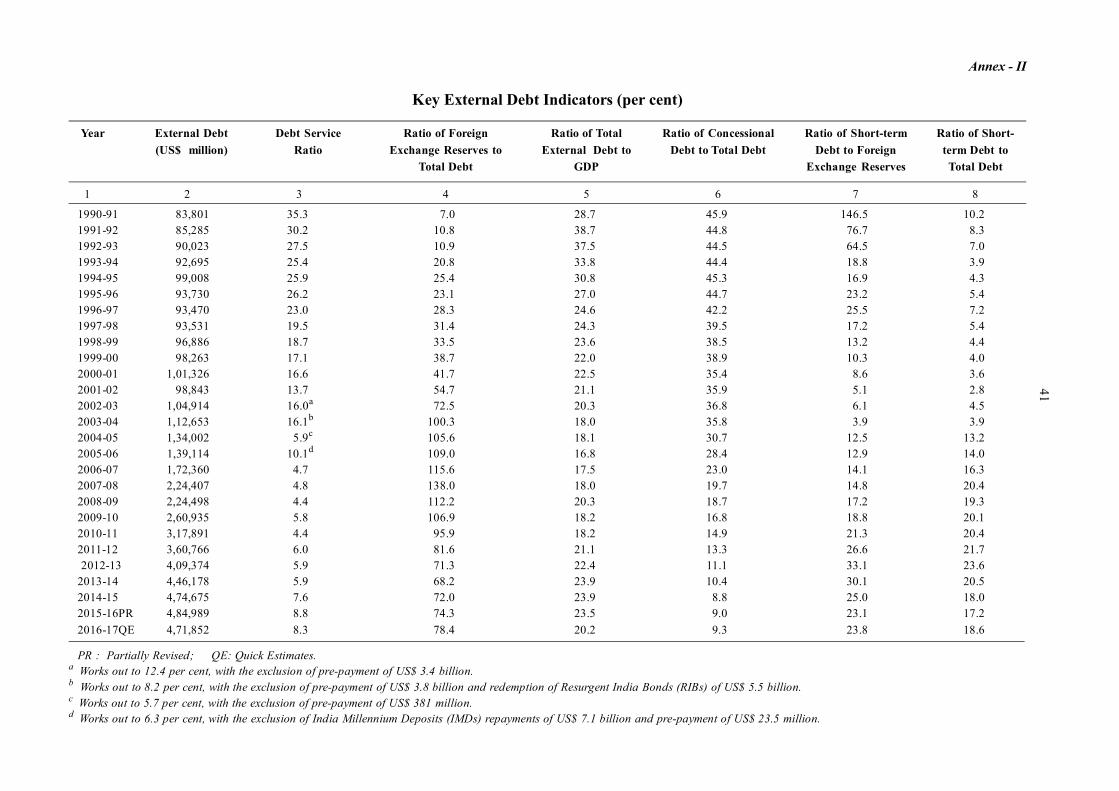
41
1990-91 83,801 35.3 7.0 28.7 45.9 146.5 10.21991-92 85,285 30.2 10.8 38.7 44.8 76.7 8.31992-93 90,023 27.5 10.9 37.5 44.5 64.5 7.01993-94 92,695 25.4 20.8 33.8 44.4 18.8 3.91994-95 99,008 25.9 25.4 30.8 45.3 16.9 4.31995-96 93,730 26.2 23.1 27.0 44.7 23.2 5.41996-97 93,470 23.0 28.3 24.6 42.2 25.5 7.21997-98 93,531 19.5 31.4 24.3 39.5 17.2 5.41998-99 96,886 18.7 33.5 23.6 38.5 13.2 4.41999-00 98,263 17.1 38.7 22.0 38.9 10.3 4.02000-01 1,01,326 16.6 41.7 22.5 35.4 8.6 3.62001-02 98,843 13.7 54.7 21.1 35.9 5.1 2.82002-03 1,04,914 16.0a 72.5 20.3 36.8 6.1 4.52003-04 1,12,653 16.1b 100.3 18.0 35.8 3.9 3.92004-05 1,34,002 5.9c 105.6 18.1 30.7 12.5 13.22005-06 1,39,114 10.1d 109.0 16.8 28.4 12.9 14.02006-07 1,72,360 4.7 115.6 17.5 23.0 14.1 16.32007-08 2,24,407 4.8 138.0 18.0 19.7 14.8 20.42008-09 2,24,498 4.4 112.2 20.3 18.7 17.2 19.32009-10 2,60,935 5.8 106.9 18.2 16.8 18.8 20.12010-11 3,17,891 4.4 95.9 18.2 14.9 21.3 20.42011-12 3,60,766 6.0 81.6 21.1 13.3 26.6 21.7 2012-13 4,09,374 5.9 71.3 22.4 11.1 33.1 23.62013-14 4,46,178 5.9 68.2 23.9 10.4 30.1 20.52014-15 4,74,675 7.6 72.0 23.9 8.8 25.0 18.02015-16PR 4,84,989 8.8 74.3 23.5 9.0 23.1 17.22016-17QE 4,71,852 8.3 78.4 20.2 9.3 23.8 18.6
PR : Partially Revised; QE: Quick Estimates.a Works out to 12.4 per cent, with the exclusion of pre-payment of US$ 3.4 billion.b Works out to 8.2 per cent, with the exclusion of pre-payment of US$ 3.8 billion and redemption of Resurgent India Bonds (RIBs) of US$ 5.5 billion.c Works out to 5.7 per cent, with the exclusion of pre-payment of US$ 381 million.d Works out to 6.3 per cent, with the exclusion of India Millennium Deposits (IMDs) repayments of US$ 7.1 billion and pre-payment of US$ 23.5 million.
Annex - II
Key External Debt Indicators (per cent)
Year External Debt Debt Service Ratio of Foreign Ratio of Total Ratio of Concessional Ratio of Short-term Ratio of Short-(US$ million) Ratio Exchange Reserves to External Debt to Debt to Total Debt Debt to Foreign term Debt to
Total Debt GDP Exchange Reserves Total Debt
1 2 3 4 5 6 7 8
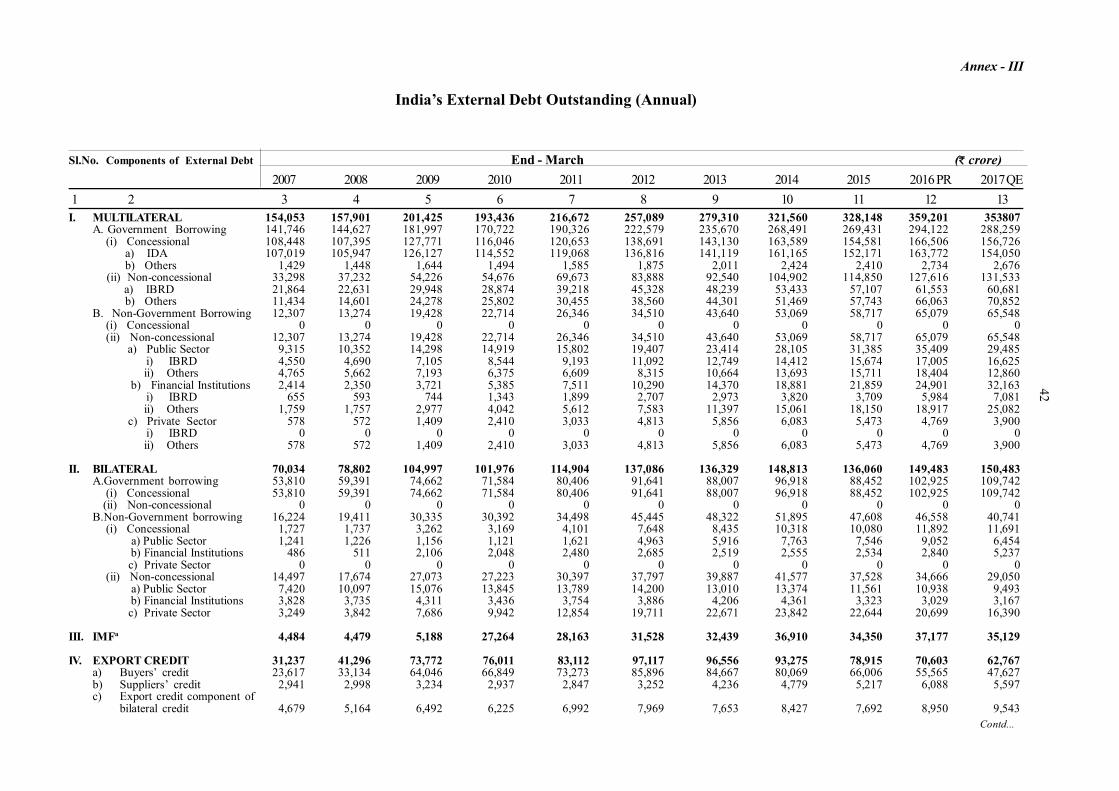
42Annex - III
India’s External Debt Outstanding (Annual)
Sl.No. Components of External Debt End - March (` crore)2007 2008 2009 2010 2011 2012 2013 2014 2015 2016 PR 2017 QE
1 2 3 4 5 6 7 8 9 10 11 12 13
Contd...
I. MULTILATERAL 154,053 157,901 201,425 193,436 216,672 257,089 279,310 321,560 328,148 359,201 353807A. Government Borrowing 141,746 144,627 181,997 170,722 190,326 222,579 235,670 268,491 269,431 294,122 288,259 (i) Concessional 108,448 107,395 127,771 116,046 120,653 138,691 143,130 163,589 154,581 166,506 156,726 a) IDA 107,019 105,947 126,127 114,552 119,068 136,816 141,119 161,165 152,171 163,772 154,050 b) Others 1,429 1,448 1,644 1,494 1,585 1,875 2,011 2,424 2,410 2,734 2,676 (ii) Non-concessional 33,298 37,232 54,226 54,676 69,673 83,888 92,540 104,902 114,850 127,616 131,533 a) IBRD 21,864 22,631 29,948 28,874 39,218 45,328 48,239 53,433 57,107 61,553 60,681 b) Others 11,434 14,601 24,278 25,802 30,455 38,560 44,301 51,469 57,743 66,063 70,852B. Non-Government Borrowing 12,307 13,274 19,428 22,714 26,346 34,510 43,640 53,069 58,717 65,079 65,548 (i) Concessional 0 0 0 0 0 0 0 0 0 0 0 (ii) Non-concessional 12,307 13,274 19,428 22,714 26,346 34,510 43,640 53,069 58,717 65,079 65,548 a) Public Sector 9,315 10,352 14,298 14,919 15,802 19,407 23,414 28,105 31,385 35,409 29,485 i) IBRD 4,550 4,690 7,105 8,544 9,193 11,092 12,749 14,412 15,674 17,005 16,625 ii) Others 4,765 5,662 7,193 6,375 6,609 8,315 10,664 13,693 15,711 18,404 12,860 b) Financial Institutions 2,414 2,350 3,721 5,385 7,511 10,290 14,370 18,881 21,859 24,901 32,163 i) IBRD 655 593 744 1,343 1,899 2,707 2,973 3,820 3,709 5,984 7,081 ii) Others 1,759 1,757 2,977 4,042 5,612 7,583 11,397 15,061 18,150 18,917 25,082 c) Private Sector 578 572 1,409 2,410 3,033 4,813 5,856 6,083 5,473 4,769 3,900 i) IBRD 0 0 0 0 0 0 0 0 0 0 0 ii) Others 578 572 1,409 2,410 3,033 4,813 5,856 6,083 5,473 4,769 3,900
II. BILATERAL 70,034 78,802 104,997 101,976 114,904 137,086 136,329 148,813 136,060 149,483 150,483A.Government borrowing 53,810 59,391 74,662 71,584 80,406 91,641 88,007 96,918 88,452 102,925 109,742 (i) Concessional 53,810 59,391 74,662 71,584 80,406 91,641 88,007 96,918 88,452 102,925 109,742 (ii) Non-concessional 0 0 0 0 0 0 0 0 0 0 0B.Non-Government borrowing 16,224 19,411 30,335 30,392 34,498 45,445 48,322 51,895 47,608 46,558 40,741 (i) Concessional 1,727 1,737 3,262 3,169 4,101 7,648 8,435 10,318 10,080 11,892 11,691 a) Public Sector 1,241 1,226 1,156 1,121 1,621 4,963 5,916 7,763 7,546 9,052 6,454 b) Financial Institutions 486 511 2,106 2,048 2,480 2,685 2,519 2,555 2,534 2,840 5,237 c) Private Sector 0 0 0 0 0 0 0 0 0 0 0 (ii) Non-concessional 14,497 17,674 27,073 27,223 30,397 37,797 39,887 41,577 37,528 34,666 29,050 a) Public Sector 7,420 10,097 15,076 13,845 13,789 14,200 13,010 13,374 11,561 10,938 9,493 b) Financial Institutions 3,828 3,735 4,311 3,436 3,754 3,886 4,206 4,361 3,323 3,029 3,167 c) Private Sector 3,249 3,842 7,686 9,942 12,854 19,711 22,671 23,842 22,644 20,699 16,390
III. IMFa 4,484 4,479 5,188 27,264 28,163 31,528 32,439 36,910 34,350 37,177 35,129
IV. EXPORT CREDIT 31,237 41,296 73,772 76,011 83,112 97,117 96,556 93,275 78,915 70,603 62,767a) Buyers’ credit 23,617 33,134 64,046 66,849 73,273 85,896 84,667 80,069 66,006 55,565 47,627b) Suppliers’ credit 2,941 2,998 3,234 2,937 2,847 3,252 4,236 4,779 5,217 6,088 5,597c) Export credit component of
bilateral credit 4,679 5,164 6,492 6,225 6,992 7,969 7,653 8,427 7,692 8,950 9,543
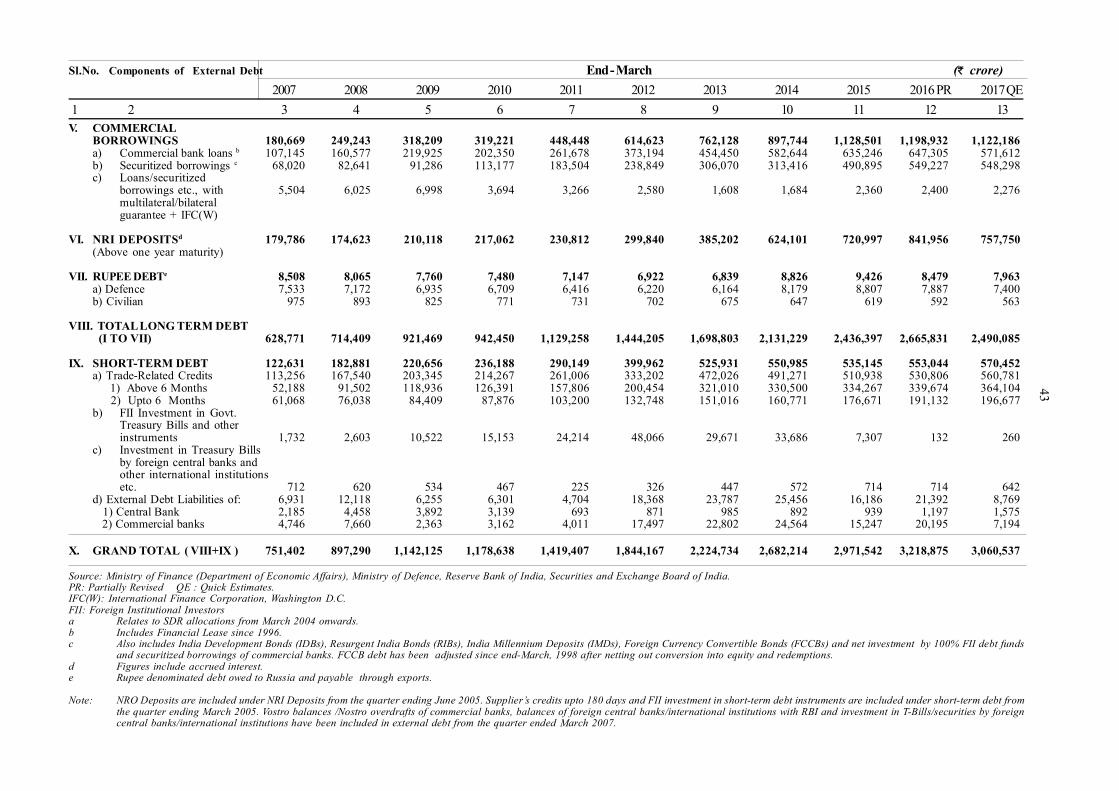
43Sl.No. Components of External Debt End - March (` crore)
2007 2008 2009 2010 2011 2012 2013 2014 2015 2016 PR 2017 QE 1 2 3 4 5 6 7 8 9 10 11 12 13V. COMMERCIAL
BORROWINGS 180,669 249,243 318,209 319,221 448,448 614,623 762,128 897,744 1,128,501 1,198,932 1,122,186a) Commercial bank loans b 107,145 160,577 219,925 202,350 261,678 373,194 454,450 582,644 635,246 647,305 571,612b) Securitized borrowings c 68,020 82,641 91,286 113,177 183,504 238,849 306,070 313,416 490,895 549,227 548,298c) Loans/securitized
borrowings etc., with 5,504 6,025 6,998 3,694 3,266 2,580 1,608 1,684 2,360 2,400 2,276multilateral/bilateralguarantee + IFC(W)
VI. NRI DEPOSITSd 179,786 174,623 210,118 217,062 230,812 299,840 385,202 624,101 720,997 841,956 757,750(Above one year maturity)
VII. RUPEE DEBTe 8,508 8,065 7,760 7,480 7,147 6,922 6,839 8,826 9,426 8,479 7,963a) Defence 7,533 7,172 6,935 6,709 6,416 6,220 6,164 8,179 8,807 7,887 7,400b) Civilian 975 893 825 771 731 702 675 647 619 592 563
VIII. TOTAL LONG TERM DEBT (I TO VII) 628,771 714,409 921,469 942,450 1,129,258 1,444,205 1,698,803 2,131,229 2,436,397 2,665,831 2,490,085
IX. SHORT-TERM DEBT 122,631 182,881 220,656 236,188 290,149 399,962 525,931 550,985 535,145 553,044 570,452a) Trade-Related Credits 113,256 167,540 203,345 214,267 261,006 333,202 472,026 491,271 510,938 530,806 560,781 1) Above 6 Months 52,188 91,502 118,936 126,391 157,806 200,454 321,010 330,500 334,267 339,674 364,104 2) Upto 6 Months 61,068 76,038 84,409 87,876 103,200 132,748 151,016 160,771 176,671 191,132 196,677b) FII Investment in Govt.
Treasury Bills and otherinstruments 1,732 2,603 10,522 15,153 24,214 48,066 29,671 33,686 7,307 132 260
c) Investment in Treasury Billsby foreign central banks andother international institutionsetc. 712 620 534 467 225 326 447 572 714 714 642
d) External Debt Liabilities of: 6,931 12,118 6,255 6,301 4,704 18,368 23,787 25,456 16,186 21,392 8,769 1) Central Bank 2,185 4,458 3,892 3,139 693 871 985 892 939 1,197 1,575 2) Commercial banks 4,746 7,660 2,363 3,162 4,011 17,497 22,802 24,564 15,247 20,195 7,194
X. GRAND TOTAL ( VIII+IX ) 751,402 897,290 1,142,125 1,178,638 1,419,407 1,844,167 2,224,734 2,682,214 2,971,542 3,218,875 3,060,537
Source: Ministry of Finance (Department of Economic Affairs), Ministry of Defence, Reserve Bank of India, Securities and Exchange Board of India.PR: Partially Revised QE : Quick Estimates.IFC(W): International Finance Corporation, Washington D.C.FII: Foreign Institutional Investorsa Relates to SDR allocations from March 2004 onwards.b Includes Financial Lease since 1996.c Also includes India Development Bonds (IDBs), Resurgent India Bonds (RIBs), India Millennium Deposits (IMDs), Foreign Currency Convertible Bonds (FCCBs) and net investment by 100% FII debt funds
and securitized borrowings of commercial banks. FCCB debt has been adjusted since end-March, 1998 after netting out conversion into equity and redemptions.d Figures include accrued interest.e Rupee denominated debt owed to Russia and payable through exports.
Note: NRO Deposits are included under NRI Deposits from the quarter ending June 2005. Supplier’s credits upto 180 days and FII investment in short-term debt instruments are included under short-term debt fromthe quarter ending March 2005. Vostro balances /Nostro overdrafts of commercial banks, balances of foreign central banks/international institutions with RBI and investment in T-Bills/securities by foreigncentral banks/international institutions have been included in external debt from the quarter ended March 2007.
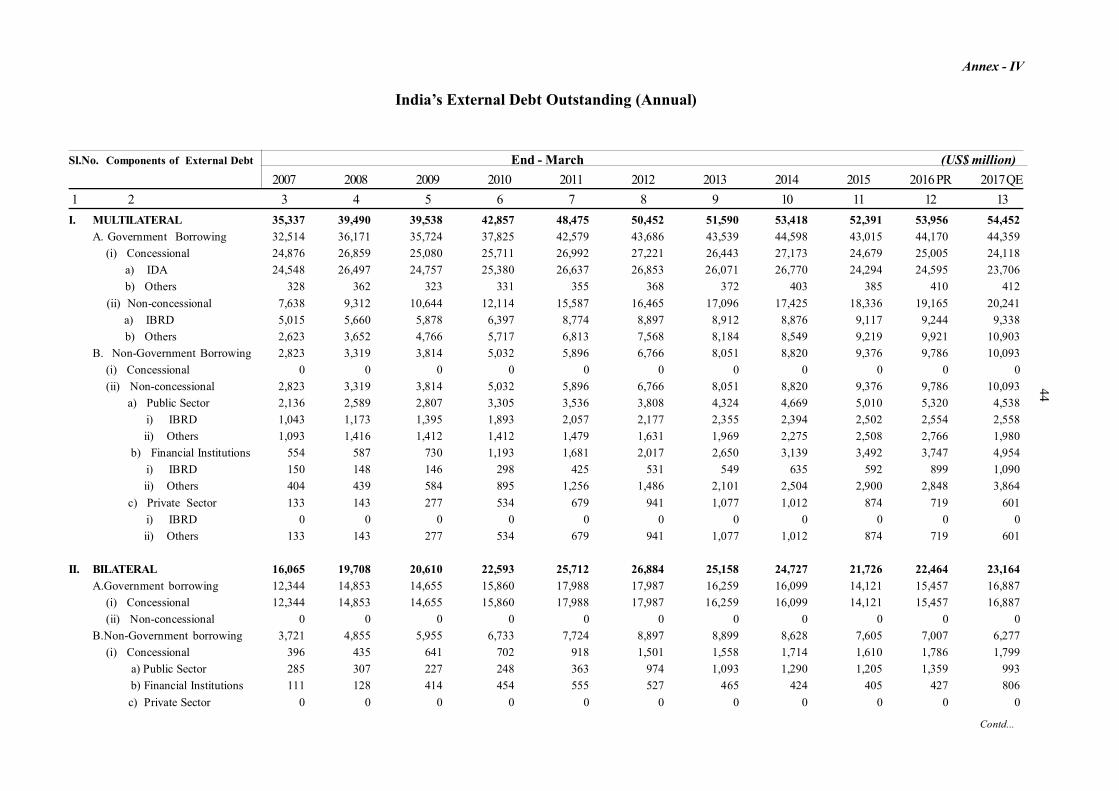
44Annex - IV
India’s External Debt Outstanding (Annual)
Sl.No. Components of External Debt End - March (US$ million)2007 2008 2009 2010 2011 2012 2013 2014 2015 2016 PR 2017 QE
1 2 3 4 5 6 7 8 9 10 11 12 13I. MULTILATERAL 35,337 39,490 39,538 42,857 48,475 50,452 51,590 53,418 52,391 53,956 54,452
A. Government Borrowing 32,514 36,171 35,724 37,825 42,579 43,686 43,539 44,598 43,015 44,170 44,359 (i) Concessional 24,876 26,859 25,080 25,711 26,992 27,221 26,443 27,173 24,679 25,005 24,118 a) IDA 24,548 26,497 24,757 25,380 26,637 26,853 26,071 26,770 24,294 24,595 23,706 b) Others 328 362 323 331 355 368 372 403 385 410 412 (ii) Non-concessional 7,638 9,312 10,644 12,114 15,587 16,465 17,096 17,425 18,336 19,165 20,241 a) IBRD 5,015 5,660 5,878 6,397 8,774 8,897 8,912 8,876 9,117 9,244 9,338 b) Others 2,623 3,652 4,766 5,717 6,813 7,568 8,184 8,549 9,219 9,921 10,903B. Non-Government Borrowing 2,823 3,319 3,814 5,032 5,896 6,766 8,051 8,820 9,376 9,786 10,093 (i) Concessional 0 0 0 0 0 0 0 0 0 0 0 (ii) Non-concessional 2,823 3,319 3,814 5,032 5,896 6,766 8,051 8,820 9,376 9,786 10,093 a) Public Sector 2,136 2,589 2,807 3,305 3,536 3,808 4,324 4,669 5,010 5,320 4,538 i) IBRD 1,043 1,173 1,395 1,893 2,057 2,177 2,355 2,394 2,502 2,554 2,558 ii) Others 1,093 1,416 1,412 1,412 1,479 1,631 1,969 2,275 2,508 2,766 1,980 b) Financial Institutions 554 587 730 1,193 1,681 2,017 2,650 3,139 3,492 3,747 4,954 i) IBRD 150 148 146 298 425 531 549 635 592 899 1,090 ii) Others 404 439 584 895 1,256 1,486 2,101 2,504 2,900 2,848 3,864 c) Private Sector 133 143 277 534 679 941 1,077 1,012 874 719 601 i) IBRD 0 0 0 0 0 0 0 0 0 0 0 ii) Others 133 143 277 534 679 941 1,077 1,012 874 719 601
II. BILATERAL 16,065 19,708 20,610 22,593 25,712 26,884 25,158 24,727 21,726 22,464 23,164A.Government borrowing 12,344 14,853 14,655 15,860 17,988 17,987 16,259 16,099 14,121 15,457 16,887 (i) Concessional 12,344 14,853 14,655 15,860 17,988 17,987 16,259 16,099 14,121 15,457 16,887 (ii) Non-concessional 0 0 0 0 0 0 0 0 0 0 0B.Non-Government borrowing 3,721 4,855 5,955 6,733 7,724 8,897 8,899 8,628 7,605 7,007 6,277 (i) Concessional 396 435 641 702 918 1,501 1,558 1,714 1,610 1,786 1,799 a) Public Sector 285 307 227 248 363 974 1,093 1,290 1,205 1,359 993 b) Financial Institutions 111 128 414 454 555 527 465 424 405 427 806 c) Private Sector 0 0 0 0 0 0 0 0 0 0 0
Contd...
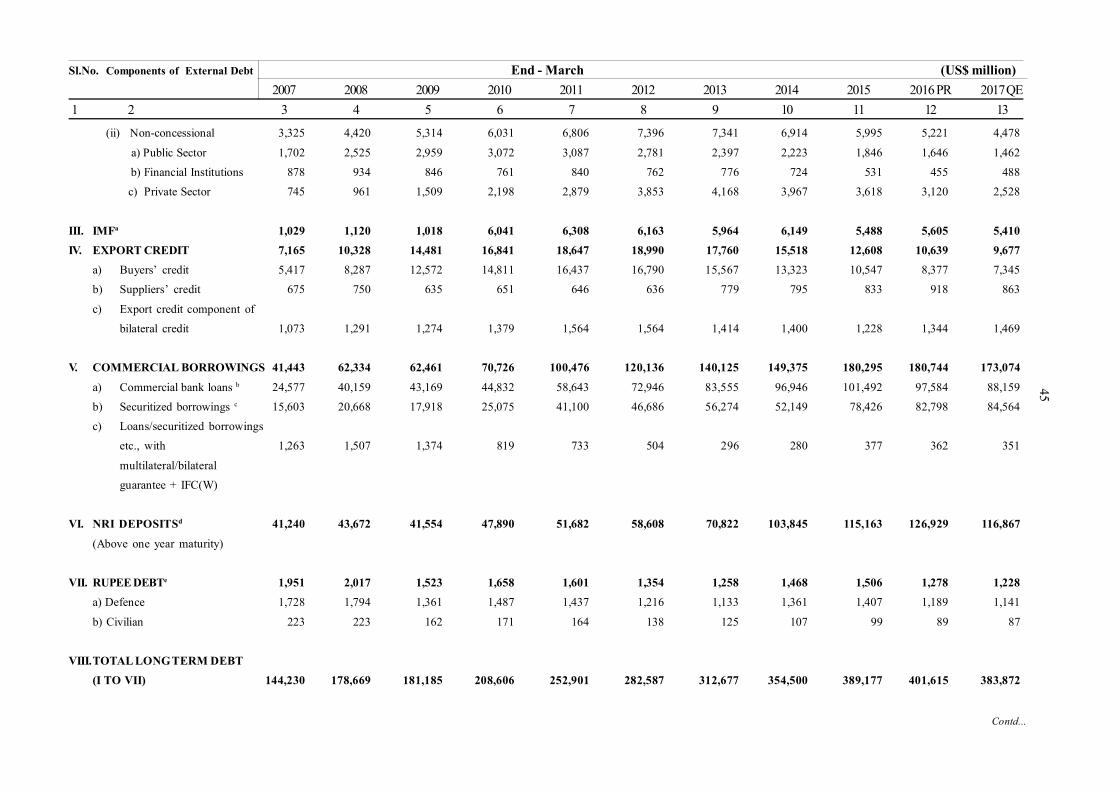
45Sl.No. Components of External Debt End - March (US$ million)
2007 2008 2009 2010 2011 2012 2013 2014 2015 2016 PR 2017 QE 1 2 3 4 5 6 7 8 9 10 11 12 13
(ii) Non-concessional 3,325 4,420 5,314 6,031 6,806 7,396 7,341 6,914 5,995 5,221 4,478
a) Public Sector 1,702 2,525 2,959 3,072 3,087 2,781 2,397 2,223 1,846 1,646 1,462
b) Financial Institutions 878 934 846 761 840 762 776 724 531 455 488
c) Private Sector 745 961 1,509 2,198 2,879 3,853 4,168 3,967 3,618 3,120 2,528
III. IMFa 1,029 1,120 1,018 6,041 6,308 6,163 5,964 6,149 5,488 5,605 5,410IV. EXPORT CREDIT 7,165 10,328 14,481 16,841 18,647 18,990 17,760 15,518 12,608 10,639 9,677
a) Buyers’ credit 5,417 8,287 12,572 14,811 16,437 16,790 15,567 13,323 10,547 8,377 7,345
b) Suppliers’ credit 675 750 635 651 646 636 779 795 833 918 863
c) Export credit component of
bilateral credit 1,073 1,291 1,274 1,379 1,564 1,564 1,414 1,400 1,228 1,344 1,469
V. COMMERCIAL BORROWINGS 41,443 62,334 62,461 70,726 100,476 120,136 140,125 149,375 180,295 180,744 173,074
a) Commercial bank loans b 24,577 40,159 43,169 44,832 58,643 72,946 83,555 96,946 101,492 97,584 88,159
b) Securitized borrowings c 15,603 20,668 17,918 25,075 41,100 46,686 56,274 52,149 78,426 82,798 84,564
c) Loans/securitized borrowings
etc., with 1,263 1,507 1,374 819 733 504 296 280 377 362 351
multilateral/bilateral
guarantee + IFC(W)
VI. NRI DEPOSITSd 41,240 43,672 41,554 47,890 51,682 58,608 70,822 103,845 115,163 126,929 116,867
(Above one year maturity)
VII. RUPEE DEBTe 1,951 2,017 1,523 1,658 1,601 1,354 1,258 1,468 1,506 1,278 1,228a) Defence 1,728 1,794 1,361 1,487 1,437 1,216 1,133 1,361 1,407 1,189 1,141
b) Civilian 223 223 162 171 164 138 125 107 99 89 87
VIII.TOTAL LONG TERM DEBT(I TO VII) 144,230 178,669 181,185 208,606 252,901 282,587 312,677 354,500 389,177 401,615 383,872
Contd...
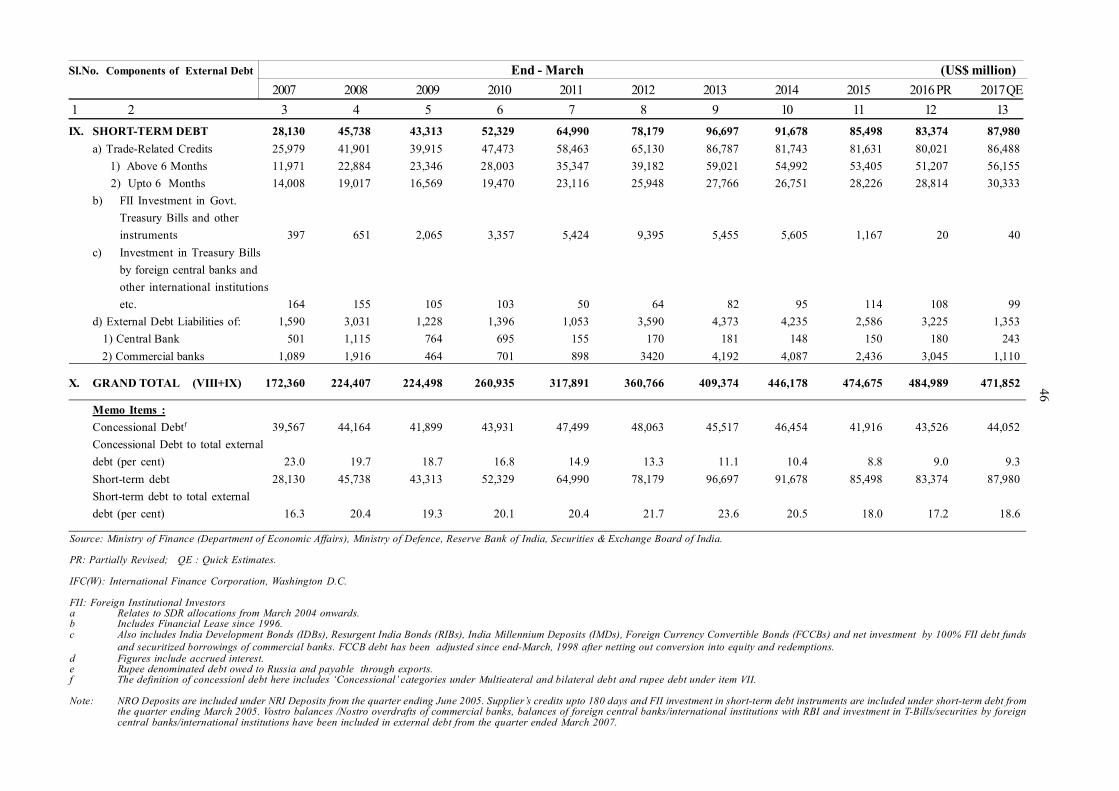
46Sl.No. Components of External Debt End - March (US$ million)
2007 2008 2009 2010 2011 2012 2013 2014 2015 2016 PR 2017 QE 1 2 3 4 5 6 7 8 9 10 11 12 13IX. SHORT-TERM DEBT 28,130 45,738 43,313 52,329 64,990 78,179 96,697 91,678 85,498 83,374 87,980
a) Trade-Related Credits 25,979 41,901 39,915 47,473 58,463 65,130 86,787 81,743 81,631 80,021 86,488 1) Above 6 Months 11,971 22,884 23,346 28,003 35,347 39,182 59,021 54,992 53,405 51,207 56,155 2) Upto 6 Months 14,008 19,017 16,569 19,470 23,116 25,948 27,766 26,751 28,226 28,814 30,333b) FII Investment in Govt.
Treasury Bills and otherinstruments 397 651 2,065 3,357 5,424 9,395 5,455 5,605 1,167 20 40
c) Investment in Treasury Billsby foreign central banks andother international institutionsetc. 164 155 105 103 50 64 82 95 114 108 99
d) External Debt Liabilities of: 1,590 3,031 1,228 1,396 1,053 3,590 4,373 4,235 2,586 3,225 1,353 1) Central Bank 501 1,115 764 695 155 170 181 148 150 180 243 2) Commercial banks 1,089 1,916 464 701 898 3420 4,192 4,087 2,436 3,045 1,110
X. GRAND TOTAL (VIII+IX) 172,360 224,407 224,498 260,935 317,891 360,766 409,374 446,178 474,675 484,989 471,852
Memo Items :Concessional Debtf 39,567 44,164 41,899 43,931 47,499 48,063 45,517 46,454 41,916 43,526 44,052Concessional Debt to total externaldebt (per cent) 23.0 19.7 18.7 16.8 14.9 13.3 11.1 10.4 8.8 9.0 9.3Short-term debt 28,130 45,738 43,313 52,329 64,990 78,179 96,697 91,678 85,498 83,374 87,980Short-term debt to total externaldebt (per cent) 16.3 20.4 19.3 20.1 20.4 21.7 23.6 20.5 18.0 17.2 18.6
Source: Ministry of Finance (Department of Economic Affairs), Ministry of Defence, Reserve Bank of India, Securities & Exchange Board of India.
PR: Partially Revised; QE : Quick Estimates.
IFC(W): International Finance Corporation, Washington D.C.
FII: Foreign Institutional Investorsa Relates to SDR allocations from March 2004 onwards.b Includes Financial Lease since 1996.c Also includes India Development Bonds (IDBs), Resurgent India Bonds (RIBs), India Millennium Deposits (IMDs), Foreign Currency Convertible Bonds (FCCBs) and net investment by 100% FII debt funds
and securitized borrowings of commercial banks. FCCB debt has been adjusted since end-March, 1998 after netting out conversion into equity and redemptions.d Figures include accrued interest.e Rupee denominated debt owed to Russia and payable through exports.f The definition of concessionl debt here includes ‘Concessional’ categories under Multieateral and bilateral debt and rupee debt under item VII.
Note: NRO Deposits are included under NRI Deposits from the quarter ending June 2005. Supplier’s credits upto 180 days and FII investment in short-term debt instruments are included under short-term debt fromthe quarter ending March 2005. Vostro balances /Nostro overdrafts of commercial banks, balances of foreign central banks/international institutions with RBI and investment in T-Bills/securities by foreigncentral banks/international institutions have been included in external debt from the quarter ended March 2007.
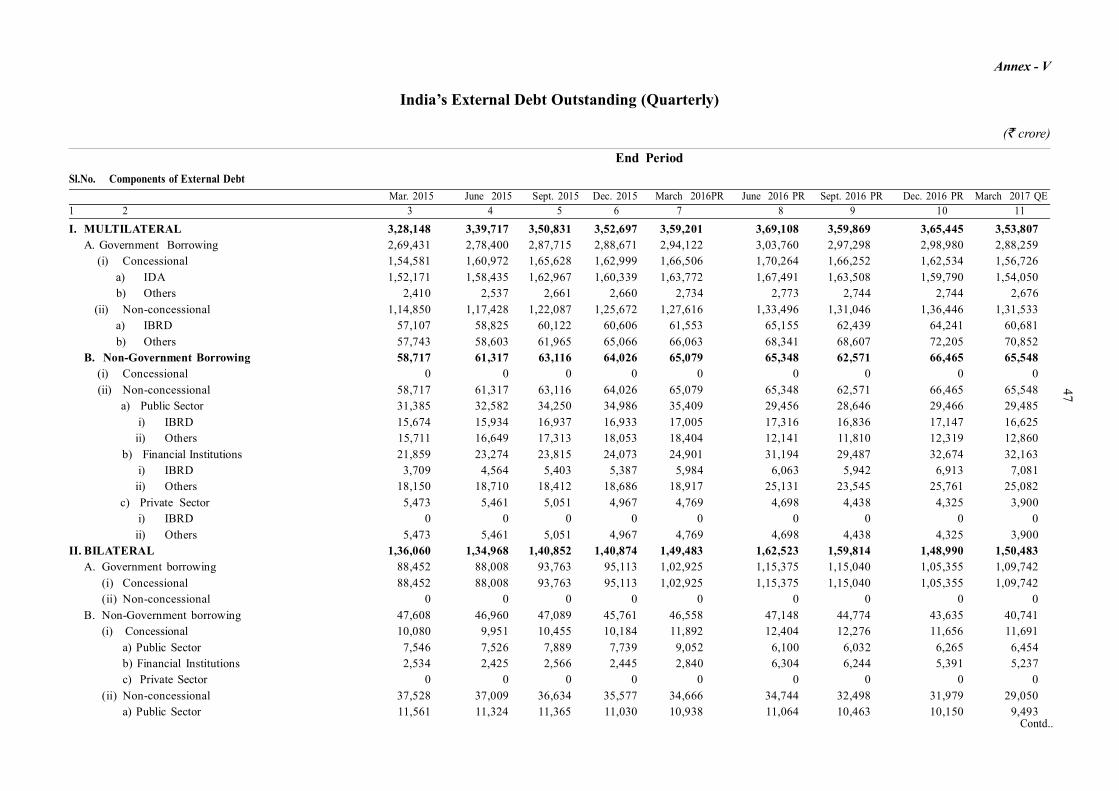
47Annex - V
India’s External Debt Outstanding (Quarterly)
(` crore)
End PeriodSl.No. Components of External Debt
Mar. 2015 June 2015 Sept. 2015 Dec. 2015 March 2016PR June 2016 PR Sept. 2016 PR Dec. 2016 PR March 2017 QE1 2 3 4 5 6 7 8 9 10 11
I. MULTILATERAL 3,28,148 3,39,717 3,50,831 3,52,697 3,59,201 3,69,108 3,59,869 3,65,445 3,53,807A. Government Borrowing 2,69,431 2,78,400 2,87,715 2,88,671 2,94,122 3,03,760 2,97,298 2,98,980 2,88,259 (i) Concessional 1,54,581 1,60,972 1,65,628 1,62,999 1,66,506 1,70,264 1,66,252 1,62,534 1,56,726 a) IDA 1,52,171 1,58,435 1,62,967 1,60,339 1,63,772 1,67,491 1,63,508 1,59,790 1,54,050 b) Others 2,410 2,537 2,661 2,660 2,734 2,773 2,744 2,744 2,676 (ii) Non-concessional 1,14,850 1,17,428 1,22,087 1,25,672 1,27,616 1,33,496 1,31,046 1,36,446 1,31,533 a) IBRD 57,107 58,825 60,122 60,606 61,553 65,155 62,439 64,241 60,681 b) Others 57,743 58,603 61,965 65,066 66,063 68,341 68,607 72,205 70,852B. Non-Government Borrowing 58,717 61,317 63,116 64,026 65,079 65,348 62,571 66,465 65,548 (i) Concessional 0 0 0 0 0 0 0 0 0 (ii) Non-concessional 58,717 61,317 63,116 64,026 65,079 65,348 62,571 66,465 65,548 a) Public Sector 31,385 32,582 34,250 34,986 35,409 29,456 28,646 29,466 29,485 i) IBRD 15,674 15,934 16,937 16,933 17,005 17,316 16,836 17,147 16,625 ii) Others 15,711 16,649 17,313 18,053 18,404 12,141 11,810 12,319 12,860 b) Financial Institutions 21,859 23,274 23,815 24,073 24,901 31,194 29,487 32,674 32,163 i) IBRD 3,709 4,564 5,403 5,387 5,984 6,063 5,942 6,913 7,081 ii) Others 18,150 18,710 18,412 18,686 18,917 25,131 23,545 25,761 25,082 c) Private Sector 5,473 5,461 5,051 4,967 4,769 4,698 4,438 4,325 3,900 i) IBRD 0 0 0 0 0 0 0 0 0 ii) Others 5,473 5,461 5,051 4,967 4,769 4,698 4,438 4,325 3,900
II. BILATERAL 1,36,060 1,34,968 1,40,852 1,40,874 1,49,483 1,62,523 1,59,814 1,48,990 1,50,483A. Government borrowing 88,452 88,008 93,763 95,113 1,02,925 1,15,375 1,15,040 1,05,355 1,09,742
(i) Concessional 88,452 88,008 93,763 95,113 1,02,925 1,15,375 1,15,040 1,05,355 1,09,742(ii) Non-concessional 0 0 0 0 0 0 0 0 0
B. Non-Government borrowing 47,608 46,960 47,089 45,761 46,558 47,148 44,774 43,635 40,741(i) Concessional 10,080 9,951 10,455 10,184 11,892 12,404 12,276 11,656 11,691
a) Public Sector 7,546 7,526 7,889 7,739 9,052 6,100 6,032 6,265 6,454b) Financial Institutions 2,534 2,425 2,566 2,445 2,840 6,304 6,244 5,391 5,237c) Private Sector 0 0 0 0 0 0 0 0 0
(ii) Non-concessional 37,528 37,009 36,634 35,577 34,666 34,744 32,498 31,979 29,050a) Public Sector 11,561 11,324 11,365 11,030 10,938 11,064 10,463 10,150 9,493
Contd..
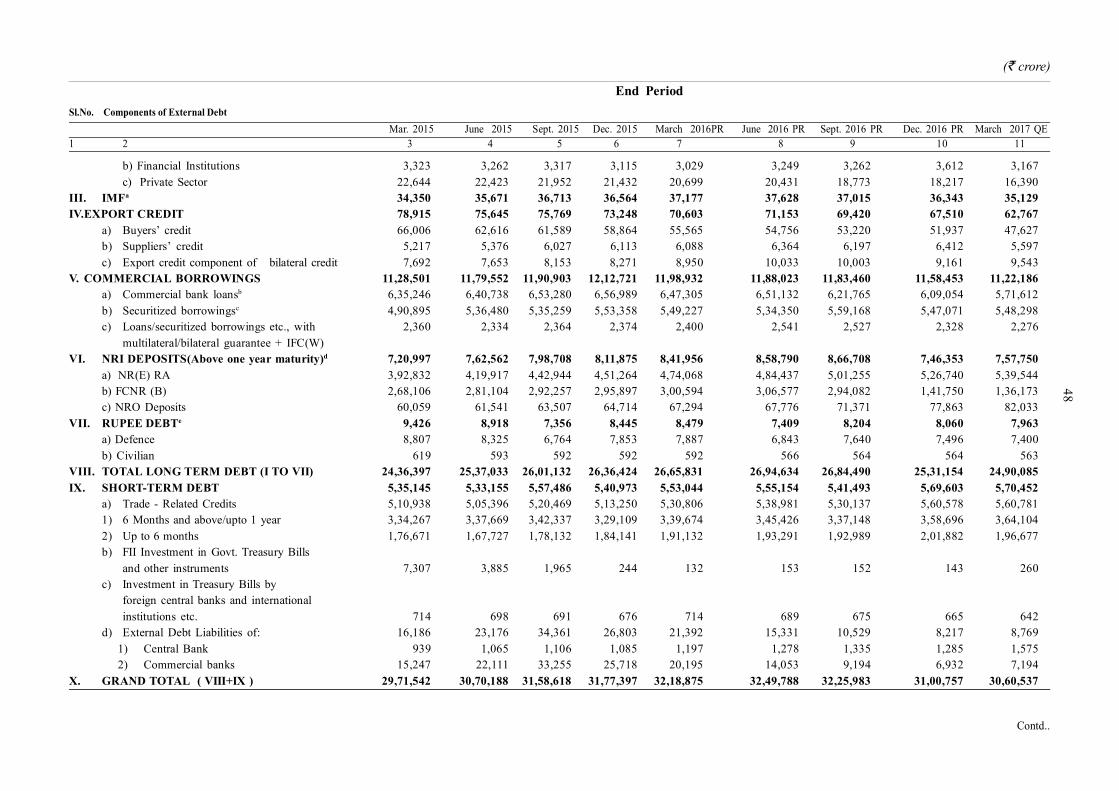
48
Contd..
(` crore)
End PeriodSl.No. Components of External Debt
Mar. 2015 June 2015 Sept. 2015 Dec. 2015 March 2016PR June 2016 PR Sept. 2016 PR Dec. 2016 PR March 2017 QE1 2 3 4 5 6 7 8 9 10 11
b) Financial Institutions 3,323 3,262 3,317 3,115 3,029 3,249 3,262 3,612 3,167c) Private Sector 22,644 22,423 21,952 21,432 20,699 20,431 18,773 18,217 16,390
III. IMFa 34,350 35,671 36,713 36,564 37,177 37,628 37,015 36,343 35,129IV.EXPORT CREDIT 78,915 75,645 75,769 73,248 70,603 71,153 69,420 67,510 62,767
a) Buyers’ credit 66,006 62,616 61,589 58,864 55,565 54,756 53,220 51,937 47,627b) Suppliers’ credit 5,217 5,376 6,027 6,113 6,088 6,364 6,197 6,412 5,597c) Export credit component of bilateral credit 7,692 7,653 8,153 8,271 8,950 10,033 10,003 9,161 9,543
V. COMMERCIAL BORROWINGS 11,28,501 11,79,552 11,90,903 12,12,721 11,98,932 11,88,023 11,83,460 11,58,453 11,22,186a) Commercial bank loansb 6,35,246 6,40,738 6,53,280 6,56,989 6,47,305 6,51,132 6,21,765 6,09,054 5,71,612b) Securitized borrowingsc 4,90,895 5,36,480 5,35,259 5,53,358 5,49,227 5,34,350 5,59,168 5,47,071 5,48,298c) Loans/securitized borrowings etc., with 2,360 2,334 2,364 2,374 2,400 2,541 2,527 2,328 2,276
multilateral/bilateral guarantee + IFC(W)VI. NRI DEPOSITS(Above one year maturity)d 7,20,997 7,62,562 7,98,708 8,11,875 8,41,956 8,58,790 8,66,708 7,46,353 7,57,750
a) NR(E) RA 3,92,832 4,19,917 4,42,944 4,51,264 4,74,068 4,84,437 5,01,255 5,26,740 5,39,544b) FCNR (B) 2,68,106 2,81,104 2,92,257 2,95,897 3,00,594 3,06,577 2,94,082 1,41,750 1,36,173c) NRO Deposits 60,059 61,541 63,507 64,714 67,294 67,776 71,371 77,863 82,033
VII. RUPEE DEBTe 9,426 8,918 7,356 8,445 8,479 7,409 8,204 8,060 7,963a) Defence 8,807 8,325 6,764 7,853 7,887 6,843 7,640 7,496 7,400b) Civilian 619 593 592 592 592 566 564 564 563
VIII. TOTAL LONG TERM DEBT (I TO VII) 24,36,397 25,37,033 26,01,132 26,36,424 26,65,831 26,94,634 26,84,490 25,31,154 24,90,085IX. SHORT-TERM DEBT 5,35,145 5,33,155 5,57,486 5,40,973 5,53,044 5,55,154 5,41,493 5,69,603 5,70,452
a) Trade - Related Credits 5,10,938 5,05,396 5,20,469 5,13,250 5,30,806 5,38,981 5,30,137 5,60,578 5,60,7811) 6 Months and above/upto 1 year 3,34,267 3,37,669 3,42,337 3,29,109 3,39,674 3,45,426 3,37,148 3,58,696 3,64,1042) Up to 6 months 1,76,671 1,67,727 1,78,132 1,84,141 1,91,132 1,93,291 1,92,989 2,01,882 1,96,677b) FII Investment in Govt. Treasury Bills
and other instruments 7,307 3,885 1,965 244 132 153 152 143 260c) Investment in Treasury Bills by
foreign central banks and internationalinstitutions etc. 714 698 691 676 714 689 675 665 642
d) External Debt Liabilities of: 16,186 23,176 34,361 26,803 21,392 15,331 10,529 8,217 8,769 1) Central Bank 939 1,065 1,106 1,085 1,197 1,278 1,335 1,285 1,575 2) Commercial banks 15,247 22,111 33,255 25,718 20,195 14,053 9,194 6,932 7,194
X. GRAND TOTAL ( VIII+IX ) 29,71,542 30,70,188 31,58,618 31,77,397 32,18,875 32,49,788 32,25,983 31,00,757 30,60,537
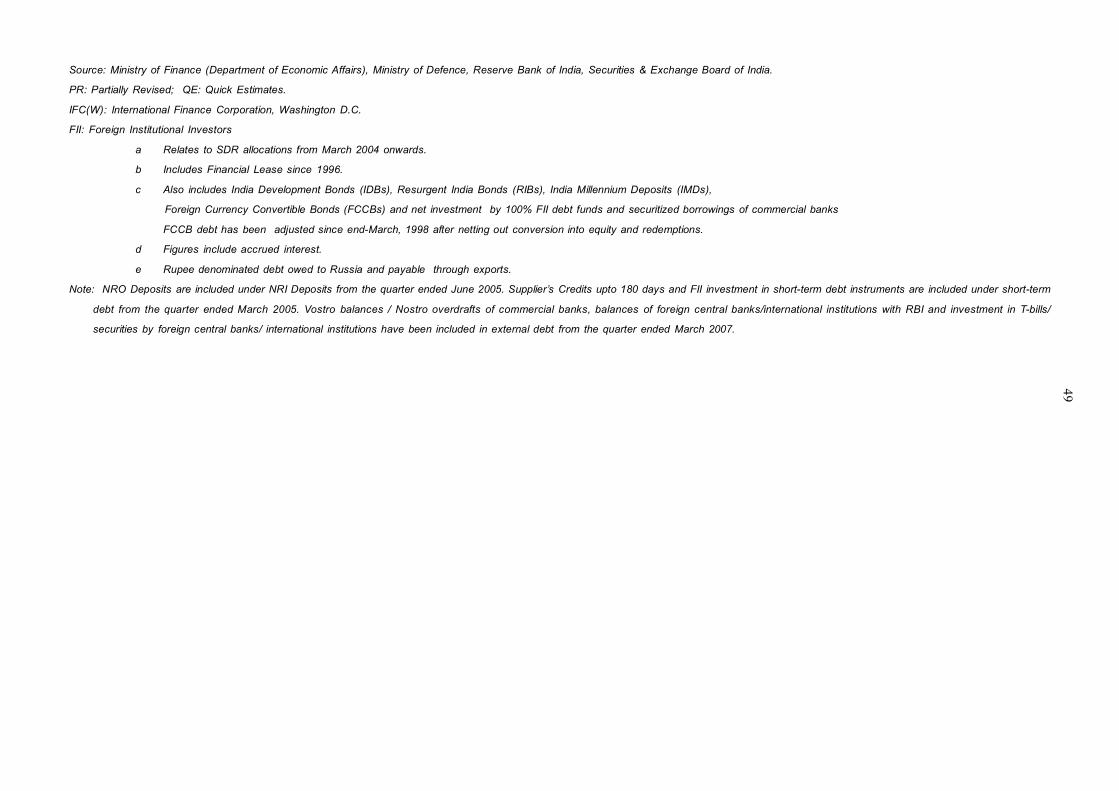
49Source: Ministry of Finance (Department of Economic Affairs), Ministry of Defence, Reserve Bank of India, Securities & Exchange Board of India.
PR: Partially Revised; QE: Quick Estimates.
IFC(W): International Finance Corporation, Washington D.C.
FII: Foreign Institutional Investors
a Relates to SDR allocations from March 2004 onwards.
b Includes Financial Lease since 1996.
c Also includes India Development Bonds (IDBs), Resurgent India Bonds (RIBs), India Millennium Deposits (IMDs),
Foreign Currency Convertible Bonds (FCCBs) and net investment by 100% FII debt funds and securitized borrowings of commercial banks
FCCB debt has been adjusted since end-March, 1998 after netting out conversion into equity and redemptions.
d Figures include accrued interest.
e Rupee denominated debt owed to Russia and payable through exports.
Note: NRO Deposits are included under NRI Deposits from the quarter ended June 2005. Supplier’s Credits upto 180 days and FII investment in short-term debt instruments are included under short-term
debt from the quarter ended March 2005. Vostro balances / Nostro overdrafts of commercial banks, balances of foreign central banks/international institutions with RBI and investment in T-bills/
securities by foreign central banks/ international institutions have been included in external debt from the quarter ended March 2007.
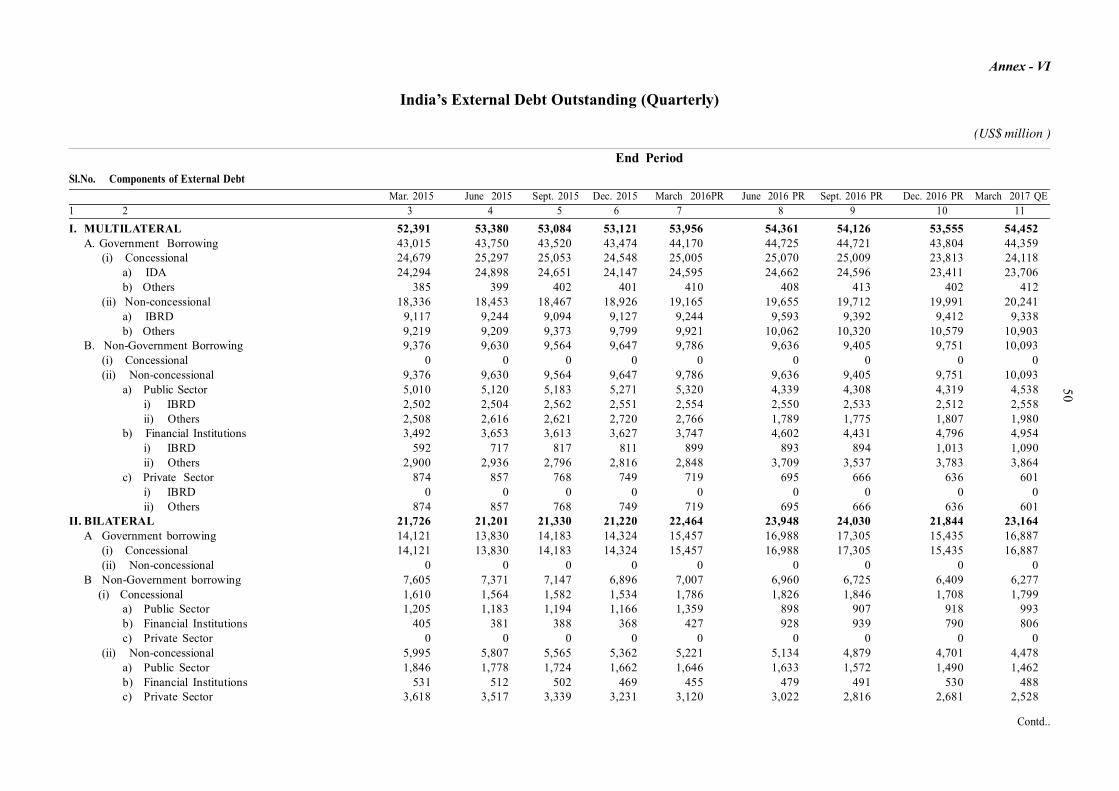
50Annex - VI
India’s External Debt Outstanding (Quarterly)
(US$ million )
End PeriodSl.No. Components of External Debt
Mar. 2015 June 2015 Sept. 2015 Dec. 2015 March 2016PR June 2016 PR Sept. 2016 PR Dec. 2016 PR March 2017 QE1 2 3 4 5 6 7 8 9 10 11I. MULTILATERAL 52,391 53,380 53,084 53,121 53,956 54,361 54,126 53,555 54,452
A. Government Borrowing 43,015 43,750 43,520 43,474 44,170 44,725 44,721 43,804 44,359(i) Concessional 24,679 25,297 25,053 24,548 25,005 25,070 25,009 23,813 24,118
a) IDA 24,294 24,898 24,651 24,147 24,595 24,662 24,596 23,411 23,706b) Others 385 399 402 401 410 408 413 402 412
(ii) Non-concessional 18,336 18,453 18,467 18,926 19,165 19,655 19,712 19,991 20,241a) IBRD 9,117 9,244 9,094 9,127 9,244 9,593 9,392 9,412 9,338b) Others 9,219 9,209 9,373 9,799 9,921 10,062 10,320 10,579 10,903
B. Non-Government Borrowing 9,376 9,630 9,564 9,647 9,786 9,636 9,405 9,751 10,093(i) Concessional 0 0 0 0 0 0 0 0 0(ii) Non-concessional 9,376 9,630 9,564 9,647 9,786 9,636 9,405 9,751 10,093
a) Public Sector 5,010 5,120 5,183 5,271 5,320 4,339 4,308 4,319 4,538i) IBRD 2,502 2,504 2,562 2,551 2,554 2,550 2,533 2,512 2,558ii) Others 2,508 2,616 2,621 2,720 2,766 1,789 1,775 1,807 1,980
b) Financial Institutions 3,492 3,653 3,613 3,627 3,747 4,602 4,431 4,796 4,954i) IBRD 592 717 817 811 899 893 894 1,013 1,090ii) Others 2,900 2,936 2,796 2,816 2,848 3,709 3,537 3,783 3,864
c) Private Sector 874 857 768 749 719 695 666 636 601i) IBRD 0 0 0 0 0 0 0 0 0ii) Others 874 857 768 749 719 695 666 636 601
II. BILATERAL 21,726 21,201 21,330 21,220 22,464 23,948 24,030 21,844 23,164A Government borrowing 14,121 13,830 14,183 14,324 15,457 16,988 17,305 15,435 16,887
(i) Concessional 14,121 13,830 14,183 14,324 15,457 16,988 17,305 15,435 16,887(ii) Non-concessional 0 0 0 0 0 0 0 0 0
B Non-Government borrowing 7,605 7,371 7,147 6,896 7,007 6,960 6,725 6,409 6,277 (i) Concessional 1,610 1,564 1,582 1,534 1,786 1,826 1,846 1,708 1,799
a) Public Sector 1,205 1,183 1,194 1,166 1,359 898 907 918 993b) Financial Institutions 405 381 388 368 427 928 939 790 806c) Private Sector 0 0 0 0 0 0 0 0 0
(ii) Non-concessional 5,995 5,807 5,565 5,362 5,221 5,134 4,879 4,701 4,478a) Public Sector 1,846 1,778 1,724 1,662 1,646 1,633 1,572 1,490 1,462b) Financial Institutions 531 512 502 469 455 479 491 530 488c) Private Sector 3,618 3,517 3,339 3,231 3,120 3,022 2,816 2,681 2,528
Contd..
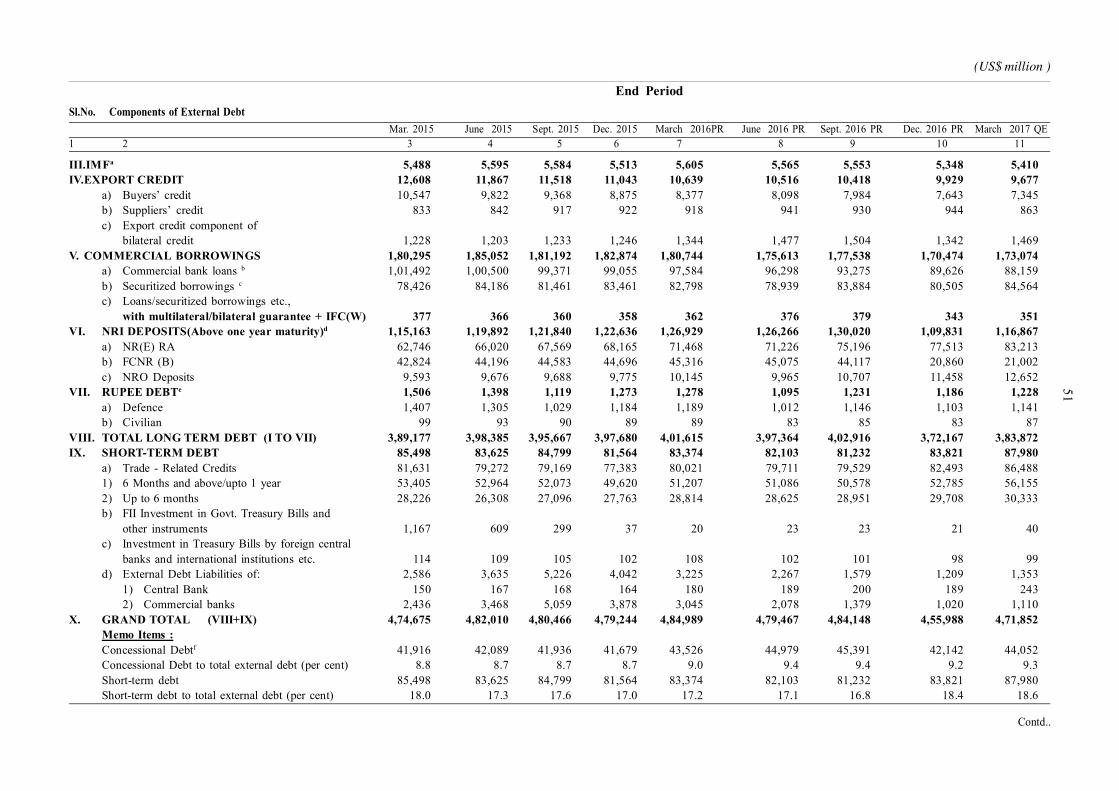
51(US$ million )
End PeriodSl.No. Components of External Debt
Mar. 2015 June 2015 Sept. 2015 Dec. 2015 March 2016PR June 2016 PR Sept. 2016 PR Dec. 2016 PR March 2017 QE1 2 3 4 5 6 7 8 9 10 11
Contd..
III.IMFa 5,488 5,595 5,584 5,513 5,605 5,565 5,553 5,348 5,410IV.EXPORT CREDIT 12,608 11,867 11,518 11,043 10,639 10,516 10,418 9,929 9,677
a) Buyers’ credit 10,547 9,822 9,368 8,875 8,377 8,098 7,984 7,643 7,345b) Suppliers’ credit 833 842 917 922 918 941 930 944 863c) Export credit component of
bilateral credit 1,228 1,203 1,233 1,246 1,344 1,477 1,504 1,342 1,469V. COMMERCIAL BORROWINGS 1,80,295 1,85,052 1,81,192 1,82,874 1,80,744 1,75,613 1,77,538 1,70,474 1,73,074
a) Commercial bank loans b 1,01,492 1,00,500 99,371 99,055 97,584 96,298 93,275 89,626 88,159b) Securitized borrowings c 78,426 84,186 81,461 83,461 82,798 78,939 83,884 80,505 84,564c) Loans/securitized borrowings etc.,
with multilateral/bilateral guarantee + IFC(W) 377 366 360 358 362 376 379 343 351VI. NRI DEPOSITS(Above one year maturity)d 1,15,163 1,19,892 1,21,840 1,22,636 1,26,929 1,26,266 1,30,020 1,09,831 1,16,867
a) NR(E) RA 62,746 66,020 67,569 68,165 71,468 71,226 75,196 77,513 83,213b) FCNR (B) 42,824 44,196 44,583 44,696 45,316 45,075 44,117 20,860 21,002c) NRO Deposits 9,593 9,676 9,688 9,775 10,145 9,965 10,707 11,458 12,652
VII. RUPEE DEBTe 1,506 1,398 1,119 1,273 1,278 1,095 1,231 1,186 1,228a) Defence 1,407 1,305 1,029 1,184 1,189 1,012 1,146 1,103 1,141b) Civilian 99 93 90 89 89 83 85 83 87
VIII. TOTAL LONG TERM DEBT (I TO VII) 3,89,177 3,98,385 3,95,667 3,97,680 4,01,615 3,97,364 4,02,916 3,72,167 3,83,872IX. SHORT-TERM DEBT 85,498 83,625 84,799 81,564 83,374 82,103 81,232 83,821 87,980
a) Trade - Related Credits 81,631 79,272 79,169 77,383 80,021 79,711 79,529 82,493 86,4881) 6 Months and above/upto 1 year 53,405 52,964 52,073 49,620 51,207 51,086 50,578 52,785 56,1552) Up to 6 months 28,226 26,308 27,096 27,763 28,814 28,625 28,951 29,708 30,333b) FII Investment in Govt. Treasury Bills and
other instruments 1,167 609 299 37 20 23 23 21 40c) Investment in Treasury Bills by foreign central
banks and international institutions etc. 114 109 105 102 108 102 101 98 99d) External Debt Liabilities of: 2,586 3,635 5,226 4,042 3,225 2,267 1,579 1,209 1,353
1) Central Bank 150 167 168 164 180 189 200 189 2432) Commercial banks 2,436 3,468 5,059 3,878 3,045 2,078 1,379 1,020 1,110
X. GRAND TOTAL (VIII+IX) 4,74,675 4,82,010 4,80,466 4,79,244 4,84,989 4,79,467 4,84,148 4,55,988 4,71,852Memo Items :Concessional Debtf 41,916 42,089 41,936 41,679 43,526 44,979 45,391 42,142 44,052Concessional Debt to total external debt (per cent) 8.8 8.7 8.7 8.7 9.0 9.4 9.4 9.2 9.3Short-term debt 85,498 83,625 84,799 81,564 83,374 82,103 81,232 83,821 87,980Short-term debt to total external debt (per cent) 18.0 17.3 17.6 17.0 17.2 17.1 16.8 18.4 18.6
52Source: Ministry of Finance (Department of Economic Affairs), Ministry of Defence, Reserve Bank of India and Securities & Exchange Board of India.
PR: Partially Revised QE: Quick Estimates
IFC(W): International Finance Corporation, Washington D.C.
FII: Foreign Institutional Investorsa Relates to SDR allocations from March 2004 onwards.b Includes Financial Lease since 1996.c Also includes India Development Bonds (IDBs), Resurgent India Bonds (RIBs), India Millennium Deposits (IMDs),
Foreign Currency Convertible Bonds (FCCBs) and net investment by 100% FII debt funds and securitized borrowings of commercial banks.
FCCB debt has been adjusted since end-March, 1998 after netting out conversion into equity and redemptions.d Figures include accrued interest.e Rupee denominated debt owed to Russia and payable through exports.f The definition of concessional debt here includes 'concessional' categoreis under multilateral and bilateral debt and rupee debt under item VII.
Note: NRO Deposits are included under NRI Deposits from the quarter ended June 2005. Supplier’s Credits upto 180 days and FII investment in short-term debt instruments are included under short-
term“debt from the quarter ended March 2005. Vostro balances / Nostro overdrafts of commercial banks, balances of foreign central banks/international institutions with RBI and investments in
T-bills/“securities by foreign central banks/ international institutions have been included in external debt from the quarter ended March 2007.
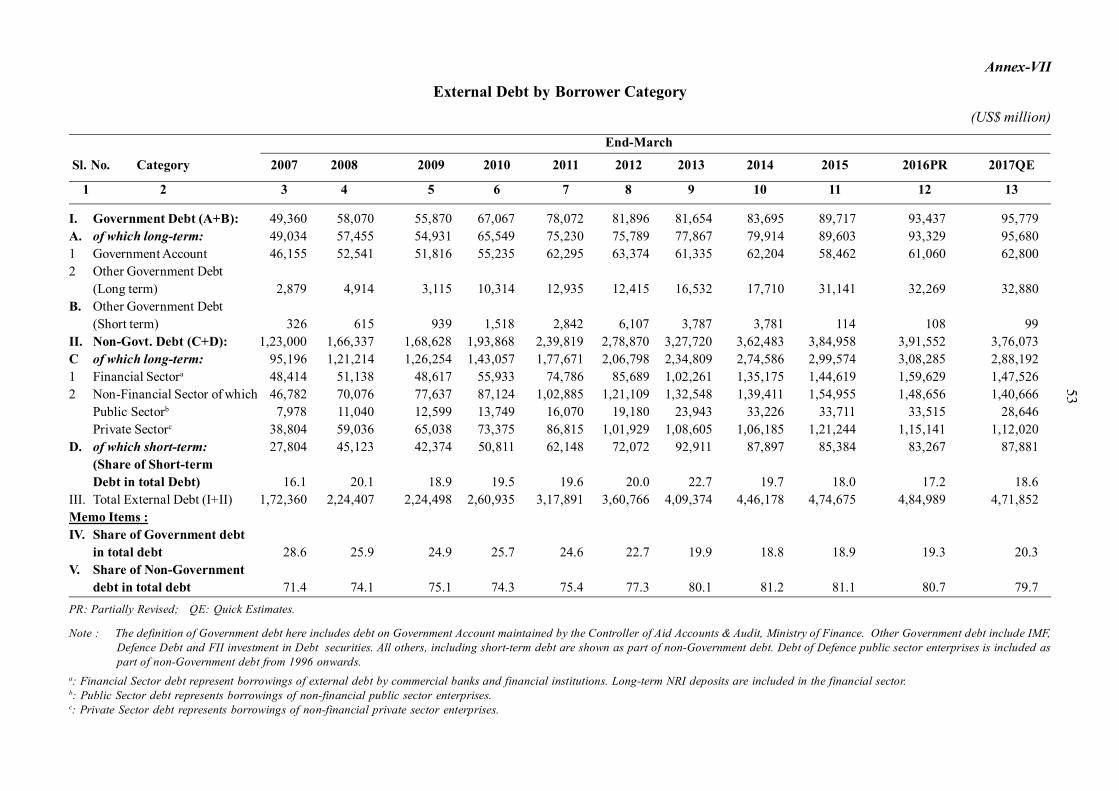
Annex-VII
External Debt by Borrower Category(US$ million)
End-March
Sl. No. Category 2007 2008 2009 2010 2011 2012 2013 2014 2015 2016PR 2017QE
1 2 3 4 5 6 7 8 9 10 11 12 13
I. Government Debt (A+B): 49,360 58,070 55,870 67,067 78,072 81,896 81,654 83,695 89,717 93,437 95,779A. of which long-term: 49,034 57,455 54,931 65,549 75,230 75,789 77,867 79,914 89,603 93,329 95,6801 Government Account 46,155 52,541 51,816 55,235 62,295 63,374 61,335 62,204 58,462 61,060 62,8002 Other Government Debt
(Long term) 2,879 4,914 3,115 10,314 12,935 12,415 16,532 17,710 31,141 32,269 32,880B. Other Government Debt
(Short term) 326 615 939 1,518 2,842 6,107 3,787 3,781 114 108 99II. Non-Govt. Debt (C+D): 1,23,000 1,66,337 1,68,628 1,93,868 2,39,819 2,78,870 3,27,720 3,62,483 3,84,958 3,91,552 3,76,073C of which long-term: 95,196 1,21,214 1,26,254 1,43,057 1,77,671 2,06,798 2,34,809 2,74,586 2,99,574 3,08,285 2,88,1921 Financial Sectora 48,414 51,138 48,617 55,933 74,786 85,689 1,02,261 1,35,175 1,44,619 1,59,629 1,47,5262 Non-Financial Sector of which 46,782 70,076 77,637 87,124 1,02,885 1,21,109 1,32,548 1,39,411 1,54,955 1,48,656 1,40,666
Public Sectorb 7,978 11,040 12,599 13,749 16,070 19,180 23,943 33,226 33,711 33,515 28,646Private Sectorc 38,804 59,036 65,038 73,375 86,815 1,01,929 1,08,605 1,06,185 1,21,244 1,15,141 1,12,020
D. of which short-term: 27,804 45,123 42,374 50,811 62,148 72,072 92,911 87,897 85,384 83,267 87,881(Share of Short-termDebt in total Debt) 16.1 20.1 18.9 19.5 19.6 20.0 22.7 19.7 18.0 17.2 18.6
III. Total External Debt (I+II) 1,72,360 2,24,407 2,24,498 2,60,935 3,17,891 3,60,766 4,09,374 4,46,178 4,74,675 4,84,989 4,71,852Memo Items :IV. Share of Government debt
in total debt 28.6 25.9 24.9 25.7 24.6 22.7 19.9 18.8 18.9 19.3 20.3V. Share of Non-Government
debt in total debt 71.4 74.1 75.1 74.3 75.4 77.3 80.1 81.2 81.1 80.7 79.7
53
PR: Partially Revised; QE: Quick Estimates.
Note : The definition of Government debt here includes debt on Government Account maintained by the Controller of Aid Accounts & Audit, Ministry of Finance. Other Government debt include IMF,Defence Debt and FII investment in Debt securities. All others, including short-term debt are shown as part of non-Government debt. Debt of Defence public sector enterprises is included aspart of non-Government debt from 1996 onwards.
a: Financial Sector debt represent borrowings of external debt by commercial banks and financial institutions. Long-term NRI deposits are included in the financial sector.b: Public Sector debt represents borrowings of non-financial public sector enterprises.c: Private Sector debt represents borrowings of non-financial private sector enterprises.
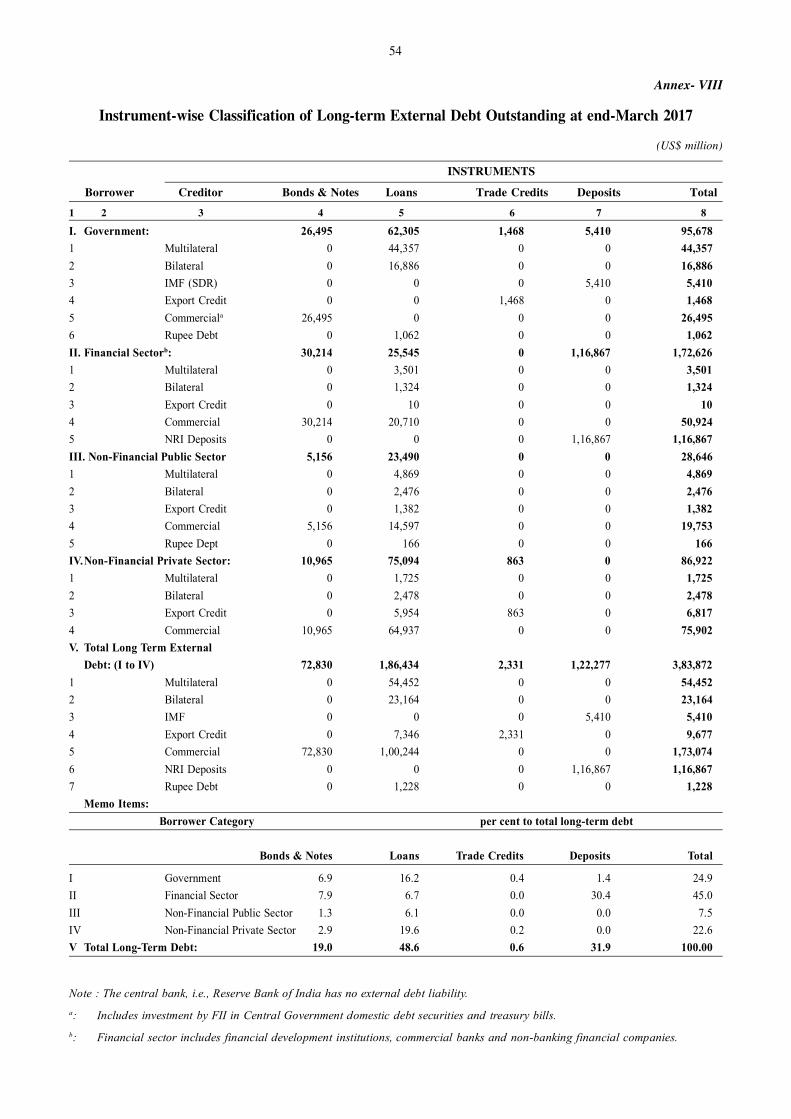
54
Annex- VIII
Instrument-wise Classification of Long-term External Debt Outstanding at end-March 2017
(US$ million)
INSTRUMENTS
Borrower Creditor Bonds & Notes Loans Trade Credits Deposits Total
1 2 3 4 5 6 7 8
I. Government: 26,495 62,305 1,468 5,410 95,6781 Multilateral 0 44,357 0 0 44,3572 Bilateral 0 16,886 0 0 16,8863 IMF (SDR) 0 0 0 5,410 5,4104 Export Credit 0 0 1,468 0 1,4685 Commerciala 26,495 0 0 0 26,4956 Rupee Debt 0 1,062 0 0 1,062II. Financial Sectorb: 30,214 25,545 0 1,16,867 1,72,6261 Multilateral 0 3,501 0 0 3,5012 Bilateral 0 1,324 0 0 1,3243 Export Credit 0 10 0 0 104 Commercial 30,214 20,710 0 0 50,9245 NRI Deposits 0 0 0 1,16,867 1,16,867III. Non-Financial Public Sector 5,156 23,490 0 0 28,6461 Multilateral 0 4,869 0 0 4,8692 Bilateral 0 2,476 0 0 2,4763 Export Credit 0 1,382 0 0 1,3824 Commercial 5,156 14,597 0 0 19,7535 Rupee Dept 0 166 0 0 166IV.Non-Financial Private Sector: 10,965 75,094 863 0 86,9221 Multilateral 0 1,725 0 0 1,7252 Bilateral 0 2,478 0 0 2,4783 Export Credit 0 5,954 863 0 6,8174 Commercial 10,965 64,937 0 0 75,902V. Total Long Term External
Debt: (I to IV) 72,830 1,86,434 2,331 1,22,277 3,83,8721 Multilateral 0 54,452 0 0 54,4522 Bilateral 0 23,164 0 0 23,1643 IMF 0 0 0 5,410 5,4104 Export Credit 0 7,346 2,331 0 9,6775 Commercial 72,830 1,00,244 0 0 1,73,0746 NRI Deposits 0 0 0 1,16,867 1,16,8677 Rupee Debt 0 1,228 0 0 1,228
Memo Items:Borrower Category per cent to total long-term debt
Bonds & Notes Loans Trade Credits Deposits Total
I Government 6.9 16.2 0.4 1.4 24.9II Financial Sector 7.9 6.7 0.0 30.4 45.0III Non-Financial Public Sector 1.3 6.1 0.0 0.0 7.5IV Non-Financial Private Sector 2.9 19.6 0.2 0.0 22.6V Total Long-Term Debt: 19.0 48.6 0.6 31.9 100.00
Note : The central bank, i.e., Reserve Bank of India has no external debt liability.a: Includes investment by FII in Central Government domestic debt securities and treasury bills.b: Financial sector includes financial development institutions, commercial banks and non-banking financial companies.
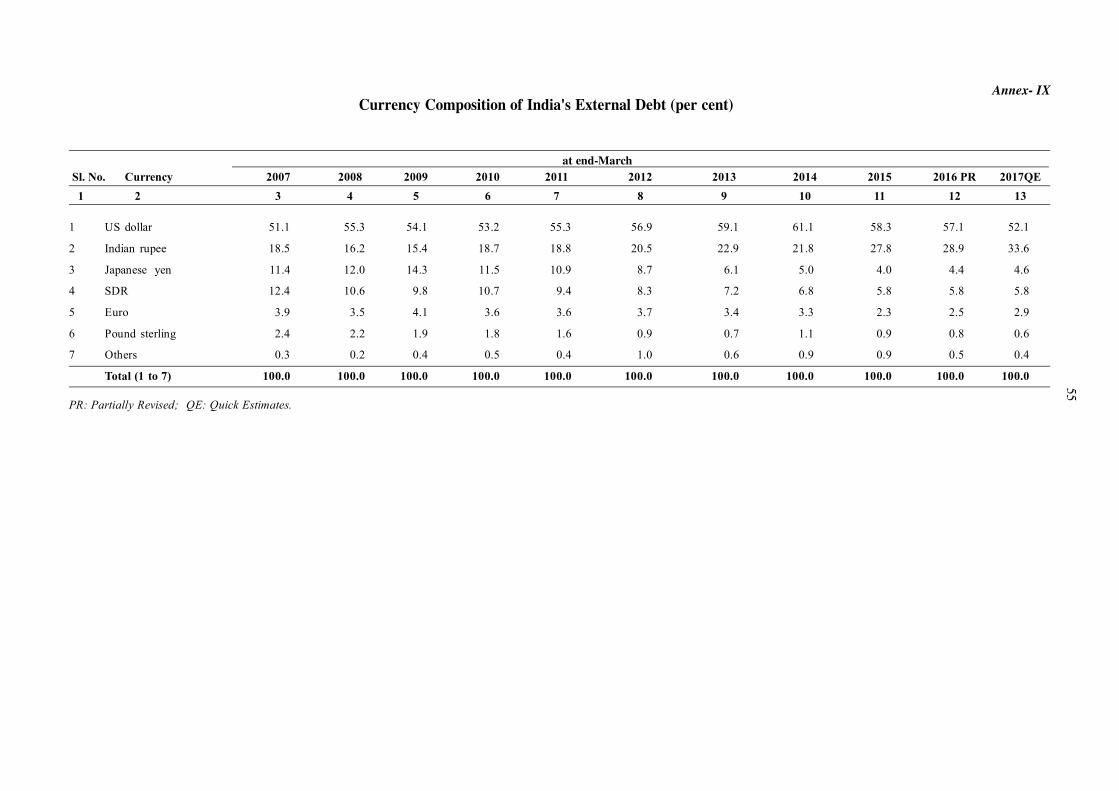
Annex- IXCurrency Composition of India's External Debt (per cent)
at end-March Sl. No. Currency 2007 2008 2009 2010 2011 2012 2013 2014 2015 2016 PR 2017QE
1 2 3 4 5 6 7 8 9 10 11 12 13
55
PR: Partially Revised; QE: Quick Estimates.
1 US dollar 51.1 55.3 54.1 53.2 55.3 56.9 59.1 61.1 58.3 57.1 52.1
2 Indian rupee 18.5 16.2 15.4 18.7 18.8 20.5 22.9 21.8 27.8 28.9 33.6
3 Japanese yen 11.4 12.0 14.3 11.5 10.9 8.7 6.1 5.0 4.0 4.4 4.6
4 SDR 12.4 10.6 9.8 10.7 9.4 8.3 7.2 6.8 5.8 5.8 5.8
5 Euro 3.9 3.5 4.1 3.6 3.6 3.7 3.4 3.3 2.3 2.5 2.9
6 Pound sterling 2.4 2.2 1.9 1.8 1.6 0.9 0.7 1.1 0.9 0.8 0.6
7 Others 0.3 0.2 0.4 0.5 0.4 1.0 0.6 0.9 0.9 0.5 0.4
Total (1 to 7) 100.0 100.0 100.0 100.0 100.0 100.0 100.0 100.0 100.0 100.0 100.0
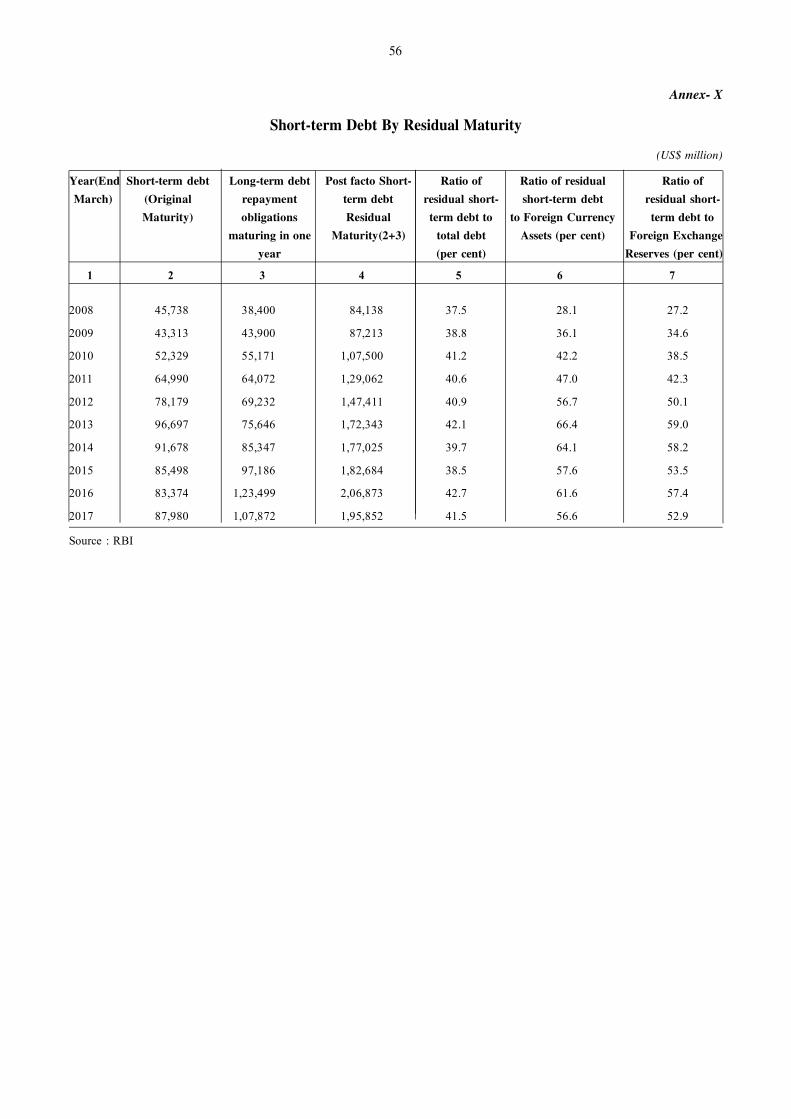
56
Annex- X
Short-term Debt By Residual Maturity
(US$ million)
Year(End Short-term debt Long-term debt Post facto Short- Ratio of Ratio of residual Ratio of
March) (Original repayment term debt residual short- short-term debt residual short-
Maturity) obligations Residual term debt to to Foreign Currency term debt to
maturing in one Maturity(2+3) total debt Assets (per cent) Foreign Exchange
year (per cent) Reserves (per cent)
1 2 3 4 5 6 7
2008 45,738 38,400 84,138 37.5 28.1 27.2
2009 43,313 43,900 87,213 38.8 36.1 34.6
2010 52,329 55,171 1,07,500 41.2 42.2 38.5
2011 64,990 64,072 1,29,062 40.6 47.0 42.3
2012 78,179 69,232 1,47,411 40.9 56.7 50.1
2013 96,697 75,646 1,72,343 42.1 66.4 59.0
2014 91,678 85,347 1,77,025 39.7 64.1 58.2
2015 85,498 97,186 1,82,684 38.5 57.6 53.5
2016 83,374 1,23,499 2,06,873 42.7 61.6 57.4
2017 87,980 1,07,872 1,95,852 41.5 56.6 52.9
Source : RBI
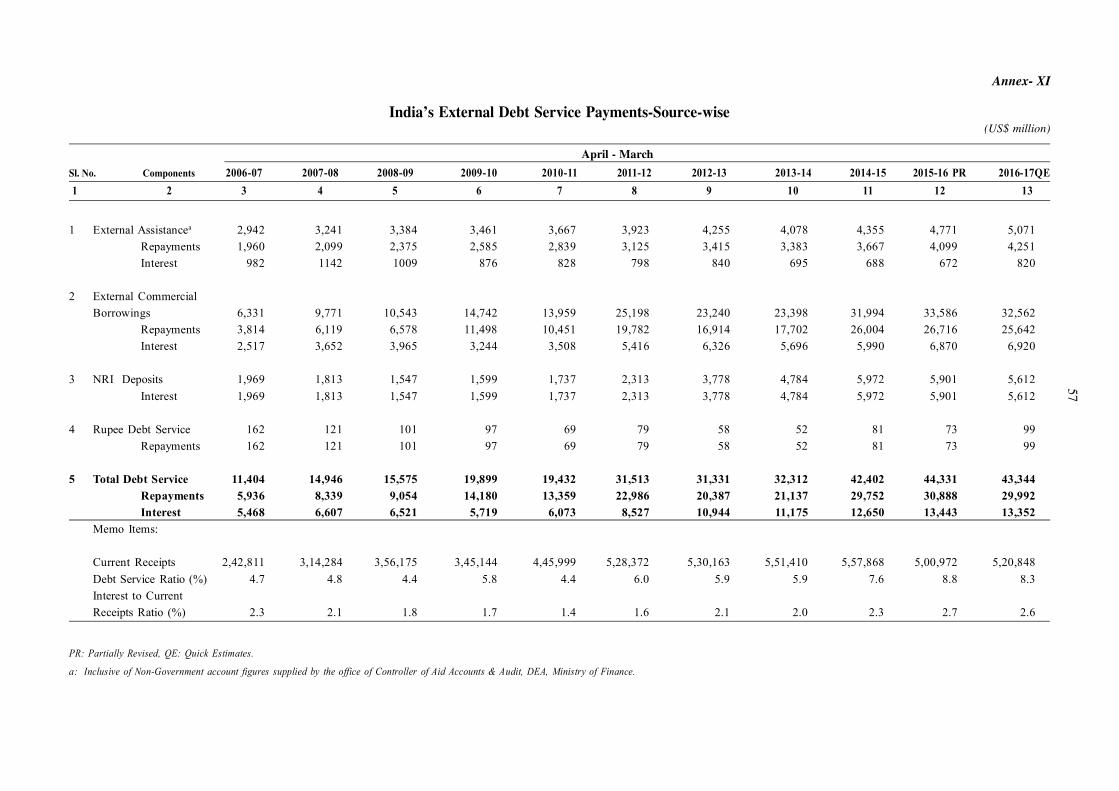
Annex- XI
India’s External Debt Service Payments-Source-wise(US$ million)
April - March
Sl. No. Components 2006-07 2007-08 2008-09 2009-10 2010-11 2011-12 2012-13 2013-14 2014-15 2015-16 PR 2016-17QE 1 2 3 4 5 6 7 8 9 10 11 12 13
57
1 External Assistancea 2,942 3,241 3,384 3,461 3,667 3,923 4,255 4,078 4,355 4,771 5,071Repayments 1,960 2,099 2,375 2,585 2,839 3,125 3,415 3,383 3,667 4,099 4,251Interest 982 1142 1009 876 828 798 840 695 688 672 820
2 External CommercialBorrowings 6,331 9,771 10,543 14,742 13,959 25,198 23,240 23,398 31,994 33,586 32,562
Repayments 3,814 6,119 6,578 11,498 10,451 19,782 16,914 17,702 26,004 26,716 25,642Interest 2,517 3,652 3,965 3,244 3,508 5,416 6,326 5,696 5,990 6,870 6,920
3 NRI Deposits 1,969 1,813 1,547 1,599 1,737 2,313 3,778 4,784 5,972 5,901 5,612Interest 1,969 1,813 1,547 1,599 1,737 2,313 3,778 4,784 5,972 5,901 5,612
4 Rupee Debt Service 162 121 101 97 69 79 58 52 81 73 99Repayments 162 121 101 97 69 79 58 52 81 73 99
5 Total Debt Service 11,404 14,946 15,575 19,899 19,432 31,513 31,331 32,312 42,402 44,331 43,344Repayments 5,936 8,339 9,054 14,180 13,359 22,986 20,387 21,137 29,752 30,888 29,992Interest 5,468 6,607 6,521 5,719 6,073 8,527 10,944 11,175 12,650 13,443 13,352
Memo Items:
Current Receipts 2,42,811 3,14,284 3,56,175 3,45,144 4,45,999 5,28,372 5,30,163 5,51,410 5,57,868 5,00,972 5,20,848Debt Service Ratio (%) 4.7 4.8 4.4 5.8 4.4 6.0 5.9 5.9 7.6 8.8 8.3Interest to CurrentReceipts Ratio (%) 2.3 2.1 1.8 1.7 1.4 1.6 2.1 2.0 2.3 2.7 2.6
PR: Partially Revised, QE: Quick Estimates.
a: Inclusive of Non-Government account figures supplied by the office of Controller of Aid Accounts & Audit, DEA, Ministry of Finance.
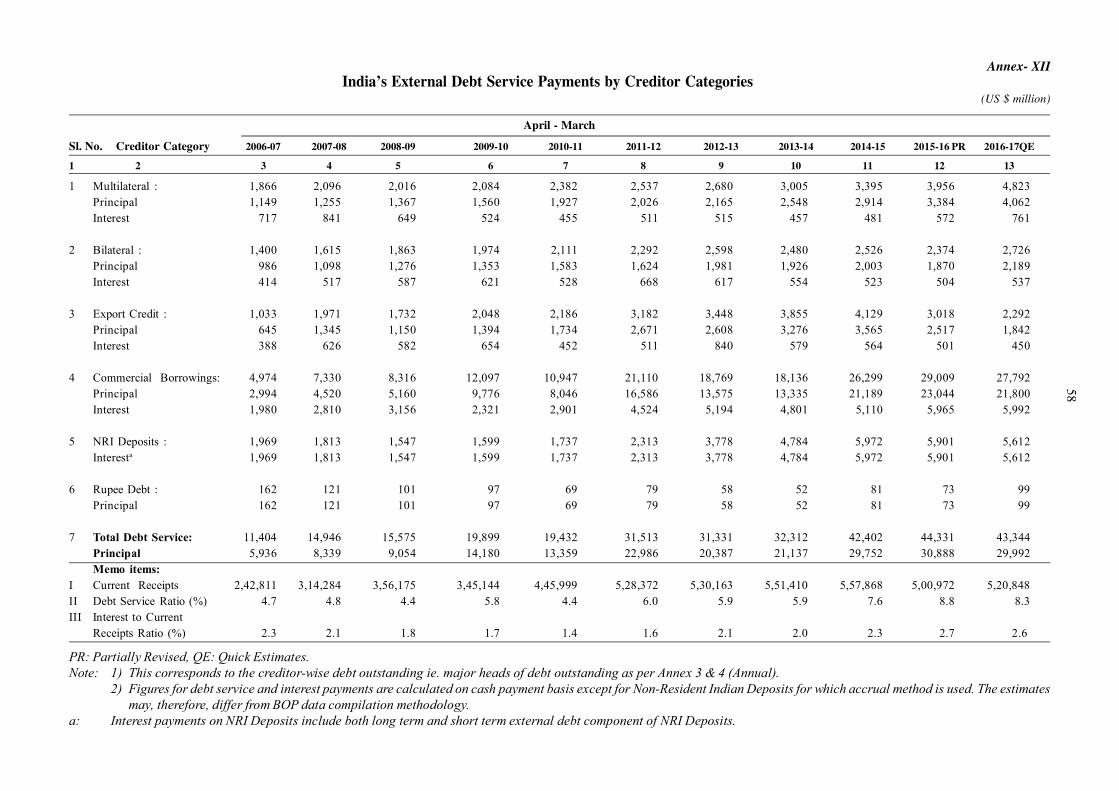
Annex- XIIIndia’s External Debt Service Payments by Creditor Categories
(US $ million)
April - March
Sl. No. Creditor Category 2006-07 2007-08 2008-09 2009-10 2010-11 2011-12 2012-13 2013-14 2014-15 2015-16 PR 2016-17QE
1 2 3 4 5 6 7 8 9 10 11 12 13
1 Multilateral : 1,866 2,096 2,016 2,084 2,382 2,537 2,680 3,005 3,395 3,956 4,823Principal 1,149 1,255 1,367 1,560 1,927 2,026 2,165 2,548 2,914 3,384 4,062Interest 717 841 649 524 455 511 515 457 481 572 761
2 Bilateral : 1,400 1,615 1,863 1,974 2,111 2,292 2,598 2,480 2,526 2,374 2,726Principal 986 1,098 1,276 1,353 1,583 1,624 1,981 1,926 2,003 1,870 2,189Interest 414 517 587 621 528 668 617 554 523 504 537
3 Export Credit : 1,033 1,971 1,732 2,048 2,186 3,182 3,448 3,855 4,129 3,018 2,292Principal 645 1,345 1,150 1,394 1,734 2,671 2,608 3,276 3,565 2,517 1,842Interest 388 626 582 654 452 511 840 579 564 501 450
4 Commercial Borrowings: 4,974 7,330 8,316 12,097 10,947 21,110 18,769 18,136 26,299 29,009 27,792Principal 2,994 4,520 5,160 9,776 8,046 16,586 13,575 13,335 21,189 23,044 21,800Interest 1,980 2,810 3,156 2,321 2,901 4,524 5,194 4,801 5,110 5,965 5,992
5 NRI Deposits : 1,969 1,813 1,547 1,599 1,737 2,313 3,778 4,784 5,972 5,901 5,612Interesta 1,969 1,813 1,547 1,599 1,737 2,313 3,778 4,784 5,972 5,901 5,612
6 Rupee Debt : 162 121 101 97 69 79 58 52 81 73 99Principal 162 121 101 97 69 79 58 52 81 73 99
7 Total Debt Service: 11,404 14,946 15,575 19,899 19,432 31,513 31,331 32,312 42,402 44,331 43,344Principal 5,936 8,339 9,054 14,180 13,359 22,986 20,387 21,137 29,752 30,888 29,992Memo items:
I Current Receipts 2,42,811 3,14,284 3,56,175 3,45,144 4,45,999 5,28,372 5,30,163 5,51,410 5,57,868 5,00,972 5,20,848II Debt Service Ratio (%) 4.7 4.8 4.4 5.8 4.4 6.0 5.9 5.9 7.6 8.8 8.3III Interest to Current
Receipts Ratio (%) 2.3 2.1 1.8 1.7 1.4 1.6 2.1 2.0 2.3 2.7 2.6
58
PR: Partially Revised, QE: Quick Estimates.Note: 1) This corresponds to the creditor-wise debt outstanding ie. major heads of debt outstanding as per Annex 3 & 4 (Annual).
2) Figures for debt service and interest payments are calculated on cash payment basis except for Non-Resident Indian Deposits for which accrual method is used. The estimatesmay, therefore, differ from BOP data compilation methodology.
a: Interest payments on NRI Deposits include both long term and short term external debt component of NRI Deposits.
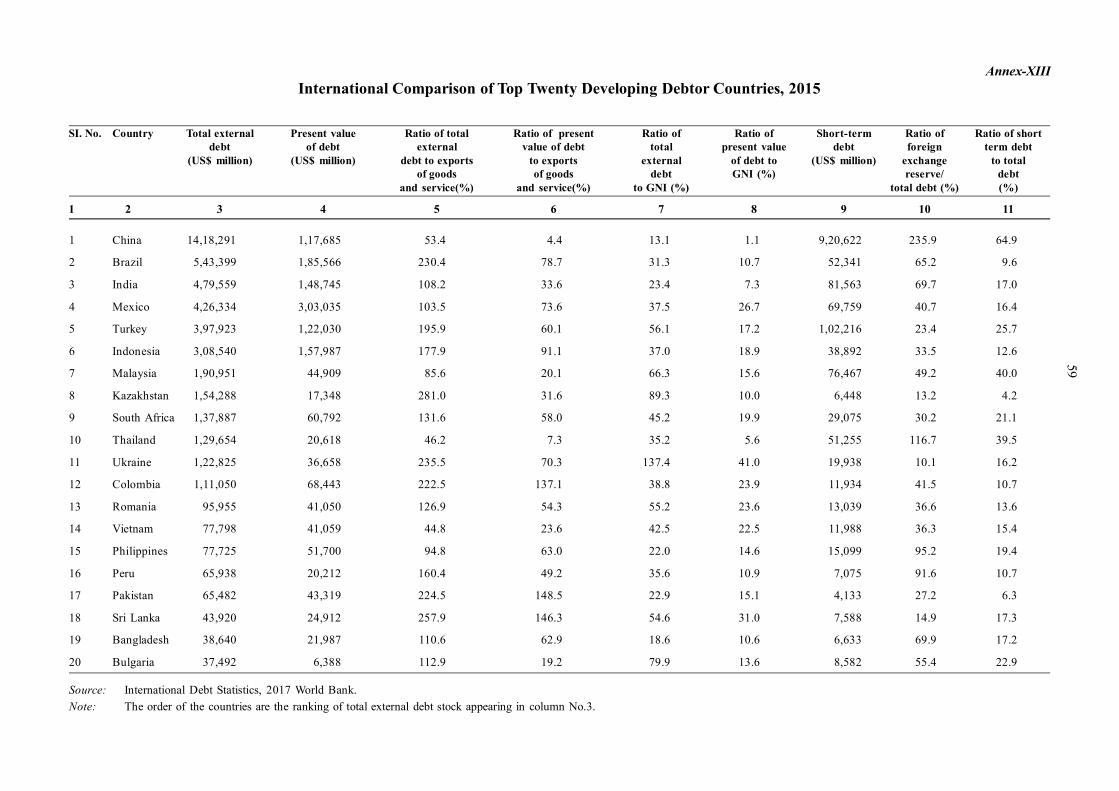
Annex-XIIIInternational Comparison of Top Twenty Developing Debtor Countries, 2015
SI. No. Country Total external Present value Ratio of total Ratio of present Ratio of Ratio of Short-term Ratio of Ratio of shortdebt of debt external value of debt total present value debt foreign term debt
(US$ million) (US$ million) debt to exports to exports external of debt to (US$ million) exchange to totalof goods of goods debt GNI (%) reserve/ debt
and service(%) and service(%) to GNI (%) total debt (%) (%)
1 2 3 4 5 6 7 8 9 10 11
59
1 China 14,18,291 1,17,685 53.4 4.4 13.1 1.1 9,20,622 235.9 64.9
2 Brazil 5,43,399 1,85,566 230.4 78.7 31.3 10.7 52,341 65.2 9.6
3 India 4,79,559 1,48,745 108.2 33.6 23.4 7.3 81,563 69.7 17.0
4 Mexico 4,26,334 3,03,035 103.5 73.6 37.5 26.7 69,759 40.7 16.4
5 Turkey 3,97,923 1,22,030 195.9 60.1 56.1 17.2 1,02,216 23.4 25.7
6 Indonesia 3,08,540 1,57,987 177.9 91.1 37.0 18.9 38,892 33.5 12.6
7 Malaysia 1,90,951 44,909 85.6 20.1 66.3 15.6 76,467 49.2 40.0
8 Kazakhstan 1,54,288 17,348 281.0 31.6 89.3 10.0 6,448 13.2 4.2
9 South Africa 1,37,887 60,792 131.6 58.0 45.2 19.9 29,075 30.2 21.1
10 Thailand 1,29,654 20,618 46.2 7.3 35.2 5.6 51,255 116.7 39.5
11 Ukraine 1,22,825 36,658 235.5 70.3 137.4 41.0 19,938 10.1 16.2
12 Colombia 1,11,050 68,443 222.5 137.1 38.8 23.9 11,934 41.5 10.7
13 Romania 95,955 41,050 126.9 54.3 55.2 23.6 13,039 36.6 13.6
14 Vietnam 77,798 41,059 44.8 23.6 42.5 22.5 11,988 36.3 15.4
15 Philippines 77,725 51,700 94.8 63.0 22.0 14.6 15,099 95.2 19.4
16 Peru 65,938 20,212 160.4 49.2 35.6 10.9 7,075 91.6 10.7
17 Pakistan 65,482 43,319 224.5 148.5 22.9 15.1 4,133 27.2 6.3
18 Sri Lanka 43,920 24,912 257.9 146.3 54.6 31.0 7,588 14.9 17.3
19 Bangladesh 38,640 21,987 110.6 62.9 18.6 10.6 6,633 69.9 17.2
20 Bulgaria 37,492 6,388 112.9 19.2 79.9 13.6 8,582 55.4 22.9
Source: International Debt Statistics, 2017 World Bank.Note: The order of the countries are the ranking of total external debt stock appearing in column No.3.
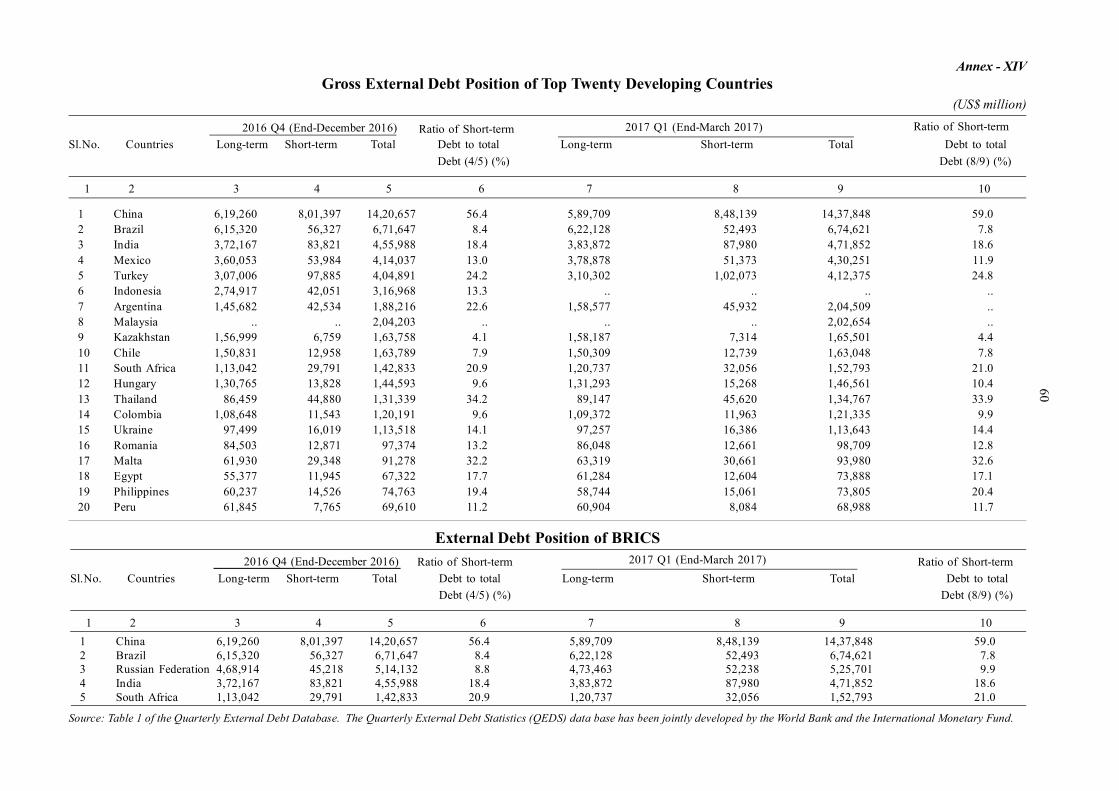
60
1 China 6,19,260 8,01,397 14,20,657 56.4 5,89,709 8,48,139 14,37,848 59.02 Brazil 6,15,320 56,327 6,71,647 8.4 6,22,128 52,493 6,74,621 7.83 India 3,72,167 83,821 4,55,988 18.4 3,83,872 87,980 4,71,852 18.64 Mexico 3,60,053 53,984 4,14,037 13.0 3,78,878 51,373 4,30,251 11.95 Turkey 3,07,006 97,885 4,04,891 24.2 3,10,302 1,02,073 4,12,375 24.86 Indonesia 2,74,917 42,051 3,16,968 13.3 .. .. .. ..7 Argentina 1,45,682 42,534 1,88,216 22.6 1,58,577 45,932 2,04,509 ..8 Malaysia .. .. 2,04,203 .. .. .. 2,02,654 ..9 Kazakhstan 1,56,999 6,759 1,63,758 4.1 1,58,187 7,314 1,65,501 4.410 Chile 1,50,831 12,958 1,63,789 7.9 1,50,309 12,739 1,63,048 7.811 South Africa 1,13,042 29,791 1,42,833 20.9 1,20,737 32,056 1,52,793 21.012 Hungary 1,30,765 13,828 1,44,593 9.6 1,31,293 15,268 1,46,561 10.413 Thailand 86,459 44,880 1,31,339 34.2 89,147 45,620 1,34,767 33.914 Colombia 1,08,648 11,543 1,20,191 9.6 1,09,372 11,963 1,21,335 9.915 Ukraine 97,499 16,019 1,13,518 14.1 97,257 16,386 1,13,643 14.416 Romania 84,503 12,871 97,374 13.2 86,048 12,661 98,709 12.817 Malta 61,930 29,348 91,278 32.2 63,319 30,661 93,980 32.618 Egypt 55,377 11,945 67,322 17.7 61,284 12,604 73,888 17.119 Philippines 60,237 14,526 74,763 19.4 58,744 15,061 73,805 20.420 Peru 61,845 7,765 69,610 11.2 60,904 8,084 68,988 11.7
Annex - XIVGross External Debt Position of Top Twenty Developing Countries
(US$ million)
2016 Q4 (End-December 2016)Sl.No. Countries Long-term Short-term Total Debt to total Long-term Short-term Total Debt to total
Debt (4/5) (%) Debt (8/9) (%)
1 2 3 4 5 6 7 8 9 10
Source: Table 1 of the Quarterly External Debt Database. The Quarterly External Debt Statistics (QEDS) data base has been jointly developed by the World Bank and the International Monetary Fund.
Ratio of Short-term 2017 Q1 (End-March 2017) Ratio of Short-term
2016 Q4 (End-December 2016)Sl.No. Countries Long-term Short-term Total Debt to total Long-term Short-term Total Debt to total
Debt (4/5) (%) Debt (8/9) (%)
1 2 3 4 5 6 7 8 9 101 China 6,19,260 8,01,397 14,20,657 56.4 5,89,709 8,48,139 14,37,848 59.02 Brazil 6,15,320 56,327 6,71,647 8.4 6,22,128 52,493 6,74,621 7.83 Russian Federation 4,68,914 45,218 5,14,132 8.8 4,73,463 52,238 5,25,701 9.94 India 3,72,167 83,821 4,55,988 18.4 3,83,872 87,980 4,71,852 18.65 South Africa 1,13,042 29,791 1,42,833 20.9 1,20,737 32,056 1,52,793 21.0
Ratio of Short-term Ratio of Short-term
External Debt Position of BRICS2017 Q1 (End-March 2017)
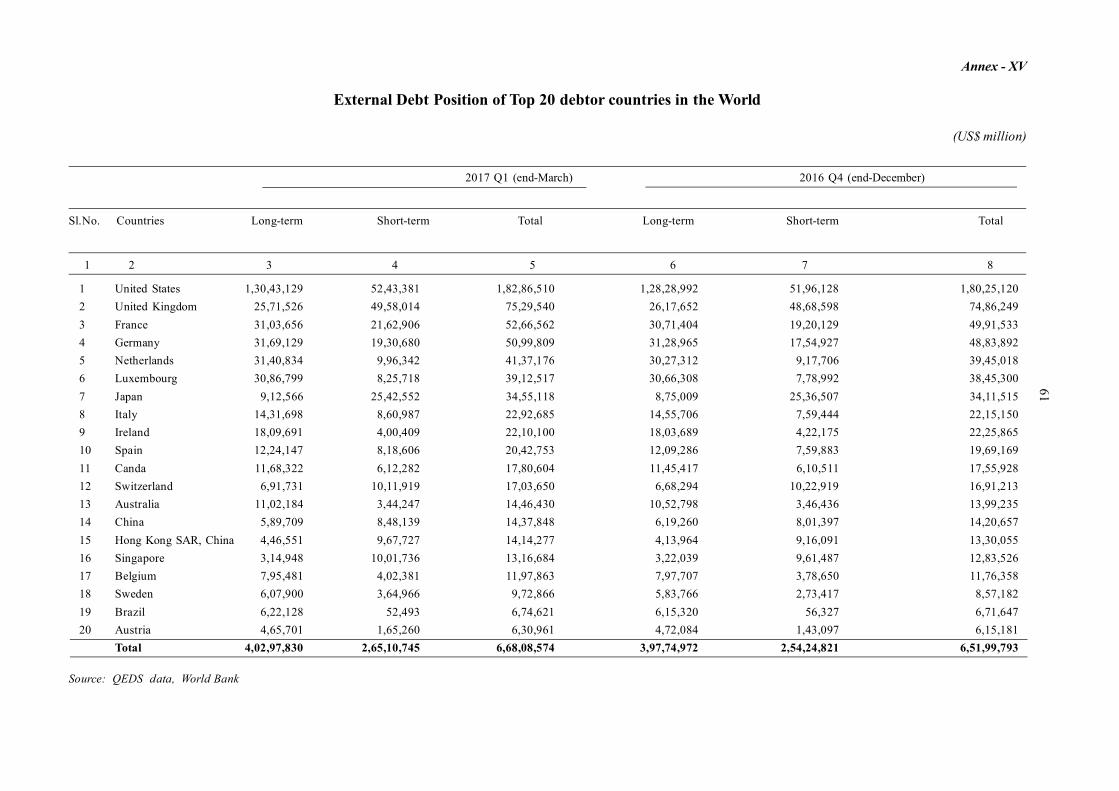
61
1 United States 1,30,43,129 52,43,381 1,82,86,510 1,28,28,992 51,96,128 1,80,25,1202 United Kingdom 25,71,526 49,58,014 75,29,540 26,17,652 48,68,598 74,86,2493 France 31,03,656 21,62,906 52,66,562 30,71,404 19,20,129 49,91,5334 Germany 31,69,129 19,30,680 50,99,809 31,28,965 17,54,927 48,83,8925 Netherlands 31,40,834 9,96,342 41,37,176 30,27,312 9,17,706 39,45,0186 Luxembourg 30,86,799 8,25,718 39,12,517 30,66,308 7,78,992 38,45,3007 Japan 9,12,566 25,42,552 34,55,118 8,75,009 25,36,507 34,11,5158 Italy 14,31,698 8,60,987 22,92,685 14,55,706 7,59,444 22,15,1509 Ireland 18,09,691 4,00,409 22,10,100 18,03,689 4,22,175 22,25,86510 Spain 12,24,147 8,18,606 20,42,753 12,09,286 7,59,883 19,69,16911 Canda 11,68,322 6,12,282 17,80,604 11,45,417 6,10,511 17,55,92812 Switzerland 6,91,731 10,11,919 17,03,650 6,68,294 10,22,919 16,91,21313 Australia 11,02,184 3,44,247 14,46,430 10,52,798 3,46,436 13,99,23514 China 5,89,709 8,48,139 14,37,848 6,19,260 8,01,397 14,20,65715 Hong Kong SAR, China 4,46,551 9,67,727 14,14,277 4,13,964 9,16,091 13,30,05516 Singapore 3,14,948 10,01,736 13,16,684 3,22,039 9,61,487 12,83,52617 Belgium 7,95,481 4,02,381 11,97,863 7,97,707 3,78,650 11,76,35818 Sweden 6,07,900 3,64,966 9,72,866 5,83,766 2,73,417 8,57,18219 Brazil 6,22,128 52,493 6,74,621 6,15,320 56,327 6,71,64720 Austria 4,65,701 1,65,260 6,30,961 4,72,084 1,43,097 6,15,181
Total 4,02,97,830 2,65,10,745 6,68,08,574 3,97,74,972 2,54,24,821 6,51,99,793
Annex - XV
External Debt Position of Top 20 debtor countries in the World
(US$ million)
Sl.No. Countries Long-term Short-term Total Long-term Short-term Total
1 2 3 4 5 6 7 8
Source: QEDS data, World Bank
2017 Q1 (end-March) 2016 Q4 (end-December)
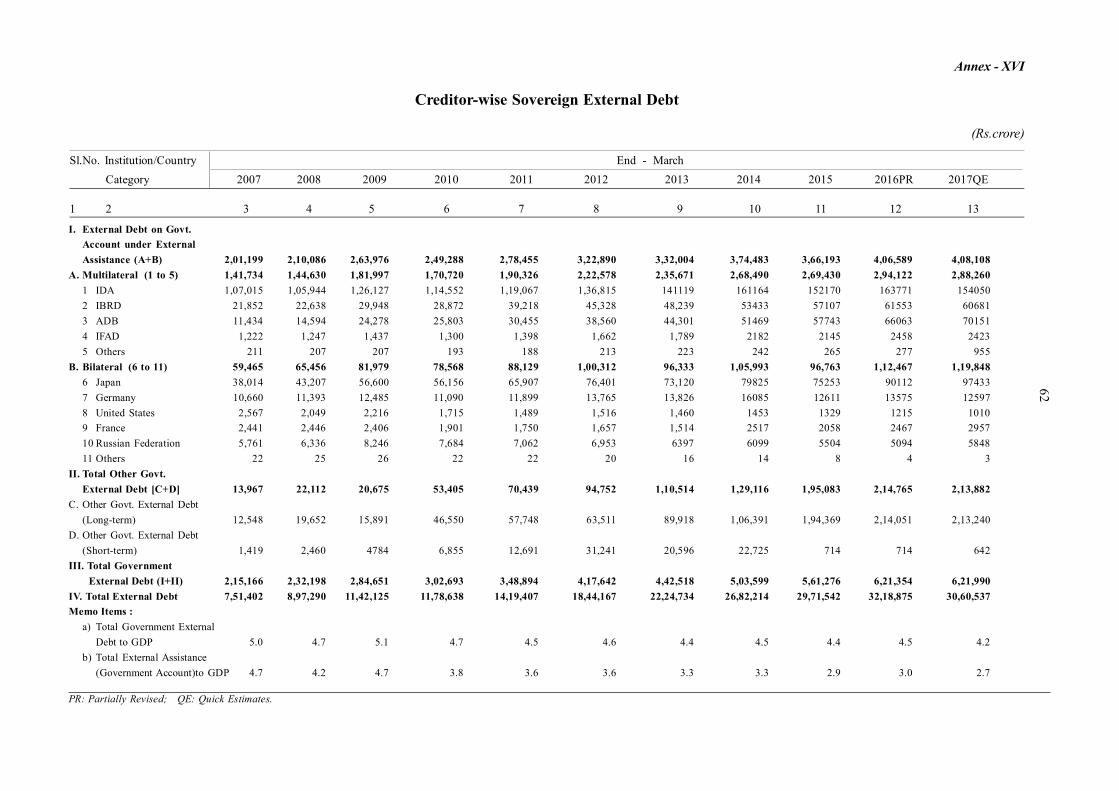
62Annex - XVI
Creditor-wise Sovereign External Debt
(Rs.crore)
Sl.No. Institution/Country End - MarchCategory 2007 2008 2009 2010 2011 2012 2013 2014 2015 2016PR 2017QE
1 2 3 4 5 6 7 8 9 10 11 12 13
I. External Debt on Govt.Account under ExternalAssistance (A+B) 2,01,199 2,10,086 2,63,976 2,49,288 2,78,455 3,22,890 3,32,004 3,74,483 3,66,193 4,06,589 4,08,108
A. Multilateral (1 to 5) 1,41,734 1,44,630 1,81,997 1,70,720 1,90,326 2,22,578 2,35,671 2,68,490 2,69,430 2,94,122 2,88,2601 IDA 1,07,015 1,05,944 1,26,127 1,14,552 1,19,067 1,36,815 141119 161164 152170 163771 1540502 IBRD 21,852 22,638 29,948 28,872 39,218 45,328 48,239 53433 57107 61553 606813 ADB 11,434 14,594 24,278 25,803 30,455 38,560 44,301 51469 57743 66063 701514 IFAD 1,222 1,247 1,437 1,300 1,398 1,662 1,789 2182 2145 2458 24235 Others 211 207 207 193 188 213 223 242 265 277 955
B. Bilateral (6 to 11) 59,465 65,456 81,979 78,568 88,129 1,00,312 96,333 1,05,993 96,763 1,12,467 1,19,8486 Japan 38,014 43,207 56,600 56,156 65,907 76,401 73,120 79825 75253 90112 974337 Germany 10,660 11,393 12,485 11,090 11,899 13,765 13,826 16085 12611 13575 125978 United States 2,567 2,049 2,216 1,715 1,489 1,516 1,460 1453 1329 1215 10109 France 2,441 2,446 2,406 1,901 1,750 1,657 1,514 2517 2058 2467 295710 Russian Federation 5,761 6,336 8,246 7,684 7,062 6,953 6397 6099 5504 5094 584811 Others 22 25 26 22 22 20 16 14 8 4 3
II. Total Other Govt.External Debt [C+D] 13,967 22,112 20,675 53,405 70,439 94,752 1,10,514 1,29,116 1,95,083 2,14,765 2,13,882
C. Other Govt. External Debt(Long-term) 12,548 19,652 15,891 46,550 57,748 63,511 89,918 1,06,391 1,94,369 2,14,051 2,13,240
D. Other Govt. External Debt(Short-term) 1,419 2,460 4784 6,855 12,691 31,241 20,596 22,725 714 714 642
III. Total Government External Debt (I+II) 2,15,166 2,32,198 2,84,651 3,02,693 3,48,894 4,17,642 4,42,518 5,03,599 5,61,276 6,21,354 6,21,990
IV. Total External Debt 7,51,402 8,97,290 11,42,125 11,78,638 14,19,407 18,44,167 22,24,734 26,82,214 29,71,542 32,18,875 30,60,537Memo Items :
a) Total Government ExternalDebt to GDP 5.0 4.7 5.1 4.7 4.5 4.6 4.4 4.5 4.4 4.5 4.2
b) Total External Assistance(Government Account)to GDP 4.7 4.2 4.7 3.8 3.6 3.6 3.3 3.3 2.9 3.0 2.7
PR: Partially Revised; QE: Quick Estimates.
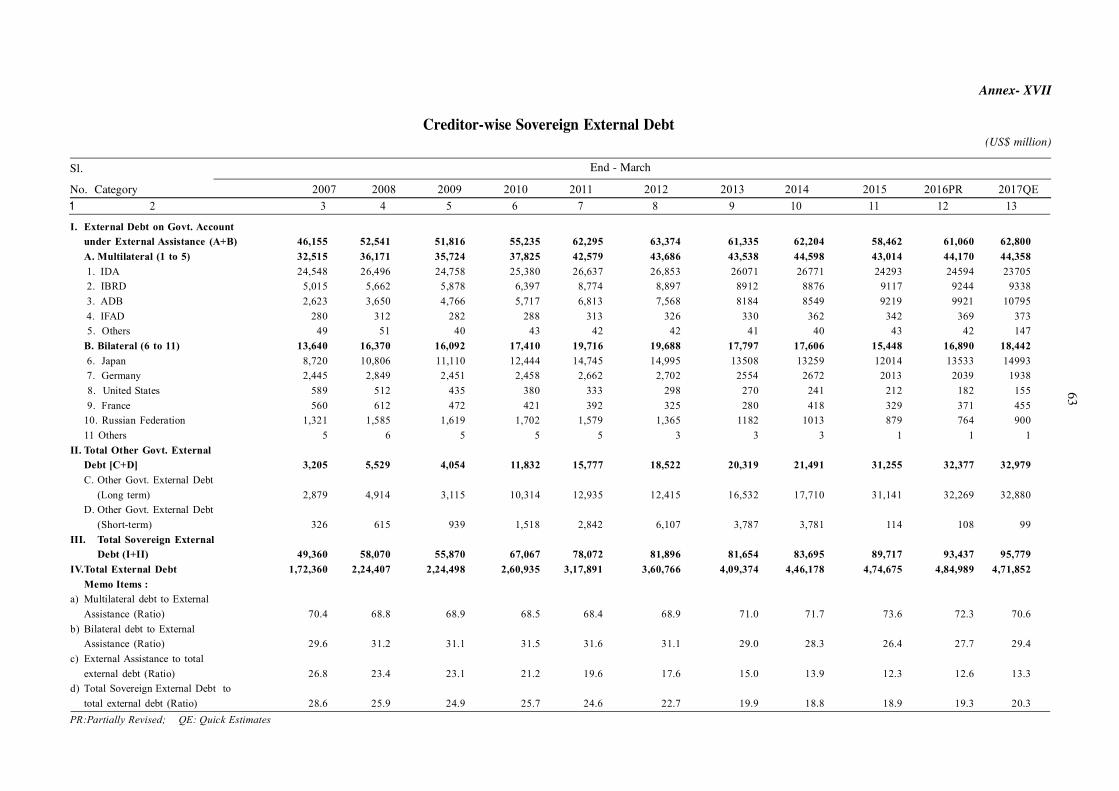
63
Annex- XVII
Creditor-wise Sovereign External Debt(US$ million)
Sl.
No. Category 2007 2008 2009 2010 2011 2012 2013 2014 2015 2016PR 2017QE1 2 3 4 5 6 7 8 9 10 11 12 13
End - March
I. External Debt on Govt. Accountunder External Assistance (A+B) 46,155 52,541 51,816 55,235 62,295 63,374 61,335 62,204 58,462 61,060 62,800A. Multilateral (1 to 5) 32,515 36,171 35,724 37,825 42,579 43,686 43,538 44,598 43,014 44,170 44,358 1. IDA 24,548 26,496 24,758 25,380 26,637 26,853 26071 26771 24293 24594 23705 2. IBRD 5,015 5,662 5,878 6,397 8,774 8,897 8912 8876 9117 9244 9338 3. ADB 2,623 3,650 4,766 5,717 6,813 7,568 8184 8549 9219 9921 10795 4. IFAD 280 312 282 288 313 326 330 362 342 369 373 5. Others 49 51 40 43 42 42 41 40 43 42 147B. Bilateral (6 to 11) 13,640 16,370 16,092 17,410 19,716 19,688 17,797 17,606 15,448 16,890 18,442 6. Japan 8,720 10,806 11,110 12,444 14,745 14,995 13508 13259 12014 13533 14993 7. Germany 2,445 2,849 2,451 2,458 2,662 2,702 2554 2672 2013 2039 1938 8. United States 589 512 435 380 333 298 270 241 212 182 155 9. France 560 612 472 421 392 325 280 418 329 371 45510. Russian Federation 1,321 1,585 1,619 1,702 1,579 1,365 1182 1013 879 764 90011 Others 5 6 5 5 5 3 3 3 1 1 1
II. Total Other Govt. ExternalDebt [C+D] 3,205 5,529 4,054 11,832 15,777 18,522 20,319 21,491 31,255 32,377 32,979C. Other Govt. External Debt
(Long term) 2,879 4,914 3,115 10,314 12,935 12,415 16,532 17,710 31,141 32,269 32,880D. Other Govt. External Debt
(Short-term) 326 615 939 1,518 2,842 6,107 3,787 3,781 114 108 99III. Total Sovereign External
Debt (I+II) 49,360 58,070 55,870 67,067 78,072 81,896 81,654 83,695 89,717 93,437 95,779IV.Total External Debt 1,72,360 2,24,407 2,24,498 2,60,935 3,17,891 3,60,766 4,09,374 4,46,178 4,74,675 4,84,989 4,71,852
Memo Items :a) Multilateral debt to External
Assistance (Ratio) 70.4 68.8 68.9 68.5 68.4 68.9 71.0 71.7 73.6 72.3 70.6b) Bilateral debt to External
Assistance (Ratio) 29.6 31.2 31.1 31.5 31.6 31.1 29.0 28.3 26.4 27.7 29.4c) External Assistance to total
external debt (Ratio) 26.8 23.4 23.1 21.2 19.6 17.6 15.0 13.9 12.3 12.6 13.3d) Total Sovereign External Debt to
total external debt (Ratio) 28.6 25.9 24.9 25.7 24.6 22.7 19.9 18.8 18.9 19.3 20.3PR:Partially Revised; QE: Quick Estimates
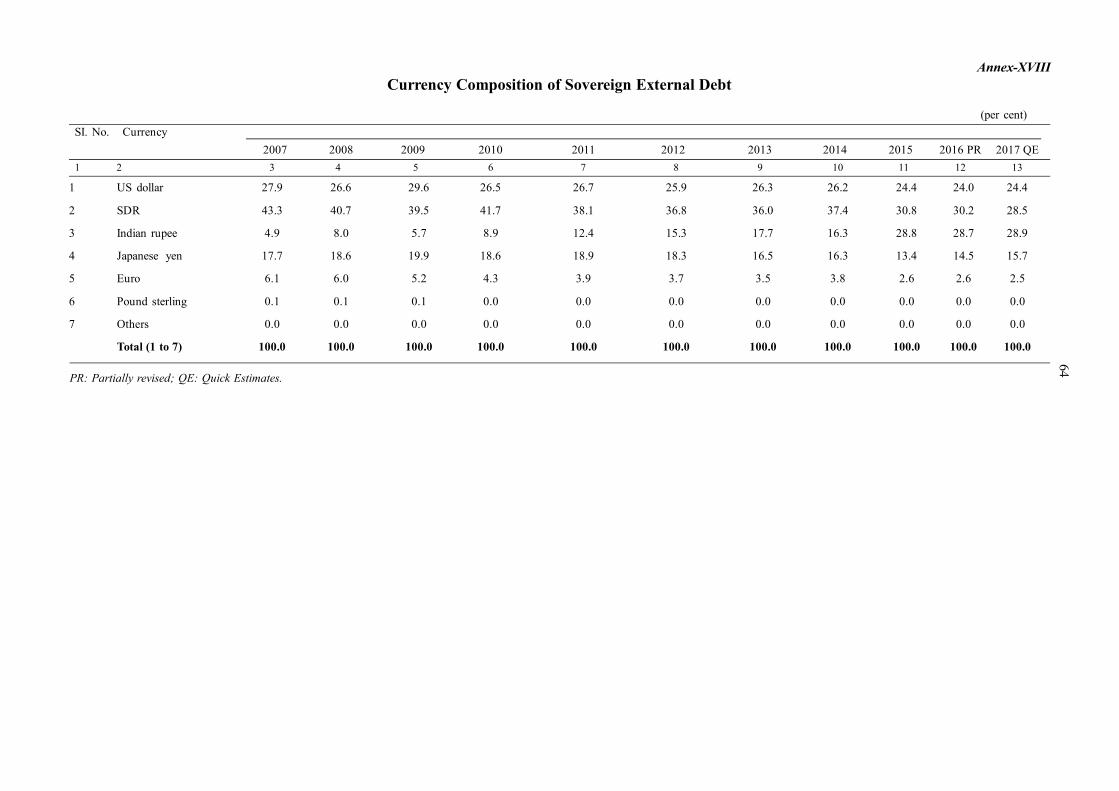
1 US dollar 27.9 26.6 29.6 26.5 26.7 25.9 26.3 26.2 24.4 24.0 24.4
2 SDR 43.3 40.7 39.5 41.7 38.1 36.8 36.0 37.4 30.8 30.2 28.5
3 Indian rupee 4.9 8.0 5.7 8.9 12.4 15.3 17.7 16.3 28.8 28.7 28.9
4 Japanese yen 17.7 18.6 19.9 18.6 18.9 18.3 16.5 16.3 13.4 14.5 15.7
5 Euro 6.1 6.0 5.2 4.3 3.9 3.7 3.5 3.8 2.6 2.6 2.5
6 Pound sterling 0.1 0.1 0.1 0.0 0.0 0.0 0.0 0.0 0.0 0.0 0.0
7 Others 0.0 0.0 0.0 0.0 0.0 0.0 0.0 0.0 0.0 0.0 0.0
Total (1 to 7) 100.0 100.0 100.0 100.0 100.0 100.0 100.0 100.0 100.0 100.0 100.0
Annex-XVIIICurrency Composition of Sovereign External Debt
(per cent)SI. No. Currency
2007 2008 2009 2010 2011 2012 2013 2014 2015 2016 PR 2017 QE1 2 3 4 5 6 7 8 9 10 11 12 13
64
PR: Partially revised; QE: Quick Estimates.
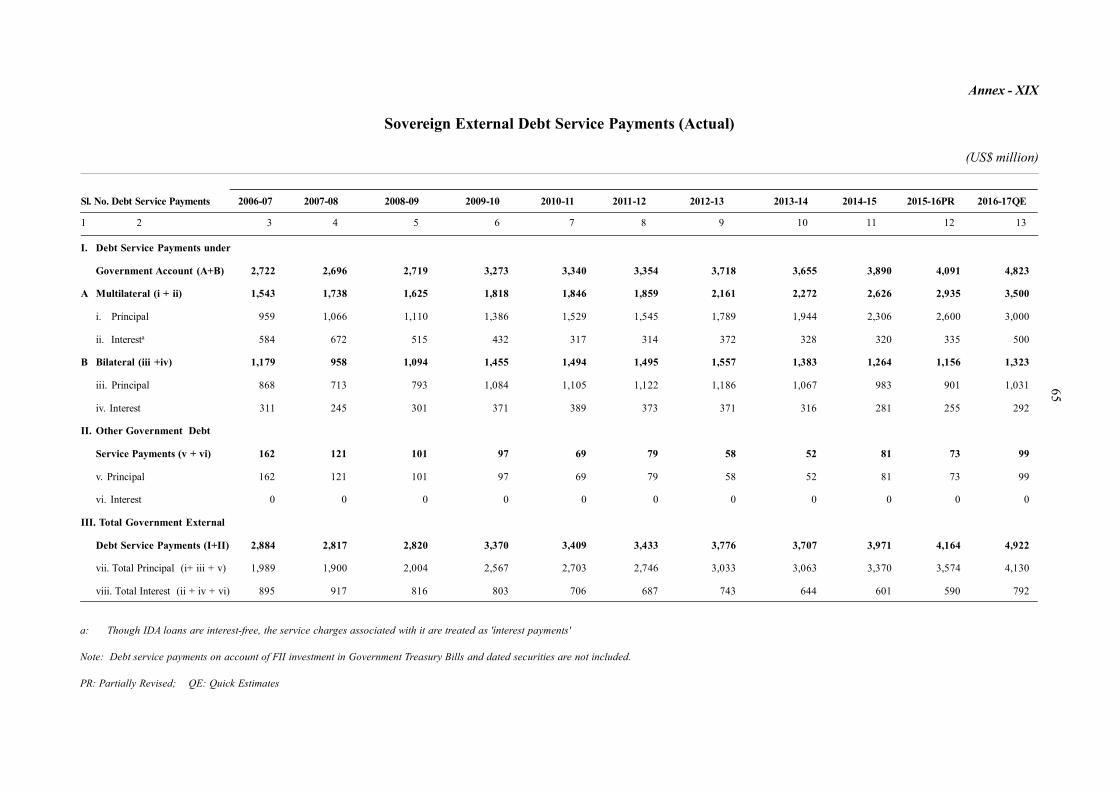
65
I. Debt Service Payments under
Government Account (A+B) 2,722 2,696 2,719 3,273 3,340 3,354 3,718 3,655 3,890 4,091 4,823
A Multilateral (i + ii) 1,543 1,738 1,625 1,818 1,846 1,859 2,161 2,272 2,626 2,935 3,500
i. Principal 959 1,066 1,110 1,386 1,529 1,545 1,789 1,944 2,306 2,600 3,000
ii. Interesta 584 672 515 432 317 314 372 328 320 335 500
B Bilateral (iii +iv) 1,179 958 1,094 1,455 1,494 1,495 1,557 1,383 1,264 1,156 1,323
iii. Principal 868 713 793 1,084 1,105 1,122 1,186 1,067 983 901 1,031
iv. Interest 311 245 301 371 389 373 371 316 281 255 292
II. Other Government Debt
Service Payments (v + vi) 162 121 101 97 69 79 58 52 81 73 99
v. Principal 162 121 101 97 69 79 58 52 81 73 99
vi. Interest 0 0 0 0 0 0 0 0 0 0 0
III. Total Government External
Debt Service Payments (I+II) 2,884 2,817 2,820 3,370 3,409 3,433 3,776 3,707 3,971 4,164 4,922
vii. Total Principal (i+ iii + v) 1,989 1,900 2,004 2,567 2,703 2,746 3,033 3,063 3,370 3,574 4,130
viii. Total Interest (ii + iv + vi) 895 917 816 803 706 687 743 644 601 590 792
Annex - XIX
Sovereign External Debt Service Payments (Actual)
(US$ million)
Sl. No. Debt Service Payments 2006-07 2007-08 2008-09 2009-10 2010-11 2011-12 2012-13 2013-14 2014-15 2015-16PR 2016-17QE
1 2 3 4 5 6 7 8 9 10 11 12 13
a: Though IDA loans are interest-free, the service charges associated with it are treated as 'ínterest payments'
Note: Debt service payments on account of FII investment in Government Treasury Bills and dated securities are not included.
PR: Partially Revised; QE: Quick Estimates
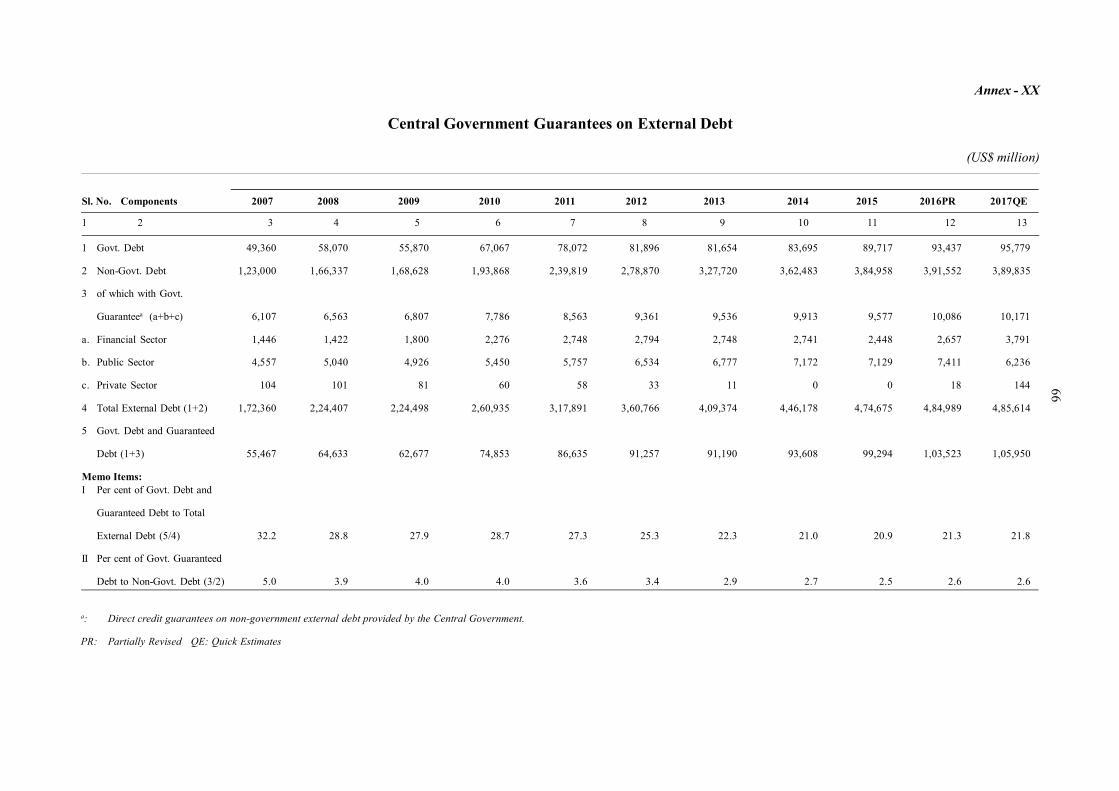
66
1 Govt. Debt 49,360 58,070 55,870 67,067 78,072 81,896 81,654 83,695 89,717 93,437 95,779
2 Non-Govt. Debt 1,23,000 1,66,337 1,68,628 1,93,868 2,39,819 2,78,870 3,27,720 3,62,483 3,84,958 3,91,552 3,89,835
3 of which with Govt.
Guaranteea (a+b+c) 6,107 6,563 6,807 7,786 8,563 9,361 9,536 9,913 9,577 10,086 10,171
a. Financial Sector 1,446 1,422 1,800 2,276 2,748 2,794 2,748 2,741 2,448 2,657 3,791
b. Public Sector 4,557 5,040 4,926 5,450 5,757 6,534 6,777 7,172 7,129 7,411 6,236
c. Private Sector 104 101 81 60 58 33 11 0 0 18 144
4 Total External Debt (1+2) 1,72,360 2,24,407 2,24,498 2,60,935 3,17,891 3,60,766 4,09,374 4,46,178 4,74,675 4,84,989 4,85,614
5 Govt. Debt and Guaranteed
Debt (1+3) 55,467 64,633 62,677 74,853 86,635 91,257 91,190 93,608 99,294 1,03,523 1,05,950
Memo Items:I Per cent of Govt. Debt and
Guaranteed Debt to Total
External Debt (5/4) 32.2 28.8 27.9 28.7 27.3 25.3 22.3 21.0 20.9 21.3 21.8
II Per cent of Govt. Guaranteed
Debt to Non-Govt. Debt (3/2) 5.0 3.9 4.0 4.0 3.6 3.4 2.9 2.7 2.5 2.6 2.6
Annex - XX
Central Government Guarantees on External Debt
(US$ million)
Sl. No. Components 2007 2008 2009 2010 2011 2012 2013 2014 2015 2016PR 2017QE
1 2 3 4 5 6 7 8 9 10 11 12 13
a: Direct credit guarantees on non-government external debt provided by the Central Government.
PR: Partially Revised QE: Quick Estimates
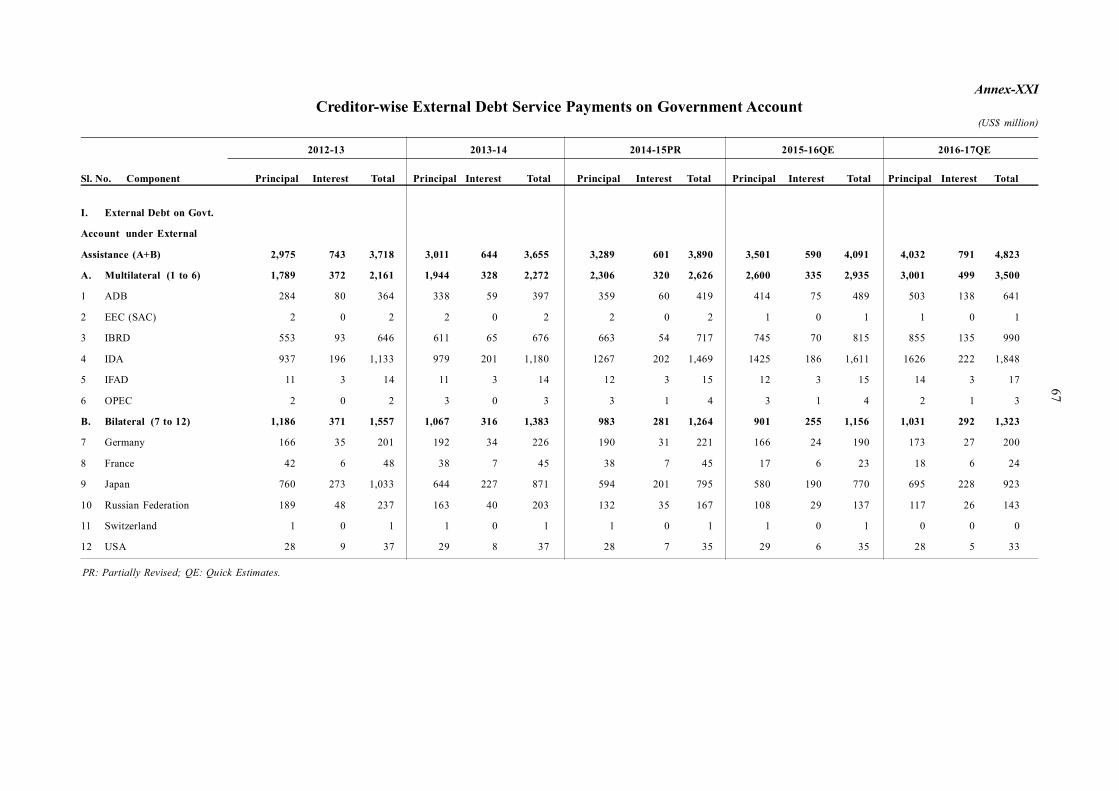
67
2,975 743 3,718 3,011 644 3,655 3,289 601 3,890 3,501 590 4,091 4,032 791 4,823
1,789 372 2,161 1,944 328 2,272 2,306 320 2,626 2,600 335 2,935 3,001 499 3,500
284 80 364 338 59 397 359 60 419 414 75 489 503 138 641
2 0 2 2 0 2 2 0 2 1 0 1 1 0 1
553 93 646 611 65 676 663 54 717 745 70 815 855 135 990
937 196 1,133 979 201 1,180 1267 202 1,469 1425 186 1,611 1626 222 1,848
11 3 14 11 3 14 12 3 15 12 3 15 14 3 17
2 0 2 3 0 3 3 1 4 3 1 4 2 1 3
1,186 371 1,557 1,067 316 1,383 983 281 1,264 901 255 1,156 1,031 292 1,323
166 35 201 192 34 226 190 31 221 166 24 190 173 27 200
42 6 48 38 7 45 38 7 45 17 6 23 18 6 24
760 273 1,033 644 227 871 594 201 795 580 190 770 695 228 923
189 48 237 163 40 203 132 35 167 108 29 137 117 26 143
1 0 1 1 0 1 1 0 1 1 0 1 0 0 0
28 9 37 29 8 37 28 7 35 29 6 35 28 5 33
I. External Debt on Govt.
Account under External
Assistance (A+B)
A. Multilateral (1 to 6)
1 ADB
2 EEC (SAC)
3 IBRD
4 IDA
5 IFAD
6 OPEC
B. Bilateral (7 to 12)
7 Germany
8 France
9 Japan
10 Russian Federation
11 Switzerland
12 USA
PR: Partially Revised; QE: Quick Estimates.
Annex-XXICreditor-wise External Debt Service Payments on Government Account
(US$ million)
2012-13 2013-14 2014-15PR 2015-16QE 2016-17QE
Sl. No. Component Principal Interest Total Principal Interest Total Principal Interest Total Principal Interest Total Principal Interest Total
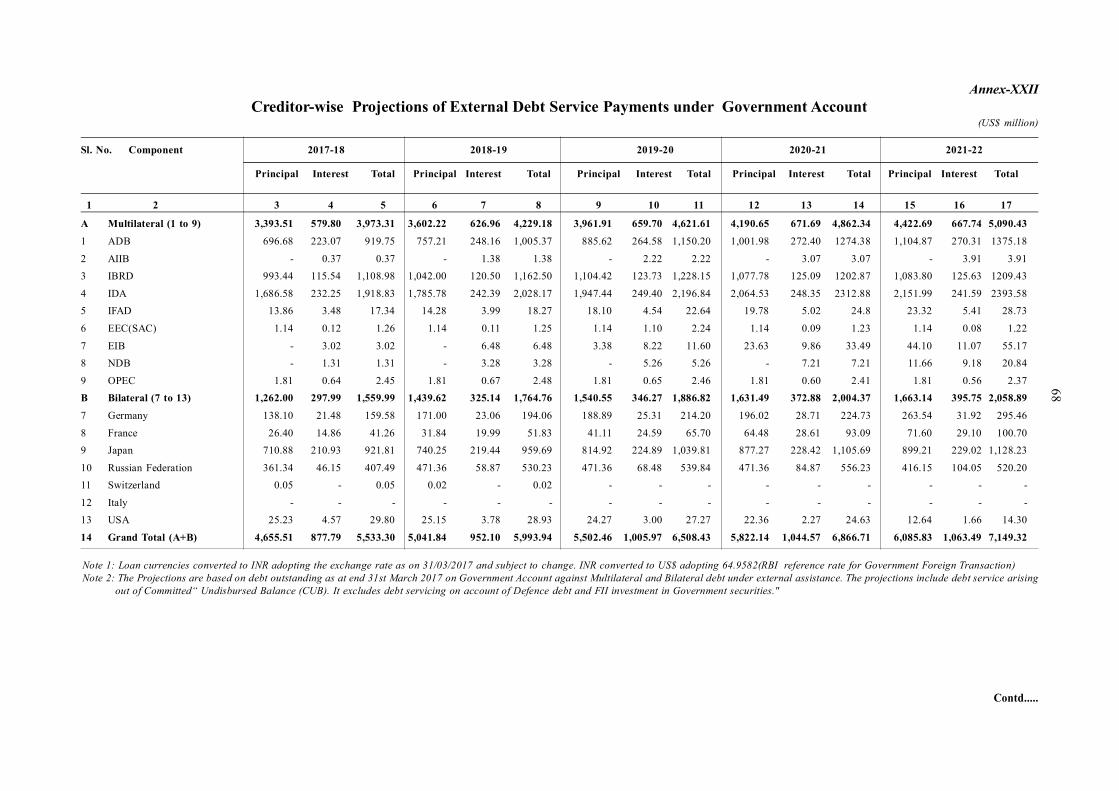
68
A Multilateral (1 to 9) 3,393.51 579.80 3,973.31 3,602.22 626.96 4,229.18 3,961.91 659.70 4,621.61 4,190.65 671.69 4,862.34 4,422.69 667.74 5,090.43
1 ADB 696.68 223.07 919.75 757.21 248.16 1,005.37 885.62 264.58 1,150.20 1,001.98 272.40 1274.38 1,104.87 270.31 1375.18
2 AIIB - 0.37 0.37 - 1.38 1.38 - 2.22 2.22 - 3.07 3.07 - 3.91 3.913 IBRD 993.44 115.54 1,108.98 1,042.00 120.50 1,162.50 1,104.42 123.73 1,228.15 1,077.78 125.09 1202.87 1,083.80 125.63 1209.43
4 IDA 1,686.58 232.25 1,918.83 1,785.78 242.39 2,028.17 1,947.44 249.40 2,196.84 2,064.53 248.35 2312.88 2,151.99 241.59 2393.585 IFAD 13.86 3.48 17.34 14.28 3.99 18.27 18.10 4.54 22.64 19.78 5.02 24.8 23.32 5.41 28.73
6 EEC(SAC) 1.14 0.12 1.26 1.14 0.11 1.25 1.14 1.10 2.24 1.14 0.09 1.23 1.14 0.08 1.22
7 EIB - 3.02 3.02 - 6.48 6.48 3.38 8.22 11.60 23.63 9.86 33.49 44.10 11.07 55.178 NDB - 1.31 1.31 - 3.28 3.28 - 5.26 5.26 - 7.21 7.21 11.66 9.18 20.84
9 OPEC 1.81 0.64 2.45 1.81 0.67 2.48 1.81 0.65 2.46 1.81 0.60 2.41 1.81 0.56 2.37B Bilateral (7 to 13) 1,262.00 297.99 1,559.99 1,439.62 325.14 1,764.76 1,540.55 346.27 1,886.82 1,631.49 372.88 2,004.37 1,663.14 395.75 2,058.89
7 Germany 138.10 21.48 159.58 171.00 23.06 194.06 188.89 25.31 214.20 196.02 28.71 224.73 263.54 31.92 295.46
8 France 26.40 14.86 41.26 31.84 19.99 51.83 41.11 24.59 65.70 64.48 28.61 93.09 71.60 29.10 100.709 Japan 710.88 210.93 921.81 740.25 219.44 959.69 814.92 224.89 1,039.81 877.27 228.42 1,105.69 899.21 229.02 1,128.23
10 Russian Federation 361.34 46.15 407.49 471.36 58.87 530.23 471.36 68.48 539.84 471.36 84.87 556.23 416.15 104.05 520.2011 Switzerland 0.05 - 0.05 0.02 - 0.02 - - - - - - - - -
12 Italy - - - - - - - - - - - - - - -13 USA 25.23 4.57 29.80 25.15 3.78 28.93 24.27 3.00 27.27 22.36 2.27 24.63 12.64 1.66 14.30
14 Grand Total (A+B) 4,655.51 877.79 5,533.30 5,041.84 952.10 5,993.94 5,502.46 1,005.97 6,508.43 5,822.14 1,044.57 6,866.71 6,085.83 1,063.49 7,149.32
Annex-XXIICreditor-wise Projections of External Debt Service Payments under Government Account
(US$ million)
Sl. No. Component 2017-18 2018-19 2019-20 2020-21 2021-22
Principal Interest Total Principal Interest Total Principal Interest Total Principal Interest Total Principal Interest Total
1 2 3 4 5 6 7 8 9 10 11 12 13 14 15 16 17
Contd.....
Note 1: Loan currencies converted to INR adopting the exchange rate as on 31/03/2017 and subject to change. INR converted to US$ adopting 64.9582(RBI reference rate for Government Foreign Transaction)Note 2: The Projections are based on debt outstanding as at end 31st March 2017 on Government Account against Multilateral and Bilateral debt under external assistance. The projections include debt service arising
out of Committed“ Undisbursed Balance (CUB). It excludes debt servicing on account of Defence debt and FII investment in Government securities."
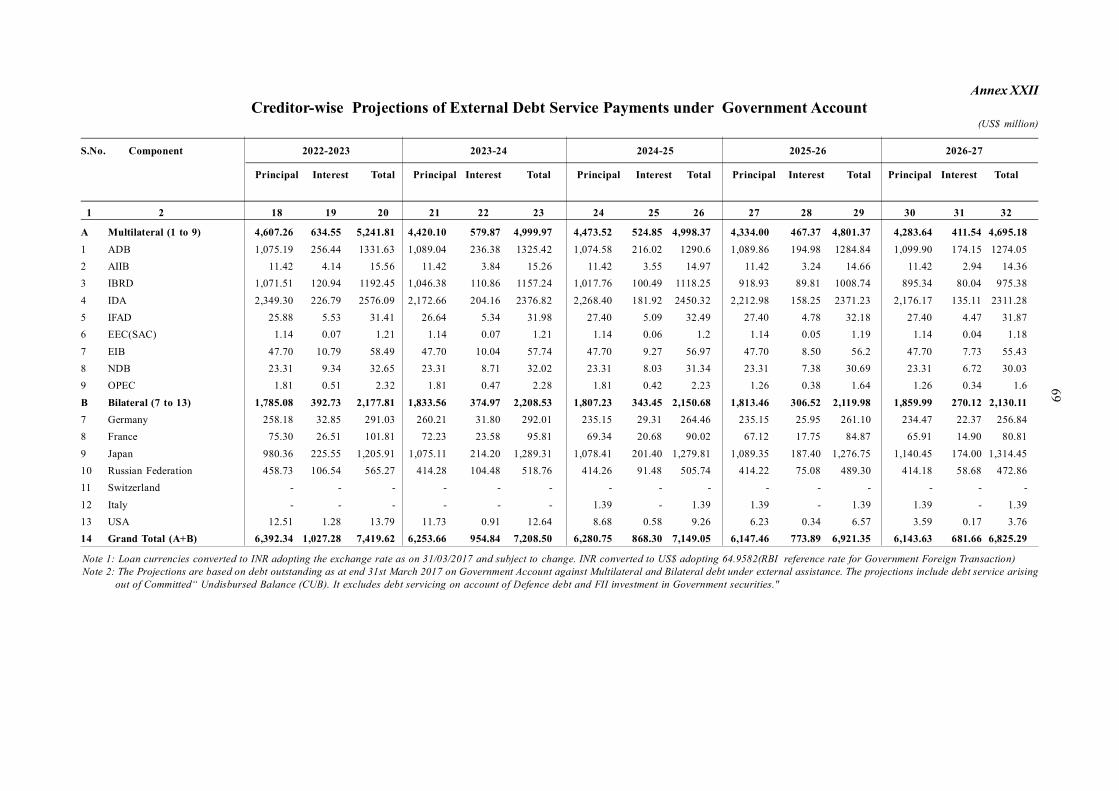
69
Annex XXIICreditor-wise Projections of External Debt Service Payments under Government Account
(US$ million)
S.No. Component 2022-2023 2023-24 2024-25 2025-26 2026-27
Principal Interest Total Principal Interest Total Principal Interest Total Principal Interest Total Principal Interest Total
1 2 18 19 20 21 22 23 24 25 26 27 28 29 30 31 32
A Multilateral (1 to 9) 4,607.26 634.55 5,241.81 4,420.10 579.87 4,999.97 4,473.52 524.85 4,998.37 4,334.00 467.37 4,801.37 4,283.64 411.54 4,695.181 ADB 1,075.19 256.44 1331.63 1,089.04 236.38 1325.42 1,074.58 216.02 1290.6 1,089.86 194.98 1284.84 1,099.90 174.15 1274.052 AIIB 11.42 4.14 15.56 11.42 3.84 15.26 11.42 3.55 14.97 11.42 3.24 14.66 11.42 2.94 14.363 IBRD 1,071.51 120.94 1192.45 1,046.38 110.86 1157.24 1,017.76 100.49 1118.25 918.93 89.81 1008.74 895.34 80.04 975.384 IDA 2,349.30 226.79 2576.09 2,172.66 204.16 2376.82 2,268.40 181.92 2450.32 2,212.98 158.25 2371.23 2,176.17 135.11 2311.285 IFAD 25.88 5.53 31.41 26.64 5.34 31.98 27.40 5.09 32.49 27.40 4.78 32.18 27.40 4.47 31.876 EEC(SAC) 1.14 0.07 1.21 1.14 0.07 1.21 1.14 0.06 1.2 1.14 0.05 1.19 1.14 0.04 1.187 EIB 47.70 10.79 58.49 47.70 10.04 57.74 47.70 9.27 56.97 47.70 8.50 56.2 47.70 7.73 55.438 NDB 23.31 9.34 32.65 23.31 8.71 32.02 23.31 8.03 31.34 23.31 7.38 30.69 23.31 6.72 30.039 OPEC 1.81 0.51 2.32 1.81 0.47 2.28 1.81 0.42 2.23 1.26 0.38 1.64 1.26 0.34 1.6B Bilateral (7 to 13) 1,785.08 392.73 2,177.81 1,833.56 374.97 2,208.53 1,807.23 343.45 2,150.68 1,813.46 306.52 2,119.98 1,859.99 270.12 2,130.117 Germany 258.18 32.85 291.03 260.21 31.80 292.01 235.15 29.31 264.46 235.15 25.95 261.10 234.47 22.37 256.848 France 75.30 26.51 101.81 72.23 23.58 95.81 69.34 20.68 90.02 67.12 17.75 84.87 65.91 14.90 80.819 Japan 980.36 225.55 1,205.91 1,075.11 214.20 1,289.31 1,078.41 201.40 1,279.81 1,089.35 187.40 1,276.75 1,140.45 174.00 1,314.4510 Russian Federation 458.73 106.54 565.27 414.28 104.48 518.76 414.26 91.48 505.74 414.22 75.08 489.30 414.18 58.68 472.8611 Switzerland - - - - - - - - - - - - - - -12 Italy - - - - - - 1.39 - 1.39 1.39 - 1.39 1.39 - 1.3913 USA 12.51 1.28 13.79 11.73 0.91 12.64 8.68 0.58 9.26 6.23 0.34 6.57 3.59 0.17 3.7614 Grand Total (A+B) 6,392.34 1,027.28 7,419.62 6,253.66 954.84 7,208.50 6,280.75 868.30 7,149.05 6,147.46 773.89 6,921.35 6,143.63 681.66 6,825.29
Note 1: Loan currencies converted to INR adopting the exchange rate as on 31/03/2017 and subject to change. INR converted to US$ adopting 64.9582(RBI reference rate for Government Foreign Transaction)Note 2: The Projections are based on debt outstanding as at end 31st March 2017 on Government Account against Multilateral and Bilateral debt under external assistance. The projections include debt service arising
out of Committed“ Undisbursed Balance (CUB). It excludes debt servicing on account of Defence debt and FII investment in Government securities."
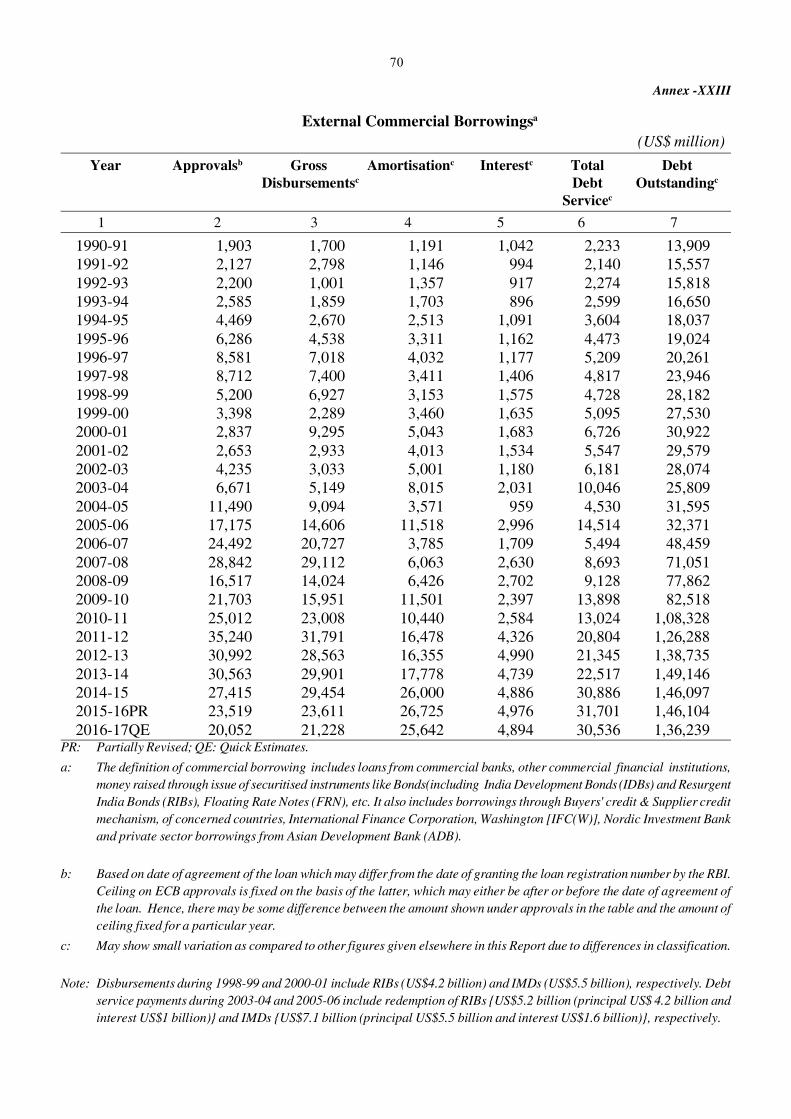
70
Annex -XXIII
External Commercial Borrowingsa
(US$ million)
Year Approvalsb Gross Amortisationc Interestc Total Debt Disbursementsc Debt Outstandingc
Servicec
1 2 3 4 5 6 7
PR: Partially Revised; QE: Quick Estimates.
a: The definition of commercial borrowing includes loans from commercial banks, other commercial financial institutions,money raised through issue of securitised instruments like Bonds(including India Development Bonds (IDBs) and ResurgentIndia Bonds (RIBs), Floating Rate Notes (FRN), etc. It also includes borrowings through Buyers' credit & Supplier creditmechanism, of concerned countries, International Finance Corporation, Washington [IFC(W)], Nordic Investment Bankand private sector borrowings from Asian Development Bank (ADB).
b: Based on date of agreement of the loan which may differ from the date of granting the loan registration number by the RBI.Ceiling on ECB approvals is fixed on the basis of the latter, which may either be after or before the date of agreement ofthe loan. Hence, there may be some difference between the amount shown under approvals in the table and the amount ofceiling fixed for a particular year.
c: May show small variation as compared to other figures given elsewhere in this Report due to differences in classification.
Note: Disbursements during 1998-99 and 2000-01 include RIBs (US$4.2 billion) and IMDs (US$5.5 billion), respectively. Debtservice payments during 2003-04 and 2005-06 include redemption of RIBs {US$5.2 billion (principal US$ 4.2 billion andinterest US$1 billion)} and IMDs {US$7.1 billion (principal US$5.5 billion and interest US$1.6 billion)}, respectively.
1990-91 1,903 1,700 1,191 1,042 2,233 13,9091991-92 2,127 2,798 1,146 994 2,140 15,5571992-93 2,200 1,001 1,357 917 2,274 15,8181993-94 2,585 1,859 1,703 896 2,599 16,6501994-95 4,469 2,670 2,513 1,091 3,604 18,0371995-96 6,286 4,538 3,311 1,162 4,473 19,0241996-97 8,581 7,018 4,032 1,177 5,209 20,2611997-98 8,712 7,400 3,411 1,406 4,817 23,9461998-99 5,200 6,927 3,153 1,575 4,728 28,1821999-00 3,398 2,289 3,460 1,635 5,095 27,5302000-01 2,837 9,295 5,043 1,683 6,726 30,9222001-02 2,653 2,933 4,013 1,534 5,547 29,5792002-03 4,235 3,033 5,001 1,180 6,181 28,0742003-04 6,671 5,149 8,015 2,031 10,046 25,8092004-05 11,490 9,094 3,571 959 4,530 31,5952005-06 17,175 14,606 11,518 2,996 14,514 32,3712006-07 24,492 20,727 3,785 1,709 5,494 48,4592007-08 28,842 29,112 6,063 2,630 8,693 71,0512008-09 16,517 14,024 6,426 2,702 9,128 77,8622009-10 21,703 15,951 11,501 2,397 13,898 82,5182010-11 25,012 23,008 10,440 2,584 13,024 1,08,3282011-12 35,240 31,791 16,478 4,326 20,804 1,26,2882012-13 30,992 28,563 16,355 4,990 21,345 1,38,7352013-14 30,563 29,901 17,778 4,739 22,517 1,49,1462014-15 27,415 29,454 26,000 4,886 30,886 1,46,0972015-16PR 23,519 23,611 26,725 4,976 31,701 1,46,1042016-17QE 20,052 21,228 25,642 4,894 30,536 1,36,239