india - external debt development and management
TRANSCRIPT
External Debt Development and Management: Some Reflections on India
Dr HK PradhanProfessor of Finance and Economics
XLRI Jamshedpur India
Regional Workshop on Capacity-building for External Debt Management in the Era of Rapid Globalization
6-7 July 2004Bangkok

Introduction
In 1990-91 when India got into a severe foreign exchange crisis her outstanding level of external debt was $ 83. 8 billion. The level of debt was about 40 per cent of Gross Domestic Product and the debt service payment was about 30 per cent of exports of goods and services. Several destabilizing forces acting on the Indian foreign exchange markets were a downgrade of India’s sovereign credit ratings to non-investment grade, reversal of capital flows, exacerbated the foreign exchange crisis and withdrawal of the foreign currency deposits held by non-resident Indians. One can best describe the severity of the situation by quoting from the then Finance Minister of India Dr Manmohan Singh’s Budget 1992-93 speech to the Parliament:
"When the new Government assumed office (June 1991) we inherited an economy on the verge of collapse. Inflation was accelerating rapidly. The balance of payments was in serious trouble. The foreign exchange reserves were barely enough for two weeks of imports. Foreign commercial banks had stopped lending to India. Non-resident Indians were withdrawing their deposits. Shortages of foreign exchange had forced a massive import squeeze, which had halted the rapid industrial growth of earlier years and had produced negative growth rates from May 1991 onwards".
With this background a study on India’s external debt would obviously raise certain questions such as: how did India manage historically with a very low volume of external capital inflows; how is that the third world debt crisis of early 80s had a little impact; how is it then that India got into a massive foreign exchange crisis in 1990-91; how was India spared from the contagious currency crisis of 1997; and how did India managed to improve her rank from what was third debtor after Brazil and Mexico in 1991 to eighth in 2002 in the list of the top fifteen debtor countries(as per the Global Development Finance report 2004 published by the World Bank). Still more notable is the fact that India never defaulted to international lenders in her entire credit history (except one or two instances of corporate rescheduling).
Although the level of debt has increased to $ 112.1 billion by end-December 2003, the magnitude of debt is no longer an issue at present. The economic reforms and debt management policies pursued since 1991 have helped to bring down the share of external debt in GDP to 20.2 per cent and the debt service ratio to 15.8 percent by end-December 2003. The reforms involving trade and capital account liberalisatrion have changed the nature and composition of capital flows into Indian economy. The gradual opening of the capital account and improved credit standing internationally, supported by the prudent macroeconomic policies, have established investors’ confidence.
The above scenario although presupposes several accomplishments underlying the country’s external debt management history, the Indian economy nevertheless displayed several episodes of imbalances in her debt, capital flows and external sector. This paper puts in perspectives the case of India’s external debt management in the light of the
development in her overall macroeconomic policies and draws lessons for countries in the region. It needs to be mentioned here that the trends in debt need to be reviewed along with the developments in external sector and capital flows, because the overall trade regime, involving trade restrictions, export subsidisation and exchange controls would govern to a large extent the behaviour of external debt.
External Debt Development Until 1970s Looking at historically one observes that external capital played a very insignificant role in India’s development process. The industrialisation strategy adopted since the 1950s emulated an import substituting trade regime, with both imports and exports being strictly regulated through quota and duties. The level of current account deficit was as low as 1.2 per cent in 1970, matching the availability of external finance, most of which were contracted from the official creditors and at concessional interest rates. Private commercial borrowings from the international capital markets were nil. The total external debt outstanding at $ 8.4 billion was just about 13.3 per cent of GDP for the year 1970.
India responded very well to the first oil shock of 1973, with prudent macroeconomic management. The deflationary stance of macroeconomic policies coupled with massive inflows of inward remittances from Gulf led to even a surplus on current account in 1976-77, which helped to build up the reserve level. Imports were virtually restricted to the level of exports, and thus the entire inflows of worker's remittances and net aid inflows (after adjusting the gross flows for debt service) were ploughed back to build up the reserves.
It was no surprise, therefore, to find that during this period gross aid inflows were sharply reduced by the donors, as these were only going to swell further the reserves. By 1978-79, the reserve level reached about 9 months of import requirements. There was strong opinion in some quarters as to whether India could take advantage of this comfortable foreign exchange situation to relax the severity of the import control regime. To some extent imports were liberalised in 1976-77 and 1977-78 through the introduction of Open General License (OGL), but the persistence of almost total protection of the Indian industrial sector prevented any significant loosening of import.
The second oil shock had a major impact on India’s balance of payments, however, with the prices of POL more than doubling during the course of 1979. The oil imports accounted for almost 58 percent of total imports and 46 percent in terms of export earnings. The primary focus of balance of payment management after the second shock was to finance the deficit, rather to control the it through deflationary stance of the first oil shock-type.
Developments in External Sector During 1980s
India remained unaffected by the debt crisis of early eighties facing many developing countries, due to her insignificant level of private debt. The foreign exchange constraints
in the aftermath of second oil shock could be relieved by drawing substantial amount of loans from the International Monetary Fund: SDR 266 million under Compensatory Financing Facility (CFF) in 1980, SDR 529.01 million under Trust Fund Loan (TFL) in 1980-81 and SDR 5 billion under Extended Fund Facility (EFF) during 1981-84 (of which India used only SDR 3.9 billion). The foreign exchange situation also improved dramatically due to the inflow of remittances from the Gulf.
A substantial amount of import savings could be made due to large-scale import substitution in the areas of food, petroleum (after the discovery of Bombay High) and fertilizer. Thus, an improved foreign exchange scenario, which along with the available multilateral concessional assistance helped India to retain her credit-worthiness and avoid a possible liquidity crisis of the Latin American type in early 1980s. In fact taking the advantage of the improved foreign exchange scenario Indian policy makers attempted to relax the severity of the controlled trade regime in the 80s.
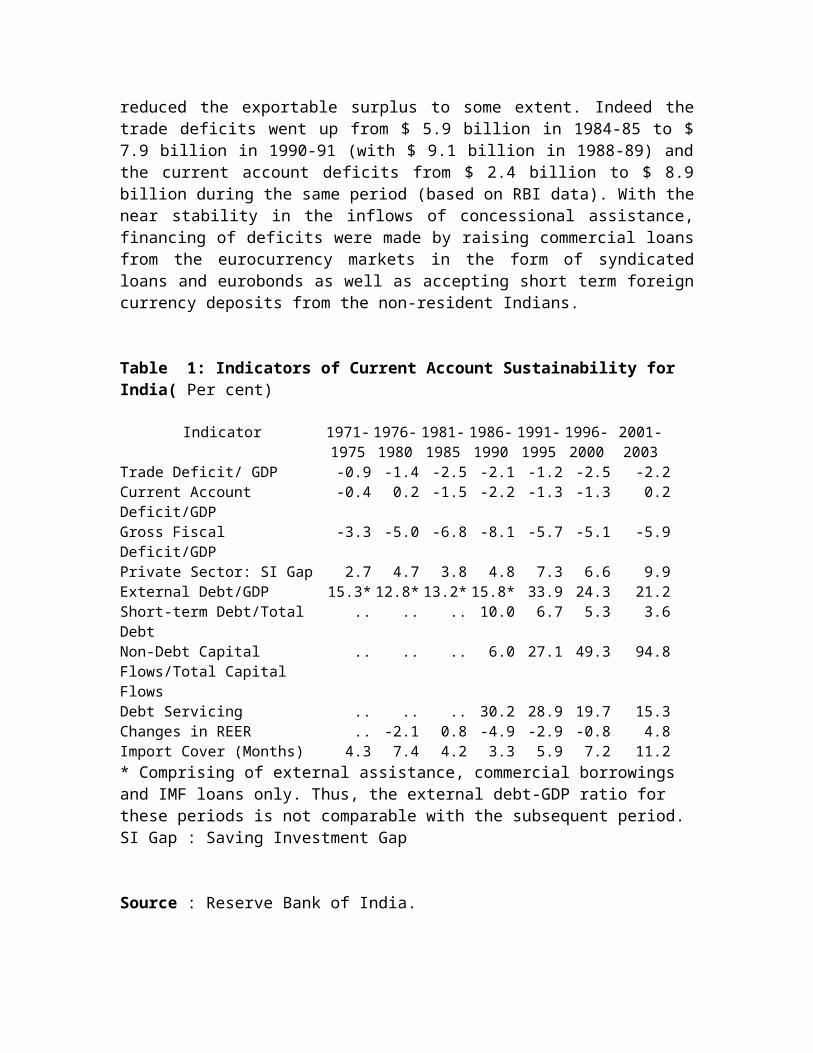
The liberalization of the import control regime, particularly the category of Open General License (OGL) and export-related licenses, opened up a variety of imports that were required by a wider range of emerging consumer goods industries. Export growth remained sluggish during the eighties, due to the slowdown in the growth of world trade, decline in primary commodity prices in the global market, and the expansionary policy at home, as the later might have reduced the exportable surplus to some extent. Indeed the trade deficits went up from $ 5.9 billion in 1984-85 to $ 7.9 billion in 1990-91 (with $ 9.1 billion in 1988-89) and the current account deficits from $ 2.4 billion to $ 8.9 billion during the same period (based on RBI data). With the near stability in the inflows of concessional assistance, financing of deficits were made by raising commercial loans from the eurocurrency markets in the form of syndicated loans and eurobonds as well as accepting short term foreign currency deposits from the non-resident Indians.
Table 1: Indicators of Current Account Sustainability for India( Per cent)
Indicator 1971-1975
1976-1980
1981-1985
1986-1990
1991-1995
1996-2000
2001-2003
Trade Deficit/ GDP -0.9 -1.4 -2.5 -2.1 -1.2 -2.5 -2.2Current Account Deficit/GDP -0.4 0.2 -1.5 -2.2 -1.3 -1.3 0.2Gross Fiscal Deficit/GDP -3.3 -5.0 -6.8 -8.1 -5.7 -5.1 -5.9Private Sector: SI Gap 2.7 4.7 3.8 4.8 7.3 6.6 9.9External Debt/GDP 15.3* 12.8* 13.2* 15.8* 33.9 24.3 21.2Short-term Debt/Total Debt .. .. .. 10.0 6.7 5.3 3.6Non-Debt Capital Flows/Total Capital Flows
.. .. .. 6.0 27.1 49.3 94.8
Debt Servicing .. .. .. 30.2 28.9 19.7 15.3Changes in REER .. -2.1 0.8 -4.9 -2.9 -0.8 4.8Import Cover (Months) 4.3 7.4 4.2 3.3 5.9 7.2 11.2* Comprising of external assistance, commercial borrowings and IMF loans only. Thus, the external debt-GDP ratio for these periods is not comparable with the subsequent period. SI Gap : Saving Investment Gap
Source : Reserve Bank of India.
The imbalances in the external sector coincided with the macroeconomic imbalances in the economy, particularly in the form of increasing domestic money supply and budget deficits(see Table 1). The expansionary monetary and fiscal policies did not take into account the likely repercussion in the form of spill over effects on balance of payments. In fact, the generation of the excess liquidity that accompanied the liberalised import structure swelled the level of current account deficit.
The principal mode of balance of payment adjustments in India during the second half of the eighties was the managed depreciation of the rupee. Between 1985-90, the NEER of the rupee depreciated by almost 50 per cent and the REER by 30 per cent. It is clear that in a situation where the balance of payment problem was basically due to the macroeconomic imbalances, which arose primarily from the expansionary macroeconomic policies and the liberalised import structure, the expenditure switching effects of devaluation did not work.
Developments to 1991 Foreign Exchange Crisis
By 1990, there was a marked deterioration in India's balance of payments. Although there was satisfactory growth in exports, it was overshadowed by growth in imports, stagnant flows in invisibles such as tourism and private transfers, and mounting debt service burden. The current account deficits which were sustained mainly by borrowing from commercial sources and NRI deposits, with short maturities and variable interest rates, resulted in a ballooning of repayment burden towards 1990. The size of external debt reached $ 83 billion in March 1991, 45 per 'cent of which was contracted from private creditors and at variable interest rates.
The debt service payments had reached 30 percent of export earnings by March 1991, which was close to some of the heavily indebted countries such as Indonesia [31 per cent), Mexico [28 per cent), and Turkey (28 per cent). Interest components alone was about $ 4 billion, comprising some 50 per cent of the total current account deficits and 21 per cent of the total merchandise exports. The growth of exports in US dollar terms was not sufficient even to pay for the interests for each of the three years to 1990-91 and India had to make for amortization payments by resorting to fresh borrowing.
The foreign exchange crisis was exacerbated by the Gulf war that began in August 1990, causing shortfall in exports to West Asia, loss of remittances from Kuwait and Iraq, huge foreign exchange costs of emergency repatriation from the region and, most importantly, additional cost of oil imports due to the oil price increase. The Gulf crisis coincided with recessionary trends in the West that had depressed the demand for India’s exports. Furthermore, the economic decline in Eastern Europe led to a contraction of exports to these markets. The uncertain political climate at home along with the precarious balance
of payments situation led to the erosion of India's credit ratings abroad. The Moody's downgraded India's status to BB in 1990, which was the highest speculative grade for long-term debt.
There were indications that the net resource transfer on account of official and private credit had become negative in 1990-91 i.e. the fresh inflows were not even adequate to meet the obligations on account of amortization and interest payments. The level of foreign exchange reserves fell to just $ 1 billion in 1990-91. This desperate situation led the Reserve Bank of India to sell 20 tonnes of gold in May 1991 and pledge another 46.91 tonnes in July 1991, for meeting the urgent foreign exchange needs and financing current account deficits. An imminent foreign exchange crisis loomed large before the Indian economy, with unsustainable external debt burden.
Crisis and Reform in the 1990s
The foreign exchange crisis opened up several internal conflicts of an inward looking economy. The policy makers considered the unsustainable balance of payment situation as the symptom and the disease was inherent in the trade and industrial policy that protected the Indian economy from both internal and external competition. The shrinking share of India's exports in the global trade was considered as the reflection of the receding exports competitiveness and the absence of a right kind of commodity mix in India's export basket. The inefficiency of the trade regime had much to do with the prohibitive tariffs and a pervasive system of import controls. The entire regime of discretionary management of foreign exchange had constrained growth, proliferated black markets in foreign exchange and created avenues for considerable rent-seeking activities.
India’s approach to the 1990-91 crises was not to default on her external obligations, rather to pursue macroeconomic reforms, and remain current on debt servicing by borrowing from multilateral sources. As part of the overall macroeconomic reforms, sweeping changes were introduced in the areas of trade and exchange rate policies. The Congress led government, which assumed office at the Centre in June 1991, accepted the medium term structural adjustment programme of the IMF. An immediate fall out of this programme was the sharp devaluation of the rupee. In July 1991 the rupee was devalued at two stages, from £ 1 Rs.34.36 to Rs.41.59. This was followed by a plethora of trade policy reform measures, beginning August 1991, by slashing cash subsidies for the export sector and relieving the economy from the QR and tariff regimes adopted since fifties.
India’s reform efforts since 1990s had led to a resumption of growth, decline in inflation, improved fiscal deficit, and a sustainable balance of payments. As we shall see later this had remarkably reduced the external debt burden and brought several beneficial changes in the composition of capital flows in years to come.
1997 Asian Crisis and Its Impact
The Southeast Asian crises had several common elements: speculative attack on the currencies (with sharp depreciation); the authorities being forced to defend the plummeting currency by depleting large volumes of international reserves; banking crisis compelling the governments to extend massive financial assistance to banks through budgetary support to prevent a collapse.
Another distinguishing feature of the crisis was the effect of contagion; crisis in one country spreading into several others in the region. The contagion impact depended on the degree of financial markets integration as well as the existing state of the economy. The speculative attacks were on those countries’ currencies that were competing in the same world markets for goods and capital.
The Asian crisis had only a marginal impact on India, with negligible impact on her foreign exchange markets, the level of reserves and the banking system. It has been observed that the macro economic fundamentals prevailing at the time coupled with the flexible exchange rate management and control on short-term capital flows helped India to withstand the currency crisis. The crises demonstrated that the major objective of sound debt management policy could be to achieve or maintain debt sustainability, while meeting key economic macroeconomic goals.
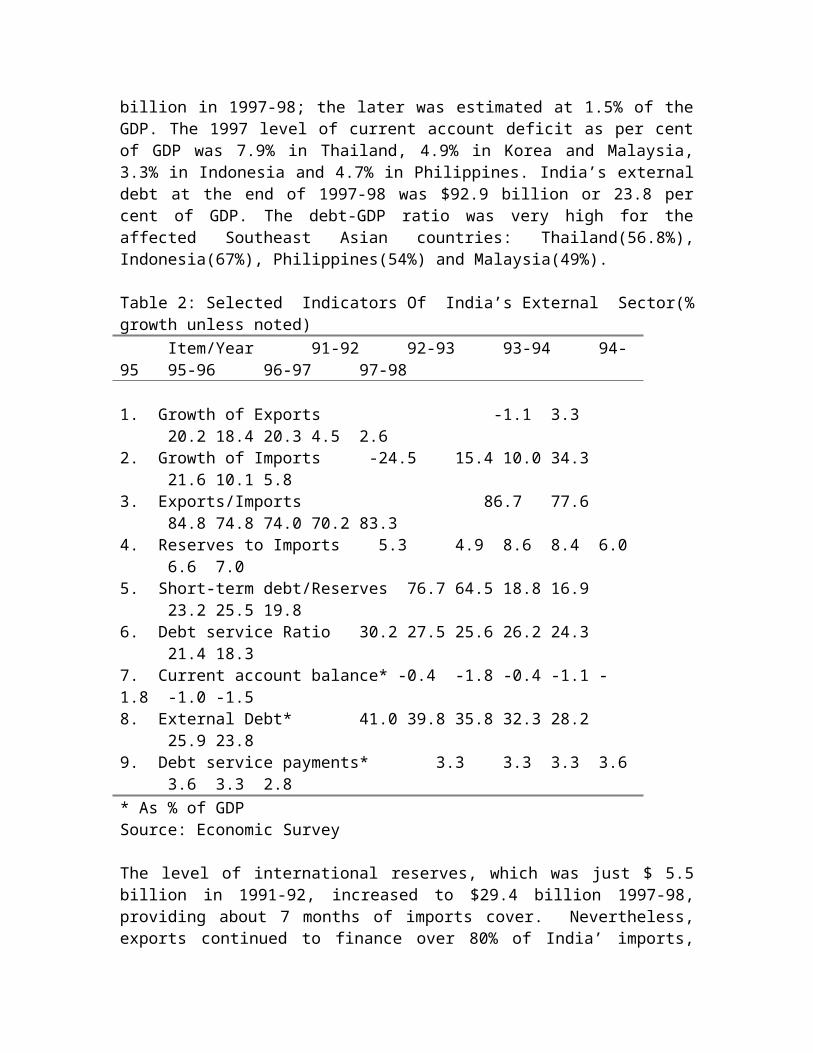
At the time of currency crisis India’s balance of payments situation had become sustainable due both to a reduction in the current account deficit and to a substantial increase in net capital inflows. The current account deficit had fallen from its peak level of $ 9.8 billion in 1990- 91 to US $3.7 billion in 1997-98; the later was estimated at 1.5% of the GDP. The 1997 level of current account deficit as per cent of GDP was 7.9% in Thailand, 4.9% in Korea and Malaysia, 3.3% in Indonesia and 4.7% in Philippines. India’s external debt at the end of 1997-98 was $92.9 billion or 23.8 per cent of GDP. The debt-GDP ratio was very high for the affected Southeast Asian countries: Thailand(56.8%), Indonesia(67%), Philippines(54%) and Malaysia(49%).
Table 2: Selected Indicators Of India’s External Sector(% growth unless noted)Item/Year 91-92 92-93 93-94 94-95 95-96 96-97 97-98
1. Growth of Exports -1.1 3.3 20.2 18.4 20.3 4.5 2.62. Growth of Imports -24.5 15.4 10.0 34.3 21.6 10.1 5.83. Exports/Imports 86.7 77.6 84.8 74.8 74.0 70.2 83.34. Reserves to Imports 5.3 4.9 8.6 8.4 6.0 6.6 7.05. Short-term debt/Reserves 76.7 64.5 18.8 16.9 23.2 25.5 19.86. Debt service Ratio 30.2 27.5 25.6 26.2 24.3 21.4 18.37. Current account balance* -0.4 -1.8 -0.4 -1.1 -1.8 -1.0 -1.58. External Debt* 41.0 39.8 35.8 32.3 28.2 25.9 23.89. Debt service payments* 3.3 3.3 3.3 3.6 3.6 3.3 2.8* As % of GDPSource: Economic Survey
The level of international reserves, which was just $ 5.5 billion in 1991-92, increased to $29.4 billion 1997-98, providing about 7 months of imports cover. Nevertheless, exports continued to finance over 80% of India’ imports, thus making the trade account near self-sustaining. By the end of March 1998, the combined level of portfolio flows and short-term debt constituted about 75 per cent of the country’s foreign exchange reserves. Indeed, the entire volatile inflows were said to have been added to reserves that had given sufficient leeway for stabilizing speculations in the foreign exchange markets.
The net capital inflows into India increased from $4.7 billion in 1991-92 to $9.5 billion in 1996-97, which came down marginally to $8.2 billion in 1997-98, because of the uncertain domestic and international environment(mainly arising out of sanctions from the US). In the aggregate, there was already a shift towards non-debt creating flows, by way of foreign institutional investors (FII) into India’s debt and equity markets, euro equity issues by Indian companies, which had reached at $5.5 billion in 1997-98. Debt flows (to cover aid, commercial borrowings, NRI deposits, drawings from IMF) in contrast was actually coming down significantly, reaching about $3.0 billion in 1997-98.
Short-term debt was repeatedly considered as an important risk factor in the precipitation of foreign exchange crisis, especially when coupled with high or unsustainable current account deficits. The share of short-term debt in the total debt was just 6% in India at the time of crisis, which compares with 41% in Thailand, 25% in Indonesia, 28% in Malaysia and 19% in Philippines. By the end of March 1998, the combined level of portfolio flows and short-term debt constituted about 75 per cent of the country’s foreign exchange reserves. Indeed, the entire volatile inflows was said to have been added to reserves, that had given sufficient leeway for stabilizing speculations in the foreign exchange markets. It needs to be recognized that the short term flows also have provided the necessarily liquidity to an otherwise thin currency market in India.
The Asian crisis had therefore important policy lessons, and particularly in the context of external debt management and capital flows. It is by now abundantly clear that the crisis was not just because of the high current account deficit but much to do with the way the current account deficit was financed, the nature of capital flows(such as debt vs non-debt creating flows), and finally the way external capital being used for(such as financing investment as opposed to consumption or non tradable). The relative immunity to the crisis had also much to do with the structure of capital flows. Although the Indian rupee was fully convertible on the current account, convertibility on the capital account front was rather asymmetric, with somewhat more restrictions on capital outflows than on inflows. With controls on trade, foreign exchange transactions and short-term capital flows, it was therefore possible to insulate the Indian economy from external shocks.
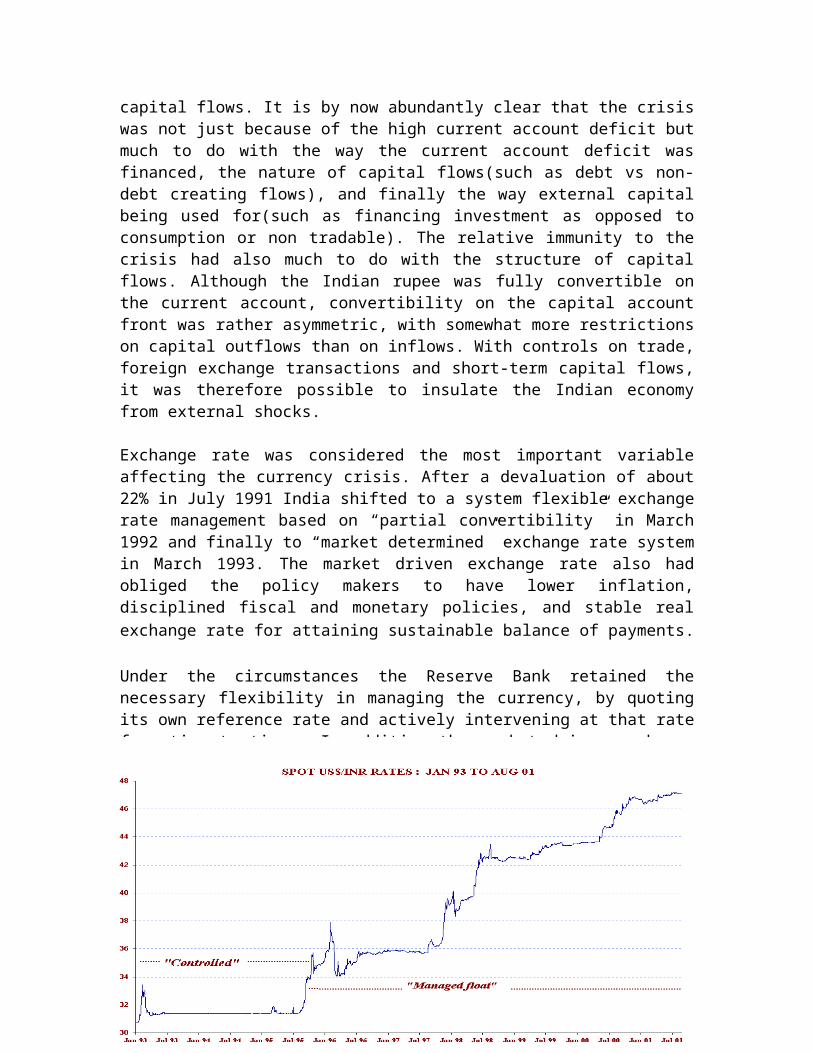
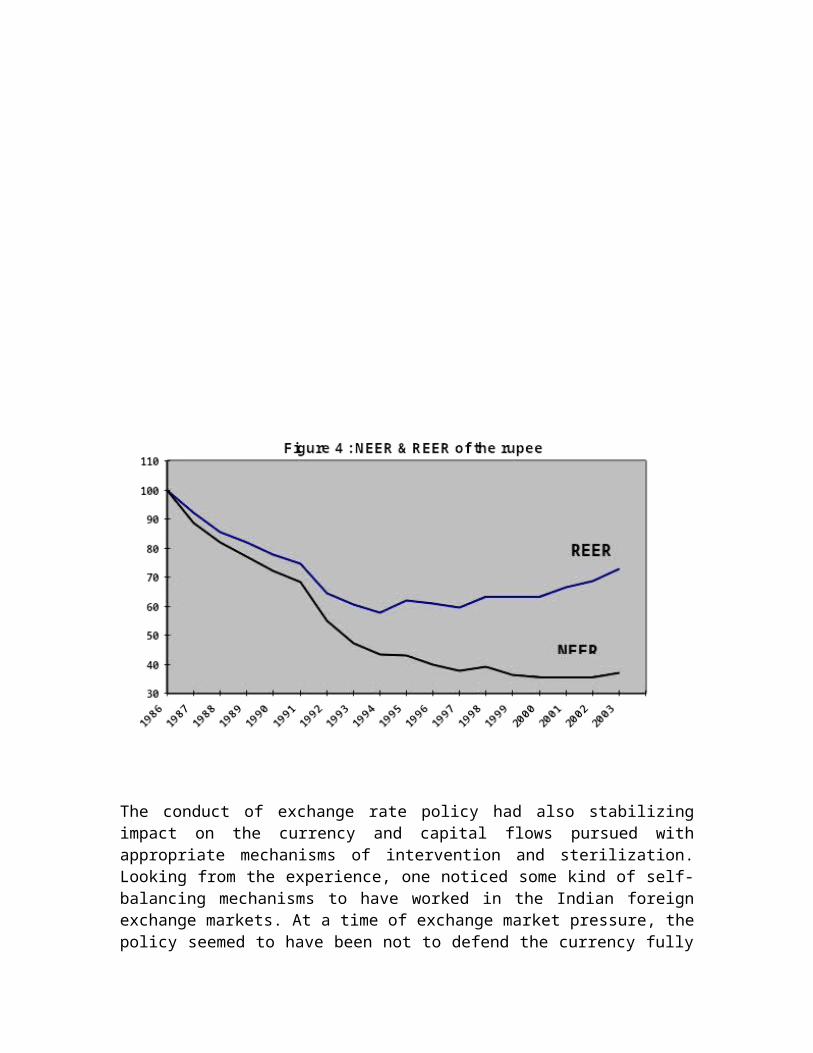
Exchange rate was considered the most important variable affecting the currency crisis. After a devaluation of about 22% in July 1991 India shifted to a system flexible exchange rate management based on “partial convertibility” in March 1992 and finally to “market determined” exchange rate system in March 1993. The market driven exchange rate also had obliged the policy makers to have lower inflation, disciplined fiscal and monetary policies, and stable real exchange rate for attaining sustainable balance of payments.
Under the circumstances the Reserve Bank retained the necessary flexibility in managing the currency, by quoting its own reference rate and actively intervening at that rate from time to time. In addition the market driven exchange rate also prevented excessive risk-taking by agents that would have occurred a fixed or a pegged exchange rate regime. In fact, the existence of exchange risks have discouraged some of the more speculative short-term capital flows in to India, thereby reducing the need for policy interventions.
The conduct of exchange rate policy had also stabilizing impact on the currency and
capital flows pursued with appropriate mechanisms of intervention and sterilization. Looking from the experience, one noticed some kind of self-balancing mechanisms to have worked in the Indian foreign exchange markets. At a time of exchange market pressure, the policy seemed to have been not to defend the currency fully by spending reserves and, thereby, offering the speculators an easy target. In addition the market driven exchange rate also prevented excessive risk-taking by agents that would have occurred a fixed or a pegged exchange rate regime. In fact, the existence of exchange risks have discouraged some of the more speculative short-term capital flows into India, thereby reducing the need for policy interventions.
Evolving Debt and Capital Flows Scenario Towards 2003
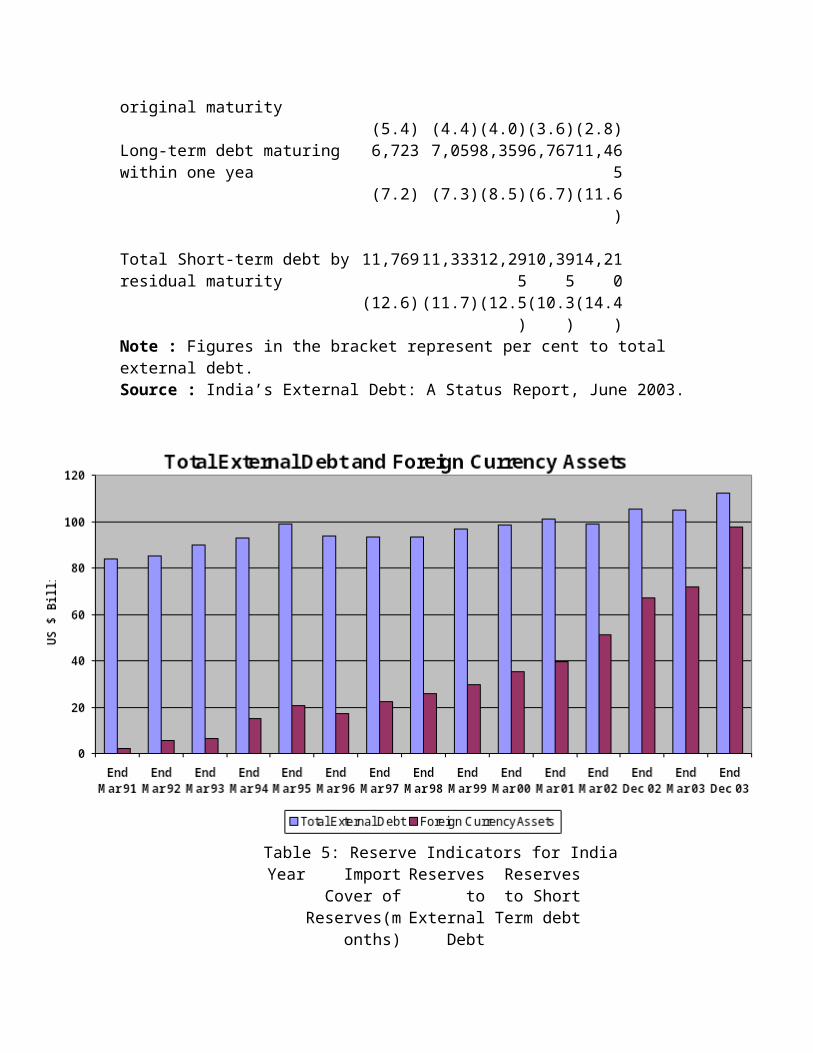
India’s external $ 112.1 billion stood at the end of December 2003, which increased from $ 83.8 billion in March 1991(Table 3). The growth rate during the period was at an annual average rate of 2 per cent per annum. Some of the increase has been due to valuation changes, resulting from the weakening of US dollar visà- vis other currencies (for example, $ 5.7 billion out of $6.8 billion increase in external debt during 2002-03 was due to such valuation changes).
In terms of the level of outstanding debt India ranked as eighth in 2002 from among the top fifteen debtor countries in the world, coming after Brazil, China, Russian Federation, Mexico, Argentina, Indonesia and Turkey. This implied a marked improvement in her debtor position since 1991 foreign exchange crisis, when her rank was third from among the top fifteen debtor countries, i.e. coming after the two most heavily indebted countries such as Brazil and Mexico.
Table 3: India's External Debt
En
d-M
arch
199
1(U
S $
mn
.)
Sh
are
in
to
tal
Ext
ern
al D
ebt
En
d-M
arch
199
6(U
S $
mn
.)
Sh
are
in
to
tal
Ext
ern
al D
ebt
En
d-M
arch
200
1(U
S $
mn
.)
Sh
are
in
to
tal
Ext
ern
al D
ebt
En
d-D
ec 2
003
(US
$ m
n.)
Sh
are
in
to
tal
Ext
ern
al D
ebt
Multilateral 20900 25 28616 31 31898 32 30558 27Bilateral 14168 17 19213 20 15323 16 17942 16IMF 2623 3 2374 3 0 0 0 0Export Credit 4301 5 5376 6 5368 5 4773 4Commercial Borrowing 10209 12 13873 15 23227 24 20582 18NRI Deposits* 10209 12 11011 12 17154 17 29867 27Rupee Debt 12847 15 8233 9 3042 3 2635 2Short-term Debt 8544 10 5034 5 2745 3 5773 5Total External debt 83801 100 93730 100 98757 100 112130 100Share of Concessional Debt to Total Debt 44.8 42.3 36.0 36.4

Source: India’s External Debt : A Status Report, Government of India, 2003.
An important aspect of India’s external debt has been its concessionality. As of December 2003 about 36. 4 per cent of the overall debt portfolio was characterized by concessional debt, contracted mainly from multilateral and bilateral institutions. Due to the concessional nature of indebtedness the present value concept becomes the appropriate measure, obtained by discounting the future debt service payments for individual loans by appropriate discount rates and aggregating such present values. The present values India’s external debt stood at $ 82.9 billion in the year 2002 which is 80 per cent of the total outstanding debt. According to Global development Finance, the present value of external debt in the year 2002 was 17 per cent of GNP, lowest within the top fifteen debtor countries except China (with 14 per cent in 2002).
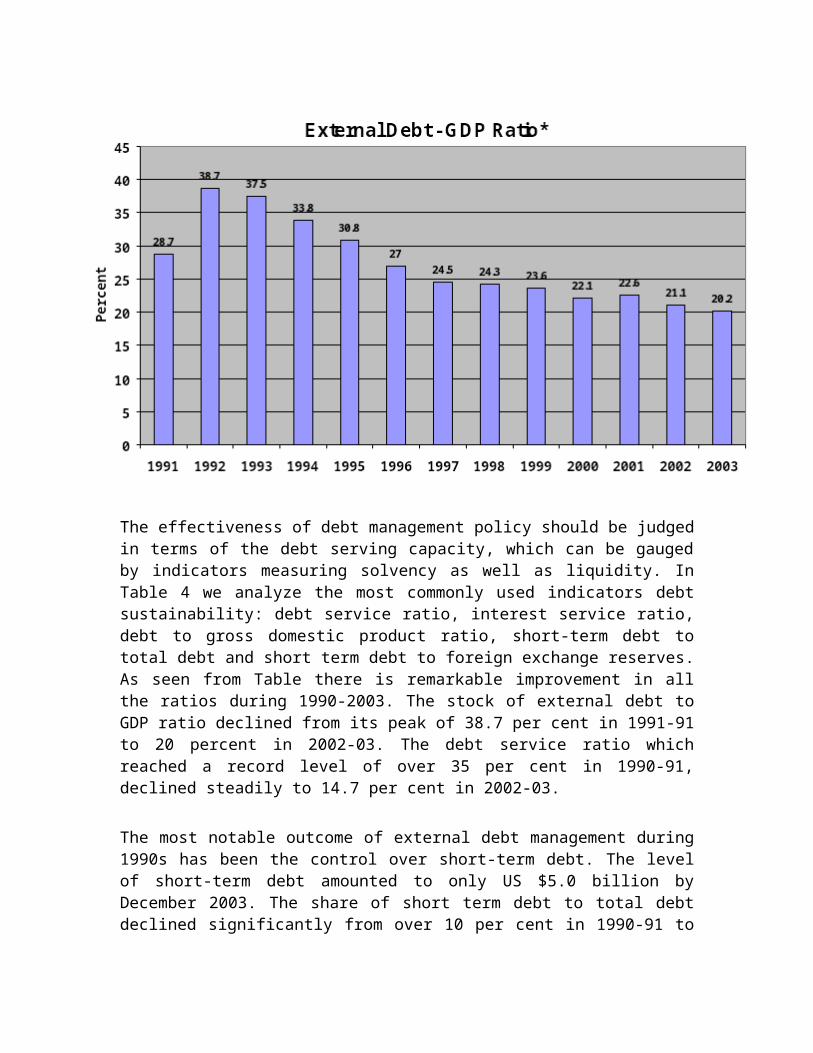
The effectiveness of debt management policy should be judged in terms of the debt serving capacity, which can be gauged by indicators measuring solvency as well as liquidity. In Table 4 we analyze the most commonly used indicators debt sustainability: debt service ratio, interest service ratio, debt to gross domestic product ratio, short-term debt to total debt and short term debt to foreign exchange reserves. As seen from Table there is remarkable improvement in all the ratios during 1990-2003. The stock of external debt to GDP ratio declined from its peak of 38.7 per cent in 1991-91 to 20 percent in 2002-03. The debt service ratio which reached a record level of over 35 per cent in 1990-91, declined steadily to 14.7 per cent in 2002-03.
The most notable outcome of external debt management during 1990s has been the control over short-term debt. The level of short-term debt amounted to only US $5.0 billion by December 2003. The share of short term debt to total debt declined significantly from over 10 per cent in 1990-91 to 4.4 per cent in 2002-03, which actually was the lowest for India from among the top 15 debtor countries.
The volume of short-term debt, which was 146 per cent of foreign exchange reserves in 1990-91, declined to just 6 per cent in 2002-03. By taking into account the residual/remaining maturity within the component of short-term debt, it still remains modest at $ 12. 7 billion or 11.7 per cent of total external debt by end-December 2003(Table 5).
Table 4: Indicators of Debt Sustainability for India
Year Solvency Indicators Liquidity IndicatorsDSR ISR DGDP STD/TD STD/FER
1990-91 35.3 15.5 28.7 10.2 146.51991-92 30.2 13.0 38.7 8.3 76.71992-93 27.5 12.5 37.5 7.0 64.51993-94 25.4 10.5 33.8 3.9 18.81994-95 26.2 9.7 30.8 4.3 16.91995-96 24.3 8.8 27.0 5.4 23.21996-97 21.2 7.3 24.5 7.2 25.51997-98 19.0 7.5 24.3 5.4 17.21998-99 17.8 7.8 23.6 4.4 13.21999-00 16.2 7.3 22.1 4.0 10.32000-01 17.2 6.6 22.4 3.6 8.62001-02 13.9 5.4 21.0 2.8 5.12002-03 14.7 4.1 20.3 4.4 6.1
DSR = Debt Service Ratio; ISR = Interest Service Ratio; DGDP = Debt to Gross Domestic Product Ratio; STD = Short-Term Debt; TD = Total Debt; FER = Foreign Exchange Reserves.Source : Reserve Bank of India
Table 5: India’s Short Term External Debt by Residual Maturity(US $ million)1998 1999 2000 2001 2002
Short-term debt by original maturity 5,046 4,274 3,936 3,628 2,745(5.4) (4.4) (4.0) (3.6) (2.8)
Long-term debt maturing within one yea
6,723 7,059 8,359 6,767 11,465
(7.2) (7.3) (8.5) (6.7) (11.6)
Total Short-term debt by residual maturity
11,769 11,333 12,295 10,395 14,210
(12.6) (11.7) (12.5) (10.3) (14.4)
Note : Figures in the bracket represent per cent to total external debt.Source : India’s External Debt: A Status Report, June 2003.
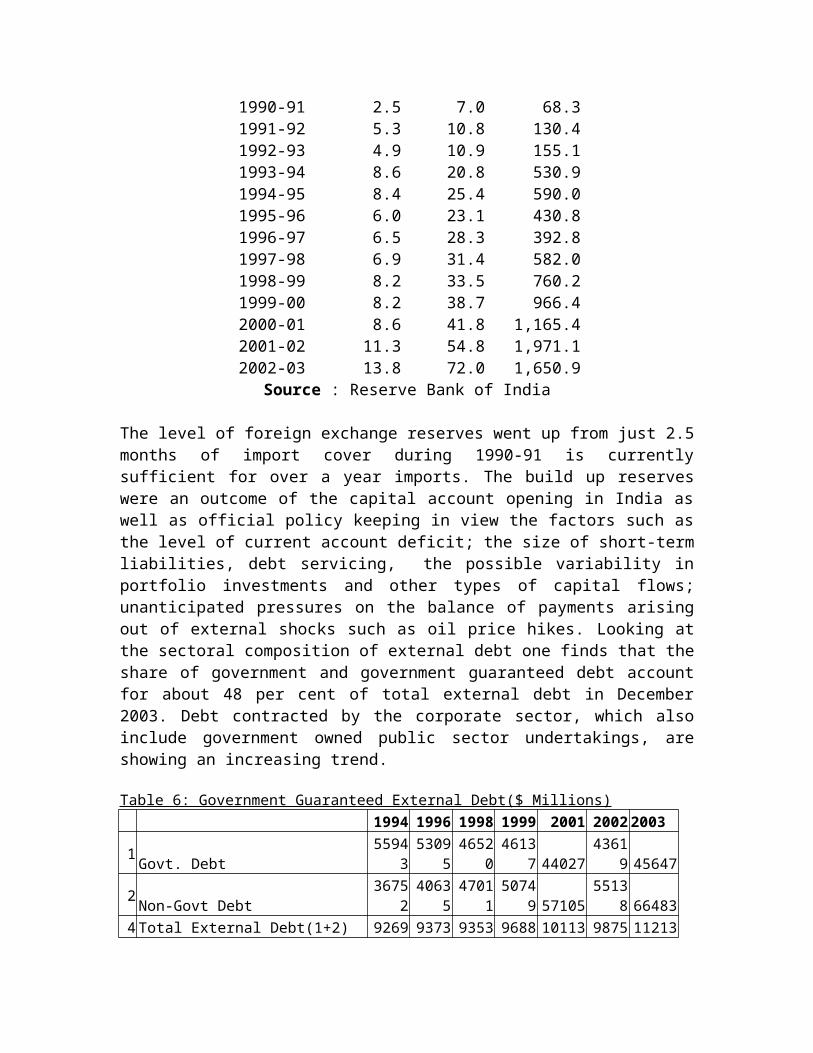
Table 5: Reserve Indicators for IndiaYear Import Cover
of Reserves(mont
hs)
Reserves to External
Debt
Reserves to Short Term
debt
1990-91 2.5 7.0 68.31991-92 5.3 10.8 130.41992-93 4.9 10.9 155.11993-94 8.6 20.8 530.91994-95 8.4 25.4 590.01995-96 6.0 23.1 430.81996-97 6.5 28.3 392.81997-98 6.9 31.4 582.01998-99 8.2 33.5 760.21999-00 8.2 38.7 966.42000-01 8.6 41.8 1,165.42001-02 11.3 54.8 1,971.12002-03 13.8 72.0 1,650.9
Source : Reserve Bank of India
The level of foreign exchange reserves went up from just 2.5 months of import cover during 1990-91 is currently sufficient for over a year imports. The build up reserves were an outcome of the capital account opening in India as well as official policy keeping in view the factors such as the level of current account deficit; the size of short-term liabilities, debt servicing, the possible variability in portfolio investments and other types of capital flows; unanticipated pressures on the balance of payments arising out of external shocks such as oil price hikes. Looking at the sectoral composition of external debt one finds that the share of government and government guaranteed debt account for about 48 per cent of total external debt in December 2003. Debt contracted by the corporate sector, which also include government owned public sector undertakings, are showing an increasing trend.
Table 6: Government Guaranteed External Debt($ Millions) 1994 1996 1998 1999 2001 2002 2003
1 Govt. Debt 55943 53095 46520 46137 44027 43619 456472 Non-Govt Debt 36752 40635 47011 50749 57105 55138 664834 Total External Debt(1+2) 92695 93730 93531 96886 101132 98757 112130
3of which with Govt.Guarantee*:(a+b+c) 10568 8545 7269 7174 6315 7022 6851
a. Financial Sector 1709 1098 2323 2496 1429 1761 1807 b. Public Sector 8533 7070 4605 4363 4639 5070 4985 c.Private Sector 326 377 341 315 247 191 59
5 Govt. Debt and Guaranteed Debt(1+3) 66511 61640 53789 53311 50342 50641 52498
6Percent of Govt.Debt and Guaranteed Debt to Total External Debt(5/4) 71.8 65.8 57.5 55.0 49.8 51.3 46.8
7Percent of Govt. Guaranteed Debt to Non-Govt Debt(3/2) 28.8 21.0 15.5 14.1 11.1 12.7 11.0
Comparing the external debt indicators of the top 15 debtor countries for the years 1990 and 2001 one observes very comfortable situation for India(Table 7). India’s debt had grown at 18 per cent as compared to over 300 percent rise in Korea, China, Malaysia and Russian Federation and over 200 per cent rise in Argentina, Brazil, Chile, Colombia, Indonesia and Turkey. Most of the solvency indicators for India has shown perceptible improvement during the decade and fare well from among the top fifteen indebted countries: level of external debt to exports of goods and services, external debt to GNP, debt service ratio and interest service ratio, etc all show considerable improvement during the decade. The adjustments in the debt indicators are far better for India as compared to all other debt countries, particularly in the post Asian crisis years.
Composition of Capital Flows The pattern of capital flows into India reveals a shift in its composition, from debt to non-debt creating flows with decreasing importance of short-term flows such as foreign currency deposits and short term debt, and an increasing share of foreign direct and portfolio investment flows(Table 8). The share of non-debt flows in total capital flows
have increased to 46.6 per cent during 2002-03. Portfolio investments flows from FIIs are allowed since 1993, the cumulative investment of which was $ 19 billion in 2003 with about 10 per cent of the total market capitalization of the Indian stock market.
Table 7: Comparison of External Debt Indicators of Top Fifteen Debtor Countries
Debt Outstanding
($ billion)
Concessional Debt to Total
Debt(%)
PPG to Total Debt External Debt to Current receipts
External debt to national Income
Debt Service Ratio Interest Service Ratio
Short Term Debt to Total Debt
Short Term Debt to Reserves
Country 1990 2001 1990 2001 1990 2001 1990 2001 1990 2001 1990 2001 1990 2001 1990 2001 1990 2001Argentina 62.2 136.7 0.8 1.0 75.3 75.1 373.7 373.7 46.0 52.5 37.0 66.3 16.3 29.9 16.8 14.6 228.1 137.4
Brazil 120.0 226.4 2.5 1.2 73.2 41.3 325.5 314.4 26.5 46.9 22.2 75.4 6.1 23.6 19.8 12.5 318.7 79.1Chile 19.2 38.4 1.9 0.9 54.2 14.5 179.6 162.6 67.3 60.0 25.9 28.1 16.7 8.3 17.6 6.7 55.7 17.8China 55.3 170.1 17.6 15.4 82.3 53.9 91.4 54.9 15.2 15.0 11.7 7.8 5.4 2.5 16.8 25.8 31.5 20.4
Colombia 17.2 36.7 5.7 2.4 85.2 59.3 181.0 210.6 45.1 46.2 40.9 36.1 17.9 15.3 8.4 10.2 31.1 36.8India 83.8 98.8 45.9 36.0 84.9 85.0 328.9 121.6 28.7 21.0 35.3 13.9 15.5 5.4 10.2 2.8 365.4 5.4
Indonesia 69.9 135.7 26.4 20.7 68.7 50.4 233.9 205.9 64.0 97.2 33.3 23.6 13.3 8.9 15.9 16.1 149.3 80.0Korea, Rep. 35.0 110.1 12.6 0.3 53.7 30.6 45.6 58.5 13.8 26.1 10.8 13.8 3.4 2.8 30.9 31.9 73.0 34.2
Malaysia 15.3 43.4 14.6 7.3 75.6 55.5 44.4 41.6 36.4 54.4 12.6 6.0 3.4 2.1 12.4 11.8 19.5 16.7Mexico 104.4 158.3 0.8 0.7 72.7 54.5 191.4 85.5 41.1 26.2 20.7 26.1 13.4 6.9 15.4 11.4 163.1 40.2
Philippines 30.6 52.4 20.0 21.3 78.6 65.3 230.1 125.1 69.4 69.2 27.0 18.6 13.3 6.7 14.5 11.6 479.1 45.0Poland 49.4 62.4 7.7 9.9 79.5 39.8 251.3 113.5 88.8 35.7 4.9 28.0 1.7 5.0 19.4 11.2 213.6 27.2
Russian Fed 59.3 152.6 0.0 0.0 80.1 66.8 .. 128.0 10.3 50.9 .. 14.5 .. 6.6 19.9 13.7 .. 64.4Thailand 28.1 67.4 15.2 12.6 44.4 39.2 89.8 84.2 33.3 60.4 16.9 25.1 6.5 4.1 29.6 19.6 62.6 40.9
Turkey 49.4 115.1 15.1 3.5 78.6 48.6 196.1 205.7 32.5 78.8 29.4 40.0 13.5 11.1 19.2 14.2 157.0 86.6
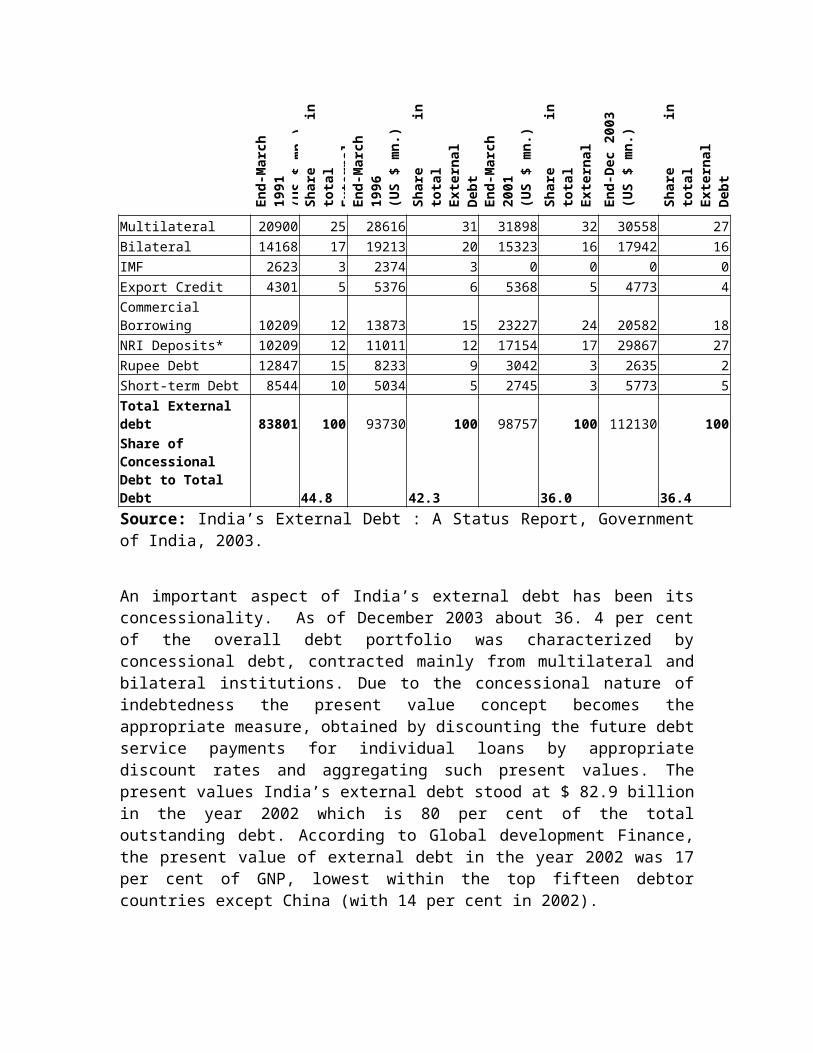
Table 9: Composition of Capital Inflows to IndiaTypes of Flows 1990-91 1995-
961997-
981999-00 2000-01 2001-
022002-
03Total Net Capital Inflows($ bn) 7.1 4.1 9.8 10.4 10.0 10.6 12.1
Per centNon-debt Creating Inflows 1.5 117.5 54.8 49.7 67.8 77.1 46.6 a) FDI 1.4 52.4 36.2 20.7 40.2 58.0 38.5 b) Portfolio Investment 0.1 65.1 18.6 29.0 27.6 19.1 8.1Debt Creating Inflows 83.3 57.7 52.4 23.1 59.4 9.2 -10.6 a) External Assistance 31.3 21.6 9.2 8.6 4.3 11.4 -20.0 b) ECB # 31.9 31.2 40.6 3.0 37.2 -14.9 -19.4 c) Short- term Credits 15.2 1.2 -1.0 3.6 1.0 -8.4 8.1 d) NRI Deposits 21.8 27.0 11.4 14.7 23.1 26.0 24.6 e) Rupee Debt Service -16.9 -23.3 -7.8 -6.8 -6.2 -4.9 -3.9Other Capital @ 15.2 -75.2 -7.2 27.2 -27.2 13.7 64.0Total (1 to 3) 100.0 100.0 100.0 100.0 100.0 100.0 100.0 Memo: Excluding b & c* 84.7 33.7 82.4 67.4 71.4 89.3 83.8# Refers to medium and long-term borrowingsSource : Reserve Bank of India.
Table 10: Portfolio Investment In India( US $ Million)GDRs/ADRs# FIIs* Offshore funds Total
1992-93 240 1 3 2441993-94 1,520 1,665 382 3,5671994-95 2,082 1,503 239 3,8241995-96 683 2,009 56 2,7481996-97 1,366 1,926 20 3,3121997-98 645 979 204 1,8281998-99 270 -390 59 -611999-00 768 2,135 123 3,0262000-01 831 1,847 82 2,7602001-02 477 1,505 39 2,0212002-03 600 377 2 979
# : Represents the amount raised by Indian corporates through Global Depository Receipts (GDRs) and American Depository Receipts (ADRs).
* : Represents fresh inflow of funds by Foreign Institutional Investors.Source : Reserve Bank of India
Special Purpose External Commercial Borrowing
The Indian Government had obtained external borrowing using special provisions three times since 1991: India Development Bonds (IDBs), 1991; Resurgent India Bonds (RIBs), 1998; and, India Millennium Deposits (IMDs), 2000. These borrowings were
used only to meet the unfavorable external circumstances, and served as alternative to sovereign borrowings. The maturity of these issuances were about five years, mostly subscribed by non-resident Indians, with redemption only at maturity and offering reasonable spread over comparable government bond yields. These instruments were considered as substitutes for foreign currency deposits, which extended the duration of the country’s debt profile.
Table 11: Special Borrowings by India since 1991Type of Borrowings Amount(US $
Million)Interest Rate(%)
5-Year Government Bond Yield
Spread(Col 3-4)
India Millennium Deposits, 2000 5,520Mobilization in US Dollar 5,182 8.50 5.57 2.93Mobilization in Pound Sterling 258 7.85 4.63 3.22Mobilization in Euro 80 6.85Resurgent India Bonds, 1998 4,230Mobilization in US Dollar 3,987 7.75 5.26 2.49Mobilization in Pound Sterling 180 8.00 5.45 2.55Mobilization in Euro 63 6.25India Development Bonds, 1991 1,627Mobilization in US Dollar 1,307 9.50 7.86 1.64Mobilization in Pound Sterling 320 13.25 9.92 3.33Source: India’s External Debt: A Status Report, Government of India, October 2001.
Foreign Currency Deposits
Many countries allow foreign currency deposits from expatriates as a source for balance of payments financing. Such schemes were introduced in India in 1970 allowing non-Resident Indians/Overseas Corporate Bodies to place deposits denominated in foreign currency as well as local currency with the Indian banks, with interest rate fixed and exchange rate guaranteed by the Reserve Bank of India. The two oil shocks of 1970s brought substantial amount of US dollar deposits from the gulf countries. By the end of March 1990, the total NRI deposits were to the extent of $ 12 billion. However these short-term deposits have proved to be very volatile, responding to macroeconomic instability as well as political risks. The external payments difficulties of 1990-91 demonstrated the vulnerability associated with these deposits.
Considering the huge fiscal costs of exchange guarantee and higher interest rates offered on such deposits as compared to international rates, the policy later years withdrew the exchange rate guarantee and reduced considerably the interest rate spread. A scheme called Non-resident Non-repatriable Rupee Deposit (NR(NR)RD) was also introduced in order to avoid the reversibility character of the deposits, but was later withdrawn in April 2002.
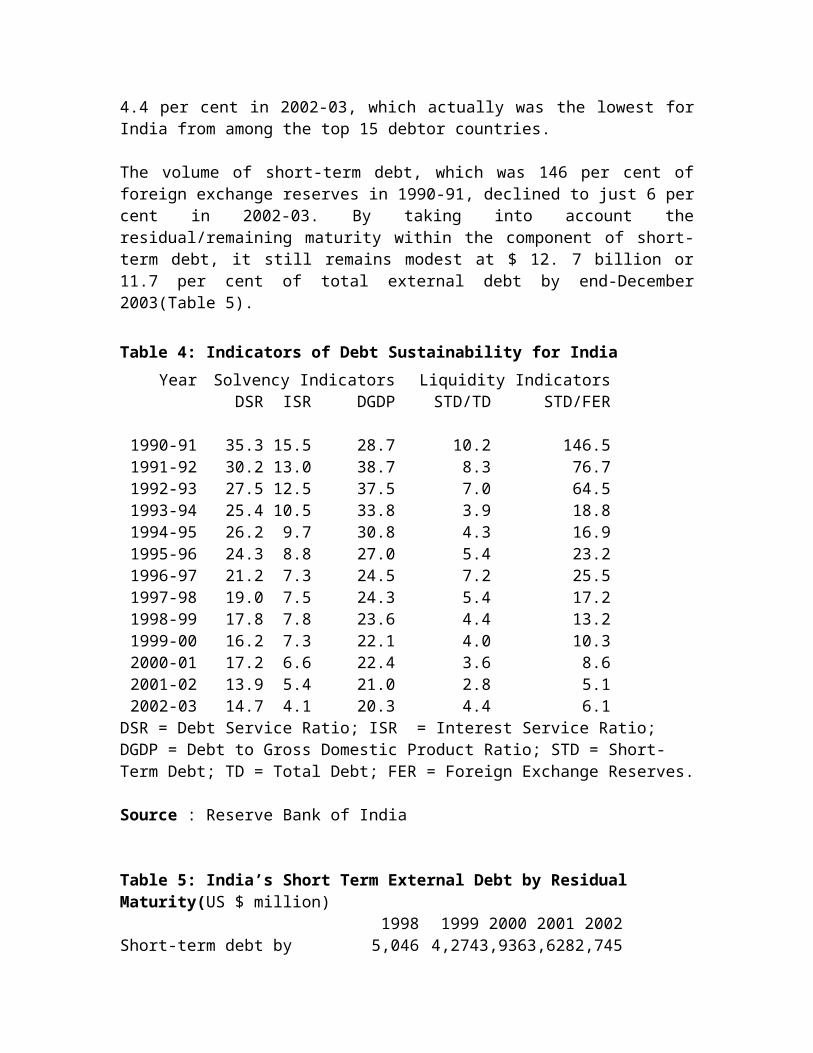
Table 12: Outstanding Balances NRI Deposit Schemes (US $ million)End-
MarchNR(E)RA FCNR(A)
*FCNR(B) NR(NR)RD
**FC(O)N Total
1975 40 – – – – 401980 856 188 – – – 1,0441985 2,304 770 – – – 3,0741990 3,777 8,638 – – – 12,4151995 4,556 7,051 3,063 2,486 10 17,1661996 3,916 4,255 5,720 3,542 13 17,4461997 4,983 2,306 7,496 5,604 4 20,3931998 5,637 1 8,467 6,262 2 20,3691999 6,045 – 7,835 6,618 – 20,4982000 6,758 – 8,172 6,754 – 21,6842001 7,147 – 9,076 6,849 – 23,0722002 8,449 – 9,673 7,052 – 25,1742003 14,923 – 10,199 3,407 – 28,529* :Withdrawn effective August 1994.** :Withdrawn effective April 2002.Source : Reserve Bank of India.
Policy Perspectives On External Debt Management
The debt management policy following the balance of payments crisis evolved into a multi-pronged strategy. This evolving policy regime was based broadly on the recommendations of the Rangarajan Committee (1993) which implied (i) the continuation of an annual cap, minimum maturity restrictions and prioritizing the use of ECBs; (ii) LIBOR based ceilings on interest rates and minimum maturity requirements on NRI deposits to discourage the volatile component of such deposits; (iii) containment of short-term debt together with controls to prevent its undue increase in future; (iv) retiring/ restructuring/ refinancing of more expensive external debt; (v) measures to encourage non-debt creating financial flows such as foreign direct and portfolio investments; (vi) incentives and schemes to promote exports and other current receipts; and (vii) conscious build-up of foreign exchange reserves to provide effective insurance against external sector uncertainties.
These policies pursued with varying intensity yielded good results in making a turnaround in India’s external debt scenario, which is reflected in the sustained improvement in her key debt indicators. A transparent policy on external commercial borrowings with the stated objectives of prudent debt management seems to have emerged in recent years. India began considering the need for a Public Debt Management Office in 2000. Attention was focused on building up of the institutional capability for debt analysis for effective public debt management and an appropriate institutional structure for it in the public sector.
The institutional arrangement of debt reporting is shared between the Ministry of Finance (MOF) and the Reserve Bank of India (RBI), with the External Debt Management Unit (EDMU) in the Ministry of Finance serving as the apex unit for monitoring, computerization and management related decisions. The majority of the country’s total external debt data relating to external assistance and external commercial borrowings have been computerized on the Commonwealth Secretariat Debt Recording and Management System(CS : DRMS).
The ECB guidelines issued by the Ministry of Finance from time to time put a cap on the overall amounts that can be borrowed in a financial year, allowing a longer maturity for larger borrowing, caps on borrowing cost and restrictions on end-use(See the Appendix). These restrictions have proved to be helpful in avoiding debt-servicing difficulties. The annual review of a cap on ECB is fixed considering the requirement of different sectors and the medium term balance of payments scenario. ECB approvals are monitored regularly to ensure that the total debt is maintained within the limits of debt management.
The ECB guidelines in a way impose restrictions on the leveraging capabilities of Indian companies in terms of the amounts and the periods for which the borrowings can be made. Corporate access external commercial borrowings for expansion of existing capacities as well as for fresh investment. At the moment different rules apply for different forms of financing which therefore restricts the choice of financing available. In this way, to a large extent, funding depends upon the government rules rather than the characteristics of the projects. There are no sovereign guarantee; corporate today access
oversees capital markets based on the strength of their balance-sheet and their brand. The government has relaxed recently to prepay external debt, thus the possibilities for lowering the interest costs due to falling interest rate environment.
The concern is gradually shifting towards managing corporate borrowing, as the volume of external debt on the government account has been decreasing. Corporate can also undertake liability management for hedging the interest and exchange rate risks on their underlying foreign currency exposures without prior approval of the Ministry of Finance or the Reserve Bank of India.
The policy gives greater priority for projects in the infrastructure, core and export sectors. The regulatory structure has been evolving to influence the activities that would be financed through external borrowings, thereby restricting the funds from recycling into financial markets as well as real estate. To lengthen the maturity profile of external debt, commercial borrowings of eight years and above are kept outside the ceiling.
Keeping in view the volatility the short term capital flows are monitored and restricted mostly for trade related purposes. As regards the foreign currency and local currency denominated deposits, from the non-resident Indians, there has been significant changes in terms of the removal of exchange guarantees provided by banks, gradual shift in policy in favor of local currency denominated deposits, promotion of non-repatriable deposits, and aligning interest rates to international rates such as LIBOR.
The Future
Given the sustainable level of current account and foreign exchange reserves in India, it is very unlikely that the foreign exchange situation becomes critical again. It also seems unlikely that international investors will substantially reduce their exposure, given the strong fundamentals of the Indian economy. External debt management will continue to be an area of high priority in the context of overall management of the Indian economy. To consolidate the gains already made, the focus of external debt management policy should stress on high growth rate of exports, keeping the maturity structure as well as the total amount of commercial debt under manageable limits, tight control on short-term debt, and encouraging non-debt creating foreign investments flows. These combined with the policy efforts aimed at achieving a commensurate growth in current receipts to service the existing debt will help retain the sustainability status in the long run.
AppendixExternal Commercial Borrowings Policy Guidelines
External Commercial Borrowings (ECB) refer to commercial loans availed from non-resident lenders with minimum average maturity of 3 years. Borrowers can raise ECB from internationally recognized sources such as (i) international banks, international capital markets, multilateral financial institutions (such as IFC, ADB) (ii) export credit agencies and (iii) suppliers of equipment, foreign collaborators and foreign equity holders.
A. Access Mechanism Under the present framework, ECB can be raised through two routes viz. (i) Automatic Route and (ii) Approval Route.
(i) Automatic Route (ii) Eligible Borrowers : Corporates registered under the Companies Act except financial intermediaries (such
as banks, financial institutions’ (Fis), housing finance companies and NBFCs) are eligible.Cases considered : (i) Up to USD 20 million or equivalent with minimum average maturity of 3 years.(ii) Above USD 20 million and up to USD 500 million or equivalent with minimum maturity of 5 years.Eligible Borrowers : a) Financial Institution dealing exclusively with infrastructure or export finance will be considered on a case by case
basis.b) Banks and Financial Institutions which have participated in the textile or steel sector restructuring packages
approved by the Government will also be permitted to the extent of their investment in the package and assessment by RBI based on prudential norms.
Cases considered : cases falling outside the purview of the automatic route limits and maturity period mentioned earlier. Such cases falling under the Approval Route will be considered by an Empowered Committee of the RBI.
B. General terms and conditions : All-in-cost ceilingsThe present all-in-cost ceilings for ECB are as follows :Maturity All-in-cots ceiling* over 6 month LIBORi) 3 years and up to 5 years 200 basis pointsii) More than 5 years 350 basis points* All-in-cost ceiling includes rate of interest, other fees and expenses in foreign currency except commitment fee, prepayment fee, and fees payable in Indian rupees. Also, payment of withholding tax is excluded for calculating the all-in-cost.End-use (i) ECB can be raised only for investment (such as import of capital goods, new projects,
modernization/expansion of existing production units) in the real sector-industrial sector including small and medium enterprises and infrastructure sector in India.
(ii) Utilisation of ECB proceeds is permitted in the first stage acquisition of shares in the disinvestments process and in the mandatory second stage offer to the public under the disinvestments programme of PSU shares.
(iii) Utilisation of ECB proceeds is not permitted for on-lending or investment in capital market by corporates.
(iv) Utilisation of ECB proceeds is not permitted in real estate . ‘Real Estate’ excludes development of integrated townships as per provisions of Press Note No. 3 (2002 series) dated 4.1.2002 of the D/O Industrial Policy & Promotion.
(v) End-uses of ECB for working capital, general corporate purpose and repayment of existing rupee loans are not permitted.
C. Payments Prepayment of ECB up to USD 100 million is permitted without prior approval of RBI, subject to compliance with stipulated minimum average maturity period as applicable for the loan.(iii) Refinance of existing ECBRefinancing of existing ECB by raising fresh loans at lower cost is permitted, subject to the condition that the outstanding maturity of the original loan is maintained.
E. Foreign Currency Convertible Bonds (FCCB)The liberalization norms applicable to ECB are also extended to FCCB in all respects.
Source: India’s External Debt : A Status Report, Government of India, 2003.