chapter iv results and discussions 4.1...
TRANSCRIPT

CHAPTER IV
RESULTS AND DISCUSSIONS
4.1 OVERVIEW
This chapter deals with the analysis of data collected from the samples under study.
This research was to find out the effect of varied packages of yogic practices on selected
motor ability physiological hematological and bio-chemical variables among college men
students. To facilitate the study 90 subjects were randomly selected from Rajapalayam
Raju’s college, Rajapalayam, for the purpose of this study. Their age was between 18 – 25
years. They were assigned into three groups, group one served as Swami Satyananda
Saraswati Yogic Practices group, group two served as Swami Vishnudevananda Yogic
Practices group and third one as control group.
The study was formulated as a true random group design, consisting of a pretest and
post test. The subjects (n=90) were randomly assigned to the equal groups of 30 subjects
each. The groups were assigned as experimental group I, experimental group II and control
group. Pretest were conducted for all the subjects on selected motor ability such as
flexibility, muscular strength and cardio vascular endurance and physiological variables
such as resting pulse rate, vital capacity, and Vo2 Max and hematological variables such as
RBC Count (Red Blood Cell Count), WBC Count (White Blood Cell Count) and platelets
count and bio-chemical variables such as blood sugar, high density lipoprotein (HDL) and
low density lipoprotein (LDL). The Experimental groups participated in their respective
Swami Satyananda Saraswati Yogic Practice group and Swami Vishnudevananda Yogic
Practice group for a period of 12 weeks.
The post tests were conducted on the above said dependent variables after a period
of 12weeks in the respective treatments. The differences between the initial and final scores
in selected motor ability, physiological, hematological and bio-chemical variables were
subject to statistical treatment using analysis of covariance (ANCOVA) to find out whether
the mean differences were significant or not.
173
4.2 TEST OF SIGNIFICANCE
As Clarke and Clarke, (1972) say, “These data must be analyzed in an appropriate
to the research design. Such analysis can only be appropriate to the research design. Such
analysis can only be accomplished through the application of pertinent statistics.
This is the vital portion of thesis achieving the conclusion by examining the
hypothesis. The procedure of testing the hypothesis was either by accepting the hypotheses
or rejection the same in accordance with the results obtained in relation to the level of
confidents.
The test was usually called the test of significance since we test whether the
difference between three groups or with in many groups scores were significant or not. In
the study, if they obtained F value were greater than the table value, the null hypothesis
were rejected to the effect that there existed significant difference among the means of the
groups compared and if they obtained F value were lesser than the table value. Then the null
hypotheses were accepted to the effect that there existed no significant differences among
the means of the groups under study.
4.2.1 LEVEL OF SIGNIFICANCE
The purpose of this study was to find out the effect of varied packages of yogic
practices on selected motor ability, physiological, hematological and bio-chemical variables
among college men students. The selected variables were, motor ability such as flexibility,
muscular strength and cardio vascular endurance and physiological variables such as resting
pulse rate, vital capacity, and VO2 Max and hematological variables such as RBC Count
(Red Blood Cell Count), WBC Count (White Blood Cell Count), and platelets count, and
bio-chemical variables such as blood sugar, high density lipoprotein (HDL) and low density
lipoprotein (LDL) the analysis of covariance (ANCOVA)was used to find out the significant
differences if any different between the groups on selected criterion variables separately. In
all the cases , 0.05 level of confidence was fixed to test of significance, which was
considered as appropriate in this study, if they obtained F value were greater than the table
value, the null hypotheses were rejected to the effect that there existed significant difference

174
among the means of the groups compared and if they obtained F value were lesser than the
table value at 0.05 level the null hypothesis were accepted to the effect that there existed to
significant differences among the means of the groups under study.
4.3 COMPUTATION OF ANALYSIS OF COVARIANCE AND SCHEFFE’S POST
HOC TEST
4.3.1 RESULTS OF MOTOR ABILITY VARIABLE FLEXIBILITY
The statistical analysis compare the initial and final means of flexibility assessed
through sit and reach test due to Swami Satyananda Saraswati Yogic Practice group and
Swami Vishnudevananda Yogic Practice group on college men Students presented in
Table V.
TABLE V
COMPUTATION OF ANALYSIS OF COVARIANCE OF FLEXIBILITY
(Total scores in centimeters)
Test EXP.GP 1 EXP.GP 2 Control GP SOV SS df MS F
B 4.02 2 2.011 Pre test
Mean 24.3 24.80 24.67
W 133.77 87 1.54 1.31
B 225.87 2 112.93 Post test
Mean 29.63 28.90 25.97
W 456.63 87 5.25 21.52*
B 253.29 2 126.64 Adjusted
Post test
mean
29.91 28.69 25.89 W 329.580 86 3.83
33.06*
*Significant at 0.05 level of confidence.
(The table value required for 0.05 level of significance with F 2, 87 and 2, 86 are 3.103 and
3.103 respectively)

175
As shown in table V, the obtained F value on the scores of the pretest means 1.31
was lesser than the required F value of 3.103, which proved that the random assignment of
the subject were successful and their scores in flexibility before the training were equal and
there was no significant differences. The analysis of posttest means proved that the obtained
F value 21.52 was greater than the required F value of 3.103 to be significance at 0.05
levels. Taking into consideration of the pretest and posttest means the adjusted posttest
means were done and the obtained F value of 33.06 was greater than the required F value of
3.103 hence it was accepted that the Swami Satyananda Saraswati Yogic Practice group and
Swami Vishnudevananda Yogic Practice group significantly increased the flexibility.
Since the significant differences were recorded, the results were subjected to post
hoc analysis using scheffe’s confidence Interval test. The results are presented in table VI.
TABLE VI
SCHEFFE’S CONFIDENCE INTERVAL TEST SCORES ON FLEXIBILITY
MEANS
EXP.GP 1 EXP.GP 2 CONTROL GP
MEAN
DIFFERENCE
REQUIRED CI
29.91 28.69 - 1.22 1.26
29.91 - 25.89 4.02* 1.26
- 28.69 25.89 2.80* 1.26
*significant at .05 level of confidence
Table VI shows that the adjusted post-test mean difference in flexibility between
EXP.GP 1 and CG and between EXP.GP 2 and CG are 4.02 and 2.8, respectively which
were statistically significant at 0.05 level of confidence. The adjusted post-test mean
difference in flexibility between EXP GP 1 and Exp GP 2 was 1.22 which was less than the
confidence interval value at 0.05 level.
The ordered adjusted means are presented through bar diagram on ordered adjust
means of the result of this study in Figure I.

176
4.3.1.1 DISCUSSION ON THE FINDINGS OF FLEXIBILITY
The result of the study on flexibility indicates that all the experimental groups
namely EXP GP 1 and EXP GP 2 brought about significant improvement after the training.
The analysis of the data indicates that there was no significant difference on flexibility
between EXP GP 1 and EXP GP 2. Based on the mean value, the Swami Satyananda
Saraswati Yogic Practice group was found to be better in increasing the level of flexibility
than the Swami Vishnudevananda Yogic Practice group. Systematic yogic practices training
improve the flexibility. The result of this study on flexibility has in line with the study
conducted by Rajakumar, (2010).
4.3.2 RESULTS OF MOTOR ABILITY VARIABLE MUSCULAR STRENGTH
The statistical analysis comparing the initial and final means of muscular strength
assessed through push-ups test due to Swami Satyananda Saraswati Yogic Practice group,
and Swami Vishnudevananda Yogic Practice group on college men Students presented in
Table VII.
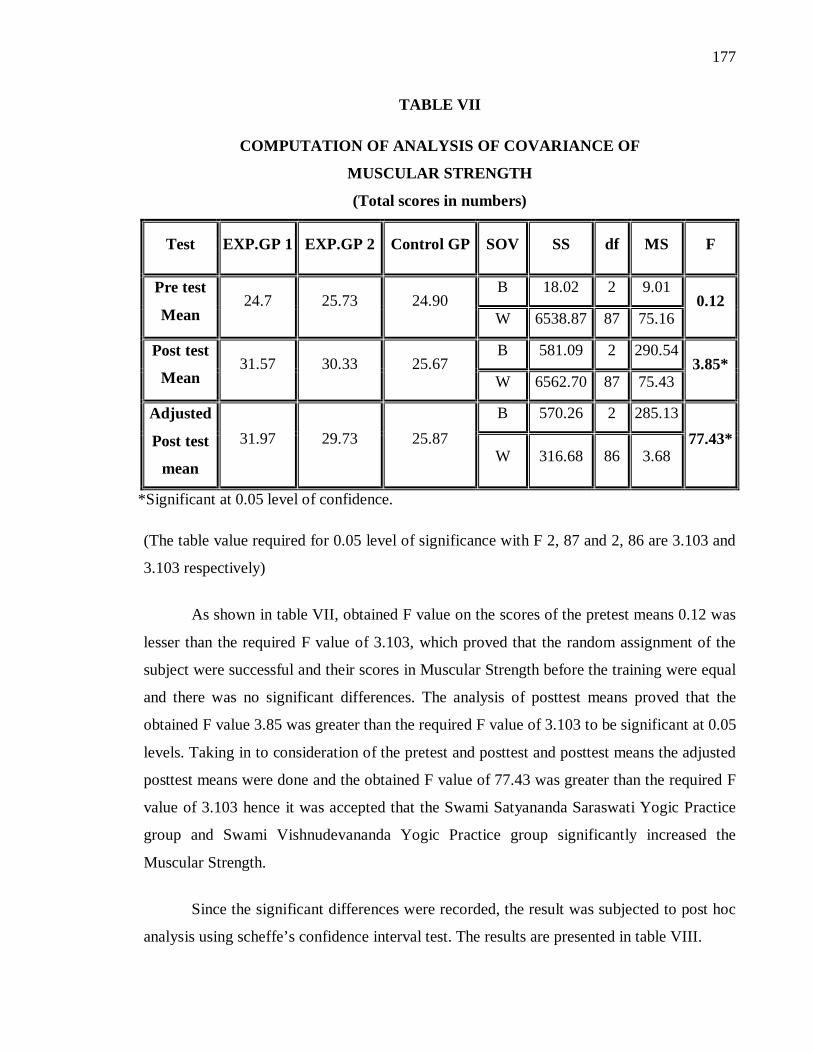
177
TABLE VII
COMPUTATION OF ANALYSIS OF COVARIANCE OF
MUSCULAR STRENGTH
(Total scores in numbers)
Test EXP.GP 1 EXP.GP 2 Control GP SOV SS df MS F
B 18.02 2 9.01 Pre test
Mean 24.7 25.73 24.90
W 6538.87 87 75.16 0.12
B 581.09 2 290.54 Post test
Mean 31.57 30.33 25.67
W 6562.70 87 75.43 3.85*
B 570.26 2 285.13 Adjusted
Post test
mean
31.97 29.73 25.87 W 316.68 86 3.68
77.43*
*Significant at 0.05 level of confidence.
(The table value required for 0.05 level of significance with F 2, 87 and 2, 86 are 3.103 and
3.103 respectively)
As shown in table VII, obtained F value on the scores of the pretest means 0.12 was
lesser than the required F value of 3.103, which proved that the random assignment of the
subject were successful and their scores in Muscular Strength before the training were equal
and there was no significant differences. The analysis of posttest means proved that the
obtained F value 3.85 was greater than the required F value of 3.103 to be significant at 0.05
levels. Taking in to consideration of the pretest and posttest and posttest means the adjusted
posttest means were done and the obtained F value of 77.43 was greater than the required F
value of 3.103 hence it was accepted that the Swami Satyananda Saraswati Yogic Practice
group and Swami Vishnudevananda Yogic Practice group significantly increased the
Muscular Strength.
Since the significant differences were recorded, the result was subjected to post hoc
analysis using scheffe’s confidence interval test. The results are presented in table VIII.
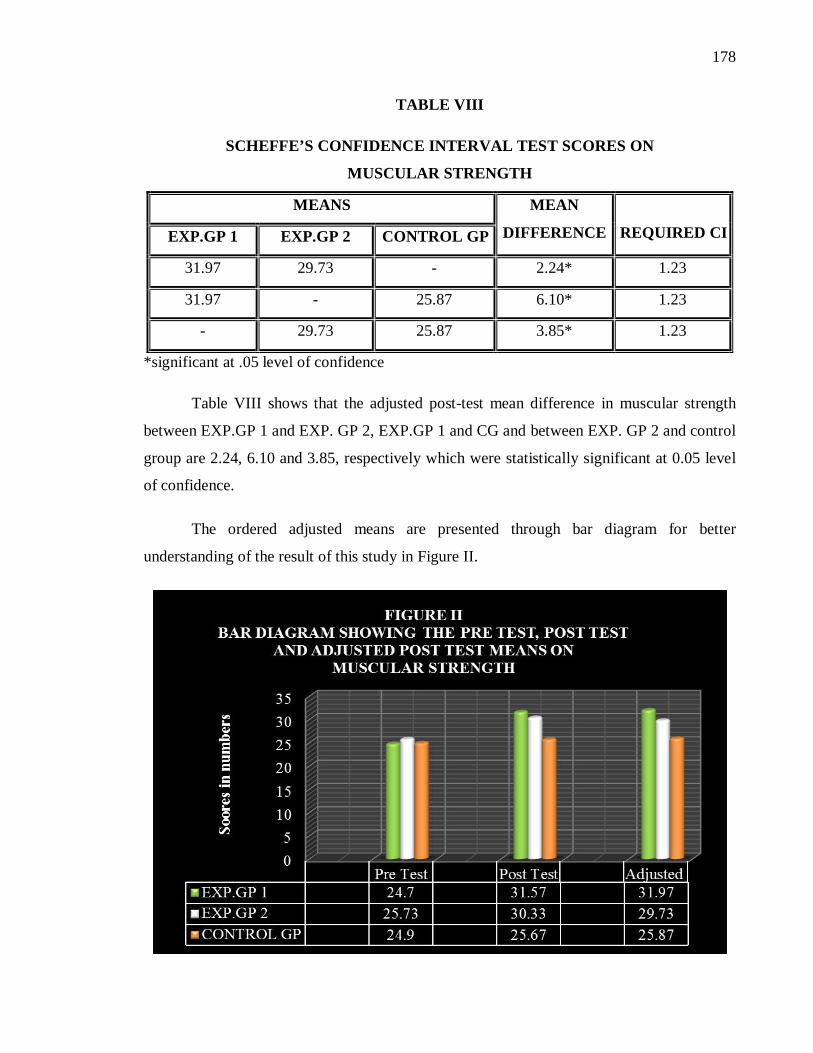
178
TABLE VIII
SCHEFFE’S CONFIDENCE INTERVAL TEST SCORES ON
MUSCULAR STRENGTH
MEANS
EXP.GP 1 EXP.GP 2 CONTROL GP
MEAN
DIFFERENCE
REQUIRED CI
31.97 29.73 - 2.24* 1.23
31.97 - 25.87 6.10* 1.23
- 29.73 25.87 3.85* 1.23
*significant at .05 level of confidence
Table VIII shows that the adjusted post-test mean difference in muscular strength
between EXP.GP 1 and EXP. GP 2, EXP.GP 1 and CG and between EXP. GP 2 and control
group are 2.24, 6.10 and 3.85, respectively which were statistically significant at 0.05 level
of confidence.
The ordered adjusted means are presented through bar diagram for better
understanding of the result of this study in Figure II.
179
4.3.2.1 DISCUSSION ON THE FINDINGS OF MUSCULAR STRENGTH
The result of the study on muscular strength indicates that all the experimental
groups namely EXP GP 1 and EXP GP 2 brought about significant improvement after the
training. The results of the study indicate that there was a significant difference on muscular
strength between the EXP GP 1 and EXP GP 2. However, Swami Satyananda Saraswati
Yogic Practice group was found to be better in improving on muscular strength than the
Swami Vishnudevananda Yogic Practice group. The result of this study on muscular
strength has in line with the study conducted by Chen, et.al. (2009).
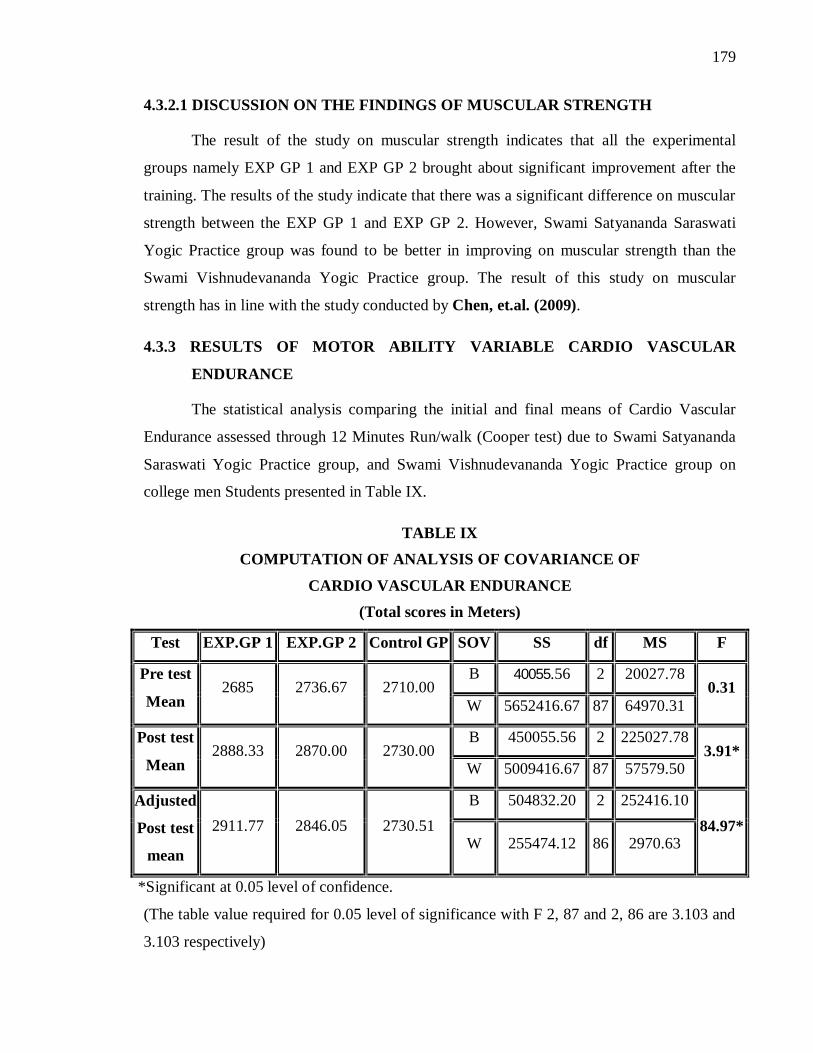
4.3.3 RESULTS OF MOTOR ABILITY VARIABLE CARDIO VASCULAR
ENDURANCE
The statistical analysis comparing the initial and final means of Cardio Vascular
Endurance assessed through 12 Minutes Run/walk (Cooper test) due to Swami Satyananda
Saraswati Yogic Practice group, and Swami Vishnudevananda Yogic Practice group on
college men Students presented in Table IX.
TABLE IX COMPUTATION OF ANALYSIS OF COVARIANCE OF
CARDIO VASCULAR ENDURANCE (Total scores in Meters)
Test EXP.GP 1 EXP.GP 2 Control GP SOV SS df MS F
B 40055.56 2 20027.78 Pre test
Mean 2685 2736.67 2710.00
W 5652416.67 87 64970.31 0.31
B 450055.56 2 225027.78 Post test
Mean 2888.33 2870.00 2730.00
W 5009416.67 87 57579.50 3.91*
B 504832.20 2 252416.10 Adjusted
Post test
mean
2911.77 2846.05 2730.51 W 255474.12 86 2970.63
84.97*
*Significant at 0.05 level of confidence.
(The table value required for 0.05 level of significance with F 2, 87 and 2, 86 are 3.103 and
3.103 respectively)

180
As shown in table IX the obtained F value on the scores of the pretest means 0.31
was lesser then the required F value of 3.103, which proved that the random assignment of
the subject were successful and their scores in Cardio Vascular Endurance before the
training were equal and there was no significant differences. The analysis of posttest means
proved that the obtained F value 3.91 was greater than the required F value of 3.103 to be
significant at 0.05 levels. Taking in to consideration of the pretest and posttest means the
adjusted posttest means were done and the obtained F value of 84.97 was greater than the
required F value of 3.103 hence it was accepted that the Swami Satyananda Saraswati Yogic
Practice group and Swami Vishnudevananda Yogic Practice group significantly increased
the Cardio Vascular Endurance.
Since the significant differences were recorded, the result was subjected to post hoc
analysis using scheffe’s confidence interval test. The results are presented in table X.
TABLE X
SCHEFFE’S CONFIDENCE INTERVAL TEST SCORES ON
CARDIO VASCULAR ENDURANCE
MEANS
EXP.GP 1 EXP.GP 2 CONTROL GP
MEAN
DIFFERENCE
REQUIRED CI
2911.77 2846.05 - 65.72* 35.04
2911.77 - 2730.51 181.26* 35.04
- 2846.05 2730.51 115.54* 35.04
*significant at .05 level of confidence
Table X shows that the adjusted post-test mean difference in cardio vascular
endurance between EXP.GP 1 and EXP. GP 2, EXP.GP 1 and CG and between EXP. GP 2
and control group are 65.72, 181.26 and 115.54, respectively which were statistically
significant at 0.05 level of confidence.
The ordered adjusted means are presented through bar diagram for better
understanding of the result of this study in Figure III.
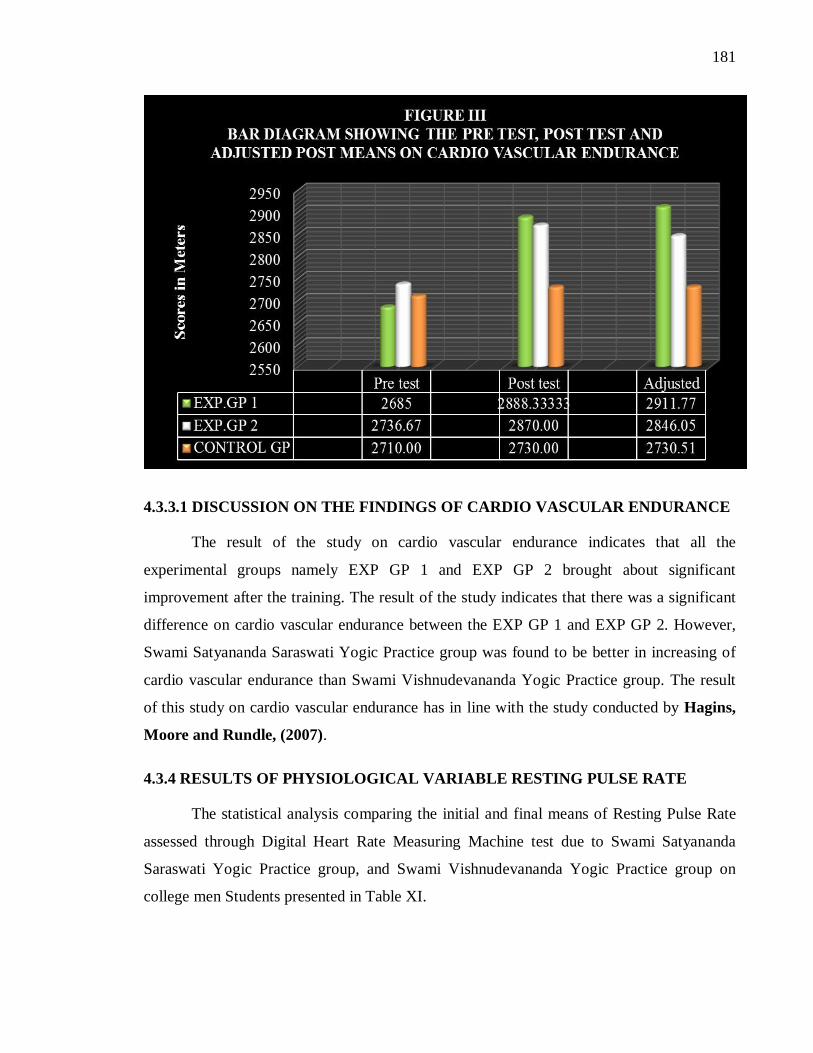
181
4.3.3.1 DISCUSSION ON THE FINDINGS OF CARDIO VASCULAR ENDURANCE
The result of the study on cardio vascular endurance indicates that all the
experimental groups namely EXP GP 1 and EXP GP 2 brought about significant
improvement after the training. The result of the study indicates that there was a significant
difference on cardio vascular endurance between the EXP GP 1 and EXP GP 2. However,
Swami Satyananda Saraswati Yogic Practice group was found to be better in increasing of
cardio vascular endurance than Swami Vishnudevananda Yogic Practice group. The result
of this study on cardio vascular endurance has in line with the study conducted by Hagins,
Moore and Rundle, (2007).
4.3.4 RESULTS OF PHYSIOLOGICAL VARIABLE RESTING PULSE RATE
The statistical analysis comparing the initial and final means of Resting Pulse Rate
assessed through Digital Heart Rate Measuring Machine test due to Swami Satyananda
Saraswati Yogic Practice group, and Swami Vishnudevananda Yogic Practice group on
college men Students presented in Table XI.

182
TABLE XI
COMPUTATION OF ANALYSIS OF COVARIANCE OF RESTING PULSE RATE
(Total scores in beats/minute)
Test EXP.GP 1 EXP.GP 2 Control GP SOV SS df MS F
B 132.16 2 66.08 Pre test
Mean 74.03 72.63 75.60
W 5565.13 87 63.97 1.03
B 862.69 2 431.34 Post test
Mean 68.67 68.80 75.30
W 3981.77 87 45.77 9.42*
B 466.94 2 233.47 Adjusted
Post test
mean
68.71 69.97 74.08 W 366.07 86 4.26
54.85*
*Significant at 0.05 level of confidence.
(The table value required for 0.05 level of significance with F 2, 87 and 2, 86 are 3.103 and
3.103 respectively)
As shown in table XI the obtained F value on the scores of the pretest means 1.03
was lesser than the required F value of 3.103, which proved that the random assignment of
the subject were successful and their scores in Resting Pulse Rate before the training were
equal and there was no significant differences. The analysis of posttest means proved that
the obtained F value 9.42 was greater than the required F value of 3.103 to be significant at
0.05 levels. Taking in to consideration of the pretest and posttest means the adjusted posttest
means were done and the obtained F value of 54.85 was greater than the required F value of
3.103 hence it was accepted that the Swami Satyananda Saraswati Yogic Practice group and
Swami Vishnudevananda Yogic Practice group significantly decreased the Resting Pulse
Rate.
Since the significant differences were recorded, the result was subjected to post hoc
analysis using scheffe’s confidence interval test. The results are presented in table XII.

183
TABLE XII SCHEFFE’S CONFIDENCE INTERVAL TEST SCORES ON
RESTING PULSE RATE
MEANS
EXP.GP 1 EXP.GP 2 CONTROL GP
MEAN
DIFFERENCE
REQUIRED CI
68.71 69.97 - 1.26 1.33
68.71 - 74.08 5.37* 1.33
- 69.97 74.08 4.11* 1.33
*significant at 0.05 level of confidence
Table XII shows that the adjusted post-test mean difference in resting pulse rate
between EXP.GP 1 and CG and between EXP.GP 2 and CG are 5.37 and 4.11, respectively
which were statistically significant at 0.05 level of confidence. The adjusted post-test mean
difference in resting pulse rate between EXP GP 1 and Exp GP 2 was 1.26 which was less
than the confidence interval value at 0.05 level.
The ordered adjusted means are presented through bar diagram for better
understanding of the result of this study in Figure IV.

184
4.3.4.1 DISCUSSION ON THE FINDINGS OF RESTING PULSE RATE
The result of the study on resting pulse rate indicates that all the experimental groups
namely EXP GP 1 and EXP GP 2 brought about significant improvement after the training.
The analysis of the data indicates that there was no significant difference on resting pulse
rate between EXP GP 1 and EXP GP 2. Based on the mean value, the Swami Satyananda
Saraswati Yogic Practice group was better in decreasing the resting pulse rate than the
Swami Vishnudevananda Yogic Practice group. Systematic yogic practices training
decrease the resting pulse rate. The result of this study on resting pulse rate has in line with
the study conducted by Kewal Krishan and Sudhir Kumar Sharma (2009).
4.3.5 RESULTS OF PHYSIOLOGICAL VARIABLE VITAL CAPACITY
The statistical analysis comparing the initial and final means of Vital Capacity
assessed through Spiro meter test due to Swami Satyananda Saraswati Yogic Practice group,
and Swami Vishnudevananda Yogic Practice group on college men Students presented in
Table XIII.
TABLE XIII
COMPUTATION OF ANALYSIS OF COVARIANCE OF VITAL CAPACITY
(Scores in milliliters)
Test EXP.GP 1 EXP.GP 2 Control GP SOV SS df MS F
B 239055.56 2 119527.78 Pre test
Mean 3280 3311.67 3401.67
W 13943833.33 87 160273.95 0.75
B 6088666.67 2 3044333.33 Post test
Mean 4116.67 3860.00 3483.33
W 15835333.33 87 182015.33 16.73*
B 8023968.90 2 4011984.45 Adjusted
Post test
mean
4157.77 3875.64 3426.59 W 6815397.16 86 79248.80
50.63*
*Significant at 0.05 level of confidence.
(The table value required for 0.05 level of significance with F 2, 87 and 2, 86 are 3.103 and
3.103 respectively).
185
As shown in table XIII the obtained F value on the scores of the pretest means 0.75
was lesser than the required F value of 3.103, which proved that the random assignment of
the subject were successful and their scores in Vital Capacity before the training were equal
and there was no significant differences. The analysis of posttest means proved that the
obtained F value 16.73 was greater than the required F value of 3.103 to be significant at
0.05 levels. Taking in to consideration of the pretest and posttest means the adjusted posttest
means were done and the obtained F value of 50.63 was greater than the required F value of
3.103 hence it was accepted that the Swami Satyananda Saraswati Yogic Practice group and
Swami Vishnudevananda Yogic Practice group significantly increased the Vital Capacity.
Since the significant differences were recorded, the result was subjected to post hoc
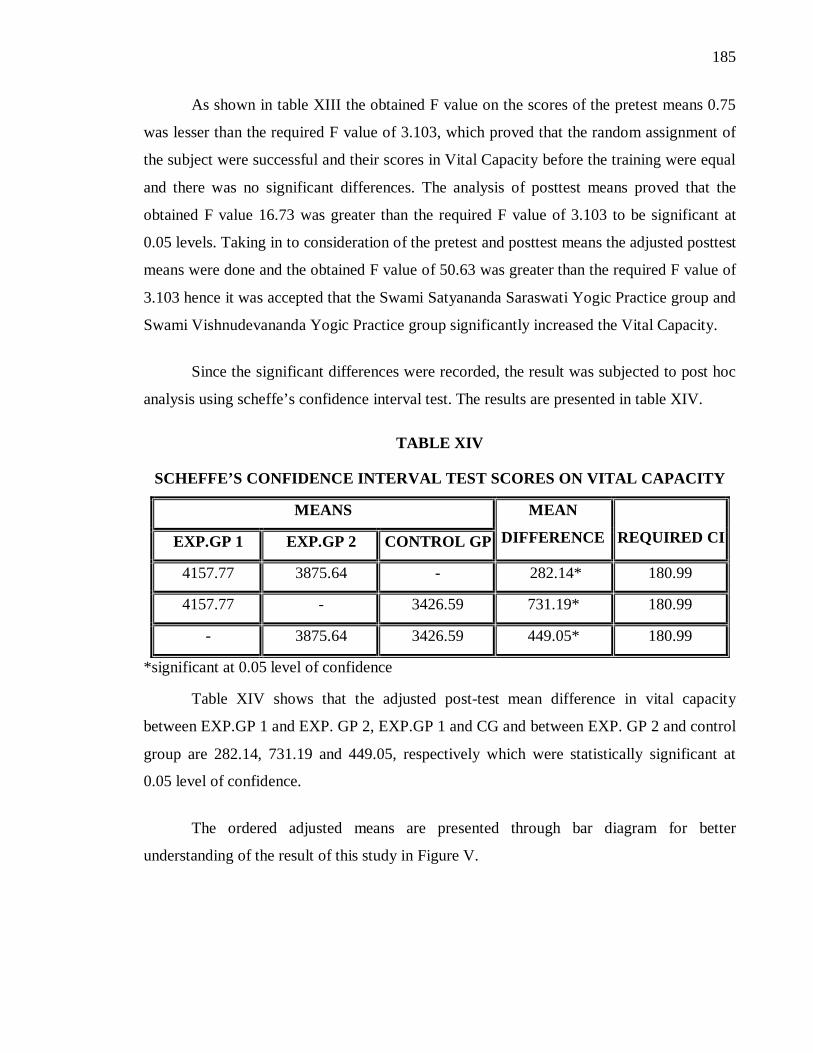
analysis using scheffe’s confidence interval test. The results are presented in table XIV.
TABLE XIV
SCHEFFE’S CONFIDENCE INTERVAL TEST SCORES ON VITAL CAPACITY
MEANS
EXP.GP 1 EXP.GP 2 CONTROL GP
MEAN
DIFFERENCE
REQUIRED CI
4157.77 3875.64 - 282.14* 180.99
4157.77 - 3426.59 731.19* 180.99
- 3875.64 3426.59 449.05* 180.99
*significant at 0.05 level of confidence
Table XIV shows that the adjusted post-test mean difference in vital capacity
between EXP.GP 1 and EXP. GP 2, EXP.GP 1 and CG and between EXP. GP 2 and control
group are 282.14, 731.19 and 449.05, respectively which were statistically significant at
0.05 level of confidence.
The ordered adjusted means are presented through bar diagram for better
understanding of the result of this study in Figure V.

186
4.3.5.1 DISCUSSION ON THE FINDINGS OF VITAL CAPACITY
The result of the study on vital capacity indicates that all the experimental groups
namely EXP GP 1 and EXP GP 2 brought about significant improvement after the training.
The results of the study indicate that there was a significant improvement difference in vital
capacity between the EXP GP 1 and EXP GP 2. However, Swami Satyananda Saraswati
Yogic Practice group was found to be better in increasing of vital capacity than Swami
Vishnudevananda Yogic Practice group. The result of this study on vital capacity has in line
with the study conducted by Anurodh Singh Sisodia and Satendra Singh Tomar (2009).
4.3.6 RESULTS OF PHYSIOLOGICAL VARIABLE VO2 MAX
The statistical analysis comparing the initial and final means of VO2 Max assessed
through bench step test due to Swami Satyananda Saraswati Yogic Practice group, and
Swami Vishnudevananda Yogic Practice group on college men Students presented in
Table XV.
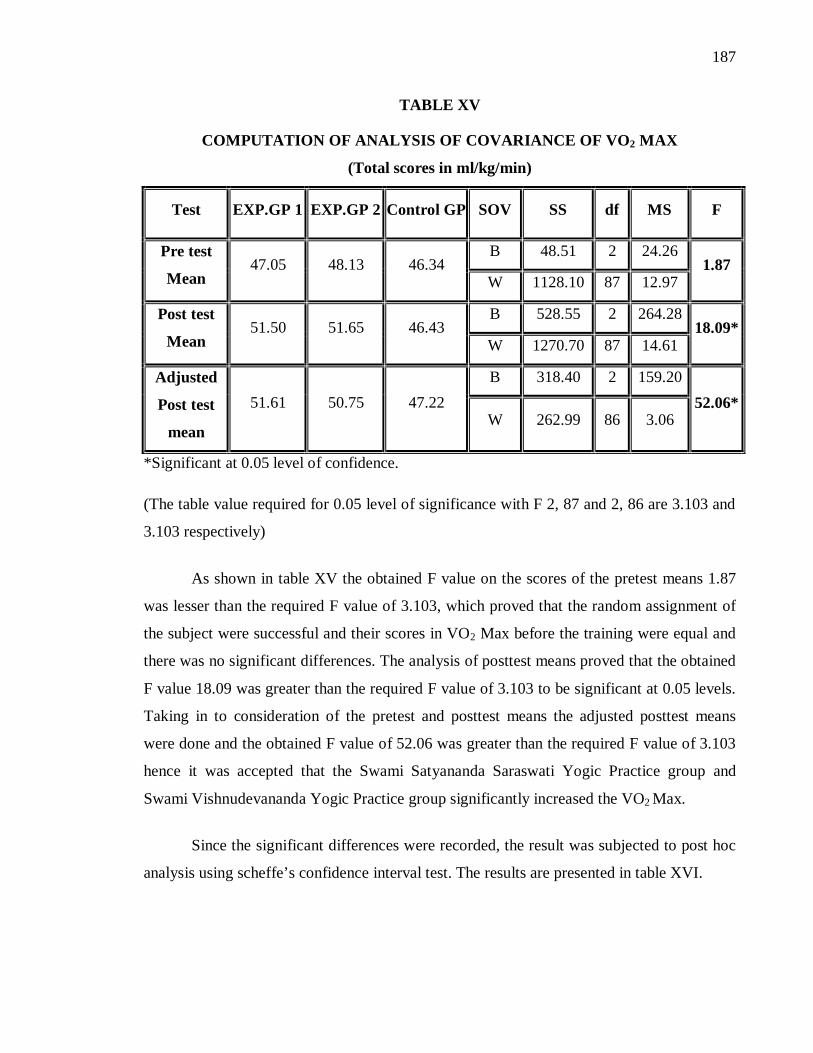
187
TABLE XV
COMPUTATION OF ANALYSIS OF COVARIANCE OF VO2 MAX
(Total scores in ml/kg/min)
Test EXP.GP 1 EXP.GP 2 Control GP SOV SS df MS F
B 48.51 2 24.26 Pre test
Mean 47.05 48.13 46.34
W 1128.10 87 12.97 1.87
B 528.55 2 264.28 Post test
Mean 51.50 51.65 46.43
W 1270.70 87 14.61 18.09*
B 318.40 2 159.20 Adjusted
Post test
mean
51.61 50.75 47.22 W 262.99 86 3.06
52.06*
*Significant at 0.05 level of confidence.
(The table value required for 0.05 level of significance with F 2, 87 and 2, 86 are 3.103 and
3.103 respectively)
As shown in table XV the obtained F value on the scores of the pretest means 1.87
was lesser than the required F value of 3.103, which proved that the random assignment of
the subject were successful and their scores in VO2 Max before the training were equal and
there was no significant differences. The analysis of posttest means proved that the obtained
F value 18.09 was greater than the required F value of 3.103 to be significant at 0.05 levels.
Taking in to consideration of the pretest and posttest means the adjusted posttest means
were done and the obtained F value of 52.06 was greater than the required F value of 3.103
hence it was accepted that the Swami Satyananda Saraswati Yogic Practice group and
Swami Vishnudevananda Yogic Practice group significantly increased the VO2 Max.
Since the significant differences were recorded, the result was subjected to post hoc
analysis using scheffe’s confidence interval test. The results are presented in table XVI.

188
TABLE XVI
SCHEFFE’S CONFIDENCE INTERVAL TEST SCORES ON VO2 MAX
MEANS
EXP.GP 1 EXP.GP 2 CONTROL GP
MEAN
DIFFERENCE
REQUIRED CI
47.22 51.61 - 0.87 1.12
47.22 - 50.75 4.39* 1.12
- 51.61 50.75 3.53* 1.12
*significant at 0.05 level of confidence
Table XVI shows that the adjusted post-test mean difference in VO2 Max between
EXP.GP 1 and CG and between EXP.GP 2 and CG are 4.39 and 3.53, respectively which
were statistically significant at 0.05 level of confidence. The adjusted post-test mean
difference in VO2MAX between EXP GP 1 and Exp GP 2 was 0.87 which was less than the
confidence interval value at 0.05 level.
The ordered adjusted means are presented through bar diagram for better
understanding of the result of this study in Figure VI.
189
4.3.6.1 DISCUSSION ON THE FINDINGS OF VO2 MAX
The result of the study on VO2 Max indicates that all the experimental groups
namely EXP GP 1 and EXP GP 2 brought about significant improvement after the training.
The analysis of the data indicates that there was no significant difference on VO2 Max
between EXP GP 1 and EXP GP 2. Based on the mean value, the Swami Satyananda
Saraswati Yogic Practice group was better in increasing the VO2Max than the Swami
Vishnudevananda Yogic Practice group. Systematic yogic practices training improve the
VO2 MAX. The result of this study on VO2 Max has in line with the study conducted by
Ray, et al., (2001).
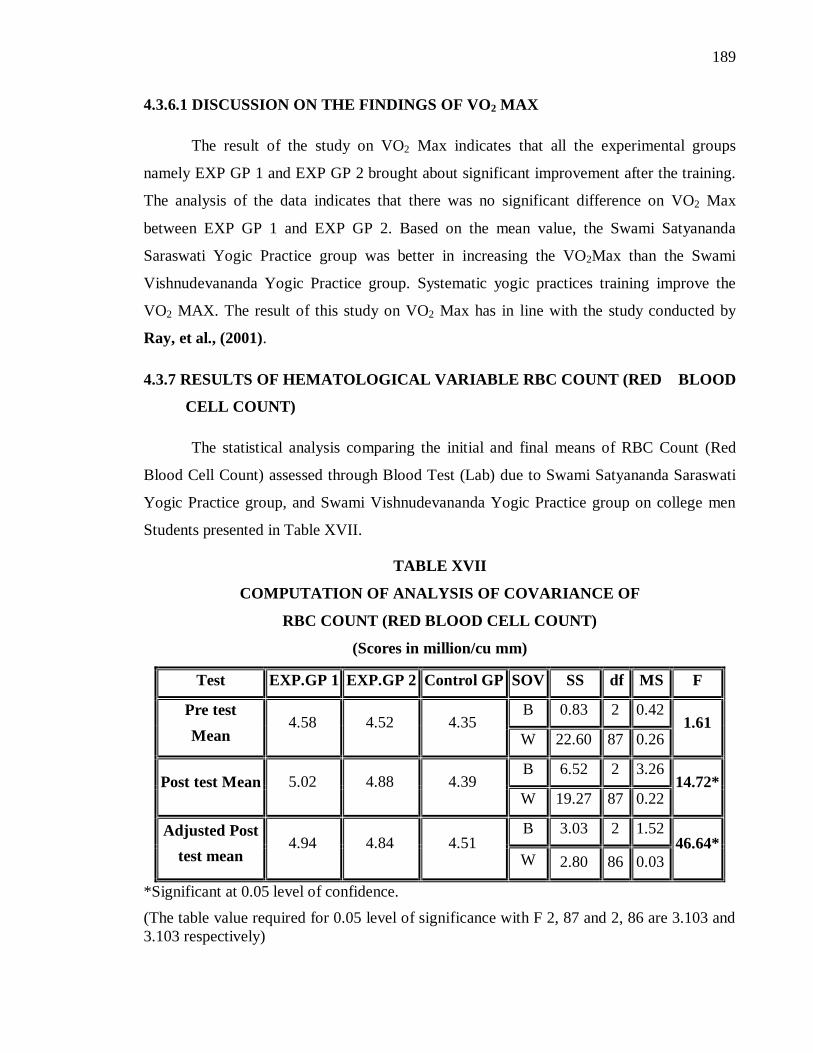
4.3.7 RESULTS OF HEMATOLOGICAL VARIABLE RBC COUNT (RED BLOOD
CELL COUNT)
The statistical analysis comparing the initial and final means of RBC Count (Red
Blood Cell Count) assessed through Blood Test (Lab) due to Swami Satyananda Saraswati
Yogic Practice group, and Swami Vishnudevananda Yogic Practice group on college men
Students presented in Table XVII.
TABLE XVII
COMPUTATION OF ANALYSIS OF COVARIANCE OF
RBC COUNT (RED BLOOD CELL COUNT)
(Scores in million/cu mm)
Test EXP.GP 1 EXP.GP 2 Control GP SOV SS df MS F
B 0.83 2 0.42 Pre test Mean
4.58 4.52 4.35 W 22.60 87 0.26
1.61
B 6.52 2 3.26 Post test Mean 5.02 4.88 4.39
W 19.27 87 0.22 14.72*
B 3.03 2 1.52 Adjusted Post test mean
4.94 4.84 4.51 W 2.80 86 0.03
46.64*
*Significant at 0.05 level of confidence. (The table value required for 0.05 level of significance with F 2, 87 and 2, 86 are 3.103 and 3.103 respectively)
190
As shown in table XVII the obtained F value on the scores of the pretest means 1.61
was lesser than the required F value of 3.103, which proved that the random assignment of
the subject were successful and their scores in RBC Count (Red Blood Cell Count) before
the training were equal and there was no significant differences. The analysis of posttest
means proved that the obtained F value 14.72 was greater than the required F value of 3.103
to be significant at 0.05 levels. Taking in to consideration of the pretest and posttest means
the adjusted posttest means were done and the obtained F value of 46.64 was greater than
the required F value of 3.103 hence it was accepted that the Swami Satyananda Saraswati
Yogic Practice group and Swami Vishnudevananda Yogic Practice group significantly
increased the RBC Count (Red Blood Cell Count).
Since the significant differences were recorded, the result was subjected to post hoc
analysis using scheffe’s confidence interval test. The results are presented in table XVIII.
TABLE XVIII
SCHEFFE’S CONFIDENCE INTERVAL TEST SCORES ON
RBC COUNT (RED BLOOD CELL COUNT)
MEANS
EXP.GP 1 EXP.GP 2 CONTROL GP
MEAN
DIFFERENCE
REQUIRED CI
4.94 4.84 - 0.10 0.12
4.94 - 4.51 0.44* 0.12
- 4.84 4.51 0.34* 0.12
*significant at .05 level of confidence
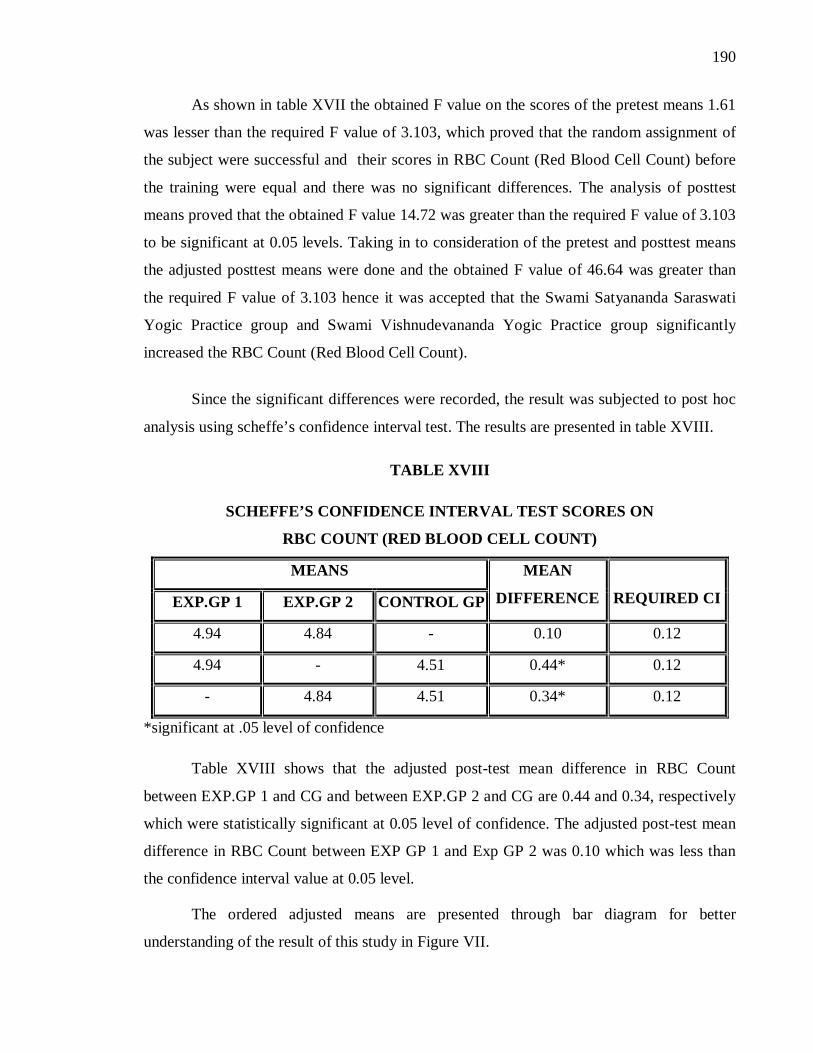
Table XVIII shows that the adjusted post-test mean difference in RBC Count
between EXP.GP 1 and CG and between EXP.GP 2 and CG are 0.44 and 0.34, respectively
which were statistically significant at 0.05 level of confidence. The adjusted post-test mean
difference in RBC Count between EXP GP 1 and Exp GP 2 was 0.10 which was less than
the confidence interval value at 0.05 level.
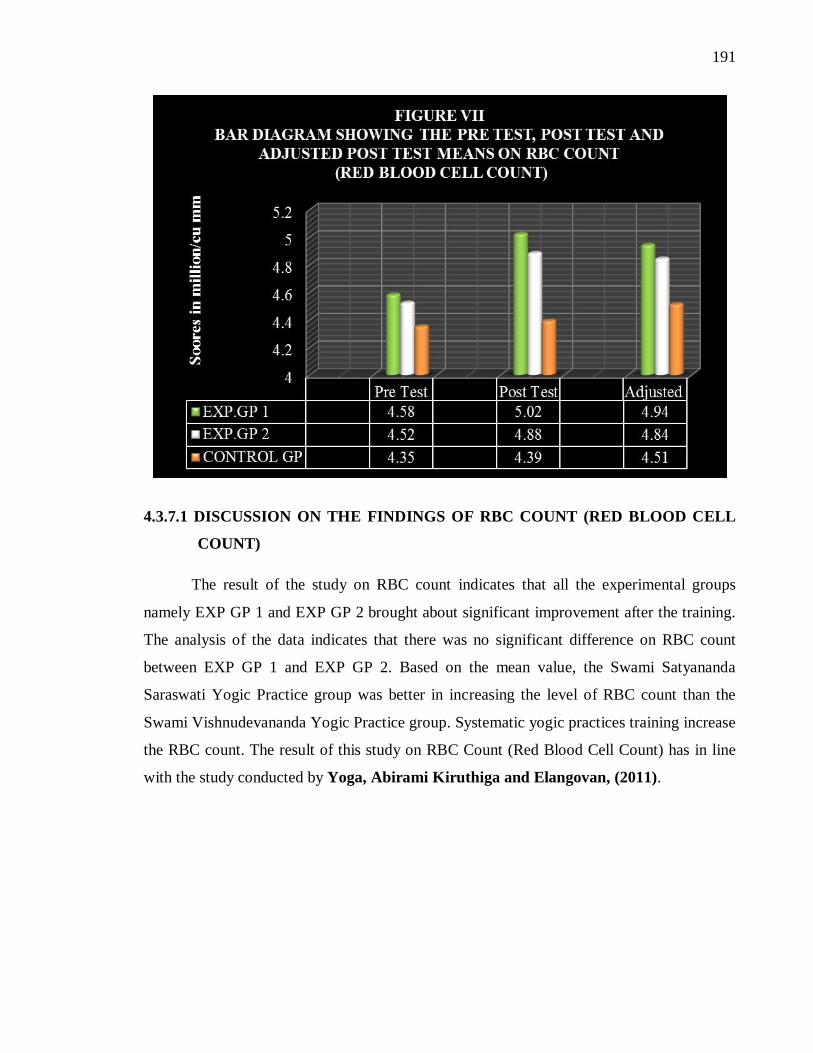
The ordered adjusted means are presented through bar diagram for better
understanding of the result of this study in Figure VII.
191
4.3.7.1 DISCUSSION ON THE FINDINGS OF RBC COUNT (RED BLOOD CELL
COUNT)
The result of the study on RBC count indicates that all the experimental groups
namely EXP GP 1 and EXP GP 2 brought about significant improvement after the training.
The analysis of the data indicates that there was no significant difference on RBC count
between EXP GP 1 and EXP GP 2. Based on the mean value, the Swami Satyananda
Saraswati Yogic Practice group was better in increasing the level of RBC count than the
Swami Vishnudevananda Yogic Practice group. Systematic yogic practices training increase
the RBC count. The result of this study on RBC Count (Red Blood Cell Count) has in line
with the study conducted by Yoga, Abirami Kiruthiga and Elangovan, (2011).
192
4.3.8 RESULTS OF HEMATOLOGICAL VARIABLE WBC COUNT (WHITE
BLOOD CELL COUNT)
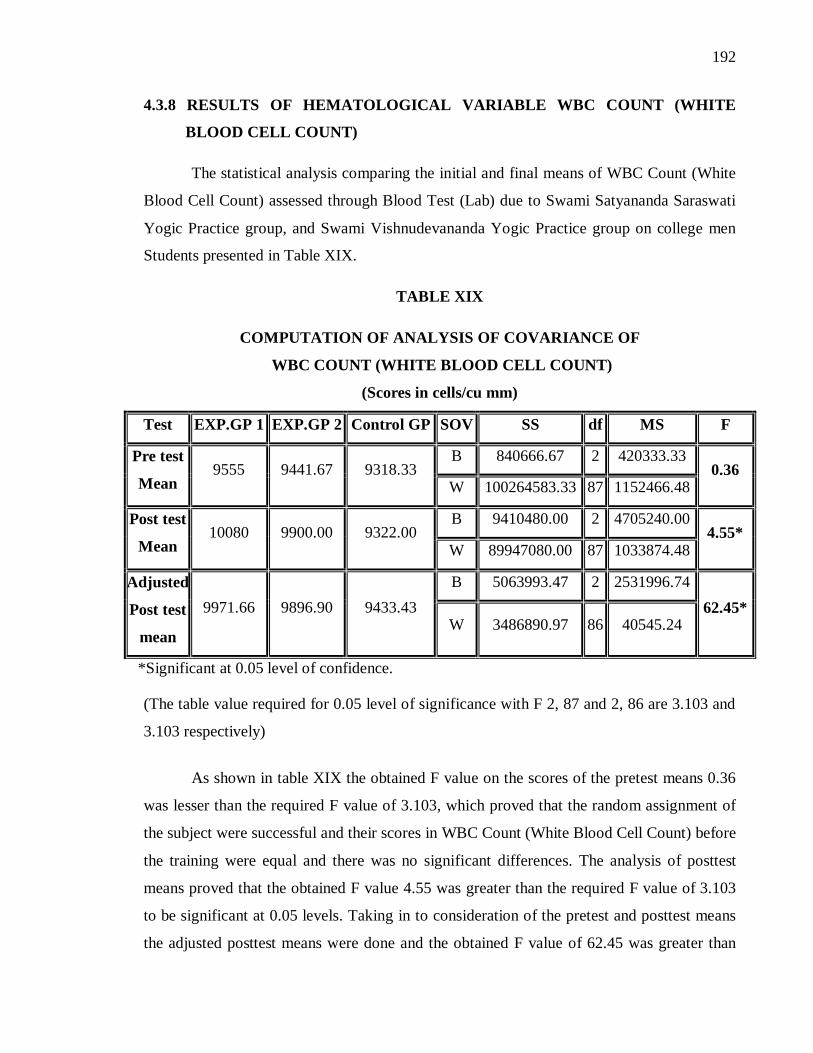
The statistical analysis comparing the initial and final means of WBC Count (White
Blood Cell Count) assessed through Blood Test (Lab) due to Swami Satyananda Saraswati
Yogic Practice group, and Swami Vishnudevananda Yogic Practice group on college men
Students presented in Table XIX.
TABLE XIX
COMPUTATION OF ANALYSIS OF COVARIANCE OF
WBC COUNT (WHITE BLOOD CELL COUNT)
(Scores in cells/cu mm)
Test EXP.GP 1 EXP.GP 2 Control GP SOV SS df MS F
B 840666.67 2 420333.33 Pre test
Mean 9555 9441.67 9318.33
W 100264583.33 87 1152466.48 0.36
B 9410480.00 2 4705240.00 Post test
Mean 10080 9900.00 9322.00
W 89947080.00 87 1033874.48 4.55*
B 5063993.47 2 2531996.74 Adjusted
Post test
mean
9971.66 9896.90 9433.43 W 3486890.97 86 40545.24
62.45*
*Significant at 0.05 level of confidence.
(The table value required for 0.05 level of significance with F 2, 87 and 2, 86 are 3.103 and
3.103 respectively)
As shown in table XIX the obtained F value on the scores of the pretest means 0.36
was lesser than the required F value of 3.103, which proved that the random assignment of
the subject were successful and their scores in WBC Count (White Blood Cell Count) before
the training were equal and there was no significant differences. The analysis of posttest
means proved that the obtained F value 4.55 was greater than the required F value of 3.103
to be significant at 0.05 levels. Taking in to consideration of the pretest and posttest means
the adjusted posttest means were done and the obtained F value of 62.45 was greater than

193
the required F value of 3.103 hence it was accepted that the Swami Satyananda Saraswati
Yogic Practice group and Swami Vishnudevananda Yogic Practice group significantly
increased the WBC Count (White Blood Cell Count).
Since the significant differences were recorded, the result was subjected to post hoc
analysis using scheffe’s confidence interval test. The results are presented in table XX.
TABLE XX
SCHEFFE’S CONFIDENCE INTERVAL TEST SCORES ON
WBC COUNT (WHITE BLOOD CELL COUNT)
MEANS
EXP.GP 1 EXP.GP 2 CONTROL GP
MEAN
DIFFERENCE
REQUIRED CI
9971.66 9896.90 - 74.76 129.46
9971.66 - 9433.43 538.23* 129.46
- 9896.90 9433.43 463.47* 129.46
*significant at .05 level of confidence
Table XX shows that the adjusted post-test mean difference in WBC count between
EXP.GP 1 and CG and between EXP.GP 2 and CG are 538.23 and 463.47, respectively
which were statistically significant at 0.05 level of confidence. The adjusted post-test mean
difference in WBC count between EXP GP 1 and Exp GP 2 was 74.76 which was less than
the confidence interval value at 0.05 level.
The ordered adjusted means are presented through bar diagram for better
understanding of the result of this study in Figure VIII.

194
4.3.8.1 DISCUSSION ON THE FINDINGS OF WBC COUNT (WHITE BLOOD
CELL COUNT)
The result of the study on WBC count indicates that all the experimental groups
namely EXP GP 1 and EXP GP 2 brought about significant improvement after the training.
The analysis of the data indicates that there was no significant difference on WBC count
between EXP GP 1 and EXP GP 2. Based on the mean value, the Swami Satyananda
Saraswati Yogic Practice group was better in increasing the level of WBC count than the
Swami Vishnudevananda Yogic Practice group. Systematic yogic practices training improve
the WBC count. The result of this study on WBC Count (White Blood Cell Count) has in
line with the study conducted by Kasundra, Thumar, and Mungra, (2010).
4.3.9 RESULTS OF HEMATOLOGICAL VARIABLE PLATELETS COUNT
The statistical analysis comparing the initial and final means of Platelets Count
assessed through Blood Test (Lab) due to Swami Satyananda Saraswati Yogic Practice
group, and Swami Vishnudevananda Yogic Practice group on college men Students
presented in Table XXI.
195
TABLE XXI
COMPUTATION OF ANALYSIS OF COVARIANCE OF PLATELETS COUNT
(Scores in lakhs/cu mm)
Test EXP.GP 1 EXP.GP 2 Control GP SOV SS df MS F
B 0.08 2 0.04 Pre test
Mean 3.19 3.24 3.17
W 19.59 87 0.23 0.18
B 2.64 2 1.32 Post test
Mean 3.59 3.55 3.21
W 12.80 87 0.15 8.99*
B 2.29 2 1.15 Adjusted
Post test
mean
3.60 3.52 3.23 W 1.96 86 0.02
50.28*
*Significant at 0.05 level of confidence.
(The table value required for 0.05 level of significance with F 2, 87 and 2, 86 are 3.103 and
3.103 respectively)
As shown in table XXI the obtained F value on the scores of the pretest means 0.18
was lesser than the required F value of 3.103, which proved that the random assignment of
the subject were successful and their scores in Platelets Count before the training were equal
and there was no significant differences. The analysis of posttest means proved that the
obtained F value 8.99 was greater than the required F value of 3.103 to be significant at 0.05
levels. Taking in to consideration of the pretest and posttest means the adjusted posttest
means were done and the obtained F value of 50.28 was greater than the required F value of
3.103 hence it was accepted that the Swami Satyananda Saraswati Yogic Practice group and
Swami Vishnudevananda Yogic Practice group significantly increased the Platelets Count.
Since the significant differences were recorded, the result was subjected to post hoc
analysis using scheffe’s confidence interval test. The results are presented in table XXII.

196
TABLE XXII
SCHEFFE’S CONFIDENCE INTERVAL TEST SCORES ON
PLATELETS COUNT
MEANS
EXP.GP 1 EXP.GP 2 CONTROL GP
MEAN
DIFFERENCE
REQUIRED CI
3.60 3.52 - 0.09 0.10
3.60 - 3.23 0.37* 0.10
- 3.52 3.23 0.29* 0.10
*significant at .05 level of confidence
Table XXII shows that the adjusted post-test mean difference in Platelets Count
between EXP.GP 1 and CG and between EXP.GP 2 and CG are 0.37 and 0.29, respectively
which were statistically significant at 0.05 level of confidence. The adjusted post-test mean
difference in Platelets Count between EXP GP 1 and Exp GP 2 was 0.09 which was less
than the confidence interval value at 0.05 level.
The ordered adjusted means are presented through bar diagram for better
understanding of the result of this study in Figure IX.
197
4.3.9.1 DISCUSSION ON THE FINDINGS OF PLATELETS COUNT
The result of the study on Platelets Count indicates that all the experimental groups
namely EXP GP 1 and EXP GP 2 brought about significant improvement after the training.
The analysis of the data indicates that there was no significant difference on Platelets Count
between EXP GP 1 and EXP GP 2. Based on the mean value, the Swami Satyananda
Saraswati Yogic Practice group was better in increasing the level of Platelets Count than the
Swami Vishnudevananda Yogic Practice group. Systematic yogic practices training increase
the Platelets Count. The result of this study on platelets has in line with the study conducted
by Yoga, Abirami Kiruthiga and Elangovan, (2011).
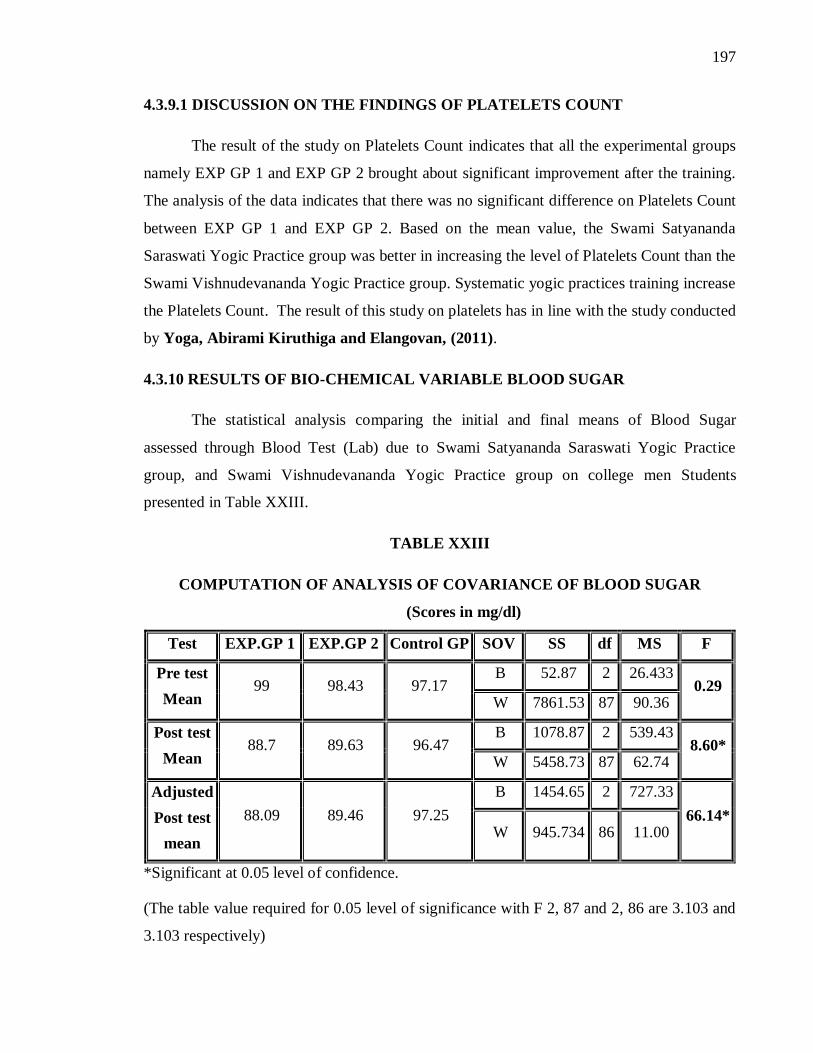
4.3.10 RESULTS OF BIO-CHEMICAL VARIABLE BLOOD SUGAR
The statistical analysis comparing the initial and final means of Blood Sugar
assessed through Blood Test (Lab) due to Swami Satyananda Saraswati Yogic Practice
group, and Swami Vishnudevananda Yogic Practice group on college men Students
presented in Table XXIII.
TABLE XXIII
COMPUTATION OF ANALYSIS OF COVARIANCE OF BLOOD SUGAR
(Scores in mg/dl)
Test EXP.GP 1 EXP.GP 2 Control GP SOV SS df MS F
B 52.87 2 26.433 Pre test Mean
99 98.43 97.17 W 7861.53 87 90.36
0.29
B 1078.87 2 539.43 Post test Mean
88.7 89.63 96.47 W 5458.73 87 62.74
8.60*
B 1454.65 2 727.33 Adjusted Post test
mean
88.09 89.46 97.25 W 945.734 86 11.00
66.14*
*Significant at 0.05 level of confidence.
(The table value required for 0.05 level of significance with F 2, 87 and 2, 86 are 3.103 and
3.103 respectively)
198
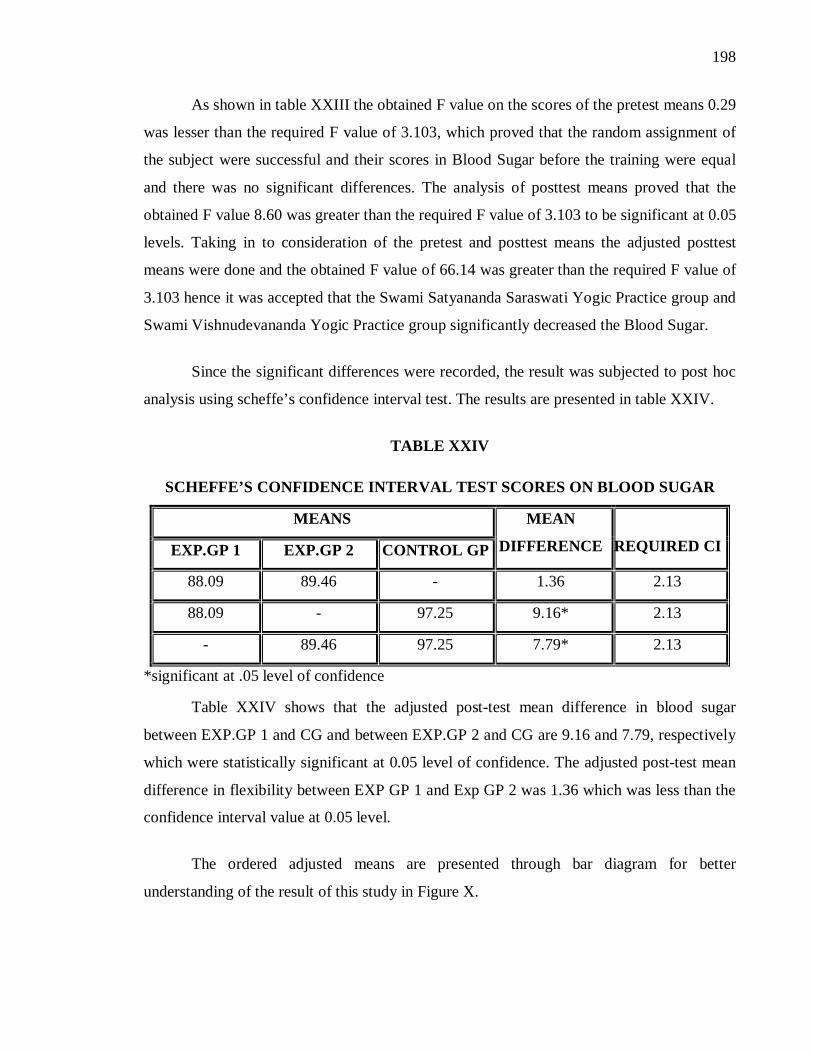
As shown in table XXIII the obtained F value on the scores of the pretest means 0.29
was lesser than the required F value of 3.103, which proved that the random assignment of
the subject were successful and their scores in Blood Sugar before the training were equal
and there was no significant differences. The analysis of posttest means proved that the
obtained F value 8.60 was greater than the required F value of 3.103 to be significant at 0.05
levels. Taking in to consideration of the pretest and posttest means the adjusted posttest
means were done and the obtained F value of 66.14 was greater than the required F value of
3.103 hence it was accepted that the Swami Satyananda Saraswati Yogic Practice group and
Swami Vishnudevananda Yogic Practice group significantly decreased the Blood Sugar.
Since the significant differences were recorded, the result was subjected to post hoc
analysis using scheffe’s confidence interval test. The results are presented in table XXIV.
TABLE XXIV
SCHEFFE’S CONFIDENCE INTERVAL TEST SCORES ON BLOOD SUGAR
MEANS
EXP.GP 1 EXP.GP 2 CONTROL GP
MEAN
DIFFERENCE
REQUIRED CI
88.09 89.46 - 1.36 2.13
88.09 - 97.25 9.16* 2.13
- 89.46 97.25 7.79* 2.13
*significant at .05 level of confidence
Table XXIV shows that the adjusted post-test mean difference in blood sugar
between EXP.GP 1 and CG and between EXP.GP 2 and CG are 9.16 and 7.79, respectively
which were statistically significant at 0.05 level of confidence. The adjusted post-test mean
difference in flexibility between EXP GP 1 and Exp GP 2 was 1.36 which was less than the
confidence interval value at 0.05 level.
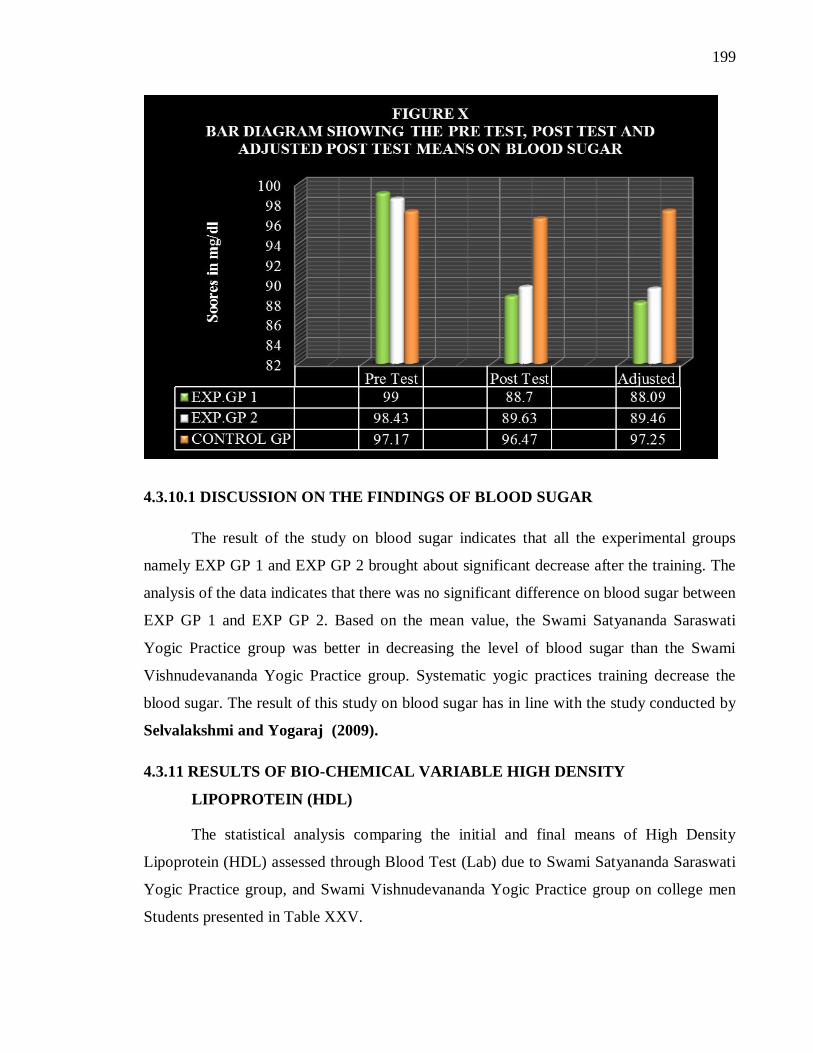
The ordered adjusted means are presented through bar diagram for better
understanding of the result of this study in Figure X.
199
4.3.10.1 DISCUSSION ON THE FINDINGS OF BLOOD SUGAR
The result of the study on blood sugar indicates that all the experimental groups
namely EXP GP 1 and EXP GP 2 brought about significant decrease after the training. The
analysis of the data indicates that there was no significant difference on blood sugar between
EXP GP 1 and EXP GP 2. Based on the mean value, the Swami Satyananda Saraswati
Yogic Practice group was better in decreasing the level of blood sugar than the Swami
Vishnudevananda Yogic Practice group. Systematic yogic practices training decrease the
blood sugar. The result of this study on blood sugar has in line with the study conducted by
Selvalakshmi and Yogaraj (2009).
4.3.11 RESULTS OF BIO-CHEMICAL VARIABLE HIGH DENSITY
LIPOPROTEIN (HDL)
The statistical analysis comparing the initial and final means of High Density
Lipoprotein (HDL) assessed through Blood Test (Lab) due to Swami Satyananda Saraswati
Yogic Practice group, and Swami Vishnudevananda Yogic Practice group on college men
Students presented in Table XXV.

200
TABLE XXV
COMPUTATION OF ANALYSIS OF COVARIANCE OF
HIGH DENSITY LIPOPROTEIN (HDL)
(Scores in mg/dl)
Test EXP.GP 1 EXP.GP 2 Control GP SOV SS df MS F
B 138.47 2 69.233 Pre test Mean 46.57 45.20 48.23
W 4775.53 87 54.89 1.26
B 449.067 2 224.533 Post test Mean 53.77 50.83 48.30
W 3931.18 87 45.193 4.97*
B 747.607 2 373.803 Adjusted Post test
mean 53.85 52.06 46.99
W 593.361 86 6.9 54.18*
*Significant at 0.05 level of confidence.
(The table value required for 0.05 level of significance with F 2, 87 and 2, 86 are 3.103 and
3.103 respectively)
As shown in table XXV the obtained F value on the scores of the pretest means 1.26
was lesser than the required F value of 3.103, which proved that the random assignment of
the subject were successful and their scores in High Density Lipoprotein (HDL) before the
training were equal and there was no significant differences. The analysis of posttest means
proved that the obtained F value 4.97 was greater than the required F value of 3.103 to be
significant at 0.05 levels. Taking in to consideration of the pretest and posttest means the
adjusted posttest means were done and the obtained F value of 54.18 was greater than the
required F value of 3.103 hence it was accepted that the Swami Satyananda Saraswati Yogic
Practice group and Swami Vishnudevananda Yogic Practice group significantly increased
the High Density Lipoprotein (HDL).
Since the significant differences were recorded, the result was subjected to post hoc
analysis using scheffe’s confidence interval test. The results are presented in table XXVI.

201
TABLE XXVI
SCHEFFE’S CONFIDENCE INTERVAL TEST SCORES ON
HIGH DENSITY LIPOPROTEIN (HDL)
MEANS
EXP.GP 1 EXP.GP 2 CONTROL GP
MEAN
DIFFERENCE
REQUIRED CI
53.85 52.06 - 1.79* 1.69
53.85 - 46.99 6.86* 1.69
- 52.06 46.99 5.07* 1.69 *significant at .05 level of confidence
Table XXVI shows that the adjusted post-test mean difference in HDL between
EXP.GP 1 and EXP. GP 2, EXP.GP 1 and CG and between EXP. GP 2 and control group
are 1.79, 6.86 and 5.07, respectively which were statistically significant at 0.05 level of
confidence.
The ordered adjusted means are presented through bar diagram for better
understanding of the result of this study in Figure XI.
202
4.3.11.1 DISCUSSION ON THE FINDINGS OF HIGH DENSITY LIPOPROTEIN
(HDL)
The result of the study on HDL indicates that all the experimental groups namely
EXP GP 1 and EXP GP 2 brought about significant improvement after the training. The
results of the study indicate that there was a significant difference on HDL between the EXP
GP 1 and EXP GP 2. However, Swami Satyananda Saraswati Yogic Practice group was
found to be better in increasing the HDL level in blood than Swami Vishnudevananda Yogic
Practice group. The result of this study on High Density Lipoprotein (HDL) has in line with
the study conducted by Yogaraj, Ramaraj and Elangovan (2010).
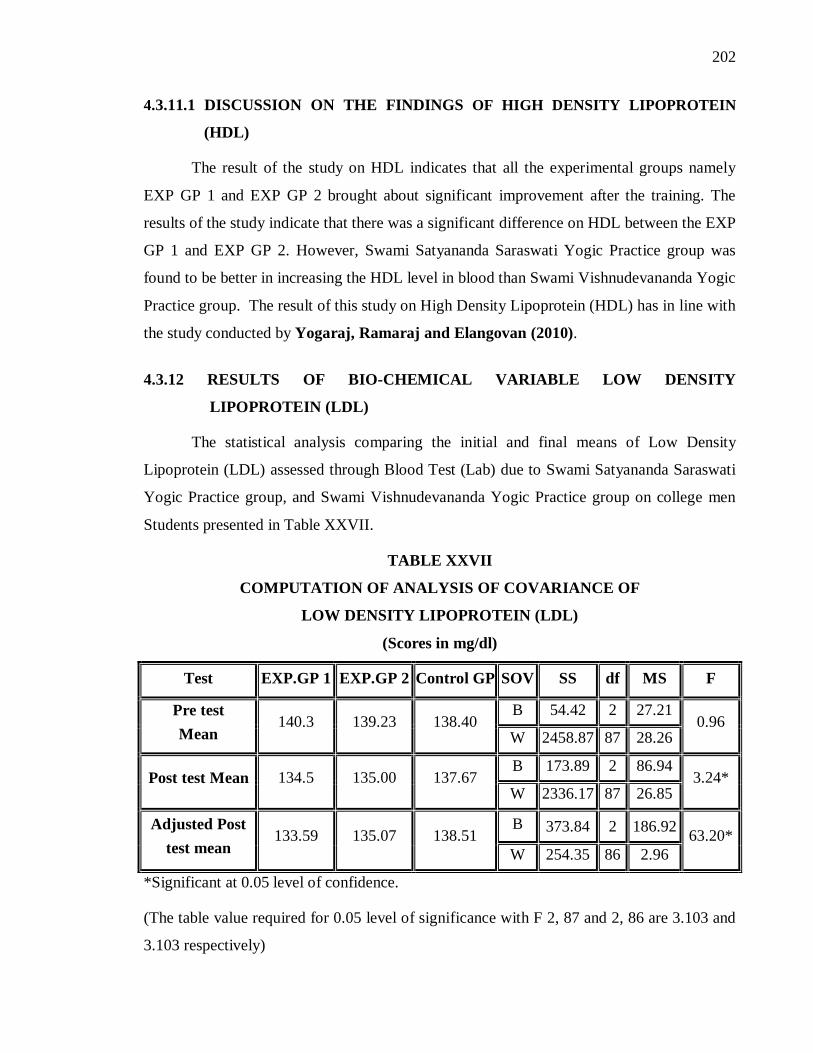
4.3.12 RESULTS OF BIO-CHEMICAL VARIABLE LOW DENSITY
LIPOPROTEIN (LDL)
The statistical analysis comparing the initial and final means of Low Density
Lipoprotein (LDL) assessed through Blood Test (Lab) due to Swami Satyananda Saraswati
Yogic Practice group, and Swami Vishnudevananda Yogic Practice group on college men
Students presented in Table XXVII.
TABLE XXVII
COMPUTATION OF ANALYSIS OF COVARIANCE OF
LOW DENSITY LIPOPROTEIN (LDL)
(Scores in mg/dl)
Test EXP.GP 1 EXP.GP 2 Control GP SOV SS df MS F
B 54.42 2 27.21 Pre test Mean
140.3 139.23 138.40 W 2458.87 87 28.26
0.96
B 173.89 2 86.94 Post test Mean 134.5 135.00 137.67
W 2336.17 87 26.85 3.24*
B 373.84 2 186.92 Adjusted Post test mean
133.59 135.07 138.51 W 254.35 86 2.96
63.20*
*Significant at 0.05 level of confidence.
(The table value required for 0.05 level of significance with F 2, 87 and 2, 86 are 3.103 and
3.103 respectively)
203
As shown in table XXVII the obtained F value on the scores of the pretest means
0.96 was lesser than the required F value of 3.103, which proved that the random
assignment of the subject were successful and their scores in Low Density Lipoprotein
(LDL) before the training were equal and there was no significant differences. The analysis
of posttest means proved that the obtained F value 3.24 was greater than the required F
value of 3.103 to be significant at 0.05 levels. Taking in to consideration of the pretest and
posttest means the adjusted posttest means were done and the obtained F value of 63.20 was
greater than the required F value of 3.103 hence it was accepted that the Swami Satyananda
Saraswati Yogic Practice group and Swami Vishnudevananda Yogic Practice group
significantly decreased the Low Density Lipoprotein (LDL).
Since the significant differences were recorded, the result was subjected to post hoc
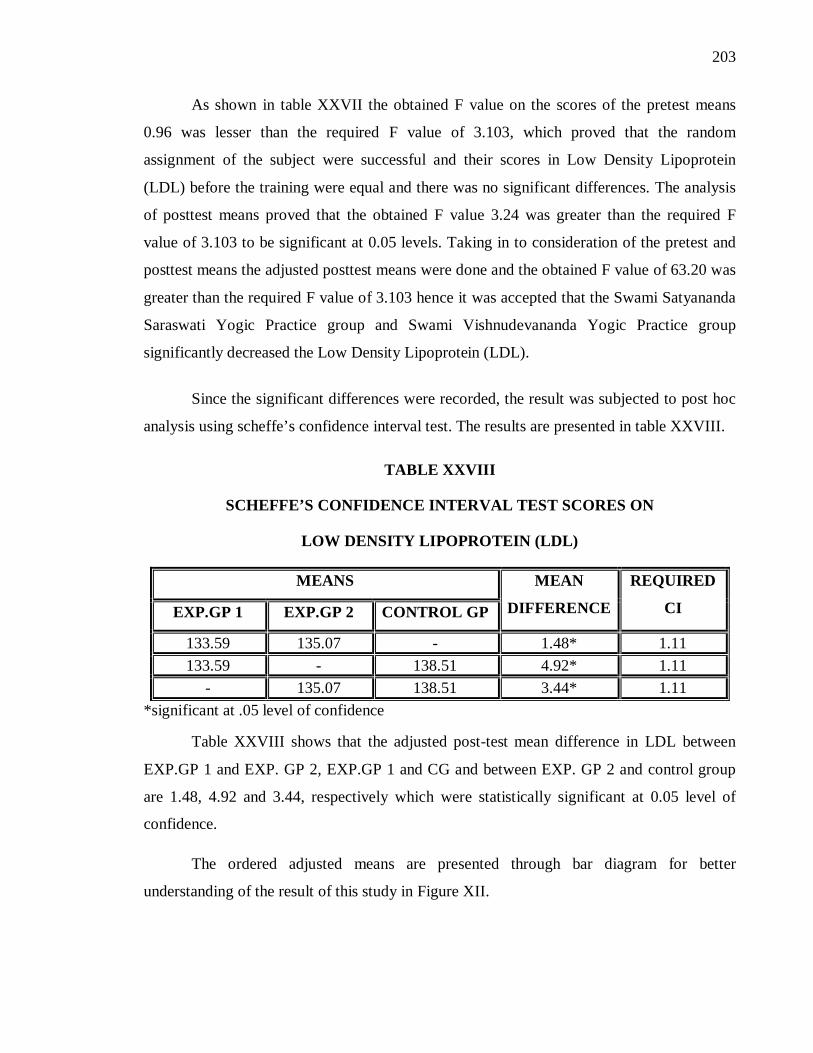
analysis using scheffe’s confidence interval test. The results are presented in table XXVIII.
TABLE XXVIII
SCHEFFE’S CONFIDENCE INTERVAL TEST SCORES ON
LOW DENSITY LIPOPROTEIN (LDL)
MEANS
EXP.GP 1 EXP.GP 2 CONTROL GP
MEAN
DIFFERENCE
REQUIRED
CI
133.59 135.07 - 1.48* 1.11 133.59 - 138.51 4.92* 1.11
- 135.07 138.51 3.44* 1.11 *significant at .05 level of confidence
Table XXVIII shows that the adjusted post-test mean difference in LDL between
EXP.GP 1 and EXP. GP 2, EXP.GP 1 and CG and between EXP. GP 2 and control group
are 1.48, 4.92 and 3.44, respectively which were statistically significant at 0.05 level of
confidence.
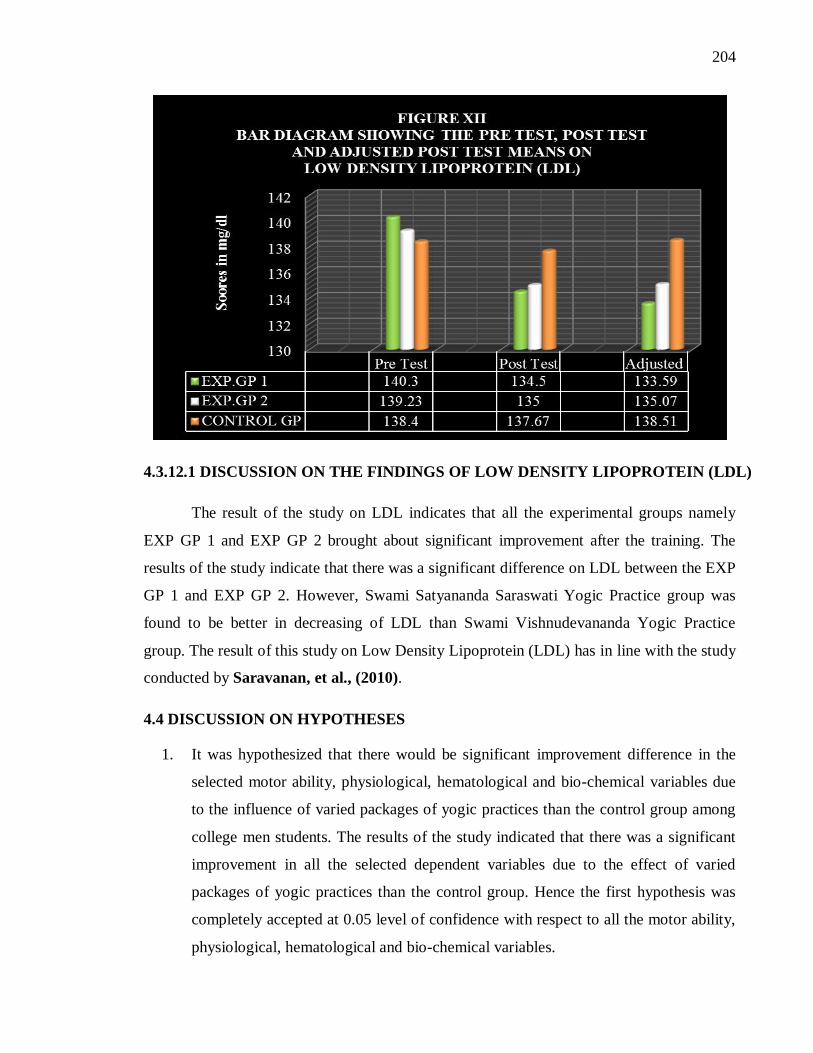
The ordered adjusted means are presented through bar diagram for better
understanding of the result of this study in Figure XII.
204
4.3.12.1 DISCUSSION ON THE FINDINGS OF LOW DENSITY LIPOPROTEIN (LDL)
The result of the study on LDL indicates that all the experimental groups namely
EXP GP 1 and EXP GP 2 brought about significant improvement after the training. The
results of the study indicate that there was a significant difference on LDL between the EXP
GP 1 and EXP GP 2. However, Swami Satyananda Saraswati Yogic Practice group was
found to be better in decreasing of LDL than Swami Vishnudevananda Yogic Practice
group. The result of this study on Low Density Lipoprotein (LDL) has in line with the study
conducted by Saravanan, et al., (2010).
4.4 DISCUSSION ON HYPOTHESES
1. It was hypothesized that there would be significant improvement difference in the
selected motor ability, physiological, hematological and bio-chemical variables due
to the influence of varied packages of yogic practices than the control group among
college men students. The results of the study indicated that there was a significant
improvement in all the selected dependent variables due to the effect of varied
packages of yogic practices than the control group. Hence the first hypothesis was
completely accepted at 0.05 level of confidence with respect to all the motor ability,
physiological, hematological and bio-chemical variables.
205
2. It was hypothesized that there would be significant improvement difference between
the (varied packages of yogic practices) Swami Satyananda Saraswati yogic
practices and Swami Vishnudevananda yogic practices group on selected motor
ability, physiological, hematological and bio-chemical variables among college men
students. The second hypothesis was partially accepted at 0.05 level of confidence as
there was a significant improvement difference between the Satyananda Saraswati
and Swami Vishnudevananda yogic practice groups, with respect to variables such
as muscular strength, cardio vascular endurance, vital capacity, HDL and LDL. In
the remaining variables such as flexibility, resting pulse rate, VO2MAX, RBC count,
WBC count and platelets, there was no significant difference between the
Satyananda Saraswati and Swami Vishnudevananda yogic practice groups. In these
cases the null hypothesis was accepted at 0.05 level of confidence.