chapter 8: net exports of goods and … 8: net exports of goods and services (updated: december...
TRANSCRIPT
CHAPTER 8: NET EXPORTS OF GOODS AND SERVICES (Updated: December 2015)
Definitions and Concepts Recording in the NIPAs Overview of Source Data and Estimating Methods Benchmark-year and nonbenchmark-year estimates Current quarterly estimates Adjustments and other differences between the NIPA and ITA estimates Quantity and price estimates Table 8.A—Summary of Methodology for Exports of Goods and Services Table 8.B—Summary of Methodology for Imports of Goods and Services Net exports of goods and services is the difference between U.S. exports of goods and services and U.S. imports of goods and services. Exports measures the portion of total U.S. production of goods and services—gross domestic product (GDP)—that is provided to the rest of the world; thus, movements in exports reflect changes in foreign demand for U.S.-produced goods and services. Imports measures the portion of total U.S. expenditures—gross domestic purchases—that is accounted for by goods and services provided by the rest of the world; thus, movements in imports reflect changes in domestic demand for foreign-produced goods and services. The impact of imports on the U.S. economy depends on the degree to which they act as substitutes for, or as complements to, domestic production. Together, the two measures reflect the extent to which the United States participates in the global marketplace, which provides broad opportunities for specialization and other economic efficiencies. As the difference between the two, net exports represents the gap between U.S. domestic production and U.S. domestic demand and the extent to which a surplus or deficit of domestic production relative to domestic demand is addressed by foreign markets. Net exports in the national income and product accounts (NIPAs) corresponds to the measure “balance on goods and services”—commonly referred to as the “trade deficit” (when imports exceeds exports) or the “trade surplus” (when exports exceeds imports)—in the international transactions (or balance of payments) accounts (ITAs), also produced by BEA.1 The two measures are very similar, but they differ in coverage, definitions, and in timing of revisions (see the section “Adjustments and other differences between the NIPA and ITA estimates). Net exports is also a component of the “balance on current account,” a measure in both the ITAs and the NIPAs that also includes receipts and payments of income and net unilateral current transfers.
1 For a detailed description of the ITAs, see “U.S. International Transactions Accounts: Concepts and Estimation Methods”; go to www.bea.gov, and select “International” and then “Methodologies.”
CHAPTER 8: NET EXPORTS OF GOODS AND SERVICES
8-2
Net exports also relates GDP to other important aggregates in the NIPAs. GDP less net exports is equal to gross domestic purchases, which is the market value of goods and services purchased by U.S. residents regardless of where those goods and services are produced. Final sales of domestic product (worldwide final sales of U.S. production) less net exports is equal to final sales to domestic purchasers, which is the market value of final goods and services purchased by U.S. residents regardless of where those goods and services are produced,. Net exports is also used in preparing two alternative measures of U.S. production—command-basis GDP and command-basis gross national product (GNP)—that provide information on the real purchasing power of the income generated by U.S. production of goods and services.2 These measures reflect the impact of changes in the terms of trade and of changes in production on the purchasing power associated with the nation’s output. More specifically, these measures deflate exports and imports of goods and services (and, in the case of command-basis GNP, also income receipts and payments) by the price index for gross domestic purchases (which measures the prices of goods and services purchased by U.S. residents). Thus, the command-basis measures reflect the prices of purchased goods and services, while real GDP and real GNP reflect the prices of produced goods and services. Other related measures include the trading gains index, which is measured as the ratio of the GDP price index to the price index for gross domestic purchases, and the terms of trade index, which is measured as the ratio of the price index for exports of goods and services to the price index for imports of goods and services.3 The estimates of net exports are an integral part of the NIPAs, a set of accounts that provides a logical and consistent framework for presenting statistics on U.S. economic activity (see “Chapter 2: Fundamental Concepts”).
Definitions and Concepts
As discussed in chapter 2, net exports is one of the final expenditures components of GDP. It is equal to exports, which measures all goods and services sold, given away, or otherwise transferred by residents of the United States to foreign residents (also referred to as nonresidents or the rest of the world) less imports, an offsetting component of GDP that measures all goods and services sold, given away, or otherwise transferred by foreign residents to U.S. residents. The inclusion of exports as a component of GDP is straightforward; as explained in chapter 2, in the final expenditures approach, GDP is measured by summing the final
2 GDP measures the value of goods and services produced by labor and property located in the United States, while GNP measures the value of goods and services produced by labor and property supplied by U.S. residents. GNP is equal to GDP less net income payments to the rest of the world. BEA also prepares alternative command-basis measures of net national product and of net domestic product. 3 For more information, see the section “Principal quantity and price measures” in chapter 2.
CHAPTER 8: NET EXPORTS OF GOODS AND SERVICES
8-3
expenditures of persons, businesses, governments, and foreigners for goods and services produced in the United States. Because exports to foreign residents represent the endpoint of domestic production, they include goods and services intended for intermediate as well as final use; any further processing that occurs outside of the United States is foreign production and is not included in GDP. For example, automotive parts that are produced in the United States and shipped to a final assembly plant in Canada are included in U.S. exports and counted as final expenditures in GDP. The inclusion of imports as an offsetting entry in deriving GDP and the inclusion of intermediate goods and services in imports warrant further explanation. Imports represent production that has occurred outside the United States, and thus they are not included in GDP. However, purchases of imported goods and services, as well as purchases of domestic goods and services, are included in personal consumption expenditures (PCE), gross private domestic investment, and government consumption expenditures and gross investment so that these final expenditure components of GDP will accurately reflect the aggregate demand of persons, businesses, and governments for goods and services wherever they are produced.4 Thus, imports is included in the calculation of GDP as a counter-entry that offsets the non-U.S. production that is included in these final expenditures components. For example, a U.S. consumer may purchase an automobile (a final good) that is produced in the United States or in a foreign country. In either case, the purchase is recorded in PCE (a positive entry in deriving GDP); however, in the case of a foreign automobile, the purchase is offset in U.S. imports (a negative entry in deriving GDP).5 Similarly, a domestic automobile manufacturer may purchase steel (an intermediate good) from either a domestic or a foreign manufacturer; the steel is either used in the production process and included in the value of the final product (and therefore GDP) during that period, or it is added to the manufacturer’s inventory of materials and supplies (also a positive entry in deriving GDP). 6 The domestically produced steel reflects value added that contributes to GDP; in contrast, the foreign-produced steel reflects value added that does not reflect U.S. production and that is offset by the recording of imports of steel (a negative entry in deriving GDP).
4 Additionally, the source data for estimating these final expenditures components do not, for the most part, distinguish between domestically produced and foreign-produced goods and services. 5 Another example is the payments by U.S. residents to foreign residents for travel services. These expenditures are included in PCE collectively as “Foreign travel by U.S. residents” in the category “Net foreign travel”; unlike other expenditures on imports, they are not distributed among the individual PCE categories. They are also recorded as imports of goods and services; thus, the PCE and import entries cancel out in deriving GDP. For the results of research aimed at better separating spending by nonresidents from spending by U.S. residents in the detailed PCE statistics, see Michael Armah and Teresita Teensma, “Research Spotlight: Estimates of Categories of Personal Consumption Expenditures Adjusted for Net Foreign Travel Spending,” Survey 92 (April 2012): 13–21. 6 The NIPA accounting for change in private inventories ensures that the value added at each stage of domestic production—including production of intermediate goods—is included in GDP in the period in which it occurs without being double-counted as further processing occurs (see the box “Simple Example of CIPI Role in Calculating GDP” on page 7-3 in chapter 7).
CHAPTER 8: NET EXPORTS OF GOODS AND SERVICES
8-4
Residents of the United States—as defined in both the NIPAs and the ITAs—are (1) individuals residing permanently in the United States, (2) business enterprises and nonprofit organizations established under U.S. laws, including corporations, partnerships, and proprietorships; and (3) U.S. federal, state, and local governments, together with their subdivisions. Individuals who reside or expect to reside in the United States for 1 year or more are considered U.S. residents. An exception is made for U.S. students who study abroad and foreign students who study in the United States; students retain the residency of their home country regardless of their length of stay. U.S. government employees stationed abroad (and their families) such as diplomats, consular officials, and members of the armed forces are also considered U.S. residents, regardless of their length of stay abroad. Affiliates of multinational corporations are considered residents of the country in which they are located, not residents of the country of the parent; thus, U.S. affiliates of foreign corporations are considered U.S. residents, and foreign affiliates of U.S. corporations are considered foreign residents. Economic activities of production and consumption occur predominately in the countries in which the affiliates are located. 7 Federal, state, and local governments and their agencies and subdivisions are considered residents of their home country. U.S. government installations abroad are considered residents of the United States, and foreign government installations in the United States are considered residents of their home country. International organizations such as the United Nations, the International Monetary Fund, and the International Bank for Reconstruction and Development are considered residents of an international area beyond national boundaries, rather than residents of the country in which they are located or in which they operate.
Foreign residents—as defined in both the NIPAs and the ITAs—are (1)
individuals residing permanently outside of the United States, (2) business enterprises and nonprofit organizations established under the laws of foreign nations; (3) foreign governments, together with their subdivisions, and (4) international organizations located in the United States. Thus, for example, U.S. nationals who reside outside of the United States for more than 1 year (with the exception of U.S. students and U.S. government employees) and foreign affiliates of U.S. companies are considered foreign residents. In
7 The measure of net exports presented in the NIPAs is referred to in the ITAs as the “cross-border” measure of international transactions. The cross-border measure is an important indicator of U.S. performance in foreign markets; it reflects the net value of the transactions in goods and services between U.S. residents (including companies) and foreign residents. In addition, BEA annually provides a supplemental, “ownership-based” framework of the current-account portion of the ITAs in which net receipts resulting from sales by affiliates of U.S. and of foreign companies are combined with the “cross-border” measures of exports and imports to provide an indicator of the net effect of United States-foreign commerce on the U.S. economy. This alternative framework, which is usually published in the January issue of the Survey of Current Business, recognizes that both cross-border trade and sales through affiliates represent methods of active participation in the international markets for goods and services.
CHAPTER 8: NET EXPORTS OF GOODS AND SERVICES
8-5
the NIPAs, the “rest of the world” sector consists of foreign residents who are transactors with U.S. residents.
The definition of residency impacts the NIPAs and the ITAs differently because
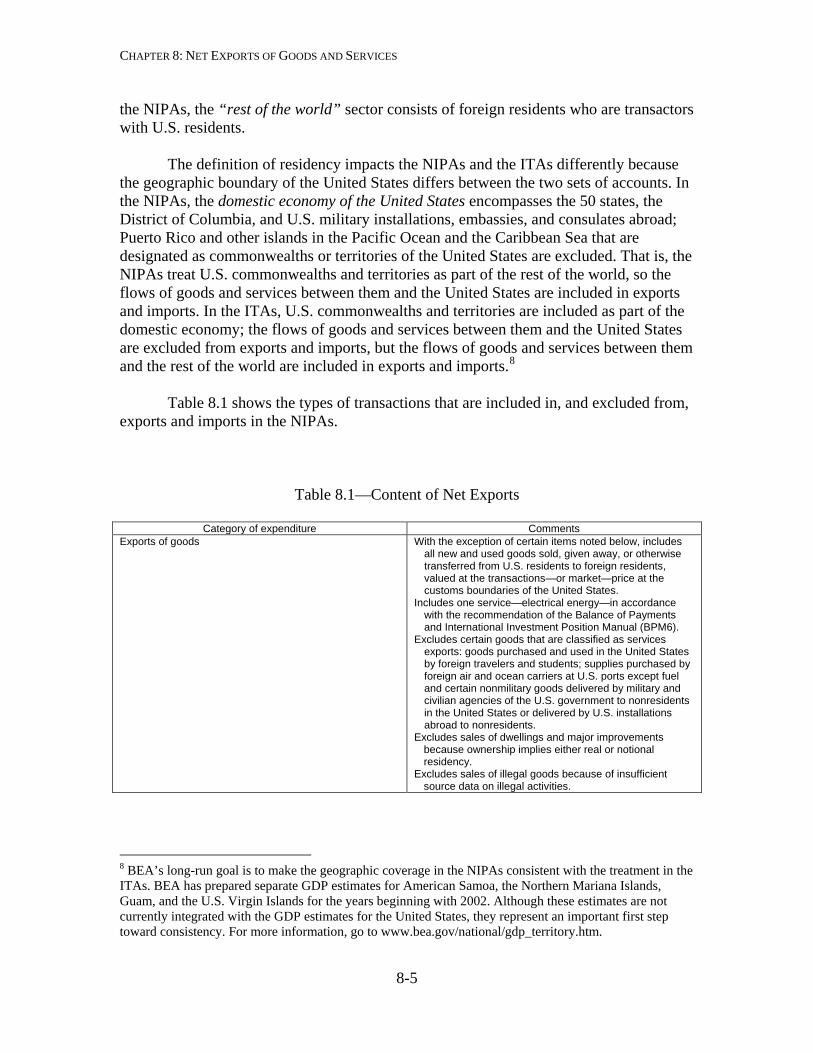
the geographic boundary of the United States differs between the two sets of accounts. In the NIPAs, the domestic economy of the United States encompasses the 50 states, the District of Columbia, and U.S. military installations, embassies, and consulates abroad; Puerto Rico and other islands in the Pacific Ocean and the Caribbean Sea that are designated as commonwealths or territories of the United States are excluded. That is, the NIPAs treat U.S. commonwealths and territories as part of the rest of the world, so the flows of goods and services between them and the United States are included in exports and imports. In the ITAs, U.S. commonwealths and territories are included as part of the domestic economy; the flows of goods and services between them and the United States are excluded from exports and imports, but the flows of goods and services between them and the rest of the world are included in exports and imports.8 Table 8.1 shows the types of transactions that are included in, and excluded from, exports and imports in the NIPAs.
Table 8.1—Content of Net Exports
Category of expenditure Comments
Exports of goods With the exception of certain items noted below, includes all new and used goods sold, given away, or otherwise transferred from U.S. residents to foreign residents, valued at the transactions—or market—price at the customs boundaries of the United States.
Includes one service—electrical energy—in accordance with the recommendation of the Balance of Payments and International Investment Position Manual (BPM6).
Excludes certain goods that are classified as services exports: goods purchased and used in the United States by foreign travelers and students; supplies purchased by foreign air and ocean carriers at U.S. ports except fuel and certain nonmilitary goods delivered by military and civilian agencies of the U.S. government to nonresidents in the United States or delivered by U.S. installations abroad to nonresidents.
Excludes sales of dwellings and major improvements because ownership implies either real or notional residency.
Excludes sales of illegal goods because of insufficient source data on illegal activities.
8 BEA’s long-run goal is to make the geographic coverage in the NIPAs consistent with the treatment in the ITAs. BEA has prepared separate GDP estimates for American Samoa, the Northern Mariana Islands, Guam, and the U.S. Virgin Islands for the years beginning with 2002. Although these estimates are not currently integrated with the GDP estimates for the United States, they represent an important first step toward consistency. For more information, go to www.bea.gov/national/gdp_territory.htm.
CHAPTER 8: NET EXPORTS OF GOODS AND SERVICES
8-6
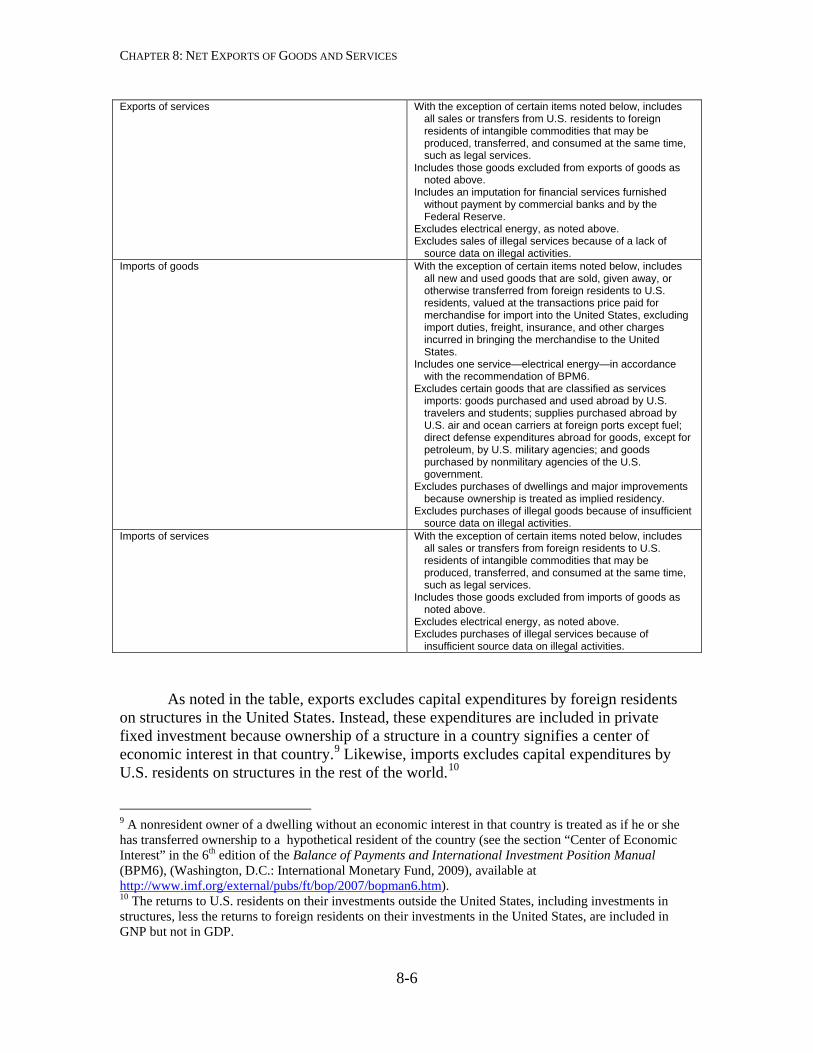
Exports of services With the exception of certain items noted below, includes all sales or transfers from U.S. residents to foreign residents of intangible commodities that may be produced, transferred, and consumed at the same time, such as legal services.
Includes those goods excluded from exports of goods as noted above.
Includes an imputation for financial services furnished without payment by commercial banks and by the Federal Reserve.
Excludes electrical energy, as noted above. Excludes sales of illegal services because of a lack of
source data on illegal activities. Imports of goods With the exception of certain items noted below, includes
all new and used goods that are sold, given away, or otherwise transferred from foreign residents to U.S. residents, valued at the transactions price paid for merchandise for import into the United States, excluding import duties, freight, insurance, and other charges incurred in bringing the merchandise to the United States.
Includes one service—electrical energy—in accordance with the recommendation of BPM6.
Excludes certain goods that are classified as services imports: goods purchased and used abroad by U.S. travelers and students; supplies purchased abroad by U.S. air and ocean carriers at foreign ports except fuel; direct defense expenditures abroad for goods, except for petroleum, by U.S. military agencies; and goods purchased by nonmilitary agencies of the U.S. government.
Excludes purchases of dwellings and major improvements
because ownership is treated as implied residency. Excludes purchases of illegal goods because of insufficient
source data on illegal activities. Imports of services With the exception of certain items noted below, includes
all sales or transfers from foreign residents to U.S. residents of intangible commodities that may be produced, transferred, and consumed at the same time, such as legal services.
Includes those goods excluded from imports of goods as noted above.
Excludes electrical energy, as noted above. Excludes purchases of illegal services because of
insufficient source data on illegal activities.
As noted in the table, exports excludes capital expenditures by foreign residents on structures in the United States. Instead, these expenditures are included in private fixed investment because ownership of a structure in a country signifies a center of economic interest in that country.9 Likewise, imports excludes capital expenditures by U.S. residents on structures in the rest of the world.10
9 A nonresident owner of a dwelling without an economic interest in that country is treated as if he or she has transferred ownership to a hypothetical resident of the country (see the section “Center of Economic Interest” in the 6th edition of the Balance of Payments and International Investment Position Manual (BPM6), (Washington, D.C.: International Monetary Fund, 2009), available at http://www.imf.org/external/pubs/ft/bop/2007/bopman6.htm). 10 The returns to U.S. residents on their investments outside the United States, including investments in structures, less the returns to foreign residents on their investments in the United States, are included in GNP but not in GDP.
CHAPTER 8: NET EXPORTS OF GOODS AND SERVICES
8-7
As the NIPAs do not record transactions in financial assets, exports and imports
do not include sales to, or purchases from, the rest of the world of financial assets (though the fees associated with these transactions are recorded as services provided).11 The NIPAs also do not include illegal goods and services, which are excluded because there are insufficient source data available on illegal activities.12
The principal categories of exports and of imports are goods and services. In the
NIPAs, goods are classified by type of product into broad categories that reflect the more detailed “end-use” classification system used by the ITAs. The end-use classification system for goods, which consists of 145 export categories and 149 import categories, is based on the principal use rather than the physical characteristics of the merchandise, and allows changes in trade to be compared with changes in production, consumption, and income.13
Services exports and imports in the NIPAs are generally classified by type of
service. However, because of data limitations, certain services are instead classified according to the type of transactors associated with them. Examples include services that are exported and imported by U.S. military agencies, which are classified as exports and imports of “government goods and services, n.e.c.” 14
Exports and imports of services in the NIPAs are each grouped into six broad categories that generally correspond to the aggregate categories used in the ITAs: transport, travel (for all purposes including education), charges for the use of intellectual property n.e.c., other business services, government goods and services n.e.c., and other exports or imports.15
11 However, financial transactions are recorded in BEA’s international accounts and in the Federal Reserve Board’s financial accounts (formerly called the flow of funds accounts). 12 For more information on the activities that are included in, and excluded from, production and on the exclusion of financial assets in the NIPAs, see the sections “Production boundary” and “Asset boundary” in chapter 2. 13 The end-use categories used by BEA—such as foods, feeds, and beverages; capital goods; industrial supplies and materials; automotive products; and consumer goods—incorporate the Harmonized Commodity Description and Coding System (Brussels: Customs Cooperation Council): 1984. The system was developed under the auspices of the International Customs Cooperation Council to establish an accepted standard for the classification of internationally traded goods. 14 As part of the 2014 annual update of the NIPAs, a new category, “government goods and services n.e.c.” was introduced for both exports and imports. For exports, this component primarily consists of the previously presented category “transfers under U.S. military agency sales contracts.” For imports, the component primarily consists of the previously presented category “direct defense expenditures.” 15 The category “Other business services” consists of the following categories that are recorded separately in the ITAs: maintenance and repair services n.i.e., insurance services, financial services, telecommunication, computer, and information services, and “other” business services. Prior to the 2014 annual update of the NIPAs, the NIPA categories were travel, passenger fares, other transportation, royalties and license fees, other private services, transfers under U.S. military agency sales contracts (for exports only), direct defense expenditures (for imports only), and other exports or imports; these corresponded to the ITA categories in use prior to the 2014 comprehensive restructuring of the ITAs. See
CHAPTER 8: NET EXPORTS OF GOODS AND SERVICES
8-8
Recording in the NIPAs
As described in chapter 2, the NIPAs can be viewed as aggregations of accounts
belonging to individual transactors in the economy. In this context, net exports represents the difference between the aggregate demand by all foreign residents for goods and services produced in the United States and the aggregate demand by all U.S. residents for goods and services produced outside the United States. In the seven summary accounts of the NIPAs, net exports of goods and services appears on the right, or credit, side of the Domestic Income and Product Account (account 1) as one of the final expenditures components of GDP. In the Foreign Transactions Current Account (account 5), exports of goods and services appears on the left, or debit, side as the largest component of current receipts from the rest of the world, and imports of goods and services appears on the right, or credit, side as the largest component of current payments to the rest of the world. Information on exports and imports of goods and services by type of product and by service category is presented in NIPA table group 4.2. Information on the relationship between the NIPAs and the ITAs is shown in table 4.3. The following is a list of the principal NIPA tables that present estimates of exports and imports: 4.2.1. Percent Change From Preceding Period in Real Exports and in Real Imports of
Goods and Services by Type of Product 4.2.2. Contributions to Percent Change in Real Exports and in Real Imports of Goods
and Services by Type of Product 4.2.3 Real Exports and Imports of Goods and Services by Type of Product, Quantity
Indexes 4.2.4 Price Indexes for Exports and Imports of Goods and Services by Type of Product 4.2.5 Exports and Imports of Goods and Services by Type of Product 4.2.6 Real Exports and Imports of Goods and Services by Type of Product, Chained
Dollars 4.3B Relation of Foreign Transactions in the National Income and Product Accounts to
the Corresponding Items in the International Transactions Accounts The NIPAs also present information on other international transactions, such as income receipts and payments, movements of capital, and taxes and transfer payments. These transactions are recorded in the Foreign Transactions Current Account (account 5) and in the Foreign Transactions Capital Account (account 7), as well as in NIPA table 4.1.
McCulla, Holdren, and Smith, p. 4, and see the section “Comprehensive Restructuring of the International Economic Accounts” on the International page of BEA’s website.
CHAPTER 8: NET EXPORTS OF GOODS AND SERVICES
8-9
The ITAs present information on exports and imports in greater detail than in the NIPAs. For example, ITA table group 2 presents measures of U.S. exports and imports of goods by area and by country, and ITA table group 3 presents measures of exports and imports of more detailed services categories by area and by country.16
Overview of Source Data and Estimating Methods
As described earlier in the handbook, most of the NIPA estimates are prepared using a wide variety of source data (see “Chapter 3: Principal Source Data”) and using estimating methods that adjust the source data to the required NIPA concepts and that fill in gaps in coverage and timing (see “Chapter 4: Estimating Methods”). Tables 8.A (exports of goods and services) and 8.B (imports of goods and services) at the end of this chapter summarize the source data and estimating methods that are used to prepare the current-dollar benchmark estimates, nonbenchmark annual estimates, and current quarterly estimates, as well as the quantity and price indexes, for the categories of exports and imports shown in NIPA table group 4.2.
The NIPA estimates of exports and imports are primarily based on the ITA
estimates of exports and imports, though they also incorporate certain adjustments and other differences that reflect different revision schedules, geographic boundaries, and treatments for certain transactions (see the section “Adjustments and other differences between the NIPA and ITA estimates” below). In turn, the ITA estimates for goods are based primarily on Census Bureau data on trade in goods, and the ITA estimates for services are based primarily on data collected on BEA surveys and on data reported by other U.S. government agencies.17
Specifically, the ITA estimates of exports and imports of goods are based
primarily on monthly compilations by the Census Bureau of data that are collected by the U.S. Customs and Border Protection, within the U.S. Department of Homeland Security. These data reflect the movement of goods between foreign countries and the United States. They exclude the following: shipments between the United States and its commonwealths and territories; shipments between the United States and its military, diplomatic, and consular installations abroad; shipments of U.S. goods returned to the United States by its Armed Forces; shipments of the personal and household effects of travelers; and shipments of goods that are in transit. The data on goods are valued at the transactions price at the port of exportation, which includes inland freight, insurance, and other charges incurred in placing the goods alongside the carrier. Loading costs and freight charges for transportation of goods beyond the port of exportation are assumed to
16 See “Table 2.1 U.S. International Trade in Goods” and “Table 3.1 U.S. International Trade in Services,” on BEA’s Website at www.bea.gov; under “Interactive Data” select “International Transactions and IIP” and then “International Transactions (ITA).” 17 For an overview of the source data and estimating methods used in preparing the ITAs, see “U.S. International Economic Accounts: Concepts and Methods” on the “Methodologies” tab of the International page of BEA’s Website.
CHAPTER 8: NET EXPORTS OF GOODS AND SERVICES
8-10
be paid by the importing country; in the ITAs, these charges are included as exports or imports in “other” transportation services.
The ITA estimates of exports and imports of services are based primarily on 10 mandatory BEA “benchmark” and quarterly surveys of international services transactions.18 These surveys provide information on the receipts and payments for a variety of services and for various types of intangible assets (such as intellectual property). The ITAs also use data from surveys conducted by other U.S. government agencies and mandatory reports submitted to BEA by U.S. government agencies engaged in international transactions. These data are used in deriving estimates of travel, transport, and government goods and services n.e.c. Finally, a variety of published and unpublished source data—including information from U.S. government budgetary documents, from international organizations, from trade associations, and from various other international transactors—are used in deriving certain ITA estimates of services.
Benchmark-year and nonbenchmark-year estimates The benchmark and nonbenchmark annual NIPA estimates are derived using essentially the same methodologies. The differences between the benchmark and nonbenchmark annual NIPA estimates relate to the vintage of ITA data used and the number of years for which revisions are incorporated. Each annual NIPA revision (which generally occurs in July) incorporates on a best-level basis the revised statistics from the most recent annual revision of the ITAs (which generally occurs in June).19 The time spans of the ITA revisions are not generally limited. However, the annual NIPA revisions are generally limited to the previous 3 years, although the adoption of flexible annual updates in 2010 allows the expansion to additional years if warranted.20 Therefore, unless the revision period is expanded, the NIPA estimates for earlier years will differ from the ITA estimates by the revisions incorporated into the ITAs but not incorporated into the NIPAs (as well as by the other revisions incorporated into the NIPAs but not into the ITAs). As a result, the NIPA time series of foreign transactions may reflect a discontinuity between the years covered by the NIPA annual update and the preceding years. The discontinuities within the NIPA series and the statistical differences between the NIPAs and the ITAs are generally resolved during benchmark revisions of the NIPAs (which generally occur every 5 years and which incorporate revisions as far back as necessary).21 However, the adjustments 18 In this context, “benchmark” refers to the comprehensive nature of the survey and not to the NIPA comprehensive, or “benchmark,” revisions. 19 See “Best level and best change” in chapter 4. 20 BEA’s flexible approach to annual updates is described in “BEA Briefing: Improving BEA’s Accounts Through Flexible Annual Revisions,” Survey 88 (June 2008): 29-32. 21 During the 2013 comprehensive update of the NIPAs, estimates from the most recent annual revision of the ITAs were incorporated into the NIPAs for only the most recent 3 years; the revisions to the ITAs for years back to 1999 were incorporated as part of the 2014 annual update of the NIPAs. The discontinuities in NIPA series are usually presented in the Survey with the results of the annual or comprehensive update.
CHAPTER 8: NET EXPORTS OF GOODS AND SERVICES
8-11
and other differences described below will remain, and new differences between the two sets of accounts may be introduced when definitional or statistical changes are implemented in the NIPAs during benchmark revisions that are not fully incorporated into the ITAs. NIPA table 4.3 provides a complete reconciliation of the differences between the NIPAs and the ITAs. Current quarterly estimates
Monthly statistics on trade in goods, based on Census Bureau compilations of the
customs data, and on trade in services, primarily based on BEA surveys and on data reported by other U.S. government agencies, are provided in a Census Bureau-BEA news release.22
For exports and imports of goods, the “advance” quarterly NIPA estimates are
based on Census Bureau trade data for the first 2 months of the quarter and the Census advanced trade report for the 3rd month of the quarter. “Second” quarterly NIPA estimates are based on the Census Bureau data for all three months of the quarter. The “third” quarterly NIPA estimates are based on the quarterly ITAs, which incorporate revised Census Bureau data.23
For exports and imports of services, the “advance” and “second” quarterly NIPA
estimates are largely based on various ITA indicator series that are used to extrapolate from the latest source data. The “third” quarterly NIPA estimates are based on the quarterly ITA estimates, which incorporate data from BEA transportation surveys, extrapolations of BEA survey data on royalties and license fees and “other” private services, and data reported by other U.S. government agencies (and which are used to revise the monthly trade data). The ITA quarterly estimates are incorporated into the NIPA estimates on a “best-change” basis.24 After the third current quarterly estimate, the NIPA estimates of net exports are not revised again until the next annual update. Adjustments and other differences between the NIPA and ITA estimates
As noted above, the NIPA estimates of exports and imports are equal to the ITA estimates with the exception of certain adjustments and other differences that reflect revision schedules, geographic boundaries, and treatments for certain transactions. These For example, see the box, “Discontinuities in NIPA Foreign Transactions” in Stephanie H. McCulla, Alyssa E. Holdren, and Shelly Smith, “Improved Estimates of the National Income and Product Accounts: Results of the 2013 Comprehensive Revision,” Survey 93 (September 2013): 31. 22 See “U.S. International Trade in Goods and Services” on the International page of BEA’s Website; select “News Release: International Transactions.” 23 For information on BEA’s adjustments to the Census data, see the “Information on Goods and Services” section of the “U.S. International Trade in Goods and Services” news release, and see ITA table 2.4 on the ITA section of the Interactive Data page on BEA’s Website. 24 See “Best level and best change” in chapter 4.
CHAPTER 8: NET EXPORTS OF GOODS AND SERVICES
8-12
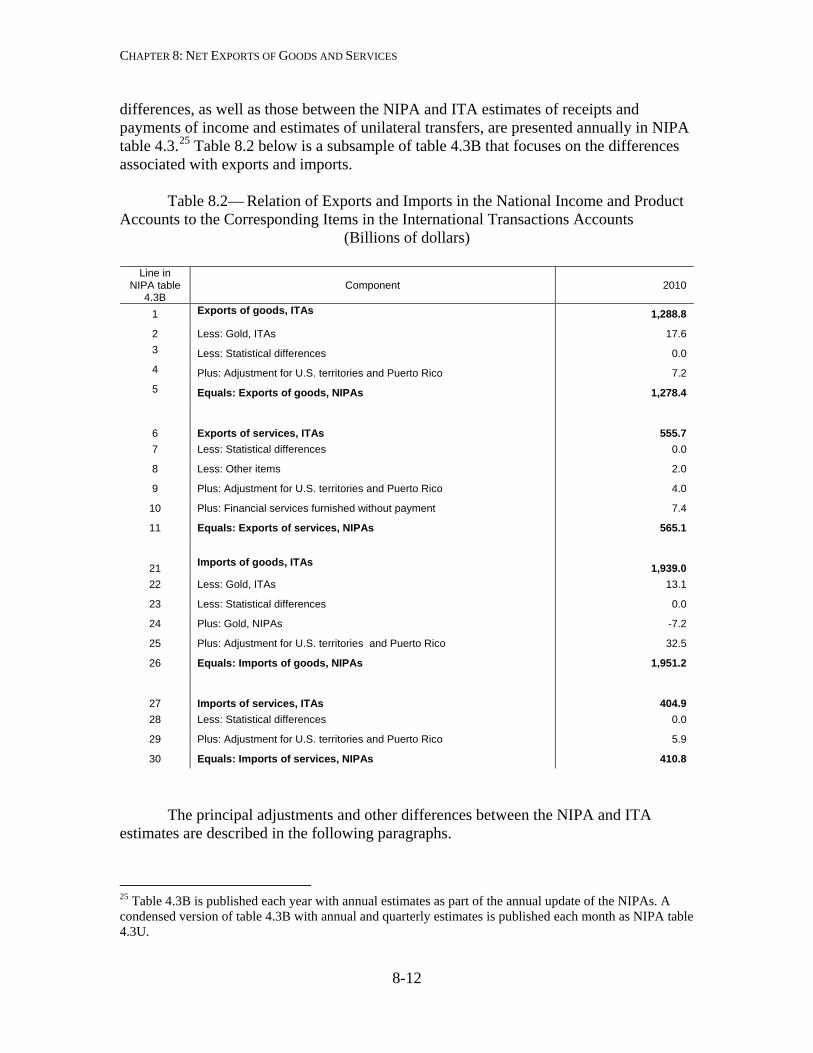
differences, as well as those between the NIPA and ITA estimates of receipts and payments of income and estimates of unilateral transfers, are presented annually in NIPA table 4.3.25 Table 8.2 below is a subsample of table 4.3B that focuses on the differences associated with exports and imports.
Table 8.2— Relation of Exports and Imports in the National Income and Product
Accounts to the Corresponding Items in the International Transactions Accounts (Billions of dollars)
Line in
NIPA table 4.3B
Component 2010
1 Exports of goods, ITAs 1,288.8
2 Less: Gold, ITAs 17.6 3 Less: Statistical differences 0.0 4 Plus: Adjustment for U.S. territories and Puerto Rico 7.2 5 Equals: Exports of goods, NIPAs 1,278.4
6
Exports of services, ITAs
555.7 7 Less: Statistical differences 0.0
8 Less: Other items 2.0
9 Plus: Adjustment for U.S. territories and Puerto Rico 4.0
10 Plus: Financial services furnished without payment 7.4
11 Equals: Exports of services, NIPAs 565.1
21
Imports of goods, ITAs
1,939.0 22 Less: Gold, ITAs 13.1
23 Less: Statistical differences 0.0
24 Plus: Gold, NIPAs -7.2
25 Plus: Adjustment for U.S. territories and Puerto Rico 32.5
26 Equals: Imports of goods, NIPAs 1,951.2
27
Imports of services, ITAs
404.9 28 Less: Statistical differences 0.0
29 Plus: Adjustment for U.S. territories and Puerto Rico 5.9
30 Equals: Imports of services, NIPAs 410.8
The principal adjustments and other differences between the NIPA and ITA
estimates are described in the following paragraphs.
25 Table 4.3B is published each year with annual estimates as part of the annual update of the NIPAs. A condensed version of table 4.3B with annual and quarterly estimates is published each month as NIPA table 4.3U.
CHAPTER 8: NET EXPORTS OF GOODS AND SERVICES
8-13
Adjustment of gold (lines 2, 18, and 20). Gold is used for two purposes: for industrial demand (as an input into the production of goods and services, such as jewelry, watches, and electronic equipment) and for investment (as a store of wealth and a hedge against inflation). In the NIPAs, all domestic production of gold, regardless of its final use, is included in GDP. However, the NIPAs do not treat transactions in valuables, such as gold, as investments in fixed assets, and so investments in gold (other than gold held in industrial inventories) are not reflected in gross domestic purchases (PCE, gross private domestic investment, and government consumption expenditures and gross investment).26 For example, if households purchase gold as a form of investment, including that purchase in PCE would distort the analysis of consumption and saving. In contrast, in the SNA, the capital account includes the net acquisition of gold and similar valuables (such as antiques and other art objects) that are held as stores of value in gross fixed capital formation as “Acquisitions less disposals of valuables.” Only a small share of the international transactions in nonmonetary gold recorded in the ITAs is for business or industrial use; most transactions are for investment or other purposes. Consequently, the NIPA estimates for exports and imports of nonmonetary gold are not based on the ITA estimates. Instead, the NIPAs incorporate a special adjustment for transactions in gold. The NIPA estimates for gold begin with an estimate of domestic production of gold, which is included in GDP and in the associated gross domestic income for gold. Domestic gold production is measured as the sum of mine production of gold and of secondary production of gold in the United States multiplied by the average price of gold.27 Annual estimates of gold production are based on data provided by Gold Fields Mineral Services (GFMS), and quarterly estimates are based on data provided by the U.S. Geological Survey’s Mineral Industry Surveys—Precious Metals. The average price of gold is based on the producer price index for gold from the Bureau of Labor Statistics (BLS). Part of domestic gold production is for domestic industrial use (that is, business transactions in gold used for production of final goods, such as jewelry, specialty coins, and medals and for electronics and dental applications). Annual and quarterly estimates of industrial demand for gold are derived using GFMS data on gold used for production multiplied by the average price of gold. The difference between domestic gold production and industrial demand for gold is entered into the NIPAs in the form of an adjustment to net exports: specifically, the adjustment consists of removing the ITA estimates of exports (line 2) and imports (line 18) of nonmonetary gold and of adding “Gold, NIPAs” (line 20) to imports with its sign
26 Because source data do not allow a complete accounting of valuables for the United States, investments in valuables are not included in the NIPAs. See “Asset boundary” in chapter 2. 27 Secondary production of gold is the supply of gold available from scrap (used gold).
CHAPTER 8: NET EXPORTS OF GOODS AND SERVICES
8-14
reversed.28 This treatment maintains the relationship of GDP to gross domestic purchases (gross domestic purchases is equal to GDP minus net exports) while protecting the integrity of the other final expenditures components of GDP.29 Adjustment for statistical differences (lines 3, 7, 19, and 24). The lines in table 8.2 for “statistical differences” reconcile the different revision cycles of the NIPAs and the ITAs discussed earlier. Adjustment for U.S. territories (lines 4, 9, 21, and 25). As discussed earlier, the “U.S. estimates” for the NIPAs cover the 50 states, the District of Columbia, and U.S. military installations, embassies, and consulates abroad, while the “U.S. estimates” for the ITAs include these geographical areas as well as commonwealths and territories of the United States. Therefore, an adjustment must be made to the ITA statistics to make the geographic coverage consistent with the NIPA coverage. In practice, the adjustment is made only for Puerto Rico and the U.S. Virgin Islands; the value of trade with other U.S. territories and commonwealths is relatively small. The adjustment consists of adding the value of U.S. trade with Puerto Rico and with the U.S. Virgin Islands to the ITA estimates and of deducting the value of their trade with the rest of the world from the ITA estimates. For U.S. exports and imports of goods to and from Puerto Rico and the U.S. Virgin Islands and for exports and imports between them and the rest of the world, the annual and quarterly estimates for the adjustments are based on the balance of payments accounts for those territories.
For exports and imports of services, the annual estimates of the value of U.S. exports to, and imports from, Puerto Rico are based on balance-of-payments data from Puerto Rico, and the quarterly estimates are based on judgmental trend. There is no territorial adjustment in the NIPAs for U.S. services exported to, or imported from, the U.S. Virgin Islands; however, the data for exports and imports of goods suggest that the value for services is very small. There is also no adjustment for the value of trade in services between either Puerto Rico or the U.S. Virgin Islands and the rest of the world; total trade data suggest that these values are also very small.
Adjustment for other items (line 8). In the ITAs, certain military grant transfers are treated as exports of services. In the NIPAs, some transfers of services under military grant programs, such as peace and humanitarian operations, are included in federal government transfer payments. Thus, an adjustment is made to remove these transfers from the ITA data on exports of services.
28 Thus, if domestic gold production exceeds industrial demand for gold (as it has since 1987), the excess supply of gold is available for export or for use as a store of valuables by domestic investors. If industrial demand exceeds domestic production, the gap in the supply of gold would need to be filled by imports. 29 This treatment is not strictly appropriate for analyses of international competitiveness, but its effects will not be significant as long as the net values remain small and stable.
CHAPTER 8: NET EXPORTS OF GOODS AND SERVICES
8-15
Adjustment for financial services furnished without payment (line 10). In the NIPAs, an imputation is made for the value of the services (such as check-clearing, recordkeeping, and investment services) that are provided to depositors and to borrowers by financial intermediaries without explicit charge. This imputation for “financial services furnished without payment” is made so that GDP and its components will be invariant to whether the charges for these services are implicit or explicit.30 The ITAs do not include this imputation.
For depositor services, the adjustment arises because U.S. depository institutions provide services to nonresidents for which they implicitly compensate themselves by paying depositors less interest on their deposits than the interest that the depository institutions earn from lending or investing funds. Thus, in the NIPAs, a depositor service is imputed as “financial services furnished without payment” and is recorded in exports of “other” services and as a corresponding entry in income payments to the rest of the world. Similarly, for borrower services, the adjustment arises because nonresidents pay a higher interest rate for loans in exchange for the unpriced services provided to them by U.S. institutions. The imputed borrower service is recorded in exports of “other” services, and a corresponding entry is subtracted from income receipts from the rest of the world. The adjustments for depositor services and income payments are offsetting, as are those for borrower services and income receipts, so there is no net impact on the balance on current account.
Quantity and price estimates In general, the estimates of quantities purchased, or real spending, for the most detailed components of most exports and imports are prepared by deflation. In the deflation method, the quantities are calculated by dividing the current-dollar value of the component by an “appropriate” price index with the reference year set equal to 100.
For most categories of exports and imports of goods, the closest price indexes are BLS export and import price indexes. However, for several categories of capital goods that have known quality-adjustment problems, other quality-adjusted indexes are substituted. In particular, quality-adjusted prices from the Federal Reserve Board are used in deflating exports and imports of communication equipment,31 the BLS producer price index (PPI) for semiconductors and related device manufacturing is used in deflating
30 Financial services furnished without payment by commercial banks and by the Federal Reserve to foreign commercial banks and to foreign governments are treated as exports of services. The underlying concepts and the source data and methods used for the imputation for commercial banks and its allocation are described in detail in “Financial services furnished without payment” in the technical note to “Chapter 5: Personal Consumption Expenditures.” The source data for the imputation for the Federal Reserve are based on data on Federal Reserve transactions, assets, and liabilities from the balance sheet of the Federal Reserve. 31 See Seskin and Smith, 23.
CHAPTER 8: NET EXPORTS OF GOODS AND SERVICES
8-16
exports of semiconductors,32 and a BEA quality-adjusted hedonic price index is used in deflating imports of photocopier equipment.33 Finally, several types of exports and imports of transportation equipment are deflated using specific PPIs, because export and import price indexes are not available at that level of detail.34
For most categories of services, BLS export or import prices are not available. Instead, PPIs, consumer price indexes, or BEA composite indexes of prices or of input costs are used for deflation.35
In addition, the quantity estimates for several categories of exports and imports
are prepared using methods other than deflation. For example, the quantity estimates for petroleum and petroleum products imports are prepared using direct valuation—that is, by multiplying the base-year price by the current-period quantity data, and the quantity estimates for insurance and for services furnished without payment are prepared using quantity extrapolation—that is, by extrapolating the base-year values by quantity indicators. (For general descriptions of the above methods, see “Estimates for detailed components” in chapter 4.)
The aggregate measures of exports and imports are calculated from the detailed
components as chain-type quantity and price indexes (for information about these calculations, see “Estimates for NIPA aggregates” in chapter 4). BEA also prepares measures of real exports and imports and their components in a dollar-denominated form, designated “chained-dollar” estimates (see “Chained-dollar measures” in chapter 4). Net exports in chained dollars is calculated as the difference between chained-dollar exports and chained-dollar imports—that is, real net exports is derived as the difference between real exports and real imports.36
32 See Robert P. Parker and Eugene P. Seskin, “Annual Revision of the National Income and Product Accounts,” Survey 77 (August 1997): 30. 33 See Carol E. Moylan and Brooks B. Robinson, “Preview of the 2003 Comprehensive Revision of the National Income and Product Accounts: Statistical Changes,” Survey 83 (September 2003): 30. 34 For goods, the deflation is carried out for 104 categories of exports and for 113 categories of imports. 35 For services, the deflation is carried out for 38 categories of exports and for 30 categories of imports. 36 The Fisher formula cannot be used to compute quantity and price indexes for “net exports” because it would require taking the square root of a negative number. For more information, see the “Calculation of Output and Price Indexes” in the appendix to chapter 4.
CHAPTER 8: NET EXPORTS OF GOODS AND SERVICES
8-17
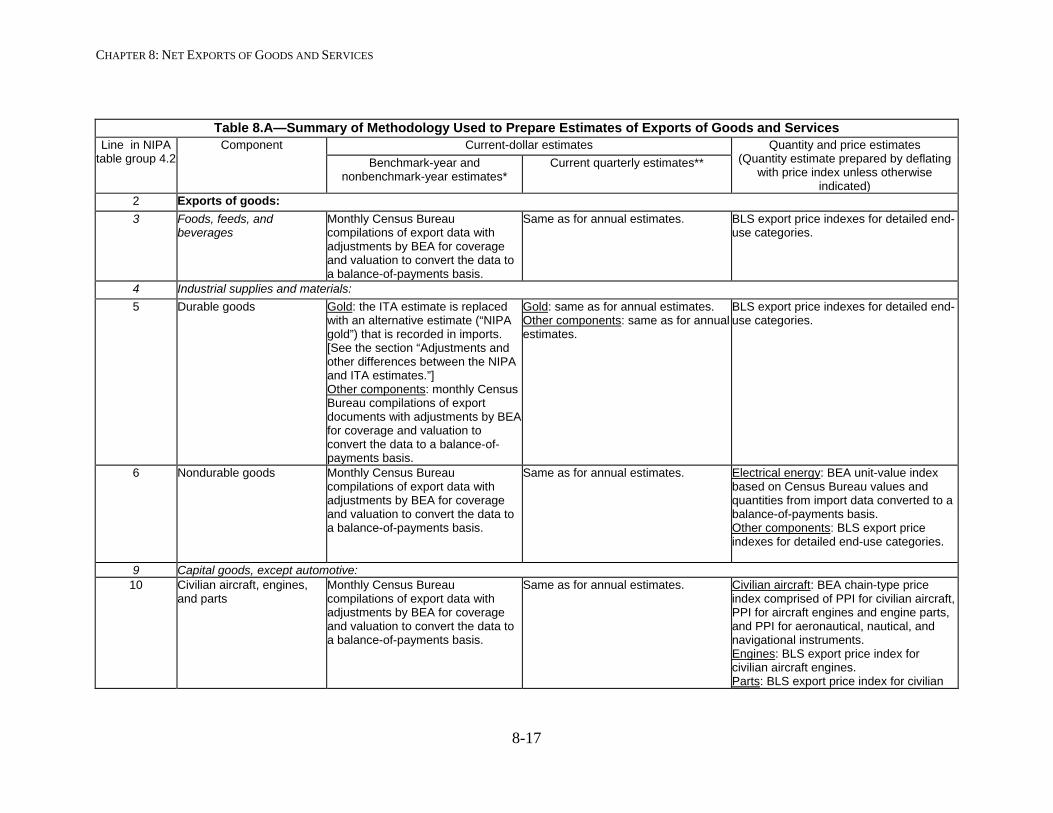
Table 8.A—Summary of Methodology Used to Prepare Estimates of Exports of Goods and Services Line in NIPA
table group 4.2 Component
Current-dollar estimates Quantity and price estimates
(Quantity estimate prepared by deflating with price index unless otherwise
indicated)
Benchmark-year and nonbenchmark-year estimates*
Current quarterly estimates**
2 Exports of goods: 3 Foods, feeds, and
beverages Monthly Census Bureau compilations of export data with adjustments by BEA for coverage and valuation to convert the data to a balance-of-payments basis.
Same as for annual estimates. BLS export price indexes for detailed end-use categories.
4 Industrial supplies and materials: 5 Durable goods Gold: the ITA estimate is replaced
with an alternative estimate (“NIPA gold”) that is recorded in imports. [See the section “Adjustments and other differences between the NIPA and ITA estimates.”] Other components: monthly Census Bureau compilations of export documents with adjustments by BEA for coverage and valuation to convert the data to a balance-of-payments basis.
Gold: same as for annual estimates. Other components: same as for annual estimates.
BLS export price indexes for detailed end-use categories.
6 Nondurable goods Monthly Census Bureau compilations of export data with adjustments by BEA for coverage and valuation to convert the data to a balance-of-payments basis.
Same as for annual estimates. Electrical energy: BEA unit-value index based on Census Bureau values and quantities from import data converted to a balance-of-payments basis. Other components: BLS export price indexes for detailed end-use categories.
9 Capital goods, except automotive: 10 Civilian aircraft, engines,
and parts Monthly Census Bureau compilations of export data with adjustments by BEA for coverage and valuation to convert the data to a balance-of-payments basis.
Same as for annual estimates. Civilian aircraft: BEA chain-type price index comprised of PPI for civilian aircraft, PPI for aircraft engines and engine parts, and PPI for aeronautical, nautical, and navigational instruments. Engines: BLS export price index for civilian aircraft engines. Parts: BLS export price index for civilian
CHAPTER 8: NET EXPORTS OF GOODS AND SERVICES
8-18
Table 8.A—Summary of Methodology Used to Prepare Estimates of Exports of Goods and Services Line in NIPA
table group 4.2 Component
Current-dollar estimates Quantity and price estimates
(Quantity estimate prepared by deflating with price index unless otherwise
indicated)
Benchmark-year and nonbenchmark-year estimates*
Current quarterly estimates**
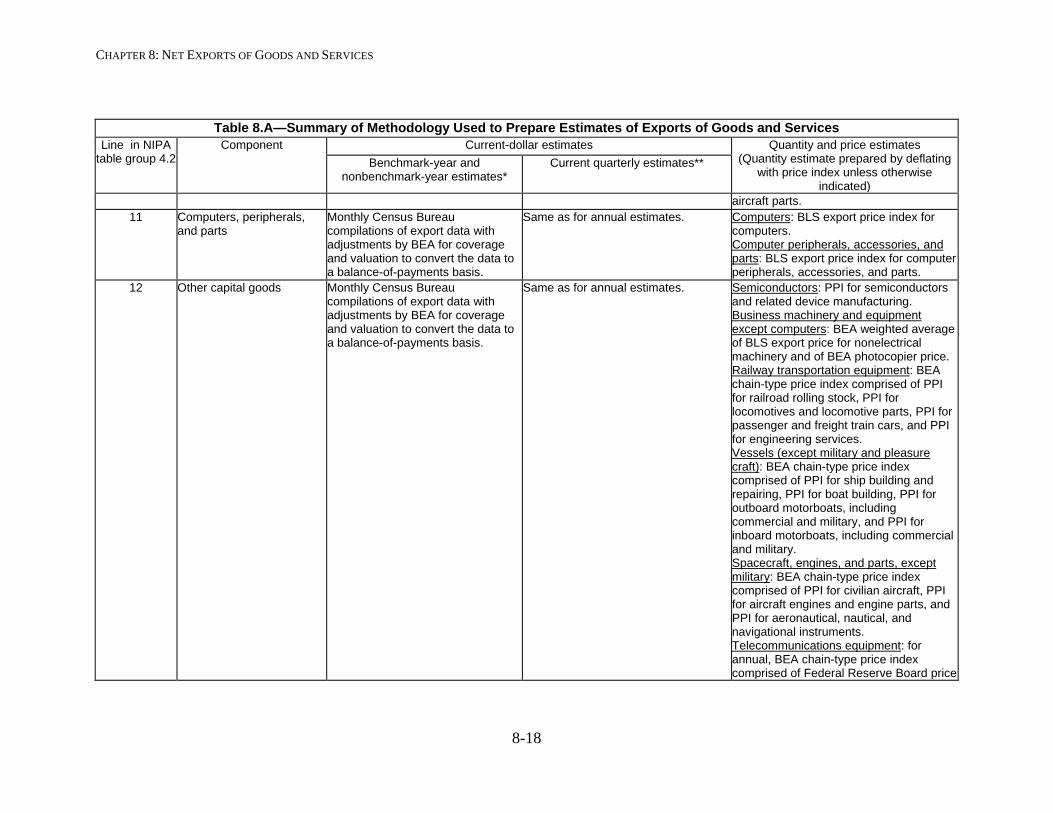
aircraft parts. 11 Computers, peripherals,
and parts Monthly Census Bureau compilations of export data with adjustments by BEA for coverage and valuation to convert the data to a balance-of-payments basis.
Same as for annual estimates. Computers: BLS export price index for computers. Computer peripherals, accessories, and parts: BLS export price index for computer peripherals, accessories, and parts.
12 Other capital goods Monthly Census Bureau compilations of export data with adjustments by BEA for coverage and valuation to convert the data to a balance-of-payments basis.
Same as for annual estimates. Semiconductors: PPI for semiconductors and related device manufacturing. Business machinery and equipment except computers: BEA weighted average of BLS export price for nonelectrical machinery and of BEA photocopier price. Railway transportation equipment: BEA chain-type price index comprised of PPI for railroad rolling stock, PPI for locomotives and locomotive parts, PPI for passenger and freight train cars, and PPI for engineering services. Vessels (except military and pleasure craft): BEA chain-type price index comprised of PPI for ship building and repairing, PPI for boat building, PPI for outboard motorboats, including commercial and military, and PPI for inboard motorboats, including commercial and military. Spacecraft, engines, and parts, except military: BEA chain-type price index comprised of PPI for civilian aircraft, PPI for aircraft engines and engine parts, and PPI for aeronautical, nautical, and navigational instruments. Telecommunications equipment: for annual, BEA chain-type price index comprised of Federal Reserve Board price
CHAPTER 8: NET EXPORTS OF GOODS AND SERVICES
8-19
Table 8.A—Summary of Methodology Used to Prepare Estimates of Exports of Goods and Services Line in NIPA
table group 4.2 Component
Current-dollar estimates Quantity and price estimates
(Quantity estimate prepared by deflating with price index unless otherwise
indicated)
Benchmark-year and nonbenchmark-year estimates*
Current quarterly estimates**
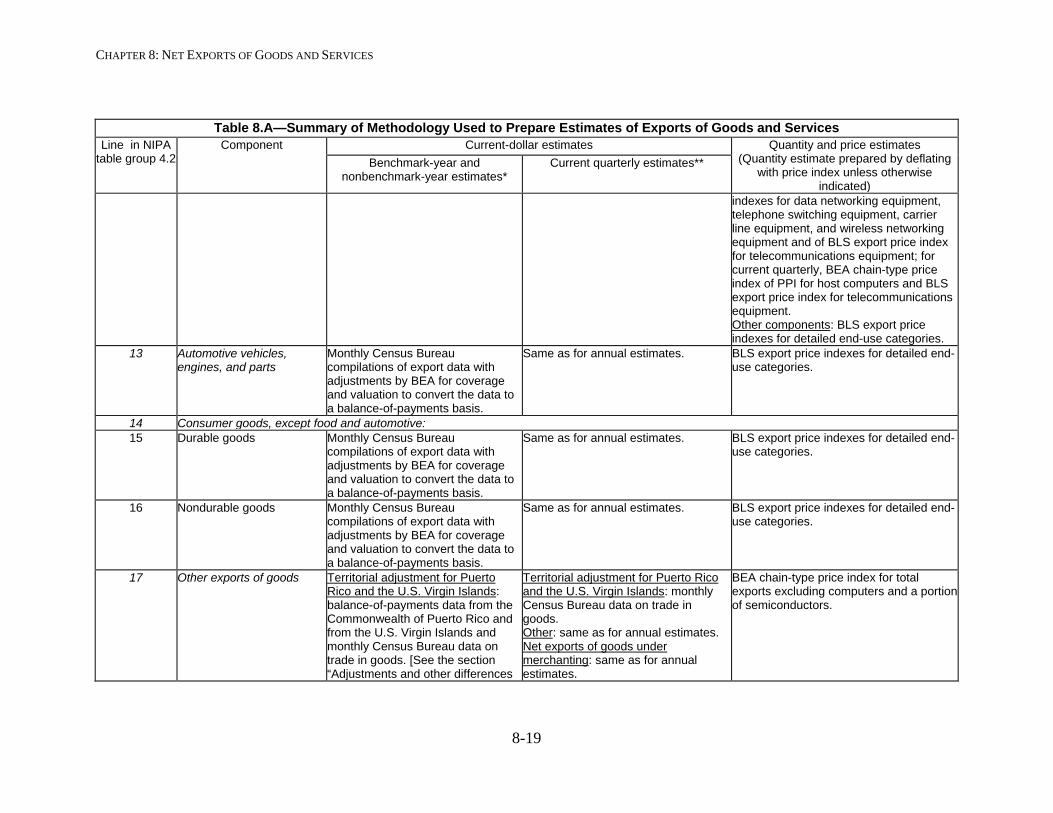
indexes for data networking equipment, telephone switching equipment, carrier line equipment, and wireless networking equipment and of BLS export price index for telecommunications equipment; for current quarterly, BEA chain-type price index of PPI for host computers and BLS export price index for telecommunications equipment. Other components: BLS export price indexes for detailed end-use categories.
13 Automotive vehicles, engines, and parts
Monthly Census Bureau compilations of export data with adjustments by BEA for coverage and valuation to convert the data to a balance-of-payments basis.
Same as for annual estimates. BLS export price indexes for detailed end-use categories.
14 Consumer goods, except food and automotive: 15 Durable goods Monthly Census Bureau
compilations of export data with adjustments by BEA for coverage and valuation to convert the data to a balance-of-payments basis.
Same as for annual estimates. BLS export price indexes for detailed end-use categories.
16 Nondurable goods Monthly Census Bureau compilations of export data with adjustments by BEA for coverage and valuation to convert the data to a balance-of-payments basis.
Same as for annual estimates. BLS export price indexes for detailed end-use categories.
17 Other exports of goods Territorial adjustment for Puerto Rico and the U.S. Virgin Islands: balance-of-payments data from the Commonwealth of Puerto Rico and from the U.S. Virgin Islands and monthly Census Bureau data on trade in goods. [See the section “Adjustments and other differences
Territorial adjustment for Puerto Rico and the U.S. Virgin Islands: monthly Census Bureau data on trade in goods. Other: same as for annual estimates. Net exports of goods under merchanting: same as for annual estimates.
BEA chain-type price index for total exports excluding computers and a portion of semiconductors.
CHAPTER 8: NET EXPORTS OF GOODS AND SERVICES
8-20
Table 8.A—Summary of Methodology Used to Prepare Estimates of Exports of Goods and Services Line in NIPA
table group 4.2 Component
Current-dollar estimates Quantity and price estimates
(Quantity estimate prepared by deflating with price index unless otherwise
indicated)
Benchmark-year and nonbenchmark-year estimates*
Current quarterly estimates**
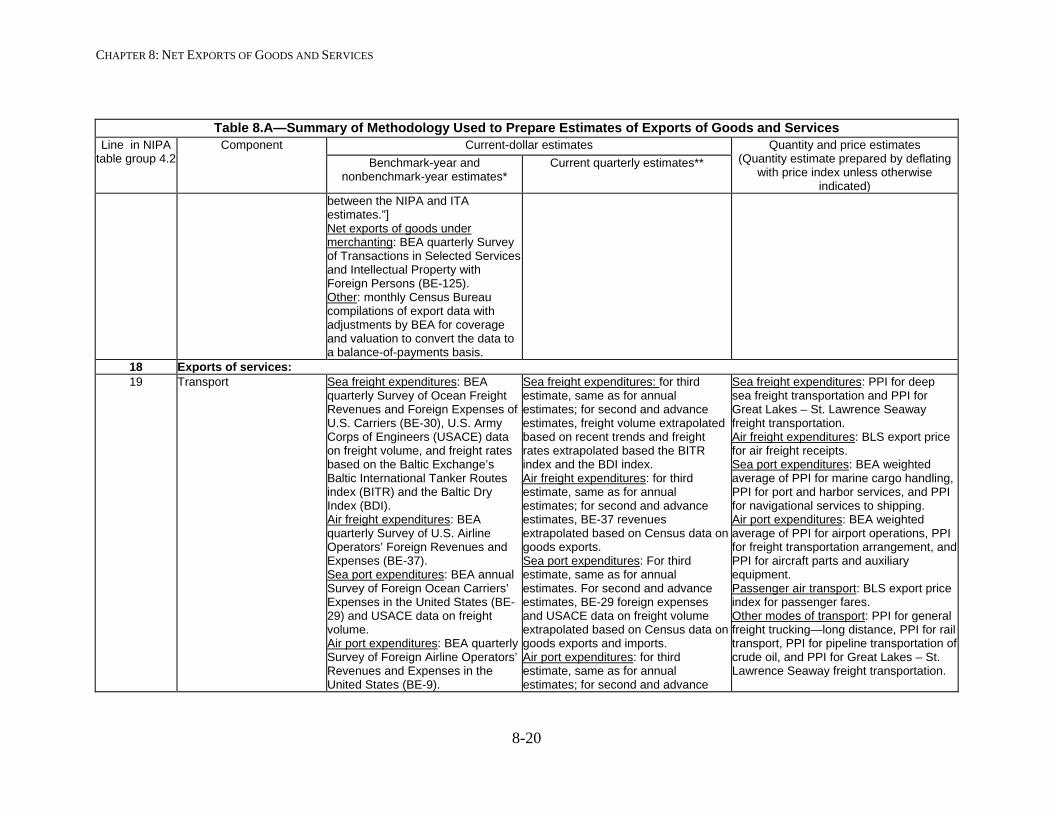
between the NIPA and ITA estimates.”] Net exports of goods under merchanting: BEA quarterly Survey of Transactions in Selected Services and Intellectual Property with Foreign Persons (BE-125). Other: monthly Census Bureau compilations of export data with adjustments by BEA for coverage and valuation to convert the data to a balance-of-payments basis.
18 Exports of services: 19 Transport Sea freight expenditures: BEA
quarterly Survey of Ocean Freight Revenues and Foreign Expenses of U.S. Carriers (BE-30), U.S. Army Corps of Engineers (USACE) data on freight volume, and freight rates based on the Baltic Exchange’s Baltic International Tanker Routes index (BITR) and the Baltic Dry Index (BDI). Air freight expenditures: BEA quarterly Survey of U.S. Airline Operators’ Foreign Revenues and Expenses (BE-37). Sea port expenditures: BEA annual Survey of Foreign Ocean Carriers’ Expenses in the United States (BE-29) and USACE data on freight volume. Air port expenditures: BEA quarterly Survey of Foreign Airline Operators’ Revenues and Expenses in the United States (BE-9).
Sea freight expenditures: for third estimate, same as for annual estimates; for second and advance estimates, freight volume extrapolated based on recent trends and freight rates extrapolated based the BITR index and the BDI index. Air freight expenditures: for third estimate, same as for annual estimates; for second and advance estimates, BE-37 revenues extrapolated based on Census data on goods exports. Sea port expenditures: For third estimate, same as for annual estimates. For second and advance estimates, BE-29 foreign expenses and USACE data on freight volume extrapolated based on Census data on goods exports and imports. Air port expenditures: for third estimate, same as for annual estimates; for second and advance
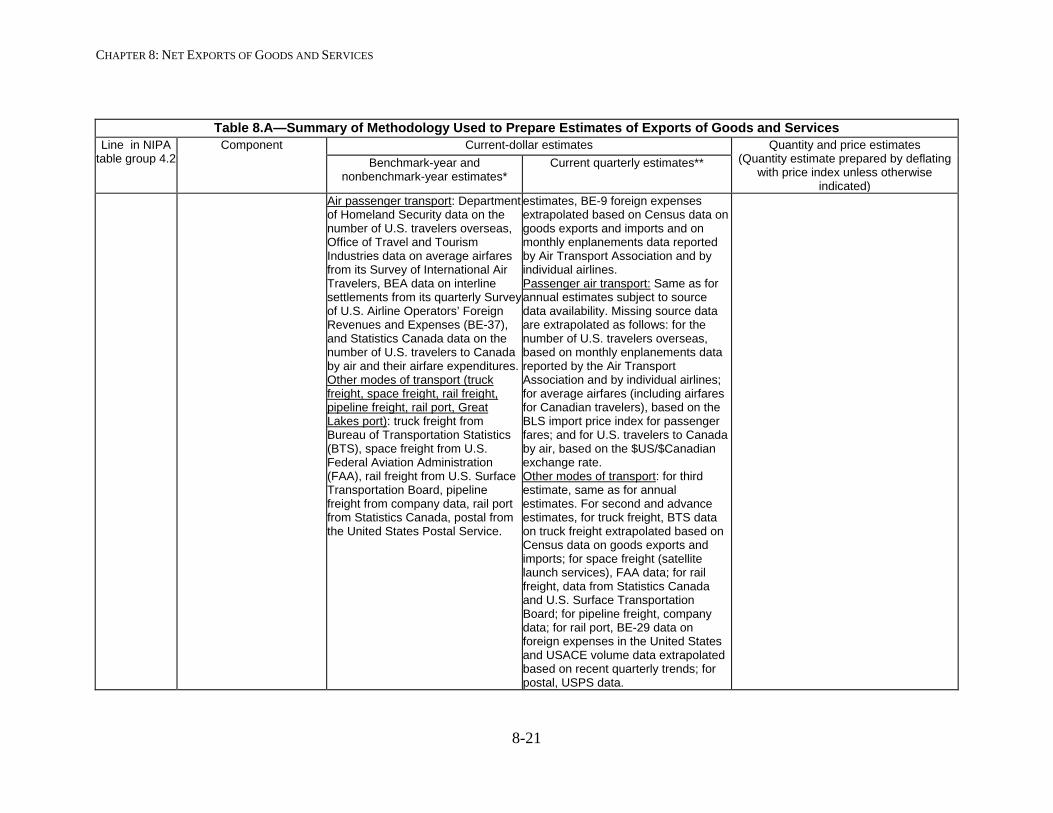
Sea freight expenditures: PPI for deep sea freight transportation and PPI for Great Lakes – St. Lawrence Seaway freight transportation. Air freight expenditures: BLS export price for air freight receipts. Sea port expenditures: BEA weighted average of PPI for marine cargo handling, PPI for port and harbor services, and PPI for navigational services to shipping. Air port expenditures: BEA weighted average of PPI for airport operations, PPI for freight transportation arrangement, and PPI for aircraft parts and auxiliary equipment. Passenger air transport: BLS export price index for passenger fares. Other modes of transport: PPI for general freight trucking—long distance, PPI for rail transport, PPI for pipeline transportation of crude oil, and PPI for Great Lakes – St. Lawrence Seaway freight transportation.
CHAPTER 8: NET EXPORTS OF GOODS AND SERVICES
8-21
Table 8.A—Summary of Methodology Used to Prepare Estimates of Exports of Goods and Services Line in NIPA
table group 4.2 Component
Current-dollar estimates Quantity and price estimates
(Quantity estimate prepared by deflating with price index unless otherwise
indicated)
Benchmark-year and nonbenchmark-year estimates*
Current quarterly estimates**
Air passenger transport: Department of Homeland Security data on the number of U.S. travelers overseas, Office of Travel and Tourism Industries data on average airfares from its Survey of International Air Travelers, BEA data on interline settlements from its quarterly Survey of U.S. Airline Operators’ Foreign Revenues and Expenses (BE-37), and Statistics Canada data on the number of U.S. travelers to Canada by air and their airfare expenditures. Other modes of transport (truck freight, space freight, rail freight, pipeline freight, rail port, Great Lakes port): truck freight from Bureau of Transportation Statistics (BTS), space freight from U.S. Federal Aviation Administration (FAA), rail freight from U.S. Surface Transportation Board, pipeline freight from company data, rail port from Statistics Canada, postal from the United States Postal Service.
estimates, BE-9 foreign expenses extrapolated based on Census data on goods exports and imports and on monthly enplanements data reported by Air Transport Association and by individual airlines. Passenger air transport: Same as for annual estimates subject to source data availability. Missing source data are extrapolated as follows: for the number of U.S. travelers overseas, based on monthly enplanements data reported by the Air Transport Association and by individual airlines; for average airfares (including airfares for Canadian travelers), based on the BLS import price index for passenger fares; and for U.S. travelers to Canada by air, based on the $US/$Canadian exchange rate. Other modes of transport: for third estimate, same as for annual estimates. For second and advance estimates, for truck freight, BTS data on truck freight extrapolated based on Census data on goods exports and imports; for space freight (satellite launch services), FAA data; for rail freight, data from Statistics Canada and U.S. Surface Transportation Board; for pipeline freight, company data; for rail port, BE-29 data on foreign expenses in the United States and USACE volume data extrapolated based on recent quarterly trends; for postal, USPS data.
CHAPTER 8: NET EXPORTS OF GOODS AND SERVICES
8-22
Table 8.A—Summary of Methodology Used to Prepare Estimates of Exports of Goods and Services Line in NIPA
table group 4.2 Component
Current-dollar estimates Quantity and price estimates
(Quantity estimate prepared by deflating with price index unless otherwise
indicated)
Benchmark-year and nonbenchmark-year estimates*
Current quarterly estimates**
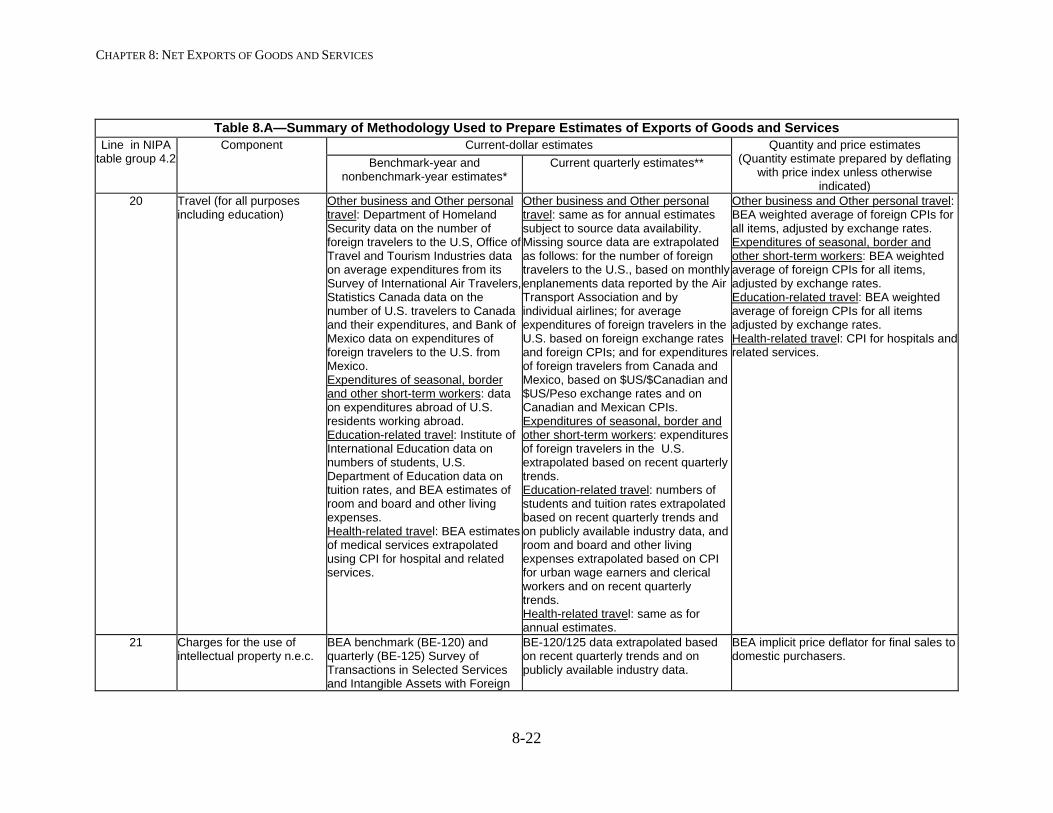
20 Travel (for all purposes including education)
Other business and Other personal travel: Department of Homeland Security data on the number of foreign travelers to the U.S, Office of Travel and Tourism Industries data on average expenditures from its Survey of International Air Travelers, Statistics Canada data on the number of U.S. travelers to Canada and their expenditures, and Bank of Mexico data on expenditures of foreign travelers to the U.S. from Mexico. Expenditures of seasonal, border and other short-term workers: data on expenditures abroad of U.S. residents working abroad. Education-related travel: Institute of International Education data on numbers of students, U.S. Department of Education data on tuition rates, and BEA estimates of room and board and other living expenses. Health-related travel: BEA estimates of medical services extrapolated using CPI for hospital and related services.
Other business and Other personal travel: same as for annual estimates subject to source data availability. Missing source data are extrapolated as follows: for the number of foreign travelers to the U.S., based on monthly enplanements data reported by the Air Transport Association and by individual airlines; for average expenditures of foreign travelers in the U.S. based on foreign exchange rates and foreign CPIs; and for expenditures of foreign travelers from Canada and Mexico, based on $US/$Canadian and $US/Peso exchange rates and on Canadian and Mexican CPIs. Expenditures of seasonal, border and other short-term workers: expenditures of foreign travelers in the U.S. extrapolated based on recent quarterly trends. Education-related travel: numbers of students and tuition rates extrapolated based on recent quarterly trends and on publicly available industry data, and room and board and other living expenses extrapolated based on CPI for urban wage earners and clerical workers and on recent quarterly trends. Health-related travel: same as for annual estimates.
Other business and Other personal travel: BEA weighted average of foreign CPIs for all items, adjusted by exchange rates. Expenditures of seasonal, border and other short-term workers: BEA weighted average of foreign CPIs for all items, adjusted by exchange rates. Education-related travel: BEA weighted average of foreign CPIs for all items adjusted by exchange rates. Health-related travel: CPI for hospitals and related services.
21 Charges for the use of intellectual property n.e.c.
BEA benchmark (BE-120) and quarterly (BE-125) Survey of Transactions in Selected Services and Intangible Assets with Foreign
BE-120/125 data extrapolated based on recent quarterly trends and on publicly available industry data.
BEA implicit price deflator for final sales to domestic purchasers.

CHAPTER 8: NET EXPORTS OF GOODS AND SERVICES
8-23
Table 8.A—Summary of Methodology Used to Prepare Estimates of Exports of Goods and Services Line in NIPA
table group 4.2 Component
Current-dollar estimates Quantity and price estimates
(Quantity estimate prepared by deflating with price index unless otherwise
indicated)
Benchmark-year and nonbenchmark-year estimates*
Current quarterly estimates**
Persons. 22 Other business services Business, professional, and
technical services and telecommunications services: BEA benchmark (BE-120) and quarterly (BE-125) Survey of Transactions in Selected Services and Intangible Assets with Foreign Persons, Census Bureau data on equipment repairs, and BEA estimates of medical services. Insurance services: BEA benchmark (BE-140) and quarterly (BE-45) Survey of Insurance Transactions by U.S. Insurance Companies with Foreign Persons, BE-125 data on insurance transactions, and publicly available industry data. Financial services: BEA benchmark (BE-180) and quarterly (BE-185) Survey of Financial Services Transactions between U.S. Financial Services Providers and Foreign Persons, and U.S. Treasury Department surveys of international capital flows. Maintenance and repair services: Census Bureau data on maintenance and repairs and BEA quarterly (BE-125) Survey of Transactions in Selected Services and Intellectual Property with Foreign Persons. Other-other business services: based primarily on BEA quarterly BE-125 survey and benchmark BE-
Business, professional, and technical services and telecommunications services: BE-120/125 data extrapolated based on recent quarterly trends, Census Bureau data on equipment repairs, and BEA estimates of medical services. Insurance services: BE-140/45 data extrapolated based on recent quarterly trends and on publicly available industry data. Financial services: BE-180/185 data extrapolated based on monthly data from the U.S. Treasury Department surveys of international capital flows, on BEA estimates of average brokerage commission rates and fees, on recent quarterly trends, and on publicly available industry data. Maintenance and repair services: Census Bureau data on maintenance and repairs and BE-125 data extrapolated based on recent quarterly trends. Other-other business services: based on BEA quarterly BE-125 survey data.
Business, professional, and technical services except medical services: BEA implicit price deflator for final sales to domestic purchasers. Telecommunications services: PPI for international business switched access toll service. Insurance services: quantity extrapolation using premiums deflated by a BEA weighted average of PPI for direct life insurance carriers and PPI for premiums of property and casualty insurance. Financial services: PPI for security and commodity contracts. Maintenance and repair services: PPI for maintenance and repair construction. Other-other business services: BEA implicit price deflator for final sales to domestic purchasers.
CHAPTER 8: NET EXPORTS OF GOODS AND SERVICES
8-24
Table 8.A—Summary of Methodology Used to Prepare Estimates of Exports of Goods and Services Line in NIPA
table group 4.2 Component
Current-dollar estimates Quantity and price estimates
(Quantity estimate prepared by deflating with price index unless otherwise
indicated)
Benchmark-year and nonbenchmark-year estimates*
Current quarterly estimates**
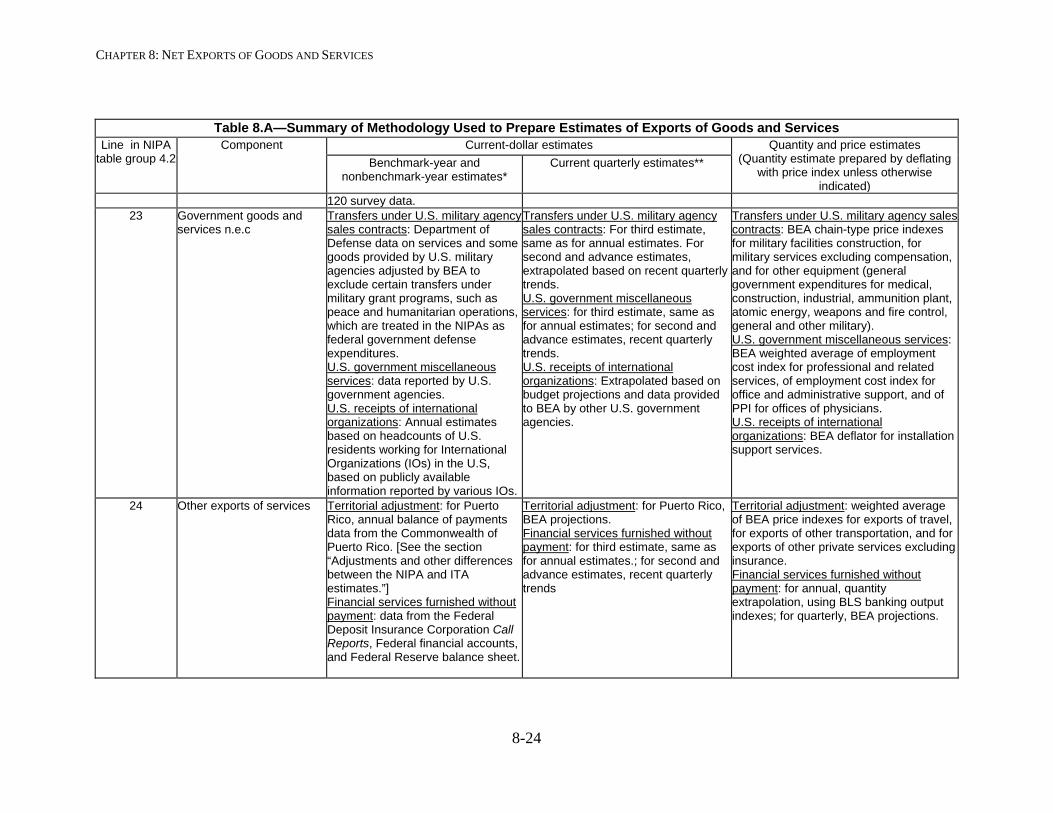
120 survey data. 23 Government goods and
services n.e.c Transfers under U.S. military agency sales contracts: Department of Defense data on services and some goods provided by U.S. military agencies adjusted by BEA to exclude certain transfers under military grant programs, such as peace and humanitarian operations, which are treated in the NIPAs as federal government defense expenditures. U.S. government miscellaneous services: data reported by U.S. government agencies. U.S. receipts of international organizations: Annual estimates based on headcounts of U.S. residents working for International Organizations (IOs) in the U.S, based on publicly available information reported by various IOs.
Transfers under U.S. military agency sales contracts: For third estimate, same as for annual estimates. For second and advance estimates, extrapolated based on recent quarterly trends. U.S. government miscellaneous services: for third estimate, same as for annual estimates; for second and advance estimates, recent quarterly trends. U.S. receipts of international organizations: Extrapolated based on budget projections and data provided to BEA by other U.S. government agencies.
Transfers under U.S. military agency sales contracts: BEA chain-type price indexes for military facilities construction, for military services excluding compensation, and for other equipment (general government expenditures for medical, construction, industrial, ammunition plant, atomic energy, weapons and fire control, general and other military). U.S. government miscellaneous services: BEA weighted average of employment cost index for professional and related services, of employment cost index for office and administrative support, and of PPI for offices of physicians. U.S. receipts of international organizations: BEA deflator for installation support services.
24 Other exports of services Territorial adjustment: for Puerto Rico, annual balance of payments data from the Commonwealth of Puerto Rico. [See the section “Adjustments and other differences between the NIPA and ITA estimates.”] Financial services furnished without payment: data from the Federal Deposit Insurance Corporation Call Reports, Federal financial accounts, and Federal Reserve balance sheet.
Territorial adjustment: for Puerto Rico, BEA projections. Financial services furnished without payment: for third estimate, same as for annual estimates.; for second and advance estimates, recent quarterly trends
Territorial adjustment: weighted average of BEA price indexes for exports of travel, for exports of other transportation, and for exports of other private services excluding insurance. Financial services furnished without payment: for annual, quantity extrapolation, using BLS banking output indexes; for quarterly, BEA projections.
CHAPTER 8: NET EXPORTS OF GOODS AND SERVICES
8-25
* The NIPA annual estimates are also consistent with changes to methodology, source data, or seasonal factors implemented during the annual revision of the ITAs. ** For the goods components that use monthly Census Bureau compilations of export data, the source data for the “advance” quarterly estimate are available for only the first 2 months of the quarter; the third month is based on BEA projections using publicly available information. For both goods and services, the third quarterly estimates incorporate the ITA revisions to the monthly trade data. BEA Bureau of Economic Analysis BLS Bureau of Labor Statistics CPI Consumer Price Index, BLS ITAs International Transactions Accounts, BEA NIPAs National Income and Product Accounts, BEA PPI Producer Price Index, BLS
CHAPTER 8: NET EXPORTS OF GOODS AND SERVICES
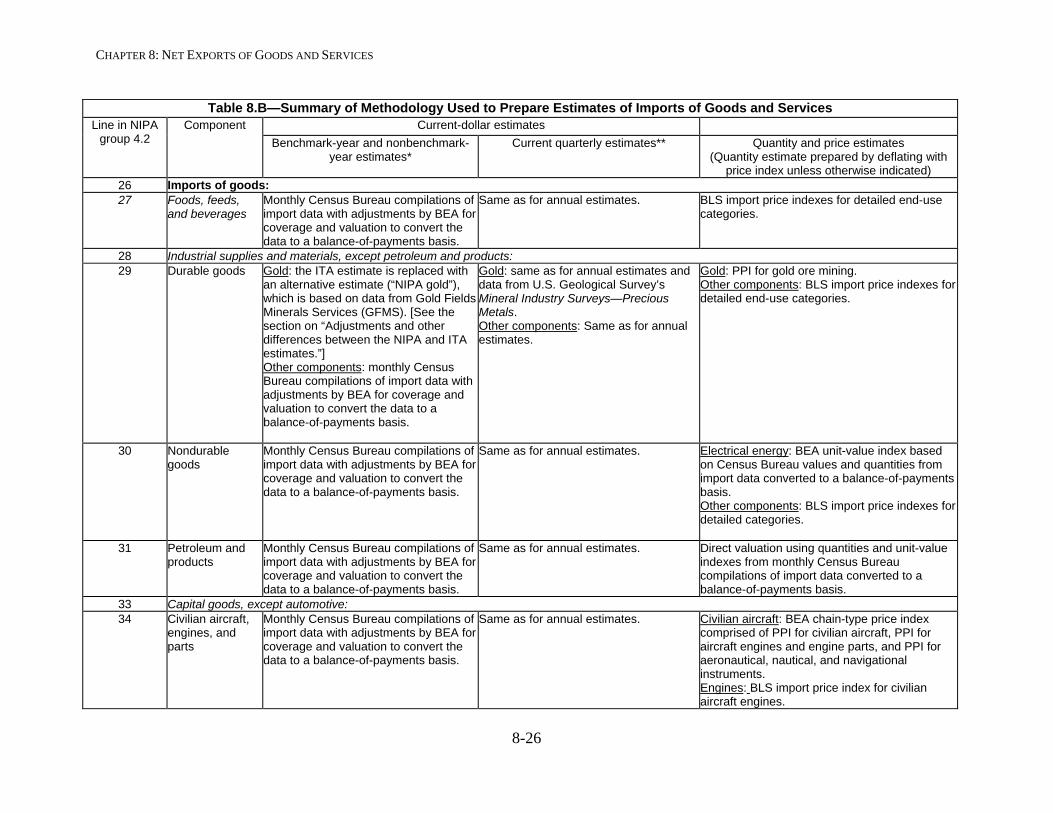
8-26
Table 8.B—Summary of Methodology Used to Prepare Estimates of Imports of Goods and Services Line in NIPA
group 4.2 Component
Current-dollar estimates
Benchmark-year and nonbenchmark-year estimates*
Current quarterly estimates** Quantity and price estimates (Quantity estimate prepared by deflating with
price index unless otherwise indicated) 26 Imports of goods: 27 Foods, feeds,
and beverages Monthly Census Bureau compilations of import data with adjustments by BEA for coverage and valuation to convert the data to a balance-of-payments basis.
Same as for annual estimates. BLS import price indexes for detailed end-use categories.
28 Industrial supplies and materials, except petroleum and products: 29 Durable goods
Gold: the ITA estimate is replaced with an alternative estimate (“NIPA gold”), which is based on data from Gold Fields Minerals Services (GFMS). [See the section on “Adjustments and other differences between the NIPA and ITA estimates.”] Other components: monthly Census Bureau compilations of import data with adjustments by BEA for coverage and valuation to convert the data to a balance-of-payments basis.
Gold: same as for annual estimates and data from U.S. Geological Survey’s Mineral Industry Surveys—Precious Metals. Other components: Same as for annual estimates.
Gold: PPI for gold ore mining. Other components: BLS import price indexes for detailed end-use categories.
30 Nondurable goods
Monthly Census Bureau compilations of import data with adjustments by BEA for coverage and valuation to convert the data to a balance-of-payments basis.
Same as for annual estimates. Electrical energy: BEA unit-value index based on Census Bureau values and quantities from import data converted to a balance-of-payments basis. Other components: BLS import price indexes for detailed categories.
31 Petroleum and products
Monthly Census Bureau compilations of import data with adjustments by BEA for coverage and valuation to convert the data to a balance-of-payments basis.
Same as for annual estimates. Direct valuation using quantities and unit-value indexes from monthly Census Bureau compilations of import data converted to a balance-of-payments basis.
33 Capital goods, except automotive: 34 Civilian aircraft,
engines, and parts
Monthly Census Bureau compilations of import data with adjustments by BEA for coverage and valuation to convert the data to a balance-of-payments basis.
Same as for annual estimates. Civilian aircraft: BEA chain-type price index comprised of PPI for civilian aircraft, PPI for aircraft engines and engine parts, and PPI for aeronautical, nautical, and navigational instruments. Engines: BLS import price index for civilian aircraft engines.
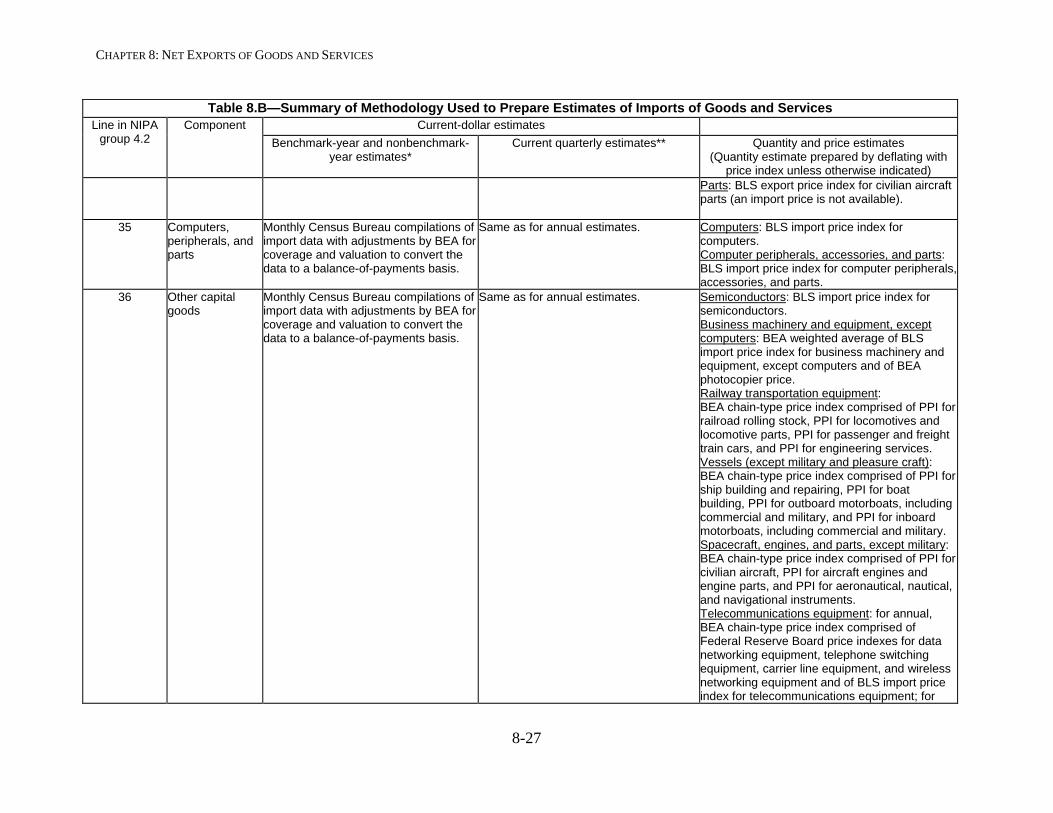
CHAPTER 8: NET EXPORTS OF GOODS AND SERVICES
8-27
Table 8.B—Summary of Methodology Used to Prepare Estimates of Imports of Goods and Services Line in NIPA
group 4.2 Component
Current-dollar estimates
Benchmark-year and nonbenchmark-year estimates*
Current quarterly estimates** Quantity and price estimates (Quantity estimate prepared by deflating with
price index unless otherwise indicated) Parts: BLS export price index for civilian aircraft parts (an import price is not available).
35 Computers, peripherals, and parts
Monthly Census Bureau compilations of import data with adjustments by BEA for coverage and valuation to convert the data to a balance-of-payments basis.
Same as for annual estimates. Computers: BLS import price index for computers. Computer peripherals, accessories, and parts: BLS import price index for computer peripherals, accessories, and parts.
36 Other capital goods
Monthly Census Bureau compilations of import data with adjustments by BEA for coverage and valuation to convert the data to a balance-of-payments basis.
Same as for annual estimates. Semiconductors: BLS import price index for semiconductors. Business machinery and equipment, except computers: BEA weighted average of BLS import price index for business machinery and equipment, except computers and of BEA photocopier price. Railway transportation equipment: BEA chain-type price index comprised of PPI for railroad rolling stock, PPI for locomotives and locomotive parts, PPI for passenger and freight train cars, and PPI for engineering services. Vessels (except military and pleasure craft): BEA chain-type price index comprised of PPI for ship building and repairing, PPI for boat building, PPI for outboard motorboats, including commercial and military, and PPI for inboard motorboats, including commercial and military. Spacecraft, engines, and parts, except military: BEA chain-type price index comprised of PPI for civilian aircraft, PPI for aircraft engines and engine parts, and PPI for aeronautical, nautical, and navigational instruments. Telecommunications equipment: for annual, BEA chain-type price index comprised of Federal Reserve Board price indexes for data networking equipment, telephone switching equipment, carrier line equipment, and wireless networking equipment and of BLS import price index for telecommunications equipment; for
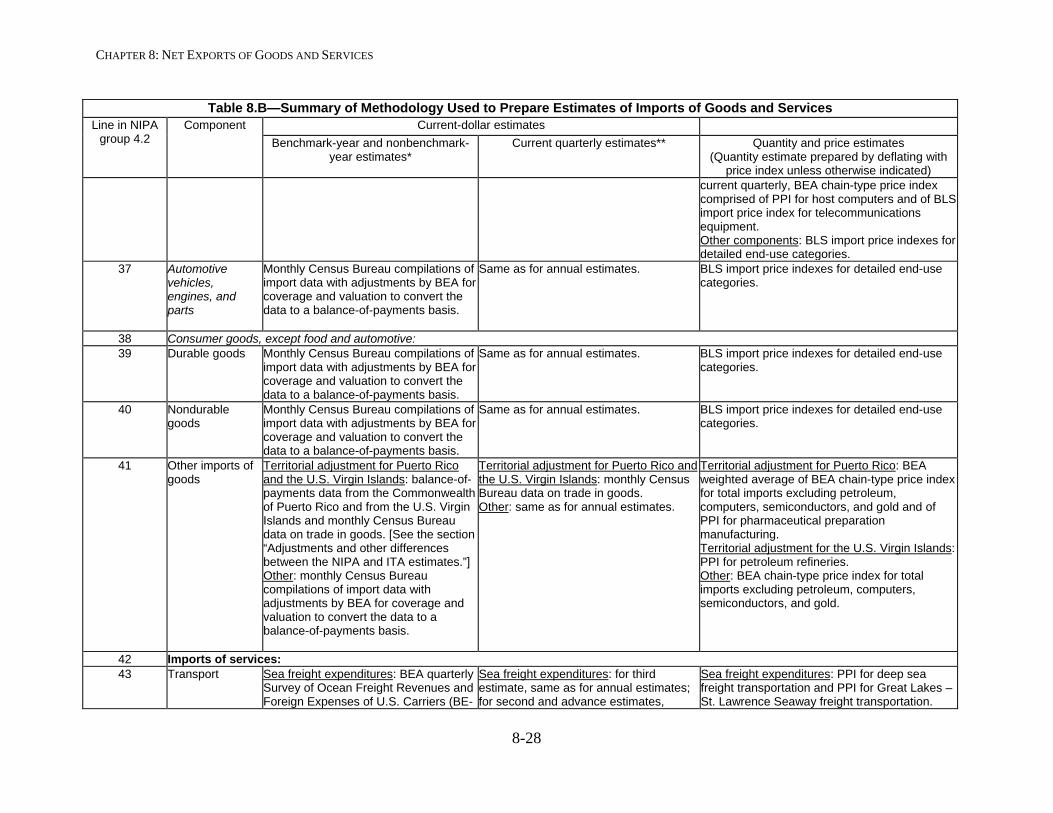
CHAPTER 8: NET EXPORTS OF GOODS AND SERVICES
8-28
Table 8.B—Summary of Methodology Used to Prepare Estimates of Imports of Goods and Services Line in NIPA
group 4.2 Component
Current-dollar estimates
Benchmark-year and nonbenchmark-year estimates*
Current quarterly estimates** Quantity and price estimates (Quantity estimate prepared by deflating with
price index unless otherwise indicated) current quarterly, BEA chain-type price index comprised of PPI for host computers and of BLS import price index for telecommunications equipment. Other components: BLS import price indexes for detailed end-use categories.
37 Automotive vehicles, engines, and parts
Monthly Census Bureau compilations of import data with adjustments by BEA for coverage and valuation to convert the data to a balance-of-payments basis.
Same as for annual estimates. BLS import price indexes for detailed end-use categories.
38 Consumer goods, except food and automotive: 39 Durable goods
Monthly Census Bureau compilations of import data with adjustments by BEA for coverage and valuation to convert the data to a balance-of-payments basis.
Same as for annual estimates. BLS import price indexes for detailed end-use categories.
40 Nondurable goods
Monthly Census Bureau compilations of import data with adjustments by BEA for coverage and valuation to convert the data to a balance-of-payments basis.
Same as for annual estimates. BLS import price indexes for detailed end-use categories.
41 Other imports of goods
Territorial adjustment for Puerto Rico and the U.S. Virgin Islands: balance-of-payments data from the Commonwealth of Puerto Rico and from the U.S. Virgin Islands and monthly Census Bureau data on trade in goods. [See the section “Adjustments and other differences between the NIPA and ITA estimates.”] Other: monthly Census Bureau compilations of import data with adjustments by BEA for coverage and valuation to convert the data to a balance-of-payments basis.
Territorial adjustment for Puerto Rico and the U.S. Virgin Islands: monthly Census Bureau data on trade in goods. Other: same as for annual estimates.
Territorial adjustment for Puerto Rico: BEA weighted average of BEA chain-type price index for total imports excluding petroleum, computers, semiconductors, and gold and of PPI for pharmaceutical preparation manufacturing. Territorial adjustment for the U.S. Virgin Islands: PPI for petroleum refineries. Other: BEA chain-type price index for total imports excluding petroleum, computers, semiconductors, and gold.
42 Imports of services: 43 Transport Sea freight expenditures: BEA quarterly
Survey of Ocean Freight Revenues and Foreign Expenses of U.S. Carriers (BE-
Sea freight expenditures: for third estimate, same as for annual estimates; for second and advance estimates,
Sea freight expenditures: PPI for deep sea freight transportation and PPI for Great Lakes – St. Lawrence Seaway freight transportation.
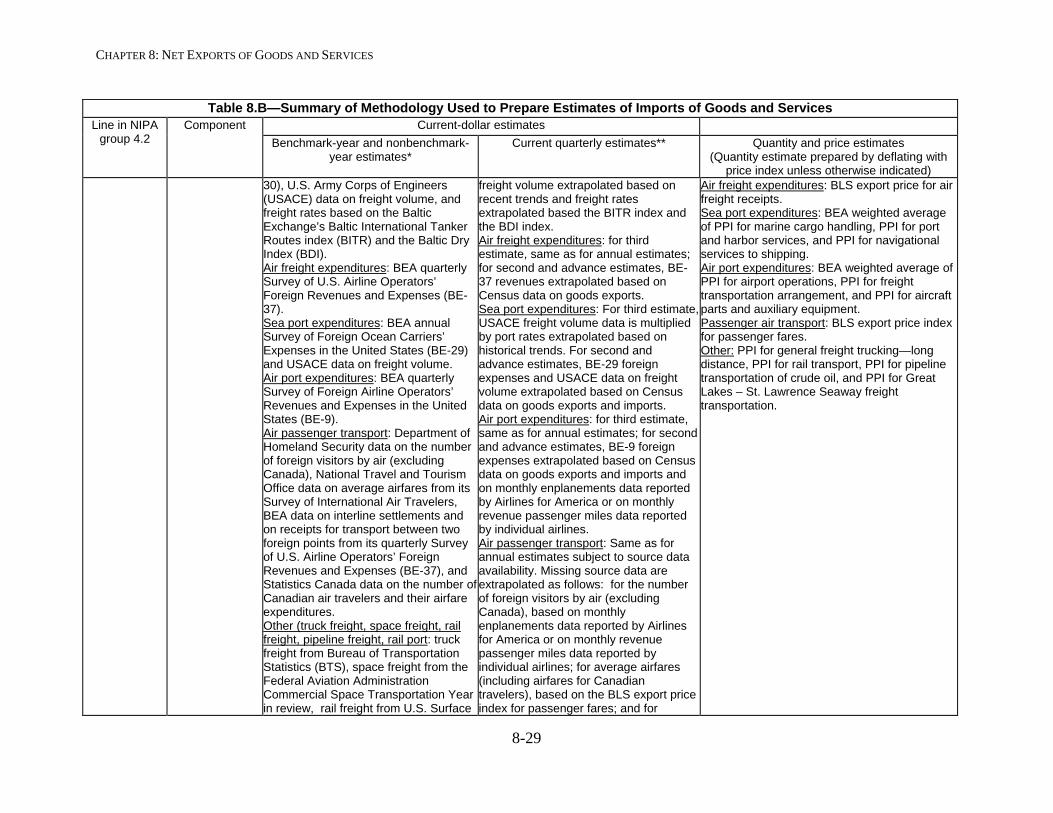
CHAPTER 8: NET EXPORTS OF GOODS AND SERVICES
8-29
Table 8.B—Summary of Methodology Used to Prepare Estimates of Imports of Goods and Services Line in NIPA
group 4.2 Component
Current-dollar estimates
Benchmark-year and nonbenchmark-year estimates*
Current quarterly estimates** Quantity and price estimates (Quantity estimate prepared by deflating with
price index unless otherwise indicated) 30), U.S. Army Corps of Engineers (USACE) data on freight volume, and freight rates based on the Baltic Exchange’s Baltic International Tanker Routes index (BITR) and the Baltic Dry Index (BDI). Air freight expenditures: BEA quarterly Survey of U.S. Airline Operators’ Foreign Revenues and Expenses (BE-37). Sea port expenditures: BEA annual Survey of Foreign Ocean Carriers’ Expenses in the United States (BE-29) and USACE data on freight volume. Air port expenditures: BEA quarterly Survey of Foreign Airline Operators’ Revenues and Expenses in the United States (BE-9). Air passenger transport: Department of Homeland Security data on the number of foreign visitors by air (excluding Canada), National Travel and Tourism Office data on average airfares from its Survey of International Air Travelers, BEA data on interline settlements and on receipts for transport between two foreign points from its quarterly Survey of U.S. Airline Operators’ Foreign Revenues and Expenses (BE-37), and Statistics Canada data on the number of Canadian air travelers and their airfare expenditures. Other (truck freight, space freight, rail freight, pipeline freight, rail port: truck freight from Bureau of Transportation Statistics (BTS), space freight from the Federal Aviation Administration Commercial Space Transportation Year in review, rail freight from U.S. Surface
freight volume extrapolated based on recent trends and freight rates extrapolated based the BITR index and the BDI index. Air freight expenditures: for third estimate, same as for annual estimates; for second and advance estimates, BE-37 revenues extrapolated based on Census data on goods exports. Sea port expenditures: For third estimate, USACE freight volume data is multiplied by port rates extrapolated based on historical trends. For second and advance estimates, BE-29 foreign expenses and USACE data on freight volume extrapolated based on Census data on goods exports and imports. Air port expenditures: for third estimate, same as for annual estimates; for second and advance estimates, BE-9 foreign expenses extrapolated based on Census data on goods exports and imports and on monthly enplanements data reported by Airlines for America or on monthly revenue passenger miles data reported by individual airlines. Air passenger transport: Same as for annual estimates subject to source data availability. Missing source data are extrapolated as follows: for the number of foreign visitors by air (excluding Canada), based on monthly enplanements data reported by Airlines for America or on monthly revenue passenger miles data reported by individual airlines; for average airfares (including airfares for Canadian travelers), based on the BLS export price index for passenger fares; and for
Air freight expenditures: BLS export price for air freight receipts. Sea port expenditures: BEA weighted average of PPI for marine cargo handling, PPI for port and harbor services, and PPI for navigational services to shipping. Air port expenditures: BEA weighted average of PPI for airport operations, PPI for freight transportation arrangement, and PPI for aircraft parts and auxiliary equipment. Passenger air transport: BLS export price index for passenger fares. Other: PPI for general freight trucking—long distance, PPI for rail transport, PPI for pipeline transportation of crude oil, and PPI for Great Lakes – St. Lawrence Seaway freight transportation.
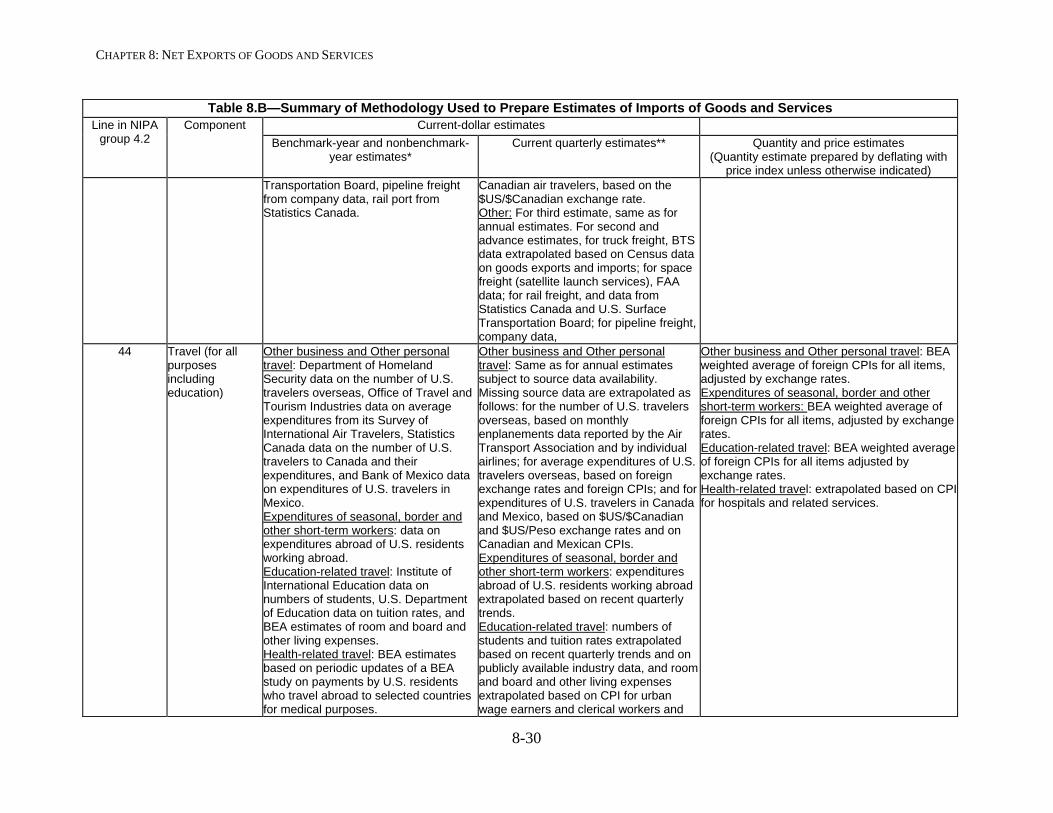
CHAPTER 8: NET EXPORTS OF GOODS AND SERVICES
8-30
Table 8.B—Summary of Methodology Used to Prepare Estimates of Imports of Goods and Services Line in NIPA
group 4.2 Component
Current-dollar estimates
Benchmark-year and nonbenchmark-year estimates*
Current quarterly estimates** Quantity and price estimates (Quantity estimate prepared by deflating with
price index unless otherwise indicated) Transportation Board, pipeline freight from company data, rail port from Statistics Canada.
Canadian air travelers, based on the $US/$Canadian exchange rate. Other: For third estimate, same as for annual estimates. For second and advance estimates, for truck freight, BTS data extrapolated based on Census data on goods exports and imports; for space freight (satellite launch services), FAA data; for rail freight, and data from Statistics Canada and U.S. Surface Transportation Board; for pipeline freight, company data,
44 Travel (for all purposes including education)
Other business and Other personal travel: Department of Homeland Security data on the number of U.S. travelers overseas, Office of Travel and Tourism Industries data on average expenditures from its Survey of International Air Travelers, Statistics Canada data on the number of U.S. travelers to Canada and their expenditures, and Bank of Mexico data on expenditures of U.S. travelers in Mexico. Expenditures of seasonal, border and other short-term workers: data on expenditures abroad of U.S. residents working abroad. Education-related travel: Institute of International Education data on numbers of students, U.S. Department of Education data on tuition rates, and BEA estimates of room and board and other living expenses. Health-related travel: BEA estimates based on periodic updates of a BEA study on payments by U.S. residents who travel abroad to selected countries for medical purposes.
Other business and Other personal travel: Same as for annual estimates subject to source data availability. Missing source data are extrapolated as follows: for the number of U.S. travelers overseas, based on monthly enplanements data reported by the Air Transport Association and by individual airlines; for average expenditures of U.S. travelers overseas, based on foreign exchange rates and foreign CPIs; and for expenditures of U.S. travelers in Canada and Mexico, based on $US/$Canadian and $US/Peso exchange rates and on Canadian and Mexican CPIs. Expenditures of seasonal, border and other short-term workers: expenditures abroad of U.S. residents working abroad extrapolated based on recent quarterly trends. Education-related travel: numbers of students and tuition rates extrapolated based on recent quarterly trends and on publicly available industry data, and room and board and other living expenses extrapolated based on CPI for urban wage earners and clerical workers and
Other business and Other personal travel: BEA weighted average of foreign CPIs for all items, adjusted by exchange rates. Expenditures of seasonal, border and other short-term workers: BEA weighted average of foreign CPIs for all items, adjusted by exchange rates. Education-related travel: BEA weighted average of foreign CPIs for all items adjusted by exchange rates. Health-related travel: extrapolated based on CPI for hospitals and related services.
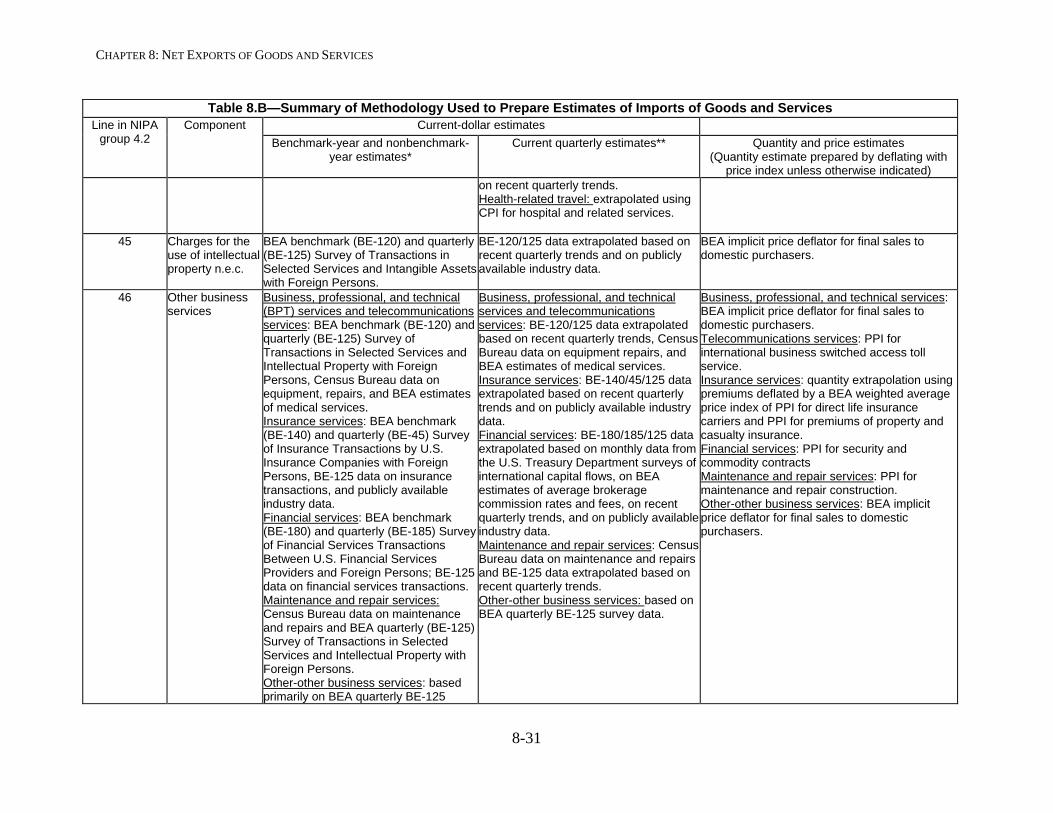
CHAPTER 8: NET EXPORTS OF GOODS AND SERVICES
8-31
Table 8.B—Summary of Methodology Used to Prepare Estimates of Imports of Goods and Services Line in NIPA
group 4.2 Component
Current-dollar estimates
Benchmark-year and nonbenchmark-year estimates*
Current quarterly estimates** Quantity and price estimates (Quantity estimate prepared by deflating with
price index unless otherwise indicated) on recent quarterly trends. Health-related travel: extrapolated using CPI for hospital and related services.
45 Charges for the use of intellectual property n.e.c.
BEA benchmark (BE-120) and quarterly (BE-125) Survey of Transactions in Selected Services and Intangible Assets with Foreign Persons.
BE-120/125 data extrapolated based on recent quarterly trends and on publicly available industry data.
BEA implicit price deflator for final sales to domestic purchasers.
46 Other business services
Business, professional, and technical (BPT) services and telecommunications services: BEA benchmark (BE-120) and quarterly (BE-125) Survey of Transactions in Selected Services and Intellectual Property with Foreign Persons, Census Bureau data on equipment, repairs, and BEA estimates of medical services. Insurance services: BEA benchmark (BE-140) and quarterly (BE-45) Survey of Insurance Transactions by U.S. Insurance Companies with Foreign Persons, BE-125 data on insurance transactions, and publicly available industry data. Financial services: BEA benchmark (BE-180) and quarterly (BE-185) Survey of Financial Services Transactions Between U.S. Financial Services Providers and Foreign Persons; BE-125 data on financial services transactions. Maintenance and repair services: Census Bureau data on maintenance and repairs and BEA quarterly (BE-125) Survey of Transactions in Selected Services and Intellectual Property with Foreign Persons. Other-other business services: based primarily on BEA quarterly BE-125
Business, professional, and technical services and telecommunications services: BE-120/125 data extrapolated based on recent quarterly trends, Census Bureau data on equipment repairs, and BEA estimates of medical services. Insurance services: BE-140/45/125 data extrapolated based on recent quarterly trends and on publicly available industry data. Financial services: BE-180/185/125 data extrapolated based on monthly data from the U.S. Treasury Department surveys of international capital flows, on BEA estimates of average brokerage commission rates and fees, on recent quarterly trends, and on publicly available industry data. Maintenance and repair services: Census Bureau data on maintenance and repairs and BE-125 data extrapolated based on recent quarterly trends. Other-other business services: based on BEA quarterly BE-125 survey data.
Business, professional, and technical services: BEA implicit price deflator for final sales to domestic purchasers. Telecommunications services: PPI for international business switched access toll service. Insurance services: quantity extrapolation using premiums deflated by a BEA weighted average price index of PPI for direct life insurance carriers and PPI for premiums of property and casualty insurance. Financial services: PPI for security and commodity contracts Maintenance and repair services: PPI for maintenance and repair construction. Other-other business services: BEA implicit price deflator for final sales to domestic purchasers.
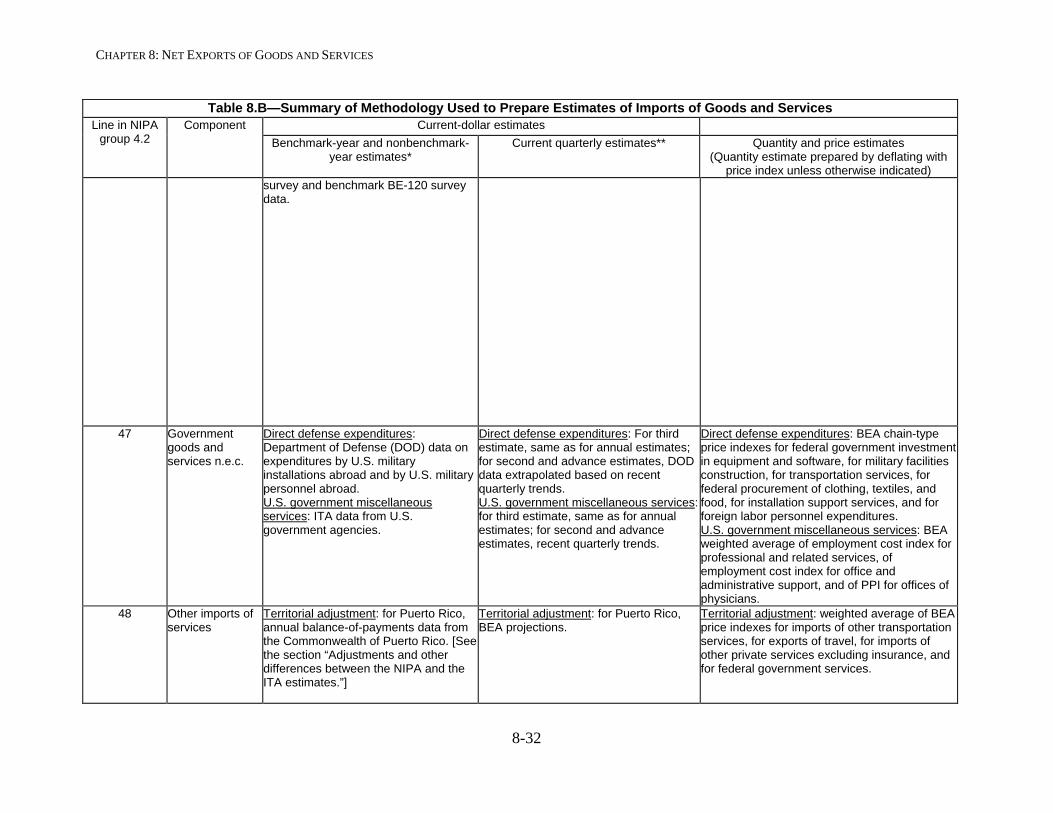
CHAPTER 8: NET EXPORTS OF GOODS AND SERVICES
8-32
Table 8.B—Summary of Methodology Used to Prepare Estimates of Imports of Goods and Services Line in NIPA
group 4.2 Component
Current-dollar estimates
Benchmark-year and nonbenchmark-year estimates*
Current quarterly estimates** Quantity and price estimates (Quantity estimate prepared by deflating with
price index unless otherwise indicated) survey and benchmark BE-120 survey data.
47 Government goods and services n.e.c.
Direct defense expenditures: Department of Defense (DOD) data on expenditures by U.S. military installations abroad and by U.S. military personnel abroad. U.S. government miscellaneous services: ITA data from U.S. government agencies.
Direct defense expenditures: For third estimate, same as for annual estimates; for second and advance estimates, DOD data extrapolated based on recent quarterly trends. U.S. government miscellaneous services: for third estimate, same as for annual estimates; for second and advance estimates, recent quarterly trends.
Direct defense expenditures: BEA chain-type price indexes for federal government investment in equipment and software, for military facilities construction, for transportation services, for federal procurement of clothing, textiles, and food, for installation support services, and for foreign labor personnel expenditures. U.S. government miscellaneous services: BEA weighted average of employment cost index for professional and related services, of employment cost index for office and administrative support, and of PPI for offices of physicians.
48 Other imports of services
Territorial adjustment: for Puerto Rico, annual balance-of-payments data from the Commonwealth of Puerto Rico. [See the section “Adjustments and other differences between the NIPA and the ITA estimates.”]
Territorial adjustment: for Puerto Rico, BEA projections.
Territorial adjustment: weighted average of BEA price indexes for imports of other transportation services, for exports of travel, for imports of other private services excluding insurance, and for federal government services.
CHAPTER 8: NET EXPORTS OF GOODS AND SERVICES
8-33
* The annual NIPA estimates are also consistent with changes to methodology, source data, or seasonal factors implemented during the annual revision of the ITAs. **For the goods components that use monthly Census Bureau compilations of import data, the source data for the “advance” quarterly estimate are available for only the first 2 months of the quarter; the third month is based on BEA projections using publicly available information. For both goods and services, the third quarterly estimates incorporate the ITA revisions to the monthly trade data. BEA Bureau of Economic Analysis BLS Bureau of Labor Statistics CPI Consumer Price Index, BLS ITAs International Transactions Accounts, BEA NIPAs National Income and Product Accounts, BEA PPI Producer Price Index, BLS