chapter 7: modes of cell death - university of pretoria
TRANSCRIPT

89
Chapter 7: Modes of Cell Death
7.1. Background
Cell death can follow one of two distinct pathways, apoptosis or necrosis, and can occur in
response to severe stress conditions or after exposure to toxic agents. Apoptosis is a normal
physiological event taking place continuously in the development of multicellular organisms
or during the immune response (Samali et al., 1999). Apoptosis involves activation of the
intra-cellular caspase (cysteine-aspartic proteases) enzymes. Whether cell death occurs by
apoptosis or necrosis is dependent on the physiologic milieu, developmental stage, tissue
type, and the nature of the cell death signal (Ziess, 2003).
Sloviter (2002) recommended replacing necrosis with the term 'passive cell death', and
apoptosis and programmed cell death with the term 'active cell death'. The reason for this
suggested change in terminology is found in the underlying dependence/independence on
cellular energy of each of these modes to manifest cell death. Apoptosis is an ordered form
of cell death which depends on the ability of dying cells to initiate well-regulated, ATP-
dependent self-degradation without initiating an immune response. In contrast, the core
event of necrosis is rapid loss of plasma membrane integrity associated with energy
depletion and release of pro-inflammatory molecules (Lin and Yang, 2008).
Apoptosis can be initiated by one of two routes: the 'intrinsic' apoptotic pathway and the
'extrinsic' apoptotic pathway. In the 'intrinsic' apoptotic pathway the mitochondria play the
central role and involves the Bcl-2 family of pro-apoptotic proteins (Bad, Bid, Bax). The Bcl-2
proteins facilitate permeabilisation of the mitochondrial membrane with subsequent
release of mitochondrial proteins such as cyt C and apoptotic protease activating factor-1
(Apaf-1). Cyt C and Apaf-1, in turn, form a new complex, together with po-caspase-9, known
as the apoptosome, which contains active caspase-9. The cyt C/Apaf-1/Caspase-9
apoptosome then recruits effector caspases like pro-caspase-3 that is cleaved to form active
caspase-3 (Cas-3) (Harwood et al., 2005). Activation of Cas-3, considered by many as a final
executioner protein of the apoptotic cell death sequence, leads to rapid cleavage of a

90
diverse spectrum of key structural and functional proteins in the cell. These targets for
proteolytic attack include, amongst others, cytoskeletal components, signal transduction
molecules and DNA repair enzymes (Carambula et al., 2002).
The 'extrinsic' apoptotic pathway is a receptor-mediated, ordered sequence of events
starting with activation of a cell surface “death receptor” such as Fas or a receptor from the
tumour necrosis factor family of receptors. Receptor occupation allows interaction between
receptor death domains and death effector domain on pro-caspase-8. This results in the
formation of the death-inducing signalling complex or DISC (similar to the apoptosome from
the 'intrinsic' pathway), followed by subsequent cleavage and activation of caspase-8, which
is then able to activate the effector Cas-3 (Harwood et al., 2005).
Apoptosis that follows after activation of either the mitochondria-mediated or receptor-
mediated pathways rapidly leads to characteristic morphological changes associated with
apoptosis including, cytoplasmic vacuolization, cellular shrinkage, an increase in cellular
density, nuclear fragmentation, membrane budding and apoptotic bodies which are
removed by phagocytic cells. The absence of this set of morphological changes indicates
that cell death occurs by necrosis, which is characterised by chromatin flocculation and a
progressive loss of plasma membrane integrity, which allows an influx of Na+, Ca2+ and
water. This constant influx causes cellular swelling, which eventually results in cell rupture
and leakage of the cytoplasmic contents into the surrounding tissue. Clinically, the main
difference between these modes of cell death lies in the fact that necrosis results in
localised inflammation due to spillage of cytoplasmic contents, which in turn releases pro-
inflammatory factors. On the other hand, apoptotic cells are broken down to apoptotic
bodies with intact membranes, which are then engulfed by nearby phagocytic cells and
macrophages with no subsequent inflammatory response (Harwood et al., 2005).
The experiments presented in this chapter were conducted in an attempt to elucidate the
mode of cell death caused by each of the test compounds, in order to provide information
regarding the mechanism of toxicity of the compounds in question.

91
7.2. Methods
7.2.1. Assessment of cell death by apoptosis
Staurosporine, the potent inhibitor of serine/threonine kinases known to induce apoptosis
in hepatocytes (Giuliano et al., 2004), was used as positive control. To induce apoptosis in
positive control samples, 100 µl of staurosporine working solution was added to 100 µl of
cell suspesion, giving exposure to a final concentration of 11 µM for 6 h at 37°C. To quantify
Cas-3 activity, the method accompanying the CASP3F Cas-3 fluorometric detection kit from
Sigma-Aldrich was followed with slight modification. (The CASP3F kit was not used, just the
protocol and Ac-DEVD-AMC)
Following 6 h exposure to either positive control or test compounds, plates were put on ice
for 20 - 30 min to cool. As soon as the plates were not warm to the touch, medium was
aspirated and replaced with 25 µl of ice-cold lysis buffer and incubated on ice for a further
20 min. After this 100 µl of assay buffer was added and the plates incubated overnight at
37°C. The following day, the cleaved 7-amino-4-methylcoumarin (AMC) was quantitated
using a FluoStar Optima using λex = 360 nm and λem = 460 nm.
7.2.2. Assessment of cell death by necrosis
The detergent Triton X-100, which is reported to disrupt most cell membranes (Tate et al.,
1983), was used as positive control for PI staining. To disrupt plasma membranes of the
positive control sample, a 100 µl of Triton X-100 (working solution) was added to 100 µl of
cells to give a final concentration of 0.5% (v/v). Cells were treated with Triton X-100 for 30
min at 37°C. Plasma membrane integrity was assessed by a modified version of PI
fluorometry described by Nieminen et al. (1992). Prior to use, the PI stock solution was

92
diluted to 75 µM in PBS. Following exposure to the test compounds, a 50 µl of PI working
solution was added to 200 µl of cells and stained with a final concentration of 15 µM PI for
15 min at 37°C. After staining, medium was discarded and cells washed with 200 µl of PBS,
followed by the addition of 100 µl PBS before detecting the fluorescence using a FluoStar
Optima at λex = 544 nm and λem = 595 nm.
7.2.3. Statistical analyses
Six independent fluorometry experiments were carried out in duplicate (n=12). Relevant
blank values were deducted from all experimental values before observed values were
standardised to percentage of controls. Outliers were detected using Grubb's test and
removed, before normality of the data distributions were evaluated with the Shapiro-
Francia test. Hypothesis testing was then performed utilising either Student's t-tests
(normal) or Mann-Whitney tests (non-normal), to determine whether any observable
differences between means were statistically significant. Results are presented as Mean ±
SEM.
Three additional experiments were carried out in duplicate to assess the possible effects
that NAC may have on the pesticide-induced mode of cell death. These results were also
standardised to percentage of control but no preliminary tests (Grubb's and Shapiro-
Francia) were performed. Mann-Whitney tests were performed due to the small sample size
(n = 6), no outliers were removed and normality of the data could not be established.
7.3. Results
7.3.1. Assessment of cell death by apoptosis
Analysis confirmed the presence of outliers in the 5 µM groups of both the DDE and DDD
data sets, with p < 0.05 (Table 7.1). Subsequently, these were identified and removed. This

93
was followed by normality testing, which revealed normal distributions for most of the data
except the 5, 10 and 100 µM groups of the DDE data set (p < 0.05) (Table 7.2.). Non-normal
data was analysed using Mann-Whitney tests.
Table 7.1. Grubb's test results for detecting outliers in Cas-3 data. Values given in the table are p-
values. Instances where pppp < 0.05 (*) indicates the presence of outliers.
Concentration DDT DDE DDD
Control 0.40 0.78 0.49
5 µµµµM 0.14 0.02* 0.00*
10 µµµµM 0.51 0.46 0.31
50 µµµµM 0.54 0.61 0.20
100 µµµµM 0.44 0.77 0.08
150 µµµµM 0.47 0.27 0.11
Table 7.2. Shapiro-Francia test normality results of the observed Cas-3 data after removal of
outliers detected with Grubb's test. Values given in the table are p-values. Instances where pppp < 0.05 are
significantly non-normal. * indicates pppp < 0.05.
Concentration DDT DDE DDD
Control 0.74 0.38 0.42
5 µµµµM 0.84 0.05* 0.95
10 µµµµM 0.82 0.02* 0.92
50 µµµµM 0.47 0.04* 0.09
100 µµµµM 0.41 0.18 0.22
150 µµµµM 0.22 0.23 0.57
The positive control (11 µM staurosporine) significantly (p < 0.001) induced Cas-3 activity
when compared to controls with a mean increase of 97% (Figure 7.1). All the tested
concentrations of DDT (5 - 150 µM) were found to significantly (p < 0.001) increase Cas-3

94
activity in a dose-dependent manner, ranging from a 21% increase (5 µM) to a 63% increase
(150 µM). DDT-induced Cas-3 activity followed a dose-dependent trend (Figure 7.2 and
Table 7.3).
Figure 7.1. Active caspase-3 in HepG2 cells following 6 h exposure to Control vs. Staurosporine (11
µM) (mean ±SEM). Staurosporine significantly induced caspase-3 activity with pppp < 0.001 (***).
Table 7.3. Relative Cas-3 activity in HepG2 cells following 6 h exposure to DDT, DDE, DDD and
Staurosporine (positive control). Results (% of Control) are presented as mean ±SEM. ** indicates pppp <
0.01 and *** pppp < 0.001 as determined by Mann-Whitney and Student's t-tests.
Concentration DDT DDE DDD Staurosporine (11 µµµµM)
Control 100± 2 100± 2 100± 2
197± 11***
5 µµµµM 121± 4*** 104± 3 119± 4***
10 µµµµM 128± 4*** 116± 7 119± 5**
50 µµµµM 143± 5*** 133± 8*** 141± 8***
100 µµµµM 149± 5*** 148± 7*** 182± 9***
150 µµµµM 163± 5*** 165± 9*** 239± 6***
DDE affected Cas-3 activity in a dose-dependent manner and was also found to significantly
(p < 0.001) increase Cas-3 activity. However, DDE was not as potent an inducer as DDT,
yielding insignificant increases at the lower concentration range tested (5 - 10 µM). DDE

95
significantly increased Cas-3 activity at higher concentrations by 34% (50 µM), 49% (100
µM) and 66% (150 µM) (Figure 7.2 and Table 7.3).
At concentrations of 5 - 50 µM, DDD yielded results similar to that of DDT, causing
significant (p < 0.01) increases in Cas-3 activity of between 20% and 40%. However, at
concentrations of 100 and 150 µM, DDD caused highly significantly (p < 0.001) elevated Cas-
3 activity when compared not only to the controls, but also DDT and DDE. The effect of DDD
on Cas-3 activity followed a dose-dependent trend (Figure 7.2 and Table 7.3).

96
Figure 7.2. Caspase-3 activity in HepG2 cells following 6 h exposure to DDT (A), DDE (B) and DDD (C)
(mean ±SEM). Caspase-3 activity was used as a measure of cell death by apoptosis. Graphs (D), (E) and
(F) represent the PI staining of cells exposed to DDT, DDE and DDD, respectively. Propidium iodide was
used as a measure of membrane integrity and cell death by necrosis. Dashed horizontal lines represent
untreated control values. Results are given as mean ± SEM. * indicates pppp < 0.05, ** indicates pppp < 0.01
and *** pppp < 0.001 as determined by Mann-Whitney and Student's t-tests, where applicable.
97
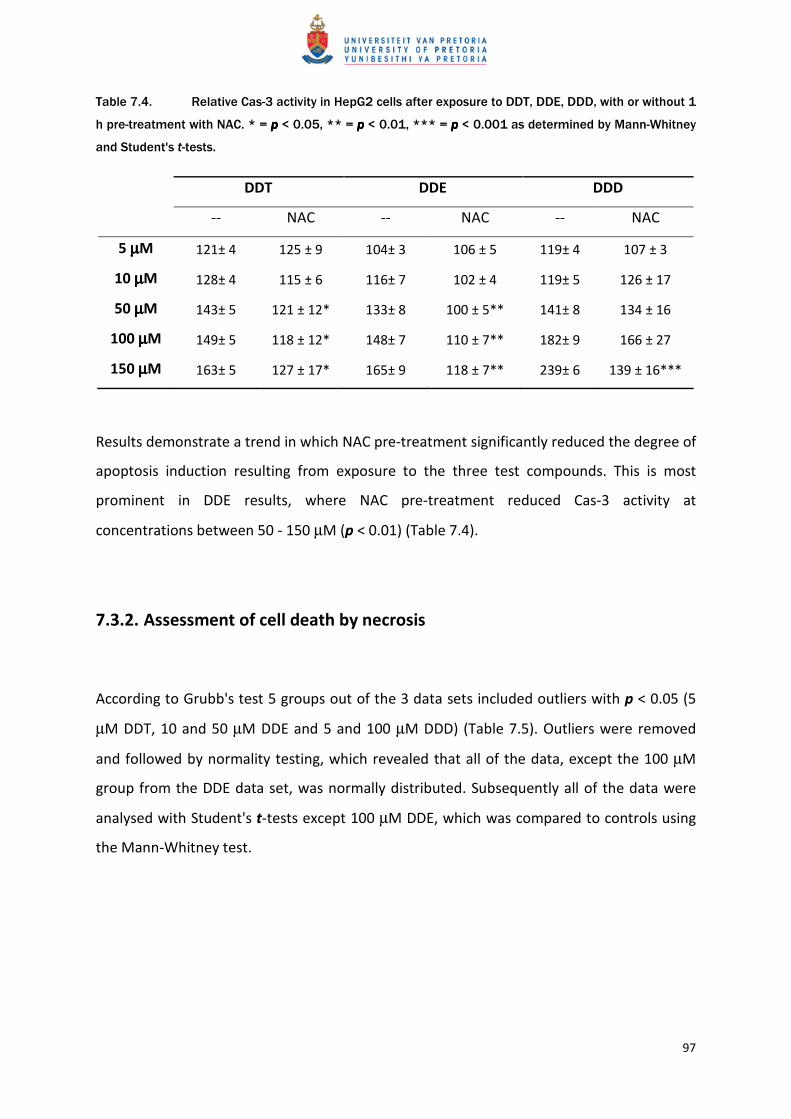
Table 7.4. Relative Cas-3 activity in HepG2 cells after exposure to DDT, DDE, DDD, with or without 1
h pre-treatment with NAC. * = pppp < 0.05, ** = pppp < 0.01, *** = pppp < 0.001 as determined by Mann-Whitney
and Student's t-tests.
DDT DDE DDD
-- NAC -- NAC -- NAC
5 µµµµM 121± 4 125 ± 9 104± 3 106 ± 5 119± 4 107 ± 3
10 µµµµM 128± 4 115 ± 6 116± 7 102 ± 4 119± 5 126 ± 17
50 µµµµM 143± 5 121 ± 12* 133± 8 100 ± 5** 141± 8 134 ± 16
100 µµµµM 149± 5 118 ± 12* 148± 7 110 ± 7** 182± 9 166 ± 27
150 µµµµM 163± 5 127 ± 17* 165± 9 118 ± 7** 239± 6 139 ± 16***
Results demonstrate a trend in which NAC pre-treatment significantly reduced the degree of
apoptosis induction resulting from exposure to the three test compounds. This is most
prominent in DDE results, where NAC pre-treatment reduced Cas-3 activity at
concentrations between 50 - 150 µM (p < 0.01) (Table 7.4).
7.3.2. Assessment of cell death by necrosis
According to Grubb's test 5 groups out of the 3 data sets included outliers with p < 0.05 (5
µM DDT, 10 and 50 µM DDE and 5 and 100 µM DDD) (Table 7.5). Outliers were removed
and followed by normality testing, which revealed that all of the data, except the 100 µM
group from the DDE data set, was normally distributed. Subsequently all of the data were
analysed with Student's t-tests except 100 µM DDE, which was compared to controls using
the Mann-Whitney test.

98
Table 7.5. Grubb's test results for detecting outliers in the data from PI staining. Values given in the
table are p-values. Instances where p < 0.05 (*) indicates the presence of outliers.
Concentration DDT DDE DDD
Control 0.19 0.24 0.32
5 µµµµM 0.01* 0.26 0.03*
10 µµµµM 0.70 0.01* 0.07
50 µµµµM 0.33 0.02* 0.69
100 µµµµM 0.33 0.64 0.00*
150 µµµµM 0.13 0.35 0.05
Table 7.6. Shapiro-Francia test normality results of the observed PI data after removal of outliers
detected with Grubb's test. Values given in the table are p-values. Instances where pppp < 0.05 are
significantly non-normal. * indicates pppp < 0.05.
Concentration DDT DDE DDD
Control 0.68 0.11 0.06
5 µµµµM 0.89 0.78 0.06
10 µµµµM 0.30 0.08 0.88
50 µµµµM 0.54 0.05 0.59
100 µµµµM 0.43 0.05* 0.47
150 µµµµM 0.82 0.15 0.33
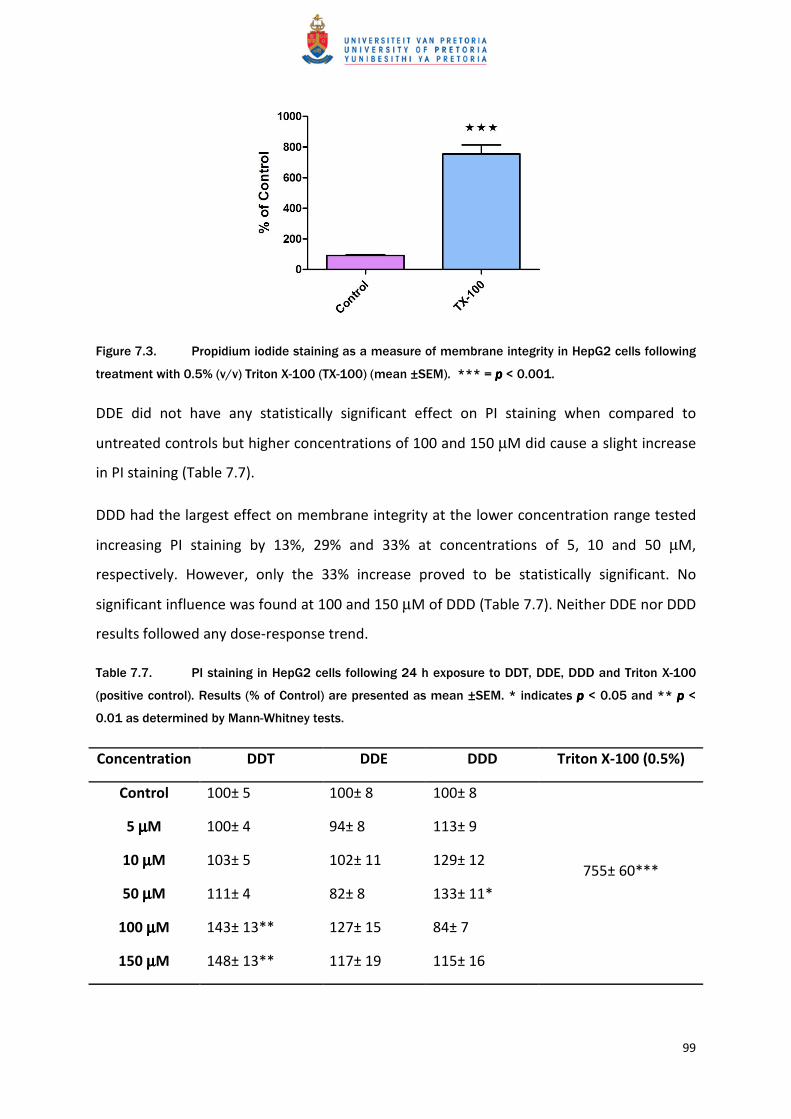
Positive controls yielded an expected increase in membrane damage, causing significantly (p
< 0.001) higher PI staining (755%) than the untreated controls (Figure 7.3). DDT
demonstrated significant loss of membrane integrity at higher concentrations (100 and 150
µM), which is indicated by the significantly higher PI staining (p < 0.01). This effect followed
a dose-dependent trend (Table 7.7).
99
Figure 7.3. Propidium iodide staining as a measure of membrane integrity in HepG2 cells following
treatment with 0.5% (v/v) Triton X-100 (TX-100) (mean ±SEM). *** = pppp < 0.001.
DDE did not have any statistically significant effect on PI staining when compared to
untreated controls but higher concentrations of 100 and 150 µM did cause a slight increase
in PI staining (Table 7.7).
DDD had the largest effect on membrane integrity at the lower concentration range tested
increasing PI staining by 13%, 29% and 33% at concentrations of 5, 10 and 50 µM,
respectively. However, only the 33% increase proved to be statistically significant. No
significant influence was found at 100 and 150 µM of DDD (Table 7.7). Neither DDE nor DDD
results followed any dose-response trend.
Table 7.7. PI staining in HepG2 cells following 24 h exposure to DDT, DDE, DDD and Triton X-100
(positive control). Results (% of Control) are presented as mean ±SEM. * indicates pppp < 0.05 and ** pppp <
0.01 as determined by Mann-Whitney tests.
Concentration DDT DDE DDD Triton X-100 (0.5%)
Control 100± 5 100± 8 100± 8
755± 60***
5 µµµµM 100± 4 94± 8 113± 9
10 µµµµM 103± 5 102± 11 129± 12
50 µµµµM 111± 4 82± 8 133± 11*
100 µµµµM 143± 13** 127± 15 84± 7
150 µµµµM 148± 13** 117± 19 115± 16
100
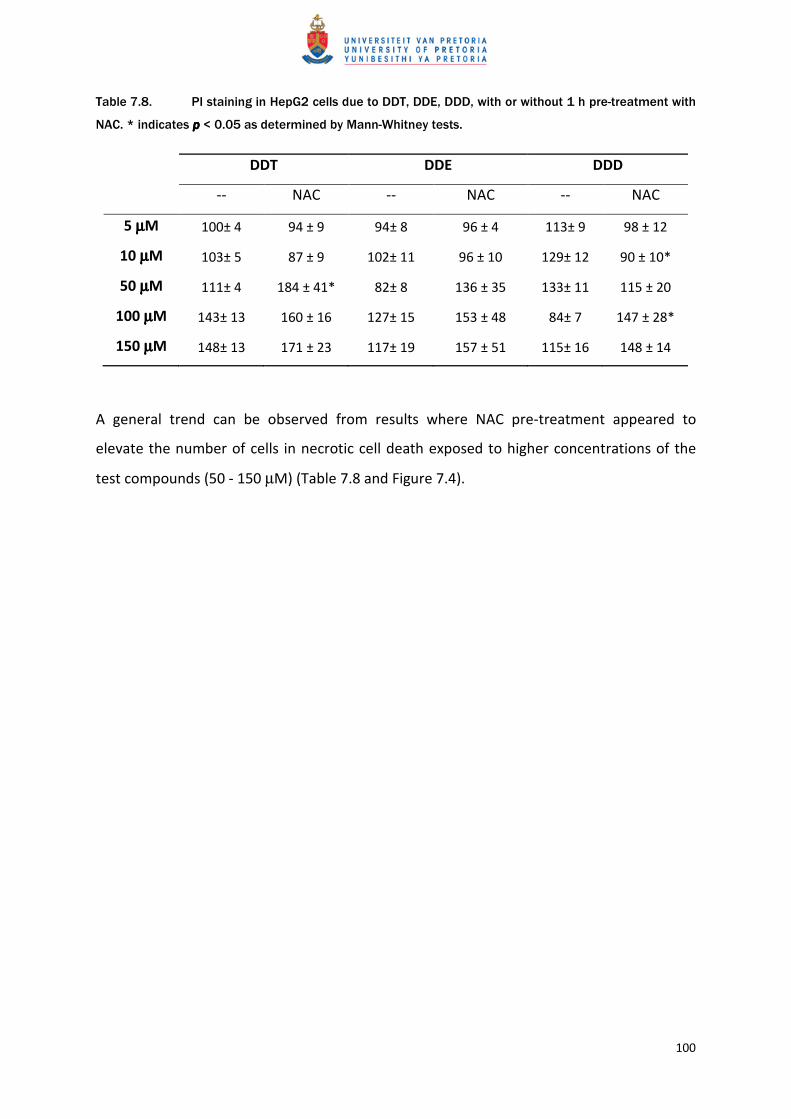
Table 7.8. PI staining in HepG2 cells due to DDT, DDE, DDD, with or without 1 h pre-treatment with
NAC. * indicates pppp < 0.05 as determined by Mann-Whitney tests.
DDT DDE DDD
-- NAC -- NAC -- NAC
5 µµµµM 100± 4 94 ± 9 94± 8 96 ± 4 113± 9 98 ± 12
10 µµµµM 103± 5 87 ± 9 102± 11 96 ± 10 129± 12 90 ± 10*
50 µµµµM 111± 4 184 ± 41* 82± 8 136 ± 35 133± 11 115 ± 20
100 µµµµM 143± 13 160 ± 16 127± 15 153 ± 48 84± 7 147 ± 28*
150 µµµµM 148± 13 171 ± 23 117± 19 157 ± 51 115± 16 148 ± 14
A general trend can be observed from results where NAC pre-treatment appeared to
elevate the number of cells in necrotic cell death exposed to higher concentrations of the
test compounds (50 - 150 µM) (Table 7.8 and Figure 7.4).

101
Figure 7.4. Caspase-3 activity in HepG2 cells following 6 h exposure to DDT (A), DDE (B) and DDD
(C)(mean ±SEM). Graphs (D), (E) and (F) represent the propidium iodide staining of cells exposed to DDT,
DDE and DDD, respectively. Caspase-3 activity and propidium iodide were used as a measure of cell
death by apoptosis and necrosis, respectively. Dashed horizontal lines represent Control values. Results
are given as mean ± SEM. * indicates pppp < 0.05, ** indicates pppp < 0.01 and *** pppp < 0.001 as determined
by Mann-Whitney and Student's t-tests, where applicable. Light green bars represent 1 h pre-treatment
with NAC as opposed to dark green bars, which received no pre-treatment.

102
7.4. Discussion
Following the removal of outliers in the Cas-3 data sets with the Grubb’s test (Table 7.1),
only 3 of the 18 data sets presented non-normal distributions (Table 7.2), indicating good
reproducibility for the Cas-3 assay. Regarding the membrane integrity assay, only 1 of the 18
data sets presented with a non-normal distribution (Table 7.6) after removal of the relevant
outliers (Table 7.5), showing good assay reproducibility.
All three tested compounds affected HepG2 cells leading to dose-dependent activation of
Cas-3, implying activation of the apoptotic pathway. DDT and DDD were more potent than
DDE by highly significantly (p < 0.001) raising Cas-3 activity beyond baseline (controls) at
concentrations as low as 5 µM. Of the three tested compounds, DDD proved to be the most
potent, causing significantly more Cas-3 activity than DDT and DDE at concentrations of 100
µM (≈ +30%) and 150 µM (≈ +70%). In terms of potency the following was observed: DDD >
DDT > DDE. These results correlate very well with the IC50 values determined during the
cytotoxicity assay where a similar trend was noted.
Shi et al. (2010a) examined apoptosis as a possible mode of cell death of cultured
hepatocytes exposed to concentrations of 10 - 100 nM of DDT. During that study the
authors did not observe any DDT-induced apoptosis, probably due to a lack of cell death
(94% viability). Even if that study did report some apoptotic cell death, with cell viability that
high it could have been normal cell attrition and not necessarily DDT-induced. Contrarily,
another study did report apoptosis in HepG2 cells exposed to 50 nM of DDT (Filipak Neto et
al., 2008). The discrepancy between the results from these two studies could be ascribed to
the length of exposure, 24 h (Shi et al., 2010a) versus 96 h (Filipak Neto et al., 2008). In the
present study concentrations of 5 - 10 µM were not found to induce toxicity after 24 h
exposure, but significantly raised Cas-3 activity. It could be hypothesised that lower
concentrations of DDT (that are not necessarily toxic) may cause significant activation of

103
Cas-3 following longer incubation periods such as those used in the study by Filipak Neta et
al. (2008)
The fact that DDT is able to induce apoptosis is not confined to the liver alone. It has also
been reported to induce apoptosis in human peripheral blood mononuclear cells (Perez-
Maldonado et al., 2004), rat thymocytes (Tebourbi et al., 1998) and murine embryos
(Greenlee et al., 1999). DDE has also been reported to induce apoptosis in various types of
tissues such as peripheral blood mononuclear cells (Perez-Maldonado et al., 2004), rat
Sertoli cells (Shi et al., 2009) and cells from the testes of rats exposed in vivo (Shi et al.,
2010b). DDD-induced apoptosis has only been reported in peripheral blood mononuclear
cells (Perez-Maldonado et al., 2004). No literature is available regarding DDE/DDD-induced
apoptosis in cultured hepatocytes. From their study on rat Sertoli cells, Shi et al. (2009)
concluded that exposure to 30 and 50 µM DDE induced apoptosis via the 'extrinsic'
apoptotic pathway as indicated by the up-regulation of caspase-8 activated by the Fas
receptor. The authors suggested that DDE may have activated the receptor-mediated
pathway by activating nuclear factor-κβ, which can exert both pro- and anti-apoptotic
effect, depending on the specific cell type as well as the type of inducer. It is therefore
possible that the increase in Cas-3 activity observed in the present study could also be due
to upstream caspase-8 activation. However, in the liver, nuclear factor-κβ prevents
apoptosis and has a positive role in regeneration (Taub, 1998). Also, observations with
regard to the mitochondrial membrane potential changes after exposure to the test
compounds is suggestive of Cas-3 activation via the 'intrinsic'/mitochondrial-mediated
pathway in that all three test compounds (DDT, DDE and DDD) were able to significantly
raise ∆ψm, which would lead to the release of cyt C from the mitochondria, with subsequent
formation of the apoptosome and Cas-3 activation. Further investigations would be
necessary to confirm which of the two apoptotic pathways are responsible for the elevated
Cas-3 activity after exposure to DDT, DDE and DDD.
No literature could be found with regards to necrotic effects as a result of DDT, DDE or DDD
exposure in vitro. It would be erroneous to conclude that DDT/DDE/DDD induces cell death
104
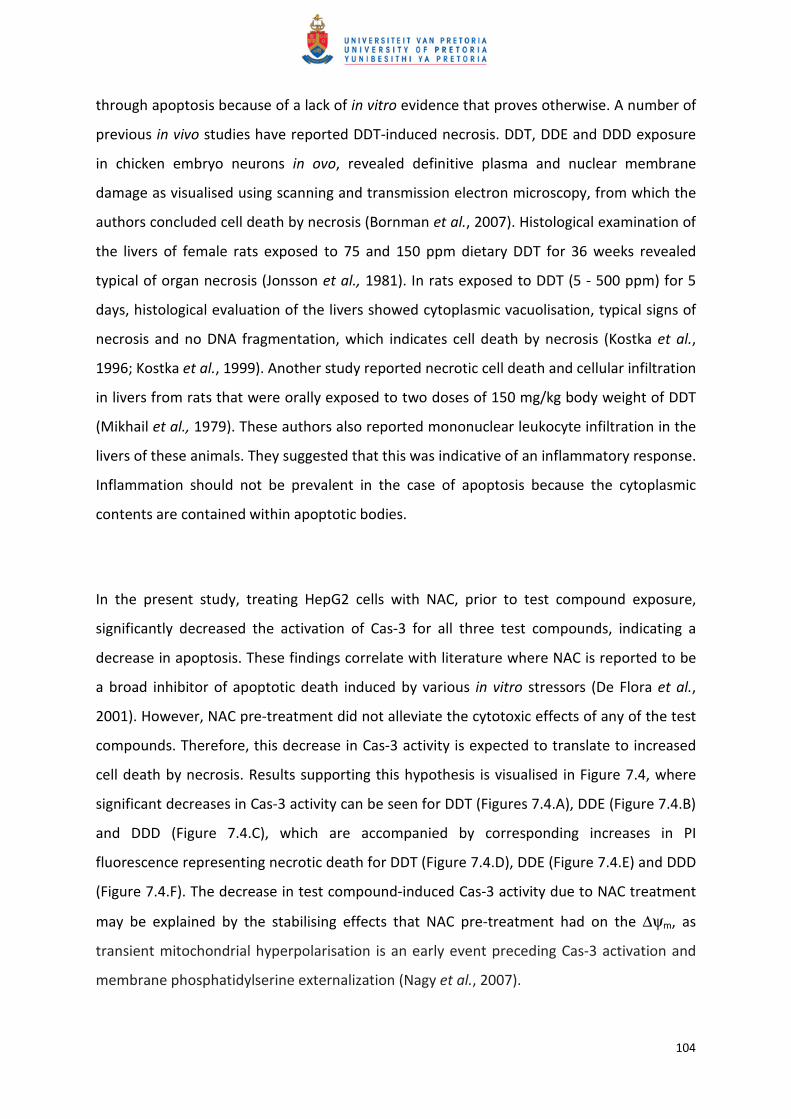
through apoptosis because of a lack of in vitro evidence that proves otherwise. A number of
previous in vivo studies have reported DDT-induced necrosis. DDT, DDE and DDD exposure
in chicken embryo neurons in ovo, revealed definitive plasma and nuclear membrane
damage as visualised using scanning and transmission electron microscopy, from which the
authors concluded cell death by necrosis (Bornman et al., 2007). Histological examination of
the livers of female rats exposed to 75 and 150 ppm dietary DDT for 36 weeks revealed
typical of organ necrosis (Jonsson et al., 1981). In rats exposed to DDT (5 - 500 ppm) for 5
days, histological evaluation of the livers showed cytoplasmic vacuolisation, typical signs of
necrosis and no DNA fragmentation, which indicates cell death by necrosis (Kostka et al.,
1996; Kostka et al., 1999). Another study reported necrotic cell death and cellular infiltration
in livers from rats that were orally exposed to two doses of 150 mg/kg body weight of DDT
(Mikhail et al., 1979). These authors also reported mononuclear leukocyte infiltration in the
livers of these animals. They suggested that this was indicative of an inflammatory response.
Inflammation should not be prevalent in the case of apoptosis because the cytoplasmic
contents are contained within apoptotic bodies.
In the present study, treating HepG2 cells with NAC, prior to test compound exposure,
significantly decreased the activation of Cas-3 for all three test compounds, indicating a
decrease in apoptosis. These findings correlate with literature where NAC is reported to be
a broad inhibitor of apoptotic death induced by various in vitro stressors (De Flora et al.,
2001). However, NAC pre-treatment did not alleviate the cytotoxic effects of any of the test
compounds. Therefore, this decrease in Cas-3 activity is expected to translate to increased
cell death by necrosis. Results supporting this hypothesis is visualised in Figure 7.4, where
significant decreases in Cas-3 activity can be seen for DDT (Figures 7.4.A), DDE (Figure 7.4.B)
and DDD (Figure 7.4.C), which are accompanied by corresponding increases in PI
fluorescence representing necrotic death for DDT (Figure 7.4.D), DDE (Figure 7.4.E) and DDD
(Figure 7.4.F). The decrease in test compound-induced Cas-3 activity due to NAC treatment
may be explained by the stabilising effects that NAC pre-treatment had on the ∆ψm, as
transient mitochondrial hyperpolarisation is an early event preceding Cas-3 activation and
membrane phosphatidylserine externalization (Nagy et al., 2007).

105
Literature describing apoptotic death due to DDT exposure tends to originate from in vitro
studies, whereas necrotic effects have been reported from in vivo studies. A possible
explanation as to why DDT-induced apoptotic death has not been described in vivo may be
the fact that it is difficult to detect apoptosis in vivo. The difficulty in detecting apoptosis in
vivo has been attributed to the fast endogenous clearance of apoptotic cells from an
organism (Zhang et al., 2000; Nyati et al., 2006). In the present study the in vitro tests were
able to detect necrosis due to DDT exposure but not when cells were exposed to DDE and
DDD. DDE and DDD results were inconsistent, not presenting any predictable dose-response
trends. This is likely to be the result of experimental procedures like wash steps, aimed at
reducing background fluorescence. During these wash steps necrotic cells may have been
lost when aspirating the supernatant, even though particular care was taken to try and
avoid this.
In summary, there seems to be no clear distinction between which mode of cell death leads
to the loss of viability due to either DDT, DDE or DDD exposure since evidence exists that
supports both pathways. The inflammatory response seen in vivo appears the most
convincing, which is indicative of necrosis.
It has been reported that a switch can take place from apoptosis to necrosis due to
inactivation of caspases by ROS (Samali et al., 1999; Prabhakaran et al., 2004). In the present
study Cas-3 activity was detected after 6 h and membrane integrity was assessed after 24 h.
It is therefore possible (but unlikely) that DDT may induce activation of Cas-3 but that cell
death eventually occurs due to necrosis after 24 h because of Cas-3 inactivation by CYP1A1-
generated ROS. The fact that DDT may inhibit ATP-synthase provides further support for this
theory as apoptosis is an energy-dependent mode of death and a loss of cellular ATP would
preferentially lead to cell death by necrosis, which is the hepatocyte mode of death
reported in vivo. However, this is disputable as no test compound-induced ROS generation
was observed in the present study.