results - university of pretoria
TRANSCRIPT

73
4. RESULTS
4.1. Semi-solid metal processing
4.1.1. ProCAST simulation of SSM-HPDC of plates
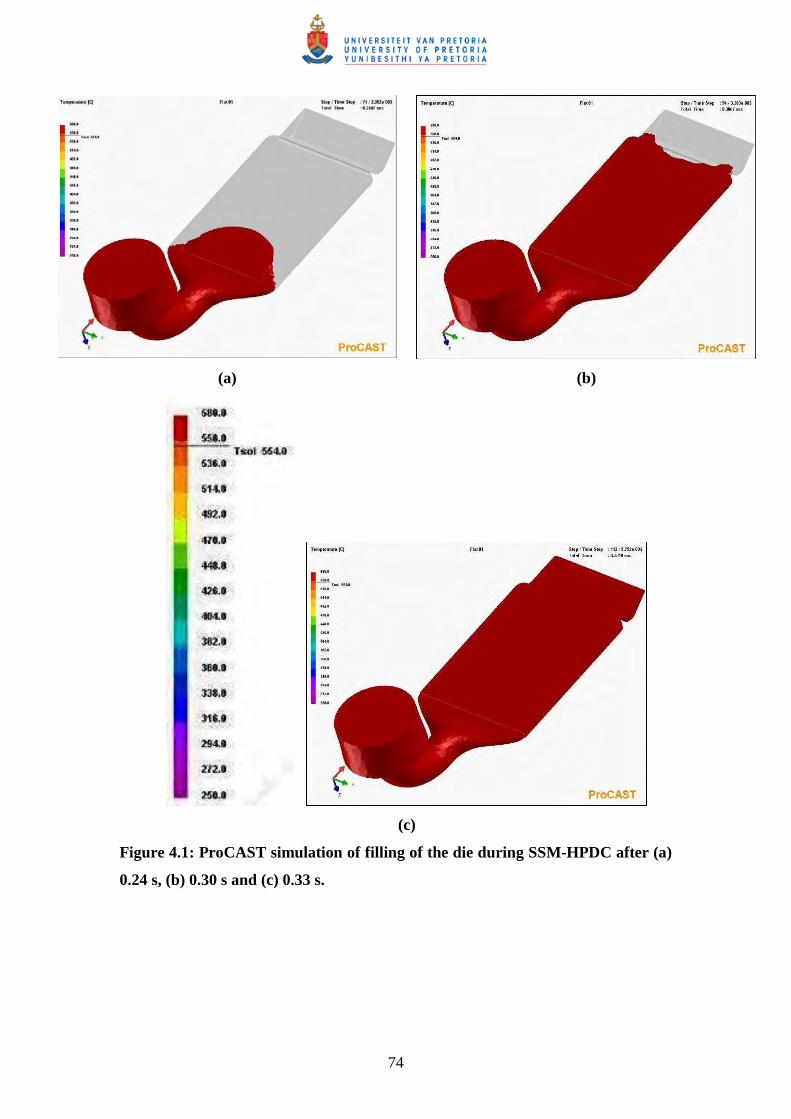
ProCAST (operating in semi-solid mode with “Viscosity” defined with “Power Cut-
Off”) was used to provide an indication of the flow behaviour and cooling
characteristics of the plates during HPDC. Figure 4.1 shows the simulated flow
behaviour of the SSM-slurry during HPDC. Complete filling of the die is predicted to
occur after only ~ 0.33 s (Fig. 4.1(c)).
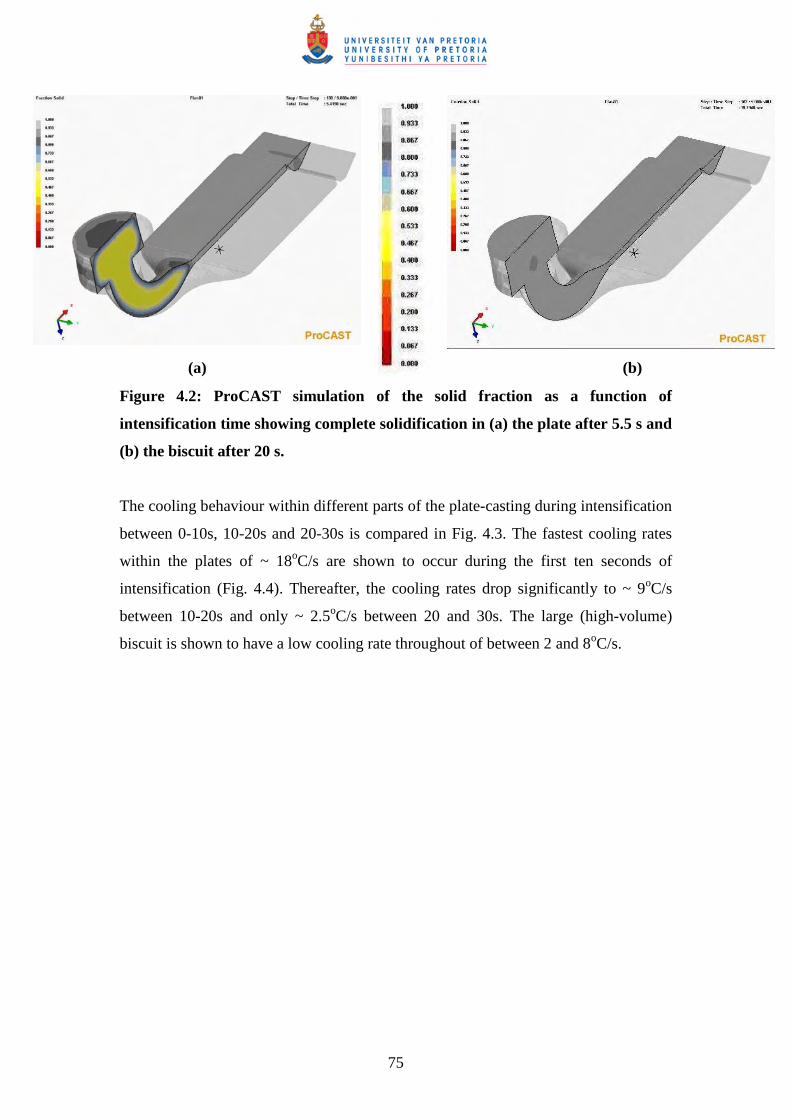
To determine how the plates cool down in the die during the intensification step,
values of Tinitial = 580oC (casting temperature) and Tdie = 250oC were used for the
simulation. Complete solidification is predicted to occur within ~ 5.5 s within the
plate (Fig. 4.2(a)), whereas it is predicted to occur only after ~ 20 s in the relatively
high-volume biscuit (Fig. 4.2(b)).
74
(a) (b)
(c)
Figure 4.1: ProCAST simulation of filling of the die during SSM-HPDC after (a)
0.24 s, (b) 0.30 s and (c) 0.33 s.
75
(a) (b)
Figure 4.2: ProCAST simulation of the solid fraction as a function of
intensification time showing complete solidification in (a) the plate after 5.5 s and
(b) the biscuit after 20 s.
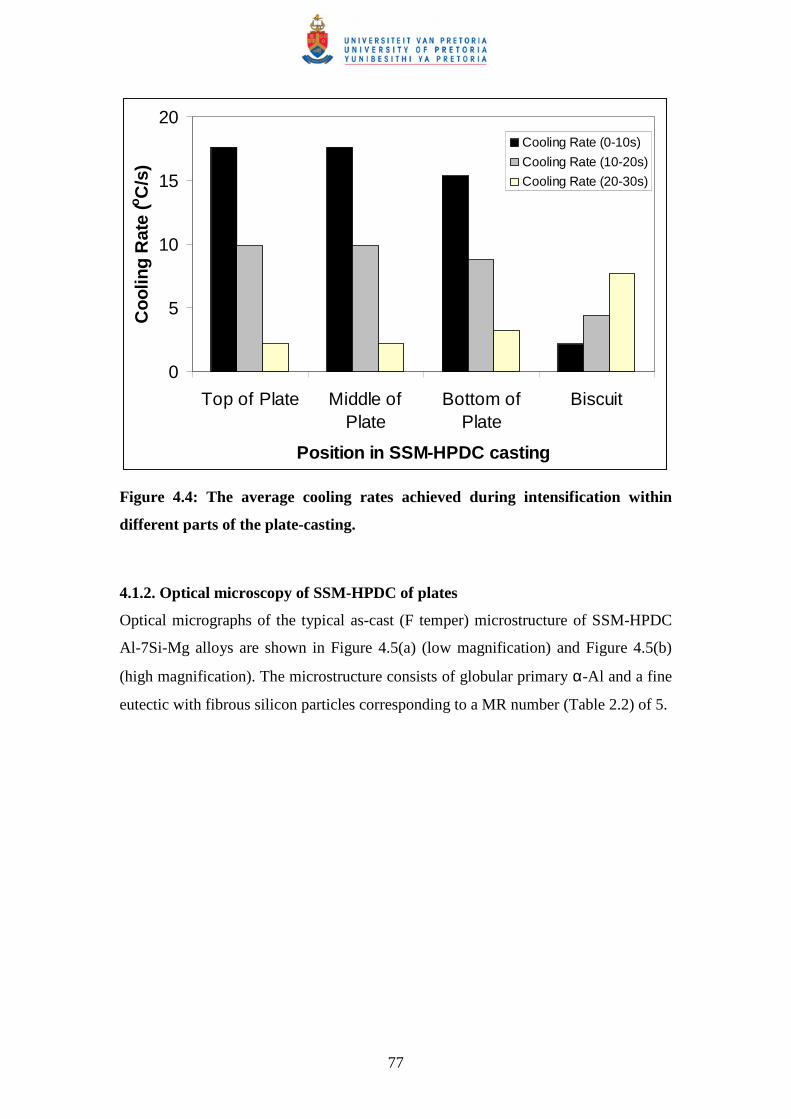
The cooling behaviour within different parts of the plate-casting during intensification
between 0-10s, 10-20s and 20-30s is compared in Fig. 4.3. The fastest cooling rates
within the plates of ~ 18oC/s are shown to occur during the first ten seconds of
intensification (Fig. 4.4). Thereafter, the cooling rates drop significantly to ~ 9oC/s
between 10-20s and only ~ 2.5oC/s between 20 and 30s. The large (high-volume)
biscuit is shown to have a low cooling rate throughout of between 2 and 8oC/s.

76
(a) (b)
(c)
Figure 4.3: Temperature distribution within the plate during intensification in
the die for (a) 10 s, (b) 20 s and (c) 30 s as predicted by ProCAST.
77
0
5
10
15
20
Top of Plate Middle ofPlate
Bottom ofPlate
Biscuit
Position in SSM-HPDC casting
Co
olin
g R
ate
(oC
/s)
Cooling Rate (0-10s)
Cooling Rate (10-20s)
Cooling Rate (20-30s)
Figure 4.4: The average cooling rates achieved during intensification within
different parts of the plate-casting.
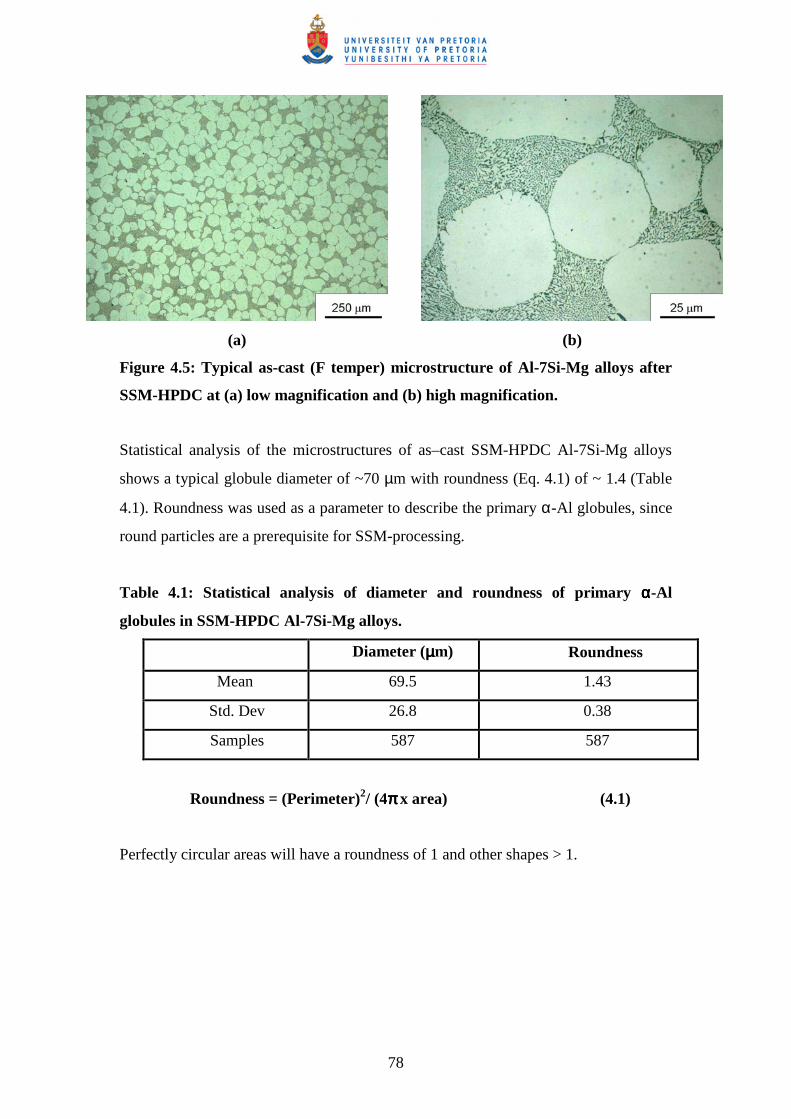
4.1.2. Optical microscopy of SSM-HPDC of plates
Optical micrographs of the typical as-cast (F temper) microstructure of SSM-HPDC
Al-7Si-Mg alloys are shown in Figure 4.5(a) (low magnification) and Figure 4.5(b)
(high magnification). The microstructure consists of globular primary α-Al and a fine
eutectic with fibrous silicon particles corresponding to a MR number (Table 2.2) of 5.
78
(a) (b)
Figure 4.5: Typical as-cast (F temper) microstructure of Al-7Si-Mg alloys after
SSM-HPDC at (a) low magnification and (b) high magnification.
Statistical analysis of the microstructures of as–cast SSM-HPDC Al-7Si-Mg alloys
shows a typical globule diameter of ~70 µm with roundness (Eq. 4.1) of ~ 1.4 (Table
4.1). Roundness was used as a parameter to describe the primary α-Al globules, since
round particles are a prerequisite for SSM-processing.
Table 4.1: Statistical analysis of diameter and roundness of primary αααα-Al
globules in SSM-HPDC Al-7Si-Mg alloys.
Diameter (µµµµm) Roundness
Mean 69.5 1.43
Std. Dev 26.8 0.38
Samples 587 587
Roundness = (Perimeter)2/ (4ππππ x area) (4.1)
Perfectly circular areas will have a roundness of 1 and other shapes > 1.
79
4.2. Solution heat treatment
4.2.1. Spheroidisation of eutectic Si
The size and shape of the eutectic silicon particles in Al-7Si-Mg alloys can be
“modified” (refined) either by chemical additions such as Sr or by rapid cooling
during solidification (Table 2.2). Figure 4.6 shows optical micrographs of as-cast
SSM-HPDC Al-7Si-Mg alloys with varying Sr contents. Statistical analysis of the
eutectic Si-particles in these samples is presented in Table 4.2. The aspect ratio (the
ratio between the major axis and minor axis of an ellipse equivalent to the object) is
used for the eutectic Si-particles, since this parameter has been shown to influence the
properties of these alloys [101].
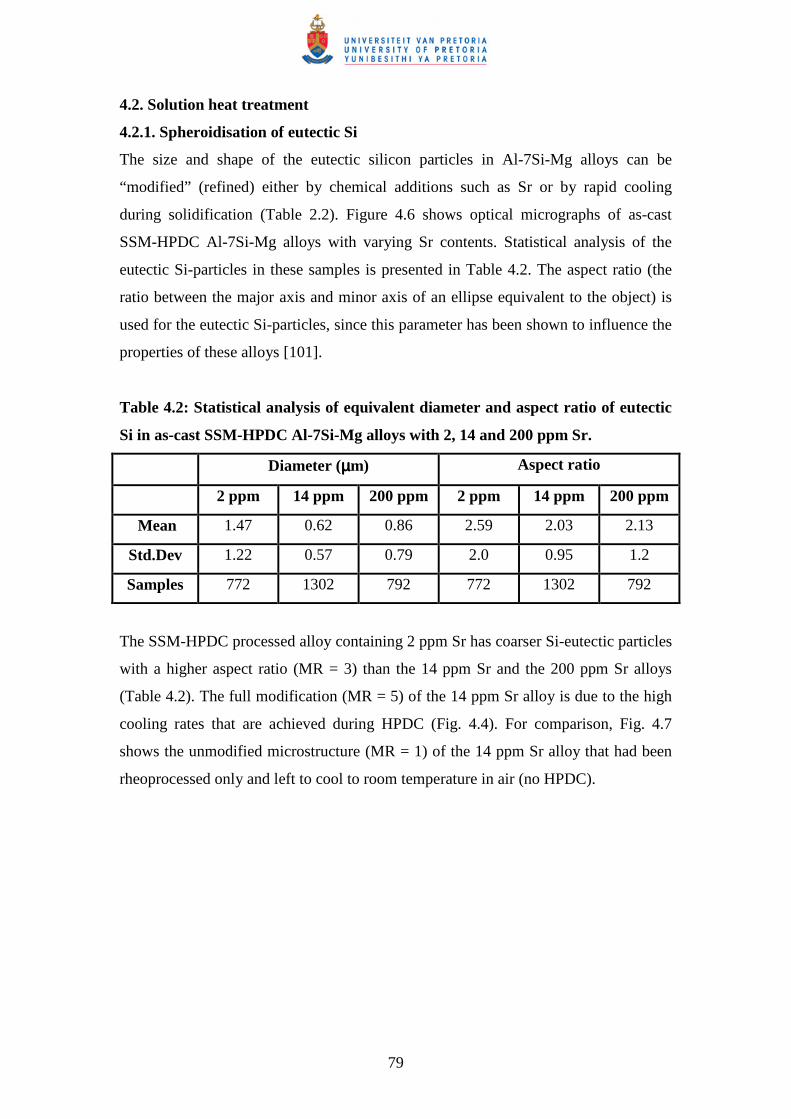
Table 4.2: Statistical analysis of equivalent diameter and aspect ratio of eutectic
Si in as-cast SSM-HPDC Al-7Si-Mg alloys with 2, 14 and 200 ppm Sr.
Diameter (µµµµm) Aspect ratio
2 ppm 14 ppm 200 ppm 2 ppm 14 ppm 200 ppm
Mean 1.47 0.62 0.86 2.59 2.03 2.13
Std.Dev 1.22 0.57 0.79 2.0 0.95 1.2
Samples 772 1302 792 772 1302 792
The SSM-HPDC processed alloy containing 2 ppm Sr has coarser Si-eutectic particles
with a higher aspect ratio (MR = 3) than the 14 ppm Sr and the 200 ppm Sr alloys
(Table 4.2). The full modification (MR = 5) of the 14 ppm Sr alloy is due to the high
cooling rates that are achieved during HPDC (Fig. 4.4). For comparison, Fig. 4.7
shows the unmodified microstructure (MR = 1) of the 14 ppm Sr alloy that had been
rheoprocessed only and left to cool to room temperature in air (no HPDC).

80
2 ppm Sr (MR = 3) 14 ppm Sr (MR = 5)
200 ppm Sr (MR = 5)
Figure 4.6: As-cast microstructures (including MR numbers from Table 2.2) of
SSM-HPDC Al-7Si-Mg alloys with increasing Sr contents.

81
Figure 4.7: Microstructure with MR = 1 (Table 2.2) of rheoprocessed only (not
HPDC) alloy with 14 ppm Sr following air cooling from the semi-solid
temperature.
Modification of the eutectic component enables rapid spheroidisation of the silicon
particles during solution treatment. Figure 4.8 shows microstructures of SSM-HPDC
Al-7Si-Mg alloys with 2, 14 and 200 ppm Sr respectively after solution treatment at
540oC for 1 h. Statistical analysis of the eutectic Si-particles in these samples is
presented in Table 4.3.
Table 4.3: Statistical analysis of diameter and aspect ratio of eutectic Si in
solution treated (540oC-1h) SSM-HPDC Al-7Si-Mg alloys with 2, 14 and 200 ppm
Sr.
Diameter (µµµµm) Aspect ratio
2 ppm 14 ppm 200 ppm 2 ppm 14 ppm 200 ppm
Mean 1.36 1.13 1.24 1.73 1.58 1.54
Std.Dev 0.83 0.80 0.84 1.5 0.79 1.0
Samples 840 1057 420 840 1057 420

82
2 ppm Sr 14 ppm Sr
200 ppm Sr
Figure 4.8: Optical micrographs of solution treated (at 540oC for 1 h) SSM-
HPDC Al-7Si-Mg alloys with 2 ppm Sr, 14 ppm Sr and 200 ppm Sr.
It is seen that spheroidisation of the eutectic silicon particles occurred in all the alloys
with a decrease in the aspect ratio (Table 4.3).
No spheroidisation of the eutectic silicon particles occurred at 540oC in the
rheoprocessed-only (no HPDC) alloy with 14 ppm Sr, even after 4 h at 540oC (Fig.
4.9).

83
540oC-1h 540oC-4h
Figure 4.9: Microstructures after solution treatment at 540oC for rheoprocessed-
only (no HPDC) alloy with 14 ppm Sr.
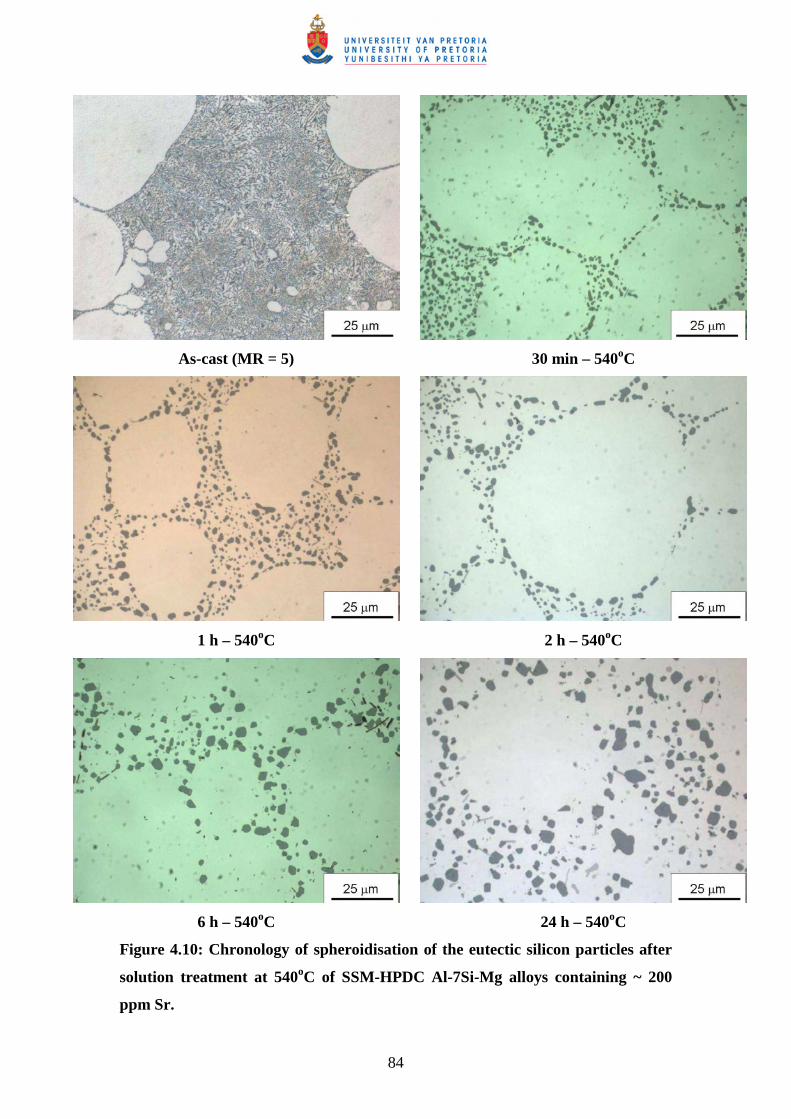
The chronology of the spheroidisation of eutectic Si particles of SSM-HPDC Al-7Si-
Mg alloys (with 200 ppm Sr) is shown in Fig. 4.10. Statistical analysis of the
coarsening of the Si-particles in the eutectic after solution treatment at 540oC is
presented in Table 4.4.
Table 4.4: Statistical analysis of the diameter (in µµµµm) of eutectic Si particles after
solution treatment at 540oC in SSM-HPDC Al-7Si-Mg alloys
30 min 1 h 2 h 6 h 24 h
Mean 1.12 1.24 1.41 1.64 2.05
Std. Dev 0.74 0.84 0.89 1.21 1.50
Samples 582 420 278 427 280
84
As-cast (MR = 5) 30 min – 540oC
1 h – 540oC 2 h – 540oC
6 h – 540oC 24 h – 540oC
Figure 4.10: Chronology of spheroidisation of the eutectic silicon particles after
solution treatment at 540oC of SSM-HPDC Al-7Si-Mg alloys containing ~ 200
ppm Sr.

85
The cube of the change in mean diameter of the Si eutectic particles (D3-Do3, where
Do = 0.86 µm in Table 4.2) is in reasonable direct proportion to solution treatment
time (Fig. 4.11). Therefore, the growth process of the eutectic silicon particles during
solution treatment is described by the Lifshitz-Slyozov-Wagner (LSW) theory of
Ostwald ripening [6,69,102].
R2 = 0.9625
0
1
2
3
4
5
6
7
8
9
0 5 10 15 20 25
Solution treatment time (h)
D3 -
Do
3 (um
3 )
Figure 4.11: The cube of the change in mean diameter of the Si eutectic particles
as a function of solution treatment time at 540oC using as starting diameter (Do)
of as-cast fibrous Si.
4.2.2. Dissolution of solutes and reduction of microsegregation
The time necessary to place magnesium in solid solution (dissolve the Mg2Si in the
alloy) is rapid at 540oC and occurs within minutes (section 2.3.1). However, it is
frequently specified that solution treatments for these alloys at 540oC should be for 4-
10 h (Table 2.8). Artificial aging curves (Fig. 4.12) indicate that similar levels of
strengthening can be obtained following solution treatment at 540oC for either 1 or 6 h
[HM1-HM3].

86
50
60
70
80
90
100
110
0.0 0.1 1.0 10.0 100.0
t (h) at 180oC
VH
N 540C-1h
540C-6h
Figure 4.12: Artificial aging curves for SSM-HPDC A356 (0.34% Mg) following
solution treatment at 540oC for 1 or 6 h (no natural pre-aging).
Tensile results (Table 4.5) of alloy F357 with 0.62% Mg (Table 3.1) confirm these
observations, indicating that even in the higher Mg-containing alloys, a solution
treatment of 1 h at 540oC is sufficient to obtain maximum strength [HM8].

87
Table 4.5: Yield strength (YS), ultimate tensile strength (UTS) and % elongation
after fracture of heat treated SSM-HPDC F357 (0.62% Mg) samples. The
standard deviation from five values for tensile properties is also indicated in
brackets
Heat treatment YS (MPa) UTS (MPa) % Elongation
T4
540oC-0.5h, 120h NA 170 (3.4) 294 (4.4) 14.6 (2.0)
540oC-1h, 120h NA 172 (4.7) 297 (4.0) 17.0 (2.5)
540oC-6h, 120h NA 172 (1.9) 290 (4.1) 14.2 (0.7)
T6
540oC-0.5h, 20h NA, 180oC-4 h 304 (2.2) 353 (1.3) 7.8 (1.4)
540oC-1h, 20h NA, 180oC-4 h 312 (4.1) 355 (3.9) 6.0 (1.3)
540oC-6h, 20h NA, 180oC-4 h 317 (4.9) 354 (5.2) 5.6 (1.4)
4.2.3. Impact strength
The impact strength of SSM-HPDC Al-7Si-Mg alloys with different Mg-contents that
had been solution treated at 540oC for either 1 or 6 h were determined using a Zwick
impact tester with a 40 kpcm hammer [HM3]. The impact strength in the T4 and T6
temper conditions was determined and is shown in Table 4.6. Similar impact
properties are obtained after a solution treatment of 1 h rather than 6 h for each
composition. There is therefore no advantage to impact strength by employing a
longer solution treatment time of 6 h. The strength of the alloy plays a more important
role than the solution treatment time on the impact strength in the T4 and T6 temper
conditions. Linear relationships are found between impact strength and YS (Fig.
4.13(a) and UTS (Fig. 4.13(b)) regardless of whether the solution treatment was
performed for 1 or 6 h. The alloys with lower strength have better impact properties
because crack propagation is more difficult in these materials due to blunting, which
would suggest that a better correlation between impact strength and UTS (rather than
YS) should be found. The reason why a better correlation with UTS is not found in
this case is most likely related to the fact that UTS is influenced significantly more by
small casting defects than YS [103]. Note that Figure 4.13 is only applicable to alloys
in the T4 and T6 temper conditions where spheroidisation of the Si has taken place.
88
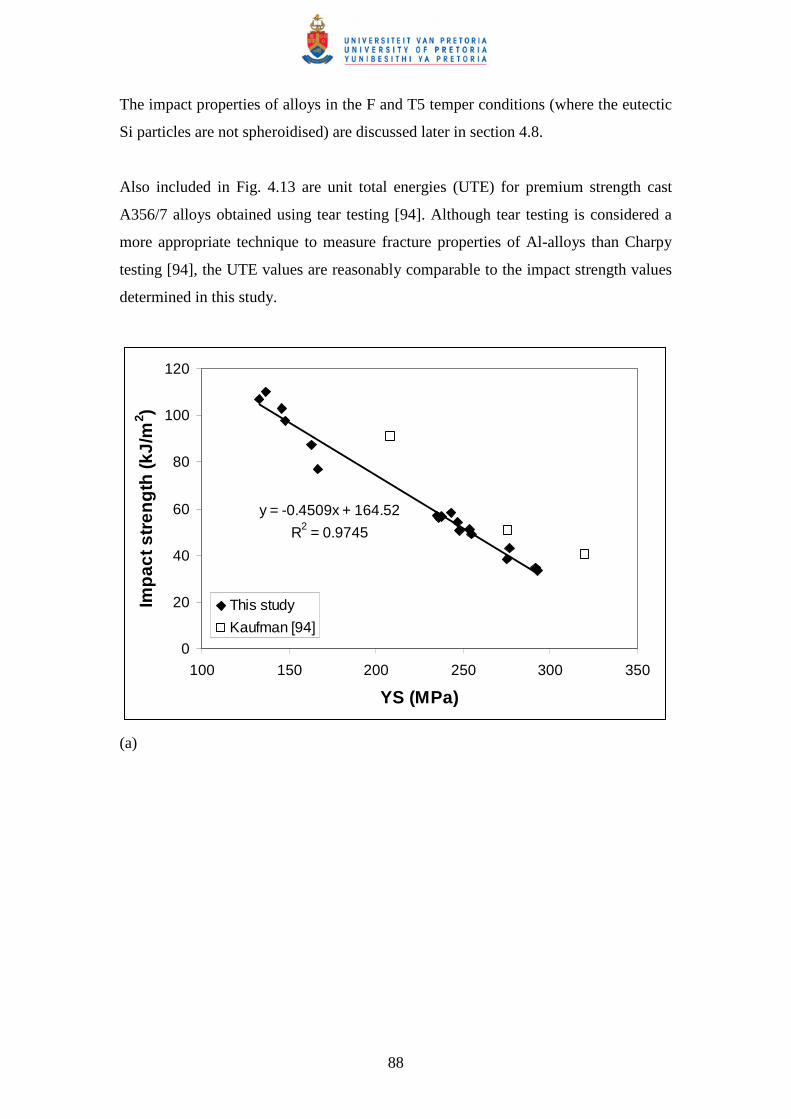
The impact properties of alloys in the F and T5 temper conditions (where the eutectic
Si particles are not spheroidised) are discussed later in section 4.8.
Also included in Fig. 4.13 are unit total energies (UTE) for premium strength cast
A356/7 alloys obtained using tear testing [94]. Although tear testing is considered a
more appropriate technique to measure fracture properties of Al-alloys than Charpy
testing [94], the UTE values are reasonably comparable to the impact strength values
determined in this study.
y = -0.4509x + 164.52
R2 = 0.9745
0
20
40
60
80
100
120
100 150 200 250 300 350
YS (MPa)
Imp
act s
tren
gth
(kJ/
m2 )
This study
Kaufman [94]
(a)

89
y = -0.7776x + 298.76
R2 = 0.9221
0
20
40
60
80
100
120
200 250 300 350 400
UTS (MPa)
Imp
act s
tren
gth
(kJ/
m2 )
This study
Kaufman [94]
(b)
Figure 4.13: Impact strength of SSM-HPDC Al-7Si-Mg alloys in the T4 and T6
temper conditions as a function of (a) YS and (b) UTS of the alloys. UTE values
from tear testing from Kaufmann [94] are also included.

90
Table 4.6: Impact strength of T4 and T6 heat treated samples of Al-7Si-Mg
alloys (standard deviation from five values is also indicated in brackets).
Heat treatment Impact Strength (kJ/m2)
T4
0.25% Mg
540oC,1 h 110.0 (3.7)
540oC, 6 h 106.9 (9.1)
0.31% Mg
540oC,1 h 103.0 (5.5)
540oC, 6 h 97.6 (6.0)
0.45% Mg
540oC,1 h 87.3 (6.4)
540oC,6 h 77.1 (4.7)
T6
0.25% Mg
540oC-6h, 0h NA,180oC-1h 56.5 (6.7)
540oC-1h, 0h NA, 180oC-1h 57.0 (2.4)
540oC-6h, 20h NA, 180oC-4h 56.1 (4.1)
540oC-1h, 20h NA, 180oC-4h 58.3 (1.6)
0.31% Mg
540oC-6h, 0h NA, 180oC-1h 50.6 (2.3)
540oC-1h, 0h NA, 180oC-1h 54.1 (3.0)
540oC-6h, 20h NA, 180oC-4h 49.1 (6.7)
540oC-1h, 20h NA, 180oC-4h 50.9 (4.3)
0.45% Mg
540oC-6h, 0h NA, 180oC-1h 38.3 (3.8)
540oC-1h, 0h NA, 180oC-1h 43.0 (0.7)
540oC-6h, 20h NA, 180oC-4h 33.4 (2.6)
540oC-1h, 20h NA, 180oC-4h 34.6 (2.0)
91
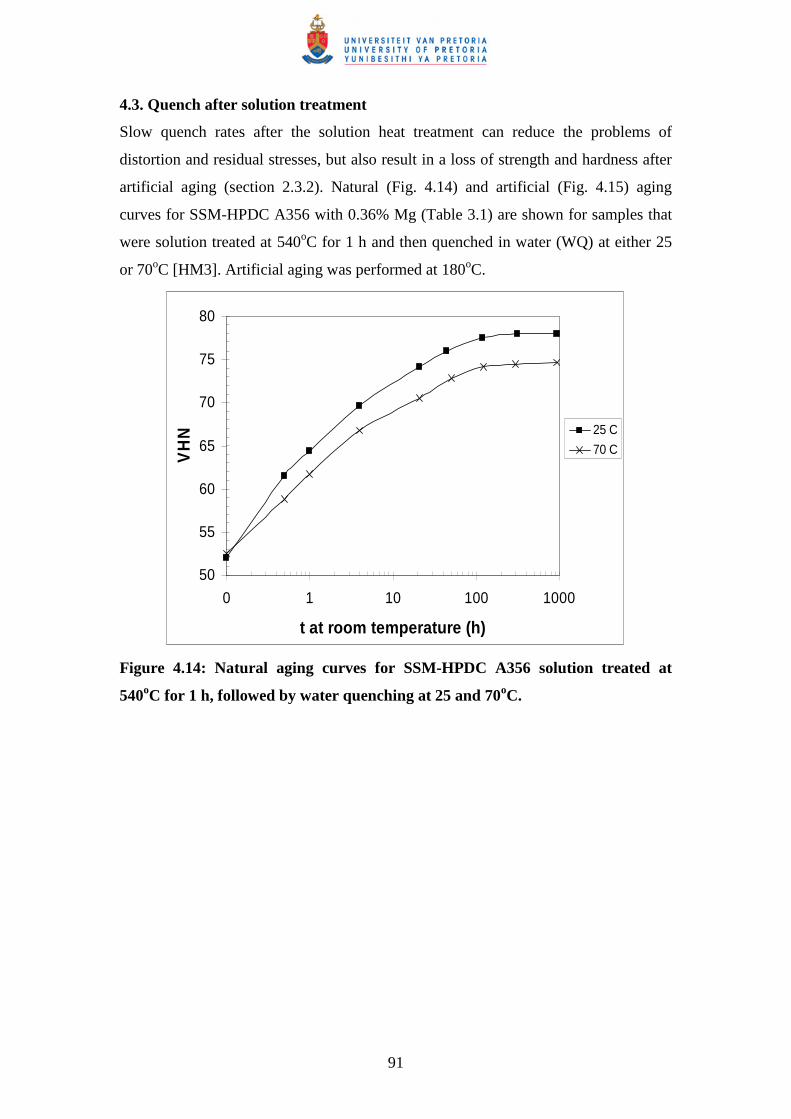
4.3. Quench after solution treatment
Slow quench rates after the solution heat treatment can reduce the problems of
distortion and residual stresses, but also result in a loss of strength and hardness after
artificial aging (section 2.3.2). Natural (Fig. 4.14) and artificial (Fig. 4.15) aging
curves for SSM-HPDC A356 with 0.36% Mg (Table 3.1) are shown for samples that
were solution treated at 540oC for 1 h and then quenched in water (WQ) at either 25
or 70oC [HM3]. Artificial aging was performed at 180oC.
50
55
60
65
70
75
80
0 1 10 100 1000
t at room temperature (h)
VH
N 25 C
70 C
Figure 4.14: Natural aging curves for SSM-HPDC A356 solution treated at
540oC for 1 h, followed by water quenching at 25 and 70oC.

92
50
60
70
80
90
100
110
120
0.1 1 10 100
t at 180oC (h)
VH
N
25 C
70 C
Figure 4.15: Artificial aging curves at 180oC for SSM-HPDC A356 solution
treated at 540oC for 1 h, followed by water quenching at 25 and 70oC and
artificial aging at 180oC.
It is seen that the higher quench temperature leads to a lower T4 hardness due to less
supersaturation (Fig. 4.14). The more sluggish artificial aging response following the
70oC quench is presumably due to less quenched in vacancies (Fig. 4.14). The peak
hardness (VHN = 106) is slightly less than when a 25oC water quench is used. This is
most likely due to a lower degree of supersaturation obtained after the 70oC water
quench. The tensile properties of SSM-HPDC A356 (0.40% Mg) in the T4 and T6
temper conditions are compared in Table 4.7 for samples quenched in 25 and 70oC
water respectively. As expected, the YS and UTS of the 70oC water quenched alloys
are less than the 25oC water quenched alloys.

93
Table 4.7: YS, UTS, % elongation after fracture of T4 and T6 heat treated SSM-
HPDC samples (0.40wt% Mg-A356). The standard deviation from five values for
tensile properties is also indicated in brackets.
Heat
Treatment
YS
(MPa)
UTS
(MPa)
% Elongation
T4
540oC-1h, 25WQ, 120h NA 152 (3.5) 282 (6.1) 15.8 (3.3)
540oC-1h, 70WQ, 120h NA 138 (2.2) 264 (6.5) 16.5 (2.5)
T6
540oC-1h,25WQ,0h NA,180oC-4h 276 (8.0) 342 (4.9) 9.1 (1.2)
540oC-1h,70WQ,0h NA,180oC-4h 265 (5.0) 330 (2.7) 9.8 (2.1)
540oC-1h,25WQ,120h NA,180oC-4h 280 (5.2) 337 (6.0) 6.9 (1.8)
540oC-1h,70WQ,120h NA,180oC-4h 265 (3.5) 327 (4.5) 8.6 (0.7)
4.4. Natural aging and the T4 temper
Natural aging time is the time a component is stored at room temperature after the
solution heat treatment and quench. The precipitation hardening that result from
natural aging alone (no artificial aging) produces the T4 temper. Figure 4.16 shows
natural aging curves for SSM-HPDC Al-7Si-Mg alloys after solution treatment at
540oC for 1 h, followed by a water quench (25oC) before natural aging [HM1].

94
50
55
60
65
70
75
80
85
90
0 1 10 100 1000
Natural aging time (h)
VH
N
0.28% Mg
0.34% Mg
0.45% Mg
Figure 4.16: Natural aging curves for SSM-HPDC Al-7Si-Mg alloys following
solution treatment at 540oC for 1 h and a 25oC water quench.
The alloy is relatively soft immediately after quenching (VHN = ~ 53), but thereafter
the hardness increases rapidly and eventually levels out after about 120 h
corresponding to the stable T4 temper. The natural aging response of these alloys is
considered to be due to the forming of (Mg+Si) clusters (see APT results in section
4.14). The tensile properties of SSM-HPDC Al-7Si-Mg alloys with different Mg-
contents are shown in Table 4.8.
95
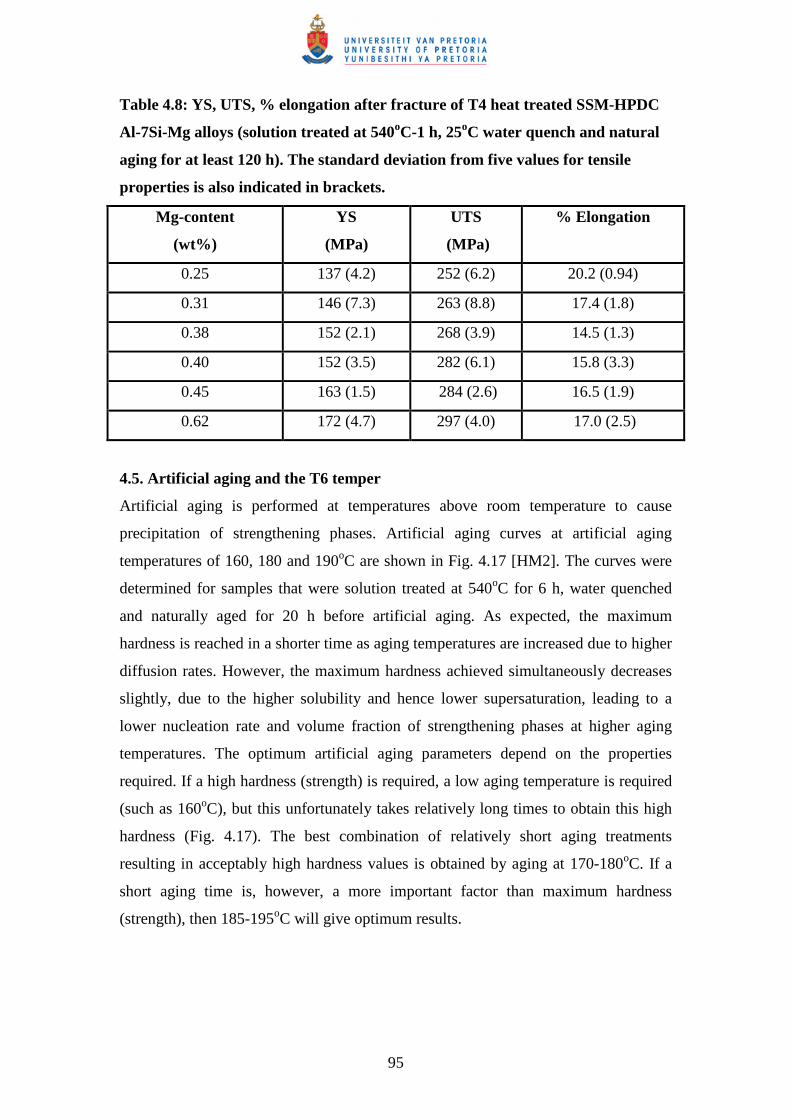
Table 4.8: YS, UTS, % elongation after fracture of T4 heat treated SSM-HPDC
Al-7Si-Mg alloys (solution treated at 540oC-1 h, 25oC water quench and natural
aging for at least 120 h). The standard deviation from five values for tensile
properties is also indicated in brackets.
Mg-content
(wt%)
YS
(MPa)
UTS
(MPa)
% Elongation
0.25 137 (4.2) 252 (6.2) 20.2 (0.94)
0.31 146 (7.3) 263 (8.8) 17.4 (1.8)
0.38 152 (2.1) 268 (3.9) 14.5 (1.3)
0.40 152 (3.5) 282 (6.1) 15.8 (3.3)
0.45 163 (1.5) 284 (2.6) 16.5 (1.9)
0.62 172 (4.7) 297 (4.0) 17.0 (2.5)
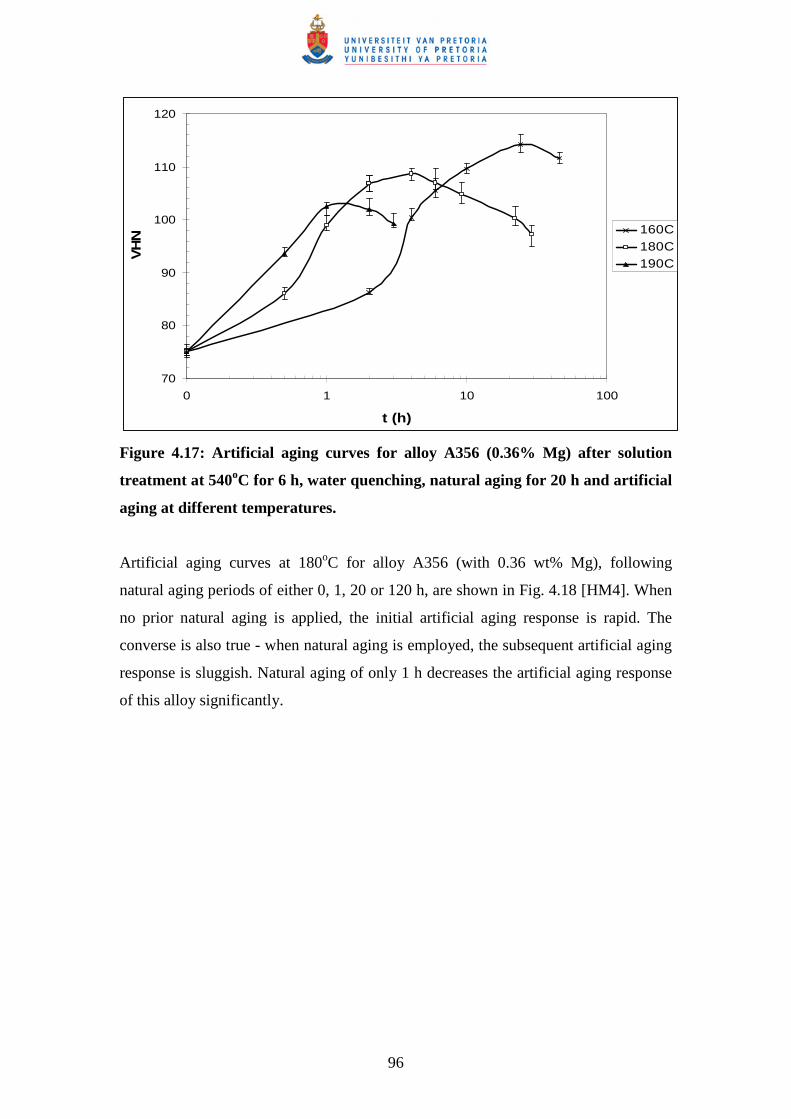
4.5. Artificial aging and the T6 temper
Artificial aging is performed at temperatures above room temperature to cause
precipitation of strengthening phases. Artificial aging curves at artificial aging
temperatures of 160, 180 and 190oC are shown in Fig. 4.17 [HM2]. The curves were
determined for samples that were solution treated at 540oC for 6 h, water quenched
and naturally aged for 20 h before artificial aging. As expected, the maximum
hardness is reached in a shorter time as aging temperatures are increased due to higher
diffusion rates. However, the maximum hardness achieved simultaneously decreases
slightly, due to the higher solubility and hence lower supersaturation, leading to a
lower nucleation rate and volume fraction of strengthening phases at higher aging
temperatures. The optimum artificial aging parameters depend on the properties
required. If a high hardness (strength) is required, a low aging temperature is required
(such as 160oC), but this unfortunately takes relatively long times to obtain this high
hardness (Fig. 4.17). The best combination of relatively short aging treatments
resulting in acceptably high hardness values is obtained by aging at 170-180oC. If a
short aging time is, however, a more important factor than maximum hardness
(strength), then 185-195oC will give optimum results.
96
70
80
90
100
110
120
0 1 10 100
t (h)
VH
N 160C180C190C
Figure 4.17: Artificial aging curves for alloy A356 (0.36% Mg) after solution
treatment at 540oC for 6 h, water quenching, natural aging for 20 h and artificial
aging at different temperatures.
Artificial aging curves at 180oC for alloy A356 (with 0.36 wt% Mg), following
natural aging periods of either 0, 1, 20 or 120 h, are shown in Fig. 4.18 [HM4]. When
no prior natural aging is applied, the initial artificial aging response is rapid. The
converse is also true - when natural aging is employed, the subsequent artificial aging
response is sluggish. Natural aging of only 1 h decreases the artificial aging response
of this alloy significantly.

97
50
60
70
80
90
100
110
0 1 10 100
t at 180oC (h)
VH
N
0 h1 h20 h120 h
Figure 4.18: Artificial aging curves at 180oC after natural aging for times of 0, 1,
20 and 120 h respectively for A356 with 0.36wt% Mg.
This phenomenon can be explained by two different mechanisms. Firstly, it has been
shown that the precipitates which grow during artificial aging from the clusters are
coarser than those that develop in certain 6000 series alloys aged immediately after
quenching. This results in a reduction of up to 10% in tensile properties for certain
alloys [9]. Secondly, it has been shown that natural aging following the solution
treatment reduced the age hardenability of Al-Mg-Si wrought alloy 6016, especially
in the under-aged condition [104]. This was attributed to solute clustering during
natural aging, and the subsequent dissolution of these clusters during artificial aging.
The extent of the loss was, however, recovered by precipitation of β″−particles upon
further aging.
Considering Fig. 4.18, it is seen that for alloy A356, the hardness values of naturally
aged samples are also recovered with further artificial aging. The mechanism of the
formation of coarser precipitates that leads to a decrease in tensile properties does not
allow for a full recovery in hardness. It is also seen from Fig. 4.18 that the hardness of
the sample that did not age naturally increases immediately during artificial aging.

98
However, the samples that were naturally aged soften during the first 10 minutes at
180oC, before the hardness increases again. The clusters that form during natural
aging and their response during artificial aging are shown in detail in the APT results
in section 4.14.
When no natural pre-aging occurs, a plateau is maintained once the maximum
hardness is reached during artificial aging after about 1 to 5 h (Fig. 4.18). This differs
from when natural pre-aging occurs, when a hardness peak is observed after
approximately 4 h. The tensile properties (YS and UTS) are shown Table 4.9 as a
function of the artificial aging time within the hardness plateau (with no prior natural
aging). It is seen that the ultimate tensile strengths of the samples on the hardness
plateau are similar. However, the yield strength of the 1 hour artificially aged sample
is significantly lower than the rest of the samples with a concurrent higher ductility.
The hardness plateau allows more freedom in terms of the artificial aging times that
can be used and the dangers of either under-aging or over-aging are therefore
minimised. Once natural aging occurs, a hardness plateau is not maintained during the
subsequent artificial aging. Instead, a hardness peak is reached after approximately 4
h (Fig. 4.18). This would necessitate stricter control in terms of artificial aging time
(i.e. aging for less than 4 h will result in under-aging, and aging for more than 4 h will
result in over-aging). The tensile properties after artificial aging for 4 h at 180oC as a
function of prior natural aging time are also shown in Table 4.9. In this case, no
significant differences are seen in either the yield strength or ultimate tensile strength.
The influence of natural aging prior to artificial aging can therefore be removed by a 4
h, 180oC artificial aging treatment. It is seen from Fig. 4.18 that, while artificial aging
at 180oC for 1 h causes maximum hardening in SSM-HPDC A356 that was not
naturally aged, under-aging is achieved in samples that were naturally aged prior to
artificial aging. The tensile properties of 0.40wt% Mg-A356 were determined under
these conditions (1 h artificial aging at 180oC for samples that were naturally aged for
0 h, 20 h and 120 h). The negative influence of natural aging on the initial stages of
artificial aging can be seen in Table 4.9. Similar effects to those observed for SSM-
HPDC A356 in Table 4.9 have also been found for the higher Mg-containing (0.62%)
SSM-HPDC alloy F357 and are presented in Table 4.10 [HM8].

99
Table 4.9: Yield strength (YS), UTS and % elongation after fracture of SSM-
HPDC A356. The standard deviation from five values for tensile properties is
also indicated in brackets.
Heat treatment YS (MPa) UTS (MPa) % Elongation
0.36wt% Mg
540oC-1h,0h NA,180oC-1h 255 (4.8) 330 (6.4) 10.4 (2.5)
540oC-1h,0h NA,180oC-2h 269 (8.5) 334 (6.8) 7.5 (1.9)
540oC-1h,0h NA,180oC-4h 273 (6.5) 333 (8.4) 8.4 (2.1)
540oC-1h,0h NA,180oC-5h 273 (3.1) 328 (6.9) 7.7 (3.1)
540oC-1h,1h NA,180oC-4h 269 (5.8) 325 (4.6) 10.3 (3.4)
540oC-1h,20h NA,180oC-4h 270 (4.7) 325 (2.8) 9.3 (1.7)
540oC-1h,120h NA,180oC-4h 270 (5.5) 328 (5.8) 8.0 (2.2)
0.40wt% Mg
540oC-1h,0h NA,180oC-1h 266 (7.5) 341 (9.5) 7.8 (1.8)
540oC-1h,20h NA,180oC-1h 224 (7.5) 315 (3.4) 12.5 (1.4)
540oC-1h,120h NA,180oC-1h 233 (8.2) 318 (5.2) 10.0 (2.7)
540oC-1h,-18oC for 20h,180oC-1h 266 (6.7) 343 (4.7) 9.1 (1.9)
Table 4.10: Yield strength (YS), ultimate tensile strength (UTS) and %
elongation after fracture of SSM-HPDC F357 (0.62% Mg). The standard
deviation from five values for tensile properties is also indicated in brackets
Heat treatment YS (MPa) UTS (MPa) % Elongation
540oC-1h,0h NA,180oC-1h 296 (2.9) 358 (3.7) 7.4 (0.7)
540oC-1h,0h NA,180oC-2h 307 (3.1) 364 (2.5) 9.6 (2.4)
540oC-1h,0h NA,180oC-4h 315 (5.2) 360 (5.0) 5.7 (1.1)
540oC-1h,20h NA,180oC-1h 243 (6.2) 320 (7.9) 9.5 (2.6)
540oC-1h,20h NA,180oC-2h 289 (10.7) 346 (4.5) 8.0 (2.4)
540oC-1h,20h NA,180oC-4h 312 (4.1) 355 (3.9) 6.0 (1.3)
To determine whether the process of natural aging could be impeded by low
temperatures, SSM-HPDC A356 samples were stored in a freezer at -18oC for 20 h
after quenching, before artificial aging at 180oC for 1 h. The tensile properties (Table

100
4.9) indicate that this treatment was indeed successful. The artificial aging response of
the samples that were kept in the freezer was the same as the samples that were not
naturally aged at all. However, it would be more practical to remove the influence of
natural pre-aging by employing an artificial aging treatment of 180oC for 4 h.
The onset of the hardness plateau (no natural aging) and hardness peak (with natural
aging) in Fig. 4.18 as a function of artificial aging temperature follows an Arrhenius-
type response (tT6 = C EXP (Q/RT)) with C the pre-exponential factor, Q the
activation energy in J/mol and R the universal gas constant = 8.314 J/mol K). The
equations that describe the time-to-maximum-hardness (tT6) are given by equation 4.2
(with prior natural aging time) and equation 4.3 (for no natural aging time) [HM2]:
tT6 = 2.3 x 10⁻¹⁵ EXP (163000 / 8.314T) (4.2)
tT6 = 4.9 x 10⁻¹⁶ EXP (163000/ 8.314T) (4.3)
with tT6 the time in seconds and T the artificial aging temperature in K.
Arrhenius-type plots are shown in Fig. 4.19 for the artificial aging of SSM-HPDC Al-
7Si-Mg alloys with prior natural aging (Equation 4.2) and without prior natural aging
(Equation 4.3). Comparing the equations and plots, it is seen that an instantaneous
transfer from quench to artificial aging does not have an influence on the activation
energy (Q). It does, however, decrease the pre-exponential factor C, thereby resulting
in a much faster artificial aging response. These equations are useful for determining
how long an SSM-HPDC Al-7Si-Mg component must be artificially aged at a specific
temperature to get maximum hardness (for convenience the temperatures and times
are shown in Table 4.11).
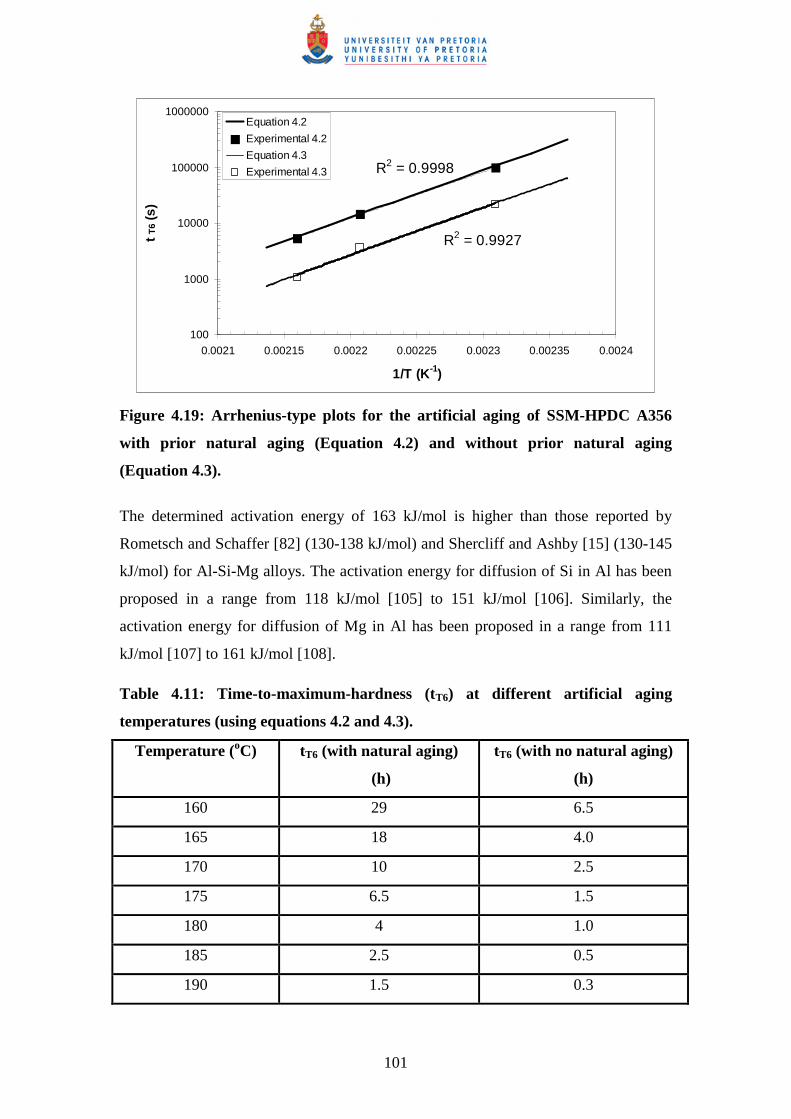
101
R2 = 0.9998
R2 = 0.9927
100
1000
10000
100000
1000000
0.0021 0.00215 0.0022 0.00225 0.0023 0.00235 0.0024
1/T (K-1)
t T6
(s)
Equation 4.2
Experimental 4.2
Equation 4.3
Experimental 4.3
Figure 4.19: Arrhenius-type plots for the artificial aging of SSM-HPDC A356
with prior natural aging (Equation 4.2) and without prior natural aging
(Equation 4.3).
The determined activation energy of 163 kJ/mol is higher than those reported by
Rometsch and Schaffer [82] (130-138 kJ/mol) and Shercliff and Ashby [15] (130-145
kJ/mol) for Al-Si-Mg alloys. The activation energy for diffusion of Si in Al has been
proposed in a range from 118 kJ/mol [105] to 151 kJ/mol [106]. Similarly, the
activation energy for diffusion of Mg in Al has been proposed in a range from 111
kJ/mol [107] to 161 kJ/mol [108].
Table 4.11: Time-to-maximum-hardness (tT6) at different artificial aging
temperatures (using equations 4.2 and 4.3).
Temperature (oC) tT6 (with natural aging)
(h)
tT6 (with no natural aging)
(h)
160 29 6.5
165 18 4.0
170 10 2.5
175 6.5 1.5
180 4 1.0
185 2.5 0.5
190 1.5 0.3
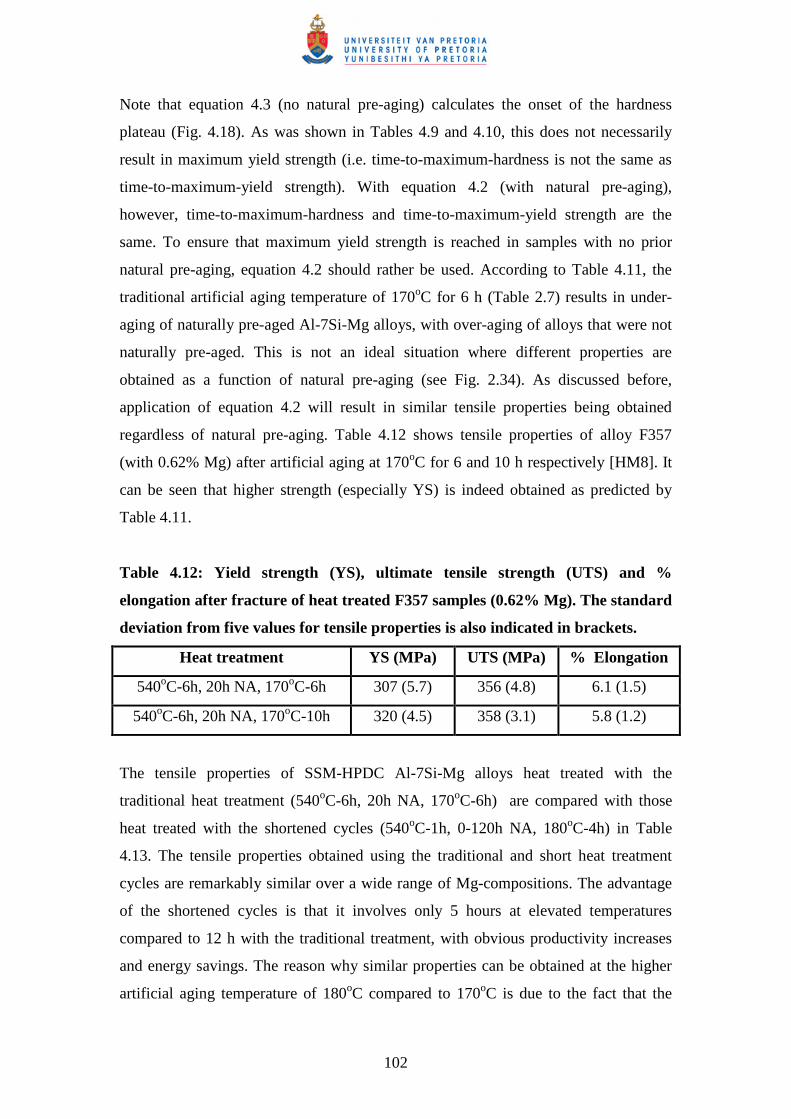
102
Note that equation 4.3 (no natural pre-aging) calculates the onset of the hardness
plateau (Fig. 4.18). As was shown in Tables 4.9 and 4.10, this does not necessarily
result in maximum yield strength (i.e. time-to-maximum-hardness is not the same as
time-to-maximum-yield strength). With equation 4.2 (with natural pre-aging),
however, time-to-maximum-hardness and time-to-maximum-yield strength are the
same. To ensure that maximum yield strength is reached in samples with no prior
natural pre-aging, equation 4.2 should rather be used. According to Table 4.11, the
traditional artificial aging temperature of 170oC for 6 h (Table 2.7) results in under-
aging of naturally pre-aged Al-7Si-Mg alloys, with over-aging of alloys that were not
naturally pre-aged. This is not an ideal situation where different properties are
obtained as a function of natural pre-aging (see Fig. 2.34). As discussed before,
application of equation 4.2 will result in similar tensile properties being obtained
regardless of natural pre-aging. Table 4.12 shows tensile properties of alloy F357
(with 0.62% Mg) after artificial aging at 170oC for 6 and 10 h respectively [HM8]. It
can be seen that higher strength (especially YS) is indeed obtained as predicted by
Table 4.11.
Table 4.12: Yield strength (YS), ultimate tensile strength (UTS) and %
elongation after fracture of heat treated F357 samples (0.62% Mg). The standard
deviation from five values for tensile properties is also indicated in brackets.
Heat treatment YS (MPa) UTS (MPa) % Elongation
540oC-6h, 20h NA, 170oC-6h 307 (5.7) 356 (4.8) 6.1 (1.5)
540oC-6h, 20h NA, 170oC-10h 320 (4.5) 358 (3.1) 5.8 (1.2)
The tensile properties of SSM-HPDC Al-7Si-Mg alloys heat treated with the
traditional heat treatment (540oC-6h, 20h NA, 170oC-6h) are compared with those
heat treated with the shortened cycles (540oC-1h, 0-120h NA, 180oC-4h) in Table
4.13. The tensile properties obtained using the traditional and short heat treatment
cycles are remarkably similar over a wide range of Mg-compositions. The advantage
of the shortened cycles is that it involves only 5 hours at elevated temperatures
compared to 12 h with the traditional treatment, with obvious productivity increases
and energy savings. The reason why similar properties can be obtained at the higher
artificial aging temperature of 180oC compared to 170oC is due to the fact that the

103
180oC-4h treatment results in peak aging, whereas 170oC-6h results in under-aging
(Table 4.11).
Table 4.13: Yield strength (YS), ultimate tensile strength (UTS) and %
elongation after fracture of SSM-HPDC Al-7Si-Mg samples heat treated with the
traditional or shortened heat treatments. The standard deviation from five
values for tensile properties is also indicated in brackets.
Heat treatment YS (MPa) UTS (MPa) % Elongation
0.28% Mg
540oC-6h, 20h NA, 170oC-6h 243 (4.1) 296 (6.5) 7.2 (1.3)
540oC-1h, 0-120h NA, 180oC-4h 240 (2.8) 301 (3.1) 9.4 (0.9)
0.34% Mg
540oC-6h, 20h NA, 170oC-6h 261 (4.5) 316 (5.9) 8.3 (2.1)
540oC-1h, 0-120h NA, 180oC-4h 259 (5.2) 317 (7.1) 8.8 (1.4)
0.45% Mg
540oC-6h, 20h NA, 170oC-6h 297 (5.0) 345 (5.6) 7.3 (2.3)
540oC-1h, 0-120h NA, 180oC-4h 294 (5.8) 344 (3.1) 7.1 (1.4)
0.62% Mg
540oC-6h, 20h NA, 170oC-6h 307 (5.7) 356 (4.8) 6.1 (1.5)
540oC-1h, 0-120h NA, 180oC-4h 312 (4.1) 355 (3.9) 6.0 (1.3)
4.6. The effects of Mg and Fe in Al-7Si-Mg alloys
The tensile properties of SSM-HPDC Al-7Si-Mg alloys from this study are compared
in Fig. 4.20 with SSM-processed Al-7Si-Mg alloys from other researchers [35,89], all
heat treated with the traditional T6 heat treatment cycles.
104
220
240
260
280
300
320
340
360
380
0.25 0.3 0.35 0.4 0.45 0.5 0.55 0.6 0.65
% Mg
YS
an
d U
TS
(M
Pa)
YS_CSIR
UTS_CSIR
YS_[35]
UTS_[35]
YS_[89]
UTS_[89]
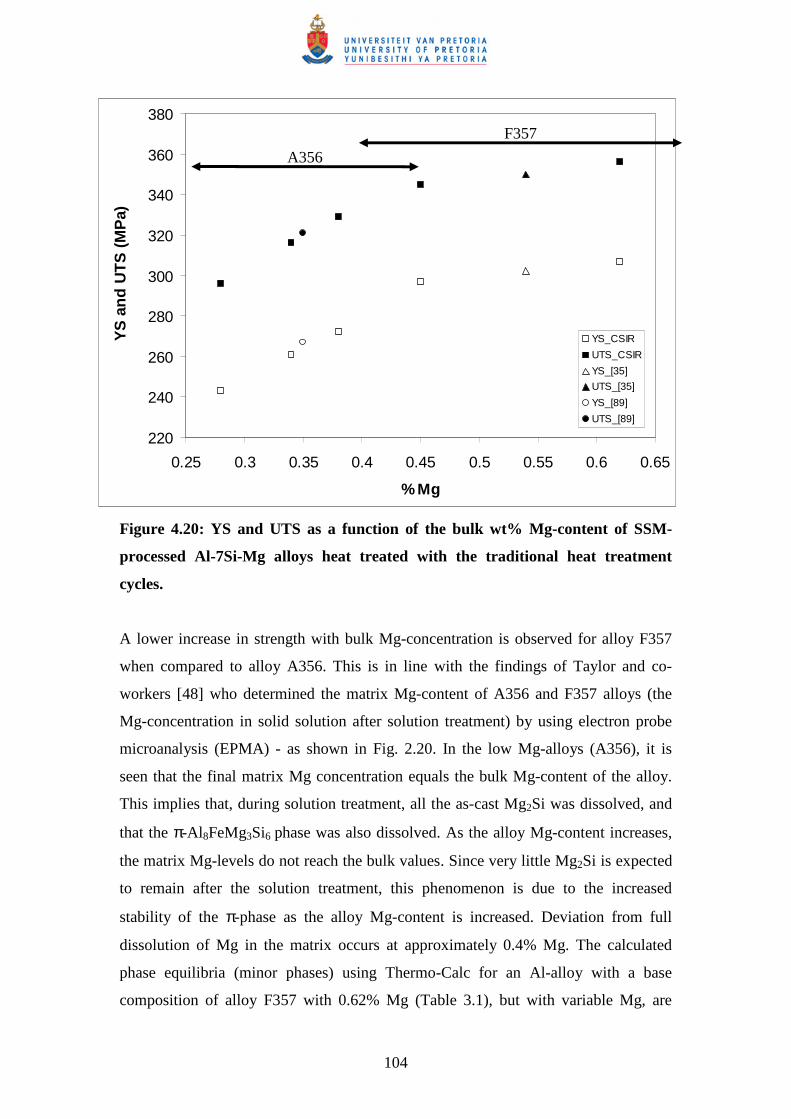
Figure 4.20: YS and UTS as a function of the bulk wt% Mg-content of SSM-
processed Al-7Si-Mg alloys heat treated with the traditional heat treatment
cycles.
A lower increase in strength with bulk Mg-concentration is observed for alloy F357
when compared to alloy A356. This is in line with the findings of Taylor and co-
workers [48] who determined the matrix Mg-content of A356 and F357 alloys (the
Mg-concentration in solid solution after solution treatment) by using electron probe
microanalysis (EPMA) - as shown in Fig. 2.20. In the low Mg-alloys (A356), it is
seen that the final matrix Mg concentration equals the bulk Mg-content of the alloy.
This implies that, during solution treatment, all the as-cast Mg2Si was dissolved, and
that the π-Al 8FeMg3Si6 phase was also dissolved. As the alloy Mg-content increases,
the matrix Mg-levels do not reach the bulk values. Since very little Mg2Si is expected
to remain after the solution treatment, this phenomenon is due to the increased
stability of the π-phase as the alloy Mg-content is increased. Deviation from full
dissolution of Mg in the matrix occurs at approximately 0.4% Mg. The calculated
phase equilibria (minor phases) using Thermo-Calc for an Al-alloy with a base
composition of alloy F357 with 0.62% Mg (Table 3.1), but with variable Mg, are
A356
F357

105
shown in Fig. 4.21 [HM8]. In this figure, the liquidus and solidus temperatures are
indicated by arrows; "pi" refers to the π phase, "beta" is β−Al5FeSi, and "alpha" is an
Al-Mn-Fe-Si solid solution based on Al8Fe2Si (containing approximately equal
amounts of Mn and Fe for the cases considered here). In all cases the major phases
were liquid, Al-based FCC solid solution (the primary phase upon solidification), and
Si (formed by eutectic solidification). In the region of the solution temperature (just
below the solidus) the effect is quite clear: higher Mg levels increase the stability
range of π to higher temperatures, and suppress β−Al5FeSi formation at high
temperatures. A secondary effect is that the dissolution temperature of Mg2Si
increases (and the equilibrium mass fraction of Mg2Si at low temperatures increases),
as one would expect. The extension of the stability range of the π-phase to high
temperatures is in line with the observation that it is not possible to remove π by
solution treatment in the high-Mg alloys above 0.4% in Fig. 2.20. According to the
Thermo-Calc simulations, the dissolution temperature of π increases linearly with the
Mg content of the alloy, and reaches 540°C at a Mg content of 0.40%.
Figs. 4.22(a,b) show scanning electron micrographs of SSM-HPDC A356 and F357
after solution treatment at 540oC for 6 hours. The needle-like phase that is found in
both A356 and F357 is tentatively identified by energy dispersive spectroscopy (EDS)
(Fig. 4.23(a)) as likely to be β−Al 5FeSi. The blocky intermetallic phase that was
mainly found in F357 is tentatively identified with EDS (Fig. 4.23(b)) as likely to be
the Mg-containing π-phase (Al8FeMg3Si6).

106
Figure 4.21: Calculated phase equilibria (minor phases) for Al alloy containing
7.01% Si, 0.10% Fe, 0.01% Cu, 0.01% Mn, 0.13% Ti and variable Mg.

107
(a) (b)
Figure 4.22: Secondary electron images of (a) alloy A356 (with 0.36wt% Mg) and
(b) alloy F357 (with 0.62% Mg) after solution treatment at 540oC for 6 h.
The data from Taylor and co-workers [48] as plotted in Fig. 2.20 were used to
estimate the Mg-concentration available for precipitation hardening for the bulk
compositions used in Fig. 4.20.
Make y = wt% Mg available for precipitation hardening
x = Bulk wt% Mg-content of alloy
For 0.25 ≤ Bulk Mg ≤ 0.4
y = x (4.4)
For 0.4 ≤ Bulk Mg ≤ 0.7 (see Figure 4.24, deduced from the high Mg-range in Figure
2.20)
y = -0.25x2 +0.665x + 0.1755 (4.5)

108
Figure 4.23(a): EDS spectrum for a β−β−β−β−Al5FeSi-particle. Note the absence of a
Mg-peak, (b) EDS spectrum for a ππππ-particle. Note the presence of a Mg-peak.
a
b

109
y = -0.25x2 + 0.665x + 0.1755
R2 = 0.9941
0.4
0.42
0.44
0.46
0.48
0.5
0.52
0.4 0.45 0.5 0.55 0.6 0.65 0.7
Bulk wt%Mg
wt%
Mg
ava
ilble
for
pre
cip
itatio
n h
ard
enin
g
Figure 4.24: Estimation of Mg-content available for precipitation hardening for
bulk Mg-contents of between 0.40 and 0.70% (Data points from Fig. 2.20 [48]).
The effects of Mg on the yield strength can be understood in terms of the age-
hardening process. It is known [109] that the increment of the yield strength (∆YS) is
determined by the volume fraction (f) of shearable and non-shearable precipitates (eq.
4.6 - also see Chapter 6):
∆YS = Constant x (f)1/2 (4.6)
Provided that all the Mg is available for precipitation hardening (i.e. calculated by
equations 4.4 and 4.5 and converting from wt% to at% Mg), then ∆YS should be
proportional to (at% Mg available for precipitation hardening)1/2 – eq. 4.6 [109].
Therefore, taking the same YS data points in Fig. 4.20 and plotting it against (at% Mg
available for precipitation hardening)1/2, a linear relationship is obtained as shown in
Fig. 4.25. Note that a good linear relationship is also found between YS and (at% Mg
available for precipitation hardening) - i.e. not the square root of the at% Mg (Fig.
4.26) [HM8]. This occurs due to the fact that the mathematical function of x1/2 vs x is
almost linear in the composition range of x = 0.28-0.55at% Mg-available for
110
precipitation hardening in alloys A356/7 (Fig. 4.27). However, the YS-at%Mg1/2
relationship in Fig. 4.25 is fundamentally the correct relationship.
Figure 4.25: YS as a function of (at% Mg-concentration available for
precipitation hardening)1/2 for the traditional T6 heat treatment - same data
points used as in Figure 4.20.

111
Figure 4.26: YS as a function of at% Mg-concentration available for
precipitation hardening for the traditional T6 heat treatment - same data points
used as in Figures 4.20 and 4.25.
y = 0.783x + 0.3161
R2 = 0.998
0
0.1
0.2
0.3
0.4
0.5
0.6
0.7
0.8
0.9
1
0 0.2 0.4 0.6 0.8 1
x
x1/2
Figure 4.27: (x)1/2 vs x mathematical function showing an almost linear relation
in the typical range of x = 0.28-0.55at% Mg-available for precipitation hardening
for alloys A356/7.

112
Figure 4.25 is applicable to the traditional T6 heat treatments. A similar approach was
followed to determine if the Mg-content has a comparable effect on the CSIR heat
treatment cycles (Figs. 4.28 to 4.33) [HM1]. The tensile properties of SSM-HPDC Al-
7Si-Mg alloys with different Mg-contents in the CSIR heat treated T6 temper
conditions are shown in Table 4.14.
50
60
70
80
90
100
110
120
130
0.0 0.1 1.0 10.0 100.0
t at 180oC (h)
VH
N 0.28% Mg
0.34% Mg
0.45% Mg
Figure 4.28: Artificial aging curves at 180oC for SSM-HPDC Al-7Si-Mg alloys
after 0 h natural pre-aging.

113
50
60
70
80
90
100
110
120
130
0.0 0.1 1.0 10.0 100.0
t at 180oC (h)
VH
N
0.28% Mg
0.34% Mg
0.45% Mg
Figure 4.29: Artificial aging curves at 180oC for SSM-HPDC Al-7Si-Mg alloys
after 20 h natural pre-aging.
50
60
70
80
90
100
110
120
130
0.0 0.1 1.0 10.0 100.0
t at 180oC (h)
VH
N
0.28% Mg
0.34% Mg
0.45% Mg
Figure 4.30: Artificial aging curves at 180oC for SSM-HPDC Al-7Si-Mg alloys
after 120 h natural pre-aging.

114
50
60
70
80
90
100
110
120
130
0 1 10 100
t at 160oC (h)
VH
N
0.28% Mg
0.34% Mg
0.45% Mg
Figure 4.31: Artificial aging curves at 160oC for SSM-HPDC Al-7Si-Mg alloys
after 0 h natural pre-aging.
50
60
70
80
90
100
110
120
130
0 1 10 100
t at 160oC (h)
VH
N
0.28% Mg
0.34% Mg
0.45% Mg
Figure 4.32: Artificial aging curves at 160oC for SSM-HPDC Al-7Si-Mg alloys
after 20 h natural pre-aging.

115
50
60
70
80
90
100
110
120
130
0 1 10 100
t at 160oC (h)
VH
N
0.28% Mg
0.34% Mg
0.45% Mg
Figure 4.33: Artificial aging curves at 160oC for SSM-HPDC Al-7Si-Mg alloys
after 120 h natural pre-aging.
Table 4.14: Yield strength (YS), UTS and % elongation after fracture of SSM-
HPDC Al-7Si-Mg alloys (produced with the 50t HPDC machine) in the T6
temper condition (540oC-1h, {20-120}h NA, 180oC-4h). The standard deviation
from five values for tensile properties is also indicated in brackets.
Mg-content
(wt%)
Mg-content
(at%)
YS (MPa) UTS (MPa) % Elongation
0.25 0.28 243 (1.4) 303 (1.5) 7.9 (0.7)
0.28 0.31 240 (2.8) 301 (3.1) 9.4 (0.9)
0.31 0.35 254 (6.1) 313 (7.3) 10.5 (0.9)
0.34 0.38 259 (5.2) 317 (7.1) 8.8 (1.4)
0.36 0.40 270 (5.5) 328 (5.8) 8.0 (2.2)
0.38 0.42 272 (5.1) 332 (4.4) 7.9 (1.5)
0.40 0.45 280 (5.2) 337 (6.0) 6.9 (1.8)
0.45 0.50 294 (5.8) 344 (3.1) 7.1 (1.4)
0.62 0.69 312 (4.1) 355 (3.9) 6.0 (1.3)

116
The data in Table 4.14 were processed in a similar manner to that in Fig. 4.25 to
produce YS as a function of (at% Mg-concentration available for precipitation
hardening)1/2 for the short CSIR T6 heat treatment cycles (Fig. 4.34).
y = 349.81x + 48.854
R2 = 0.956
220
230
240
250
260
270
280
290
300
310
320
0.5 0.55 0.6 0.65 0.7 0.75
(at%Mg available for precipitaion hardening)1/2
YS
(MP
a)
Figure 4.34: YS as a function of (at% Mg-concentration available for
precipitation hardening)1/2 for the short CSIR T6 heat treatment (540-1,{20-
120}NA, 180-4).
As with Fig. 4.25, a reasonable linear relationship is also found in Fig. 4.34. Note that
the data points in Figures 4.25 and 4.34 are only applicable for Al-7Si-Mg alloys
containing ~ 0.1% Fe. Alloys with more than 0.1% Fe should result in the formation
of more of the π-phase and vice versa.
The alloys with 0.62% Mg-0.10% Fe and 0.67% Mg-0.25% Fe in Table 3.1 were used
to study the effects of Fe-levels above specification [HM9]. The calculated phase
equilibria (minor phases) using Thermo-Calc for these two Al-alloys of alloy F357 are
shown in Fig. 4.35. In this figure, the liquidus and solidus temperatures are indicated
by arrows; "pi" refers to the π phase, "beta" is β−Al 5FeSi, and "alpha" is an Al-Mn-
Fe-Si solid solution based on Al8Fe2Si. In all cases the major phases were liquid, Al-
based FCC solid solution (the primary phase upon solidification), and Si (formed by

117
eutectic solidification). Comparing the two diagrams, it is seen that the predicted
Mg2Si content is slightly lower for the 0.62Mg-0.10Fe alloy than the 0.67Mg-0.25Fe
alloy. This is to be expected, as the Mg-content of the former is lower than that of the
latter. Based solely on the Mg-contents of the two alloys, the expectation is that the
strength in the T6 temper of alloys from the 0.67Mg-0.25Fe alloy should be slightly
higher (see the discussion on tensile properties later to see why this is not the case
here – due to the effects of Fe). The higher Fe and Ni contents of the 0.67Mg-0.25Fe
alloy lead to significantly higher predicted quantities of phases such as π-
Al 8FeMg3Si6, β-Al5FeSi and Al9FeNi than for the 0.62Mg-0.10Fe alloy. Scanning
electron microscopy (coupled with EDS to tentatively identify phases) was used to
study the intermetallic phases in the T4 and T6 temper conditions (the intermetallics
are similar in both temper conditions). Backscattered electron images of samples from
both alloys are shown in Fig. 4.36. For the 0.62Mg-0.10Fe alloy (Fig. 4.36(a)), only
β-Al 5FeSi and π-Al 8FeMg3Si6 could be identified in the eutectic (see typical EDS
spectra in Fig. 4.37 for all qualitatively identified phases in the samples). However,
for the 0.67Mg-0.25Fe alloy, apart from higher quantities of β-Al 5FeSi and π-
Al8FeMg3Si6, particles of Al9FeNi could also be identified (Fig. 4.36(b) and Fig.
4.37(c)). Note that Si was also detected in the EDS of the Al9FeNi particles. The
maximum solubility of Si in this phase has been reported to be 4% [110]. The tensile
properties of T4 and T6 heat treated samples were determined and the results are
shown in Table 4.15.

118
(a)
(b)
Figure 4.35: Calculated phase equilibria (minor phases) for Al alloys with
compositions given in Table 3.1 corresponding to the (a) 0.62Mg-0.10Fe alloy and
(b) 0.67Mg-0.25Fe alloy.
The expectation is that the 0.67Mg-0.25Fe should give higher strength than the
0.62Mg-0.10Fe alloy in both temper conditions based on Fig. 4.34. However, from
Table 4.15 it can be seen that the strength (YS and UTS) of the two alloys are fairly
similar. This can be related directly to the higher Fe-content of the 0.67Mg-0.25Fe
alloy. The presence of high quantities of the Mg-containing π-phase in samples from
this alloy (Fig. 4.36(b)) causes a reduction in the amount of magnesium in solid
solution, which has a detrimental effect on the aging behaviour of samples from this

119
alloy. Note that the Mg-free particles such as β-Al 5FeSi and Al9FeNi particles do not
contribute to this effect.
(a) (b)
Figure 4.36: Backscattered electron images of T6 samples of (a) 0.62Mg-0.10Fe
alloy and (b) 0.67Mg-0.25Fe alloy.
Table 4.15: Yield strength (YS), ultimate tensile strength (UTS) and %
elongation after fracture (%A) of T4 and T6 heat treated F357 samples. The
standard deviation from five values for tensile properties is also indicated in
brackets.
Alloy YS (MPa) UTS (MPa) % A
T4 (540oC-1h, 120 h natural aging)
0.62Mg-0.10Fe 172 (4.7) 297 (4.0) 17 (2.5)
0.67Mg-0.25Fe 169 (3.6) 285 (5.7) 8.2 (2.0)
T6 (540oC-1h, 20 h natural aging, 180oC-4h artificial aging)
0.62Mg-0.10Fe 312 (4.1) 355 (3.9) 6.0 (1.3)
0.67Mg-0.25Fe 313 (2.2) 353 (5.0) 3.5 (0.64)
120
a
b
c

121
Figure 4.37: EDS spectra of qualitatively identified (a) π π π π-Al 8FeMg3Si6, (b) β β β β-
Al 5FeSi (note the absence of a Mg-peak) and (c) Al9FeNi particles (note the
presence of a Ni-peak). The EDS spectrum in (d) is of a primary αααα-Al grain from
a T4 sample as reference.
Even though the YS and UTS of the two alloys are fairly similar, the ductilities differ
significantly (Table 4.15). The % elongation of samples from the 0.67Mg-0.25Fe is
considerably lower in both temper conditions. Figure 4.38 shows a backscattered
electron image of a sample from the 0.67Mg-0.25Fe alloy in the T6 condition after
tensile testing. The fracture occurred to the right of the image and part of the fracture
surface can be seen. Micro-cracking of the intermetallics can clearly be seen. Taylor
and co-workers [48] also reasoned that any increase in the amount of hard, brittle π-
intermetallics would lead to a decrease in elongation to fracture values in this alloy
system.
d

122
Figure 4.38: Backscattered electron image of T6 sample of the 0.67Mg-0.25Fe
after tensile testing showing the fracture surface on the right, as well as micro-
cracking of the ππππ-intermetallics.
Another effect of the intermetallics in this alloy system (which was not studied in this
work) is their influence on corrosion properties. Yang and co-workers [34] showed
that intermetallic compounds play a major role in the pit initiation process of Al–7Si–
Mg alloys. Micro-galvanic cells are produced, leading to corrosion attack along the
interface between the intermetallic compounds and the aluminium alloy matrix. The
0.67Mg-0.25Fe alloy is therefore expected to have inferior corrosion resistance
compared to the 0.62Mg-0.10Fe alloy.
4.7. Artificial aging and the T5 temper
The T5 temper is achieved by artificially aging as-cast material without a solution
treatment (as opposed to the T4 and T6 temper conditions where a solution heat
treatment is used).
Variables that affect the T5 properties are the cooling rate after casting (air or AQ and
water or WQ), the natural aging period after quenching and the artificial aging

123
temperature and time. The tensile properties of differently T5-treated SSM-HPDC
alloy F357 (with 0.63% Mg) are compared in Table 4.16 [HM6]. As expected, higher
tensile properties are obtained by water quenching the alloy after SSM-HPDC rather
than cooling in air. Also, it can be seen from Table 4.16 that there is a significant
difference in tensile properties between the as-cast material that was cooled in air
[F357-F(AQ)] and the F357-T5(AQ) sample. This implies that most of the elements
are actually placed in solution during cooling with SSM-HPDC, rather than with the
quench after SSM-HPDC. It has been shown that the solidification rate during HPDC
is relatively high (Fig. 4.4).
Table 4.16: Yield strength (YS), ultimate tensile strength (UTS) and %
elongation after fracture (%A) of SSM-HPDC F357 with 0.63% Mg. The
standard deviation from 12 values for tensile properties is also indicated in
brackets.
Quench after
SSM-HPDC
Natural Aging
(NA)
Artificial
aging (AA)
YS (MPa) UTS (MPa) % A
Air (AQ) 25oC-120 h - 117 (2.2) 229 (4.9) 9.9 (1.7)
Water (WQ) 25oC-120 h - 124 (2.7) 241 (6.1) 9.4 (1.7)
Air (AQ) 25oC-120 h 180oC-4 h 170 (9.9) 256 (10.9) 7.2 (1.5)
Water (WQ) - 180oC-4 h 186 (3.6) 273 (3.8) 6.6 (1.1)
Water (WQ) 25oC-120 h 180oC-4 h 188 (1.9) 278 (4.9) 6.4 (1.0)
Water (WQ) 25oC-120 h 160oC-28 h 205 (3.1) 290 (4.9) 6.1 (1.3)
Differences in the morphology of β-Mg2Si in the F(AQ) and F(WQ) can be observed
using backscattered electron imaging (Fig. 4.39(a,b)). The β-Mg2Si is significantly
coarser in the F(AQ) samples than in the F(WQ) samples, which corresponds to a
slower cooling rate to room temperature in the former sample.

124
(a) (b)
Figure 4.39: Backscattered electron images (BEI) of SSM-HPDC F357 in (a)
F(AQ) and (b) F(WQ) conditions.
Figure 4.39 indicates that significant quantities of undissolved β-Mg2Si are in the F
and T5 temper condition samples. The solution treatment of the T4 and T6 temper
conditions dissolves the β-Mg2Si phase and the supersaturation of solute is
significantly higher. The artificial aging response for the T6 temper (e.g. Fig 4.18) is
therefore considerably more pronounced than for the T5 temper (Fig. 4.40).
70
75
80
85
90
95
0 1 10 100
t at 180oC (h)
VH
N
Figure 4.40: T5-artificial aging curve of an SSM-HPDC F357 plate (with
0.63wt% Mg) that was water quenched after casting, naturally aged for 120 h
and artificially aged at 180oC.
π
π
β-Mg2Si
β-Mg2Si

125
Natural aging after the quench (0 or 120 h) does not have a meaningful influence on
the T5 properties (Table 4.16), but, as already mentioned before, an artificial aging
treatment of 180oC for 4 h also resulted in removing the effects of natural pre-aging in
the T6 treated alloys (Fig. 4.18). Finally, as with the T6 temper (Fig. 4.17), a lower
artificial aging temperature (160 vs 180oC) results in better mechanical properties.
Unfortunately, due to the lower diffusion rates at 160oC, the time to attain these
properties is reached after much longer times than with artificial aging at 180oC
(Table 4.16).
4.8. Comparison between different temper conditions
The properties of SSM-HPDC Al-7Si-Mg alloys in different temper conditions were
compared using the alloy with 0.38% Mg in Table 3.1 [HM7]. To make comparisons,
solution treatment (for T4 and T6) was performed at 540oC for 1 hour, followed by a
water quench (25oC). The T6 treated samples were then naturally aged for 20 hours,
before artificial aging for 4 h at 180oC. The T4 treated samples were allowed to
naturally age (at 25oC) for at least 120 h. The samples used for the T5 temper
condition were quenched in water after SSM-HPDC and naturally aged for 120 h
before artificial aging at 180oC for 4 h. Optical micrographs of SSM-HPDC A356 are
shown in Figure 4.41 for the as-cast condition or F temper (Fig. 4.41(a)), T4 temper
(Fig. 4.41(b)), T5 temper (Fig. 4.41(c)) and the T6 temper (Fig. 4.41(d)). The average
Vickers microhardness values (50 g load) of the α-Al and eutectic in all the temper
conditions are also shown in Figure 4.41. Heat treatment to the T4, T5 and T6 temper
conditions results in an increase in the hardness of the primary α-Al grains and the
eutectic regions relative to the A356-F condition. The increase of the hardness of the
eutectic component with aging suggests that precipitation hardening also occurs
within the α-Al phase of the eutectic. The fibrous silicon particles in A356-F are
spheroidised by the solution treatment applied on A356-T4 (Fig. 4.41(b)) and A356-
T6 (Fig. 4.41(d)). For A356-T5, no solution treatment is used, and it is seen from
Figure 4.41(c) that the artificial aging temperature is too low to cause any
spheroidisation of the eutectic silicon particles.

126
(a) (b)
(c) (d)
Figure 4.41: Optical micrographs of SSM-HPDC A356 in the (a) F, (b) T4, (c) T5
and (d) T6 temper conditions.
The macrohardness (Fig. 4.42) and tensile properties of this alloy in different temper
conditions are shown in Table 4.17. The importance of the solution treatment in
dissolving all the solutes for precipitation hardening during artificial aging can clearly
be seen by comparing the lower tensile properties of A356-T5 with those of A356-T6.
On the other hand, the beneficial effect of artificial aging after solution treatment
(A356-T6) rather than natural aging (A356-T4) is also evident. The Quality Index
(QI) for SSM-HPDC alloy A356 in different temper conditions is shown in Table
4.17. It is seen that the high ductility of A356-T4 and high strength of A356-T6 result
in high QI values for these two temper conditions.

127
50
60
70
80
90
100
110
120
F T4 T5 T6
Temper condition
Har
dn
ess
(VH
N)
Figure 4.42: Vickers macrohardness (20 kg) of SSM-HPDC A356 in different
temper conditions.
Table 4.17: Yield strength (YS), ultimate tensile strength (UTS), % elongation
after fracture and Quality Index (QI) of heat treated A356 samples with 0.38%
Mg. The standard deviation for tensile properties (from 5 samples/temper
condition) is also indicated in brackets.
Temper YS (MPa) UTS (MPa) % Elongation QI (MPa)
F 113 (3.0) 218 (2.5) 10.6 (1.6) 372 (10.6)
T4 152 (2.1) 268 (3.9) 14.5 (1.4) 442 (7.2)
T5 168 (2.2) 258 (4.0) 8.4 (0.9) 396 (10.2)
T6 272 (5.1) 332 (4.4) 7.9 (1.5) 466 (12.7)
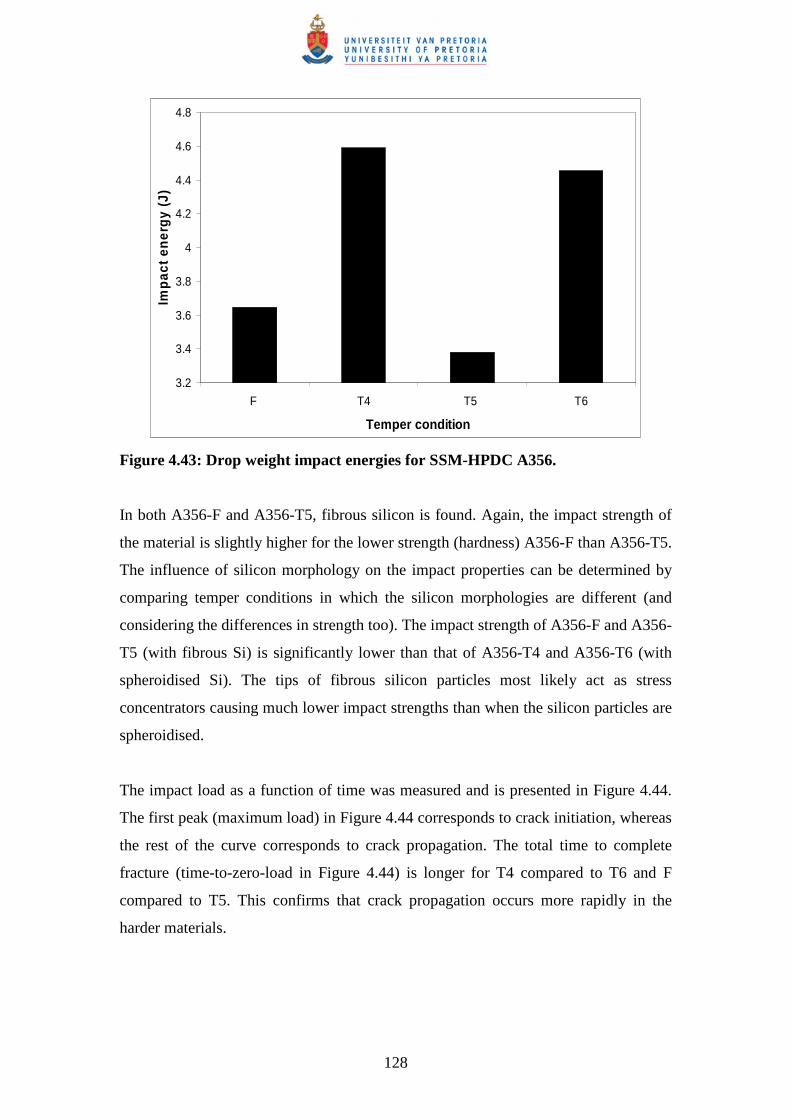
The drop weight impact energies for A356 in different temper conditions are shown in
Figure 4.43. Alloy strength (Fig. 4.13) and silicon morphology have the largest effects
on the impact properties of this material. The influence of strength of the alloys on the
impact properties can be determined by comparing temper conditions in which the
silicon morphologies are similar. In both A356-T4 and A356-T6, spheroidised silicon
is found. However, the impact strength of the material is slightly higher for A356-T4
than A356-T6. This difference can be related to the lower strength (hardness) of the
material in the T4 condition compared to the T6 condition.
128
3.2
3.4
3.6
3.8
4
4.2
4.4
4.6
4.8
F T4 T5 T6
Temper condition
Imp
act
ener
gy
(J)
Figure 4.43: Drop weight impact energies for SSM-HPDC A356.
In both A356-F and A356-T5, fibrous silicon is found. Again, the impact strength of
the material is slightly higher for the lower strength (hardness) A356-F than A356-T5.
The influence of silicon morphology on the impact properties can be determined by
comparing temper conditions in which the silicon morphologies are different (and
considering the differences in strength too). The impact strength of A356-F and A356-
T5 (with fibrous Si) is significantly lower than that of A356-T4 and A356-T6 (with
spheroidised Si). The tips of fibrous silicon particles most likely act as stress
concentrators causing much lower impact strengths than when the silicon particles are
spheroidised.
The impact load as a function of time was measured and is presented in Figure 4.44.
The first peak (maximum load) in Figure 4.44 corresponds to crack initiation, whereas
the rest of the curve corresponds to crack propagation. The total time to complete
fracture (time-to-zero-load in Figure 4.44) is longer for T4 compared to T6 and F
compared to T5. This confirms that crack propagation occurs more rapidly in the
harder materials.
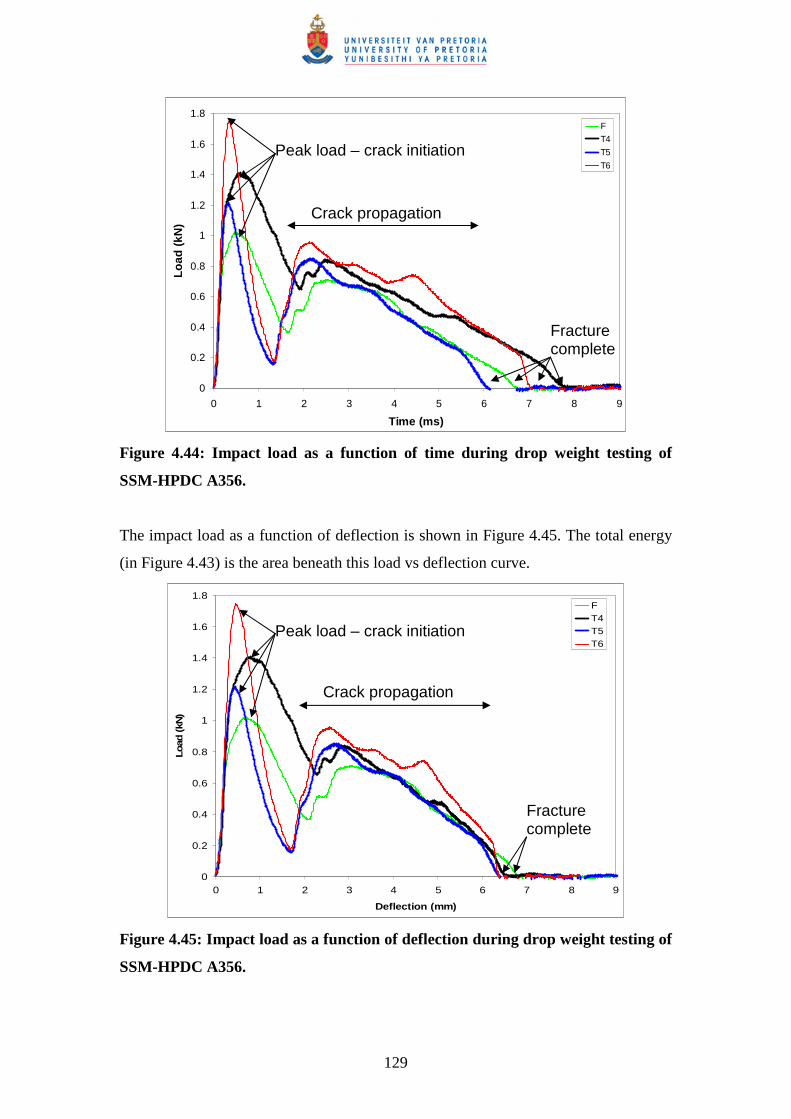
129
0
0.2
0.4
0.6
0.8
1
1.2
1.4
1.6
1.8
0 1 2 3 4 5 6 7 8 9
Time (ms)
Lo
ad (
kN)
F
T4
T5
T6
Figure 4.44: Impact load as a function of time during drop weight testing of
SSM-HPDC A356.
The impact load as a function of deflection is shown in Figure 4.45. The total energy
(in Figure 4.43) is the area beneath this load vs deflection curve.
0
0.2
0.4
0.6
0.8
1
1.2
1.4
1.6
1.8
0 1 2 3 4 5 6 7 8 9
Deflection (mm)
Load
(kN
)
FT4T5T6
Figure 4.45: Impact load as a function of deflection during drop weight testing of
SSM-HPDC A356.
Peak load – crack initiation
Crack propagation
Fracture complete
Peak load – crack initiation
Crack propagation
Fracture complete

130
The impact energy as a function of time is shown in Figure 4.46. The narrow peak
widths of the T5 and T6 temper conditions (Figures 4.44 and 4.45) result in the
inflection points at around 1.5 ms in Figure 4.46.
0
0.5
1
1.5
2
2.5
3
3.5
4
4.5
5
0 1 2 3 4 5 6 7 8 9
Time (ms)
En
erg
y (J
)
FT4T5T6
Figure 4.46: Impact energy as a function of time during drop weight testing of
SSM-HPDC A356 – fracture is complete once the lines become horizontal.
The peak load value (Figure 4.47) for the T6 condition is higher than for the T4
condition, but the width of the peak is narrower. This is most likely due to the higher
strength (hardness) of the T6 material, requiring a higher impact load to initiate the
crack. However, after crack initiation, its propagation is much easier through the
harder material, causing the narrow peak width compared to the softer T4 material. A
similar mechanism is operative when comparing the T5 and F (both with fibrous
silicon) temper conditions.
Fracture complete

131
Figure 4.47: Peak load measured during drop weight testing of SSM-HPDC
A356.
The cross-section of the fracture surfaces of the tensile and impact tested samples
were studied using optical microscopy. It was found that the fracture paths for the
different tests in the different temper conditions were similar and, therefore, only the
results of A356-T6 are presented. Figure 4.48(a) shows that the crack propagates
preferentially through the eutectic regions and not through the softer α-Al globules.
Figure 4.48(b) shows a higher magnification micrograph where the fracture
completely bypassed an α-Al grain.

132
(a) (b)
Figure 4.48(a): Fracture path in SSM-HPDC A356-T6 tensile specimen (cross-
section of tensile fracture surface) and (b) higher magnification micrograph
showing fracture bypassing primary αααα-Al grain.
Quality Index values of SSM-HPDC A356 (with 0.38% Mg) and F357 (with 0.63%
Mg) in different temper conditions are compared in Fig. 4.49. The QI values are
higher for alloy F357 than A356 in all the temper conditions. This is due to the higher
strengths that can be obtained using the higher Mg-containing alloy F357. The QI
values are, however, only marginally higher than for A356. This can be related to the
lower ductility achieved for alloy F357 compared to A356 (due, in part, to the higher
strength of F357 compared with A356, but also due to the presence of the π-phase in
alloy F357 which causes a reduction in ductility).

133
350
370
390
410
430
450
470
490
F (AQ) T4 (540-1,WQ,120NA) T5 (WQ,120NA,180-4) T6 (540-1,WQ,20NA,180-4)
Temper condition (Heat treatment parameters)
QI
(MP
a)A356F357
Figure 4.49: Quality index (QI) values for SSM-HPDC Al-7Si-Mg alloys in
different temper conditions.
4.9. Surface liquid segregation in SSM-HPDC castings
The surface liquid segregation (SLS) phenomenon in SSM-HPDC castings was
studied by using plates with 0.36% Mg in Table 3.1 [HM5]. Chemical analysis depth
profiles of the main alloying elements determined using OES, are shown in Figure
4.50. Two regions on the plate were investigated, close to the top of the plate and
close to the gate (Fig. 4.51).

134
(a)
(b)
(c)
(d)
Figure 4.50: OES chemical analyses depth profiles for (a) Si, (b) Mg, (c) Ti and (d) Sr.
Thickness of plate – 4mm Length – 100mm Width – 80mm
Figure 4.51: Image of a SSM-HPDC plate showing the approximate location for the OES analyses
Gate
- Approximate location of OES analyses points
“Top”
“Bottom”
135
In the region close to the top of the plate the surface Si, Sr and Mg contents were
relatively high while Ti content was relatively low. The Si content drops significantly
towards the centre of the plate, dropping below the minimum specification for the
alloy. Si, Sr and Mg are typical alloying elements that would be found in the eutectic
of the A356 alloy, hence indicating that the regions with high content of these
alloying elements were regions of high liquid content. Using the Si high specification
as the criteria, it can be seen that the liquid segregation layer can be as high 1.1 mm
(measured at the top of the plate). The Ti content displayed the opposite behaviour.
This had occurred since Ti was a grain refiner for the primary α-phase and would
hence be present where the α grains would be of highest density. At the bottom of the
plate, close to the gate, the silicon content was found to be relatively low at the
surface, increasing to peak at a depth of approximately 0.4mm on one side of the plate
and 0.7mm on the opposite side. The Si content distribution profile through the
balance of the cross-section was very similar to that observed at the top. The
segregation behaviour observed is as a result of a combination of the gate shape and
injection parameters used; these were not optimised for minimising or eliminating
liquid segregation for this particular study.
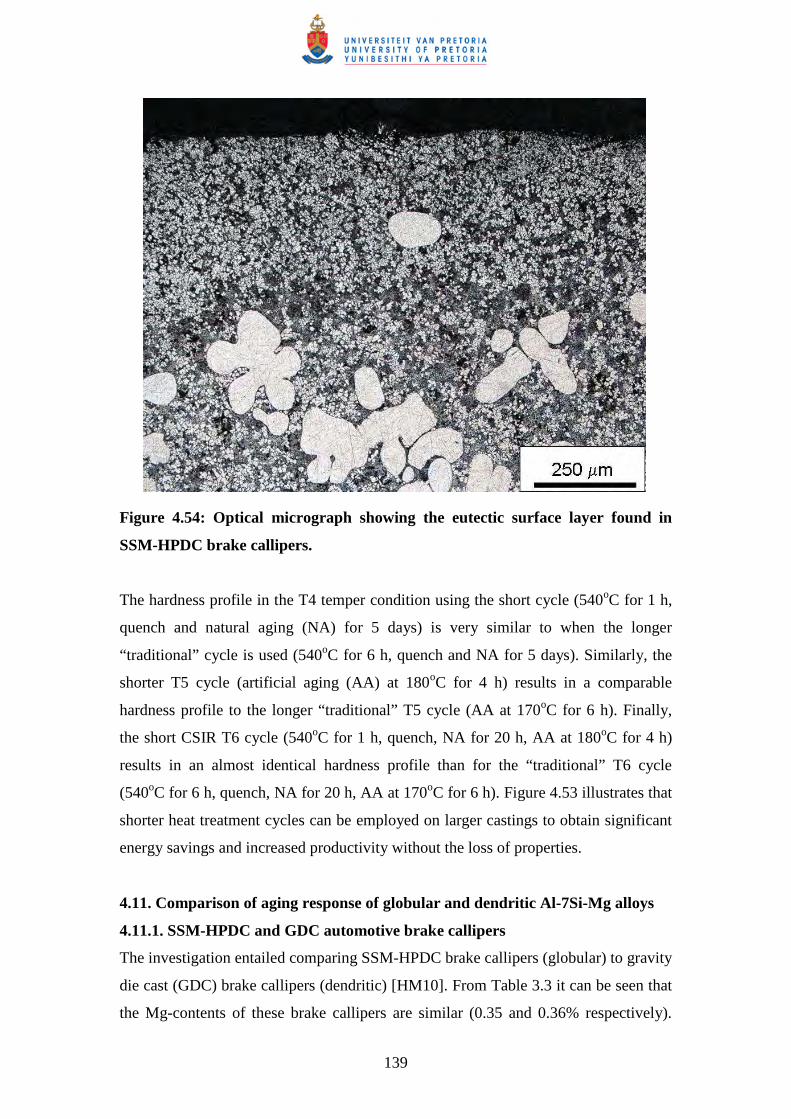
It is evident from these results that the segregation effect is a general phenomenon
that occurs on the surface of the component. The region close to the gate shows a
slightly different behaviour with a liquid segregation band 0.4-0.7mm below the
surface (Fig. 4.50(a)). This had occurred because of a poor gate design resulting in
poor filling characteristics around the gate region.
Microstructural analysis of cross-sections close to top and bottom of the castings (Fig.
4.52(a,b)) reveals the presence of the liquid segregation band. The region close to the
surface was composed of mainly eutectic while closer to the centre of the casting
microconstituents were mainly globular α primary grains and smaller amounts of
eutectic. The microstructure at the centre of the casting was more homogenous. It was
evident from the solution heat treatments that homogenisation of the surface
segregation effects was not possible. Microstructural analysis of the region close to
the surface after a T4 heat treatment showed (Fig. 4.52(c)) that there was a structural
change in the eutectic structure only, namely spheroidisation of the Si.

136
(a)
(b)
(c)
Figure 4.52: Micrographs of cross-sections (a) close to the top, (b) close to the bottom and
(c) after T4 heat treatment (540ºC for 6 h followed by natural aging for 120 h).
It has also been reported that the surface regions of conventional liquid HPDC
components is of higher solute content than the centre [111]. This has been ascribed to
the presence of externally solidified grains (ESG’s). ESG’s are large dendritic grains
that are formed in the shot sleeve during conventional liquid HPDC, with fine grains
solidifying inside the die cavity. These two grain populations mix in dissimilar
proportions across the casting cross section, with a prevalence of the fine grains near
the surface (skin) and the ESG’s at the centre (core) [112]. The distribution of large
ESG’s at the centre of the cross section of HPDC castings is thought to be due to
shear-induced migration of the ESG’s during die filling from regions of high to low
shear rate (i.e. toward the core of the casting) [111]. The ESG’s have a low solute
content and their migration to the centre results in surfaces with higher solute content.
50µm
500µm 500µm

137
Additional macrosegregation in HPDC components has also been ascribed to a
combination of inverse segregation and exudation [111]. Inverse segregation is caused
by the backflow of enriched liquid through the mushy zone in the dominant direction
of heat flow (i.e. to the casting surface) to compensate for solidification shrinkage.
With exudation, enriched liquid is drawn to the casting surface due to a pressure
differential between the interior and the surface that occurs as the surface pulls away
from the die wall during solidification.
With SSM-HPDC, the purpose of rheoprocessing is to form solid globular grains
before the billet is transferred to the HPDC machine. In other words, these globular
grains can be considered as ESG’s that are formed, not in the shot sleeve, but
deliberately during the rheopressing step. Additionally, the globular nature of the solid
grains should result in a more suitable pathway for enriched liquid to flow to the
surface than an interdendritic pathway in conventional HPDC and the surface layer
(as shown in Fig. 4.52) is therefore more pronounced in SSM-HPDC components.
Vickers hardness tests of the as-cast surface and core of the casting (Table 4.18)
showed a significant difference. This indicates that the mechanical properties of the
surface of the casting will be significantly different to the core of the casting and
hardness values therefore performed on the surface of a casting does not give a true
indication of bulk hardness properties.
Table 4.18: Hardness of the plates without removing the segregation layer and
after the surface segregation was removed.
Temper Surface VHN Centre VHN
F 80 77
T4 89 80
T6 122 106

138
4.10. SSM-HPDC of automotive brake callipers
Automotive brake callipers were also produced with SSM-HPDC (Table 3.3) to
determine whether the heat treatment cycles that were developed for the small
rectangular plates could also be applied successfully to a larger (and more complex)
casting [HM10]. The hardness profiles through a cross section of SSM-HPDC brake
calliper side-arms (Fig. 3.13) with 0.31% Mg in different temper conditions (F or as-
cast, T4, T5 and T6) are shown in Fig. 4.53. The thickness of the side-arm at this
selected position is seen to be 20 mm. The hardness values of the surface (at depths of
0 and 20 mm respectively) are significantly higher than the interior (which is constant
for all temper conditions from depths of approximately 2-18 mm). The higher surface
hardness is due to surface liquid segregation that occurs with SSM-HPDC (Fig. 4.54).
Figure 4.53: Hardness profiles through a cross section of SSM-HPDC brake
callipers heat treated to various temper conditions by short cycles and longer
“traditional” cycles.
50
70
90
110
130
150
0 2 4 6 8 10 12 14 16 18 20
Depth (mm)
VH
N
FT4 (540-1)T4 (540-6)T5 (180-4)T5 (170-6)T6(540-1,20NA,180-4)T6(540-6,20NA,170-6)
139
Figure 4.54: Optical micrograph showing the eutectic surface layer found in
SSM-HPDC brake callipers.
The hardness profile in the T4 temper condition using the short cycle (540oC for 1 h,
quench and natural aging (NA) for 5 days) is very similar to when the longer
“traditional” cycle is used (540oC for 6 h, quench and NA for 5 days). Similarly, the
shorter T5 cycle (artificial aging (AA) at 180oC for 4 h) results in a comparable
hardness profile to the longer “traditional” T5 cycle (AA at 170oC for 6 h). Finally,
the short CSIR T6 cycle (540oC for 1 h, quench, NA for 20 h, AA at 180oC for 4 h)
results in an almost identical hardness profile than for the “traditional” T6 cycle
(540oC for 6 h, quench, NA for 20 h, AA at 170oC for 6 h). Figure 4.53 illustrates that
shorter heat treatment cycles can be employed on larger castings to obtain significant
energy savings and increased productivity without the loss of properties.
4.11. Comparison of aging response of globular and dendritic Al-7Si-Mg alloys
4.11.1. SSM-HPDC and GDC automotive brake callipers
The investigation entailed comparing SSM-HPDC brake callipers (globular) to gravity
die cast (GDC) brake callipers (dendritic) [HM10]. From Table 3.3 it can be seen that
the Mg-contents of these brake callipers are similar (0.35 and 0.36% respectively).

140
The Mg-content controls the response to age hardening (Fig. 4.34), so for direct
comparison of strength after heat treatment, the Mg-composition of the different brake
callipers needs to be similar. The Fe-content of the SSM-HPDC callipers is, however,
lower than for the GDC callipers, which is actually above the upper limit of the
specification (Table 3.3). Iron tends to form intermetallics which have a negative
influence on ductility (Fig. 4.38). The microstructures achieved with SSM-HPDC and
GDC differ significantly. The SSM-HPDC brake callipers have a globular
microstructure (Fig. 4.55(a)), whereas the GDC brake callipers have a dendritic
microstructure (Fig. 4.55(b)). It is evident from Fig. 4.55 that GDC produces a much
finer microstructure than SSM-HPDC. Image analysis revealed an average secondary
dendrite arm spacing (SDAS) of 21µm (standard deviation of 3.6 from 30 manual
measurements) in the GDC callipers, whereas the average globule size in CSIR SSM-
HPDC callipers was 62µm (standard deviation of 21 from 635 measurements using
Image–Pro MC v6.0 imaging software).
(a) (b)
Figure 4.55: Optical micrographs showing the as-cast (F temper)
microstructures with MR = 5 (Table 2.2) of automotive brake callipers produced
by (a) SSM-HPDC and (b) GDC.
141
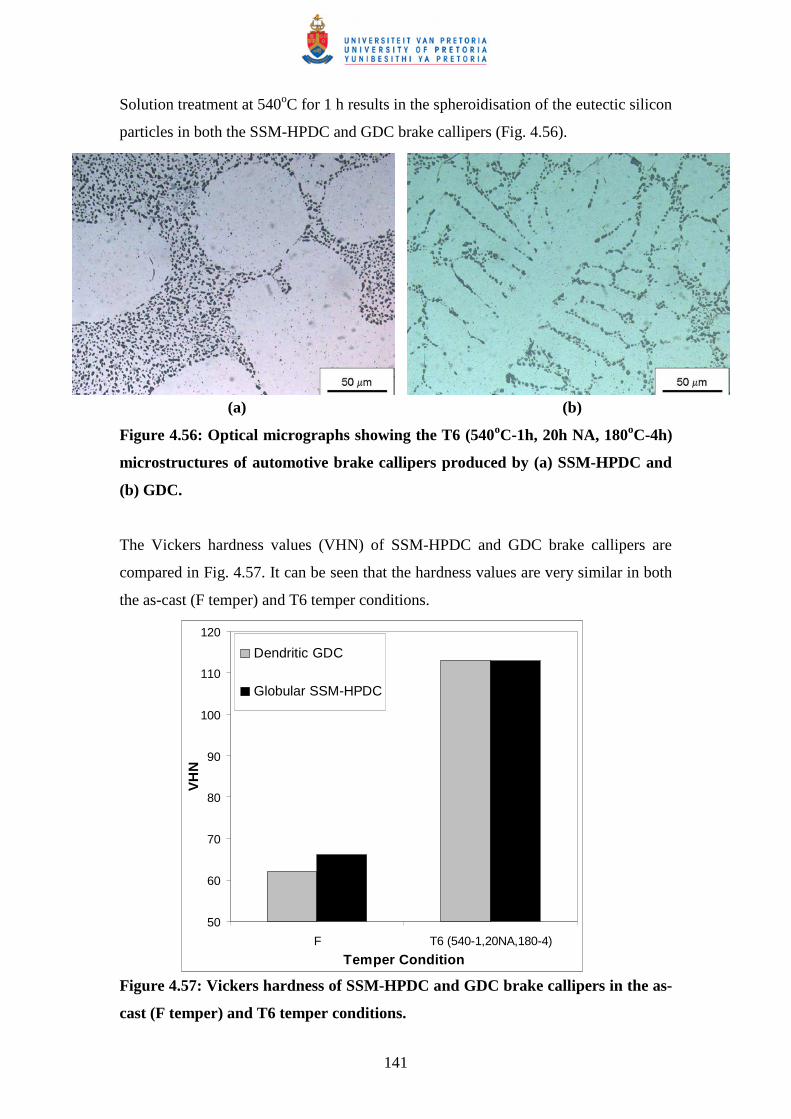
Solution treatment at 540oC for 1 h results in the spheroidisation of the eutectic silicon
particles in both the SSM-HPDC and GDC brake callipers (Fig. 4.56).
(a) (b)
Figure 4.56: Optical micrographs showing the T6 (540oC-1h, 20h NA, 180oC-4h)
microstructures of automotive brake callipers produced by (a) SSM-HPDC and
(b) GDC.
The Vickers hardness values (VHN) of SSM-HPDC and GDC brake callipers are
compared in Fig. 4.57. It can be seen that the hardness values are very similar in both
the as-cast (F temper) and T6 temper conditions.
Figure 4.57: Vickers hardness of SSM-HPDC and GDC brake callipers in the as-
cast (F temper) and T6 temper conditions.
50
60
70
80
90
100
110
120
F T6 (540-1,20NA,180-4)
Temper Condition
VH
N
Dendritic GDC
Globular SSM-HPDC

142
Also, note that the T6 hardness values are slightly higher than was obtained for the
SSM-HPDC brake callipers with 0.31% Mg (Fig. 4.53). This is due to the slightly
higher Mg-contents of 0.35 and 0.36% of the alloys in Fig. 4.57.
Comparison of the tensile properties of GDC and SSM-HPDC T6 (540oC-1h,20h
NA,180oC-4h) callipers in Table 4.19 confirm the hardness results of Fig. 4.57: the
0.2% yield strengths (YS) and ultimate tensile strengths (UTS) are similar. This result
is significant as it shows that dendritic and globular A356 components respond
similarly to heat treatment. The lower % elongation after fracture of the GDC calliper
as compared to the SSM-HPDC callipers is noteworthy. It is most likely due to the
higher Fe-content (Table 3.3) of the GDC calliper, which has an adverse effect on
ductility (Fig. 4.38). The differences in Fe-content between the brake callipers make it
virtually impossible to determine the effects of globular versus dendritic
microstructure on the ductility of A356 in this case.
Table 4.19: Yield strength (YS), ultimate tensile strength (UTS) and %
elongation after fracture (%A) of T6 heat treated A356 brake calliper samples.
The standard deviation (from 4 values) for tensile properties is also indicated in
brackets.
Brake calliper YS (MPa) UTS (MPa) % Elongation
SSM-HPDC (0.35% Mg) 261 (1.4) 317 (3.6) 6.7 (1.9)
GDC (0.36% Mg) 268 (2.1) 315 (4.9) 3.2 (1.6)
Figure 4.34 is redrawn in Fig. 4.58 by also including the data points of the brake
callipers in Table 4.19. The data points of the brake callipers correlate well with the
data points of the SSM-HPDC plates.

143
y = 350.65x + 47.562
R2 = 0.9483
220
240
260
280
300
320
0.52 0.57 0.62 0.67 0.72
(at%Mg available for precipitation hardening)1/2
YS
(M
Pa)
SSM-HPDC Plates
SSM-HPDC Brake Cal
GDC Brake Cal
Figure 4.58: YS as a function of (at% Mg-concentration available for
precipitation hardening)1/2 for the (540-1, {20-120}NA, 180-4) heat treatment
applied to SSM-HPDC plates and brake callipers, as well as GDC brake
callipers.
4.11.2. Investment cast (IC) plates
Rectangular plates (Fig. 3.10) with composition given in Table 3.4 were cast using
investment casting (IC) to obtain a coarser dendritic microstructure than achieved in
the brake calliper cast using GDC [HM12]. Optical micrographs for IC-A356 are
shown in Fig. 4.59 in the (a) as-cast and (b) T6 temper conditions respectively.

144
(a) (b)
Figure 4.59: Optical micrographs of IC-A356 in (a) the as-cast and (b) T6
temper conditions.
It is evident from Figures 4.55 and 4.59 that IC produced a coarser microstructure
than GDC. Image analysis revealed an average secondary dendrite arm spacing
(SDAS) of 32µm in the IC callipers (standard deviation of 4.0 from 30 manual
measurements), whereas the average SDAS of the GDC plates was 21µm (see section
4.11.1). Solution treatment at 540oC for 1 h resulted in the spheroidisation of the
eutectic silicon particles in the IC-A356 (Fig. 4.59(b)). Due to the slow cooling rate
during solidification of these plates, a Sr-addition of 300 ppm was necessary to
achieve modification of the eutectic Si-particles (Table 3.4). However, the
microstructure in Fig. 4.59(a) corresponds to a MR number (Table 2.2) of 4, since
some acicular particles are still present.
Figure 4.60 shows artificial aging curves that were determined for SSM-HPDC and
GDC brake callipers, as well as IC plates after solution treatment at 540oC for 1 hour,
water quenching and no natural pre-aging. The artificial aging response is similar to
what was presented in Fig. 4.18 and appears to be independent of whether the
microstructure is globular or dendritic. Note that the hardness values are significantly
lower for the IC plates than for the brake callipers due to the low Mg-content of the IC
plates of only 0.25% (Table 3.4). Artificial aging curves were also determined for
these alloys after solution treatment at 540oC for 1 hour, water quenching and 120
hours natural pre-aging, followed by artificial aging (Figure 4.61). Again, the curves
are similar to those presented in Fig. 4.18.

145
50
60
70
80
90
100
110
120
0 1 10 100
t at 180oC after 0h NA (h)
VH
N
SSM BrakeCal (0.35% Mg)
GDC BrakeCal (0.36% Mg)
IC Plate (0.25% Mg)
Figure 4.60: Artificial aging curves at 180oC for alloy A356 cast using different
casting techniques (after 0 h natural pre-aging time).
50
60
70
80
90
100
110
120
0 1 10 100
t at 180oC after 120h NA (h)
VH
N
SSM BrakeCal (0.35% Mg)
GDC BrakeCal (0.36% Mg)
IC Plate (0.25% Mg)
Figure 4.61: Artificial aging curves at 180oC for alloy A356 cast using different
casting techniques (after 120 h natural pre-aging time).
No tensile testing could be performed on the IC-A356 plates due to constraints on
sample size. In order to make comparisons between the different plates and brake

146
callipers, hardness was used instead of yield strength (as was done in Fig. 4.58) and
the results are shown in Fig. 4.62. Hardness generally correlates better with UTS than
with YS since significant plastic deformation occurs with both hardness and UTS
determination [82] (see section 4.12). Figure 4.62 is therefore only used as a
convenient method of making comparisons of the heat treatment response of Al-7Si-
Mg castings produced by different casting techniques. It can be seen that an excellent
linear correlation is achieved in Fig. 4.62.
y = 124.76x + 31.704R2 = 0.9834
95
100
105
110
115
120
125
130
0.52 0.57 0.62 0.67 0.72
(at%Mg available for precipitation hardening)1/2
VH
N
SSM-HPDC PlatesSSM-HPDC Brake CalGDC Brake CalIC Plates
Figure 4.62: VHN as a function of (at% Mg-concentration available for
precipitation hardening)1/2 for the (540-1, {20-120}NA, 180-4) T6 heat treatment
applied to SSM-HPDC plates and brake callipers, as well as GDC brake callipers
and IC plates.
4.12. Correlations between hardness, yield strength and UTS in Al-7Si-Mg alloys
As mentioned earlier, direct correlations between yield strength and hardness
generally contain an appreciable amount of scatter. This is due to the fact that strain
associated with a Vickers indentation is approximately 8% for a variety of strain
hardening alloys and hardness therefore generally correlates better with UTS than
with YS (where only 0.2% plastic strain has occurred) [82].

147
The YS and UTS as a function of the Vickers hardness for this work (F, T4, T5 and
T6 temper conditions) are plotted in Figures 4.63 and 4.64 respectively.
y = 3.5621x - 127.84
R2 = 0.9767
100
150
200
250
300
60 70 80 90 100 110 120 130
VHN
YS
(M
Pa)
SSM-HPDC Plates:T6
SSM-HPDC Brake Cal:T6
GDC Brake Cal:T6
SSM-HPDC Plates:T4
SSM-HPDC Plates: T5
SSM-HPDC Plates: F
Figure 4.63: Correlation between YS and VHN for Al-7Si-Mg alloys in the F, T4,
T5 and T6 temper conditions used in this study.
y = 2.1254x + 91.26
R2 = 0.9451
210
230
250
270
290
310
330
350
60 70 80 90 100 110 120 130
VHN
UTS
(MP
a)
SSM-HPDC Plates:T6
SSM-HPDC Brake Cal:T6
GDC Brake Cal:T6
SSM-HPDC Plates:T4
SSM-HPDC Plates: T5
SSM-HPDC Plates: F
Figure 4.64: Correlation between UTS and VHN for Al-7Si-Mg alloys in the F,
T4, T5 and T6 temper conditions used in this study.

148
From Figure 4.63 it is seen that the correlation between YS and hardness is rather
reasonable in the range of hardness and yield strengths tested. From Figure 4.64 it is
seen that the correlation between UTS and hardness is comparable to that of YS and
hardness in Fig. 4.63. The reason why better correlation with UTS is not obtained
with Al-7Si-Mg alloys is most likely due to the fact that UTS is influenced by the
degree of spheroidisation of the eutectic Si particles in these alloys. Spheroidised Si-
particles tend to result in a higher % elongation, which in turn gives a higher UTS as
necking generally does not occur (compare for instance UTS and the % elongation
after fracture of the T4 and T5 samples in Table 4.17). The data points in Fig. 4.64
include alloys in which the eutectic Si particles are fibrous (F and T5) and
spheroidised (T4 and T6), resulting in a worse-than-expected correlation between
UTS and VHN. This suggestion is supported by the fact that most of the F and T5
data points lie below the trend line in Fig. 4.64, whereas the T4 (and to a lesser extent
the T6) data points are above the trend line.
Rometsch and Schaffer [82] have proposed an equation (4.7) to convert Brinell
hardness (HB) of alloys A356 to A357 to YS by employing the strain hardening
exponent (n):
YS = 2.95 x HB x [0.065]n (4.7)
Accurate n-values from experimental data in this study could not be obtained due to
the removal of the extensometer during tensile testing after reaching the 0.2% plastic
strain value. However, assuming that the strain hardening exponent is constant over
the plastic strain range up to the point of necking during tensile testing of these alloys,
an expression for YS/UTS in terms of n alone may be found (eq. 4.8):
YS0.2%/UTS ≈≈≈≈ {(0.002)n (exp n)} /(n)n (4.8)
Equation 4.8 is derived from the Hollomon equation (σ = Kεn), as well as from the
conversion equations for engineering strain (e) to true strain (ε) [ε = ln (e+1)],
engineering stress (s) to true stress (σ) [σ = s(e+1)] and the equivalence of true strain
at necking = n [113]. Using the data points in Fig. 4.63 and their respective UTS

149
values in Fig. 4.64, average n-values for each temper condition can be calculated
(Table 4.20).
Table 4.20: Average n-values for Al-7Si-Mg alloys in this study in different
temper conditions
Temper condition Average n-value Standard deviation
F 0.188 0.0015 from 3 values
T4 0.165 0.0065 from 6 values
T5 0.125 0.0071 from 5 values
T6 0.072 0.0083 from 11 values
The n-values presented in Table 4.20 correspond well to those that could be found in
the literature, validating the use of eq. 4.8. Bogdanoff and Dahlström [114] found n-
values of 0.17-0.22 for as-cast A356. The evaluated strain hardening exponent for
A356/7-T6 according to Wang [115] ranged from 0.045-0.095 depending on the
secondary dendrite arm spacing. Rometsch and Schaffer [82] found n-values of 0.088
and 0.078 for their A356 and A357 alloys in the T6 temper condition respectively.
Adapting equation 4.8 slightly to use Vickers hardness rather than Brinell hardness,
also minimising Σ(YSMeasured −YSPredicted)2 and ensuring that the intercept of the line of
best fit passes through the origin, equation 4.9 is proposed:
YS = 3.03 x VHN x [0.055]n (4.9)
The predicted YS-values using this equation correlate very well with the measured
YS-values (Fig. 4.65).
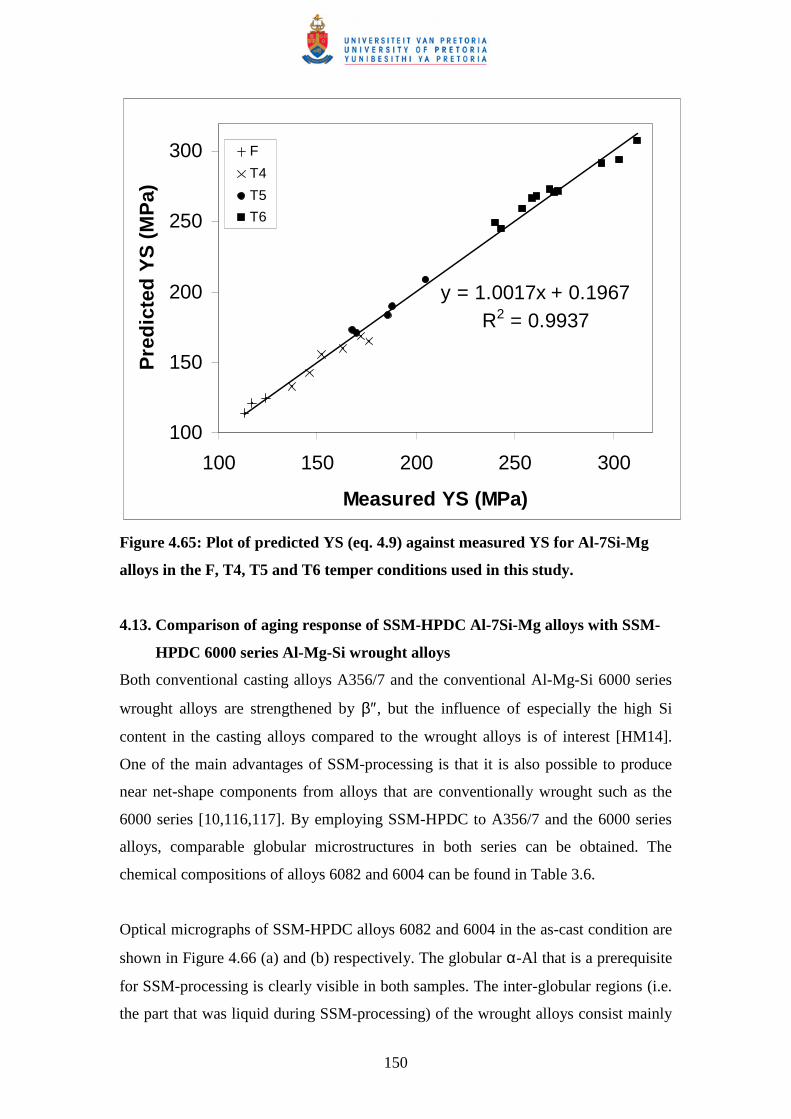
150
y = 1.0017x + 0.1967R2 = 0.9937
100
150
200
250
300
100 150 200 250 300
Measured YS (MPa)
Pre
dic
ted
YS
(M
Pa)
F
T4
T5
T6
Figure 4.65: Plot of predicted YS (eq. 4.9) against measured YS for Al-7Si-Mg
alloys in the F, T4, T5 and T6 temper conditions used in this study.
4.13. Comparison of aging response of SSM-HPDC Al-7Si-Mg alloys with SSM-
HPDC 6000 series Al-Mg-Si wrought alloys
Both conventional casting alloys A356/7 and the conventional Al-Mg-Si 6000 series
wrought alloys are strengthened by β″, but the influence of especially the high Si
content in the casting alloys compared to the wrought alloys is of interest [HM14].
One of the main advantages of SSM-processing is that it is also possible to produce
near net-shape components from alloys that are conventionally wrought such as the
6000 series [10,116,117]. By employing SSM-HPDC to A356/7 and the 6000 series
alloys, comparable globular microstructures in both series can be obtained. The
chemical compositions of alloys 6082 and 6004 can be found in Table 3.6.
Optical micrographs of SSM-HPDC alloys 6082 and 6004 in the as-cast condition are
shown in Figure 4.66 (a) and (b) respectively. The globular α-Al that is a prerequisite
for SSM-processing is clearly visible in both samples. The inter-globular regions (i.e.
the part that was liquid during SSM-processing) of the wrought alloys consist mainly
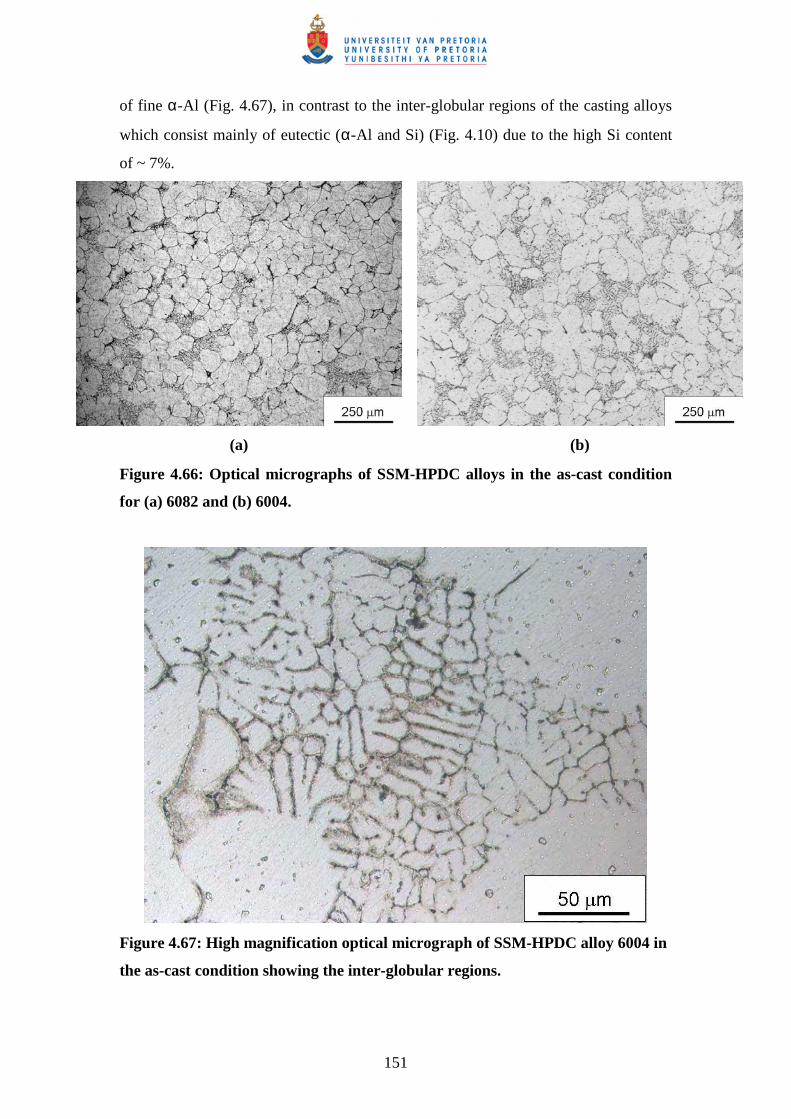
151
of fine α-Al (Fig. 4.67), in contrast to the inter-globular regions of the casting alloys
which consist mainly of eutectic (α-Al and Si) (Fig. 4.10) due to the high Si content
of ~ 7%.
(a) (b)
Figure 4.66: Optical micrographs of SSM-HPDC alloys in the as-cast condition
for (a) 6082 and (b) 6004.
Figure 4.67: High magnification optical micrograph of SSM-HPDC alloy 6004 in
the as-cast condition showing the inter-globular regions.

152
Optical micrographs of SSM-HPDC alloys 6082 and 6004 in the T6 condition are
shown in Figure 4.68 (a) and (b) respectively. The globular α-Al structure is retained
in the samples during heat treatment.
(a) (b)
Figure 4.68: Optical micrographs of SSM-HPDC alloys in the T6 temper
condition for (a) 6082 and (b) 6004.
As was shown in section 4.9, the nature of the SSM slurry with solid spherical grains
suspended in liquid makes it susceptible to liquid segregation during forming
processes. An example of the surface liquid segregation (SLS) layer found in alloy
6004-T6 is shown in Figure 4.69. The solution treatment step during the T6 heat
treatment has been found to dissolve the majority of the intermetallic phases,
however, it does not reduce segregation of elements in the casting [HM11]. As with
the A356 and F357 alloys in this study, this surface layer was removed by grinding
before all hardness measurements were performed.
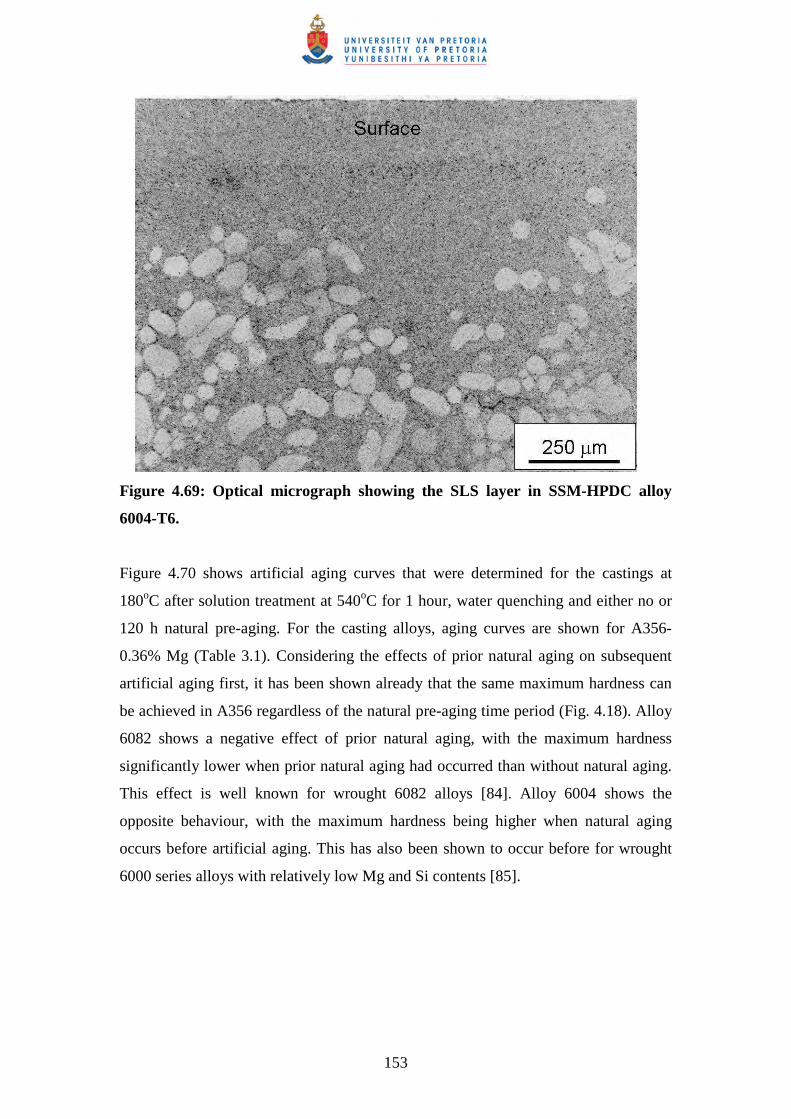
153
Figure 4.69: Optical micrograph showing the SLS layer in SSM-HPDC alloy
6004-T6.
Figure 4.70 shows artificial aging curves that were determined for the castings at
180oC after solution treatment at 540oC for 1 hour, water quenching and either no or
120 h natural pre-aging. For the casting alloys, aging curves are shown for A356-
0.36% Mg (Table 3.1). Considering the effects of prior natural aging on subsequent
artificial aging first, it has been shown already that the same maximum hardness can
be achieved in A356 regardless of the natural pre-aging time period (Fig. 4.18). Alloy
6082 shows a negative effect of prior natural aging, with the maximum hardness
significantly lower when prior natural aging had occurred than without natural aging.
This effect is well known for wrought 6082 alloys [84]. Alloy 6004 shows the
opposite behaviour, with the maximum hardness being higher when natural aging
occurs before artificial aging. This has also been shown to occur before for wrought
6000 series alloys with relatively low Mg and Si contents [85].

154
30
40
50
60
70
80
90
100
110
120
130
0 1 10 100
t at 180oC (h)
VH
N
6082: 0NA6082: 120NA6004: 0NA6004: 120NAA356: 0NAA356: 120NA
Figure 4.70: Artificial aging curves at 180oC for SSM-HPDC alloys 6082, 6004
and A356 (after either 0 or 120 h natural pre-aging time).
The tensile mechanical properties of SSM-HPDC alloys 6082, 6004 (and A356-0.36%
Mg and F357-0.62% Mg for convenience) are shown in Table 4.21. Artificial aging
time to peak hardness at 180oC of 4 h was used for A356 and F357 and 8 h for 6082
and 6004 (Fig. 4.70). The tensile mechanical properties are compared for samples that
had been naturally aged for 0 or 20-120 h before artificial aging. The tensile results in
Table 4.21 are in agreement with the aging curves of Figure 4.70. The strength of
SSM-HPDC 6082 is decreased significantly by a prior natural aging period, whereas
alloy 6004 displays the opposite behaviour. The strength (YS and UTS) of the casting
alloys A356 and F357 are not influenced significantly by a prior natural aging period.
It can also be seen from Table 4.21 that alloy 6082 has a strength comparable to alloy
F357 when no natural aging of the 6082 occurs and a strength similar to A356 once
natural aging occurs. However, this strength is achieved by employing double the
artificial aging time at 180oC that was needed for the casting alloys. Also, the Mg
requirement to achieve this strength is significantly higher for 6082 than for the
casting alloys. The ductility of the 6082 is relatively low if compared to its wrought
counterpart and the casting alloys (Table 4.21). Low ductility of SSM-HPDC high
performance wrought alloys has been reported before and is related to the distribution

155
of intermetallic compounds within the coarse eutectic regions [116]. The relatively
high ductility of SSM-HPDC 6004 is due to the low strength values that are achieved
in this alloy (Table 4.21), in agreement with the low hardness values in Figure 4.70.
Table 4.21: Yield strength (YS), ultimate tensile strength (UTS) and %
elongation after fracture (%A) of SSM-HPDC alloys in the T6 temper condition.
The standard deviation from at least four values for tensile properties is also
indicated in brackets.
6082 6004 A356 F357
0NA 120NA 0NA 120NA 0NA 120NA 0NA 20NA
YS
(MPa) 323 (12.9) 278 (6.3) 148 (9.4) 207 (2.2) 273 (6.5) 270 (5.5) 315 (5.2) 312 (4.1)
UTS
(MPa) 344 (11.7) 305 (10.3) 189 (5.5) 237 (3.0) 333 (8.4) 328 (5.8) 360 (5.0) 355 (3.9)
%A 4.2 (2.0) 5.4 (2.2) 13.1 (1.0) 12.0 (1.6) 8.4 (2.1) 8.0 (2.2) 5.7 (1.1) 6.0 (1.3)
Bichsel and Ried [87] drew contour plots for 6000 series wrought alloys showing the
effect of 24 h natural aging on the change in UTS (MPa) as a function of the Mg and
Si content (Fig. 2.32). The contour lines indicate the change in UTS after artificial
aging at 165oC for 15 h. This is shown in Figure 4.71, together with the compositions
of the 6082 and 6004 used in this study. The change in UTS as a result of prior natural
aging is much larger in this case (Table 4.21). The heat treatment cycles and
processing techniques (wrought vs. SSM-HPDC) employed in this study are different
from the data in Fig. 4.71, which might explain the differences between the two sets
of results. The data in Figure 4.71 do not include the Si-composition range of the
A356 and F357 alloys of 6.5-7.5% Si. However, the high Si content of these alloys
reduces the sensitivity to Mg content – naturally aged alloys A356 and F357 reach the
same strength and hardness as the alloys which were not naturally aged before
artificial aging for Mg contents covering the whole range of 0.25 to 0.7% (see for
example Tables 4.9 and 4.10).
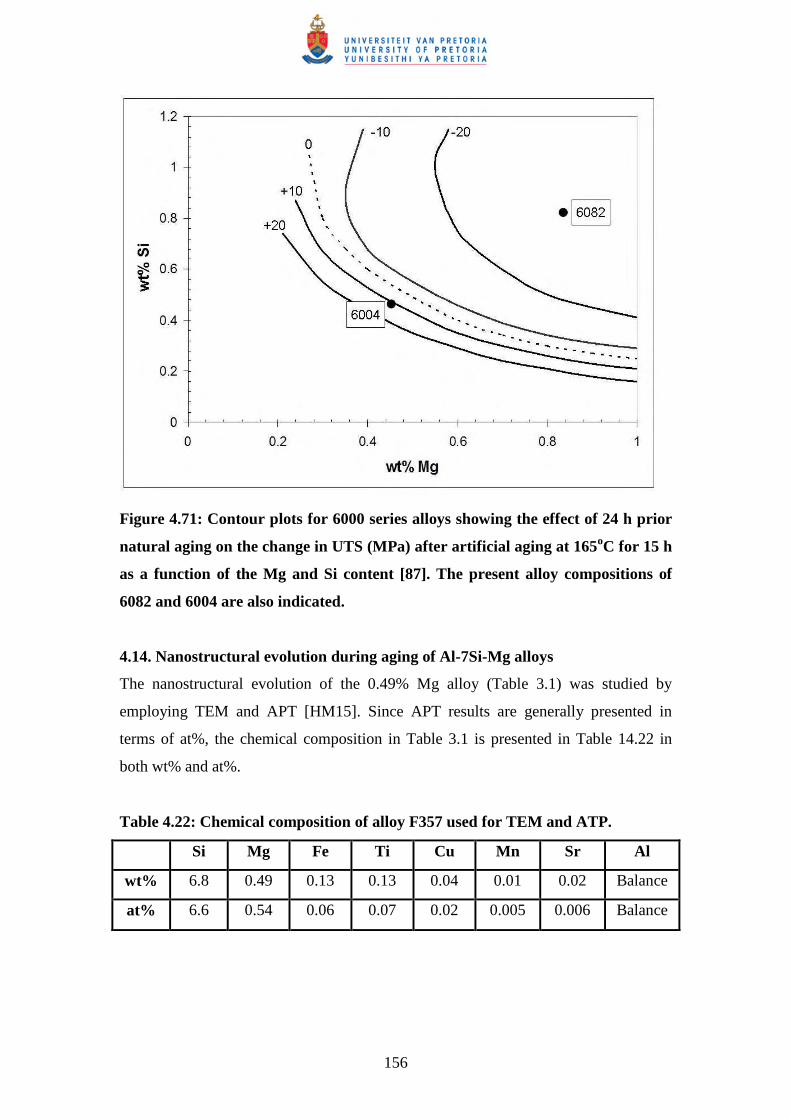
156
Figure 4.71: Contour plots for 6000 series alloys showing the effect of 24 h prior
natural aging on the change in UTS (MPa) after artificial aging at 165oC for 15 h
as a function of the Mg and Si content [87]. The present alloy compositions of
6082 and 6004 are also indicated.
4.14. Nanostructural evolution during aging of Al-7Si-Mg alloys
The nanostructural evolution of the 0.49% Mg alloy (Table 3.1) was studied by
employing TEM and APT [HM15]. Since APT results are generally presented in
terms of at%, the chemical composition in Table 3.1 is presented in Table 14.22 in
both wt% and at%.
Table 4.22: Chemical composition of alloy F357 used for TEM and ATP.
Si Mg Fe Ti Cu Mn Sr Al
wt% 6.8 0.49 0.13 0.13 0.04 0.01 0.02 Balance
at% 6.6 0.54 0.06 0.07 0.02 0.005 0.006 Balance

157
4.14.1. Age hardening response and tensile properties
Artificial aging curves following no or 120 h of natural pre-aging for alloy F357 are
shown in Figure 4.72. As also shown in Fig. 4.18, a hardness plateau is found between
1 and 4 hours at 180oC following no natural pre-aging. In contrast, a hardness peak is
found after 4 h artificial aging following natural pre-aging, with the peak hardness of
120 VHN similar to the plateau hardness. The microhardness values of the primary α-
Al and the eutectic components are also indicated in Fig. 4.72. It is seen that the
hardness of the primary α-Al is marginally lower than the macrohardness of the alloy,
with the hardness of the eutectic being higher. The change of hardness of the eutectic
component with aging implies that precipitation hardening also occurs within the α-
Al phase of the eutectic. The TEM and APT investigations in this paper relate only to
the primary α-Al, but it is seen from Fig. 4.72 that the trends in the aging curves of
the alloy (macrohardness) and the primary α-Al are comparable.
Tensile properties of the samples used for TEM and APT investigations are shown in
Table 4.23. The results correlate well with the aging curves from Fig. 4.72, with the
strength (YS and UTS) of the 120h NA,180oC-10min sample being lower than that of
the T4 sample. The strength then increases again for the 120h NA,180oC-1h sample,
before reaching peak values for the 120h NA,180oC-4h sample. The samples on the
hardness plateau (0h NA,180oC-1h and 0h NA,180oC-4h) have similar UTS values,
but different YS values, with the 0h NA,180oC-1h sample having a significantly lower
YS than the 0h NA,180oC-4h sample (also see Tables 4.9 and 4.10).

158
Figure 4.72: Artificial aging curves for alloy F357 following no or 120 h of
natural pre-aging (NA), including the microhardness values of the primary αααα-Al
and the eutectic components.
Table 4.23: Tensile properties of SSM-HPDC alloy F357 samples (produced with
the 130t HPDC machine) used for TEM and APT analysis. The standard
deviation from four values for tensile properties is also indicated in brackets.
YS (MPa) UTS (MPa) % Elongation
T4 176 (4.3) 299 (1.6) 18.0 (2.6)
540oC-1h,120 h NA,180oC-10 min 164 (2.8) 288 (2.6) 20.2 (0.44)
540oC-1h,120 h NA,180oC-1 h 253 (9.5) 335 (3.8) 11.7 (2.6)
540oC-1h,120 h NA,180oC-4 h 303 (3.3) 356 (3.3) 10.6 (1.3)
540oC-1h,0 h NA,180oC-10 min 180 (4.0) 298 (1.6) 19.1 (4.2)
540oC-1h,0 h NA,180oC-1 h 288 (3.0) 362 (1.7) 12.5 (2.4)
540oC-1h,0 h NA,180oC-4 h 304 (1.7) 365 (2.0) 10.6 (1.8)

159
4.14.2. Nanostructural evaluation
4.14.2.1. Transmission electron microscopy (TEM)
Figure 4.73 shows bright field (BF) images and selected area diffraction patterns
(SADPs) recorded with the electron beam near <001>Al for samples that experienced
120 h natural pre-aging before artificial aging at 180oC for up to 4 h, whereas Figure
4.74 shows the same for samples that experienced no natural pre-aging prior to
artificial aging at 180oC for up to 4 h. The <001>Al zone axis has been shown to be
the best orientation for visualizing the β″ phase [44,118].
There is no indication of precipitation in the bright field images and the SADPs of the
T4 sample and the 120h NA,180oC-10min sample in Figures 4.73 (a,b) respectively.
The solute clusters that are found in large numbers in Al-alloys in the T4 (Fig.
4.73(a)) and under-aged T6 conditions (Fig. 4.73(b) typically contain only a few to
tens of solute atoms [11,78,80]. They are known to be fully coherent with the matrix
and are difficult to resolve even by employing high resolution transmission electron
microscopy (HRTEM). However, dark contrast arising from GP zones (~ 2 nm
diameter) can be seen in the 0 h NA, 180oC-10min sample in Fig. 4.74(a). Faint
streaks in the <100>Al SADP of this sample, as shown in Fig. 4.74(a), indicated that
there was limited precipitation of β″ [44]. “Cross-shaped” streaks were observed in
the <100>Al SADPs of all the samples aged at 180oC for 1 or 4 h, which correspond to
weak diffractions produced by the needle β″-precipitates (Figs. 4.73(c,d) and Figs.
4.74(b,c)) [44]. The bright shadows surrounding the needles are reflections of the
coherency strains present in the adjoining Al-matrix [44]. The β″-needles increase in
size from ~ 2 nm diameter x 10 nm length in the 120h NA, 180oC-1h sample (Fig.
4.73(c)) to ~ 4 nm diameter x 25 nm length in the 120h NA, 180oC-4h sample (Fig.
4.73(d)). Similarly, the β″-needles increase in size from ~ 3 nm diameter x 20 nm
length in the 0h NA, 180oC-1h sample (Fig. 4.74(b)) to ~ 4 nm diameter x 25 nm
length in the 0h NA, 180oC-4h sample (Fig. 4.74(c)).

160
Figure 4.73: Bright field TEM images and SADPs for SSM-HPDC alloy F357
artificially aged at 180oC for (a) 0 min – T4, (b) 10 minutes, (c) 1 h and (d) 4 h
after 120 h natural pre-aging.

161
Figure 4.74: Bright field TEM images and SADPs for SSM-HPDC alloy F357
artificially aged at 180oC for (a) 10 minutes, (b) 1 h and (c) 4 h after no natural
pre-aging.
4.14.2.2. Atom Probe Tomography (APT)
Figure 4.75 shows three-dimensional (3D) reconstructed Mg atom maps, containing
only solute-enriched features of samples that experienced 120 h natural aging before
artificial aging at 180oC for up to 4 h, whereas Figure 4.76 shows the same for
samples that experienced no natural aging prior to artificial aging at 180oC for up to 4
h. It is difficult to make a scientific distinction between GP zones and clusters of Mg-

162
Si since they have similar spherical morphologies [39]. GP zones and β″ can be
distinguished more readily based on the differences in morphology (spheres vs
needles) and also the β″ needles that generally contain more solute atoms than GP
zones [42]. Critical sizes of 8 and 30 solutes have been used to distinguish between
solute clusters and GP zones in two different wrought Al-Mg-Si alloys [42,78]. The
small solute-rich features containing 10-20 detected solute atoms are designated as
solute clusters in this study. Considering a detection efficiency of ~55% in APT
analysis, a spherical feature of one nm in diameter should contain about 30 atoms.
Use of 20 solutes assumes that a third of detected atoms will be Al atoms. Those
containing 21-100 solute atoms are GP zones, and elongated β″ contains > 100 solute
atoms (Table 4.24). Note that over-aged samples (180oC for > 4 h) were not
investigated in this study and that no large β′ rods were detected in any of the
analysed volumes (β′ rods typically have diameters of ~ 10 nm and lengths of several
hundred nanometers [39]). Thus, even the largest precipitates with n > 1200 in this
study refer to β″ rather than β′.
Figure 4.75: 3D Mg atom maps containing only solute enriched features after
removing solutes in the matrix of SSM-HPDC F357 alloy samples aged at 180oC
for (a) 0 h, (b) 10 min (c) 1 h and (d) 4 h after 120 h prior natural aging.
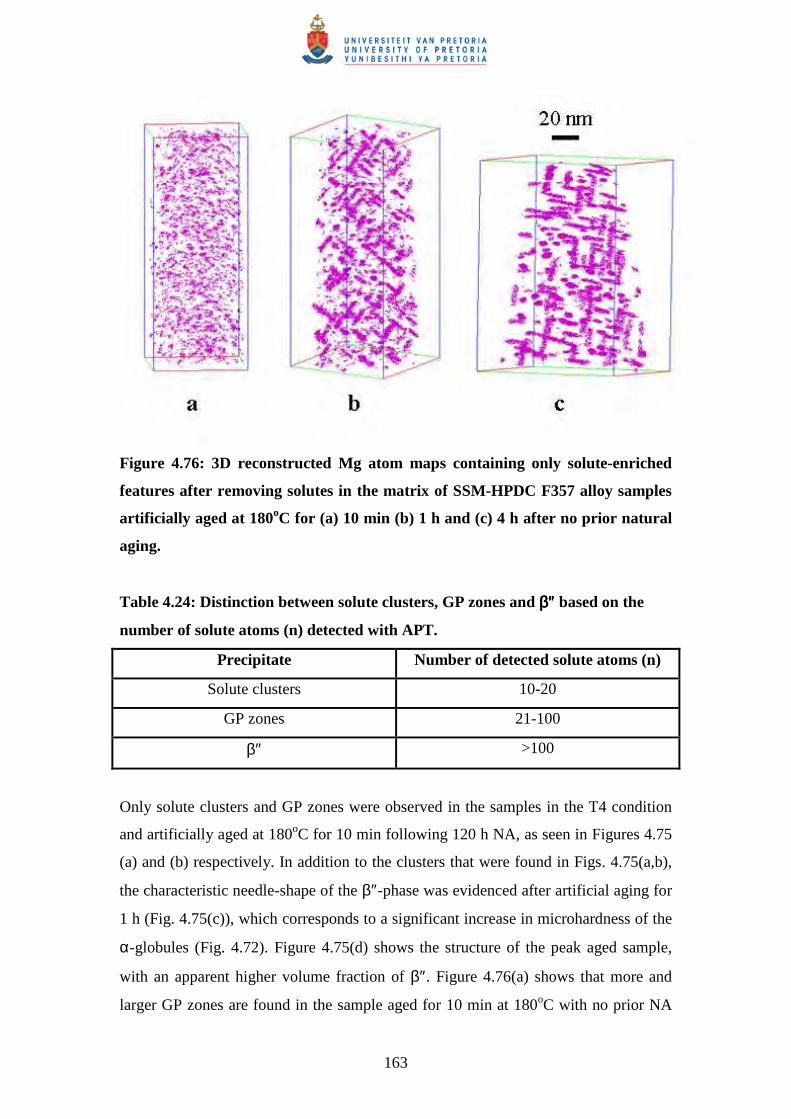
163
Figure 4.76: 3D reconstructed Mg atom maps containing only solute-enriched
features after removing solutes in the matrix of SSM-HPDC F357 alloy samples
artificially aged at 180oC for (a) 10 min (b) 1 h and (c) 4 h after no prior natural
aging.
Table 4.24: Distinction between solute clusters, GP zones and ββββ″″″″ based on the
number of solute atoms (n) detected with APT.
Precipitate Number of detected solute atoms (n)
Solute clusters 10-20
GP zones 21-100
β″ >100
Only solute clusters and GP zones were observed in the samples in the T4 condition
and artificially aged at 180oC for 10 min following 120 h NA, as seen in Figures 4.75
(a) and (b) respectively. In addition to the clusters that were found in Figs. 4.75(a,b),
the characteristic needle-shape of the β″-phase was evidenced after artificial aging for
1 h (Fig. 4.75(c)), which corresponds to a significant increase in microhardness of the
α-globules (Fig. 4.72). Figure 4.75(d) shows the structure of the peak aged sample,
with an apparent higher volume fraction of β″. Figure 4.76(a) shows that more and
larger GP zones are found in the sample aged for 10 min at 180oC with no prior NA
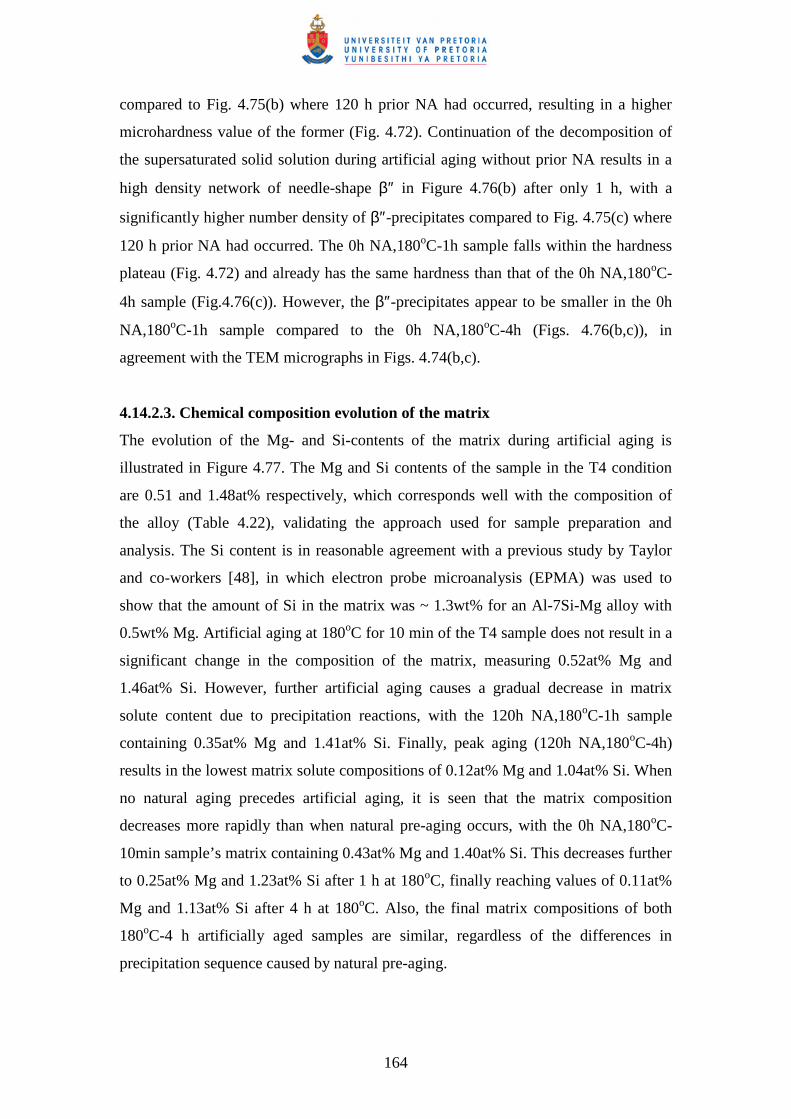
164
compared to Fig. 4.75(b) where 120 h prior NA had occurred, resulting in a higher
microhardness value of the former (Fig. 4.72). Continuation of the decomposition of
the supersaturated solid solution during artificial aging without prior NA results in a
high density network of needle-shape β″ in Figure 4.76(b) after only 1 h, with a
significantly higher number density of β″-precipitates compared to Fig. 4.75(c) where
120 h prior NA had occurred. The 0h NA,180oC-1h sample falls within the hardness
plateau (Fig. 4.72) and already has the same hardness than that of the 0h NA,180oC-
4h sample (Fig.4.76(c)). However, the β″-precipitates appear to be smaller in the 0h
NA,180oC-1h sample compared to the 0h NA,180oC-4h (Figs. 4.76(b,c)), in
agreement with the TEM micrographs in Figs. 4.74(b,c).
4.14.2.3. Chemical composition evolution of the matrix
The evolution of the Mg- and Si-contents of the matrix during artificial aging is
illustrated in Figure 4.77. The Mg and Si contents of the sample in the T4 condition
are 0.51 and 1.48at% respectively, which corresponds well with the composition of
the alloy (Table 4.22), validating the approach used for sample preparation and
analysis. The Si content is in reasonable agreement with a previous study by Taylor
and co-workers [48], in which electron probe microanalysis (EPMA) was used to
show that the amount of Si in the matrix was ~ 1.3wt% for an Al-7Si-Mg alloy with
0.5wt% Mg. Artificial aging at 180oC for 10 min of the T4 sample does not result in a
significant change in the composition of the matrix, measuring 0.52at% Mg and
1.46at% Si. However, further artificial aging causes a gradual decrease in matrix
solute content due to precipitation reactions, with the 120h NA,180oC-1h sample
containing 0.35at% Mg and 1.41at% Si. Finally, peak aging (120h NA,180oC-4h)
results in the lowest matrix solute compositions of 0.12at% Mg and 1.04at% Si. When
no natural aging precedes artificial aging, it is seen that the matrix composition
decreases more rapidly than when natural pre-aging occurs, with the 0h NA,180oC-
10min sample’s matrix containing 0.43at% Mg and 1.40at% Si. This decreases further
to 0.25at% Mg and 1.23at% Si after 1 h at 180oC, finally reaching values of 0.11at%
Mg and 1.13at% Si after 4 h at 180oC. Also, the final matrix compositions of both
180oC-4 h artificially aged samples are similar, regardless of the differences in
precipitation sequence caused by natural pre-aging.
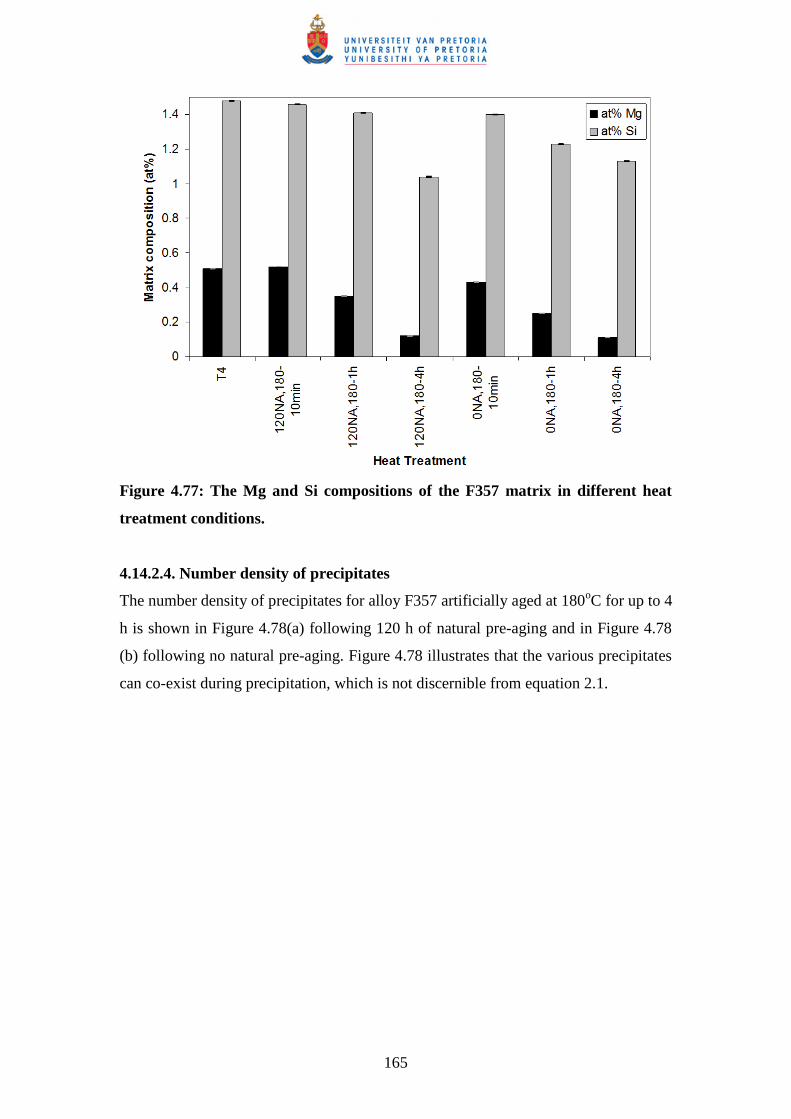
165
Figure 4.77: The Mg and Si compositions of the F357 matrix in different heat
treatment conditions.
4.14.2.4. Number density of precipitates
The number density of precipitates for alloy F357 artificially aged at 180oC for up to 4
h is shown in Figure 4.78(a) following 120 h of natural pre-aging and in Figure 4.78
(b) following no natural pre-aging. Figure 4.78 illustrates that the various precipitates
can co-exist during precipitation, which is not discernible from equation 2.1.

166
Figure 4.78(a): Comparison of the number density of precipitates for alloy F357
artificially aged at 180oC following 120 h natural pre-aging.
Figure 4.78(b): Comparison of the number density of precipitates for alloy F357
artificially aged at 180oC following no natural pre-aging.

167
4.14.2.5. The Mg:Si ratio of clusters and precipitates in alloy F357
The composition of the precipitates analysed by APT is normally expressed through
the ratio of the main alloying elements, rather than the total quantity of aluminium and
solute atoms that are detected in the precipitates [42]. This is due to the issues
associated with the acquisition and analysis of atom probe data, especially regarding
aberrations in preferential evaporation and ion trajectory [119,120]. Considering the
proposed decomposition of the SSS of Al-Si-Mg alloys in equation 2.1, it is seen that
the Mg:Si ratio theoretically increases from 0.83 in β″ to 1.7 in β′ to 2 in β. The
Mg:Si ratio of solute clusters, GP zones and β″-needles after various stages of
artificial aging is shown in Figure 4.79(a) for samples that experienced 120 h natural
pre-aging and in Figure 4.79(b) for samples that experienced no natural pre-aging. It
is seen that, in general, the Mg:Si ratio increases from ~ 0.6-1.2 with the number of
solute atoms within the precipitates.
Figure 4.79(a): The Mg:Si ratio of solute clusters, GP zones and ββββ″″″″-needles in
F357 samples that were naturally aged for 120 h prior to artificial aging.

168
Figure 4.79(b): The Mg:Si ratio of solute clusters, GP zones and ββββ″″″″-needles in
F357 samples that were not naturally aged prior to artificial aging.
4.14.2.6. Incorporation of Al into clusters and precipitates of alloy F357
Significant quantities of Al have been detected in all precipitates in this study, despite
it being generally accepted that the β″-phase consists of only Mg and Si (Mg5Si6)
[45]. On average, the solute clusters were found to contain ~ 3.7at% Mg and 5.5at%
Si, the GP zones ~ 6.1at% Mg and 6.5at% Si and the β″-needles ~ 10.5at% Mg, and
9.3at% Si. Buha and co-workers [42] also found that the clusters, GP zones and β″-
needles in wrought alloy 6061-T6 contained significant amounts of between 65 and
80at% Al. Similar results have also been reported by Vaumousse and co-authors [98]
for an Al–Mg–Si–Cu alloy containing an excess of Si. Structural models that
accommodate Al atoms in β″-needles and GP zones have been proposed based on
TEM studies [118,121].
4.14.2.7. Incorporation of Cu into clusters and precipitates of alloy F357
A few APT precipitation studies have been conducted using pure ternary Al-Mg-Si
alloys [50,80]. However, addition of other alloying elements and impurity elements in
aluminium alloys can influence precipitation. The addition of Cu for example is
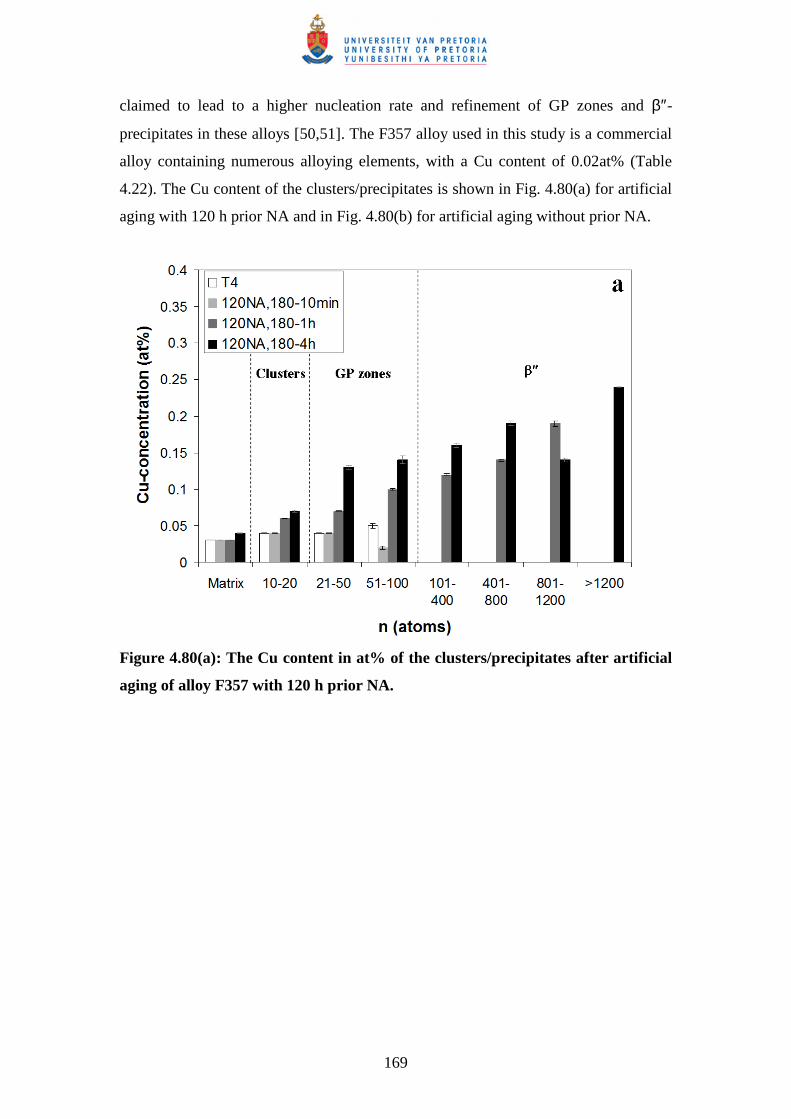
169
claimed to lead to a higher nucleation rate and refinement of GP zones and β″-
precipitates in these alloys [50,51]. The F357 alloy used in this study is a commercial
alloy containing numerous alloying elements, with a Cu content of 0.02at% (Table
4.22). The Cu content of the clusters/precipitates is shown in Fig. 4.80(a) for artificial
aging with 120 h prior NA and in Fig. 4.80(b) for artificial aging without prior NA.
Figure 4.80(a): The Cu content in at% of the clusters/precipitates after artificial
aging of alloy F357 with 120 h prior NA.

170
Figure 4.80(b): The Cu content in at% of the clusters/precipitates after artificial
aging of alloy F357 without prior NA.
The matrix content of Cu analysed by APT is generally similar to the nominal Cu
composition of the alloy, namely 0.02at%. In general, the Cu-content of the particles
increases with artificial aging time and as the decomposition of the SSS progresses
from clusters to GP zones to β″. Buha and co-workers [42] also found in a 6061-T6
wrought alloy that all precipitates classified as GP zones and β″ were enriched in Cu,
whereas no Cu was associated with the solute clusters. Considering Table 4.22, it is
seen that Fe and Ti are the other main alloying elements in this alloy. However,
neither Fe nor Ti was detected in noteworthy quantities within any of the precipitates
in this study and they were detected in the matrix only as trace elements. These
elements are rather incorporated into intermetallic particles of which π-Al 8FeMg3Si6,
β-Al 5FeSi and Al3Ti are the most common in this alloy [HM8].