chapter 5 : part ii composite curve (heat integrations) · exchange, limits the amount of heat...
TRANSCRIPT

CHAPTER 5 : Part II COMPOSITE CURVE
(HEAT INTEGRATIONS)
1
2
Determining the Minimum Energy Requirement (MER) using Process Composite Curves for Process energy
targets (minimum steam and cooling water requirements)

Composite Curves
“Representation of process streams’ heat content on a plot of temperature (T) versus enthalpy (DH)”

Reactor 200 oC 30 oC
50 oC
Feed Feed
Product
Steam
Cooling Water
Process Before integration
DH (MW)
Hot Stream e.g. product)
Cold Stream (e.g. feed)
200
50 30
T(oC)
CW
Steam T-DH Plot
Temperature vs Enthalpy Diagram

Process After Integration
Reactor 200 oC 30 oC
50 oC
Feed Feed
Product
Steam
Cooling Water

Working Session - HEN “Design by intuition (awareness)”
R2
R1
Cool FCP=1
Heat FCP=4
Cool FCP=2
Heat FCP=1.8
30°
120°
130°
40°
60°
100°
120°
180° 80°
C1
Inlet Hot stream
Inlet Hot stream
Inlet Cold stream
Inlet Cold stream
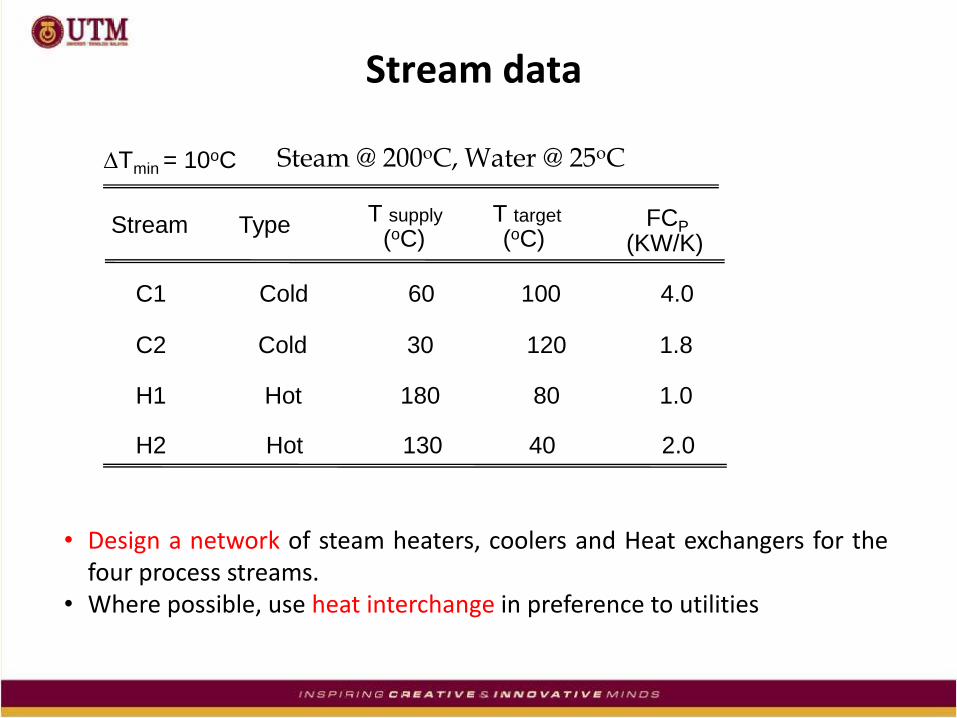
C1 Cold 60 100 4.0
C2 Cold 30 120 1.8
H1 Hot 180 80 1.0
H2 Hot 130 40 2.0
Stream Type FCP (KW/K)
T supply T target
(oC) (oC)
Stream data
DTmin = 10oC
• Design a network of steam heaters, coolers and Heat exchangers for the four process streams.
• Where possible, use heat interchange in preference to utilities
Steam @ 200oC, Water @ 25oC

• Where to begin placing a match? • Which streams to match?
Potential streams for heat exchange

Properties of T-DH Diagram
Given the stream data :
Stream Number
Stream Type
FCP (MW/K)
DH (MW)
T target
(°C ) T supply
(°C )
1 Cold 40 130 2.0 180
T vs DH Plot
130
T(°C)
DH (MW)
Tsupply
Ttarget
40
bigger FCp
smaller FCp
DH
DT
DH is a relative quantity. Thus, the T-DH line can be shifted horizontally
1/FCp is the slope of the T-DH line:
DH = FCpDT ==> DT/DH = 1/FCp
- smaller FCp: steep or - bigger FCp: flat

Example: Front End PFD of a Process Plant
30ºC
190ºC
95ºC 35ºC
110ºC
100ºC
Reactor 2
Product Splitter
For further separation
EX2
95ºC 285ºC
65ºC
Reactor 1
EX1 EX3
EX4
V1

The Stream Data
Stream Number
Stream Type
FCP (MW/K)
Tsupply ( °C )
DH (MW)
Ttarget ( °C )
1 Hot 285 65 1 220
2 Hot 95 35 2.5 150
3 Cold 95 285 0.5 -95
4 Cold 30 190 1 -160

Temperature (T) vs Enthalpy (DH)
Diagram for multiple streams
Introducing the composite curves…
Temperature (T) vs Enthalpy (ΔH)
Diagram for multiple streams

The Hot Composite Curve
H2
H1
T (ºC) T (ºC)
DH (MW) DH (MW)
H1+H2 = 370
220 150
285
65 95
35
FCPH1 = 1 MW/K Composite (resultant) Hot Stream
FCPH2 = 2.5 MW/K
75 105 190
FCPH1
FCPH1 + FCPH2
FCPH
2
Individual Composite
Stream Number
Stream Type
FCP (MW/K)
Tsupply ( °C )
DH (MW)
Ttarget ( °C )
1 Hot 285 65 1 220
2 Hot 95 35 2.5 150
3 Cold 95 285 0.5 -95
4 Cold 30 190 1 -160
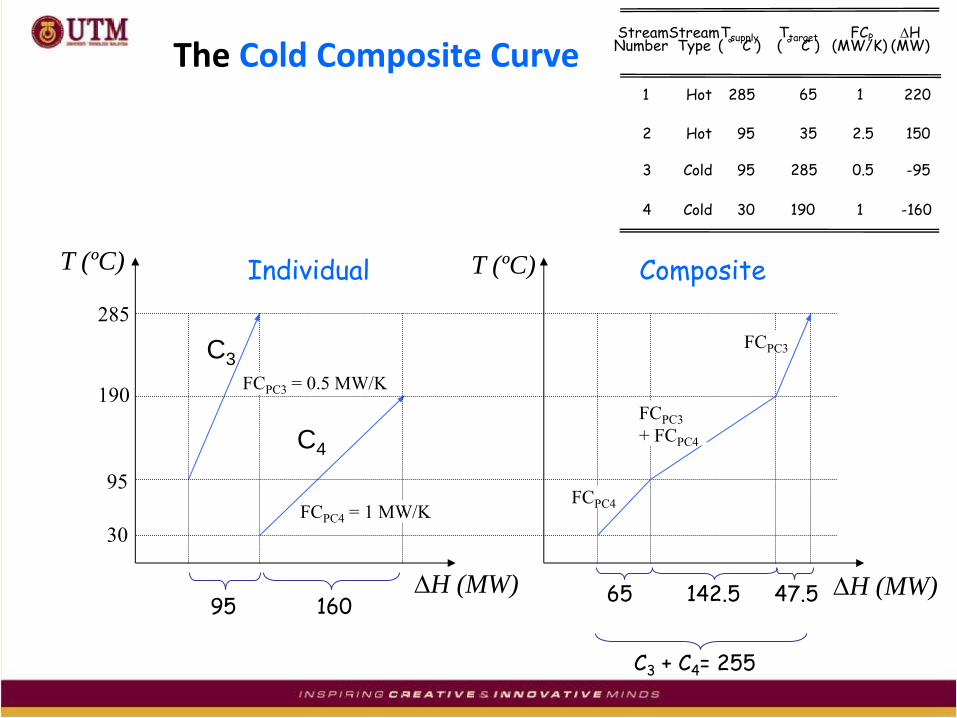
The Cold Composite Curve
C3
C4
C3 + C4= 255
DH (MW) DH (MW)
285
190
95
30
95 160
FCPC3 = 0.5 MW/K
FCPC4 = 1 MW/K
FCPC3
FCPC3
+ FCPC4
FCPC4
65 142.5 47.5
T (ºC) Individual Composite T (ºC)
Stream Number
Stream Type
FCP (MW/K)
Tsupply ( °C )
DH (MW)
Ttarget ( °C )
1 Hot 285 65 1 220
2 Hot 95 35 2.5 150
3 Cold 95 285 0.5 -95
4 Cold 30 190 1 -160

The “PINCH”
Pinch
Hot composite
curve
Cold composite
curve
H (kW)
T (ºC)
“The Pinch”
Hot and cold composites on the same T-ΔH diagram

Process-to-process heat
transfer
Composite Curves (CC)
Pinch
DTmin
Hot composite curve
Cold composite curve
H (kW)
T (ºC) QH,min
QC,min
QH= External Heating Duty
QC= External Cooling Duty
Smallest ΔT (driving force). - The most constrained part of the process (in terms of heat transfer) is at the Pinch

Energy Targets
Process to Process Heat
Exchange
QH= External Heating Duty
QC= External Cooling Duty
Q C = Cold Utility Requirement
Q H = Hot Utility

Effect of ΔTmin
Pinch
H (kW)
T (ºC) QH,min
QC,min
DTmin
Move
horizontally

Effect of ΔTmin
Less Process-to-Process
heat transfer
Pinch
DT > DTmin
H (kW)
T (ºC) QH,min
QC,min
QH >QH,min
QC >QC,min
DTmin
Move
horizontally

Working Session 1- Composite Curves
R2
R1
Cool FCP=1
Heat FCP=4
Cool FCP=2
Heat FCP=1.8
30°
120°
130°
40°
60°
100°
120°
180° 80°
C1
• Set up Stream Data Table • Construct Composite Curves • Read- Energy Targets for ΔTmin = 10°C • Compare your result with design by intuition

Heat Exchanger Network
Working Session 2– Composite Curve [Linnhoff et al.]
Given Stream data
C1 Cold 20 135 2
C2 Cold 80 140 4
H1 Hot 170 60 3
H2 Hot 150 30 1.5
DTmin = 10°C
Stream Type FCP
(MW/K) T supply T target
(°C) (°C)
(Answers) : Verify that QH,min=20MW; QC,min=60MW

Significance of The "Pinch"
DH (kW)
T (ºC)
No heat
transfer
Process below the pinch in heat balance with QC
Process above the pinch in heat balance with QH
“Pinch”
QH DHH + QH = DHC DHH
QC DHC DHC + QC = DHH
DHH
DHC
…Heat exchange should be confined to only each side of the pinch !

QH
Significance of The "Pinch"
“Pinch”
QC
DHH DHC
QH@ 180ºC
CW@ 30ºC
Heat Sink = only accepts heat
Heat Source – only rejects heat
QXS
unused process heat
DHs
“Heating below
pinch”
•QH used for heating
instead of hot stream
with DHs
• more excess heat
• must add CW
besides additional
QH to reject Qxs heat
“Cooling above
pinch”
• DHH potential heat
from rejected to
CW
• must compensate
for loss of DHH with
additional steam for
heating
DH (kW)
T (ºC)
DHH

QH
Significance of The "Pinch"
“Pinch”
QC
DHH DHC
Heat Sink = only accepts heat
Heat Source – only rejects heat
DHs
DH (kW)
T (ºC)
DHH • Cross Pinch Heat
Transfer - “upsets”
the heat balance
Implications:
• Not enough process
heat above
• excess heat below
Simple Rule:
Exchange only
• high Temp with high
temp,
• low T with low T
X-Pinch heat transfer

Significance of The "Pinch"
H (kW)
T (ºC)
QH,min
QC,min
No heat
transfer
“No Cooling above the
pinch”
“No Heating below the
pinch”

1. DTmin, which is the smallest approach temperature for heat exchange, limits the amount of heat recovery in a process (i.e. the heat recovery “pinch”).
2. There should be no heat transfer across the pinch. To guarantee this, • do not heat below the pinch (no external heating), or • do not cool above the pinch (external cooling) • do not transfer heat across the pinch (in last example, Q=0)
3. Any external cooling above the pinch, or heating below the pinch
will result in cross-pinch heat transfer, thereby increasing the external utility requirements.
Summary – Significance of The "Pinch"

Pinch Application 1 – Retrofit of an Existing Aromatics Complex
T-1 T-2 T-3
P-2 P-4 P-6
X-13
X-3
X-2
X-1
P-1
R-1
6
23
3
4
5
P-3 P-5 P-7
X-5 X-8
X-11
8
10
13
15
7
9 11
12
1416
18
17
19 21
20
22
21
X-4
X-6
X-7
X-9
X-10
X-12
Exchangers causing highest losses

Assignment 1 – Composite Curves for Palm Oil Refinery
Effluent Effluent
Effluent
Effluent
Activated
Clay H2PO3
Acid
Degummer
Bleacher
Deodorizer
Citric Acid
Filters
CPO
RBDPO
50°C
97°C
104°C
124°C
50°C
120°C
86°C 86°C
260°C
230°C
83°C
230°C
70°C 160°C
160°C
86°C
86°C 50°C
120°C
86°C
Q
Q
Q
160ºC
60ºC
70ºC
high loss
better “heat sink” (recipient)

Practical Use of the Composite Curve & Pinch
• Baseline Utility Consumption
• Maximum Heat Recovery
• Guidelines for heat recovery matches
• Avoid forbidden matches (follow 1st and 2nd thermo. Law)
• Implication of forbidden matches
• Diagnose heat recovery inefficiencies
• Guide for favorable process changes
• Guide for CHP and heat pump integration

Assignment – Energy Targeting & Process Diagnosis
a) Construct the process composite curves. b) Use the problem table method to verify your
results in (a). c) Read-off energy targets for ΔTmin = 10oC. d) Identify locations in the plant where these are
possible violations of the pinch rules. e) Through careful inspection of the process, identify
scopes for further heat recovery.
Using the stream data for the palm oil refinery,

Stream data for Palm Oil Refinery
Stream
No.
Stream
type
Supply
Temperature,
TS (oC)
Target
Temperature,
TT (oC)
Heat capacity
flow rate, FCp
(kW/oC)
1 Hot 120 86 10.99
2 Hot 260 160 6.04
3 Hot 83.3 70 13.13
4 Hot 160 50 6.56
5 Cold 50 97 11.83
6 Cold 104 124 14.89
7 Cold 86 230 5.69

THANK YOU
32