chapter 4 synthesis and spectroscopy of ruthenium(ii)/7 ... · intermediates in the dna-mediated...
TRANSCRIPT

91
Chapter 4
Synthesis and Spectroscopy of Ruthenium(II)/7-Deazaguanine-
Modified DNA Assemblies‡
‡Synthesis of the ruthenium(II) intercalator performed by Dr. Matthias M. Manger

92
4.1 Introduction
Chapters 2 and 3 detailed photoinduced DNA-mediated charge transfer between
the modified base 7-deazaguanine and the intercalator ethidium or the modified base 2-
aminopurine. Systematic investigation of ethidium excited-state reactivity with 7-
deazaguanine at a distance through the DNA π stack revealed a shallow distance
dependence1a and ultrafast charge transfer rates that correlated to the motion of the
intercalator within the base stack.2 Similar ultrafast charge transfer rates were observed
for intrastrand charge transfer between bases, specifically 2-aminopurine and guanine or
7-deazaguanine, in DNA.3,4 Although mechanisms other than electron transfer may be
systematically ruled out, charge transfer intermediates were difficult to observe. For this
reason we sought to utilize other reactants that might allow for the identification of
intermediates in the DNA-mediated charge transfer process. This chapter outlines the
synthesis of DNA duplexes modified with 7-deazaguanine and a covalently tethered
ruthenium(II) intercalator. Both steady-state and time-resolved spectroscopies will be
presented to characterize the electron transfer reaction.
Transition metal complexes of the type [Ru(L)2dppz]2+, (L = 2,2’-bipyridine (bpy)
and 1,10-phenanthroline (phen), dppz = dipyridophenazine, Figure 4.1)5,6 are well-known
DNA intercalators. In aqueous solutions, their luminescence is quenched by proton
interactions with the nitrogens on the phenazine portion of the dppz ligand.7,8 Upon
intercalation of the dppz moiety into the DNA base stack, the phenazine nitrogens
become protected from solvent, thus allowing the complexes to emit (λmax ca. 610 nm)
when excited in their metal-to-ligand charge transfer (MLCT) bands. This makes them
ideal probes to study photoinduced charge transfer through DNA, since only those metal
complexes bound to the double helix will be observed when examining the luminescence
spectroscopy of the intercalator. Indeed, a number of studies have examined the charge
transfer behavior of these molecules in the presence of DNA.9–11

93
As detailed in Chapters 2 and 3, 7-deazaguanine (Z) differs from guanine (G)
solely in the change of a nitrogen to a C-H unit (Figure 4.2). Its hydrogen bonding,
stacking, and structural stability in DNA double helices are very similar to that of the
natural base guanine. Importantly, however, Z is 0.3 V easier to oxidize than G.1 This
property can be utilized to study the effect of driving force on DNA-mediated charge
transfer or, alternatively, to examine systems where charge transfer does (Z) and does not
(G) take place. Both methods have been utilized in our laboratory, and each has provided
further evidence that charge transfer between well-coupled reactants through the DNA π
stack is a fast and efficient process.
E(*2+/1+) = 1.5 V
Figure 4.1 Structure and excited-state potential of [Ru(phen)2dppz]2+.
N
NN
NRu
N
N
NN
2+
NH
N
N
O
NH2N
R
Guanine (G)Eox=1.3 V
Figure 4.2 Structures and oxidation potentials of guanine (G) and deazaguanine (Z).1
NH
N
C
O
NH2N
H
R
Deazaguanine (Z)Eox=1.0 V

94
Because of the unique spectroscopy of ruthenium(II) intercalators and the unique
redox chemistry of 7-deazagaunine, we decided to study the photoinduced charge transfer
reaction between Z and a ruthenium intercalator covalently tethered to the end of a DNA
duplex. The overall scheme for the reaction is shown in Figure 4.3. The ruthenium
intercalator is excited with visible light (λexc = 480 nm). The excited state may either
decay back to the ground state (both radiatively and non-radiatively) or react with 7-
deazaguanine to form a ruthenium(I) and 7-deazaguanine radical species. These may
then participate in back electron transfer to bring the system back to its original state.
The driving force for charge transfer between *Ru(II) and Z is ca. ∆G = -0.5 V.
Based on the potentials of the ruthenium excited state and guanine, *Ru(II) should be
able to directly oxidize guanines in DNA as well (∆G = -0.2 V). However, previous
experiments from our laboratory have shown no evidence that this occurs.12 In fact, the
quantum yields of [Ru(phen)2dppz]2+ luminescence are higher in guanine containing
DNA (poly d(GC)) than any other combination of sequences.10 The explanation for this
lies in the nature of the [Ru(phen)2dppz]2+ excited state. The excited state that initiates
the reaction results from a metal-to-ligand charge transfer directed onto the dppz portion
of the metal complex. When intercalated into DNA, the dppz is in intimate contact with
Figure 4.3 Proposed electron transfer cycle between [Ru(phen)2dppz]2+
(Ru) and 7-deazaguanine (Z).
{*RuII, Z}
{RuII, Z}
{RuI, Z+}
ket
krec
hν kd

95
the π stack and would be the portion of the molecule accepting an electron from guanine.
The extra electron density makes accepting an electron unfavorable when used with
guanines in DNA. Using 7-deazaguanine, however, provides enough driving force to
overcome this effect, and charge transfer behavior may be observed. These subtle yet
unique properties allow us to study charge transfer through the DNA double helix in
assemblies where photoinduced charge transfer occurs (Ru/Z) while using Ru/G
assemblies as reference samples where no charge transfer takes place.
4.2 Experimental Section
Materials. Reagents for DNA oligonucleotide synthesis were obtained from Glen
Research. QAE-A25 anion exchange resin was purchased from Aldrich. Unless
otherwise noted, all other chemicals were purchased from Fluka or Aldrich and used
without further purification. Dipyrido[3,2-a:2´,3´-c]phenazine (dppz),13,14
[Ru(phen)2dppz]Cl2,15,16 [Ru(CO)2(phen)Cl2]17 and [Ru(bpy)2bpy’]Cl212 (bpy’=4-butyric
acid-8'-methyl bipyridyl) were prepared according to published procedures.
Instrumentation. NMR spectra were taken on a General Electric QE PLUS 300
MHz instrument or a Varian Inova-500 instrument using solvent as the internal standard.
UV-visible spectra were measured on a Hewlett Packard HP8452A or a Beckmann DU
7400 UV-visible spectrophotometer. CD spectra were recorded on a JASCO J-600
spectropolarimeter. Steady-state emission from 500–800 nm was measured using an ISS
K2 spectrofluorometer with λexc = 480 nm. Time-resolved transient absorption and
fluorescence measurements were conducted using a pulsed YAG-OPO laser (λexc = 480
nm). High performance liquid chromatography (HPLC) was performed on a Hewlett-
Packard 1050 HPLC.
Syntheses and Characterization. 5-bromo-1,10-phenanthroline (5-Br-phen). In a
thick wall bomb flask equipped with a PTFE stopper and a magnetic stirring bar, 3.60 g
(20.00 mmol) of anhydrous 1,10-phenanthroline (phen) were dissolved in 14 mL of fumic

96
H2SO4 (27–33% free SO3) and the solution was treated with 0.60 mL (11.71 mmol) of
bromine. The reaction mixture was then stirred for 14 hours at 120–125 ˚C upon which a
color change from brown red to light orange red occurred. After cooling to room
temperature, the reaction mixture was poured into 100 mL of ice water and the pH of the
resulting yellow solution was adjusted to ca. 10–11 with conc. NH3 solution upon which
a dark red oil separated. The mixture was extracted three times with 100 mL CH2Cl2.
The combined extracts were dried over anhydrous MgSO4 and the solvent was removed
in vacuo. The residual light purple solid was suspended in 400 mL of warm ether (ca. 30
˚C) and the suspension was filtered through celite to yield a colorless filtrate which was
brought to dryness in vacuo. 5-Bromo-1,10-phenanthroline was isolated as a colorless
solid which was used without any further purification. Yield: 4.00 g (77%). 1H NMR
(300 MHz, CDCl3): δ 9.06 (m, 2H), 8.49 (dd, Ja = 7.2 Hz, Jb = 1.2 Hz, 1H), 8.00 (dd, Ja
= 8.1 Hz, Jb = 1.4 Hz, 1H), 7.94 (s, 1H), 7.58 (dd, Ja = 8.3 Hz, Jb = 4.1 Hz, 1H), 7.48 (dd,
Ja = 8.1 Hz, Jb = 4.5 Hz, 1H). MS (ESI): m/z calculated for C12H7N2 ([M]+) 179.2, found
180.
5-(5-hydroxy-1-pentynyl)-1,10-phenanthroline. A solution of 8.00 g (30.90
mmol) of 5-Br-phen and 0.90 g (0.78 mmol) of Pd(PPh3)4 in 120 mL of pyrrolidine was
treated with 3.30 mL (35.58 mmol) of 4-pentyn-1-ol and stirred for 10 hours at 75–80 ˚C.
After cooling to room temperature, the mixture was poured into 250 mL of saturated
aqueous NH4Cl and extracted four times with 100 mL of CH2Cl2. The combined organic
layers were washed with saturated aqueous NH4Cl, saturated aqueous NaCl and dried
over anhydrous MgSO4. The solvent was removed in vacuo to leave a brown oily residue
which was dissolved in 20 mL of CHCl3. The solution was flash chromatographed on
Al2O3 (neutral) using CHCl3 as the eluant. The combined fractions were brought to
dryness in vacuo and residual light yellow oil was diluted in ca. 15 mL of CH2Cl2. After
evaporation of the latter in vacuo, the remaining light yellow solid was washed twice
with 10 mL of hexanes and dried. Yield: 3.89 g (48%). 1H NMR (300 MHz, CDCl3): δ
97
9.10 (dd, Ja = 4.3 Hz, Jb = 1.5 Hz, 1H), 9.06 (dd, Ja = 4.5 Hz, Jb =1.5 Hz, 1H), 8.60 (dd,
Ja = 8.3 Hz, Jb = 1.5 Hz, 1H), 7.83 (s, 1H), 7.58 (dd, Ja =8.3 Hz, Jb = 4.3 Hz, 1H), 7.51
(dd, Ja = 8.1 Hz, Jb = 4.5 Hz, 1H), 3.83 (t, J = 6.1 Hz), 2.65 (t, J = 7.1 Hz, 2H), 1.90 (m,
2H), 1.75 (s, 1H). MS (ESI): m/z calculated for C17H14N2O ([M]+) 262.3, found 263.
5-(5-hydroxy-1-pentyl)-1,10-phenanthroline (phen’-OH). A mixture of 5.65 g
(21.56 mmol) of 5-(5-hydroxy-1-pentynyl)-1,10-phenanthroline, 4.0 g of Pd/C (10%), 50
mL of 10% aqueous HCl and 200 mL of MeOH was stirred under a hydrogen atmosphere
for 48 hours at room temperature. After an atmosphere of argon was reestablished, the
reaction mixture was filtered through celite and the organic solvent was removed in
vacuo. The residue was diluted with 50 mL of H2O, and the pH was adjusted to ca. 11.5
with 10% aqueous NaOH. After extraction of the aqueous layer with CH2Cl2 (five times
with 100 mL), the combined extracts were washed with water, dried over anhydrous
MgSO4, filtered, and brought to dryness in vacuo. A light yellow residue was obtained
which was washed twice with 5 mL of diethyl ether and dried. Yield: 4.40 g (77%). 1H
NMR (300 MHz, CDCl3): δ 9.07 (dd, Ja = 4.2 Hz, Jb = 1.5 Hz, 1H), 9.00 (dd, Ja = 4.3
Hz, Jb = 1.6 Hz, 1H), 8.30 (dd, Ja = 8.4 Hz, Jb = 1.5 Hz, 1H), 8.04 (dd, Ja =8.1 Hz, Jb =
1.5 Hz, 1H), 7.54 (dd, Ja = 8.4 Hz, Jb = 4.2 Hz), 7.49 (m, 2H), 3.58 (m, 2H), 3.00 (t, J =
7.5 Hz), 1.77–1.41 (m, 7H). MS (ESI): m/z calculated for C17H18N2O ([M]+) 266.3,
found 267.
5-(4-methoxycarbonyl-butyl)-1,10-phenanthroline (phen’-OMe) A suspension of
4.40g (16.35mmol) of phen’-OH in 300 mL of acetone was treated with 10.07 g (63.72
mmol) of KMnO4 and stirred for 3 hours at room temperature upon which a brown
precipitate formed. The resulting reaction mixture was brought to dryness in vacuo and
the residue was suspended in 200 mL of H2O. The dark brown suspension was treated
with 15 mL of 10% aqueous NaOH and heated to reflux for 15 min. After cooling to
room temperature, the black slurry was filtered through celite and the residue was washed
with 20 mL of 0.1 N aqueous NaOH. The combined filtrates were extracted twice with
98
80 mL of CH2Cl2 to remove organic impurities. The pH of the aqueous layer was
adjusted to 3–4 with conc. aqueous HCl and the solvent was carefully removed in vacuo.
The remaining viscous residue was suspended in 300 mL of MeOH and the suspension
was treated dropwise with conc. H2SO4 until the formation of an off white precipitate
stopped. The slurry was filtered and the residue was washed twice with 10 mL of MeOH.
The combined filtrates were treated with ca. 1mL of conc. H2SO4 and heated to reflux for
3 hours. After cooling to room temperature, the mixture was concentrated to ca. 10mL,
and the concentrate was suspended in 200 mL of H2O. After the pH was adjusted to ca. 8
with 10% aqueous NaOH, the suspension was extracted six time with 100 mL of CH2Cl2.
The combined organic extracts were washed with aqueous NaCl, dried over anhydrous
MgSO4 and brought to dryness in vacuo to leave an orange-yellow oil. This was
dissolved in 10 mL of CH2Cl2/MeOH (20:1), and the solution was flash chromatographed
on silica with CH2Cl2/MeOH (20:1) as the eluant. The corresponding fractions were
combined, and the solvent was removed in vacuo. The residue was recrystallized from
boiling ethyl acetate. At -20 ºC, light yellow crystals precipitated which were separated
from the mother liquor, washed with 10 mL of ethyl acetate and 20 mL of hexanes and
dried. Yield: 1.41 g (30%). 1H NMR (500 MHz, CDCl3): δ 9.18 (d, J = 4.0 Hz, 1H),
9.12 [d, J = 3.0 Hz, 1H), 8.40 (d, J = 8.5 Hz, 1H), 8.15 (d, J = 8.0Hz, 1H), 7.65 (dd, Ja =
8.5 Hz, Jb = 4.0Hz, 1H), 7.58 (m, 2H), 3.65 (s, 3H), 3.13 (t, J = 6.5 Hz, 2H), 2.39 (t, J =
7.0 Hz, 2H), 1.82 (m, 4H). MS (ESI): m/z calculated for C18H18N2O2 ([M]+) 294.3,
found 295.
[Ru(CO)2(phen)(phen’-OMe)](PF6)2 A suspension of 511mg (0.80 mmol) of
[Ru(CO)2(phen)Cl2] and 298mg (1.02 mmol) of phen’-OMe in 30 mL of 2-methoxy-
ethanol was heated to reflux for 2 hours. A change of color from yellow to orange-
yellow occurred. After the reaction mixture was cooled to room temperature, a ca. 25%
aqueous solution of NH4PF6 was added dropwise until the precipitation of a yellow solid
was completed. The latter was filtered, washed five times with 10 mL portions of water
99
and five times with 20 mL portions of diethyl ether. The precipitate was isolated as a
shiny yellow solid and used without further purification. Yield: 0.37 g (50%). 1H NMR
not taken. MS (ESI): m/z calculated for C32H26F6N4O4PRu ([M-PF6]+) 776.6, found 777;
m/z calculated for C30H26F6N4O2PRu ([M-(CO)2-PF6]+) 720.6, found 721; m/z calculated
for C28H20F6N4O2PRu ([M-(CH2CHCOOCH3)-PF6]+) 690.5, found 691.
Synthesis of [Ru(phen)(5-phen'-OMe)(dppz)]Cl2. A solution of 464 mg (0.50
mmol) of [Ru(CO)2(phen)(phen’-OMe)](PF6)2, 284 mg (1.00 mmol) of dppz, and 146 mg
(2.86 mmol) of trimethylamine-N-oxide (TMNO) in 20 mL of 2-methoxyethanol was
heated to reflux for 2 hours. A rapid change of color from orange yellow to dark red
occurred. After cooling to room temperature, the crude reaction mixture was absorbed on
pre-equilibrated Sephadex QAE-A25 anion exchange resin. With water as eluant, an
orange red fraction was obtained which was brought to dryness in vacuo. The residue
was dissolved in 20 mL of acetonitrile and the solution was chromatographed on A12O3
(neutral). With MeCN/H2O (50: 1), a bright yellow fraction of side products was eluted;
whereas, the desired product was obtained with MeCN/H2O (94:6). The corresponding
orange-red fraction was brought to dryness in vacuo to yield a dark red crystalline solid.
Yield: 290 mg (62%). 1H NMR (500 MHz, CD3OD): δ 9.63 (m, 2H), 8.91 and 8.89
(both d, J = 8.5 Hz), 8.76 (m, 2H), 8.68 (d, J = 9.0 Hz, 0.5H), 8.66 (d, J = 8.5 Hz, 0.5H),
8.43–8.34 (m, 7H), 8.24 (m, 2H), 8.21 (m, 0.5H), 8.17 (m, 1H), 8.10 (dd, Ja = 5.5 Hz, Jb
= 1.0 Hz, 0.5H), 8.07 (dd, Ja = 6.5 Hz, Jb = 3.5 Hz, 2H), 7.88–7.77 (m, 5H), 7.74 (dd, Ja =
8.5 Hz, Jb = 5.5 Hz, 1H), 3.65, 3.64 (both s, 3H), 3.38 (t, J = 7.5 Hz, 2H), 2.46 (m, 2H),
1.93 (m, 2H), 1.85 (m, 2H). MS (ESI): m/z calculated for C48H36N8O2Ru ([M]2+) 428.9,
found 429; m/z calculated for C42H26N8Ru ([M-(CH2CHCH2CH2COOCH3)]2+) 371.9,
found 372.
Synthesis of [Ru(phen)(5-phen')(dppz)]Cl2 A solution of 281 mg (0.30 mmol) of
[Ru(phen)(5-phen'-OMe)(dppz)]Cl2 in 20 mL of water was treated with 840 mg (20
mmol) of LiOH and stirred for 16 hours at room temperature upon which an orange-red

100
precipitate formed. The mixture was diluted with 50 mL of water, and the pH was
adjusted to 5.5 with 1.0 M aqueous HCl. After addition of 400 mL of water and 5 mL of
MeCN, the resulting solution was loaded on a C18 Sep-Pak column (5 g) and the
adsorbed product was washed 20 times with 20 mL portions of water to remove residual
salts. With MeCN/trifluoroacetic acid (0.1%) (9:1) as the eluant, an orange-red fraction
was obtained which was brought to dryness in vacuo. Yield: 250 mg (90%). 1H NMR
(500 MHz, CD3OD): δ 9.77 (m, 2H), 8.88 and 8.87 (both d, J = 1.0 Hz, 1H), 8.71 (m,
2H), 8.63 (dd, Ja = 8.0 Hz, Jb =1.0 Hz, 0.5H), 8.62 (dd, Ja = 8.5 Hz, Jb = 1.0 Hz, 0.5 H),
8.51 (dd, Ja = 6.0 Hz, Jb = 3.0 Hz, 2H), 8.34 (m, 4.5H), 8.27 (dd, Ja = 5.0 Hz, Jb = 1.0 Hz,
0.5H), 8.19 (m, 2H), 8.14 (dd, Ja = 6.0 Hz, Jb = 3.0 Hz, 2H), 8.11 (m, 1.5H), 8.05 (dd, Ja
= 5.0 Hz, Jb = 1.0 Hz, 0.5H), 7.87 (m, 2H), 7.79–7.71 (m, 3H), 7.69 (dd, Ja = 8.0 Hz, Jb =
5.0 Hz, 1H), 3.37 (t, J = 7.5 Hz, 2H), 2.41 (m, 2H), 1.94 (m, 2H), 1.83 (m, 2H). MS
(ESI): m/z calculated for C47H33N8O2Ru ([M-H]+) 843, found 843; m/z calculated for
C47H34N8O2Ru ([M]2+) 422, found 422. UV-visible data (H2O): 266 nm (ε = 1.2 ×10⁵ M-
1cm-1), 374 nm (ε = 2.2 ×10⁴ M-1cm-1), 442 (ε = 2.1 ×10⁴ M-1cm-1).
[Ru(bpy)2bpy’]-DNA conjugate synthesis. [Ru(bpy)2bpy’]Cl2 (bpy’=4-butyric
acid-8'-methyl bipyridyl) was prepared according to published procedures.12 The acid
was coupled to amine-modified DNA as previously described.18 The conjugate was
cleaved from the resin with aqueous ammonia at 55 °C for 8 hours. Subsequent reverse
phase HPLC (0–35% CH3CN over 50 minutes, Rainin Dynamax C4 column) afforded a
diastereomeric mixture of the desired [Ru(bpy)2bpy’]-DNA conjugate. The conjugate
was quantitated using ε452 = 1.46 ×10⁴ M-1cm-1. MS (MALDI-TOF): m/z calculated for
[M+H]+ 5053.9, found 5054.2.
Methods. Sample Preparation. Unless otherwise noted, all experiments were
performed in a buffer of 5 mM sodium phosphate (NaPi), 50 mM sodium chloride
(NaCl), at pH=7. Ruthenium-modified and 7-deazaguanine containing duplexes were
synthesized as previously described.1,18 All conjugates were purified by reverse phase

101
HPLC (0–35% CH3CN over 50 minutes, Rainin Dynamax C4 column). Duplexes were
created by hybridizing the appropriate amounts of complementary single strands based on
the extinction coefficients for ruthenium-modified sequences (ε440 = 21000 M-1cm-1) and
calculated extinction coefficients for unmodified sequences (ε260 (M-1cm-1): dC = 7400;
dT = 8700; dG = 11,500; dA = 15,400; dZ = 10,500.1a,19,20 Characterization for all
oligonucleotides included MALDI-TOF mass spectrometry and UV-visible spectroscopy.
Steady-state Spectroscopy. All samples were purified via HPLC and de-salted
prior to use. Emission and excitation spectra were obtained on an ISS K2
spectrofluorometer. Emission intensities were determined by integration of the
luminescence spectrum and standardized against [Ru(bpy)3]Cl2 as a calibration for the
instrument. Solutions containing 5 µM Ru-DNA duplex were excited at 480 nm, and
emission was monitored from 500 nm to 800 nm. Excitation spectra were obtained by
monitoring at the emission maximum while varying excitation wavelength from 350 nm
to 600 nm.
Time-resolved Spectroscopy. All Ru-DNA conjugates were purified via HPLC
and de-salted prior to use. Time-resolved transient absorption and fluorescence
measurements were conducted using a pulsed YAG-OPO laser (λexc = 480 nm). Laser
powers ranged from 2 to 4 mJ/pulse. The Ru-DNA concentration in all samples was 5
µM. The buffer used in both fluorescence and transient absorption measurements was 5
mM NaPi, 50 mM NaCl, pH=7. Decays were fit to biexponential curves using in-house
software and least-squares analysis.
4.3 Results and Discussion
4.3.1 Synthesis of ruthenium-DNA conjugates
Ruthenium(II) Intercalator. The architecture of [Ru(phen)2dppz]2+ must be
modified in order to be able to covalently tether it to the end of a DNA oligonucleotide.
It is also important that any modifications do not drastically alter the binding, photo-

102
physical, and electrochemical properties of the intercalator compared to its parent
complex. The ruthenium(II) complex we created that satisfies these requirements is
shown in Figure 4.4. To synthesize the molecule we sequentially attached the three
polypyridyl ligands to the ruthenium metal center according to a method developed by
Anderson et al.17 (details given in the Experimental Section). The method, which is a
general route to creating ruthenium complexes with three different polypyridyl ligands,
allowed us to create a new metal complex ([Ru(phen)(phen’)dppz]2+) very similar in
structure to the well-characterized [Ru(phen)2dppz]2+. The three different ligands all play
critical roles in how the complex behaves when attached to DNA. The
dipyridophenazine ligand (dppz) intercalates into DNA and provides intimate interaction
with the base stack, a requirement for observing fast and efficient DNA-mediated charge
transfer. The modified phenanthroline (phen’), in addition to providing the photophysical
properties typical of ruthenium(II) polypyridyls, allows the complex to be attached to the
end of a modified DNA oligonucleotide (vide infra). The unmodified phenanthroline
(phen) ligand serves to complete the kinetically inert ruthenium(II) coordination sphere
and provides desirable spectroscopic properties.
Figure 4.4 Structure of [Ru(phen)(phen')dppz]2+.
N
NN
NRu
N
N
NN
2+ OH
O

103
A modified 1,10-phenanthroline (phen’) was chosen instead of a modified 2,2’-
bipyridine (bpy’ = 4-butyric acid-8'-methyl bipyridyl) based on previous results from our
laboratory. Ruthenium conjugates utilizing bpy’ instead of phen’ showed little or no
fluorescence quenching by 7-deazaguanine, even at short donor-acceptor separations.
Distance dependent fluorescence quenching was notably absent, and the observed
fluorescence varied little with the chosen DNA sequences. Further, hypochromism upon
DNA binding was reduced relative to the parent complex (without the linker arm),
indicating the complex was not well stacked within the DNA helix. The phen’-based
ruthenium intercalator did not suffer from these drawbacks, and that is the complex we
used to generate the results detailed in this Chapter.
Ruthenium-DNA oligonucleotides. After synthesizing the desired ruthenium(II)
intercalator, we set about attaching it to the end of DNA. The synthesis of ruthenium-
containing DNA oligonucleotides was performed as outlined previously18 and is
summarized in Figure 4.5. The desired single strand sequence was synthesized on an
automated DNA synthesizer and the trityl protecting group removed to leave a 5’-OH on
the terminal nucleotide on the controlled pore glass (CPG) resin. This was reacted with
carbonyl diimidazole followed by a diaminoalkane to form an amine terminated
oligonucleotide (still attached to the CPG). Next, [Ru(phen)(phen’)dppz]2+, with the
carboxylic acid group on the phen’ ligand, was coupled to the amine to create a Ru-DNA
conjugate (still attached to the CPG). This was cleaved from the resin and deprotected in
aqueous ammonia and purified via HPLC to give the desired single strand Ru-DNA
conjugate. Ru-DNA single strands and their G or Z containing complements were then
quantitated by UV-visible spectroscopy, and the appropriate amounts were annealed to
create Ru/G- and Ru/Z-modified DNA duplexes.

104
Inspection of the HPLC traces (example shown in Figure 4.5) reveals four main
peaks that elute with retention times similar to what we would expect for
metallointercalator-DNA conjugates. MALDI-TOF mass spectrometry analysis revealed
the peaks all had the same (expected) mass for the given Ru-DNA sequence (Table 4.1),
and UV-visible spectra showed the transitions consistent with the presence of both
ruthenium(II) (broad MLCT band in the 400–500 nm region)5 and DNA (large π-π*
transition at 260 nm).19,20 Thus, the peaks have the same underlying composition.
Closer examination of the [Ru(phen)(phen’)dppz]2+ structure provides the reason
for multiple HPLC peaks when the complex is attached to DNA. Shown in Figure 4.6 are
the structures of the various diastereomers of the intercalator when tethered to a DNA
oligonucleotide. There are ∆ and Λ configurations about the metal center, and each of
those configurations can have the linker arm on the phen’ in an axial or equatorial

105
position.21 It is really quite remarkable that the subtle differences in structure allow all of
the Ru-DNA diastereomers to be separated and isolated via HPLC with a non-chiral
stationary phase.
HPLC Peak (Fig. 4.5) m/z calculated (amu) m/z found (amu)
1 5227.2 5226.2
2 5227.2 5227.5
3 5227.2 5227.4
4 5227.2 5228.8
OHO
NN
NN
N
NRu
N
N
NN
NN
N
N N
NRu
OHO
NN
NN
N
NRu
N
N
NN
NN
N
N N
NRu
HO OHOO
equatorial axial
∆
Λ
Figure 4.6 Structures of the four diastereomers of [Ru(phen)(phen')dppz]2+.
Table 4.1 Mass spectrometry data for the Ru-DNA conjugates indicated by peaks 1–4 in the HPLC trace in Figure 4.5.

106
In order to verify that the four isolated HPLC peaks contained two ∆ and two Λ
strands we performed circular dichroism measurements. Figure 4.7 shows the spectra of
the four peaks isolated from the HPLC shown in Figure 4.5. Assignments of the
configuration about the metal center were made by comparing the signals to the known
circular dichroism spectra of ∆ and Λ [Ru(phen)2dppz]2+.22,23 As expected, the signals
provide solid evidence that the four peaks correspond to two ∆ plus two Λ Ru-DNA
diastereomers. In going forward with our studies, we will examine only DNA sequences
in which all four of the diastereomers can be separated via HPLC. This will allow us to
isolate the effect of intercalator chirality on DNA-mediated charge transfer.
-4
-2
0
2
4
6
250 300 350 400 450 500 550 600 650
Wavelength (nm)
Figure 4.7 Circular dichroism spectra of the four [Ru(phen)(phen')dppz]2+-
DNA conjugates (sequence shown in the Figure) isolated from the
HPLC trace shown in Figure 4.5. Spectra taken in H2O at ambient
temperature, with sample concentrations of approximately 5 µM.
5'-ACGAACCAGCATCT-3'Ru
∆3∆4
Λ2
Λ1

107
4.3.2 Steady-state spectroscopy of Ru/G and Ru/Z conjugates
Ruthenium-DNA Assemblies. The Ru-DNA duplexes assemblies employed in our
studies are shown in Figure 4.8. The donor-acceptor distances (7–14 Å) are worst-case
estimates based on intercalation of the ruthenium complex between the third and fourth
base pairs. Molecular modeling indicates the linker attaching the complex to the DNA
backbone will not allow intercalation at a site farther down the helix without significantly
disrupting the structure of the duplex. Spectroscopy experiments were performed on all
four of the Ru-diastereomers (for both Ru/G and Ru/Z duplexes) at each donor-acceptor
distance. Unfortunately, other sequences did not give rise to separation of all the
diastereomers via HPLC, so the sequences shown in Figure 4.8 are the only ones we
studied.
Figure 4.8 Sequences and donor-acceptor separations of the ruthenium-modified DNA duplexes employed for DNA-mediated charge transfer studies.
Ru-X = 7 Å5'-ACG ACCAGACATCT-3'3'-TGC TXGTCTGTAGA-5'GXT7
Ru-X = 10 Å5'-ACG AACCAGCATCT-3'3'-TGC TTXGTCGTAGA-5'GXT10
Ru-X = 14 Å5'-ACG ACACCAGCTCT-3'3'-TGC TGTXGTCGAGA-5'GXT14
X = G or Z
Ru
Ru
Ru

108
Fluorescence Behavior. Figure 4.9 shows the fluorescence spectra for select G
and Z containing, Ru-modified DNA duplexes. The single atom change in going from G
to Z results in a substantial amount of ruthenium luminescence quenching. The quantum
yields and quenching values for the series of duplexes outlined in Figure 4.8 are
summarized in Table 4.2. Steady-state luminescence quenching in the 7-deazaguanine
containing duplexes is readily apparent at donor-acceptor separations of 7–14 Å. After
14 Å, the amount of ruthenium luminescence quenching by 7-deazaguanine is negligible.
Additionally, absolute quenching yields are higher for the ∆ isomers than the Λ isomers
of the ruthenium-DNA conjugates. This is in agreement with how well the tethered
isomers are expected to intercalate into the DNA base stack.24 The thermodynamic
driving force for the reaction is the same in all cases, so the observed differences really
emphasize the importance of stacking on charge transfer mediated by the DNA double
helix.
The distance dependence of the quenching reaction is shallow and depends on the
chirality of the tethered metallointercalator. The distance dependences (0.3 Å-1 for the Λ
isomer and 0.5 Å-1 for the 0.3 Å-1 isomer) are similar to those obtained in previous studies
examining photoinduced DNA-mediated charge transfer between fluorophores and 7-
deazaguanine (Chapters 2 and 3). Surprisingly, the distance dependence is more shallow
for the Λ isomer than the ∆ isomer (Figure 4.10). This is in direct conflict with how well
the intercalator is expected to bind to DNA, as ∆ isomers show enhanced binding relative
to Λ isomers because the ancillary ligands are able to fit in the DNA groove without
steric clashing with the DNA backbone.24 The reasons for our anamolous data are
unclear but may be related to how the stacking of the reactants changes as the donor-
acceptor distance increases.

109
0
50
100
150
500 550 600 650 700 750 800
Wavelength (nm)
Figure 4.9 Steady-state fluorescence spectra of the G and Z containing, ruthenium-modified DNA duplexes shown in the Figure. Spectra shown are for the ∆4 diastereomer. λexc=480 nm. 5 µM duplex in 5 mM NaPi, 50 mM NaCl, pH=7 buffer.
G
Z
5'-ACG ACCAGACATCT-3'3'-TGC TXGTCTGTAGA-5'
Ru

110
Samplea ∆/Λb IGc IZ
d Fqe
GXT7 1 Λ 0.31 0.16 0.48 GXT10 1 Λ 0.25 0.22 0.14 GXT14 4 Λ 0.36 0.33 0.09
GXT7 2 Λ 0.22 0.11 0.49
GXT10 2 Λ 0.26 0.19 0.27 GXT14 3 Λ 0.67 0.61 0.09
GXT7 3 ∆ 0.50 0.09 0.82
GXT10 3 ∆ 0.33 0.23 0.30 GXT14 1 ∆ 0.90 0.80 0.11
GXT7 4 ∆ 0.42 0.16 0.63
GXT10 4 ∆ 0.32 0.24 0.24 GXT14 2 ∆ 0.88 0.83 0.06
Table 4.2 Steady-state fluorescence data for Ru/G and Ru/Z modified DNA
duplexes. (a) Sequence and HPLC peak number of the Ru-DNA
conjugate. (b) Chirality about the metal center of the Ru-DNA
conjugate. (c) Relative quantum yield of Ru/G modified duplexes.
(d) Relative quantum yield of Ru/Z modified duplexes. (e) The
fraction of luminescence quenched (Fq). Experimental conditions:
5 µM DNA duplex in 5 mM NaPi, 50 mM NaCl, pH=7.0 buffer
with λexc = 480 nm and λobs = 500–800 nm. Calculated intensities
are relative to a 10 µM [Ru(bpy)3]2+ in water standard.

111
-3
-2
-1
0
1
2
6 8 10 12 14
Distance (Å)
6 8 10 12 14-3
-2
-1
0
1
2
Distance (Å)
Λ
Λ1
Λ2
∆3
∆4
ln[(
I G/I Z
)-1]
ln[(I
G/I Z
)-1]
∆
Figure 4.10 Distance dependences of DNA-mediated charge transfer quenching yields between *Ru and 7-deazaguanine for Λ (top) and ∆ (bottom) Ru-DNA diastereomers.
0.3 Å-1
0.3 Å-1
0.5 Å-1
0.5 Å-1

112
Control Experiments. To verify that intercalation was essential for observing
DNA-mediated charge transfer in Ru/Z DNA conjugates, we created a DNA duplex that
contained a non-intercalating ruthenium(II) complex (Figure 4.11). The new metal
complex consists of an architecture of 2,2’-bipyridines, ligands that do not intercalate into
DNA. The photophysical properties, however, are very similar to that of our intercalator.
Figure 4.12 shows the fluorescence spectra for the Ru/G- and Ru/Z-modified duplexes
created using [Ru(bpy)2bpy’]2+. The sequence is the same as that used for the shortest
donor-acceptor separation in the intercalative Ru/Z duplexes (7 Å). As is readily
apparent from the Figure, the luminescence of the non-intercalating compound is not
quenched by 7-deazaguanine in DNA. This allows us to conclude two things: (1)
intercalation is necessary to observe DNA-mediated photoinduced charge transfer
between *Ru(II) and Z, and (2) direct contact of the metal complex with the 7-
deazaguanine is unlikely and thus cannot be used to explain the efficient quenching
behavior. This further demonstrates that intimate access of the reactants to the DNA π
stack is essential for observing efficient charge transfer through the double helix.
Figure 4.11 Structure of the non-intercalating [Ru(bpy)2(bpy')]2+.
N
NRu
N
N
NN
2+
OH
O

113
0
100
200
300
400
500
600
700
500 550 600 650 700 750 800
GZ
Wavelength (nm)
Figure 4.12 Steady-state fluorescence spectra of the G (black) and Z (gray)
containing, [Ru(bpy)2(bpy')]2+-modified DNA duplexes shown in
the Figure. Spectra shown are for the racemic conjugate. λexc=
480 nm. 10 µM duplex in 5 mM NaPi, 50 mM NaCl, pH=7.0
buffer. Total luminescence quenching is less than 1%.
5'-ACGACCAGACATCT-3'3'-TGCTXGTCTGTAGA-5'
Ru
Fq < 0.01
114
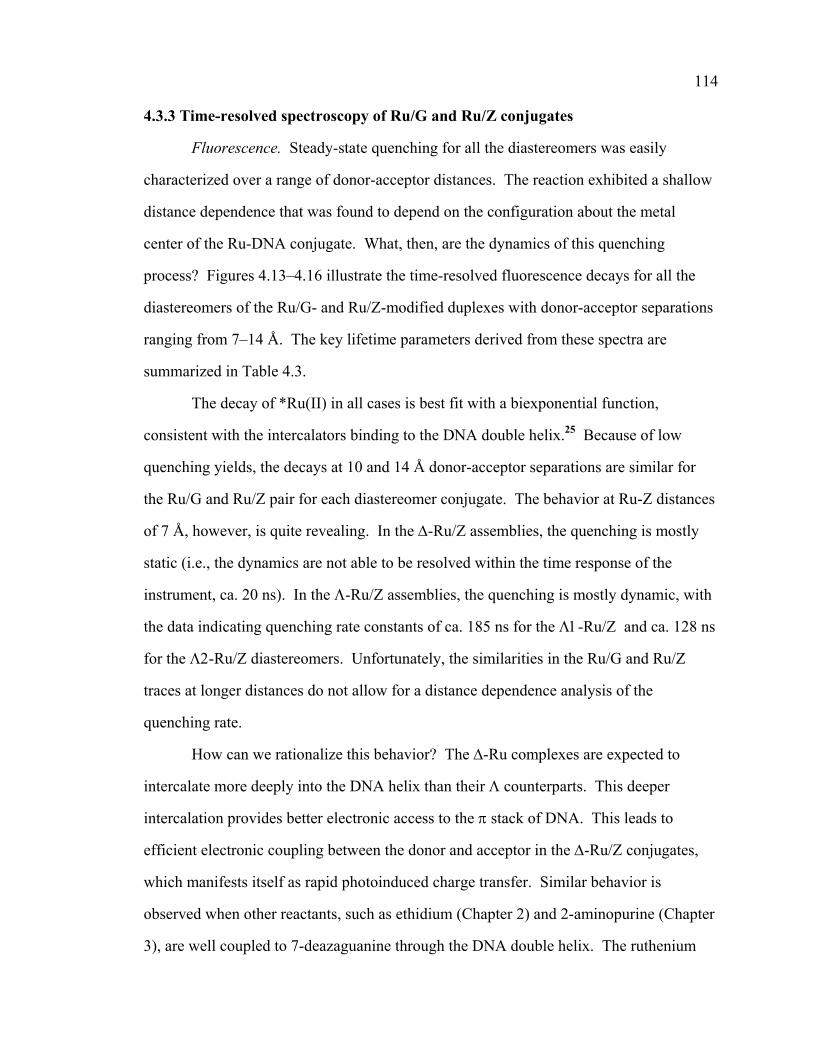
4.3.3 Time-resolved spectroscopy of Ru/G and Ru/Z conjugates
Fluorescence. Steady-state quenching for all the diastereomers was easily
characterized over a range of donor-acceptor distances. The reaction exhibited a shallow
distance dependence that was found to depend on the configuration about the metal
center of the Ru-DNA conjugate. What, then, are the dynamics of this quenching
process? Figures 4.13–4.16 illustrate the time-resolved fluorescence decays for all the
diastereomers of the Ru/G- and Ru/Z-modified duplexes with donor-acceptor separations
ranging from 7–14 Å. The key lifetime parameters derived from these spectra are
summarized in Table 4.3.
The decay of *Ru(II) in all cases is best fit with a biexponential function,
consistent with the intercalators binding to the DNA double helix.25 Because of low
quenching yields, the decays at 10 and 14 Å donor-acceptor separations are similar for
the Ru/G and Ru/Z pair for each diastereomer conjugate. The behavior at Ru-Z distances
of 7 Å, however, is quite revealing. In the ∆-Ru/Z assemblies, the quenching is mostly
static (i.e., the dynamics are not able to be resolved within the time response of the
instrument, ca. 20 ns). In the Λ-Ru/Z assemblies, the quenching is mostly dynamic, with
the data indicating quenching rate constants of ca. 185 ns for the Λ1-Ru/Z and ca. 128 ns
for the Λ2-Ru/Z diastereomers. Unfortunately, the similarities in the Ru/G and Ru/Z
traces at longer distances do not allow for a distance dependence analysis of the
quenching rate.
How can we rationalize this behavior? The ∆-Ru complexes are expected to
intercalate more deeply into the DNA helix than their Λ counterparts. This deeper
intercalation provides better electronic access to the π stack of DNA. This leads to
efficient electronic coupling between the donor and acceptor in the ∆-Ru/Z conjugates,
which manifests itself as rapid photoinduced charge transfer. Similar behavior is
observed when other reactants, such as ethidium (Chapter 2) and 2-aminopurine (Chapter
3), are well coupled to 7-deazaguanine through the DNA double helix. The ruthenium

115
-0.050
0.050.1
0.150.2
0.25
0.30.35
X = G , 7 ÅX = Z , 7 Å
-0.050
0.050.1
0.150.2
0.25
0.30.35
X = G , 10 ÅX = Z , 10 Å
-0.050
0.050.1
0.150.2
0.250.3
0.35X = G , 14 ÅX = Z , 14 Å
0 0.5 1 1.5 2 2.5
I
I
I
Time (µs)
Figure 4.13 Time-resolved fluorescence of the G (black) and Z (gray)
containing, [Ru(phen)(phen')dppz]2+-modified DNA duplex
series Λ1. Donor-acceptor distances are given in the Figure.
λexc=480 nm, λobs=610 nm. 5 µM duplex in 5 mM NaPi,
50 mM NaCl, pH=7 buffer.

116
-0.050
0.050.1
0.15
0.20.25
0.30.35
X = G , 7 ÅX = Z , 7 Å
-0.050
0.050.1
0.150.2
0.250.3
0.35X = G , 10 ÅX = Z , 10 Å
-0.050
0.05
0.10.150.2
0.25
0.30.35
0 0.5 1 1.5 2 2.5
X = G , 14 ÅX = Z , 14 Å
I
I
I
Time (µs)
Figure 4.14 Time-resolved fluorescence of the G (black) and Z (gray)
containing, [Ru(phen)(phen')dppz]2+-modified DNA duplex
series Λ2. Donor-acceptor distances are given in the Figure.
λexc=480 nm, λobs=610 nm. 5 µM duplex in 5 mM NaPi,
50 mM NaCl, pH=7 buffer.

117
-0.1
0
0.1
0.2
0.3
0.4
0.5X = G , 7 ÅX = Z , 7 Å
-0.1
0
0.1
0.2
0.3
0.4
0.5X = G , 10 ÅX = Z , 10 Å
0
0.1
0.2
0.3
0.4
0.5
0 0.5 1 1.5 2 2.5
X = G , 14 ÅX = Z , 14 Å
I
I
I
Time (µs)
Figure 4.15 Time-resolved fluorescence of the G (black) and Z (gray)
containing, [Ru(phen)(phen')dppz]2+-modified DNA duplex
series ∆3. Donor-acceptor distances are given in the Figure.
λexc=480 nm, λobs=610 nm. 5 µM duplex in 5 mM NaPi,
50 mM NaCl, pH=7 buffer.

118
-0.050
0.050.1
0.150.2
0.250.3
0.35X = G , 7 ÅX = Z , 7 Å
-0.050
0.050.1
0.150.2
0.250.3
0.35X = G , 10 ÅX = Z , 10 Å
-0.05
00.050.1
0.150.2
0.250.3
0.35
0 0.5 1 1.5 2 2.5
X = G , 14 ÅX = Z , 14 Å
I
I
I
Time (µs)
Figure 4.16 Time-resolved fluorescence of the G (black) and Z (gray)
containing, [Ru(phen)(phen')dppz]2+-modified DNA duplex
series ∆4. Donor-acceptor distances are given in the Figure.
λexc=480 nm, λobs=610 nm. 5 µM duplex in 5 mM NaPi,
50 mM NaCl, pH=7 buffer.

119
Samplea ∆/Λb X=Gc τ1 (%τ1)
X=Gd τ2 (%τ2)
X=Ze τ1 (%τ1)
X=Zf τ2 (%τ2)
GXT7 1 Λ 250 (37%) 67 (63%) 220 (17%) 53 (83%) GXT10 1 Λ 200 (27%) 54 (73%) 190 (26%) 52 (74%) GXT14 4 Λ 340 (39%) 68 (61%) 340 (35%) 69 (65%)
GXT7 2 Λ 260 (20%) 64 (80%) 330 (6%) 45 (94%) GXT10 2 Λ 310 (19%) 67 (81%) 300 (23%) 57 (77%) GXT14 3 Λ 470 (71%) 81 (29%) 470 (70%) 85 (30%)
GXT7 3 ∆ 220 (62%) 61 (38%) 310 (19%) 44 (81%) GXT10 3 ∆ 220 (27%) 77 (73%) 190 (29%) 54 (71%) GXT14 1 ∆ 300 (60%) 130 (40%) 280 (59%) 130 (41%)
GXT7 4 ∆ 220 (56%) 68 (44%) 290 (19%) 49 (81%) GXT10 4 ∆ 310 (29%) 75 (71%) 240 (30%) 59 (70%) GXT14 2 ∆ 310 (65%) 110 (35%) 300 (64%) 100 (36%)
Table 4.3 Nanosecond lifetime data for Ru/G and Ru/Z modified DNA duplexes. (a) Sequence and HPLC peak number of the Ru-DNA conjugate. (b) Chirality about the metal center of the Ru-DNA conjugate. (c) and (d) Lifetimes (ns) and percentages of *Ru in Ru/G modified duplexes. (e) and (f) Lifetimes (ns) and percentages of *Ru in Ru/Z modified duplexes. Experimental conditions: 5 µM DNA duplex in 5 mM NaPi, 50 mM NaCl, pH=7.0 buffer with λexc=480 nm and λobs=610 nm. Data fit via the least-squares method to the equation I(t) = c0+c1*exp(-t/τ1)+c2*exp(-t/τ2).

120
intercalator in the Λ-Ru/Z conjugates is not able to intercalate as well into the DNA base
stack. The electronic coupling between Ru and Z is not as good in that case, and this
manifests itself in a slower rate constant for charge transfer. Another explanation is that
the observed rate constant is simply the time required for the ruthenium intercalator to
become “well stacked” (and thus well coupled) in the DNA base stack. While a similar
dynamical motion has been used to describe charge transfer in ethidium/7-deazaguanine
duplexes, we cannot definitively say if that behavior is occurring in the Λ-Ru/Z DNA
assemblies.2 Nevertheless, the time-resolved data illustrate how subtle effects in DNA
intercalation can drastically alter charge transfer mediated by the DNA base stack.
Transient Absorption. Can any other processes account for the ruthenium
luminescence quenching by 7-deazaguanine? The redox potentials and lack of spectral
overlap between Ru emission and Z absorption make this unlikely. However, we used
transient absorption spectroscopy to identify an intermediate in the quenching reaction,
thus definitely proving charge transfer is responsible for *Ru(II) luminescence quenching
by 7-deazaguanine. Figure 4.17 (bottom graph) illustrates the differences in the transient
absorption signals at 450 nm for the ∆3-Ru/Z and ∆3-Ru/G (7 Å) conjugates. The
recovery times clearly match the excited-state fluorescence decays observed for the same
duplexes (top graph). The transient signal in the ∆3-Ru/Z (7 Å) duplex actually rises
above zero. This signal decays within 1 microsecond, and no long-lived transients are
observed under the chosen experimental conditions.
In order to characterize the spectrum of the Ru/Z transient, measurements were
taken over a large range of wavelengths. Figure 4.18 illustrates the transient spectrum
from 350–520 nm for the ∆3-Ru/Z (7 Å) assembly. Above 520 nm, residual fluorescence
overloads the photomultiplier tube and the signals are not indicative of the true transient
spectrum. As seen by comparing this spectrum to the *Ru-Ru2+ spectrum shown in
Figure 4.19, the observed species is definitely not assigned as ruthenium(II) excited state.

121
00.050.1
0.150.2
0.250.3 X = G
X = Z
-0.04
-0.03
-0.02
-0.01
0
0 0.5 1 1.5 2 2.5
X = GX = Z
5'-ACG ACCAGACATCT-3'3'-TGC TXGTCTGTAGA-5'
I
∆A
Ru
Time (µs)
Figure 4.17 Time-resolved fluorescence (top) and transient absorption (bottom) of the ∆3 diastereomer of the G (black) and Z (gray) containing, [Ru(phen)(phen')dppz]2+-modified DNA duplex shown in the Figure. Ru-G and Ru-Z distances are ca. 7 Å. 5 µM duplex in 5 mM NaPi, 50 mM NaCl, pH=7 buffer.
λexc=480 nm, λobs=610 nm
λexc=480 nm, λobs=450 nm

122
It is unclear if any of the spectral features correspond to the 7-deazaguanine radical,
because the spectrum of the 7-deazaguanine radical is unknown. It is likely very similar
to that of the guanine radical in DNA, which means that its spectroscopic signature would
be weak and difficult to observe.26 The spectrum does, however, match up very closely
with the Ru(I) spectrum generated by the reaction of *Ru(II) with the electron transfer
quencher triethanolamine in acetonitrile (middle of Figure 4.19). This provides definitive
proof that quenching of ruthenium(II) luminescence in DNA by 7-deazaguanine
generates ruthenium(I) and thus proceeds via a charge transfer mechanism.
-2 10-10
0
2 10-10
4 10-10
6 10-10
8 10-10
360 380 400 420 440 460 480 500 520
Wavelength (nm)
Figure 4.18 Transient absorption spectrum of the ∆3 diastereomer of the
[Ru(phen)(phen')dppz]2+-7-deazaguanine DNA conjugate shown in
the Figure. Points obtained by integrating the area under the curve
at each specific wavelength. 5 µM DNA duplex in 5 mM NaPi, 50
mM NaCl, pH=7 buffer with λexc=480 nm.
5'-ACG ACCAGACATCT-3'3'-TGC TZGTCTGTAGA-5'
Ru

123

124
The spectroscopic results obtained for Ru/Z assemblies reinforce the notion that
stacking of the reactants within DNA plays a huge role in determining the efficiency and
rate of DNA-mediated charge transfer. The behavior observed in Ru/Z assemblies, while
still indicative of efficient charge transfer through the DNA double helix, was different
than that observed in ethidium/Z and 2-aminopurine/Z systems (Table 4.4). Comparison
of the results for the various systems leads to the conclusion that ethidium is able to best
maintain stacking and coupling over a range of donor-acceptor distances. Rates of
intrastrand charge transfer between Ap and Z fall off slightly with distance, as the
stacking of the Ap is somewhat limited to one strand of the DNA double helix. While the
∆-Ru/Z charge transfer rates were unable to be resolved, they are faster than their Λ-Ru/Z
counterparts in which the intercalator is more poorly stacked within the DNA.
DNA Assembly D-A Distance Charge Transfer Decay Time(s)
Ethidium/7-deazaguanine 10–17 Å 5 ps, 75 ps
2-Aminopurine/7-deazaguanine 3–14 Å 4 ps – 200 ps
∆-Ruthenium/7-deazaguanine 7–14 Å < 10 ns
Λ-Ruthenium/7-deazagunine 7–14 Å ca. 100 ns
It is clear that subtle differences in the interaction of the reactants with the DNA
base stack result in substantial differences of the observed charge transfer rates. While it
would be convenient if charge transfer through DNA could be described by a simple set
of parameters, the data in the last three chapters shows this is not reasonable for a system
as complex as DNA in solution. Any future studies examining charge transfer through
the double helix must take this into account.
Table 4.4 Comparison of the DNA-mediated charge transfer behavior between 7-deazaguanine and a variety of photooxidants.

125
4.4 Conclusions
The use of a classic dppz-based ruthenium(II) intercalator tethered to DNA has
allowed us to further study the spectroscopic nuances of DNA-mediated charge transfer.
Quenching of ruthenium(II) excited-state luminescence by 7-deazaguanine over distances
of 7–14 Å through the DNA base stack was examined. The efficiency of the reaction was
found to be on par with similar studies utilizing an intercalator and 7-deazaguanine as the
donor-acceptor pair. The shallow distance dependence was also dependent upon the
chirality about the metal center of the intercalator, indicating binding to DNA plays an
important role in determining how charge transfer behaves. Time-resolved fluorescence
revealed the process takes place on the nanosecond timescale, slightly slower than
ultrafast charge transfer observed between ethidium and 7-deazaguanine. The unique
spectroscopic properties of the ruthenium intercalator allowed the identification of a
charge transfer intermediate, thus confirming that electron transfer is the mechanism of
ruthenium luminescence quenching. These results once again emphasize the importance
of stacking and electronic coupling to DNA-mediated charge transfer.

126
4.5 References
1. (a) Kelley, S. O.; Barton, J. K. Chem. Biol. 1998, 5, 413. (b) Steenken, S.; Jovanovic,
S. V. J. Am. Chem. Soc. 1997, 119, 617.
2. Wan, C.; Fiebig, T.; Kelley, S. O.; Treadway, C. R.; Barton, J. K.; Zewail, A. H.
Proc. Natl. Acad. Sci. U.S.A. 1999, 96, 6014.
3. Kelley, S. O.; Barton, J. K. Science 1999, 283, 375.
4. Wan, C.; Fiebig, T.; Schiemann, O.; Barton, J. K.; Zewail, A. H. Proc. Natl. Acad.
Sci. U.S.A. 2000, 97, 14052.
5. Friedman, A. E.; Chambron, J.-C.; Sauvage, J.-P.; Turro, N. J.; Barton, J. K. J. Am.
Chem. Soc. 1990, 112, 4960.
6. Jenkins, Y.; Friedman, A. E.; Turro, N. J.; Barton, J. K. Biochemistry 1992, 32,
10809.
7. Turro, C.; Bossman, S. H.; Jenkins, Y.; Barton, J. K.; Turro, N. J. J. Am. Chem. Soc.
1995, 117, 9026.
8. Olson, E. J. C.; Hu, D.; Hormann, A.; Jonkman, A. M.; Arkin, M. R.; Stemp, E. D. A.;
Barton, J. K.; Barbara, P. F. J. Am. Chem. Soc. 1997, 119, 11458.
9. Arkin, M. R.; Stemp, E. D. A.; Holmlin, R. E.; Barton, J. K.; Hormann, A.; Olson, E. J.
C.; Barbara, P. F. Science 1996, 273, 475.
10. Stemp, E. D. A.; Holmlin, R. E.; Barton, J. K. Inorg. Chim. Acta 2000, 297, 88.
11. Stemp, E. D. A.; Arkin, M. R.; Barton, J. K. J. Am. Chem. Soc. 1995, 117, 2375.
12. Delaney, S.; Pascaly, M.; Bhattacharya, P. K.; Han, K.; Barton, J. K. Inorg.
Chem. 2002, 41, 1966.
13. Dickeson, J. E.; Summers, L. A. Aust. J. Chem. 1970, 23, 1023.
14. Waterland, M. R.; Gordon, K C.; McGarvey, J. M; Jayaweera, P. M. J. Chem. Soc.,
Dalton Trans. 1998, 609.
15. Sullivan, B. P.; Salmon, D. J.; Meyer, T. J. Inorg. Chem. 1978, 17, 3334.

127
16. Amouyal, E.; Homsi, A.; Chambron, J.-C.; Sauvage, J.-P. J. Chem. Soc., Dalton
Trans. 1990, 1841.
17. Anderson, P. A.; Deacon, G. B.; Haarmann, K. H.; Keene, F. R.; Meyer, T. J.;
Reitsma, D. A.; Skelton, B. W.; Strouse, G. F.; Thomas, N. C.; Treadway, J. A.;
White, A. H. Inorg. Chem. 1995, 34, 6145.
18. Holmlin, R. E.; Dandliker, P. J.; Barton, J. K. Bioconj. Chem. 1999, 10, 1122.
19. Cantor, C. R.; Warshaw, M. M.; Shapiro, H. Biopolymers 1970, 9, 1059.
20. Warshaw, M. M.; Tinoco, I. J. Mol. Bio. 1966, 1, 29.
21. Yoshikawa, Y.; Yamasaki, K. Coord. Chem. Rev. 1979, 28, 205.
22. Lincoln, P.; Tuite, E.; Nordén, B. J. Am. Chem. Soc. 1997, 119, 1454.
23. Franklin, S. J.; Treadway, C. R.; Barton, J. K. Inorg. Chem. 1998, 37, 5198.
24. Barton, J. K. Science 1986, 233, 727.
25. Kumar, C. V.; Barton, J. K.; Turro, N. J. J. Am. Chem. Soc. 1985, 107, 5518.
26. Stemp, E. D. A.; Arkin, M. R.; Barton, J. K. J. Am. Chem. Soc. 1997, 119, 2921.