chapter 4 results and discussions 4.1...
TRANSCRIPT
63
CHAPTER 4
RESULTS AND DISCUSSIONS
4.1 INTRODUCTION
The waste composition studies in Petaling Jaya (PJ) were conducted to determine the
rate of plastic waste generation, as well as, respondents‘ opinion to improve plastic
recycling. The analysis also focused on:
a) Waste composition especially plastic waste generated by householders
b) The respondents‘ attitudes and their perceptions towards recycling
c) The effects of demographics (i.e., age, race, education, family income, marital status),
as well as, other explanatory variables (i.e., family size, years living in the housing unit,
ownership status, and concern for recycling) on respondents‘ recycling activities (i.e.,
selling and reuse of plastic, and home separation activities) and the amounts of
household wastes.
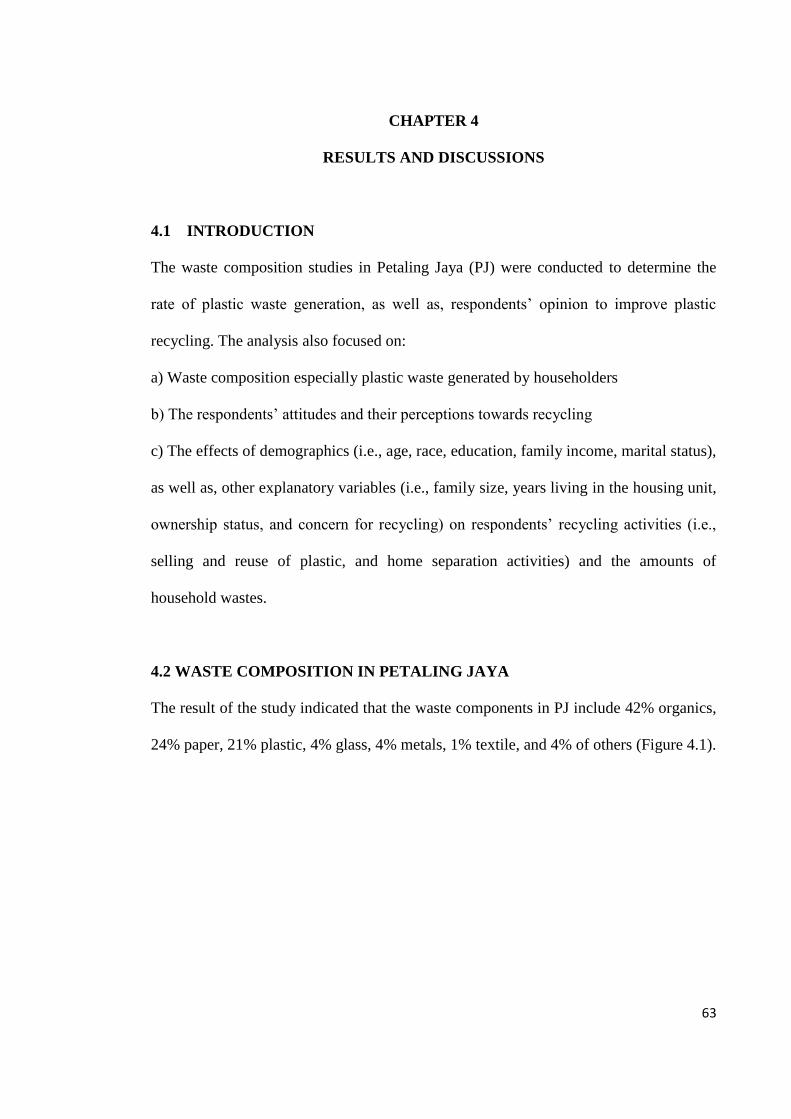
4.2 WASTE COMPOSITION IN PETALING JAYA
The result of the study indicated that the waste components in PJ include 42% organics,
24% paper, 21% plastic, 4% glass, 4% metals, 1% textile, and 4% of others (Figure 4.1).

64
Figure 4.1: Average Waste Component in PJ (% FW)
Organic waste constitutes the highest percentage of municipal solid wastes (MSW) in
PJ. This might be due to the habits of frequent cooking and quantity of left-over foods;
thus, organic waste contributes nearly half of the total waste stream. The results were
found to be similar to the previous findings that show that organic waste forms the
highest portion of the MSW stream (Mohamad et al., 2009; Agamuthu et al., 2004;
Fauziah et al., 2004; Mohd.Badruddin, 2004). Similarly, organic waste has been known
to be the core of waste components in developing countries like Malaysia, Cuba, and
etc. (Claudia and Mosler, 2007; Agamuthu et al., 2004; Fauziah et al., 2004). Organic
component is potentially suitable for conversion to compost. In Malaysia, composting is
marketable in landscaping and other agricultural sectors. Application of compost can
42%
24%
4%
4%
1%
21%
4%
Organic
Paper
Glass
Metal
Textile
Plastic
Other

65
reduce substantial cost in waste disposal (Agamuthu et al., 2004; Agamuthu, 2001;
Juzhar, 2002; Mohd. Nassir, 1996).
The second highest percentage of waste generated in PJ was paper, averaged at 24%.
This may be due to the purchasing power and lifestyle of people. Paper is widely used
in PJ which includes newspapers, magazines, reusable cardboard packages, and food
containers in fast-service restaurants. Therefore, the quantity of paper-based wastes
generated was also high. This is agreeable with findings in many rapidly developing
countries such as China (Ackerman, 2005). A comparison of paper-based wastes
generated in PJ in 2003 (Kathirvale et al., 2003) and the one from this study in 2011
showed no significant change in quantity ratio. This might be due to the fact there were
not much changes in the pattern of paper usage from 2003-2011.
Plastics were the third highest composition generated by household in PJ with 21% of
the total waste stream (Figure 4.1). The result of the study in PJ showed that around
42% of plastics in MSW is PET. Through observation and sampling plastic such as soft
drink and detergent bottles, food wrappings, ice cream boxes and others can be easily
separated from other waste components. Among the domestic users, plastic was
abundantly used because it can be obtained easily and it is cheap. As for PET usage, it is
highly favored since PET bottles have high strength against impact and they will not
break easily (Najafi et al., 2006; Omrani, 2005). The high percentage of plastic bottles
and packaging materials probably is due to its wide use in PJ area and the increasing
demand. The percentage of plastic waste is considered high (21%) and is typical of a
fast developing nation (Agamuthu, 2001). Though landfilling is the utmost method of
waste disposal in Malaysia, sending plastic waste to landfills not only caused a loss in

66
the economic value but also gave negative influence to the environmental wellbeing.
Therefore recycling of plastics should be encouraged as a step to improve on the
existing 5% level of recycling in Malaysia to a higher percentage.
Also, there is a significant variation over the quantity of plastic wastes generated in this
study (21%) when compared to quantity generated in 2003 (9%) from PJ (Figure 4.2)
(Kathirvale et al., 2003). This might be attributed to increased population, changes in
economic status, some attitudinal variation/ lifestyle etc.
0
10
20
30
40
50
60
Food Paper Plastic Glass Metal Textile Others
Percen
tage(%
)
2003
2011
Figure 4.2: Relative Comparison of Waste Composition (% FW) in PJ.
Source: Kathirvale et al., 2003.

67
From the waste composition study, PJ is one of the fastest developing urban areas in
Malaysia. The degree of waste generation is high due to associated residential and
industrial activities. The results indicated that MSW in PJ has a good recyclability
potential especially for plastics waste based on the total plastic percentage which is 21%
(Figure 4.1). The study indicated that though recycling activity in PJ is rising, yet
significant quantity of plastics (60%) are still dumped at the landfill sites. This is due to
insufficient attention from the authorities towards plastic recycling.
Basic background information of the survey respondents is discussed in the following
section.
4.3 INDEPENDENT FACTOR IN SURVEY
400 respondents between 20 to 55 years of age were interviewed and this consisted of
33% male and 67% female (Table 4.1).
Table 4.1: Frequency of Respondents‘ Gender in PJ Area
Frequency Percent
Valid Male 126 33.0
Female 255 67.0
Total 381 100.0
Missing System 6
Total 387
They were further categorized into students, housewives and workers. Ethnical group in
PJ area were 37% Malays, 43% Chinese, 17% Indian, and 3% others (Table 4.2).

68
Table 4.2: Frequency of Respondents‘ Ethnicity
Frequency Percent
Valid Malay 141 37.0
Chinese 163 43.0
Indian 67 17.0
Other 12 3.0
Total 383 100.0
Missing System 4
Total 387
Chinese residents formed the greater percentage of total respondents in the study area.
Table 4.3 summarized the background information of the respondents in the study area
based on the majority group (Appendix L).
Table 4.3: Brief Description of the Majority Group among Respondents
Area Age range Profession Income Education level
Petaling Jaya 20-55 Student
Employer
Housewife
Employee
RM 300-2000 SPM/STPM
and
tertiary education
69
The survey indicated a strong influence between income and waste quantities in PJ area.
Higher income groups tend to consume more products and thus generated more wastes
(Mohd.Badruddin, et al, 2006; Agamuthu, 2001, 1997; Mohd.Razman and Sabarinah,
1994; Mohd Nazri, 1994; Ahmad Termizi and Fadil, 1992). This study indicated that
respondents with big families and those who cooked more often at home generated
more wastes. The result disagrees with Kemper and Quigley (1976) who found
insignificant effect of family size on the waste amount generation. Some believe that
factors such as income, age and gender, as well as, housing and ownership did not
appear to be important explanatory variables in a study area (Mohd. Nazri, 1994;
Ahmad Termizi and Fadil, 1992; Rahim, 1992; Richardson and Havlicek, 1978; Wertz,
1976; Kemper and Quigley, 1976).
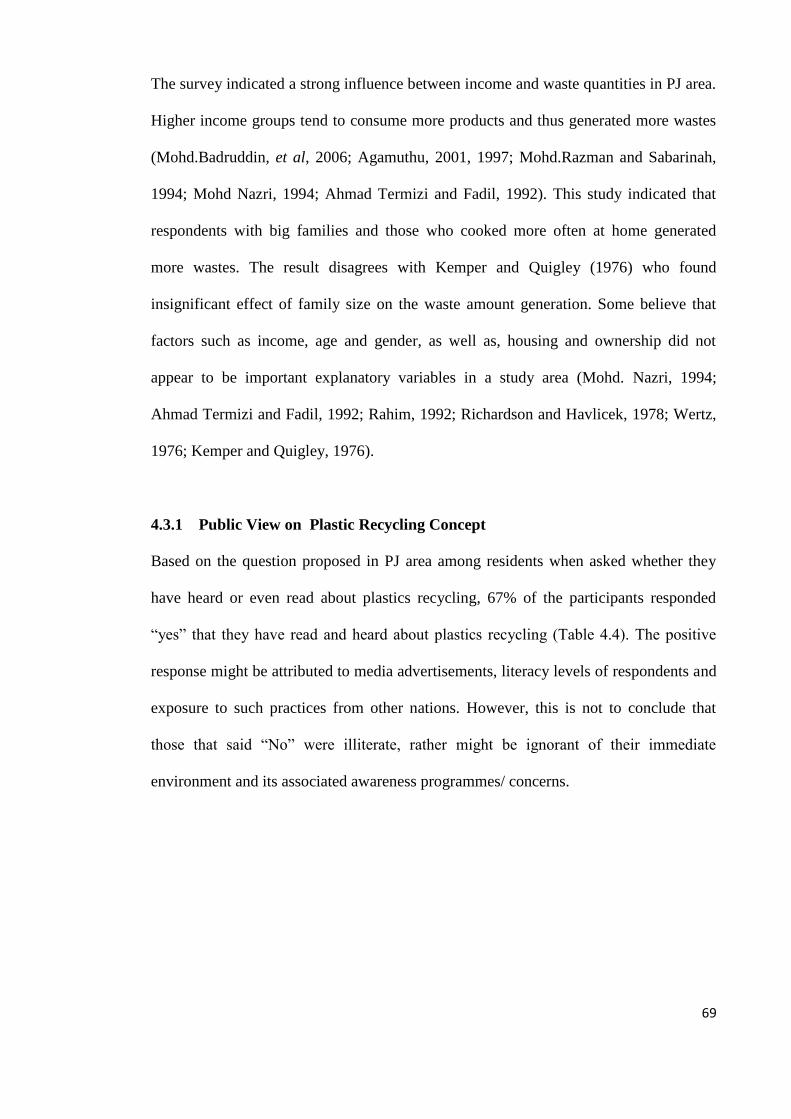
4.3.1 Public View on Plastic Recycling Concept
Based on the question proposed in PJ area among residents when asked whether they
have heard or even read about plastics recycling, 67% of the participants responded
―yes‖ that they have read and heard about plastics recycling (Table 4.4). The positive
response might be attributed to media advertisements, literacy levels of respondents and
exposure to such practices from other nations. However, this is not to conclude that
those that said ―No‖ were illiterate, rather might be ignorant of their immediate
environment and its associated awareness programmes/ concerns.
70
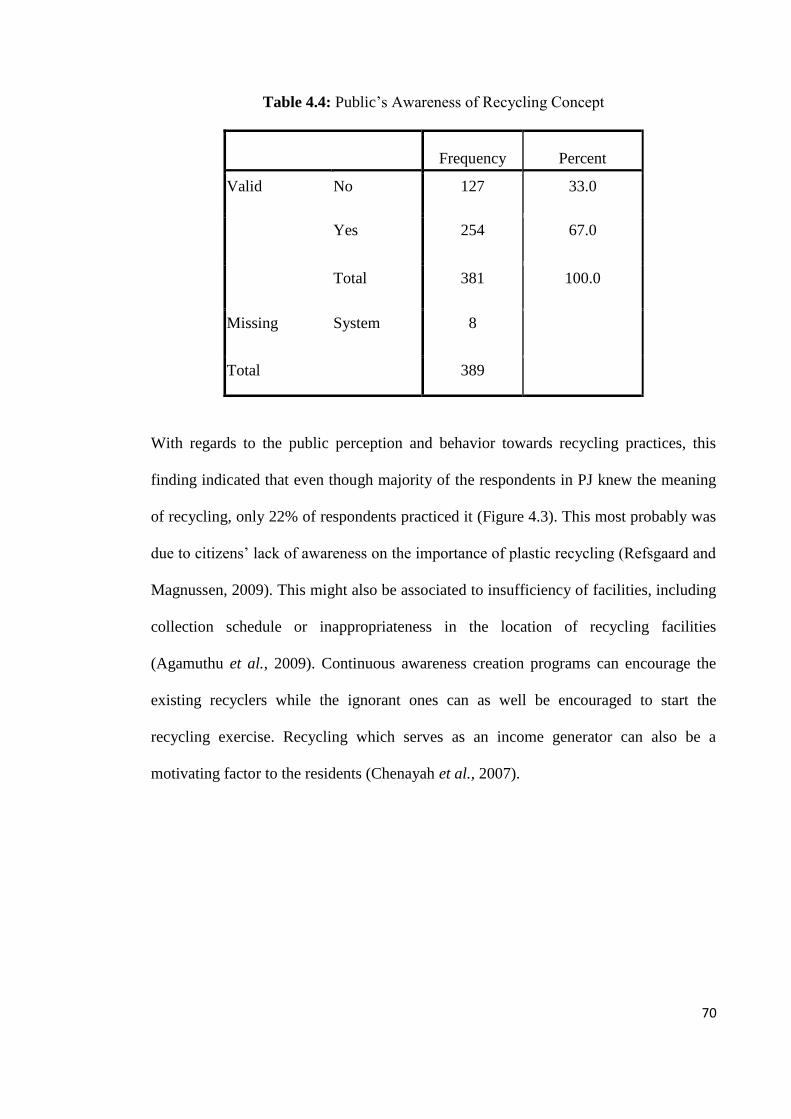
Table 4.4: Public‘s Awareness of Recycling Concept
Frequency Percent
Valid No 127 33.0
Yes 254 67.0
Total 381 100.0
Missing System 8
Total 389
With regards to the public perception and behavior towards recycling practices, this
finding indicated that even though majority of the respondents in PJ knew the meaning
of recycling, only 22% of respondents practiced it (Figure 4.3). This most probably was
due to citizens‘ lack of awareness on the importance of plastic recycling (Refsgaard and
Magnussen, 2009). This might also be associated to insufficiency of facilities, including
collection schedule or inappropriateness in the location of recycling facilities
(Agamuthu et al., 2009). Continuous awareness creation programs can encourage the
existing recyclers while the ignorant ones can as well be encouraged to start the
recycling exercise. Recycling which serves as an income generator can also be a
motivating factor to the residents (Chenayah et al., 2007).

71
Figure 4.3: Citizens‘ Involvement in Plastic Recycling in PJ
In accordance with the participants that know the meaning of recycling, it can be
inferred that majority had not heard or even read of plastic recycling from different
sources. Hence, the findings showcased newspapers as the main source of information
for about 35% of respondents. Table 4.5 detailed the respondents‘ various sources of
obtaining information about recycling.

72
Table 4.5: Sources of Information on Recycling
Frequency Percentage
Valid Newspapers 132 35.0
Magazines 43 12.0
TV 108 29.0
Radio 50 13.0
Leaflet drops 32 9.0
Other 9 2.0
Total 374 100.0
Missing System 15
Total 389
The result of the study indicated that on average, 55% of respondents knew about
plastic recycling through advertisements in the newspapers, magazines and leaflet
drops, namely of reading material. About 42% of the respondents pointed out that
television and radio advertising are the best way of getting information on plastic
recycling. The rest of the respondents (2%) pointed out that they got information about
recycling via billboards and advertisement in buses and LRT stations. They may be
getting the information while using the public transport. Similarity, they might have
gotten informed via witnessing open campaign programmes or road shows. However,
integrated use of all media can increase public participation which is agreeable with
Abdelnaser et al (2006a).

73
The liner regression was used to test and show the degree that family size, marital status
and occupation can predict the getting information about plastic recycling. The
summary of results is provided in Table 4.6. The analysis indicated that family size is
statistically significant predictor of getting information about plastic recycling in the
population (B=0.615, t = 4.343, p< 0.05, R2 Adjusted = 0.358). It means that about 39%
of the variance in getting information about plastic recycling can be explained by family
size in the population.
Table 4.6: Relationship between Family Size and Getting Information about Recycling
Variable
IV Beta t-test Sig
Family size 0.62 4.34 0
R2 0.38
Adjusted R2 0.36
Liner regression was used to test and show the degree that occupation can predict the
getting information about plastic recycling. The summary of results is provided in Table
4.7. The analysis indicated that occupation is a statistically significant predictor of
getting information about plastic recycling in the population, (B= 0.591, t = 4.081,
p<0.05, R2 Adjusted = 0.329. About 32% of the variance in getting information about
recycling can be explained by occupation in the population.

74
Table 4.7: Relationship between Occupation and Getting Information about Recycling
Variable
IV Beta t-test Sig
Occupation 0.591 4.081 0
R2 0.350
Adjusted R2 0.329
It means that residents with occupation that have big family size tend to be more
interested in getting information on the recycling of plastics. The result showed that
citizens with different types of occupation have different willingness to get information
from different sources. Employers and students are more willing to get information
from the newspaper while also housewives are more often get information from TV
programmes and magazine. In contrast to mentioned group (employer, student and
housewife), employees prefer to get information about plastic recycling via radio. This
might be due to the nature of their job which does not give them enough time for
reading or watching magazine, newspaper and TV programmes. Other parameters such
as education, income and marital status have no significant effect on getting information
about plastic recycling from a different source. The reason might be based on the
lifestyle and behaviours of the respondents in PJ area.
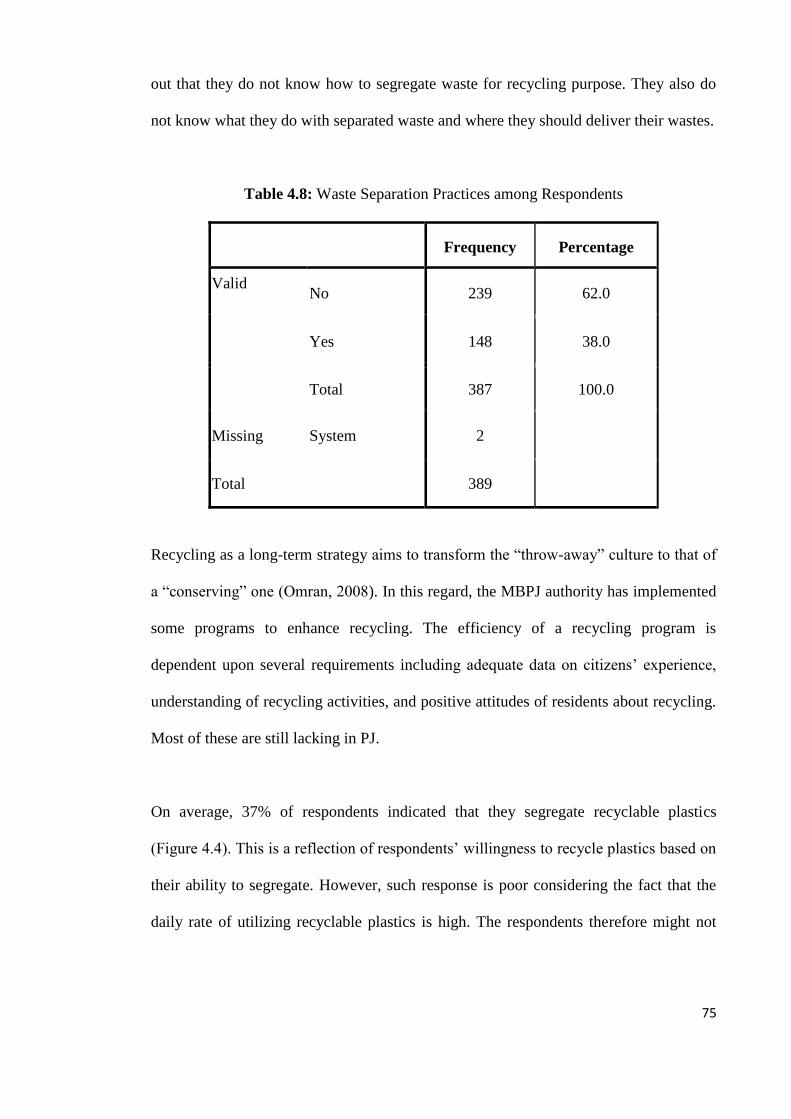
4.3.2 Actual Recycling Activities
This study indicated that 38% of respondent segregate recyclable materials. Majority of
respondents (62%) did not separate their wastes (Table 4.8). These respondents point
75
out that they do not know how to segregate waste for recycling purpose. They also do
not know what they do with separated waste and where they should deliver their wastes.
Table 4.8: Waste Separation Practices among Respondents
Frequency Percentage
Valid No 239 62.0
Yes 148 38.0
Total 387 100.0
Missing System 2
Total 389
Recycling as a long-term strategy aims to transform the ―throw-away‖ culture to that of
a ―conserving‖ one (Omran, 2008). In this regard, the MBPJ authority has implemented
some programs to enhance recycling. The efficiency of a recycling program is
dependent upon several requirements including adequate data on citizens‘ experience,
understanding of recycling activities, and positive attitudes of residents about recycling.
Most of these are still lacking in PJ.
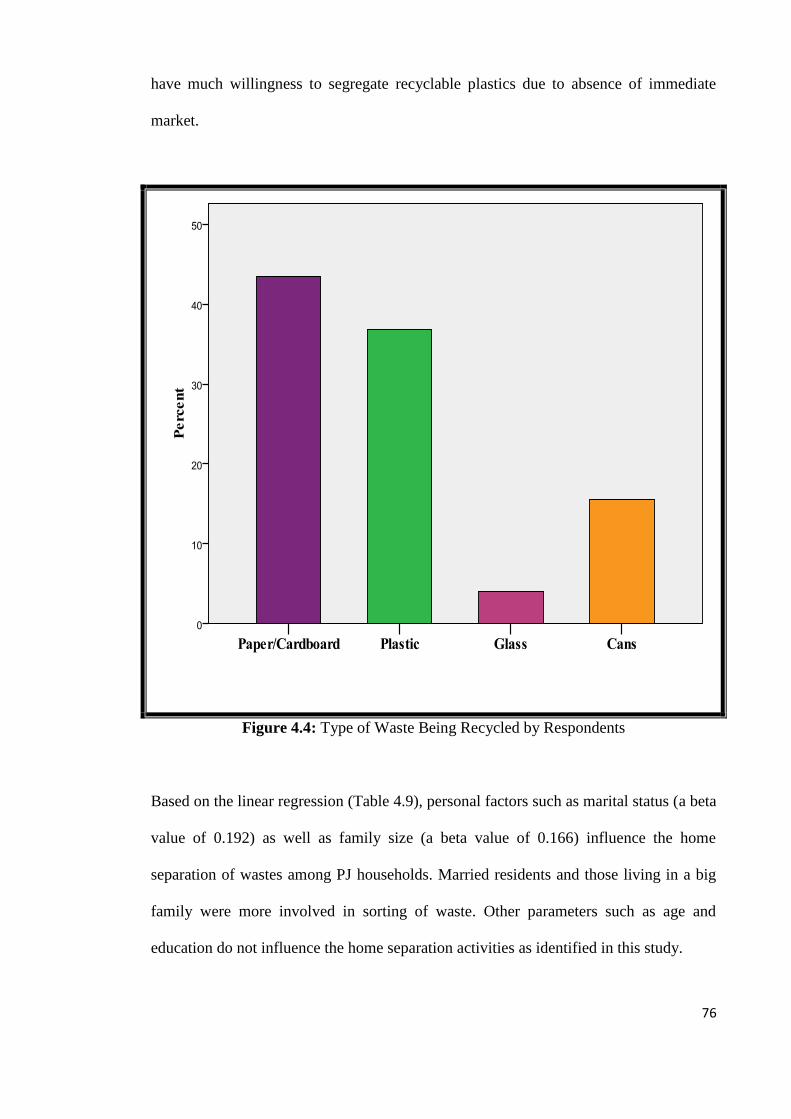
On average, 37% of respondents indicated that they segregate recyclable plastics
(Figure 4.4). This is a reflection of respondents‘ willingness to recycle plastics based on
their ability to segregate. However, such response is poor considering the fact that the
daily rate of utilizing recyclable plastics is high. The respondents therefore might not
76
have much willingness to segregate recyclable plastics due to absence of immediate
market.
Figure 4.4: Type of Waste Being Recycled by Respondents
Based on the linear regression (Table 4.9), personal factors such as marital status (a beta
value of 0.192) as well as family size (a beta value of 0.166) influence the home
separation of wastes among PJ households. Married residents and those living in a big
family were more involved in sorting of waste. Other parameters such as age and
education do not influence the home separation activities as identified in this study.

77
Table 4.9: Descriptive Statistics on Home Separation of Wastes in PJ
Model
Unstandardized
Coefficients
Standardized
Coefficients
t Sig. B Std. Error Beta
1 (Constant) -0.556 .105 -5.286 .000
Marital Status .175 .039 .192 4.527 .000
Family size .115 .029 .166 3.913 .000
4.3.3 Recycling Issues and Solutions
When respondents were asked to give the best description of why citizens did not
participate in recycling activities, 39% of the respondents indicated that the level of
public awareness on recycling activates can be the main reason of their non-
participation in plastic recycling (Table 4.10). This agrees with Imam et al. (2007) that
opined that the public can play important role in promoting efficient, financially sound
and technically competitive recycling activities. This is where a more active
participation is required. The respondents in this study agreed that an appropriate public
awareness and participation is required for the enhancement of collection and sorting of
recyclable plastic.
78
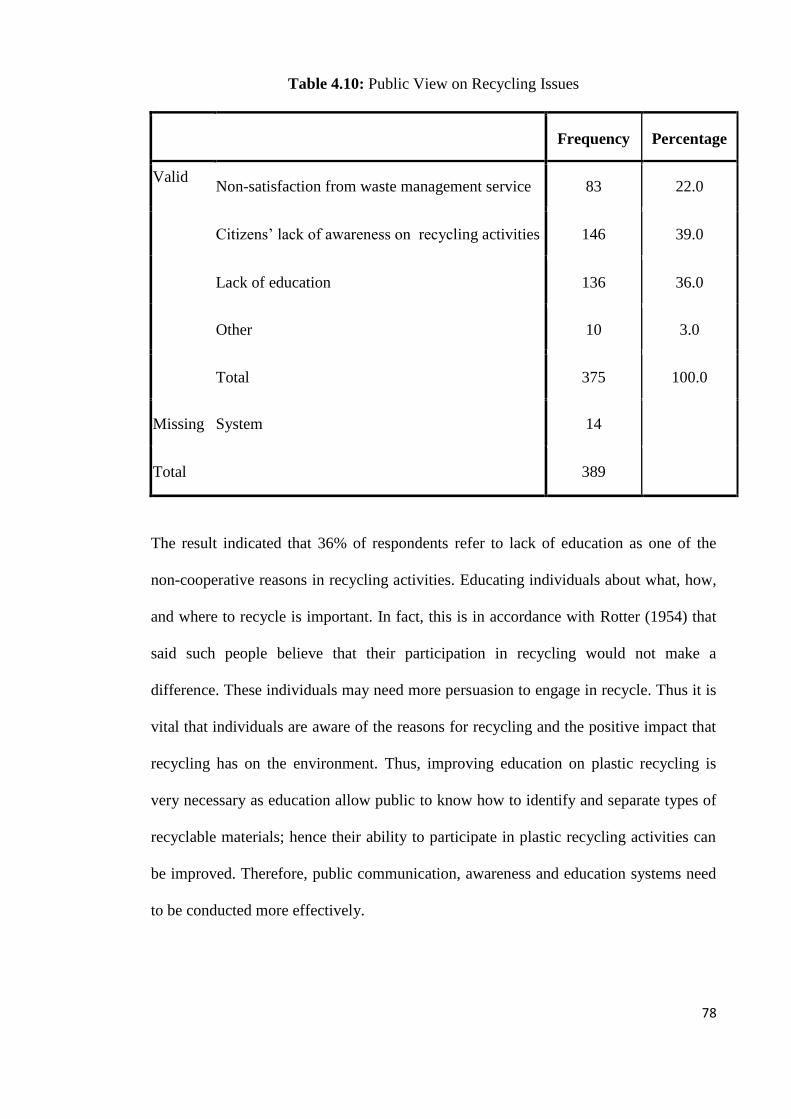
Table 4.10: Public View on Recycling Issues
Frequency Percentage
Valid Non-satisfaction from waste management service 83 22.0
Citizens‘ lack of awareness on recycling activities 146 39.0
Lack of education 136 36.0
Other 10 3.0
Total 375 100.0
Missing System 14
Total 389
The result indicated that 36% of respondents refer to lack of education as one of the
non-cooperative reasons in recycling activities. Educating individuals about what, how,
and where to recycle is important. In fact, this is in accordance with Rotter (1954) that
said such people believe that their participation in recycling would not make a
difference. These individuals may need more persuasion to engage in recycle. Thus it is
vital that individuals are aware of the reasons for recycling and the positive impact that
recycling has on the environment. Thus, improving education on plastic recycling is
very necessary as education allow public to know how to identify and separate types of
recyclable materials; hence their ability to participate in plastic recycling activities can
be improved. Therefore, public communication, awareness and education systems need
to be conducted more effectively.
79
The remaining 22% of respondents were dissatisfied with the waste management
services (WMS).
On average 78% of respondent were satisfied with the WMS. This indicated that
satisfaction with WMS can be one of the factors of public cooperation in recycling plan.
The citizens with high satisfaction with WMS can cooperate in recycling plan
voluntarily. Citizens‘ lack of confidence in WMS resulted with lack of cooperation in
waste collection services. It might be as a result of improper methodology in the WMS
to increase public awareness over the past years. If the citizens are not satisfied with the
WMS, it might be difficult to convince the public to participate in the recycling activity.
Liner regression was used to test and show the degree that education can predict the
public attitude toward plastic recycling. The summary of results is provided in the Table
4.11. The analysis indicated that education statistically significant predictor of the
public attitude toward plastic recycling in the population, (B= 0.410, t = 2.417, p<0.05,
R2 Adjusted= 0.139. About 13% of the variance in the attitude toward recycling can be
explained by education in the population.

80
Table 4.11: Relationship between Education and Attitude toward Recycling
Variable
IV Beta t-test Sig
Education 0.410 2.417 0.022
R2 0.168
Adjusted R2 0.139
Liner regression was used to test and show the degree marital status can predict the
attitude toward recycling. The summary of results is provided in Table 4.12. The
analysis indicated that marital status is statistically significant predictor of the attitude
toward recycling in the population, (B =0.616, t = 4.216, p<0.05, R2 Adjusted=0.359).
About 35% of the variance in the attitude toward recycling can be explained by marital
status in the population.
Table 4.12: Relationship between Marital Status and the Attitude toward Recycling
Variable
IV Beta t-test Sig
Marital status 0.616 4.216 0
R2 0.380
Adjusted R2 0.359
81
It means that residents who are highly educated show more interest in plastics recycling.
Thus, positive attitude towards recycling is closely related to the increased level of
education. This study showed that highly educated groups can understand the
necessities of certain action easily as compared to the less educated group (Irina et al.,
2004). Similar finding is obtained between participation in recycling and marital status,
where married respondents are more positive towards recycling as compared to the not
married respondents. Other parameters such as occupation, race and family size have no
significant effect on the public attitude toward plastic recycling.
The respondents were also asked of their opinions on how public participation in
recycling can be improved. The majority of respondents agreed that more facilities need
to be provided and also monetary incentives can encourage recycling participation. In
fact, recycling group should be encouraged by monetary incentives and more effort is
needed to educate the people on the need and importance of recycling.
Based on the study, respondents when asked on ways to encourage the public to recycle
suggested that providing more user friendly facilities can encourage public participation
in recycling. Generally the perception was that recycling information is easily available
and that sufficient and user friendly recycling facilities is important to make recycling a
success (Agamuthu et al., 2009).
When asked whether they will recycle in the future, if all facilities are provided, 86% of
the respondents said that they would participate (Table 4.13).

82
Table 4.13: Respondents‘ Willingness to recycle if Recycling Facilities are provided
Frequency Percentage
Valid No 52 14.0
Yes 329 86.0
Total 382 100.0
Missing System 7
Total 389
Therefore, available facilities can increase public willingness to participate in recycling
activities (Agamuthu and Fauziah, 2007). Furthermore, public opinions and attitudes
have been cited to be an important part of an effective recycling program (Lokman and
Fadil, 1992; Anderson, 1999). In the case of PJ, there is an urgent need for an improved
public attitude. Creating public awareness will overcome problem on the general belief
held by the public that it is the government‘s responsibility to ensure cleanliness
(Gohari, 2007; Bontoux et al., 1996). This public participation concurs with study by
Thomas (2001) which emphasized the importance of public understanding in enhancing
participation rate. The planning and designing of future recycling systems may be made
easier if a clear understanding of the public expectations and perceptions of institutional
practices is achieved, as well as, the pattern of waste generation and composition.
When asked about the future of recycling in Malaysia, approximately 84% of the
respondents generally agreed that Malaysia can achieve the recycling target of 22% by
2020 (Table 4.14).

83
Table 4.14: Respondent Agreement on the Achievement of 22% Recycling in 2020
Frequency Percentage
Valid strongly agree 24 6.0
Agrees 301 78.0
Disagree 44 11.0
Strongly disagree 18 5.0
Total 387 100.0
Missing System 2
Total 389
This is based on the perceived willingness of citizens to embank on source separation.
They agreed that the level of plastic recycling in Malaysia will increase in future. Only
16% of the respondents disagreed with this perception. This small group of the
respondents disagreed that the existing level of recycling in Malaysia is high and have
negative view about improvement of plastic recycling in the future. They pointed out
that the existing low consciousness for recycling will be the main factor, as well as, the
lack of government efforts.
4.3.4 Factors that Influenced Citizen’s Participation in Plastic Recycling
Participation of citizens can improve recycling activities. There are many reasons that
affect citizens‘ non-cooperation towards plastic recycling. With regards to the survey in
PJ, two main obstacles namely, government inability to provide basic facilities and the
public ignorance themselves were identified. Citizens normally expect provision of
84
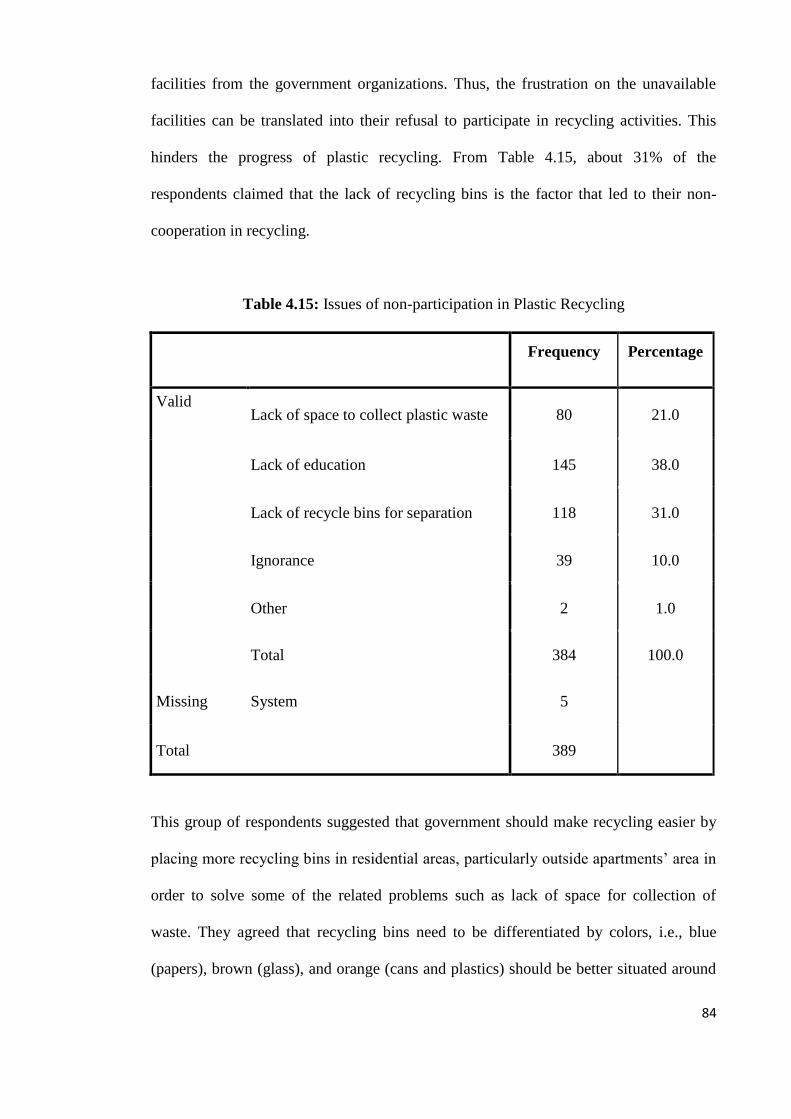
facilities from the government organizations. Thus, the frustration on the unavailable
facilities can be translated into their refusal to participate in recycling activities. This
hinders the progress of plastic recycling. From Table 4.15, about 31% of the
respondents claimed that the lack of recycling bins is the factor that led to their non-
cooperation in recycling.
Table 4.15: Issues of non-participation in Plastic Recycling
Frequency Percentage
Valid Lack of space to collect plastic waste 80 21.0
Lack of education 145 38.0
Lack of recycle bins for separation 118 31.0
Ignorance 39 10.0
Other 2 1.0
Total 384 100.0
Missing System 5
Total 389
This group of respondents suggested that government should make recycling easier by
placing more recycling bins in residential areas, particularly outside apartments‘ area in
order to solve some of the related problems such as lack of space for collection of
waste. They agreed that recycling bins need to be differentiated by colors, i.e., blue
(papers), brown (glass), and orange (cans and plastics) should be better situated around
85
the city. When respondents who are interested in recycling have bins near to their home,
they appear to be willing to recycle more fractions than when they have to walk for a
longer time to drop off the waste, due to the inconvenience of carrying the large
volumes of waste this type usually occupies.
The small group of respondent in PJ with 21% refers to the lack of space to accumulate
waste as another factor for not recycling. Due to the lack of space in apartment
residency, separation and collection of the recyclable waste is a problem. Although
there is awareness of environmental issues, 10% of respondents ignore it. This group of
respondents indicated that inconvenience as the reason for their non-participation. It is
also interesting to note that a smaller percentage (1%) of the non-participating
respondents indicated that they believed that recycling only waste time (Omran et al.,
2009).
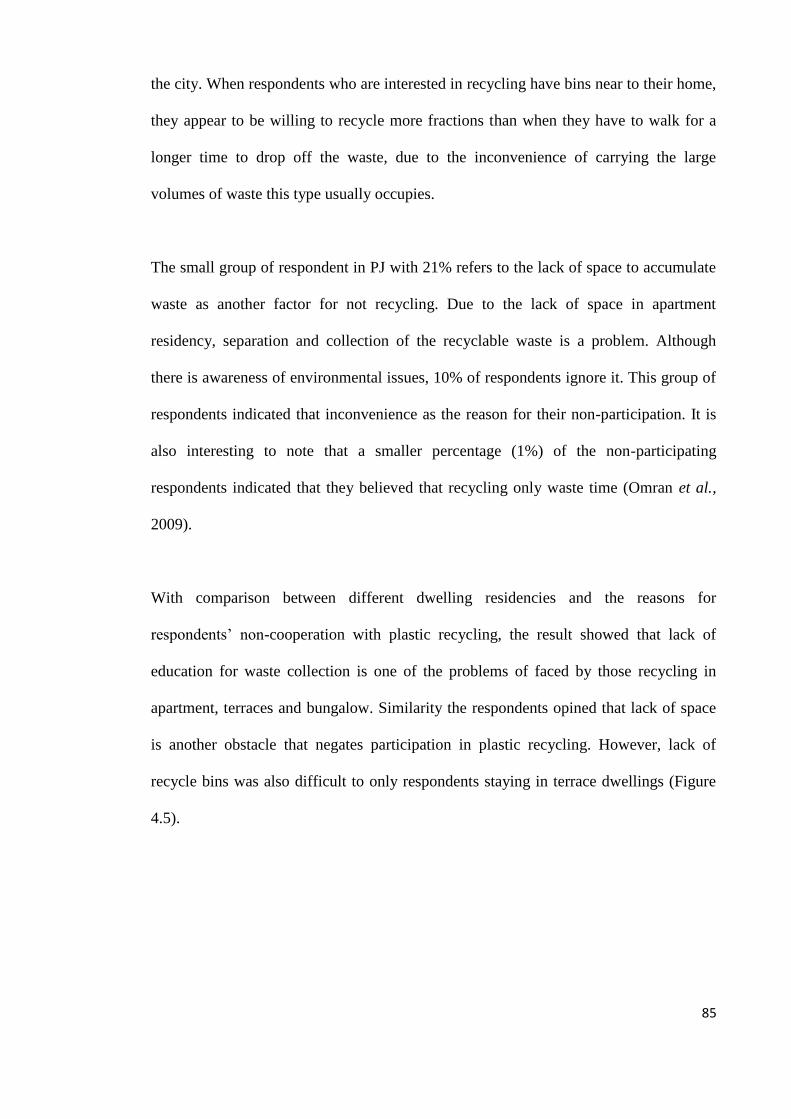
With comparison between different dwelling residencies and the reasons for
respondents‘ non-cooperation with plastic recycling, the result showed that lack of
education for waste collection is one of the problems of faced by those recycling in
apartment, terraces and bungalow. Similarity the respondents opined that lack of space
is another obstacle that negates participation in plastic recycling. However, lack of
recycle bins was also difficult to only respondents staying in terrace dwellings (Figure
4.5).
86
Figure 4.5: Relationship between Diverse Dwelling and Issues Related to Plastic
Recycling
Length of stay has influence over residents‘ cooperation in recycling activities in the
study areas. The result of regression linear test (Table 4.16) indicated that those who
have been staying their homes for a longer period of time tend to be active cooperators
in recycling, particularly in recycling of plastic and home separation of wastes. The
significant level is high, in the case of selling of plastic waste among PJ residents (a
beta value of -0.112), with a p value < 0.05, i.e., significant at 95 percent confidence
level. Respondents with high income have more cooperation to recycle plastic. Unlike

87
the correlations on the length of stay and income with residents‘ cooperation, types of
dwelling have no significant relationship with residents‘ cooperation.
Table 4.16: Plastic Recycling with Period of Tenure
Model
Unstandardized
Coefficients
Standardized
Coefficients
t Sig. B Std. Error Beta
1 (Constant) 1.849 .349 5.302 .000
dwelling -.059 .049 -.062 -1.205 .229
Income .161 .074 .111 2.155 .032
Length of Stay -.074 .034 -.112 -2.173 .030
The finding of this study is also supported by Read (1998) who proved that the success
of a recycling scheme depends largely on the public‘s participation. It also availed the
need to understand the respondents‘ frequency of plastic collection which actually
buttresses the participation.
4.3.5 The Frequency of Plastic Collection
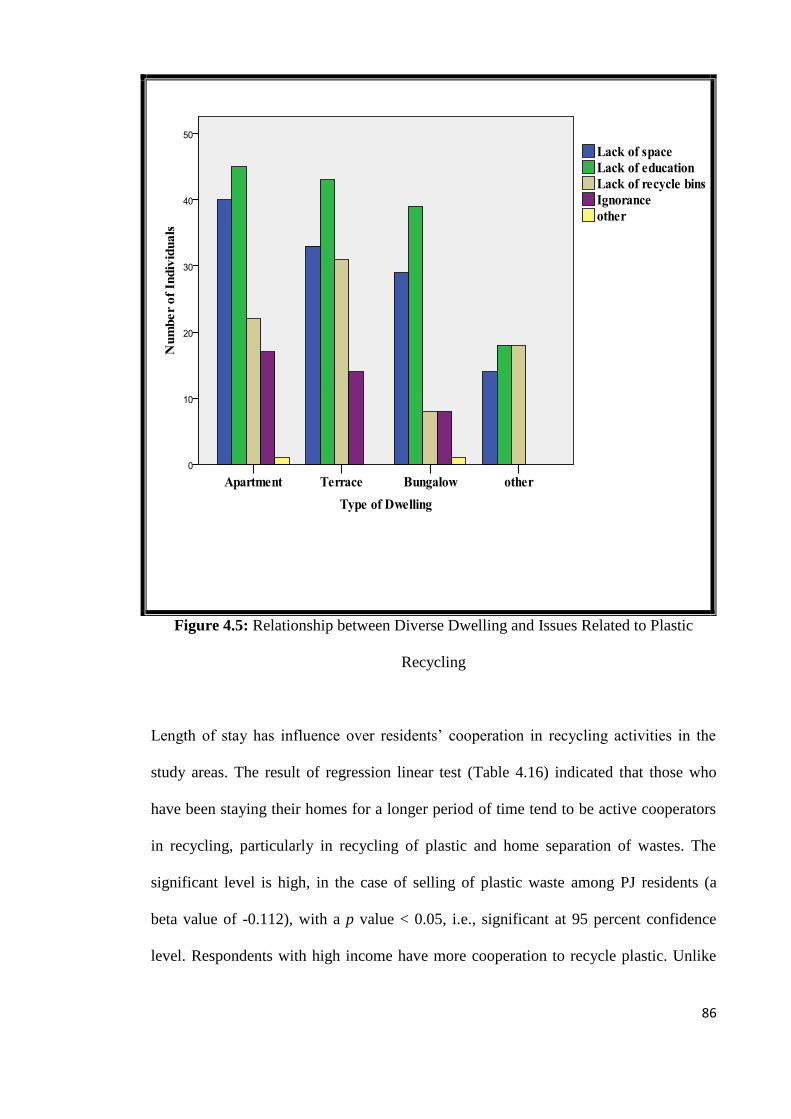
The result of the study in PJ indicated that 46% of respondents who are employees and
students preferred collection of recyclables once a week (Table 4.17). Both groups
(employees and students) claimed that they do not have enough time to deliver
recyclable waste during the week; hence they preferred collection of recyclables once a
week rather than daily collection. This might be due to the nature of their job which
does not give them enough time to observe day-day recycling activity.
88
Table 4.17: Preference of Plastic Waste Collection Frequency
Frequency Percentage
Valid Once a week 177 46.0
Twice a week 106 28.0
Three times a week 76 20.0
Every day 14 4.0
Other 9 2.0
Total 382 100.0
Missing System 7
Total 389
About 28% of respondents particularly apartment residents, housewives and those living
in a big family preferred twice a week collection of plastic waste. This group of
respondents pointed that keeping the recyclable waste for a long time at home is very
difficult because recyclable wastes such as PET bottles take huge space. For this reason,
they suggested that their recyclable waste is better to be collected as frequent as
possible.
The smallest group of respondents (20%) preferred thrice a week collection. This group
of respondents noted that more frequent collection tends to increase recycling intensity.
They suggested that they can collect more plastic materials to get more incentives fees.
However, it seems that plastic collection three times a week is difficult because of the

89
cost (labor and transportation). It is important to minimize the travel times and distances
of the collection and transferring vehicles in order to improve cost efficiency.
The remaining respondents‘ (4%) preferred day to day collection of recyclable waste.
Hence, this result agrees with Hormuth et al. (1993) and Zimmerman (1989) that
supported provision of daily collection facilities to enhance day-to-day collection of
recyclable materials which includes plastics.
Therefore, it can be deduced that recycling program may be used to reduce the cost of
waste disposal. However, the revenue obtained from the implementation of recycling
may fluctuate with the market price of recyclables such as plastic, paper, metal and
others with high revenue generation potential (Agamuthu et al., 2009).
4.3.6 The Control of Plastic Waste Generation
The public needs complete and clear information regarding the trends in waste
generation, as well as, benefits and effects of source reduction, recycling and reuse.
Recycling behaviors and household waste generating behaviors are necessary for
designing and planning an effective plastic material reduction from MSW in the near
future.
People‘s participation in 3Rs initiative is anticipated to function in an integrated
manner. The result of the study on waste generation control in PJ indicated that
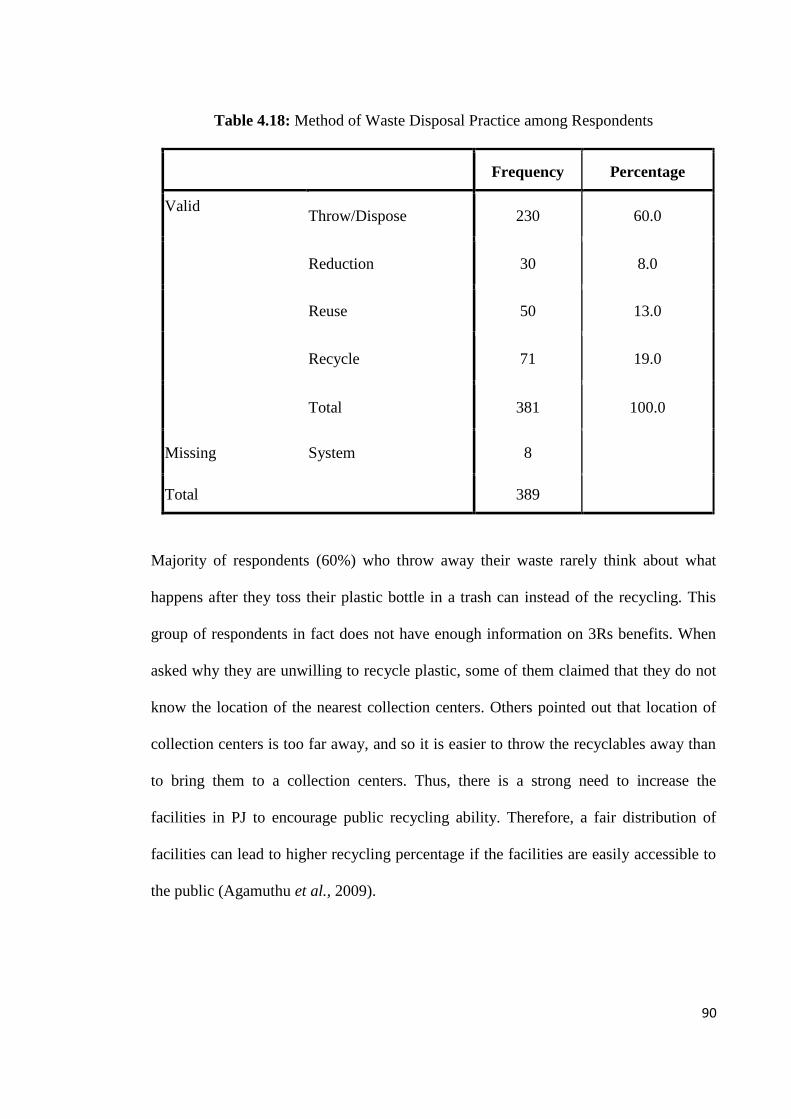
majority of respondents (60%) preferred to throw away their waste. However, in PJ,
13% of respondents reuse their products, whereas 19% of respondents recycled their
wastes. Only 8% of them prefer reduction (Table 4.18).
90
Table 4.18: Method of Waste Disposal Practice among Respondents
Frequency Percentage
Valid Throw/Dispose 230 60.0
Reduction 30 8.0
Reuse 50 13.0
Recycle 71 19.0
Total 381 100.0
Missing System 8
Total 389
Majority of respondents (60%) who throw away their waste rarely think about what
happens after they toss their plastic bottle in a trash can instead of the recycling. This
group of respondents in fact does not have enough information on 3Rs benefits. When
asked why they are unwilling to recycle plastic, some of them claimed that they do not
know the location of the nearest collection centers. Others pointed out that location of
collection centers is too far away, and so it is easier to throw the recyclables away than
to bring them to a collection centers. Thus, there is a strong need to increase the
facilities in PJ to encourage public recycling ability. Therefore, a fair distribution of
facilities can lead to higher recycling percentage if the facilities are easily accessible to
the public (Agamuthu et al., 2009).
91
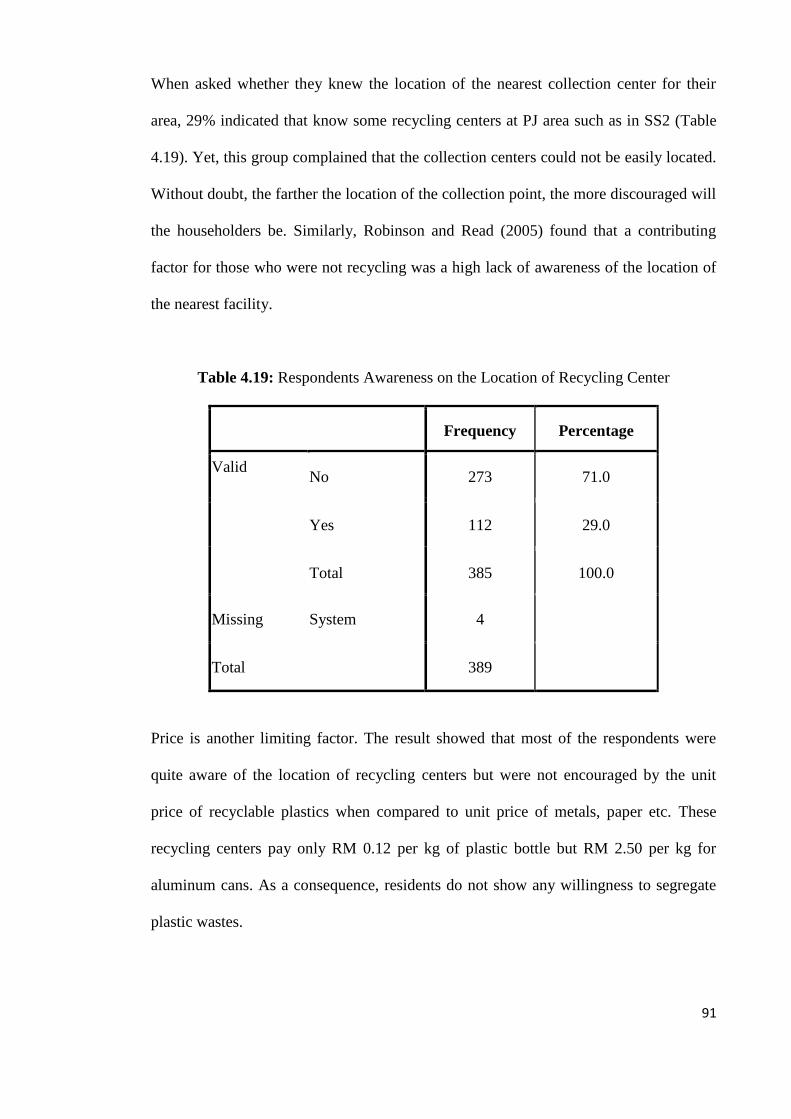
When asked whether they knew the location of the nearest collection center for their
area, 29% indicated that know some recycling centers at PJ area such as in SS2 (Table
4.19). Yet, this group complained that the collection centers could not be easily located.
Without doubt, the farther the location of the collection point, the more discouraged will
the householders be. Similarly, Robinson and Read (2005) found that a contributing
factor for those who were not recycling was a high lack of awareness of the location of
the nearest facility.
Table 4.19: Respondents Awareness on the Location of Recycling Center
Frequency Percentage
Valid No 273 71.0
Yes 112 29.0
Total 385 100.0
Missing System 4
Total 389
Price is another limiting factor. The result showed that most of the respondents were
quite aware of the location of recycling centers but were not encouraged by the unit
price of recyclable plastics when compared to unit price of metals, paper etc. These
recycling centers pay only RM 0.12 per kg of plastic bottle but RM 2.50 per kg for
aluminum cans. As a consequence, residents do not show any willingness to segregate
plastic wastes.
92
Increased in price of recyclable plastics can help the council (MBPJ) to encourage waste
management contractors to collect plastics from the plastic stream for recycling
purpose. Apart from this, residents will be able to obtain a sizeable supplementary
income by selling recyclable items to MBPJ. MBPJ should not only focus on providing
facilities but also on awareness creation too. However, awareness creation without easy
accessibility to the facilities is not rational. Therefore, a rational strategy should involve
increase in the number of recycling facilities, as well as, simultaneous awareness
creation.
The respondents were also asked of their opinions on how the situation could be
improved. The majority of respondents (76%) suggested citing of local collection
centers which are within the reach for each community or housing area. Some opined
that if the number of these centers, as well as, payment for plastic increases, it can
prompt the residents to easily deliver their plastic materials. Majority of respondents
with 80 % pointed out that they were not aware of the existences of recycling centers.
The result agrees with whose of Nyamwange (1996) which stated that making recycling
more convenient could be an effective motivator. About 19% of the respondents prefer
recycling to control waste generation.
The respondents believed that segregation at point source can increase the percentage of
recyclable waste. Definitely, they might have believed and experienced that once the
waste are segregated at the point generation, it makes collection of recyclable plastics
easier. This help to extract all the plastics that are sent to landfills when waste is not
segregated. Waste separation is the key activity in any successful 3R initiative. It is also
worthy to note the importance of recycling industries or buyers in recycling wastes.

93
Findings indicated that the best management option for solid waste in PJ area is the
integration of all options in waste management hierarchy but with strong emphasis on
recycling. This option not only will reduce the waste management cost but will also
serve as revenue generator from the marketable products (Chenayah et al., 2007).
Similar study had shown that plastic recycling application reduce the cost of plastic
waste disposal (Agamuthu et al., 2009).
Approximately 13% of the respondents agreed that reuse option can reduce waste
generation. This group of respondents suggested that the best possible way of reducing
waste is through reuse of products. Citizens should be aware of the dangers of abundant
plastic waste to the environment. Therefore, reuse is preferable since plastic bottles can
be kept for their own use such as to be refilled with self-made juice and other drinks.
When long lasting goods are reused times and again, it offsets the production of new or
same products. This saves new resources and reduces waste generation.
Another group of respondents (8%) preferred reduction of waste as one of the methods
of waste generation control. Purchase and careful use of resources can reduce the pace
of consumption of resources and energy (Shimizu, 2006). However, 28% of total
respondents recommended that the best way of reducing plastic is by using high quality
products (Table 4.20). Thus, it can be concluded that reuse of plastic materials and the
use of high quality products can reduce waste generation. Some of the respondents
believed that giving up past habits of unnecessary purchasing (the more purchasing as
the sign of high culture) can help to reduce waste generation.

94
Table 4.20: Respondents‘ Opinion on Best Solution to Reduce Plastic Waste
Generation
Frequency Percentage
Valid Use of high quality products 109 28.0
Reuse of products 189 49.0
Giving up past habits 47 12.0
Not wasting 20 5.0
Other 22
6.0
Total 387 100.0
Missing System 2
Total 389
When asked whether they use their own recycled bags for shopping in market, about
37% of the respondents indicated that they use their own baskets in market when they
go for shopping. Since they are aware of the importance of recycling of plastic, they
prefer to carry their own basket in order to reduce the rate of the plastic bags in
environment. Also, they believed that everyone should be responsible to protect the
environment.
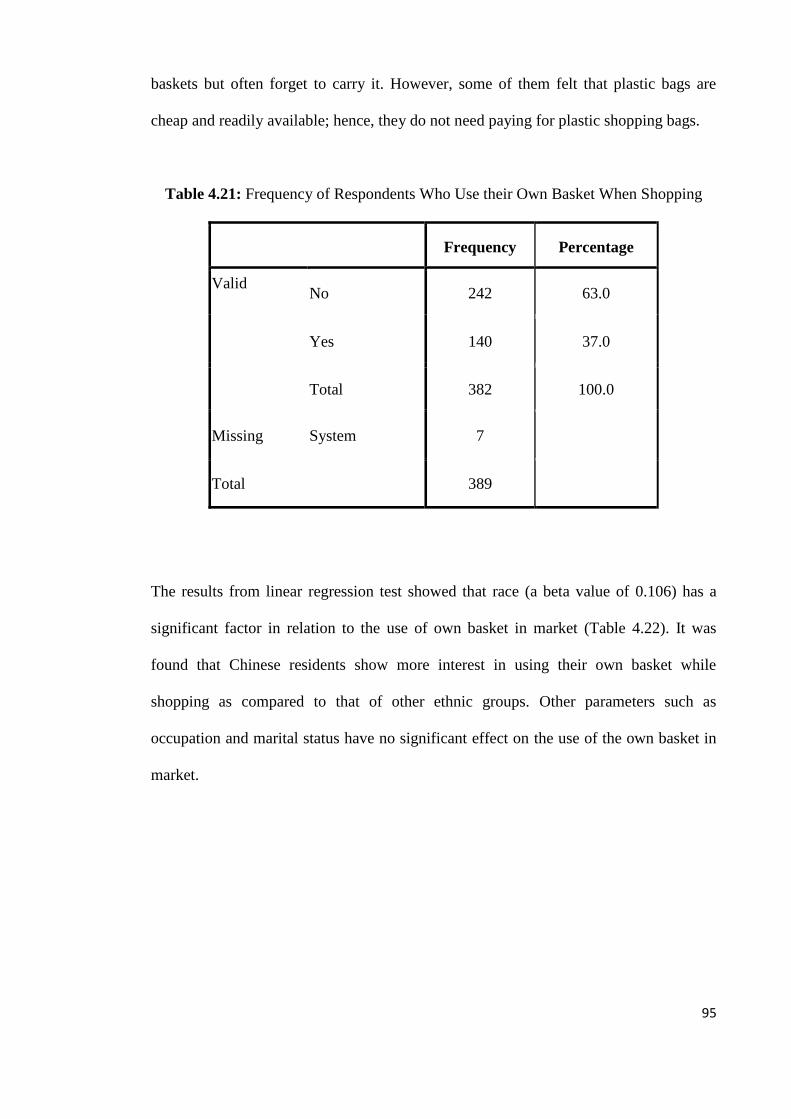
In contrast with the above mentioned group, another 63% of the respondents did not use
their own basket while shopping (Table 4.21). They pointed out some reasons for not
using of their own baskets. Some of them pointed out that they want to use their own
95
baskets but often forget to carry it. However, some of them felt that plastic bags are
cheap and readily available; hence, they do not need paying for plastic shopping bags.
Table 4.21: Frequency of Respondents Who Use their Own Basket When Shopping
Frequency Percentage
Valid No 242 63.0
Yes 140 37.0
Total 382 100.0
Missing System 7
Total 389
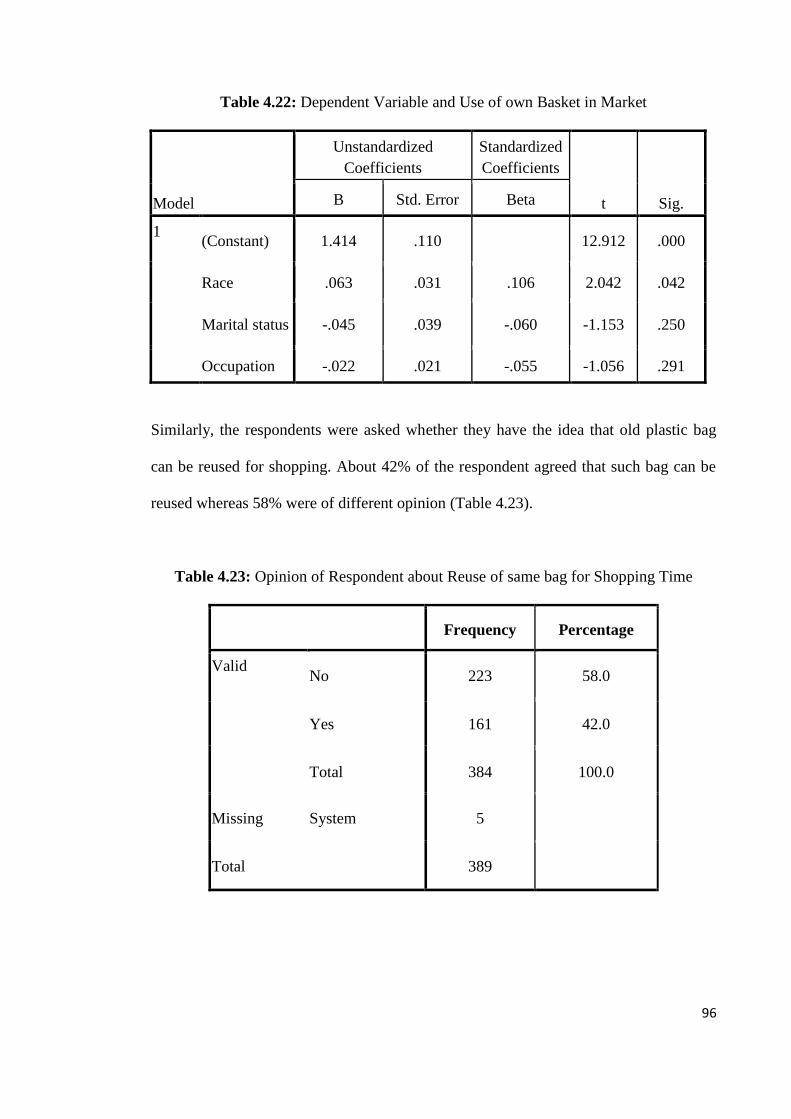
The results from linear regression test showed that race (a beta value of 0.106) has a
significant factor in relation to the use of own basket in market (Table 4.22). It was
found that Chinese residents show more interest in using their own basket while
shopping as compared to that of other ethnic groups. Other parameters such as
occupation and marital status have no significant effect on the use of the own basket in
market.
96
Table 4.22: Dependent Variable and Use of own Basket in Market
Model
Unstandardized
Coefficients
Standardized
Coefficients
t Sig. B Std. Error Beta
1 (Constant) 1.414 .110 12.912 .000
Race .063 .031 .106 2.042 .042
Marital status -.045 .039 -.060 -1.153 .250
Occupation -.022 .021 -.055 -1.056 .291
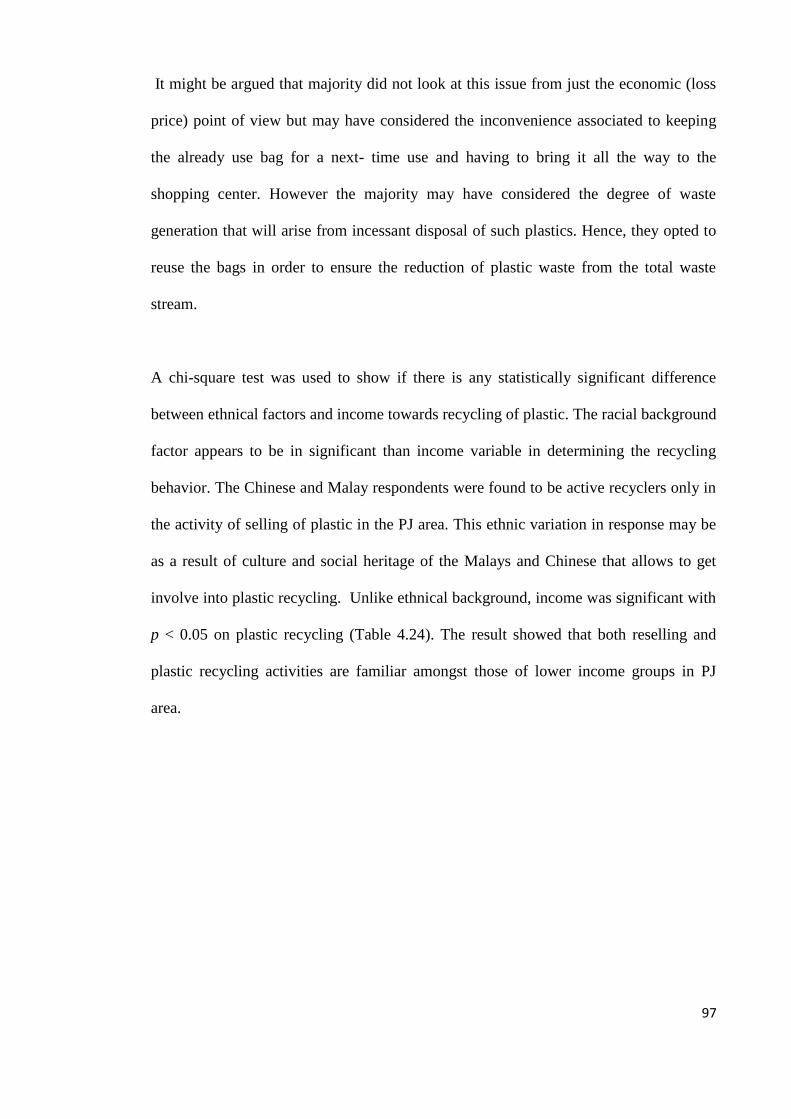
Similarly, the respondents were asked whether they have the idea that old plastic bag
can be reused for shopping. About 42% of the respondent agreed that such bag can be
reused whereas 58% were of different opinion (Table 4.23).
Table 4.23: Opinion of Respondent about Reuse of same bag for Shopping Time
Frequency Percentage
Valid No 223 58.0
Yes 161 42.0
Total 384 100.0
Missing System 5
Total 389
97
It might be argued that majority did not look at this issue from just the economic (loss
price) point of view but may have considered the inconvenience associated to keeping
the already use bag for a next- time use and having to bring it all the way to the
shopping center. However the majority may have considered the degree of waste
generation that will arise from incessant disposal of such plastics. Hence, they opted to
reuse the bags in order to ensure the reduction of plastic waste from the total waste
stream.
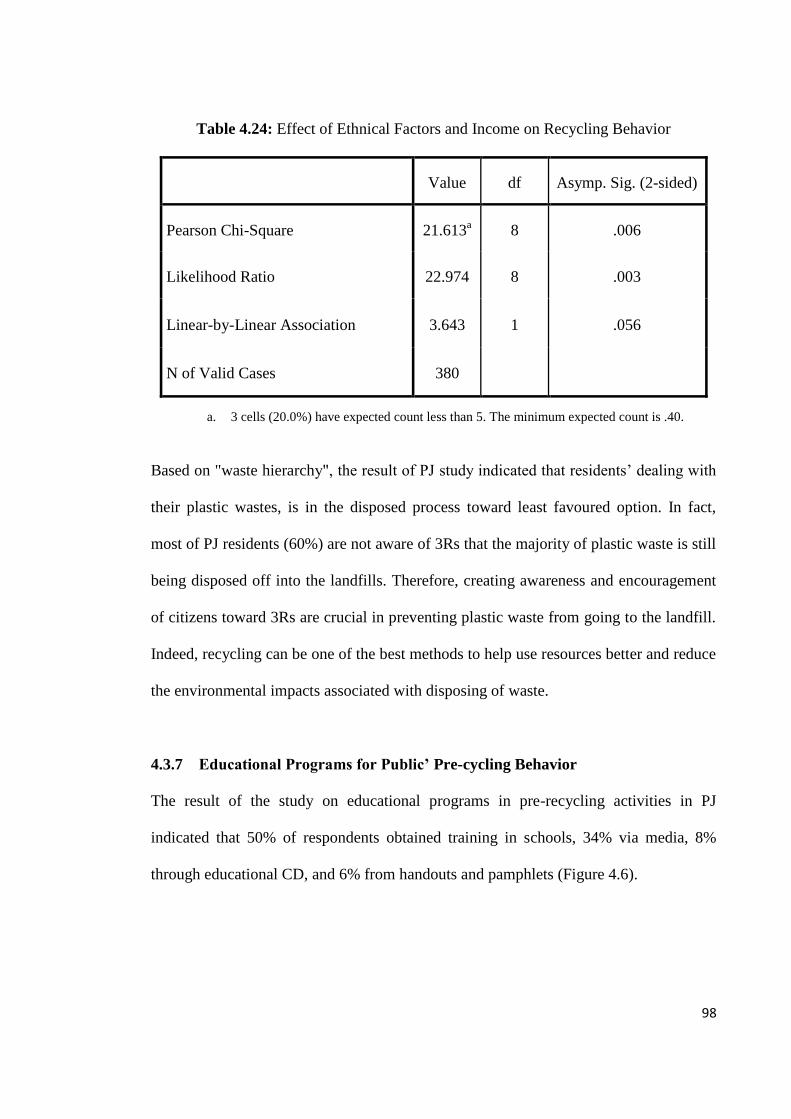
A chi-square test was used to show if there is any statistically significant difference
between ethnical factors and income towards recycling of plastic. The racial background
factor appears to be in significant than income variable in determining the recycling
behavior. The Chinese and Malay respondents were found to be active recyclers only in
the activity of selling of plastic in the PJ area. This ethnic variation in response may be
as a result of culture and social heritage of the Malays and Chinese that allows to get
involve into plastic recycling. Unlike ethnical background, income was significant with
p < 0.05 on plastic recycling (Table 4.24). The result showed that both reselling and
plastic recycling activities are familiar amongst those of lower income groups in PJ
area.
98
Table 4.24: Effect of Ethnical Factors and Income on Recycling Behavior
Value df Asymp. Sig. (2-sided)
Pearson Chi-Square 21.613a 8 .006
Likelihood Ratio 22.974 8 .003
Linear-by-Linear Association 3.643 1 .056
N of Valid Cases 380
a. 3 cells (20.0%) have expected count less than 5. The minimum expected count is .40.
Based on "waste hierarchy", the result of PJ study indicated that residents‘ dealing with
their plastic wastes, is in the disposed process toward least favoured option. In fact,
most of PJ residents (60%) are not aware of 3Rs that the majority of plastic waste is still
being disposed off into the landfills. Therefore, creating awareness and encouragement
of citizens toward 3Rs are crucial in preventing plastic waste from going to the landfill.
Indeed, recycling can be one of the best methods to help use resources better and reduce
the environmental impacts associated with disposing of waste.
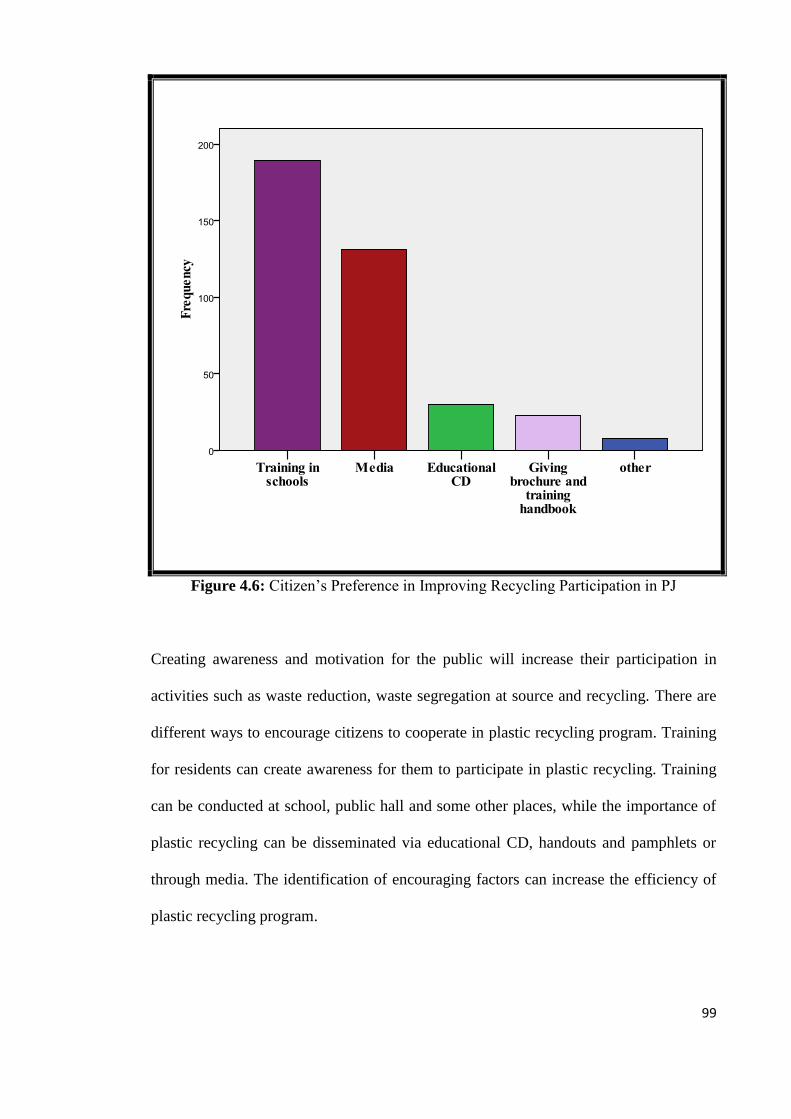
4.3.7 Educational Programs for Public’ Pre-cycling Behavior
The result of the study on educational programs in pre-recycling activities in PJ
indicated that 50% of respondents obtained training in schools, 34% via media, 8%
through educational CD, and 6% from handouts and pamphlets (Figure 4.6).
99
Figure 4.6: Citizen‘s Preference in Improving Recycling Participation in PJ
Creating awareness and motivation for the public will increase their participation in
activities such as waste reduction, waste segregation at source and recycling. There are
different ways to encourage citizens to cooperate in plastic recycling program. Training
for residents can create awareness for them to participate in plastic recycling. Training
can be conducted at school, public hall and some other places, while the importance of
plastic recycling can be disseminated via educational CD, handouts and pamphlets or
through media. The identification of encouraging factors can increase the efficiency of
plastic recycling program.
100
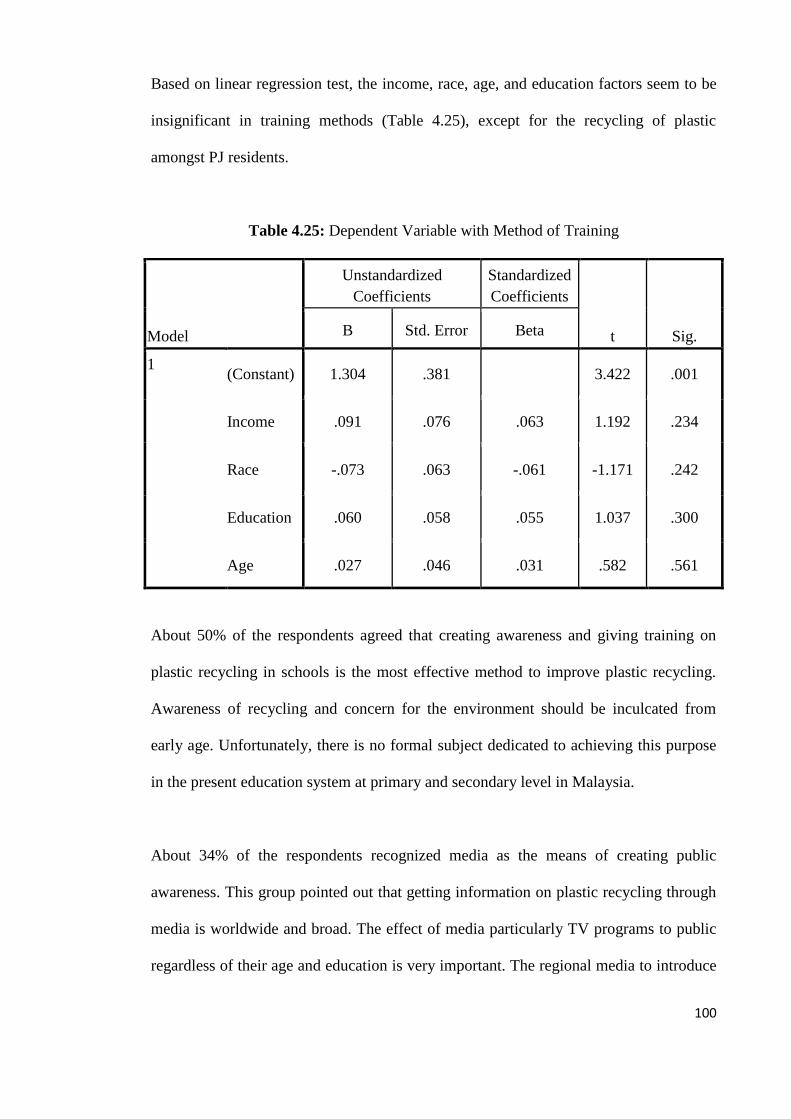
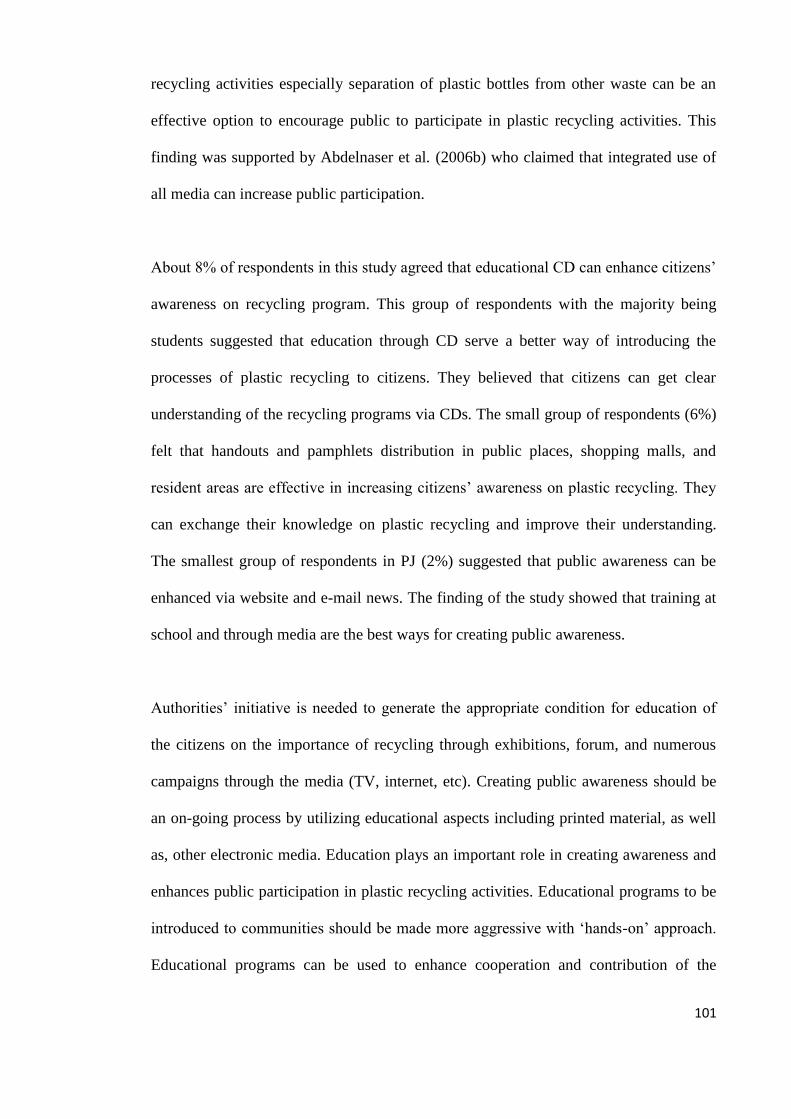
Based on linear regression test, the income, race, age, and education factors seem to be
insignificant in training methods (Table 4.25), except for the recycling of plastic
amongst PJ residents.
Table 4.25: Dependent Variable with Method of Training
Model
Unstandardized
Coefficients
Standardized
Coefficients
t Sig. B Std. Error Beta
1 (Constant) 1.304 .381 3.422 .001
Income .091 .076 .063 1.192 .234
Race -.073 .063 -.061 -1.171 .242
Education .060 .058 .055 1.037 .300
Age .027 .046 .031 .582 .561
About 50% of the respondents agreed that creating awareness and giving training on
plastic recycling in schools is the most effective method to improve plastic recycling.
Awareness of recycling and concern for the environment should be inculcated from
early age. Unfortunately, there is no formal subject dedicated to achieving this purpose
in the present education system at primary and secondary level in Malaysia.
About 34% of the respondents recognized media as the means of creating public
awareness. This group pointed out that getting information on plastic recycling through
media is worldwide and broad. The effect of media particularly TV programs to public
regardless of their age and education is very important. The regional media to introduce
101
recycling activities especially separation of plastic bottles from other waste can be an
effective option to encourage public to participate in plastic recycling activities. This
finding was supported by Abdelnaser et al. (2006b) who claimed that integrated use of
all media can increase public participation.
About 8% of respondents in this study agreed that educational CD can enhance citizens‘
awareness on recycling program. This group of respondents with the majority being
students suggested that education through CD serve a better way of introducing the
processes of plastic recycling to citizens. They believed that citizens can get clear
understanding of the recycling programs via CDs. The small group of respondents (6%)
felt that handouts and pamphlets distribution in public places, shopping malls, and
resident areas are effective in increasing citizens‘ awareness on plastic recycling. They
can exchange their knowledge on plastic recycling and improve their understanding.
The smallest group of respondents in PJ (2%) suggested that public awareness can be
enhanced via website and e-mail news. The finding of the study showed that training at
school and through media are the best ways for creating public awareness.
Authorities‘ initiative is needed to generate the appropriate condition for education of
the citizens on the importance of recycling through exhibitions, forum, and numerous
campaigns through the media (TV, internet, etc). Creating public awareness should be
an on-going process by utilizing educational aspects including printed material, as well
as, other electronic media. Education plays an important role in creating awareness and
enhances public participation in plastic recycling activities. Educational programs to be
introduced to communities should be made more aggressive with ‗hands-on‘ approach.
Educational programs can be used to enhance cooperation and contribution of the
102
citizens to the success of plastic recycling (Clarke, 1994). Hence, a study of household
pre-cycling behavior allows a better understanding on how to develop future public
educational programs along with recycling policies (Davio, 2001; Uche, 1998; Park,
1998).
4.3.8 Benefits of Plastic Recycling
In this survey, four reasons for plastic recycling were listed: the improvement of public
health, the reduction in environmental pollutions, economic benefit with direct and
indirect effect, and the increase in city‘s aesthetic condition. Respondents were asked to
give the best description of why they recycled. About 43% of respondents believed that
public health will increase with proper recycling, whereas, 35% claimed that pollution
will be reduced if citizens show adequate cooperation in recycling. On the other hand,
14% of respondents suggested that economic benefit is the main reason for recycling
while the remaining 6% takes the aesthetic aspects of a city as the reason for recycling
(Figure 4.7).

103
Figure 4.7: Respondent View on the Reasons to Recycle Plastic in PJ
The highest percentage of the respondents (43%) who live in their own house with high
income believed that recycling has indirect effects on public health. They thought that
the issue of increasing recycling wastes has been importantly linked to the most crucial
aspect of health. Due to the strong direct or indirect link between recycling and health
issues, some respondents are interested in recycling activities. Therefore, identifying
benefits of plastic recycling can increase the efficiency of plastic recycling activities.
Implementation of plastic recycling plan in developing countries such as Malaysia is

104
closely linked to the public for it is considered as an essential part of proper public
health and environmental control (Azman, 1995; Mohd.Razman and Sabarinah, 1994).
The linear regression test results showed that income factor (a beta value of – 0.012)
and ownership (a beta value of – 0.2) were significant in the need to inculcate the
benefits of recycling (Table 4.26). It means that residents with ownership and high
income tend to be more involved in the recycling of plastics. Other parameters such as
length of stay, occupation and education have no significant effect on recycling benefits.
The reason might be based on the fact that some think there is no professional reason to
make someone have the quest to recycle; hence occupation and education were
neglected. Length of stay may not really be significant since every individual intends to
maximize profit at any give opportunity.
Table 4.26: Dependent Variable with Recycling Benefits
Model Unstandardized
Coefficients
Standardized
Coefficients
t Sig. B Std. Error Beta
1 (Constant) 3.410 .481 7.089 .000
Income -.021 .090 -.012 -.228 .020
Length of Stay -.090 .114 -.065 -1.233 .219
Ownership -.351 .073 -.200 -3.806 .000
Occupation -.017 .049 -.018 -.338 .736
Education .039 .067 .031 .587 .558
105
The second largest respondents (35%) pointed out that recycling can reduce
environmental pollution. They referred to frightening fact of pollution levels and they
suggested that an immediate action on a global basis can be achieved via recycling
activities. For them, the reduction of pollution is the reason why plastic need to be
recycled. They stated that plastic recycling has close relationship to environmental
degradation. Recycling plastic may be aimed to reduce pollution to the environment,
slow down exhaustion of primary resources or simply because it is economically
profitable (Isa et al., 2005; Visvanathan et al., 2004; Broek et al., 1998). People who
believed that their government was making a reasonable effort to protect the
environment were more inclined to adopt environmental-friendly behavior. Therefore,
participation of the public in plastic recycling might help in achieving clean
environment.
The third group of respondents (14%) with low income pointed out that plastic
recycling can bring economic benefit both to the government, as well as, to themselves.
This group opined that economic factors can influence public recycling behavior in
terms of cooperating with private sectors. In regards to economic benefits, the recovery
of secondary materials is necessary to reduce dependency on other countries. Whereas
in industrialized countries, government and WMS play a large role in providing
infrastructure and partly subsidizing recycling materials, the developing countries such
as Malaysia, do not provide any financial resources to support recycling (Omran et al.,
2009).
106
The fourth reason for public to be involved in plastic recycling is due to aesthetic
reason. The remaining 6% of the respondents pointed out that plastic recycling can
improve the aesthetic condition. They expressed the need for a clean and unpolluted
place to live. They suggested that government should encourage proper placing of
recycling bins particularly in public areas. This is because most of recycling waste is
generated in public places, schools, and shopping malls (Anon, 2001). They agreed that
Malaysia as a country that receives tourists should pay more attention to the aesthetic
aspects of the country. Currently, tourism is one of the largest sources of income in
Malaysia. This group of respondents noted that PET bottle disposal on streets eventually
will clog drains or streams which are unfavorable for tourism. With the reduction of
plastic waste, the environment will be cleaner.
107
CHAPTER 5
CONCLUSION
5.1 CONCLUSION
This study was aimed at determining the factors that influence plastic recycling in PJ in
relation to the adopted recycling procedures and encountered problems. In view of the
above, this study therefore concludes that waste in PJ is mainly composed of organic
components. Among other components of MSW in PJ were paper waste, metal scraps,
textile, plastics etc. The concentration of plastics obtained in the waste stream is
approximately 21%.
Also, after estimation of respondents‘ level of plastic recycling awareness, the study
concludes that even though majority of the respondents with 67% in PJ knew the
meaning of recycling, only 22% of respondents practiced it. This most probably was
due to citizens‘ lack of awareness on the importance of plastic recycling.
However, the research identified a number of problems that hinder efficient recycling of
plastic is PJ. Such problems ranged from lack of awareness (39%), level of literacy
(36%) to unavailability of recycling facilities (31%). From the survey, it was concluded
that 60% of plastic waste from PJ area is still being disposed off at landfills. With
regards to this finding, the residents‘ awareness of 3Rs is low (81%).
108
Finally, suitable approaches to improve plastic recycling in the studied area must
include, increase in number of recycling centers, provision of more recycling facilities,
and increasing the unit price of recyclable plastics to encourage recyclers.
5.2 RECOMMENDATIONS
Finding from the study identified the following issues as problem in plastic recycling in
PJ:
a. The most important issue in plastic recycling is the lack of effective and
coherent programs in creating recycling culture in PJ. Citizens have an important
role in the success and the development of recycling activities. Therefore,
without establishing a recycling culture, achieving the objective is impossible.
Proper training methods are necessary in PJ to increase the motivation of the
citizens towards recycling. Training at school and through media proved to be
the best and the most effective solution to this problem. In addition to these
cases, it is suggested that other programs such as distributing brochures in all
areas of cities, performing musical programs for kids in parks, holding
exhibitions on recycling products in different places such as mosques and parks,
holding seminars on recycling in universities and governmental and private
organizations, performing educational programs for students in schools,
introducing recycling centers in exhibitions and stadiums, and having
educational programs for restaurant workers, are also necessary.
b. The second issue is the lack of unique and arranged educational program.
Recycling activities and programs are done through several companies and each
109
one has different educational program objectives. Due to these differences
designing a unique advertising plan for public media becomes difficult.
c. Another issue in the recycling plan is the lack of confidence among the citizens
to participate in the recycling program. Recycling is a long term plan.
Unfortunately, due to short period of management in most municipalities, most
of the recycling plans are incomplete. This problem caused distrust among
citizens. It is recommended that new management followed the incomplete
recycling plan with application of new methods. Also, advertisement and
manipulation of recycling plans should be done continuously and parallel to this
action.
d. The next issue is the collection method. Collection of waste in PJ is done with
curbside method. Due to high cost of transportation this method is not suitable.
It is recommended that drop off collection method is adopted. As it is mentioned
in Chapter Two, citizens carry plastic waste to drop off centers and this causes
reduction of transportation costs.
e. For the improvement of plastic recycling plan, it also is recommended that
manufactures are encouraged to produce high quality products.
f. Insufficient facilities or lack of appropriate facility also staggered plastic
recycling. There is no acceptable and enough equipment in transfer stations
where tools such as washing conveyors, cutting machine, packing machine, and
pressing machines are needed. Transfer stations equipped with press and cutting
110
machines reduces the costs of transportation by compacting plastic bottles. In
Malaysia, most of the separation activities are done manually. In this case, some
recycling materials were disposed due to workers‘ mistake in plastic waste
separation. Thus, it is recommended that mechanical method be used in
separation centers.
g. Another issue in recycling plan is the presence of many groups of scavengers.
This group causes dissatisfaction among citizens due to the scattering of waste.
They also create pollution and destroy aesthetic condition of a city. These
groups collect recyclables illegally and unhealthily, and mixed them with other
wastes. To solve this problem, it is recommended that municipality and relevant
organizations control the activities of the scavengers. Educational training and
facilities should be provided to encourage them to be an active player in
recycling programs. In general, municipality should supervise these groups and
use their capacity.
h. One of the biggest difficulties in plastic recycling is non-participation and lack
of support from municipality and governmental organizations. Municipality can
give factories standard bottles with low contamination to reduce the costs of
production line. To encourage plastic recycling towards environmental
preservation, municipalities and relevant organizations should provide financial
assistance and loans to private sectors as financial and economic support.

111
i. Another issue in plastic recycling plan is illegal and unorganized plants. In these
factories, production of flakes creates high pollution. As a result, value and price
of flakes of low quality will plunge causing fluctuation in the market. Hence,
municipality needs to create suitable marketing for these flakes.