chapter 1: introduction 1.0 introductionstudentsrepo.um.edu.my/3798/2/2._chapter_1_–_5.pdf ·...
TRANSCRIPT
CHAPTER 1:
INTRODUCTION
1.0 Introduction
Food is essential and indispensable to human survival and development. This
is because it provides elements necessary for man to nourish and develop his
physical, as well all intellectual activities. The commercial values of foods with
immense health benefit appeared in the main stream market in the 1960’s. Highlights
during this period include the importance of eating right and that processed foods
should retain the natural attributes of their ingredients. Information on the link
between a series of medical conditions (such as constipation, cardiovascular diseases,
obesity and hypertension) and the intake of excessive amount of certain ingredients
become prominent in the 1970’s (Cruz et al, 2007). These conditions were also
shown to be the health consequences of bad eating habits and poor diet, which can be
readily aggravated by stress inherent to modern life. This leads to the appreciation of
the additional health benefits of eating certain food (e.g. functional foods) to ward off
factors that may compromise the body physiological functions.
Herbs have the reputation as health-giving and having curative properties.
Their effects on the human body can be generally attributed to the biochemical
structure-function relationships of the myriad of chemicals that occur naturally in
foods (Labuza, 1994). Herbs are consumed widely as an alternative approaches to
enhance health in developed countries and many herbs to have profound therapeutic
effects on certain diseases (Marles & Farnsworth, 1994). In fact, most drugs in the
markets are derived from active compounds isolated from plants. However, herbal
medicine is increasingly preferred to drugs because the side effects associated with
these synthetic drugs are less prevalent when medicinal plants are used.
The present study explored the effects of selected herbs i.e. ‘Misai Kucing’
(Orthosiphon stamineus), ‘Pegaga” (Centella asiatica) and ‘Mengkudu’ (Morinda
citrifolia) when incorporated in yogurt. These plants have high intrinsic medicinal
uses in the treatment of patients with diabetes. An important underlying principal of
the anticipated changes in the yogurt as a result of the addition of these plants is the
modulative effects of the herbal bioactive compounds on the metabolism and growth
of starter culture and probiotics.
The objectives of the present study are as follows:
1. To study the effect of O. stamineus, C. asiatica and M. citrifolia water
extract on the changes of yogurt fermentation.
2. To evaluate the viability of Lactobacillus spp. and S. thermophilus
bacteria in the herbal-yogurts.
3. To investigate the in vitro inhibition of α-amylase and α-glucosidase, the
two key intestinal enzymes linked to diabetes.
CHAPTER 2:
LITERATURE REVIEW
2.1 Yogurt
The word yogurt came from the Turkish Yogen which gives the meaning of
‘thick’. Yogurt is a well known dairy product manufactured through the fermentation
of milk. Yogurt is traditionally manufactured using Streptococcus thermophilus and
L. delbrueckii ssp. bulgaricus as a starter culture. Lactic acid is the main product of
the fermentation which enhanced the yogurt texture and flavor. Yogurt is also an
important delivery vehicle for friendly bacteria (probiotic organisms) (Shah, 2007)
and it is commonly flavored with fruit preserves or other ingredients (Potter &
Hotchkiss, 1995) added before or after incubation (Keating & White, 1990). There
are many types of yogurt products in the market and these include yogurt mixed with
fruits such as strawberry, kiwi, mango and apple.
2.1.1 Health benefits of yogurt
Yogurts or fermented milk products consumption is associated with well
being and health benefits (Hughes & Hoover, 1991; Kanbe, 1992; Le, Moulton, Hill,
& Kramar, 1986; Mital & Garg, 1992; Nakazawa & Hosono, 1992; Van'tVeer et al.,
1989; Yamamoto, Akino, & Takano, 1994). Health benefits that can be obtained
from the consumption of yogurt are summarized in the following sections.
a) Anti-diabetic properties
Regular consumption of yogurt was reported to delay the onset of glucose
intolerance, hyperglycemia, hyperinsulinemia, dyslipidemia, and oxidative stress in
high fructose-induced diabetic rats (Yadav, Shalini, & Sinha, 2007). The slowing
down of the onset of these dysfunctions was suggested due to the antioxidative
effects in the liver and pancreatic tissues of diabetic animals (Yadav, et al., 2007).
b) Effectiveness against diarrhea
Diarrhea is known as a frequent passing of loose or watery stools. It is usually
caused by the disturbances to the natural balance of gut micro flora through infection
with pathogenic strains of bacteria (O'Ryan, Prado, & Pickering, 2005). The
symptoms of diarrhea are abdominal cramps, abdominal pain, temperature (fever),
fatigue, loose (watery stools), bloating and blood in stool (Aranda-Michel &
Giannella, 1999).
Certain probiotic strains e.g. L. acidophilus, L. bulgaricus and B. longum are
commonly used in the treatment of diarrhea. Rotavirus is one of the most common
causes of acute diarrhea in children worldwide. During diarrheal stage of infection
the permeability of gut epithelial cells to intact protein is increased and the use of
probiotics was found to shorten the duration of rotavirus diarrhea in children
(Saavedra, Bauman, Oung, Perman, & Yolken, 1994).
c) Improvement of lactose metabolism
Lactose is a major type of sugar found in milk, milk products and human
milk. Lactose consists about up to 8% of the solids in milk and it was not found
naturally in any other form of food except from the dairy products. Lactose is a
disaccharide composed of monosaccharide glucose and galactose bonded together by
glycosidic bond.
Lactose intolerance is caused by the inability of a normal person to digest a
significant amount of lactose due to a lack of lactase enzymes production by the
small intestine (Casellas, Aparici, Casaus, Rodriguez, & Malagelada, 2010). The
function of lactase is to enzymatically cleave the disaccharide sugar into simpler
form of sugar i.e. glucose and galactose which are subsequently absorbed into the
bloodstream. The failure to digest lactose leads to ‘gastric distress’ which is caused
by the fermentation of lactose in the large intestine that produces hydrogen gas as a
byproduct of microbial action (Shah, 1993; Shah, Fedorak, & Jelen, 1992).
Shah (2000) reported that both yogurt and probiotic yogurt are tolerated well
by lactose malabsorbers by virtue of the way yogurt is prepared. The culture (i.e., L.
delbrueckii ssp. bulgaricus and S. thermophilus) present in yogurt produce
substantial quantities of enzyme (β-D-galactosidase) that catalyses the hydrolysis of
lactose into d-glucose and d-galactose.
d) Antimutagenic properties
Mutagens are agents (physical or environmental) that can induce a genetic
mutation or the increase in rate of mutation whereas antimutagens are agents that
inhibit the effects of mutagens. The organic acids produced by probiotics were
shown using the Ames Salmonella assay to have antimutagenic activities against
several mutagens and promutagens (Lankaputhra & Shah, 1998).
e) Protection from carcinogens
Carcinogens are substances that could cause cancer. Lactobacteria has a big
potential to bind potential carcinogens and this prevent the host cells from being
damaged (Daniel, Roisin, Colette, & Ian, 2005). L. bulgaricus can bind with heavy
metals and this is associated with anti-tumor properties. Such an action may
contribute to the prevention of cancer formation because nitrate can also be a
potential carcinogen (Shah, 2007).
Certain strains of L. acidophilus and Bifidobacterium spp. can decrease the
risk of tumor development and this is achieved by a decrease in the levels of
enzymes such as β-glucuronidase, azoreductase and nitroreductase responsible for
the activation of procarcinogens (Yoon, Benamouzing, Little, Francois-Collange, &
Tome, 2000). This was further supported by studies which demonstrated short chain
fatty acids largely produced by L. acidophilus and Bifidobacterium, L. plantarum and
L. rhamnosus are able to inhibit the generation of carcinogen products by reducing
enzyme activities (Cenci, Rossi, Throtta, & Caldini, 2002).
f) Inflammatory bowel disease
Inflammatory Bowel Disease (IBD) is a disorder related to the intestinal
microflora such as Crohn’s disease, ulcerative colitis and pouchitis. The main cause
of IBD is abnormal bacteria population in the gut. Probiotics have the potential of
effectively reducing the inflammation in inflammatory bowel as shown in studies in
rats (enterocolitis) and humans (small bowel bacterial overgrowth in children,
pouchitis) (Schultz & Sartor, 2000).
g) Helicobacter pylori infection
Helicobacter pylori is a bacterium that cause peptic ulcer disease, chronic
gastritis, gastric adenocarcinoma and mucosa-associated lymphoid tissue lymphoma
(Adolfsson, Meydani, & Russell, 2004; Personnet, 1993). The S-shaped gram-
negative bacterium colonizes the gastric epithelial surface and withstands the
stomach’s hostile ambience by microaerophilic growth capability and high urease
activity (Goodwin & Armstrong, 1990). The treatment of the infection can be
obliterated with antibiotics but the use of antibiotics has been associated with side
effects and also makes H. pylori to be more resistant (Shah, 2007).
Several in vitro and animal studies (Aiba, Suzuku, Kabir, Takagi, & Koga,
1998) showed that several strains of Lactobacillus are capable to reduce the viability
of H. pylori and cause less adhesion of the bacteria to human intestine. Examples
include L. johnsonii La1 and L. gasseri OLL2716 which reduced H. pylori
colonization and inflammation (Felly et al., 2001) and L. casei Shirota and L.
acidophilus which inhibited the growth of H. pylori (Cats et al., 2003).
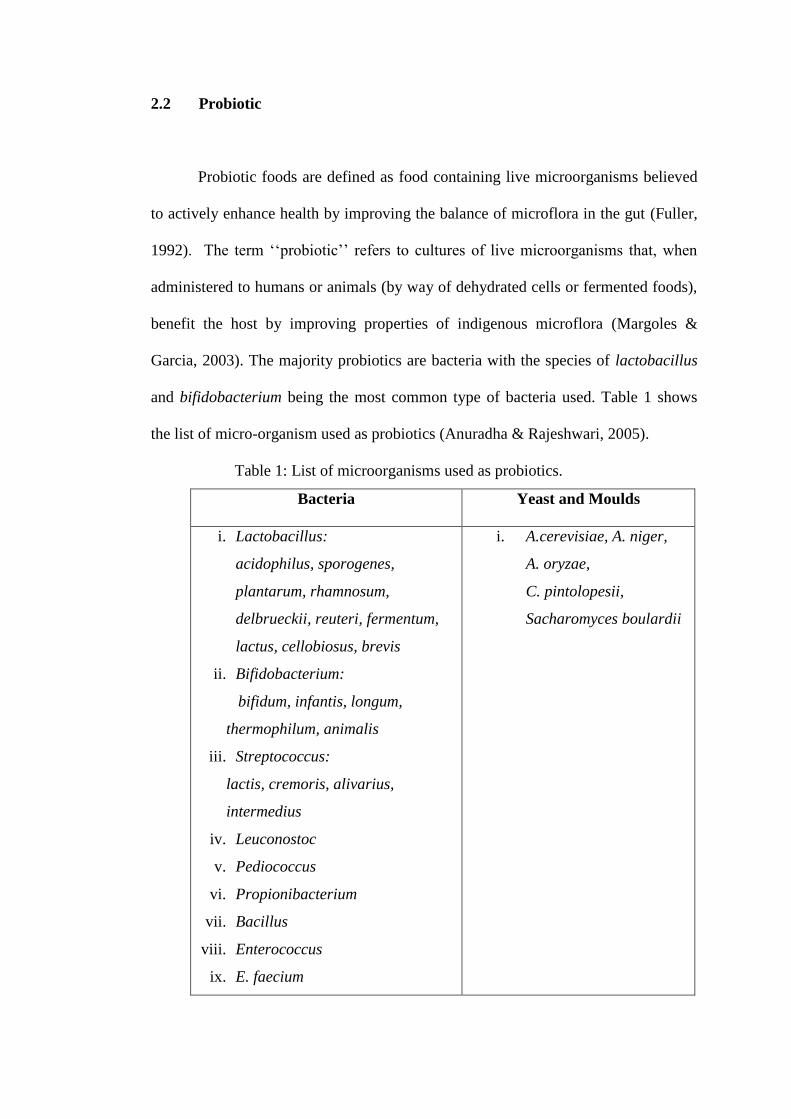
2.2 Probiotic
Probiotic foods are defined as food containing live microorganisms believed
to actively enhance health by improving the balance of microflora in the gut (Fuller,
1992). The term ‘‘probiotic’’ refers to cultures of live microorganisms that, when
administered to humans or animals (by way of dehydrated cells or fermented foods),
benefit the host by improving properties of indigenous microflora (Margoles &
Garcia, 2003). The majority probiotics are bacteria with the species of lactobacillus
and bifidobacterium being the most common type of bacteria used. Table 1 shows
the list of micro-organism used as probiotics (Anuradha & Rajeshwari, 2005).
Table 1: List of microorganisms used as probiotics.
Bacteria Yeast and Moulds
i. Lactobacillus:
acidophilus, sporogenes,
plantarum, rhamnosum,
delbrueckii, reuteri, fermentum,
lactus, cellobiosus, brevis
ii. Bifidobacterium:
bifidum, infantis, longum,
thermophilum, animalis
iii. Streptococcus:
lactis, cremoris, alivarius,
intermedius
iv. Leuconostoc
v. Pediococcus
vi. Propionibacterium
vii. Bacillus
viii. Enterococcus
ix. E. faecium
i. A.cerevisiae, A. niger,
A. oryzae,
C. pintolopesii,
Sacharomyces boulardii
Lactic acid and other acids account for over 90% of the organic acids
produced by probiotics. The lowering of pH due to lactic acid or acetic acid produced
by these bacteria in the gut has bacteriocidal or bacteriostatic effects (Shah, 2007).
The benefits of yogurt bacteria (S. thermophilus and L. delbrueckii spp. bulgaricus)
on human health and nutrition (Deeth & Tamime, 1981; IDF, 1984), can be
reinforced by the addition of L. acidophilus and bifidobacteria (known as probiotic or
AB-culture) which are able to tolerate the harsh gastrointestinal effects of acid and
bile (Gilliland, 1978; Kanbe, 1992; Lankaputhra & Shah, 1994) and thus improve the
microbial balance in the human gastrointestinal tract (GIT) (Schrezenmeir &
deVrese, 2001). Probiotics when administered in adequate amounts confer a health
benefit on the host (FAO, 2002). Benefits attributed to probiotics include
antimutagenic effects, anticarcinogenic properties, improvement in lactose
metabolism, reduction in serum cholesterol, and immune system stimulation (Shah,
2007).
The species of the genus Lactobacillus with benefits to food and food
processing numbered more than 56 (Curry & Crow, 2003). L. acidophilus is the most
commonly suggested organism for dietary use. L. acidophilus can grow as high as at
45oC, but the optimum growth temperature is between 35-40
oC. The organisms grow
in slightly acidic media at pH 6.4-4.5, with growth ceases to occur when pH of 4.0-
3.6 is reached. The acid tolerance of the organisms varies from 0.3% - 1.9% titratable
acidity, with the optimum pH at 5.5-6.0 (Curry & Crow, 2003).
L. acidophilus is the most popular bacteria used as a probiotic in food
productions. L. acidophilus is also known as ‘friendly bacteria’ for human because
these bacteria inhibit the proliferation of pathogen bacteria the intestinal tract, vagina
and mouth. L. acidophilus is also responsible for producing acetic acid that lowers
the natural pH in the intestines which discourages the growth of the other bacteria
(Deanne, 1996).
L. acidophilus also utilizes the nutrients that are necessary for unhealthy
organisms to survive, thereby depriving them of food. Other health benefits of L.
acidophilus include boosted immune system (Sander & Klaenhammer, 2001),
reduced burden on the liver and reduced levels of serum cholesterol (Ouwehand,
Salminen, & Isolauri, 2002). S. thermophilus is a gram positive microbe and a
facultative anaerobe i.e. organism that can produce ATP by aerobic respiration if
oxygen is present. S. thermophilus is a lactic acid bacterium that breaks down
pyruvate into lactic acid and acetaldehyde. Like L. acidophilus, S. thermophilus is
also used as a probiotic in producing functional food.
2.3 Medicinal plants
Herbal medicine is an accumulation of therapeutic experiences of generations
of practicing physicians on indigenous systems of medicine for over hundreds of
years (Kamboj, 2000). In the developing countries, medicinal plants are used
traditionally and these plants will continue to play major role in the treatment of
various ailments. Herbal medicine is also in increasing demand in the developed
world for primary health care because of its efficacy, safety and lesser side effects
(Kamboj, 2000).
Bussmann (2002) reported numerous drugs through exploration of
ethnopharmacology and traditional medicine have entered the international market.
About 25% of the prescription drugs contain active principles derived from the
higher plants (Tiwari & Joshi, 1990). There are more than 800 plant species
potentially useful for diabetes mellitus treatment (Perez, Zavala, Perez, & Perez,
1998).
2.3.1 Orthosiphon stamineus (Misai Kucing)
O. stamineus, Benth (family Lamiaceae) is known locally as ‘Misai Kucing’.
The plant is used for the treatment of a wide range of diseases in Southeast Asia such
as eruptive fever, epilepsy, gallstone, hepatitis, rheumatism, hypertension, syphilis,
gonorrhea and renal calculus (Akowuah, Ismail, Norhayati, & Sadikun, 2005). In
Malaysia, O. stamineus leaves are used to prepare a diuretic tea and reported to be
active against kidney and bladder inflammation, gout and diabetes (Wangner, 1982).
O. stamineus leaf has high antioxidant properties (Chung et al., 1999; Venkatamuru,
Patel, & Rao, 1983) and its polyphenol, the most active principle; (Nakasugi &
Komai, 1998) has the ability to reduce oxidative stress by inhibiting the formation of
lipid peroxidation products in biological systems (Hollman & Katan, 1999).
O. stamineus also contains several chemically active constituents such as
terpenoids (diterpenes and triterpenes), polyphenols (lipophilic flavonoids and
phenolic acids), and sterols (Tezuka et al., 2000). Sumaryono et al., (1991) reported
the identification and quantification of twenty phenolic compounds using HPLC and
these include nine lipophilic flavones, two flavonol glycosides, and nine caffeic acid
derivatives, such as rosmarinic acid and 2,3-dicaffeoyltartaric acid.
2.3.2 Centella asiatica (Pegaga)
Centella asiatica, an ethnomedicinal herbaceous species and originated from
India, grows spontaneously in tropical and subtropical countries such as China,
Malaysia, Australia, America, South Africa and Madagascar. In Madagascar, the
plant is largely used by the local population and is the second medicinal species
exported (Pechard, Antona, Aubert, & Badin, 2005). This plant is high in cathechin,
rutin and naringin (Zainol, Abdul-Hamid, Yusof, & Muse, 2003) and thus used in
porridge for feeding pre-school children in Sri Lanka in combating nutritional
deficiencies (Cox, Rajasuriya, Soysa, Gladwin, & Ashworth, 1993).
More specific studies using the extracts of the plant showed C. asiatica
possess antioxidant activity (Gnanapragasam, Ebenezar, Sathish, Govindaraju, &
Devaki, 2004) and antiproliferative effects in tumor cells, improve venous wall
alterations in chronic venous hypertension and protect the venous endothelium
(Yoshida et al., 2005). C. asiatica was also reported to have an anti-rheumatoid
effect and wound healing properties (Liu et al., 2008; Lui et al., 2008).
2.3.3 Morinda citrifolia (Mengkudu)
M. citrifolia, commonly known as Noni, and locally as ‘Mengkudu’, has a
long history of wide use as food and herbal remedies for different disease in tropical
regions. The plant is a small evergreen tree. Furusawa & Hirazumi (1994, 1996)
reported that the bark, stem, root, leaf and fruit are traditionally as a folk remedy for
diabetes, hypertension and cancer and many more.
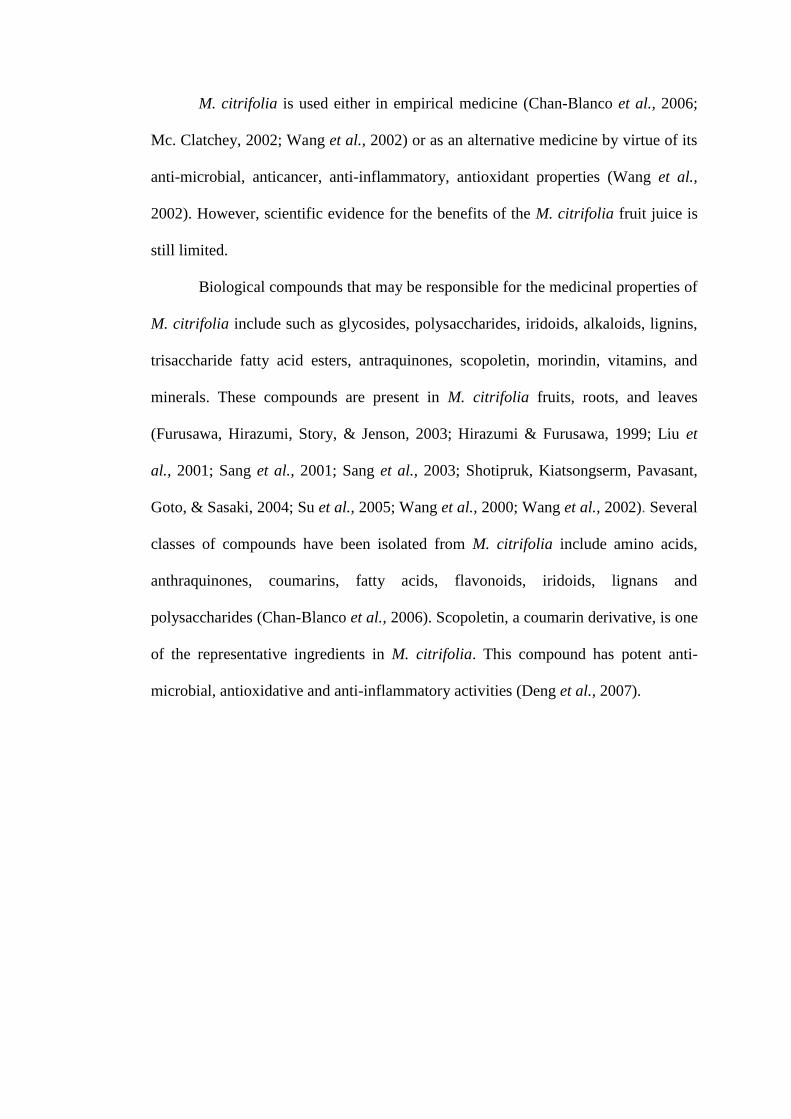
M. citrifolia is used either in empirical medicine (Chan-Blanco et al., 2006;
Mc. Clatchey, 2002; Wang et al., 2002) or as an alternative medicine by virtue of its
anti-microbial, anticancer, anti-inflammatory, antioxidant properties (Wang et al.,
2002). However, scientific evidence for the benefits of the M. citrifolia fruit juice is
still limited.
Biological compounds that may be responsible for the medicinal properties of
M. citrifolia include such as glycosides, polysaccharides, iridoids, alkaloids, lignins,
trisaccharide fatty acid esters, antraquinones, scopoletin, morindin, vitamins, and
minerals. These compounds are present in M. citrifolia fruits, roots, and leaves
(Furusawa, Hirazumi, Story, & Jenson, 2003; Hirazumi & Furusawa, 1999; Liu et
al., 2001; Sang et al., 2001; Sang et al., 2003; Shotipruk, Kiatsongserm, Pavasant,
Goto, & Sasaki, 2004; Su et al., 2005; Wang et al., 2000; Wang et al., 2002). Several
classes of compounds have been isolated from M. citrifolia include amino acids,
anthraquinones, coumarins, fatty acids, flavonoids, iridoids, lignans and
polysaccharides (Chan-Blanco et al., 2006). Scopoletin, a coumarin derivative, is one
of the representative ingredients in M. citrifolia. This compound has potent anti-
microbial, antioxidative and anti-inflammatory activities (Deng et al., 2007).
2.4 Diabetes
2.4.1 Introduction
More than 220 million people worldwide (WHO, 2009) and more than 1.2
million people in Malaysia suffer from diabetes (PDM, 2006). These figures are
likely to be more than double by 2030 with around 3.2 million deaths occurring
every year (i.e. 6 deaths per minute) attributable to complication of diabetes. Almost
80% of diabetes death occurred in low- and middle-income countries where half of
diabetes deaths occur in people under the age of 70 years with more than half (i.e.
55%) of the numbers are women (WHO, 2009).
Diabetes is classified into three types i.e. Insulin-dependent Diabetes Mellitus
(IDDM) or Type 1 Diabetes (T1D), Noninsulin-dependent Diabetes Mellitus
(NIDDM) or Type 2 Diabetes (T2D) and gestational diabetes. Gestational diabetes
symptoms are similar to T2D which is most often diagnosed through prenatal
screening, rather than reported symptoms (WHO, 2009).
T1D commonly occurs in childhood and adolescence, but it can occur at any
age, even late in life. Subject with T1D must administer insulin via injection since
insulin cannot be taken orally because the enzymes of the GI tract would digest it
(Whitney & Rolfes, 2008).
T2D is the most prevalent form of diabetes and it accounts for 90 to 95% of
diabetic cases. The primary defect in T2D is insulin resistance characterized by a
reduced sensitivity to insulin stimulation of glucose uptake in muscle, adipose and
liver cells (Whitney & Rolfes, 2008).
In Malaysia, patients with T2D make up about 77000 deaths annually due to
cardiovascular disease, especially of coronary heart disease and stroke (PDM, 2006).
Therefore, the ‘epidemic’ of T2D is characteristically followed by the ‘epidemic’ of
diabetes-related cardiovascular disease. The serious nature of chronic hyperglycemic
is such that the relative risk of coronary death was reported to be higher in
individuals with asymptomatic post-prandial glucose rises than in normal glucose
tolerant individuals, even after adjustment for other risk factors such as age smoking,
blood pressure and cholesterol (Baron, 1998).
T2D is preceded by a long period of asymptomatic hyperglycemia associated
with the clustering or cardiovascular risk factor (Wingard & Barrett-Connor, 1995).
In this pre-diabetic state, postprandial or post glucose levels are mildly elevated,
whereas fasting blood glucose can usually be maintained within the near-normal
range. Very often these individuals at risk also have the metabolic syndrome, a
multitude of other cardiovascular risk factors, e.g. abdominal obesity, elevated levels
of total triglycerides, low levels of high-density lipoprotein (HDL) cholesterol and
elevated blood pressure. Thus, these individuals are at a high risk for developing
cardiovascular diseases, including stroke (Laakso & Kuusisto, 2007)
Diabetes can damage the heart, blood vessels, eyes, kidneys and nerves
(WHO, 2009). People with diabetes have increased chances of getting heart disease
and stroke with about 50% of them die of cardiovascular disease (primarily heart
disease and stroke).
2.4.2 α-amylase and α-glucosidase inhibition on T2D
T2D is mainly caused by a high digestion rate of refined carbohydrates in the
upper part of the small intestine and results in a rapid and high postprandial rise in blood
glucose level (Dicarli, Janises, Grunberger, & Ager, 2003). One of therapeutic approach
for treating diabetes is to decrease the post-prandial hyperglycemia. This is done by
retarding the absorption of glucose through the inhibition of the carbohydrate-
hydrolyzing enzymes, α-amylase and α-glucosidase, in the digestive tract. Inhibitor of
these enzyme delay carbohydrate digestion and prolong overall carbohydrate digestion
time, causing a reduction in the rate of glucose absorption and consequently blunting the
post-prandial glucose rise (Puls, Keup, Krause, Thomas, & Hoffmeister, 1997; Rhabasa-
Lhoret & Chiasson, 2004). Examples of such inhibitors which are in clinical use are
acarbose, miglitol and voglibose. Inhibitors of α-glucosidase are currently of interest
due to their promising therapeutic potential in the treatment of disorders such as
diabetes, AIDS, metastatic cancer and lysosomal storage diseases (Melo, Gomes, &
Carvalho, 2006).
CHAPTER 3:
MATERIALS AND METHODS
3.1 Materials
3.1.1 Herbs
a) Orthosiphon stamineus (Misai Kucing)
O. stamineus leaves were collected in the late afternoon, when the leaves,
white flowers and stems were less turgid and therefore less likely to be damaged. The
whole samples were rinsed under running tap water and left to dry in the oven
(Memmert) for 3 days at 55oC. These were then ground (Waring Commercial) into
powder form and were kept in sealed airtight container and stored away from direct
sunlight.
b) Centella asiatica (Pegaga)
C. asiatica was purchased from local night market. The whole plants were
washed under running tap water and the roots were removed. The leaves and petiole
were dried in the oven for 3 days at 55oC before being ground (Waring Commercial)
to powder form. The powdered C. asiatica was then kept in sealed airtight containers
and stored away from direct sunlight.
c) Morinda citrifolia (Mengkudu)
Mature pale white but firm M. citrifolia fruits were obtained from Noni trees
in Klang, Selangor. The fruits were washed with tap water before being cut into
pieces of about 20-30g. These were then blended (Waring Commercial) and then
transferred into sealed airtight containers and stored at 4oC and used within 3 days.
3.1.2 Yogurt making
a) Milk
Pasteurized Dutch Lady Full cream milk was purchased from local grocery
stores. Milk with minimum 7 days from the date of expiry was used to ensure similar
milk fresheness.
b) Yogurt bacteria and probiotics mixture
Mixture of L. acidophilus LA-5, Bifidobacterium Bb-12, L. casei LC-10, and
Streptococcus thermophilus Th-4 in sachets (Nn Yogurt Mix, Malaysia) and mixture
of Lactobacillus acidophilus NCFM, L. bulgaricus, L. casei, L. rhamnosus,
Bifidobacterium bifidum, B. infantis and B. longum in capsules (Bio-life Sdn. Bhd.,
Malaysia) were used to prepare starter culture.
c) Chemicals
All chemicals used, unless stated otherwise, were of analytical grade purchased
either from Sigma Chemical Aldrich Co., Merck or Oxoid through local suppliers.
3.2 Methods
3.2.1 Water extraction of herbs
a) Extraction method for O. stamineus and C. asiatica
The water extraction of O. stamineus and C. asiatica was carried out as
described by Tabak et al. (1996). The herb water ratio used was 1:10 (10g herb
powder in 100ml distilled water). Herbs were placed in separate Scott bottle (200ml)
followed by the addition of 100ml distilled water. The bottle was capped and the
mixtures were incubated in a water bath (Memmert, 70oC) overnight followed by
filtration using filter paper (Whatman No.1). The filtrates were then centrifuged
(2000rpm, 15min, at 4oC) and the supernatants harvested were used as herbal water
extract in herbal yogurt preparation.
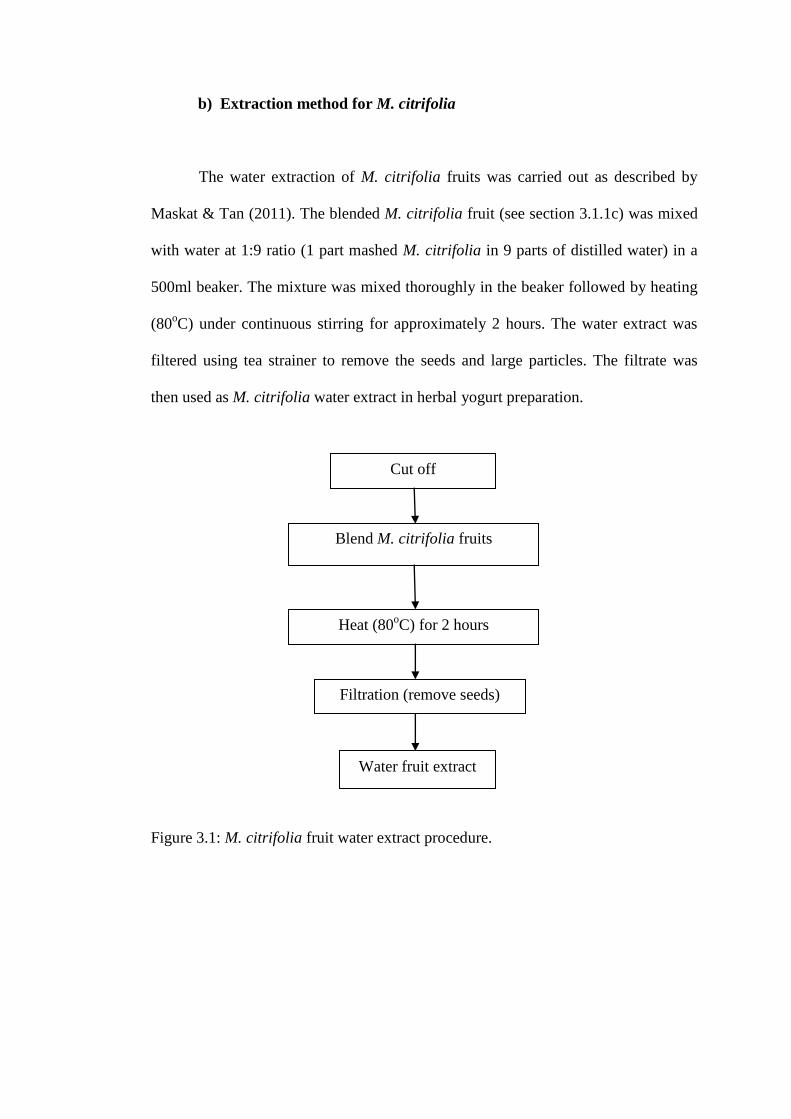
b) Extraction method for M. citrifolia
The water extraction of M. citrifolia fruits was carried out as described by
Maskat & Tan (2011). The blended M. citrifolia fruit (see section 3.1.1c) was mixed
with water at 1:9 ratio (1 part mashed M. citrifolia in 9 parts of distilled water) in a
500ml beaker. The mixture was mixed thoroughly in the beaker followed by heating
(80oC) under continuous stirring for approximately 2 hours. The water extract was
filtered using tea strainer to remove the seeds and large particles. The filtrate was
then used as M. citrifolia water extract in herbal yogurt preparation.
Figure 3.1: M. citrifolia fruit water extract procedure.
Cut off
Blend M. citrifolia fruits
Heat (80oC) for 2 hours
Filtration (remove seeds)
Water fruit extract
3.2.2 Yogurt preparation
a) Starter culture preparation
Pasteurized full cream milk (1000 ml) was poured into a sterilized 2L beaker
and the content was covered with a sterile aluminum foil. The milk was heated in the
water bath (Memmert) until it reached 41oC. The heated milk was mixed (by using
sterile glass rod) with a sachet and a capsule of yogurt bacteria starter culture (see
section 3.1.2). Incubation was carried out for 24 hours at 41oC and the yogurt formed
was stored in a fridge (4oC) and used as starter culture within 7 days.
b) Herbal-yogurt preparation
Herbal-yogurts were prepared by adding herbal water extracts at three
different concentrations i.e. 1, 5 and 10% v/v. Starter culture was added at 5% v/v.
Pasteurized full cream milk was added to make up the volume to 100%. The
mixtures were stirred well using sterile glass rod followed by incubation in the water
bath (41oC) until the pH reached to 4.5, which normally took approximately 5-6
hours. Plain-yogurts were prepared essentially in the same manner as described for
herbal-yogurt with the exception that distilled water was used in place of herbal
water extract. Yogurts formed were stored in the refrigerator (4oC) for predetermined
periods.
3.2.3 Effects of herbal extracts on yogurt fermentation
a) Measurement of pH
pH of yogurts was determined by using a digital pH meter (Cyper Scan 510).
The pH meter was routinely calibrated at pH 4.0 and 7.0 before and after the pH
measurement (Olson & Aryana, 2008). Samples of yogurts (1ml) were thoroughly
mixed with 3 ml of dH2O in a test tube. The changes of pH were monitored on days
0, 7, 14 and 21 of refrigeration.
b) Measurement of titratable acidity (TA)
Yogurt was titrated using 0.1N NaOH to determine titratable acidity (TA).
Yogurt samples (1.0ml) were transferred into a beaker (50ml) containing 9ml of
dH2O and a few drops of 0.1% phenolphthalein were added. The mixtures were
thoroughly mixed and NaOH was titrated into the solutions drop by drop under
continuous stirring by a magnetic stirrer until the color of the solution changed from
clear to a constant pink.
The content of lactic acid was calculated as follows:
Percentage of lactic acid = df x VNaOH x 0.009g x 0.1N x 100%
df = dilution factor (in this case = 10)
V NaOH = Volume of NaOH to neutralized lactic acid
0.1 = Normality of NaOH
3.2.4 Preparation of yogurt water extracts
Yogurt was mixed with water in the ratio of 1.0: 0.25 i.e. 10g of yogurt with
2.5ml of dH2O. The mixture was homogenized (Eppendorf 5804R, 10000rpm, 30
seconds) followed by incubation in water bath (45oC) for 10 minutes. The
homogenate was centrifuged (10000 rpm, 15 min, 4oC) followed by the
neutralization to pH 7.0 by the addition of 0.5M NaOH. The supernatant was
centrifuged again (10000 rpm, 15min and 4oC) to remove residual precipitates. The
clear supernatant obtained, now referred to as yogurt water extract, was harvested
and stored at -20oC until required for analysis.
3.2.5 Antioxidative activity by 1,1-Diphenyl-2-Picrylhydrazyl (DPPH) radical
inhibition (DRI) assay
The method of estimating free radical-scavenging activity of the extract of
herbal yogurt was adapted from Shetty et al. (2007). 60µM DPPH (3 ml) in ethanol
was pipetted into 4.5ml cuvette and added with 250µl of neat, or diluted (2 or 4 times
diluted in water) herbal yogurt water extract. The decrease in absorbance was
monitored at 517 nm until a constant reading was obtained. Negative controls consist
of 250µl of dH2O instead of the herbal yogurt water extract.
The free radical-scavenging activity (FRSA) was calculated by using the
following formula:
FRSA (%) = [(Ac – As) / Ac] x 100,
Ac: the absorbance of the control
As: the absorbance of the tested sample after the reading is constant.
3.2.6 Determination of total phenolic content
The total phenolic content (TPC) in each herbal yogurt was determined using
Folin-Ciocalteu reagent method according to Shetty et al. (1995). Herbal yogurt
water extract (1.0ml) was pipetted into a test tube followed with the addition of 1ml
of 95% ethanol and 5ml of dH2O. After a thorough mixing, 0.5ml of 50% (v/v)
Folin-Ciocalteu reagent was added to each sample. After 5 minutes, 1ml of 5%
Na2CO3 (Merck) was added to the mixture. The solution was allowed to stand at
room temperature for 1 hour after which the absorbance at 725nm was measured by a
spectrophotometer (Shimadzu UV Mini 1240). Gallic acids in the range of 10-
200mg/L were prepared and the total phenolic content determined in the same
manner as described for the yogurt water extract. TPC in yogurt water extract was
read against garlic acid standard curve and expressed as gallic acid equivalent (GAE;
mg/L).
3.2.7 Microbial count
a) Enumeration of Lactobacillus spp.
Lactobacillus spp. was cultured on deMan, Rogosa and Sharpe (MRS) agar,
the preparation of which was adapted from the manufacturer (Ovoid Product Detail
Code: CM0361). MRS agars (62g/l) was suspended in 1 liter of distilled water and
boiled to dissolve the medium completely. It was then autoclaved at 121oC for 15
minutes and cooled to 45-50oC. Enumeration of lactobacilli species was carried out
using the pour plate method. A series of prepared decimal dilution (dilution from 10-3
to 10-7
) of yogurts were used by mixing yogurt sample (1ml) and 9ml of 1.5% sterile
buffered peptone. Samples were mixed thoroughly and each mixture was serially
repeated (1:10 dilution) 6 times using peptone water (Oxoid, UK) as the diluents.
Diluted yogurts (1ml) in triplicate were then placed on empty petri dishes and 15ml
of cooled (45oC) autoclaved MRS agar was poured in. The mixtures were mixed
thoroughly by swirling the petri dishes. The agar was placed on the flat surface for
about 15 minutes to allow the agar to solidify. The lid was sealed by using parafilm
and the petri dishes were incubated in an inverted position in the incubator at 37oC
for 24 hours followed by colony counting the next day.
b) Enumeration of S. thermophilus
M17 agar was used for the selective enumeration of S. thermophlius and the
agar was prepared according to Oxoid (Code: CM0785). M17 agar powder (48.25g)
was rehydrated in 950ml distilled water followed by autoclaving in 121oC for 15
minutes. The agar was cooled down to 50oC and 10% solution (w/v) of lactose
monohydrate (50ml) was added and the mixture was mixed thoroughly immediately
prior to pouring (15ml) onto petri dishes. The petri dishes were left cool to room
temperature to allow the agar to solidify. Diluted yogurt samples (0.1ml) were
delivered by sterile pipette onto the surface of the agar. Sterile spreaders were used to
spread inoculums evenly over the surface of the agar. The agar plates were incubated
(37oC) in inverted position and the colonies formed after 28-48 hours incubation
were then counted.
c) Viable cell count calculation
Bacteria in each diluted yogurt sample were enumerated by counting the
colony forming units (CFU) on the agar. The bacterial population in each ml of
yogurt was then calculated using the following formula:
CFU/ml = Number of colonies in a plate x (Dilution factor)
Inoculum (ml)
3.2.8 Sensory evaluation on herbal-yogurts
The sensory evaluation of herbal-yogurt and plain-yogurt was carried out
after an overnight storage at 4°C. A panel of 16 people (mean age = 24 years old)
assessed six descriptors i.e. visual appearance, body texture, aroma, sweetness,
sourness and overall taste using a sensory rating scale of 1-10 (1 for ‘extremely
dislike’ to 10 for ‘extremely like’) (Larmond, 1987). The panels recognized the
yogurts only by codes. Each panel was requested to rinse their mouth by drinking
mineral water after assessing each yogurt.
3.2.9 Inhibition of α-glucosidase activity
The assay for α-glucosidase activity was performed according to the method
described by Shetty et al. (2007). A volume of 500μl of homogenized herbal yogurt
water extract and 1000μl of 0.1 M phosphate buffer (pH 6.9) containing α-
glucosidase (Sigma Chemical Co.) solution (1.0 U/ml) were incubated in water bath
at 25°C for 10 min. Then, 250μl of 5mM p-nitrophenyl-α-D-glucopyranoside
solution in 0.1M phosphate buffer (pH 6.9) was added to each well. The reaction
mixtures were incubated at 25°C for 5 min. Absorbance readings were recorded at
405nm before and after incubation and compared to a control which had 500μl of
buffer solution in place of the extract.
The inhibition of α-glucosidase (%) by the yogurt extract was calculated as
follows:
% inhibition = [(Δ controlA450 – Δ sample extractA450)/ Δ control A450] x 100%
3.2.10 Inhibition of α-amylase activity
The inhibition of α-amylase by herbal yogurt water extract was assayed
according to Shetty et al. (2007). Porcine pancreatic α-amylase (EC 3.2.1.1,
0.5mg/ml, Sigma Chemicals Co.) in 0.02M sodium phosphate buffer (500μl, pH 6.9
with 0.006 M sodium chloride) was mixed with 500μl yogurt water extracts in a test
tube followed by incubation at 25°C for 10 min. Starch solution (1%, 500μl) in
0.02M sodium phosphate buffer (pH 6.9 with 0.006M sodium chloride) was then
added to each tube and the reaction mixtures were then incubated at 25°C for 10 min.
The reaction was stopped by the addition of 1.0 ml of dinitrosalicylic acid (DNSA)
color reagent. The test tubes were then incubated in a boiling water bath for 7
minutes followed by the addition of 1ml of tartarate (18.2%). After cooling to room
temperature, the reaction mixture was then diluted by adding 10 ml of distilled water
prior to absorbance reading at 540 nm (OD). The inhibition of α-amylase (%) yogurt
water extract was calculated as follows:
Inhibitory activity (%) = (ODcontrol – OD sample) / ODcontrol x 100
3.2.11 Calculation of IC50 for α-amylase and α-glucosidase inhibition activity
Enzyme inhibition was expressed as the concentration of inhibitory
compound that inhibit 50% of α-amylase or α-glucosidase activity (IC50), assuming
that the activity of the blank was 100%. To enable the determination of IC50, the
inhibition of enzymes at 3 different volume of yogurt extracts (500μl, 250μl and
125μl; with dH2O used when necessary to make up the volume to 500μl) were
measured. IC50 values were calculated using ED50plus vol.1 software, developed by
Mario H. Vargas, MD (Shetty et al., 2007).
3.2.12 Statistical analysis
All experiments were carried out using three independent batches of yogurts
and each sample, unless otherwise stated was analysed in duplicate. Data were
subjected to one-way ANOVA by SPSS®, version 17.0. Duncan’s multiple range
tests was used to compare the means among treatments and significant effect was
established by ANOVA at p≤ 0.05.
CHAPTER 4
RESULTS
4.1 pH and titratable acidity (TA) of yogurt after fermentation and during
refrigerated storage
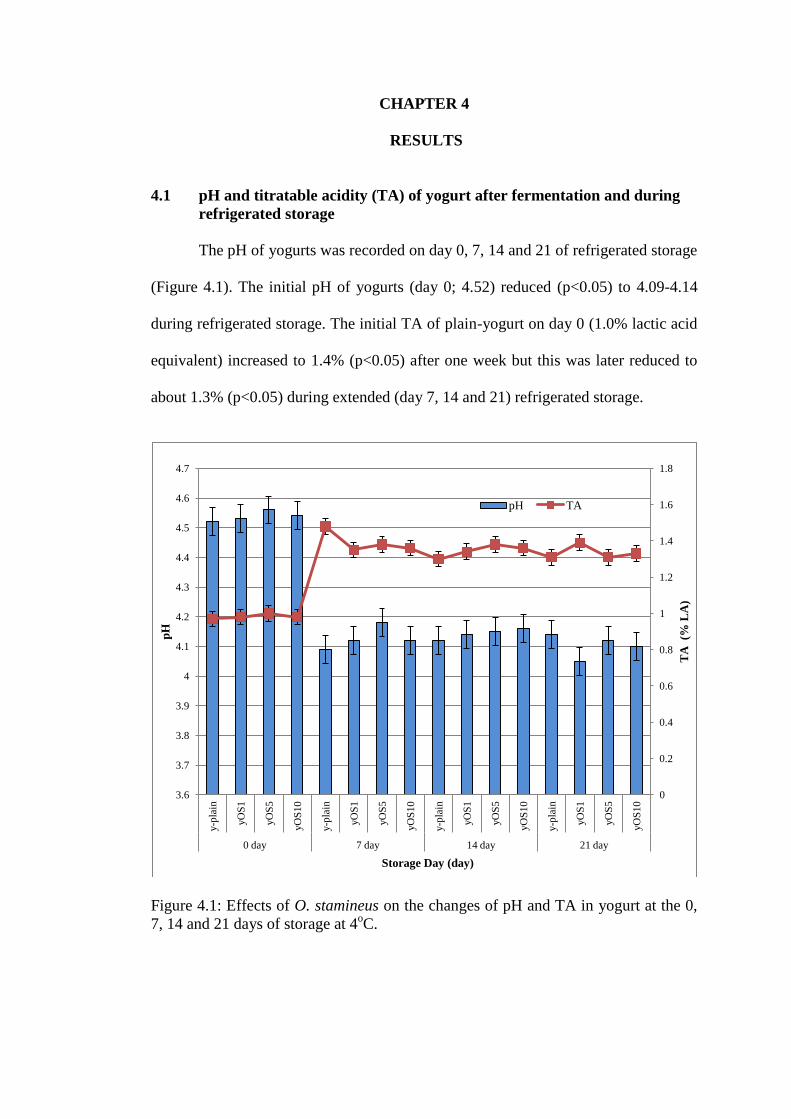
The pH of yogurts was recorded on day 0, 7, 14 and 21 of refrigerated storage
(Figure 4.1). The initial pH of yogurts (day 0; 4.52) reduced (p<0.05) to 4.09-4.14
during refrigerated storage. The initial TA of plain-yogurt on day 0 (1.0% lactic acid
equivalent) increased to 1.4% (p<0.05) after one week but this was later reduced to
about 1.3% (p<0.05) during extended (day 7, 14 and 21) refrigerated storage.
Figure 4.1: Effects of O. stamineus on the changes of pH and TA in yogurt at the 0,
7, 14 and 21 days of storage at 4oC.
0
0.2
0.4
0.6
0.8
1
1.2
1.4
1.6
1.8
3.6
3.7
3.8
3.9
4
4.1
4.2
4.3
4.4
4.5
4.6
4.7
y-p
lain
yO
S1
yO
S5
yO
S1
0
y-p
lain
yO
S1
yO
S5
yO
S1
0
y-p
lain
yO
S1
yO
S5
yO
S1
0
y-p
lain
yO
S1
yO
S5
yO
S1
0
0 day 7 day 14 day 21 day
TA
(%
LA
)
pH
Storage Day (day)
pH TA

Table 4.1: The percentage (%) of titratable acidity (TA) and pH of O. stamineus-yogurts and plain-yogurt during 21 days of
storage (4 (n=3).
0 day 7 day 14 day 21 day
pH TA pH TA pH TA pH TA
y plain
4.52±0.02 4.14±0.01 4.09±0.02 1.48±0.01 4.12±0.02 1.30±0.01 4.14±0.01 1.31±0.02
yOS1
4.53±0.08 4.05±0.01 4.12±0.01 1.35±0.00 4.14±0.03 1.34±0.01 4.05±0.01 1.39±0.01
yOS5
4.56±0.03 4.12±0.03 4.18±0.02 1.38±0.00 4.15±0.03 1.38±0.01 4.12±0.03 1.31±0.01
yOS10
4.54±0.05 4.10±0.00 4.12±0.01 1.36±0.01 4.16±0.03 1.36±0.01 4.10±0.00 1.33±0.01
4.1.1 Effects of O. stamineus on pH and TA of yogurt
The presence of O. stamineus water extract at different concentrations (1%,
5% and 10% for yOS1, yOS5 and yOS10 respectively) showed no differences
(p>0.05) on pH of the yogurt compared to plain-yogurt (control) during storage
(Figure 4.1). The TA of O. stamineus-yogurts was lower than plain-yogurt after 7
days of storage (1.35 and 1.48% respectively; p<0.05). However the differences
seen on day 7 were absent after extended refrigerated storage.
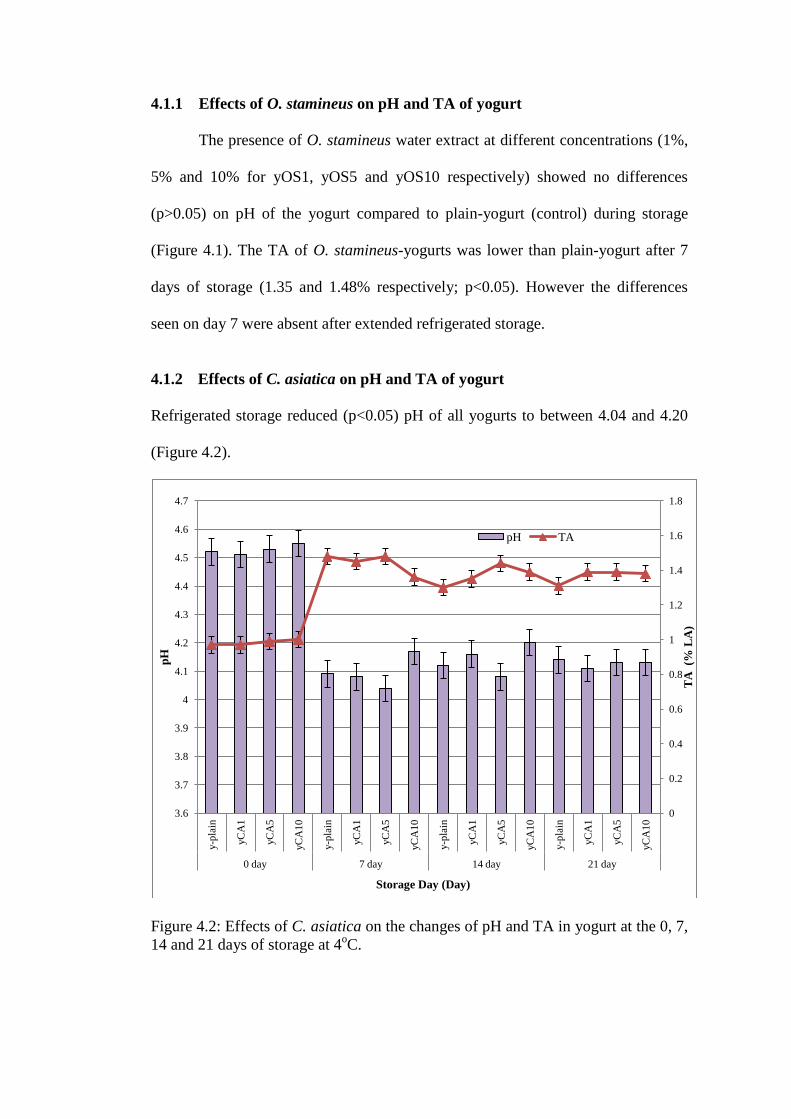
4.1.2 Effects of C. asiatica on pH and TA of yogurt
Refrigerated storage reduced (p<0.05) pH of all yogurts to between 4.04 and 4.20
(Figure 4.2).
Figure 4.2: Effects of C. asiatica on the changes of pH and TA in yogurt at the 0, 7,
14 and 21 days of storage at 4oC.
0
0.2
0.4
0.6
0.8
1
1.2
1.4
1.6
1.8
3.6
3.7
3.8
3.9
4
4.1
4.2
4.3
4.4
4.5
4.6
4.7
y-p
lain
yC
A1
yC
A5
yC
A1
0
y-p
lain
yC
A1
yC
A5
yC
A1
0
y-p
lain
yC
A1
yC
A5
yC
A1
0
y-p
lain
yC
A1
yC
A5
yC
A1
0
0 day 7 day 14 day 21 day
TA
(%
LA
)
pH
Storage Day (Day)
pH TA
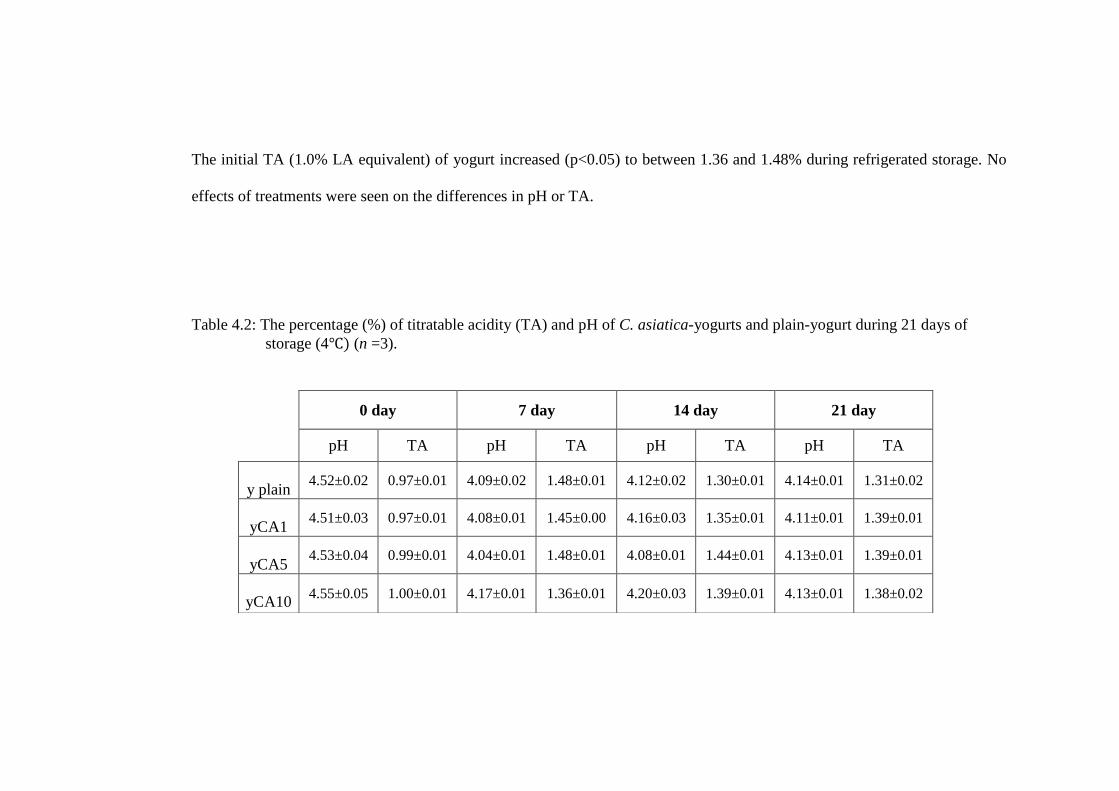
The initial TA (1.0% LA equivalent) of yogurt increased (p<0.05) to between 1.36 and 1.48% during refrigerated storage. No
effects of treatments were seen on the differences in pH or TA.
Table 4.2: The percentage (%) of titratable acidity (TA) and pH of C. asiatica-yogurts and plain-yogurt during 21 days of
storage (4 (n =3).
0 day 7 day 14 day 21 day
pH TA pH TA pH TA pH TA
y plain 4.52±0.02 0.97±0.01 4.09±0.02 1.48±0.01 4.12±0.02 1.30±0.01 4.14±0.01 1.31±0.02
yCA1 4.51±0.03 0.97±0.01 4.08±0.01 1.45±0.00 4.16±0.03 1.35±0.01 4.11±0.01 1.39±0.01
yCA5 4.53±0.04 0.99±0.01 4.04±0.01 1.48±0.01 4.08±0.01 1.44±0.01 4.13±0.01 1.39±0.01
yCA10 4.55±0.05 1.00±0.01 4.17±0.01 1.36±0.01 4.20±0.03 1.39±0.01 4.13±0.01 1.38±0.02
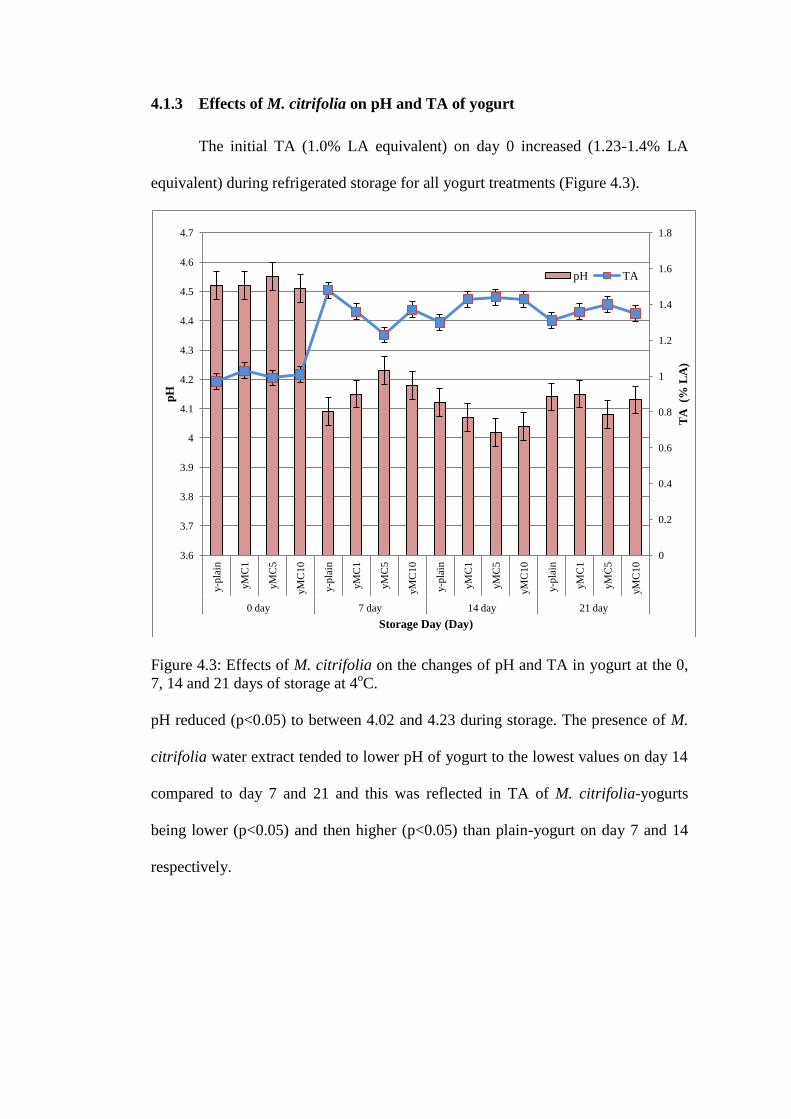
4.1.3 Effects of M. citrifolia on pH and TA of yogurt
The initial TA (1.0% LA equivalent) on day 0 increased (1.23-1.4% LA
equivalent) during refrigerated storage for all yogurt treatments (Figure 4.3).
Figure 4.3: Effects of M. citrifolia on the changes of pH and TA in yogurt at the 0,
7, 14 and 21 days of storage at 4oC.
pH reduced (p<0.05) to between 4.02 and 4.23 during storage. The presence of M.
citrifolia water extract tended to lower pH of yogurt to the lowest values on day 14
compared to day 7 and 21 and this was reflected in TA of M. citrifolia-yogurts
being lower (p<0.05) and then higher (p<0.05) than plain-yogurt on day 7 and 14
respectively.
0
0.2
0.4
0.6
0.8
1
1.2
1.4
1.6
1.8
3.6
3.7
3.8
3.9
4
4.1
4.2
4.3
4.4
4.5
4.6
4.7
y-p
lain
yM
C1
yM
C5
yM
C1
0
y-p
lain
yM
C1
yM
C5
yM
C1
0
y-p
lain
yM
C1
yM
C5
yM
C1
0
y-p
lain
yM
C1
yM
C5
yM
C1
0
0 day 7 day 14 day 21 day
TA
(%
LA
)
pH
Storage Day (Day)
pH TA
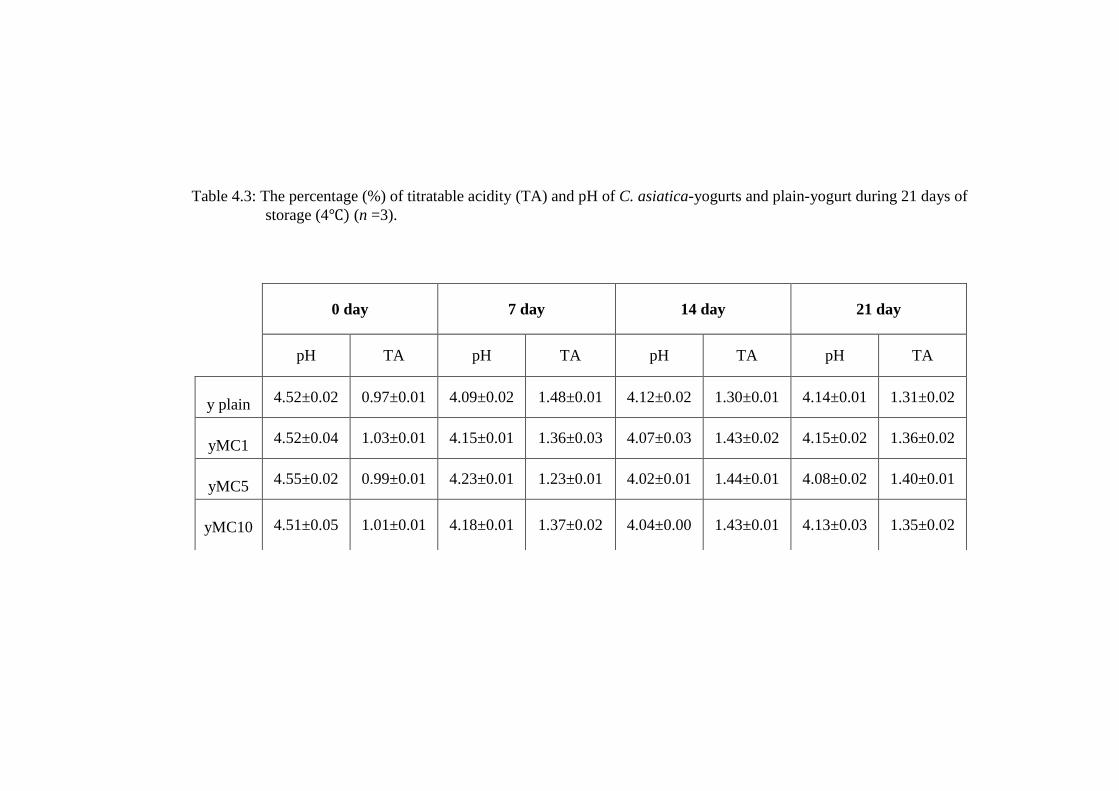
Table 4.3: The percentage (%) of titratable acidity (TA) and pH of C. asiatica-yogurts and plain-yogurt during 21 days of
storage (4 (n =3).
0 day 7 day 14 day 21 day
pH TA pH TA pH TA pH TA
y plain 4.52±0.02 0.97±0.01 4.09±0.02 1.48±0.01 4.12±0.02 1.30±0.01 4.14±0.01 1.31±0.02
yMC1 4.52±0.04 1.03±0.01 4.15±0.01 1.36±0.03 4.07±0.03 1.43±0.02 4.15±0.02 1.36±0.02
yMC5 4.55±0.02 0.99±0.01 4.23±0.01 1.23±0.01 4.02±0.01 1.44±0.01 4.08±0.02 1.40±0.01
yMC10 4.51±0.05 1.01±0.01 4.18±0.01 1.37±0.02 4.04±0.00 1.43±0.01 4.13±0.03 1.35±0.02
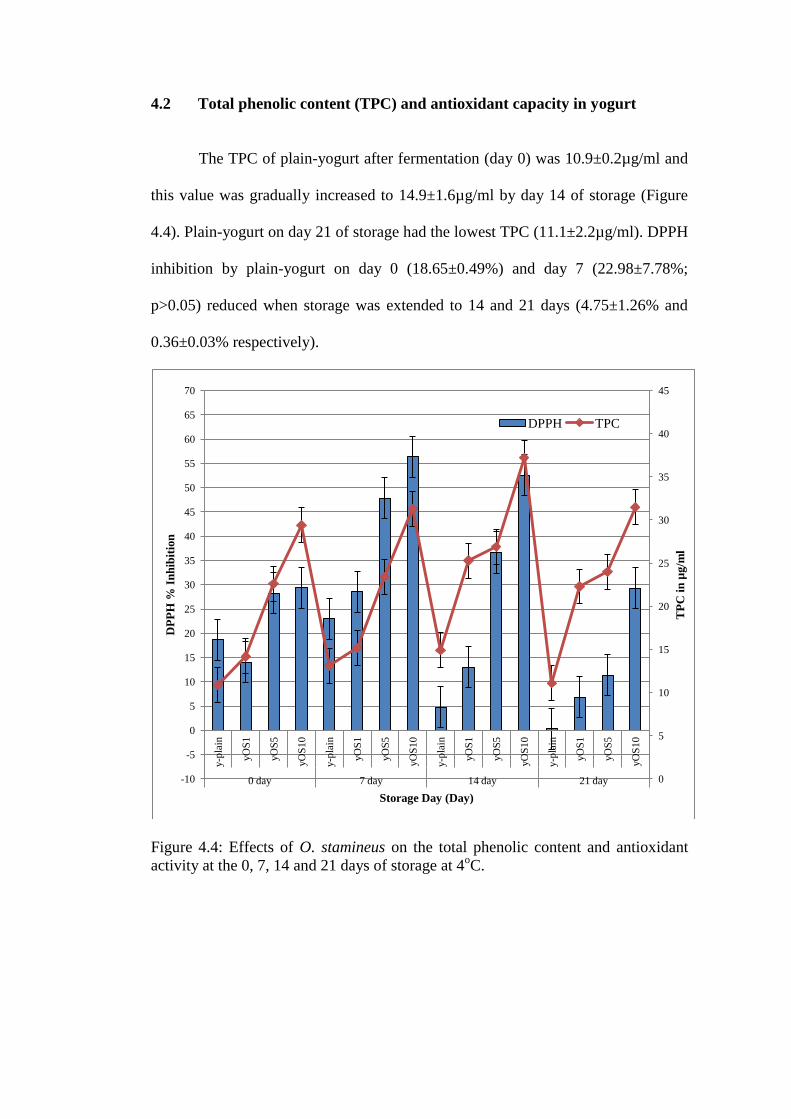
4.2 Total phenolic content (TPC) and antioxidant capacity in yogurt
The TPC of plain-yogurt after fermentation (day 0) was 10.9±0.2µg/ml and
this value was gradually increased to 14.9±1.6µg/ml by day 14 of storage (Figure
4.4). Plain-yogurt on day 21 of storage had the lowest TPC (11.1±2.2µg/ml). DPPH
inhibition by plain-yogurt on day 0 (18.65±0.49%) and day 7 (22.98±7.78%;
p>0.05) reduced when storage was extended to 14 and 21 days (4.75±1.26% and
0.36±0.03% respectively).
Figure 4.4: Effects of O. stamineus on the total phenolic content and antioxidant
activity at the 0, 7, 14 and 21 days of storage at 4oC.
0
5
10
15
20
25
30
35
40
45
-10
-5
0
5
10
15
20
25
30
35
40
45
50
55
60
65
70
y-p
lain
yO
S1
yO
S5
yO
S1
0
y-p
lain
yO
S1
yO
S5
yO
S1
0
y-p
lain
yO
S1
yO
S5
yO
S1
0
y-p
lain
yO
S1
yO
S5
yO
S1
0
0 day 7 day 14 day 21 day
TP
C i
n µ
g/m
l
DP
PH
% I
nh
ibit
ion
Storage Day (Day)
DPPH TPC
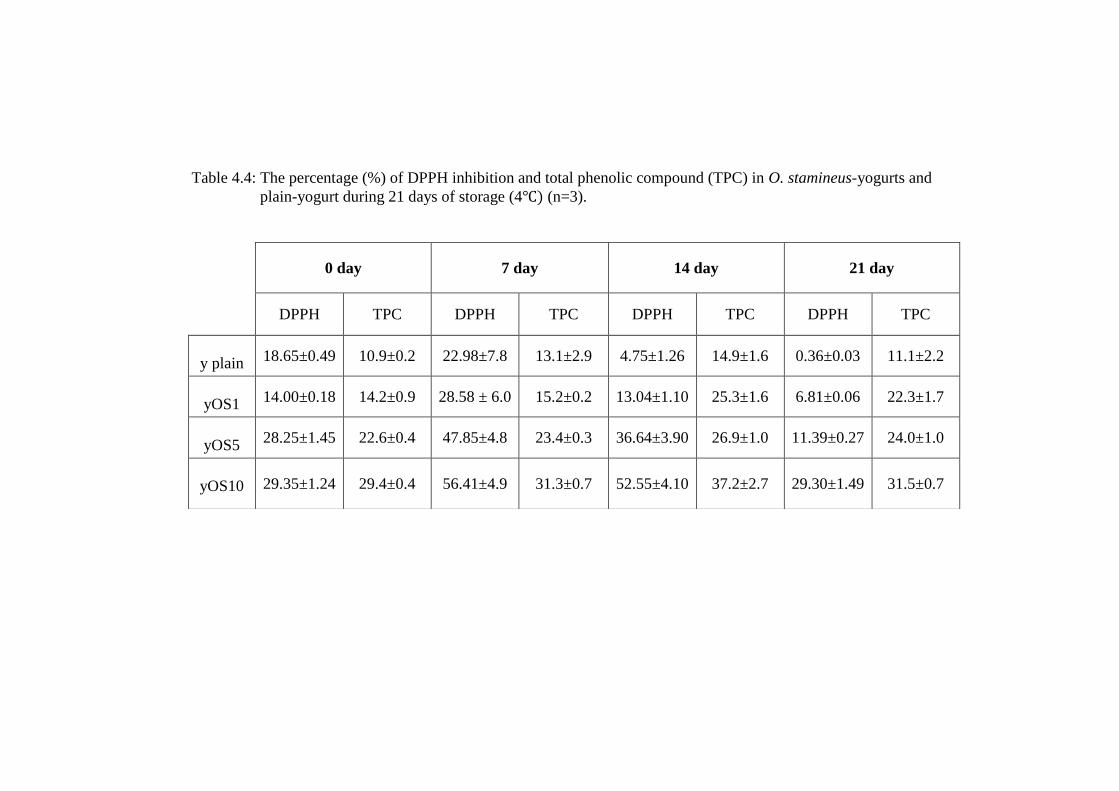
Table 4.4: The percentage (%) of DPPH inhibition and total phenolic compound (TPC) in O. stamineus-yogurts and
plain-yogurt during 21 days of storage (4 (n=3).
0 day 7 day 14 day 21 day
DPPH TPC DPPH TPC DPPH TPC DPPH TPC
y plain 18.65±0.49 10.9±0.2 22.98±7.8 13.1±2.9 4.75±1.26 14.9±1.6 0.36±0.03 11.1±2.2
yOS1 14.00±0.18 14.2±0.9 28.58 ± 6.0 15.2±0.2 13.04±1.10 25.3±1.6 6.81±0.06 22.3±1.7
yOS5 28.25±1.45 22.6±0.4 47.85±4.8 23.4±0.3 36.64±3.90 26.9±1.0 11.39±0.27 24.0±1.0
yOS10 29.35±1.24 29.4±0.4 56.41±4.9 31.3±0.7 52.55±4.10 37.2±2.7 29.30±1.49 31.5±0.7
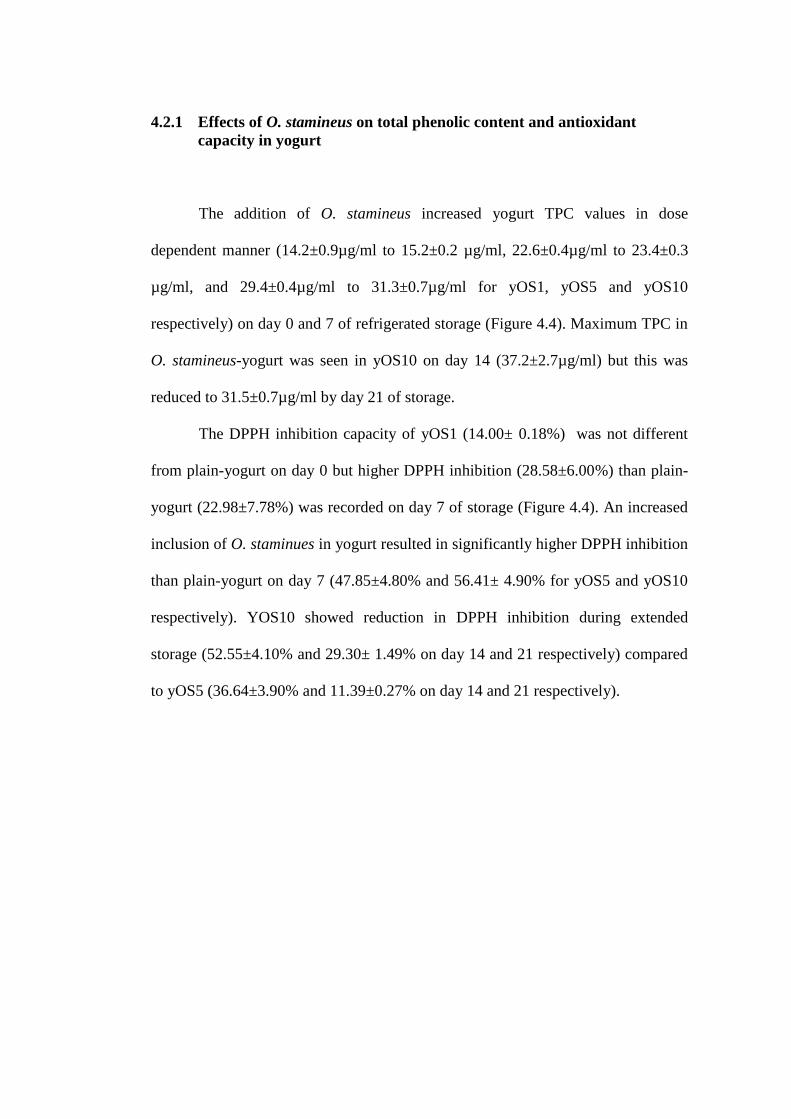
4.2.1 Effects of O. stamineus on total phenolic content and antioxidant
capacity in yogurt
The addition of O. stamineus increased yogurt TPC values in dose
dependent manner (14.2±0.9µg/ml to 15.2±0.2 µg/ml, 22.6±0.4µg/ml to 23.4±0.3
µg/ml, and 29.4±0.4µg/ml to 31.3±0.7µg/ml for yOS1, yOS5 and yOS10
respectively) on day 0 and 7 of refrigerated storage (Figure 4.4). Maximum TPC in
O. stamineus-yogurt was seen in yOS10 on day 14 (37.2±2.7µg/ml) but this was
reduced to 31.5±0.7µg/ml by day 21 of storage.
The DPPH inhibition capacity of yOS1 (14.00± 0.18%) was not different
from plain-yogurt on day 0 but higher DPPH inhibition (28.58±6.00%) than plain-
yogurt (22.98±7.78%) was recorded on day 7 of storage (Figure 4.4). An increased
inclusion of O. staminues in yogurt resulted in significantly higher DPPH inhibition
than plain-yogurt on day 7 (47.85±4.80% and 56.41± 4.90% for yOS5 and yOS10
respectively). YOS10 showed reduction in DPPH inhibition during extended
storage (52.55±4.10% and 29.30± 1.49% on day 14 and 21 respectively) compared
to yOS5 (36.64±3.90% and 11.39±0.27% on day 14 and 21 respectively).
4.2.2 Effects of C. asiatica on total phenolic content and antioxidant capacity
in yogurt
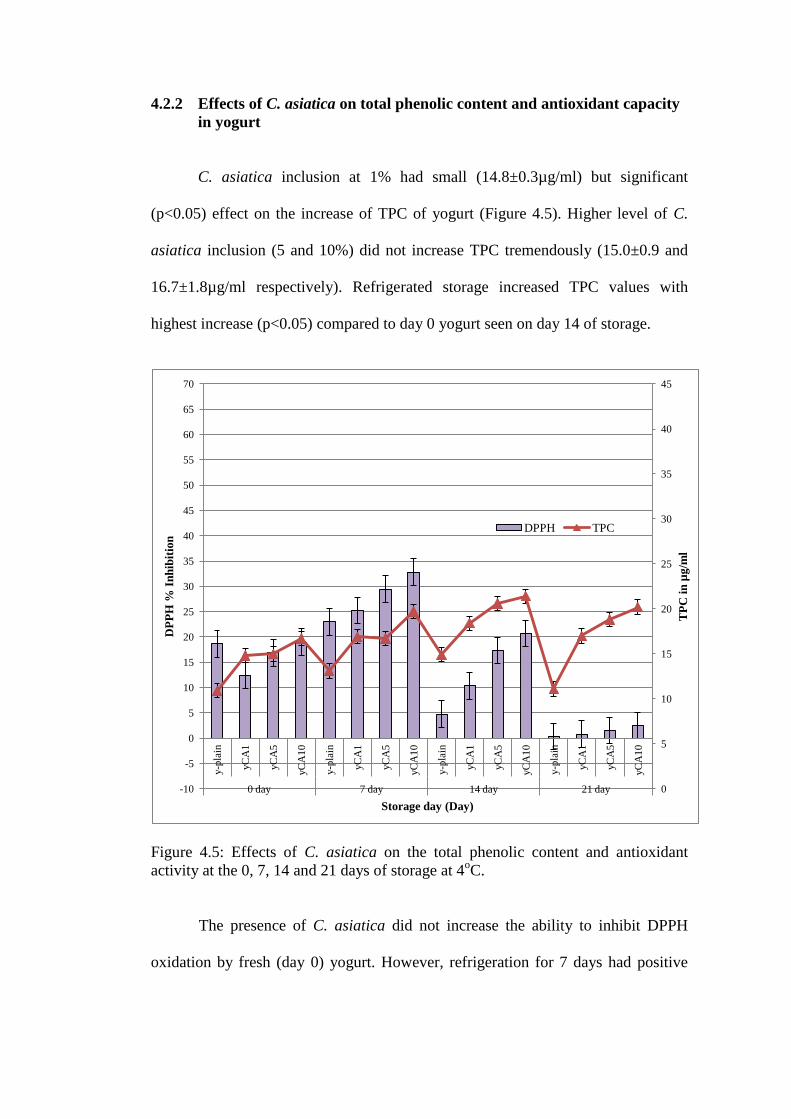
C. asiatica inclusion at 1% had small (14.8±0.3µg/ml) but significant
(p<0.05) effect on the increase of TPC of yogurt (Figure 4.5). Higher level of C.
asiatica inclusion (5 and 10%) did not increase TPC tremendously (15.0±0.9 and
16.7±1.8µg/ml respectively). Refrigerated storage increased TPC values with
highest increase (p<0.05) compared to day 0 yogurt seen on day 14 of storage.
Figure 4.5: Effects of C. asiatica on the total phenolic content and antioxidant
activity at the 0, 7, 14 and 21 days of storage at 4oC.
The presence of C. asiatica did not increase the ability to inhibit DPPH
oxidation by fresh (day 0) yogurt. However, refrigeration for 7 days had positive
0
5
10
15
20
25
30
35
40
45
-10
-5
0
5
10
15
20
25
30
35
40
45
50
55
60
65
70
y-p
lain
yC
A1
yC
A5
yC
A1
0
y-p
lain
yC
A1
yC
A5
yC
A1
0
y-p
lain
yC
A1
yC
A5
yC
A1
0
y-p
lain
yC
A1
yC
A5
yC
A1
0
0 day 7 day 14 day 21 day
TP
C i
n µ
g/m
l
DP
PH
% I
nh
ibit
ion
Storage day (Day)
DPPH TPC
effect on the enhancement of C. asiatica–yogurts to inhibit DPPH oxidation with
significant effect (p<0.05) seen by yCA1, yCA5 and yCA10 (25.24±0.36%,
29.48±3.49% and 32.84±7.18% respectively) compared to plain-yogurt
(22.98±7.78%).
Refrigerated storage for 14 days reduced yogurts inhibition of DPPH
oxidation. Increasing C. asiatica content in yogurt had no effect to minimize the
loss of antioxidant activities of yogurt due to storage. All C. asiatica–yogurts on
day 14 had higher antioxidant activities than plain-yogurt (4.75±1.26%) with
significant effects seen in yCA1, yCA5 and yCA10 (10.31±1.43%, 17.33±1.58%
and 20.7±0.41% respectively; p<0.05). Antioxidant activities were at the minimum
(<3%) for all yogurts refrigerated for 21 days.
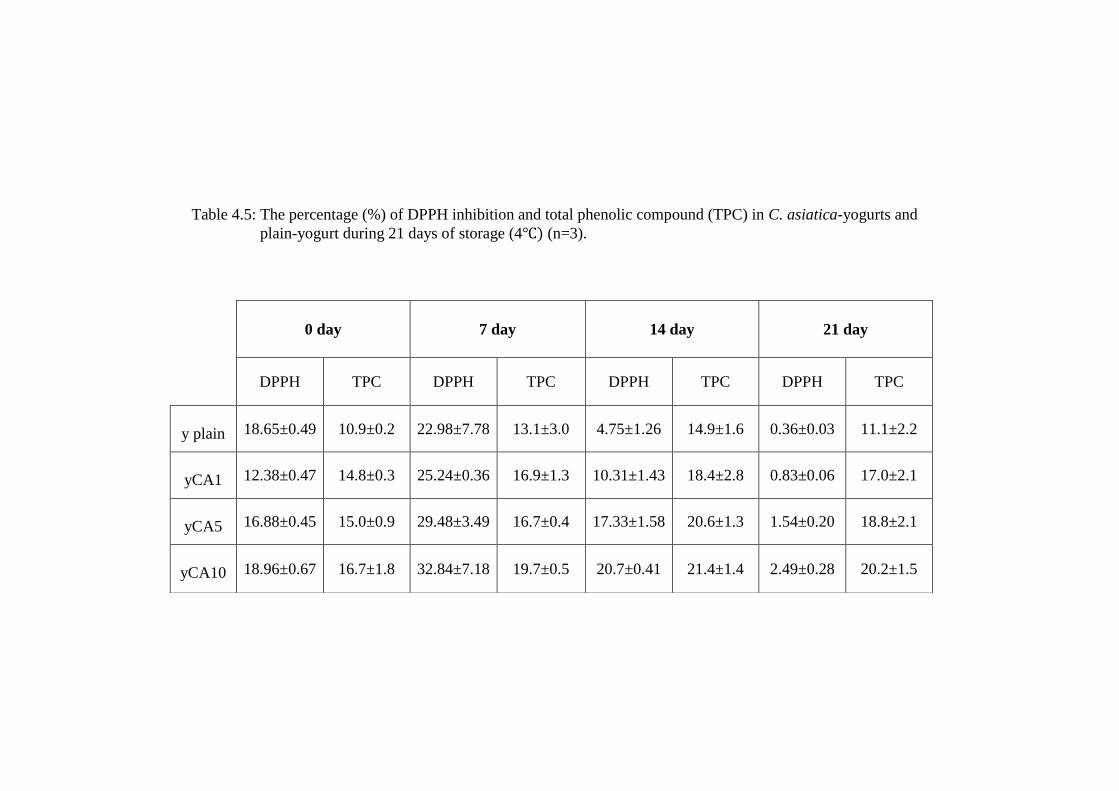
Table 4.5: The percentage (%) of DPPH inhibition and total phenolic compound (TPC) in C. asiatica-yogurts and
plain-yogurt during 21 days of storage (4 (n=3).
0 day 7 day 14 day 21 day
DPPH TPC DPPH TPC DPPH TPC DPPH TPC
y plain 18.65±0.49 10.9±0.2 22.98±7.78 13.1±3.0 4.75±1.26 14.9±1.6 0.36±0.03 11.1±2.2
yCA1 12.38±0.47 14.8±0.3 25.24±0.36 16.9±1.3 10.31±1.43 18.4±2.8 0.83±0.06 17.0±2.1
yCA5 16.88±0.45 15.0±0.9 29.48±3.49 16.7±0.4 17.33±1.58 20.6±1.3 1.54±0.20 18.8±2.1
yCA10 18.96±0.67 16.7±1.8 32.84±7.18 19.7±0.5 20.7±0.41 21.4±1.4 2.49±0.28 20.2±1.5
4.2.3 Effects of M. citrifolia on total phenolic content and antioxidant
capacity in yogurt
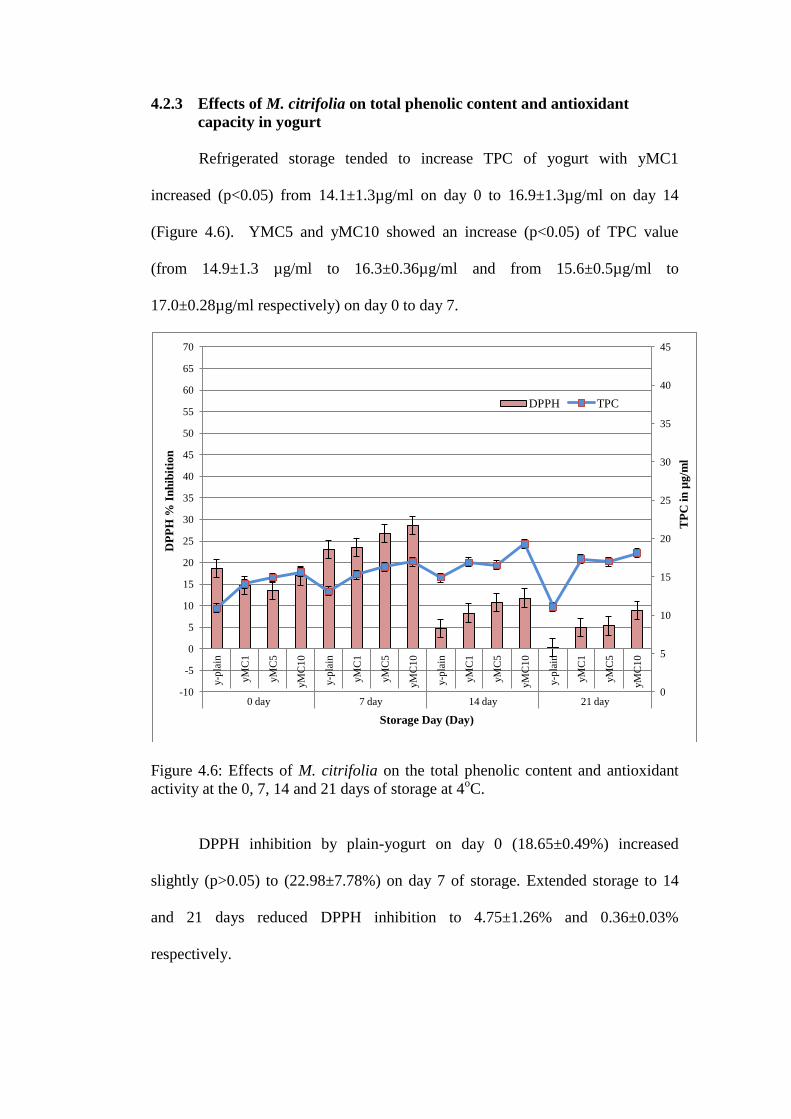
Refrigerated storage tended to increase TPC of yogurt with yMC1
increased (p<0.05) from 14.1±1.3µg/ml on day 0 to 16.9±1.3µg/ml on day 14
(Figure 4.6). YMC5 and yMC10 showed an increase (p<0.05) of TPC value
(from 14.9±1.3 µg/ml to 16.3±0.36µg/ml and from 15.6±0.5µg/ml to
17.0±0.28µg/ml respectively) on day 0 to day 7.
Figure 4.6: Effects of M. citrifolia on the total phenolic content and antioxidant
activity at the 0, 7, 14 and 21 days of storage at 4oC.
DPPH inhibition by plain-yogurt on day 0 (18.65±0.49%) increased
slightly (p>0.05) to (22.98±7.78%) on day 7 of storage. Extended storage to 14
and 21 days reduced DPPH inhibition to 4.75±1.26% and 0.36±0.03%
respectively.
0
5
10
15
20
25
30
35
40
45
-10
-5
0
5
10
15
20
25
30
35
40
45
50
55
60
65
70
y-p
lain
yM
C1
yM
C5
yM
C1
0
y-p
lain
yM
C1
yM
C5
yM
C1
0
y-p
lain
yM
C1
yM
C5
yM
C1
0
y-p
lain
yM
C1
yM
C5
yM
C1
0
0 day 7 day 14 day 21 day
TP
C i
n µ
g/m
l
DP
PH
% I
nh
ibit
ion
Storage Day (Day)
DPPH TPC
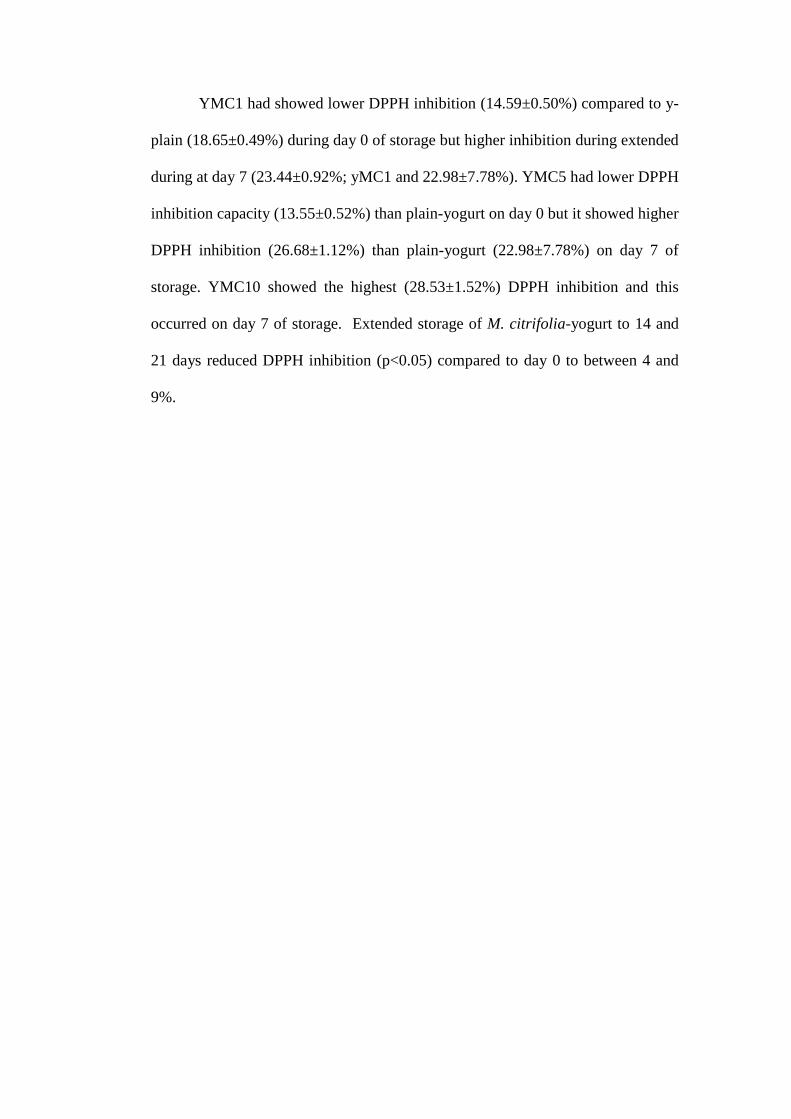
YMC1 had showed lower DPPH inhibition (14.59±0.50%) compared to y-
plain (18.65±0.49%) during day 0 of storage but higher inhibition during extended
during at day 7 (23.44±0.92%; yMC1 and 22.98±7.78%). YMC5 had lower DPPH
inhibition capacity (13.55±0.52%) than plain-yogurt on day 0 but it showed higher
DPPH inhibition (26.68±1.12%) than plain-yogurt (22.98±7.78%) on day 7 of
storage. YMC10 showed the highest (28.53±1.52%) DPPH inhibition and this
occurred on day 7 of storage. Extended storage of M. citrifolia-yogurt to 14 and
21 days reduced DPPH inhibition (p<0.05) compared to day 0 to between 4 and
9%.
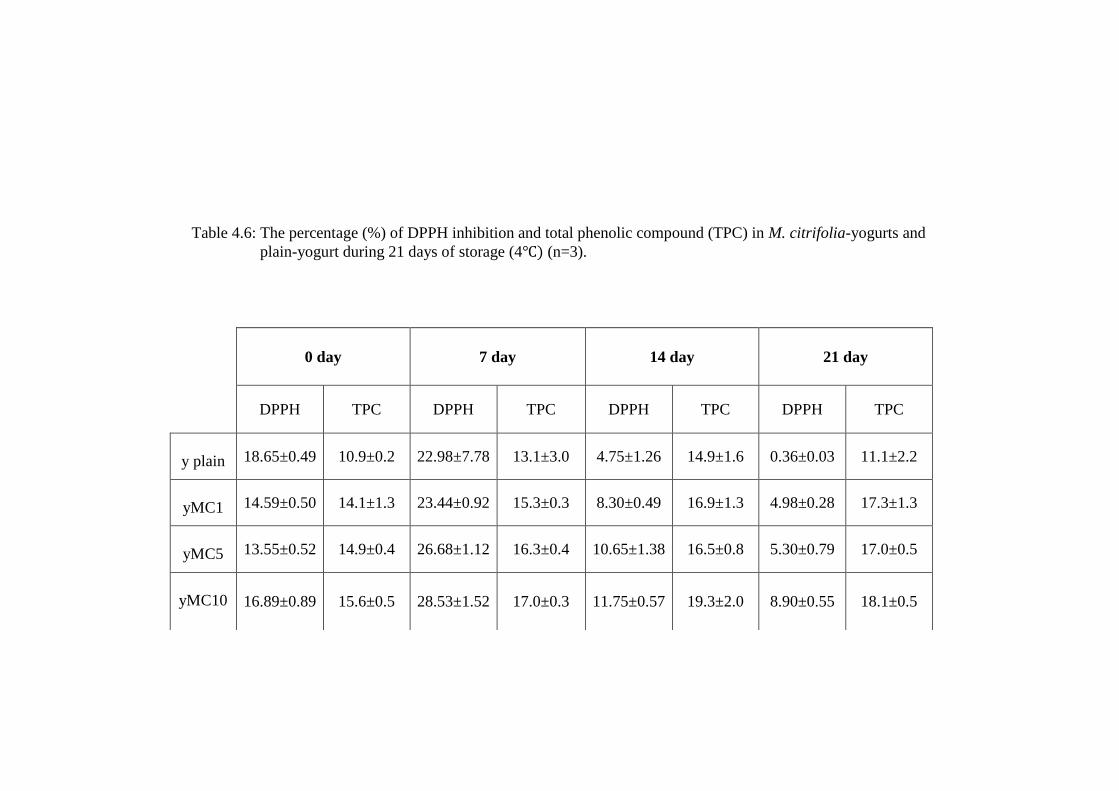
Table 4.6: The percentage (%) of DPPH inhibition and total phenolic compound (TPC) in M. citrifolia-yogurts and
plain-yogurt during 21 days of storage (4 (n=3).
0 day 7 day 14 day 21 day
DPPH TPC DPPH TPC DPPH TPC DPPH TPC
y plain 18.65±0.49 10.9±0.2 22.98±7.78 13.1±3.0 4.75±1.26 14.9±1.6 0.36±0.03 11.1±2.2
yMC1 14.59±0.50 14.1±1.3 23.44±0.92 15.3±0.3 8.30±0.49 16.9±1.3 4.98±0.28 17.3±1.3
yMC5 13.55±0.52 14.9±0.4 26.68±1.12 16.3±0.4 10.65±1.38 16.5±0.8 5.30±0.79 17.0±0.5
yMC10 16.89±0.89 15.6±0.5 28.53±1.52 17.0±0.3 11.75±0.57 19.3±2.0 8.90±0.55 18.1±0.5
4.3 Viability of Lactobacillus spp. in yogurt
Lactobacillus spp. in plain-yogurt was 5.60x10⁸cfu/ml in fresh (day 0) yogurt
(Figure 4.7a). Refrigerated storage of yogurt resulted in small increase in viable
bacteria count with mean values being significantly higher on days 7 and 14 yogurt
compared to day 0 yogurts.
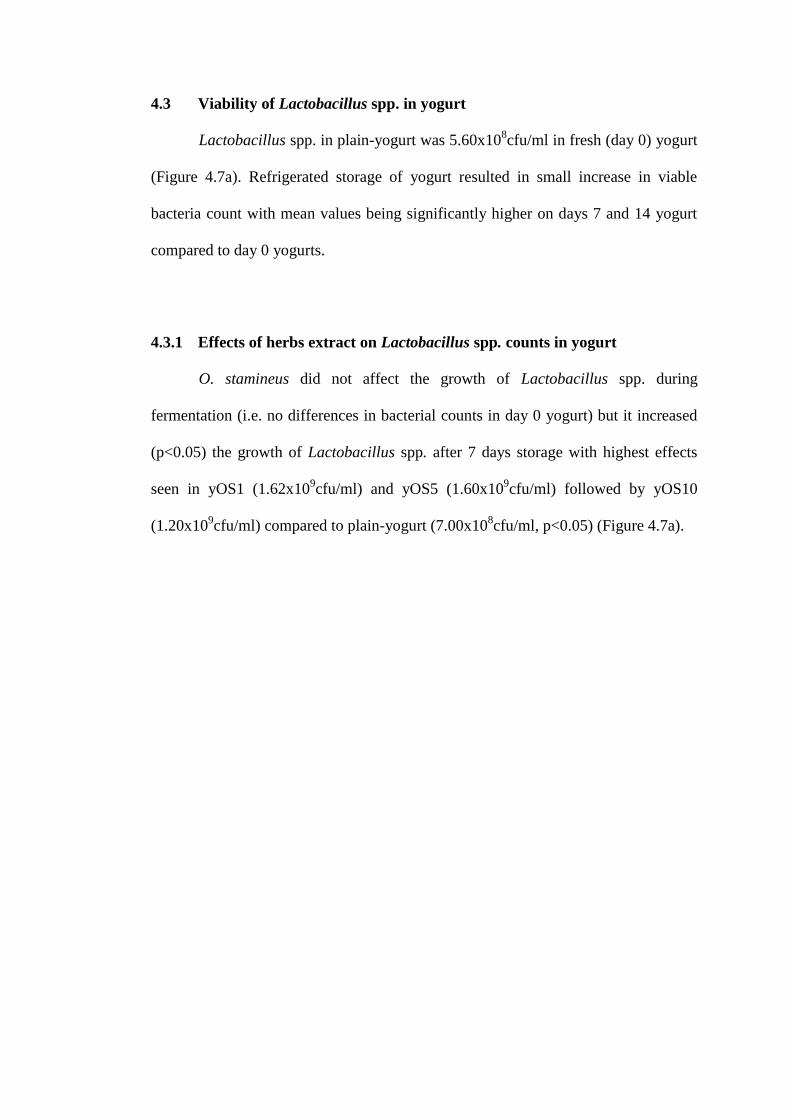
4.3.1 Effects of herbs extract on Lactobacillus spp. counts in yogurt
O. stamineus did not affect the growth of Lactobacillus spp. during
fermentation (i.e. no differences in bacterial counts in day 0 yogurt) but it increased
(p<0.05) the growth of Lactobacillus spp. after 7 days storage with highest effects
seen in yOS1 (1.62x10⁹cfu/ml) and yOS5 (1.60x10
9cfu/ml) followed by yOS10
(1.20x10⁹cfu/ml) compared to plain-yogurt (7.00x10
8cfu/ml, p<0.05) (Figure 4.7a).
Figure 4.7a: Effects of O. stamineus on the viability of Lactobacillus spp. during
storage at 4oC. Each data represents the means
\of triplicate determination.
Extended refrigerated storage resulted in reduction in viable Lactobacillus
spp. counts by day 14 (8.70x10⁸ to 1.07x10
9cfu/ml) and day 21 (6.80x10
8 to
9.00x10⁸cfu/ml) and these were not different from plain-yogurt at respective storage
days.
Table 4.7: Enumeration (Log10: cfu g-1
) of Lactobacillus spp. growth in
O. stamineus-yogurts and plain-yogurt during 21 days of storage
(4 (n=3).
0.00E+00
2.00E+08
4.00E+08
6.00E+08
8.00E+08
1.00E+09
1.20E+09
1.40E+09
1.60E+09
1.80E+09
2.00E+09
Day 0 Day 7 Day 14 Day 21
Log
10
(cf
u g
-1)
Storage Day (Day)
y-plain
yOS1
yOS5
yOS10
Day 0 Day 7 Day 14 Day 21
y-plain 5.60E+08 7.00E+08 7.70E+08 6.90E+08
yOS1 4.40E+08 1.62E+09 1.07E+09 7.40E+08
yOS5 6.30E+08 1.60E+09 9.40E+08 6.80E+08
yOS10 5.90E+08 1.20E+09 8.70E+08 9.00E+08
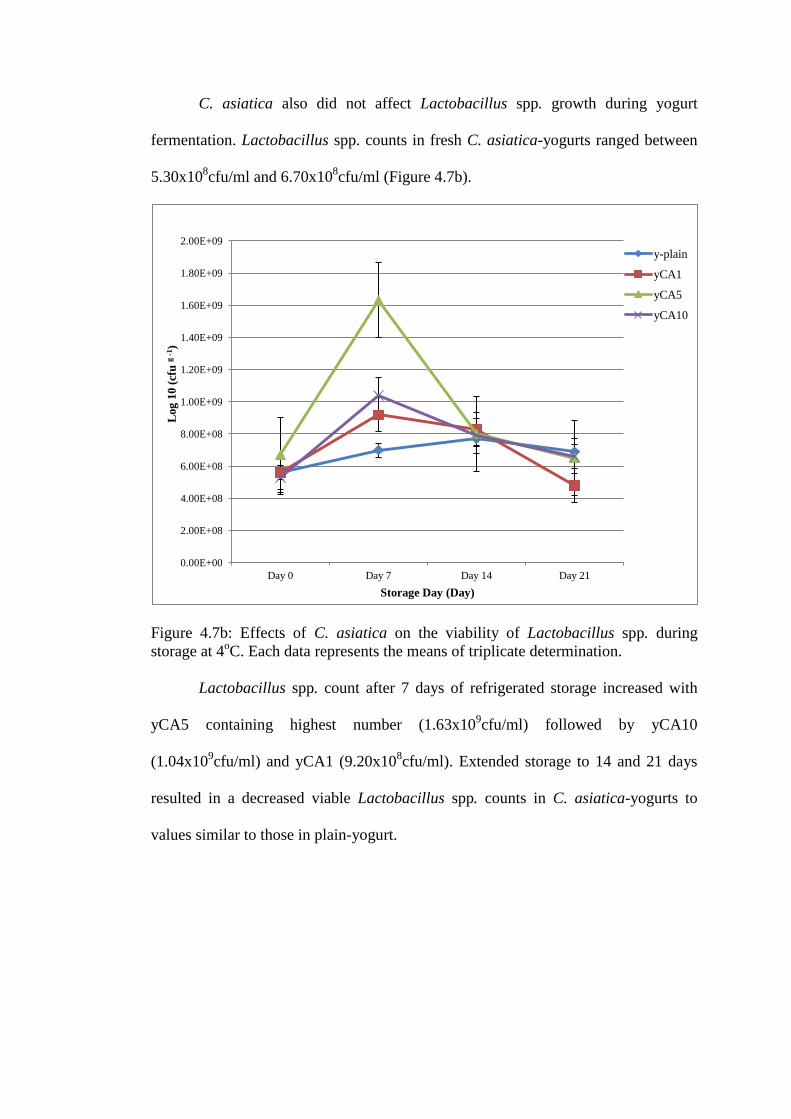
C. asiatica also did not affect Lactobacillus spp. growth during yogurt
fermentation. Lactobacillus spp. counts in fresh C. asiatica-yogurts ranged between
5.30x10⁸cfu/ml and 6.70x10
8cfu/ml (Figure 4.7b).
Figure 4.7b: Effects of C. asiatica on the viability of Lactobacillus spp. during
storage at 4oC. Each data represents the means of triplicate determination.
Lactobacillus spp. count after 7 days of refrigerated storage increased with
yCA5 containing highest number (1.63x10⁹cfu/ml) followed by yCA10
(1.04x10⁹cfu/ml) and yCA1 (9.20x10
8cfu/ml). Extended storage to 14 and 21 days
resulted in a decreased viable Lactobacillus spp. counts in C. asiatica-yogurts to
values similar to those in plain-yogurt.
0.00E+00
2.00E+08
4.00E+08
6.00E+08
8.00E+08
1.00E+09
1.20E+09
1.40E+09
1.60E+09
1.80E+09
2.00E+09
Day 0 Day 7 Day 14 Day 21
Log
10
(cf
u g
-1)
Storage Day (Day)
y-plain
yCA1
yCA5
yCA10
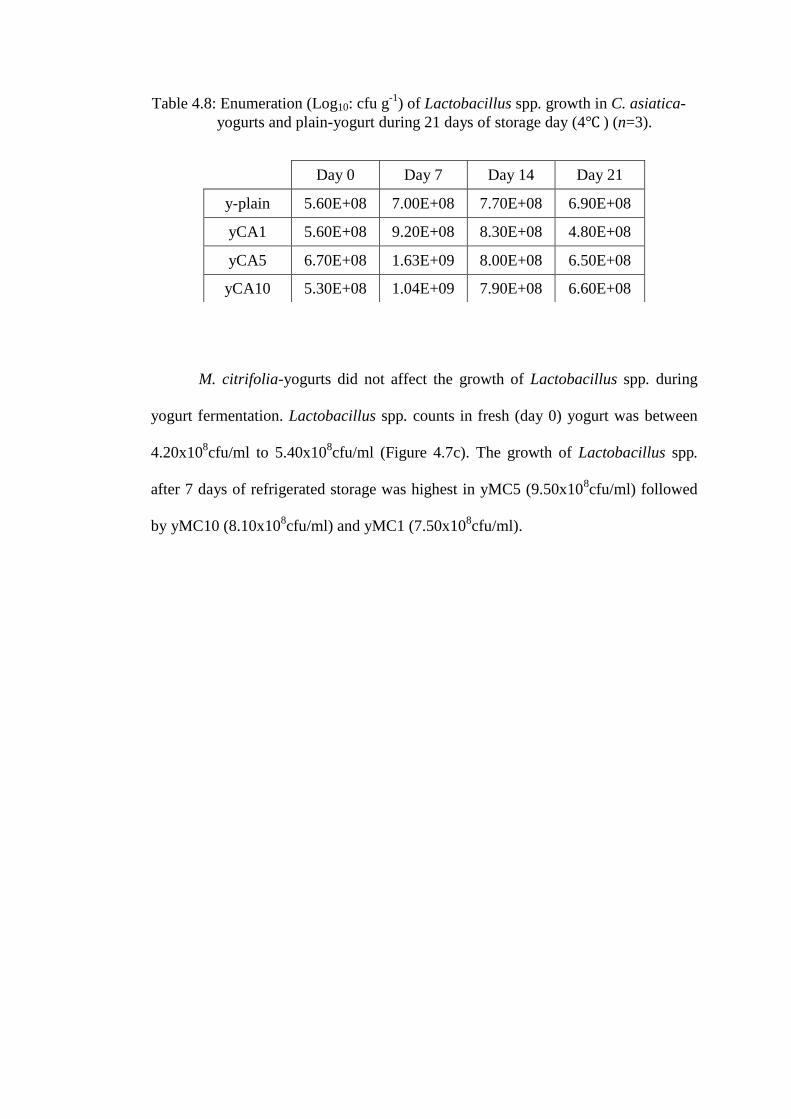
Table 4.8: Enumeration (Log10: cfu g-1
) of Lactobacillus spp. growth in C. asiatica-
yogurts and plain-yogurt during 21 days of storage day (4 ) (n=3).
M. citrifolia-yogurts did not affect the growth of Lactobacillus spp. during
yogurt fermentation. Lactobacillus spp. counts in fresh (day 0) yogurt was between
4.20x10⁸cfu/ml to 5.40x10
8cfu/ml (Figure 4.7c). The growth of Lactobacillus spp.
after 7 days of refrigerated storage was highest in yMC5 (9.50x10⁸cfu/ml) followed
by yMC10 (8.10x10⁸cfu/ml) and yMC1 (7.50x10
8cfu/ml).
Day 0 Day 7 Day 14 Day 21
y-plain 5.60E+08 7.00E+08 7.70E+08 6.90E+08
yCA1 5.60E+08 9.20E+08 8.30E+08 4.80E+08
yCA5 6.70E+08 1.63E+09 8.00E+08 6.50E+08
yCA10 5.30E+08 1.04E+09 7.90E+08 6.60E+08
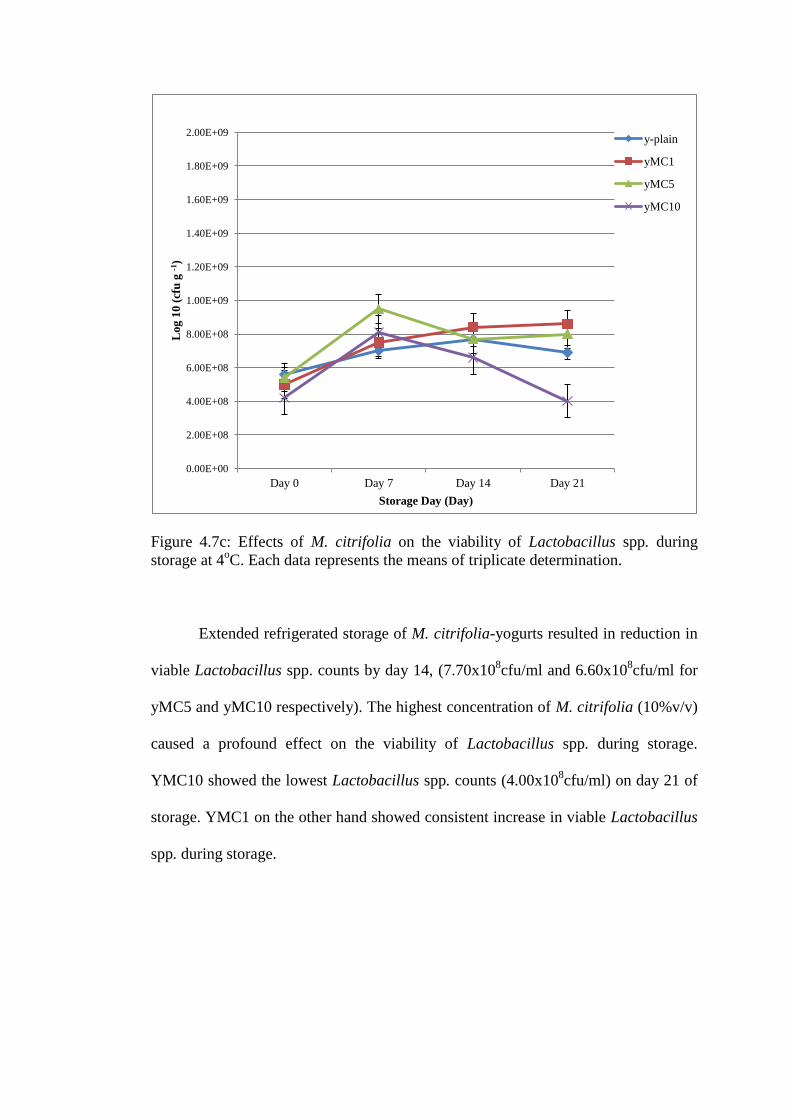
Figure 4.7c: Effects of M. citrifolia on the viability of Lactobacillus spp. during
storage at 4oC. Each data represents the means of triplicate determination.
Extended refrigerated storage of M. citrifolia-yogurts resulted in reduction in
viable Lactobacillus spp. counts by day 14, (7.70x10⁸cfu/ml and 6.60x10
8cfu/ml for
yMC5 and yMC10 respectively). The highest concentration of M. citrifolia (10%v/v)
caused a profound effect on the viability of Lactobacillus spp. during storage.
YMC10 showed the lowest Lactobacillus spp. counts (4.00x10⁸cfu/ml) on day 21 of
storage. YMC1 on the other hand showed consistent increase in viable Lactobacillus
spp. during storage.
0.00E+00
2.00E+08
4.00E+08
6.00E+08
8.00E+08
1.00E+09
1.20E+09
1.40E+09
1.60E+09
1.80E+09
2.00E+09
Day 0 Day 7 Day 14 Day 21
Log
10
(cf
u g
-1)
Storage Day (Day)
y-plain
yMC1
yMC5
yMC10
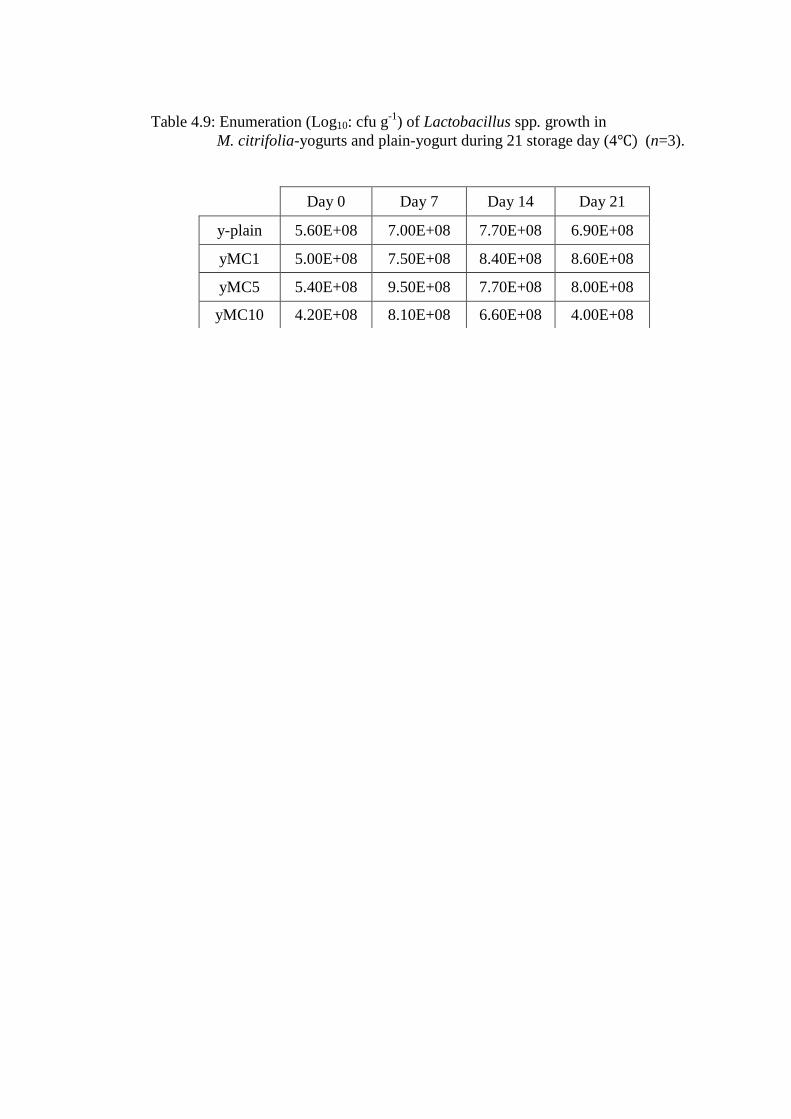
Table 4.9: Enumeration (Log10: cfu g-1
) of Lactobacillus spp. growth in
M. citrifolia-yogurts and plain-yogurt during 21 storage day (4 (n=3).
Day 0 Day 7 Day 14 Day 21
y-plain 5.60E+08 7.00E+08 7.70E+08 6.90E+08
yMC1 5.00E+08 7.50E+08 8.40E+08 8.60E+08
yMC5 5.40E+08 9.50E+08 7.70E+08 8.00E+08
yMC10 4.20E+08 8.10E+08 6.60E+08 4.00E+08
4.4 Viability of S. thermophilus in yogurt
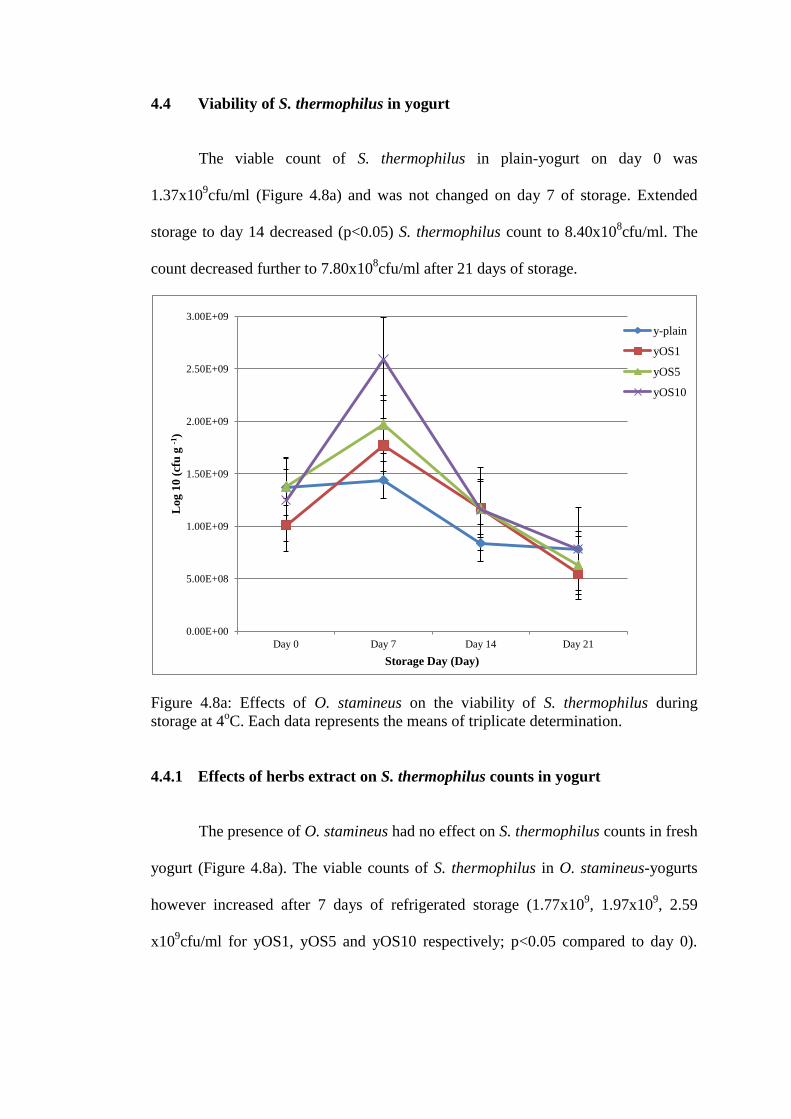
The viable count of S. thermophilus in plain-yogurt on day 0 was
1.37x10⁹cfu/ml (Figure 4.8a) and was not changed on day 7 of storage. Extended
storage to day 14 decreased (p<0.05) S. thermophilus count to 8.40x10⁸cfu/ml. The
count decreased further to 7.80x10⁸cfu/ml after 21 days of storage.
Figure 4.8a: Effects of O. stamineus on the viability of S. thermophilus during
storage at 4oC. Each data represents the means of triplicate determination.
4.4.1 Effects of herbs extract on S. thermophilus counts in yogurt
The presence of O. stamineus had no effect on S. thermophilus counts in fresh
yogurt (Figure 4.8a). The viable counts of S. thermophilus in O. stamineus-yogurts
however increased after 7 days of refrigerated storage (1.77x10⁹, 1.97x10
9, 2.59
x109cfu/ml for yOS1, yOS5 and yOS10 respectively; p<0.05 compared to day 0).
0.00E+00
5.00E+08
1.00E+09
1.50E+09
2.00E+09
2.50E+09
3.00E+09
Day 0 Day 7 Day 14 Day 21
Log
10
(cf
u g
-1)
Storage Day (Day)
y-plain
yOS1
yOS5
yOS10
Extended storage resulted in reduction of viable of S. thermophilus counts towards
day 0 values by day 14 of storage.
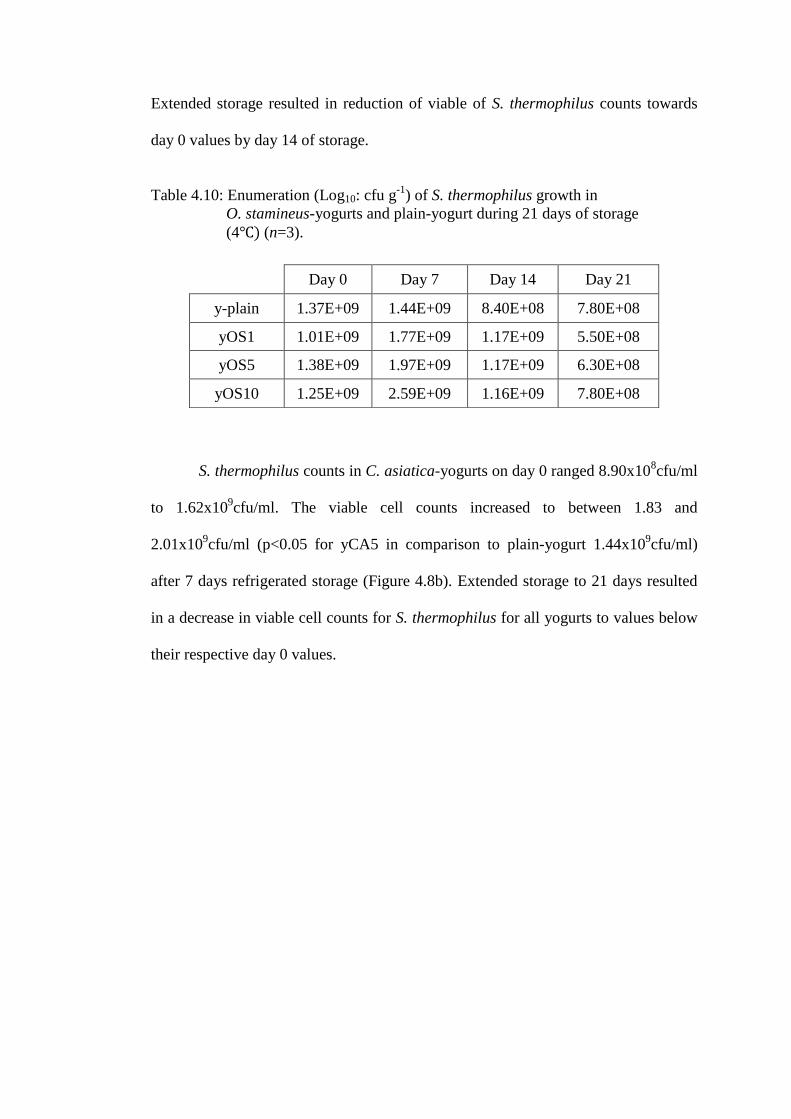
Table 4.10: Enumeration (Log10: cfu g-1
) of S. thermophilus growth in
O. stamineus-yogurts and plain-yogurt during 21 days of storage
(4 (n=3).
S. thermophilus counts in C. asiatica-yogurts on day 0 ranged 8.90x10⁸cfu/ml
to 1.62x10⁹cfu/ml. The viable cell counts increased to between 1.83 and
2.01x10⁹cfu/ml (p<0.05 for yCA5 in comparison to plain-yogurt 1.44x10
9cfu/ml)
after 7 days refrigerated storage (Figure 4.8b). Extended storage to 21 days resulted
in a decrease in viable cell counts for S. thermophilus for all yogurts to values below
their respective day 0 values.
Day 0 Day 7 Day 14 Day 21
y-plain 1.37E+09 1.44E+09 8.40E+08 7.80E+08
yOS1 1.01E+09 1.77E+09 1.17E+09 5.50E+08
yOS5 1.38E+09 1.97E+09 1.17E+09 6.30E+08
yOS10 1.25E+09 2.59E+09 1.16E+09 7.80E+08
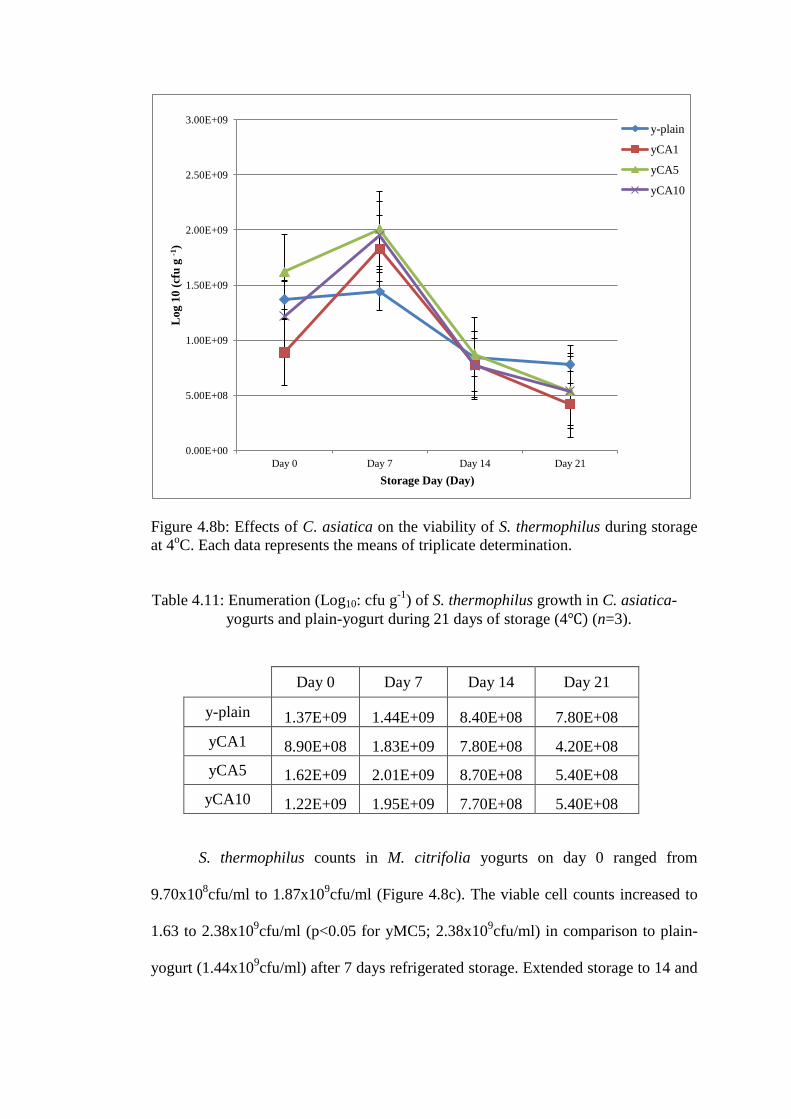
Figure 4.8b: Effects of C. asiatica on the viability of S. thermophilus during storage
at 4oC. Each data represents the means of triplicate determination.
Table 4.11: Enumeration (Log10: cfu g-1
) of S. thermophilus growth in C. asiatica-
yogurts and plain-yogurt during 21 days of storage (4 (n=3).
S. thermophilus counts in M. citrifolia yogurts on day 0 ranged from
9.70x10⁸cfu/ml to 1.87x10
9cfu/ml (Figure 4.8c). The viable cell counts increased to
1.63 to 2.38x10⁹cfu/ml (p<0.05 for yMC5; 2.38x10
9cfu/ml) in comparison to plain-
yogurt (1.44x10⁹cfu/ml) after 7 days refrigerated storage. Extended storage to 14 and
0.00E+00
5.00E+08
1.00E+09
1.50E+09
2.00E+09
2.50E+09
3.00E+09
Day 0 Day 7 Day 14 Day 21
Log
10
(cf
u g
-1)
Storage Day (Day)
y-plain
yCA1
yCA5
yCA10
Day 0 Day 7 Day 14 Day 21
y-plain 1.37E+09 1.44E+09 8.40E+08 7.80E+08
yCA1 8.90E+08 1.83E+09 7.80E+08 4.20E+08
yCA5 1.62E+09 2.01E+09 8.70E+08 5.40E+08
yCA10 1.22E+09 1.95E+09 7.70E+08 5.40E+08
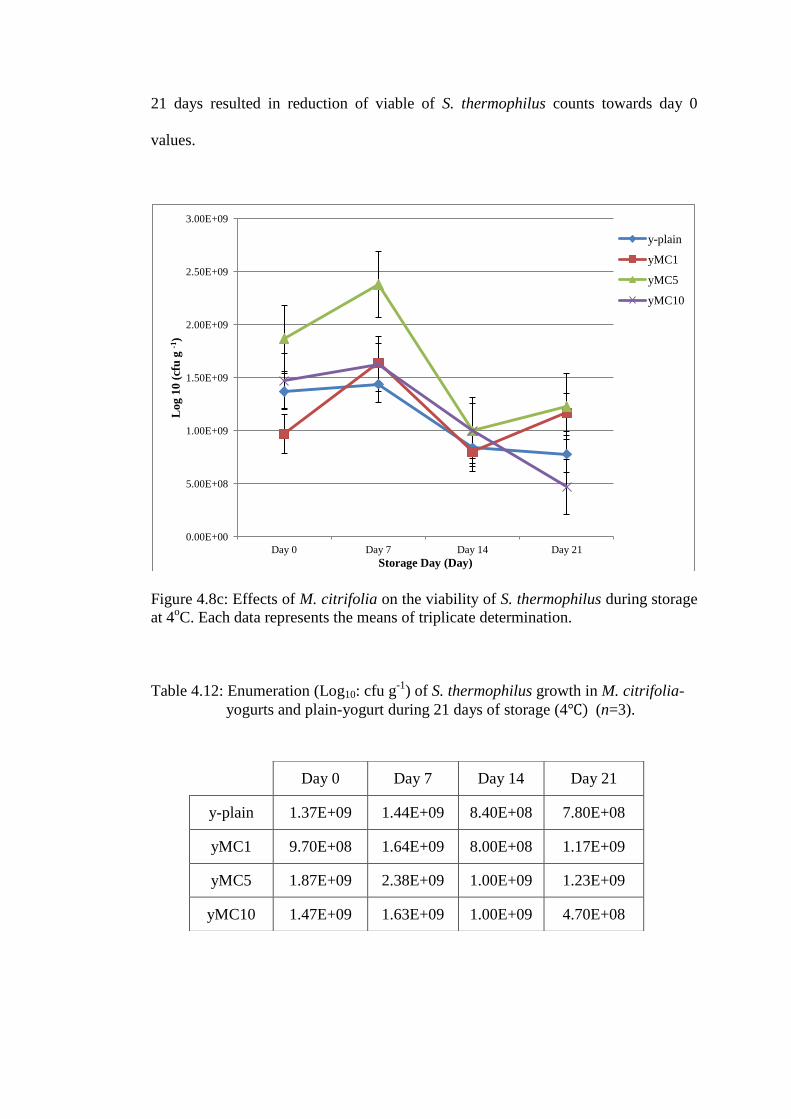
21 days resulted in reduction of viable of S. thermophilus counts towards day 0
values.
Figure 4.8c: Effects of M. citrifolia on the viability of S. thermophilus during storage
at 4oC. Each data represents the means of triplicate determination.
Table 4.12: Enumeration (Log10: cfu g-1
) of S. thermophilus growth in M. citrifolia-
yogurts and plain-yogurt during 21 days of storage (4 (n=3).
0.00E+00
5.00E+08
1.00E+09
1.50E+09
2.00E+09
2.50E+09
3.00E+09
Day 0 Day 7 Day 14 Day 21
Log
10
(cf
u g
-1)
Storage Day (Day)
y-plain
yMC1
yMC5
yMC10
Day 0 Day 7 Day 14 Day 21
y-plain 1.37E+09 1.44E+09 8.40E+08 7.80E+08
yMC1 9.70E+08 1.64E+09 8.00E+08 1.17E+09
yMC5 1.87E+09 2.38E+09 1.00E+09 1.23E+09
yMC10 1.47E+09 1.63E+09 1.00E+09 4.70E+08
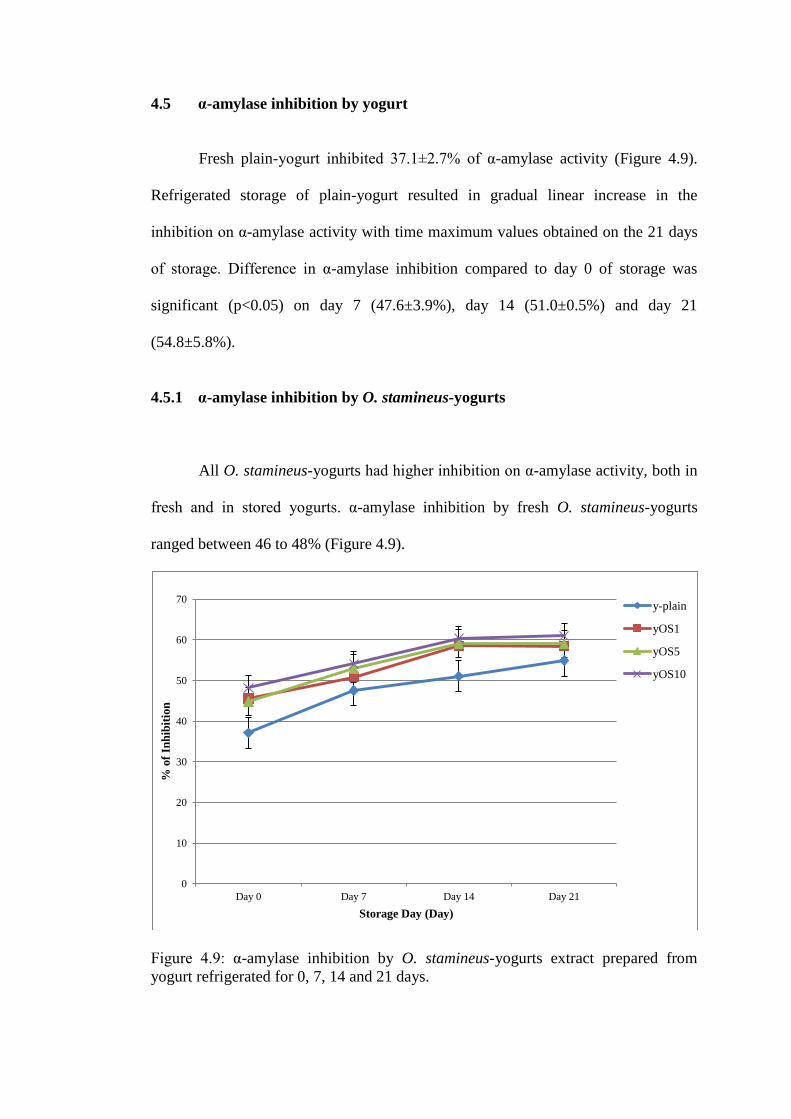
4.5 α-amylase inhibition by yogurt
Fresh plain-yogurt inhibited 37.1±2.7% of α-amylase activity (Figure 4.9).
Refrigerated storage of plain-yogurt resulted in gradual linear increase in the
inhibition on α-amylase activity with time maximum values obtained on the 21 days
of storage. Difference in α-amylase inhibition compared to day 0 of storage was
significant (p<0.05) on day 7 (47.6±3.9%), day 14 (51.0±0.5%) and day 21
(54.8±5.8%).
4.5.1 α-amylase inhibition by O. stamineus-yogurts
All O. stamineus-yogurts had higher inhibition on α-amylase activity, both in
fresh and in stored yogurts. α-amylase inhibition by fresh O. stamineus-yogurts
ranged between 46 to 48% (Figure 4.9).
Figure 4.9: α-amylase inhibition by O. stamineus-yogurts extract prepared from
yogurt refrigerated for 0, 7, 14 and 21 days.
0
10
20
30
40
50
60
70
Day 0 Day 7 Day 14 Day 21
% o
f In
hib
itio
n
Storage Day (Day)
y-plain
yOS1
yOS5
yOS10
Maximal inhibition of α-amylase by O. stamineus-yogurts was shown after
14 days of storage, whereby all O. stamineus-yogurts preparation showed higher
inhibition (58 to 60%) on α-amylase than plain-yogurt (51.0±0.5%; p<0.05). Yogurt
with the highest inclusion of O. stamineus (60.9±0.4%; yOS10) showed higher
(p<0.05) inhibition on α-amylase at all storage days.
Table 4.13 : Percentage of α-amylase inhibition by O. staminues-yogurts and plain-
yogurt during 21 days of storage.
Day 0 Day 7 Day 14 Day 21
y-plain 37.1±2.7 47.6±3.9 51.0±0.5 54.8±5.8
yOS1 45.5±6.5 50.7±0.7 58.5±1.5 58.4±1.2
yOS5 44.8±4.5 52.9±1.3 59.0±2.3 58.9±0.1
yOS10 48.2±2.2 54.1±0.5 60.2±0.4 60.9±0.4
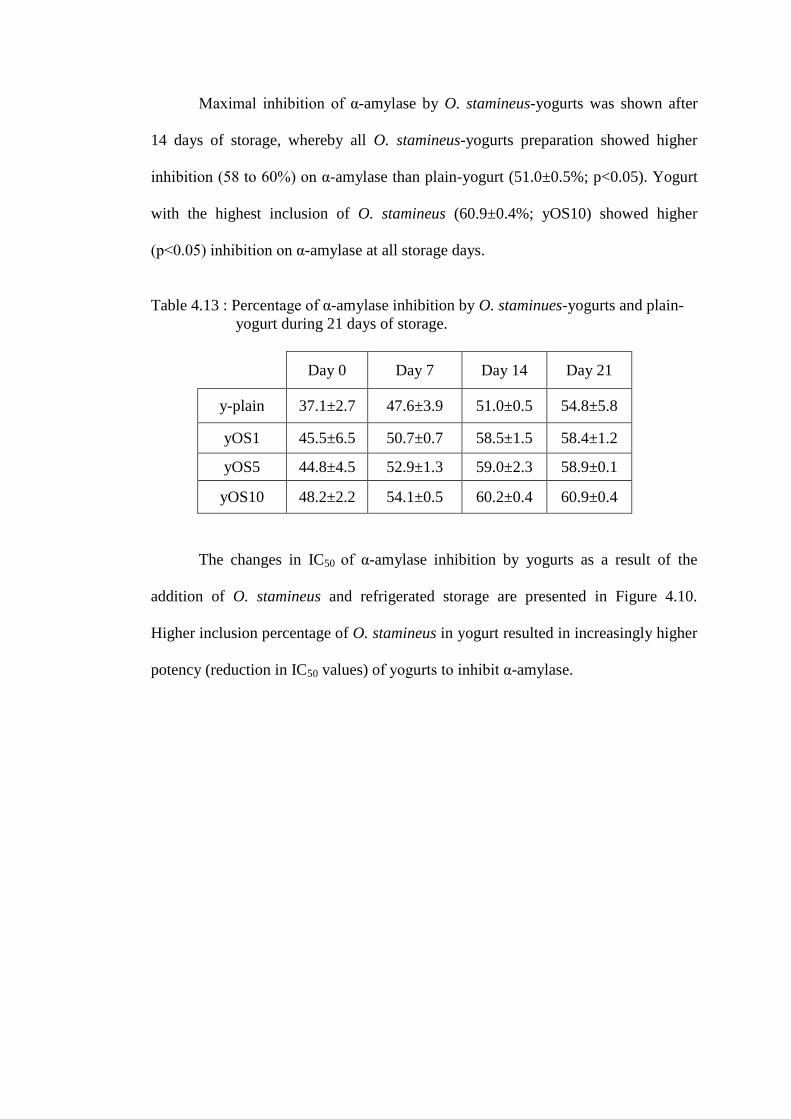
The changes in IC50 of α-amylase inhibition by yogurts as a result of the
addition of O. stamineus and refrigerated storage are presented in Figure 4.10.
Higher inclusion percentage of O. stamineus in yogurt resulted in increasingly higher
potency (reduction in IC50 values) of yogurts to inhibit α-amylase.
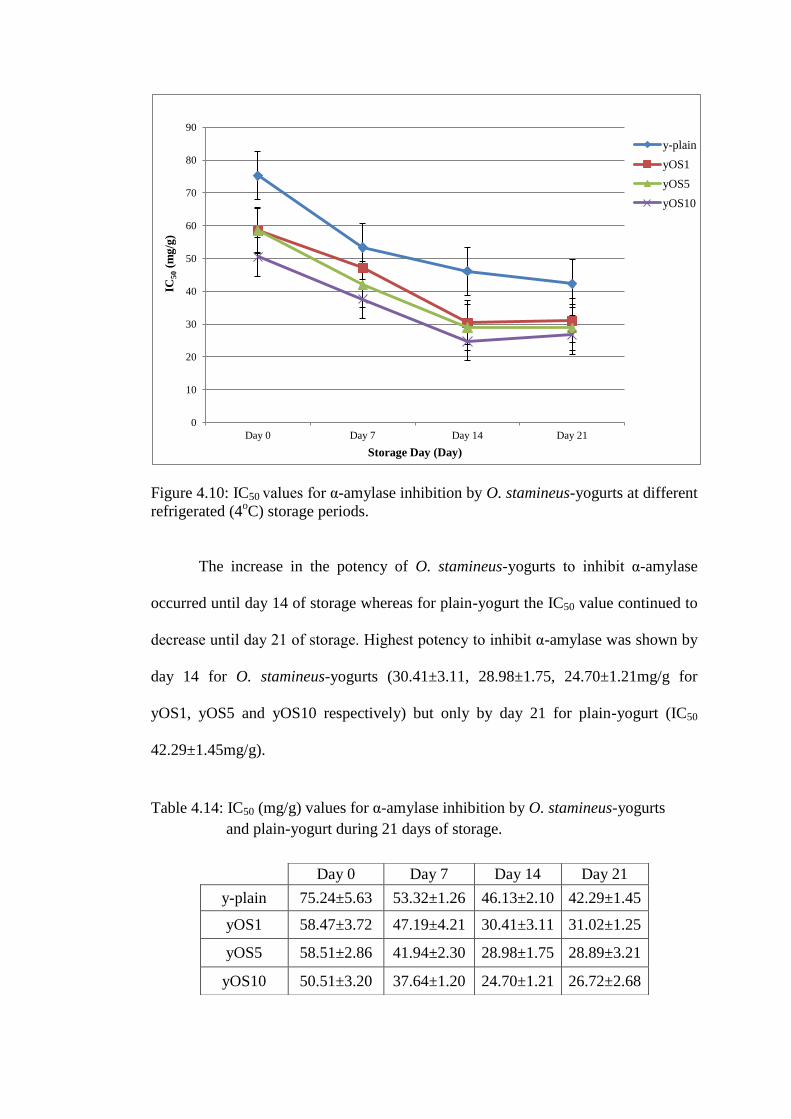
Figure 4.10: IC50 values for α-amylase inhibition by O. stamineus-yogurts at different
refrigerated (4oC) storage periods.
The increase in the potency of O. stamineus-yogurts to inhibit α-amylase
occurred until day 14 of storage whereas for plain-yogurt the IC50 value continued to
decrease until day 21 of storage. Highest potency to inhibit α-amylase was shown by
day 14 for O. stamineus-yogurts (30.41±3.11, 28.98±1.75, 24.70±1.21mg/g for
yOS1, yOS5 and yOS10 respectively) but only by day 21 for plain-yogurt (IC50
42.29±1.45mg/g).
Table 4.14: IC50 (mg/g) values for α-amylase inhibition by O. stamineus-yogurts
and plain-yogurt during 21 days of storage.
0
10
20
30
40
50
60
70
80
90
Day 0 Day 7 Day 14 Day 21
IC50 (
mg
/g)
Storage Day (Day)
y-plain
yOS1
yOS5
yOS10
Day 0 Day 7 Day 14 Day 21
y-plain 75.24±5.63 53.32±1.26 46.13±2.10 42.29±1.45
yOS1 58.47±3.72 47.19±4.21 30.41±3.11 31.02±1.25
yOS5 58.51±2.86 41.94±2.30 28.98±1.75 28.89±3.21
yOS10 50.51±3.20 37.64±1.20 24.70±1.21 26.72±2.68
4.5.2 α-amylase inhibition by C. asiatica-yogurts
The presence of C. asiatica increased the fresh yogurt inhibition of α-amylase
to 44.7±2.8%, 50.5±1.4% and 51.9±0.6% (for yCA1, yCA5 and yCA10 respectively)
compared to plain-yogurt (37.1±2.7%; Figure 4.11).
Figure 4.11: α-amylase inhibition by C. asiatica-yogurts extract prepared from
yogurt refrigerated for 0, 7, 14 and 21 days.
Refrigerated storage yogurt increased the α-amylase inhibition (p<0.05 for
yogurts after 14 days storage) with highest inhibition achieved by day 21 for yCA10
(59.0±2.5%). Maximal difference between plain-yogurt and C. asiatica-yogurts was
seen on day 0 but these differences were diminished after 7 days of refrigeration.
0
10
20
30
40
50
60
70
Day 0 Day 7 Day 14 Day 21
% o
f In
hib
itio
n
Storage Day (Day)
y-plain
yCA1
yCA5
yCA10

Table 4.15: Percentage of α-amylase inhibition by C. asiatica-yogurts and
plain-yogurt during 21 days of storage.
The changes in IC50 of α-amylase inhibition by yogurt as a result of the addition of C.
asiatica and refrigerated storage are presented in Figure 4.12. Higher inclusion
percentage of C. asiatica in yogurt resulted in increasingly higher potency (reduction
in IC50 values) of yogurts to inhibit α-amylase.
Figure 4.12: IC50 values for α-amylase inhibition by C. asiatica-yogurts at different
refrigerated (4oC) storage periods.
0
10
20
30
40
50
60
70
80
90
Day 0 Day 7 Day 14 Day 21
IC50 (
mg
/g)
Storage Day (Day)
y-plain
yCA1
yCA5
yCA10
Day 0 Day 7 Day 14 Day 21
y-plain 37.1±2.7 47.6±3.9 51.0±0.5 54.8±5.8
yCA1 44.7±2.8 49.7±2.1 52.5±0.3 56.3±1.0
yCA5 50.5±1.4 51.3±3.3 54.1±0.5 57.6±0.3
yCA10 51.9±0.6 52.2±2.0 56.6±1.2 59.0±2.5
The increase in the potency of all yogurts to inhibit α-amylase occurred until
day 21 of storage. The highest potency to inhibit α-amylase at this storage day was
42.29±1.45, 35.64±1.35, 34.82±1.24 and 30.18±0.65mg/g for plain-yogurt, yCA1,
yCA5 and yCA10 respectively.
Table 4.16: IC50 (mg/g) values for α-amylase inhibition by C. asiatica-yogurts and
plain-yogurt during 21 days of storage.
Day 0 Day 7 Day 14 Day 21
y-plain 75.24±5.63 53.32±1.26 46.13±2.10 42.29±1.45
yCA1 59.11±1.33 46.82±2.15 41.74±1.22 35.64±1.35
yCA5 47.60±1.56 43.02±3.11 38.24±1.65 34.82±1.24
yCA10 45.00±0.98 41.66±2.56 34.51±2.01 30.18±0.65
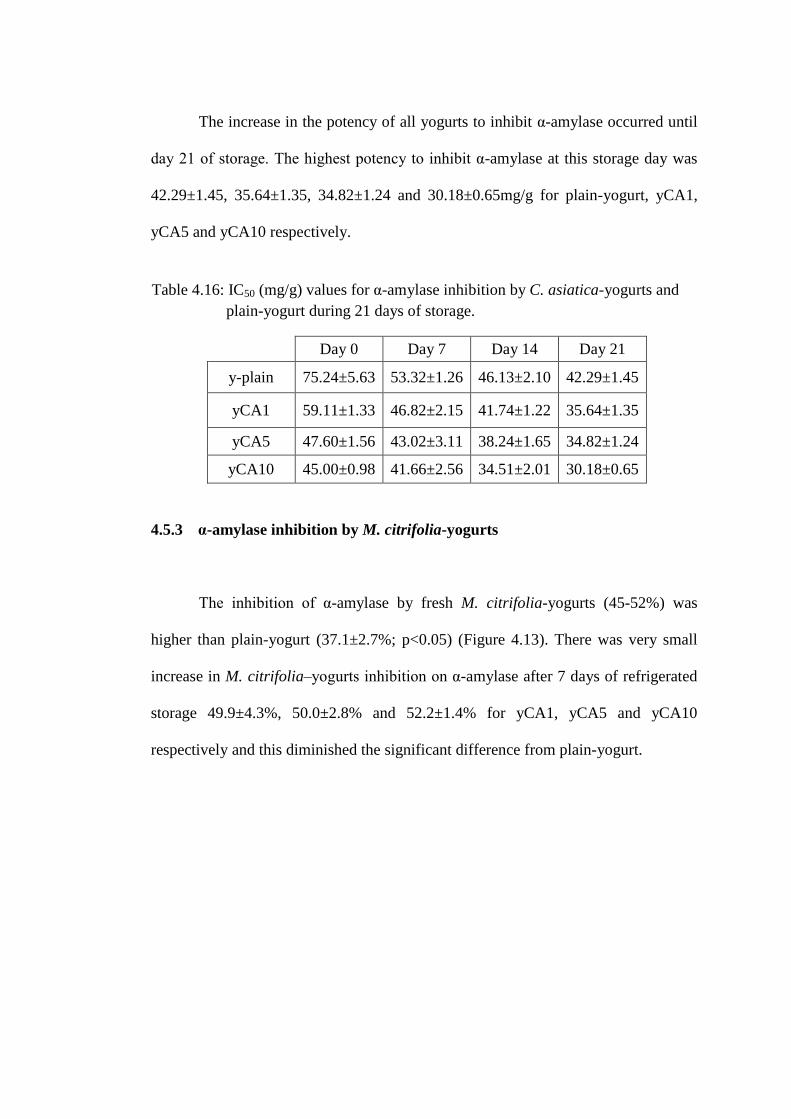
4.5.3 α-amylase inhibition by M. citrifolia-yogurts
The inhibition of α-amylase by fresh M. citrifolia-yogurts (45-52%) was
higher than plain-yogurt (37.1±2.7%; p<0.05) (Figure 4.13). There was very small
increase in M. citrifolia–yogurts inhibition on α-amylase after 7 days of refrigerated
storage 49.9±4.3%, 50.0±2.8% and 52.2±1.4% for yCA1, yCA5 and yCA10
respectively and this diminished the significant difference from plain-yogurt.
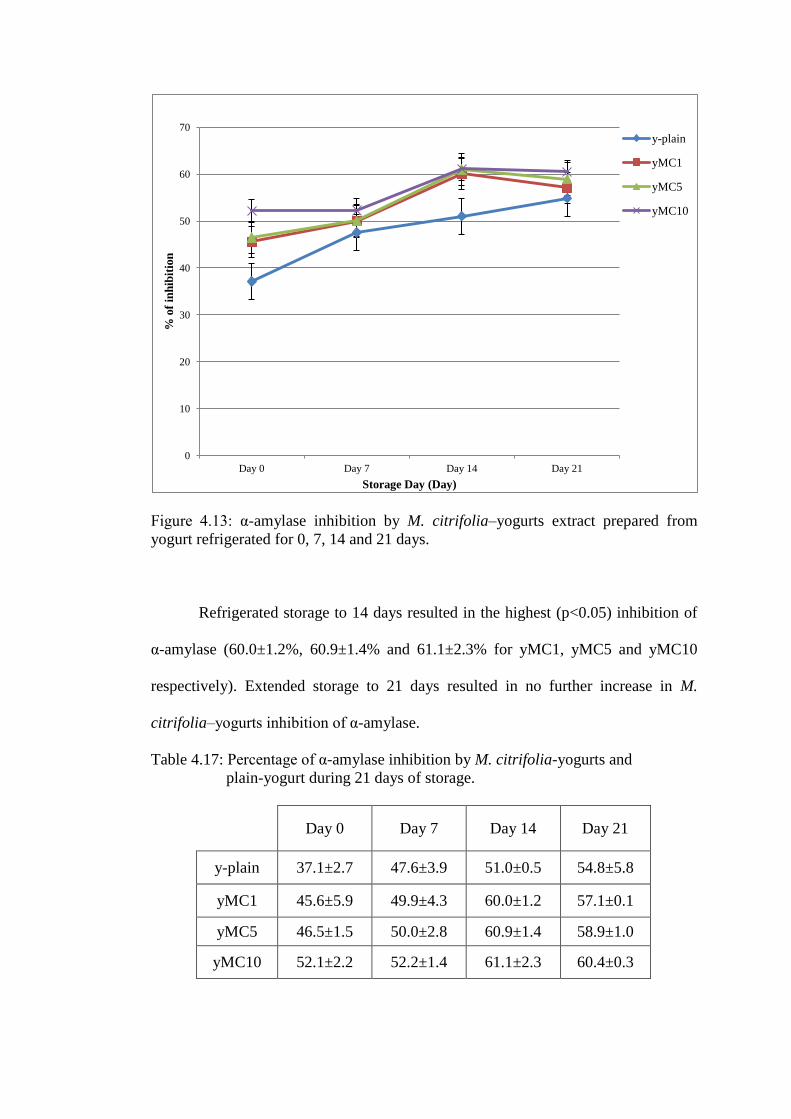
Figure 4.13: α-amylase inhibition by M. citrifolia–yogurts extract prepared from
yogurt refrigerated for 0, 7, 14 and 21 days.
Refrigerated storage to 14 days resulted in the highest (p<0.05) inhibition of
α-amylase (60.0±1.2%, 60.9±1.4% and 61.1±2.3% for yMC1, yMC5 and yMC10
respectively). Extended storage to 21 days resulted in no further increase in M.
citrifolia–yogurts inhibition of α-amylase.
Table 4.17: Percentage of α-amylase inhibition by M. citrifolia-yogurts and
plain-yogurt during 21 days of storage.
Day 0 Day 7 Day 14 Day 21
y-plain 37.1±2.7 47.6±3.9 51.0±0.5 54.8±5.8
yMC1 45.6±5.9 49.9±4.3 60.0±1.2 57.1±0.1
yMC5 46.5±1.5 50.0±2.8 60.9±1.4 58.9±1.0
yMC10 52.1±2.2 52.2±1.4 61.1±2.3 60.4±0.3
0
10
20
30
40
50
60
70
Day 0 Day 7 Day 14 Day 21
% o
f in
hib
itio
n
Storage Day (Day)
y-plain
yMC1
yMC5
yMC10
The changes in IC50 of α-amylase inhibition by yogurt as a result of the
addition of M. citrifolia and refrigerated storage are presented in Figure 4.14. Higher
inclusion percentage of M. citrifolia in yogurt resulted in increasingly higher potency
(reduction in IC50 values) of yogurts to inhibit α-amylase.
Figure 4.14: IC50 values for α-amylase inhibition by M. citrifolia–yogurts at different
refrigerated (4oC) storage periods.
0
10
20
30
40
50
60
70
80
90
Day 0 Day 7 Day 14 Day 21
IC50 (
mg
/g)
Storage Day (Day)
y-plain
yMC1
yMC5
yMC10
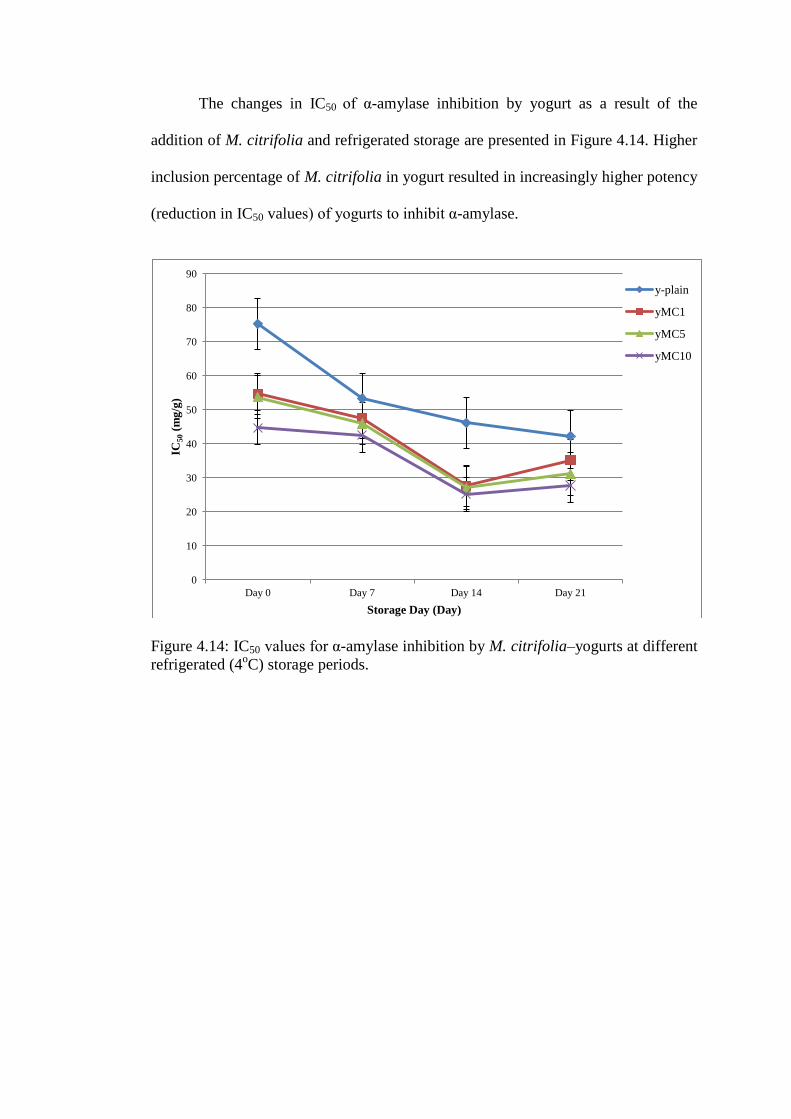
Table 4.18: IC50 (mg/g) values for α-amylase inhibition by M. citrifolia-yogurts and
plain-yogurt during 21 days of storage.
Day 0 Day 7 Day 14 Day 21
y-plain 75.24±5.63 53.32±1.26 46.13±2.10 42.29±1.45
yMC1 54.69±3.74 47.50±3.12 27.69±1.02 35.23±2.51
yMC5 53.73±2.61 45.98±1.57 27.07±1.08 31.19±2.41
yMC10 44.71±1.57 42.53±2.10 25.16±1.68 27.77±1.33
The highest potency of M. citrifolia–yogurts to inhibit α-amylase occurred on
14 day of storage for M. citrifolia–yogurts (35.23±2.51, 31.19±2.41 and
27.77±1.33mg/g for yMC1, yMC5 and yMC10 respectively) and on day 21 of
storage for plain-yogurt (42.29±1.45mg/g).
4.6 α-glucosidase inhibition by yogurt
The inhibition of α-glucosidase by plain-yogurt on day 0 (5.8±0.36%) increased with
time to the highest value (15.87±0.71%) by day 21 of refrigerated storage (Figure
4.15). IC50 for plain-yogurt decreased from 506.85 mg/g (day 0) to 247.43 mg/g (day
7) (see Figure 4.16).
4.6.1 α-glucosidase inhibition by O. stamineus-yogurts
The addition of O. stamineus increased (p<0.05) the fresh yogurt inhibition of α-
glucosidase (18.05±0.47%, 19.27±0.36%, and 21.22±0.44% for yOS1, yOS5 and
yOS10 respectively) (Figure 4.15). Refrigerated storage to 21 days resulted in
minimal changes in O. stamineus-yogurts inhibition of α-glucosidase.
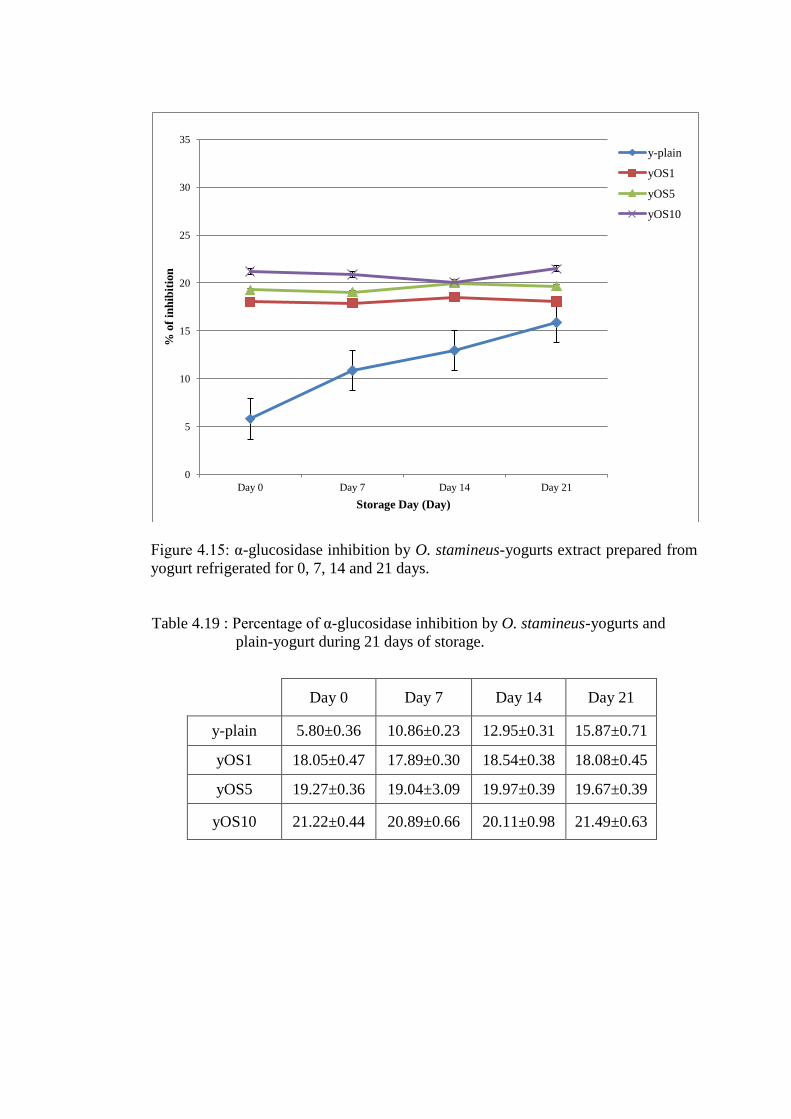
Figure 4.15: α-glucosidase inhibition by O. stamineus-yogurts extract prepared from
yogurt refrigerated for 0, 7, 14 and 21 days.
Table 4.19 : Percentage of α-glucosidase inhibition by O. stamineus-yogurts and
plain-yogurt during 21 days of storage.
0
5
10
15
20
25
30
35
Day 0 Day 7 Day 14 Day 21
% o
f in
hib
itio
n
Storage Day (Day)
y-plain
yOS1
yOS5
yOS10
Day 0 Day 7 Day 14 Day 21
y-plain 5.80±0.36 10.86±0.23 12.95±0.31 15.87±0.71
yOS1 18.05±0.47 17.89±0.30 18.54±0.38 18.08±0.45
yOS5 19.27±0.36 19.04±3.09 19.97±0.39 19.67±0.39
yOS10 21.22±0.44 20.89±0.66 20.11±0.98 21.49±0.63
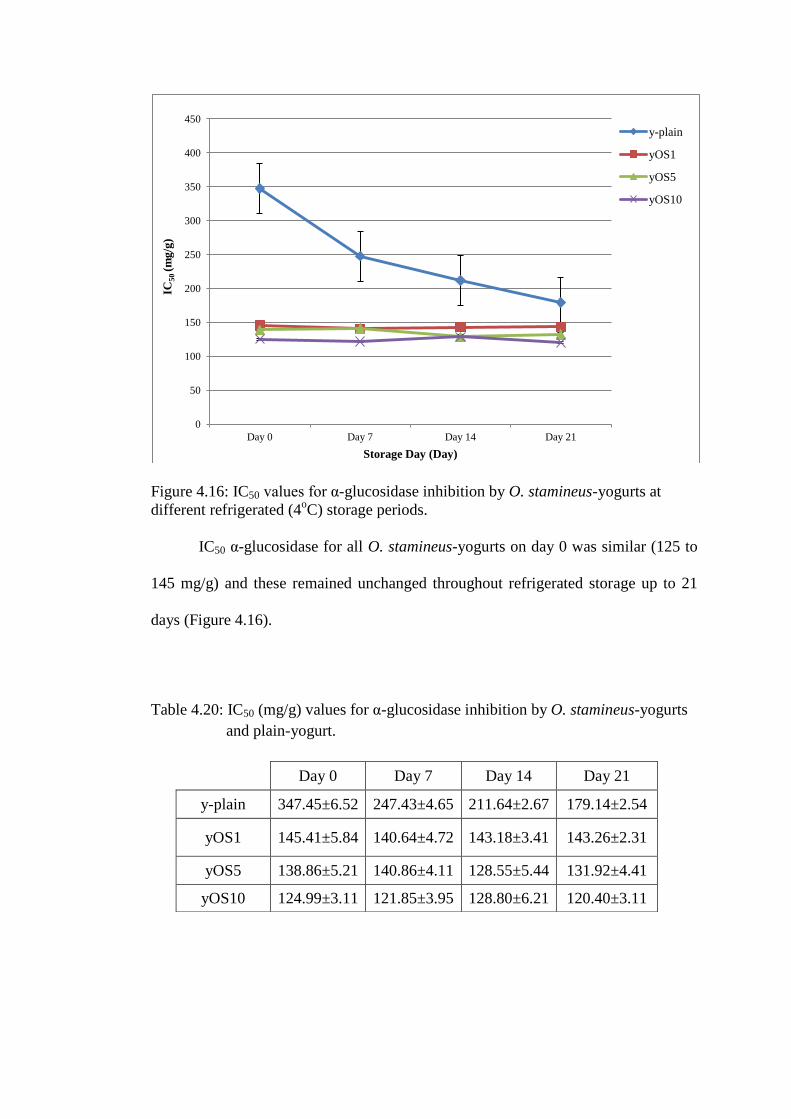
Figure 4.16: IC50 values for α-glucosidase inhibition by O. stamineus-yogurts at
different refrigerated (4oC) storage periods.
IC50 α-glucosidase for all O. stamineus-yogurts on day 0 was similar (125 to
145 mg/g) and these remained unchanged throughout refrigerated storage up to 21
days (Figure 4.16).
Table 4.20: IC50 (mg/g) values for α-glucosidase inhibition by O. stamineus-yogurts
and plain-yogurt.
0
50
100
150
200
250
300
350
400
450
Day 0 Day 7 Day 14 Day 21
IC50 (m
g/g
)
Storage Day (Day)
y-plain
yOS1
yOS5
yOS10
Day 0 Day 7 Day 14 Day 21
y-plain 347.45±6.52 247.43±4.65 211.64±2.67 179.14±2.54
yOS1 145.41±5.84 140.64±4.72 143.18±3.41 143.26±2.31
yOS5 138.86±5.21 140.86±4.11 128.55±5.44 131.92±4.41
yOS10 124.99±3.11 121.85±3.95 128.80±6.21 120.40±3.11
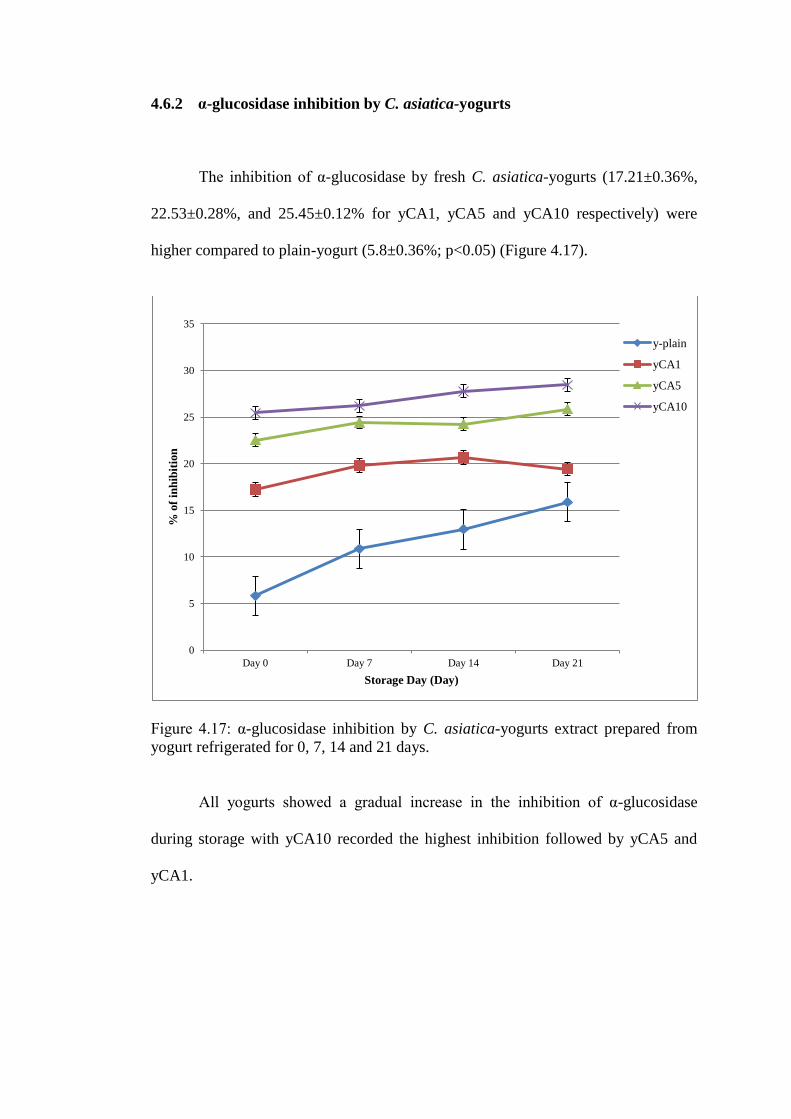
4.6.2 α-glucosidase inhibition by C. asiatica-yogurts
The inhibition of α-glucosidase by fresh C. asiatica-yogurts (17.21±0.36%,
22.53±0.28%, and 25.45±0.12% for yCA1, yCA5 and yCA10 respectively) were
higher compared to plain-yogurt (5.8±0.36%; p<0.05) (Figure 4.17).
Figure 4.17: α-glucosidase inhibition by C. asiatica-yogurts extract prepared from
yogurt refrigerated for 0, 7, 14 and 21 days.
All yogurts showed a gradual increase in the inhibition of α-glucosidase
during storage with yCA10 recorded the highest inhibition followed by yCA5 and
yCA1.
0
5
10
15
20
25
30
35
Day 0 Day 7 Day 14 Day 21
% o
f in
hib
itio
n
Storage Day (Day)
y-plain
yCA1
yCA5
yCA10
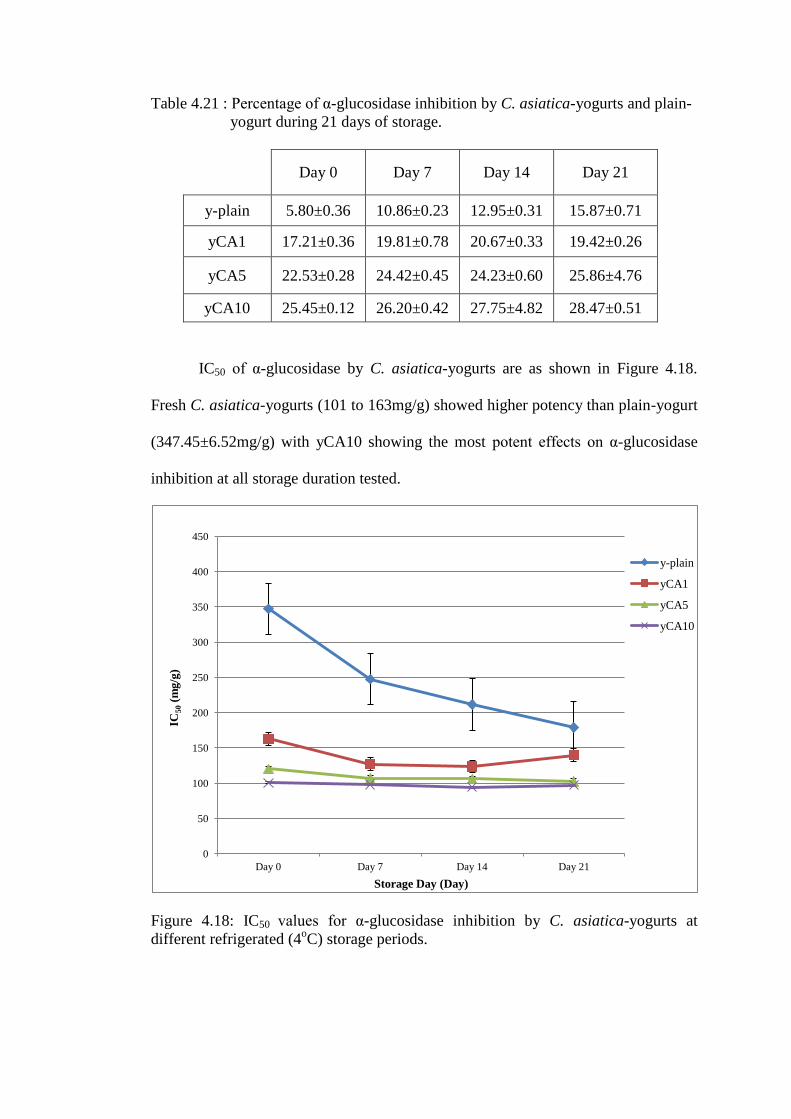
Table 4.21 : Percentage of α-glucosidase inhibition by C. asiatica-yogurts and plain-
yogurt during 21 days of storage.
Day 0 Day 7 Day 14 Day 21
y-plain 5.80±0.36 10.86±0.23 12.95±0.31 15.87±0.71
yCA1 17.21±0.36 19.81±0.78 20.67±0.33 19.42±0.26
yCA5 22.53±0.28 24.42±0.45 24.23±0.60 25.86±4.76
yCA10 25.45±0.12 26.20±0.42 27.75±4.82 28.47±0.51
IC50 of α-glucosidase by C. asiatica-yogurts are as shown in Figure 4.18.
Fresh C. asiatica-yogurts (101 to 163mg/g) showed higher potency than plain-yogurt
(347.45±6.52mg/g) with yCA10 showing the most potent effects on α-glucosidase
inhibition at all storage duration tested.
Figure 4.18: IC50 values for α-glucosidase inhibition by C. asiatica-yogurts at
different refrigerated (4oC) storage periods.
0
50
100
150
200
250
300
350
400
450
Day 0 Day 7 Day 14 Day 21
IC50 (
mg
/g)
Storage Day (Day)
y-plain
yCA1
yCA5
yCA10
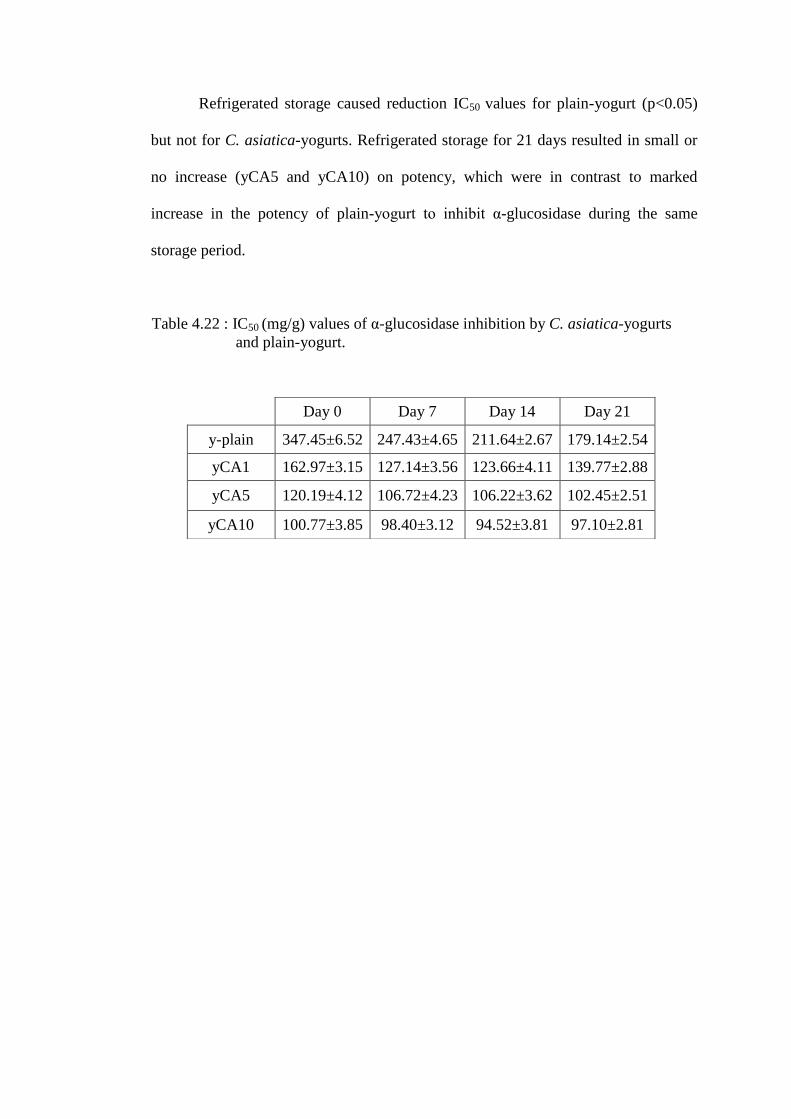
Refrigerated storage caused reduction IC50 values for plain-yogurt (p<0.05)
but not for C. asiatica-yogurts. Refrigerated storage for 21 days resulted in small or
no increase (yCA5 and yCA10) on potency, which were in contrast to marked
increase in the potency of plain-yogurt to inhibit α-glucosidase during the same
storage period.
Table 4.22 : IC50 (mg/g) values of α-glucosidase inhibition by C. asiatica-yogurts
and plain-yogurt.
Day 0 Day 7 Day 14 Day 21
y-plain 347.45±6.52 247.43±4.65 211.64±2.67 179.14±2.54
yCA1 162.97±3.15 127.14±3.56 123.66±4.11 139.77±2.88
yCA5 120.19±4.12 106.72±4.23 106.22±3.62 102.45±2.51
yCA10 100.77±3.85 98.40±3.12 94.52±3.81 97.10±2.81
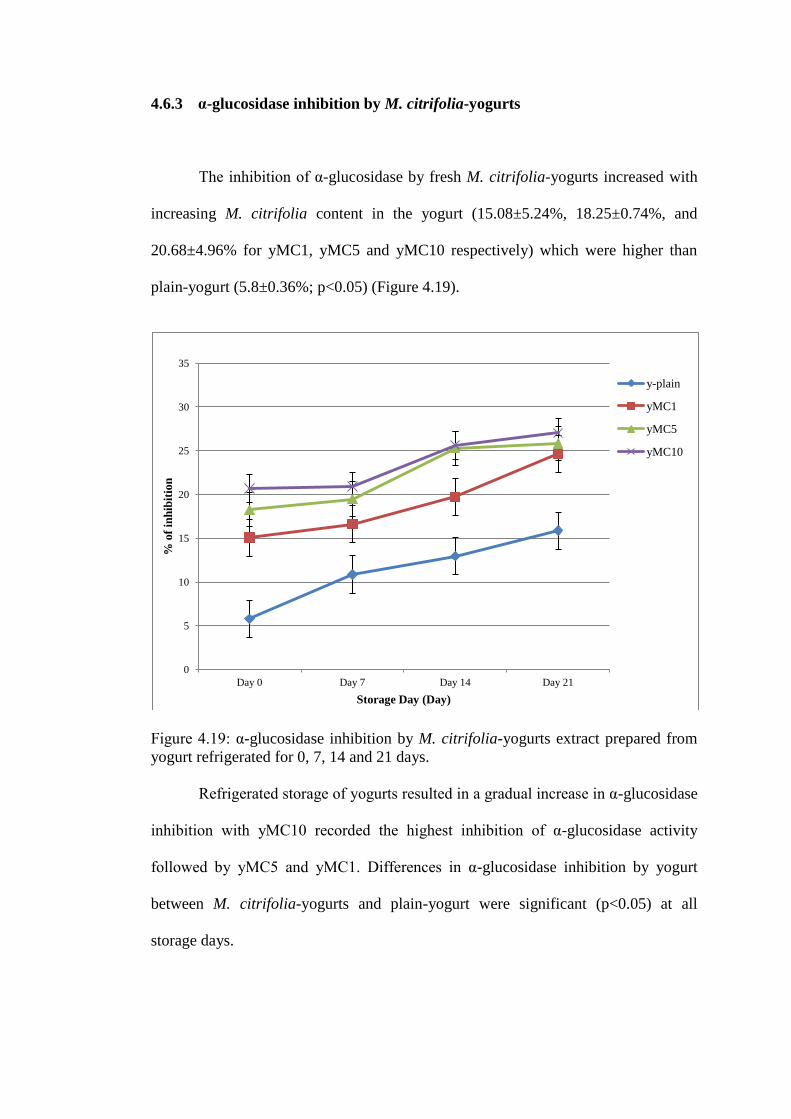
4.6.3 α-glucosidase inhibition by M. citrifolia-yogurts
The inhibition of α-glucosidase by fresh M. citrifolia-yogurts increased with
increasing M. citrifolia content in the yogurt (15.08±5.24%, 18.25±0.74%, and
20.68±4.96% for yMC1, yMC5 and yMC10 respectively) which were higher than
plain-yogurt (5.8±0.36%; p<0.05) (Figure 4.19).
Figure 4.19: α-glucosidase inhibition by M. citrifolia-yogurts extract prepared from
yogurt refrigerated for 0, 7, 14 and 21 days.
Refrigerated storage of yogurts resulted in a gradual increase in α-glucosidase
inhibition with yMC10 recorded the highest inhibition of α-glucosidase activity
followed by yMC5 and yMC1. Differences in α-glucosidase inhibition by yogurt
between M. citrifolia-yogurts and plain-yogurt were significant (p<0.05) at all
storage days.
0
5
10
15
20
25
30
35
Day 0 Day 7 Day 14 Day 21
% o
f in
hib
itio
n
Storage Day (Day)
y-plain
yMC1
yMC5
yMC10
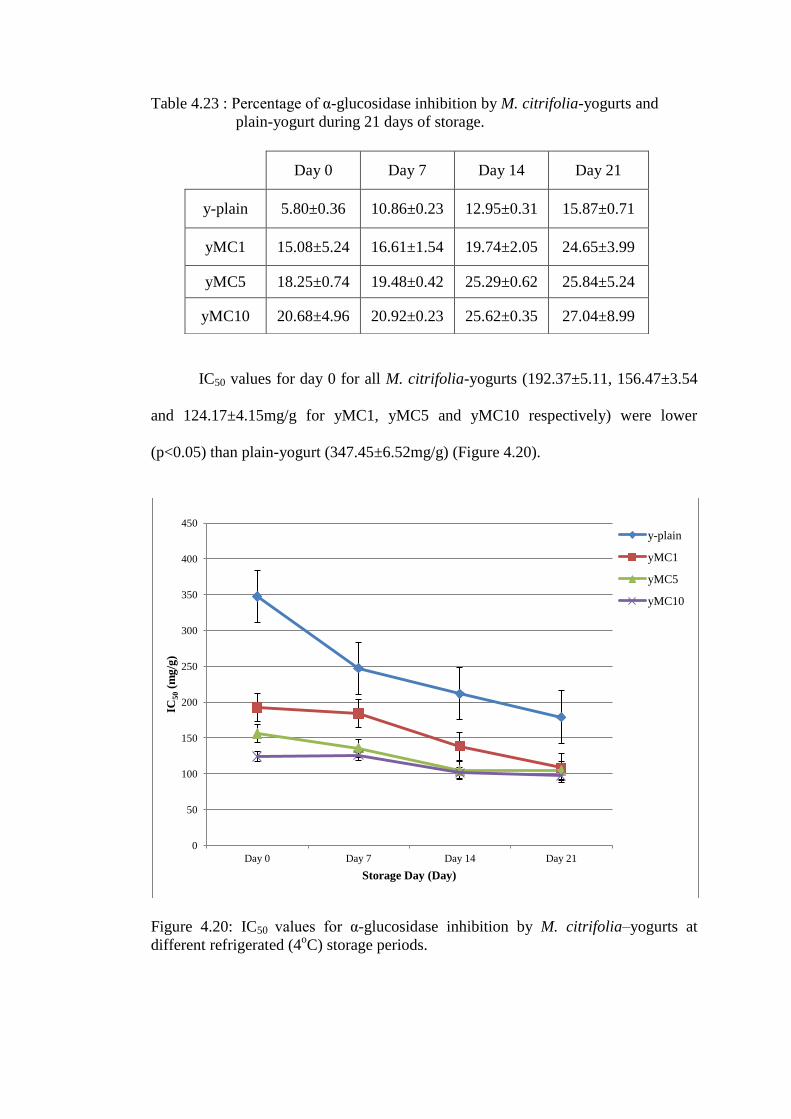
Table 4.23 : Percentage of α-glucosidase inhibition by M. citrifolia-yogurts and
plain-yogurt during 21 days of storage.
IC50 values for day 0 for all M. citrifolia-yogurts (192.37±5.11, 156.47±3.54
and 124.17±4.15mg/g for yMC1, yMC5 and yMC10 respectively) were lower
(p<0.05) than plain-yogurt (347.45±6.52mg/g) (Figure 4.20).
Figure 4.20: IC50 values for α-glucosidase inhibition by M. citrifolia–yogurts at
different refrigerated (4oC) storage periods.
0
50
100
150
200
250
300
350
400
450
Day 0 Day 7 Day 14 Day 21
IC50 (
mg
/g)
Storage Day (Day)
y-plain
yMC1
yMC5
yMC10
Day 0 Day 7 Day 14 Day 21
y-plain 5.80±0.36 10.86±0.23 12.95±0.31 15.87±0.71
yMC1 15.08±5.24 16.61±1.54 19.74±2.05 24.65±3.99
yMC5 18.25±0.74 19.48±0.42 25.29±0.62 25.84±5.24
yMC10 20.68±4.96 20.92±0.23 25.62±0.35 27.04±8.99
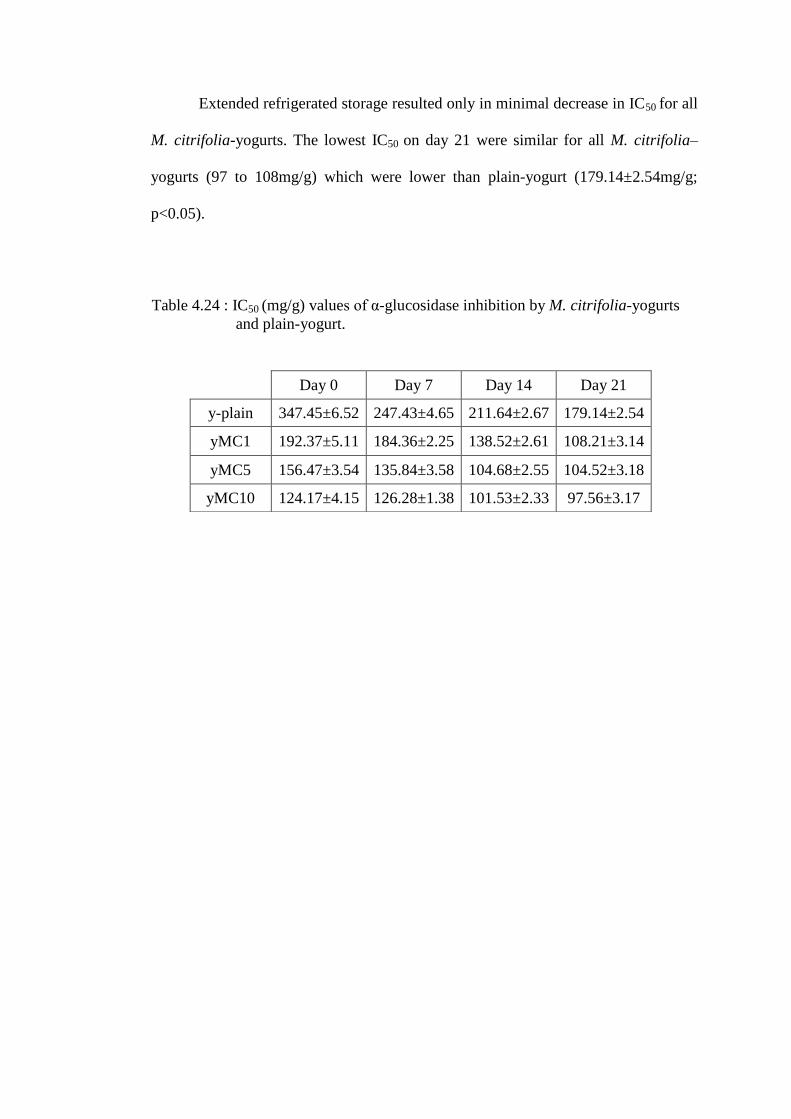
Extended refrigerated storage resulted only in minimal decrease in IC50 for all
M. citrifolia-yogurts. The lowest IC50 on day 21 were similar for all M. citrifolia–
yogurts (97 to 108mg/g) which were lower than plain-yogurt (179.14±2.54mg/g;
p<0.05).
Table 4.24 : IC50 (mg/g) values of α-glucosidase inhibition by M. citrifolia-yogurts
and plain-yogurt.
Day 0 Day 7 Day 14 Day 21
y-plain 347.45±6.52 247.43±4.65 211.64±2.67 179.14±2.54
yMC1 192.37±5.11 184.36±2.25 138.52±2.61 108.21±3.14
yMC5 156.47±3.54 135.84±3.58 104.68±2.55 104.52±3.18
yMC10 124.17±4.15 126.28±1.38 101.53±2.33 97.56±3.17
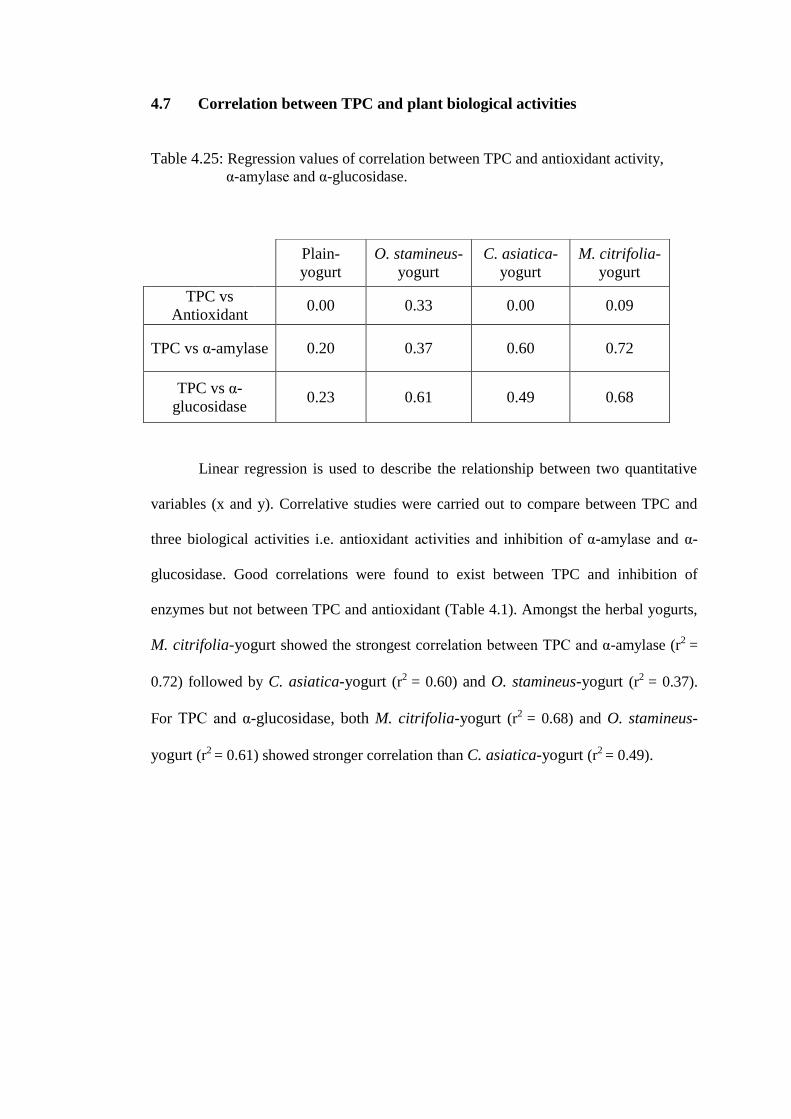
4.7 Correlation between TPC and plant biological activities
Table 4.25: Regression values of correlation between TPC and antioxidant activity,
α-amylase and α-glucosidase.
Linear regression is used to describe the relationship between two quantitative
variables (x and y). Correlative studies were carried out to compare between TPC and
three biological activities i.e. antioxidant activities and inhibition of α-amylase and α-
glucosidase. Good correlations were found to exist between TPC and inhibition of
enzymes but not between TPC and antioxidant (Table 4.1). Amongst the herbal yogurts,
M. citrifolia-yogurt showed the strongest correlation between TPC and α-amylase (r2 =
0.72) followed by C. asiatica-yogurt (r2 = 0.60) and O. stamineus-yogurt (r2 = 0.37).
For TPC and α-glucosidase, both M. citrifolia-yogurt (r2 = 0.68) and O. stamineus-
yogurt (r2 = 0.61) showed stronger correlation than C. asiatica-yogurt (r2 = 0.49).
Plain-
yogurt
O. stamineus-
yogurt
C. asiatica-
yogurt
M. citrifolia-
yogurt
TPC vs
Antioxidant 0.00 0.33 0.00 0.09
TPC vs α-amylase 0.20 0.37 0.60 0.72
TPC vs α-
glucosidase 0.23 0.61 0.49 0.68
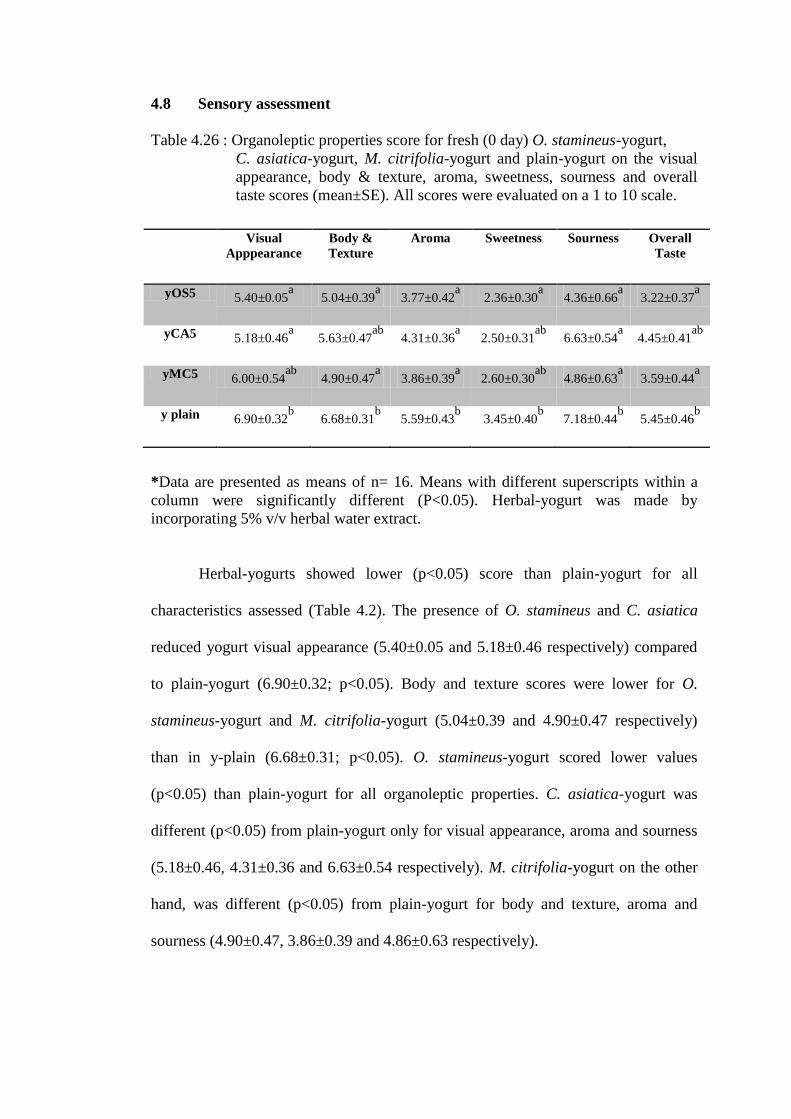
4.8 Sensory assessment
Table 4.26 : Organoleptic properties score for fresh (0 day) O. stamineus-yogurt,
C. asiatica-yogurt, M. citrifolia-yogurt and plain-yogurt on the visual
appearance, body & texture, aroma, sweetness, sourness and overall
taste scores (mean±SE). All scores were evaluated on a 1 to 10 scale.
Visual
Apppearance
Body &
Texture
Aroma Sweetness Sourness Overall
Taste
yOS5 5.40±0.05a 5.04±0.39
a 3.77±0.42
a 2.36±0.30
a 4.36±0.66
a 3.22±0.37
a
yCA5 5.18±0.46a 5.63±0.47
ab 4.31±0.36
a 2.50±0.31
ab 6.63±0.54
a 4.45±0.41
ab
yMC5 6.00±0.54ab
4.90±0.47a 3.86±0.39
a 2.60±0.30
ab 4.86±0.63
a 3.59±0.44
a
y plain 6.90±0.32b 6.68±0.31
b 5.59±0.43
b 3.45±0.40
b 7.18±0.44
b 5.45±0.46
b
*Data are presented as means of n= 16. Means with different superscripts within a
column were significantly different (P<0.05). Herbal-yogurt was made by
incorporating 5% v/v herbal water extract.
Herbal-yogurts showed lower (p<0.05) score than plain-yogurt for all
characteristics assessed (Table 4.2). The presence of O. stamineus and C. asiatica
reduced yogurt visual appearance (5.40±0.05 and 5.18±0.46 respectively) compared
to plain-yogurt (6.90±0.32; p<0.05). Body and texture scores were lower for O.
stamineus-yogurt and M. citrifolia-yogurt (5.04±0.39 and 4.90±0.47 respectively)
than in y-plain (6.68±0.31; p<0.05). O. stamineus-yogurt scored lower values
(p<0.05) than plain-yogurt for all organoleptic properties. C. asiatica-yogurt was
different (p<0.05) from plain-yogurt only for visual appearance, aroma and sourness
(5.18±0.46, 4.31±0.36 and 6.63±0.54 respectively). M. citrifolia-yogurt on the other
hand, was different (p<0.05) from plain-yogurt for body and texture, aroma and
sourness (4.90±0.47, 3.86±0.39 and 4.86±0.63 respectively).
CHAPTER 5: DISCUSSION
The presence of herbal water extract in yogurt has tremendous effects on the
growth and metabolism of yogurt bacteria and yogurt quality. This can be ascertained
from the changes in acidification of yogurt, yogurt bacteria counts as well as eating
and functional values as a result of the addition of herbs (O. stamineus, C. asiatica
and M. citrifolia). This chapter attempts to discuss the changes taken place in yogurt
due to herbal water extracts and subsequently consider the potential benefits of
herbal-yogurts for consumers with special health concern.
5.1 The effects of herbal water extract on the changes of yogurt
pysiochemical properties.
5.1.1 The changes of pH and TA in herbal-yogurts
Acidification is the main metabolic process that takes place during milk
fermentation and this can be monitored by measuring the pH and titratable acidity
(TA). Lactic acid, citric acid, pyruvic acid, succinic acid, formic acid, acetic acid,
propionic acid and butyric acid are several organic acids produced by the lactic acid
bacteria (LAB) as a result of degradation of glucose and galactose (Thomas & Crow,
1984) during energy generation for microbial growth (Donkor, Henriksson,
Vasiljevic, & Shah, 2006; Ostile, Treimo, & Narvhus, 2003). In addition, hydrolysis
of milk protein by the proteinases produced by the LAB is an important source of
amino acids to support yogurt bacteria proliferation. The pH and the organic acid
content in yogurt are inversely associated to each other i.e. when the level lactic acid
content increases, pH levels correspondingly decrease during the fermentation
(Lourens-Hattingh & Viljoen, 2001). Therefore any changes in the rate of pH
reduction and elevation of TA during fermentation or storage would implicate effects
herbs on microbial growth and metabolism (Prajapati and Dave, 1994).
Fermentation of yogurt was terminated at pH 4.5 as this is the best pH value
for commercial yogurt (Hamann & Marth, 1983) and to prevent the growth of
pathogenic organism (Micanel, Haynes, & Playne, 1997). The presence of O.
stamineus, C. asiatica and M. citrifolia extracts reduced the pH further to between
4.04 and 4.23 by day 7 of storage. This was associated with the increased of TA
during storage. Different phytochemical contents in the herbs may have influenced
post-acidification to varying degree during storage in the same manner as the effects
of fruits on yogurt during storage (Kailsapathy, Harmstorf, & Philips, 2007). This
could occur by the phytochemical modulation of growth and activity of S.
thermophilus (Kailasapathy et al., 2007) and other LAB (Prajapati & Dave, 1994)
which are responsible of pH decline during refrigerated storage.
5.1.2 The addition of herbal extract on the total phenolic content in yogurt
Phenolic compounds are secondary metabolites in plants, fruits and
vegetables several of which are essential in human and animal diets (Bravo, 1998;
Crozier et al., 2000; Vattem, Ghaedian, & Shetty, 2005). The phenolic compounds
may consist of flavonoids, cinnamic acid derivatives, coumarins, tocopherols and
polyfunctional organic acid groups (Hertog, Feskens, Hollman, Katan, & Kromhout,
1993). The inclusion of herbal extract in yogurt resulted in higher TPC with O.
stamineus-yogurt (day 14, yOS10, 37.2±2.71µ/ml) showing the highest value
followed by C. asiatica-yogurt (day 14, yCA10, 21.4±1.41 µ/ml), M. citrifolia-
yogurt (day 14, yMC10, 19.3±2.0 µ/ml) and plain-yogurt (day 14, 14.9±1.55 µ/ml).
The TPC values in plain-yogurt, despite an absence of plant extracts, reflect the
phenolic nature of proteins and amino acid with benzene rings.
Plants have a potential in protecting themselves from microbial attack
(pathogen) and resist to biotic and abiotic stresses with the presence of phenolic
compounds (Karaaslan, Ozden, Vardin, & Turkoglu, 2011). In herbal-yogurts,
phenolic compounds may protect the probiotic growth and may sustain its viability
during the refrigerated storage. These compounds are commonly used in the food
industry including dairy sector by the addition of fruit juices (Coisson, Travaglia,
Piana, Capasso, & Arlorio, 2005) rich in phenolics. Phenolic compounds are favored
due to their antioxidant, anti-inflammatory, anti-mutagen, and anti-clotting powers
which have been correlated with a declined risk of cardiovascular diseases and
cancer development (Fresco et al., 2010). The higher phenolic compound found in
the herbal-yogurts may also contribute in the same manner and future studies need to
be carried out to identify the specific phenolic compounds responsible for these
properties.
5.1.3 Effects of herbal extract on the antioxidant capacity in yogurt
As addressed in previous section, an immediate positive attribute of the
addition of herbs into yogurt is the fortification of yogurt with phenolic compounds.
This potentially increases the value of yogurt because most phenolic compounds
have antioxidant activities. Apart from flavoring, this is one of the reasons why herbs
are added to other milk products such as cheese to make it more “functional”
(Coisson et al., 2005) and also possibly to extend the product’s shelf life (Coppen,
1994). Antioxidants can neutralize the oxidizing effects of free radicals by donating
electrons (Sherwin, 1978) and thus the wide use of antioxidants in the food industry
to delay the oxidation process (Berset, Brand-Williams, & Cuvelier, 1994).
Antioxidant activity in the yogurt is not only limited to phenolic compounds because
the presence of different antioxidant components in the extracts such as sugar,
organic acid and milk protein proteolysis (Lourens-Hattingh & Viljoen, 2001) may
also function as hydrogen donor.
In the present study O. stamineus-yogurt, C. asiatica-yogurt and M.
citrifolia–yogurt showed higher capacity to inhibit DPPH oxidation than plain-yogurt
(Figure 4.4, 4.5 and 4.6). The phytochemicals in the herbal water extract used O.
stamineus (Akowuah, Ismail, Norhayati, & Sadikun, 2005), C asiatica (Zainol,
Abdul-Hamid, Yusof, & Muse, 2003) and M. citrifolia (Yang, Paulino, Janke-
Stedronsky, & Abawi, 2007), have by themselves, the antioxidant activities. DPPH
inhibition attribute to yogurt is derived from milk protein proteolysis (Lourens-
Hattingh & Viljoen, 2001) and organic acids (Correia et al., 2004) resulted from
fermentation and post-acidification during storage. Thus, the higher inhibition of
antioxidant by herbal-yogurts than by plain-yogurt could either be due to herbal
water extract or increased production of antioxidants from fermentations or both.
Despite phenolic compounds in herbs having potential antioxidant properties,
both were shown not to be well correlated with each other (Table 4.25; Cai, Luo,
Sun, & Corke, 2004; Akowuah et al., 2004). The DPPH radical-scavenging assay
determined free antioxidants in M. citrifolia product, whereas the assay of total
phenolics with Folin-Ciocalteu reagents determined both free phenolics and bound
phenolics in M. citrifolia product (Singleton, 1999). Therefore, the bound of
antioxidant in M. citrifolia may not contribute in the free-radical-scavenging activity
(RSA) in the DPPH assay (Yang et al., 2007).
5.2 The viability of Lactobacillus ssp. and S. thermophilus in herbal-yogurts
The growths of microorganism are influenced by several factors including
moisture, oxygen concentration, temperature, nutrients, pH and inhibitors (Mountney
& Gould, 1988). The viability of specific bacteria in nutrient rich food, for example
probiotic bacteria in yogurt, is affected by more defined factors such as acidity, pH,
hydrogen peroxide (Dave & Shah, 1996), oxygen content (Ishibashi & Shimamura,
1993), concentrations of lactic and acetic acids and temperature of storage during
both the fermentation and storage of yogurt (Lankaputhra & Shah, 1995;
Lankaputhra, Shah & Britz, 1996). Probiotic should have three characters i.e. able to
inhabit the gastrointestinal tract, survive through the stomach and maintain its
viability and metabolic activity in the intestine (Hyun, & Shin, 1998). Extended
storage period can affect the viability of L. acidophilus and the best shelf-life for
yogurt storage at 4oC is considered to be between 20-40 days (Dave & Shah, 1997;
Nighswonger, Brashears, & Gililand, 1996; and Gilliland & Speck, 1977).
In the present study, the viability of probiotic in herbal-yogurts during storage
was taken into consideration because they should remained high at the acceptable
level (Heller, 2001) despite being exposed to herbal extracts known to possess
antibacterial activities. Most strains of L. acidophilus do not survive well in
fermented milk during storage because post-acidification lowers the pH further
(Shah, 2007), and it is difficult to maintain high viable cell numbers in relatively
more acidic environment.
The viability of Lactobacillus spp. and S. thermophilus in herbal-yogurts in
the present studies remained high (106 to 10
7) throughout the storage period which
qualifies the products as ‘live yogurt’ (Dave & Shah, 1997). There is no agreement
on the minimum concentration of probiotics to achieve therapeutic benefit (Donkor
et al., 2006). While some researchers suggest concentration levels above 106cfu mL
-1
(Kurmann & Rasic, 1991) others stipulate >107 and 10
8cfu mL
-1 as satisfactory levels
(Davis, Ashton, & McCaskill, 1971; Kailasapathy & Rybka, 1997; Lourens-Hattingh
& Viljoen, 2001). It can be concluded from the present studies that the presence of
herbs did not significantly reduce the viability of yogurt bacteria.
Several ways to improve the survival of probiotics presence in yogurt have
been suggested. The addition of inulin is able to improve the probiotic viability
(Capela, Hay & Shah, 2006 & Ozer, et al., 2005). The inclusion of
exopolysaccharide (EPS) showed some improvement in the survival of L.
acidophilus until day 21 of storage (Ramchandran & Shah, 2010). EPS is very
sufficient to protect the microbial cells against phagocytosis, phage attacks,
antibiotics, toxic compound, osmotic stress and bacteriocins which effectively reduce
microbial death during yogurt fermentation (Durlu-Ozkaya, Aslim, & Ozkaya, 2007;
Ruas-Madiedo & de los Reyes-Gavilan, 2005). The production of EPS by LAB in
herbal-yogurts was not investigated in the present studies but it is possible that LAB
produced more EPS in the presence of more ‘challenging’ environment produced by
the herbal extracts.
5.3 In vitro inhibition of α-amylase and α-glucosidase.
Type 2 Diabetes (T2D) is a metabolic disease characterized by hyperglycemia
resulting from a defect in insulin secretion or insulin action or both. The craving for
food rich in carbohydrate and simple sugars is one of the causes for diabetes. The
therapeutic approach of treating T2D is to decrease the postprandial hyperglycemia
by inhibiting carbohydrate-hydrolysing enzymes (α-amylase and α-glucosidase) thus
reducing the rate of glucose absorption from intestine into blood (Bhandari, Nilubon,
Gao, & Kawabata, 2008).
Acarbose and miglitol, synthetic diabetes drugs, are used conventionally as
glucosidase inhibitors but these medicine are responsible for side effects such as
abdominal pain, flatulence and diarrhea in the patients (Fujisawa, Ikegami, Inoue,
Kawabata, & Ogihara, 2005). Thus more effective and safe inhibitor of α-amylase
and α-glucosidase are required (Bhandari, Nilubon, Gao, & Kawabata, 2008). In the
present studies it was found that the inhibition of α-amylase and α-glucosidase by
yogurt can be enhanced by three different plant water extracts. Manipulation of food
capacity to inhibit α-amylase and α-glucosidase opens up additional possibilities for
the control of gastrointestinal carbohydrate digestion and thus the rate of glucose
absorption into the systemic circulation.
5.3.1 In vitro inhibition of α-amylase by herbal-yogurts
Amylase is present in both salivary and pancreatic secretion (Ramasubbu et
al., 2004) and is responsible for cleaving large malto-oligosaccharides to maltose, a
substrate for intestinal α-glucosidase (Loizzo et al., 2008). The consumption of yogurt
was shown beneficial to those with diabetes by virtue of the anti-amylase activities by
this milk product (Salminen, Gueimonde, & Isolauri, 2005). O. stamineus-yogurt, C.
asiatica-yogurt and M. citrifolia-yogurt showed more pronounced inhibition on α-
amylase activity than could plain-yogurt (Figures 4.9, 4.11 and 4.13). This finding
indicates that the therapeutic benefits gain from yogurt (Chowdhury, Chakraborty, &
Raychaudhuri, 2008) may be further enhanced by the addition of certain herbal
extracts.
The inhibitory effect of herbal-yogurts on α-amylase could be explained by
the presence of phytochemicals in the plant water extracts used. The total phenolic
content showed good correlations with α-amylase inhibition, with the strongest for
M. citrifolia-yogurt followed by C. asiatica-yogurt, O. stamineus-yogurt and plain-
yogurt (0.72, 0.60, 0.37 and 0.20 respectively). Phytochemicals may consist of
hundreds of compound which may categorized as natural monophenols, flavonoids,
phenolic acids, hydroxycinnamic acids, lignans, tyrosol esters and stilbenoids. O.
stamineus (Adisakwattana et al., 2010), C. asiatica (Adisakwattana, et al., 2010;
Odhav, Kandasamy, Khumalo, & Baijnath, 2010) and M. citrifolia (Martirosyan,
2009) extracts by themselves can inhibit α-amylase activity and these plants are
widely used to help diabetic patients manage their blood glucose. The phenolic
compounds were reported capable of playing a role in mediating amylase inhibition
(McCue & Shetty, 2004). Further analysis need to be carried out to identify the
specific phenolic compound responsible for the inhibition of α-amylase.
5.3.2 In vitro inhibition of α-glucosidase by herbal-yogurts
All herbal-yogurts had higher inhibitory effects on α-glucosidase compared to
plain-yogurt. The inhibitory effects of herbs on α-glucosidase were found to be
greatest in C. asiatica-yogurt followed by M. citrifolia-yogurt and O. stamineus-
yogurt. The inhibition of α-glucosidase activity may be related to the presence of the
plant phenolic compounds since there is some correlation between α-glucosidase
inhibition (IC50) and total phenolic content of herbal-yogurts (r2
= 0.61, 0.49, 0.68 for
O. stamineus-yogurt, C. asiatica-yogurt and M. citrifolia-yogurt respectively) as
opposed to plain-yogurt (r2
=0.23).
As previously discussed for α-amylase, this highlights the potential use of
selected herbs to enhance the therapeutic properties of yogurt for patients with
diabetes. This is because α-glucosidase, an enzyme release by the small intestine,
cleaves di- and oligosaccharides into monosaccharide glucose prior to its absorption
into the blood circulation (Kawabata, Gao, Huang, & Xu, 2007). α-glucosidase
inhibitors such as acarbose and miglitol, being modified saccharides, exert their
effects through competitive and reversible inhibition of intestinal α-glucosidase enzyme
(Vadivel & Biesalski, 2011). The delay of glucose absorption by α-glucosidase
inhibition may thus reduce the hyperglycemia impact of an otherwise fast carbohydrate
digestion. The apparent presence of α-glucosidase inhibitors in the plants used in the
present studies offer safe and potentially fewer side effects commonly attributed to
inhibitory effects of natural plant compounds (McCue & Shetty, 2004).
5.4 Organoleptic properties of herbal-yogurts
The evaluation of sensory properties of herbal-yogurts is important to know
consumer preference and for marketing purposes. The organoleptic properties of
yogurt are correlated to several factor including TA content (Guler & Multu, 2005)
rheology, viscosity and firmness. During fermentation, S. thermophilus main
products metabolism are lactic acid, acetic acid, acetaldehyde, ethanol and diacetyl
(Ozer, Kirmaci, Oztekin, Hayaloglu, & Atamer, 2007) which all contributed to the
sourness of fermented yogurt (Hugenholtz and Kleerebezem, 1999). The presence of
acetaldehyde contributed to yogurt aroma (Pette & Lolkema, 1950). The
concentration of these metabolites were not measured in the present studies but the
formation of these compounds may be altered by the added herbal extract during in
yogurt fermentation as demonstrated for lemon yogurt (Boeneke & Aryana, 2008).
Plain-yogurt scored better for all sensory parameters compared to herbal-
yogurts (Table 4.26). The phytochemicals in the herbs used can be considered to play
important role in causing poor organoleptic properties of herbal-yogurts. Herbs
contain a diverse range of metabolites which may responsible for their unique taste
and flavor (Rivasseau et al, 2006). For example, ripe M. citrifolia fruit emanates a
strong byturic-acid-like rancid smell (Morton, 1992; Dixon et al. 1999) which
originates from hexanoic and octanoic acid (Matsuo, Sugaya, Yasukawa, Aigaki, &
Fuyama, 2007). The presence of tannin in O. stamineus extract (Chew et al., 2011)
can affect the astringency and bitterness (Takeda, 1994). In addition, O. stamineus
also contains lipophilic flavones, flavonol glycosides and caffeic acid derivatives
such as rosmarinic acid and 2,3-dicaffeoyltartaric acid (Sumaryono et al., 1991). In
previous studies, C. asiatica was shown to contain γ-terpinene and β-pinene. The
presence of γ-terpinene contributes bitter flavor (Wongfhun, Gordon, &
Apichartsrangkoon, 2010) whereas β-pinene gives rise to plastic and pine-like aroma
(Wongfhun, Gordon, & Apichartsrangkoon, 2010). Other compounds contain in C.
asiatica are β-caryophyllene, humulene, E-β-farnesene, α-copaene, β-elemene, and
alloaromadendrene (Wongfhun, Gordon, & Apichartsrangkoon, 2010) but the effects
of these compounds on the taste flavored have not been studied. It is not possible
from the studies to associate which metabolites are responsible for the low
organoleptic score of herbal yogurt. Therefore, future studies are required to establish
possible relationship between these compounds and organoleptic properties of
herbal-yogurts.
5.5 Implication of findings
The presence O. stamineus, C. asiatica and M. citrifolia extracts were shown
to stimulate the acidification process during yogurt fermentation, enhanced bacterial
growth and resulted in higher yogurt in vitro inhibition of α-amylase and α-
glucosidase activities. These changes may be regarded as highly desirable because
the proportionately more milk lactose catabolized, higher bacterial counts and
enhanced inhibition of diabetic enzymes make herbal-yogurts better than plain-
yogurt with respect to nutritional and functional properties.
Functional food products are relatively new to Malaysian consumers. The
eating of yogurt as functional food is now seen as very trendy largely because of the
association of milk consumption with affluence and wellness. Most yogurt products
in the market are currently made to appeal to the healthy bacteria it contains and
other essential nutrients such as calcium, folate and vitamin D. The proposition of
herbal-yogurt as a functional food should therefore be unique and relate to its herbal
taste, health benefits, probiotic survival and stability of the product during storage.
One of the challenges in making herbal-yogurt more appealing to consumers
is to improve its organoleptic properties. All herbal-yogurts in the present studies
showed less organoleptic scores than plain-yogurt, probably due to the high plant
phenolic and flavonoid compounds. Future studies to enhance the taste and texture of
herbal-yogurt should be carried out. This is despite the fact that the higher
antioxidant contents, bacterial counts and higher inhibition of α-amylase and α-
glucosidase in these yogurts make organoleptic properties relatively of small issues.
The addition of natural additives such as non-caloric sweeteners (e.g. stevia) (Savita,
Sheela, Sharan, Shankar, & Parama, 2004) and EPS-producing LAB to prevent whey
separation thus enhancing the rheology, texture and mouth feel (Jolly, Sebastien,
Duboc, & Neeser, 2002; Welman & Maddox, 2003) are examples of approaches to
improve herbal-yogurt organoleptic properties.
Efforts in making herbal-yogurt more acceptable for the organoleptic points
of view stem from three encouraging health and wellness developments: an ever
increasing trend in the consumption of a) yogurts and b) herbal products and c) the
continuing search for natural, and safe with little side effects treatment for diabetes.
The trend for yogurt and yogurt drink consumption in Malaysia is on the rise. This
phenomenon is in line with those in the developed countries (Jones & Jew, 2007).
Yogurt market in Malaysia for the year 2010 generated revenues of $79.2 million
with yogurt drinks sales proved as the most favourite for Malaysian yogurt market
because the sale for this sector alone was $70.9 million (Datamonitor, 2010).
Malaysian spent about RM91/person/year on herbal product compared to
RM45/person/year for the American (Hussin, 2001). In fact there is an increasing
shift away from the use of conventional medicines to natural substances like herbs is
associated with the belief and accumulated evidence that many herbal products are
safer than synthetic substances (Hussin, 2001; Han, Abas, & Sabariah, 2008).
From the abovementioned deliberations, it is anticipated that herbal-yogurts
have the potential in the near future to be accepted as main-stream yogurt products,
especially after the issues related to current apparently low organoleptic properties
have been addressed.
5.6 Conclusion
The presence of O. stamineus, C. asiatica and M. citrifolia changed yogurt
fermentation. The herbal extracts sustained the viability of probiotic, Lactobacillus
spp. throughout refrigerated storage. O. stamineus-yogurt, C. asiatica-yogurt and M.
citrifolia-yogurt formed enhanced the inhibition of α-amylase and α-glucosidase
activity in vitro.