chapter 4 data analysis and findings - · pdf filedata analysis and findings in this chapter...
TRANSCRIPT

Chapter 4
Data Analysis and Findings
In this chapter the results of the data analysis are presented. The data
were collected and then processed in response to the problems posed in chapter
1 of this dissertation. Two fundamental goals drove the collection of the data
and the subsequent data analysis. Those goals were to develop a base of
knowledge about the technology education curriculum organizer, construction, as
it is perceived and utilized relative to other curriculum organizers, and to
determine if current perception and utilization are consistent with the basic goals
or principles of technology education. These objectives were accomplished.
The findings presented in this chapter demonstrate the potential for merging
theory and practice.
Response Rate
One hundred and fifty eight surveys were initially sent to faculty members
of technology teacher education programs that were identified in the Industrial
Teacher Education Directory 1996-97 35th Edition. However, 10 were sent to
programs that no longer offered a viable teacher preparation alternative.
Therefore, 148 surveys were considered to be legitimate for this research. One
hundred and fourteen useable surveys were returned. Six additional surveys
were returned that were not considered useable. The unusable surveys were
111
either blank with a note attached which explained why the respondents would not
be able to complete the survey, or only partially complete with major portions of
the survey blank, or in one case the respondent created and revised categories
such that the data could not be entered without serious interpretation and
alteration. With 114 returned and useable surveys out of 148, the response rate
was 77.03%.
Of the 148 surveys, 50 were sent to faculty who were identified as
teachers of construction, either through information obtained from the Industrial
Teacher Education Directory or by contacting and asking someone associated
with the program (usually the chairperson or a secretary). Ninety eight surveys
were sent to faculty who were randomly selected from technology teacher
education programs listed in the Industrial Teacher Education Directory and who
were not listed as specializing in construction. Thirty eight construction surveys
were returned, resulting in a 76% response rate. Seventy six non-construction
surveys were returned, resulting in a 77.55% response rate. (Note: Through
e-mail, one randomly selected respondent indicated an unwillingness to fill out
the survey prior it being sent. Even though no survey was actually mailed it was
counted as a non-response.)
Active Technology Teacher Education Programs
One hundred and six programs were initially contacted based on
information derived from the Industrial Teacher Education Directory. Of those
original 106 programs, 7 were eventually identified as either no longer preparing
112

teachers or in the process of phasing out their teacher preparation program.
Ninety nine programs were considered to be active and, therefore, valid for this
study.
Medoid Clustering
Following the data entry, the first step in this analysis involved medoid
clustering of the Section 2 data. In Section 2 of the survey instrument (see
Appendix A) the respondents were asked to evaluate the importance of thirteen
goal statements that might apply to technology education. The respondents
were asked to rate each of these statements using a likert-type scale, wherein, 1
equaled very important, 2 equaled important, 3 equaled somewhat important,
and 4 equaled not important. The medoid clustering program of Number
Cruncher was used to process this information for the purpose of sorting the
respondents into clusters according to their Section 2 responses. To determine
how many clusters would produce the best fit for the given data, the default
setting of two to five clusters was accepted. The program calculated an objective
function value for each cluster combination. The objective function values were:
4126.212 for a two cluster model, 2595.681 for a three cluster model, 1875.044
for a four cluster model and 1441.752 for a five cluster model. Figure 3 is a
graph of those values. With the aid of the graph we can see that the objective
function value decreases sharply from two to three clusters and then the
decrease becomes less pronounced.
113

Regarding the selection of the number of clusters, Hintze (1992) wrote
“You want to chose the number after which the objective function seems to quit
decreasing at a rapid rate” (p. 247). Therefore, the 3 cluster model was selected
for further analysis. Hintze suggests discriminant analysis as a means for
analyzing “the appropriateness of the cluster configuration” (p. 237).
1
2
3
4
5
Tho
usan
ds
Number of Clusters
Obj
ectiv
e F
unct
ion
Val
ue
2 3 4 5
Figure 3 Results of Medoid Clustering
In order to evaluate the appropriateness of the clusters, the respondent
information provided in the Cluster Report was added to the data set. Table 10
lists of the row number of each respondent according to the cluster assignment.
114

Table 10 Respondent Assignment to the Clusters in a Three Cluster Model
1, 2, 6, 7, 12, 18, 21, 22, 25, 30, 31, 36, 37, 39, 41, 43, 44, 51, 53, 56, 57, 58, 61,
64, 66, 70, 71, 75, 78, 79, 81, 82, 85, 88, 94, 95, 103, 113, 114
Cluster 3:
3, 4, 8, 10, 13, 14, 23, 27, 29, 35, 38, 45, 46, 47, 48, 49, 50, 52, 54, 55, 62, 65, 67,
68, 69, 74, 77, 80, 83, 87, 89, 91, 96, 99, 102, 104, 105, 106, 108, 110, 111, 112
Cluster 2:
5, 9, 11, 15, 16, 17, 19, 20, 24, 26, 28, 32, 33, 34, 40, 42, 59, 60, 63, 72, 73, 76,
84, 86, 90, 92, 93, 97, 98, 100, 101, 107, 109
Cluster 1:
Using the information displayed in Table 10, a dummy variable column
was added to the original data set. Respondents in cluster 1 were assigned the
number 1, respondents in cluster 2 were assigned the number 2, respondents in
cluster 3 were assigned the number 3.
Discriminant Analysis
Following the assignment of cluster related dummy variables, the data
were evaluated using the discriminant analysis program in the Advanced
Statistics package for Number Cruncher. The discriminant analysis program
provides a diagnostic function, the Misclassifed Rows Report, which allowed for
reassignment of the respondents to the clusters with the potential for reducing
the unexplained error. Following each reclassification another analysis was
performed. The automatic function which instructs the program to search “the
variables for the ‘best set” (p. 86) was employed. Further, only variables were
115

selected which met or exceeded a .05 probability level for an F-test. In Table 11
below, the critical information obtained from the initial run is shown.
Table 11 Results of Initial Discriminant Analysis - Clusters Assigned According
to Medoid Clustering Results
Variable Influence Report
If Removed If AloneVariable Lambda F-Value F-Prob Lambda F-Value F-Prob R²-X's Mean
A 0.87009 7.76 0.0007 0.74799 18.7 0 0.17008 1.526316B 0.90208 5.64 0.0047 0.80877 13.12 0 0.15332 2.052632E 0.87305 7.56 0.0009 0.72028 21.55 0 0.24008 2.149123G 0.90621 5.38 0.006 0.78847 14.89 0 0.31244 1.736842I 0.80811 12.35 0 0.6959 24.25 0 0.22924 2.377193J 0.88028 7.07 0.0013 0.68778 25.19 0 0.288 1.850877K 0.86411 8.18 0.0005 0.66215 28.32 0 0.29212 2.640351L 0.84009 9.9 0.0001 0.74898 18.6 0 0.25043 1.307018
Group Means
1 2 3 OverallA 2.060606 1.380952 1.230769 1.526316 Develop an understanding and appreciation for the importance of fundamental
technological developments.B 2.575758 1.595238 2.102564 2.052632 Develop the full human personality.
E 2.69697 1.547619 2.333333 2.149123 Develop technological literacy with respect to the laws and standards applicableto specific technical fields
G 2.272727 1.666667 1.358974 1.736842 Develop an appreciation for the interrelationships among technology, cultures,the environment, and other human endeavors.
I 2.636364 1.761905 2.820513 2.377193 Develop basic management skills in preparation for potential employment in atechnical field.
J 2.484848 1.690476 1.487179 1.850877 Develop know ledge about and appreciation for the ways that human ingenuityand resources combine to meet human needs and wants.
K 2.454545 2.095238 3.384615 2.640351 Develop basic trade related skills w hich prepare the student for potentialemployment in a technical field.
L 1.69697 1.166667 1.128205 1.307018 Develop the ability to apply practical problem-solving / design techniquesthrough a creative process.
Count 33 42 39 114
Canonical Variate Analysis
Inv(W)B Indvl Total Canon Canon Num Den Wilks'Fn Eigenvalue Prcnt Prcnt Corr Corr² F-Value DF DF Prob>F Lambda1 1.90804 65.1 65.1 0.810016 0.65613 18.5 16 208 0 0.1699532 1.02334 34.9 100 0.711174 0.50577 15.4 7 105 0 0.494232
F-value tests whether this function and those below it are significant.
Included in Table 11 are three separate reports generated by the
discriminant analysis program. At the top is the Variable Influence Report. The
Group Means report is next, and below that is the Canonical Variate Analysis
116

report. Essentially, these reports identify those variables that discriminated
between the clusters. They provide the mean scores for each variable as it
relates to each cluster. They also indicate the overall percentage of the variance
in the data that was explained by this cluster combination.
The Variable Influence Report lists the discriminating variables. To
determine a variable’s significance, the F-Prob in the If Removed section was
used. This column indicates that the removal of any of these variables would
significantly influence the explanation that this cluster combination offers.
Variables A, B, E, G, I J, K, and L were all significant at a .05 level.
The Group Means report shows the mean score on each of the selected
variables. For ease of interpretation, the statements found on the survey
instrument which are represented by the letters A, B, E, G, I J, K, and L were
included. They are located to the right of the “Overall” score. An inspection of
variable “A” reveals that the respondents who constituted cluster 1 valued this
variable the least with a mean of 2.060606, cluster 2 had a mean score of
1.380952, and cluster 3 valued this variable the most highly with a mean of
1.230769. The options available on the survey instrument were 1= very
important, 2 = important, 3 = somewhat important, and 4 = not important.
Therefore, those respondents who were classified as members of cluster 3
valued the goal “Develop an understanding and appreciation for the importance
of fundamental technological developments” higher than the other clusters, and
the difference between the means of the three clusters was significant .
Ultimately, by considering the goal statements in conjunction with the relative
117

means of the three clusters, an interpretation of the results was achieved.
However, since Table 11 is only the first of three generations of this report the
individual details of each variable will not be discussed. After briefly reviewing
each successive report, the final report will be covered in detail.
The Canonical Variate Analysis report provides an assessment of the
overall significance and explanatory power of the model. This three cluster
model was significant at a .05 level as shown in the Prob>F column. This model
explains 50.577% of the variance which can be seen under the Canon Corr ²
column. Wilks’ Lambda indicates that .494232 is unexplained error.
As was discussed earlier, Number Cruncher’s Discriminant Analysis
program also produces a report titled “Misclassified Rows Report”. A sample of
this report is shown in Table 12.
Table 12 Sample Misclassified Rows Report
Misclassified Rows Report
Row Act Pred P(1 ) P(2 ) P(3 )5 1 3 0.174 0.33 0.49644 3 1 0.552 0.16 0.28868 2 3 0.146 0.198 0.65672 1 2 0.031 0.963 0.00673 1 2 0.387 0.611 0.00278 3 2 0.364 0.47 0.16697 1 3 0.317 0.048 0.635
The information found in the misclassified rows report was used to
increase the accuracy of cluster assignment. For example, row 5 was originally
assigned to cluster 1 through medoid clustering. However, the discriminant
analysis program suggested a better fit if it were reclassified to cluster 3.
118

After reclassifying the rows according to this information the discriminant
analysis program was run again. To achieve the results shown in Table 13
below, this process had to be repeated two times before the report read “All rows
were classified correctly”.
Table 13 Results of Discriminant Analysis Following Reclassification of Rows
with All Variables Included
Variable Influence Report
If Removed If AloneVariable Lambda F-Value F-Prob Lambda F-Value F-Prob R²-X's Mean
A 0.89838 5.88 0.0038 0.79278 14.51 0 0.17008 1.526316B 0.81453 11.84 0 0.78295 15.39 0 0.15332 2.052632E 0.82862 10.76 0.0001 0.70316 23.43 0 0.24008 2.149123G 0.86291 8.26 0.0005 0.80098 13.79 0 0.31244 1.736842I 0.66856 25.78 0 0.62383 33.47 0 0.22924 2.377193J 0.8569 8.68 0.0003 0.65192 29.63 0 0.288 1.850877K 0.90442 5.5 0.0054 0.70698 23 0 0.29212 2.640351L 0.75702 16.69 0 0.70952 22.72 0 0.25043 1.307018
Group Means
1 2 3 OverallA 2 1.488372 1.2 1.526316 Develop an understanding and appreciation for the importance of fundamental
technological developments.B 2.548387 1.534884 2.225 2.052632 Develop the full human personality.
E2.774194 1.55814 2.3 2.149123 Develop technological literacy with respect to the laws and standards applicable
to specific technical fields
G2.290323 1.651163 1.4 1.736842 Develop an appreciation for the interrelationships among technology, cultures,
the environment, and other human endeavors.
I2.774194 1.697674 2.8 2.377193 Develop basic management skills in preparation for potential employment in a
technical field.
J2.548387 1.697674 1.475 1.850877 Develop know ledge about and appreciation for the ways that human ingenuity
and resources combine to meet human needs and wants.
K2.548387 2.093023 3.3 2.640351 Develop basic trade related skills w hich prepare the student for potential
employment in a technical field.
L1.741935 1.186047 1.1 1.307018 Develop the ability to apply practical problem-solving / design techniques
through a creative process.Count 31 43 40 114
Canonical Variate Analysis
Inv(W)B Indvl Total Canon Canon Num Den Wilks'Fn Eigenvalue Prcnt Prcnt Corr Corr² F-Value DF DF Prob>F Lambda1 2.62833 68.7 68.7 0.851112 0.72439 23.7 16 208 0 0.1255272 1.19562 31.3 100 0.737935 0.54455 17.9 7 105 0 0.455451
F-value tests whether this function and those below it are significant.
Related to Table 13 four points are noteworthy. First, the same variables
as identified in Table 11 continued to be significant at a .05 level. Second, the
value and relationship of the cluster means as found in the “Group Means”
119

portion of the table are relatively unchanged compared to the “Group Means”
shown in Table 11. Third, as would be expected, the number of respondents per
cluster changed. Cluster 1 decreased from 33 to 31, Cluster 2 increased from
42 to 43, and Cluster 3 increased from 39 to 40. Fourth, the canonical
correlation² increased from .50577 to .54455. In other words, this configuration
offered an explanation of the variance that was approximately 4% better than the
original medoid clustering configuration.
Upon consideration of the goal statements associated with the
discriminating variables, identifiable categories seemed to emerge. The
respondents who comprised Cluster 3 valued A, G, J, and L highly, all of which
are consistent with the broad educational goals of technological literacy. Cluster
3 also assigned low scores to variables I and K , which are consistent with a
preparation for industry or vocational focus. This combination seemed indicative
of a technological literacy focus. If the variables that were highly ranked by the
respondents in Cluster 2 are considered, a pattern of favoring both preparation
for industry and general education was observable. Variables E, I, and K are
preparation for industry oriented and variable B was derived from the operational
definition for general education used in this dissertation. (Future references to
variable B will identify it as the general education variable or variable GE). The
respondents who made up Cluster 1 scored many of variables lower than the
other two clusters. In addition, they did not assign a high rating to any of the
variables. Therefore, this cluster appeared to be ambivalent towards these
goals.
120
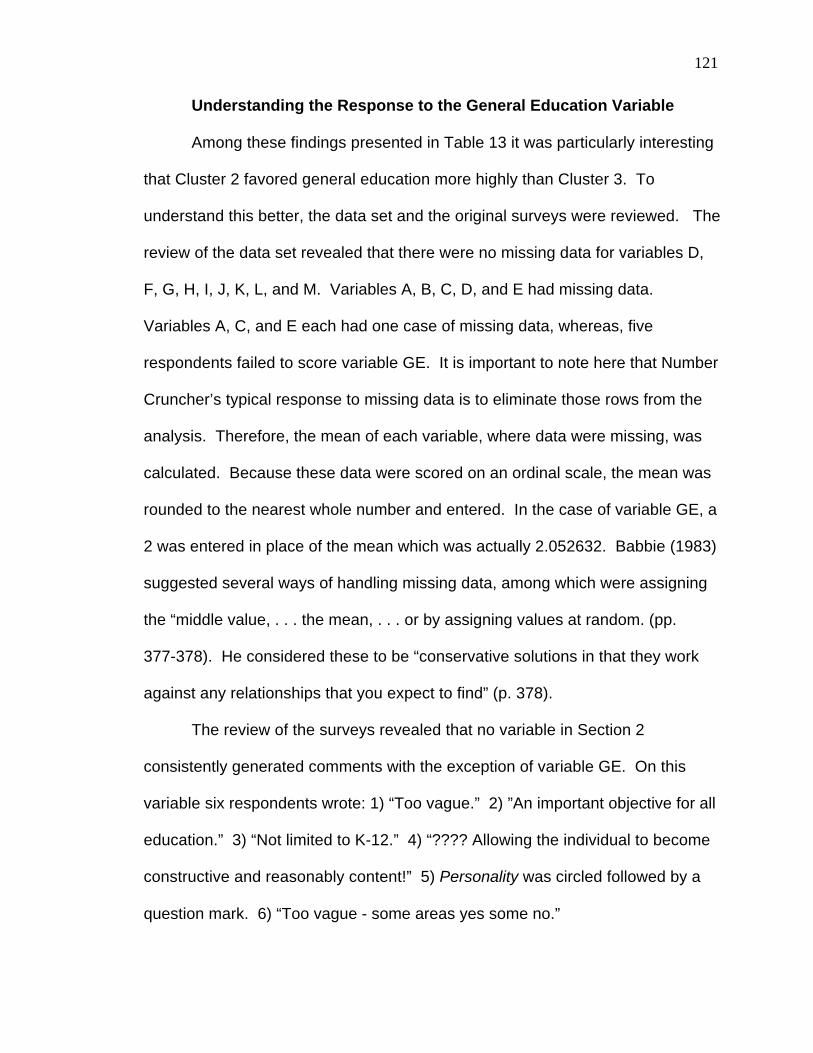
Understanding the Response to the General Education Variable
Among these findings presented in Table 13 it was particularly interesting
that Cluster 2 favored general education more highly than Cluster 3. To
understand this better, the data set and the original surveys were reviewed. The
review of the data set revealed that there were no missing data for variables D,
F, G, H, I, J, K, L, and M. Variables A, B, C, D, and E had missing data.
Variables A, C, and E each had one case of missing data, whereas, five
respondents failed to score variable GE. It is important to note here that Number
Cruncher’s typical response to missing data is to eliminate those rows from the
analysis. Therefore, the mean of each variable, where data were missing, was
calculated. Because these data were scored on an ordinal scale, the mean was
rounded to the nearest whole number and entered. In the case of variable GE, a
2 was entered in place of the mean which was actually 2.052632. Babbie (1983)
suggested several ways of handling missing data, among which were assigning
the “middle value, . . . the mean, . . . or by assigning values at random. (pp.
377-378). He considered these to be “conservative solutions in that they work
against any relationships that you expect to find” (p. 378).
The review of the surveys revealed that no variable in Section 2
consistently generated comments with the exception of variable GE. On this
variable six respondents wrote: 1) “Too vague.” 2) ”An important objective for all
education.” 3) “Not limited to K-12.” 4) “???? Allowing the individual to become
constructive and reasonably content!” 5) Personality was circled followed by a
question mark. 6) “Too vague - some areas yes some no.”
121

Given that some level of uncertainty about the meaning of variable GE
existed, and given that the respondents’ true feelings may not have been
reflected by inserting the mean as a response, it seemed worthwhile to re-run the
discriminant analysis and exclude the general education variable.
Table 14 is the results of discriminant analysis on all Section 2 variables
except variable GE. Beginning with the row classifications that had previously
been identified as correct for all variables, the discriminant analysis program was
run eight times before all the rows were reclassified such that the program
reported that all rows were correctly classified.
Five fundamental points are worth noting in Table 14. First, the Variable
Influence Report identified variables C, E, G, I, J, K, L, and M as significant at a
.05 level. Second, variables C and M were added to this list, whereas, variable
GE was intentionally omitted, and variable A ceased to be significant. (see Table
13) Third, the relationship between those variables that were significant in the
previous generations and which continued to be significant (variables E, G, I, J,
K, and L) did not change substantially. This can be observed by comparing the
means for these variables found Table 11 and Table 13. Fourth, the number of
respondents in the various clusters changed. Cluster 1 increased from 30 to 31,
cluster 2 increased from 43 to 51, and cluster 3 decreased from 40 to 33. Fifth,
the canonical correlation ² increased from .54455 to .66267, thus, increasing the
amount of variance explained by approximately 12%.
122

Table 14 Results of Discriminant Analysis Excluding the General Education
Variable (GE) - Respondents Reclassified
Variable Influence Report
If Removed If AloneVariable Lambda F-Value F-Prob Lambda F-Value F-Prob R²-X's Mean
C 0.89794 5.91 0.0037 0.88235 7.4 0.001 0.26444 1.552632E 0.84882 9.26 0.0002 0.75702 17.81 0 0.22989 2.149123G 0.63914 29.36 0 0.70167 23.6 0 0.29977 1.736842I 0.738 18.46 0 0.6493 29.98 0 0.262 2.377193J 0.93344 3.71 0.0278 0.75173 18.33 0 0.32293 1.850877K 0.77416 15.17 0 0.62309 33.57 0 0.30442 2.640351L 0.58037 37.6 0 0.69263 24.63 0 0.2157 1.307018M 0.69102 23.25 0 0.79531 14.28 0 0.1992 1.45614
Group Means
1 2 3 OverallC 1.933333 1.529412 1.242424 1.552632 Develop the ability to understand and assess the issues and outcomes of
technological activities.E 2.7 1.666667 2.393939 2.149123 Develop technological literacy with respect to the laws and standards applicable
to specific technical fieldsG 2.4 1.666667 1.242424 1.736842 Develop an appreciation for the interrelationships among technology, cultures,
the environment, and other human endeavorsI 2.666667 1.823529 2.969697 2.377193 Develop basic management skills in preparation for potential employment in a
technical field.J 2.466667 1.607843 1.666667 1.850877 Develop know ledge about and appreciation for the ways that human ingenuity
and resources combine to meet human needs and wants.K 2.433333 2.176471 3.545455 2.640351 Develop basic trade related skills w hich prepare the student for potential
employment in a technical field.L 1.766667 1.117647 1.181818 1.307018 Develop the ability to apply practical problem-solving / design techniques
through a creative process.M 1.633333 1.117647 1.818182 1.45614 Develop an understanding about the necessity of lifelong technological learning
in order to adapt to changing technological careers and environments.Count 30 51 33 114
Canonical Variate Analysis
Inv(W)B Indvl Total Canon Canon Num Den Wilks'Fn Eigenvalue Prcnt Prcnt Corr Corr² F-Value DF DF Prob>F Lambda1 2.344 54.4 54.4 0.837232 0.70096 27.9 16 208 0 0.1008772 1.96442 45.6 100 0.814043 0.66267 29.5 7 105 0 0.337334
F-value tests whether this function and those below it are significant.
Interpreting the Variables and Identifying the Clusters
To identify the unique qualities of each cluster, the mean score for each of
the three clusters was considered in relationship to the characteristics of each
significant variable. To accomplish this, three categories of variables were
established. These categories were: technological literacy, preparation for
industry, and a combination of technological literacy and preparation for industry.
123

Variables C, G, J, and L were adopted from the Technology for All Americans
(November 8, 1995) draft published on the World Wide Web and were
considered to be technological literacy variables. Variable M was also derived
from the same source but was considered to be a combination variable in that it
focuses some attention on “technological careers”. Variables E was also
considered a combination variable since it mentions “technological literacy” but it
is limited it to “laws and standards applicable to specific technical fields”.
Variables I and K were considered to preparation for industry variables due to
the emphasis placed on employment. Table 15 presents the Group Means
report reorganized according to these variable categories.
Table 15 Group Means Report Reorganized According to Variable Categories
1 2 3 Overall
TechnoloicalLiteracy
C 1.933333 1.529412 1.242424 1.552632Develop the ability to understand and assess the issuesand outcomes of technological activities.
TechnoloicalLiteracy
G 2.4 1.666667 1.242424 1.736842Develop an appreciation for the interrelationships amongtechnology, cultures, the environment, and other humanendeavors.
TechnoloicalLiteracy
J 2.466667 1.607843 1.666667 1.850877Develop knowledge about and appreciation for the waysthat human ingenuity and resources combine to meethuman needs and wants.
TechnoloicalLiteracy
L 1.766667 1.117647 1.181818 1.307018Develop knowledge about and appreciation for the waysthat human ingenuity and resources combine to meethuman needs and wants.
Preparation forIndustry
I 2.666667 1.823529 2.969697 2.377193Develop basic management skills in preparation forpotential employment in a technical field.
Preparation forIndustry
K 2.433333 2.176471 3.545455 2.640351Develop basic trade related skills which prepare thestudent for potential employment in a technical field.
Combination -Tech. Lit & Prep
for IndustryE 2.7 1.666667 2.393939 2.149123
Develop technological literacy with respect to the lawsand standards applicable to specific technical fields
Combination -Tech. Lit & Prep
for IndustryM 1.633333 1.117647 1.818182 1.45614
Develop an understanding about the necessity of lifelongtechnological learning in order to adapt to changingtechnological careers and environments
Count 30 51 33 114
124

In Table 15 we can see that the respondents who comprised the
population for cluster 3 consistently scored the technological literacy variables
high. Their mean scores for variables C, G, and L were quite close to 1 which
indicated a rating of Very Important. Variable J received a mean score of 1.666
which is what less than mid way between Very Important and Important. The
cluster 3 respondents’ mean scores on the preparation for industry variables
were also compatible with a broad-based approach to technological literacy.
Their mean score for variable I was 2.969 or Somewhat Important and their
score for variable K was 3.545 or half way between Somewhat Important and
Not Important. The mean score for the cluster 3 respondents was 2.393 on
combination variable E, indicating that they considered it to be between
Important and Somewhat Important. Finally, they valued variable M slightly
higher than Important.
Compared to the cluster 3 respondents, the cluster 2 respondents rated
the technological literacy variables C and G slightly lower and variables J and L
marginally higher. However, cluster 2 respondents provided the highest rating of
the three clusters on the preparation for industry variables. They also assigned
the highest rating to the combination variables.
A comparison of the scores of these two clusters indicated tendencies
which were representative of two unique philosophies. Because of their
tendency to value broad-based technological literacy goals while also minimizing
the importance of career or employment related goals, cluster 3 seemed most
closely linked with the general education approach to Technology Education.
125

Cluster 2, on the other hand, seemed to represent an Industrial Technology
Education focus. Comparatively, cluster 2 indicated somewhat less appreciation
of the broad technological literacy goals while favoring the preparation for
industry and combination goals.
Cluster 1 respondents were clearly the least in favor of the technological
literacy goals, but they also tended to rate the preparation for industry and
combination variables low. With the exception of variable K, they rated the
preparation for industry and combination variables below the overall mean
scores. Therefore, the best descriptor for the cluster 1 respondents seemed to
be ambivalence.
Determining Respondents’ Tendencies According to Cluster Assignment
The process of sorting the respondents into clusters according to their
rating of the goal statements in Section 2 of the survey, and then identifying the
tendencies of the cluster respondents through the use of discriminant analysis,
provided an answer to problem statement 2 found in the first chapter of this
dissertation. That problem was to determine the respondents’ tendency to value
either general education or preparation for industry in K-12 technology education
programs.
Follow-up to the Elimination of the General Education Variable
After completing the discriminant analysis necessary for the identification
of the three clusters, the discriminant analysis program was run one final time,
126

but variable GE, the general education variable, was included along with the
other 12 variables. Interestingly, with the respondents reclassified according to
the previous misclassified rows reports, the addition of variable GE made no
noticeable impact on the results of the discriminant analysis. Variable GE was
not significant at a .05 level, and its introduction did not alter the overall
canonical correlation². Table 16 includes the Variable Selection Report and the
Canonical Variate Analysis from this final run.
Table 16 Discriminant Analysis Results with Variable GE Included After
Reclassification
Variable Selection Report
Classification Variable: CLST Iteration: 8
IN Variable R2-Ad F-Val F-Prob R2-X's IN Variable R2-Ad F-Val F-Prob R2-X's
Yes C 0.102 5.9 0.0037 0.2644 Yes E 0.151 9.3 0.0002 0.2299
Yes G 0.361 29.4 0 0.2998 Yes I 0.262 18.5 0 0.262
Yes J 0.067 3.7 0.0278 0.3229 Yes K 0.226 15.2 0 0.3044
Yes L 0.42 37.6 0 0.2157 Yes M 0.309 23.3 0 0.1992
No A 0.003 0.2 0.8469 0.2873 No GE 0.001 0 0.9605 0.1583
No D 0.001 0.1 0.9424 0.143 No F 0.014 0.7 0.4897 0.2326
No H 0.027 1.4 0.25 0.1334
Overall Wilk's Lambda 0.10087742 Action this step: none
Canonical Variate Analysis
Inv(W)B Indvl Total Canon Canon Num Den Wilks'
Fn Eigenvalue Prcnt Prcnt Corr Corr² F-Value DF DF Prob>F Lambda
1 2.344 54.4 54.4 0.837232 0.70096 27.9 16 208 0 0.10088
2 1.96442 45.6 100 0.814043 0.66267 29.5 7 105 0 0.33733
F-value tests whether this function and those below it are significant.
127

Determining the Relative Importance of Construction
The relative importance of construction as compared to other curriculum
content organizers was calculated two ways. First, the overall mean of each
organizer within each human/technology sphere of interaction was computed
from the data provided in Section 3 of the survey. Second, similar information
was produced but the respondents were limited to those identified as members
of the Technological Literacy Cluster or cluster 3. Figure 4 shows the mean
percentage of the curriculum assigned to each organizer as determined by the
total sample. Figure 5 shows the mean percentage of the curriculum assigned to
each organizer as determined by the Technological Literacy Cluster.
Accompanying each pie chart is a table which indicates the rank order of
the various organizers and the mean percentage of the curriculum attributed
within each sphere of human/technology interaction. In Figure 4, construction
was ranked fifth in the civic-life sphere, sixth in the personal-life sphere, and fifth
in the work life sphere according to the entire sample population. The mean
percentage of the curriculum assigned to construction in each of the spheres
was 9.97%, 9.92%, and 10.65% respectively.
128

Figure 4 The Relative Importance of CurriculumOrganizers Within Each of the ThreeHuman/Technology Spheres of Interaction -
All Respondents
129
Comm.
Trans.
Energy
Heal.Const.
Manuf.
Recre.
Ed. Tec.
Agri.
Milit.
Comm.
Heal.
Trans.
EnergyRecre.
Const.
Manuf
Agri.
Ed. Tec.
Milit.
Comm.
Energy
Trans.
Manuf.Heal.
Const.
Ed. Tec
Recre.
Agri.Milit.
5.51%Military106.88%Recreation97.41%Agriculture810.12%Health & Medicine7
10.23%EducationalTechnology
610.65%Construction511.46%Transportation411.60%Energy311.77%Manufacturing214.36%Communication1
% ofCurriculum
OrganizerRankOrder
Work-Life
5.44%Military107.90%Agriculture9
8.65%EducationalTechnology
89.42%Manufacturing79.92%Construction610.92%Energy511.11%Recreation411.40%Transportation312.18%Health & Medicine213.06%Communication1
% ofCurriculum
OrganizerRankOrder
Personal-Life
7.31%Military107.75%Agriculture9
8.62%EducationalTechnology
89.41%Recreation79.83%Manufacturing69.97%Construction510.64%Health & Medicine411.10%Energy311.39%Transportation213.99%Communication1
% ofCurriculum
OrganizerRankOrder
Civic-Life
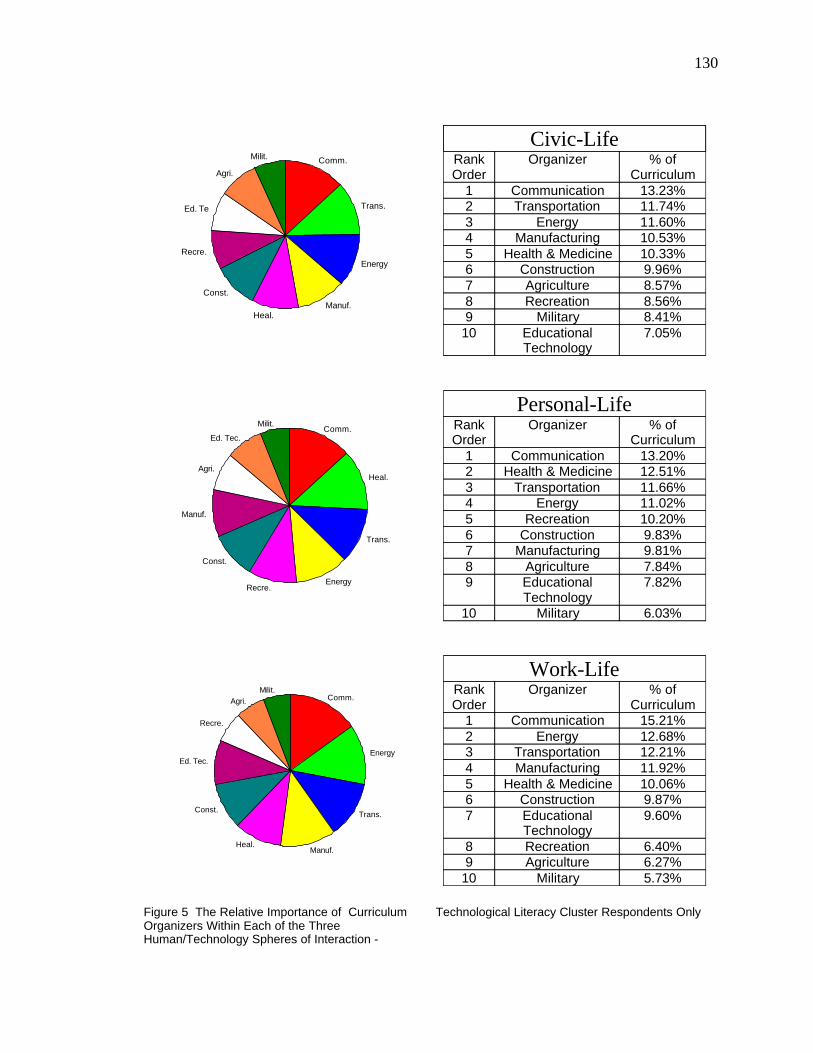
Figure 5 The Relative Importance of CurriculumOrganizers Within Each of the ThreeHuman/Technology Spheres of Interaction -
Technological Literacy Cluster Respondents Only
130
5.73%Military106.27%Agriculture96.40%Recreation8
9.60%EducationalTechnology
79.87%Construction610.06%Health & Medicine511.92%Manufacturing412.21%Transportation312.68%Energy215.21%Communication1
% ofCurriculum
OrganizerRankOrder
Work-Life
6.03%Military10
7.82%EducationalTechnology
97.84%Agriculture89.81%Manufacturing79.83%Construction610.20%Recreation511.02%Energy411.66%Transportation312.51%Health & Medicine213.20%Communication1
% ofCurriculum
OrganizerRankOrder
Personal-Life
7.05%EducationalTechnology
108.41%Military98.56%Recreation88.57%Agriculture79.96%Construction610.33%Health & Medicine510.53%Manufacturing411.60%Energy311.74%Transportation213.23%Communication1
% ofCurriculum
OrganizerRankOrder
Civic-LifeComm.
Trans.
Energy
Manuf.Heal.
Const.
Recre.
Ed. Te
Agri.
Milit.
Comm.
Heal.
Trans.
EnergyRecre.
Const.
Manuf.
Agri.
Ed. Tec.
Milit.
Comm.
Energy
Trans.
Manuf.Heal.
Const.
Ed. Tec.
Recre.
Agri.Milit.

In Figure 5, construction is ranked sixth in the civic-life sphere, sixth in the
personal-life sphere, and sixth in the work life sphere according to cluster 3 or
the Technological Literacy Cluster. The mean percentage of the curriculum
assigned to construction in each of the spheres was 9.96%, 9.83%, and 9.87%
respectively. A comparison of the percentages assigned by the total survey
population with the cluster 3 population revealed very little difference in the
civic-life sphere and the personal-life sphere. A slight increase of 0.8% was
allocated to construction in the work-life sphere when ranked by all respondents.
Even though the percentage of the curriculum changed relatively little, the rank
order was different in the civic and work-life spheres. Close inspection of the
more highly ranked organizers found in Figures 4 and 5 indicated that
differences in the relative rating of other organizers may account more for the
shift in rank than the percentage of curriculum attributed to construction.
Comparing the Relative Importance of Construction with Other Organizers
The information provided in Figures 4 and 5, and the related summary
addressed the question posed in problem statement 1 of this dissertation. This
problem was: to determine the relative degree of importance of the curriculum
content organizer, construction, as compared to other curriculum organizers,
when rated by technology teacher education faculty members identified in the
Industrial Teacher Education Directory 1996-97 35th Edition.
131
A Comparison of the Relative Percent of the Curriculum Attributed to Each
of the Three Human/Technology Spheres
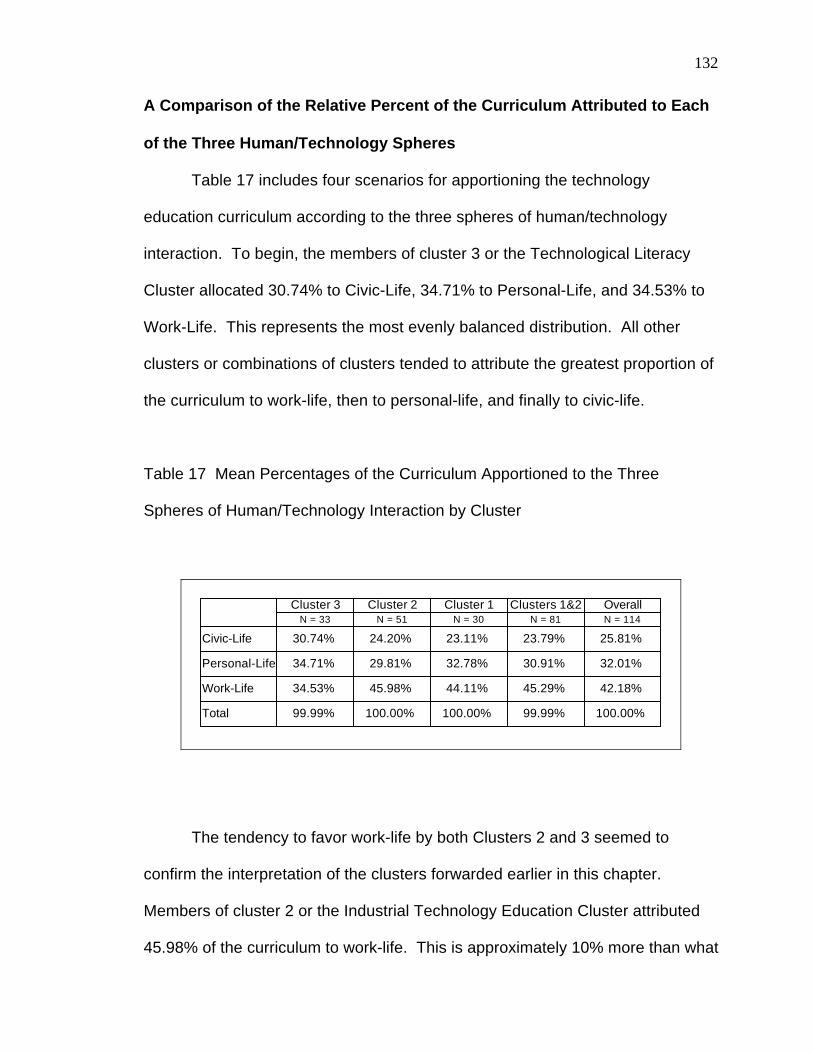
Table 17 includes four scenarios for apportioning the technology
education curriculum according to the three spheres of human/technology
interaction. To begin, the members of cluster 3 or the Technological Literacy
Cluster allocated 30.74% to Civic-Life, 34.71% to Personal-Life, and 34.53% to
Work-Life. This represents the most evenly balanced distribution. All other
clusters or combinations of clusters tended to attribute the greatest proportion of
the curriculum to work-life, then to personal-life, and finally to civic-life.
Table 17 Mean Percentages of the Curriculum Apportioned to the Three
Spheres of Human/Technology Interaction by Cluster
Cluster 3 Cluster 2 Cluster 1 Clusters 1&2 OverallN = 33 N = 51 N = 30 N = 81 N = 114
Civic-Life 30.74% 24.20% 23.11% 23.79% 25.81%
Personal-Life 34.71% 29.81% 32.78% 30.91% 32.01%
Work-Life 34.53% 45.98% 44.11% 45.29% 42.18%
Total 99.99% 100.00% 100.00% 99.99% 100.00%
The tendency to favor work-life by both Clusters 2 and 3 seemed to
confirm the interpretation of the clusters forwarded earlier in this chapter.
Members of cluster 2 or the Industrial Technology Education Cluster attributed
45.98% of the curriculum to work-life. This is approximately 10% more than what
132

was allocated by Technological Literacy Cluster. The Ambivalent Cluster or
cluster 1 allocated approximately 9% more to work-life than did cluster 3. Again,
this seems to support the idea that the members of cluster 1 may tend to value
preparation for industry over technological literacy or general education goals.
While the percentage of the curriculum allocated to personal-life is
relatively the same across clusters, the members of the Technological Literacy
Cluster allocated approximately 5% more to the civic-life sphere than the
members of the Industrial Technology Education Cluster or the Ambivalent
Cluster. This difference also seemed indicative of the differences between a
general education focus as opposed to a more specialized preparation for
industry focus.
Given the size of the clusters, it is not surprising that the overall mean is
more closely aligned with the means of Clusters 1 and 2. Discrepancies in the
totals for each column resulted from rounding error.
With respect to the percentages of the curriculum allocated to the three
spheres, T-Test were used to determine whether a significant difference existed
between the three clusters. Table 18, 19, and 20 present the results of those
calculations.
133

Table 18 T-Tests Comparing the Percentage of the Curriculum Allocated to
Civic-Life by Each of the Three Clusters.
Two Sample T-Test Results
Response: CIV%Group: CLST = 1 CLST = 2Count - Mean 30 23.11 51 24.20196
95% C.L. of Mean 19.38468 26.83532 21.94394 26.45998Std.Dev - Std.Error 9.977089 1.821559 8.028387 1.124199
Ho:Diff=0 Equal Variances Unequal VariancesT Value - Prob. -0.5396619 0.5909 -0.510134 0.6121Degrees of Freedom 79 52.40702Diff. - Std. Error -1.091961 2.023417 -1.091961 2.140538
95% C.L. of Diff. -5.11946 2.935538 -5.387295 3.203373
F-ratio testing group variances 1.544369 Prob. Level 0.193
Two Sample T-Test Results
Response: CIV%Group: CLST = 1 CLST = 3Count - Mean 30 23.11 33 30.74242
95% C.L. of Mean 19.38468 26.83532 26.55152 34.93333Std.Dev - Std.Error 9.977089 1.821559 11.81929 2.057475
Ho:Diff=0 Equal Variances Unequal VariancesT Value - Prob. -2.755019 0.0077 -2.777488 0.0072Degrees of Freedom 61 62.63532Diff. - Std. Error -7.632423 2.77037 -7.632423 2.747959
95% C.L. of Diff. -13.17209 -2.092757 -13.12436 -2.140487
F-ratio testing group variances 1.40338 Prob. Level 0.3551
Two Sample T-Test Results
Response: CIV%Group: CLST = 2 CLST = 3Count - Mean 51 24.20196 33 30.74242
95% C.L. of Mean 21.94394 26.45998 26.55152 34.93333Std.Dev - Std.Error 8.028387 1.124199 11.81929 2.057475
Ho:Diff=0 Equal Variances Unequal VariancesT Value - Prob. -3.022523 0.0033 -2.789617 0.0074Degrees of Freedom 82 52.17468Diff. - Std. Error -6.540463 2.163908 -6.540463 2.344574
95% C.L. of Diff. -10.84516 -2.23577 -11.24521 -1.835718
F-ratio testing group variances2.167336 Prob. Level 0.018
134

Table 19 T-Tests Comparing the Percentage of the Curriculum Allocated to
Personal-Life by Each of the Three Clusters.
Two Sample T-Test Results
Response: PER%Group: CLST = 1 CLST = 2Count - Mean 30 32.77667 51 29.8098
95% C.L. of Mean 28.95524 36.5981 26.82867 32.79094Std.Dev - Std.Error 10.23448 1.868552 10.59942 1.484216
Ho:Diff=0 Equal Variances Unequal VariancesT Value - Prob. 1.231917 0.2216 1.243296 0.2182Degrees of Freedom 79 64.6429Diff. - Std. Error 2.966866 2.408332 2.966866 2.386291
95% C.L. of Diff. -1.826786 7.760517 -1.799347 7.733079
F-ratio testing group variances 1.072587 Prob. Level 0.8331
Two Sample T-Test Results
Response: PER%Group: CLST = 1 CLST = 3Count - Mean 30 32.77667 33 34.71212
95% C.L. of Mean 28.95524 36.5981 31.07727 38.34697Std.Dev - Std.Error 10.23448 1.868552 10.25109 1.784486
Ho:Diff=0 Equal Variances Unequal VariancesT Value - Prob. -0.7490211 0.4567 -0.7490799 0.4566Degrees of Freedom 61 62.45148Diff. - Std. Error -1.935452 2.583975 -1.935452 2.583772
95% C.L. of Diff. -7.102399 3.231496 -7.100452 3.229549
F-ratio testing group variances 1.003248 Prob. Level 0.9929
Two Sample T-Test Results
Response: PER%Group: CLST = 2 CLST = 3Count - Mean 51 29.8098 33 34.71212
95% C.L. of Mean 26.82867 32.79094 31.07727 38.34697Std.Dev - Std.Error 10.59942 1.484216 10.25109 1.784486
Ho:Diff=0 Equal Variances Unequal VariancesT Value - Prob. -2.096864 0.0391 -2.112109 0.0381Degrees of Freedom 82 72.11968Diff. - Std. Error -4.902317 2.337929 -4.902317 2.321053
95% C.L. of Diff. -9.55319 -0.2514434 -9.529295 -0.27534
F-ratio testing group variances 1.069114 Prob. Level 0.8357
135

Table 20 T-Tests Comparing the Percentage of the Curriculum Allocated to
Work-Life by Each of the Three Clusters.
Two Sample T-Test Results
Response: WRK%Group: CLST = 1 CLST = 2Count - Mean 30 44.11334 51 45.98431
95% C.L. of Mean 37.93346 50.29321 41.86739 50.10123Std.Dev - Std.Error 16.55084 3.021756 14.63772 2.049691
Ho:Diff=0 Equal Variances Unequal VariancesT Value - Prob. -0.5291312 0.5982 -0.5124098 0.6103Degrees of Freedom 79 56.68316Diff. - Std. Error -1.870979 3.535946 -1.870979 3.651334
95% C.L. of Diff. -8.909084 5.167125 -9.183456 5.441498
F-ratio testing group variances 1.278477 Prob. Level 0.4605
Two Sample T-Test Results
Response: WRK%Group: CLST = 1 CLST = 3Count - Mean 30 44.11334 33 34.53333
95% C.L. of Mean 37.93346 50.29321 29.56368 39.50298Std.Dev - Std.Error 16.55084 3.021756 14.01554 2.439793
Ho:Diff=0 Equal Variances Unequal VariancesT Value - Prob. 2.486433 0.0157 2.466682 0.0166Degrees of Freedom 61 58.96846Diff. - Std. Error 9.580002 3.85291 9.580002 3.88376
95% C.L. of Diff. 1.875676 17.28433 1.80858 17.35142
F-ratio testing group variances 1.394505 Prob. Level 0.3641
Two Sample T-Test Results
Response: WRK%Group: CLST = 2 CLST = 3Count - Mean 51 45.98431 33 34.53333
95% C.L. of Mean 41.86739 50.10123 29.56368 39.50298Std.Dev - Std.Error 14.63772 2.049691 14.01554 2.439793
Ho:Diff=0 Equal Variances Unequal VariancesT Value - Prob. 3.559912 0.0006 3.593585 0.0006Degrees of Freedom 82 72.62445Diff. - Std. Error 11.45098 3.216647 11.45098 3.186506
95% C.L. of Diff. 5.052061 17.8499 5.099767 17.8022
F-ratio testing group variances 1.090755 Prob. Level 0.7875
136

From the previous three tables we can see that a significant difference
exists with respect to the Civic-Life sphere between Clusters 1 and 3, and
between Clusters 2 and 3 prior to adjusting for multiple tests. However, after
referring to the Bonferroni table no significant difference could be observed at a
.05 level. No significant difference was found between Clusters 1 and 2.
With regard to the personal-life sphere a significant difference was
observed between Clusters 2 and three. However, when adjusted according to
the Bonferroni tables the results were no longer significant. No significant
difference was found when comparing Clusters 1 and 2 or when comparing
Clusters 1 and 3.
When comparing the percentage of the curriculum attributed to the
work-life sphere no significant difference was found between Clusters 1 and 2.
Significant differences were found, however, between Clusters 1 and 3 and
between Clusters 2 and 3. After adjusting for multiple tests using the Bonferroni
tables no significant difference remained between Clusters 1 and 3 but the
difference between Clusters 2 and 3 continued to be significant at a .05 level.
Apportionment of Ten Curriculum Organizers for K-12 Technology
Education Across the Three Human/Tehnology Spheres of Interaction
Table 21 cross-references the percentages of the curriculum attributed to
the three spheres with the percentage of the curriculum allocated to each of the
organizers as determined by the members of the Technological Literacy Cluster.
137

In this model, construction comprises 9.88% of a K-12 technology education
curriculum.
Table 21 Apportionment of Ten Curriculum Organizers for K-12 Technology
Education Across the Three Human/Tehnology Spheres of Interaction as
Determined by the Members of the Technological Literacy Cluster
Civic-Life Personal-Life Work-Life CurriculumTotal %
Agriculture 2.63% 2.72% 2.17% 7.52%
Communication 4.07% 4.58% 5.25% 13.90%
Construction 3.06% 3.41% 3.41% 9.88%
EducationalTechnology
2.17% 2.71% 3.32% 8.20%
Energy 3.57% 3.83% 4.38% 11.77%
Health & Medical 3.18% 4.34% 3.47% 10.99%
Manufacturing 3.24% 3.41% 4.12% 10.76%
Military 2.59% 2.09% 1.98% 6.66%
Recreation 2.63% 3.54% 2.21% 8.38%
Transportation 3.61% 4.05% 4.22% 11.87%
Column Totals 30.74% 34.69% 34.52% 99.95%
Respondents’ Tendencies and Emphasis on the Three Spheres
The preceding sections which review the information provided in Tables
17,18, 19, 20, and 21 addressed the question posed by problem statement 3 of
this dissertation. Problem statement 3 required that this research determine the
effect of the respondents’ tendency to value either general education or
138

preparation for industry on their allocation of curricular emphasis among three
spheres of human/technology interaction: personal-life, work-life, and civic-life.
The Relative Importance of Construction as Perceived by Members of
Clusters 1,2, and 3
To determine if any significant difference existed between the Ambivalent
Cluster (cluster 1), the Industrial Technology Education Cluster (cluster 2), and
the Technological Literacy Cluster (cluster 3) with respect to the relative
importance of construction, a series of t-tests were conducted. No significant
differences were found. Table 22 show the results of comparisons made related
to construction in a civic-life context. Table 23 shows the results of comparisons
made related to construction in a personal-life context. Table 24 shows the
results of comparisons made related to construction in a work-life context.
Although multiple comparisons were made it was not necessary to use the
Bonferroni Multiple Comparison Test since none of the results were significant at
a .05 level.
Respondent’s Tendencies and the Importance of Construction
Problem statement 4 required that this research determine the effect of
the respondents’ tendency to value either general education or preparation for
industry on the relative importance they attributed to construction within each of
the three spheres of interaction. This question was investigated and no
significant difference was found between the three clusters.
139

Table 22 T-Tests Comparing the Percentage of the Civic-Life Curriculum
Allocated to Construction by Members of Clusters 1, 2, and 3.
Two Sample T-Test Results
Response: CCN%Group: CLST = 1 CLST = 2Count - Mean 30 0.1083 51 0.0947451
95% C.L. of Mean 9.096588E-02 0.1256341 8.771513E-02 0.101775Std.Dev - Std.Error 4.642395E-02 8.475814E-03 2.499507E-02 3.50001E-03
Ho:Diff=0 Equal Variances Unequal VariancesT Value - Prob. 1.710233 0.0911 1.478174 0.1472Degrees of Freedom 79 39.74993Diff. - Std. Error 0.0135549 7.925763E-03 0.0135549 9.170033E-03
95% C.L. of Diff. -2.220891E-03 2.933069E-02 -4.978593E-03 0.032088
F-ratio testing group variances 3.449652 Prob. Level 0.0004
Two Sample T-Test Results
Response: CCN%Group: CLST = 1 CLST = 3Count - Mean 30 0.1083 33 9.963636E-02
95% C.L. of Mean 9.096588E-02 0.1256341 8.852177E-02 0.110751Std.Dev - Std.Error 4.642395E-02 8.475814E-03 3.134567E-02 5.456581E-03
Ho:Diff=0 Equal Variances Unequal VariancesT Value - Prob. 0.8751507 0.3849 0.8594572 0.394Degrees of Freedom 61 51.62297Diff. - Std. Error 8.663639E-03 9.899597E-03 8.663639E-03 1.008036E-02
95% C.L. of Diff. -1.113172E-02 0.028459 -1.156387E-02 2.889114E-02
F-ratio testing group variances 2.193456 Prob. Level 0.0338
Two Sample T-Test Results
Response: CCN%Group: CLST = 2 CLST = 3Count - Mean 51 0.0947451 33 9.963636E-02
95% C.L. of Mean 8.771513E-02 0.1017751 8.852177E-02 0.110751Std.Dev - Std.Error 2.499507E-02 3.50001E-03 3.134567E-02 5.456581E-03
Ho:Diff=0 Equal Variances Unequal VariancesT Value - Prob. -0.7918959 0.4307 -0.7545193 0.4535Degrees of Freedom 82 58.98309Diff. - Std. Error -4.891262E-03 6.176647E-03 -4.891262E-03 6.482619E-03
95% C.L. of Diff. -1.717855E-02 7.396028E-03 -1.786295E-02 8.080425E-03
F-ratio testing group variances 1.572702 Prob. Level 0.1619
140

Table 23 T-Tests Comparing the Percentage of the Personal-Life Curriculum
Allocated to Construction by Members of Clusters 1, 2, and 3.
Two Sample T-Test Results
Response: PCN%Group: CLST = 1 CLST = 2Count - Mean 30 0.1059333 51 9.584314E-02
95% C.L. of Mean 9.228907E-02 0.1195776 8.884779E-02 0.1028385Std.Dev - Std.Error 3.654183E-02 6.671596E-03 2.487197E-02 3.482773E-03
Ho:Diff=0 Equal Variances Unequal VariancesT Value - Prob. 1.476867 0.1437 1.340721 0.1866Degrees of Freedom 79 46.06994Diff. - Std. Error 1.009019E-02 6.832163E-03 1.009019E-02 7.525948E-03
95% C.L. of Diff. -3.508848E-03 2.368924E-02 -5.058736E-03 2.523912E-02
F-ratio testing group variances 2.158541 Prob. Level 0.0226
Two Sample T-Test Results
Response: PCN%Group: CLST = 1 CLST = 3Count - Mean 30 0.1059333 33 9.833334E-02
95% C.L. of Mean 9.228907E-02 0.1195776 8.814658E-02 0.10852Std.Dev - Std.Error 3.654183E-02 6.671596E-03 2.872898E-02 5.001073E-03
Ho:Diff=0 Equal Variances Unequal VariancesT Value - Prob. 0.9219719 0.3602 0.9114976 0.3659Degrees of Freedom 61 56.72152Diff. - Std. Error 7.599995E-03 8.243196E-03 7.599995E-03 8.337921E-03
95% C.L. of Diff. -8.883202E-03 2.408319E-02 -9.098008E-03 0.024298
F-ratio testing group variances 1.617858 Prob. Level 0.1903
Two Sample T-Test Results
Response: PCN%Group: CLST = 2 CLST = 3Count - Mean 51 9.584314E-02 33 9.833334E-02
95% C.L. of Mean 8.884779E-02 0.1028385 8.814658E-02 0.1085201Std.Dev - Std.Error 2.487197E-02 3.482773E-03 2.872898E-02 5.001073E-03
Ho:Diff=0 Equal Variances Unequal VariancesT Value - Prob. -0.421509 0.6745 -0.4086117 0.6842Degrees of Freedom 82 62.98214Diff. - Std. Error -0.0024902 5.907822E-03 -0.0024902 6.094296E-03
95% C.L. of Diff. -1.424271E-02 9.262311E-03 -1.466868E-02 9.688282E-03
F-ratio testing group variances 1.334197 Prob. Level 0.3718
141
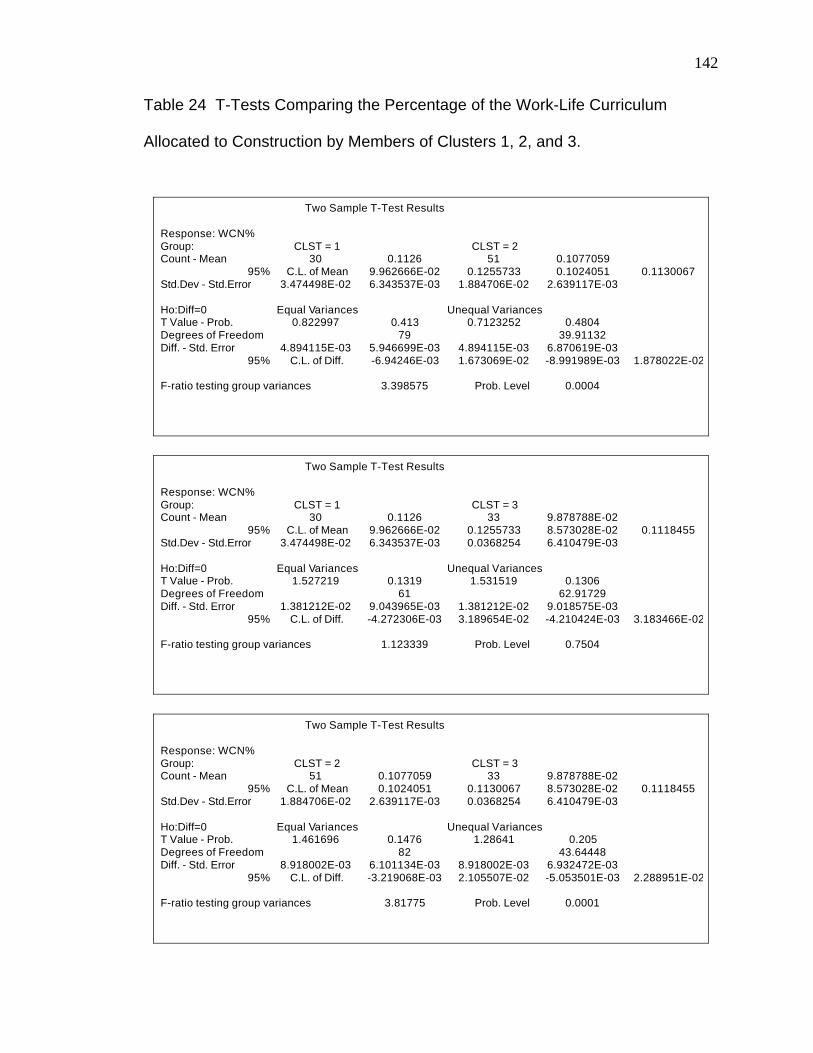
Table 24 T-Tests Comparing the Percentage of the Work-Life Curriculum
Allocated to Construction by Members of Clusters 1, 2, and 3.
Two Sample T-Test Results
Response: WCN%Group: CLST = 1 CLST = 2Count - Mean 30 0.1126 51 0.1077059
95% C.L. of Mean 9.962666E-02 0.1255733 0.1024051 0.1130067Std.Dev - Std.Error 3.474498E-02 6.343537E-03 1.884706E-02 2.639117E-03
Ho:Diff=0 Equal Variances Unequal VariancesT Value - Prob. 0.822997 0.413 0.7123252 0.4804Degrees of Freedom 79 39.91132Diff. - Std. Error 4.894115E-03 5.946699E-03 4.894115E-03 6.870619E-03
95% C.L. of Diff. -6.94246E-03 1.673069E-02 -8.991989E-03 1.878022E-02
F-ratio testing group variances 3.398575 Prob. Level 0.0004
Two Sample T-Test Results
Response: WCN%Group: CLST = 1 CLST = 3Count - Mean 30 0.1126 33 9.878788E-02
95% C.L. of Mean 9.962666E-02 0.1255733 8.573028E-02 0.1118455Std.Dev - Std.Error 3.474498E-02 6.343537E-03 0.0368254 6.410479E-03
Ho:Diff=0 Equal Variances Unequal VariancesT Value - Prob. 1.527219 0.1319 1.531519 0.1306Degrees of Freedom 61 62.91729Diff. - Std. Error 1.381212E-02 9.043965E-03 1.381212E-02 9.018575E-03
95% C.L. of Diff. -4.272306E-03 3.189654E-02 -4.210424E-03 3.183466E-02
F-ratio testing group variances 1.123339 Prob. Level 0.7504
Two Sample T-Test Results
Response: WCN%Group: CLST = 2 CLST = 3Count - Mean 51 0.1077059 33 9.878788E-02
95% C.L. of Mean 0.1024051 0.1130067 8.573028E-02 0.1118455Std.Dev - Std.Error 1.884706E-02 2.639117E-03 0.0368254 6.410479E-03
Ho:Diff=0 Equal Variances Unequal VariancesT Value - Prob. 1.461696 0.1476 1.28641 0.205Degrees of Freedom 82 43.64448Diff. - Std. Error 8.918002E-03 6.101134E-03 8.918002E-03 6.932472E-03
95% C.L. of Diff. -3.219068E-03 2.105507E-02 -5.053501E-03 2.288951E-02
F-ratio testing group variances 3.81775 Prob. Level 0.0001
142

Comparing the Ideal Allocation of Construction in the Curriculum with
Course Work that is Actually Devoted to Construction
The respondents were asked to assign values ranging from 0 to 4 to ten
curriculum organizers in the three spheres of human/technology interaction. The
assigned values were converted into percentages. By summing the percentages
allocated to construction across the three spheres, and then dividing that total by
three, a mean percentage of the curriculum allocated to construction was
calculated for each respondent. For purposes of future discussion this mean
score will be identified as the Ideal percentage.
In the surveys that were mailed to faculty who were identified as
specializing in construction, Section 7 asked them to consider the technical
subjects required of teacher education majors and estimate the percentage of
formal instructional contact hours devoted to course work in construction. For
purposes of future discussion, this estimated percentage will be identified as the
Actual percentage.
A t-test was performed to determine if the Ideal percentage of
construction course work suggested for the K-12 technology education
curriculum was different from the Actual percentage of construction course work
required of technology teacher education majors. Table 25 shows the results of
this comparison. With a probability of .5677 we must conclude that no significant
difference at a .05 level exists. However, an investigation into the range of
responses that comprised the Actual percentage was worth pursuing.
143

Table 25 T-Test Comparing Ideal and Actual Percentages of the Curriculum
Allocated to Construction
Two Sample T-TestResults
IDEAL ACTUALCount - Mean 114 0.1018161 91 0.1055494
95% C.L. of Mean 9.705314E-02 0.1065791 9.230457E-02 0.1187943Std.Dev - Std.Error 2.566898E-02 2.40412E-03 6.359792E-02 6.666873E-03
Ho:Diff=0 Equal Variances Unequal VariancesT Value - Prob. -0.5714326 0.5677 -0.5267761 0.5994Degrees of Freedom 203 113.9145Diff. - Std. Error -3.733315E-03 6.533255E-03 -3.733315E-03 0.0070871
95% C.L. of Diff. -1.653826E-02 9.07163E-03 -1.777271E-02 1.030608E-02
F-ratio testing group variances 6.138592 Prob. Level 0
Interestingly, of the programs who responded to either the written survey
or to telephone interviews, 13% did not have any requirement for construction.
At the opposite end of the range, course work in construction comprised 20% to
25% of the required technical curriculum at 7% of the institutions. Certainly
programs such as these represent a departure from the mean.
Selected Aspects of Instruction as Applied to Construction within the
Realm of Higher Education
The following sections are based on data collected from college and
university professors of construction. The respondents were asked to describe
certain aspects of the construction classes that students in their technology
teacher education programs experience. Therefore, the remainder of this
chapter should be considered in relationship to higher education, whereas,
144
previous sections of this chapter primarily focused on K-12 technology education
goals and curriculum.
The information presented in the remaining section of this chapter was
gathered in order to address the questions posed in problem statement 6 of this
dissertation. In response to this problem, it was necessary to determine certain
aspects related to the status of construction in technology teacher education
programs in the United States.
How Construction is Offered
Section 8 of the survey asked the respondents to indicate how
construction is offered in their programs with respect to courses for technology
teacher education majors. In addition they were asked to identify if such courses
were required, elective, or both.
Thirty eight people responded to part one of this section. Twenty two
indicated that construction is offered as an individual course, 2 indicated that it is
offered as part of another course, and 14 indicated that it is offered both as an
individual course and as part of another course.
Thirty six people responded to part two of this section. Twenty nine
indicated that course work in construction is required, three indicated that it is
offered as an elective, and four indicated that it is offered both ways.
145

Instructional Methods Used in Construction Courses
Data were collected in Section 9 of the construction survey which asked
the respondents to identify the percentage of construction-related instruction
according to a list of possible methods. Figure 6 presents the mean responses
of the 37 construction specialists who completed this section of the survey.
Among the instructional methods that were used, lecture was employed most
frequently or 39.9% of the time. It was followed in declining order by model
construction (21.1%), full-scale construction (13.8%), site experience (11.6%),
computer simulation (11.0%), and finally by other methods (2.8%).
(39.9%) Lecture
(21.1%) Model Construction
(13.8%) Full-scale Construction
(11.6%) Site Experience
(11.0%) Computer Simulation(2.8%) Other
N = 37
Figure 6 Breakdown of Teaching Methods Employed in Construction Courses
146

Percentage of Construction Course Work Allocated to the Study of
Residential, Commercial, and Infrastructure Construction
Figure 7 presents the mean allocation of construction course work to
three major categories of construction: residential, commercial, and
infrastructure. The results of this inquiry show that 61.1% of construction course
content is concentrated on residential construction, 29% of the course work
addresses commercial construction, and 9.8% of the courses content is related
to infrastructure.
Figure 7 Allocation of Construction Course Content Among Residential,
Commercial, and Infrastructure
147
(61.1%) Residential
(29.0%) Commercial
(9.8%) Infrastructure
N = 37

The Tendency to Teach Construction from a Content Orientation or a
Process Orientation
Thirty seven professors of construction indicated their tendency or
preference to teach the subject construction on a 10 point continuum ranging
from content orientation to process orientation. The responses ranged from
three to eight. A response of 3 indicated a tendency towards a content
orientation while a response of 8 indicated a tendency towards a process
orientation. The mean score for the group was 5.49, which suggests an
approach that generally balances content and process oriented instruction in
construction courses .
148