chapter 4 analysis and findings -...
TRANSCRIPT
Analysis and Findings
Ph.D. Thesis 55
CHAPTER 4
ANALYSIS AND FINDINGS
4.1 INTRODUCTION
The present chapter intends to accomplish the objectives of the study by holistically investigating
the various dimensions of project specific risks and organizational climate in the software
projects. The chapter is divided into four sections. The first section aims to identify the top ten
risks affecting the software projects globally through an indepth and exhaustive study of the
secondary data. It then identifies and explores the project specific risks affecting the Indian
software projects through an extensive survey and interview of the software professionals. A
systematic approach was adopted, wherein firstly, the dimensions of project specific risks were
identified by factor analysis and then these dimensions were compared among the various
personal and project characteristics. This section also describes the demographic characteristics
of the respondents and gives vivid account of the details of the project handled by the
respondents. The second section delineates the dimensions of organization climate present in the
organization through factor analysis and compares these dimensions across various personal and
project characteristics. The third sections details out the correlation between the i) the
organizational climate dimensions, demographic characteristics and project specific risk
dimensions ii) the organizational climate dimensions, project specific risk dimensions and the
project success, and finally iii) the organizational climate dimensions, project specific risk
dimensions and the three performance constructs namely budget, schedule and quality
performance of the software projects. Lastly, regression analysis is done to test the various
hypotheses of the study.
4.2 SECTION I
4.2.1 Identification and Ranking of Software Risks: A Global Perspective
The first objective of the study is to identify and rank the risk factors affecting the success of the
software projects globally. There has been plethora of research in identification of the risks
affecting the software industry but the studies focus primarily on the local software industry
Analysis and Findings
Ph.D. Thesis 56
where the research is conducted. An attempt has been made in the present research to consolidate
these studies by identifying and ranking the risks affecting the software projects globally. A list
of top ten risks has been prepared using the risks identified through literature review. The
researches conducted by Boehm [19], Keil et al. [15], Oz and Sosik [107], Schmidt et al [119],
Addison and Vallabh [121], Demarco and Lister [122], Baccarini et al. [37], Smith et al. [124],
Bannerman [36], Iacovou and Nakatsu [125], Costa et al. [24] and Anudhe and Mathew [22] have
been used for the identification and ranking of risks. These studies have been selected on the
basis of the in-depth analysis of the risks and the elaborateness of the risks in the respective
research papers. The methodology followed for identifying and ranking the risks is as follows:
Each risk was individually evaluated and categorized based on the secondary data. For example:
under stakeholder management; lack of top management support, corporate culture not
supportive, inadequate user involvement, lack of client responsibility and commitment and
friction between client and contractor were the main sub risks identified using the inputs from
various research papers and discussion with the project managers from various software
companies located in Noida. Each sub factor/risk was taken and a weighted average score was
calculated depending upon the rank given to that particular sub-category risk by the respective
researcher. For example; under requirement and schedule the first sub-category risk is
‗miscommunication of requirements‘; in this it was found that out of twelve researchers two
identified this risk as the second most important risk, other two found miscommunication of
requirements to be the third most important risk, while seven researchers gave seventh rank to
this risk. The other risks were identified in a similar manner.
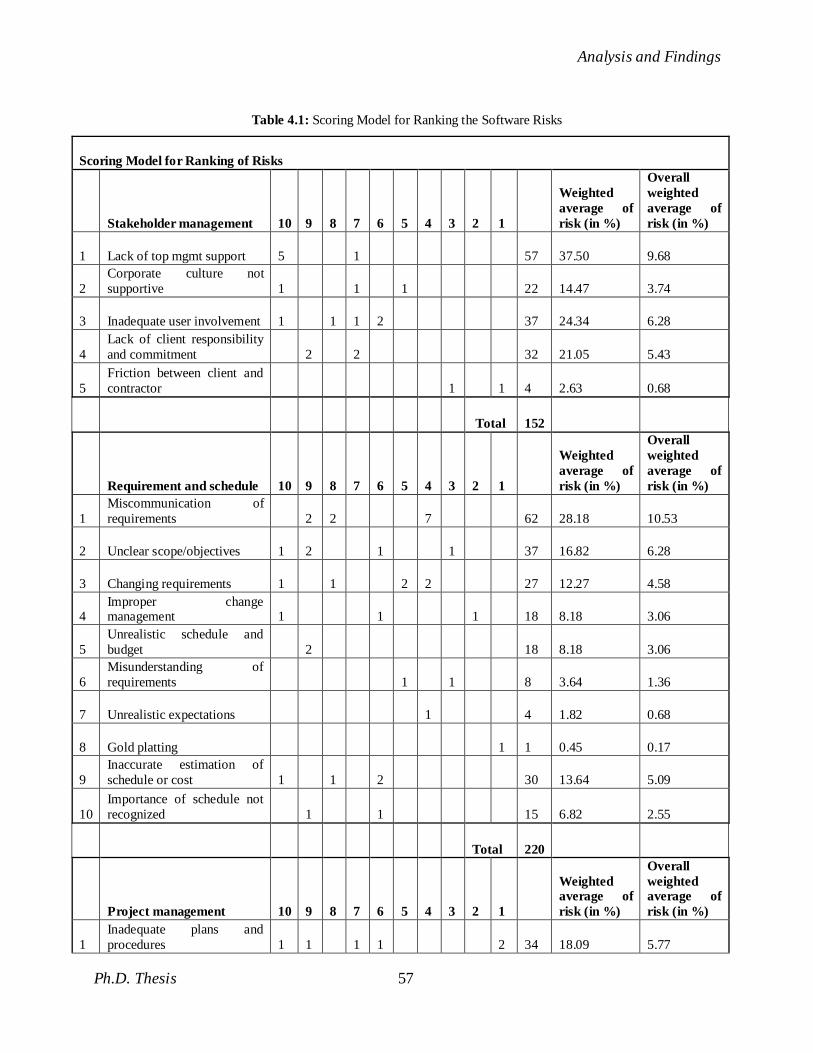
Once the frequencies of risks were placed in the cell according to the ranks given by the
researchers, the next step involved assigning weights and calculating the average. Weights were
assigned according to the ranks; the first rank was given a weight of 10 while second rank was
given the weight of 9 and so on. Once all the weights had been assigned, the weights were
multiplied with the respective number of researchers according to the ranks given by them. For
example: miscommunication of requirements has got the weight of 62 which was calculated as
9*2 + 8*2 + 4*7 = 62, where 9, 8 and 4 are the weights belonging to second, third and seventh
rank and 2, 2 and 7 are the frequency. The scoring model for ranking the risks is shown in Table
4.1.
Analysis and Findings
Ph.D. Thesis 57
Table 4.1: Scoring Model for Ranking the Software Risks
Scoring Model for Ranking of Risks
Stakeholder management 10 9 8 7 6 5 4 3 2 1
Weighted
average of
risk (in %)
Overall
weighted
average of
risk (in %)
1 Lack of top mgmt support 5 1 57 37.50 9.68
2
Corporate culture not
supportive 1 1 1 22 14.47 3.74
3 Inadequate user involvement 1 1 1 2 37 24.34 6.28
4
Lack of client responsibility
and commitment 2 2 32 21.05 5.43
5
Friction between client and
contractor 1 1 4 2.63 0.68
Total 152
Requirement and schedule 10 9 8 7 6 5 4 3 2 1
Weighted
average of
risk (in %)
Overall
weighted
average of
risk (in %)
1
Miscommunication of
requirements 2 2 7 62 28.18 10.53
2 Unclear scope/objectives 1 2 1 1 37 16.82 6.28
3 Changing requirements 1 1 2 2 27 12.27 4.58
4 Improper change management 1 1 1 18 8.18 3.06
5
Unrealistic schedule and
budget 2 18 8.18 3.06
6
Misunderstanding of
requirements 1 1 8 3.64 1.36
7 Unrealistic expectations 1 4 1.82 0.68
8 Gold platting 1 1 0.45 0.17
9
Inaccurate estimation of
schedule or cost 1 1 2 30 13.64 5.09
10
Importance of schedule not
recognized 1 1 15 6.82 2.55
Total 220
Project management 10 9 8 7 6 5 4 3 2 1
Weighted average of
risk (in %)
Overall
weighted average of
risk (in %)
1
Inadequate plans and
procedures 1 1 1 1 2 34 18.09 5.77
Analysis and Findings
Ph.D. Thesis 58
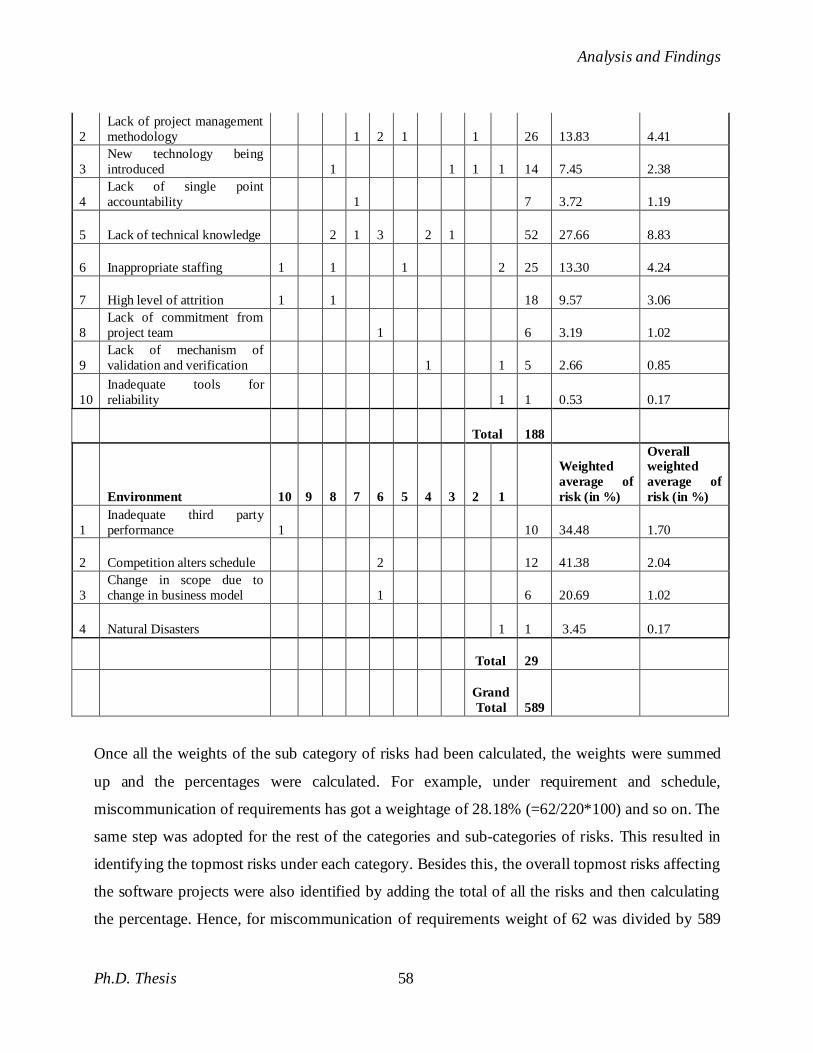
2
Lack of project management
methodology 1 2 1 1 26 13.83 4.41
3
New technology being
introduced 1 1 1 1 14 7.45 2.38
4
Lack of single point
accountability 1 7 3.72 1.19
5 Lack of technical knowledge 2 1 3 2 1 52 27.66 8.83
6 Inappropriate staffing 1 1 1 2 25 13.30 4.24
7 High level of attrition 1 1 18 9.57 3.06
8
Lack of commitment from
project team 1 6 3.19 1.02
9
Lack of mechanism of
validation and verification 1 1 5 2.66 0.85
10
Inadequate tools for
reliability 1 1 0.53 0.17
Total 188
Environment 10 9 8 7 6 5 4 3 2 1
Weighted
average of
risk (in %)
Overall weighted
average of
risk (in %)
1
Inadequate third party
performance 1 10 34.48 1.70
2 Competition alters schedule 2 12 41.38 2.04
3
Change in scope due to
change in business model 1 6 20.69 1.02
4 Natural Disasters 1 1 3.45 0.17
Total 29
Grand
Total 589
Once all the weights of the sub category of risks had been calculated, the weights were summed
up and the percentages were calculated. For example, under requirement and schedule,
miscommunication of requirements has got a weightage of 28.18% (=62/220*100) and so on. The
same step was adopted for the rest of the categories and sub-categories of risks. This resulted in
identifying the topmost risks under each category. Besides this, the overall topmost risks affecting
the software projects were also identified by adding the total of all the risks and then calculating
the percentage. Hence, for miscommunication of requirements weight of 62 was divided by 589
Analysis and Findings
Ph.D. Thesis 59
(which is the total of all the weights i.e. 152+220+188+29) and thus, the weightage of the same in
the overall risk is 10.53%. The same was done for the rest of the sub categories of risks as well.
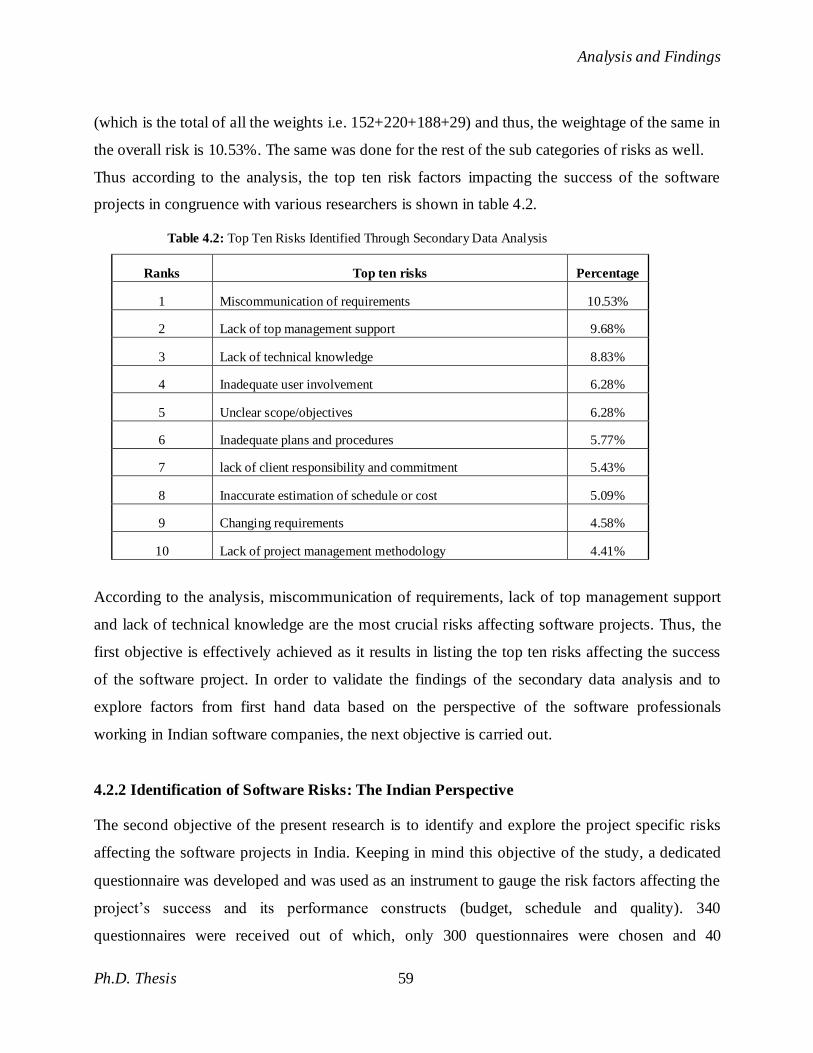
Thus according to the analysis, the top ten risk factors impacting the success of the software
projects in congruence with various researchers is shown in table 4.2.
Table 4.2: Top Ten Risks Identified Through Secondary Data Analysis
Ranks Top ten risks Percentage
1 Miscommunication of requirements 10.53%
2 Lack of top management support 9.68%
3 Lack of technical knowledge 8.83%
4 Inadequate user involvement 6.28%
5 Unclear scope/objectives 6.28%
6 Inadequate plans and procedures 5.77%
7 lack of client responsibility and commitment 5.43%
8 Inaccurate estimation of schedule or cost 5.09%
9 Changing requirements 4.58%
10 Lack of project management methodology 4.41%
According to the analysis, miscommunication of requirements, lack of top management support
and lack of technical knowledge are the most crucial risks affecting software projects. Thus, the
first objective is effectively achieved as it results in listing the top ten risks affecting the success
of the software project. In order to validate the findings of the secondary data analysis and to
explore factors from first hand data based on the perspective of the software professionals
working in Indian software companies, the next objective is carried out.
4.2.2 Identification of Software Risks: The Indian Perspective
The second objective of the present research is to identify and explore the project specific risks
affecting the software projects in India. Keeping in mind this objective of the study, a dedicated
questionnaire was developed and was used as an instrument to gauge the risk factors affecting the
project‘s success and its performance constructs (budget, schedule and quality). 340
questionnaires were received out of which, only 300 questionnaires were chosen and 40
Analysis and Findings
Ph.D. Thesis 60
questionnaires were discarded. The questions and responses were coded and entered in the
computer in Microsoft Excel Software. Data analysis in a quantitative research is essential as the
interpretation and coding of responses can be very critical. Therefore, required analysis was done
with the aid of Statistical Package for Social Sciences (SPSS) 17.0 Version.
The analysis of the data has been done in two components: first that deals with the analysis of
risk factors and second that deals with the analysis of organizational climate factors. The
following section of the chapter deals with an in-depth analysis of the risk factors identified
through primary research. It discusses the findings of the second objective i.e. to identify and
explore the various project specific risk factors affecting the success (overall and three
performance constructs) of the software projects based on primary data collected for the same.
The analysis was done on the basis of the i) factor analysis, ii) mean and standard deviation of the
risk factors, and iii) comparison of the risk factors among various personal and project
characteristics of the respondents.
Firstly, reliability of the instrument was measured with the help of cronbach alpha and Kaiser-
Meyer-Olkin Measure of Adequacy. Secondly, factor analysis was done to extract the risk factors
impacting the success of the software projects. Thirdly, these risk factors were compared among
the demographic characteristics and project characteristics using Duncan‘s mean test. To begin
with, the personal profile of the respondents and the profile of the last executed project handled
by the respondents have been discussed in the following points.
4.2.2.1 Personal Profile of the Respondents
The first section of the instrument gathered information about the personal profile of the
respondents which included designation, age and total experience. Each of these demographic
characteristics is described below.
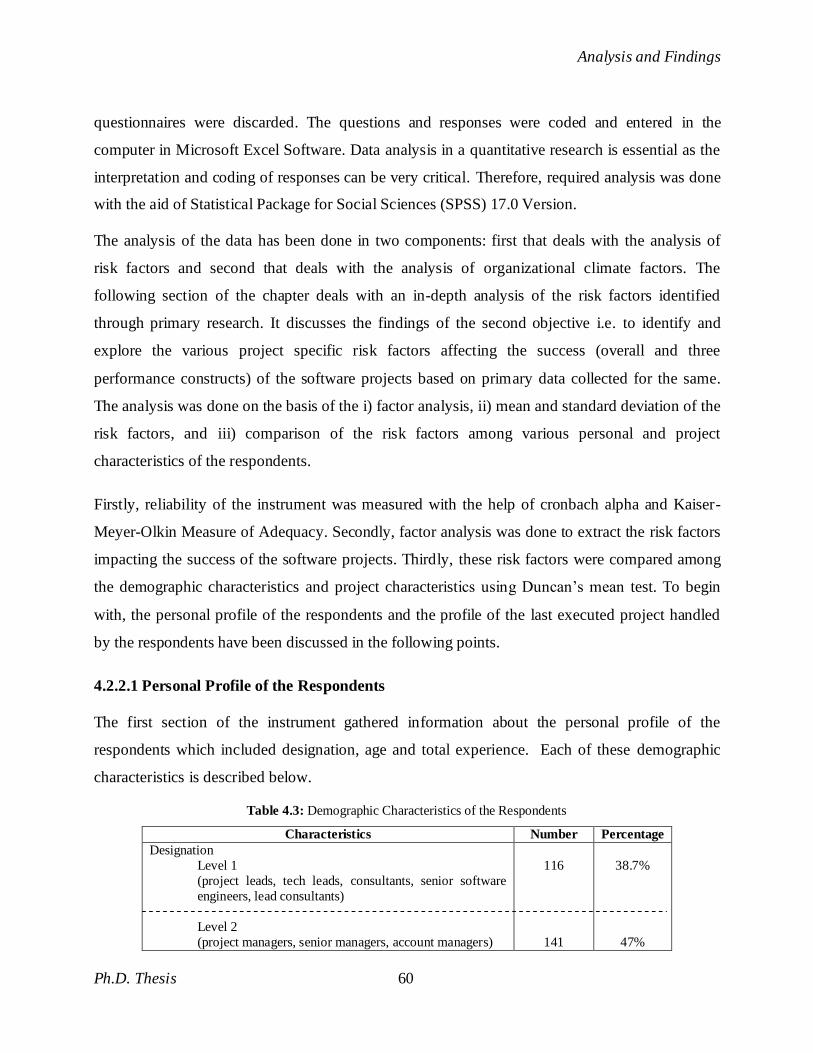
Table 4.3: Demographic Characteristics of the Respondents
Characteristics Number Percentage
Designation
Level 1
(project leads, tech leads, consultants, senior software
engineers, lead consultants)
Level 2
(project managers, senior managers, account managers)
116
141
38.7%
47%
Analysis and Findings
Ph.D. Thesis 61
Level 3
(Chief Operating Officer, Head IT, Director, Chief
Executive Officer)
43
14.3%
Total experience (in years)
4 – 9 years
10 – 14 years
More than 14 years
112
123
65
37.3%
41%
21.7%
Age group (in years)
26 – 30 years
31 – 35 years
More than 35 years
90
124
86
30%
41.3%
28.7%
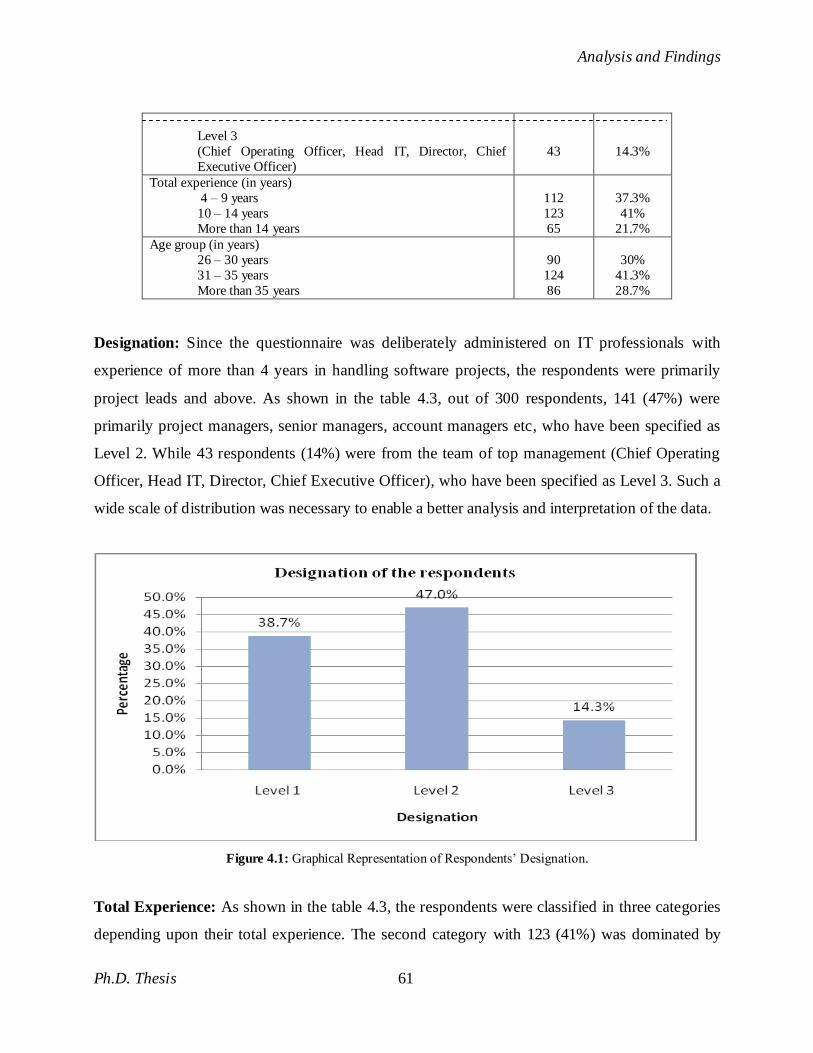
Designation: Since the questionnaire was deliberately administered on IT professionals with
experience of more than 4 years in handling software projects, the respondents were primarily
project leads and above. As shown in the table 4.3, out of 300 respondents, 141 (47%) were
primarily project managers, senior managers, account managers etc, who have been specified as
Level 2. While 43 respondents (14%) were from the team of top management (Chief Operating
Officer, Head IT, Director, Chief Executive Officer), who have been specified as Level 3. Such a
wide scale of distribution was necessary to enable a better analysis and interpretation of the data.
Figure 4.1: Graphical Representation of Respondents‘ Designation.
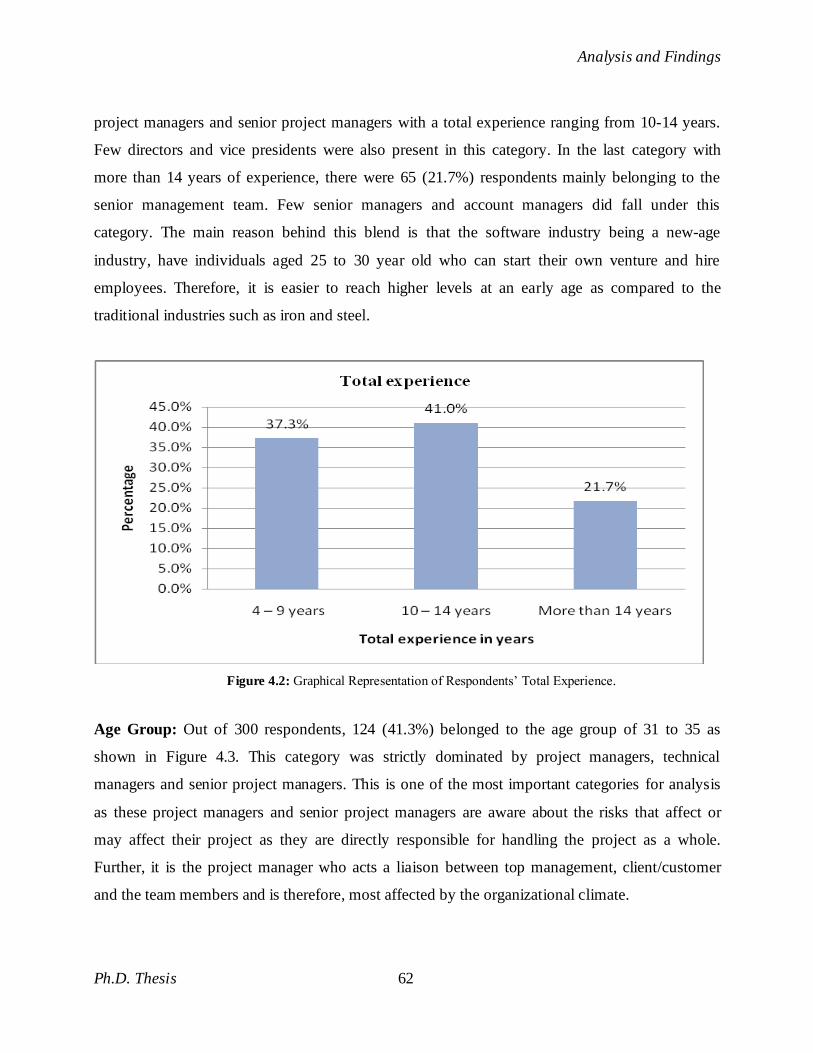
Total Experience: As shown in the table 4.3, the respondents were classified in three categories
depending upon their total experience. The second category with 123 (41%) was dominated by
Analysis and Findings
Ph.D. Thesis 62
project managers and senior project managers with a total experience ranging from 10-14 years.
Few directors and vice presidents were also present in this category. In the last category with
more than 14 years of experience, there were 65 (21.7%) respondents mainly belonging to the
senior management team. Few senior managers and account managers did fall under this
category. The main reason behind this blend is that the software industry being a new-age
industry, have individuals aged 25 to 30 year old who can start their own venture and hire
employees. Therefore, it is easier to reach higher levels at an early age as compared to the
traditional industries such as iron and steel.
Figure 4.2: Graphical Representation of Respondents‘ Total Experience.
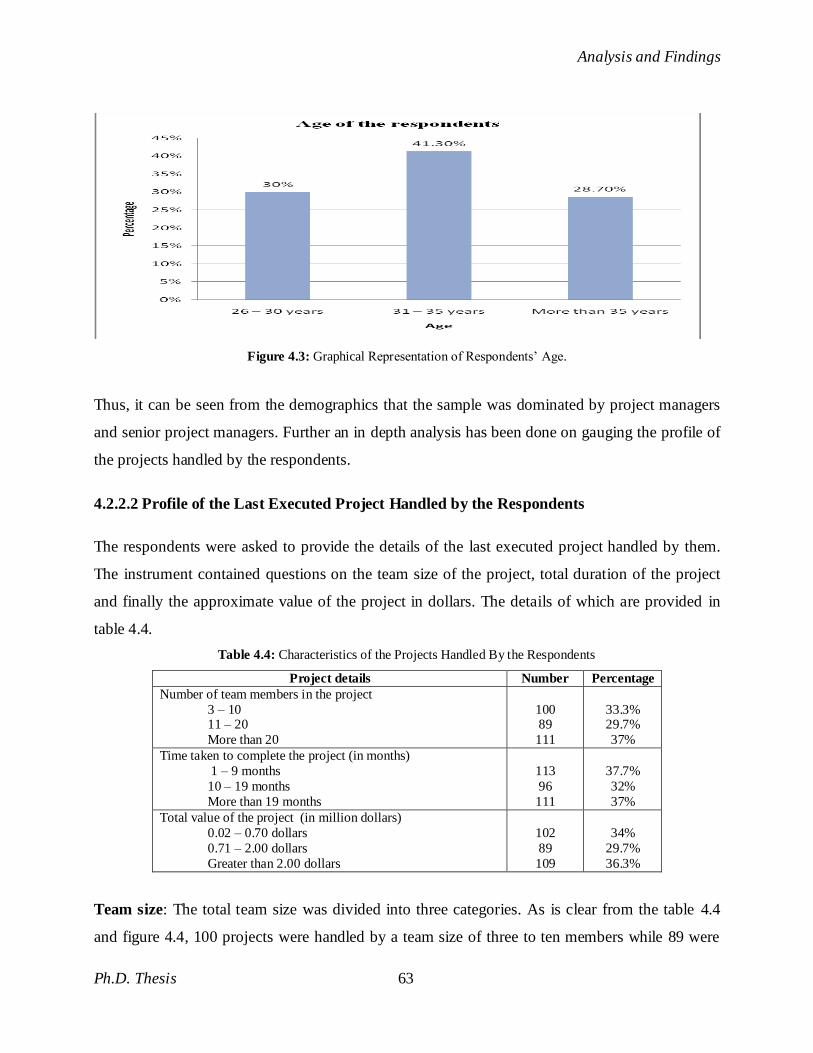
Age Group: Out of 300 respondents, 124 (41.3%) belonged to the age group of 31 to 35 as
shown in Figure 4.3. This category was strictly dominated by project managers, technical
managers and senior project managers. This is one of the most important categories for analysis
as these project managers and senior project managers are aware about the risks that affect or
may affect their project as they are directly responsible for handling the project as a whole.
Further, it is the project manager who acts a liaison between top management, client/customer
and the team members and is therefore, most affected by the organizational climate.
Analysis and Findings
Ph.D. Thesis 63
Figure 4.3: Graphical Representation of Respondents‘ Age.
Thus, it can be seen from the demographics that the sample was dominated by project managers
and senior project managers. Further an in depth analysis has been done on gauging the profile of
the projects handled by the respondents.
4.2.2.2 Profile of the Last Executed Project Handled by the Respondents
The respondents were asked to provide the details of the last executed project handled by them.
The instrument contained questions on the team size of the project, total duration of the project
and finally the approximate value of the project in dollars. The details of which are provided in
table 4.4.
Table 4.4: Characteristics of the Projects Handled By the Respondents
Project details Number Percentage
Number of team members in the project
3 – 10 11 – 20
More than 20
100 89
111
33.3% 29.7%
37%
Time taken to complete the project (in months)
1 – 9 months
10 – 19 months
More than 19 months
113
96
111
37.7%
32%
37%
Total value of the project (in million dollars)
0.02 – 0.70 dollars
0.71 – 2.00 dollars
Greater than 2.00 dollars
102
89
109
34%
29.7%
36.3%
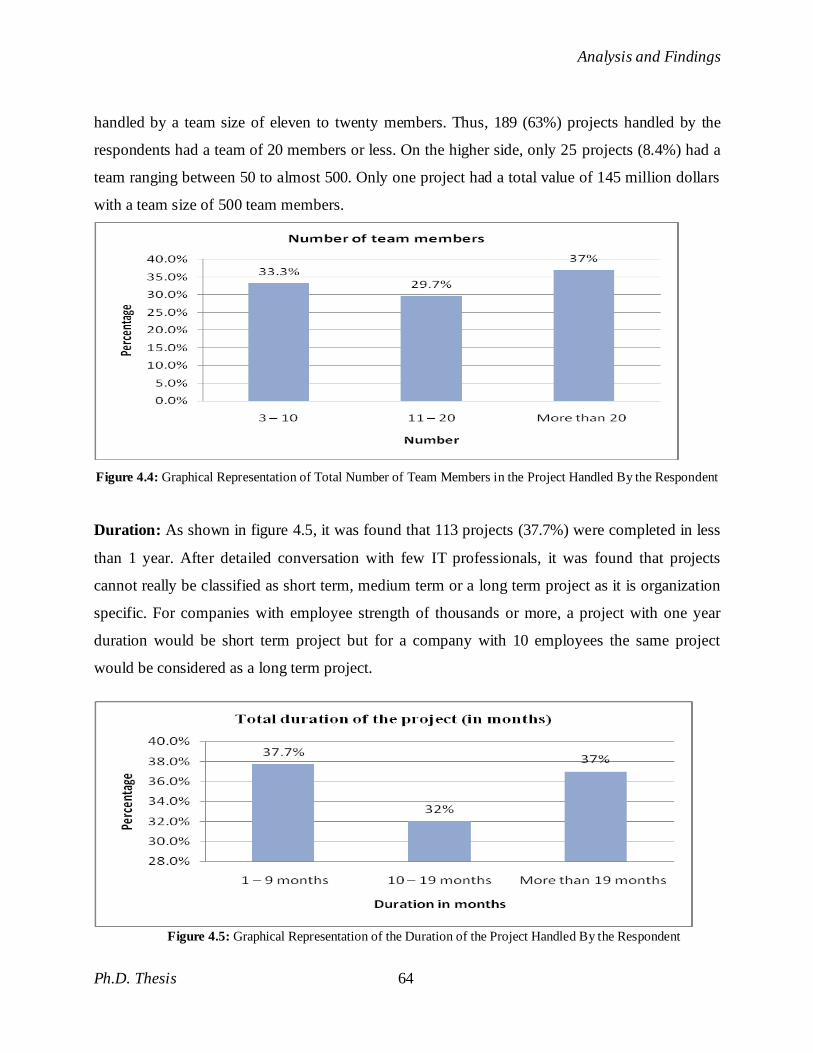
Team size: The total team size was divided into three categories. As is clear from the table 4.4
and figure 4.4, 100 projects were handled by a team size of three to ten members while 89 were
Analysis and Findings
Ph.D. Thesis 64
handled by a team size of eleven to twenty members. Thus, 189 (63%) projects handled by the
respondents had a team of 20 members or less. On the higher side, only 25 projects (8.4%) had a
team ranging between 50 to almost 500. Only one project had a total value of 145 million dollars
with a team size of 500 team members.
Figure 4.4: Graphical Representation of Total Number of Team Members in the Project Handled By the Respondent
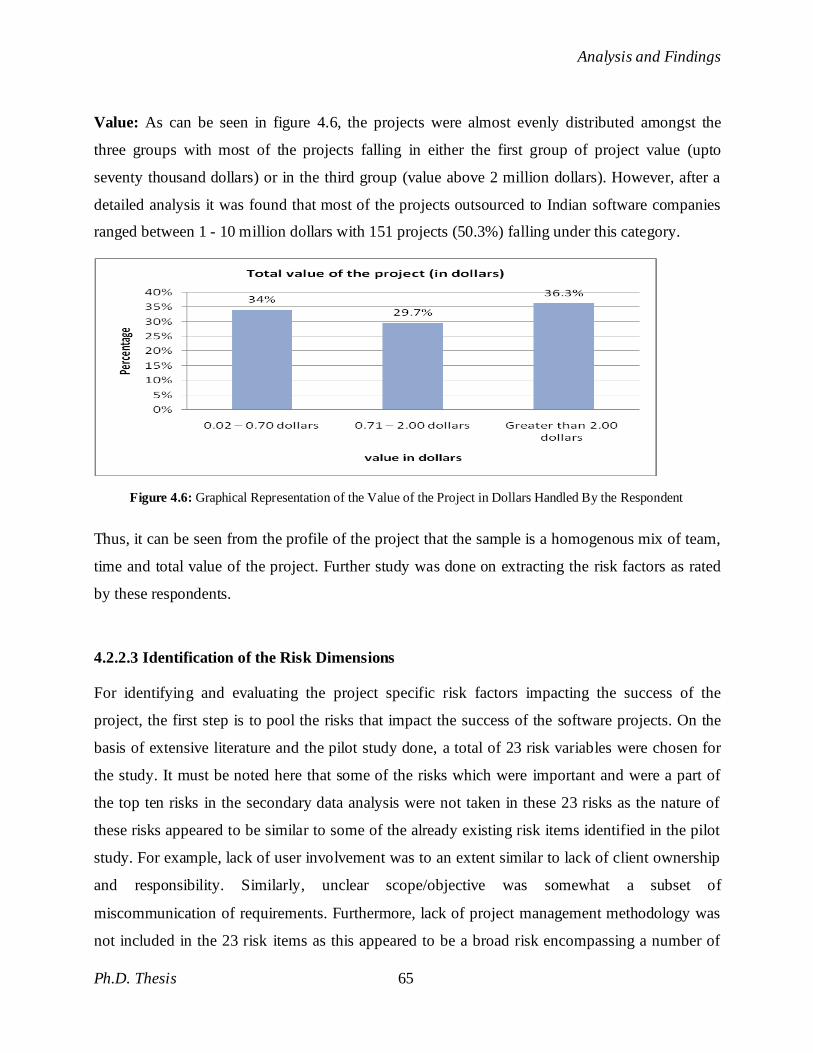
Duration: As shown in figure 4.5, it was found that 113 projects (37.7%) were completed in less
than 1 year. After detailed conversation with few IT professionals, it was found that projects
cannot really be classified as short term, medium term or a long term project as it is organization
specific. For companies with employee strength of thousands or more, a project with one year
duration would be short term project but for a company with 10 employees the same project
would be considered as a long term project.
Figure 4.5: Graphical Representation of the Duration of the Project Handled By the Respondent
Analysis and Findings
Ph.D. Thesis 65
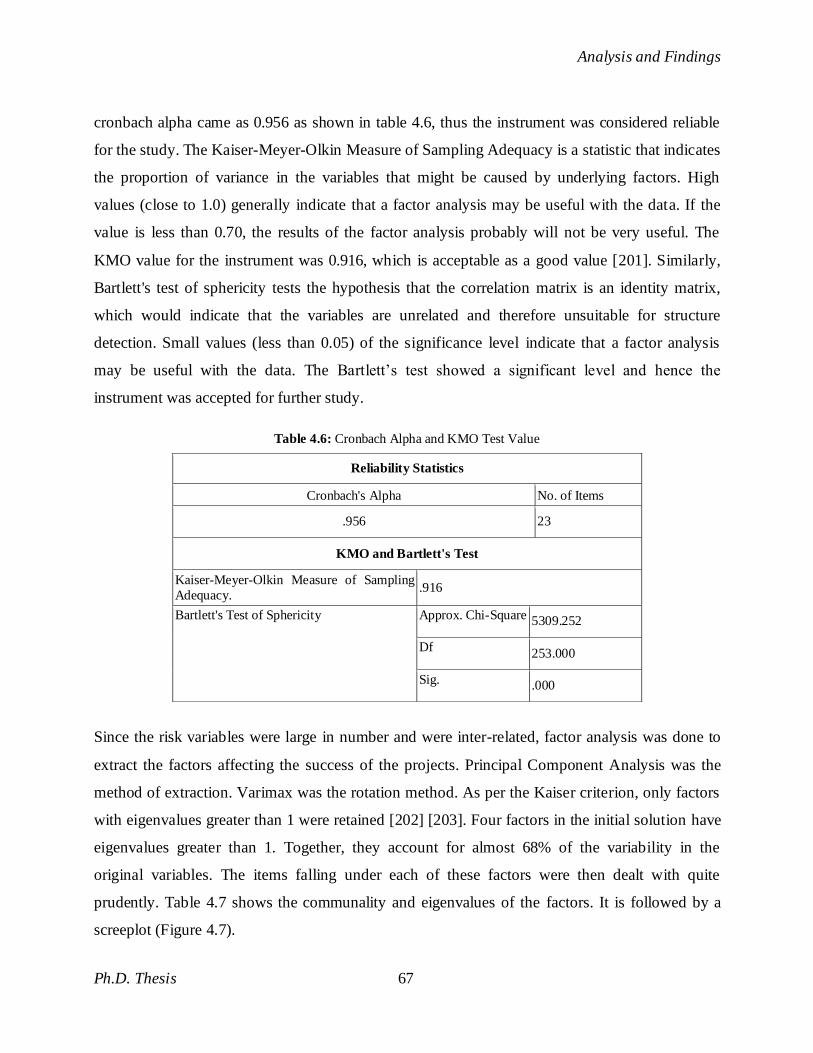
Value: As can be seen in figure 4.6, the projects were almost evenly distributed amongst the
three groups with most of the projects falling in either the first group of project value (upto
seventy thousand dollars) or in the third group (value above 2 million dollars). However, after a
detailed analysis it was found that most of the projects outsourced to Indian software companies
ranged between 1 - 10 million dollars with 151 projects (50.3%) falling under this category.
Thus, it can be seen from the profile of the project that the sample is a homogenous mix of team,
time and total value of the project. Further study was done on extracting the risk factors as rated
by these respondents.
4.2.2.3 Identification of the Risk Dimensions
For identifying and evaluating the project specific risk factors impacting the success of the
project, the first step is to pool the risks that impact the success of the software projects. On the
basis of extensive literature and the pilot study done, a total of 23 risk variables were chosen for
the study. It must be noted here that some of the risks which were important and were a part of
the top ten risks in the secondary data analysis were not taken in these 23 risks as the nature of
these risks appeared to be similar to some of the already existing risk items identified in the pilot
study. For example, lack of user involvement was to an extent similar to lack of client ownership
and responsibility. Similarly, unclear scope/objective was somewhat a subset of
miscommunication of requirements. Furthermore, lack of project management methodology was
not included in the 23 risk items as this appeared to be a broad risk encompassing a number of
Figure 4.6: Graphical Representation of the Value of the Project in Dollars Handled By the Respondent

Analysis and Findings
Ph.D. Thesis 66
risks. This risk was further sub-divided into various risk items that affect the Software
Development Life Cycle of the software projects. Thus, the 23 risk items used for data collection
and analysis were the result of exhaustive literature review and pilot study and were converted
into a questionnaire. The respondents were asked to rate these risks on a 5 point likert scale
ranging from 1 to 5, 1 being no effect on the success of the project and 5 being too much effect
on the success of the software project. Table 4.5 enlists all the 23 variables that were translated
into items in the questionnaire and were used for factor analysis.
Table 4.5: Risk Variables Chosen For Study
Items
1 Working with inexperienced team
2 Delay in recruitment and resourcing
3 Less or no experience in similar projects
4 Insufficient Testing
5 Team Diversity
6 Lack of availability of domain expert
7 Lack of commitment from the project team
8 High level of attrition
9 Estimation errors
10 Inaccurate requirement analysis
11 Lack of top management support
12 Low morale of the team
13 Miscommunication of requirements
14 Conflicting and continuous requirement changes
15 Language and regional differences with client
16 Lack of client ownership and responsibility
17 Inadequate measurement tools for reliability
18 Third party dependencies
19 Inability to meet specifications
20 Inaccurate cost measurement
21 Poor code and maintenance procedures
22 Poor documentation
23 Poor configuration control
To test the validity of the instrument, cronbach alpha and KMO tests were conducted. Cronbach
alpha was calculated to measure the internal consistency and reliability of the instrument. The
Analysis and Findings
Ph.D. Thesis 67
cronbach alpha came as 0.956 as shown in table 4.6, thus the instrument was considered reliable
for the study. The Kaiser-Meyer-Olkin Measure of Sampling Adequacy is a statistic that indicates
the proportion of variance in the variables that might be caused by underlying factors. High
values (close to 1.0) generally indicate that a factor analysis may be useful with the data. If the
value is less than 0.70, the results of the factor analysis probably will not be very useful. The
KMO value for the instrument was 0.916, which is acceptable as a good value [201]. Similarly,
Bartlett's test of sphericity tests the hypothesis that the correlation matrix is an identity matrix,
which would indicate that the variables are unrelated and therefore unsuitable for structure
detection. Small values (less than 0.05) of the significance level indicate that a factor analysis
may be useful with the data. The Bartlett‘s test showed a significant level and hence the
instrument was accepted for further study.
Table 4.6: Cronbach Alpha and KMO Test Value
Since the risk variables were large in number and were inter-related, factor analysis was done to
extract the factors affecting the success of the projects. Principal Component Analysis was the
method of extraction. Varimax was the rotation method. As per the Kaiser criterion, only factors
with eigenvalues greater than 1 were retained [202] [203]. Four factors in the initial solution have
eigenvalues greater than 1. Together, they account for almost 68% of the variability in the
original variables. The items falling under each of these factors were then dealt with quite
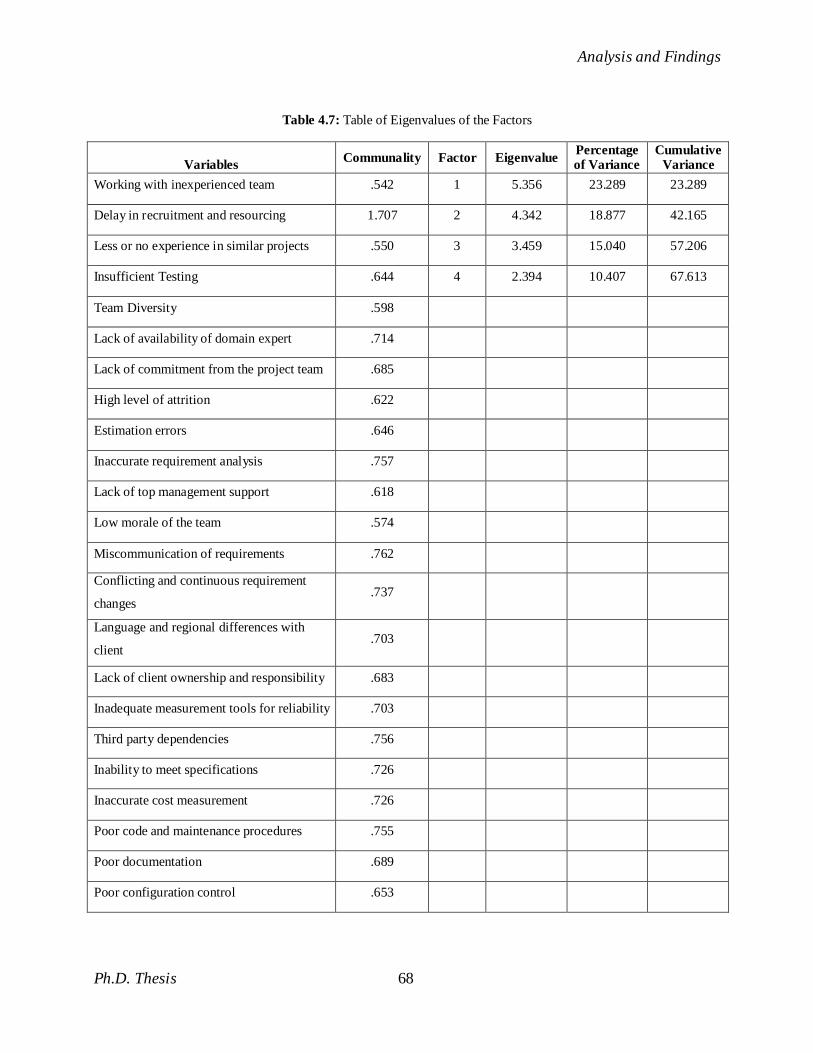
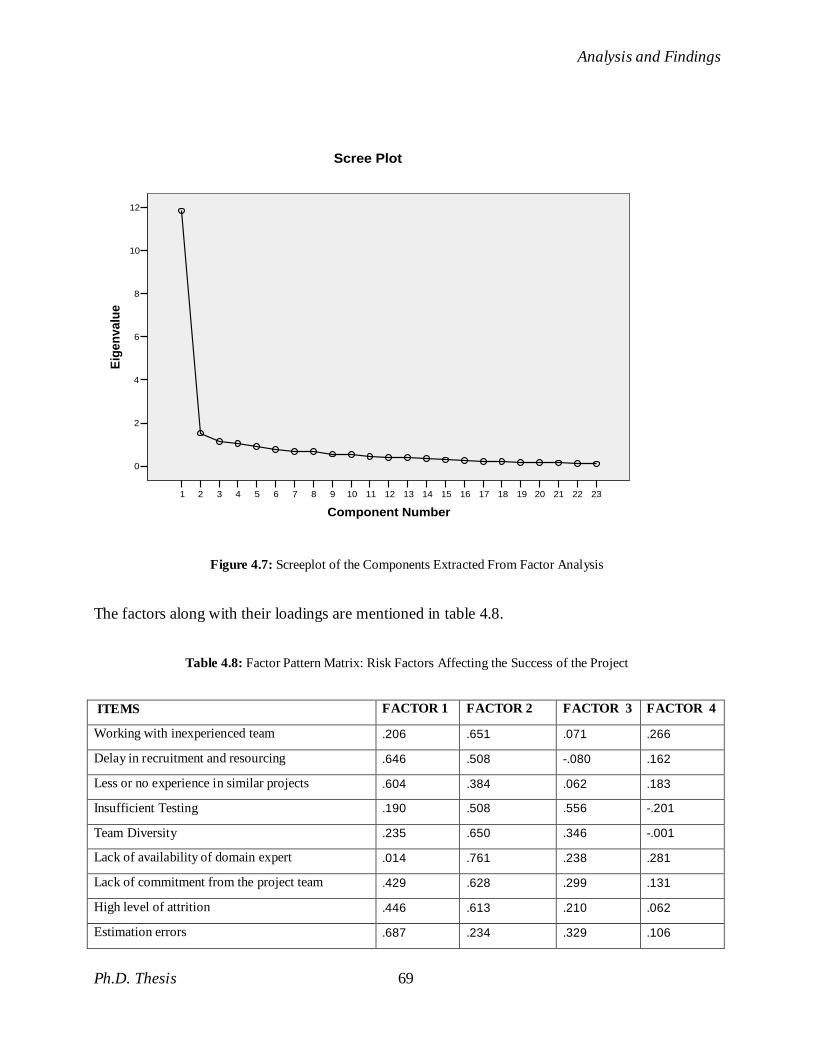
prudently. Table 4.7 shows the communality and eigenvalues of the factors. It is followed by a
screeplot (Figure 4.7).
Reliability Statistics
Cronbach's Alpha No. of Items
.956 23
KMO and Bartlett's Test
Kaiser-Meyer-Olkin Measure of Sampling
Adequacy. .916
Bartlett's Test of Sphericity Approx. Chi-Square 5309.252
Df 253.000
Sig. .000
Analysis and Findings
Ph.D. Thesis 68
Table 4.7: Table of Eigenvalues of the Factors
Variables Communality Factor Eigenvalue
Percentage of Variance
Cumulative Variance
Working with inexperienced team .542 1 5.356 23.289 23.289
Delay in recruitment and resourcing 1.707 2 4.342 18.877 42.165
Less or no experience in similar projects .550 3 3.459 15.040 57.206
Insufficient Testing .644 4 2.394 10.407 67.613
Team Diversity .598
Lack of availability of domain expert .714
Lack of commitment from the project team .685
High level of attrition .622
Estimation errors .646
Inaccurate requirement analysis .757
Lack of top management support .618
Low morale of the team .574
Miscommunication of requirements .762
Conflicting and continuous requirement
changes .737
Language and regional differences with
client .703
Lack of client ownership and responsibility .683
Inadequate measurement tools for reliability .703
Third party dependencies .756
Inability to meet specifications .726
Inaccurate cost measurement .726
Poor code and maintenance procedures .755
Poor documentation .689
Poor configuration control .653
Analysis and Findings
Ph.D. Thesis 69
2322212019181716151413121110987654321
Component Number
12
10
8
6
4
2
0
Eig
en
valu
e
Scree Plot
Figure 4.7: Screeplot of the Components Extracted From Factor Analysis
The factors along with their loadings are mentioned in table 4.8.
Table 4.8: Factor Pattern Matrix: Risk Factors Affecting the Success of the Project
ITEMS FACTOR 1 FACTOR 2 FACTOR 3 FACTOR 4
Working with inexperienced team .206 .651 .071 .266
Delay in recruitment and resourcing .646 .508 -.080 .162
Less or no experience in similar projects .604 .384 .062 .183
Insufficient Testing .190 .508 .556 -.201
Team Diversity .235 .650 .346 -.001
Lack of availability of domain expert .014 .761 .238 .281
Lack of commitment from the project team .429 .628 .299 .131
High level of attrition .446 .613 .210 .062
Estimation errors .687 .234 .329 .106
Analysis and Findings
Ph.D. Thesis 70
Inaccurate requirement analysis .786 .248 .249 .127
Lack of top management support .268 .561 .269 .399
Low morale of the team .268 .596 .221 .313
Miscommunication of requirements .765 .225 .304 .186
Conflicting and continuous requirement changes .789 .120 .218 .231
Language and regional differences with client .612 .138 .501 .242
Lack of client ownership and responsibility .533 .262 .488 .303
Inadequate measurement tools for reliability .280 .233 .486 .578
Third party dependencies .250 .196 .099 .803
Inability to meet specifications .324 .408 .312 .598
Inaccurate cost measurement .635 .153 .480 .263
Poor code and maintenance procedures .342 .290 .716 .201
Poor documentation .194 .227 .733 .251
Poor configuration control .394 .355 .529 .302
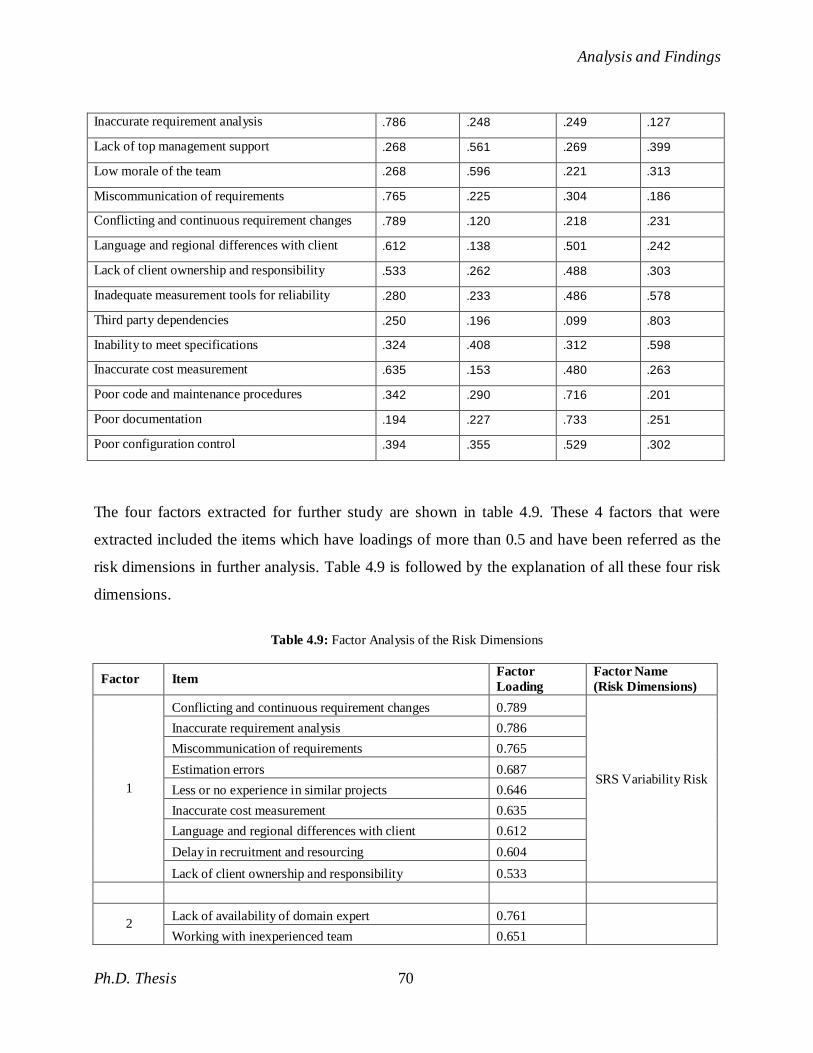
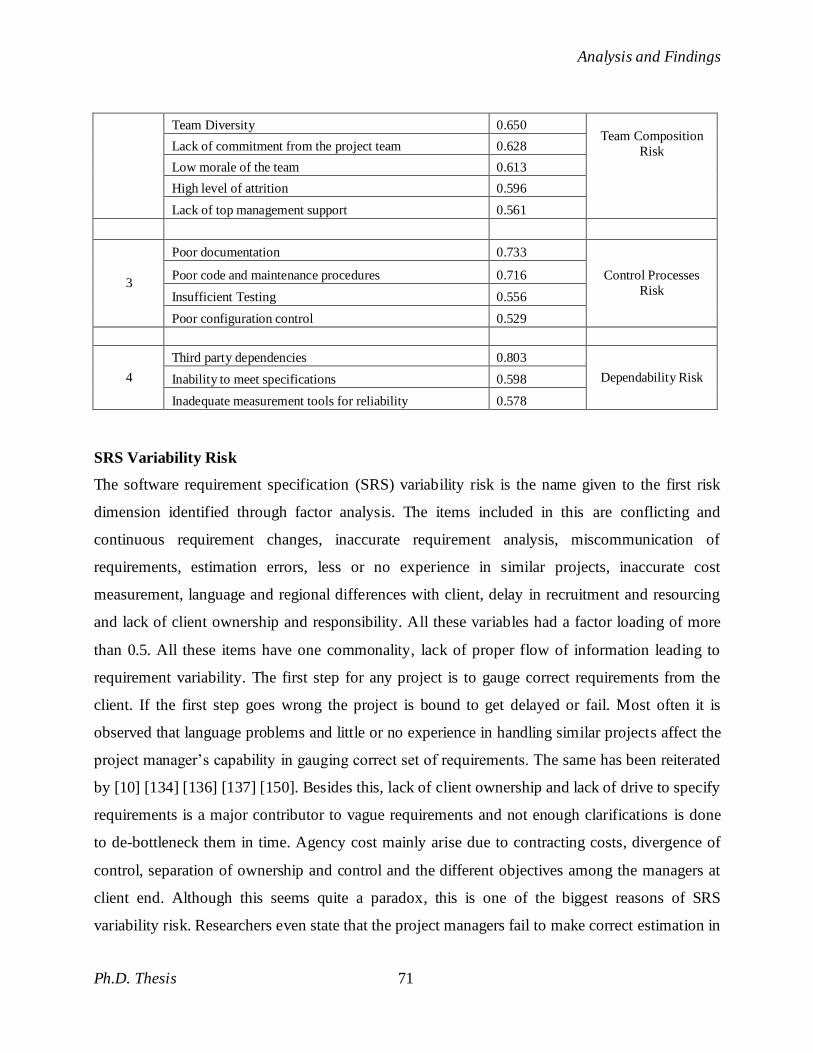
The four factors extracted for further study are shown in table 4.9. These 4 factors that were
extracted included the items which have loadings of more than 0.5 and have been referred as the
risk dimensions in further analysis. Table 4.9 is followed by the explanation of all these four risk
dimensions.
Table 4.9: Factor Analysis of the Risk Dimensions
Factor Item Factor
Loading
Factor Name
(Risk Dimensions)
1
Conflicting and continuous requirement changes 0.789
SRS Variability Risk
Inaccurate requirement analysis 0.786
Miscommunication of requirements 0.765
Estimation errors 0.687
Less or no experience in similar projects 0.646
Inaccurate cost measurement 0.635
Language and regional differences with client 0.612
Delay in recruitment and resourcing 0.604
Lack of client ownership and responsibility 0.533
2 Lack of availability of domain expert 0.761
Working with inexperienced team 0.651
Analysis and Findings
Ph.D. Thesis 71
Team Diversity 0.650
Team Composition
Risk Lack of commitment from the project team 0.628
Low morale of the team 0.613
High level of attrition 0.596
Lack of top management support 0.561
3
Poor documentation 0.733
Control Processes
Risk
Poor code and maintenance procedures 0.716
Insufficient Testing 0.556
Poor configuration control 0.529
4
Third party dependencies 0.803
Dependability Risk Inability to meet specifications 0.598
Inadequate measurement tools for reliability 0.578
SRS Variability Risk
The software requirement specification (SRS) variability risk is the name given to the first risk
dimension identified through factor analysis. The items included in this are conflicting and
continuous requirement changes, inaccurate requirement analysis, miscommunication of
requirements, estimation errors, less or no experience in similar projects, inaccurate cost
measurement, language and regional differences with client, delay in recruitment and resourcing
and lack of client ownership and responsibility. All these variables had a factor loading of more
than 0.5. All these items have one commonality, lack of proper flow of information leading to
requirement variability. The first step for any project is to gauge correct requirements from the
client. If the first step goes wrong the project is bound to get delayed or fail. Most often it is
observed that language problems and little or no experience in handling similar projects affect the
project manager‘s capability in gauging correct set of requirements. The same has been reiterated
by [10] [134] [136] [137] [150]. Besides this, lack of client ownership and lack of drive to specify
requirements is a major contributor to vague requirements and not enough clarifications is done
to de-bottleneck them in time. Agency cost mainly arise due to contracting costs, divergence of
control, separation of ownership and control and the different objectives among the managers at
client end. Although this seems quite a paradox, this is one of the biggest reasons of SRS
variability risk. Researchers even state that the project managers fail to make correct estimation in
Analysis and Findings
Ph.D. Thesis 72
the initial stages of the software development and sometimes distort or become too optimistic,
thus creating a gross estimation errors [112] [113]. Iacovou and Nakatsu [125] have very well
explained the consequences of requirement variability in their research work. According to them,
variability in requirements is one of the biggest risk factors as they can complicate the
transmission of the original set of requirements and subsequent information exchanges and
change requests. Thus, it can be seen how crucial it is to understand the requirements correctly
for the success of the project.
Team Composition Risk
This emerged as the second factor and has variables as lack of availability of domain expert,
working with inexperienced team, team diversity, lack of commitment from the project team, low
morale of the team, high level of attrition and lack of top management support falling under it.
All these variables have factor loading greater than 0.5. This factor deals with the risks related to
the team members responsible for the development and execution of the project. The major
contributors to these risks are the lack of top management support and unavailability of a
competent project manager in handling the team. Any show of disinterestedness on the part of the
top management will result in hiring of an inexperienced team or a highly diverse team. To add to
this, if the top management is not keen in investing in training or hiring the subject matter expert
it will lead to a risk of unavailability of a domain expert which will create problems for the
project [15] [127] [128] [129]. Besides lack of interest of the senior management, project
manager is also responsible in contributing to the team composition risk. Project manager acts as
a liaison between top management and the team. All the issues related to promotion, performance
appraisals are handled by the project manager. If the manager is inept in handling the team issues
it is bound to create dissatisfaction amongst team members resulting in low morale, lack of
commitment and finally turnover [28] [43] [204] [205]. According to a number of researchers
people leave managers not companies. Mostly manager drives people away [204]. Besides this,
risk variables such as lack of availability of domain expert and working with inexperienced team
can also be attributed to the project manager‘s ineptness in estimating the human resource
requirement correctly. It is the job of the manager to plan well in advance the time and the type of
resources needed for the project, failing to do so results in project delays and escalation of cost
and time.
Analysis and Findings
Ph.D. Thesis 73
Control Processes Risk
This factor includes poor documentation, poor code and maintenance procedures, insufficient
testing and poor configuration control as they are all related to the control mechanism of the
project. Pressman [90] states that configuration control is "a set of activities designed to control
change by identifying the work products that are likely to change, establishing relationships
among them, defining mechanisms for managing different versions of these work products,
controlling the changes imposed, and auditing and reporting on the changes made." To enable any
changes successfully the developer must understand how making changes will affect the system,
how the system is build and what all the different parts are doing and how they are connected.
Therefore an up-to-date documentation and configuration control is extremely important [58]
[186] [206] [207] [208] [209]. In one of the surveys done by Jansson [210], lack of
documentation and lack of up to date documentation was indicated as the primary reason for poor
maintenance of the project. Besides poor documentation, it has also been seen that the software
developer does not perform adequate testing. After a detailed discussion with the Vice President
of Quality of a reputed company in Noida (India), it was found that lack of time and coordination
during testing phase were the primary reasons especially because different members of the
maintenance team work on different problems at the same time without proper coordination. This
is especially true for the Indian software companies. Kavitak Ram Shriram, founder-director of
Google admitted in an interview that Indian IT professionals deliver low quality application
software that needs thorough testing. All these issues are related to control processes as proper
and regular audit of the on-going project would highlight the problem of poor code and poor
configuration control well in advance. It will enable the project manager to check whether a
proper documentation is being done and all the versions of the code are being saved in the central
repository of the company or not. Thus, this is a very crucial risk that affects the success of the
project.
Dependability Risk
Dependability risk is the name given to the fourth and the last factor. The items included in this
are third party dependencies, inability to meet specifications and inadequate measurement tools
for reliability. All the items had a factor loading greater than 0.5. It is extremely vital for a
Analysis and Findings
Ph.D. Thesis 74
software project to be dependable and reliable. Software dependability is defined as the ability to
avoid service failures that are more frequent and more severe than is acceptable. Dependability is
a broad term which includes availability, reliability, safety, integrity and maintainability of the
software. [211]. Dependability of the software is therefore very crucial for the success of the
project. For a successful completion of the project all components (hardware and software) must
be available at the right time and at the right place. Sometimes to make things easier, a part of the
project is outsourced by the company to the third party vendor. This creates a third party
dependency and if the sub-contractor fails to deliver the part on time it results in the inability of
the project team to meet specifications. It has often been observed, especially in the Indian
software industry that even when the project is delivered on time, yet it fails on reliability tests,
which means it fails to meet the desired quality standards. Many reasons have been attributed to
this phenomenon by the Indian software professionals. They are inability of the third party vendor
to meet the specifications, wrong choice of the sub-contracting vendor, or third party component
not reliable. This finding about dependability and reliability is supported by numerous studies and
is also in conformity with studies of [26] [116] [142] [154].
4.2.2.4 Comparison of Risk Factors across Various Personal and Project Characteristics
The dimensions of project specific risk so formulated after the factor analysis were then
compared across the various personal characteristics of the respondents and the project
characteristics handled by the respondents chosen for the study. The personal characteristics
included experience and designation while project characteristics included total team size, total
time taken to complete the project and the total value of the project. The comparisons are
discussed in the following section.
Personal characteristics
Designation
Duncan‘s Mean Test was applied to compare the dimensions of project specific risks among the
three designation groups of the respondents. All risk dimensions viz. SRS variability, team
composition, control processes and dependability showed significant differences in mean and
Analysis and Findings
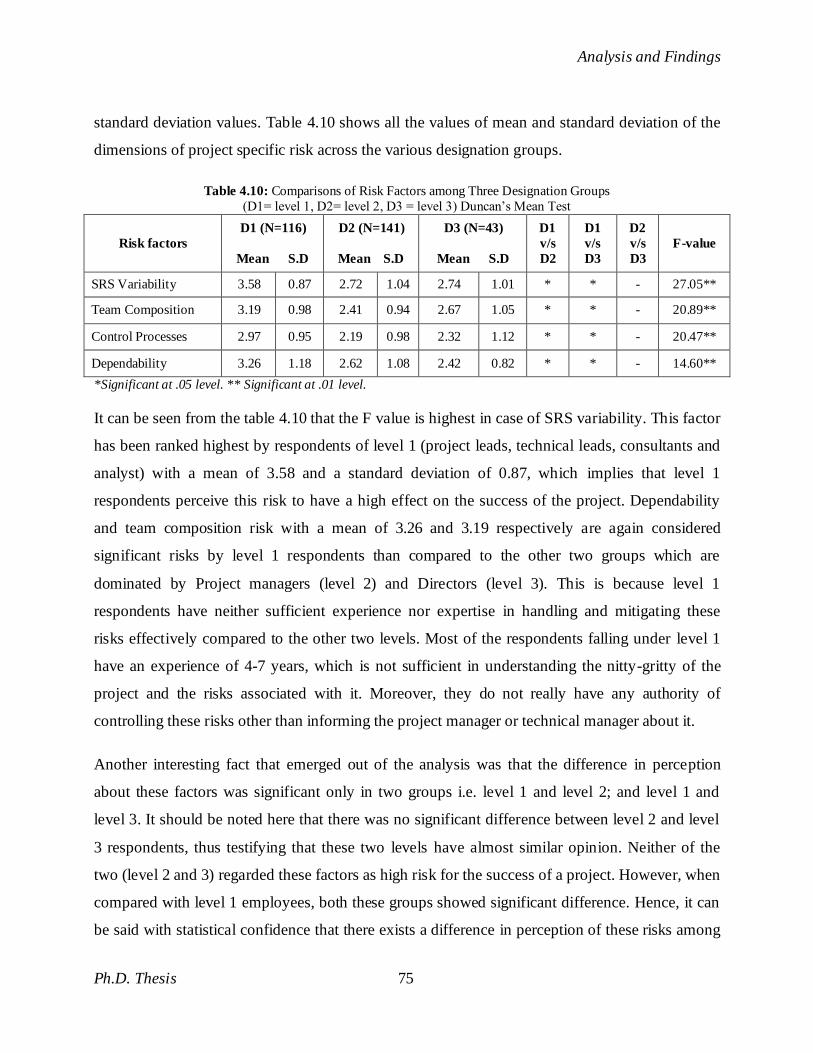
Ph.D. Thesis 75
standard deviation values. Table 4.10 shows all the values of mean and standard deviation of the
dimensions of project specific risk across the various designation groups.
Table 4.10: Comparisons of Risk Factors among Three Designation Groups
(D1= level 1, D2= level 2, D3 = level 3) Duncan‘s Mean Test
Risk factors
D1 (N=116)
Mean S.D
D2 (N=141)
Mean S.D
D3 (N=43)
Mean S.D
D1
v/s
D2
D1
v/s
D3
D2
v/s
D3
F-value
SRS Variability 3.58 0.87 2.72 1.04 2.74 1.01 * * - 27.05**
Team Composition 3.19 0.98 2.41 0.94 2.67 1.05 * * - 20.89**
Control Processes 2.97 0.95 2.19 0.98 2.32 1.12 * * - 20.47**
Dependability 3.26 1.18 2.62 1.08 2.42 0.82 * * - 14.60**
*Significant at .05 level. ** Significant at .01 level.
It can be seen from the table 4.10 that the F value is highest in case of SRS variability. This factor
has been ranked highest by respondents of level 1 (project leads, technical leads, consultants and
analyst) with a mean of 3.58 and a standard deviation of 0.87, which implies that level 1
respondents perceive this risk to have a high effect on the success of the project. Dependability
and team composition risk with a mean of 3.26 and 3.19 respectively are again considered
significant risks by level 1 respondents than compared to the other two groups which are
dominated by Project managers (level 2) and Directors (level 3). This is because level 1
respondents have neither sufficient experience nor expertise in handling and mitigating these
risks effectively compared to the other two levels. Most of the respondents falling under level 1
have an experience of 4-7 years, which is not sufficient in understanding the nitty-gritty of the
project and the risks associated with it. Moreover, they do not really have any authority of
controlling these risks other than informing the project manager or technical manager about it.
Another interesting fact that emerged out of the analysis was that the difference in perception
about these factors was significant only in two groups i.e. level 1 and level 2; and level 1 and
level 3. It should be noted here that there was no significant difference between level 2 and level
3 respondents, thus testifying that these two levels have almost similar opinion. Neither of the
two (level 2 and 3) regarded these factors as high risk for the success of a project. However, when
compared with level 1 employees, both these groups showed significant difference. Hence, it can
be said with statistical confidence that there exists a difference in perception of these risks among
Analysis and Findings
Ph.D. Thesis 76
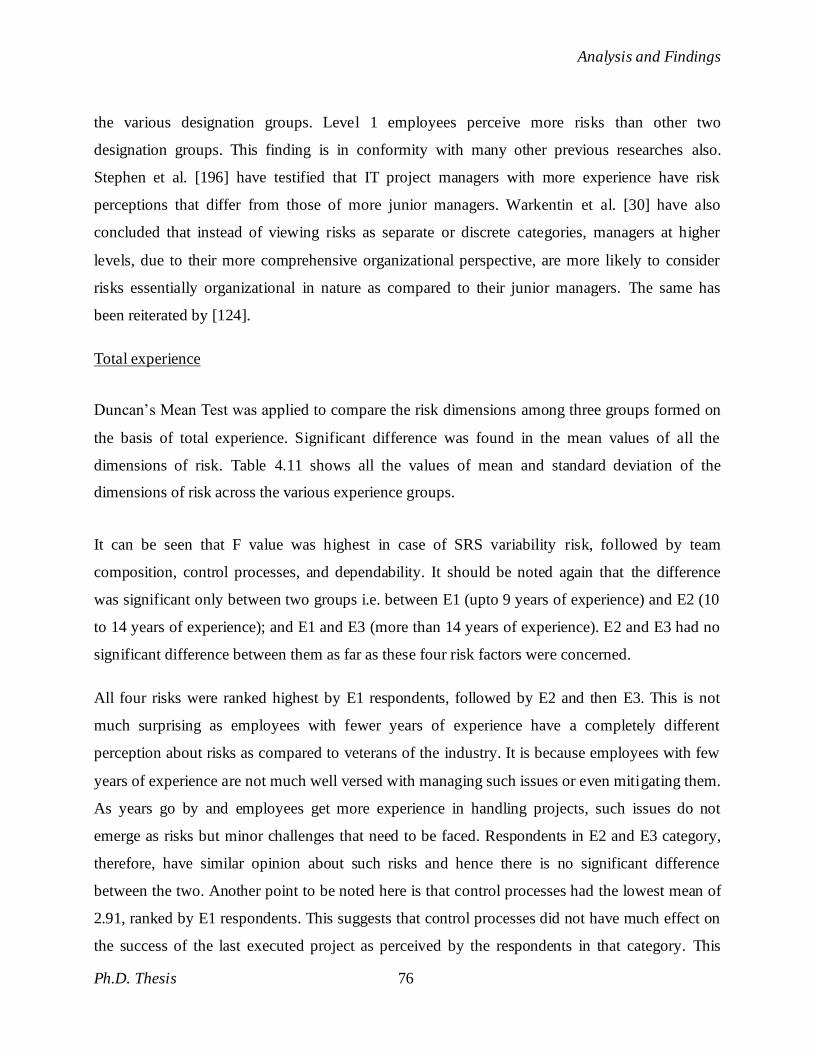
the various designation groups. Level 1 employees perceive more risks than other two
designation groups. This finding is in conformity with many other previous researches also.
Stephen et al. [196] have testified that IT project managers with more experience have risk
perceptions that differ from those of more junior managers. Warkentin et al. [30] have also
concluded that instead of viewing risks as separate or discrete categories, managers at higher
levels, due to their more comprehensive organizational perspective, are more likely to consider
risks essentially organizational in nature as compared to their junior managers. The same has
been reiterated by [124].
Total experience
Duncan‘s Mean Test was applied to compare the risk dimensions among three groups formed on
the basis of total experience. Significant difference was found in the mean values of all the
dimensions of risk. Table 4.11 shows all the values of mean and standard deviation of the
dimensions of risk across the various experience groups.
It can be seen that F value was highest in case of SRS variability risk, followed by team
composition, control processes, and dependability. It should be noted again that the difference
was significant only between two groups i.e. between E1 (upto 9 years of experience) and E2 (10
to 14 years of experience); and E1 and E3 (more than 14 years of experience). E2 and E3 had no
significant difference between them as far as these four risk factors were concerned.
All four risks were ranked highest by E1 respondents, followed by E2 and then E3. This is not
much surprising as employees with fewer years of experience have a completely different
perception about risks as compared to veterans of the industry. It is because employees with few
years of experience are not much well versed with managing such issues or even mitigating them.
As years go by and employees get more experience in handling projects, such issues do not
emerge as risks but minor challenges that need to be faced. Respondents in E2 and E3 category,
therefore, have similar opinion about such risks and hence there is no significant difference
between the two. Another point to be noted here is that control processes had the lowest mean of
2.91, ranked by E1 respondents. This suggests that control processes did not have much effect on
the success of the last executed project as perceived by the respondents in that category. This
Analysis and Findings
Ph.D. Thesis 77
finding also has congruence with few previous studies like [30] [124] wherein it was concluded
that employees with higher experiences in project leadership were more likely to view projects,
and their associated risks, more holistically and assign and resolve risk as if they were
organizational in nature.
Table 4.11: Comparisons of Risk Factors among Three Experience Groups
(E1= upto 9 years, E2= 10 - 14, E3 = more than 14) - Duncan‘s Mean Test
Risk factors
E1 (N=112)
Mean S.D
E2 (N=123)
Mean S.D
E3 (N=65)
Mean S.D
E1
v/s
E2
E1
v/s
E3
E2
v/s
E3
F-value
SRS Variability 3.51 0.93 2.82 1.07 2.74 1.01 * * - 18.17**
Team Composition 3.14 0.99 2.52 0.97 2.51 1.02 * * - 13.61**
Control Processes 2.91 1.02 2.31 0.89 2.23 1.09 * * - 13.91**
Dependability 3.19 1.17 2.74 1.09 2.44 0.98 * * - 10.42**
*Significant at .05 level. ** Significant at .01 level.
Project characteristics
After comparing the dimensions of software risks across the various personal characteristics, the
same were compared across the various project characteristics. The project characteristics
included total team size, total time taken to complete the project and the total value of the project.
The comparisons are discussed as follows:
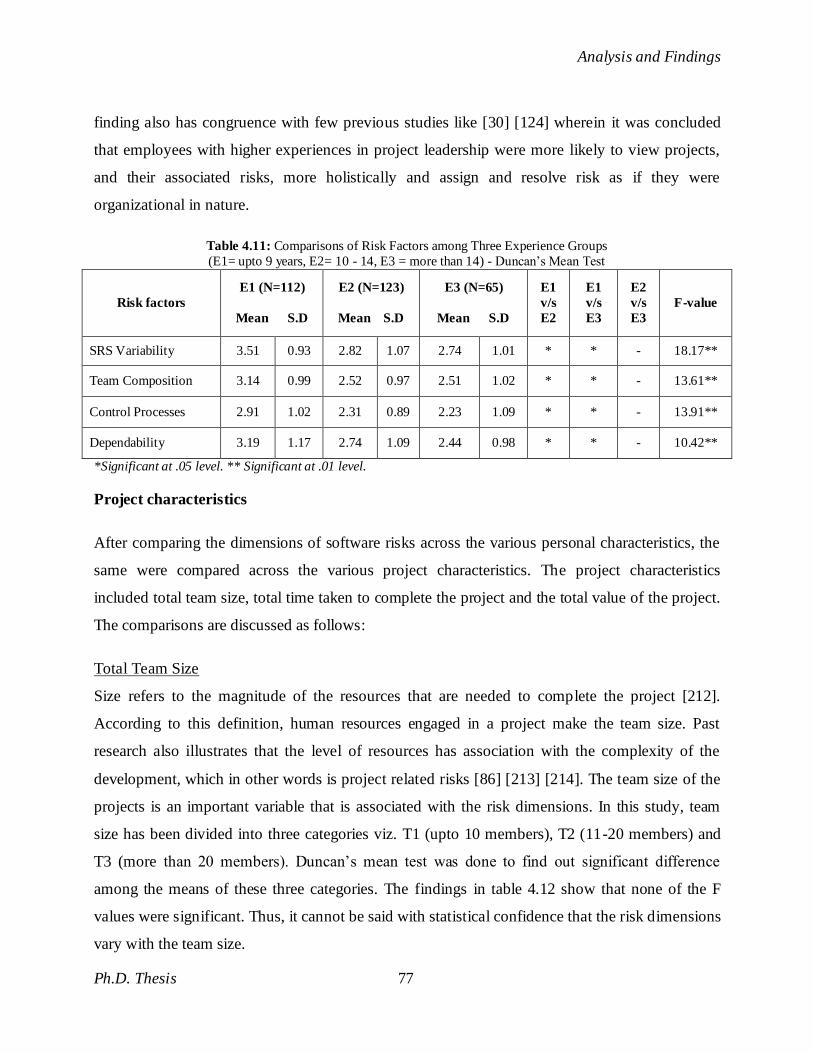
Total Team Size
Size refers to the magnitude of the resources that are needed to complete the project [212].
According to this definition, human resources engaged in a project make the team size. Past
research also illustrates that the level of resources has association with the complexity of the
development, which in other words is project related risks [86] [213] [214]. The team size of the
projects is an important variable that is associated with the risk dimensions. In this study, team
size has been divided into three categories viz. T1 (upto 10 members), T2 (11-20 members) and
T3 (more than 20 members). Duncan‘s mean test was done to find out significant difference
among the means of these three categories. The findings in table 4.12 show that none of the F
values were significant. Thus, it cannot be said with statistical confidence that the risk dimensions
vary with the team size.
Analysis and Findings
Ph.D. Thesis 78
Table 4.12: Comparisons of Risk Factors among Three Team Size Groups
(T1 = upto 10, T2 = 11-20, T3 = more than 20) Duncan‘s Mean Test
Risk factors
T1 (N=100)
Mean S.D
T2 (N=89)
Mean S.D
T3 (N=111)
Mean S.D
T1
v/s
T2
T1
v/s
T3
T2
v/s
T3
F-value
SRS Variability 2.99 1.11 3.11 1.03 3.08 1.03 - - - 0.3304
Team Composition 2.71 1.13 2.74 1.01 2.79 0.96 - - - 0.1772
Control Processes 2.64 1.13 2.43 0.84 2.47 1.13 - - - 1.1641
Dependability 2.77 1.22 2.89 1.06 2.85 1.10 - - - 0.2921
Total Duration
The total time taken for the completion of a project is an important attribute which is associated
with risks as it is an extensive resource for any project [30]. Total duration of a project was
categorized under three heads viz. TT1 (upto 9 months); TT2 (10-19 months); and TT3 (more
than 19 months). The risk factors were, thus, compared across these three categories using
Duncan‘s Mean Test. Only team composition had significant difference among the three
categories, with an F-value of 3.1201 (table 4.13). None of the other risks had any significant
difference among the three groups.
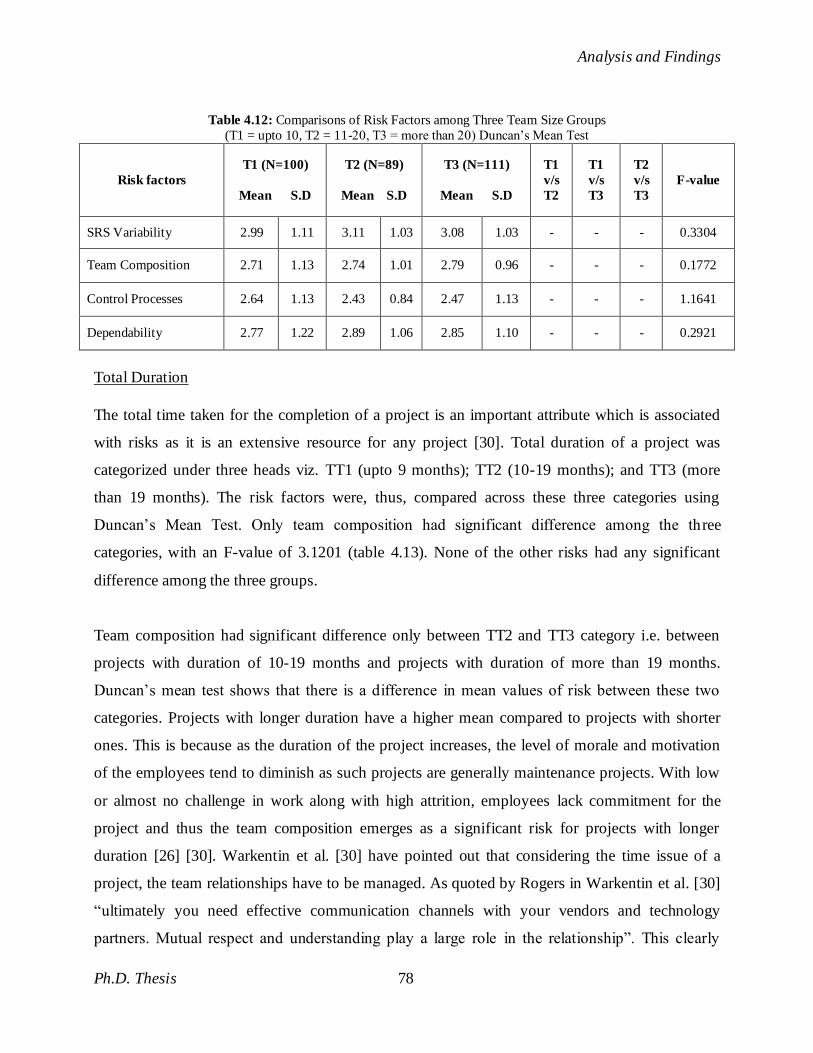
Team composition had significant difference only between TT2 and TT3 category i.e. between
projects with duration of 10-19 months and projects with duration of more than 19 months.
Duncan‘s mean test shows that there is a difference in mean values of risk between these two
categories. Projects with longer duration have a higher mean compared to projects with shorter
ones. This is because as the duration of the project increases, the level of morale and motivation
of the employees tend to diminish as such projects are generally maintenance projects. With low
or almost no challenge in work along with high attrition, employees lack commitment for the
project and thus the team composition emerges as a significant risk for projects with longer
duration [26] [30]. Warkentin et al. [30] have pointed out that considering the time issue of a
project, the team relationships have to be managed. As quoted by Rogers in Warkentin et al. [30]
―ultimately you need effective communication channels with your vendors and technology
partners. Mutual respect and understanding play a large role in the relationship‖. This clearly
Analysis and Findings
Ph.D. Thesis 79
defines that team composition is associated with the duration of a project and that it has a larger
impact on projects with longer duration as compared to shorter ones.
Table 4.13: Comparisons of Risk Factors among Three Total Time Groups
(TT1 = upto 9 months, TT2 = 10-19 months, TT3 = more than 19) Duncan‘s Mean Test
Risk factors
TT1 (N=113)
Mean S.D
TT2 (N=96)
Mean S.D
TT3 (N=111)
Mean S.D
TT1
v/s
TT2
TT1
v/s
TT3
TT2
v/s
TT3
F-value
SRS Variability 2.99 1.13 2.99 1.06 3.18 0.98 - - - 1.1998
Team Composition 2.70 1.12 2.56 1.00 2.93 0.94 - - * 3.1201*
Control Processes 2.47 1.10 2.46 1.06 2.60 0.99 - - - 0.5424
Dependability 2.76 1.15 2.75 1.19 2.98 1.07 - - - 1.4238
*Significant at .05 level. ** Significant at .01 level.
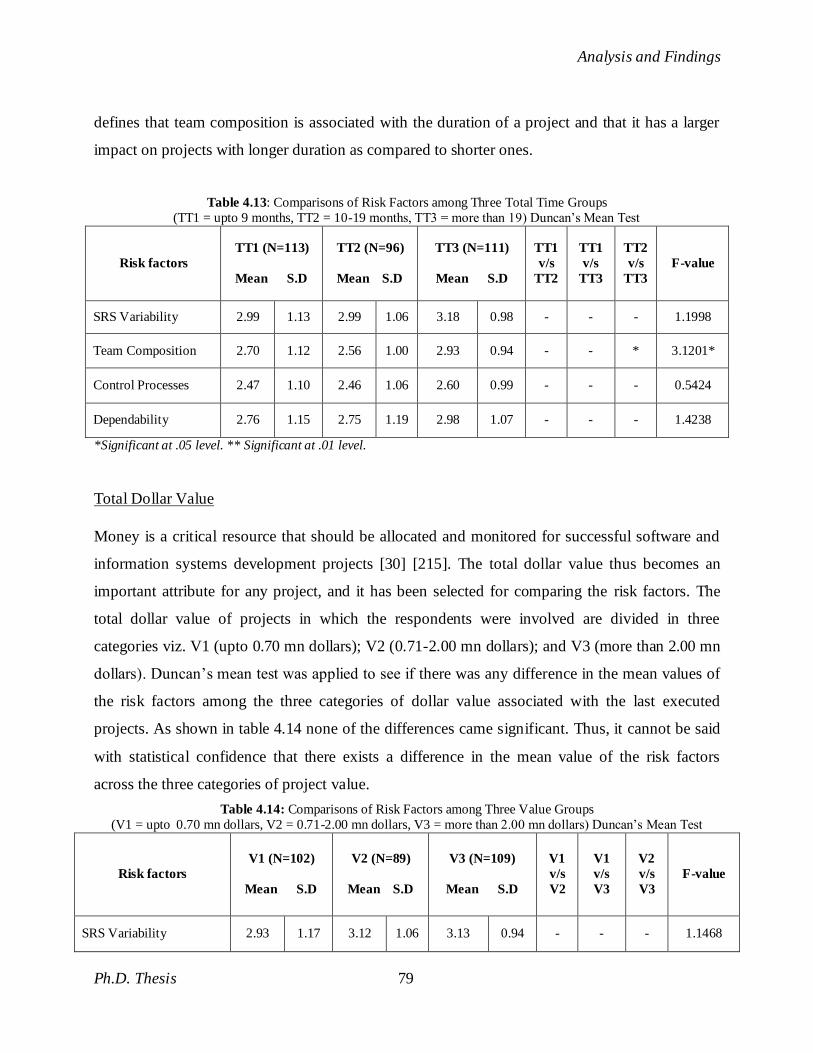
Total Dollar Value
Money is a critical resource that should be allocated and monitored for successful software and
information systems development projects [30] [215]. The total dollar value thus becomes an
important attribute for any project, and it has been selected for comparing the risk factors. The
total dollar value of projects in which the respondents were involved are divided in three
categories viz. V1 (upto 0.70 mn dollars); V2 (0.71-2.00 mn dollars); and V3 (more than 2.00 mn
dollars). Duncan‘s mean test was applied to see if there was any difference in the mean values of
the risk factors among the three categories of dollar value associated with the last executed
projects. As shown in table 4.14 none of the differences came significant. Thus, it cannot be said
with statistical confidence that there exists a difference in the mean value of the risk factors
across the three categories of project value.
Table 4.14: Comparisons of Risk Factors among Three Value Groups
(V1 = upto 0.70 mn dollars, V2 = 0.71-2.00 mn dollars, V3 = more than 2.00 mn dollars) Duncan‘s Mean Test
Risk factors
V1 (N=102)
Mean S.D
V2 (N=89)
Mean S.D
V3 (N=109)
Mean S.D
V1
v/s
V2
V1
v/s
V3
V2
v/s
V3
F-value
SRS Variability 2.93 1.17 3.12 1.06 3.13 0.94 - - - 1.1468
Analysis and Findings
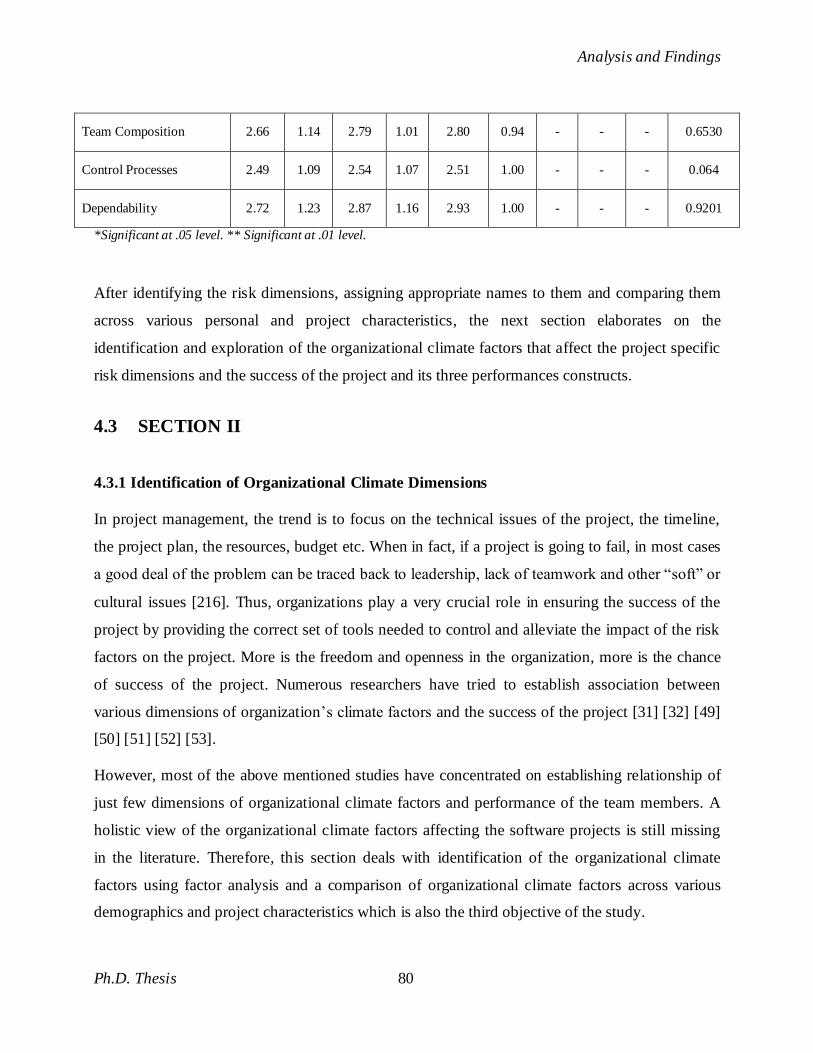
Ph.D. Thesis 80
Team Composition 2.66 1.14 2.79 1.01 2.80 0.94 - - - 0.6530
Control Processes 2.49 1.09 2.54 1.07 2.51 1.00 - - - 0.064
Dependability 2.72 1.23 2.87 1.16 2.93 1.00 - - - 0.9201
*Significant at .05 level. ** Significant at .01 level.
After identifying the risk dimensions, assigning appropriate names to them and comparing them
across various personal and project characteristics, the next section elaborates on the
identification and exploration of the organizational climate factors that affect the project specific
risk dimensions and the success of the project and its three performances constructs.
4.3 SECTION II
4.3.1 Identification of Organizational Climate Dimensions
In project management, the trend is to focus on the technical issues of the project, the timeline,
the project plan, the resources, budget etc. When in fact, if a project is going to fail, in most cases
a good deal of the problem can be traced back to leadership, lack of teamwork and other ―soft‖ or
cultural issues [216]. Thus, organizations play a very crucial role in ensuring the success of the
project by providing the correct set of tools needed to control and alleviate the impact of the risk
factors on the project. More is the freedom and openness in the organization, more is the chance
of success of the project. Numerous researchers have tried to establish association between
various dimensions of organization‘s climate factors and the success of the project [31] [32] [49]
[50] [51] [52] [53].
However, most of the above mentioned studies have concentrated on establishing relationship of
just few dimensions of organizational climate factors and performance of the team members. A
holistic view of the organizational climate factors affecting the software projects is still missing
in the literature. Therefore, this section deals with identification of the organizational climate
factors using factor analysis and a comparison of organizational climate factors across various
demographics and project characteristics which is also the third objective of the study.
Analysis and Findings
Ph.D. Thesis 81
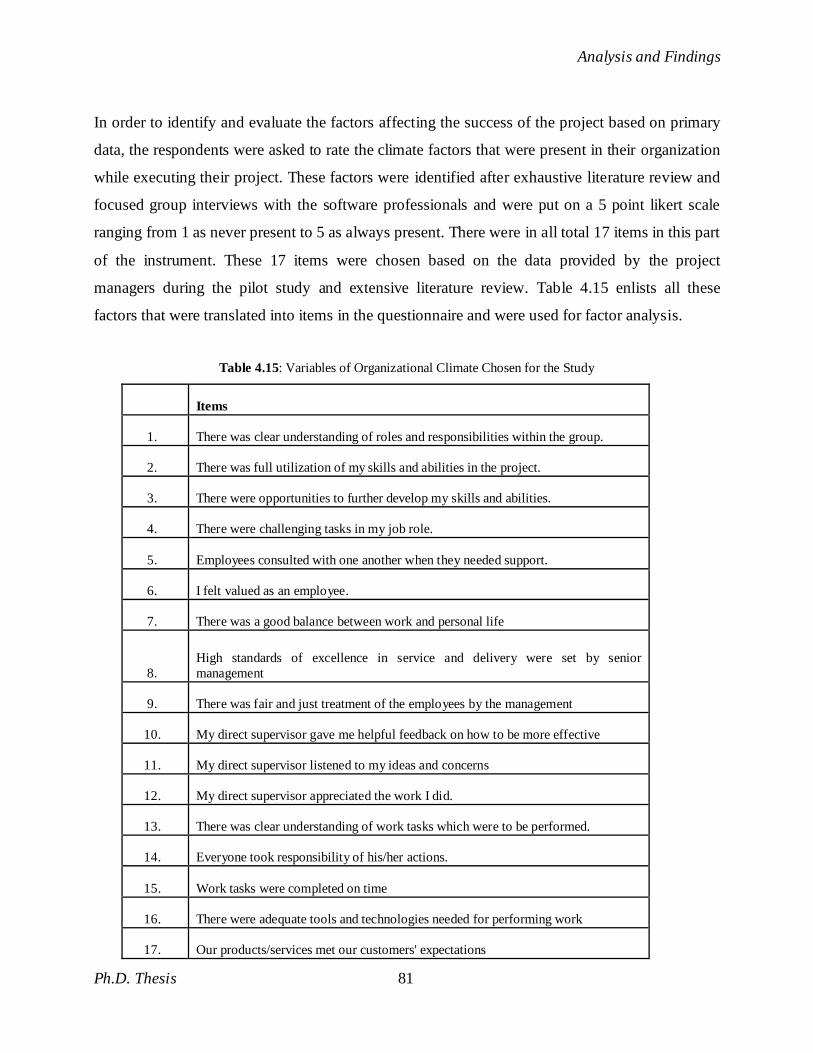
In order to identify and evaluate the factors affecting the success of the project based on primary
data, the respondents were asked to rate the climate factors that were present in their organization
while executing their project. These factors were identified after exhaustive literature review and
focused group interviews with the software professionals and were put on a 5 point likert scale
ranging from 1 as never present to 5 as always present. There were in all total 17 items in this part
of the instrument. These 17 items were chosen based on the data provided by the project
managers during the pilot study and extensive literature review. Table 4.15 enlists all these
factors that were translated into items in the questionnaire and were used for factor analysis.
Table 4.15: Variables of Organizational Climate Chosen for the Study
Items
1. There was clear understanding of roles and responsibilities within the group.
2. There was full utilization of my skills and abilities in the project.
3. There were opportunities to further develop my skills and abilities.
4. There were challenging tasks in my job role.
5. Employees consulted with one another when they needed support.
6. I felt valued as an employee.
7. There was a good balance between work and personal life
8.
High standards of excellence in service and delivery were set by senior
management
9. There was fair and just treatment of the employees by the management
10. My direct supervisor gave me helpful feedback on how to be more effective
11. My direct supervisor listened to my ideas and concerns
12. My direct supervisor appreciated the work I did.
13. There was clear understanding of work tasks which were to be performed.
14. Everyone took responsibility of his/her actions.
15. Work tasks were completed on time
16. There were adequate tools and technologies needed for performing work
17. Our products/services met our customers' expectations
Analysis and Findings
Ph.D. Thesis 82
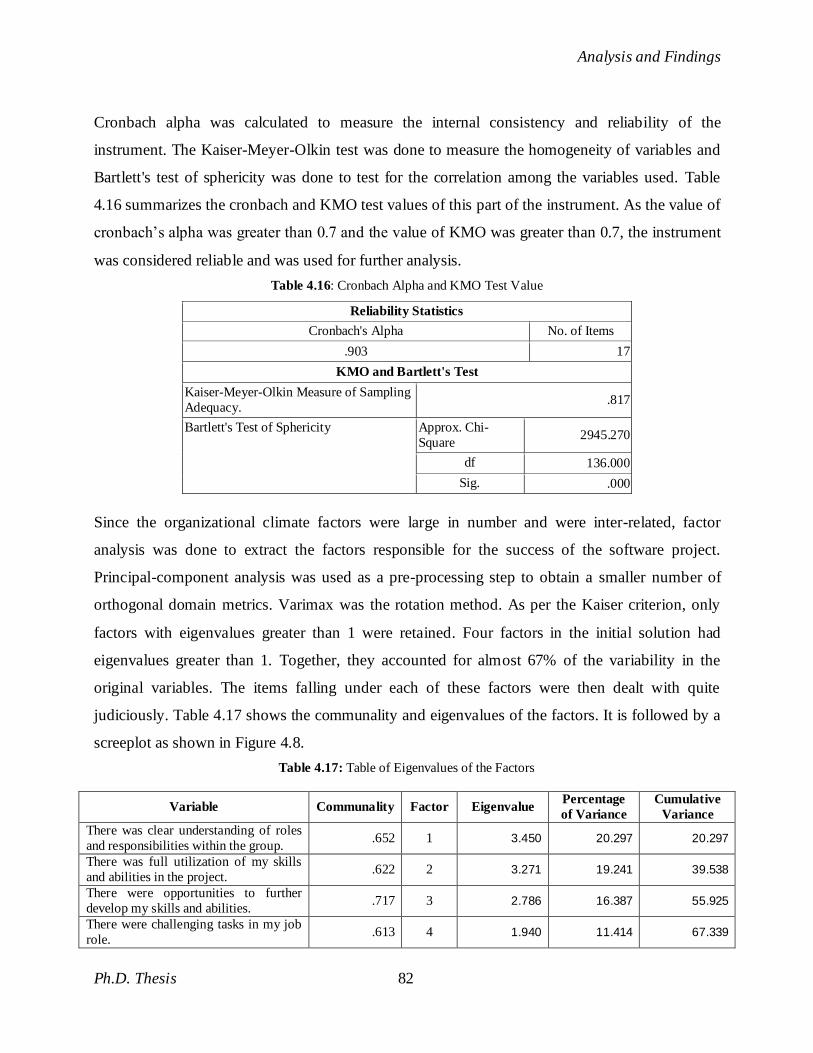
Cronbach alpha was calculated to measure the internal consistency and reliability of the
instrument. The Kaiser-Meyer-Olkin test was done to measure the homogeneity of variables and
Bartlett's test of sphericity was done to test for the correlation among the variables used. Table
4.16 summarizes the cronbach and KMO test values of this part of the instrument. As the value of
cronbach‘s alpha was greater than 0.7 and the value of KMO was greater than 0.7, the instrument
was considered reliable and was used for further analysis.
Table 4.16: Cronbach Alpha and KMO Test Value
Reliability Statistics
Cronbach's Alpha No. of Items
.903 17
KMO and Bartlett's Test
Kaiser-Meyer-Olkin Measure of Sampling
Adequacy. .817
Bartlett's Test of Sphericity Approx. Chi-
Square 2945.270
df 136.000
Sig. .000
Since the organizational climate factors were large in number and were inter-related, factor
analysis was done to extract the factors responsible for the success of the software project.
Principal-component analysis was used as a pre-processing step to obtain a smaller number of
orthogonal domain metrics. Varimax was the rotation method. As per the Kaiser criterion, only
factors with eigenvalues greater than 1 were retained. Four factors in the initial solution had
eigenvalues greater than 1. Together, they accounted for almost 67% of the variability in the
original variables. The items falling under each of these factors were then dealt with quite
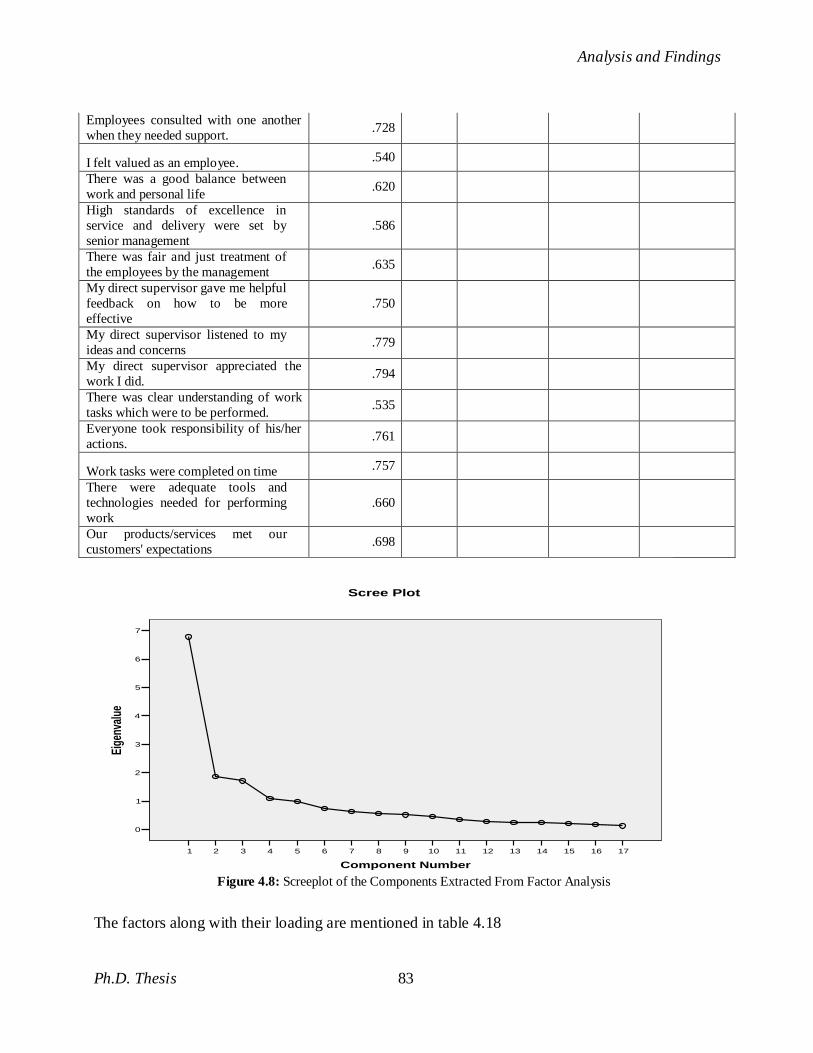
judiciously. Table 4.17 shows the communality and eigenvalues of the factors. It is followed by a
screeplot as shown in Figure 4.8.
Table 4.17: Table of Eigenvalues of the Factors
Variable Communality Factor Eigenvalue Percentage
of Variance
Cumulative
Variance
There was clear understanding of roles
and responsibilities within the group. .652 1 3.450 20.297 20.297
There was full utilization of my skills
and abilities in the project. .622 2 3.271 19.241 39.538
There were opportunities to further
develop my skills and abilities. .717 3 2.786 16.387 55.925
There were challenging tasks in my job
role. .613 4 1.940 11.414 67.339
Analysis and Findings
Ph.D. Thesis 83
Employees consulted with one another
when they needed support. .728
I felt valued as an employee. .540
There was a good balance between
work and personal life .620
High standards of excellence in
service and delivery were set by
senior management
.586
There was fair and just treatment of
the employees by the management .635
My direct supervisor gave me helpful
feedback on how to be more
effective
.750
My direct supervisor listened to my
ideas and concerns .779
My direct supervisor appreciated the
work I did. .794
There was clear understanding of work
tasks which were to be performed. .535
Everyone took responsibility of his/her
actions. .761
Work tasks were completed on time .757
There were adequate tools and
technologies needed for performing
work
.660
Our products/services met our
customers' expectations .698
1716151413121110987654321
Component Number
7
6
5
4
3
2
1
0
Eige
nval
ue
Scree Plot
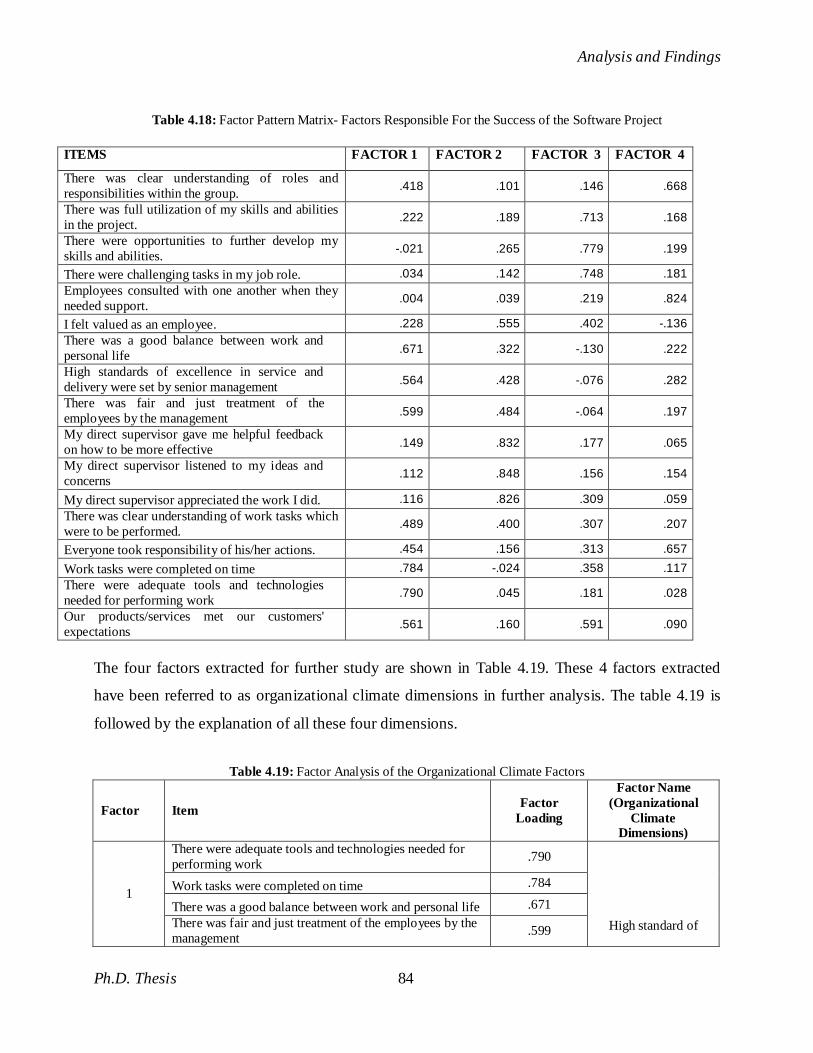
The factors along with their loading are mentioned in table 4.18
Figure 4.8: Screeplot of the Components Extracted From Factor Analysis
Analysis and Findings
Ph.D. Thesis 84
Table 4.18: Factor Pattern Matrix- Factors Responsible For the Success of the Software Project
ITEMS FACTOR 1 FACTOR 2 FACTOR 3 FACTOR 4
There was clear understanding of roles and
responsibilities within the group. .418 .101 .146 .668
There was full utilization of my skills and abilities
in the project. .222 .189 .713 .168
There were opportunities to further develop my
skills and abilities. -.021 .265 .779 .199
There were challenging tasks in my job role. .034 .142 .748 .181
Employees consulted with one another when they
needed support. .004 .039 .219 .824
I felt valued as an employee. .228 .555 .402 -.136
There was a good balance between work and
personal life .671 .322 -.130 .222
High standards of excellence in service and
delivery were set by senior management .564 .428 -.076 .282
There was fair and just treatment of the
employees by the management .599 .484 -.064 .197
My direct supervisor gave me helpful feedback
on how to be more effective .149 .832 .177 .065
My direct supervisor listened to my ideas and
concerns .112 .848 .156 .154
My direct supervisor appreciated the work I did. .116 .826 .309 .059
There was clear understanding of work tasks which
were to be performed. .489 .400 .307 .207
Everyone took responsibility of his/her actions. .454 .156 .313 .657
Work tasks were completed on time .784 -.024 .358 .117
There were adequate tools and technologies
needed for performing work .790 .045 .181 .028
Our products/services met our customers'
expectations .561 .160 .591 .090
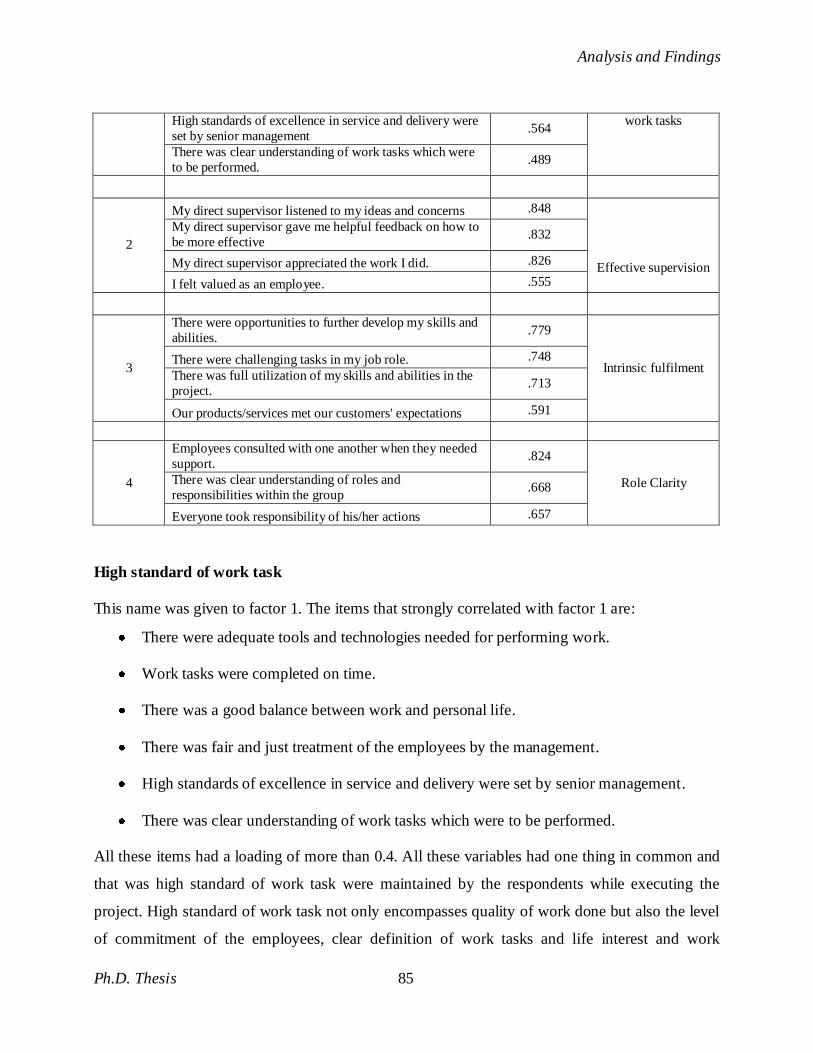
The four factors extracted for further study are shown in Table 4.19. These 4 factors extracted
have been referred to as organizational climate dimensions in further analysis. The table 4.19 is
followed by the explanation of all these four dimensions.
Table 4.19: Factor Analysis of the Organizational Climate Factors
Factor Item Factor
Loading
Factor Name
(Organizational
Climate Dimensions)
1
There were adequate tools and technologies needed for
performing work .790
High standard of
Work tasks were completed on time .784
There was a good balance between work and personal life .671
There was fair and just treatment of the employees by the
management .599
Analysis and Findings
Ph.D. Thesis 85
High standards of excellence in service and delivery were
set by senior management .564
work tasks
There was clear understanding of work tasks which were
to be performed. .489
2
My direct supervisor listened to my ideas and concerns .848
Effective supervision
My direct supervisor gave me helpful feedback on how to
be more effective .832
My direct supervisor appreciated the work I did. .826
I felt valued as an employee. .555
3
There were opportunities to further develop my skills and
abilities. .779
Intrinsic fulfilment There were challenging tasks in my job role. .748
There was full utilization of my skills and abilities in the
project. .713
Our products/services met our customers' expectations .591
4
Employees consulted with one another when they needed
support. .824
Role Clarity There was clear understanding of roles and
responsibilities within the group .668
Everyone took responsibility of his/her actions .657
High standard of work task
This name was given to factor 1. The items that strongly correlated with factor 1 are:
There were adequate tools and technologies needed for performing work.
Work tasks were completed on time.
There was a good balance between work and personal life.
There was fair and just treatment of the employees by the management.
High standards of excellence in service and delivery were set by senior management.
There was clear understanding of work tasks which were to be performed.
All these items had a loading of more than 0.4. All these variables had one thing in common and
that was high standard of work task were maintained by the respondents while executing the
project. High standard of work task not only encompasses quality of work done but also the level
of commitment of the employees, clear definition of work tasks and life interest and work
Analysis and Findings
Ph.D. Thesis 86
compatibility. A project can be successful only when the team members feel connected with the
project [31]. When there is group ―ownership,‖ project team members are more likely to treat the
plan and milestones seriously and put forth the necessary effort to get the work done. The most
effective way to achieve this ownership is to use the entire project team when putting together the
plan. The project team members should identify the tasks and should produce the work
breakdown structure. If the entire team estimates task duration and rates the dependency
relationships among the tasks, then there is more understanding and ownership in the team
resulting in on time completion of tasks and ensuing project success. The presence of fair and
just treatment of the employees by the management plays a very crucial role in motivating the
employees to give their best. When an organization has a free and open climate and a cooperative
spirit is embodied in the team members, it spreads to users so that all are more willing and ready
to contribute to project success. Studies have shown that effective management of the project,
team work, team autonomy, creative-thinking skills, team coordination, using support
technologies, identifying clear goals and assigning tasks to competent team members have been
proven to engender the software project success [55] [217] [218] [219] [220] [221] [222] [223]
[224].
Effective Supervision
This name was given to factor 2. All the items that strongly associated with this factor are:
My direct supervisor listened to my ideas and concerns.
My direct supervisor gave me helpful feedback on how to be more effective.
My direct supervisor appreciated the work I did.
I felt valued as an employee.
All the variables had a factor loading greater than 0.5. All the items had one commonality and
that is effective and facilitative supervision. Extraordinary demands are placed on software person-
nel—demands that require extraordinary commitments in order to accomplish the task at hand.
Generating this level of commitment through the process of team building is a primary responsibility
of any supervisor [225]. Software is mostly invisible and software projects also tend to be
invisible. To be successful, the supervisor whether he is a team lead, project lead or a project
Analysis and Findings
Ph.D. Thesis 87
manager must make the product (the software being developed) and the project (the development
process) visible. Project goals, system requirements, project plans, project risks, individual
responsibilities, and project status must be visible and understood by all parties involved. Only
then can the project team make informed decisions and have a reasonably good opportunity for
success. Finding a person who can handle these challenges successfully is not easy. Few people
have the qualifications and attitudes necessary to succeed in managing complex projects. Having
a certain level of technical competence is helpful, but managerial and interpersonal skills are the
most important attributes of an effective supervisor. Researchers have stated that the employees
do not leave the organizations or projects, they leave their supervisor. Previous studies have laid
great emphasis on characteristics of an effective supervisor, team commitment and the success of
the software projects [56] [225] [226] [227] [228] [229] [230] [231]. Therefore, finding the right
minded person who values the team members, listens to their ideas and facilitates their
development is very crucial.
Intrinsic Fulfilment
This name was given to Factor 3. The items that were strongly associated with factor 3 are as
follows:
There were opportunities to further develop my skills and abilities.
There were challenging tasks in my job role.
There was full utilization of my skills and abilities in the project.
Our products/services met our customers' expectations.
All these factors had factor loadings of more than 0.5. Intrinsic fulfilment is when an individual is
motivated by internal factors, as opposed to external drivers of motivation. Intrinsic motivation is
the means by which the potent wellsprings of human energy and creativity are directed toward
people‘s desired goals [233]. Herzberg [234] describes motivation as being ―…based on growth
needs. Motivation is an internal engine, and its benefits show up over a long period of time.
Because the ultimate reward (of) motivation is personal growth, people don‘t need to be rewarded
incrementally (such as through raises and promotions).‖ As an internal growth need, motivation
stands in contrast to a ‗surface‘ ―fear of punishment or failure to get extrinsic rewards‖ [234].
Analysis and Findings
Ph.D. Thesis 88
Thus, intrinsic motivation drives one to do things from the soul. Factors like growth
opportunities, substantial learning during and after the project, challenging tasks and feeling of
self-fulfilment arouse the instinct in an individual internally. Autonomy, proper feedback,
intellectually challenged work enables the team members to bring out the best in them. Mc
Connell [235] has also cited in his study that software professionals place higher value in the
intrinsic value of the work itself rather than in extrinsic factors, which include compensation,
working conditions and appropriate technical resources. Much of the research that focused on the
practitioner‘s perception of software project success explored, to some extent, employee
motivation [81] [236]. According to the researchers, the practitioner‘s perception of project
success is, at least in part, determined by components that are related to their motivation and that
motivation had the single largest impact on practitioner productivity [233] [235]. Therefore,
project managers need to establish a vision for the development team, hold the team accountable
for results, delegate tasks to the team in a manner that are ―challenging, clear and supportive‖ and
remove barriers to team productivity when necessary [80] [235] [237] [238].
Role Clarity
This name was given to Factor 4. The items that were strongly associated with factor 4 are as
follows:
Employees consulted with one another when they needed support.
There was clear understanding of roles and responsibilities within the group.
Everyone took responsibility of his/her actions.
All these factors had factor loadings of more than 0.6. All these items rated by the respondents
had one thing in common and that is clarity in roles and responsibilities. Role clarity is defined as
the "fit between the amount of information that a person has and the amount he (or she) requires
to perform the role adequately" [239]. A clear definition of roles and responsibilities provides a
mechanism to distinctly assign accountability to team members for carrying out a task. When
roles and responsibilities remain unclear, multiple untested assumptions often displace them
[240]. Opportunities realised or opportunities lost can be linked to how well an individual grasps
his/her role and the level of commitment to accountabilities, even the slightest vagueness here can
hurt an entire teams‘ ability to meet its objectives. Without a clear articulation of roles, a team
Analysis and Findings
Ph.D. Thesis 89
can be sent sputtering whenever a new idea or problem presents itself. Not only does this result in
missed opportunities, rework and delays, it also creates an atmosphere of uncertainty and lack of
predictability. However, a clear and lucid definition of roles and responsibilities promotes
autonomy, ownership, and self-accountability. When team members are confident about what is
in their control and what is not, they can step forward to accept responsibility with full knowledge
of what is expected from them. Roles and responsibilities exercised out of a sense of ownership
inspire commitment towards the project and organization [241]. Furthermore, role clarity also
increases job satisfaction amongst the team members thereby, further strengthening the
commitment levels. Numerous studies have been conducted on establishing relationship between
role clarity, job satisfaction and commitment towards the project and organizations [242] [243]
[244] [245] [246] [247] [248]. Therefore, to ensure the success of the project, it is the
responsibility of the project manager to define specific, clear and lucid roles for the members of
the development team [232] [238].
4.3.2 Comparison of organizational climate factors across various personal and project
characteristics
The dimensions of organizational climate factors so formulated after the factor analysis were then
compared across the various personal characteristics of the respondents and the project
characteristics handled by the respondents chosen for the study. The personal characteristics
taken for the analysis included experience and designation while the project characteristics
included total team size, total time taken to complete the project and the total value of the project.
The comparisons are discussed as follows:
Personal characteristics
Designation
Duncan‘s Mean Test was applied to compare the dimensions of organizational climate among
three designation groups. Significant difference was found in the mean values of only two of the
dimensions of organizational climate as perceived by respondents of the various categories of
designation. High standards of work tasks and effective supervision showed significant
Analysis and Findings
Ph.D. Thesis 90
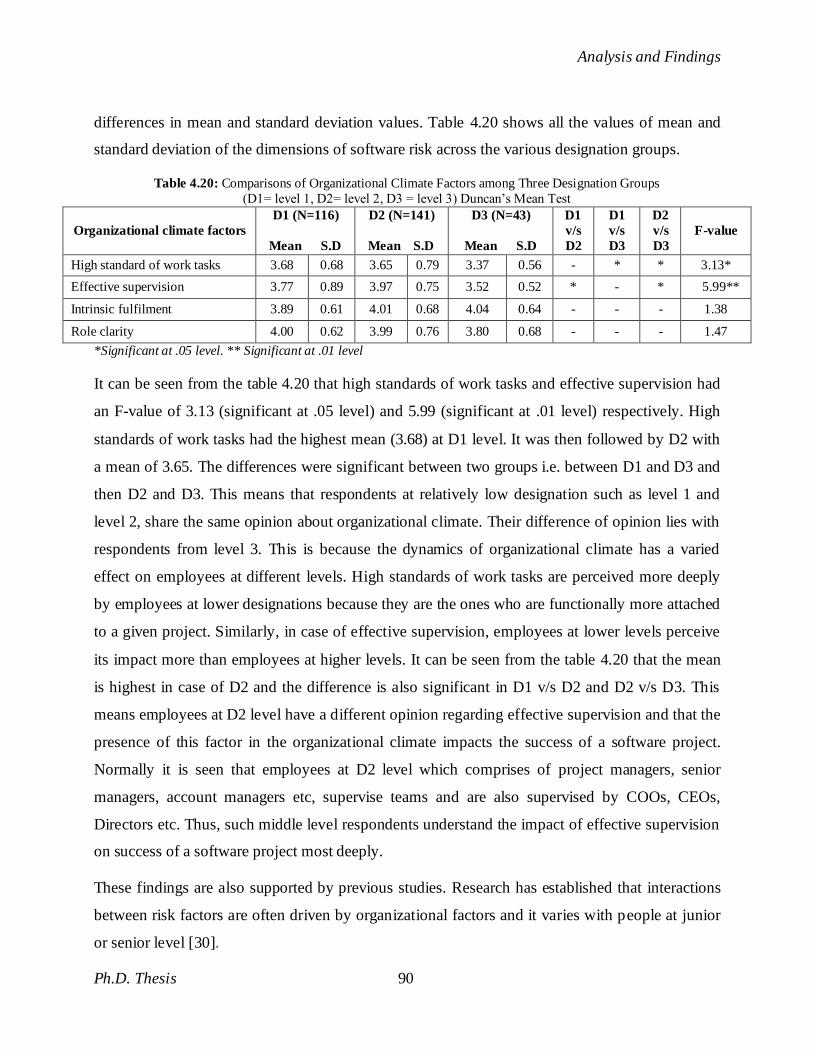
differences in mean and standard deviation values. Table 4.20 shows all the values of mean and
standard deviation of the dimensions of software risk across the various designation groups.
Table 4.20: Comparisons of Organizational Climate Factors among Three Designation Groups
(D1= level 1, D2= level 2, D3 = level 3) Duncan‘s Mean Test
Organizational climate factors
D1 (N=116)
Mean S.D
D2 (N=141)
Mean S.D
D3 (N=43)
Mean S.D
D1
v/s
D2
D1
v/s
D3
D2
v/s
D3
F-value
High standard of work tasks 3.68 0.68 3.65 0.79 3.37 0.56 - * * 3.13*
Effective supervision 3.77 0.89 3.97 0.75 3.52 0.52 * - * 5.99**
Intrinsic fulfilment 3.89 0.61 4.01 0.68 4.04 0.64 - - - 1.38
Role clarity 4.00 0.62 3.99 0.76 3.80 0.68 - - - 1.47
*Significant at .05 level. ** Significant at .01 level
It can be seen from the table 4.20 that high standards of work tasks and effective supervision had
an F-value of 3.13 (significant at .05 level) and 5.99 (significant at .01 level) respectively. High
standards of work tasks had the highest mean (3.68) at D1 level. It was then followed by D2 with
a mean of 3.65. The differences were significant between two groups i.e. between D1 and D3 and
then D2 and D3. This means that respondents at relatively low designation such as level 1 and
level 2, share the same opinion about organizational climate. Their difference of opinion lies with
respondents from level 3. This is because the dynamics of organizational climate has a varied
effect on employees at different levels. High standards of work tasks are perceived more deeply
by employees at lower designations because they are the ones who are functionally more attached
to a given project. Similarly, in case of effective supervision, employees at lower levels perceive
its impact more than employees at higher levels. It can be seen from the table 4.20 that the mean
is highest in case of D2 and the difference is also significant in D1 v/s D2 and D2 v/s D3. This
means employees at D2 level have a different opinion regarding effective supervision and that the
presence of this factor in the organizational climate impacts the success of a software project.
Normally it is seen that employees at D2 level which comprises of project managers, senior
managers, account managers etc, supervise teams and are also supervised by COOs, CEOs,
Directors etc. Thus, such middle level respondents understand the impact of effective supervision
on success of a software project most deeply.
These findings are also supported by previous studies. Research has established that interactions
between risk factors are often driven by organizational factors and it varies with people at junior
or senior level [30].
Analysis and Findings
Ph.D. Thesis 91
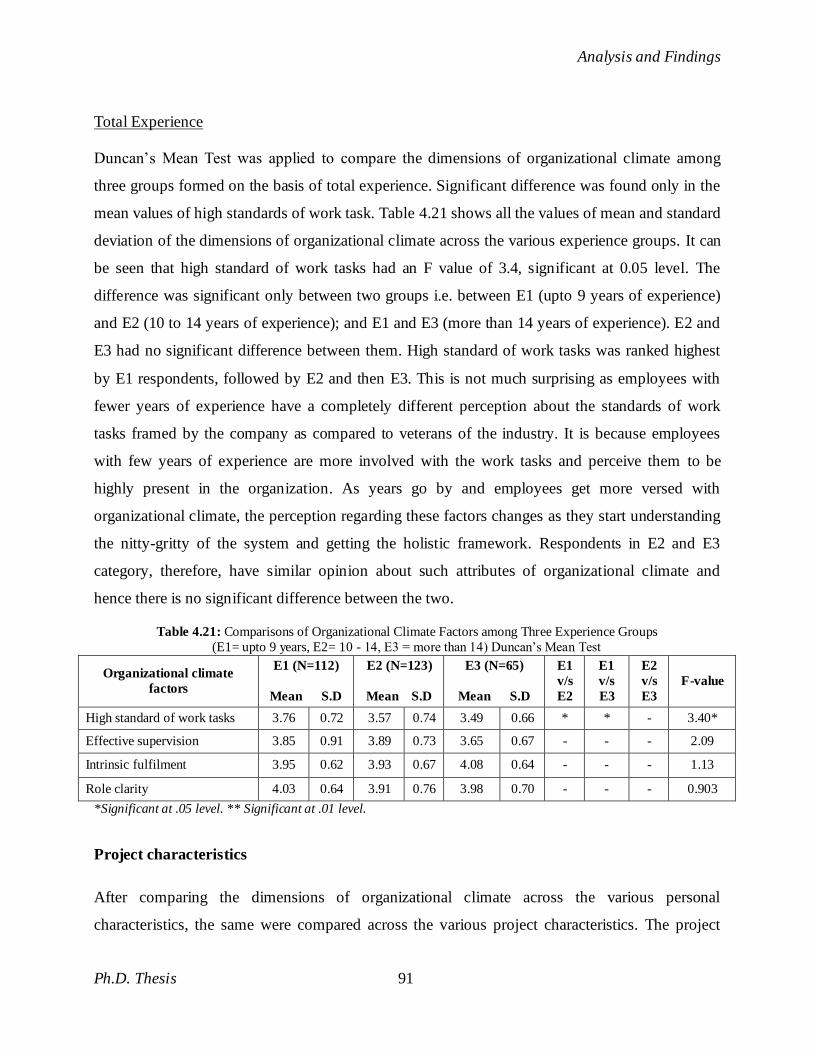
Total Experience
Duncan‘s Mean Test was applied to compare the dimensions of organizational climate among
three groups formed on the basis of total experience. Significant difference was found only in the
mean values of high standards of work task. Table 4.21 shows all the values of mean and standard
deviation of the dimensions of organizational climate across the various experience groups. It can
be seen that high standard of work tasks had an F value of 3.4, significant at 0.05 level. The
difference was significant only between two groups i.e. between E1 (upto 9 years of experience)
and E2 (10 to 14 years of experience); and E1 and E3 (more than 14 years of experience). E2 and
E3 had no significant difference between them. High standard of work tasks was ranked highest
by E1 respondents, followed by E2 and then E3. This is not much surprising as employees with
fewer years of experience have a completely different perception about the standards of work
tasks framed by the company as compared to veterans of the industry. It is because employees
with few years of experience are more involved with the work tasks and perceive them to be
highly present in the organization. As years go by and employees get more versed with
organizational climate, the perception regarding these factors changes as they start understanding
the nitty-gritty of the system and getting the holistic framework. Respondents in E2 and E3
category, therefore, have similar opinion about such attributes of organizational climate and
hence there is no significant difference between the two.
Table 4.21: Comparisons of Organizational Climate Factors among Three Experience Groups
(E1= upto 9 years, E2= 10 - 14, E3 = more than 14) Duncan‘s Mean Test
Organizational climate
factors
E1 (N=112)
Mean S.D
E2 (N=123)
Mean S.D
E3 (N=65)
Mean S.D
E1
v/s
E2
E1
v/s
E3
E2
v/s
E3
F-value
High standard of work tasks 3.76 0.72 3.57 0.74 3.49 0.66 * * - 3.40*
Effective supervision 3.85 0.91 3.89 0.73 3.65 0.67 - - - 2.09
Intrinsic fulfilment 3.95 0.62 3.93 0.67 4.08 0.64 - - - 1.13
Role clarity 4.03 0.64 3.91 0.76 3.98 0.70 - - - 0.903
*Significant at .05 level. ** Significant at .01 level.
Project characteristics
After comparing the dimensions of organizational climate across the various personal
characteristics, the same were compared across the various project characteristics. The project
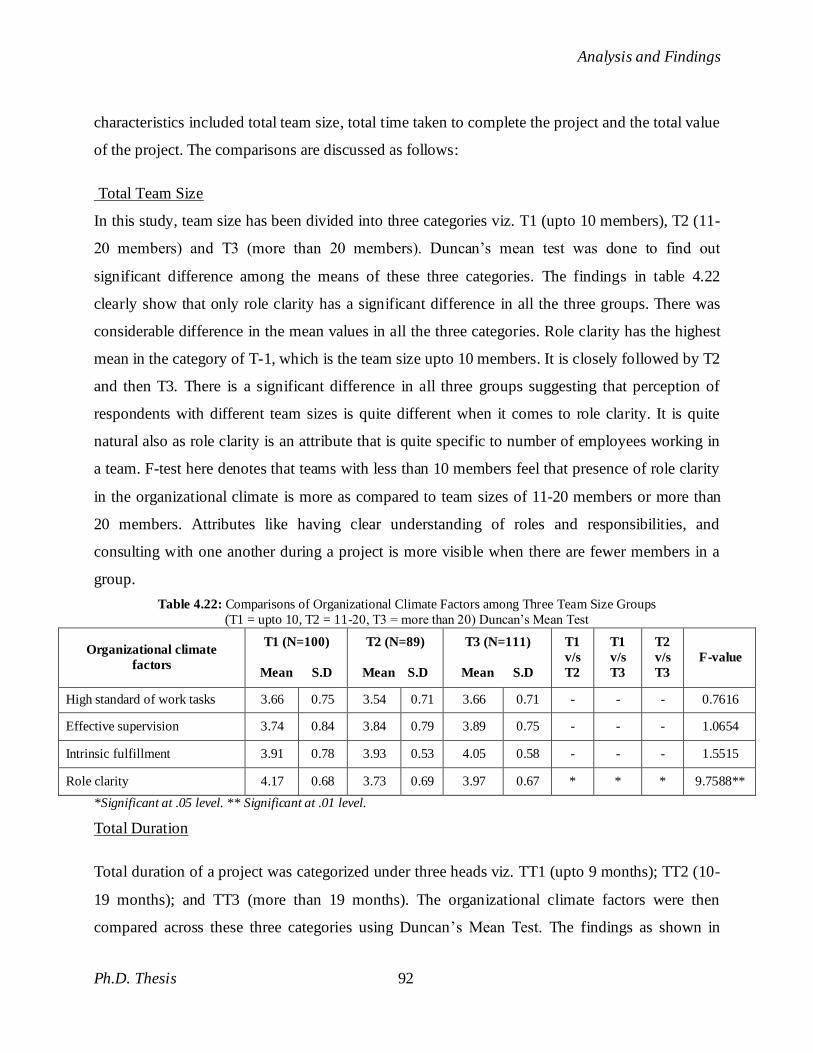
Analysis and Findings
Ph.D. Thesis 92
characteristics included total team size, total time taken to complete the project and the total value
of the project. The comparisons are discussed as follows:
Total Team Size
In this study, team size has been divided into three categories viz. T1 (upto 10 members), T2 (11-
20 members) and T3 (more than 20 members). Duncan‘s mean test was done to find out
significant difference among the means of these three categories. The findings in table 4.22
clearly show that only role clarity has a significant difference in all the three groups. There was
considerable difference in the mean values in all the three categories. Role clarity has the highest
mean in the category of T-1, which is the team size upto 10 members. It is closely followed by T2
and then T3. There is a significant difference in all three groups suggesting that perception of
respondents with different team sizes is quite different when it comes to role clarity. It is quite
natural also as role clarity is an attribute that is quite specific to number of employees working in
a team. F-test here denotes that teams with less than 10 members feel that presence of role clarity
in the organizational climate is more as compared to team sizes of 11-20 members or more than
20 members. Attributes like having clear understanding of roles and responsibilities, and
consulting with one another during a project is more visible when there are fewer members in a
group.
Table 4.22: Comparisons of Organizational Climate Factors among Three Team Size Groups
(T1 = upto 10, T2 = 11-20, T3 = more than 20) Duncan‘s Mean Test
Organizational climate
factors
T1 (N=100)
Mean S.D
T2 (N=89)
Mean S.D
T3 (N=111)
Mean S.D
T1
v/s
T2
T1
v/s
T3
T2
v/s
T3
F-value
High standard of work tasks 3.66 0.75 3.54 0.71 3.66 0.71 - - - 0.7616
Effective supervision 3.74 0.84 3.84 0.79 3.89 0.75 - - - 1.0654
Intrinsic fulfillment 3.91 0.78 3.93 0.53 4.05 0.58 - - - 1.5515
Role clarity 4.17 0.68 3.73 0.69 3.97 0.67 * * * 9.7588**
*Significant at .05 level. ** Significant at .01 level.
Total Duration
Total duration of a project was categorized under three heads viz. TT1 (upto 9 months); TT2 (10-
19 months); and TT3 (more than 19 months). The organizational climate factors were then
compared across these three categories using Duncan‘s Mean Test. The findings as shown in
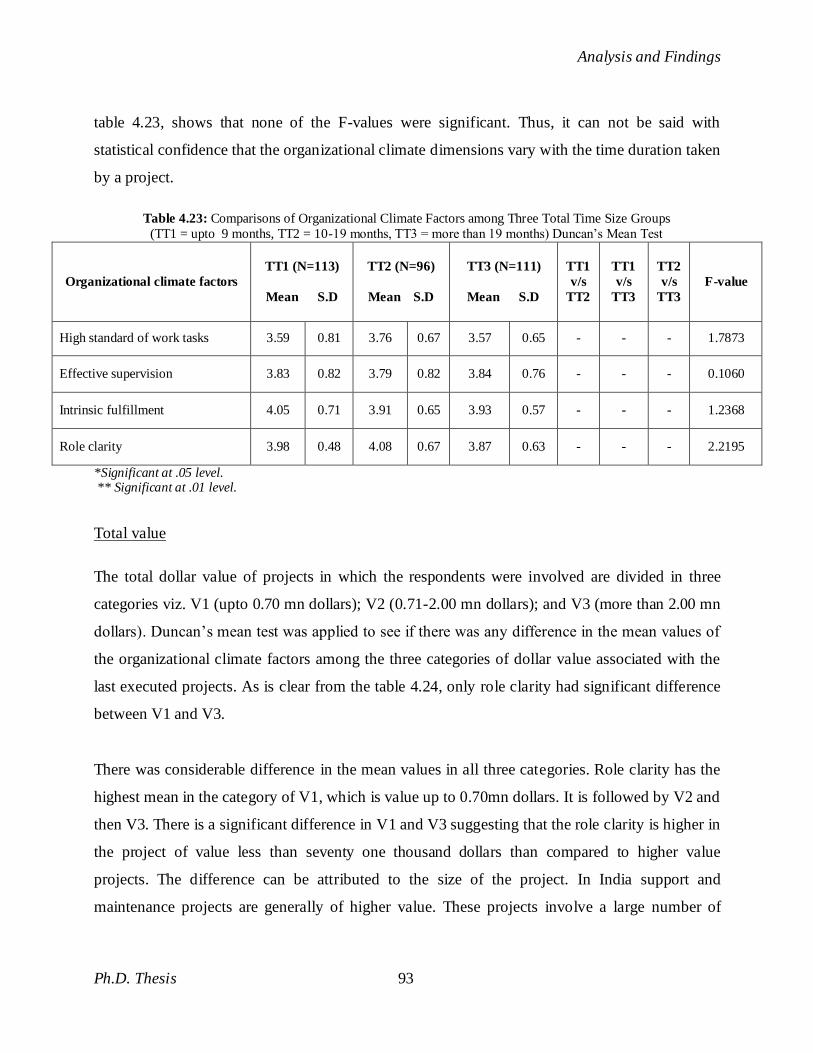
Analysis and Findings
Ph.D. Thesis 93
table 4.23, shows that none of the F-values were significant. Thus, it can not be said with
statistical confidence that the organizational climate dimensions vary with the time duration taken
by a project.
Table 4.23: Comparisons of Organizational Climate Factors among Three Total Time Size Groups
(TT1 = upto 9 months, TT2 = 10-19 months, TT3 = more than 19 months) Duncan‘s Mean Test
Organizational climate factors
TT1 (N=113)
Mean S.D
TT2 (N=96)
Mean S.D
TT3 (N=111)
Mean S.D
TT1
v/s
TT2
TT1
v/s
TT3
TT2
v/s
TT3
F-value
High standard of work tasks 3.59 0.81 3.76 0.67 3.57 0.65 - - - 1.7873
Effective supervision 3.83 0.82 3.79 0.82 3.84 0.76 - - - 0.1060
Intrinsic fulfillment 4.05 0.71 3.91 0.65 3.93 0.57 - - - 1.2368
Role clarity 3.98 0.48 4.08 0.67 3.87 0.63 - - - 2.2195
*Significant at .05 level. ** Significant at .01 level.
Total value
The total dollar value of projects in which the respondents were involved are divided in three
categories viz. V1 (upto 0.70 mn dollars); V2 (0.71-2.00 mn dollars); and V3 (more than 2.00 mn
dollars). Duncan‘s mean test was applied to see if there was any difference in the mean values of
the organizational climate factors among the three categories of dollar value associated with the
last executed projects. As is clear from the table 4.24, only role clarity had significant difference
between V1 and V3.
There was considerable difference in the mean values in all three categories. Role clarity has the
highest mean in the category of V1, which is value up to 0.70mn dollars. It is followed by V2 and
then V3. There is a significant difference in V1 and V3 suggesting that the role clarity is higher in
the project of value less than seventy one thousand dollars than compared to higher value
projects. The difference can be attributed to the size of the project. In India support and
maintenance projects are generally of higher value. These projects involve a large number of
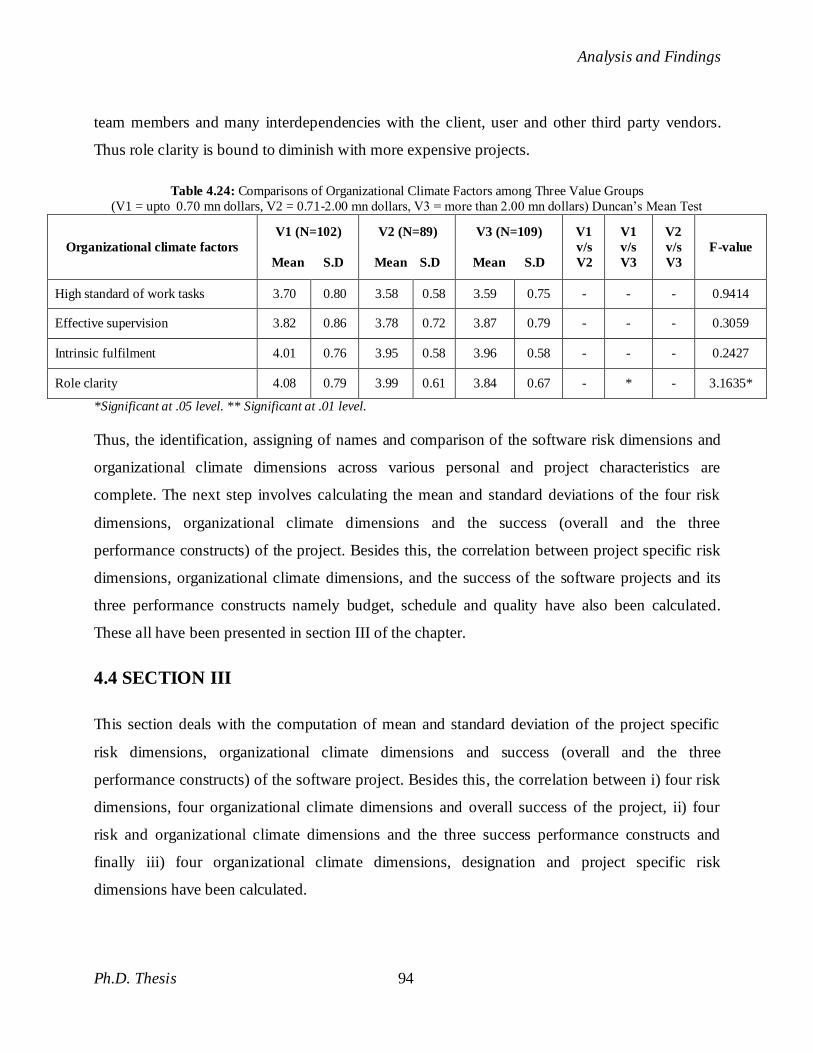
Analysis and Findings
Ph.D. Thesis 94
team members and many interdependencies with the client, user and other third party vendors.
Thus role clarity is bound to diminish with more expensive projects.
Table 4.24: Comparisons of Organizational Climate Factors among Three Value Groups
(V1 = upto 0.70 mn dollars, V2 = 0.71-2.00 mn dollars, V3 = more than 2.00 mn dollars) Duncan‘s Mean Test
Organizational climate factors
V1 (N=102)
Mean S.D
V2 (N=89)
Mean S.D
V3 (N=109)
Mean S.D
V1
v/s
V2
V1
v/s
V3
V2
v/s
V3
F-value
High standard of work tasks 3.70 0.80 3.58 0.58 3.59 0.75 - - - 0.9414
Effective supervision 3.82 0.86 3.78 0.72 3.87 0.79 - - - 0.3059
Intrinsic fulfilment 4.01 0.76 3.95 0.58 3.96 0.58 - - - 0.2427
Role clarity 4.08 0.79 3.99 0.61 3.84 0.67 - * - 3.1635*
*Significant at .05 level. ** Significant at .01 level.
Thus, the identification, assigning of names and comparison of the software risk dimensions and
organizational climate dimensions across various personal and project characteristics are
complete. The next step involves calculating the mean and standard deviations of the four risk
dimensions, organizational climate dimensions and the success (overall and the three
performance constructs) of the project. Besides this, the correlation between project specific risk
dimensions, organizational climate dimensions, and the success of the software projects and its
three performance constructs namely budget, schedule and quality have also been calculated.
These all have been presented in section III of the chapter.
4.4 SECTION III
This section deals with the computation of mean and standard deviation of the project specific
risk dimensions, organizational climate dimensions and success (overall and the three
performance constructs) of the software project. Besides this, the correlation between i) four risk
dimensions, four organizational climate dimensions and overall success of the project, ii) four
risk and organizational climate dimensions and the three success performance constructs and
finally iii) four organizational climate dimensions, designation and project specific risk
dimensions have been calculated.
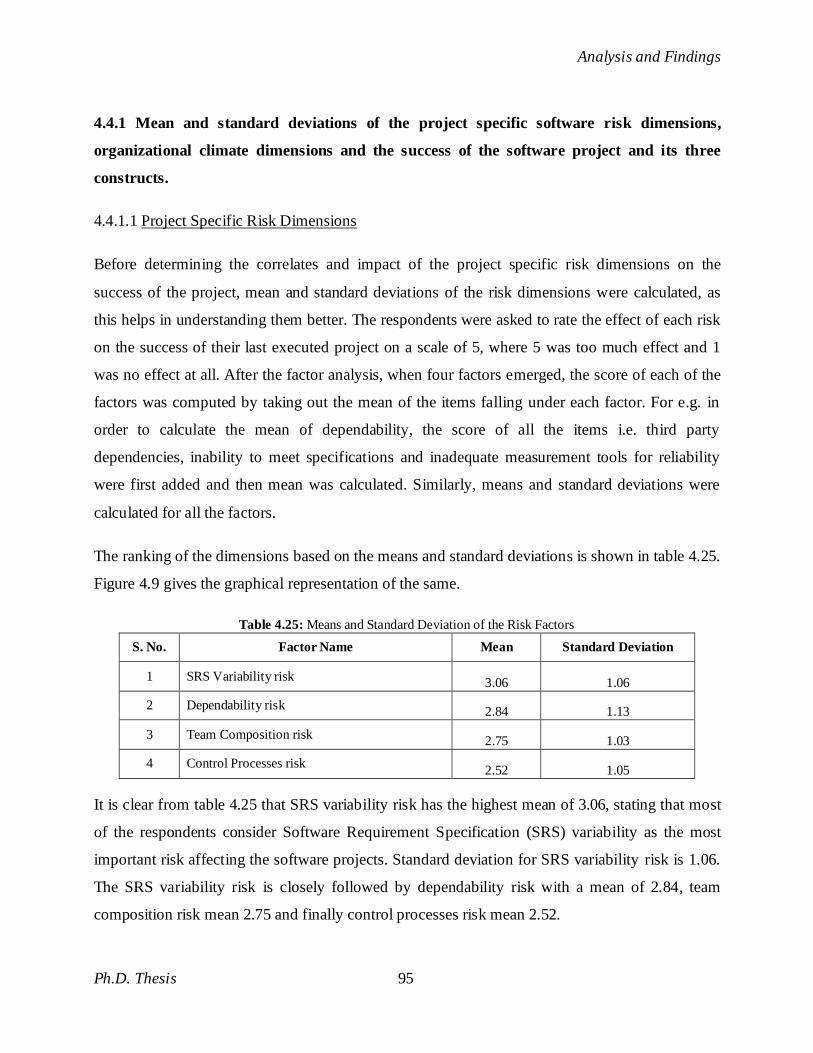
Analysis and Findings
Ph.D. Thesis 95
4.4.1 Mean and standard deviations of the project specific software risk dimensions,
organizational climate dimensions and the success of the software project and its three
constructs.
4.4.1.1 Project Specific Risk Dimensions
Before determining the correlates and impact of the project specific risk dimensions on the
success of the project, mean and standard deviations of the risk dimensions were calculated, as
this helps in understanding them better. The respondents were asked to rate the effect of each risk
on the success of their last executed project on a scale of 5, where 5 was too much effect and 1
was no effect at all. After the factor analysis, when four factors emerged, the score of each of the
factors was computed by taking out the mean of the items falling under each factor. For e.g. in
order to calculate the mean of dependability, the score of all the items i.e. third party
dependencies, inability to meet specifications and inadequate measurement tools for reliability
were first added and then mean was calculated. Similarly, means and standard deviations were
calculated for all the factors.
The ranking of the dimensions based on the means and standard deviations is shown in table 4.25.
Figure 4.9 gives the graphical representation of the same.
Table 4.25: Means and Standard Deviation of the Risk Factors
S. No. Factor Name Mean Standard Deviation
1 SRS Variability risk 3.06 1.06
2 Dependability risk 2.84 1.13
3 Team Composition risk 2.75 1.03
4 Control Processes risk 2.52 1.05
It is clear from table 4.25 that SRS variability risk has the highest mean of 3.06, stating that most
of the respondents consider Software Requirement Specification (SRS) variability as the most
important risk affecting the software projects. Standard deviation for SRS variability risk is 1.06.
The SRS variability risk is closely followed by dependability risk with a mean of 2.84, team
composition risk mean 2.75 and finally control processes risk mean 2.52.
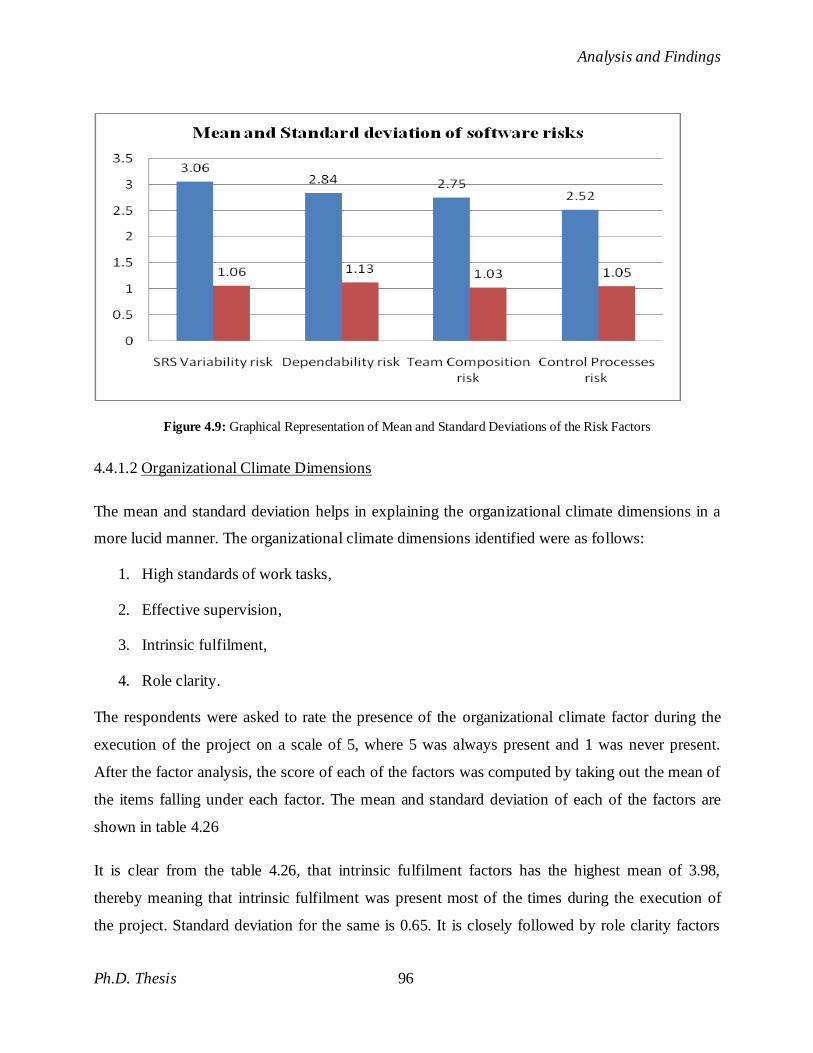
Analysis and Findings
Ph.D. Thesis 96
Figure 4.9: Graphical Representation of Mean and Standard Deviations of the Risk Factors
4.4.1.2 Organizational Climate Dimensions
The mean and standard deviation helps in explaining the organizational climate dimensions in a
more lucid manner. The organizational climate dimensions identified were as follows:
1. High standards of work tasks,
2. Effective supervision,
3. Intrinsic fulfilment,
4. Role clarity.
The respondents were asked to rate the presence of the organizational climate factor during the
execution of the project on a scale of 5, where 5 was always present and 1 was never present.
After the factor analysis, the score of each of the factors was computed by taking out the mean of
the items falling under each factor. The mean and standard deviation of each of the factors are
shown in table 4.26
It is clear from the table 4.26, that intrinsic fulfilment factors has the highest mean of 3.98,
thereby meaning that intrinsic fulfilment was present most of the times during the execution of
the project. Standard deviation for the same is 0.65. It is closely followed by role clarity factors
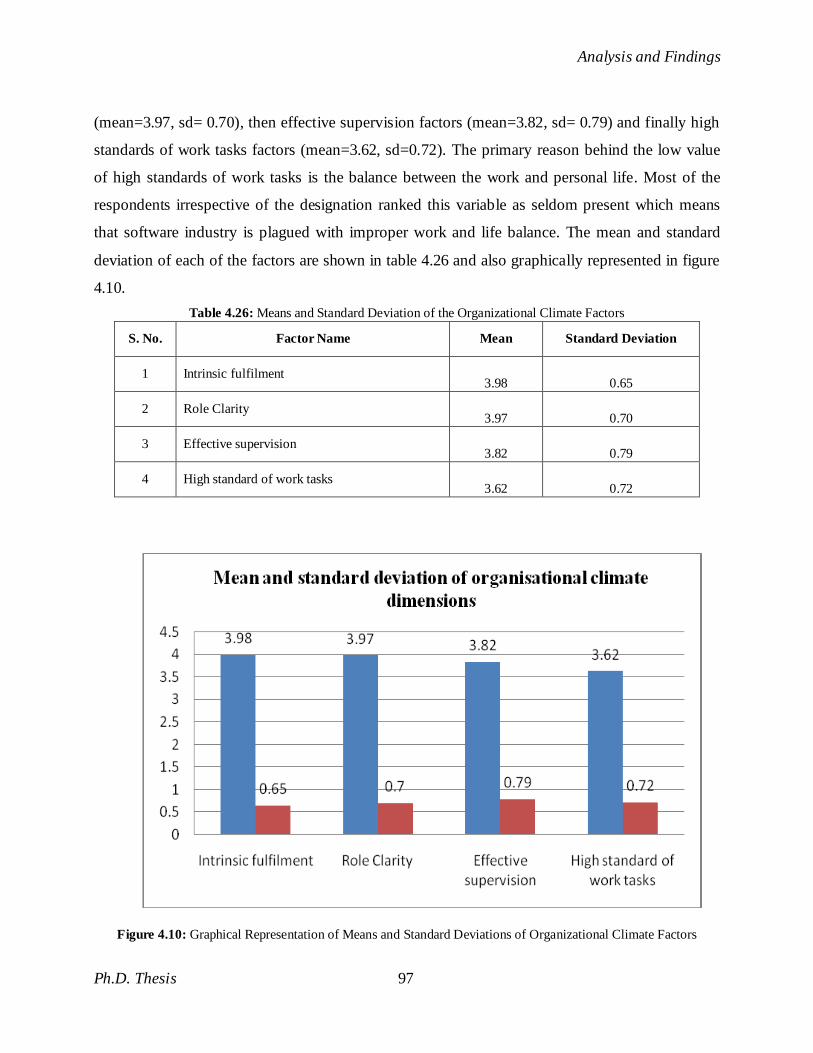
Analysis and Findings
Ph.D. Thesis 97
(mean=3.97, sd= 0.70), then effective supervision factors (mean=3.82, sd= 0.79) and finally high
standards of work tasks factors (mean=3.62, sd=0.72). The primary reason behind the low value
of high standards of work tasks is the balance between the work and personal life. Most of the
respondents irrespective of the designation ranked this variable as seldom present which means
that software industry is plagued with improper work and life balance. The mean and standard
deviation of each of the factors are shown in table 4.26 and also graphically represented in figure
4.10.
Table 4.26: Means and Standard Deviation of the Organizational Climate Factors
S. No. Factor Name Mean Standard Deviation
1 Intrinsic fulfilment 3.98 0.65
2 Role Clarity 3.97 0.70
3 Effective supervision 3.82 0.79
4 High standard of work tasks 3.62 0.72
Figure 4.10: Graphical Representation of Means and Standard Deviations of Organizational Climate Factors
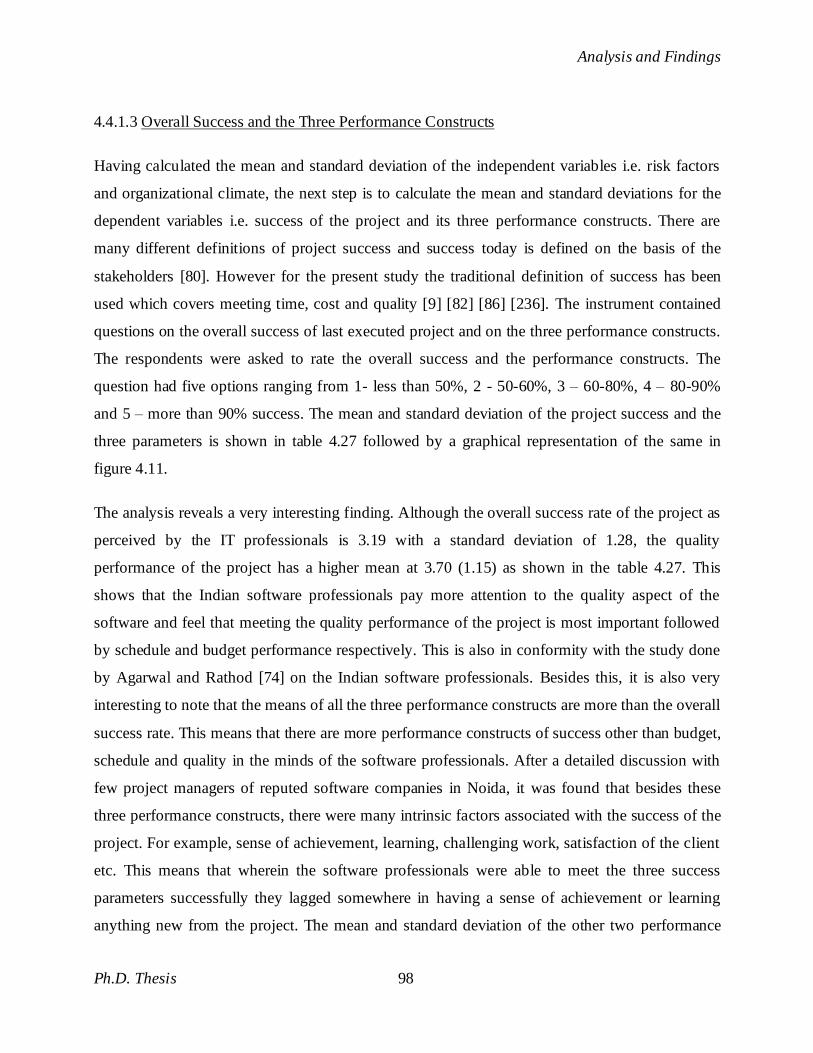
Analysis and Findings
Ph.D. Thesis 98
4.4.1.3 Overall Success and the Three Performance Constructs
Having calculated the mean and standard deviation of the independent variables i.e. risk factors
and organizational climate, the next step is to calculate the mean and standard deviations for the
dependent variables i.e. success of the project and its three performance constructs. There are
many different definitions of project success and success today is defined on the basis of the
stakeholders [80]. However for the present study the traditional definition of success has been
used which covers meeting time, cost and quality [9] [82] [86] [236]. The instrument contained
questions on the overall success of last executed project and on the three performance constructs.
The respondents were asked to rate the overall success and the performance constructs. The
question had five options ranging from 1- less than 50%, 2 - 50-60%, 3 – 60-80%, 4 – 80-90%
and 5 – more than 90% success. The mean and standard deviation of the project success and the
three parameters is shown in table 4.27 followed by a graphical representation of the same in
figure 4.11.
The analysis reveals a very interesting finding. Although the overall success rate of the project as
perceived by the IT professionals is 3.19 with a standard deviation of 1.28, the quality
performance of the project has a higher mean at 3.70 (1.15) as shown in the table 4.27. This
shows that the Indian software professionals pay more attention to the quality aspect of the
software and feel that meeting the quality performance of the project is most important followed
by schedule and budget performance respectively. This is also in conformity with the study done
by Agarwal and Rathod [74] on the Indian software professionals. Besides this, it is also very
interesting to note that the means of all the three performance constructs are more than the overall
success rate. This means that there are more performance constructs of success other than budget,
schedule and quality in the minds of the software professionals. After a detailed discussion with
few project managers of reputed software companies in Noida, it was found that besides these
three performance constructs, there were many intrinsic factors associated with the success of the
project. For example, sense of achievement, learning, challenging work, satisfaction of the client
etc. This means that wherein the software professionals were able to meet the three success
parameters successfully they lagged somewhere in having a sense of achievement or learning
anything new from the project. The mean and standard deviation of the other two performance
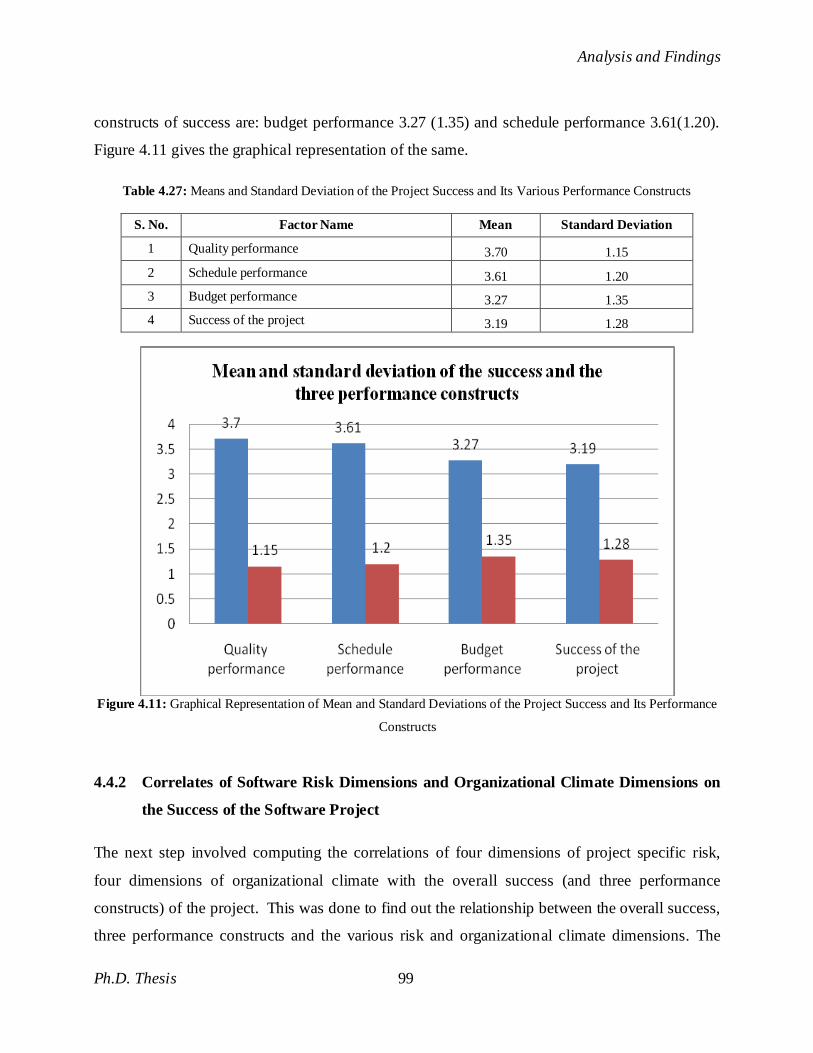
Analysis and Findings
Ph.D. Thesis 99
constructs of success are: budget performance 3.27 (1.35) and schedule performance 3.61(1.20).
Figure 4.11 gives the graphical representation of the same.
Table 4.27: Means and Standard Deviation of the Project Success and Its Various Performance Constructs
S. No. Factor Name Mean Standard Deviation
1 Quality performance 3.70 1.15
2 Schedule performance 3.61 1.20
3 Budget performance 3.27 1.35
4 Success of the project 3.19 1.28
Figure 4.11: Graphical Representation of Mean and Standard Deviations of the Project Success and Its Performance
Constructs
4.4.2 Correlates of Software Risk Dimensions and Organizational Climate Dimensions on
the Success of the Software Project
The next step involved computing the correlations of four dimensions of project specific risk,
four dimensions of organizational climate with the overall success (and three performance
constructs) of the project. This was done to find out the relationship between the overall success,
three performance constructs and the various risk and organizational climate dimensions. The
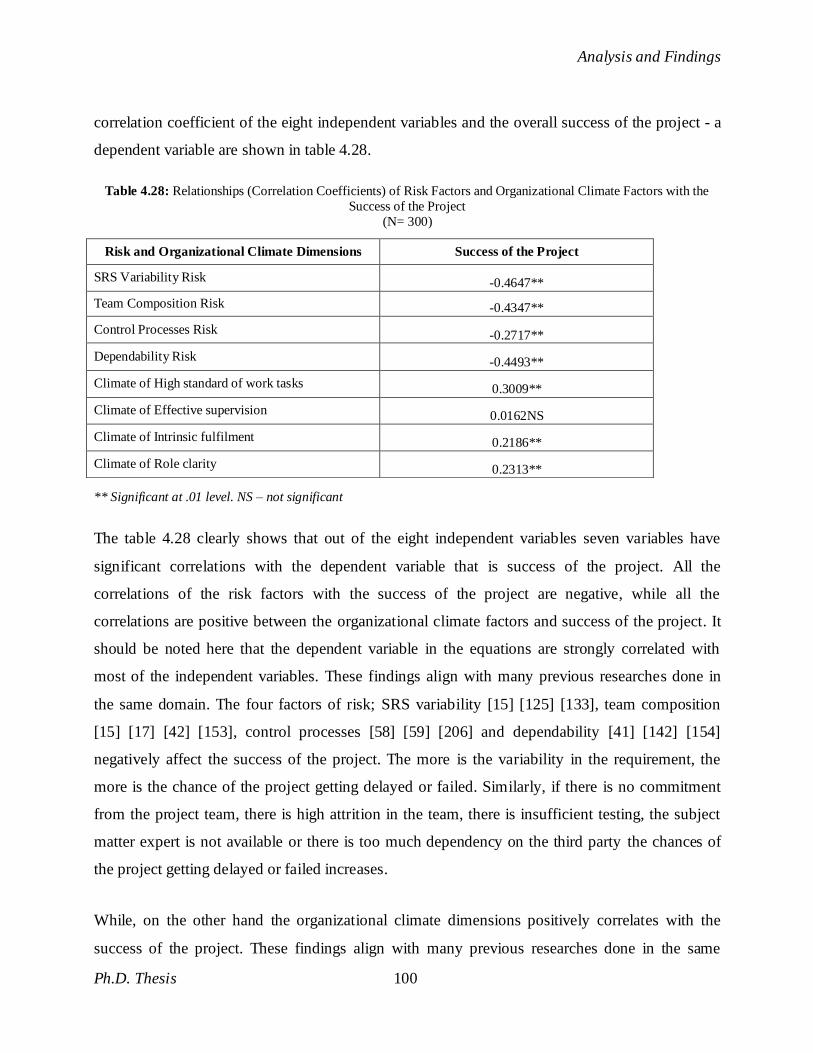
Analysis and Findings
Ph.D. Thesis 100
correlation coefficient of the eight independent variables and the overall success of the project - a
dependent variable are shown in table 4.28.
Table 4.28: Relationships (Correlation Coefficients) of Risk Factors and Organizational Climate Factors with the
Success of the Project
(N= 300)
** Significant at .01 level. NS – not significant
The table 4.28 clearly shows that out of the eight independent variables seven variables have
significant correlations with the dependent variable that is success of the project. All the
correlations of the risk factors with the success of the project are negative, while all the
correlations are positive between the organizational climate factors and success of the project. It
should be noted here that the dependent variable in the equations are strongly correlated with
most of the independent variables. These findings align with many previous researches done in
the same domain. The four factors of risk; SRS variability [15] [125] [133], team composition
[15] [17] [42] [153], control processes [58] [59] [206] and dependability [41] [142] [154]
negatively affect the success of the project. The more is the variability in the requirement, the
more is the chance of the project getting delayed or failed. Similarly, if there is no commitment
from the project team, there is high attrition in the team, there is insufficient testing, the subject
matter expert is not available or there is too much dependency on the third party the chances of
the project getting delayed or failed increases.
While, on the other hand the organizational climate dimensions positively correlates with the
success of the project. These findings align with many previous researches done in the same
Risk and Organizational Climate Dimensions Success of the Project
SRS Variability Risk -0.4647**
Team Composition Risk -0.4347**
Control Processes Risk -0.2717**
Dependability Risk -0.4493**
Climate of High standard of work tasks 0.3009**
Climate of Effective supervision 0.0162NS
Climate of Intrinsic fulfilment 0.2186**
Climate of Role clarity 0.2313**
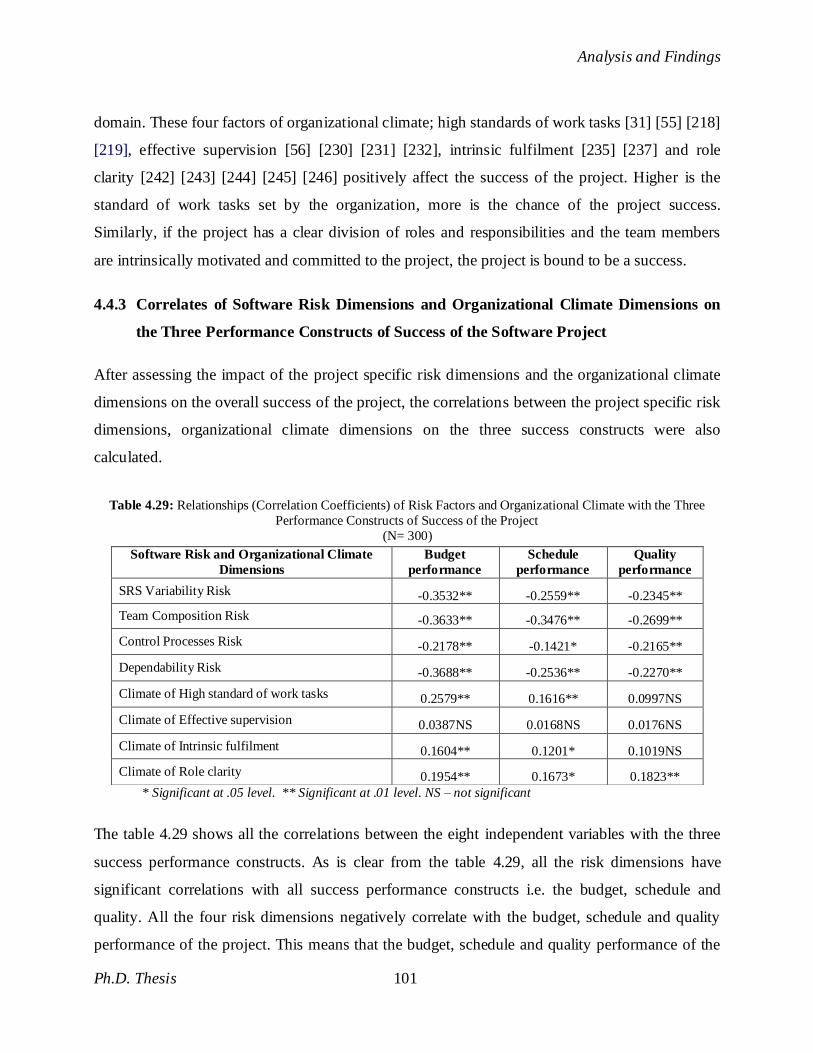
Analysis and Findings
Ph.D. Thesis 101
domain. These four factors of organizational climate; high standards of work tasks [31] [55] [218]
[219], effective supervision [56] [230] [231] [232], intrinsic fulfilment [235] [237] and role
clarity [242] [243] [244] [245] [246] positively affect the success of the project. Higher is the
standard of work tasks set by the organization, more is the chance of the project success.
Similarly, if the project has a clear division of roles and responsibilities and the team members
are intrinsically motivated and committed to the project, the project is bound to be a success.
4.4.3 Correlates of Software Risk Dimensions and Organizational Climate Dimensions on
the Three Performance Constructs of Success of the Software Project
After assessing the impact of the project specific risk dimensions and the organizational climate
dimensions on the overall success of the project, the correlations between the project specific risk
dimensions, organizational climate dimensions on the three success constructs were also
calculated.
Table 4.29: Relationships (Correlation Coefficients) of Risk Factors and Organizational Climate with the Three
Performance Constructs of Success of the Project
(N= 300)
* Significant at .05 level. ** Significant at .01 level. NS – not significant
The table 4.29 shows all the correlations between the eight independent variables with the three
success performance constructs. As is clear from the table 4.29, all the risk dimensions have
significant correlations with all success performance constructs i.e. the budget, schedule and
quality. All the four risk dimensions negatively correlate with the budget, schedule and quality
performance of the project. This means that the budget, schedule and quality performance of the
Software Risk and Organizational Climate
Dimensions
Budget
performance
Schedule
performance
Quality
performance
SRS Variability Risk -0.3532** -0.2559** -0.2345**
Team Composition Risk -0.3633** -0.3476** -0.2699**
Control Processes Risk -0.2178** -0.1421* -0.2165**
Dependability Risk -0.3688** -0.2536** -0.2270**
Climate of High standard of work tasks 0.2579** 0.1616** 0.0997NS
Climate of Effective supervision 0.0387NS 0.0168NS 0.0176NS
Climate of Intrinsic fulfilment 0.1604** 0.1201* 0.1019NS
Climate of Role clarity 0.1954** 0.1673* 0.1823**
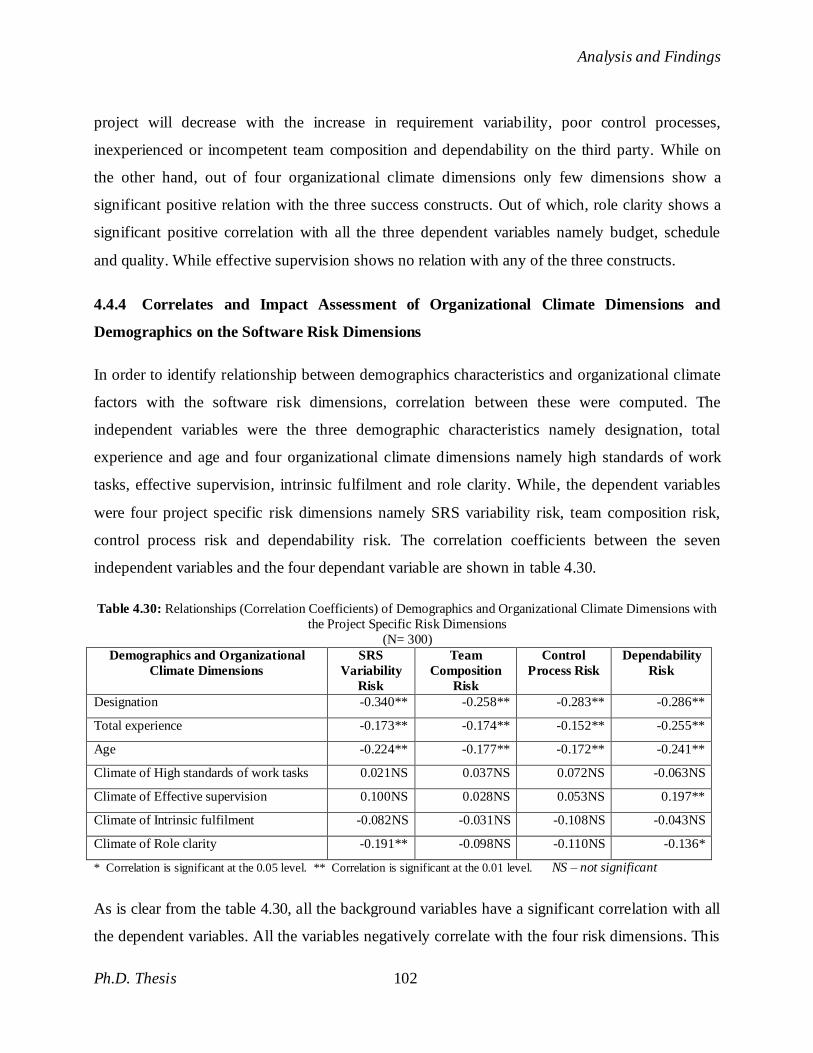
Analysis and Findings
Ph.D. Thesis 102
project will decrease with the increase in requirement variability, poor control processes,
inexperienced or incompetent team composition and dependability on the third party. While on
the other hand, out of four organizational climate dimensions only few dimensions show a
significant positive relation with the three success constructs. Out of which, role clarity shows a
significant positive correlation with all the three dependent variables namely budget, schedule
and quality. While effective supervision shows no relation with any of the three constructs.
4.4.4 Correlates and Impact Assessment of Organizational Climate Dimensions and
Demographics on the Software Risk Dimensions
In order to identify relationship between demographics characteristics and organizational climate
factors with the software risk dimensions, correlation between these were computed. The
independent variables were the three demographic characteristics namely designation, total
experience and age and four organizational climate dimensions namely high standards of work
tasks, effective supervision, intrinsic fulfilment and role clarity. While, the dependent variables
were four project specific risk dimensions namely SRS variability risk, team composition risk,
control process risk and dependability risk. The correlation coefficients between the seven
independent variables and the four dependant variable are shown in table 4.30.
Table 4.30: Relationships (Correlation Coefficients) of Demographics and Organizational Climate Dimensions with
the Project Specific Risk Dimensions
(N= 300)
Demographics and Organizational
Climate Dimensions
SRS
Variability
Risk
Team
Composition
Risk
Control
Process Risk
Dependability
Risk
Designation -0.340** -0.258** -0.283** -0.286**
Total experience -0.173** -0.174** -0.152** -0.255**
Age -0.224** -0.177** -0.172** -0.241**
Climate of High standards of work tasks 0.021NS 0.037NS 0.072NS -0.063NS
Climate of Effective supervision 0.100NS 0.028NS 0.053NS 0.197**
Climate of Intrinsic fulfilment -0.082NS -0.031NS -0.108NS -0.043NS
Climate of Role clarity -0.191** -0.098NS -0.110NS -0.136*
* Correlation is significant at the 0.05 level. ** Correlation is significant at the 0.01 level. NS – not significant
As is clear from the table 4.30, all the background variables have a significant correlation with all
the dependent variables. All the variables negatively correlate with the four risk dimensions. This
Analysis and Findings
Ph.D. Thesis 103
means that the perception about the risks greatly vary as the employees move ahead in their
career and gain more experience. A negative correlation indicates that the project managers and
senior project managers with an experience of 11-15 years perceive these risk factors as having
less impact on the success than perceived by the project leads with an experience of 4 -7 years.
While on the other hand, out of four organizational climate dimensions only few dimensions
show a significant relation with the four risk dimensions. Role clarity shows a significant
negative correlation with two dimensions of risk namely SRS variability risk, and dependability
risk while effective supervision show a significant positive correlation with one dimension, that is
dependability risk.
4.5 SECTION IV
After calculating the correlates and determinants of the overall success and the three performance
constructs and four risk dimensions the next section details out the regression process carried out
to test the hypothesis.
A) To test the relation of the organizational climate dimensions and demographic characteristics
with software risk dimensions following hypotheses were formulated.
Hypothesis related to SRS variability risk
H1a. The demographic characteristics and the organizational climate dimensions affect the
SRS variability risk.
Hypothesis related to Team composition risk
H1b. The demographic characteristics and the organizational climate dimensions affect the
team composition risk.
Hypothesis related to Control processes risk
H1c. The demographic characteristics and the organizational climate dimensions affect the
control process risk.
Analysis and Findings
Ph.D. Thesis 104
Hypothesis related to the Dependability risk
H1d. The demographic characteristics and the organizational climate dimensions affect the
dependability risk.
B) To test the relation of the organizational climate dimensions and software risk dimensions
characteristics with the overall success and three performance constructs following
hypotheses were formulated.
Hypothesis related to the overall success of the project
H2. The organizational climate and project specific risk dimensions affect the overall success
of the software projects.
Hypothesis related to the budget performance of the project
H3. The organizational climate and project specific risk dimensions affect the budget
performance of the software projects.
Hypothesis related to the schedule performance of the project
H4. The organizational climate and project specific risk dimensions affect the schedule
performance of the software projects.
Hypothesis related to the quality performance of the project
H5. The organizational climate and project specific risk dimensions affect the quality
performance of the software projects.
4.5.1 Regression Model for Predicting the Affect of Organizational Climate Dimensions and
Demographic Characteristics on the Software Risk Dimensions
This section works out the regression model of the demographics and organizational climate
dimensions that impact the project specific software risk dimensions. It considers the regression
equation in the model and examines the strength of the independent variables in predicting the
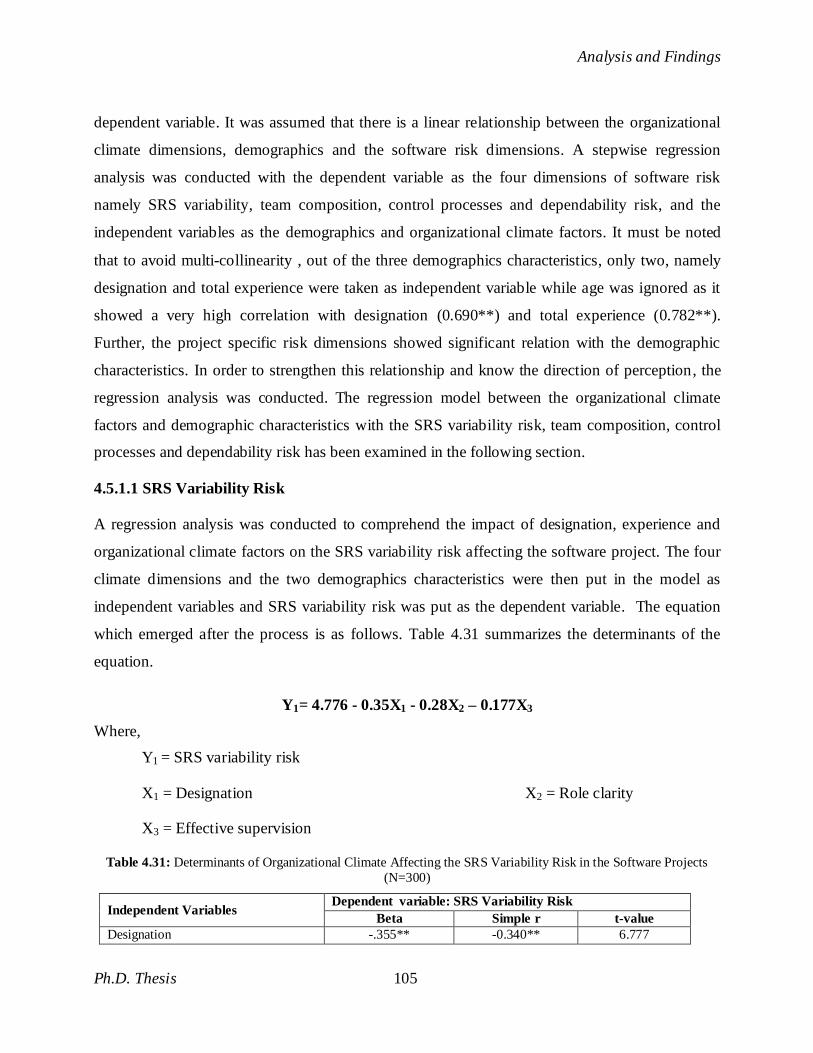
Analysis and Findings
Ph.D. Thesis 105
dependent variable. It was assumed that there is a linear relationship between the organizational
climate dimensions, demographics and the software risk dimensions. A stepwise regression
analysis was conducted with the dependent variable as the four dimensions of software risk
namely SRS variability, team composition, control processes and dependability risk, and the
independent variables as the demographics and organizational climate factors. It must be noted
that to avoid multi-collinearity , out of the three demographics characteristics, only two, namely
designation and total experience were taken as independent variable while age was ignored as it
showed a very high correlation with designation (0.690**) and total experience (0.782**).
Further, the project specific risk dimensions showed significant relation with the demographic
characteristics. In order to strengthen this relationship and know the direction of perception, the
regression analysis was conducted. The regression model between the organizational climate
factors and demographic characteristics with the SRS variability risk, team composition, control
processes and dependability risk has been examined in the following section.
4.5.1.1 SRS Variability Risk
A regression analysis was conducted to comprehend the impact of designation, experience and
organizational climate factors on the SRS variability risk affecting the software project. The four
climate dimensions and the two demographics characteristics were then put in the model as
independent variables and SRS variability risk was put as the dependent variable. The equation
which emerged after the process is as follows. Table 4.31 summarizes the determinants of the
equation.
Y1= 4.776 - 0.35X1 - 0.28X2 – 0.177X3
Where,
Y1 = SRS variability risk
X1 = Designation X2 = Role clarity
X3 = Effective supervision
Table 4.31: Determinants of Organizational Climate Affecting the SRS Variability Risk in the Software Projects
(N=300)
Independent Variables Dependent variable: SRS Variability Risk
Beta Simple r t-value
Designation -.355** -0.340** 6.777
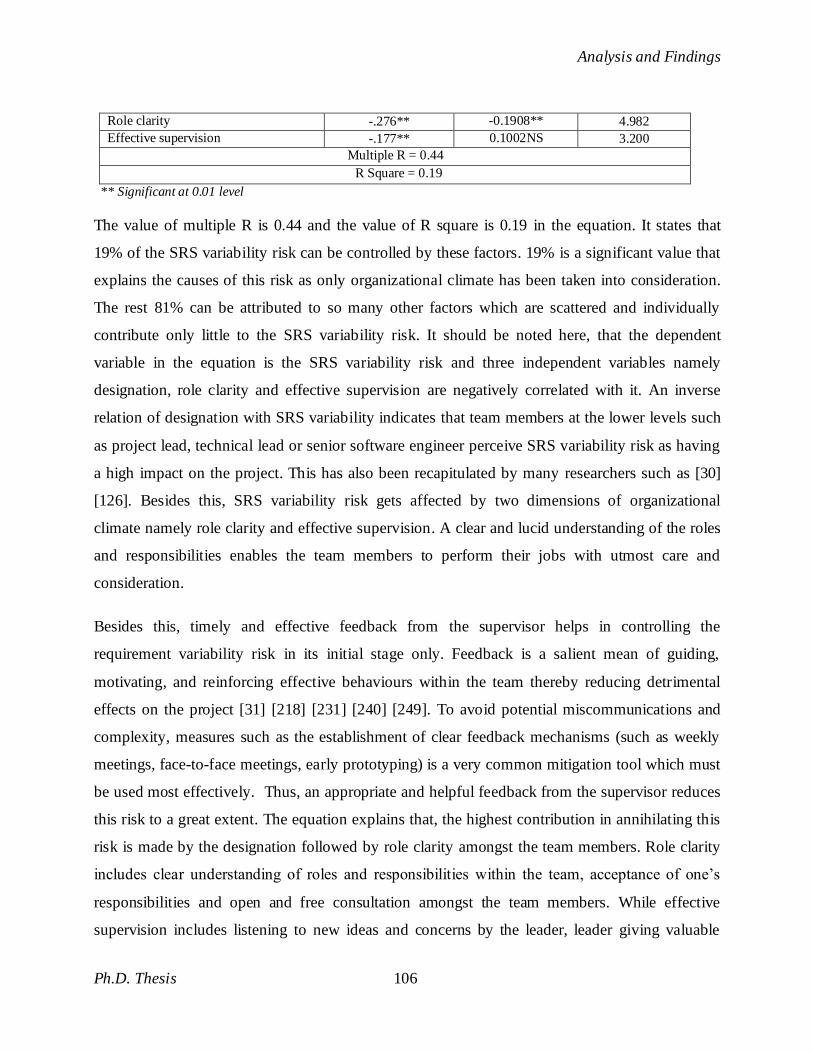
Analysis and Findings
Ph.D. Thesis 106
Role clarity -.276** -0.1908** 4.982
Effective supervision -.177** 0.1002NS 3.200
Multiple R = 0.44
R Square = 0.19
** Significant at 0.01 level
The value of multiple R is 0.44 and the value of R square is 0.19 in the equation. It states that
19% of the SRS variability risk can be controlled by these factors. 19% is a significant value that
explains the causes of this risk as only organizational climate has been taken into consideration.
The rest 81% can be attributed to so many other factors which are scattered and individually
contribute only little to the SRS variability risk. It should be noted here, that the dependent
variable in the equation is the SRS variability risk and three independent variables namely
designation, role clarity and effective supervision are negatively correlated with it. An inverse
relation of designation with SRS variability indicates that team members at the lower levels such
as project lead, technical lead or senior software engineer perceive SRS variability risk as having
a high impact on the project. This has also been recapitulated by many researchers such as [30]
[126]. Besides this, SRS variability risk gets affected by two dimensions of organizational
climate namely role clarity and effective supervision. A clear and lucid understanding of the roles
and responsibilities enables the team members to perform their jobs with utmost care and
consideration.
Besides this, timely and effective feedback from the supervisor helps in controlling the
requirement variability risk in its initial stage only. Feedback is a salient mean of guiding,
motivating, and reinforcing effective behaviours within the team thereby reducing detrimental
effects on the project [31] [218] [231] [240] [249]. To avoid potential miscommunications and
complexity, measures such as the establishment of clear feedback mechanisms (such as weekly
meetings, face-to-face meetings, early prototyping) is a very common mitigation tool which must
be used most effectively. Thus, an appropriate and helpful feedback from the supervisor reduces
this risk to a great extent. The equation explains that, the highest contribution in annihilating this
risk is made by the designation followed by role clarity amongst the team members. Role clarity
includes clear understanding of roles and responsibilities within the team, acceptance of one‘s
responsibilities and open and free consultation amongst the team members. While effective
supervision includes listening to new ideas and concerns by the leader, leader giving valuable
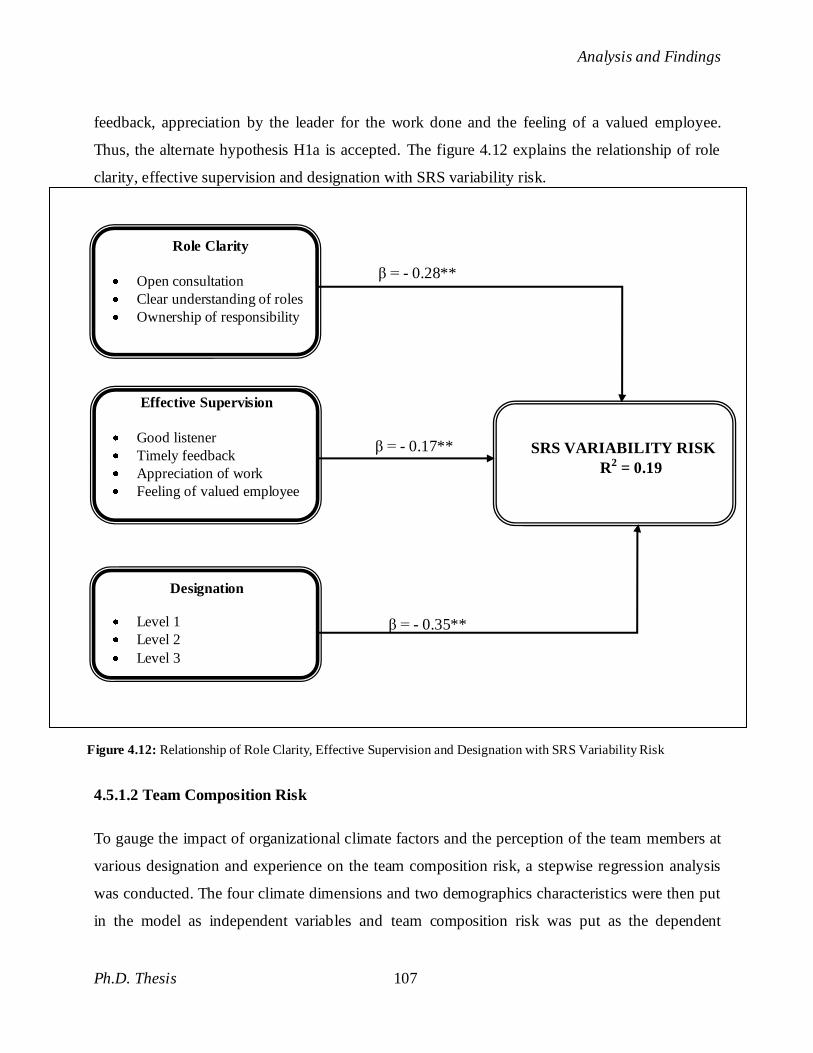
Analysis and Findings
Ph.D. Thesis 107
feedback, appreciation by the leader for the work done and the feeling of a valued employee.
Thus, the alternate hypothesis H1a is accepted. The figure 4.12 explains the relationship of role
clarity, effective supervision and designation with SRS variability risk.
4.5.1.2 Team Composition Risk
To gauge the impact of organizational climate factors and the perception of the team members at
various designation and experience on the team composition risk, a stepwise regression analysis
was conducted. The four climate dimensions and two demographics characteristics were then put
in the model as independent variables and team composition risk was put as the dependent
Role Clarity
Open consultation
Clear understanding of roles
Ownership of responsibility
Effective Supervision
Good listener
Timely feedback
Appreciation of work
Feeling of valued employee
Designation
Level 1
Level 2
Level 3
SRS VARIABILITY RISK
R2 = 0.19
β = - 0.28**
β = - 0.17**
β = - 0.35**
Figure 4.12: Relationship of Role Clarity, Effective Supervision and Designation with SRS Variability Risk
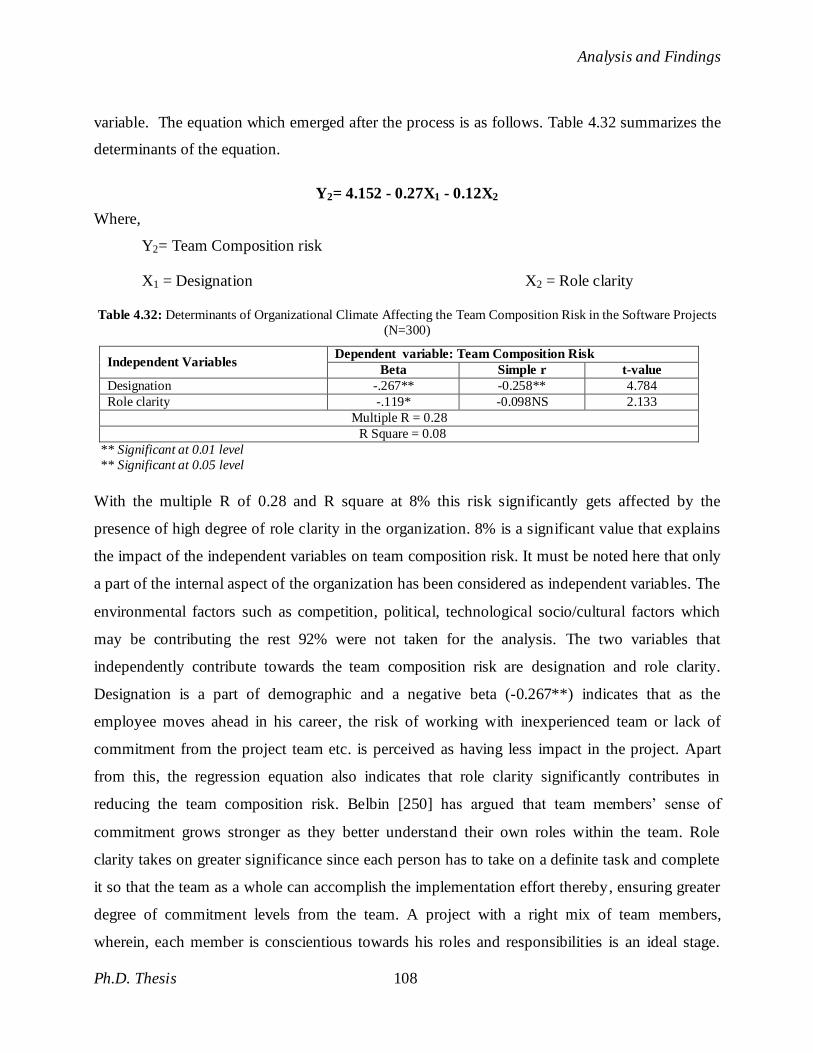
Analysis and Findings
Ph.D. Thesis 108
variable. The equation which emerged after the process is as follows. Table 4.32 summarizes the
determinants of the equation.
Y2= 4.152 - 0.27X1 - 0.12X2
Where,
Y2= Team Composition risk
X1 = Designation X2 = Role clarity
Table 4.32: Determinants of Organizational Climate Affecting the Team Composition Risk in the Software Projects
(N=300)
Independent Variables Dependent variable: Team Composition Risk
Beta Simple r t-value
Designation -.267** -0.258** 4.784
Role clarity -.119* -0.098NS 2.133
Multiple R = 0.28
R Square = 0.08
** Significant at 0.01 level
** Significant at 0.05 level
With the multiple R of 0.28 and R square at 8% this risk significantly gets affected by the
presence of high degree of role clarity in the organization. 8% is a significant value that explains
the impact of the independent variables on team composition risk. It must be noted here that only
a part of the internal aspect of the organization has been considered as independent variables. The
environmental factors such as competition, political, technological socio/cultural factors which
may be contributing the rest 92% were not taken for the analysis. The two variables that
independently contribute towards the team composition risk are designation and role clarity.
Designation is a part of demographic and a negative beta (-0.267**) indicates that as the
employee moves ahead in his career, the risk of working with inexperienced team or lack of
commitment from the project team etc. is perceived as having less impact in the project. Apart
from this, the regression equation also indicates that role clarity significantly contributes in
reducing the team composition risk. Belbin [250] has argued that team members‘ sense of
commitment grows stronger as they better understand their own roles within the team. Role
clarity takes on greater significance since each person has to take on a definite task and complete
it so that the team as a whole can accomplish the implementation effort thereby, ensuring greater
degree of commitment levels from the team. A project with a right mix of team members,
wherein, each member is conscientious towards his roles and responsibilities is an ideal stage.
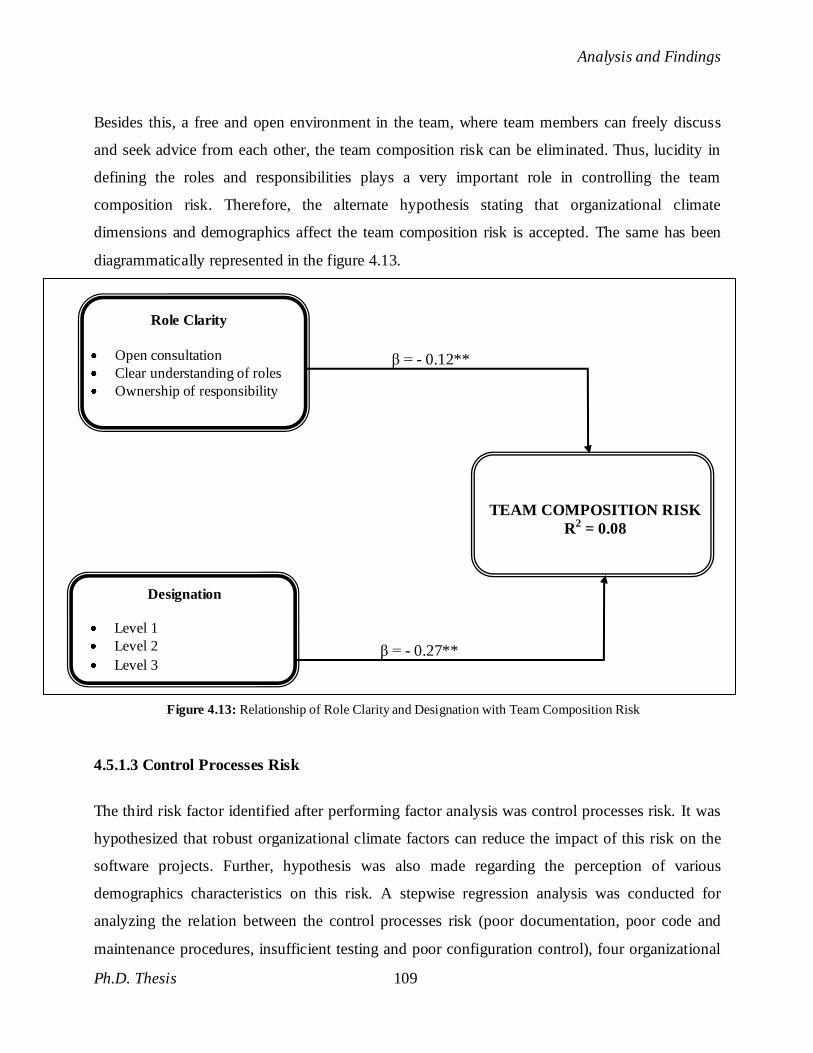
Analysis and Findings
Ph.D. Thesis 109
Besides this, a free and open environment in the team, where team members can freely discuss
and seek advice from each other, the team composition risk can be eliminated. Thus, lucidity in
defining the roles and responsibilities plays a very important role in controlling the team
composition risk. Therefore, the alternate hypothesis stating that organizational climate
dimensions and demographics affect the team composition risk is accepted. The same has been
diagrammatically represented in the figure 4.13.
4.5.1.3 Control Processes Risk
The third risk factor identified after performing factor analysis was control processes risk. It was
hypothesized that robust organizational climate factors can reduce the impact of this risk on the
software projects. Further, hypothesis was also made regarding the perception of various
demographics characteristics on this risk. A stepwise regression analysis was conducted for
analyzing the relation between the control processes risk (poor documentation, poor code and
maintenance procedures, insufficient testing and poor configuration control), four organizational
Role Clarity
Open consultation
Clear understanding of roles
Ownership of responsibility
Designation
Level 1
Level 2
Level 3
TEAM COMPOSITION RISK
R2 = 0.08
β = - 0.12**
β = - 0.27**
Figure 4.13: Relationship of Role Clarity and Designation with Team Composition Risk
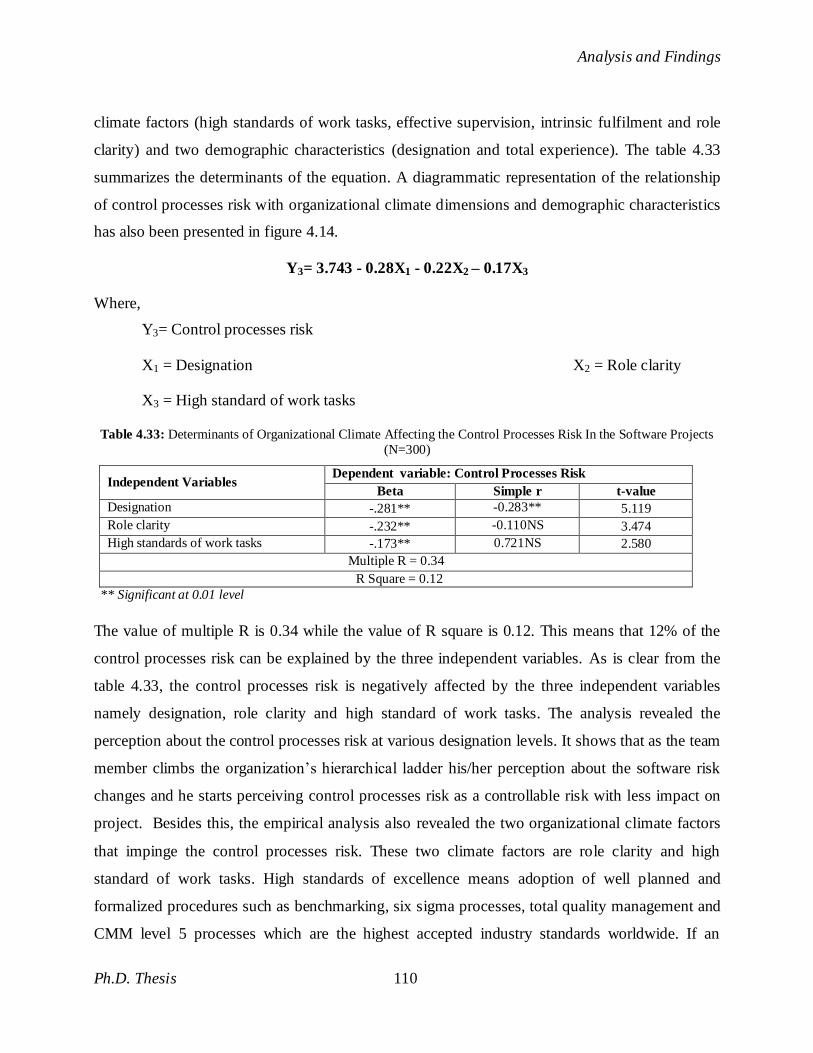
Analysis and Findings
Ph.D. Thesis 110
climate factors (high standards of work tasks, effective supervision, intrinsic fulfilment and role
clarity) and two demographic characteristics (designation and total experience). The table 4.33
summarizes the determinants of the equation. A diagrammatic representation of the relationship
of control processes risk with organizational climate dimensions and demographic characteristics
has also been presented in figure 4.14.
Y3= 3.743 - 0.28X1 - 0.22X2 – 0.17X3
Where,
Y3= Control processes risk
X1 = Designation X2 = Role clarity
X3 = High standard of work tasks
Table 4.33: Determinants of Organizational Climate Affecting the Control Processes Risk In the Software Projects
(N=300)
Independent Variables Dependent variable: Control Processes Risk
Beta Simple r t-value
Designation -.281** -0.283** 5.119
Role clarity -.232** -0.110NS 3.474
High standards of work tasks -.173** 0.721NS 2.580
Multiple R = 0.34
R Square = 0.12
** Significant at 0.01 level
The value of multiple R is 0.34 while the value of R square is 0.12. This means that 12% of the
control processes risk can be explained by the three independent variables. As is clear from the
table 4.33, the control processes risk is negatively affected by the three independent variables
namely designation, role clarity and high standard of work tasks. The analysis revealed the
perception about the control processes risk at various designation levels. It shows that as the team
member climbs the organization‘s hierarchical ladder his/her perception about the software risk
changes and he starts perceiving control processes risk as a controllable risk with less impact on
project. Besides this, the empirical analysis also revealed the two organizational climate factors
that impinge the control processes risk. These two climate factors are role clarity and high
standard of work tasks. High standards of excellence means adoption of well planned and
formalized procedures such as benchmarking, six sigma processes, total quality management and
CMM level 5 processes which are the highest accepted industry standards worldwide. If an
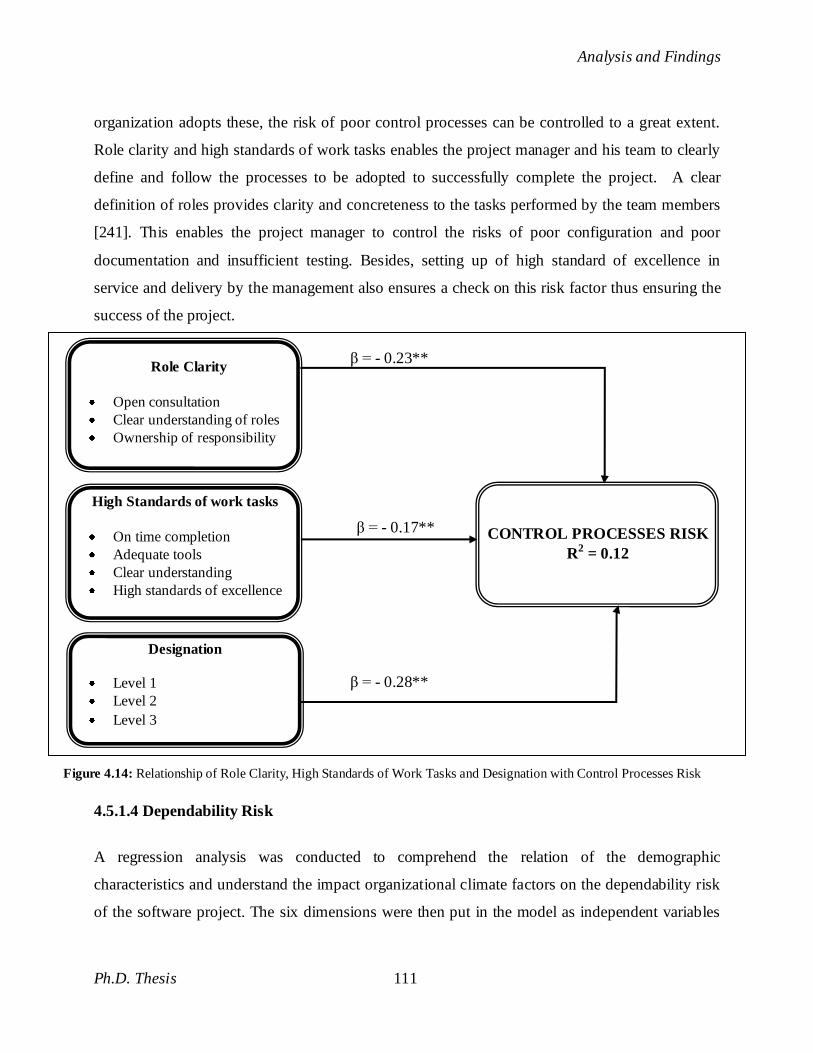
Analysis and Findings
Ph.D. Thesis 111
organization adopts these, the risk of poor control processes can be controlled to a great extent.
Role clarity and high standards of work tasks enables the project manager and his team to clearly
define and follow the processes to be adopted to successfully complete the project. A clear
definition of roles provides clarity and concreteness to the tasks performed by the team members
[241]. This enables the project manager to control the risks of poor configuration and poor
documentation and insufficient testing. Besides, setting up of high standard of excellence in
service and delivery by the management also ensures a check on this risk factor thus ensuring the
success of the project.
4.5.1.4 Dependability Risk
A regression analysis was conducted to comprehend the relation of the demographic
characteristics and understand the impact organizational climate factors on the dependability risk
of the software project. The six dimensions were then put in the model as independent variables
Role Clarity
Open consultation
Clear understanding of roles
Ownership of responsibility
High Standards of work tasks
On time completion
Adequate tools
Clear understanding
High standards of excellence
Designation
Level 1
Level 2
Level 3
CONTROL PROCESSES RISK
R2 = 0.12
β = - 0.23**
β = - 0.17**
β = - 0.28**
Figure 4.14: Relationship of Role Clarity, High Standards of Work Tasks and Designation with Control Processes Risk
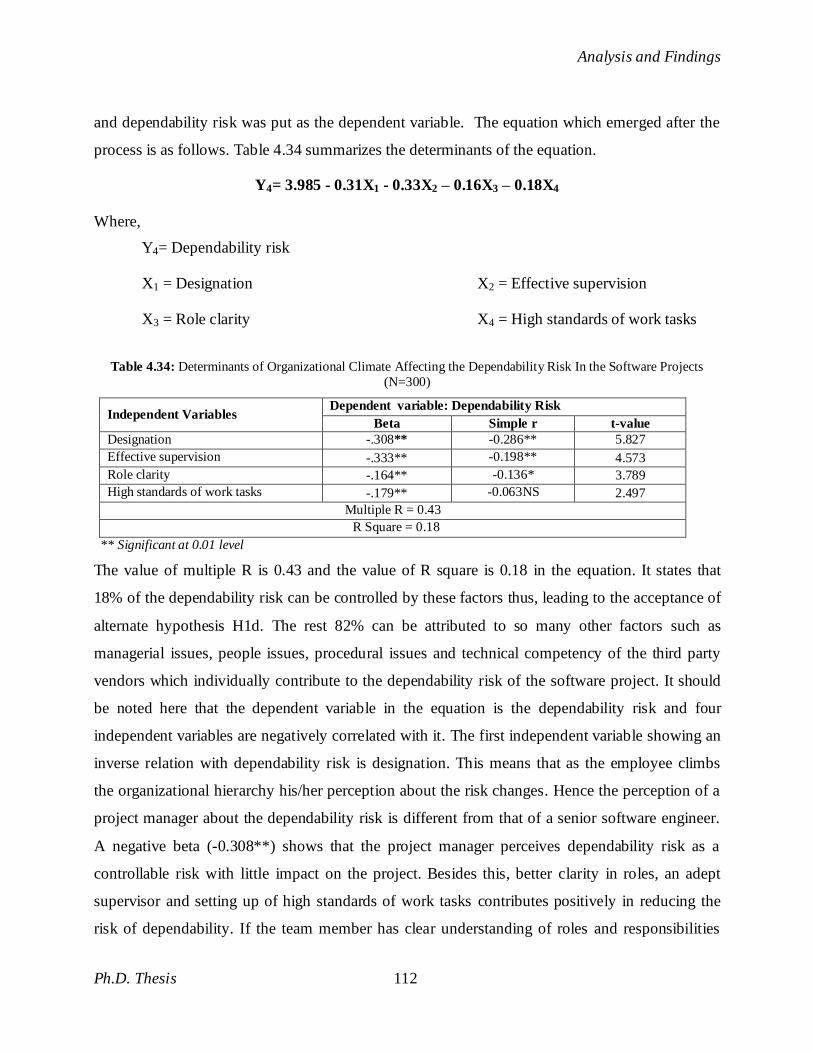
Analysis and Findings
Ph.D. Thesis 112
and dependability risk was put as the dependent variable. The equation which emerged after the
process is as follows. Table 4.34 summarizes the determinants of the equation.
Y4= 3.985 - 0.31X1 - 0.33X2 – 0.16X3 – 0.18X4
Where,
Y4= Dependability risk
X1 = Designation X2 = Effective supervision
X3 = Role clarity X4 = High standards of work tasks
Table 4.34: Determinants of Organizational Climate Affecting the Dependability Risk In the Software Projects
(N=300)
Independent Variables Dependent variable: Dependability Risk
Beta Simple r t-value
Designation -.308** -0.286** 5.827
Effective supervision -.333** -0.198** 4.573
Role clarity -.164** -0.136* 3.789
High standards of work tasks -.179** -0.063NS 2.497
Multiple R = 0.43
R Square = 0.18
** Significant at 0.01 level
The value of multiple R is 0.43 and the value of R square is 0.18 in the equation. It states that
18% of the dependability risk can be controlled by these factors thus, leading to the acceptance of
alternate hypothesis H1d. The rest 82% can be attributed to so many other factors such as
managerial issues, people issues, procedural issues and technical competency of the third party
vendors which individually contribute to the dependability risk of the software project. It should
be noted here that the dependent variable in the equation is the dependability risk and four
independent variables are negatively correlated with it. The first independent variable showing an
inverse relation with dependability risk is designation. This means that as the employee climbs
the organizational hierarchy his/her perception about the risk changes. Hence the perception of a
project manager about the dependability risk is different from that of a senior software engineer.
A negative beta (-0.308**) shows that the project manager perceives dependability risk as a
controllable risk with little impact on the project. Besides this, better clarity in roles, an adept
supervisor and setting up of high standards of work tasks contributes positively in reducing the
risk of dependability. If the team member has clear understanding of roles and responsibilities
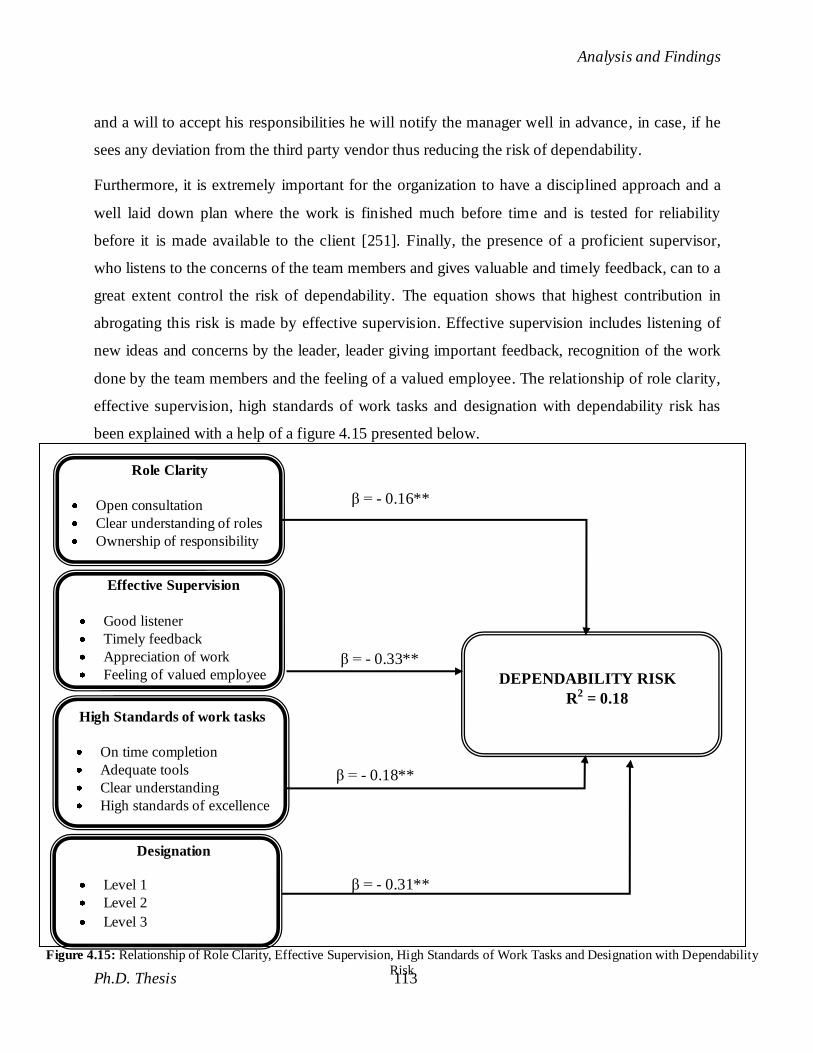
Analysis and Findings
Ph.D. Thesis 113
and a will to accept his responsibilities he will notify the manager well in advance, in case, if he
sees any deviation from the third party vendor thus reducing the risk of dependability.
Furthermore, it is extremely important for the organization to have a disciplined approach and a
well laid down plan where the work is finished much before time and is tested for reliability
before it is made available to the client [251]. Finally, the presence of a proficient supervisor,
who listens to the concerns of the team members and gives valuable and timely feedback, can to a
great extent control the risk of dependability. The equation shows that highest contribution in
abrogating this risk is made by effective supervision. Effective supervision includes listening of
new ideas and concerns by the leader, leader giving important feedback, recognition of the work
done by the team members and the feeling of a valued employee. The relationship of role clarity,
effective supervision, high standards of work tasks and designation with dependability risk has
been explained with a help of a figure 4.15 presented below.
High Standards of work tasks
On time completion
Adequate tools
Clear understanding
High standards of excellence
Role Clarity
Open consultation
Clear understanding of roles
Ownership of responsibility
Effective Supervision
Good listener
Timely feedback
Appreciation of work
Feeling of valued employee
Designation
Level 1
Level 2
Level 3
DEPENDABILITY RISK
R2 = 0.18
β = - 0.16**
β = - 0.33**
β = - 0.31**
β = - 0.18**
Figure 4.15: Relationship of Role Clarity, Effective Supervision, High Standards of Work Tasks and Designation with Dependability
Risk
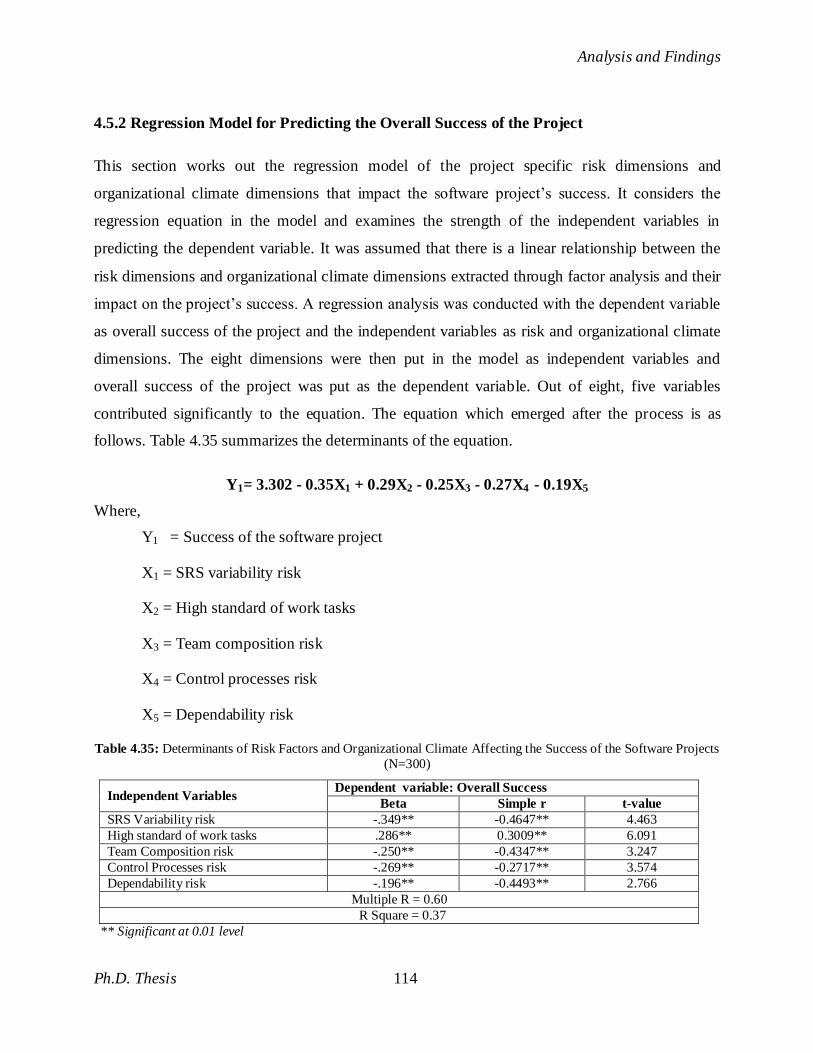
Analysis and Findings
Ph.D. Thesis 114
4.5.2 Regression Model for Predicting the Overall Success of the Project
This section works out the regression model of the project specific risk dimensions and
organizational climate dimensions that impact the software project‘s success. It considers the
regression equation in the model and examines the strength of the independent variables in
predicting the dependent variable. It was assumed that there is a linear relationship between the
risk dimensions and organizational climate dimensions extracted through factor analysis and their
impact on the project‘s success. A regression analysis was conducted with the dependent variable
as overall success of the project and the independent variables as risk and organizational climate
dimensions. The eight dimensions were then put in the model as independent variables and
overall success of the project was put as the dependent variable. Out of eight, five variables
contributed significantly to the equation. The equation which emerged after the process is as
follows. Table 4.35 summarizes the determinants of the equation.
Y1= 3.302 - 0.35X1 + 0.29X2 - 0.25X3 - 0.27X4 - 0.19X5
Where,
Y1 = Success of the software project
X1 = SRS variability risk
X2 = High standard of work tasks
X3 = Team composition risk
X4 = Control processes risk
X5 = Dependability risk
Table 4.35: Determinants of Risk Factors and Organizational Climate Affecting the Success of the Software Projects
(N=300)
Independent Variables Dependent variable: Overall Success
Beta Simple r t-value
SRS Variability risk -.349** -0.4647** 4.463
High standard of work tasks .286** 0.3009** 6.091
Team Composition risk -.250** -0.4347** 3.247
Control Processes risk -.269** -0.2717** 3.574
Dependability risk -.196** -0.4493** 2.766
Multiple R = 0.60
R Square = 0.37
** Significant at 0.01 level
Analysis and Findings
Ph.D. Thesis 115
The value of multiple R is 0.60 and the value of R square is 0.37 in the equation. It states that
37% of the project success gets affected by these factors. As is clear from the table 4.35, the
probability of project‘s success reduces due to variability in requirement gathering, low morale
and high attrition in the team, poor documentation and control and finally too much dependability
on third party. While the probability of success of the project increases with setting up high
standards of work tasks. Thus, the hypothesis H2 is accepted. However, it should be noted here,
that the dependent variable in the equation is the overall success of the software project and four
independent variables are negatively correlated with it while one is positively correlated. That
means the pessimistic dimensions like SRS variability risk, team composition risk, control
processes risk and dependability risk are negatively correlated and negatively affect the success
of the software project. While positive dimensions like high standards of work tasks are
positively correlated and contribute positively to the success of the software project. The equation
explains that highest contribution to delay in project is made by the variability in the requirement
gathering and this includes conflicting and continuous requirement changes, inaccurate
requirement analysis, miscommunication of requirements etc. Similarly poor team composition
which includes lack of availability of domain expert, working with inexperienced team, team
diversity, lack of commitment from the project team, also contribute to the delay or failure of the
software project. Only one factor contributes positively to the success of the project i.e. high
standard of work tasks. All these factors have been discussed below:
SRS variability risk
It is a well known fact that variability in requirement gathering and analysis impacts the success
of the project to an extent that it can lead to a complete failure of the project. With a beta value of
0.35 and a correlation coefficient of 0.46, significant at 0.01 level, this factor impacts
significantly and quite largely on the success of the project. This is quite evident from the fact,
that the entire project is dependent on the correct set of requirements and any miscommunication,
misunderstanding or error can prove fatal to the project. Another important point that needs a
mention here is the ability of the project manager to make correct estimation of budget, schedule,
human resource requirements etc. Any error in estimation can prove extremely deadly during the
later stages of the project when both the budget and schedule are at stake. One risk which is
peculiar to the Indian software industry is the delay in resourcing and recruitment. Many project
Analysis and Findings
Ph.D. Thesis 116
managers highlighted in the interview, that they were forced to start the project without any team,
which is very surprising. This of course, limits the ability of the project manager in correctly
estimating the schedule and budget as he is not even aware of the nature of team with whom he
has to work.
High standard of work tasks
This factor with a beta coefficient of 0.29 and a correlation coefficient of 0.31, significant at 0.01
level, also emerged as an imperative determinant of success of the software project. Availability
of adequate tools and technologies, a well defined work breakdown structure and sufficient and
clear understanding of work tasks enables the team to perform their best. This is also evident
from the fact that clear and robust understanding of what is expected from the team members will
improve their productivity and the ability to deliver the project modules on time, while
simultaneously reducing the wastage of time, resources and duplication of work. This will not
only certify the success of the project but will also ensure a satisfied customer.
Team composition risk
The variable that negatively correlates with the success of the project is the team composition.
With a beta value of 0.25 and a negative correlate coefficient of 0.43, significant at 0.01 level,
team composition emerged as a very important variable that impacts the success of the software
project. It is an assortment of inexperienced team, low morale, lack of availability of subject
matter expert, lack of commitment from team and top management. This independent variable is
bound to affect the success of the project because if the team is not good no matter how accurate
the estimation and requirement gathering has been done the project is bound to get delayed or
failed. This is quite evident from the fact, that the project is a result of human endeavour and if
the efforts are not applied in correct manner by the right resources with a right attitude and frame
of mind, the project is bound to get affected.
Control processes risk
Yet, another important factor that affects the success of the project is improper control processes.
The beta value of this variable is 0.26 with a negative correlate coefficient of 0.27 with the
success of the project. Control processes encompass poor documentation, insufficient testing and
Analysis and Findings
Ph.D. Thesis 117
poor configuration control. Although most of the variables of this risk factor come later in the
project but have a surmountable effect on the delivery of the project. Skipping the testing phase
because the project is way behind schedule has been observed as a very common practice among
the software professionals. Moreover, most of the Indian software professionals have not been
exposed to proper technical documentation training. As a result, even when a good code is
written, without proper explanation it fails to satisfy the client and results in the delay of the
project, thus, affecting its success.
Dependability risk
The last independent variable that negatively affects the success of the software project is
dependability. With a beta value of 0.16 and a negative correlation of 0.45 this risk factors plays a
dominant role in reducing the chances of success of the project. Whenever the team rely upon
third-party tools or systems to make their applications work, they are putting the customer‘s
perception of the quality of their product into someone else‘s hands. Most often it has been
observed, that many of these third-party components are the cause for the customer‘s
dissatisfaction. Not only this, maintenance nightmares, security woes and installation pain are all
associated with third party association. The entire problem of third party arises when the project
team fails to meet the desired specifications set by client either due to lack of availability of
subject matter expert or unavailability of licensed software or hardware. Whatever may be the
cause, this risk definitely adds a pessimistic dimension to the success of the project.
The figure 4.16, elucidates the determinants of success in form of a diagrammatic relationship.
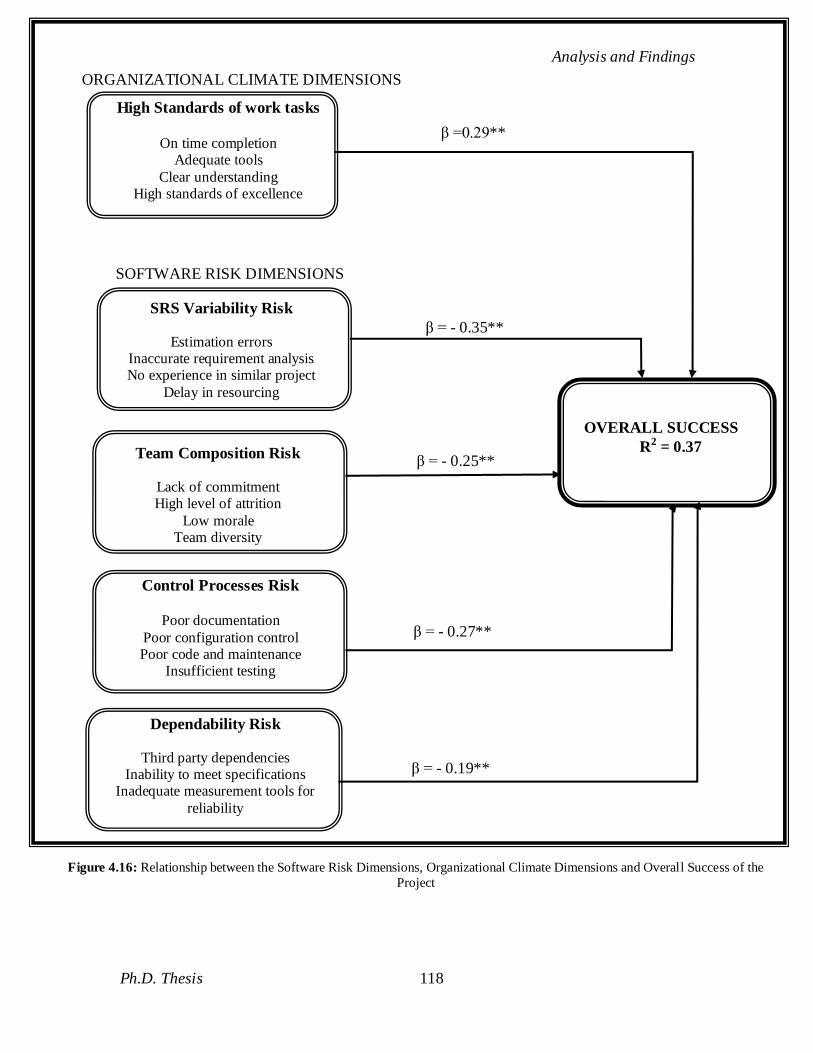
Analysis and Findings
Ph.D. Thesis 118
OVERALL SUCCESS
R2 = 0.37
SRS Variability Risk
Estimation errors Inaccurate requirement analysis No experience in similar project
Delay in resourcing
Team Composition Risk
Lack of commitment High level of attrition
Low morale Team diversity
Control Processes Risk
Poor documentation
Poor configuration control Poor code and maintenance
Insufficient testing
Dependability Risk
Third party dependencies Inability to meet specifications
Inadequate measurement tools for
reliability
Figure 4.16: Relationship between the Software Risk Dimensions, Organizational Climate Dimensions and Overall Success of the
Project
High Standards of work tasks
On time completion
Adequate tools
Clear understanding High standards of excellence
β =0.29**
β = - 0.35**
β = - 0.25**
β = - 0.27**
β = - 0.19**
ORGANIZATIONAL CLIMATE DIMENSIONS
SOFTWARE RISK DIMENSIONS
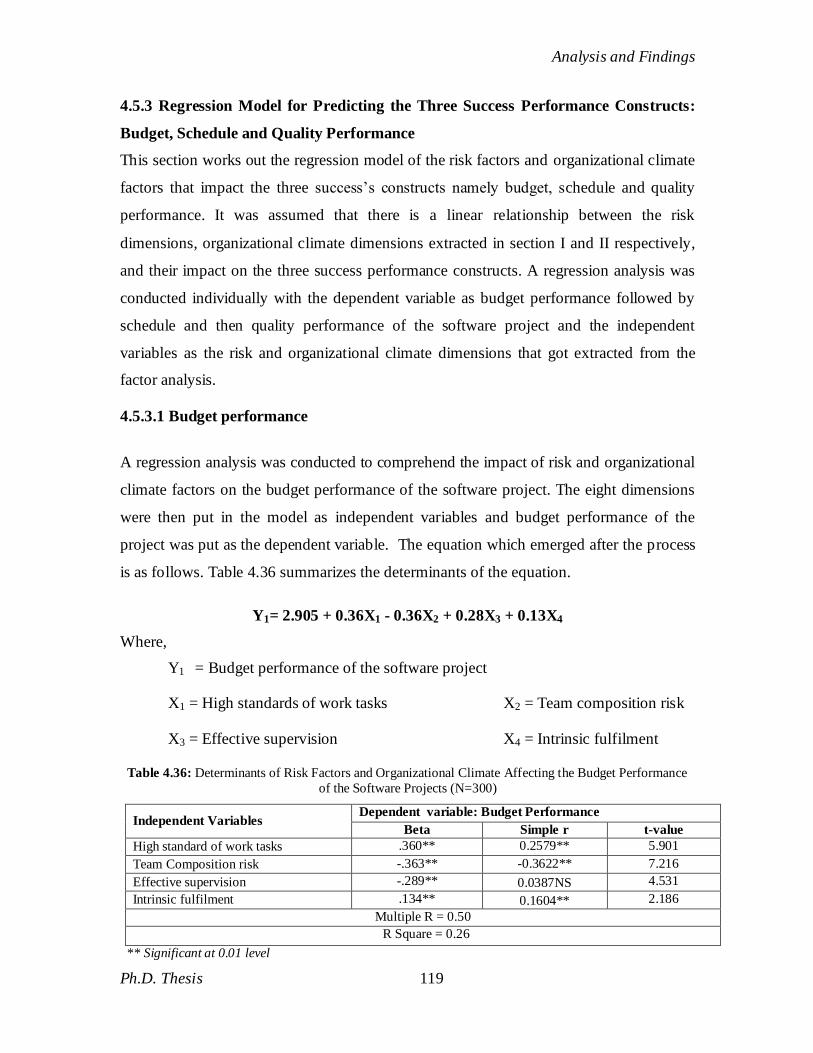
Analysis and Findings
Ph.D. Thesis 119
4.5.3 Regression Model for Predicting the Three Success Performance Constructs:
Budget, Schedule and Quality Performance
This section works out the regression model of the risk factors and organizational climate
factors that impact the three success‘s constructs namely budget, schedule and quality
performance. It was assumed that there is a linear relationship between the risk
dimensions, organizational climate dimensions extracted in section I and II respectively,
and their impact on the three success performance constructs. A regression analysis was
conducted individually with the dependent variable as budget performance followed by
schedule and then quality performance of the software project and the independent
variables as the risk and organizational climate dimensions that got extracted from the
factor analysis.
4.5.3.1 Budget performance
A regression analysis was conducted to comprehend the impact of risk and organizational
climate factors on the budget performance of the software project. The eight dimensions
were then put in the model as independent variables and budget performance of the
project was put as the dependent variable. The equation which emerged after the process
is as follows. Table 4.36 summarizes the determinants of the equation.
Y1= 2.905 + 0.36X1 - 0.36X2 + 0.28X3 + 0.13X4
Where,
Y1 = Budget performance of the software project
X1 = High standards of work tasks X2 = Team composition risk
X3 = Effective supervision X4 = Intrinsic fulfilment
Table 4.36: Determinants of Risk Factors and Organizational Climate Affecting the Budget Performance
of the Software Projects (N=300)
Independent Variables Dependent variable: Budget Performance
Beta Simple r t-value
High standard of work tasks .360** 0.2579** 5.901
Team Composition risk -.363** -0.3622** 7.216
Effective supervision -.289** 0.0387NS 4.531
Intrinsic fulfilment .134** 0.1604** 2.186
Multiple R = 0.50
R Square = 0.26
** Significant at 0.01 level
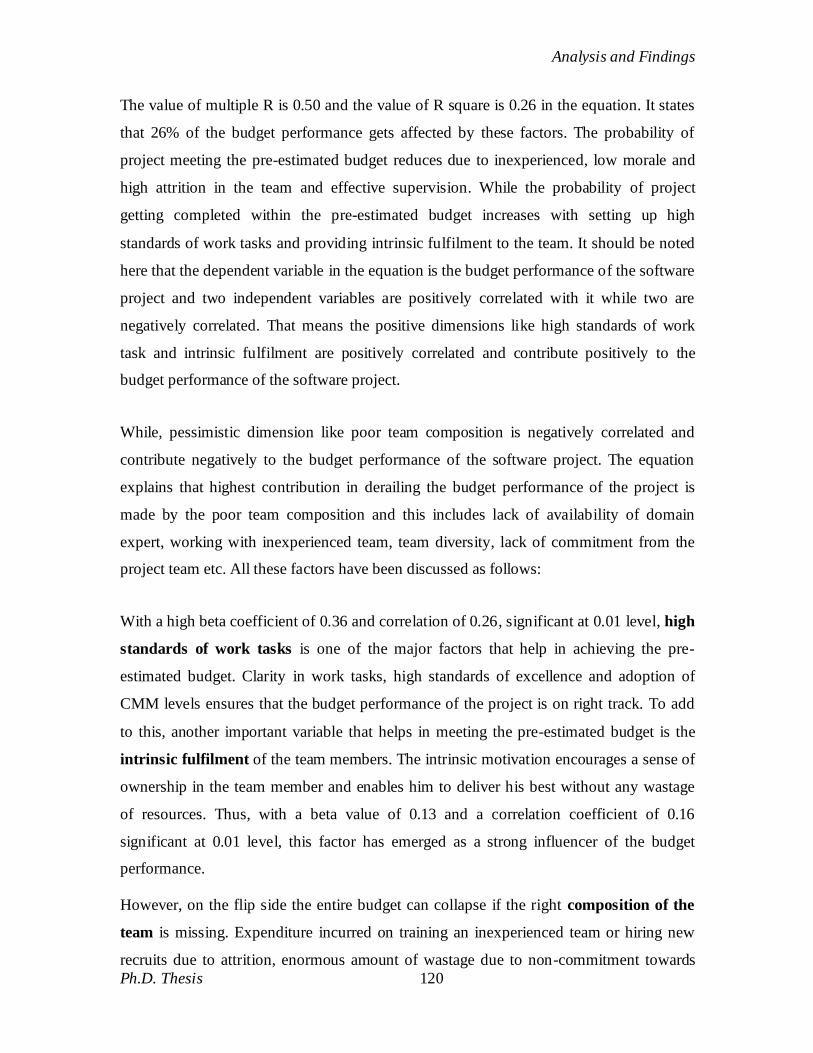
Analysis and Findings
Ph.D. Thesis 120
The value of multiple R is 0.50 and the value of R square is 0.26 in the equation. It states
that 26% of the budget performance gets affected by these factors. The probability of
project meeting the pre-estimated budget reduces due to inexperienced, low morale and
high attrition in the team and effective supervision. While the probability of project
getting completed within the pre-estimated budget increases with setting up high
standards of work tasks and providing intrinsic fulfilment to the team. It should be noted
here that the dependent variable in the equation is the budget performance of the software
project and two independent variables are positively correlated with it while two are
negatively correlated. That means the positive dimensions like high standards of work
task and intrinsic fulfilment are positively correlated and contribute positively to the
budget performance of the software project.
While, pessimistic dimension like poor team composition is negatively correlated and
contribute negatively to the budget performance of the software project. The equation
explains that highest contribution in derailing the budget performance of the project is
made by the poor team composition and this includes lack of availability of domain
expert, working with inexperienced team, team diversity, lack of commitment from the
project team etc. All these factors have been discussed as follows:
With a high beta coefficient of 0.36 and correlation of 0.26, significant at 0.01 level, high
standards of work tasks is one of the major factors that help in achieving the pre-
estimated budget. Clarity in work tasks, high standards of excellence and adoption of
CMM levels ensures that the budget performance of the project is on right track. To add
to this, another important variable that helps in meeting the pre-estimated budget is the
intrinsic fulfilment of the team members. The intrinsic motivation encourages a sense of
ownership in the team member and enables him to deliver his best without any wastage
of resources. Thus, with a beta value of 0.13 and a correlation coefficient of 0.16
significant at 0.01 level, this factor has emerged as a strong influencer of the budget
performance.
However, on the flip side the entire budget can collapse if the right composition of the
team is missing. Expenditure incurred on training an inexperienced team or hiring new
recruits due to attrition, enormous amount of wastage due to non-commitment towards
Analysis and Findings
Ph.D. Thesis 121
the projects are some of the critical points that can derail the budget of the project. One
very intriguing finding that came into light is the negative effect of effective supervision.
At the first look, it seems as oxymoron but a detailed analysis gives a completely
different picture. Constant feedback and advice from the supervisor is exceptionally good
for the project‘s quality, but too much time spent on this can actually derail the budget
construct of the project. Too much importance given to the team members concerns and
issues will result in shift in focus of the manager from the bigger picture to small
concerns. Thus, with a beta value of 0.29 this risk negatively impacts the budget
performance of the project. Therefore, the hypothesis H3 is accepted. Figure 4.17 explain
the relationship in a diagrammatic form.
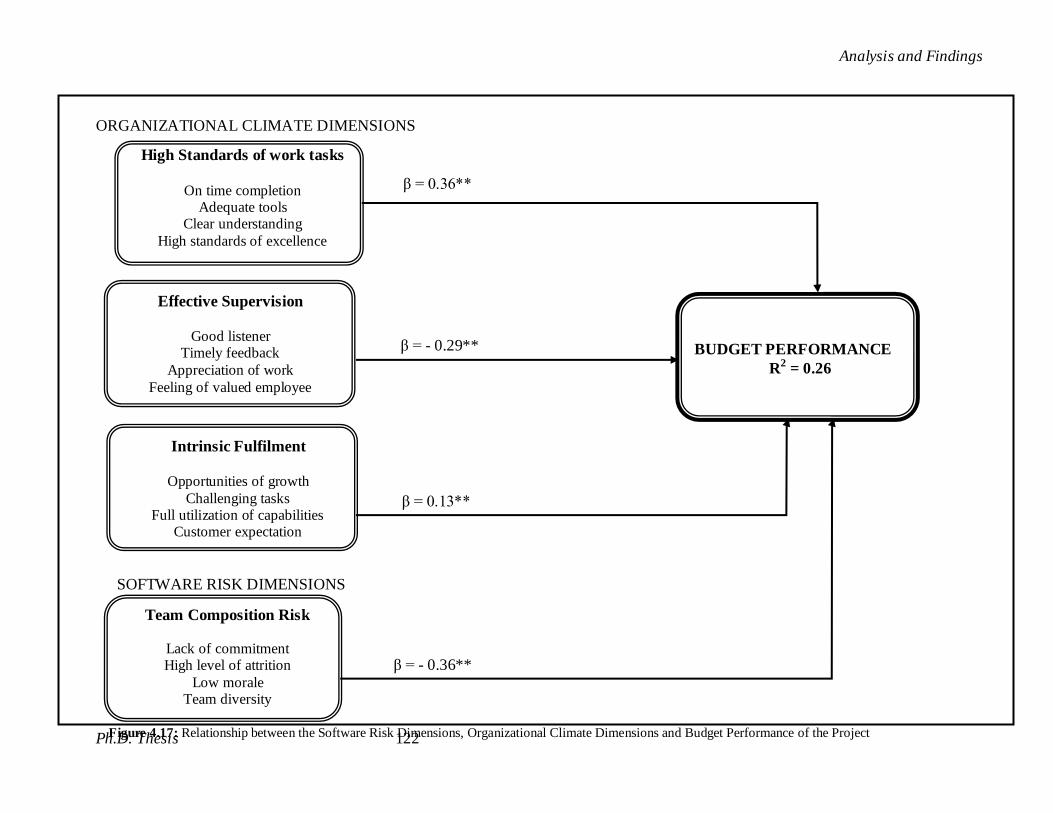
Analysis and Findings
Ph.D. Thesis 122
Figure 4.17: Relationship between the Software Risk Dimensions, Organizational Climate Dimensions and Budget Performance of the Project
BUDGET PERFORMANCE
R2 = 0.26
Team Composition Risk
Lack of commitment High level of attrition
Low morale Team diversity
High Standards of work tasks
On time completion
Adequate tools Clear understanding
High standards of excellence
ORGANIZATIONAL CLIMATE DIMENSIONS
SOFTWARE RISK DIMENSIONS
Effective Supervision
Good listener Timely feedback
Appreciation of work
Feeling of valued employee
Intrinsic Fulfilment
Opportunities of growth
Challenging tasks Full utilization of capabilities
Customer expectation
β = - 0.36**
β = 0.13**
β = 0.36**
β = - 0.29**
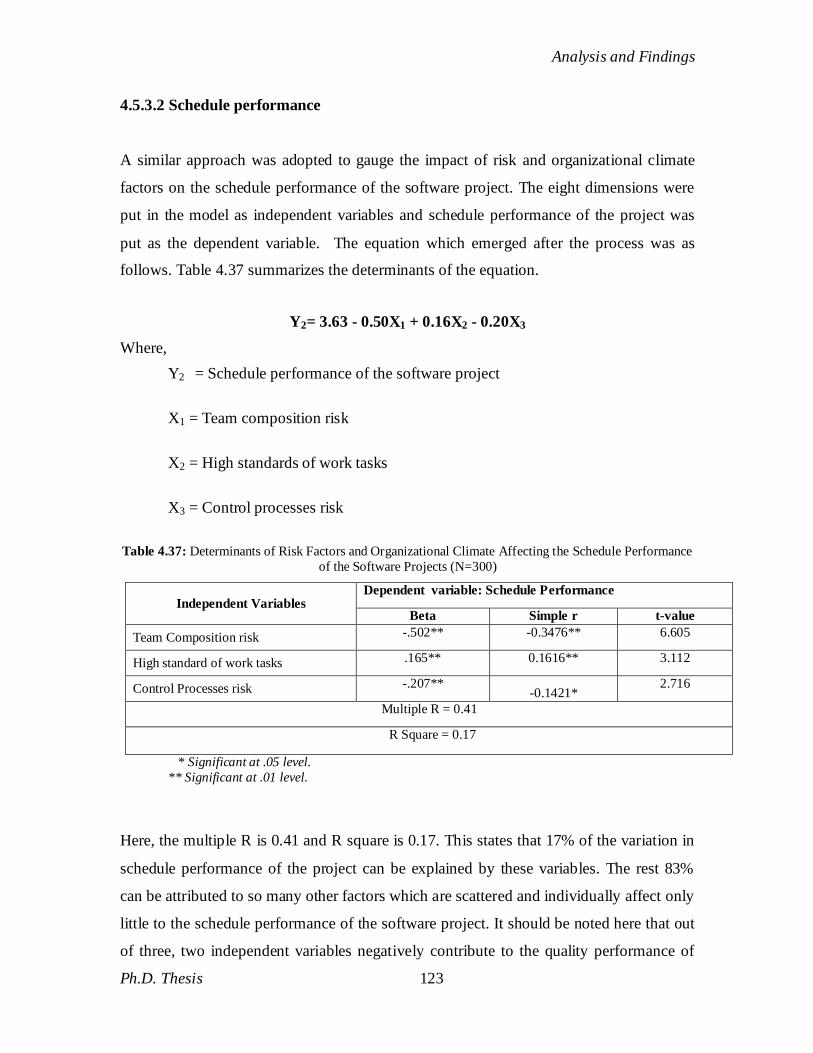
Analysis and Findings
Ph.D. Thesis 123
4.5.3.2 Schedule performance
A similar approach was adopted to gauge the impact of risk and organizational climate
factors on the schedule performance of the software project. The eight dimensions were
put in the model as independent variables and schedule performance of the project was
put as the dependent variable. The equation which emerged after the process was as
follows. Table 4.37 summarizes the determinants of the equation.
Y2= 3.63 - 0.50X1 + 0.16X2 - 0.20X3
Where,
Y2 = Schedule performance of the software project
X1 = Team composition risk
X2 = High standards of work tasks
X3 = Control processes risk
Table 4.37: Determinants of Risk Factors and Organizational Climate Affecting the Schedule Performance
of the Software Projects (N=300)
Independent Variables Dependent variable: Schedule Performance
Beta Simple r t-value
Team Composition risk -.502** -0.3476** 6.605
High standard of work tasks .165** 0.1616** 3.112
Control Processes risk -.207** -0.1421*
2.716
Multiple R = 0.41
R Square = 0.17
* Significant at .05 level.
** Significant at .01 level.
Here, the multiple R is 0.41 and R square is 0.17. This states that 17% of the variation in
schedule performance of the project can be explained by these variables. The rest 83%
can be attributed to so many other factors which are scattered and individually affect only
little to the schedule performance of the software project. It should be noted here that out
of three, two independent variables negatively contribute to the quality performance of
Analysis and Findings
Ph.D. Thesis 124
the project. While, only one independent variable contribute positively to the
performance. Inadequate and inexperienced team along with poor documentation and
inadequate testing delays the project and affects the schedule performance of the software
projects. While, setting up of high standards of work tasks assist in keeping the software
project on track and meeting the pre-estimated guidelines. The equation explains that
highest contribution in derailing the schedule performance of the project is made by the
poor team composition and this includes lack of availability of domain expert, working
with inexperienced team, team diversity, lack of commitment from the project team etc.
The independent variables are further explained below. Thus, it can be clearly seen that
the hypothesis H4 is accepted. The relationship has also been explained diagrammatically
in figure 4.18.
Team composition has once again emerged as a major contributor in off-tracking the
schedule performance of the project. With beta coefficient of 0.50 and a strong negative
correlation of 0.35 at a significance level of 0.01, this risk has emerged as a strong
detriment to the schedule performance of the project. High level of attrition and non-
availability of domain expert strongly impacts the schedule of the project to an extent that
it can lead to shutdown of the project. Besides this, poor control processes like poor
code and maintenance, poor documentation and insufficient testing also affects the
schedule of the project as it will lead to development of a software which is full of bugs
and most of the time will be spent on removing them. However, if the organization is able
to set high standards of work task with proper process and role definition this risk can
be controlled. Adoption of CMM level and PCMM levels is the right step in this
direction.
Thus, with a beta value of 0.165 and a correlation coefficient of 0.16, at 0.01 significance
level high standards of work tasks positively affects the schedule performance of the
software project.
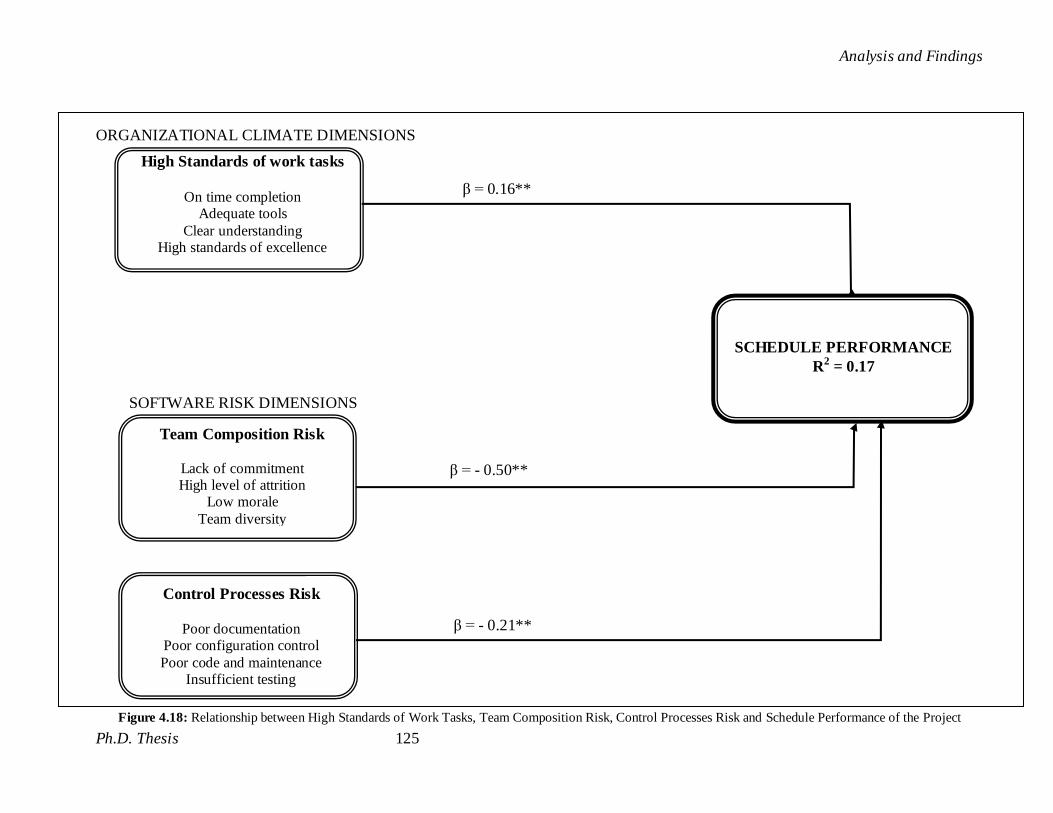
Analysis and Findings
Ph.D. Thesis 125
Figure 4.18: Relationship between High Standards of Work Tasks, Team Composition Risk, Control Processes Risk and Schedule Performance of the Project
Team Composition Risk
Lack of commitment High level of attrition
Low morale
Team diversity
Control Processes Risk
Poor documentation
Poor configuration control
Poor code and maintenance Insufficient testing
High Standards of work tasks
On time completion
Adequate tools
Clear understanding High standards of excellence
ORGANIZATIONAL CLIMATE DIMENSIONS
SOFTWARE RISK DIMENSIONS
β = 0.16**
β = - 0.50**
β = - 0.21**
SCHEDULE PERFORMANCE
R2 = 0.17
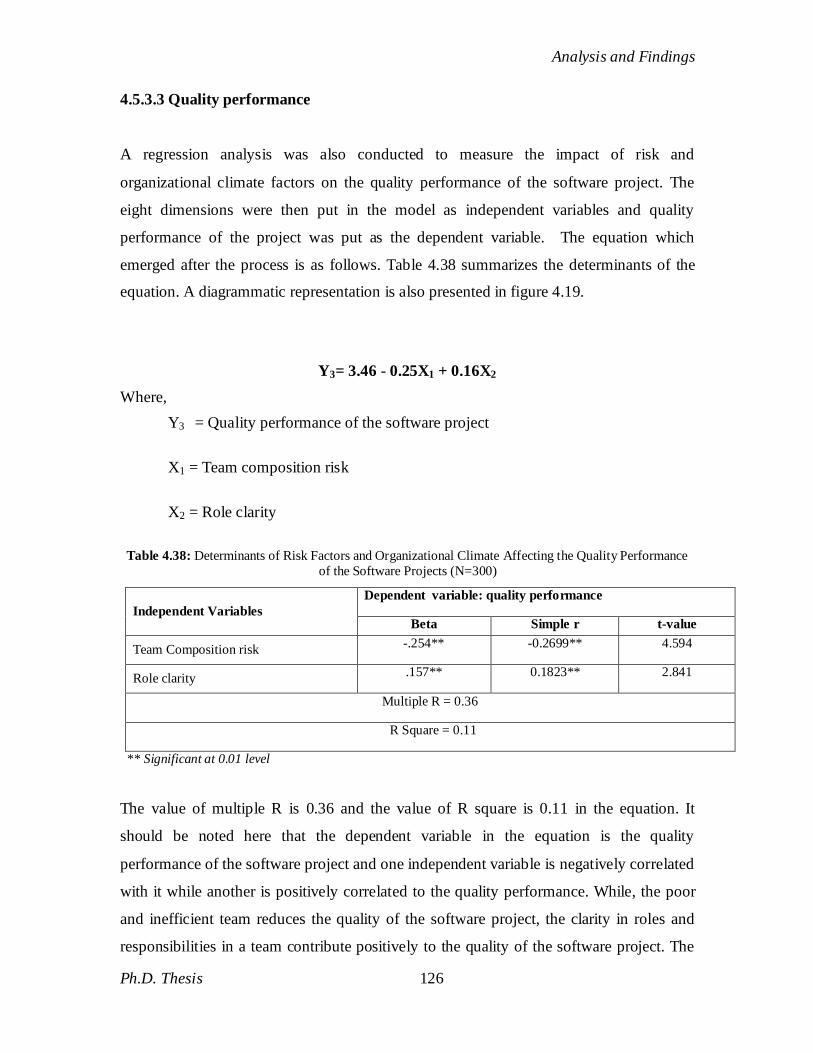
Analysis and Findings
Ph.D. Thesis 126
4.5.3.3 Quality performance
A regression analysis was also conducted to measure the impact of risk and
organizational climate factors on the quality performance of the software project. The
eight dimensions were then put in the model as independent variables and quality
performance of the project was put as the dependent variable. The equation which
emerged after the process is as follows. Table 4.38 summarizes the determinants of the
equation. A diagrammatic representation is also presented in figure 4.19.
Y3= 3.46 - 0.25X1 + 0.16X2
Where,
Y3 = Quality performance of the software project
X1 = Team composition risk
X2 = Role clarity
Table 4.38: Determinants of Risk Factors and Organizational Climate Affecting the Quality Performance
of the Software Projects (N=300)
Independent Variables
Dependent variable: quality performance
Beta Simple r t-value
Team Composition risk -.254** -0.2699** 4.594
Role clarity .157** 0.1823** 2.841
Multiple R = 0.36
R Square = 0.11
** Significant at 0.01 level
The value of multiple R is 0.36 and the value of R square is 0.11 in the equation. It
should be noted here that the dependent variable in the equation is the quality
performance of the software project and one independent variable is negatively correlated
with it while another is positively correlated to the quality performance. While, the poor
and inefficient team reduces the quality of the software project, the clarity in roles and
responsibilities in a team contribute positively to the quality of the software project. The
Analysis and Findings
Ph.D. Thesis 127
equation explains that the highest contribution in reducing the quality of the project is
made by poor team composition which includes lack of availability of domain expert,
working with inexperienced team, team diversity, and lack of commitment from the
project team. All the independent variables are explained below.
With a beta coefficient of 0.25 and negative correlation of 0.27 significant at 0.01 level,
team composition factor negatively contributes to the quality performance of the project.
A right mix of candidates in a team is mandatory to achieve desired outcome. Working
with inexperienced team is same as working with highly qualified team as both may
result in poor performance and poor delivery. A novice team may fail to deliver the
desired quality product due to their inexperience while ego, overconfidence and conflict
may affect the performance delivery of the highly qualified team, thus resulting in a poor
quality of the software. Besides this, high level of attrition and lack of availability of
domain expert are yet another factors that may affect the quality performance of the
project. Another important variable that affects the quality performance of the project is
role clarity. Clarity in roles and responsibilities and the acceptance of one‘s
responsibilities help greatly in instilling a sense of ownership amongst the team members.
The moment a sense of belongingness is developed among the team members they start
putting extra efforts in delivering a quality product to the customer or client.
Thus, role clarity significantly contributes to the quality performance of the project. With
a beta coefficient of 0.15 and correlation of 0.18 significant at 0.01 level, this factor
positively contributes in achieving desired quality performance.
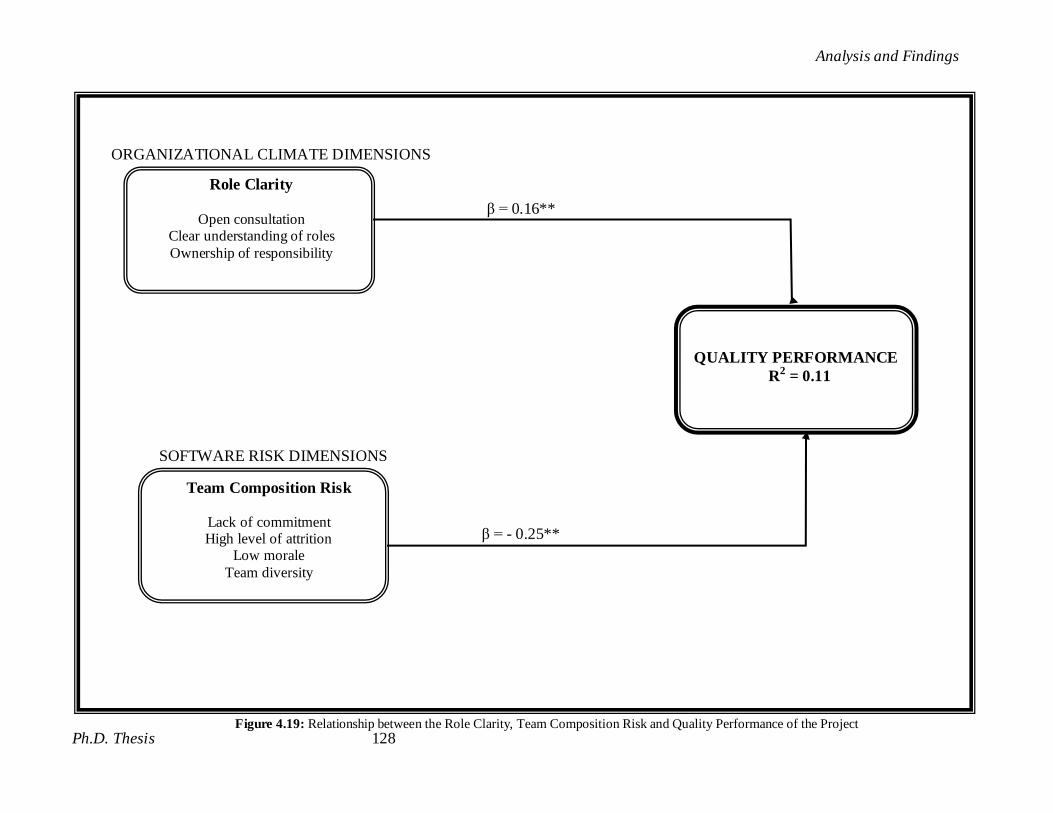
Analysis and Findings
Ph.D. Thesis 128
Role Clarity
Open consultation Clear understanding of roles
Ownership of responsibility
Team Composition Risk
Lack of commitment High level of attrition
Low morale
Team diversity
ORGANIZATIONAL CLIMATE DIMENSIONS
SOFTWARE RISK DIMENSIONS
QUALITY PERFORMANCE
R2 = 0.11
β = - 0.25**
β = 0.16**
Figure 4.19: Relationship between the Role Clarity, Team Composition Risk and Quality Performance of the Project
Analysis and Findings
Ph.D. Thesis 129
4.6 CONCLUDING REMARKS
Based on the outcome of various statistical tests done for analysis many interesting
findings have come to light. Tests like factor analysis; Duncan‘s mean test; correlations
and regressions analysis have been instrumental in analyzing the data and inferring out
from it. The detailed analysis of the secondary data unfolds the list of top ten software
project risks that are present in the software projects globally. Weighted average method
has been used and miscommunication of requirements, lack of top management support
and lack of technical knowledge have been identified as the top three most important
risks affecting the software projects globally. The Principal Component factor analysis
has extracted four risk dimensions namely a) SRS variability risk, b) Team composition
risk, c) Control processes risk and d) Dependability risk, as the key project specific risk
factors that are present in the Indian software industry. Similarly, four organizational
climate dimensions have also been extracted and they are a) climate of high standards of
work tasks, b) climate of effective supervision, c) climate of intrinsic fulfilment and d)
climate of role clarity. In order to compare the means of the perceptions about risk
dimensions and organizational climate dimensions across the various demographic
characteristics, Duncan‘s mean test has been done. It is found that the perception about
software risks greatly varies amongst the three designations and experience group with
employees having an experience of upto 9 years perceiving the risks to have greater
degree of impact on the success of the project than compared to the more experienced
employees. The perception about the software risks does not show much variation as far
as the team size and total value of the project characteristics are concerned. Only the team
composition risk shows a significant difference between projects with duration of 10-19
months and projects with duration of more than 19 months. The perception about the
organizational climate factors also varies greatly amongst the three designations and
experience groups.
Moving ahead to the regression analysis for identifying the organizational climate factors
that contribute in reducing the software risks reveals that clarity and lucidity in roles can
help in reducing all the identified project specific software risk dimensions namely SRS
variability risk, team composition risk, intrinsic fulfilment risk and dependability risk,
Analysis and Findings
Ph.D. Thesis 130
while an effective and proficient supervisor can contribute effectively in reducing the risk
of SRS variability and Dependability. Lastly, setting up of high standards of work tasks
in the organization and project can help in controlling and annihilating the control
processes risk and dependability risk.
Last of all, the regression analysis done to find out the determinants of project success
reveals the project specific software risk dimensions and organizational climate
dimensions that affect the overall success and the three performance constructs of the
software project. The overall success of the software project gets affected by all the four
dimensions of risk but in varying degree. The team composition risk negatively affects
the budget, schedule and quality performance of the software projects on the other hand,
the control processes risk affects the schedule performance and the dependability risk
affects the budget performance of the software project negatively. As far as the
organizational climate dimensions are concerned, out of four only high standards of work
tasks contributed positively to the overall success of the software project. The climate of
high standards of work tasks also contributed positively to the budget and schedule
performances of the project, while dimensions of intrinsic fulfilment and role clarity
showed a significant positive impact on the budget and quality performances
respectively, the effective supervision – a climate dimension showed a negative impact
on the budget performance of the project. This is an interesting finding as it shows that
too much interference by the manager can actually derail the project. Thus all the
research objectives have been successfully attained and all the alternate hypotheses have
been accepted.