chapter 4 contents - united states agency for ... · chapter 4 contents 4. agriculture, natural...
TRANSCRIPT

Second Food Aid and Food Security Assessment (FAFSA-2)
Chapter 4 Contents4. Agriculture, Natural Resource Management,
Livelihoods, Income Generation ............................... 4-1Abstract ....................................................................................................................................4-1
4.1 Introduction ........................................................................................................................ 4-24.1.1 Policy and Program Environment ......................................................................................................4-24.1.2 Country Context ............................................................................................................................... 4-4
4.1.2.1 Where the Programs Work ............................................................................................... 4-44.1.2.2 Target Population ............................................................................................................. 4-5
4.2 Basic Facts about Programs in the FAFSA-2 Universe .......................................................4-74.2.1 Projects and Countries .....................................................................................................................4-74.2.2 Resources and Beneficiaries ...........................................................................................................4-7
4.3 Program Approaches and Interventions ............................................................................ 4-84.3.1 Objectives and Intermediate Results .............................................................................................. 4-84.3.2 Interventions and Outcomes ........................................................................................................... 4-8
4.3.2.1 Crop Production and Productivity .................................................................................... 4-84.3.2.2 Natural Resource Management at the Farm Level ........................................................4-164.3.2.3 Irrigation ........................................................................................................................4-204.3.2.4 Storage ..........................................................................................................................4-254.3.2.5 Marketing ........................................................................................................................4-274.3.2.6 Livestock ........................................................................................................................4-334.3.2.7 Rural and Agricultural Finance ......................................................................................4-374.3.2.8 Non-Farm Income Generation (Non-AG IG) Programs ............................................... 4-42
4.3.3 Approaches ................................................................................................................................... 4-434.3.3.1 Disseminating New Knowledge .................................................................................... 4-434.3.3.2 Organizing and Working with Groups ........................................................................... 4-484.3.3.3 Providing Inputs ..............................................................................................................4-52
4.4 Program Impact ............................................................................................................... 4-544.4.1 Household Consumption ............................................................................................................... 4-544.4.2 Household Income ....................................................................................................................... 4-564.4.3 Household Assets ........................................................................................................................ 4-574.4.4 Qualitative Information Suggesting Impact ................................................................................... 4-58
4.5 Cross-Cutting Issues and Opportunities .......................................................................... 4-594.5.1 New Approaches to Market-Oriented Programs ........................................................................... 4-59
4.5.1.1 Market-Driven Programs ................................................................................................ 4-594.5.1.2 The Value of Value Chains ............................................................................................4-61

Second Food Aid and Food Security Assessment (FAFSA-2)
4.5.2 Economics 101 .............................................................................................................................. 4-624.5.3 Managing Risks and Reducing Vulnerabilities .............................................................................. 4-644.5.4 Sustainability ................................................................................................................................. 4-64
4.5.4.1 Commercialization, Profitability, and Increased Incomes ............................................. 4-644.5.4.2 Capacity Strengthening ................................................................................................ 4-67
4.5.5 Key Assumptions and Alternative Development Models ............................................................... 4-674.5.5.1 Key Assumptions ........................................................................................................... 4-674.5.5.2 Alternative Development Hypotheses and Models ........................................................4-72
4.6 Conclusions and Recommendations ................................................................................4-744.6.1 Conclusions ....................................................................................................................................4-744.6.2 Recommendations ........................................................................................................................ 4-80
Bibliography for Chapter 4 ..................................................................................................... 4-82

4-1
Second Food Aid and Food Security Assessment (FAFSA-2)
4. Agriculture, Natural Resource Management, Livelihoods, Income Generation
Abstract
More than three-quarters of the Title II development programs in the FAFSA-2 universe had an SO related to AG. Fifty of these programs were in Africa (20 countries), 6 were in Asia (3 countries), and 23 were in LAC (5 countries). Almost 60 percent also focused on LH and IG. The vast majority were designed based on the assumptions that most of their clients were farmers and that the solutions to their food insecurity lay primarily in production agriculture. Most AG/NRM programs included a wide range of interventions focused on improving crop and livestock production, NRM, irrigation, storage, marketing, and rural and agricultural finance in an attempt to be responsive to the different opportunities and production potentials available to farmers in their target areas. Key approaches included disseminating knowledge about improved technologies and practices to their client farmers, organizing them into groups, and distributing agricultural inputs and capital investment goods. These programs were often technically complex and difficult to design and implement successfully. The FAFSA-2 universe includes many examples of programs that helped improve their clients’ lives, usually by providing them access to a combination of improved agricultural technologies and market opportunities. The successes that these programs achieved are even more noteworthy given the challenging environments in which they worked. Not all clients in Title II target areas are farmers, however, and many that do farm do not have the asset base needed to farm their way out of poverty. A few programs also included limited amounts of support to the development of microenterprises in their target areas, but since most people do not have strong entrepreneurial skills, the rural poor included, what is really needed for those households that will not be able to succeed as farmers is access to more and better-paying jobs. In FY 2009, 40 percent of Title II development resources (US$125 million) was devoted to AG/NRM technical sector activities and only 3 percent (US$8.9 million) to Non-AG IG. The policy implications of the AG/NRM/LH/IG assessment are provided in Box 4.37 and details on the conclusions and recommendations are provided in Sections 4.6.1 and 4.6.2.

4-2 Agriculture, Natural Resource Management, Livelihoods, Income Generation
4.1 Introduction
4.1.1 Policy and Program Environment
Title II agricultural development programs underwent a major change in the late 1990s as a result of the 1995 Policy Paper, which shifted the focus and goal of the program to “rural areas” and to “increasing agricultural productivity.” In an effort to address the underlying causes of food insecurity identified in the Policy Paper, the focus of Title II development programs also shifted from shorter- to longer-term interventions that were expected to have a higher probability of sustainability.
Prior to the 1995 Policy Paper, the Title II development program supported activities that had a more indirect relationship to agriculture, such as road rehabilitation, soil conservation, and reforestation, using FFW. The portfolio began to change during the time covered by the 2002 FAFSA. More emphasis was given to increasing agricultural productivity and production and to reducing post-harvest losses, and more attention was given to crop diversification, marketing, and agricultural-based enterprises—activities that required significant amounts of non-food resources to implement. FFW continued to be used to support community-based soil conservation and reforestation activities, but
more attention began to be placed on NRM practices that would have more direct effects on improving on-farm agricultural productivity (e.g., giving more emphasis to using crop residues in farmers’ fields than to building stone terraces on community land). These changes were dramatic, according to the 2002 FAFSA, and required Awardees to make significant changes in their programming, implementation, and staffing.
Many of these same emphases continued into and throughout the FAFSA-2 time period. This includes the emphasis on increasing agricultural productivity; promoting improvements in NRM as part of an emphasis on developing sustainable agricultural systems; and marketing, with a more updated view of the role of market-driven demand in maximizing economic “return and the predictability of income generation” (see Box 4.1).
What was expected to be new under the 2006–2010 Strategic Plan was an increased focus on helping farmers manage risk, including during (but not limited to) the agricultural production cycle. This was expected to include: “providing technical assistance and training on soil and water conservation techniques; agricultural technologies that reduce risk (e.g., drought resistant crops, low-external input agriculture); and improved post
Box 4.1. USAID/FFP Definition of Its “Sustainable Agricultural Production/Natural Resources Management” (AG/NRM) Technical Sector
“Objectives include reducing risk during the agricultural production cycle, increasing agricultural productivity, and promoting natural resource management in a socially, economically, and environmentally sustainable manner. Includes activities related to production, processing, marketing, distribution, use, and trade of food, feed, and fiber produced by a sustainable agricultural system in a manner that is non-degrading to the environment, technically appropriate, economically viable, market-driven, locally replicable, equitable, and socially acceptable. Activities promote agricultural technologies that: offset losses of and/or regenerate soil fertility; prevent erosion of top soil; protect water point quality and quantity; employ a judicious use of affordable purchased inputs; reduce post harvest storage losses; diversify and integrate crops, livestock, agro-forestry, fisheries production systems to enhance resiliency to climatic fluctuations; and rely on market-driven demand to maximize return and predictability of income generation. Food rations are used to build agriculture-related physical and human assets.”
Source: USAID/FFP Annual Results Reporting Guidance for FY 2009.

4-3Agriculture, Natural Resource Management, Livelihoods, Income Generation
harvest handling to reduce post harvest losses.” Crop and income diversification activities were also expected to receive added attention, because the Strategic Plan viewed support to more diversified livelihoods as “another important risk reduction strategy as well as an income enhancing strategy.” This latter focus, according to the Strategic Plan, meant that Awardees would need to pay “more attention to markets and market demand and working more closely with the private sector, helping support as well as take advantage of mission and other USAID market strengthening activities where possible” (USAID/FFP, 2005, p. 69).
The 2006–2010 Strategic Plan also clarifies the roles of food and non-food resources in the Title II development programs, including by providing numerous examples of how food and non-food (primarily cash) resources can be used in combination to achieve a broad range of objectives within the sub-IR category, “Livelihoods capacities
protected and enhanced” (see Table 4.1 for an example of one of the illustrative activities). The Strategic Plan reemphasized the importance of cash, by pointing out that the Title II development programs were going to have to continue to “rely primarily on non-food assistance to increase agricultural productivity and diversify production.” Food, the Strategic Plan argued, could be used in public works programs. (See Chapter 5 on “Infrastructure” for a further discussion of the uses of food and non-food resources to support public works programs.) Food could also be used as an incentive to offset the opportunity costs of participating in the training and TA activities (which needed to be funded with cash), which were paramount to the success of the AG/NRM/LH programs. The Strategic Plan also included two caveats with respect to the latter uses of food, pointing out that “food might not be necessary to insure participation, particularly if the programs are well designed so that people can see their economic
Box 4.2. Limitations and Gaps and in the Program Documentation and Data
The completeness and accuracy of the assessment of the AG/NRM/LH programs are dependent on the completeness and accuracy of the program documents and results data reported by the Awardees. These programs are complex and most contain a wide range of interventions and activities, many of which are not clearly identified or consistently reported on in the current documentation system. One cannot say for certain, for example, how many programs include activities focused on conservation agriculture, small ruminants, home storage, distribution of processing equipment to women’s income generation groups, planting of trees, rural/agricultural finance, or small-scale irrigation. Proposals frequently do not identify all the various types of interventions/activities that Awardees are considering including in their programs; some interventions/activities that are identified in proposals may never be implemented; and some may be added during a project and others subtracted. Annual reports do not report on all the activities implemented during the year and are not consistent year to year in the activities that they do report on. Mid-term and final evaluations tend to focus on bigger program components and sometimes on interventions and activities that evaluators themselves are interested in and say little or nothing about many others. Many activities in the AG/NRM/LH programs have no indicators associated with them, and, for those that do, the lack of standardization makes it difficult to aggregate information on program performance for the Title II development program as a whole, as well as to compare performance across programs and countries. Many program documents, including evaluations, also lack information on the nature of program interventions and approaches. This makes it difficult to draw conclusions about the relative effectiveness of alternative types of interventions, even in major program areas, including the promotion of improved agricultural technologies and practices and the organization and strengthening of producer associations and cooperatives.

4-4 Agriculture, Natural Resource Management, Livelihoods, Income Generation
benefits.” The Strategic Plan also pointed out the dangers that “food could also distort behaviors, encouraging farmers to adopt new farming practices that are not profitable or sustainable and/or attracting participants away from other agricultural development programs that do not have a subsidy component” (USAID/FFP Strategic Plan, p. 69).
4.1.2 Country Context
4.1.2.1 Where the Programs Work
The Title II development programs that were implemented during the FAFSA-2 time period, in accordance with policy and program guidance, were deliberately located in some of the poorest and most food insecure areas in countries that were already some of the poorest and most food insecure in the world. Most programs also worked in rural areas characterized by their:
• Low agricultural productivity
• Heavy dependence on rain-fed agriculture
• Geographical isolation
• Degraded natural resource base
• Vulnerability to the effects of lack of access to water(drought)and/ortoomuchwater(flooding)
• Lack of productive infrastructure, including market roads and irrigation systems
• Lack of agricultural support services
• Weak and underdeveloped market linkages
• Low household incomes
• Migration, both internally and internationally, to earn money, especially during the dry season
The specific problems and combinations of problems varied significantly across countries and within countries, however. In some areas where Title II development programs worked, agricultural potential was low due to high altitudes, encroaching desertification, limited or uncertain rainfall, degraded soils, steep slopes, or other biophysical constraints. In other areas, the agricultural potential was better, but the level of development was low due to a lack of infrastructure, long distances to markets, and lack of investments. In some areas, low population densities made it difficult to find cost-effective approaches to service delivery; in other areas, high population densities reduced plot
Table 4.1. Illustrative Activities from the 2006–2010 Strategic Plan Related to Sub-IR 2.2, Livelihoods Capacities Protected and Enhanced
Illustrative Activities: To increase agricultural productivity and diversify production
Non-Food Assistance Food AssistanceThe Title II program:
• Provides and/or coordinates the provision of the complementary inputs needed for the successful completion of the relevant infrastructure, such as engineering drawings and services and cement. Also provides or ensures the provision of the TA and training needed to ensure that the public works are operated properly and maintained.
• Provides training and TA on new agricultural technologies (including storage and agro-processing).
• Provides information on markets and TA and training to increase capacity to identify and access markets.
• Provides and/or coordinates the provision of credit to finance agricultural activities.
The Title II program:
• Provides food through public works programs to construct water reservoirs and irrigation systems (which also helps reduce production risks and adds to community assets).
• Provides food through public works programs to rebuild/build roads and improve market access.
• Provides food as an incentive and to offset the opportunity costs of participating in training activities.
Source: This table is taken verbatim from the USAID/FFP Strategic Plan, p. 71.

4-5Agriculture, Natural Resource Management, Livelihoods, Income Generation
sizes and increased the numbers of rural households that were effectively landless. Some areas suffered from years of political neglect and others from years of civil conflict that damaged productive and social infrastructure. Countries and communities also varied greatly in terms of the capacities of their public and private sectors and civil societies, not to mention their histories and cultures.
4.1.2.2 Target Population
Following the guidance originally laid out in the 1995 Policy Paper, the Title II development programs that were implemented during the FAFSA-2 time period continued to work in rural areas, and the target population for their AG/NRM/LH programs were small, resource-poor farmers. This included farmers that had only small amounts of land and/or poor-quality land (the soils were poor and/or the land was mountainous).
Many in the Title II target population did not have enough land or land of sufficient quality to become food secure by focusing only on increasing farm production, however, at least not without getting access to improved technologies and markets for higher-valued products. And in some countries—Bangladesh, for example—the majority of the most food insecure in rural areas is landless. In other words, as John Staatz, Professor Emeritus, Michigan State University (MSU), pointed out during an October 2011 IFPRI seminar on “Agribusiness in Africa,” “Not all farmers will be able to farm their way out of poverty,” even in Africa. His actual estimate, reported in a Background Paper for the World Bank Development Report 2008 (Staatz and Dembele, 2008), is that “somewhere between one- and two-thirds of smallholder farmers (depending on the country) appear to lack the resources to ‘farm their way out of poverty’ and will therefore need eventually to move to more remunerative employment outside farming.”
Agriculture can also be a very risky business, especially for most of the Title II farmers that do not have access to irrigation and thus have to depend on rains to provide water for their crops and animals. Being so dependent on the weather means that they can lose their entire crop and a significant percentage
of their annual income in the case of drought or even a delay in the rains. Poor farmers typically have to cover 100 percent of their losses, since they have no access to insurance. Most also have to come up with 100 percent of any capital investments that they make, on their own or out of the accumulated wealth of their families (self-finance), since few have access to credit and what little credit is available is usually available only at very high interest rates.
Because they have limited agricultural assets and opportunities, many households that were/are included in the Title II target population have developed alternative livelihoods to farming, including other on-farm and/or off-farm wage labor; petty trading; and a variety of microenterprises, including tailoring, carpentry, and brick making. These activities help them supplement their farm incomes and better cope with the many risks that they have to deal with on a daily basis. Small farmers all over the world, as a recent IFPRI publication describes them (see Box 4.3), are
Box 4.3. The Title II Target Population: Poor, Rural Households
• “Everywhere in the world, small agricultural producers are entrepreneurs, traders, investors, and consumers, all rolled into one” (Kloeppinger-Todd and Sharma, 2010, Overview).
• A U.S. Secretary of Agriculture during the 1960s—Orville Freeman—used to say that he had visited with small farmers all over the world and met many that couldn’t read or write, but that he had yet to meet a farmer who couldn’t count.
• “…the poor are like hedge fund managers—they live with huge amounts of risk. The only difference is in their levels of income” (Banerjee and Duflo, 2011, pp. 134–135).

4-6 Agriculture, Natural Resource Management, Livelihoods, Income Generation
“entrepreneurs, traders, investors, and consumers, all rolled into one.” Migration was/is another common way that poor, food insecure households living in the Title II target areas cope(d) with low and/or variable incomes, with some travelling to the nearest big city, others to where agricultural labor was/is needed for harvesting, and others leaving the country—Bolivians migrating to Argentina, Malawians and Mozambicans to South Africa, and Bangladeshis to the United Arab Emirates.
The populations targeted by the Title II development programs, in other words, although poor and food insecure, were/are also economic actors that respond to economic incentives. These latter characteristics are not always recognized, however, or sufficiently appreciated, by some program staff and others in the Title II stakeholder community that still tend to think of the Title II target populations in their role as program “beneficiaries”69 and as “objects of compassion” rather than “economically empowered entrepreneurs,” as one Title II Awardee expressed it (see Box 4.4). Some programs have started using the term “participant,” which recognizes that the target populations have a more active role to play in the Title II development programs. The FAFSA-2 prefers to use the term “client” when discussing the Title II AG/NRM/LH/IG programs because it better describes the fact that the resource-poor farmers, who are the main targets of these programs, are economic actors that respond to economic incentives
69 USAID/FFP requires its Awardees to report on the number of“directbeneficiaries”oftheirdevelopmentprograms,whichitdefinesas“thosewhocomeintodirectcontactwiththesetofinterventions (goods and services) provided by the program in each technical area.” This information is necessary, including as a measure of the scope of programs and their potential impact.However,theuseoftheterm“beneficiary”tendstoputmoreemphasisonthereceiptofthebenefitsratherthantheiruse. (See USAID/FFP Annual Results Reporting Guidance for FY2009formoredetailsontheUSAID/FFPdefinitionsfordirectandindirectbeneficiaries.)
in managing their farms and other household enterprises, in light of their own needs, objectives, and priorities, and not just program “recipients” or “objects of compassion.”70
70 This rationale for the use of the term “client” is similar to the one that the United Nations Development Programme used to explain why it decided to use the term “emerging markets” rather than “developing countries” in its report on “Value Chain Development for Decent Work,” arguing that by doing so the implication is that it is “no longer regarding developing countries as the recipients of aid and development programs, but acknowledging that they are serious players in the market—both as suppliers to global markets, and also as consumers, workers/employees, and providers of services” (Herr and Muzira, 2009, p. 2).
Box 4.4. The Title II Target Populations: “Objects of Compassion” or “Economically Empowered Entrepreneurs”
“One of the lessons that SC learned from its Title II program in Bolivia was the changing vision of the producer. At the beginning of Title II [program,] producers took on the role and were viewed as objects of compassion. Over time, this vision [on the part of the SC staff] changed to one of economically empowered entrepreneurs.”
Source: Piper et al., 2010, p. 17.
4-7Agriculture, Natural Resource Management, Livelihoods, Income Generation
4.2 Basic Facts about Programs in the FAFSA-2 Universe
4.2.1 Projects and Countries71
More than three-quarters of the Title II development programs in the FAFSA-2 universe included an SO related to agriculture. This included 50 programs in Africa (Burkina Faso, Cape Verde, Chad, Ethiopia, Gambia, Ghana, Guinea, Kenya, Liberia, Madagascar, Malawi, Mali, Mauritania, Mozambique, Niger, Rwanda, Senegal, Sierra Leone, Uganda, and Zambia), six programs in Asia (Bangladesh and India), and 23 programs in LAC (Bolivia, Guatemala, Haiti, Honduras, and Nicaragua). Almost 60 percent of this set of programs also included a focus on livelihoods and incomes.
4.2.2 Resources and Beneficiaries72
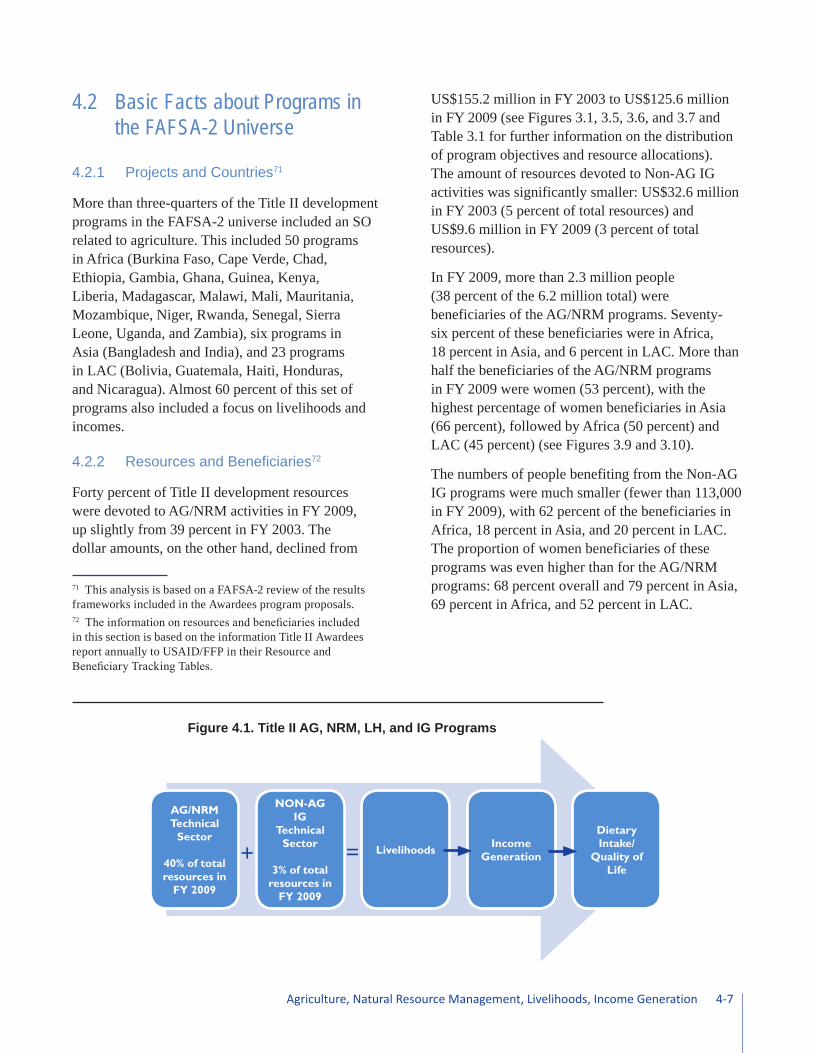
Forty percent of Title II development resources were devoted to AG/NRM activities in FY 2009, up slightly from 39 percent in FY 2003. The dollar amounts, on the other hand, declined from
71 This analysis is based on a FAFSA-2 review of the results frameworks included in the Awardees program proposals.72 Theinformationonresourcesandbeneficiariesincludedin this section is based on the information Title II Awardees report annually to USAID/FFP in their Resource and BeneficiaryTrackingTables.
US$155.2 million in FY 2003 to US$125.6 million in FY 2009 (see Figures 3.1, 3.5, 3.6, and 3.7 and Table 3.1 for further information on the distribution of program objectives and resource allocations). The amount of resources devoted to Non-AG IG activities was significantly smaller: US$32.6 million in FY 2003 (5 percent of total resources) and US$9.6 million in FY 2009 (3 percent of total resources).
In FY 2009, more than 2.3 million people (38 percent of the 6.2 million total) were beneficiaries of the AG/NRM programs. Seventy-six percent of these beneficiaries were in Africa, 18 percent in Asia, and 6 percent in LAC. More than half the beneficiaries of the AG/NRM programs in FY 2009 were women (53 percent), with the highest percentage of women beneficiaries in Asia (66 percent), followed by Africa (50 percent) and LAC (45 percent) (see Figures 3.9 and 3.10).
The numbers of people benefiting from the Non-AG IG programs were much smaller (fewer than 113,000 in FY 2009), with 62 percent of the beneficiaries in Africa, 18 percent in Asia, and 20 percent in LAC. The proportion of women beneficiaries of these programs was even higher than for the AG/NRM programs: 68 percent overall and 79 percent in Asia, 69 percent in Africa, and 52 percent in LAC.
Figure 4.1. Title II AG, NRM, LH, and IG Programs
AG/NRM Technical
Sector
40% of total resources in
FY 2009
NON-AG IG
Technical Sector
3% of total resources in
FY 2009
Livelihoods Income Generation
Dietary Intake/
Quality of Life
=+

4-8 Agriculture, Natural Resource Management, Livelihoods, Income Generation
4.3 Program Approaches and Interventions
4.3.1 Objectives and Intermediate Results
The Title II development programs implemented during the FAFSA-2 time period were still focused on a variety of objectives, ranging from a more narrow focus on increasing food production and/or increasing agricultural productivity to higher-level objectives related to increasing and/or diversifying household incomes through sales of food and non-food products (see Box 4.5 for examples of objectives and IRs included in the Title II programs in the FAFSA-2 universe). In some programs that were under way at the beginning of the FAFSA-2 time period, the income objective was separated from the agricultural production/productivity-related objective, even when the increased income was expected to come from the sale of agricultural products. More recent programs were more likely to include agricultural production and income objectives within the same SO, in recognition of the intimate relationships in rural areas between agricultural development and improvements in household incomes and quality of life. Plus, Non-AG IG activities have been given their own technical sector (see Section 4.3.2.8).
4.3.2 Interventions and Outcomes
The vast majority of the Title II development programs that were implemented during the FAFSA-2 time period started with the assumptions that most of their clients were farmers and that solutions to their problems lay primarily in production agriculture. This strategy worked for numerous programs in the FAFSA-2 universe. But not all clients in the Title II target areas had/have the asset base needed to farm their way out of poverty, as was noted earlier.
4.3.2.1 Crop Production and Productivity
The vast majority of Title II development programs in the FAFSA-2 universe included a strong focus
on crop agriculture. This was particularly true of programs in the Africa and LAC regions. Much of the focus was also on the major food crops (cassava, maize, millet, rice, and sorghum), especially at the beginning of the FAFSA-2 time period (see Table 4.2). A few programs also worked with secondary crops, including pigeon peas, cow peas, sesame, and sunflower. Many programs also began to focus on a variety of other crops with higher values in the market as a way to help their clients increase their incomes and access to food.
There are two ways to increase agricultural production in the areas where the Title II programs
Box 4.5. Objectives and Intermediate Results Included in Title II Development Programs Related to Increasing Food Availability and Access
• Increasing agricultural productivity
• Increasing food production
• Increasing cash crop production
• Diversifying crop production
• Increasing livestock production
• Increasing/diversifying household incomes through sales of farm products
• Improving use of/protecting the natural resource base
• Reducing crop losses
• Adding value to basic agricultural products
• Increasing market access
• Increasing/diversifying household incomes, including through support to agricultural- and non-agricultural-based microenterprises

4-9Agriculture, Natural Resource Management, Livelihoods, Income Generation
are operating where productivity levels tend to be low. Title II development programs can (1) expand the area under production by opening up new land or expand the area under irrigation so that more crops can be grown each year on the same amount of land and/or (2) increase the yields per unit of land. Programs that were implemented during the time period covered by the 2002 FAFSA were focused
primarily on increasing agricultural productivity, of staple foods in particular. This emphasis probably originated with the 1995 Policy Paper and subsequent USAID/FFP guidance that continued to stress increases in agricultural productivity as one of the best indicators of the food security impacts of the Title II devolvement program.
Promoting and Disseminating New Technologies and Practices
Agricultural productivity levels are low in the Title II target areas, and most Title II clients made only limited use of improved technologies. As a result, most programs focused their efforts on increasing the crop productivity (yields) of their target farmers. During the FAFSA-2 time period, this meant, among other activities, introducing farmers to new/improved seeds and planting materials and providing them with information on more productive farming practices.
• Promoting improved varieties. A primary objective of many programs was to introduce farmers to a more productive variety of their major staple (i.e., one that would produce higher yields per unit of land), which was one of the key objectives for the Title II development program from the time of the 1995 Policy Paper. Other varieties were introduced because they were resistant to common plant pests and diseases (e.g., a new variety of cassava in Mozambique and Uganda that was resistant to the brown streak disease [BSD] that was ravaging cassava harvests in East Africa), they were more drought resistant (e.g., new millet varieties in Niger and rice varieties in Bangladesh), or they could be used to improve the quality of the local weaning foods (e.g., the orange fleshed sweet potato in Mozambique and Uganda).
• Promoting improved agronomic practices. Most programs also included a set of agronomic practices in their package of recommendations. Common recommendations across countries and programs in Africa, for example, included: planting in lines, better spacing between seeds,
Table 4.2. Programs with a Focus on Staple CropsStaple Crops Country and AwardeeCassava Madagascar: ADRA, CRS
Mozambique: ADRA, CRS
Rwanda: ACDI/VOCA, WV
Uganda: SC, WV
Maize Cape Verde: ACDI/VOCA
Ghana: ADRA, OICI, TN
Guatemala: CRS, SC
Guinea: ADRA, OICI
Haiti: SC, WV
Honduras: ADRA, CARE, SC, WV
Kenya: ADRA, CARE
Madagascar: ADRA, CRS
Malawi: CRS
Mozambique: ADRA, CARE, FH, SC
Uganda: SC
Millet Ghana: OICI
Kenya: ADRA
Niger: CRS
Rice Ghana: TN
Guinea: ADRA, OICI
Kenya: ADRA
Madagascar: ADRA, CRS
Uganda: WV
Sorghum Ghana: ADRA, TN
Guinea: ADRA
Haiti: SC, WV
Honduras: CARE, SC
Kenya: ADRA, CARE, WV
Mozambique: FH

4-10 Agriculture, Natural Resource Management, Livelihoods, Income Generation
thinning seedlings to achieve the proper plant density, and weeding. Other programs also added technology packages related to improving soil fertility (e.g., the use of commercial fertilizers, manure, and mulch, and the use of plant legume cover and crop rotation in association with legumes) and crop protection (e.g., the use of commercial pesticides, botanicals, and integrated pest management).
The development of new and improved technologies and practices is an essential component of any productivity-oriented agricultural development strategy. This process can take significant time, however, and this more basic research is also an activity that Title II Awardees do not have a comparative advantage in undertaking. Both were/are reasons why the Title II programs usually looked/look to others (local, national, and international research institutes; other donor projects; and the private sector) for the technologies that they promote in their projects. Over time, many Title II Awardees have strengthened these links, including with a number of the International Agricultural Research Centers, such as the International Center for Tropical Agriculture (CIAT) and the International Crops Research Institute for the Semi-Arid Tropics (ICRISAT).
The process involved in disseminating these new technologies and practices can also take time, particularly when it comes to the dissemination of new seeds and planting materials, which may need to be multiplied in large numbers at the beginning of the dissemination process. In situations where there is only one crop cycle per year, it can take at least three years to get an improved crop into individual farmer’s fields. In year one, the vegetative material is multiplied in project nurseries. In year two, it is given to farmers to multiply in community plots. In year three, the material finally gets to individual farmer’s fields (see Box 4.6 for an example of this process on the ground in Mozambique). Even three years is a long lead time, however, when viewed in the context of a five-year program, and especially when the first year of most Title II development programs, even follow-on programs, is usually
devoted to getting organized, staffing up, and identifying and getting established in the new target communities.
The Technology Adoption and Diffusion Process
Considerable research lies behind what we now know about the technology adoption and diffusion process (Rogers, 2003).73 Much of this work began in the United States in the 1950s and 1960s in an attempt to understand the diffusion of innovations in the agricultural sector. This work, which soon spread to other sectors and, after the early 1960s, to the developing countries in Africa, Asia, and
73 Everett Rogers, in his seminal work, Diffusion of Innovations,definesdiffusionas“theprocessbywhich(1)an innovation (2) is communicated through certain channels (3) over time (4) among the members of a social system” (2003, p. 11).
Box 4.6. Disseminating a Variety of Cassava Resistant to the Brown Streak Disease
Cassava BSD was first recognized in the SC/Mozambique project area in 1998, under the predecessor SC Title II emergency program, but the real magnitude of the problem was not fully understood until 1999. A number of BSD-tolerant varieties were discovered in Mozambique, which probably helped shorten the dissemination process, but testing them, multiplying them in project-run nurseries under controlled conditions, and distributing the cuttings to farmer groups for further multiplication and dissemination also took a number of years. But, by 2006, according to estimates provided in the SC final evaluation, up to 45,000 households in the SC project area were growing some BSD-tolerant varieties.
Source: SC/Mozambique Final Evaluation (Sullivan and Selvester, 2006, pp. 9–12).

4-11Agriculture, Natural Resource Management, Livelihoods, Income Generation
Latin America,74 explains how new ideas are spread by different communication channels over time. Innovators in a community, who are likely to be leaders, are the first to try out a new technology or idea, followed by early adopters. Their early adoption can help pave the way for others in a community—poorer farmers, for example—that may be more reluctant to try out new practices because they have fewer assets and need additional assurances about the value of the new technologies. These innovations are perceived as risky; to overcome this risk, most people seek other people like themselves that have already adopted the new idea.
According to the diffusion literature, the adoption of an innovation usually follows a normal, bell-shaped curve when plotted over time on a frequency basis (see Figure 4.2), with successive groups of farmers adopting the new technologies/practices and the cumulative number of adopters represented by the “S” curve. Not all innovations diffuse at the same rate over time, however. Some are more popular and diffuse more rapidly (producing a steeper “S” curve), and others diffuse more slowly.75 Professional change agents, agricultural extension agents, for example, also have a role to play in this process, especially in the earlier stages of the adoption process, and the extent of a change agent’s promotion efforts in diffusing an innovation affects the rate at which an innovation is adopted.
According to diffusion experts, relative advantage, which is a ratio of the expected benefits and costs from adopting an innovation, is one of the strongest predictors of the rate at which an innovation is adopted. “The greater the perceived relative advantage of an innovation, the more rapid its rate
74 A 1981 World Bank-sponsored survey of the literature focusing on the adoption of agricultural innovations in developing countries included a comment that the “volume of such published research is overwhelming” (Feder, 1981).75 The rate of adoption is the relative speed with which an innovation is adopted by members of a social system. It is generally measured as the number of individuals that adopt anewideainaspecifiedperiod,suchasayear.Sotherateof adoption is a numerical indicator of the steepness of the adoption curve for an innovation (Rogers, 2003, p. 221).
of adoption will be.”76 Economic profitability is a key component of relative advantage, but low initial cost, a decrease in discomfort, social prestige, savings of time and effort, and the immediacy of award have also been shown to be important factors in getting people to change their behaviors (Rogers, 2003, p. 233). These factors help explain the speed of the uptake of the high-yielding varieties that were introduced as part of the Green Revolution in Asia that were adopted at exceptionally rapid rates in those areas where they were technically and economically superior to local varieties according to Ruttan (1977). According to Haggblade and Hazel, several case studies included in an IFPRI-supposed assessment of “Successes in African Agriculture” also “demonstrate that farmers can respond with alacrity when clearly superior new technology arrives together with financially attractive market outlets” (2010, p. 332).
The FAFSA-2 universe also includes a number of examples of new technologies and practices that
76 Other key characteristics of innovations, as perceived by individuals, which help explain their differential rates of adoption include: compatibility, i.e., the degree to which an innovation is perceived as being consistent with the existing values, past experiences, and needs of potential adopters; complexity, i.e., the degree to which an innovation is perceived asdifficulttounderstandanduse;trialability,i.e.,thedegreeto which an innovation may be experimented with on a limited basis; and observability, i.e., the degree to which the results of an innovation are visible to others (Rogers, 2003).
Figure 4.2. Diffusion of Innovation
Innovators2.5%
Early Adoptors 13.5%
Early Majority 34%
Market share %
Laggards 16%
Late Majority 34%
100
75
50
25
0
Source: http://en.wikipedia.org/wiki/Everett_Rogers.

4-12 Agriculture, Natural Resource Management, Livelihoods, Income Generation
were adopted relatively quickly, including several that did not have a relative advantage when they were first introduced to the Title II clients. One example of the latter involved a number of Bolivian fruit growers that did not begin to adopt the improved technologies and practices that SC/Bolivia was promoting until SC introduced them to a new set of buyers that were willing to pay considerably higher prices for better-quality fruit. This changed the farmers’ calculations: the SC-promoted technologies and practices were profitable once farmers were able to sell into this new market, which led to a rapid increase in their adoption in a relatively short period of time (see Box 4.7 and Section 4.3.2.5 on “Marketing” and Section 4.5.1.1 on “Market-Driven Programs”).
Constraints to Technology Adoption
Providing farmers with information about new technologies and practices does not guarantee that they learn the messages, however, and knowing about these new technologies and practices does not mean that farmers are going to change their behaviors and start using them or continue to use them. Knowledge, in other words, is different from practice. Still, during the FAFSA-2 time period, most Awardees did not appear to be spending much time trying to understand why some practices that they were recommending were not adopted and others were.
Some of the more likely constraints to technology adoption in the Title II programs are discussed next.77
77 A 1981 survey of the adoption of agricultural innovations in developing countries focused on several potential constraints to adoption, including farm size, land tenure, labor availability, credit, risk and uncertainty, human capital, and sociological factors, findingconflictingconclusionsacrosscountriesandregions along with methodological problems (Feder, 1981). A more recent survey of the adoption of agricultural technologies in developing countries focused on the role ofmarketinefficienciesininputandoutput,land,labor,credit risk, and information markets, and recommended further research on the barriers to agricultural technology adoption using randomized control trials (Jack, 2011).
Box 4.7. Behavior Change in a Title II Program in Bolivia: The Adoption of a New Technology Package by Fruit Producers
In one of the valley communities in Bolivia, SC/Bolivia extension agents were not having much success in promoting improved fruit cultivation practices, including convincing farmers that they should prune the existing peach and pear trees that were seriously overgrown and infested with a parasitic vine. One explanation given to members of the mid-term evaluation (MTE) team was that some of the older women in the community believed pruning was harmful to the trees and to pacha mama (mother earth). Two years later, one of the members of the MTE team returned to the same community on another assessment and found the community hardly recognizable. The farmers were selling premium fruit in high-end markets, trees in large areas of the valley had been severely pruned, some tree replacement was under way, and many of the improved production practices that SC had been recommending had also been adopted. One of the key things that had taken place during these two years was that SC staff, as a result of the decision to convert to a market-driven program, had introduced the fruit growers to the buyers in these high-end markets that explained what qualities they were looking for and how much they were willing to pay for fruit that met these qualities. SC also showed farmers how they could improve the harvesting, packing, and transport of their fruit. Learning that they could get higher prices for larger fruit led a few households to try the new technology package the first year after the MTE and large numbers tried it in the second year. Several older women, who had been against pruning, were now in charge of getting the fruit ready for the market. They took great pains to explain to the assessment team all the benefits that they had received from pruning their trees, including higher-quality fruit and higher sales prices.
Source: SC/Bolivia Assessment (van Haeften et al., 2006).

4-13Agriculture, Natural Resource Management, Livelihoods, Income Generation
Lack of Profitability
When adoption rates are low, or mixed, one of the most likely explanations is that the technologies and/or practices that are being promoted are not profitable to farmers, i.e., in the terminology of the diffusion literature, its relative advantage is low. Based on information available in program proposals, annual reports, and evaluations, however, most Awardees appear to have had little or no information on the costs and returns to alternative packages of technologies and practices that they could use to help them make informed decisions on which crops and technologies were more promising and/or to help them make mid-course corrections. CARE/Mozambique made good use of cost of production data available from a USAID-supported project with MSU to make adjustments to the technology package it was promoting in Mozambique (see Box 4.8), but having such data from other sources was an exception. The four Bolivia programs, which developed costs of production information for the technology packages that they were recommending, were also an exception.78
Labor Constraints
The problem of labor constraints is frequently mentioned in Title II evaluations as one of the main reasons why farmers were not adopting a particular technology package or, more frequently, were adopting some but not all of the recommended practices. The issue of labor constraints also came up while interviewing farmers during the FAFSA-2 field visits and, in particular, during the visits to the three countries in Africa. The reduced labor requirements of the new conservation agricultural package that ACDI/VOCA/Uganda was disseminating at the time of the FAFSA-2 field visit to northern Uganda may be one of its most attractive features, at least from the perspective of its farmer clients. This new package, which ACDI/VOCA refers to as low labor, high yield (LLHY),
78 The Bolivia programs also trained many of their farmers to do their own costs of production estimates. This information wasreadilyavailableatmanyofthefieldsitesvisitedduringthefinalevaluation,withmanyfarmersinthegroupsconversant about the estimates and their implications.
seems particularly suitable for these farmers that do not have enough labor to open up all the land that they have access to using only a hoe. The oxen many used to use to help with the plowing disappeared during the fighting in northern Uganda (see Box 4.9 for further details).
Unavailability of Commercial Inputs
A lack of supply of inputs in local markets can be another explanation for low adoption rates. This was initially thought to be the case in Mozambique, but CARE/Mozambique eventually concluded that it was the lack in demand for external inputs, due to the marginal benefits to be gained from their use that was responsible for the scarcity of external inputs in the markets in its region of the country (see Box 4.8). Sometimes projects can run into a
Box 4.8. A Low External Input Technology Package Was More Cost-Effective in Mozambique
CARE/Mozambique had access to information from field experiments that indicated that using certified seed and fertilizer would provide only marginal benefits for most crops at current prices. This led CARE to adopt a low external input approach in its extension program—promoting farmer-level seed selection, improved seed storage and exchange techniques, and conservation farming, and helping its farmers become certified producers of organic groundnuts. This information, along with a range of other economic analyses, was available from a USAID-supported project with MSU. This low-external input approach was quite successful, according to the final evaluation, but this success was not reflected in the indicators that were used to measure program performance because they were focused on purchased fertilizers and seed.
Source: CARE/Mozambique Final Evaluation (Selvester et al., 2006, p. 6).

4-14 Agriculture, Natural Resource Management, Livelihoods, Income Generation
“Catch 22” situation, as seemed to be the case in northern Uganda, where farmers were having trouble getting access to the herbicides and sprayers that were essential ingredients in the LLHY package that ACDI/VOCA was promoting. The private sector input dealers in the area were reluctant to stock large quantities of these items in the absence of any prior
demand for either one of these products. In this case, ACDI/VOCA stepped in to take the orders and buy and deliver the products to their farmer clients at cost, because it did not want to let a lack of supply dampen farmers’ interest in testing what looked like a very promising new technology package. This was definitely a stopgap measure, however, because the ACDI/VOCA project was ending in a couple of months. This was also not a sustainable approach, and Awardees have to be very careful in situations like these to not take steps that will discourage or crowd out private sector participation.
The Time Requirements of the Technology Dissemination and Adoption Processes and Program Performance Measurement
The nature and rapidity of these processes—the dissemination and adoption of new technologies and practices—can affect the conclusions about program performance and cost effectiveness. If Awardees have only a few years in which to identify and introduce a new package of technologies and practices, as is likely the case in many Title II development programs, they could easily find themselves having to measure program impact at too early a stage in the technology adoption process, e.g., while it is still in the early adopters stage. In these cases, one could easily draw the wrong conclusions, underestimating program performance over the longer term and overestimating the cost of the program per adopter.
Impact on yields. The emphasis on increases in crop productivity and yields, which was characteristic of the programs implemented during the 2002 FAFSA time period, decreased somewhat during the FAFSA-2 time period. Only 26 programs in 14 countries (40 percent of the total programs included in the AG/NRM/LH sub-universe)79 reported on whether they were able to increase the yields of the crops that they were promoting, with many
79 The sub-universe of countries/programs included in the review of the AG/NRM/LH programs includes 64 programs in 26 countries. The sub-universe is smaller than the FAFSA-2 universe because it is limited to programs that had one or more components focused on food availability and access and also toprogramsforwhichfinalperformanceinformationwasavailable.
Box 4.9. The Introduction of a Conservation Agriculture Technology Package in Uganda
During the FAFSA-2 field visit, ACDI/VOCA/Uganda was in the process of rolling out a new package of conservation agricultural practices that it refers to as LLHY. This set of practices, which was based on a set of practices developed in Zambia, seemed to be providing immediate benefits to farmers in northern Uganda, who were still returning home from the internally displaced persons camps, because they did not have to use as much labor to open land that in some cases had been lying fallow for ten or more years. LLHY requires less labor for subsequent weeding (a reduction of 50–75 percent), which means that farmers can manage larger land areas. Lower labor requirements also make LLHY more attractive to women and PLHIV. Using this package enables farmers to plant earlier, because they do not have to plow twice, and there is less weed competition, which results in higher yields for many crops. The residue left on the surface also traps and conserves soil moisture, reducing the effects of drought. Use of these practices over the longer term, according to ACDI/VOCA, can also reduce soil erosion (more of the rainfall is retained on fields) and rejuvenate degraded soils.
Sources: “Less Labor, High Yield Farming Practices” presentation (Lukungu, 2011); and discussion with John Wendt, ACDI/VOCA, May 2011.

4-15Agriculture, Natural Resource Management, Livelihoods, Income Generation
programs reporting separately on multiple crops. Fifteen programs reported having exceeded some or all of their targets: ADRA in Ghana, Honduras, Kenya, Madagascar, and Nicaragua; CRS in Burkina Faso, Haiti, and Madagascar; SC in Guatemala and Mozambique; CARE in Honduras and Kenya; ACDI/VOCA in Cape Verde; TNS in Ghana; and WV in Rwanda. Ten of these same programs also reported on not meeting their targets for some of the crops that they were promoting: the ADRA and TNS programs in Ghana; the CRS programs in Haiti; the ADRA and CARE programs in Honduras; the ADRA and CARE programs in Kenya; the CRS program in Kenya; the CRS program in Madagascar; the SC program in Mozambique; and the WV program in Rwanda. Most programs focused on measuring improvements in the yields of important food crops, including beans, cassava, groundnuts, maize, oilseeds, peanuts, pigeon peas, plantains, rice, sesame, sorghum, sunflower, sweet potato, and taro. In Honduras, ADRA also measured and reported on the yields of a variety of cash crops, including green peppers, broccoli, onions, tomatoes, potatoes, cucumbers, and cabbages.
Outcomes. During the FAFSA-2 time period, USAID/FFP, with assistance from FANTA-2, began focusing more attention on the development of outcome indicators, including those designed to measure rates of technology adoption, rather than production or productivity (yields). USAID/FFP began requiring its Awardees to collect and report on an indicator of agricultural technology adoption in 2007. FTF is also planning to require its implementing partners to report on the number of farmers and others who have applied new technologies or management practices
as a result of USG assistance. These types of indicators are important because they represent one of the major ways of measuring behavior change in the agricultural sector. They should also be of particular use to the Title II Awardees themselves as monitoring indicators to be tracked annually, assessed, and used as a basis for making adjustments in how they are implementing their programs, including helping them determine whether they need to make changes in the technology packages that they are promoting.
In September 2011, USAID/FFP issued new guidance on the outcome indicators for which Awardees will be expected to collect data in their baseline and final surveys. These requirements are applicable to programs directed to the achievement of four AG/NRM-related objectives, including increased access to improved agricultural practices and technologies (see Table 4.3).
During the FAFSA-2 time period, 23 programs in 17 countries reported on the percent of farmers adopting improved technologies and practices (i.e., more than 35 percent of the total programs included in the AG/NRM/LH sub-universe). Eighteen programs reported having achieved some or all of their targets: CARE in Bangladesh, Bolivia, Guatemala, and Madagascar; WV in Haiti, Kenya, Rwanda, and Uganda; Africare in Chad/Mali, Guinea, and Mozambique; CRS in Malawi and Uganda; FH in Bolivia and Mozambique; SC in Bangladesh and Mozambique; and PCI in Nicaragua. Eight of these programs also reported not meeting their targets for some of the crops they were promoting: the CARE and SC programs in Bangladesh; the Africare program in Guinea; the
Table 4.3. USAID/FFP Standard Outcome Indicator Required in Baseline and Final Surveys for Use in Title II Development Programs That Have Objectives Related to Agriculture, Natural Resources Management, and LivelihoodsApplicable to development programs that aim to: No. Indicator titleIncrease farmers’ access to improved agriculture (crop/livestock and NRM) practices and technologies.
14 Percentage of farmers who used at least (a project-defined minimum number of) sustainable agriculture (crop/livestock and/or NRM) practices and/or technologies in the most recent growing season (overall and disaggregated by sex).
Source: USAID/FFP, FFPIB 11-03, 2011.

4-16 Agriculture, Natural Resource Management, Livelihoods, Income Generation
CARE program in Madagascar; the Africare and SC programs in Mozambique; and the CRS and WV programs in Uganda. Most indicators were couched in more general terms (e.g., percent of households adopting improved technologies). Some specified numbers of practices (e.g., one, two, three, four, or five out of seven, or five out of ten). Others mentioned specific practices (e.g., using organic or commercial fertilizer, using improved seeds/planting materials, preparing fields without burning, planting in lines, using proper spacing between plants, using approved commercial or botanical pesticides, and adopting organic farming practices).
Yields and rates of technology adoption. The performance of the Title II programs with respect to both the technology adoption and yield indicators was mixed. The FAFSA-2 team attempted to use these data to assess whether any relationships could be discerned between rates of technology adoption and yields, but this also provided little insight. Only 7 of 38 programs reported on both technology adoption and yield indicators. Of these seven, four reported adoption rates improving and yields decreasing; one program reported adoption rates down and yields up, one program reported mixed results for its adoption indicators and yields decreasing, and one program reported mixed results for both indicators.
4.3.2.2 Natural Resource Management at the Farm Level
Soil and water conservation activities have been supported under Title II development programs as part of public works programs implemented on community/state lands and as part of packages of improved technologies and practices implemented by farmers on their own lands to increase their productivity and promote more sustainable farming systems. The public works activities, which were especially important components in many of the Title II programs implemented prior to the 1995 Policy Paper, are discussed in Chapter 5 on “Infrastructure.” The farm-focused activities are discussed here. The problem in trying to assess these programs is that much of the documentation on NRM activities is not clear on whether a given
component and/or activities within that component are focused on creating public goods and/or improving farm management systems. Many appear to have included both objectives. This lack of clarity in program descriptions can make it difficult to draw appropriate conclusions about individual Title II development programs, as well as at the level of the Title II program as a whole.
Conserving soils and improving their quality were/are of particular importance in many Title II programs. This is because of the poor quality of the soils in most areas where the Title II programs work and the reliance of the poor and food insecure farmers in these areas on the productivity of their land. Low soil fertility is a particular problem in much of Africa, but most of the poor, food insecure farmers in the programs in LAC—in Bolivia, Guatemala, Haiti, Honduras, and Nicaragua—were/are also relegated to farming on small plots in some of the less fertile and more mountainous and isolated areas of their countries.
The FAFSA-2 universe included examples of soil conservation techniques popular during the 1960s and 1970s that involved the construction of different kinds of terraces, embankments, and ditches—activities that often required moving large amounts of earth. These practices required considerable physical effort to build and maintain and produced benefits only in the long term, if then, which helps explain why so many farmers proved reluctant to adopt them.80 Resource-poor farmers, in developing countries in particular, cannot afford to make major investments in soil quality only to have the payback come years later. The same is true with respect to planting trees. Resource-poor farmers cannot afford to spend their scarce time planting trees on public land without some compensation. It is not that they are insensitive to environmental issues; it is that
80 Thediffusionofinnovationsliteratureidentifiestheimmediacy of the award as one of the key factors that can help increase or decrease the relative advantage of adopting a new innovation and argues that the lack of the immediacy of an award helps “explain in part why preventive innovations generally [also read many NRM and environment innovations] have an especially slow rate of adoption…” (Rogers, 2003, p. 233).
4-17Agriculture, Natural Resource Management, Livelihoods, Income Generation
they are too poor to be able to spend their scarce time on activities that do not have a more immediate payback. Planting fruit trees around their homes, on the other hand, was popular among farmers in many of the Title II programs because they were able to obtain direct benefits from many of these trees in one to two years.81
As extra encouragement to the adoption of program recommendations and to overcome farmer reluctance, many soil conservation programs began to offer subsidies to farmers, including cash payments and donated or subsidized tools. Having what seemed to be a positive way to use food to have a development impact also made these activities of interest to the Title II development programs. Being able to use food to encourage farmer adoption can appear to be a major advantage during the implementation phase, if the focus is on the number of trees planted or terraces built. On the other hand, if the objective is to have a sustainable impact on the environment, whether on individual farms and/or communal and state lands, better approaches are needed. A stronger case can be made for using food to pay farmers to work on public lands because these efforts, which are producing public goods, are not likely to be made otherwise, since the farmers involved will not be able to capture all the benefits from their own efforts. However, even in these cases, farmers and communities need to see an economic benefit from these activities in the near term to have an incentive to maintain them.
A more serious problem is created when food and/or cash are used to compensate farmers for applying these practices on their own land. When farmers are paid, one does not know whether these practices are adopted because of the payment or because farmers expect to benefit economically from them, with the former being more likely. The final evaluation of the CRS/Kenya program concluded, for example, that using FFW contributed a great deal to the expansion of the area under conservation in the program, but
81 Theamountoftimeittakesfromplantingtothefirstcropcan vary considerably by type and variety of fruit, and some programs also taught their farmer clients how to graft new/improved varieties onto old rock stock in order to shorten the timeuntilthefirstharvest.
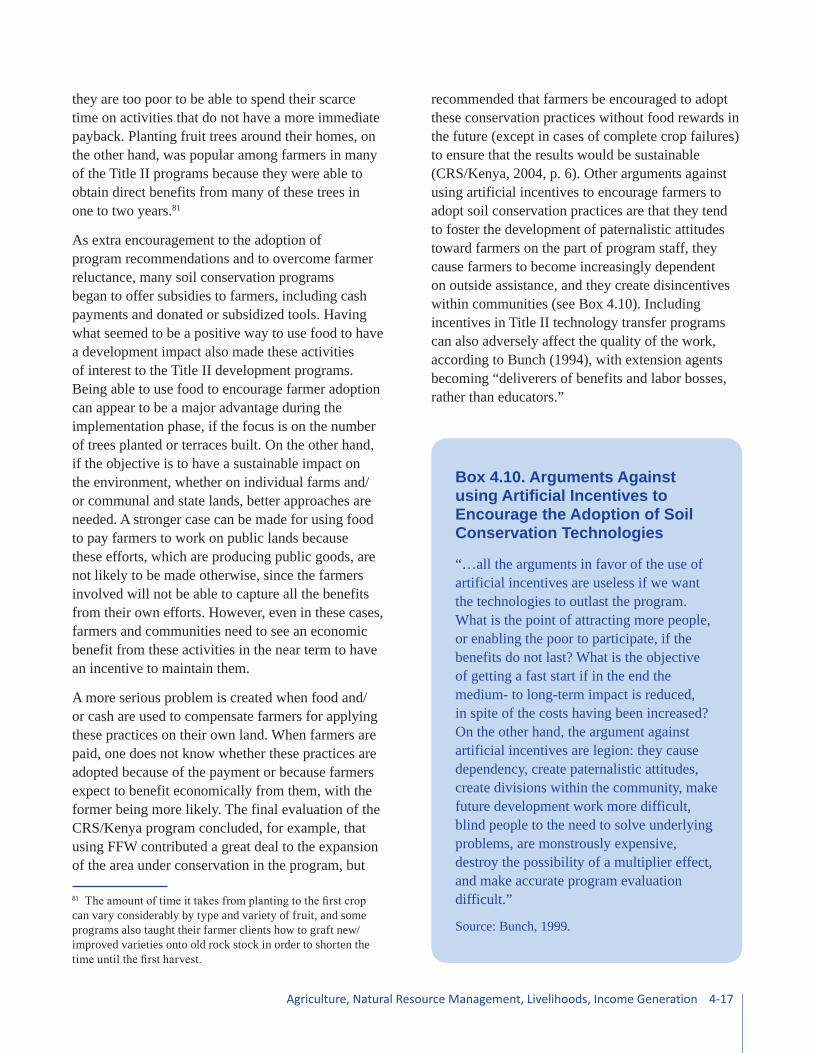
recommended that farmers be encouraged to adopt these conservation practices without food rewards in the future (except in cases of complete crop failures) to ensure that the results would be sustainable (CRS/Kenya, 2004, p. 6). Other arguments against using artificial incentives to encourage farmers to adopt soil conservation practices are that they tend to foster the development of paternalistic attitudes toward farmers on the part of program staff, they cause farmers to become increasingly dependent on outside assistance, and they create disincentives within communities (see Box 4.10). Including incentives in Title II technology transfer programs can also adversely affect the quality of the work, according to Bunch (1994), with extension agents becoming “deliverers of benefits and labor bosses, rather than educators.”
Box 4.10. Arguments Against using Artificial Incentives to Encourage the Adoption of Soil Conservation Technologies
“…all the arguments in favor of the use of artificial incentives are useless if we want the technologies to outlast the program. What is the point of attracting more people, or enabling the poor to participate, if the benefits do not last? What is the objective of getting a fast start if in the end the medium- to long-term impact is reduced, in spite of the costs having been increased? On the other hand, the argument against artificial incentives are legion: they cause dependency, create paternalistic attitudes, create divisions within the community, make future development work more difficult, blind people to the need to solve underlying problems, are monstrously expensive, destroy the possibility of a multiplier effect, and make accurate program evaluation difficult.”
Source: Bunch, 1999.

4-18 Agriculture, Natural Resource Management, Livelihoods, Income Generation
The approaches being promoted by the soil conservation community have been changing, however, with a growing number of practitioners coming to recognize that soil conservation practices, to be more widely adopted, need to provide concrete economic benefits in a much shorter time period.82 As a result, more recent innovations are moving away from an emphasis on building structures designed to stop water that is already running down the surface of the soil to simpler, less expensive solutions that focus on taking away the causes of erosion. These include maintaining high organic content in the soils; keeping the soils covered; reducing, changing, or ending tillage; and preventing compaction. Many of these techniques, such as green manure and cover crops, improved fallows, and using more live barriers with a greater variety of grasses, bushes, and trees can also provide additional economic benefits, including food, fodder, and firewood. The Title II programs in the FAFSA-2 universe were making progress in this direction, but more efforts/actions are still needed. In Bolivia, for example, programs began placing less emphasis on the promotion of stone structures (see Figure 4.3) during the FAFSA-2 time period and more emphasis on the development of live barriers and the integration of NRM with income generation activities (see Figure 4.4). According to the Bolivia Joint Final Evaluation, the farmers that built the stone terrace in Figure 4.3 “enthusiastically adopted other soil conservation methods, such as straw barriers and mulching instead of burning, but they would only build stone terraces for FFW, or to compete in a contest” (p. 222).
The FAFSA-2 universe also included efforts to better integrate soil conservation techniques with technologies and practices designed to increase yields and, in environments where water is a limiting factor, small-scale irrigation and water
82 Bunch argues that soil conservation will be sustainably adoptedbypoorerfarmersonlyifeachyear’sbenefitsmorethan counterbalance the costs (1999). A similar lesson was learned from an IFPRI analysis of the adoption of NRM techniques in Burkina Faso and Niger—that “farmers are more likely to adopt resources conservation techniques if at least one innovationorcomponentprovidessignificantbenefitsinthefirstorsecondyear”(Reijetal.,2009,p.57).
harvesting. In northern Uganda, the conservation agriculture technology package that ACDI/VOCA was introducing at the time of the FAFSA-2 field visit (see Box 4.9 and Figure 4.5) includes soil conservation as well as yield-increasing techniques. In southern Malawi, the conservation agricultural package that CRS and its consortium partners are promoting in their FY 2009–FY 2014 project, which is based on technology packages developed in Zambia, also includes a recommendation that farmers begin planting their crops in shallow basins (see Figure 4.6).83 These micro-catchments, which
83 The FY 2005–FY 2009 CRS project also included a conservation agriculture component, but it is being given more emphasis under the FY 2009–FY 2014 project.
Figure 4.3. A stone terrace in Bolivia that would not have been constructed in the absence of FFW
Jeffe
ry B
entle
y
Figure 4.4. A live barrier of alfalfa helps hold and fertilize the soil in a peach orchard in Bolivia
Jeffe
ry B
entle
y

4-19Agriculture, Natural Resource Management, Livelihoods, Income Generation
farmers are being encouraged to construct in their own fields, are a form of water harvesting that, when coupled with recommendations that farmers add manure, fertilizers, and/or mulch to these basins, also helps improve soil fertility.
Soil conservation and water harvesting activities were also promoted in a number of the Title II development programs in the Western Sahel, including the CRS programs in Burkina Faso and Niger. Specific techniques included the construction of water harvesting structures—zais (planting pits/holes), demi lunes (shallow depressions that are made in the soil in the form of half moons), stone walls, and grass strips—and the natural regeneration of trees in farmers’ fields. These Title II-supported NRM efforts were a small part of a much broader dissemination effort on the part of the development
community, which some observers have described as the “regreening of the Sahel,” since many of these practices have spread broadly within the Sahel, often solely on the basis of knowledge transferred through farmer-to-farmer exchanges.84 The final evaluations of the CRS Burkina Faso and Niger programs reported that the target farmers were particularly interested in adopting the zai and natural regeneration of tree systems and, in Niger, this happened in the absence of FFW or any other type of external support other than TA, training, and farmer visits (Robins et al., 2009; Gaudreau et al., 2009). Since the zais and demi lunes, which are another form of micro-catchments, are constructed within individual farmer’s fields (also the tree regeneration activities), farmers are able to benefit directly from any of the production increases stemming from their labors on these activities, which suggests that farmers should be willing to construct them on their own without subsidies, assuming that they are profitable. The macro-catchments that were also supported by these programs, such as the stone bunds and banquettes, are more in the nature of public works, since their benefits accrue to larger numbers of farmers and were/are less likely to be adopted in the absence of some form of subsidy (see further discussion in Section 5.3.3.2).85
Outcomes. Only 10 programs in the FAFSA-2 time period reported on the percentage of farmers adopting some measure of improved NRM practices. Eight reported exceeding their targets—the SC programs in Bolivia, Guatemala, Honduras,
84 The extent of this spread and its impact has been documented in a presentation on “Transformational Development in Niger” (McGahuey and Winterbottom, 2007) and in an IFPRI paper on “Agroenvironmental Transformation in the Sahel: Another Kind of ‘Green Revolution.’ ” The “regreening of the Sahel began when local farmers’ practices were rediscovered and enhanced in simple, low-cost ways by innovative farmers and non-governmental organizations. An evolving coalition of local, national, and international actors then enabled large-scale diffusion and continued use of these improvedpracticeswheretheybenefitedfarmers”(Reijetal.,2009, p. 53).85 CRS used FFW to promote the adoption of its entire menu of NRM practices in Burkina Faso, but Government of Niger policy required it to limit its use of FFW in Niger to the construction of banquettes, which are a form of macro-water catchments and are more in the nature of public goods.
Figure 4.5. Application of conservation agricultural techniques in northern Uganda
AC
DI/V
OC
A/U
gand
aFigure 4.6. Application of conservation agricultural techniques in southern Malawi
CR
S C
onso
rtium
/Mal
awi

4-20 Agriculture, Natural Resource Management, Livelihoods, Income Generation
Nicaragua, and Mozambique; the ADRA programs in Ghana and Madagascar; and the PCI program in Nicaragua—and one program reported meeting its targets—the CRS program in Nicaragua. It is not clear from these indicators, however, whether food rations had any influence on these adoption rates.
4.3.2.3 Irrigation
Title II development programs provided support to smallholder-focused irrigation activities in at least 15 countries during the FAFSA-2 time period: 10 in Africa (Burkina Faso, Cape Verde, Ethiopia, Ghana, Guinea, Kenya, Madagascar, Malawi, Mauritania, and Niger), 2 in Asia (Bangladesh and India), and 3 in LAC (Bolivia, Guatemala, and Nicaragua). The characteristics and size of these systems varied considerably, depending on the local context, but usually included some combination of gravity, manual, and diesel pumps and main and feeder canals to deliver the water from nearby rivers, springs, and/or underground aquifers to farmers’ fields by flooding the entire field, into basins or furrows, or through sprinklers or drip pipes (drip irrigation). A few programs provided minimal help—free vegetable seeds and watering cans combined with some training in improved production practices—to enable farmers to take advantage of water in nearby rivers or existing wells to plant small gardens during the dry season. Other programs were more ambitious and involved the construction of dams, relatively large water intakes along rivers, major canals, and smaller “overnight” storage reservoirs. Title II Awardees helped with the engineering designs and helped organize and train the water user groups needed to take over responsibility for operating and maintaining the systems. FFW was also used for some of the larger-scale activities, which were more in the nature of public goods, for example, the dams, the major canals, and the night storage reservoirs. (See Chapter 5 on “Infrastructure” for a more detailed discussion of the uses of FFW in irrigation projects as well as a discussion of some of the other water management and control activities that Title II development programs helped implement.)
Rationale for the Programs
Numerous mid-term and final evaluations emphasized the importance of irrigation in the context of the Title II programs, arguing that helping small farmers obtain access to water to irrigate their crops was one of the most important steps these programs could take to enhance the food security of their target populations. Many evaluations also argued that these programs should have done more to increase access to irrigation in their target areas. This included evaluations of programs in Bolivia, Ethiopia, Guatemala, Ghana, Guinea, Malawi, Mozambique, Nicaragua, and Niger. When improved access to water is combined with the provision of improved technologies, the impact on farmers’ incomes can be even greater than when the intervention involves only one or the other intervention. When farming areas are drought-prone and farm holdings are small, which is the situation facing many Title II client farmers, the only way that many of these farmers are going to be able to produce more is to increase their yields and/or harvest more crops per year. The team found numerous examples from the FAFSA-2 time period of Title II-supported irrigation systems that were doing both. That is, these systems provided farmers with a more assured source of water when it was needed for crop growth, which helped improve yields, and for more months, which enabled farmers to produce an additional one or two crops a year.
Examples of Systems Developed
Several programs in West Africa helped target farmers expand their access to water during the dry season so that they could make more money producing vegetables for sale (market gardens) and secondarily for home consumption.86 Several of these programs also supported the development
86 Market gardens are a common practice in West Africa, according to FAO, particularly in urban and peri-urban areas, and are also used in rural areas to grow vegetables for sale during the dry season. The use of watering cans to deliver water is also a common practice. Watering cans are cheap and provide farmers with considerable control over the application of the water, but, according to FAO, this is also a relatively labor intensive technology. FAO, p. 101.

4-21Agriculture, Natural Resource Management, Livelihoods, Income Generation
of new wells, including TNS in Ghana and CPI in eastern Niger. CPI/Niger had already financed the construction of several boreholes in existing wetlands (oases) at the time of the FAFSA-2 field visit and had provided groups of farmers with diesel pumps to make it easier to pump water into their fields (see Figure 4.7), along with TA and training in improved agricultural practices. One of the wetlands where CPI was beginning to work appeared to have tremendous production potential once the boreholes were drilled and the irrigation pumps installed, and was located close to good markets in northern Nigeria.
The SC/Bolivia program brought more than 230 new hectares under irrigation. The program got off to a slow start, due in part to its initial reliance on the municipal governments to develop the proposals and SC’s lack of in-house engineering capacity—problems that were corrected after its mid-term evaluation. The program concentrated on developing sprinkler irrigation (see Figure 4.8),87 which makes better use of the scarce water resources in the region than flood irrigation. It was also a better choice in areas where the slopes were moderate because the systems can be operated without having to make additional investments in the construction of terraces. These sprinkler systems are also simpler and require less labor to operate than gravity-fed systems. In addition, SC was able to connect its clients with private equipment suppliers, who had already begun providing limited amounts of TA to SC’s clients at the time of the final evaluation. SC staff also conducted value chain analyses for the priority products it had identified for these irrigation systems and worked with the farmers on technology transfer and marketing issues.
One hundred eighteen small-scale irrigation systems were built under the CRS/Malawi (I-LIFE) program (FY 2005–FY 2009), using a combination of Title II and OFDA resources. These systems benefited more than 6,000 households, with women accounting for 55 percent of the membership.
87 ThefinalevaluationreportedthatSC/Boliviahadestimatedthat the cost of developing these sprinkler irrigation systems was approximately US$3,500 per hectare. p. 12.
Five hundred sixty-three hectares were brought under irrigation—75 percent by diverting water from nearby rivers and 25 percent using treadle pumps to pump the water out of a river or shallow well88—with main and feeder canals distributing water to the farmers’ fields (see Figure 4.9). FFW was used in only five systems. The consensus of the staff that worked on the systems was that FFW “lowered the sense of ownership by the water users involved and creates an expectation of compensation in other developing schemes nearby” (I-LIFE Final Evaluation, Robins et al., 2008, p. 11). The exception was the use of FFW to develop the night storage reservoirs, which are more in the nature of public goods. Members of the I-LIFE
88 Thefinalevaluationreportedthattheestimatedcostofdevelopingthestreamdiversionwiththegravityflowsystemwas US$613 per hectare and US$808 per hectare for the shallow well/river using the treadle pumps system. p. 11.
Figure 4.7. Inspecting a recently completed borehole and pump in a wetland in eastern Niger
Eam
onn
Kilm
artin
/CP
I/Nig
er
Figure 4.8. Sprinkler irrigation and contour plowing that was part of the SC/Bolivia program
Jeffe
ry B
entle
y

4-22 Agriculture, Natural Resource Management, Livelihoods, Income Generation
consortium helped with the design of the systems. They also helped organize and train user groups in the operation and maintenance of the systems and helped communities and user farmers work through complicated and potentially contentious land tenure issues.
The Tomoyo irrigation project in Bolivia was a major undertaking for FH, diverting enough water to irrigate 600 hectares of land spread among three communities along a river valley. The construction of the intake that diverts the water from the river upstream and the main canal that delivers the water to the communities was completed during a previous FH/Bolivia Title II development program. During the project included in the FAFSA-2 universe, FH helped farmers systematize their plots for irrigation and finish the canals that deliver water to their fields, provided farmers with information on improved technologies and practices and marketing assistance, and helped organize and increase the capacity of the irrigation association to operate and maintain the system. FFW was used appropriately, that is, to pay community members for the work they did on the intake and the main canal (public works) but not for work they did on the feeder canals that delivered water to their fields or on their own fields. The number of cropping cycles per year increased over the life of the project from one to three, production became more diversified, production levels rose, and the value of sales through forward contracts and producers’ associations increased from nothing in 2002 to almost US$65,000 in 2008. Average
household income also increased from US$238 in 2002 to US$1,725 in 2008 (p. 134).
Providing Advice on Farming under Irrigated Conditions
Farmers also need information and advice on better practices with respect to farming under irrigated conditions, a step that not all Title II development programs in the FAFSA-2 time period paid enough attention to, based on comments in some of the final evaluations. Helping farmers understand that these water resources are still scarce and how to make the most efficient use of them was/is also important. Using water more efficiently means applying appropriate quantities at strategic stages in a plant’s growth. Using too little water can be wasteful, since it will not produce the desired effects, and using too much water (flooding) can be harmful, leading to nutrient leaching as well as inducing greater evaporation and salinization. Making more effective use of the limited water resources available was one reason why SC/Bolivia decided to focus on the development of sprinkler, rather than gravity-fed, irrigation systems in Bolivia. It is also why a number of other programs experimented with and promoted drip irrigation, including programs in Nicaragua and Niger.
Organizing and Strengthening Water Users Associations
Most programs also helped organize and train water users associations, which experience has shown are critical to the long-term sustainability of these systems. Programs helped organize these user groups and taught them how to maintain the systems and to develop simple operating plans, rules, and schedules for water distribution; set up fee structures and collect fees; and manage the funds that are necessary to cover the costs of operating and maintaining the systems. Helping users get organized and learn how to operate and maintain their systems needs to be a high priority in any irrigation development intervention.
Water is a common pool resource, which means that it may be owned by national, regional, or local governments as public goods; by communal groups as common property resources; or by private
Figure 4.9. Inspecting a main irrigation canal in southern Malawi
CR
S C
onso
rtium
/Mal
awi

4-23Agriculture, Natural Resource Management, Livelihoods, Income Generation
individuals or firms as private goods. The irrigation systems that the Title II Awardees helped develop were/are small. National and local governments were/are not willing or able to maintain and operate these systems, and individual farmers cannot manage these water resources on their own. So the people directly benefiting from the systems—the group of users—will have to. The sustainability of these irrigation systems, in other words, depends on the users being willing and able to continue to operate and maintain them once the project ends.
Standard economic models predict that resources owned in common will be exploited in the absence of clearly defined property rights, with individuals acting without regard for the effects of their actions on the overall resource pool. More recent research on the use of common resources, including by Elinor Ostrom, has found that people can devise rather sophisticated governance systems to ensure that these common pool resources continue to be used appropriately, which involves explicit rules about what people can use, what their responsibilities are, and how they will be punished if they break the rules.89 FAO analyses also suggest that keeping these small-scale, community-based irrigation systems simple and the number of users relatively small are important contributors to their success (including increasing the likelihood of their being sustainable) (Liniger et al., 2011). (Also see Box 4.32 in Section 4.5.4 on “Sustainability” for additional information on what has happened to four Title II-supported irrigation systems in Malawi since project support ended several years ago.)
In Malawi, the I-LIFE program (FY 2005–FY 2009) and now the WALA program (FY 2009–FY 2014) took extra steps to try to ensure that poorer households in the target communities would also benefit from the irrigation systems and not just the
89 In her book Governing the Commons, Ostrom described the rules needed to keep a commons going. These include rules about who can use resources and when; making sure that what is taken out of a commons is proportional to what is put in; ensuring that usage is compatible with the long-term health of the commons; enabling everyone to have some say in the development and application of the rules; and emphasizing the monitoringofabusesandconflictresolution,whichtendtobemore effective than sanctions and punishment (Ostrom, 1990).
land owners. This involved working out formal arrangements in each of the communities between households that owned the land within the planned irrigation perimeters and other potential users that gave the owners the right to continue to use their land during the rainy season, but to share its use during the dry season with others in the community that were willing to commit their time and labor to the construction of the systems and to their operation and maintenance. These can be complicated negotiations, and part of the training of these groups involved/involves negotiating skills as well as the more typical training in system operation and maintenance. These types of arrangements had been worked out and seemed to still be functioning in all four of the I-LIFE irrigation systems that the FAFSA-2 team visited during its field visit to Malawi.
Assessing, Using, and Protecting Water Sources
As part of the design and implementation of small-scale irrigation systems, issues also arise pertaining to the overall availability of the water resources being developed and the adequacy of the measures being taken to manage the use and protection of these water resources. Some issues were clearly more important in the longer term. One issue raised in both the mid-term and final evaluations of the four Bolivia programs related to climate change and how long the water resources that the programs were tapping into would continue to be available given the decline in the snow pack in the Andes. Other issues were more immediate in nature, including those that involved the harvesting of water from underground aquifers in programs in eastern and western Africa. The potential negative effects of pumping water out of these aquifers were recognized in several of the IEEs that were reviewed. These IEEs also identified a range of mitigation measures that could be undertaken, including advising user associations to limit the amount of water drawn from the aquifer to the water table renewal rate and building dams around the perimeters of the aquifer to help recharge the water table. However, it is not clear from the documentation available, or during the FAFSA-2 field visit in the case of Niger, that the programs that were actually being implemented were based on any

4-24 Agriculture, Natural Resource Management, Livelihoods, Income Generation
professional assessment of the overall amount of water available in the aquifers, what a proper usage level might be, and/or what effects these programs might have on these aquifers over time. In Ethiopia, the shallow well technology that was introduced by one of the projects in Tigray was so attractive that farmers in some valleys were digging wells on their own in much greater numbers than project staff had anticipated. One could have concluded that this intervention was a great success, and it was in terms of numbers of wells dug. But project staff expressed their concerns to the final evaluation team that all these extra wells could be having an adverse effect on the water table and undoing the efforts of their FFW activities, which were supporting the application of NRM practices on the hills surrounding these valleys designed to reduce soil erosion and increase water retention (CRS/WV FY 2003–FY 2005 Final Evaluation).
Issues of water rights were identified as problems in some of the documentation, as were developments downstream and upstream from Title II-supported irrigation systems. In some cases, the problems had to do with disagreements among farmers/communities over water rights. In other cases, they resulted from specific actions that farmer groups or communities took or did not take. Examples were cited of Title II irrigation programs that used so much water that not enough was left for communities downstream, for human consumption, or even for agricultural uses. In still other cases, Title II programs were adversely affected by actions of other farmer groups or communities upstream, for example, when they cleared land around the water source for the Title II irrigation programs, which reduced water retention and eventually water flow, or when they cleared land along the river/stream, which increased flooding downstream.
Although not always clear in the documentation, discussions in the field seemed to indicate a growing awareness on the part of Title II Awardee staff of the need to do more to help protect important water sources and to transfer this concern to the individuals and communities with which they were/are working. Awardee staff also raised concerns about the possible adverse affects of actions
being taken by other non-project communities. These concerns reflect the growing interest in the landscape effects of Title II interventions that occurred during the FAFSA-2 time period, among those involved with NRM interventions in particular. (See Section 5.3.3.3 for a discussion of landscape effects and integrated watershed management in the context of the Title II development program during the FAFSA-2 time period.)
Outcomes. Sixteen programs in the FAFSA-2 universe reported on one or more indicators related to irrigation: nine in Africa (Burkina Faso, Cape Verde, Ghana, Kenya, Madagascar, Malawi, Mauritania, and Niger), one in Asia (India), and six in LAC (Bolivia and Nicaragua). Only 11 of these programs reported on a common indicator—number of new hectares brought under irrigation—but 9 of these 11 programs (more than three-quarters) reported having exceeded their targets: ACDI/VOCA in Cape Verde, ADRA in Bolivia and Madagascar, Africare in Niger, CARE in Madagascar, CRS in Malawi, FH in Bolivia, and SC in Bolivia and Nicaragua.
Concerns were also raised about the high costs (per hectare) of some of the irrigation systems that were implemented during the FAFSA-2 time period and the fact that frequently only a small portion of the overall target populations seemed to have benefited from their development. These outcomes were identified as shortcomings in the CRS evaluation of its integrated watershed management programs in Ethiopia, for example (Herbert et al., 2010). The reality is that not all communities in the Title II target areas will be able to benefit from irrigation projects, starting with those that do not have access to sufficient water sources. Whether this should be interpreted to mean that none should benefit, which some people have suggested, seems questionable, especially given the fact that cost-benefit analysis techniques are available for Awardees to use to determine whether the returns to specific systems will be positive.
It is also a reality that not all community members will be able to benefit equally as producers from all irrigation projects. Some farmers own more land than others do, for example, and some may

4-25Agriculture, Natural Resource Management, Livelihoods, Income Generation
own land that is located above the main canal. On the other hand, considerable evidence also exists, including from Title II interventions, that many households that were/are not able to benefit directly, as producers, were/are able to benefit from the increases in other economic activities that occurred/occur as a result of the development of these systems. This can include, as it did in the case of the Tomoyo irrigation project in Bolivia: an increase in the demand for farm labor as a result of the increased number of crop cycles, the increased need for marketing and transport inputs and services, and the increased demand for consumer goods and services as a result of more people making more money. Many of these multiplier benefits are probably missed by the current Title II performance measurement system. Some are not captured because they are not measured—off-farm jobs created, for example—and others because the changes may take longer to take full effect and measurement stops when the project ends.
4.3.2.4 Storage
Reducing the percentage of food staples lost post-harvest was another strategy that some Title II programs used to try to increase food availability at the household level.90 Many proposals approved during the FAFSA-2 time frame emphasized the high level of post-harvest losses in the areas where they were proposing to work. The importance of reducing post-harvest losses as a key strategy for increasing food availability at the household level was also emphasized in the 2002 FAFSA.
Farm-Level Storage
Typical approaches used by Awardees to promote improvements in farm-level storage included providing farmers with information about improved storage techniques (e.g., treating grains with
90 Although many proposals still make reference to the hungry season, the large post-harvest losses, and the need to reduce these losses, most Awardees still seem to devote more effort to activities expected to increase food production rather than reduce losses. For example, 142 indicators out of the more than 1,000 AG/NRM/LH performance indicators in the FAFSA-2 universe were designed to measure changes in yields, but only 25 were designed to measure changes in post-harvest losses.
botanical and/or commercial pesticides prior to bagging and storing) and introducing farmers to improved storage facilities. Several types and sizes of metal silos were promoted in LAC programs, for example, and improvements to traditional storage units (building them higher off the ground and adding rat guards) were promoted in west, east, and southern Africa.
Awardees also had to deal with constraints to the adoption of the storage practices and facilities that they were recommending. A number of evaluations raised cost issues, suggesting that some recommended facilities were too expensive for Title II client farmers and, in particular, that the required initial cash outlays were too high. This was an issue raised in the ACDI/VOCA/Uganda program (FY 2007–FY 2011), for example, and in the joint final evaluation of the four Title II development programs in Guatemala (FY 2000–FY 2007). The problem of high initial costs led some programs to experiment with the development of group storage arrangements, providing a silo to a group of women on credit and/or at a subsidized price and encouraging them to use this as a basis for a micro-storage business. Several programs in LAC experimented with this approach, but found it to be very costly in terms of the time staff had to spend organizing the women and providing them with training in business management and bookkeeping. It was also not a very profitable way for the women to use their time. Household worries about possible theft of their grain stores was another reason given for not adopting the recommended storage facilities in Uganda and was also cited as a major concern by farmers interviewed by the FAFSA-2 team in Malawi.
The Title II program in Malawi (WALA) (FY 2009–FY 2014) that the FAFSA-2 team visited was providing its client farmers with information on a number of different storage options. Several consortium members had recently started experimenting with the use of a relatively new “green bag” technology. This plastic bag, which comes in many sizes, can be rolled up to create a vacuum that kills pests without the need for botanical or chemical pesticides. More

4-26 Agriculture, Natural Resource Management, Livelihoods, Income Generation
experimentation is needed to determine how well these bags will work under the conditions common to Title II clients; whether they are cost-effective will depend to some extent on their reusability. But the initial outlay is relatively small; plus, this new technology has the advantage of enabling families to keep their grain stores inside their houses and safer from theft.
Outcomes. Farmers’ performance with respect to the adoption of project-recommended improved storage facilities was quite mixed. The four programs that reported on the numbers of farmers using improved storage practices—CARE in Haiti, CRS in Guatemala, SC in Nicaragua, and TNS in Ghana—exceeded their targets. On the other hand, only two of the six programs that reported on the percentage of households adopting the recommended storage practices—SC in Guatemala and Africare in Mozambique—exceeded their targets.91 Numerous evaluations also cited poor adoption rates and the many constraints to adoption of improved storage techniques and facilities.
Community Storage
During the FAFSA-2 time period, a number of programs also supported the development of community storage facilities, using project funds to help build facilities and train communities in their operation and management. Community storage activities and other types of community-based, in-kind (also cash) revolving funds have had a poor track record, however, with funds/stocks declining in value, and they usually ceased to exist after several seasons. The community cereal banks (CCBs), which have been particularly popular interventions in the Sahelian countries in West Africa, are a variant of this approach. These CCBs, which are basically village cooperatives that buy, store, and sell basic food grains, became especially popular
91 Africaredefineditsindicatorasthe% [of households] adopting effective traditional storage systems. The four programs that reported on the percent of households adopting improved/recommended storage practices that did not meet their targets were ADRA in Madagascar and Nicaragua, FH/Mozambique, and TNS/Ghana.
among donors in the 1980s as a way of using the significant amounts of food aid that were coming into the Sahel in response to the droughts. The CCBs were effective as “slow release mechanisms for food aid,” as one observer put it, which can be a useful attribute in the context of a drought (Kent, 1998a, p. 14 and 1998b). It is also easier to stock a few dozen community grain banks with food aid than it is to use this food in FFW programs or as rations in a community-based MCHN program. The problem is that CCBs are not sustainable as institutions—their propensity for stocks to decline (the “slow release,” which is also referred to as “leakages”) is one of the reasons for their lack of sustainability. Proponents of CCBs consistently underestimate the difficulties involved in grain trading, which is a complicated, risky, and competitive business, and overestimate the ability of CCB managers, who are managing collective goods—not their own—which means that they have fewer incentives to manage efficiently or to minimize costs and whose inexperience coupled with the slowness of collective decision making and social pressures also leads to poor decisions on the timing and pricing of grain purchases and sales92 (see Box 4.11). There are also downsides to this option in terms of potential benefits forgone. When these leakages (the slow releases) occur, due to members borrowing food from the CCBs and not repaying it, for example, or unwise purchases or sales on the part of the CCB management, this food does not necessarily reach either the poorest in these communities or those in most need of nutritional support, such as pregnant and lactating women and children under two years of age.
92 A 2011 analysis of the CCBs in Niger by the USAID RegionalOfficeoftheInspectorGeneralandamorerecentassessment of the CCBs in several of the Sahelian countries by USAID/FFP’sWestAfricanRegionalOfficerecognizedthatthe CCBs have had a poor record with respect to sustainability but were overly optimistic about the likelihood of being able to improve the management of these institutions through training andimprovementsinmanagementandfinancialcontrolsgiventhe fundamental reasons why they continue to fail, which are described in the text and in Box 4.11.

4-27Agriculture, Natural Resource Management, Livelihoods, Income Generation
4.3.2.5 Marketing
By the end of the FAFSA-2 time period, the vast majority of Title II development programs included a marketing dimension. This was not always the case at the beginning of the time period, and programs still vary considerably in terms of the importance given to market issues and the timing of their market activities. The distinction between including marketing activities in a program and having a market-driven program is discussed in Section 4.5.1.1.
Marketing Strategies
Common marketing strategies used by Title II Awardees during the FAFSA-2 time period included:
(1) helping farmers get access to timely and reliable market price information, (2) encouraging farmers to sell as a group to increase their negotiating power and get higher prices for their products, (3) helping farmers identify and diversify into higher-value markets and products, and (4) facilitating linkages between client farmers and buyers of higher-value products.
Providing market information and analyses and analytical support. Some of the earliest market activities focused on helping farmers get access to more reliable and timely information on prices so that they would be able to identify and take advantage of opportunities in alternative markets. A number of the proposals approved in the beginning
Box 4.11. Why Community Cereal Bank Projects Rarely Work
Evidence from extensive research on grain markets in the Sahel indicates that grain trading is a risky, difficult, and competitive business. Buying grain right after the harvest, and storing and selling it during the hungry season, is no guarantee of making a profit, or even breaking even. Many proponents of CCBs overestimate the size of the price increases between the harvest and hungry seasons and vastly underestimate the cost of operating a CCB. The end result is that the vast majority of these CCBs go out of business, usually after project support ends, if not before. More than 1,200 of the 1,500 CCBs created in Burkina Faso before 1991 (80 percent) went bankrupt within five years of their creation, and a review of 100 CCBs created by FAO in Niger found that only 1 was able to survive after outside support ended.
Reasons for these high failure rates include: (1) a failure to recognize that net margins in the grain trade are thin, which leaves little room for error in trading; (2) CCBs frequently make management mistakes, with inexperience, slow collective decision making, and social pressures leading to poor decisions on the timing and pricing of purchases and sales; (3) CCB managers are managing collective goods—not their own—which means that they have fewer incentives for managing efficiently or minimizing costs; (4) speculative storage is riskier and less profitable than most people assume; (5) grain that is loaned by CCBs is frequently not paid back, contributing to the decapitalization of the stock; and (6) CCBs often suffer from corruption and support agents can also become “predators,” stealing money from the CCBs that they are supposed to be helping. The creation of a CCB can also have adverse effects on the longer-term food security of a village if it displaces private traders, breaks traditional relationships between traders and villages, or keeps these relationships from developing. Finally, since CCBs rarely make a profit, they are rarely in a position to subsidize other village activities, such as literacy training, which some proponents suggest is one of their strong points.
Sources: Kent, 1998a and 1998b.

4-28 Agriculture, Natural Resource Management, Livelihoods, Income Generation
the FAFSA-2 time period made references to using program resources to design and implement their own market information systems.93 Over time, more programs began to focus on what they could do to take better advantage of the price information already available from other sources, sometimes with the support of USAID (in Bolivia, for example) and other donors. This included supporting the dissemination of price information on local radio stations and using project volunteers to post price information in community centers. The next step for many programs was to help farmers begin to make use of these data so that they could improve their understanding of how local markets worked (market dynamics) and, in particular, determine whether there were price differentials between markets and/or seasonal price differences that they might be able to use to their advantage. Many programs did this analysis for their clients at the start, but many also eventually developed training programs to teach farmers how to conduct these analyses on their own.
The information environment has changed dramatically since the beginning of the FAFSA-2 time period, however, with the spread of cell phones to some of the poorest and more isolated areas where the Title II programs are located. The FAFSA-2 team met with many farmers in all five countries that had cell phones. Cell phones were/are in widespread use in Guatemala and Bangladesh, and their use was spreading fast in Malawi and Uganda at the time of the FAFSA-2 visit. Cell phones were introduced into the Title II program in Guatemala in the late 1990s, when one of the Awardees gave one each to several of its women’s groups that made money by charging local farmers that used them to call nearby markets to check on prices. Now small farmers in Guatemala are using their own phones to call buyers to check on buyers’ needs and prices. This included one small-scale onion producer in Guatemala, who explained to team members that he had just used his cell phone to check prices in several markets and decided that he could make more money by selling his onions
93 A number of these plans were never implemented, for example, in several of the Bolivian programs, as a result of these systems being developed by other organizations.
to the buyer who was willing to come to his farm than he could if he took them to the market himself. USAID and Awardee staff in Malawi and Uganda were also talking about the potential for making more effective use of cell phones to access price information, including by making use of “Esoko,” which is a mobile-enabled, cloud-based service to which users can subscribe that collects and provides content, including on prices, bids and offers, weather, and agricultural tips.94 In short, cell phones are quickly becoming a ubiquitous technology, but further efforts are needed within the Title II development program to identify cost-effective ways of helping farmers use this technology to greater advantage.
Promoting marketing by groups. Promoting collective sales was another of the early marketing strategies adopted by a number of the Title II programs implemented during the FAFSA-2 time period. The idea was that if farmers were able to sell their products as a group (i.e., in bulk), they would be in a stronger position vis-à-vis buyers and would be able to negotiate higher prices for their products. What is not clear, however, is whether farmers actually have to sell as a group to get the higher prices or whether they can also get the higher prices if they bring their produce together in one place but still sell as individuals. Much of the transaction costs to buyers can be reduced just by having sellers congregate in one place, so buyers could afford to pay sellers higher prices in either case. Efforts to promote sales by groups can also be costly, requiring Title II program staff to spend considerable time helping groups organize more formally and training them in business management and bookkeeping.95
Selling in bulk makes more sense for field crops, where the price differentials for quality that farmers can take advantage of are less likely to be available. But for higher-value products, where quality makes a difference, it may be preferable for farmers to
94 http://www.esoko.com/about/index.php.95 The issues of costs and opportunity costs are discussed further in Section 4.3.3.2, “Organizing and Working with Groups.”

4-29Agriculture, Natural Resource Management, Livelihoods, Income Generation
continue to sell as individuals so that they can capture quality premiums for themselves. For example, the clients of Emanuel International (part of the CRS WALA consortium in southern Malawi) were selling Bird’s Eye chilies at the time of the FAFSA-2 field visit. These farmers, mostly women, brought their chilies to one location, making it easier for the buyer, but sold their chilies as individuals, which enabled them to capture the higher price for premium quality (see Figure 4.10). Similarly, women in Bangladesh, who were part of SC/Helen Keller’s homestead gardening component, arranged to have their produce taken to the market at the same time, but each woman’s produce was sold separately, again ensuring that the benefits of any extra time and attention taken during the production and harvesting processes could be captured by that woman. The final evaluation of the CARE/Mozambique program also wrote positively about market facilitation by farmers’ groups, which involved “bulking, weighing and price and transport negotiation with traders—but with the group never actually owning the crop” (Selvester et al., 2006, p. 35). This model, according
to the final evaluation, can empower smallholder farmers within the existing market and requires less intensive training and continued support (e.g., with credit, legislation, bookkeeping, bank accounts) than to funnel all these activities through formal associations and associations of associations. (See Section 4.3.3.2 for a further discussion of CARE’s experience working with these farmers’ associations.)
Assessing markets and identifying priority products. The FAFSA-2 universe includes numerous examples of programs that helped their resource-poor clients switch to producing products for higher-value markets. This includes Bird’s Eye chilies (Malawi and Uganda); broad beans (Bolivia); French beans (Guatemala); potatoes (Bolivia, Guatemala, and Uganda); sesame (Mozambique); peanuts (Mozambique); onions (Bolivia and Guatemala); tomatoes and green peppers (Nicaragua); peaches, plums, and grapes (Bolivia); cashew nuts (Mozambique); milk (Bolivia and Zambia); and several indigenous crops (organic
Figure 4.10. Women farmers in Malawi selling Bird’s Eye chilies for export
Dr.
Jaya
chan
dran
Vas
uden
evan
/CR
S (E
man
uel
Inte
rnat
iona
l)/M
alaw
i

4-30 Agriculture, Natural Resource Management, Livelihoods, Income Generation
maca, a medicinal product, and amaranth in Bolivia) (see Box 4.12). Some of these products were new to the farmers—Bird’s Eye chilies in Uganda and Malawi, French beans in Guatemala, and potatoes in Uganda. In other cases, the products were already being grown by farmers in the target area, and the programs helped farmers make changes in the quality of their products and how they marketed them so that they would be saleable in higher-value, often niche markets.
Many programs did much of the initial analyses of market potentials themselves, looking for markets for products that were of high value and for which there was a growing demand, and then assessing
the production potentials in their target areas.96 The more effective programs began to involve their farmers and farmers’ groups in the market assessments, having learned that assessing markets is an ongoing process and one for which farmers are eventually going to have to take responsibility. Going to the source was also important.97 So, priority activities included taking groups of farmers to visit with potential buyers (including supermarkets, wholesalers, processing plants, and regional and national food and agricultural fairs) about their immediate requirements, as well as to gain perspectives on market conditions in the future.
In addition to information on the quantities demanded, these analyses also collected information on the unique demands of each market with respect to the quality required (e.g., the variety, size, shape, and color of the product) and timing. With this information, programs were able to help their client farmers change how their products were harvested, dried, packed, shipped, and presented and when they were marketed, a little earlier or later than their main competitors, for example. A few programs, for example CARE in Bolivia and ADRA in Nicaragua, also introduced the idea of calendarization, which is a planting/harvesting system frequently used for horticulture crops. The basic idea is that if farmers take a longer time to plant the crop (a month instead of a week, for example), harvests and sales can also take place over a longer time period, which enables farmers to average their sales prices over a longer
96 Determining production potentials is also important, i.e., determining whether a product can be physically produced in thetargetareasandatapotentialprofit.OthercriteriausedinTitle II market-oriented programs to identify priority products included: whether small producers could have a competitive advantage; whether the Title II clients would be able to differentiate their products in some way, including by placing their products in the market before or after current suppliers; and whether there were any potentials for generating additional employment, both on- and off-farm.97 This was also one of the lessons learned by a USAID-financedprojectinEthiopiadesignedtoexploretheuseofmarkets to alleviate extreme poverty. “Establishing a real dialogue between local market actors leads to the most reliable market information. The best way to understand the opportunities and constraints in the market is by talking to the actors on the ground—they know better than anyone” (Chemonics International, 2007, p. 42).
Box 4.12. Examples of Priority Products and Market Linkages Developed during the FAFSA-2 Time Period
• Bolivia/ADRA: Sale of fresh peaches in high-end fairs and dried peaches to processors
• Bolivia/FH and SC: Sale of milk to dairy processors
• Bolivia/SC: Sale of premium and branded potatoes to supermarkets in the capital city
• Guatemala/CRS: Export of French beans
• Guatemala/SHARE: Sale of potatoes to a potato chip processor
• Malawi/CRS (Emmanuel International): Export of Bird’s Eye chilies
• Mozambique/CARE: Export of organic groundnuts
• Nicaragua/ADRA: Export of green peppers and tomatoes to the U.S. market
• Uganda/Africare: Sale of potatoes to fast food restaurants in the capital city
• Zambia/LOL: Sale of milk to collection centers/processors

4-31Agriculture, Natural Resource Management, Livelihoods, Income Generation
period and, hopefully, avoid selling their entire harvest at the lowest point in the market. In Bolivia, several Awardees also developed branding programs for some of the products intended for higher-value, niche markets, including developing logos and attractive advertising materials and packaging.
Promoting and facilitating market linkages. Over the FAFSA-2 time period, a number of programs became more active, adept, and successful in promoting and facilitating market linkages for their farmer clients. This included: helping farmers identify and make contact with specific buyers in specific markets; facilitating deals with these buyers, including developing forward contracts; helping with initial negotiations between their Title II clients and potential buyers; and encouraging the development and strengthening of these relationships.
Many programs included in the FAFSA-2 time period focused initially on organizing their clients into market groups/associations and providing them with training on a variety of marketing topics, with the apparent expectation that farmers would be able to translate their knowledge into practice largely on their own. This approach did not always work that well, as SC/Bolivia learned (see Box 4.28). In addition, the more successful programs learned that they needed to take a more proactive approach, using their project staff to help guide their clients through new and unfamiliar business practices in what for their clients can be very unfamiliar environments. In LAC, this process of providing hands-on guidance and support was referred to as acompañamiento, which can be translated as “accompanying,” but in English, the word “mentoring” is more applicable.98
Outside help in initiating and facilitating market linkages between Title II farmers and buyers can be
98 A recent book focused on creating jobs for the poor describes this role as follows: “But, what they [the clients] most appreciated was the ESC [Economic Service Center] advisors accompanying them in new and unfamiliar business transactions. Whether in discussing prices or delivery dates or quality standards, the ESC advisors were there to help clients interpret,understandandgainconfidenceinthemselvesandtheir business partners. In short, they drew strength from the ready access to an independent third party willing to serve as a sounding board for testing ideas and as a source of objective advice and encouragement” (Riordan, 2011, pp. 84–85).
extremely important to building farmers’ confidence and also trust among the parties in the market chain. This is even more important when there are class, cultural, ethnic, and language differences between the Title II clients and buyers, situations that are common in some Title II countries, and/or when the buyers represent larger processors, for example, or supermarkets and exporters. The objective is to facilitate the development of these linkages, not to do the work for their clients, an approach that some marketing programs were criticized for during the 2002 FAFSA and FAFSA-2 time periods. Instead, the better practice, as SC/Bolivia learned, was to let their clients take over more responsibility for their own marketing activities over time as the clients learned the ropes and gained confidence (Piper, Zavaleta, and Scavone, 2010). In CRS’s case, its active involvement in the global CIAT-supported Agroenterprise Learning Alliance helped lead it to start putting more emphasis on working with local actors and the private sector to facilitate changes in market chains rather than on providing goods and services (CRS, 2009b).
Programs implemented during the FAFSA-2 time period helped link their clients to a wide range of buyers, including: small and large firms; cooperatives and private sector businesses from local, regional, and international markets; and small traders, wholesalers, exporters, processors, supermarkets, and restaurant chains. Decisions with respect to which organizations to work with are site-specific and need to be based on a variety of factors in addition to whether they are large or small or cooperatives or private sector businesses. Several programs were criticized in the 2002 FAFSA for relying too heavily on larger firms. Experience during the FAFSA-2 time period, on the other hand, provides many examples of the benefits that can be gained from working with larger firms (see Box 4.13).
Awardee Marketing Capacity
The 2002 FAFSA noted that few Awardee field staff were trained and/or had experience in marketing, business administration, and/or economics. This was still a problem during the FAFSA-2 time period. Agronomists were still likely to be put in charge

4-32 Agriculture, Natural Resource Management, Livelihoods, Income Generation
of marketing programs at the field level, and, even if they had some training in market development and business, production problems still tended to get priority attention. This problem was noticeable during a number of the field visits, including visits to programs in Guatemala, Niger, Malawi, and Uganda. This is one reason why many programs that were designed with a relatively strong emphasis
on marketing still ended up being too production oriented.
Outcomes. Sixteen of the programs in the FAFSA-2 universe reported on a sales indicator, with three-quarters of these indicators exceeding their targets. Programs that reported increases in sales included ADRA, CARE, FH, and SC in Bolivia; TNS in Ghana; FH in Kenya; WV in Mozambique; SC in Uganda; and LOL in Zambia. Tracking changes in the value of sales made through forward contracts and producers’ associations proved to be a useful indicator in these market-oriented, agricultural-based income generation programs. The data, which are easily understood, were also fairly easy to collect through these programs’ monitoring systems and were reported on annually. Having sales information also made it easier to understand the links between project production and marketing strategies and their impacts on incomes and assets.
The data from the Bolivia programs are interesting (see Figure 4.11) because the sales numbers can be related to the programs’ marketing strategies. According to the joint final evaluation of the four Bolivia programs (pp. 10, 108), for example, ADRA, which had a market-driven approach from the beginning, saw a significant increase in sales even during the first year of its project. The sales figures for the FH and SC programs, on the other hand, did not really begin to take off until FY 2005–FY 2006, after the mid-term evaluation and after they, SC in particular, recast their programs to give them a stronger market orientation. The value of sales facilitated by ADRA might have increased more substantially toward the end of the project had it not been for the adverse effects of El Niño on production and post-harvest losses in more than half the ADRA program area.
In the 2011 FFPIB 11-03, USAID/FFP also included an indicator related to the adoption of improved marketing practices (see Table 4.4). While useful as an indicator of one type of outcome, it is lower in the hierarchy of indicators leading up to improvements in household incomes and food consumption than the value of sales indicator. This outcome indicator also lacks the body of evidence that exists confirming the link between the adoption
Box 4.13. Examples of Advantages of Working with Larger Firms Noted in Title II Program Evaluations
It may be easier for larger firms to buy through forward contracts, for example, a mechanism that can provide small farmers with some degree of price stability. Many large firms are also in a better position to assess market demand and develop and promote new products than are the Title II small-farmer clients. Plus, these larger firms may frequently find it to their benefit to provide their suppliers with what are referred to as “embedded services.” That is, these firms are in a position to provide and may benefit from providing their suppliers with the market intelligence and/or technology packages and TA that will enable these suppliers to better meet the firms’ requirements. The availability of embedded services can be important to sustainability, particularly in cases where government services are weak or nonexistent. Making contacts with and learning how to work with larger firms has been particularly important in some Title II programs with respect to export markets, where larger firms have more contacts and should find it easier to track what is happening in overseas markets, anticipating and identifying changes earlier, than smaller farmers could, whether operating individually or as part of a group.

4-33Agriculture, Natural Resource Management, Livelihoods, Income Generation
of a given set of agronomic practices and/or the use of improved seeds and increases in yields, for example.
4.3.2.6 Livestock
Approximately one-quarter of the programs in the FAFSA-2 universe included livestock activities, usually in addition to crop activities. In a few cases—the LOL dairy program in Zambia and several pilot programs working with pastoralists in Ethiopia—the focus was solely on animals. A few programs were focused on larger animals, including cattle (the FH program in Kenya) and dairy cattle (in addition to the LOL program in Zambia mentioned previously, the FH and SC programs in Bolivia also helped link their clients to dairy value chains). The CARE program in Bolivia also included value chains focused on the markets for sheep and llama meat and fiber. More programs chose to focus on small animals (including goats, sheep, pigs, and rabbits) and poultry in an effort to help households
diversify their income sources and/or household diets. These included programs in Burkina Faso (Africare), Ghana (OICI), Guatemala (CRS, SC, and SHARE), Nicaragua (CRS, PCI, and SC), and Rwanda (CRS and WV). Most programs included some combination of the following interventions: the introduction of new breeds to improve the breeding stock; the distribution of animals to poor and/or women-headed households, often through some form of animal pass-on system99; the promotion of improved management practices (e.g., improved pastures, penning animals and adopting cut and feed practices, and improved shelters); and support to improved animal health (e.g., training community-based livestock health workers [paravets] and facilitating access to veterinary medicine, including through initial grants or loans to the paravets).
The most successful livestock programs, including from a sustainability perspective, seem to be those that were developed using a business model. This included the FH market-driven livestock program in Kenya, the development of community-based paravets in a number of programs in Africa and LAC, and the LOL dairy value chain in Zambia and the FH and SC dairy value chains in Bolivia.
Development of a Livestock Market
In 2004, when FH expanded its Title II development program into the lowlands in northern Kenya, it decided to increase its focus on livestock, in addition to crop agriculture, because livestock was an important source of income for the target
99 Some animal distribution programs require recipients of an animaltopassonacertainnumberofthefirstchicks,goats,orpigs to other people in the community. Programs vary in terms of the numbers of animals expected to be passed on and the number of pass-on cycles.
Figure 4.11. The Bolivia Title II Development Programs: The Value of Sales made through Forward Contracts and Producers’ Associations
0
100
200
300
400
500
600
700
800
2002 2003 2004 2005 2006 2007 2008
ADRA CARE FH SC
Cur
rent
US$
(000
)
Table 4.4. USAID/FFP Standard Outcome Indicator Required in Baseline and Final Surveys for Use in Title II Development Programs that have Objectives Related to Agriculture, Natural Resources Management, and LivelihoodsApplicable to development programs that aim to: No. Indicator titleImprove farmers’ marketing of agricultural products
15 Percentage of farmers that participated in post-harvest value chain activities in the most recent growing season (overall and disaggregated by sex).
Source: USAID/FFP, FFPIB 11-03, September 2011.

4-34 Agriculture, Natural Resource Management, Livelihoods, Income Generation
groups in the new area. The program focused on the market, including putting in the physical infrastructure needed to support the development of livestock markets in six sites. Livestock trade was already present at all six sites at the beginning of the program, along with trading in other goods and services. FH focused on helping transform these sites into permanent markets, equipping them with loading ramps, enclosures for animals, and auction blocks. These structures were constructed with some community support, primarily labor compensated with FFW, and contributions of local materials, including sand and stone. FH hoped to regularize livestock trade in the area, opening it up to a wider market, promoting more competition among prospective buyers, and raising the market value of animals. The vision behind this intervention was that of a series of competitive markets, managed by livestock marketing management committees, which would attract buyers from larger population centers as far away as Nairobi willing to pay increased prices for quality animals. FH also helped organize and train these market management committees, helping to ensure that they were broadly representative of various interest groups, including both sellers and traders.
Outcomes. The FH program came close to or exceeded the final targets that it had set for the mean annual value of livestock trade in the markets it had developed, despite the adverse effects of the 2005–2006 drought. Income from livestock production also more than doubled between 2006 and 2008 among target households. The final evaluation in 2008 concluded that the markets were being used and valued, despite the drought and the closure of some markets due to quarantine regulations (Robins et al., 2008, p. 38). Drought continued to be a problem into 2010, according to the preliminary results from the Tufts sustainability study, reducing market use and the collection of user fees (Coates and Kegode, 2011).
A Fee for Service Model for Providing Animal Health Services
Several Awardees included a community-based animal health worker or paravet component in their programs during the FAFSA-2 time period,
including FH in Kenya and CARE, FH, and SC in Bolivia. These programs trained community members in basic animal health practices and provided them with veterinarian supplies and medical kits. Animals are an important component of many small farmers’ operations in countries where Title II programs work, and these programs seem to be a cost-effective way of expanding poor farmers’ access to basic health services for their animals. Keeping animals alive and healthy can have a major positive impact on farmers’ asset bases and incomes, even in the absence of other programs designed to introduce improved production practices and/or upgrade local breeds.
The concept of a community-based animal health worker was not new in northern Kenya where the FH program was working, having been promoted by several other donors in the 1990s. So FH focused its efforts on strengthening the existing system and extending it to the lowlands, which were more heavily pastoral. In Kenya, FH also adopted a business model approach to the delivery of these animal health services from the beginning of its program, as did SC in Bolivia. CARE and FH took a different approach in the beginning of their programs in Bolivia, starting with the idea that the paravets could be the focal point for a community-based enterprise, with the communities setting the fees and the paravets depositing part of their fees into a revolving fund to be managed by the community. But both programs switched to a business model approach in response to one of the mid-term evaluation’s recommendations. In Kenya, FH provided the training in collaboration with the Ministry of Livestock and Development and FARM Africa (a United Kingdom-based NGO), while in Bolivia most training was done in collaboration with local universities.100 The technical training focused on animal diseases and treatment; the use of drugs; and preventive care, vaccinations in particular. In Bolivia, the programs also provided the paravets with training in how to set up and run a microenterprise, set fees (charging enough to
100 SC/Bolivia had an agreement with the Bolivian Catholic University, for example.

4-35Agriculture, Natural Resource Management, Livelihoods, Income Generation
cover the costs of their time and to replenish their supplies), and keep accounts.
Outcomes. Preliminary findings from the Tufts sustainability study indicate that: (1) considerable demand for paravet services still existed two years after the FH program ended in Kenya, (2) the fee for services model enabled paravets to purchase the needed medical supplies and to earn a living, and (3) links between the paravets and the Department of Veterinary Services continued to be mutually beneficial (Coates and Kegode, 2011).
Development of a Dairy Value Chain
The LOL/Zambia dairy development program was initially designed to be active at all key points along the dairy value chain in Zambia, with the ultimate objective of increasing the incomes of vulnerable households through the sales of milk and other dairy products. The program, which had a strong business and marketing orientation, was also clearly designed to focus on smallholders and vulnerable households.
Key intermediate results included:
• Increasing milk output of the smallholder farmers, through the distribution of improved in-calf dairy animals (a pass-on scheme where each recipient of an improved dairy animal passes on the first born female animal to another recipient household) and the provision of artificial insemination services to improve and/or maintain the genetic quality of the animals owned by the clients
• Increasing the quantity and quality of raw milk supplied by smallholder producers to milk processors, through the provision of TA in animal nutrition and health, pasture establishment and management, and milk quality assurance
• Providing market linkages, through the formation of farmers’ associations and cooperatives; the establishment of and support to milk collection centers, where clients sell and bulk their milk; and the provision of market services through the facilitation of linkages to dairy processors.
The third component was taken out of the Title II development program after the 2006 mid-term
evaluation, however, and moved to a related USAID-supported LOL program. This decision was fortuitous, since it is doubtful that the program could have achieved its income objectives for smallholder dairy producers in the absence of any work further up the value chain, and in particular the work done to help establish and support the milk collection centers. The milk collection centers, in fact, were crucial to being able to successfully link small, widely dispersed dairy producers to a growing market that was dominated by urban-based, bulk, private sector milk processors that did not even consider the small farmer as a source of milk. Over time, LOL was able to successfully link its target groups to the two largest milk processors in Zambia as well as a considerable number of medium and smaller processors.
LOL partnered with Heifer International, which handled the animal distribution component of the program. Most of the more vulnerable households in the LOL target areas did not have cows of their own. Therefore, including the in-calf heifer distribution component was an essential mechanism for ensuring that these households would be able to participate in the program. The distribution component did suffer from a number of problems that seem to be characteristic of many of these components: too many animals died, especially at the beginning of the program; many animals did not come into heat; and a larger number of bull calves were born than were expected. The end result was that the number of calf pass-ons did not come anywhere near the program targets, according to the final evaluation, but the herd size did keep growing (55 percent according to one estimate), which may have helped encourage some of the potential recipients to continue to believe that they might eventually receive their pass-on animal.
Several factors contributed to making this program a success, according to the final evaluation, where other animal distribution programs have failed. This included the fact that LOL/Zambia had an experienced partner in Heifer International, which also had a long-term commitment in the project area. LOL also took a very aggressive stance with respect to managing the pass-on component, insisting that

4-36 Agriculture, Natural Resource Management, Livelihoods, Income Generation
animals (either the original in-calf heifer provided to a recipient or a pass-on calf) be repossessed if poorly managed, a strategy that resulted in program participants taking the management practices that were recommended by the project more seriously than they might have otherwise. But in the end, it was probably the existence of a profitable and growing market for their milk that was one of the most, if not the most, important incentives to all the farmers participating in the LOL program, and not just those that had received or were still anticipating receiving an animal.
Outcomes. The project was able to exceed its targets for the value of milk collection center sales by 211 percent and increases in average household incomes by 125 percent. Households also benefited from the fact that milk sales produced a steady stream of income, unlike crop sales, and that peak incomes from milk sales coincided with the former “hunger months.” The final evaluation also estimated that the entire US$10 million cost of the project would be recovered in terms of a positive
net gain within two years after the end of the project (Swanson, 2009, pp. 9–10).
Small Animal Programs
Relatively little information is available on the small animal interventions in the FAFSA-2 universe. What information is available, however, suggests that most faced many problems and achieved limited success.101 The interventions that seemed to work best were the ones that focused on the distribution of an animal asset and did not require an animal pass-on. For example, they provided a baby goat to the poorest women in a community, as the CARE and SC programs did in Bangladesh, and the women fed it, sold it, and bought two goats or another more valuable animal. Animal health could/can be a problem, and difficulties in finding sufficient feed
101 The animal distribution activities were among the least well documented of the Title II livestock interventions. Only one program, the OICI program in Ghana, included indicators in its IPTT that were designed to measure the performance of its small animal pass-on program, and the results, in terms of the program meeting its targets, were disappointing.
Box 4.14. A Dairy Value Chain in Bolivia
The dairy value chain that SC/Bolivia helped develop was only a small component of its overall program, and its geographical impact was much smaller than the LOL program in Zambia. Still SC’s experience illustrates some of the factors that can be important to the success of a dairy value chain: current demand was strong and the market was growing; the price producers received for their milk was attractive and they could produce and sell milk year round; the dairies bought their milk on contract, which helped mitigate price risks to farmers; and the dairies also provided the producers with TA and access to improved feed. SC’s contributions to this chain, which were numerous and varied, also provide a good illustration of how the value chain approach helped SC better integrate its activities. SC helped build the road that made it possible for the milk producers to get their milk to market during the rainy as well as the dry season. SC’s marketing specialists helped make the initial contacts with the dairies and facilitated the development of the forward contracts. Once the links were made to the market, a number of other activities that SC had initiated earlier in its program began to have more value to the milk producers. This included SC’s agricultural technicians that provided TA in forage production and animal nutrition; the paravets SC trained, who became available to provide veterinarian services; and the atajados (stock tanks) and family stables that were constructed with SC assistance, which contributed to increased milk production—the atajados by increasing animals’ access to water year round and the stables by providing them protection from the cold.
Source: Bolivia Joint Final Evaluation (van Haeften et al., 2009).

4-37Agriculture, Natural Resource Management, Livelihoods, Income Generation
limited the number of animals these women could handle at any one time, but the basics of rearing these animals were known to them and markets existed, particularly at the time of the Muslim holiday of Eid. On the other hand, if an animal—or other asset—was/is provided within the context of a value chain, as was the case with the LOL dairy program described previously, it was likely to have more value.
The problems seemed to arise when the interventions got more complicated. Awardees established a pass-on system in an attempt to expand the number of people reached by the asset transfers. Awardees added a nutrition objective to their program, trying to get mothers to feed goat milk to their young children, in the absence of a tradition of doing so. They tried to improve the breeding stock by using new breeds in their distribution programs and/or implementing artificial insemination programs, and/or they tried to introduce new management practices, encouraging clients to pen the animals and to adopt a cut and feed system instead of their traditional system of letting the animals free range. These more complex small animal interventions can require significant amounts of Awardee staff time to be successful. But, since these activities tended to be add-ons, the level of support needed was often not programmed or available. On the other hand, it is also not clear that more resources should have been devoted to these activities, since diverting more staff time to what were considered to be more marginal activities could have had significant opportunity costs in terms of less progress on other higher-priority activities.
Outcomes. The few evaluations that included any discussion of these programs tended to cite the problems involved in making them work and to suggest that the pass-on system was not likely to continue to function beyond the first or second cycle and certainly not beyond the life of the project. FH’s experience with goats in Kenya seems to be somewhat typical of many of these programs. The introduction of dairy goats was intended to provide community groups with an asset that would provide additional income and augment the family food supply, through increased milk production,
and improve children’s nutritional status. The groups had numerous problems, however: goat care was very labor intensive, particularly with the introduction of the cut and feed management practice; the goats introduced were susceptible to disease; milk yields were mixed; and slow breeding was a problem. The conclusion of the final evaluation was that the component had a very low probability of sustainability because the groups were still too dependent on FH for inputs, breeding and production results were low with respect to targets, and owners found the special care that the goats needed was a drain on their resources (Robins et al., 2008, pp. 42–43). The goat distribution programs in Guatemala also seemed to be beset with many of these same problems, based on what was seen during the FAFSA-2 team visit.
4.3.2.7 Rural and Agricultural Finance
Two of the Title II development programs included in the FAFSA-2 universe had a separate SO focused on improving their clients’ access to finance (CARE in Kenya and ACDI/VOCA in Cape Verde). At least 20 other programs included some rural and/or agricultural finance activities in their programs, 9 as separate IRs under their agricultural SO (Africare in Chad/Mali; TNS in Ghana; ACDI/VOCA in Uganda; CRS in Malawi; ADRA, FH, and SC in Bolivia; CARE and SHARE in Guatemala; and ADRA and CRS in Nicaragua).
These programs varied considerably in terms of their focus and approaches—whether the Awardees were focused on:
• The poor—helping develop microfinance institutions (MFIs) (e.g., ACDI/VOCA in Cape Verde and WV in Mauritania).
• The rural poor—helping organize and develop community-based savings and loan groups (e.g., CARE in Kenya, CRS in Burkina Faso, the CRS consortium in Malawi, and ACDI/VOCA in its FY 2007–FY 2011 program in Uganda).
• Small resource-poor farmers—experimenting with alternative ways to supply agricultural credit to the clients of their agricultural programs, either

4-38 Agriculture, Natural Resource Management, Livelihoods, Income Generation
directly and/or by linking them with other credit-providing institutions, including rural-based MFIs and commercial banks (e.g., FH and SC in Bolivia; ADRA, CRS, and PCI in Nicaragua; CRS and SHARE in Guatemala; and ACDI/VOCA in Rwanda).
The Title II development programs used their resources to help organize and train community savings and loan groups and to support the development of MFIs, cooperatives, and associations, providing them with TA and training and, in the case of some MFIs and cooperatives, seed capital.
Microfinance
The MFI component in ACDI/VOCA’s FY 2003–FY 2009 program in Cape Verde was probably the most significant MFI program undertaken during the FAFSA-2 time period in terms of resources and impact.102 The final evaluation of the program in late 2005 credited ACDI/VOCA with the development of the entire microfinance sector in Cape Verde, including stimulating interest on the part of the Bank of Cape Verde in establishing a legal framework for the sector. The ACDI/VOCA program worked on a number of the islands over the years with a variety of different credit organizations, including banks, women’s organizations, and microfinance associations, providing them with technical support, training, and, in some cases, seed capital. These programs were urban-based, however, with most of the credit being used to finance non-farm business and trading opportunities. ACDI/VOCA’s ventures into agricultural credit—the creation of a fund at a local bank that farmers could use to invest in drip irrigation, for example—were much less successful. Drip irrigation had been a key intervention in both of ACDI/VOCA’s Title II development programs, but the lack of a viable long-term mechanism for providing capital for investment in drip irrigation remained an issue at the time of the final evaluation (Langworthy et al., 2005, p. 5).
102 This program was a follow-on to the MFI component in ACDI’s previous Title II development program and to a USAID-supported Micro Enterprise and Training Program that it had managed from 1997 through 2001.
Providing support to the development of MFIs was more popular during the time period covered by the 2002 FAFSA than during the FAFSA-2 period. The problem with focusing too heavily on MFIs, which the Title II Awardees learned over time, along with the rest of the development community (see Box 4.15), is that they are not well suited to serve farmers’ needs for agricultural credit, including the needs of the small, resource-poor farmers, who are the majority of the Title II clients. The MFI approach originated in more urbanized areas to serve poor micro-entrepreneurs and petty traders whose major credit needs were for short-term credit to replace their inventories. Most MFIs still do not lend to farmers, unless the household has other sources of income to accommodate their frequent repayment
Box 4.15. Microfinance Has Not Led to an Expansion of Finance for Agriculture
“In the 1980s and 1990s the deleterious impact of limited financial access caught the attention of many academics, policymakers, donor agencies, and development practitioners, who generated an outpouring of new thinking and new ideas. Innovative concepts such as group liability, village banking, micro insurance and index-based insurance were tested in new and emerging microfinance institutions. But progress in expanding agricultural finance—as opposed to nonagricultural microenterprise finance—lagged. Donors and governments that had invested heavily in agricultural development banks and agricultural credit in the early 1980s and 1990s found that these efforts did not produce the expected results and withdrew their support. It was hoped that private commercial banks would step in, but for the most part they did not.”
Source: Kloeppinger-Todd and Sharma, 2010.

4-39Agriculture, Natural Resource Management, Livelihoods, Income Generation
cycles. More specifically, most MFIs require that loan payments be made on a weekly or monthly basis, which does not work well for crop farmers who may have to wait for four to six months from planting to harvest time to pay back a loan used to buy seeds and fertilizer, for example.
Rural Savings Mobilization
A number of experts in rural and agricultural finance believe that it may be better to start with rural savings mobilization, when working with the food insecure, rather than with rural credit programs. The poor, they argue, can and do save, and households can and do use their savings to “manage emergencies, prepare investments, and smooth consumption” (Campion and van Haeften, 2010, p. 8). The VSL interventions supported by Title II programs during the FAFSA-2 time period also seem to have developed into a relatively simple but effective approach to solving the problem of farmers not having enough cash on hand when they need it to buy fertilizer and other inputs, at least in Kenya and Malawi, based on information from final evaluations and field visits.
The initial idea was simple, to see whether poor people in rural areas, initially primarily women, would be able to contribute small amounts of money on a regular basis into a capital fund, which could be loaned out to members during the year to help them meet consumption needs and/or to invest in small-scale economic activities. These interventions are rural-based, and their members include farmers as well as agricultural laborers, rural-based micro-entrepreneurs, and petty traders. Most loans were/are used by members to expand their businesses or for petty trading activities, with smaller percentages used to pay for school fees, books and uniforms, and household expenses, including food and clothing.103 The loans made by VSLs also tend to require frequent repayments. As a result, it is the savings that they get back at the end of the year, when the funds are liquidated, that members use to buy
103 In Kenya, 41 percent of the VSL members reported using these loans for business or petty trading activities, for example, 16 percent for school expenses, and 14 percent for household expenses (CARE/Kenya Evaluation, Macher et al., 2009).
fertilizer and other agricultural inputs, buy livestock, pay school fees, and pay for improvements to their homes.
The groups are self-selected, and all funds come from the personal savings of the members. The funds are usually lent to members with interest and by consensus. Over time, the interest allows groups’ funds to grow, giving each member greater access to money and greater savings than they could feasibly save on their own. Since the savings are internally generated, groups have more incentive to manage this money well, and since the group is lending its own money to its members, collateral is not required. The major cost to the Title II development program was/is the cost of training the community and community-based field agents in the group savings and loan methodology. This includes training in individual self-screening, group formation and leadership, group fund development, and record keeping. Awardees often try to graduate groups after the first savings cycle, with Awardee personnel still available to provide TA during the remainder of the Title II program.
Outcomes. Preliminary evidence from the Tufts Exit Strategies Study indicates that Title II-supported VSL groups in Kenya were still working well two years after the program ended. According to the Tufts study, this is because the groups still have: (1) the capacity to keep the programs running (the groups had been trained to manage their own operations), (2) access to the resources needed (no outside capital is needed, and group operations are financed by internal donations), and (3) the incentives needed to keep functioning (access to credit and payouts are still helping group members meet their consumption and investment needs) (Coates and Rogers, 2011). The FAFSA-2 team also visited with VSLs in Malawi that had been organized under the I-LIFE program (FY 2005–FY 2009), which were still flourishing and spinning off new groups.
In short, these VSLs seem to have found a way to use social pressure to help people save money and invest it later. They have helped members smooth

4-40 Agriculture, Natural Resource Management, Livelihoods, Income Generation
consumption as well as provided a source of limited amounts of operating capital. Their ability to grow, on the other hand, appears to be constrained by local capacity, which is frequently limited. Some observers also question the advisability of trying to link VSLs with formal MFIs, believing that this would not be compatible with the basic principles of the program and could jeopardize their continued operation. VSLs, whose basic unit is the individual, have not yet become a source of capital for group investments and/or larger and longer-term investments, in agriculture in particular, and some observers also question the advisability of encouraging such a development.
Agricultural Finance
Although the VSL programs have provided some help, most Title II clients still have difficulties getting access to the additional funds that they need to be able to invest in the technology packages being promoted by the Title II programs—to buy the improved seeds and fertilizers (operating capital) and equipment, such as irrigation pumps, sprayers, and plows (investment capital). The Title II development programs have not had much success in finding and/or helping develop institutions specialized in the provision of agricultural finance, a problem that was/is not unique to the Title II programs.
Access to credit from the commercial banking system has not been a viable alternative for small, resource-poor farmers, Title II client farmers included. One reason is that most banks and other financial entities are willing to provide loans only in exchange for collateral in the form of some fixed asset, such as real estate, which is particularly difficult for small farmers to provide. Part of the problem is that rural and agricultural finance face unique risks and challenges beyond those typically found in financial markets. Providing finance in rural areas has higher transaction costs, for example, because populations are generally smaller and more dispersed in rural areas. Agricultural finance is also exposed to additional risks associated with weather and inappropriate government actions, such as politically motivated price controls and debt forgiveness (see Box 4.16).
Many Title II programs in the FAFSA-2 universe responded to these challenges by providing some of the inputs that they were recommending free or on a subsidized basis to jump-start the technology adoption process. (See Section 4.3.3.3 for further discussion on the use of this approach in Title II development programs.) This enabled their clients to try program recommendations on an experimental basis, but this is not a viable approach in the long term. CRS’s response to these challenges was to change its focus from MFIs to community-based savings programs (see Box 4.17), but this approach also has its limits, as discussed in the previous section on “Rural Savings Mobilization.” The response of some other Title II Awardees was to shift the focus of their finance activities to working with rural-based commercial and nonprofit MFIs and cooperatives.
Box 4.16. Challenges of Agricultural Finance
• Lending for agriculture is seasonal and covariant in communities, which causes liquidity management challenges.
• Market interventions, such as interest rate controls, subsidized credit, and ad hoc debt forgiveness, distort markets and discourage formal financial institutions from offering agricultural finance.
• Financial institutions have limited capacity to assess and mitigate full risks involved with agricultural lending.
• Lending for staple crops is especially difficult, because they usually offer low returns and are vulnerable to global price fluctuations and politically motivated price interventions.
Source: Campion and van Haeften, 2010, p. 9.

4-41Agriculture, Natural Resource Management, Livelihoods, Income Generation
Many thought that the rural-based MFIs would be a good fit with the Title II development programs, since their interests were/are similar (i.e., most were/are interested in serving the needs of the rural poor). Plus, some rural-based MFIs have developed interesting technologies for reducing transaction costs in rural areas.104 The problem was/is that very few of these institutions had/have the necessary technical knowledge or the appropriate resources, management information systems, and methodologies to be able to implement successful agricultural finance programs (including providing larger and longer-term loans that require seasonal grace periods rather than an MFI’s typical weekly or monthly repayment schedule).
The Title II Awardees also experimented with several other options during the FAFSA-2 time period, including equipment leasing, inventory credit programs,105 and value chain financing. The financing arrangements that FH and SC helped arrange for their dairy farmer clients, which are described next in “Outcomes,” could be viewed as a variant of value chain financing. Several recent assessments of agricultural credit have identified value chain financing as a (or perhaps the most) promising approach for financing small, cash-crop farmers (Empel, 2010; Campaigne and Roush, 2010; and AZM, 2011). Most of the agricultural finance efforts supported during the FAFSA-2 time period had limited success, however, particularly if assessed in terms of their sustainability.
Outcomes. USAID/Bolivia encouraged its Title II development programs to collaborate with
104 Theseincludecharacter-andcashflow-basedlendingand innovative technologies to reduce the transaction costs of serving rural areas (e.g., branchless banking and mobile banking) (Campion and van Haeften, 2010, p. 9).105 TNS included an inventory credit component in its program inGhana.Thefinalevaluationprovidesabriefdescriptionof this component, which included building warehouses and training farmers and linking farmers’ groups to banks, but stresses the implementation challenges, which suggests that thiseffortwasprobablynotsustainable.Thefinalevaluationof the OICI program in Ghana also reported that the inventory credit schemes that were included in the program had had limited use (p. vii).
other specialized credit organizations rather than implement agricultural credit programs on their own. FH/Bolivia and SC/Bolivia were able to find MFIs with experience in agricultural sector lending with which to work. Both were able to develop some innovative arrangements that enabled their dairy farmers to buy improved dairy cows on credit. In the FH case, the Tomoyo irrigation users association, which was well capitalized, guaranteed the loans; in the SC case, the dairy processors collected the loan payments for the credit organization. These arrangements seemed to be working well at the time of the final evaluation, but they were time consuming to develop.
In Uganda, ACDI/VOCA tried capitalizing several rural credit institutions over two consecutive programs, with mixed results (including problems with repayments and declines in their capital base), according to the final evaluation of the FY 2002–FY 2006 program. As a result, ACDI/VOCA decided to promote an individual and group savings approach in its follow-on program rather than continue to
Box 4.17. A Change in One Awardee’s Approach to Linking Agriculture to Finance
“Underlying any new intervention in agriculture is the need for investment in new technologies and systems. Lack of access to financing is a critical impediment to agricultural development in areas without formal banking facilities. In the past five years, CRS has fundamentally changed our approach to microfinance, by divesting in microfinance institutions and refocusing on savings-led methods with poor communities. Agriculture requires a similar rethink, so that new financial instruments can be developed to support agroentrepreneurs.”
Source: CRS, 2009a, p. 12.

4-42 Agriculture, Natural Resource Management, Livelihoods, Income Generation
capitalize and guarantee institutional rural credit facilities (Pierce and Gardner, 2006, p. 30).106
Three of the Awardees in Nicaragua (ADRA, CRS, and PCI) included a credit component in their programs, to which they contributed more than US$2.4 million in project funds. ADRA decided to run its own credit programs, developing lines of credit for non-agricultural as well as agricultural loans. ADRA also decided that it would offer agricultural credit at no interest, since it was expecting its client farmers to adopt strategies that ADRA itself considered to be experimental. ADRA discontinued its credit component part way into its program, due to the low recovery rates on its agricultural loans, and moved its clients over to several MFIs already working in its target area. CRS and PCI worked through other specialized MFIs right from the beginning, but also encountered financial and managerial problems. The three programs did succeed in making credit available to their clients while the programs were under way, but it is not clear whether these clients continued to have access to agricultural credit from these organizations once the Title II programs ended. SC—the fourth program in Nicaragua—had no credit component, but provided more of the inputs included in its agricultural program—drip irrigation, seedlings, fence wire—at an 80 –100 percent subsidy. SC also actively assisted its clients in accessing credit from other sources, helping its clients develop business plans and fill out loan and grant application forms, but at least one of the lending institutions that it was working with was in the process of losing its capital base at the time of the joint final evaluation (pp. 47–59).
4.3.2.8 Non-Farm Income Generation (Non-AG IG) Programs
A number of programs also included components designed to help the rural poor increase their non-
106 ThefinalevaluationalsogaveACDI/VOCAcreditforhaving realized halfway through its program that promoting and mobilizing group savings was a more effective way of providing liquidity to its client farmers than continuing to support institutional rural credit facilities.
farm incomes. These activities were located in a separate SO in a few programs, but they were more likely to be included as part of a broader SO focused on improving livelihoods and incomes more generally. Strategies used included support to microfinance activities; cash and in-kind grants to the poor, women in particular, to help them jump-start a business—cash to buy inventory to start a small village store, for example, or a sewing machine to start a tailoring business, or the provision of equipment, on a grant or loan basis, to a women’s group that they could use to process locally produced agricultural products for sale. Relatively few resources were allocated to these types of interventions, however—only 3 percent in FY 2009, down from 5 percent in FY 2003. Assessing the performance of these programs is difficult given the scarcity of information available in the evaluations.
Box 4.18. USAID/FFP Definition of Its “Non-Agricultural Income Generation” (Non-AG IG) Technical Sector
“Objectives include increasing and diversifying non-agricultural sources of income. Activities include: micro-finance and business development services, including provision of information on markets and technical assistance and training to increase capacity to identify and access markets; and vocational and business practices training and apprenticeship programs for youth and adults, including orphans and vulnerable children (OVC). Food rations are used to offset the opportunity costs of program participation and build human assets.”
Source: USAID/FFP Annual Results Reporting Guidance for FY 2009.

4-43Agriculture, Natural Resource Management, Livelihoods, Income Generation
Group Businesses
One type of group business promoted by a number of Title II programs during the FAFSA-2 time period involved the introduction of processing equipment to use to add value to locally produced agricultural products, including rice, maize, groundnuts, cassava, and shea-nuts. Much of this equipment is too expensive for a poor individual to buy, but if donated to a women’s group, or lent to them on favorable terms, the expectation was that they would be able to use this as a basis for generating additional incomes. These activities seemed to be fairly widespread, in West Africa in particular. However, little information is provided in the evaluations about how these programs were implemented (the costs of the equipment, the amount of staff time devoted to training the recipients in operating and maintaining the equipment, or in the marketing and bookkeeping skills needed to run these operations as a micro-business) or about how well they were/are working (what types of constraints they face, whether they are making any money, and whether they have any chance of becoming sustainable micro-businesses). Potential issues such as operating and maintenance problems and non-availability of parts were not mentioned in the evaluations, but lack of access to markets, especially for groups isolated by distance and/or poor roads, were mentioned, along with the suggestion that programs focus on markets and market issues at an earlier stage in project implementation.
Urban Income Generation Programs
The two CARE programs in Bangladesh (FY 2005–FY 2010 and FY 2010–FY 2015) included income generation activities in their urban components as well as in their much larger rural programs. The 2002 FAFSA focused its attention on the potentials for agricultural activities to promote better food security in urban and peri-urban environments (Bonnard et al. 2002, p. 19). In Bangladesh, CARE was able to successfully link its client groups—poor and extremely poor urban women—to a wide range of income-earning opportunities. One FAFSA-2 team member saw two examples, one in 2009 during
the preparation of the Bangladesh FSCF and the second during the visit of the FAFSA-2 team. In the first case, CARE linked a group of poor women to a local businessman who bought and sold baskets used for transporting products to market. This businessman told the women in advance how many baskets he would need and showed the women how to make baskets that met his quality standards. In the beginning, he also provided the women with the raw materials, but after several sales they determined that they could make more money if they bought the supplies themselves. In the second case, CARE Title II staff worked with their Business Development Unit to facilitate contacts between a small, local manufacturer, a local NGO, and a large European retailer. This arrangement resulted in permanent jobs for a number of poor urban women, who were clients of the Title II development program, making tufted rugs for sale in the European market using castoff remnants from one of the larger garment factories in Bangladesh.
4.3.3 Approaches
The Title II AG/NRM/LH programs were/are geographic based and client focused. That is, they were/are designed to respond to the problems faced by and have an impact on specific target groups in specific target areas. This means that Title II problem assessments and programs need to be unique to each target group and not generic to major geographic regions or to the country as a whole. Within this context, Title II Awardees functioned/function largely as service providers to their client groups—disseminating knowledge about improved technologies and practices to farmers in their target areas, organizing them into groups, and distributing agricultural inputs and capital investment goods.
4.3.3.1 Disseminating New Knowledge
The promotion and dissemination of new knowledge is a key approach that the Title II development programs have used/use in all their interventions—in marketing and rural credit interventions as well as those focused on increasing crop and livestock production and productivity. As part of their

4-44 Agriculture, Natural Resource Management, Livelihoods, Income Generation
approach to knowledge dissemination, Title II Awardees identified/identify promising technologies and practices, in consultation with government extension services and national, regional, and international research centers, and developed/develop approaches and methods for extending these technologies and practices to their target farmers. Some Awardees during the FAFSA-2 time period hired their own staff to provide these extension services, while others worked through local organizations, which some partnered with from the beginning and others selected through competitive grants programs. CRS frequently partners with local dioceses and CARITAS, for example; ACDI/VOCA used a competitive grants program to select its partners in Mauritania and Uganda; and WV frequently works closely with its own Area Development Programs (ADPs), when the geographical locations of the two programs overlap.
In disseminating these new technologies and practices, the Title II programs were/are taking on an extension role that is still widely thought to be a government function, although NGO and private sector actors are alternative extension service providers. The Title II Awardees took/take on this function, because in most of the Title II countries,
and particularly in the poorer, more isolated areas where Title II programs work, government extension staff are either not present or, if present, do not have the ability to provide extension services to Title II client groups, often because they do not have enough funds to travel to the field. The capacities of the government extension services vary by country. The government agricultural research and extension services are much stronger in Bangladesh, a poor but populous country with a long history of public service that began during its colonial period, than they are in poor countries with small populations, such as Haiti, Niger, or Bolivia.
Approaches and Methods Used in the Title II Programs to Disseminate New Technologies and Practices
FAO, in the Guide on Alternative Extension Approaches, identifies eight major approaches to extension that have been used in various parts of the world (Axinn, 1988). The one that best describes the approach most frequently used by Title II Awardees during the FAFSA-2 time period, which Axinn labels the “Agricultural Extension Participatory Approach,” is briefly described in Box 4.20.107 Areas of commonality between what one sees in the field with the Title II programs and the approach described by Axinn include the importance of farmer participation; the recognition that programs can reach more small farmers through their groups and organizations than through more individualized approaches; the preference for using group meetings, demonstrations, and individual and group travel to disseminate messages; and the need for combining knowledge from the outside with farmers’ knowledge of local conditions. Where Title II programs differ is in terms of how they measure success. The focus of the “Agricultural Extension Participatory Approach,” according to Axinn, is on “the numbers of farmers actively participating and benefiting, as well as the continuity
107 Otherapproachesidentifiedare:thegeneralagriculturalextension approach, the commodity specialized approach, the training and visit approach, the project approach, the farming systems development approach, the cost sharing approach, and the educational institution approach.
Box 4.19. The Goals of Agricultural Extension
The goals of extension include transferring knowledge from researchers to farmers, advising farmers in their decision making, and educating farmers on how to make better decisions, enabling farmers to make better decisions, enabling farmers to clarify their own goals and possibilities, and stimulating desirable agricultural development.
Source: Van den Ban and Hawkins, 1996.

4-45Agriculture, Natural Resource Management, Livelihoods, Income Generation
of local extension organizations.” This is in contrast to the Title II development programs, where the objectives are more directly linked to concrete changes in farmers’ behaviors (technology adoption, for example) and the impact that these changes have on yields, incomes, and consumption.108
108 Governments tend to take a different approach to extension, according to Axinn, giving more emphasis to increasing production, setting priorities at a national level rather than at a regional or local level, controlling program planning and staff from the central government level, relying on a relatively largefieldstafftoimplementprograms(resultinginarelativelyhigh cost program), and measuring success in terms of rates of adoption of important recommendations and increases in national production (Axinn, 1988, p. 6).
Unfortunately, very little descriptive or evaluative material is available in project documents about the specific approaches and methods that individual Awardees were using to promote and disseminate new technologies and practices. In many cases, little or nothing is said about the extension philosophy that was adopted; the number of field workers and how they were organized, trained, and supervised; or the nature and content of the training materials. This made it difficult for the FAFSA-2 to draw meaningful conclusions about the relative merits of alternative approaches and their appropriateness and effectiveness, even within the same country.
The approach most frequently mentioned in the documentation is often described as the “lead farmer” approach, in which a subset of farmers in a community, which may be self-selected—the early adopters—or community-selected, were/are trained in a package of technologies by project-supported extension staff and expected to transfer this information to other interested farmers—sometimes referred to as “follower farmers”—in the community. Another approach used in some programs, which is often referred to as “farmers field schools” (FFSs), is notable for the source of its recommendations, which are supposed to be based on knowledge identified locally and tested in farmer groups. A third approach used by a few programs puts more focus on the introduction of new technologies and practices that it promotes by providing them free or at subsidized prices to selected farmers—the “model farmers”—that are expected to serve as role models.
Several of the programs that tried the FFS approach indicated that they did so because they found the idea of building on farmers’ indigenous knowledge and encouraging them to conduct their own experiments in the field attractive. Others, including some evaluators, Awardees, and USAID staff, questioned the cost-effectiveness of this approach. Some critics suggested that the FFS approach requires more field staff time and effort to organize and manage than other approaches and may require more time to get information about new/improved technologies and practices to farmers because
Box 4.20. The Agricultural Extension Participatory Approach
“Here the assumption is that farming people have much more wisdom regarding production of food from their land, but their levels of living could be improved by learning more of what is known outside. It further assumes that effective extension cannot be achieved without the active participation of farmers themselves, as well as research and related services; that there is a reinforcing effect in group learning and group action; and that extension efficiency is gained by focusing on important points based on expressed needs of farmers and by reaching more small farmers through their groups/organizations instead of through individualized approaches. The purpose is to increase production and consumption and to enhance the quality of life of rural people…Implementation is through group meetings, demonstrations, individual and group travel and local sharing of appropriate technologies…”
Source: Axinn, 1988, p. 9.

4-46 Agriculture, Natural Resource Management, Livelihoods, Income Generation
the protocol is to be more demand-driven and encourages the extension agents/volunteers to delay providing information until farmers ask for it.109
The “model farm” approach also has a mixed record. Some argue that model farms can be useful as a place where farmers can go to see the various technologies and capital investments that are being promoted by a program. Others argue that model farmers may not be representative enough of the client group, and that technologies that tend to be demonstrated on model farms are frequently more expensive, more complex, higher-end options that are less likely to be replicated by others in the community. The latter is most likely to happen when the project provides some or all of these new technologies to the model farmers free or at a subsidized cost. Examples of this, which the team saw during its visit to Guatemala, included the selection of storage facilities and animal pens that are larger and more expensive than necessary, using unnecessary purchased inputs, and constructing rock walls on steep slopes to control soil erosion when vegetative barriers would have been easier and cheaper to install. Model farmers could be useful, according to the joint evaluation of the four Nicaragua programs and the LOL program in Zambia, but to be able to function effectively as “real” role models, both during a program and after it ends, they need to be “real” model farmers (see Box 4.21).
Extension Methods
Some programs implemented during the FAFSA-2 time period still used more formalized training
109 Anderson and Feder, in a 2007 review entitled “Agricultural Extension” for the Handbook of Agricultural Economics, cite the high costs per farmer trained as a key drawback to the FFS approach,plusevidencefromseveralfieldstudiesthatlittlediffusion of knowledge had taken place during FFSs from trained farmers to other farmers (p. 2,367). Glennerster and Jack, in a Note prepared for FTF, suggest that more evidence is needed on the effectiveness of demand-driven extension models, which are hard to implement, more labor intensive than other models, and thus more expensive (Glennerster and Jack, 2012, pp. 4–5).
courses to disseminate information.110 However, most programs relied most heavily on demonstration plots on farmer fields as a basis for their extension programs, coupled with field days and exchange visits. These learning by doing and seeing activities were very popular among the client farmers, according to many evaluations, and also rated as among the most effective activities by numerous evaluators.111 The WV program in Ethiopia (FY 2003–FY 2008) helped finance a series of formal training courses that were implemented by the woreda Agricultural and Rural Development Offices, in addition to its own farm-based extension efforts. The final evaluation looked at both types of
110 Glennerster and Jack also note that remarkably little evidence exists on the effectiveness of training programs in agriculture or other sectors, with little known about how much people retain of what is covered in the training, whether they change their practices, or what types of training are most effective (Glennerster and Jack, 2012, p. 3).111 See the Agricultural Communications Documentation Center (http://www.library.illinois.edu/funkaces/acdc), and in particular the Francis C. Byrnes collection for publications related to agricultural communication, development communication, extension communication, intercultural communication, and training.
Box 4.21. A Recommendation on the Role of Model Farms from the Nicaragua Programs
“Model farms should be the best of the regular farms, rather than special creations of projects that benefit from unusual levels of resources. Farmers who visit a model farm should know that the model farmer started just like they are and received the same resources that they receive, and were able to make a dramatic difference on that basis alone. Artificially-created model farms do not make legitimate examples for replication.”
Source: Nicaragua Joint Final Evaluation (Harris, et al., 2007, p. 89).

4-47Agriculture, Natural Resource Management, Livelihoods, Income Generation
training activities, and the brief descriptions that are included in Box 4.22 and Box 4.23 provide some idea of the strengths and weaknesses of the two different types of interventions.
Not all programs implemented during the FAFSA-2 time period produced training materials, and what materials were produced and/or used varied in quality.112 Some materials still seemed to be developed for more educated audiences and/or were not translated into local languages. Female illiteracy was also a problem in some places, in the largely
112 Many of the materials produced focused on target-area-specifictechnologypackages.Avarietyofmanualswerealso produced that covered a range of topics, including the construction and maintenance of roads and other infrastructure, the organization and management of water user groups, marketing and market analyses, and farming as a business.
Muslim areas of West Africa, for example. The lack of sharing of materials, which had been identified as a problem in the 2002 FAFSA, also remained a problem during the FAFSA-2 time period, even among Awardees working on similar problems in nearby locations.
Extension Staff
Extension (behavior change) agents play important roles in the Title II AG/NRM/LH programs, which, according to the diffusion of innovation literature, includes helping develop a need for change on the part of the Title II clients, establish an information exchange relationship, diagnose problems, create an attempt to change the client, and translate intentions into action (Rogers, 2003, p. 400). The FAFSA-2 team met with numerous extension workers during its field visits, most of whom were knowledgeable,
Box 4.22. A Formal Approach to Disseminating Knowledge in Ethiopia
The formal courses. “Much of the training that was done under the auspices of the DAP [Development Assistance Program] seems to have been done on an ad hoc basis at the request of the local woreda offices without any one in the ADPs or the woreda having undertaken a needs assessments and/or developed a clear strategy linking the training to the other activities being promoted under the DAP. Too much emphasis was placed on more formal courses with not enough attention given to demonstrations and demonstration plots. No training manuals were prepared, and the lack of manuals coupled with the high staff turn-over made it more difficult to replicate programs and/or to follow-up on previous programs. Many of the farmers that were interviewed seemed more interested in the per diem payments than in the skills to be acquired from the training sessions. Some farmers also complained that a limited number of farmers were getting all the opportunities for training repeatedly” (WV/Ethiopia Final Evaluation, van Haeften et al., 2006, p. 85).
Box 4.23. A Less Formal Approach to Disseminating Knowledge in Ethiopia
The field-based extension program. In Bosset, WV/Ethiopia “identified model (lead) farmers and used them in conjunction with follow farmers to demonstrate new technologies on their farms. These demonstrations were coupled with a variety of diverse and intensive training sessions covering row cropping, timely weeding, timely planting, and reducing post harvest losses. According to project staff, this strategy was very effective and resulted in significant productivity increments (more than 100%) due to the improvements in crop husbandry. These demonstrations have already influenced many other farmers in the area” (WV/Ethiopia Final Evaluation, van Haeften et al., 2006, p. 66).

4-48 Agriculture, Natural Resource Management, Livelihoods, Income Generation
enthusiastic about their work, and seemed to have good working relationships with their farmer clients, characteristics that are consistent with those of a successful change agent, which are outlined in Box 4.24. Several FAFSA-2 team members noticed considerable improvements in the technical quality of the field staff since the beginning of the FAFSA-2 time period. These improvements appeared to have taken place in all five of the countries visited, which is notable, since these five countries vary considerably in terms of the numbers and levels of trained and experienced people available. Programs still had human resource problems, according to many of the evaluations that were reviewed. These included insufficient staff, technical staff in particular; too much staff turnover; lack of supervisors and poor supervision; and problems in motivating volunteer workers.
Returns to Technology Dissemination
Information is also lacking on the dollar value of the benefits produced by these extension programs, as it is for most of the other AG/NRM interventions and activities implemented during the FAFSA-2 time period. One of the few cost/benefit estimates available comes from an analysis that MSU did of the SC/Mozambique BSD-resistant cassava dissemination intervention in Mozambique. The results of this analysis, which are summarized in Box 4.25, suggest that the returns to some of the Title II interventions could be considerable.
4.3.3.2 Organizing and Working with Groups
Most Title II development programs worked/work with groups of farmers, which is more cost effective than meeting with each farmer individually to
Box 4.24. Characteristics of a Successful Change Agent
Evidence from the diffusion literature suggests that the degree to which a change agent is able to succeed in getting his/her clients to adopt an innovation is positively related to: (1) the extent of the exchange agents’ effort in contacting clients; (2) a client orientation rather than a change agent orientation; (3) the degree to which the diffusion program is compatible with clients’ needs; (4) the change agent’s empathy with clients; (5) the degree to which the change agent and his/her clients share similar beliefs, education, and socioeconomic status; (6) credibility in the clients’ eyes; (7) the extent to which he or she works through opinion leaders; and (8) increasing clients’ ability to evaluate innovations.
Source: Rogers, 2003, p. 400.
Box 4.25. Returns to the Dissemination of the BSD-Resistant Cassava in Mozambique
MSU, as part of a USAID-supported project, estimated that the “value of getting this new variety out to poor farm households in six districts on the Nampula’s coast [was] expected to result in annual benefits of over 8 million dollars with a 100% rate of return on investment.” This analysis also identified the ingredients of success as including “the rapid identification of a tolerant variety, that also looked good on other traits, such as consumption preferences, a focus on low-cost methods to multiply and distribute [plant] materials as widely as possible, a rigorous monitoring program of the incidence of the disease and the up-take of the material, and a five-year project duration that afforded sufficient time to get the job done.”
Source: SC/Mozambique Final Evaluation (Sullivan and Selvester, 2006, pp. 24–25).

4-49Agriculture, Natural Resource Management, Livelihoods, Income Generation
deliver a message or provide a service. Programs implemented during the FAFSA-2 time period supported farmers’ groups, marketing groups, savings and loan groups, cooperatives, and networks of farmers’ associations. Many of these groups were women’s groups, and many of the Awardees also worked hard during the FAFSA-2 time frame to increase the percentage of women members in the mixed gender groups, although many of the evaluations reviewed and comments heard during the field visits suggest that women still tend to be underrepresented in the leadership of many groups.
Producer Groups
Working with groups was/is an essential part of Title II extension activities. Programs differed, however, in the amount of time Awardees spent organizing these groups and how they worked with them, with some Awardees working with relatively informal groups, self-selected groups with common interests, for example, and others developing formal rules about the size and composition of the groups and/or spending considerable time up front organizing them into more formal organizations or associations with a constitution, bylaws, and officers.
Some approaches to working with groups that were used during the FAFSA-2 time period were more successful than others. Two not-so-good practices, based on conclusions reached in program evaluations and field observations, were: (1) trying to limit group participation to the poorer, more food insecure households in communities and (2) encouraging, and in some cases requiring, group members to farm as a group and to sell their output as a group.
Extension programs, as discussed in the earlier section on “Technology Adoption” (Section 4.3.2.1), are less likely to be successful if they try to exclude more progressive farmers from their activities. The progressive farmers are frequently among the early adopters of the technologies and practices being recommended by the Title II programs. And, in taking on that role, they can help pave the way for poorer farmers in a community that may be more reluctant to try new practices because they have fewer assets and need additional assurances
as to the value of the new technologies. This was confirmed by a number of the final evaluations of the programs included in the FAFSA-2 universe. As one example, the final evaluation of the CRS/Kenya program (CRS/Kenya, 2004, p. 6) concluded that the practice of excluding the progressive farmers from the program had a negative effect on program performance and recommended that future programs be designed to include all farmers living in the selected catchment areas.
Other evaluations were critical of what some referred to as collective action programs, i.e., programs that encouraged or required their client farmers to farm and sell their produce as part of a group activity. Although the documentation is somewhat limited, a number of Title II Awardees seemed to have devoted considerable time and effort during the FAFSA-2 time period to these types of activities. The joint final evaluation of the four Title II development programs in Guatemala argued, for example, that the emphasis of some of the Awardees on collective activity ignored the evidence that most smallholders prefer to work and make decisions at the household level, and choose to work as a community when the resources are too large for a single family or individual to handle, such as an irrigation system, grazing lands, and forests (Schnell et al., 2006, p. 29). A recent assessment of markets and poverty reached a similar conclusion about the use of groups to help the rural poor access markets (see Box 4.26).
In Guinea, a program that was focused on dry season vegetable gardening required members of its producer groups (PGs) to farm collectively on communal land and market their produce collectively, a requirement that ended up disadvantaging poorer women, who could not afford to spend their time on the communal plots in addition to their own fields. The lesson learned about collective action, cited in the final evaluation, was that “[w]omen’s vegetable production should be organized at the field level—rows or small plots within the PG’s collective field—because ‘laziness has no support’ with individual production, and the women work harder for their own individual profit than they do for collective profit” (Adelski et al.,

4-50 Agriculture, Natural Resource Management, Livelihoods, Income Generation
2006, p. 57). Some FFSs were also criticized for requiring their farmer groups to find communal plots on which to experiment, farm the land as a group, and then sell the output collectively.113 In Niger, the FAFSA-2 team had a chance to interview a group of Title II women farmers, who were also involved in off-season vegetable gardening. Off-season market gardens had been promoted by an earlier Nigerien president, who also decreed that the women should produce and sell as a group. This group approach did not work very well, according to these women, because some of the women did not always show up for work or, if they did show up, they didn’t work as hard as the others—what economists refer to as “free riders.” So the women decided to continue to locate their plots close together so that they could share some of the land preparation tasks and the costs of a fence to protect the area from livestock. But each had her own plot, which she worked on her own, and each sold her own produce separately. When the Title II program entered the picture, its staff also
113 There was one example in Bolivia when members of the joint mid-term evaluation team were taken into a nearby forest to meet with members of an FFS who happened to be in the process of cutting down trees so that they could have a piece of communal land on which to carry out the FFS experiments and farm as a group. Not surprisingly, the two environmental experts on the team were somewhat dismayed by the situation.
encouraged the women to farm and sell together as a group, but the women found that this approach did not work any better the second time. So they dropped it after one season.
Cost-effectiveness, sequencing, and incentives. There is no question that it is more efficient to work with farmers in groups than meeting with each farmer individually to deliver a message or provide a service. There are also clear economies of scale in selling at the same time and place, which can benefit both sellers and buyers. On the other hand, it is not clear how formal these groups have to be to be effective. There are numerous examples from the FAFSA-2 universe that are discussed in the marketing and technology dissemination sections (Section 4.3.2.5 and Section 4.3.3.1) that seem to suggest that farmers do not have to be organized into formal groups to take advantage of many of the economies of scale of groups to deliver messages or encourage farmers to bring their produce to one place to sell to a buyer or take to market. The widespread availability of cell phones is also making it easier to deliver messages to a large number of farmers at the same time and/or to assemble groups of farmers in the same place at the same time.
Economic incentives are also essential to get farmers involved in the AG/NRM programs to
Box 4.26. Another Perspective on Using Groups (Horizontal Coordination)
In their book Markets and Rural Poverty: Upgrading in Value Chains, Mitchell and Coles concluded the following: “Horizontal coordination can allow participants to pool resources and achieve economies of scale which is important given ever-increasing standards and cost-pressures from buyer driven supply chains. Coordination also allows producers to share costs and risks…Development experience suggests that horizontal coordination can be necessary to provide particular members with specific support, which would be difficult to access as individuals. However, other functions are best left to individual agency, and collectivist models may damage livelihoods by seeking to bring functions into the group, which could be more competitively provided by individual entrepreneurs. A form of the ‘subsidiarity’ organizing principle (that matters are best handled by the most local competent party) emerges from the field evidence. So only in cases where individual entrepreneurs are unable to provide a function, should this role by elevated to group structure. In this way the horizontal structure focuses on providing functions that cannot be carried out by individual entrepreneurs.”
Source: Mitchell and Coles, 2011, p. 238.

4-51Agriculture, Natural Resource Management, Livelihoods, Income Generation
begin with and to keep them involved, and to be effective, activities need to be designed and sequenced keeping incentives in mind. What the Title II programs in Bolivia found was that farmers were more interested in getting organized once they saw some real concrete financial benefits from the activities that were being promoted and then began to see how further organization could help them expand and sustain these benefits. Early sales seemed to motivate farmers to spend their scarce time participating in these groups much more than theoretical arguments about the benefits of producer associations (see Box 4.7 and Box 4.26, for example). The numerous examples cited in evaluations of farmers dropping out of program-created organizations several years into programs or after programs ended are also likely due to the absence of non-project-provided incentives to participate.
Opportunity costs. Efforts to promote farming as a group business, which did not have a good track record with respect to suitability for the Title II clientele or program performance, as was indicated earlier, can also be costly. The direct costs of these activities during the FAFSA-2 time period were likely to have been high, since it seemed typical for many Awardees to require their field staff to spend considerable time helping groups get organized formally and providing them with TA and training in group business and financial management. The opportunity costs of this strategy were also likely to have been high, since Awardee staff could have spent this time on other activities more directly related to achieving more immediate production and marketing objectives. Encouraging their clients to spend time and effort on group activities could also have diverted their clients’ limited time and capital resources from other, more profitable, but individually owned income earning opportunities.
Producers’ Associations and Cooperatives
A number of the Title II development programs focused on producers’ associations and cooperatives, working with and through them, and putting significant effort into helping strengthen their
capacities.114 Most evaluations did not spend enough time discussing these organizations, their effectiveness, strengths and weaknesses, or likelihood of sustainability. Based on what little information is available, developing these organizations into viable business organizations has proven more difficult than many had expected, requiring more training and assistance in business and financial management than originally programmed and more time to take effect.115
In Bolivia, ADRA financed the development of six agricultural service centers, which provided services to their members as well as a physical place for them to bring their products for consolidation and sale. ADRA’s ultimate objective was to transform these centers into true commercial enterprises. As part of this effort, ADRA helped them obtain legal status and develop business plans and provided members with training in small business organization and management. As part of its exit strategy, ADRA also arranged for business students from a local university to take over some of the management tasks that ADRA’s technical staff had been performing. To be viable longer term, however, these centers needed to be able to hire good managers
114 In some cases, this focus may have had a lot to do with the philosophy of the Awardee. ACDI/VOCA had its beginnings in cooperative development, for example, and LOL is a cooperative. In other cases, preferences may have been given to working with producers’ associations, in Mozambique and Zambia, for example, to support national government policy. 115 Jack suggests that “[f]armer organizations have the potential to address many of the adoption constraints associated with inputandoutputmarketinefficiencies,suchasimprovingfarmer bargaining power, aggregating demand, reducing individual risk, decreasing transactions cost associated with marketing, and improving credit access.” Jack also points out that “the challenges faced by these organizations are numerous and include legal restrictions, low managerial capacity, elite capture, exclusion of women and the poor…” (Jack, 2011, p. 17). The Mitchell and Coles assessment, Markets and Rural Poverty, also points out that although many development workers see the cooperative as “the obvious institutional form for the horizontal coordination of low-income producers…The evidence suggests that, while appropriate in some circumstances, cooperatives have inherent institutional limitations that constrain their ability to provide a vehicle for sustainable growth” (Mitchell and Coles, 2011, p. 238).

4-52 Agriculture, Natural Resource Management, Livelihoods, Income Generation
from the private sector, a step that had not yet been taken at the time of the final evaluation.
In Zambia, the milk collection centers, many of which were built on the basis of cooperatives that already existed in LOL target areas, were key to the continued sustainability of the LOL dairy value chain. Working with these organizations made sense as a way to get started, but the final evaluation warned that the management structure of these dairy cooperatives represented perhaps the greatest long-term threat to the sustainability of the overall system. The final evaluation described these cooperatives as being “run like social welfare agencies, with management by committee at the lowest common denominator” (Swanson, 2009, p. 10). Other weaknesses cited included financial accounting systems that were “inadequate and open to potential for abuse” and lack of smallholder farmer engagement (or ownership) in the cooperatives. The final evaluation concluded that dairy cooperatives in Zambia had an uncertain future without professional managers and oversight, and it recommended that the development of linkages between smallholder dairy farmers and private sector processors continue to be an option (p. 102).
In Mozambique, CARE worked with CLUSA (Cooperative League of the USA), using the CLUSA methodology to graduate farmers’ extension groups into more formal associations and associations of associations (or forums). Marketing through these associations and forums had mixed results, according to the final evaluation, and was an issue that went beyond the CARE project (Selvester et al., 2006, p. 35). Some associations were successful, according to the final evaluation, but many faced increasing competition from other traders and had to cut their margins, making it difficult for them to cover their credit costs and to pay forum officials’ expenses. This led some to try to buy from their farmer members at the lowest possible prices, so that they could cover their costs, which meant that these associations began behaving much like the private traders that they were supposed to be replacing. Other identified problems included corruption, the fact that profits sometimes were not returned to ordinary members, and the likelihood that continued
support would be needed to maintain the association/forum model.
4.3.3.3 Providing Inputs
Many Title II programs also distributed agricultural inputs and capital investment goods to participants, sometimes for free, but often at subsidized prices and sometimes to individuals but also to groups.116 During the FAFSA-2 time period, these inputs included seeds, fertilizer, pesticides, small tools, carts, water pumps, food processing equipment (e.g., grain mills), and animals (e.g., oxen, dairy cows, small animals, and poultry). A few programs also provided cash—to poor women to set themselves up as petty traders, for example, or to groups of poor farmers to buy water pumps, seeds, and/or other agricultural investment goods. Although these distribution programs were clearly important, it was impossible for the FAFSA-2 team to get a precise idea of how important, as they were not adequately described in proposals or mid-term and final evaluations.117
Rationale
Sometimes there was/is no alternative to providing inputs directly, in a transition program, when farmers are returning to their land at the end of a conflict, for example, and have no seeds or access to fertilizer. In other cases, individuals and/or groups of farmers may be given seeds and other planting materials to multiply and make available to other farmers in their area as part of a systematic process for disseminating new/improved varieties (see Box 4.6 in Section 4.3.2.1 on “Crop Production and Productivity” for one example of such a dissemination program).
In many cases, however, the real constraint to project performance was/is that Title II farmer clients did/do not have enough cash on hand to purchase
116 Many programs also provide complementary inputs, such as cement, pipes, and iron sheeting, to support community infrastructure development efforts, which are discussed in more detail in Chapter 5 on “Infrastructure.” 117 Documents did not adequately describe what subsidies were being proposed or used, for what activities, over what period of time, or what their expected costs were, by subsidy type or in total.

4-53Agriculture, Natural Resource Management, Livelihoods, Income Generation
the technology packages that the programs were/are recommending, even in cases where it was/is clear that the returns to adoption outweigh the costs.118 As a result, many programs implemented during the FAFSA-2 time period decided to use the distribution of subsidized inputs to jump-start the technology adoption process and to work on the problems of improving the access of their client farmers to agricultural credit over the longer term. Some programs implemented during the FAFSA-2 time period also provided subsidized inputs on the basis that a subsidy was the only way for a program to demonstrate the value of a promising new technology to its client farmers and/or that a subsidy was needed to reduce the risk to client farmers of trying a promising but not yet fully proven technology.
One can understand why programs were/are tempted to use subsidies to get their agricultural interventions off the ground, especially given the time constraints under which they were/are operating. In other words, these distribution programs had/have their rationale, but they also had/have some disadvantages. One problem is the potential to create dependencies among program participants. This seemed to be a problem in a number of programs included in the FAFSA-2 universe, based on discussions included in a number of final evaluations. In some cases, evaluations indicated that program participants said that they would not be able to continue using the new technologies and practices once the programs ended. In other cases, the evaluators concluded that continued use of these technology packages was questionable once program resources were no longer available. Providing subsidized inputs also makes it harder for Awardees to assess how well their programs are doing. Adoption rates may look good,
118 Some programs also used subsidies to promote the use of larger investment goods, with some programs making an outright gift of the good (CPI made outright grants of irrigation pumps to farmer groups in Niger, for example), others required clients to pay a certain percentage of the cost of the item (ADRA/Bolivia, for example), and others established credit programs. One advantage of the one-time grant is its simplicity andefficiency.One-timesubsidiestocoverpurchasesofcapitalequipment also are less likely to distort economic decisions than programs that subsidize farmers’ operating costs, according to a number of economists.
but one does not know whether farmers will continue to use these inputs in the absence of the subsidy, or if these behaviors will stop once the subsidies stop.119 The free or subsidized distribution of inputs, such as seeds and fertilizers, can also undercut private sector profitability and discourage private sector input dealers from supplying or continuing to supply these goods, reducing the likelihood of their availability once the project ends.
Using Revolving Funds to Graduate Farmers from a Reliance on Project-Provided Inputs
During the FAFSA-2 time period, a number of Title II development programs experimented with the development of community-based, cash and/or in-kind revolving funds as a way to wean client farmers away from their reliance on project-supplied inputs. The idea was that farmers that received the subsidized project inputs would make contributions in cash or in-kind (seed, for example) to a local fund from which they and others in their community would be able to continue to borrow. These programs did not a have good track record during the FAFSA-2 time period. Farmers often paid back in poor-quality grain, for example, reserving the better-quality for seeds or sale, or did not pay back at all, citing a poor harvest or other extenuating circumstances. Issues also arose related to who would be responsible for managing the fund, where the products would be stored, and how. The result was that funds declined in value and after several seasons usually ceased to exist. Other critics worried that if the cash and in-kind programs were not well managed and farmers were allowed to default, this experience could undermine other attempts to establish credit programs and instill a credit mentality. These arrangements were also thought to have high opportunity costs for Awardees’ field staff in terms of the time and effort that went into organizing, managing, and monitoring them. Others
119 According to Rogers, “Although incentives increase the quantity of adopters of an innovation, the quality of such adoption decisions may be relatively low, thus limiting the intended consequences of adoption. If individuals adopt an innovation partly in order to obtain an incentive, there is relatively less motivation to continue using the innovation (if it can be discontinued), so the innovation’s sustainability may be lessened” (Rogers, 2003, p. 238).

4-54 Agriculture, Natural Resource Management, Livelihoods, Income Generation
argued that these programs could put staff, whose primary purpose was to provide information to and assist people, into the role of debt collector.
The Benefits of Adopting a Commercially Oriented, Market-Focused Strategy
This is another example where a commercially oriented, market-focused program has its advantages. If farmers are able to sell their products at a profit, for example, they will get access to the additional resources needed to pay for inputs on their own, instead of having to rely on project-distributed inputs. Of course, having sufficient cash right after harvest, as many development programs have learned, does not guarantee that farmers will have enough cash on hand when the time comes to purchase these inputs. But there seems to be some effective strategies for dealing with this problem. The rural savings mobilization strategy, which was used in a number of Title II development programs during the FAFSA-2 time period (see Section 4.3.2.7), uses social pressure to help farmers save money and invest it later, including to buy fertilizer and seeds. The book Poor Economics also describes a program developed in Kenya that gives farmers an opportunity to buy a voucher right after the harvest, when they have money in hand, that entitles them to receive fertilizer at sowing time (Banerjee and Duflo, 2011, pp. 192–193). There were also numerous examples during the FAFSA-2 time period of buyers providing their Title II suppliers with many of the necessary production inputs and subtracting their costs from the purchase price at the time of sale.
4.4 Program Impact
4.4.1 Household Consumption
In 2007, to standardize the measurement of the impact of Title II development programs on food access, USAID/FFP began requiring Awardees to include two standardized “consumption indicators” in their M&E systems for any Title II development programs that included activities to improve “household access” to food (i.e., programs
in agriculture, microenterprise development, income generation, and diversification).120 The two indicators selected were: (1) the number of months of adequate household food provisioning (MAHFP) and (2) the household dietary diversity score.121 According to the Indicator Guide developed for the HDDS, these two indicators represent a more direct measure of improved food access than household income does because “they focus on the desired outcome of improved food access—improved household food consumption” (Swindale and Bilinsky, 2006, p. 1). These are both proxy indicators, however, and do not measure actual dietary intake.
These two consumption indicators were not in use at the time of the 2002 FAFSA and were not yet in widespread use during the FAFSA-2 time period. Twenty-five of the programs (39 percent) included in the FAFSA-2 sub-universe of completed programs122 reported on the MAHFP indicator, for example, and 24 of the programs (38 percent) reported on the HDDS indicator.123 These percentages vary considerably by region. Forty-nine percent of the African programs reported on changes in the MAHFP indicator, compared to only 33 percent
120 The term “consumption” is used here to distinguish the three measures of access discussed in this section from income measures, which many, especially among the economics profession, also consider to be measures of access to food.121 FFPIB 07-02, of August 8, 2007, states that all MYAPs that include activities designed to increase households’ access to food (e.g., programs in agriculture, microenterprise development,incomegeneration,and/ordiversification)willberequired to report on the following indicators collected using a population-based, representative sample survey at baseline andfinal:(1)number of months of adequate household food provisioning and (2) household dietary diversity score. In addition, FFPIB 07-02 states that MYAPs reporting on these indicators must also report the number of households benefiting from activities to maintain or improve household access to food during the fiscal year (USAID/FFP, 2007).122 The universe of countries/programs included in the assessment of program performance for the AG/NRM/LH programs includes 64 programs in 26 countries. This sub-universe is smaller than the FAFSA-2 universe because it is limited to programs that had one or more components focused on food availability and access and also to programs for which finalperformanceinformationwasavailable.123 The HDDS measures the number of different food groups consumed over a given reference period.

4-55Agriculture, Natural Resource Management, Livelihoods, Income Generation
of the Asia programs and 20 percent of the LAC programs. The HDDS was more popular in the Asian programs, with two of the three programs reporting on dietary diversity compared to 40 percent of the LAC programs and 34 percent of the Africa programs.
On the other hand, for those that did report, the rates of success were quite high,124 i.e., 92 percent of the programs that reported on the MAHFP reported an improvement in this indicator and 79 percent of the programs that reported on the HDDS reported an increase in this indicator (see Table 4.5). The number of months of improvement in household food provisioning ranged from 0.2 to 5.2 months, and improvements in dietary diversity ranged from 0.4 to 4.4 food groups.125
In September 2011, USAID/FFP eliminated its requirement that Title II development programs collect information in their baseline and final surveys on average months of adequate household food provisioning and substituted a new indicator—percentage of households with moderate or severe hunger (FFPIB 11-03).126 This new indicator, also referred to as the HHS, is also one of the required FTF indicators. This means that future programs will still have to collect data on two consumption indicators—an HDDS and an HHS (see Table 4.6).
124 Performance with respect to the consumption indicators was assessed by comparing the endline results with the baseline data. 125 Based on information included in Title II MCHN program documents, the FAFSA-2 concluded that 46 percent of the 54 evaluation surveys completed during the FAFSA-2 time period could not be used as a basis for drawing conclusions about the impact of the Title II MCHN development programs on child stunting and undernutrition. Almost 20 percent of the surveys were deemed problematic as a result of the poor quality of the anthropometric data; other major reasons included sampling problems(13percent)andbaselinesandfinalevaluationsbeingundertaken during different seasons (see Section 6.4.1 on “Evaluation Survey Quality” and Table 6.15). The information availableintheseprogramdocumentswasnotsufficienttobeable to determine the extent to which these limitations also had an adverse affect on the quality of the consumption indicator data.126 According to FFPIB 11-03, the MAHFP indicator was eliminated because its 12-month recall period was considered to be too long to provide reliable results.
Table 4.5. Examples of Title II Development Programs in the FAFSA-2 Universe That Reported on the MAHFP and/or the HDDS between Baseline and Final Surveys
Country Program
Indicator
MAHFP HDDS
Bangladesh CARE X X
SC X
Burkina Faso Africare X
Chad/Mali Africare X
Ghana ADRA X
OICI X X
TNS X
Guatemala SC X
Guinea ADRA X
Africare X
OICI X X
Haiti CARE X
CRS X X
WV X
Honduras ADRA X X
SC X
WV X X
Madagascar CRS X
Malawi CRS X
Mozambique ADRA X
Africare X
CARE X X
SC X X
WV X
Niger Africare X
Rwanda WV X
Senegal/Gambia CRS X
Sierra Leone CARE* X
Uganda ACDI/VOCA X
Africare X
Zambia LOL X X
* Two programs

4-56 Agriculture, Natural Resource Management, Livelihoods, Income Generation
4.4.2 Household Income
Twenty-four of the programs in the FAFSA-2 universe reported on some form of household income indicator, with more than 80 percent of these indicators exceeding their targets. There was considerable variation in terms of how these indicators were defined, however, with some focusing on actual changes in some measure of household income and others focusing on changes in the percent of households that increased their incomes or sources of incomes.127
Examples of programs that exceeded their income targets include programs in Bangladesh (CARE), Bolivia (ADRA, CARE, FH, and SC), Ghana (OICI), Honduras (ADRA and CARE), Kenya (FH), Mozambique (ADRA, CARE, FH, SC, and WV), Nicaragua (ADRA, CRS, and PCI), and Zambia (LOL) (see Box 4.27). These programs all tracked the changes in average (mean) incomes, which is a relatively simple measure to calculate. A potential problem with this indicator is that large increases in
127 A variety of different indicators were used during the FAFSA-2 time period to measure household income. These included: average annual household income, average monthly household income, percent increase in household revenues from value added marketing activities, number of households reporting having diversified their sources of income, number of households benefiting from two or more new income generation activities, number of households reporting increases in income over the previous year, percent of women that have received increases in income, and annual increase in earnings from the sale of agricultural products.
household incomes on the part of a few households can raise the average (mean), making it look like incomes for the target group as a whole increased. To avoid this problem, three of the four Bolivian programs also collected information annually on the percent of households whose [annual] incomes increased by 5 percent or more over the previous year, which they used to get some sense as to how the increases in incomes generated under their programs were distributed among their clients.
Household income is a notoriously difficult indicator to measure, both for definitional reasons and because it can be very difficult to get accurate information from respondents, who are frequently reluctant to provide information on their incomes and have poor or no records on their production costs. Measuring household expenditures, which is often used as a proxy for household incomes, can also be difficult, especially in rural areas where expenditures frequently represent only a small share of total household consumption and because of the difficulty in determining appropriate values for the production that is directly consumed by the household rather than sold. Length of recall can also be a problem when collecting both income and expenditure data, with longer periods of recall reducing the likelihood of reliable results. Measuring gross farm incomes, which some Awardees did during the FAFSA-2 time period, should be somewhat easier for them because they should have access to information on crop yields and sales prices from their own project activities. This should give them an advantage in
Table 4.6. FFP Standard Impact Indicators Required in Baseline Surveys and Final Evaluations for Use in Title II Development Programs That Aim to Improve Access to FoodApplicable to development programs that aim to: No. Indicator Title
FTF Ind. Indicator background information
Improve household access to food
1 Average Household Dietary Diversity Score
Household Dietary Diversity Score (HDDS) for Measurement of Household Food Access: Indicator Guide
http://www.fantaproject.org/downloads/pdfs/HDDS_v2_Sep06.pdf
2 Percentage of households with moderate or severe hunger
X The Household Hunger Scale (HHS) Indicator Definition and Measurement Guide
http://www.fantaproject.org/downloads/pdfs/HHS_Indicator_Guide_Aug2011.pdf

4-57Agriculture, Natural Resource Management, Livelihoods, Income Generation
assessing the adequacy of the information provided by their respondents that others assessing farm incomes do not always have. Other potential weaknesses of using household income as an indicator is that incomes can vary considerably from year to year and are also driven by many factors outside the control of the individual Awardees, including weather and economic developments elsewhere in the country.
4.4.3 Household Assets
Tracking changes in household assets is another option for assessing program impact, but one that was not widely used during the FAFSA-2 time period. Only six programs included some type of asset indicator in their IPTTs—CARE in Honduras and Kenya, CRS in Liberia and Malawi, and WV in Haiti and Rwanda—and all six indicators were
different.128 Only two programs reported on their results, with CRS/Liberia meeting its target with respect to percent of targeted households with increased assets and the I-LIFE Malawi program exceeding the target that it set for its household asset indicator.
Asset indicators have several potential advantages: (1) they provide an indication of economic surplus (or deficit) over time, unlike measures of annual income/expenditures; (2) they may be more stable over time than income indicators, which are likely to vary more with changes in the weather; and (3) questions about asset ownership are easier to
128 The six indicators were: percent of targeted households with increased assets, average value of household assets, average number of key household assets, household asset index, percent of households with increased targeted assets, and percent of households accumulating liquid and productive assets.
Box 4.27. Raising Household Incomes in the Title II Programs
• Bangladesh: Monthly incomes of the participants in the CARE project increased by 133 percent between 2006 and 2009. These income increases did not result in any significant changes in assets, but the percentages of households not having to resort to certain food coping strategies, such as eating less food in a meal or skipping meals, also increased.
• Bolivia: All four of the Bolivia Title II development programs were able to achieve significant increases in the average annual gross farm incomes of their client households between 2002 and 2008, with the average household income in constant dollars doubling (ADRA), tripling (CARE and SC), and quadrupling (FH).
• Kenya: In the FH program, annual income from livestock production more than doubled between 2006 and 2008 among target households.
• Mozambique: The total annual household incomes of the households participating in the ADRA, CARE, FH, SC, and WV Title II programs ranged from 1.2 to 1.4 times greater than the non-participating households in 2007, the year before the projects ended.
• Nicaragua: Average annual gross household incomes increased by more than 130 percent in the ADRA project, and CRS and PCI reported that 53 and 89 percent of their households were able to increase their incomes between 2002 and 2008, respectively.
• Zambia: Average annual household incomes of participants in the LOL dairy project increased by 125 percent, with households also benefiting from a steady stream of income, with peak incomes from milk sales coinciding with the former “hunger months.”

4-58 Agriculture, Natural Resource Management, Livelihoods, Income Generation
answer than those about production and income levels because they rely less on estimates of quantities and prices. Asset indicators may also have some shortcomings. What is defined as an asset may vary considerably from area to area, for example; plus asset indicators could be difficult to aggregate across regions and countries.
4.4.4 Qualitative Information Suggesting Impact
Many evaluations also provided information on other changes that had occurred in people’s lives over the life of the project that project participants reported on and/or evaluators observed. This type of qualitative information may lack precision in terms of numbers of people affected and the magnitude of the changes. However, qualitative information can increase one’s understanding of project performance and likely sustainability, including by providing additional information on what changes people value more, what they perceive to have been their greatest challenges during the project and going forward, and how they plan to use the knowledge and opportunities they gained from project activities in the future.
• Quality of life. The positive impact of the programs on participants’ quality of life is frequently mentioned in many annual reports and mid-term and final evaluations. People that were interviewed during the FAFSA-2 five country visits also described how they used some of the increases in income to better their lives: improve their diets, make improvements to their houses, and keep their children in school, and, in some cases, send their children out of their communities to high school. Some also used their increases in income to make investments in their agricultural operations, buying fertilizer to use during the next cropping season and animals to feed and sell.
• Dietary preferences and nutrition. Dietary preferences and the nutritional quality of a diet are not the same. When the people interviewed during the FAFSA-2 five country visits talked about making improvements in their diets as a result of the Title II program’s assistance, most were referring to being able to afford some of the more
desired foods (e.g., foods that taste better and that add variety to their diets), and not about making improvements in their diets in a nutritional sense. In other words, increases in incomes do not automatically translate into improvements in the nutritional quality of people’s diets, if people lack basic knowledge about why good nutrition is important, what foods are more nutritious, how to plan and prepare more nutritious meals, and how to make better uses of their increased incomes to improve the nutritional quality of family diets. Higher incomes will also not necessarily result in a reduction in child undernutrition in the absence of community-based MCHN programs that deliver the ENA in the first 1,000 days and that provide access to improved waster, sanitation, and health services (also see Chapter 6 on “Maternal Child Health and Nutrition”).
• Migration. A reduction in the numbers of people migrating temporarily or permanently (e.g., fewer men in Bangladesh leaving their communities to go to Dhaka to find work pedaling a rickshaw or fewer men in Niger going south during the dry season to pour tea on the streets of a city in northern Nigeria) may also be one of the positive impacts of a successful program. The places people migrate to, the length of time they spend migrating, and the things they do to make money while they are in their new location differ, but all have social costs to their families and their communities. Most programs do not try to measure changes in migration, but a few evaluations make reference to migrants having returned home and/or that fewer people migrate now as a result of the new income opportunities closer to home as positive consequences of program interventions. A decline in the number of people migrating can be an ambiguous event, however; it could be the result of fewer job opportunities available in the areas to which people typically migrate, for example, instead of an increase in job opportunities closer to home.
• Pride and self-reliance. During many of their interviews in the field, FAFSA-2 team members were struck with how proud many people were when they explained what they had learned from
4-59Agriculture, Natural Resource Management, Livelihoods, Income Generation
the program and how they were able to use this new knowledge and these new opportunities to better their lives and the lives of their families. This pride and sense of self-reliance is hard to measure quantitatively, but it is real nonetheless. It also contrasts sharply with the sense of dependency and lack of self-reliance observed by the FAFSA-2 team in some communities, where the primary concerns of many community members was to make sure that the visitors understood how needy the community still was and to request more and/or continued assistance.
4.5 Cross-Cutting Issues and Opportunities
4.5.1 New Approaches to Market-Oriented Programs
It became increasingly popular during the FAFSA-2 time period for development practitioners to talk about making their programs more market-driven and, within the agricultural development community, to also move from a focus on agricultural production to thinking about the entire value chain for their priority commodities. This evolution in thinking about the role and importance of markets has also been taking place within the Title II development program, albeit somewhat unevenly, within USAID/FFP as well as within the Awardee community. The need to “rely on market-driven demand to maximize return and predictability of income generation” is highlighted in USAID/FFP’s current definition of its AG/NRM technical sector, for example (see Box 4.1). One also began to see more references in Title II development program documents during the FAFSA-2 time period to the AG/LH programs being market-driven and using a value chain approach.
During the FAFSA-2 time period, a number of donors also became more interested in the use of markets more generally to help improve the livelihoods of the poor. Programs with this focus include the “Making Markets Work for the Poor” approach, whose central idea is that “the poor are dependent on market systems for their livelihoods” and that “changing these market systems to work
more effectively and sustainably for the poor will improve their livelihoods and consequently reduce poverty.”129 Other programs with a similar focus on markets and the poor include the “Growing Inclusive Markets” program of the United Nations Development Programme, the “Opportunities for the Majority” program of the Inter-American Development Bank, and the “Next 4 Billion” program of the International Finance Corporation.130 These programs are not specifically focused on rural areas or on markets for agricultural or agricultural-based products, and they take a more systemic approach to markets instead of the more transactional approach used in the Title II development programs. That is, their primary focus is on how to bring about effective changes in market systems, which is in contrast to the Title II programs, which focus more on their clients and the actions that can be taken to assist and facilitate their participation in specific markets. Still, there may be lessons to be learned from these programs as well as potential areas for collaboration.
4.5.1.1 Market-Driven Programs
There is also growing evidence, including from the Title II programs in the FAFSA-2 universe, that programs that were/are more market-driven were/are more successful in helping their poor clients increase their incomes. However, not all programs that claim to be market-driven are actually driven by markets. Adding a market component to a project does not change a production-driven program into a market-driven one. Adopting a market-driven approach, in
129 The “Making Markets Work for the Poor” program receives funding from the United Kingdom’s Department for International Development, the Swedish Development Agency, the Swiss Agency for Development and Cooperation, and USAID. http://www.enterprise-development.org/page/m4p.130 More information about these programs is available at the following websites: “Growing Inclusive Markets” at http://www.undp.org/content/undp/en/home/ourwork/partners/private_sector/GIM.html; “Opportunities for the Majority” at http://www.iadb.org/en/topics/opportunities-for-the-majority/idb-opportunities-for-the-majority-serving-the-base-of-the-pyramid-in-latin-america.1377.html; and “Next 4 Billion” at http://www1.ifc.org/wps/wcm/connect/3c2787004cc75e6094d7b59ec86113d5/Pub_009_The%2BNext%2B4%2BBillion.pdf?MOD=AJPERES.

4-60 Agriculture, Natural Resource Management, Livelihoods, Income Generation
fact, requires a new way of thinking on the part of the Title II program staff and their farmer clients, one that requires them to focus on the market first and figuring out what people want and can be sold and not trying to figure out how to sell what they are already producing. Or, as Figure 4.12 suggests, if consumers want square watermelons, farmers should start producing square watermelons.
At the operational level, adopting a market-driven approach means that decisions about what products a Title II program should focus on need to start with an assessment of the market potentials that exist for their client farmers (market opportunities) and then move on to a more detailed assessment of the production potentials for these products (i.e., whether the Title II clients already do or could produce the products in question). Knowing about market opportunities and production potentials in the absence of information on production and marketing costs is also insufficient. Costs also count. Costs and returns also have to be calculated to determine whether the Title II clients can be competitive in these markets and make a profit.
Too many programs included in the FAFSA-2 universe were still too production-driven, however. That is, first priority was given to increasing the production of products that were already being/could be produced in their target areas, and programs frequently did not get around to dealing with marketing issues until the third or fourth year of the project. Marketing, in other words, still tended to be an afterthought or an add-on—a problem to be dealt with after the major production problems had been addressed.
Implementing a successful market-driven strategy that benefits the poor is not easy. Countries that are poor and landlocked, with small populations, which are characteristics common to a number of countries included in the Title II development program, are at a particular disadvantage; they have small local markets and can face higher transportation costs in getting their products to external markets. Plus, the areas where most Title II programs work tend to be isolated with poor infrastructure. But there are examples of successes. The four Title II
development programs in Bolivia (a landlocked country) were able to help their clients find a number of promising markets in nearby cities, regionally, and internationally for a broad range of products. Bird’s Eye chilies have also been successfully exported from Malawi and Uganda (also landlocked countries), with Title II assistance. Title II programs have also helped their client farmers make more money by selling to more promising local markets, including selling potatoes as seed potatoes in Bolivia, to a local potato chip maker in Guatemala, and to fast food restaurants in Kampala, Uganda.131 Other examples of programs that have succeeded in linking the poor to markets can be found in Markets and Rural Poverty (Mitchell and Coles, 2011) and on the websites cited in the previous section.
131 OneofthekeyfindingsfromMarkets and Rural Poverty is that “local and regional value chains and their associated labor markets are often of greater relevance to low-income producers in rural areas” (Mitchell and Coles, 2011, p. 236).
Figure 4.12. A Market-Driven Program: Focuses on Producing What You Can Sell, Not on Selling What You Are Producing
SC
/Bol
ivia

4-61Agriculture, Natural Resource Management, Livelihoods, Income Generation
4.5.1.2 The Value of Value Chains
The value chain approach also became increasingly popular within USAID during the FAFSA-2 time period, and it has been adopted as a major approach within FTF. The interest in this approach has also been growing within the Title II development community. More proposals are being submitted that include references to value chains, for example, the ACDI/VOCA, CARE, and SC proposals for the FY 2010–FY 2015 programs in Bangladesh. Numerous meetings have included or been organized around this topic by USAID knowledge management projects, including the USAID-supported Micro Links seminars and the USAID/FFP-supported TOPS project.
Within the FAFSA-2 time frame, the four Title II development programs that were implemented in Bolivia between FY 2003 and FY 2009—ADRA, CARE, FH, and SC—probably had the longest and most in-depth experience working with the value chain concept and applying it to their programs. What they learned was that adopting a value chain approach helped them think more systematically about the potential markets for their clients and what needed to be done to help their clients access these markets. It was a “tool,” in other words, that they used to improve both the design and implementation of their programs. SC, for example, identified one or more priority products for each of its intervention sites and then conducted specific value chain analyses for each of these sites and products. (See
Box 4.28. The Adoption of a Market-Driven Focus in Bolivia
In response to the results of an MTE, SC/Bolivia decided to convert its production-oriented program to what became a very successful market-driven program, which took a proactive approach to the development of value chains and to the promotion and facilitation of market linkages between its primarily indigenous farmer clients and a range of buyers, including supermarkets, processors, and exporters. At the time of the MTE visit to one of the highland communities, SC extension staff were focused on increasing the production of potatoes, which were the staple crop, but had not had much success in getting farmers to adopt the new technology package that they were recommending. SC staff were also spending some time organizing producers and marketing groups and familiarizing members with some basic marketing concepts, but none of the farmer members that were interviewed seemed to have much understanding of what their marketing opportunities were or how to take advantage of them. One of these communities was visited two years later by one of the MTE evaluators as part of a follow-on assessment and the changes that had taken place as a result of the shift to a more market-driven focus were dramatic. Farmers were producing a new product—broad beans—and selling them through forward contracts to an export firm that SC had helped identify. This firm was also providing producers with seeds and production and post-harvest TA. Farmers were also making more money selling potatoes, to higher-end markets—the traditional variety as certified seed potatoes and another potato variety that was more desired in the higher-end markets. SC had helped these farmers identify the market opportunities for these higher-value products and had shown them how to improve their production, harvesting, packaging, and transport practices. Significant changes had also occurred in people’s knowledge and attitudes. Community members appeared to have become more entrepreneurial, better organized, and more knowledgeable about business and markets, and could talk much more concretely about their plans for the future.
Source: SC/Bolivia Assessment (van Haeften et al., 2006).

4-62 Agriculture, Natural Resource Management, Livelihoods, Income Generation
Figure 4.13, an example of the value chain that SC developed for dry beans destined for export markets.) These analyses included information on specific buyers in each chain and specific players at each stage in the chain, from input and service providers through production, assembly, processing, packing, and marketing.
As these analyses were developed, gaps were identified (e.g., lack of service providers), as well as constraints, bottlenecks, and opportunities. SC used this information as a basis for deciding where its Title II programs could make the greatest contributions, with which organizations currently active in the value chain it should think about collaborating and partnering, and what role these and other organizations could play—in some cases with some assistance on their part—as part of their sustainability and exit strategies. More specific lessons learned about the value of a value chain approach by the four Bolivian Title II programs are summarized in Box 4.29. What distinguished these Title II value chain activities from other value chain activities, however, and what was essential to their success, was that they were focused on specific
clients in specific geographic areas and were market-driven.132
4.5.2 Economics 101
USAID reported in a 2012 publication, Frontiers in Development, that it had decided to reclaim economic analysis within the agency to “direct practitioners to the most promising and sustainable paths to development” and to ensure that “we use scarce funds to benefit the poor by intervening where necessary and leveraging private funds and untapped sources of capital wherever possible” (Bahn and Lane, 2012, p. 192). The analytical tools that it plans to use include the traditional ones, such as cost-benefit analyses and cost-effectiveness analyses, and newer ones, such as growth diagnostics and randomized control trials. USAID/FFP also needs
132 The Markets and Rural Poverty assessment also stressed the importance of markets in the development of value chains, arguing that “[a] value chain development exercise which focuseson‘empoweringproducers,’butfailstofindaviablemarketing channel in which they can sell their output, is not an effective use of development funding” (Mitchell and Coles, 2011, p. 259).
Figure 4.13. Dried Haba Bean Chain
Save the Children
Certificaton committee
ASOHABA
Certification
DESTINATION: EXPORT TO JAPAN AND EUROPE
PRIMARY PRODUCTION COMMERCIALIZATIONPROCESSINGGATHER
Farmers Producers Assoc. Enterprise Enterprise
Communities at the Municipality of Cairoma
Save the ChildrenDemonstrative plotsTechnical assistanceIrrigationCooperación Tec. BelgaGathering centerASOHABASeeds provision
ASOHABA ASCEXAMPROARACA ASOHABA ASCEX
Technical Services Enterprise Services
Save the ChildrenFormationStrengtheningTrainingSelling contractServicios Industriales CruceñoSICIndustrial Machinery
Certification Services
Source: Recreated from SC/Bolivia.

4-63Agriculture, Natural Resource Management, Livelihoods, Income Generation
to be more concerned about issues of cost benefits and cost-effectiveness, especially now at a time of growing resource scarcity and to increase the likelihood that the Title II AG/NRM/LH programs have substantial and sustainable impacts on the economic well-being of their target groups.
Title II Awardees also need more information on the costs and returns of their own programs (those involving knowledge transfers as well as physical structures) to ensure that they are making effective use of scarce resources. And, to be of most use to their clients, Awardees also need to have a better understanding of whether and how much their clients
will benefit if they accept their advice, i.e., if the client farmers adopt the technologies and practices that the programs are promoting. Awardees also need to be thinking about working more closely with their clients to help them develop a better understanding of the economics of their enterprises as well as their households as a whole. If their programs involve working with micro-, small, and medium businesses and/or the development and strengthening of producers’ and marketing associations, Awardees also need to be able to assist these groups/organizations with the development of business plans and to help them understand the importance of becoming and remaining profitable and competitive.
Box 4.29. Lessons Learned about the Value of the Value Chains Approach from the Four Title II Development Programs in Bolivia
“The adoption of a value chain approach provided a number of benefits to the CSs [cooperating sponsors] including:• Providingconceptualclarity—The analytical process that the CSs went through to develop these
value chains was useful because it helped them better understand the nature of the markets that they were trying to help their clients participate in, the opportunities in these markets and the constraints and bottlenecks. It also made it easier for them to identify where their assistance was most needed, and what that assistance should be, providing technical assistance in production and post harvest technologies, for example, helping conduct market assessments, and/or facilitating market connections, or providing business management training.
• Guidingprogrammanagement—The adoption of the value chain approach was also useful at a more practical level, because it helped the CSs organize the individual activities they had been implementing under their IG programs in a more coherent way that facilitated the management of their own programs and staff, and helped them better coordinate activities with other actors in the chain. The value chain approach also seemed to have helped some field technicians do their work better by giving them a clearer vision of their roles and the contribution that their work made to the overall program.
• Encouragingtheidentificationofandcollaborationwithpartners—Several of the CSs were criticized in the MTE for trying to do too much on their own and not collaborating enough with other organizations operating in their areas with similar or overlapping objectives. This need to enlist the help of other organizations in order to achieve their income generation objectives seemed to be more obvious and harder to ignore once a value chain was developed. And, by the end of the project all four CSs were working more closely with and relying to a larger extent on other organizations as a major aspect of their sustainability strategies. Having a clearly articulated value chain also seemed to help some of the CSs partners get a better understanding of where and how their activities were contributing to improving and sustaining the overall operation of the value chain.”
Source: Joint Final Evaluation Bolivia (van Haeften et al., 2009, p. 100).

4-64 Agriculture, Natural Resource Management, Livelihoods, Income Generation
Awardees will need to add basic economic and business management skills to their staff, but might be able to access the additional expertise needed for more specific analytical work through partnering with local universities and business schools, for example.
Unfortunately, during the FAFSA-2 time period, the capacity of most Title II Awardees to conduct and make use of economic analyses to support the selection and management of their AG/NRM/LH interventions was quite limited. Only a few programs had access to information on the costs and returns of their own interventions, or the costs and returns to farmers of the technology packages that they were recommending. Even fewer programs had the capacity to develop this information on their own.
4.5.3 Managing Risks and Reducing Vulnerabilities
The 2006–2010 Strategic Plan committed USAID/FFP to reorienting its programs to focus more directly on the vulnerabilities of the food insecure. This included focusing more on risk prevention and helping farmers manage their risks better. Title II farmer clients, as was pointed out earlier in this chapter, have to cope with large amounts of risk in their lives. AG/NRM/LH strategies that the Title II development programs have used to help their client farmers reduce their risks and increase their resiliency include helping them diversify what they are producing on their farms and/or into non-farm sources of income133 and introducing more drought resistant crop varieties, conservation agricultural practices, water harvesting techniques, soil and water conservation, and irrigation.
133 As indicated in Section 4.1.2.2, many households in the Title II target population have already developed alternative livelihoodstofarming.Thisdiversificationstrategyhelpsthem supplement their incomes and manage their risks, but it also has costs as is pointed out in Poor Economics: A Radical Rethinking of the Way to Fight Global Poverty: “Having multipleoccupations…isalsoinefficient.Itishardtobecomeaspecialist in anything without specializing in something” and “[b]y passing up these opportunities [to specialize], [the poor] also pass up the gains from specializing in what they are really goodat”(BanerjeeandDuflo,2011,p.143).
Many Title II development programs in the FAFSA-2 universe were already employing these strategies prior to the adoption of the Strategic Plan, and it was difficult to determine from the documentation available or from the field visits whether Awardees were giving more emphasis to risk prevention and management after the adoption of the Strategic Plan. The FAFSA-2 team encountered more good examples of the application of conservation agricultural practices in the field than during previous field visits, in Malawi, for example. This may have had more to do with the maturation of the technology, however, and the fact that the researchers and practitioners have been paying more attention to the labor requirements of these practices, which may have been one of the more important factors limiting the uptake of some of the packages that were being promoted earlier in the FAFSA-2 time period. A similar situation may be occurring with respect to the adoption of improved soil and water conservation technologies more generally. The new approaches used to promote soil and water conservation give more emphasis to the use of biological measures, which are less labor intensive than building structures, and to practices that provide concrete economic benefits to farmers in a much shorter time period. These approaches are more attractive to farmers economically, and it is this change that may be responsible for the higher adoption rates rather than more attention being devoted to these programs. More attention should also be paid to the development of irrigation systems, which, as many Title II final evaluations pointed out, is one of the more effective ways to reduce risk and increase production and incomes in the drought-prone areas where so many of the Title II development programs work.
4.5.4 Sustainability
4.5.4.1 Commercialization, Profitability, and Increased Incomes
Preliminary results from the Tufts study on Title II exit strategies support the FAFSA-2 conclusion that commercialization, profitability, and increased incomes do matter. In fact, they seem to be essential to achieving both impact and sustainability. One

4-65Agriculture, Natural Resource Management, Livelihoods, Income Generation
of the lessons learned from the four Nicaragua agricultural-based income generation programs, for example, was the importance of “commercial, market-oriented production in order to increase incomes” (see Box 4.30).
These characteristics (commercialization, profitability, and increased incomes) also seem to be key to the sustainability of these production and income increases. Program interventions/activities in the AG/NRM/LH programs that were most likely to be sustainable were those that were organized around economic incentives—profitability—and supplied their own resources. This means projects
that used a business model and focused on markets and the sale of goods and services to these markets.
Using the language of the Tufts analytical framework, which identifies motivation, resources, and capacity as the three key factors contributing to sustainability (see Box 4.31), the Title II farmers included in these commercialization programs had the:
• Motivation (incentives) to continue to use these technologies and practices (as long as they were able to continue to sell their products at a profitable price). (Others in the value chain are also likely to continue participating in the chain as long as their participation remains profitable.)
• Resources they needed to be able to continue to buy the necessary inputs (from the sales of their products).
• Capacity to continue to use these improved technologies and practices (having been trained by the Title II extension programs).
The importance of economic incentives and business models is also stressed in discussions on sustainability in the recent literature on markets and the poor. The “Making Markets Work for the Poor” approach recommends building programs around incentives and capacities, arguing that successful change in markets is “based around developing the technical capacities of different players and aligning better their incentives and motivations” and that
Box 4.30. Lessons Learned from the Nicaragua Income Generation Programs
“One of the most important lessons learned during this [program] has been the importance of commercial, market-oriented production in order to increase incomes. Some of the cooperating sponsors focused mainly on small-scale, socially-oriented interventions in the beginning, but since 2006 all of them have had commercial agricultural components. Certain key elements have been universal: Choosing crops based on the results of market surveys, identifying industrial clients and signing production contracts, collective marketing assisted by current market price information, technical production advice, adoption of productive technologies such as drip irrigation and hybrid seeds, the formation of profitable producer enterprises, and the development of the entire value chain simultaneously. This strategy has led to results that are both durable and significant in scale.”
Source: Nicaragua Joint Final Evaluation (Harris, et al., 2007, p. 82).
Box 4.31. Key Factors Contributing to Sustainability
• Motivation (e.g., profit)
• Resources (e.g., a self-financing business model)
• Capacity (e.g., technical and managerial knowledge/skills)
Source: Tufts Exit Strategies Study (Rogers and Coates, 2013).

4-66 Agriculture, Natural Resource Management, Livelihoods, Income Generation
incentives and capacities are key to sustainability.134 And Markets and Rural Poverty concluded, based on its seven action-research projects, that “no amount of good will, money or effort is sufficient to develop relationships that operate against business models” (Mitchell and Coles, 2011, p. 250).
In Bolivia, which was one of the Tufts focus countries, the value chains established under the four Title II programs were still operating successfully two years after the programs had ended. The key benefit from these programs, according to the Tufts analysis, was the increased incomes of producers and the profitability of these activities, which means that producers can continue to invest in inputs and TA (Rogers and Houk, 2011). In Honduras, another Tufts focus country, the study found that program activities and benefits were sustained in communities where farmers (e.g., coffee farmers) could translate their increased yields into profits because they had access to certification systems and to buyer organizations. What did not seem to be sustainable in Honduras, according to the Tufts study, were programs focused on increasing the production of food crops, primarily for home consumption. In these cases, farmers reported some increases in yields and incomes during the life of the project, when inputs were supplied by the project(s). However, after the projects ended, farmers indicated that they lacked the resources to purchase these inputs and thus were not able to continue to capitalize on the yield-increasing technology packages that were originally provided by the projects (Rogers and Sanchez, 2011). During its field visit to Malawi, the FAFSA-2 team also saw firsthand the important role that commercialization and profitability played with respect to the sustainability of several irrigation systems developed under the I-LIFE project (FY 2005–FY 2009) (see Box 4.32).
134 “Sustainability is a prime concern of the [‘Making Markets Work for the Poor’ approach],” according to the synthesis document. “This means not just considering the existing alignment of key market functions and players but how they can work more effectively in the future, based on the incentives and capacities of players (government, private sector, associations, etc.) to play different roles” (Tschumi and Hagan, 2008c).
Box 4.32. A Lesson in Sustainability from Four Small-Scale Irrigation Projects in Malawi
The FAFSA-2 team visited four irrigation systems that had been developed under the I-LIFE project (FY 2005–FY 2009) in Malawi by three of the CRS Consortium members: Africare, WV, and Emmanuel International. Two of the systems were doing very well at the time of the visit and two not so well. Why the differences? The two that were doing well were located close to good markets, and business was so good that both user groups had expanded their systems, one digging a second long diversion canal to bring water from the river to an expanded irrigation perimeter. A third group asked for additional resources to help make improvements in their system. But when asked why they couldn’t use their own resources, from their savings and loan groups, they explained that any additional investment in the system on their part would not pay off, because selling more produce on the nearby roadside, which was the only market readily available to them, would only drive down prices. The fourth system was no longer functioning because its water source had dried up earlier in the season. The biggest challenge facing the farmer group that had dug the second diversion canal was the hippopotamus that was walking up from the nearby river to eat their irrigated maize. Their solution to this challenge? To dig another deep ditch on their own around their entire irrigation perimeter.

4-67Agriculture, Natural Resource Management, Livelihoods, Income Generation
4.5.4.2 Capacity Strengthening
To be sustainable, the Title II development programs also have to focus on capacity strengthening. To be effective, however, this effort needs to go beyond the traditional focus on producers and producer and community groups to encompass other actors along the value chain. One of the advantages of the value chain approach, as was suggested in Box 4.29, is that it forced the Bolivia programs to identify the existing actors along the chain and the roles that they played and could possibly play, including whether they could take over some of the service delivery activities that the Title II programs planned to provide. Much of the focus in the past has been on the role of local and national government agencies as service providers and, failing that, on strengthening producer and community groups. But, as the experiences of a number of programs in the FAFSA-2 universe demonstrated, the potential suppliers of key services, including extension services, include local NGOs, universities, input suppliers, processors, buyers from large retail stores, and exporters. And, if these potential service providers are identified early on in a program, Awardees can take steps to increase the likelihood that these service providers will be able to take over from the Awardees at the end of the Title II program, including by initiating and strengthening linkages between these organizations and the Title II clients, helping build trust among these groups, and, when appropriate, including them in project extension and training activities.
The reality in most cases is that the governments will not be able to take on many of the service delivery activities being provided by the Title II development programs. One element of CARE’s exit strategy in Bangladesh was to make sure that people in the communities it was exiting had the cell phone numbers for their local government service providers and their local political representatives. This is part of CARE’s “rights-based” strategy, but it is more likely to work in situations where who gets access to services may be more of a problem than whether services are actually available. In most areas where the Title II development programs work,
most services are likely to be unavailable or in short supply. Some staff are located in district offices, for example, but they do not have the resources to travel to the field. It would be preferable if more government services were available in these poor, rural areas where the Title II development programs work. But their absence does not mean that Title II development programs cannot help establish successful and sustainable commercialization programs, including by involving other actors available in the local NGO, university, and private sector communities, for example.
4.5.5 Key Assumptions and Alternative Development Models
The documentation for the Title II development programs tends not to be very clear about the assumptions that underlie the design of a given program or the model that the program is using.
4.5.5.1 Key Assumptions
Farmers and Farming
The vast majority of Title II development programs implemented during the FAFSA-2 time period appear to have been designed based on the assumptions that the vast majority of their clients were farmers and that solutions to their clients’ problems lay primarily in production agriculture. This strategy was successful in numerous situations. That is, the FAFSA-2 universe includes numerous examples of programs that helped improve the lives of their clients, usually by providing them access to a combination of improved agricultural technologies and market opportunities. But not all clients in the Title II target areas were/are farmers, and many who did/do farm did/do not have the asset base needed to farm their way out of poverty. Some programs included limited amounts of support to the development of microenterprises, which undoubtedly helped these clients in the short run. The value of these programs over the longer term is not that clear, however, given the growing body of evidence that most of the poor do not have sufficient entrepreneurial skills to be able to transform a microenterprise into a successful small business

4-68 Agriculture, Natural Resource Management, Livelihoods, Income Generation
(Banerjee and Duflo, 2011, Chapter 9, “Reluctant Entrepreneurs,” pp. 223–234).135
What most programs need to do is broaden their focus to include opportunities that would create more off-farm employment activities for their clients, as was recommended in the Bangladesh FSCF for FY 2010–FY 2014 (see Box 4.33). IFPRI, in its 2011 Global Hunger Index, also recommended that development practitioners “foster and support non-farm income opportunities in rural areas,” arguing that farmers producing solely for subsistence without additional income opportunities will remain vulnerable to weather and price shocks” and that “[i]mproving resilience also involves fostering nonfarm income opportunities in rural areas and fostering an environment in which nonfarm activities can thrive” (IFPRI, 2011, p. 8).
The Vulnerable or the Vulnerable and Viable
Related to the issue of farmers and farming is the question of whether the target clients for the AG/NRM/LH programs should be the “vulnerable” or the “vulnerable and viable.” At the time of the FAFSA-2, one still heard some stakeholders describe the Title II programs working with the poorest of the poor, the bottom 10 percent of the income distribution, and the most vulnerable, and not always making the distinction that FTF programs do between the “vulnerable” and the “vulnerable and viable.” This focus on the most vulnerable led some Title II programs to try to adopt an agricultural solution for some farmers that were very unlikely to be able to farm their way out of poverty or food insecurity, because the agricultural resources that they had access to, land in particular, were insufficient even with the application of new technologies and access to higher-value markets.
135 Paul Collier also makes the point that few people are suited for entrepreneurship, arguing that “[g]iven the chance, smallholder farmers in poorer countries seek local wage jobs and their offspring head to the cities. This is because at low income levels rural bliss is precarious, isolated and tedious. The life forces millions of ordinary people into the role of entrepreneur, for which most are ill suited. In successful economies, a majority of people invariably opt for wage employment, so they can leave to others the worry and grind of running a business; entrepreneurship is a minority pursuit” (Collier, 2010, p. 213).
(Also see the discussion in Section 4.1.2.2 on the Title II target population.) Few proposals written during the FAFSA-2 time period addressed this issue, let alone indicated how they planned to deal with it.
The distinction between the “vulnerable” and the “vulnerable and viable” is an important one that needs to be made in the AG/NRM programs, given the likelihood of continuing pressure on the availability of resources for Title II development
Box 4.33. Broadening the Focus in Bangladesh to Include Creating Jobs for Clients of Title II Development Programs
“In Bangladesh, in other words, Awardees are going to have to consider including several different types of approaches to working with their client groups in their IG programs. Some households will be able to benefit from options that will enable them to derive more value from what limited land they do have, adopting improved rice varieties and production practices, for example, or more likely, moving into higher valued horticultural crops or other higher valued agricultural activities such as poultry, livestock feeding and aquaculture. In these cases, Awardees will be able to work with their client households directly, which is the typical approach used in Title II IG programs. Other households will need access to better paying jobs and/or other income earning opportunities, however, and, finding effective ways to assist these households is likely to require more experimentation and creativity. This is also likely to include finding acceptable ways of working and collaborating with other actors, including other USAID projects that are focused on the development of small and medium enterprises as well as private sector businesses.”
Source: Bangladesh Food Security Country Framework (van Haeften and Moses, 2009, p. 62).

4-69Agriculture, Natural Resource Management, Livelihoods, Income Generation
programs. The basic question is whether Title II development resources should continue to be used to try to help people become better farmers that basically stand no chance of becoming economically viable as farmers. Economists would argue that this strategy is not cost-effective and that Title II development programs, if they are truly development programs, should focus on farmers that are “vulnerable and viable” and look for other options involving the creation of off-farm jobs, for example, for those clients that do not fall into this category. Many economists would also argue that a strategy that focuses scarce resources on activities that have little chance of success have high opportunity costs in that they divert resources from other activities that might have a higher probability of success. Other avenues are also available within the Title II development program to provide short-term assistance to the truly vulnerable, the elderly, and orphans, for example, through Vulnerable Group Feeding Programs. There are serious trade-offs that many programs are not taking into account, in other words; Title II Awardees can choose to focus primarily on agricultural programs, in which case they need to target the “vulnerable and viable,” or they can chose to focus on all the vulnerable, in which case they need to explore other options for their target clients in addition to farming (see Table 4.7).
A variety of indicators have been used to assess degrees of household vulnerability, including assessments of poverty levels (based on household incomes and/or expenditures), number or value of assets, size of land holdings, and extent of market participation. These indicators are less useful in distinguishing among households in terms of potential to participate in new economic opportunities, however. Farming is not likely to be a promising activity for households that have little
or no land, but small amounts of land or the fact that households do not have crop surpluses to currently sell are not necessarily good indicators of whether they will be able to participate if they are helped to gain access to a new market for a higher-value product and to the knowledge of new and improved technologies and practices that will help them become more competitive.136 Michael Carter, in a Thematic Note for FTF, describes the experiences that a Millennium Challenge Corporation program in Nicaragua had in trying to restrict participation in its value chain activities to households with a minimum of two to five hectares. According to Carter, there was no evidence that farmers with resources less than the eligibility criteria were not able to effectively participate in the value chain activities. If anything, the data actually suggest that “initial living standards were higher among the households that benefited least from the program” (Carter, 2012, p. 3).137 The economic viability of communities and households can also be changed with the introduction of new productive infrastructure, feeder roads, and small-scale irrigation in particular.
To get a better idea of which households and communities are likely to be viable is going to require more information on the market
136 Small farm sizes were not a serious constraint to the adoption of the Green Revolution high-yield grain varieties either (although smaller farmers and tenants tended to lag behind in the early years following their adoption), or an important source of a differential growth in productivity (Ruttan, 1977).137 The message for FTF, Carter argues, is that “the minimum requirements for effective participation in value chain programs is an open question that requires exploration. From this perspective, standard program evaluation criteria that fail to create either the incentives or the space for program implementers to probe these requirements should be revisited. More globally, FTF’s learning agenda needs to prioritize exploration of these requirements or minimum asset thresholds” (p. 3).
Table 4.7. Clarifying Project Design: Farmers and Farming and the “Vulnerable” or the “Vulnerable and Viable”
VulnerableNot Viable as Farmers Viable
Livelihoods Farming NO YES
Non-Farming (microenterprises and/or jobs) YES YES

4-70 Agriculture, Natural Resource Management, Livelihoods, Income Generation
opportunities that might be available to a particular community or sets of communities, the production potentials in the area, and an analysis of what it would take for farmers in these communities to be able to compete in these markets. Program developers and implementers should begin to get a better idea of which households are likely to be viable as they develop their value chain analyses and especially during their assessment of production potentials and constraints to participation in the chain and what are the likelihoods of being able to overcome them, which could differ by location, how near households are to a road, for example, and/or whether they have access to a source of water. Costs of production and costs of getting products to market would also have to be estimated for different groups. Some notions as to the relative costs and benefits of alternative strategies for decreasing these constraints will have to be developed, recognizing that some activities may not be cost-effective if they will benefit only a few households, for example, or in cases when the benefits may be widespread but are minimal.
Productivity and Profitability
Programs that were implemented during the 2002 FAFSA time period tended to be focused on increasing agricultural productivity, the productivity of food staples in particular. The 2002 FAFSA suggested that this focus originated with the 1995 Policy Paper and subsequent USAID/FFP guidance that continued to put stress on increases in agricultural productivity as one of the best indicators of the food security impacts of the Title II development program (Bonnard et al., 2002, p. 48).
Increasing agricultural productivity means helping resource-poor farmers get higher returns from their scarce land and labor resources, which is important. But many food insecure farmers have little or no land. This means that increasing yields (output per hectare of land), which is the usual measure of increased productivity, is not as important to them as increasing the returns to their labor (i.e., output produced per person). Output per person is the indicator small farmers are more likely to use when trying to decide what to do with their scarce time—whether to spend more time working on
their own land, looking for casual labor nearby, or migrating further afield—not yields. Increasing agricultural productivity may be important to policy makers and planners, but for small farmers it is the increased profitability of their enterprise that is more important, along with managing risk.138 There are also other, more promising routes to increased profitability than increasing the productivity of staple food crops, as the 2002 FAFSA also pointed out. These more promising strategies include switching into livestock, off-season vegetable production, tree crops, and other products for which there are high-value niche markets. (See Box 4.34 for information on the economics of growing basic grains in Guatemala and why farmers are likely to prefer growing high-value winter vegetables for export rather than their staple food. Also see Section 3.4.3 on “Improving the Integration of Program Interventions” for a discussion on the various pathways between production for own consumption and sale and incomes and improved diets.)
Food from Purchases and/or from Own Production
Some in the Title II development community remain conflicted about the switch that is occurring to more commercially oriented programs. More practitioners recognize that their Title II clients can make more money by producing products for sale in more profitable markets. However, some still worry that these successes in increasing household incomes will not lead to improvements in family diets or the nutritional status of family members, young children in particular. These are legitimate worries, but not all cash crop programs have had negative consumption/nutrition effects (see Box 4.35 for information on a well-documented export program that had a positive effect on the consumption and nutrition of small, resource-poor farmers in the highlands of Guatemala).
138 Glennerster and Jack cite an example where overconcentration on yields led to “inappropriate advice being disseminated through agricultural extension” and argue that“[u]nderstandingtherelativeprofitabilityofdifferenttechnologies in real farm conditions is an area where more evidence is needed to inform the strategies of FTF—i.e., where best to focus energies” (Glennerster and Jack, 2012, p. 2).

4-71Agriculture, Natural Resource Management, Livelihoods, Income Generation
Box 4.34. The Economics of Basic Grains in Guatemala
The costs and returns to small farmers of growing corn versus horticulture products indicates that small farmers can make much more money by growing French Beans or Snow Peas on one half a manzana of their land than by growing corn on one manzana—almost 17,000 quetzales from the French Beans (two harvests) or Snow Peas (one harvest) compared to only 1,784 [quetzales] from traditional corn. And, the total income (for farmers plus laborers) generated from the production of either one of these horticulture products is over 37,000 [quetzales] compared to only 6,084 [quetzales] from corn.
Source: Wingert, 2010, pp. 30–31.
Box 4.35. The Consumption/Nutrition Effects on Small, Resource-Poor Farmers in Guatemala of the Switch to Producing Labor-Intensive Crops for High-Value Export Markets
In the late 1980s, as one of several in-depth analyses of the cash crop consumption/nutrition issue, IFPRI looked at the potential benefits and risks to small, resource-poor Guatemalan farmers from switching to the production of high-value winter vegetables for export. These new export crops were rapidly adopted by the smallest farmers in the Western highlands, an area known for its high levels of poverty and undernutrition, because they were substantially more profitable than their traditional maize and beans. Households without access to reliable sources of off-farm income showed significantly higher probabilities of adopting these new crops. Income gains were highest among the adopters on the smallest farms. The non-traditional export crops were more labor intensive than the traditional crops, creating more local employment on farms and indirectly through forward and backward linkages and multiplier effects from increased income spent locally. Food expenditures and consumption increased relatively less than expected. But the nutritional status of young children improved, with the most significant decreases in wasting (weight-for-height). Most export crop producers preferred to continue to use some of their limited land for food production for home consumption, but their yields were higher because they now had the money to buy fertilizer. So the end result was that they were able to obtain more of their maize and beans (per person) from their own production than other non-export producers with farms of the same size. The nutritional benefits from the economic growth generated from this export program were “substantial,” according to IFPRI. Equally interesting in the Title II context was IFPRI’s conclusion that “joint operation and development of the health and sanitation infrastructure in rural areas is required to translate the growth effects into nutritional welfare effects for the poor.”
Source: von Braun, 1989, pp 11–13.

4-72 Agriculture, Natural Resource Management, Livelihoods, Income Generation
Title II development programs can also take actions that can help avoid/mitigate the potential adverse effects of an increased emphasis on market-oriented, agricultural development programs. Increases in income do not automatically translate into improvements in the nutritional quality of people’s diets if people lack basic nutrition knowledge and/or basic foods are not available in local markets and/or only at unaffordable prices. Dealing effectively with clients’ lack of knowledge is a problem that most Title II Awardees already have considerable experience with, including by adding nutrition education activities in home economics add-ons to their agricultural components or to their community-based MCHN components. Most Title II clients need more information about why and how they can improve their diets, including information on why good nutrition is important, what foods are more nutritious, and how to plan and prepare more nutritious meals. This is true whether they are consuming food that they are producing on their own land or buying it in local markets or both. Improving the nutrition of the younger children in the household is also likely to require another set of activities (e.g., improved child care practices; access to and use of preventive and curative health care; and improved water, sanitation, and hygiene). (See the top section of Figure 1.1, “Food Security Conceptual Framework Developed for Use in the FAFSA-2.” Also see discussions in Chapter 6.)
4.5.5.2 Alternative Development Hypotheses and Models
Most proposals approved during the FAFSA-2 time period included results frameworks, per USAID/FFP requirements, but many were not clear about the models that they were using or their positions with respect to markets and whether linking their clients to markets was a viable strategy for lifting them out of poverty and food insecurity. As one outcome of its program review, the FAFSA-2 team was able to articulate four distinct models that differ in terms of the assumptions made about whether the Title II target populations can be linked to growing markets and, if so, what strategies work and in what
order. The basic characteristics of these models are described next and in Figure 4.14.
The Food Production for Home Consumption Model
The 2002 FAFSA assumed that there would be some households among the Title II target groups that one should forget about trying to link to markets and recommended that programs just concentrate on helping these households improve agricultural productivity for home consumption. The approaches used in these programs were similar to those used in more market oriented programs, i.e., the promotion of new/improved technologies and practices using TA, training, and the provision of inputs. Usually the focus was on basic staples, but some programs also included a focus on vegetable gardening and small animals, including goats and chickens—all for home consumption. Some argued that this strategy was most suitable for farmers that lacked surpluses to sell, the so-called “subsistence farmers,” forgetting that even subsistence farmers are active in markets when they sell their labor. What has become more apparent recently, in part as a result of the preliminary results from the Tufts Exit Strategies Study (see Section 4.5.4.1), is that the changes that are produced using this model seem not to be sustainable. For example, the Tufts study found that programs in Honduras that focused on increasing the productivity of food crops primarily for home consumption did not result in any lasting changes. Farmers used the new practices and inputs while the project was under way, but stopped using them once the projects were over because they lacked the resources to buy the inputs that the projects had been supplying.
The Graduation Model
A number of programs included in the FAFSA-2 universe implemented some version of what has come to be called the “Graduation Model.” This model, according to the Consultative Group to Assist the Poor (CGAP), is based on five core elements: (1) targeting to ensure that only the poorest households are selected for the program,

4-73Agriculture, Natural Resource Management, Livelihoods, Income Generation
(2) consumption support to stabilize consumption, (3) savings to build assets and instill financial discipline (with some variants relying on MFIs and others on VSLs), (4) skills training to learn how to care for an asset and run a business, and (5) an in-kind asset (often livestock) to help jump-start a sustainable economic activity.139 Proponents argue that these activities, if well sequenced and intensely monitored, “can lead to increased consumption, asset and income diversification, and some level of empowerment.” Proponents also recognize that the model may be too challenging for some households (including the elderly, the disabled,
139 According to CGAP, this model is based on an approach developed by the Bangladesh Rural Advancement Committee (BRAC), which, in 1986, began partnering with “the Government of Bangladesh and the World Food Programme to add a graduation ladder to an existing national safety net program that was providing the poorest households with a monthly allocation of food-grain for a two-year period. BRAC workedwiththesebeneficiariesandaddedskillstraining,mandatory savings and small loans to accelerate livelihoods development” (Hashemi and de Montesquiou, 2011, p. 1).
and the dysfunctional), because it “rests on the ability of individuals to seize the opportunity to create new economic activities and create their own pathways out of poverty.” Market opportunities and challenges are supposed to be taken into account when livelihood options are designed, so markets are not ignored. But the model itself does nothing to “directly tackle market conditions,” even though proponents recognize that lack of markets or poorly functioning markets can severely constrain the development of the household-level entrepreneurs that the model is trying to promote (Hashemi and de Montesquiou, 2011, p. 11).
The Pull Model
Other models focus on using markets as a pathway out of poverty but have different hypotheses about how to link the vulnerable to growth, how these links work, and what approaches are more effective in fostering these links. The focus of the “Pull Model,” as some describe it, is on developing markets/value chains first and secondarily on
Figure 4.14. Alternative Models for Working with Title II AG/NRM/LH Development Programs
FOOD PRODUCTION FOR HOME CONSUMPTION MODELAssists producers improve food production for home consumption, including through dissemination, improved technologies, and training.
GRADUATION MODELAssists farmers improve their asset bases, including through asset transfers, training, and increasing access to financial services. Some also include consumption support.
PULL MODELLinks producers to markets/value chains, including graduates from a push model (aka a graduation model).
PULL PLUS PUSH MODELLinks producers to new/higher value markets in combination and simultaneously with the introduction of new/improved crops, technologies, and practices; TA and training; and, in some cases, asset transfers.
EMPHASIS ON MARKET-DRIVEN PATHWAYS OUT OF POVERTY AND FOOD INSECURITY

4-74 Agriculture, Natural Resource Management, Livelihoods, Income Generation
linking producers to these markets/value chains. Many of the earlier “Pull Models” focused on the larger, more commercially oriented farmers, but since the mid-years of the last decade, there have been a growing number of programs that have had some success in linking poorer producers to more promising higher-valued markets, including through value chains. Since the primary focus of these programs is on markets and improving marketing, resources to tackle problems at lower levels of the value chains have often been limited, especially when it comes to the special needs of the smaller, more vulnerable producers. USAID/Ethiopia, in its Strategic Review for FTF (2010), proposed to deal with this problem by marrying two models—the “Graduation Model,” which it renamed the “Push Model,” and a separate “Pull Model.” The larger, more commercially oriented farmers were expected to be ready to participate in the “Pull Model” immediately, while the more vulnerable households would have to be enrolled in and graduate from the “Push Model” before they would be ready to be linked into value chains.140 One issue with the “Graduation Model” (aka “Push Model”) is whether or not one can realistically expect to be able to make a meaningful and sustainable difference in poor people’s lives without “directly tackling market conditions.” There are also issues in trying to marry the “Push Model” and the “Pull Model,” including an issue of sequencing. How interested are resource-poor farmers likely to be in participating in a “Push Model” if they are excluded from the incentives that come from making sales for a number of years until they are deemed to have graduated? Asset transfers may keep them interested for a while, but integration into a growing market offers longer-term advantages.
140 USAID/Ethiopia had already been experimenting with alternative approaches to working with the chronically poor and food insecure populations in Ethiopia prior to FTF. Examples of these earlier efforts included the PSNP Plus project, which worked with a subset of the PSNP population using a “Graduation Model” that included additional interventions focused on linking these households to microfinanceandvaluechains(the“plus”intheprojecttitle)(CARE, 2011) and the Using Markets to Alleviate Extreme Poverty project, which tested a market-led livelihoods approach to reach the chronically poor (Chemonics International, 2007).
The Pull Plus Push Model
A fourth strategy/model, which the more successful Title II programs in the FAFSA-2 universe have used, begins with the market linkages and the incentives that markets provide (i.e., facilitates the access of its clients to new market opportunities), but combines this with the provision of new technologies and the TA and training needed to help them increase their capacity to produce for and compete in these markets. In other words, this fourth model includes both pull and push elements, but these are implemented simultaneously so that the Title II clients are able to benefit from market sales early, which gives them greater incentives to participate, at the same time the clients receive the resources that they need to continue participating in the program. To encourage and enable greater participation on the part of the more vulnerable in these programs, Awardees may also need to be more proactive, providing the more vulnerable with additional/more tailored TA, training, mentoring, and cash and/or in-kind asset transfers (a “Pull Plus Extra Push Model”) (see Box 4.36).
4.6 Conclusions and Recommendations
4.6.1 Conclusions
Program Impact
• The FAFSA-2 universe includes many examples of AG/NRM/LH programs that helped their clients increase their incomes and access to food, usually by providing them access to a combination of improved agricultural technologies/practices and market opportunities. These programs were often technically complex and difficult to design and implement successfully. The successes that these programs achieved are even more noteworthy given the challenging environments in which they worked.
• Considerable progress was made during the FAFSA-2 time period in measuring the impact of the Title II programs on food access with the development of several standardized consumption

4-75Agriculture, Natural Resource Management, Livelihoods, Income Generation
Box 4.36. What Distinguishes the Title II AG/NRM/LH Programs from Other Agricultural-Based, Food Security-Oriented Development Programs?
There are some within USAID and the development community that still think of the Title II development programs, including the AG/NRM/LH programs, as primarily humanitarian assistance programs. Some also still believe that food is an important component of the AG/NRM/LH programs, even though their greatest need is for cash to pay for the TA, training, and agricultural input distribution activities that are essential to their success. Others recognize that food does not play a very important role in the Title II development programs anymore. But this leads them to question their cost-effectiveness, given the fact that much of the cash comes from monetization, and to question whether they have any added value now that the FTF programs are also focused on the same target group—the food insecure that are “vulnerable and viable.”
One feature that distinguishes Title II AG/NRM/LH programs from other USAID agricultural-based, food security-oriented development programs is that they are geographic based and client focused. That is, they are designed to respond to the problems faced by and have an impact on specific target groups in specific target areas. This means that Title II problem assessments and programs need to be unique to each target group and its needs, market opportunities, and production potentials and not generic to major geographic regions or to the country as a whole.
Title II development programs also have the flexibility to use their resources to expand the number of households in their target groups that will be able to succeed as farmers (i.e., that are viable as well as vulnerable) by:
• Providing more and more tailored training and TA to some of the more disadvantaged households (including literacy training for women as part of their business management training activities, for example, as some programs in West Africa did)
• Providing poor individuals and households with an economic asset that they might not have access to otherwise (providing an in-calf cow to a poor household so that they can participate in a dairy value chain as LOL did in Zambia, for example, or a cash grant to a group of very poor farmers so that they could buy a pump to irrigate their fields and expand the number of crops that they could produce per year from one to three, as CARE did in Bangladesh)
• Changing the underlying environment for larger groups of farmers and entire communities (helping groups of farmers and communities develop small-scale irrigation systems so that they can begin to produce and market crops during the dry season, adding to their incomes and reducing their risks, or upgrading a feeder road into a community to enable farmers to access markets that were previously unattainable).
To be responsive to clients that are unlikely to be able to succeed as farmers, Title II development programs also have the flexibility to work on off-farm and non-farm activities (Non-AG Income Generation) to support micro- and small enterprise development and job creation.

4-76 Agriculture, Natural Resource Management, Livelihoods, Income Generation
indicators. These indicators were not yet in widespread use during the FAFSA-2 time period, but for those that did report, the rates of success were quite high.
• Learning from the experiences of these AG/NRM/LH programs and making greater use of more effective models and better practices highlighted later in this section present a major opportunity for USAID/FFP and its Awardees to improve program outcomes and impacts in the coming years.
Title II Target Groups
• The resource-poor farmers, who are the main targets of the Title II AG/NRM/LH programs, are economic actors that respond to economic incentives in managing their farms and other household enterprises, and not just “objects of compassion,” as one Title II Awardee put it.
• Small, resource-poor farmers respond positively to market incentives, but payoffs need to come in the short term, given their poverty. Therefore, facilitating market contacts and sales early on helps spur interest, increases farmers’ participation, and improves technology adoption rates.
• Title II clients are not all farmers, even if they live in rural areas. In some Title II countries, such as Bangladesh, the majority of the most food insecure are landless. And in many rural areas in many countries, many food insecure households do not have the asset base to become food secure by focusing only on increasing farm production. Many need alternative livelihoods to farming, an opportunity to start a microenterprise, for example. But, since most people do not have strong entrepreneurial skills, the rural poor included, what is really needed for those households, who will not be able to succeed as farmers, is access to more and better jobs.
• Title II clients live with large amounts of risk. Strategies that the Title II programs have employed successfully to help their clients reduce/manage their risks include helping them
diversify what they are producing on their farms and/or into non-farm sources of income and introducing more drought resistant varieties, conservation agricultural practices, water harvesting techniques, and irrigation.
Program Strengths and Weaknesses
• Title II development programs are client- and geographic-based, i.e., they are designed to have a specific impact on specific groups in specific
Box 4.37. AG/NRM/LH/IG Policy Implications
• Title II development programs that are market-oriented and focus on linking producers to more promising, higher-value markets in combination and simultaneously with the introduction of new technologies, TA, and training tend to be more successful in terms of technologies and practices adopted, income generated, and activities sustained.
• To be cost-effective, Title II development programs should focus their agricultural interventions on farmers that are “vulnerable and viable” and look for other options involving the creation of off-farm jobs, for example, for those clients in their target areas that do not fall into this category.
• Increasing overall household incomes is crucial. However, higher incomes will not necessarily result in more nutritious diets if people lack basic nutrition knowledge. Higher incomes will also not necessarily result in reductions in child undernutrition in the absence of community-based MCHN programs focused on the application of the ENA in the first 1,000 days and access to improved water, sanitation, and health services.

4-77Agriculture, Natural Resource Management, Livelihoods, Income Generation
areas of a country. This is a strength when it comes to working effectively with the rural poor. It also means that programs may need to work with a wide range of crops and problems, including improving the delivery of extension services to farmers and helping link their farmer clients to markets, in order to be responsive to the needs of their clients and their specific market opportunities and production possibilities.
• The quality of many of the Title II agricultural programs has improved significantly. The technology packages being disseminated now tend to be better developed, and the Awardees also tend to have more competent staff working in the field, i.e., staff with more technical expertise in agriculture.
• More programs are using best practices. Programs are better linked to sources of new and improved technologies and practices, including local and international research institutions and other donor- and NGO-supported programs. More programs are also using practical, hands-on methods to extend packages of new technologies and practices, including using lead farmers, on-farm demonstrations, field days, and exchange visits.
• Too many programs are still too production oriented, however, with a tendency to view marketing as something to be thought about later in the project after the production problems have been addressed. Many programs are still being designed with a production focus. And, because the Title II agricultural components tend to be staffed primarily with technicians with a production background, many programs designed with a stronger marketing focus end up being more production oriented.
• The vast majority of the Title II development programs included in the FAFSA-2 universe did not have enough information on the basic economics of their programs. Few knew whether the technology packages that they were recommending were profitable to their client farmers (whether the returns were greater than
the costs) or the costs and benefits of their own interventions.
• Few programs appeared to have made much of an effort to understand the technology adoption process, including why some of the practices that they were recommending were not adopted and whether lack of adoption was due to lack of profitability, labor constraints, and/or lack of availability of commercial inputs, for example.
• One area where the Title II development programs tend to be strong is in organizing and working with community-level groups. Working with groups of small farmers is essential to achieve economies of scale in agricultural extension and marketing. Farmers/communities also are likely to need to work together to manage common pool resources, such as small irrigation systems and key natural resources affecting these systems. On the other hand, many Awardees try to push their clients to work in groups and to develop group businesses in situations in which allowing individuals to work on their own and as individual entrepreneurs is more appropriate.
• The experiences that the Title II development programs have had with rural and agricultural finance have been mixed. Savings mobilization interventions seemed to be very effective in a number of Title II programs as a way to use social pressures to help people save money and invest it later. These programs have helped poor rural households smooth consumption, as well as provide a source of working capital for their farms and other business activities. What they have not seemed to have been successful in doing is becoming a source of capital for larger and longer-term investments, in agriculture in particular. And some practitioners believe that encouraging VSLs to get involved in this type of lending activity or to be linked with formal MFIs would not be compatible with the basic principles of the VSL program and could jeopardize their continued operation.
• Like many development programs, the Title II programs have still not figured out sustainable

4-78 Agriculture, Natural Resource Management, Livelihoods, Income Generation
and cost-effective ways to increase their clients’ access to the credit that they need to purchase agricultural inputs and, in particular, to the longer-term credit that they need to purchase larger investment items, such as pumps, sprayers, plows, and improved breeds of animals. This problem is not unique to the Title II programs, however.
• Many Title II programs use the distribution of subsidized inputs to jump-start the technology transfer components of their programs. These distributions have their rationale in the short run, including as a mechanism for reducing the risks to farmers of adopting a not-yet-proven technology. Longer-term disadvantages, on the other hand, include encouraging dependencies on the part of the Title II client farmers and discouraging input dealers in the private sector from supplying or continuing to supply these goods, reducing the likelihood of their availability once the Title II program ends.
More Successful Programs
• Agricultural programs and income generation programs generally are more successful, in terms of technologies and practices adopted, income generated, and sustainability, if they are market-oriented. Preliminary results from the Tufts study of sustainability and exit strategies also support the FAFSA-2 conclusion that commercialization,
profitability, and increased incomes are key factors contributing to the sustainability of the Title II AG/LH programs.
• Market-based agricultural programs can be designed and implemented so that the clients of the Title II development programs, the “vulnerable but viable,” can participate successfully, a conclusion that is consistent with those reached by other market-oriented programs that have been working with the rural poor.
• The value chain model is useful for Title II programs, as it has been for other market-oriented programs working with the rural poor. Among other advantages, it can help Awardees conceptualize and organize their activities and better plan and execute their sustainability and exit strategies. Value chains need to be market- and not production-driven, however, and tailored to the market opportunities and production potentials of their Title II clients.
• More successful programs also make good use of market incentives, including in ways that enable their clients to begin to see concrete economic benefits from participating in the programs and adopting the recommended technologies and practices early on (e.g., in one or two years), and limit their reliance on artificial incentives to get farmers to change their behaviors.
Figure 4.15. Summary of Major Weaknesses in Title II AG/NRM/LH Development Programs during the FAFSA-2 Time Frame
VISION/DESIGN
Programs lack clarity (Farming and/or non-farming? Vulnerable or vulnerable and viable?
Model?)
PROVISION OF KNOWLEDGE
SERVICES
Programs lack expertise in marketing
and economics
PROVISION OF INPUTS (Cash, In-
Kind, Food)
Programs may rely too much on subsidizing
inputs
OUTCOMES/ IMPACT
< Impact< Sustainability

4-79Agriculture, Natural Resource Management, Livelihoods, Income Generation
• Title II agricultural development programs that focus on rural households that are unlikely to be viable as agricultural producers are not likely to be sustainable. They also have high opportunity costs, in that they divert resources from other food insecure clients and/or other types of interventions where the probability of these resources having a positive impact in both the short and longer term may be much higher.
Better and Not-So-Good Practices
• The “Pull Plus Push Model,” with its focus on linking farmers to more promising, higher-value markets in combination and simultaneously with improved technologies and practices, is a better practice.
• Extension and training programs that give emphasis to learning by doing and seeing methods, including in their marketing activities, are better practices. Programs that are more pragmatic and give priority to understanding and finding solutions to their clients’ problems are more effective. Programs that are more prescriptive (e.g., require their producer groups to be of a certain size and/or require group members to farm and sell collectively) or exclusionary (e.g., excluding more progressive farmers that may be best situated to get the technology adoption process started and to provide continuing support) are less effective and sometimes even counterproductive. Activities that are most effective include on-farm demonstrations; farmers’ field days; exchange visits; and visits to potential buyers, markets, and agricultural fairs.
• Expanding farmers’ access to irrigation in the drought-prone areas where so many Title II clients live, when feasible technically and cost-effective, is a better practice. When linked to markets, these programs can increase farmers’ incomes, reduce risks, and, in many cases, help increase other economic activities in the area (multiplier effects). Conversely, increasing crop production and incomes in the absence of expanding farmers’ access to irrigation may be difficult, if not impossible, in many communities where the Title II development programs operate.
• VSL groups, which promote individual savings (as a way for individuals to accumulate cash that they can use to invest in their own homes, farms, and microenterprises), and value chain financing are better practices and should be encouraged.
• Revolving funds, especially in-kind funds, that are collectively owned and managed by communities are not good practices and should be discouraged. CCBs, which have been described as effective “slow release mechanisms” for distributing emergency food assistance during the droughts in the Sahel, also have a poor record as a development intervention, especially in terms of their lack of sustainability. Therefore, Awardees should be discouraged from including CCBs in future applications, especially given the alternative of being able to use food to have a more direct impact on reducing the high rates of child undernutrition in these countries (see the discussion in Section 6.3.1.9, “Supplementary Feeding”).
• Training community-based animal health workers and helping set them up as microenterprises is a better practice and should be encouraged in countries with a supportive (or at least neutral) policy environment. The distribution of animal assets to Title II clients can also be a better practice, if the animals are targeted to the poorer households in a community as an economic asset that can be sold in local markets or through a value chain. Adding an animal pass-on requirement to these programs, on the other hand, seemed fraught with problems and should probably be avoided unless it is key to the success of a program and closely managed, as was the case with the LOL dairy value chain program in Zambia.
• Using FFW and cash to develop public, productive assets is a good practice and should be encouraged (also see Chapter 5).
• Using FFW or cash for work as an incentive to get farmers to apply AG and/or NRM practices on their own lands or to participate in other activities from which they will receive a direct economic benefit are not good practices and, with few

4-80 Agriculture, Natural Resource Management, Livelihoods, Income Generation
exceptions (the PSNP program in Ethiopia may be one), should not be approved.
4.6.2 Recommendations
• USAID/FFP and Awardees should give preference to models and strategies that are market-oriented and that focus on linking producers to more promising, higher-value markets, in combination and simultaneously with the introduction of new technologies, TA, training, and, in some cases, asset transfers (e.g., the “Pull Plus Push Model” in Figure 4.14). To encourage and enable greater participation on the part of the more vulnerable in these programs, Awardees may also need to be more proactive, providing them with additional, more tailored TA, training, and mentoring; cash and/or in-kind grants; and upgrading roads and other productive infrastructure (a “Pull Plus Extra Push Model”). (Recommendation 24)141
• USAID/FFP and Awardees should give preference to the use of better practices and avoid practices that experience indicates do not work as well. (Recommendation 25)
• USAID/FFP should require Awardees to be more specific in their proposals about: (1) the commercial aspects of their AG and LH programs, including providing more information on priority products, markets, possible buyers, and other organizations with which they plan to partner and collaborate along the value chain; and (2) their plans, if any, to make use of inputs and other subsidies, as well as how they plan to use them and for how long and how they plan to avoid dependencies and disruptions to private sector suppliers. (Recommendation 26)
141 The numbers after certain recommendations are the same as those assigned to the major recommendations in the FAFSA-2 summary report.
• In addition to taking full advantage of any business and value chain development expertise available elsewhere in their organizations, Awardees should: (1) strengthen the business development and management skills of their staff and increase their marketing expertise, especially among country-level program staff; (2) develop a better understanding of the basic costs and returns of their interventions (those involving knowledge transfers as well as physical structures) and the technology packages they are promoting; and (3) focus more on program monitoring and the use of rapid appraisals and focus groups as management tools for improving performance by helping them understand why certain components and activities are not progressing as expected and identify better practices. (Recommendation 27)
• USAID/FFP should require all programs with food access and income objectives to report, on an annual basis, the value of sales made through program-supported processes, including forward contracts and producers’ associations. USAID/FFP should also consider adding several indicators to its list of standard indicators that are both meaningful measures of impact and more directly connected to AG and LH interventions than the current food access/consumption indicators are. This could include an asset indicator and an indicator that measures income from farm operations (e.g., the gross value of farm-based income) (see Figure 4.16). (Recommendation 28)
• USAID/FFP should devote more attention and resources to identifying and describing better practices and not-so-good practices in its AG/NRM/LH programs. Encouraging and facilitating more sharing of knowledge and experiences among Awardees will be beneficial. However, this sharing of knowledge should be combined with an effort to develop a better knowledge base about

4-81Agriculture, Natural Resource Management, Livelihoods, Income Generation
what works and what does not based on more rigorous, data-rich, and independent analyses of important issues, interventions, and activities. These comparative case studies and other applied research activities could focus on a range of topics, including those that are cross-cutting (e.g., assessing the effectiveness of alternative approaches to agricultural extension and training), related to emerging issues/activities (e.g., conservation agriculture technology packages and/or new information and communication
technologies), or involve more minor activities that are frequently added to programs but whose scope and effectiveness are poorly understood (e.g., small animal programs, new agricultural finance instruments, tree nurseries, and income generation programs organized around the donation of processing equipment). The possibilities of collaborating in these efforts with other potentially interested parties within USAID as well as the broader donor and research community should also be explored.
Figure 4.16. Recommendations Regarding Indicators
Food Security Conceptual Framework Developed for Use in the FAFSA-2(Adapted by Roberta van Haeften and Mary Ann Anderson from Riely et al., 1999 and UNICEF, 1990.)
Recommended Indicators
Farm Income
Indicator
Current Indicators
Consumption Indicators
Technology Adoption Indicators
Practices
Inputs
Capital LaborTechnology
(Agricultural)Land/Water
Non-AgriculturalProduction
Non-FoodAgriculturalProduction
MarketPurchases
FoodPrices
Cash Income
WagesSales
Transfers and Loans(Food/Cash)
NATURAL ENVIRONMENTSOCIAL/POLITICAL ENVIRONMENT
* Indicator
Food Access(Household)
• Community• Social Networks• Government/Donor Programs• Remittances
Number andSpacing of Children
• Water/Sanitation/Hygiene• Use of Preventive and Curative Health Care
Stocks
FoodProduction
Food Availability(National)
Food Aid
Imports
Food Utilization(Individual)
Nutritional Status*
HealthStatus
DietaryIntake
IntrahouseholdFood Allocation
• Knowledge• Culture• Time/Workload
Maternal andChild CarePractices
Annual Sales
Indicator

4-82 Agriculture, Natural Resource Management, Livelihoods, Income Generation
Bibliography for Chapter 4Adelski, Elizabeth; Diop, Ousmane; and Joseph, Marguerite. 2006. Final Evaluation of the Africare Guinea Food Security Initiative. A report prepared for Africare/Guinea.
Anderson, J. and Feder, G. 2007. “Agricultural Extension” in Handbook of Agricultural Economics. Volume 3:2343–2378.
Axinn, George H. 1988. Guide on Alternative Extension Approaches. Rome: FAO.
AZM. 2011. Cracking the Nut: Overcoming Obstacles to Rural and Agricultural Finance, Lessons from the 2011 Conference. Washington, DC.
Bahn, Rachel and Lane, Sara. 2012. “Reclaiming Economic Analysis” in Frontiers in Development, edited by Shah, Rajiv and Radelet, Steven.Washington, DC: USAID.
Banerjee, Abhijit and Duflo, Esther. 2011. Poor Economics: A Radical Rethinking of the Way to Fight Global Poverty. New York: Public Affairs.
Bonnard, Patricia et al. 2002. “Report of the Food Aid and Food Security Assessment: A Review of the Title II Development Food Aid Program.” http://www.fantaproject.org/downloads/pdfs/FAFSA.pdf.
Bunch, Roland. n.d. “Soil Recuperation in Central America: Measuring the Impact Four to Forty Years After Intervention.” COSECHA.
Bunch, Roland. 1999. Reasons for Non-Adoption of Soil Conservation Technologies and How to Overcome Them. Mountain Research and Development, Vol. 19, No. 3, pp. 213-220.
Bunch, Roland. 2003. Water Management for Small-Scale Farmers: What We Have learned to Date. COSECHA.
Byerlee, Derek. June 2, 2011. “Agricultural Technology Adoption and Productivity Growth in Sub-Saharan Africa.” USAID Evidence Summit. Washington, DC.
Campaigne, Jonathan and Rausch, Tom. 2010. “Bundling Development Services with Agricultural Finance: The Experience of DrumNet” in Innovations in Rural and Agriculture Finance, edited by Kloeppinger-Todd, Renate and Sharma, Manohar. Washington, DC: IFPRI/World Bank.
Campion, Anita and van Haeften, Roberta. 2010. FS Share Series #8: Rural and Agricultural Finance for Food Security: Primer, Model Scope of Work, and Diagnostic Checklist. Washington, DC: Chemonics International.
CARE. 2011. PSNP Plus: Linking Poor Rural Households to Microfinance and Markets – Final Report. Addis Ababa, Ethiopia: USAID.
Carter, Michael. 2012. Thematic Overview Note: Expanded Markets and Increased Investments. Washington, DC: USAID/IFPRI Feed the Future Learning Agenda.
Chemonics International. 2007. Using Markets to Alleviate Extreme Poverty: Market-Led Livelihoods for Vulnerable Populations (MLVP) Project Terminal Report. Washington, DC: USAID.
Coates, Jenifer and Kegode, Elizabeth. 2011. “Kenya Exit Strategies Study: Round 2 Results.” FANTA Workshop, March 10, Washington, DC.
Coates, Jenifer and Rogers, Beatrice. 2011. “Exit Strategies Study: Concepts and Methods.” FANTA Workshop, March 10, Washington, DC.
Collier, Paul. 2010. The Plundered Planet: Why We Must—and How We Can—Manage Nature for Global Prosperity. Oxford, England: Oxford University Press.
CRS. 2009a. Agriculture and Environment Strategy 2009–2014. Baltimore, Maryland: CRS.
CRS. 2009b. Getting to Market: From Agriculture to Agroenterprise. Baltimore, Maryland: CRS.
CRS/Kenya. 2004. Report on the End-term Evaluation of the Integrated Health and Agriculture Project in Kenya.

4-83Agriculture, Natural Resource Management, Livelihoods, Income Generation
Empel, Gerard van. 2010. “Rural Banking in Africa: The Rabobank Approach” in Innovations in Rural and Agriculture Finance, edited by Kloeppinger-Todd, Renate and Sharma, Manohar. Washington, DC: IFPRI/World Bank.
Feder, Gershon. 1981. Adoption of Agricultural Innovations in Developing Countries: A Survey. Staff Working Paper No. 44. Washington, DC: World Bank.
Foster, A.D. and Rosenzweig, M.R. 1995. “Learning by doing and learning from others: Human capital and technical change in agriculture.” The Journal of Political Economy 103(6): 1176–1209.
Fowler, Ben and Brand, Margie. 2011. Pathways out of Poverty: Applying Key Principles of the Value Chain Approach to Reach the Very Poor. microREPORT #173. Washington, DC: USAID, Accelerated Microenterprise Advancement Project—Knowledge and Practice II/ACDI/VOCA.
Gaudreau, Mimi et al. 2009. Mid-term Qualitative Evaluation of the CRS Food and Nutrition Security Program in Niger-PROSAN Rayuwa. A report prepared for CRS/Niger.
Glennerster, Rachel and Jack, Kelsey. 2012. Thematic Overview Note: Improved R&D, Agricultural Extension, Technology Adoption, and Diffusion. Washington, DC: USAID/IFPRI Feed the Future Learning Agenda.
Haggblade, Steve and Hazell, Peter R.B. 2010. Successes in African Agriculture: Lessons for the Future. Washington, DC: IFPRI.
Hall, Andy. 2007. Challenges to Strengthening Agricultural Innovation Systems. Working Paper Series 2007-038. Maastricht, Netherlands: United Nations University.
Harris, Timm et al. 2007. Joint Final Evaluation of the Nicaragua Title II Development Programs, 2002-2008. A report prepared for ADRA/Nicaragua, CRS/Nicaragua, PCI/Nicaragua, and SC/Nicaragua.
Hashemi, Syed M. and de Montesquiou. 2011. Reaching the Poorest: Lessons from the Graduation Model. Focus Note #69. Washington, DC: CGAP.
Herbert, Paul V.; Emana, Bezabih; and Gessema, Tsegahun. 2010. Transforming Lives: An Evaluation of CRS Integrated Watershed Management Programs in Ethiopia. Baltimore: CRS.
Herr, Matthias I. and Muzira, Tapera J. 2009. Value Chain Development for Decent Work: A Guide for Development Practitioners, Government and Private Sector Initiatives. Geneva: United Nations Development Programme/International Labor Office.
IFPRI. 2011. 2011 Global Hunger Index. The Challenge of Hunger: Taming Price Spikes and Excessive Food Price Volatility. Washington, DC.
Jack,B.K.2011.“MarketInefficienciesandthe Adoption of Agricultural Technologies in Developing Countries.” White paper prepared for the Agricultural Technology Adoption Initiative, JPAL (MIT)/CEGA (Berkeley).
Kassam, Amir et al. 2009. “The Spread of ConservationAgriculture:Justification,Sustainability and Uptake.” International Journal of Agricultural Sustainability 7(4): pp. 292–320.
Kent, Lawrence. 1998a. “Notes from the Workshop on: Community-Level Grain Storage Banks (Cereal Banks): Why Do They Rarely Work and What Are the Alternatives.” January 19-22, Dakar,Senegal.http://lasdanaides.files.wordpress.com/2009/02/1998-crs.pdf.
Kent, Lawrence. 1998b. “Why Cereal Bank Projects Rarely Work: A Summary of Findings.” http://lasdanaides.files.wordpress.com/2009/02/1998-kent.pdf.
Kloeppinger-Todd, Renate and Sharma, Manohar. 2010. Innovations in Rural and Agricultural Finance. Washington, DC: IFPRI/World Bank.

4-84 Agriculture, Natural Resource Management, Livelihoods, Income Generation
Kula, Olaf; Downing, Jean; and Field, Michael. 2006. Globalization and the Small Firm: An Industry Value Chain Approach to Economic Growth and Poverty Reduction. microREPORT #42. Washington, DC: USAID, Accelerated Microenterprise Advancement Project—Business Development Services.
Langworthy, Mark et al. 2005. Final Evaluation of the Cape Verde P.L. 480 Title II Monetization Program. A report prepared for ACDI/VOCA/ Cape Verde.
Liniger, Hanspeter; Studer, Rima Mekdaschi; Hauert, Christine; and Gurtner, Mats. 2011. “Rainwater Harvesting” and “Smallholder Irrigation Management” in Sustainable Land Management Practice: Guidelines and Best Practices for Sub-Saharan Africa. http://www.fao.org/docrep/014/i1861e/i1861e00.pdf.
Lukungu, David. 2011. “Less Labor, High Yield Farming Practices.” Presentation. Kampala, Uganda: USAID, ACDI/VOCA.
Macher, Mumbi et al. 2009. Report on the End Term Evaluation of the CARE/Kenya Sustainable Livelihoods Security for Vulnerable Households in Nyanza Province “DAK ACHANA” Program. A report prepared for CARE/Kenya.
Mariko, Dramine; Malik, Sabina; and Mohamoud, Osman. 2012. Building Resilience in the Sahel through Cereal Banks. Issue #9. Dakar, Senegal: USAID/FFP West Africa.
McGahuey, Mike and Winterbottom, Bob. 2007. “Transformational Development in Niger.” Presentation. USAID.
Mitchell, Jonathan and Coles, Christopher, eds. 2011. Markets and Rural Poverty: Upgrading in Value Chains. London: International Development Research Center.
Netting, Robert McC. 1993. Smallholders, Householders: Farm Families and the Ecology of Intensive Sustainable Agriculture. Stanford, California: Stanford University Press.
Ostrom, Elinor. 1990. Governing the Commons: The Evolution of Institutions for Collective Action. Cambridge, England: Cambridge University Press.
Pierce, Robert and Gardner, Allison. 2006. Final Evaluation of the ACDI/VOCA/Uganda, FY 2002-2006 Title II DAP. A report prepared for ACDI/VOCA/Uganda.
Piper, Lisa; Zavaleta, K. Williams; and Scavone, Mariko. 2010. Sustained Market Access for Subsistence Farmers in Bolivia. Final Learning Agenda Report, Field Report No. 7.
Reij, Chris; Tappen, Gray; and Smale, Melinda. 2009. “Re-Greening the Sahel: Farmer-led innovation in Burkina Faso and Niger.” http://www.ifpri.org/sites/default/files/publications/oc64ch07.pdf.
Riely et al. 1999. “Food Security Indicators and Framework for Use in the Monitoring and Evaluation of Food Aid Programs.” http://www.fantaproject.org/downloads/pdfs/fsindctr.pdf.
Riordan, James T. 2011. We Do Know How: A Buyer-Led Approach to Creating Jobs for the Poor. Washington, DC: New Academia Publishing.
Robins, Catherine et al. 2008. Final Evaluation of the Food for the Hungry (FH) Title II Marsabit FY2004-FY2008 Integrated Food Security Program for Kenya. A report prepared for FH/Kenya.
Robins, Catherine et al. 2008. Final Evaluation of the I-LIFE (Improving Livelihoods though Increasing Food Security) Title II Development Assistance Program, October 1, 2005 through June 30, 2009. A report prepared for CRS/Malawi.
Robins, Catherine et al. 2009. Final Evaluation of the CRS FY 2004-FY 2009 P.L. 480 Title II Development Assistance Program in Burkina Faso. A report prepared for CRS/Burkina Faso.
Rogers, Beatrice and Coates, Jenifer. 2013. “Effectiveness of Title II Program and Exit Strategies: Introduction and Conceptual Overview.” FANTA Workshop, February, Washington, D.C.

4-85Agriculture, Natural Resource Management, Livelihoods, Income Generation
Rogers, Beatrice Lorge and Houk, Katie. March 10, 2011. “Exit Strategies Study: Bolivia Phase II Findings.” FANTA Workshop. Washington, DC.
Rogers, Beatrice Lorge and Sanchez, Leslie. March 10, 2011. “Exit Strategies Study: Honduras Phase II Findings.” FANTA Workshop. Washington, DC.
Rogers, Everett. 2003. Diffusion of Innovation. New York: Free Press.
Ruttan, Vernon. 1977. “The Green Revolution: Seven Generalizations.” International Development Review 19(4):16–23.
Schnell, Charles; McNulty, Judiann; and Bentley, Jeffery. 2006. Joint Evaluation of the 2001-2006 Title Development Programs in Guatemala. A report prepared by Tango International for CARE, CRS, SC, and SHARE.
Selvester, Kerry; Tapulua, Raul; and Whiteside, Martin. 2006. Final Evaluation of the CARE/Mozambique Viable Initiatives for the Development of Agriculture IVIDA 2) Title II Development Program. A report prepared for CARE/Mozambique.
Staatz, J.M. and Dembele, N.N. 2008. Agriculture for Development in Sub-Saharan Africa. Washington, DC: World Bank.
Sullivan, Frank and Selvester, Kerry. 2006. Final Evaluation of the Save the Children Coastal Region Integrated Food Security Program. A report submitted to Save the Children Mozambique and USAID/Mozambique.
Swanson, Richard. 2009. Final Evaluation of the Land O’ Lakes Title II Development Assistance Program (DAP) for Vulnerable Populations in Zambia. A report prepared for LOL/Zambia.
Swindale, Anne and Bilinsky, Paula. 2006. “Household Dietary Diversity Score (HDDS) for Measurement of Household Food Access: Indicator Guide, Version 2.” http://www.fantaproject.org/downloads/pdfs/HDDS_v2_Sep06.pdf.
Tschumi, Peter and Hagan, Harry. 2008a. The Operational Guide for the Making Markets Work for the Poor (MP4) Approach. Bern, Switzerland: Swiss Agency for Development and Cooperation.
Tschumi, Peter and Hagan, Harry. 2008b. Perspectives on the Making Markets Work for the Poor (MP4) Approach. Bern, Switzerland: Swiss Agency for Development and Cooperation.
Tschumi, Peter and Hagan, Harry. 2008c. A Synthesis of the Making Markets Work for the Poor (MP4) Approach. Bern, Switzerland: Swiss Agency for Development and Cooperation.
UNICEF. 1990. Strategy for Improved Nutrition of Children and Women in Developing Countries. New York: UNICEF.
USAID/Ethiopia. 2010. Strategic Review for Feed the Future. Washington, DC: USAID.
USAID/FFP. Annual Results Reporting Guidance for FY 2009. Updated 2012 Guidance available at http://transition.usaid.gov/our_work/humanitarian_assistance/ffp/fy12.arr.guidance.pdf.
USAID/FFP. 2005. Strategic Plan for 2006-2010.Washington, DC: USAID.
USAID/FFP. 2007. “New Reporting Requirements for Food for Peace.” FFPIB 07-02.
USAID/FFP. 2011. “Revision to Food for Peace Standard Indicators Collected in Baseline Surveys and Final Evaluations.” FFPIB 11-03.
USAIDOfficeoftheInspectorGeneral.2011.Audit of USAID’s Food Assistance Under the Multiyear Assistance Program in Niger. Audit Report No.7-683-11-008-P. Dakar, Senegal: USAID.
Van den Ban, A.W. and Hawkins, H.S. 1996. Agricultural Extension, Second Edition. Oxford: Blackwell.
van Haeften, Roberta; Bentley, Jeffery; Fernandez, Alfredo; and McNulty, Judiann. 2009. The Final Evaluation of the FY 2002–FY 2008 Bolivia Title II Development Program.

4-86 Agriculture, Natural Resource Management, Livelihoods, Income Generation
van Haeften, Roberta; Fernandez, Alfredo; McNulty, Judiann; and Peterson, Tricia. 2006. An Assessment of the Save the Children Bolivia Title II Program Post Mid-Term Evaluation. La Paz, Bolivia: SC.
van Haeften, Roberta and Moses, Phil. 2009. USAID Office of Food for Peace Bangladesh Food Security Country Framework FY 2010 – FY 2014.Washington, DC: Food and Nutrition Technical Assistance II Project (FANTA-2).
van Haeften, Roberta; Zewditu Getahun Ayicheh; TesafiMebrahtu;andSorssaNateaMerga.2006.Final Evaluation of the CRS/Ethiopia and World Vision/Ethiopia 2001-2007 Title II Development Assistance Programs (DAPs). A report prepared for CRS/Ethiopia and WV/Ethiopia.
Vanmeenen, Guy. 2010. Savings and Internal Lending Communities – SILC – Voices from Africa. Nairobi: CRS.
von Braun, Joachim. 1989. Non-Traditional Export Crops in Guatemala: Effects on Production, Income, and Nutrition. Washington, DC: IFPRI.
Wingert, Steve. 2010. Feed the Future Initiative Achieving Food Security in Guatemala: Opportunities and Challenges. Washington, DC: Abt Associates.
World Bank. 2012. Agricultural Innovation Systems: An Investment Source Book. Washington, DC: World Bank.
World Bank. 2008. World Development Report: Agriculture for Development. Washington, DC: World Bank.
Yumkella, Kandeh et al., eds. 2011. Agribusiness for Africa’s Prosperity. Austria: United Nations Development Organization.