chapter 21 human adaptation to high terrestrial …
TRANSCRIPT
Medical Aspects of Harsh Environments, Volume 2
644
Chapter 21
HUMAN ADAPTATION TO HIGHTERRESTRIAL ALTITUDE
ANDREW J. YOUNG, PHD*; AND JOHN T. REEVES, MD†
INTRODUCTION
THE HYPOXIC ENVIRONMENTElevation, Barometric Pressure, and Inspired OxygenOverview of the Oxygen-Transport Cascade at High Altitude
PULMONARY GAS EXCHANGE AT HIGH ALTITUDEThe Role of Increasing VentilationVentilatory Responses to Acute HypoxiaVentilatory Acclimatization to High AltitudeSummary of Ventilation at High Altitude
ALVEOLAR–ARTERIAL OXYGEN PRESSURE GRADIENTPulmonary Venous AdmixtureDiffusing Capacity
SYSTEMIC OXYGEN TRANSPORT AT HIGH ALTITUDEUnacclimatized Lowlanders on Arrival at High AltitudeAcclimatization Effects on Systemic Oxygen Transport
METABOLISM AT HIGH ALTITUDEHigh-Altitude Weight LossEnergy Metabolism During Exercise at High Altitude: The Lactate ParadoxEndocrine Responses at High Altitude
CONCLUDING THOUGHTS
*Thermal & Mountain Medicine Division, US Army Research Institute of Environmental Medicine, Natick, Massachusetts 01760-5007†Department of Medicine, Pediatrics, and Family Medicine, University of Colorado Health Science Center, Denver, Colorado 80262

645
Human Adaptation to High Terrestrial Altitude
INTRODUCTION
ultimately due to hypoxia. However, a series ofphysiological adjustments ensue that are directedat compensating for the reduction in ambient oxy-gen. These adjustments, which include increases inventilation, hemodynamic and hematologic changes,altered hormone secretion, and metabolic and bodywater changes, to name a few, relieve some but notall of the physiological strain of continued residenceat high altitude. The time required for altitude ad-aptations to become manifest varies with the dif-ferent processes, with the altitude ascended, andwith the speed of ascent. The progressive develop-ment of these adjustments, usually termed acclima-tization, alleviates, to varying degrees, the symp-toms and physical and mental limitations inflictedby hypoxia. The adjustments to hypoxia that beginimmediately with acute hypoxic exposure, togetherwith the continuing processes of acclimatization,collectively comprise the altitude adaptations thatwill be examined in this chapter.
Bar
omet
ric P
ress
ure
(mm
Hg)
Sea Level
Denver, CO
Leadville, CO
Pikes Peak, COArochoa, PeruCerro De Pasco
Aucanquilcha
Mt. Everest
ICAO
200
400
600
800
Altitude (m)0 2,000 4,000 6,000 8,000 10,000
Altitude (m)
PO
2 (m
m H
g)
AMB
INSP
ALV
ART
0 2,000 4,000 6,000 8,000 10,000
150
120
90
60
30
Fig. 21-1. Both atmospheric pressure and the partial pressure of oxygen decrease as functions of altitude. (a) Thebarometric pressure measured at various sites located at different elevations (closed circles and dashed line)1,2 andthe global average (solid line) reported3 by the International Civil Aviation Organization (ICAO). (b) Partial pres-sures of oxygen (PO2) at increasing altitude are shown in ambient air (AMB), in the airways after inspired air has beenwarmed and humidified (INSP), in the alveolus after CO2 has been added (ALV), and in the arterial blood (ART).Data sources: (1) West JB. Prediction of barometric pressures at high altitudes with the use of model atmospheres. JAppl Physiol. 1996;81:1850–1854. (2) Authors’ personal unpublished observations. (3) Ward MP, Milledge JS, West JB.High Altitude Medicine and Physiology. New York, NY: Oxford University Press; 2000: 26, Table 2.1.
a b
Soldiers who deploy from sea-level bases foroperations in the mountains or high plateaus willexperience multiple environmental stressors, butthe stress unique to high altitudes is the oxygen-deficient atmosphere. This chapter will focus on thephysiological effects of acute and chronic exposureto that stressor. The emphasis will be on the effectsexperienced during altitude sojourns of the typethat military units might conduct (ie, ascent to mod-erate altitudes [2,500–5,000 m] for a few days to sev-eral weeks), although effects of longer and moreextreme ascents will also be considered. The mecha-nisms for these effects will be discussed with a viewto explaining functional changes experienced bylowlanders (natives or acclimatized inhabitants oflow-altitude regions) who are sojourning at altitude.
On arriving at high altitude, lowlanders will beincapable of as much physical exertion as they wereat sea level. Further, they may not feel well, andmay have impaired mentation. These effects are

Medical Aspects of Harsh Environments, Volume 2
646
THE HYPOXIC ENVIRONMENT
bient PO2, as illustrated by Equation 2, where thePH2O is taken to be 47 mm Hg:
(2) PIO2 = (PB – 47) • 0.2093
Thus, PIO2 also falls with increasing elevation. AsFigure 21-1(b) shows, PIO2 is 149 mm Hg ([760 – 47]• 0.2093) at sea level and 43 mm Hg ([253 – 47] •0.2093) on the summit of Mount Everest. Althoughthe major determining factor of PIO2 is PB, body tem-perature can affect the PIO2 somewhat. If body tem-perature falls, PH2O of saturated inspired air wouldalso fall and PIO2 would rise; conversely, if bodytemperature were to rise, PIO2 would fall. At a givenPB, the oxygen pressure in the inspired air is there-fore independent of ventilation and depends onlyon body temperature. (Alveolar temperature equalsbody temperature, but a detailed discussion of thispoint is beyond the scope of this chapter.)
Overview of the Oxygen-Transport Cascade atHigh Altitude
For health and even for life itself, oxygen mustconstantly be transported from the atmosphere tothe mitochondria in sufficient quantities to meettissue demands. Transport can be regarded as a se-ries of steps in a cascade, because the PO2 falls se-quentially and progressively, much as cascadingwater flowing over steps must fall to each new level.The cascade has four steps (Figure 21-2a):
1. oxygen transport by the bellows action of therespiratory system, which brings oxygenfrom ambient air to the alveolus, from which
2. oxygen passively diffuses across the alveo-lar–capillary membrane into the blood,which then
3. convectively transports the oxygen via car-diac action to the systemic capillaries, where
4. the oxygen passively diffuses through thetissues to the cells’ mitochondria.
Figure 21-2b illustrates the PO2 fall for each stepin the cascade during near maximal exercise. At sealevel, where the PIO2 is near 150 mm Hg, ventila-tion normally limits the PO2 pressure fall during thefirst step in the cascade to approximately 40 mmHg, resulting in an alveolar PO2 of 110 mm Hg. Dur-ing the second step in the cascade, the PO2 falls asoxygen diffuses across the pulmonary–capillary
Elevation, Barometric Pressure, and InspiredOxygen
The surface of Earth’s oceans, which we call sealevel, is also the bottom of an ocean of air. Air, un-like water, is compressible. Therefore air is denserat sea level than at higher terrestrial elevations, andbarometric pressure (PB) is not directly proportionalto elevation but is logarithmic. Thus, from sea level(PB = 760 mm Hg) to the summit of Mount Everest(PB = 253 mm Hg), the highest point on Earth, therelationship of pressure to elevation is a curved, andnot a straight, line (Figure 21-1). Also, where PB hasactually been measured at various terrestrial eleva-tions within the temperate zone, it is slightly higherthan the “standard barometric pressure” indicatedin the table published by the International CivilAviation Organization (ICAO) to reflect mean con-ditions over the entire earth’s surface.1 In addition,the ambient barometric pressure is lower in winterthan in summer, a decrease that over the years av-erages 8 mm Hg in Colorado.
Air is a mixture of gases, the summated partialpressures of which equal the PB. The principal gasesin air are oxygen and nitrogen. Their concentrationsare essentially constant over Earth’s terrestrial el-evations. For example, when water vapor is absent,oxygen comprises 20.93% of the air at all elevations.The partial pressure of oxygen (PO2, in mm Hg) inthe atmosphere falls as barometric pressure (PB, inmm Hg) falls, as defined by Equation 1:
(1) PO2 = PB • 0.2093
Thus, ambient PO2 also depends on the terrestrialelevation, falling with PB as elevation above sealevel increases, as indicated in Figure 21-1b. Theatmospheric PO2 (in dry air) is 159 mm Hg at sealevel (760 • 0.2093) and 53 mm Hg on the summitof Mount Everest (253 • 0.2093).
When air is inspired, it is warmed to body tem-perature and saturated with water vapor by the timeit reaches the bifurcation of the trachea. The watervapor has a partial pressure, which is also a com-ponent of total pressure. At all altitudes, the partialpressure of water vapor (PH2O) in fully humidifiedair depends only on temperature, ranging (in mmHg) from approximately 0.5 at 0°C and 760 at 100°C.At body temperature of 37°C, PH2O is 47 mm Hg.The dilution of inspired air by water vapor reducesthe inspired oxygen pressure (PIO2) below the am-

647
Human Adaptation to High Terrestrial Altitude
membrane from air in the alveolus to pulmonarycapillary blood. During heavy exercise, where largeamounts of oxygen are to be transported, the diffu-sion gradient may be large. This is because bloodentering the pulmonary capillaries during heavyexercise has relatively little oxygen content to be-gin with, and the high circulatory flow rate ensuresthat oxygen is removed quickly after crossing thepulmonary–capillary membrane. In addition,venous shunts allow deoxygenated blood to bypassthe lung capillaries and contribute to the PO2 pres-sure gradient from alveolus to arterial blood. Fig-
ure 21-2b shows the cascade from alveolus to ar-tery as a PO2 pressure fall of about 30 mm Hg dur-ing near-maximal exercise at sea level. The thirdstep, convective transport by the circulation, rep-resenting cardiac action, normally limits the PO2pressure fall to about 60 mm Hg (ie, from 80 mmHg in arterial blood to 20 mm Hg in venous blood).In Figure 21-2b, venous PO2 is assumed to reflectthat in the systemic capillaries. The PO2 in the mi-tochondria is considered to be near zero, so thefourth step in the cascade represents a PO2 fall ofabout 20 mm Hg.
Ambient
Mitochondria
Alveolar
Arterial
SystemicCapillary
Ventilation
Diffusion
Circulation
Diffusion
0
50
100
150Sea Level
Mt. Everest
Ventilation
Lung Diffusion
Circulation
TissueDiffusion
INSP ALVEOL ART VEN MITO
PO
(m
m H
g)2
a b
Fig. 21-2. In the oxygen transport cascade, oxygen moves from the atmosphere to the tissues down a decreasingpressure gradient. (a) The four steps in the oxygen transport cascade from ambient air to tissue mitochondria useeither active (ventilation, circulation) or passive (diffusion) processes. (b) The average fall in the partial pressure ofoxygen (PO2) was observed1–4 at each step in the oxygen transport cascade during near-maximal exercise at sea level(solid line) and at the simulated summit of Mount Everest (dotted line).INSP: inspired air, warmed and humidified; ALVEOL: in the alveoli, after CO2 has been added; ART: in the arterialblood, convectively transporting oxygen to metabolically active tissue; VEN: in the venous blood draining fromcapillaries perfusing metabolically active tissue; MITO: in the mitochondria while oxygen is used in the regenerationof adenosophine triphosphate.Data sources: (1) Sutton JR, Reeves JT, Wagner PD, et al. Operation Everest II: Oxygen transport during exercise atextreme simulated altitude. J Appl Physiol. 1988;64:1309–1321. (2) Wagner PD, Sutton JR, Reeves JT, Cymerman A,Groves BM, Malconian MK. Operation Everest II: Pulmonary gas exchange during a simulated ascent of Mt Everest.J Appl Physiol. 1987;63:2348–2359. (3) Cymerman A, Reeves JT, Sutton JR, et al. Operation Everest II: Maximal oxygenuptake at extreme altitude. J Appl Physiol. 1989;66:2446–2453. (4) Houston CS, Sutton JR, Cymerman A, Reeves JT.Operation Everest II: Man at extreme altitude. J Appl Physiol. 1987;63:877–882.

Medical Aspects of Harsh Environments, Volume 2
648
The overall PO2 pressure gradient that drives oxy-gen down the transport chain during heavy exer-cise at sea level is approximately 150 mm Hg frominspired air to the mitochondria. The overall PO2gradient driving oxygen transport at the highestpoint on Earth, the summit of Mount Everest, is con-siderably less than at sea level, about 43 mm Hgfrom inspired air to the mitochondria, because theatmospheric PO2 is so low at the top of MountEverest. Nevertheless, men recently ascendedMount Everest successfully without using supple-mental breathing oxygen.2 As shown in Figure 21-2b,the PO2 fall at each successive step in the oxygen-transport cascade is less on Mount Everest than at
sea level. Clearly, humans must have a great capacityfor physiological adjustments to compensate for thereduced pressure gradient that drives oxygen trans-port at high altitude. Not surprisingly, the most pro-found adjustments involve the active transportsteps in the cascade, ventilation and circulation, butthere are also adjustments affecting the passive trans-port steps. In the subsequent sections of this chapter,we will use experimental data reported from a vari-ety of studies at high altitudes to focus on the physi-ology and implications involved in the altitude-relatedchanges in each step in the oxygen-transport cascade,to better understand the normal responses to the com-bined stresses of exercise and hypoxia.
PULMONARY GAS EXCHANGE AT HIGH ALTITUDE
The Role of Increasing Ventilation
As we will discuss next in detail, one of the princi-pal physiological responses to hypoxia is an increasein ventilation. However, in the preceding section itwas pointed out that PIO2 was independent of alter-ations in ventilation. Therefore, we need to considerwhat role increasing ventilation plays in adjustingoxygen transport in response to hypoxia.
The alveolus always contains carbon dioxide.Because ambient inspired air contains relativelylittle carbon dioxide, alveolar carbon dioxide(PACO2) reflects the net balance between carbon di-oxide diffusion into the alveolus from the capillaryblood and removal of carbon dioxide from the al-veolus by expiration. When the inspired air reachesthe alveolus, it is diluted by the alveolar carbon di-oxide, which causes the alveolar PO2 (PAO2) to fallbelow the PIO2 (see Figure 21-1b). For practical pur-poses one may consider that the alveolus containsessentially four gases: nitrogen (including the otherinert gases), water vapor, oxygen, and carbon di-oxide. When the glottis is open at the end of inspi-ration and expiration, the total pressure in the al-veolus must equal the PB, which is the sum of thepartial pressures of the alveolar gases, as indicatedin Equation 3:
(3) PB = (PAN2 + PAH2O + PACO2 + PAO2)
Therefore, by rearranging Equation 3, an expressionof the partial pressure of oxygen in the alveolus,Equation 4, is obtained:
(4) PAO2 = PB – (PAN2 + PACO2 + PAH2O)
So how can increasing ventilation at any altitude
increase the partial pressure of oxygen in the alveo-lus? The PB is determined by the altitude and thePAH2O is determined by body temperature (47 mmHg at 37°C, as described above). Physiologically,nitrogen is an inert gas, being neither produced norconsumed by the body. Assuming that body tem-perature is 37°C and that equal volumes of oxygenleave and carbon dioxide enter the alveolus overtime (ie, the respiratory exchange ratio, R, equals1), the alveolar partial pressure of nitrogen (PAN2)may be expressed as follows in Equation 5:
(5) PAN2 = (PB – 47) • 0.7907
where 0.7907 is the fraction of nitrogen in dry at-mospheric air. Physiological variations in body tem-perature or R have only small effects on PAN2, whichis relatively high, compared with pressures of otheratmospheric gases. Thus, hyperventilation has littleor no effect on the PB, PAH2O, or PAN2 componentsof Equation 4 but does have a profound effect onthe two remaining components. Hyperventilationincreases the rate of removal of carbon dioxide fromthe alveolus relative to the rate that it diffuses infrom the blood. As hyperventilation lowers thePACO2, the PAO2 must rise.
Another expression of the steady state relationof PAO2 and PACO2 is given by the alveolar air equa-tion in Equation 6:
(6) PAO2 = PIO2 – PACO2 (FIO2 + [1 – FIO2] / R)
where FIO2 represents the fraction of oxygen in theinspired air (0.2093 during air breathing) and R, therespiratory exchange ratio, represents carbon diox-ide production divided by oxygen uptake. As Rvaries within its usual physiological range of 0.8 to

649
Human Adaptation to High Terrestrial Altitude
1.2, PACO2 will be modified by a factor ranging, re-spectively, from approximately 1.20 to 0.87. Equa-tion 7 illustrates the special case when R = 1:
(7) PAO2 = PIO2 – PACO2
It is clear from Equations 6 and 7 that if PIO2 isconstant, then PAO2 must rise as PACO2 falls. Fur-ther, when R = 1, there is an equal exchange of O2for CO2. Each mm Hg fall in PCO2 is accompaniedby a mm Hg rise in PO2. Thus, ventilation raises PO2to the extent that it lowers PCO2.
It is important to understand that although therelationship between the ventilation expired (VE)and PCO2 depends on the volume of carbon dioxideto be expired, the expired volumes of ventilationand of carbon dioxide are reported differently. Theventilation expired is usually reported in liters perminute, measured at body temperature, ambientpressure, and saturated with water vapor (BTPS,designated VE BTPS). These measurements reflect thevolume of gas expired under the conditions withinthe alveolus, and therefore the actual movement ofthe diaphragm and chest wall (ie, the bellows func-tion of the respiratory system). But the volumes ofcarbon dioxide (V
•CO2) are always reported under
standard conditions of temperature (0°C), pressure(760 mm Hg), and dry (PH2O = 0 mm Hg) (known asSTPD) to reflect the number of molecules of gas.(Occasionally, ventilation is reported as VE STPD todesignate the number of molecules transported intoand out of the lungs, as will be discussed later inthis chapter).
Equation 8 shows that the PACO2 falls as alveolarventilation (VA, total ventilation minus dead spaceventilation) rises for any given volume of CO2 pro-duced (V
•CO2):
(8) PACO2 = (F • V•
CO2 STPD) / VA BTPS
where F is the factor that converts CO2 from STPDto BTPS conditions, multiplied by the barometricpressure to allow the alveolar CO2 to be expressedas a partial pressure rather than a fractional con-centration.3 Because F is nearly constant from sealevel (1.21 • 760 mm Hg = 920 mm Hg) to the sum-mit of Mount Everest (4.19 • 253 mm Hg = 1,060mm Hg), the PACO2 for a given V
•CO2 depends al-
most entirely on the VA measured under BTPS con-ditions. Further, in normal subjects resting quietlyat sea level, PACO2 and the ratio of V
•CO2 / VA re-
main stable over long periods,4 demonstrating thateven at rest, ventilation is tightly coupled to meta-
bolic rate. The tight coupling of resting metabolicrate and ventilation also occurs at altitude, and de-creases in PACO2 reflect altitude-related hyperven-tilation independent of changes in metabolic rate.5
Also, carbon dioxide, being a water-soluble mol-ecule, crosses the alveolar–capillary membrane withmuch greater facility than does oxygen. The resultis that the resting alveolar–capillary PCO2 gradientis so small that alveolar and arterial PCO2 values areoften used interchangeably. By convention, respi-ratory physiologists use the carbon dioxide partialpressure in either the alveolus (PACO2) or the arte-rial blood (PaCO2) as convenient approximations ofeffective (alveolar) resting ventilation for the variousaltitudes.
Ventilatory Responses to Acute Hypoxia
Mechanism for Increasing Ventilation WithHypoxia
An increase in ventilation begins within secondsof exposure to hypoxia, but the subsequent time-dependent changes are complex. Figure 21-3 sche-matically depicts these sequential changes in stagesthat include a stimulation of ventilation known asthe acute hypoxic ventilatory response, hypoxicventilatory depression, ventilatory acclimatization,and finally hypoxic desensitization. The first twostages occur within minutes of hypoxic exposure,whereas ventilatory acclimatization is developedover the ensuing days to weeks that hypoxia con-tinues and persists for many years of residence in ahypoxic environment. The final stage, hypoxic de-sensitization, is not usually observed until afterdecades of chronic hypoxic exposure.
The key sensors that initiate and sustain the in-crease in ventilation in response to hypoxia appearto be the peripheral chemoreceptor cells in the ca-rotid bodies. The carotid bodies are about the sizeof the head of a pin and are located bilaterally inthe wall of the internal carotid artery at its originfrom the common carotid. Decreasing arterial oxy-genation increases carotid body neural discharge.The carotid body neural discharge increases hyper-bolically with decreasing PO2, and in inverse pro-portion to decreasing oxygen saturation below96%.6–8 With acute hypoxia, the carotid body neu-ral discharge is tightly coupled with elevatedphrenic nerve activity and increased ventilation.8
Carotid bodies sense oxygen pressure rather thancontent, as they do not respond to carbon monox-ide–induced reductions in arterial oxygen content

Medical Aspects of Harsh Environments, Volume 2
650
(CaO2) where the arterial PO2 remains high.8 Carotidbodies have an extremely high blood flow relativeto their size and metabolism (only a 5- to 15-mmHg PO2 gradient from arterial blood to the chemore-ceptor cell), so small changes in arterial oxygenationcan be rapidly sensed. Experiments with animalsindicate that removal of the carotid bodies preventsventilatory acclimatization to hypoxia.9 Animalswithout carotid body function that are taken to highaltitude do poorly and may die. Further, selectivecarotid body hypoxia induces acclimatization evenwhen the rest of the body, including the brain, isnormoxic. Thus, the acute and chronic ventilatoryresponse to hypoxia resides in the carotid bodies.
When the arterial oxygen pressure (PaO2) falls,nervelike cells (chemoreceptor cells, also called glo-mus type I cells) in the carotid body increase afferent
impulses along the ninth cranial nerve to the respira-tory system in the brainstem, resulting in increasedrespiratory effort. If a subject breathes oxygen-en-riched mixtures, the reverse happens (ie, decreasednerve traffic and respiratory effort). Thus, an impor-tant mechanism controlling breathing is the PaO2,where a decrease in PO2 increases breathing, and anincrease in PO2 decreases breathing. In each case, theresult is, in effect, the body’s effort to maintain con-stant blood oxygen levels. This concept is fully devel-oped in subsequent sections of this chapter.
How the carotid body senses oxygen levels hasbeen intensively investigated. Following the initialreport from Lopez-Barneo,10 there is increasing evi-dence that the glomus type I cells have voltage-gatedK+ channels that are altered by oxygen pressure overthe physiological range (see review by Benot11). Whenthe PO2 is high, the channels are open, allowing theegress of K+ to maintain the negative transmembranepotential in the interior of the cell, which under theseconditions is quiescent. As the PO2 falls, the outwardK+ current is progressively inhibited, causing the in-terior of the cell to become less negative and therebyinducing membrane depolarization. A reduction inPO2 thus induces electrical discharge of the glomustype I cells, which send afferent impulses up the ninthcranial nerve to the respiratory center in the medulla,resulting in an increase in ventilation within seconds.Whether changing PO2 directly affects the K+ chan-nels by changing the configuration of key proteins,or whether it alters mitochondrial activity, or worksthrough some other mechanism is not clear.
Many complex factors act on this basic controlmechanism to modulate the resultant level of ven-tilation. For one thing, hypercapnia augments andhypocapnia inhibits the hypoxic response. Changesin PCO2 exert direct effects on the respiratory centeras well as acting indirectly by affecting chemore-ceptor function.12 Although changing PCO2 levelsappear to be foremost, other factors also modulatethe hypoxic ventilatory response. Dopamine isthought to profoundly inhibit carotid body chemore-ceptor activity, probably via effects on the Na+ andCa++ channels and the levels of cyclic adenosinemonophosphate (AMP) in the glomus type I cells,which modulate the firing rate.13 Somatic neuralimpulses to the central nervous system, includingthose from the lungs, also contribute to regulationof ventilation. With so many influences, ventilationis both highly regulated and variable from one in-dividual to another. The interplay of these variousinfluences within an individual account for changesin ventilation over time at altitude (see Figure 21-3).
Minutes Hours Days Years Years x 10
AH
VR
Hyp
oxic
Ven
tilat
ory
Dep
ress
ion
Acc
limat
izat
ion
Acclimatized
Hyp
oxic
Des
ensi
tizat
ion
Duration of Hypoxia
Ven
tilat
ion
Fig. 21-3. Ventilation responses to hypoxia change as theexposure increases in duration. The acute hypoxic venti-latory response (AHVR) increases ventilation over thefirst 5 to 8 minutes. After about 10 minutes of hypoxia,some of the initial increase abates during hypoxic venti-latory depression. Over the next hours and days, venti-lation increases as the ventilatory depression disappears,and ventilatory acclimatization occurs. Fully developedventilatory acclimatization is characterized by hyperven-tilation, which is sustained for years at high altitude. Afall in ventilation that sometimes occurs after decades ofaltitude residence has been called hypoxic desentization.Adapted with permission from Weil JV. Ventilatory con-trol at high altitude. In: Fishman AP, Cherniak NS,Widdicombe JG, Geiger SR, eds. Handbook of Physiology.Section 3: The Respiratory System. Vol 2: Control of Breath-ing, Part 2. Bethesda, Md: American Physiological Soci-ety; 1986: 704.

651
Human Adaptation to High Terrestrial Altitude
The Acute Hypoxic Ventilatory Response
When sea-level residents are made progressivelymore hypoxemic over 10 minutes, the stimulus–response curve of PO2 to ventilation is hyperbolic (Figure21-4a). That the curve indeed reflects a stimulus-response relationship is theoretically likely, becausePO2 may be considered the actual stimulus for thecarotid body, as already discussed. The acute ven-tilatory response can be described by Equation 98,14:
(9) V•
E = Vo + A / (PO2 – B)
where V•
E represents minute ventilation (in L/min),
and Vo , the asymptote along the abscissa, repre-sents the minute ventilation (in L/min) when thePO2 is high (ie, when there is no hypoxic stimula-tion of ventilation). The constant B, empirically de-termined to equal 32 mm Hg,8,14 represents the PO2below which there is no further increase in carotidbody neural discharge, and ventilation is assumedto become asymptotic along the ordinate.6,7 PO2, byconvenience, usually represents the alveolar oxy-gen pressure (PAO2, in mm Hg), and A representsthe shape parameter for the curve. Figure 21-4ashows clearly that a higher A value correspondswith a greater “drive” to breathe, whereas a lowerA value characterizes individuals with a less-sen-
0
5
A = 186
A = 50
50 100 150 200
10
30
25
20
15
Ven
tilat
ion
(L/m
in)
PAO2 (mm Hg)
35a b
Fig. 21-4. The acute hypoxic ventilatory response is quantified by the increase in ventilation measured as alveolaroxygen pressure (PAO2) is decreased. (a) The stimulus-response curve is generated by plotting minute ventilation asPAO2 is progressively lowered over 5–8 minutes from a high value to about 45 mm Hg. The shape parameter, A, fromthe response curve’s equation, quantifies an individual’s “drive” to ventilate (V
•E = Vo + A / PO2 – B), where V
•E
represents minute ventilation (in L/min), and Vo, the asymptote along the abscissa, represents the minute ventilation(in L/min) when the PO2 is high (ie, when there is no hypoxic stimulation of ventilation). The constant B, empiricallydetermined to equal 32 mm Hg, represents the PO2 below which there is no further increase in carotid body neuraldischarge, and ventilation is assumed to become asymptotic along the ordinate.1,2 PO2, by convenience, usually repre-sents the alveolar oxygen pressure (PAO2, in mm Hg).
The average response (solid line) for 44 normal men and women has a shape parameter equal to 186 (the shapeparameter’s units are generally ignored), whereas in a subgroup of individuals whose response to hypoxia was at thelow end of the normal range (broken line), the value of A is 50.3,4 (b) For the tests plotted in panel (a), the correspond-ing relationship between minute ventilation and the arterial oxygen saturation (SaO2) is linear with a negative slope.References for the figure legend: (1) Hornbein TF. The relation between stimulus to chemoreceptors and their re-sponse. In: Torrance RW, ed. Arterial Chemoreceptors. Oxford, Edinburgh, Scotland: Blackwell Scientific Publications;1968: 65–78. (2) von Euler US, Liljestrand G, Zotterman Y. The excitation mechanism of the chemoreceptor in thecarotid body. Scand Arch Physiol. 1939;83:132–152. (3) Weil JV, Byrne-Quinn E, Sodal IE, Filley GF, Grover RF. Hypoxicventilatory drive in normal man. J Clin Invest. 1971;50:186–195. (4) Hirschman CA, McCullough RE, Weil JV. Normalvalues for hypoxic and hypercapnic ventilatory drives in man. J Appl Physiol. 1975;38:1095–1098.Data sources for the graphs: (1) Weil JV, Byrne-Quinn E, Sodal IE, Filley GF, Grover RF. Hypoxic ventilatory drive innormal man. J Clin Invest. 1971;50:186–195. (2) Hirschman CA, McCullough RE, Weil JV. Normal values for hypoxicand hypercapnic ventilatory drives in man. J Appl Physiol. 1975;38:1095–1098.
S = –0.15
S = –0.55
0
5
10
30
25
20
15
35
70 75 85 9580 90 100
Ve
ntil
atio
n (
L/m
in)
SaO2

Medical Aspects of Harsh Environments, Volume 2
652
sitive response to falling PAO2. In a group of 44 nor-mal Denver residents, Vo and A were measured andfound to be (mean ± 1 SD) 6.9 ± 2.4 L/min, and 186± 85 L • mm Hg/min, respectively.8,14 The large stan-dard deviation for A indicates the large variabilityamong individuals observed in the normal population.
The strength of an individual’s acute ventilatoryresponse during the 10-minute progressive hypoxiatest can also be quantified using the relationshipbetween V
•E and the arterial oxygen saturation (SaO2)
(Figure 21-4b). As SaO2 falls, V•
E rises linearly, such thatthe slope, S, is negative, as calculated in Equation 10:
(10) S = ∆V•
E /∆SaO2
SaO2 is frequently and conveniently measured us-ing commercial oximeters. Thus, the negative slopeof the relation of V
•E to SaO2 is a measure of the
strength of the hypoxic ventilatory response, wherethe strength of an individual’s hypoxic ventilatoryresponse increases as the slope becomes more nega-tive. The curvilinear relation of V
•E (and carotid body
neural discharge) to PAO2, as shown in Equation 9and Figure 21-4a, have been thought to reflect theshape of the oxyhemoglobin dissociation curve(ODC). Therefore, using SaO2 rather than PAO2 todescribe ventilatory responsiveness linearizes therelationship between stimulus and response, al-though the stimulus to the carotid body is thoughtto be oxygen pressure rather than hemoglobin satu-ration. Another advantage of using SaO2 rather thanPAO2 is that arterial blood (and not alveolar air)bathes the carotid chemoreceptor.
Regardless of whether the hypoxic ventilatory re-sponse is quantified using oxygen pressure to mea-sure A, or hemoglobin saturation to measure S, it isan inherent characteristic of an individual that pro-vides an accurate index of the strength of the ventila-tory response to acute hypoxia. Because there isgreater concurrence between identical than fraternaltwins, the response may have a familial component.15
When PCO2 is maintained at normal values during thehypoxic breathing (isocapnia), the response is greaterthan when PCO2 is allowed to fall.6,16 The hypoxic ven-tilatory response correlates with PCO2 at sea level andmay be a determinant of ventilation in subjects accli-matized to 4,300 m.17 The response is increased whenthe metabolic rate is increased, as with eating, exer-cise, and hyperthyroidism. The strength of the venti-latory response to hypoxia correlates with the strengthof the ventilatory response to hypercapnia,14 suggest-ing that the ventilatory responses to low oxygen andhigh carbon dioxide are linked.
Hypoxic Ventilatory Depression
The strength of the initial hypoxic response is notsustained (Figure 21-5). For example, at PAO2 of ap-proximately 45 mm Hg, the ventilatory responseduring acute hypoxia rises to a maximum between5 and 10 minutes, and then over the next 20 min-utes partially declines toward the normoxic, con-trol value. This ventilatory depression is not a re-sponse to hypocapnia, because it occurs both whenPCO2 is held constant (isocapnia) and when it is al-lowed to vary (poikilocapnia).
This hypoxic ventilatory depression may notoriginate from the carotid body. Studies using anes-thetized cats have demonstrated that when the ven-tilation falls, the carotid body neural traffic doesnot decrease.9 In other studies using cats, selectivehypoxia of the brain stem produced the ventilatorydepression, indicating that the depression is cen-tral in origin.18 Recent research has focused on thepossibility that hypoxic ventilatory depression ismediated by γ-aminobutyric acid (GABA). GABAis a central neurotransmitter released by inhibitoryinterneurons within the brain and spinal cord duringhypoxia and is implicated in the hypoventilationof hibernating and diving animals.19 Further, GABAadministration depresses ventilation, and admin-istration of antagonists to GABA prevents the hy-poxic ventilatory depression.20 Possibly, GABA re-lease is a vestigial remnant of a central mechanismthat was active in the aquatically adapted fetus.21
However, anesthetized animals may not provide anappropriate model of ventilatory control in awakehumans, in whom the carotid body may still regu-late the ventilatory depression.22
Ventilation Arrival at High Altitude
Thus, in subjects rapidly transported to high al-titude, opposing factors alter ventilation on arrival.On the one hand, hypoxia stimulates ventilation;on the other, the ventilatory response is limited bythe development of both hypocapnia and hypoxicdepression.16 When all three factors—hypoxicstimulation, hypocapnia, and hypoxic depression—were measured over 30 minutes in a group of indi-viduals at low altitude, these factors largely ac-counted for the level of ventilation observed on ar-rival (day 1) at high altitude (see Figure 21-5a).Approximately half of the ventilatory inhibitionthat occurred on arrival could be attributed to hy-poxic depression, and half to the development ofhypocapnia. Both inhibitory factors abated over the

653
Human Adaptation to High Terrestrial Altitude
next several days at altitude, and the ventilationobserved was that predicted by the acute ventila-tory response to isocapnic hypoxia at low altitude(see Figure 21-5b). The loss, over several days, ofthe factors inhibiting ventilation at altitude maycontribute to the process of ventilatory acclimati-zation, as will be discussed in the next section ofthis chapter.
The increase in ventilation at altitude is a truehyperventilation, in that ventilation increases outof proportion to metabolic requirements. However,resting metabolic rate increases on arrival at alti-tude,5,23 and this increased metabolic rate is anothercontributing factor signaling for an increase in ven-tilation. This is demonstrated by the findings thatpropranolol treatment to induce dense β-adrener-gic blockade prevented the increase in metabolicrate and lowered ventilation at altitude comparedto placebo treatment.5 However, ventilation roseprogressively and PaCO2 fell progressively in both
propranolol- and placebo-treated subjects.5 Thus,these data were interpreted to indicate that the in-crease in metabolic rate on arrival at altitude doesstimulate ventilation; however, this effect was sepa-rate from the process of ventilatory acclimatization.
Ventilatory Acclimatization to High Altitude
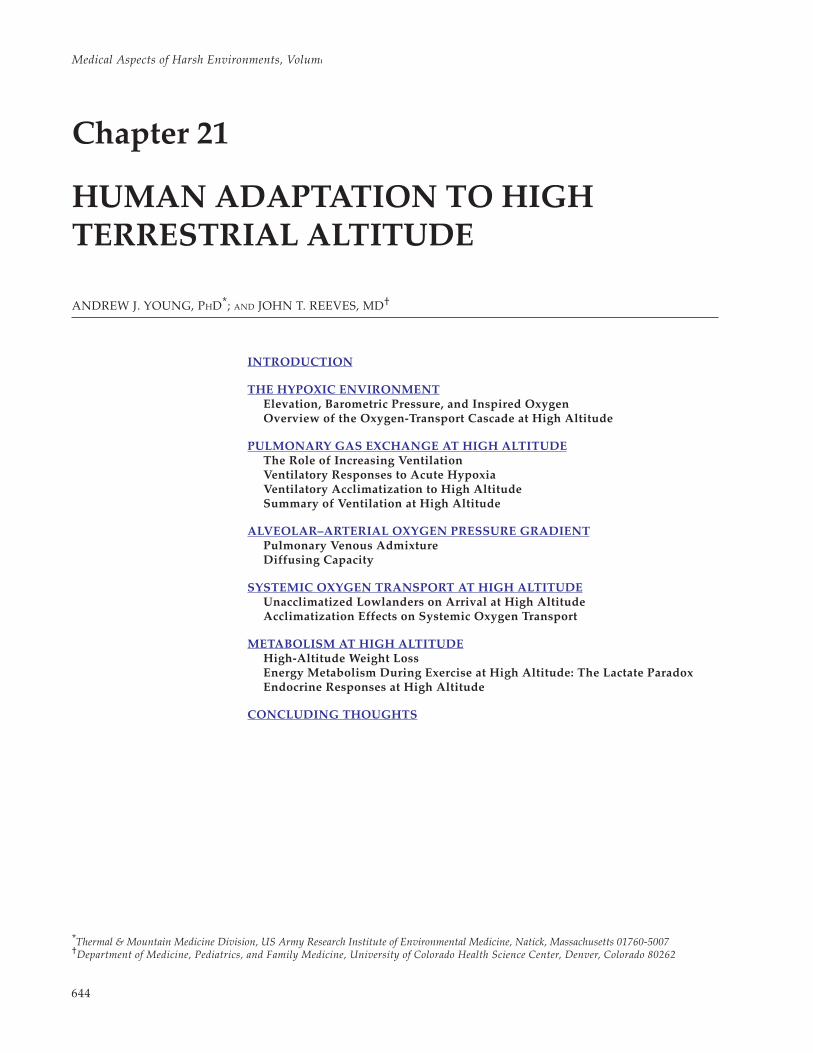
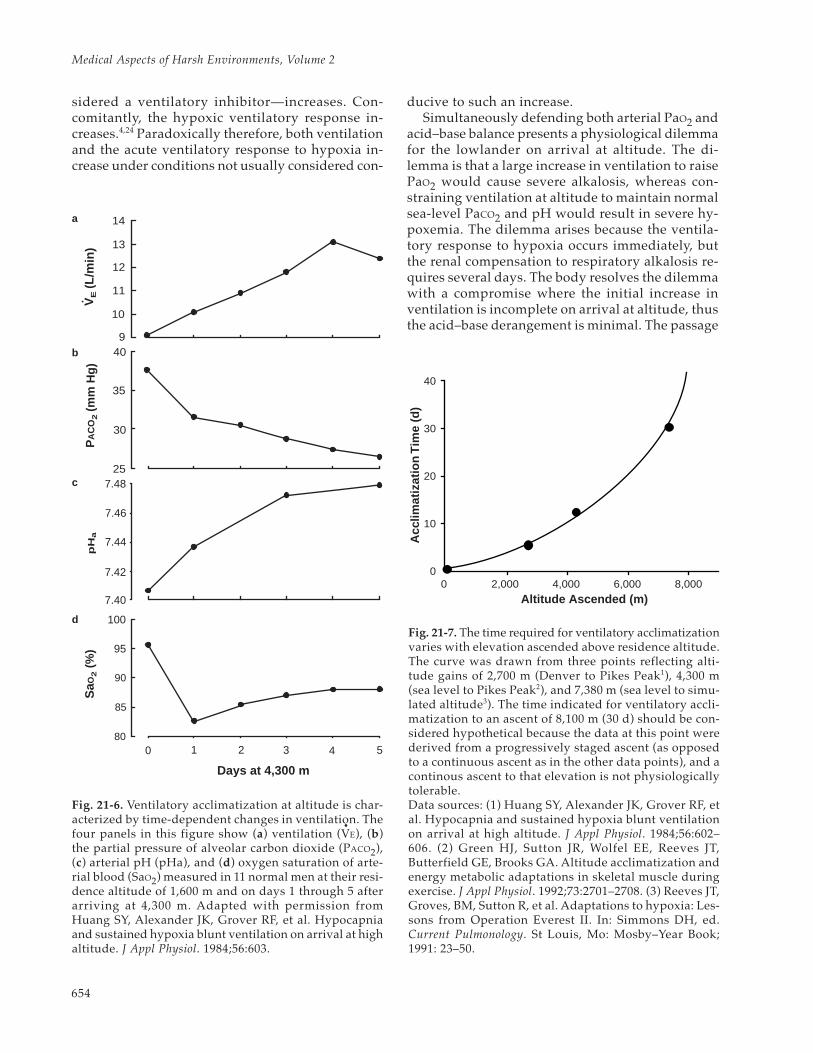
Ventilation increases during the first days afterarrival at high altitude through a poorly understoodprocess termed “ventilatory acclimatization.” Asventilation increases, PCO2 falls and arterial pH andSaO2 rise (Figure 21-6). More time is required forfull development of ventilatory acclimatization (evi-denced by plateauing of these responses) when thealtitude ascended increases (Figure 21-7). The risein ventilation develops progressively over severaldays following arrival at altitude, even though hy-poxemia—a ventilatory stimulus—progressivelydecreases, and hypocapnic alkalosis—usually con-
18
SaO
8
12
3
4
5
Duration of Hypoxia (min)
Poikilocapnia
Isocapnia
Ven
tilat
ion
(L/m
in)
16
14
12
10
8
0 10 20 30 Day 1
4,300 m
18
16
14
12
10
80 85 90 95 100
2
Ven
tilat
ion
(L/m
in)
a b
Fig. 21-5. When hypoxia is sustained for more than a few minutes, the increase in ventilation observed with acutehypoxia abates owing to ventilatory depression. (a) The acute ventilatory response to hypoxia (partial pressure ofalveolar oxygen [PAO2] ~ 45 mm Hg) and the ventilatory response to hypoxia sustained over the next 30 minutes weremeasured in 11 male residents of 1,600 m. Ventilation is greater when the partial pressure of alveolar carbon dioxide(PACO2) is held constant (isocapnia, solid line) than when it is allowed to fall (poikiolcapnia, dotted line) during thehypoxia. However, ventilatory depression begins after about 10 minutes of hypoxia, regardless of whether the partialpressure of carbon dioxide (PCO2) is maintained or allowed to fall. Resting ventilation in these subjects on arrival at4,300 m was near that observed during sustained poikilocapnic hypoxia at 1,600 m. (b) For the same 11 subjects at1,600 m (solid line), the mean values of resting ventilation and the corresponding arterial oxygen saturation (SaO2)were measured on each of the first 5 days during acclimatization at 4,300 m (closed circles, days 1–5). These observa-tions suggest that ventilation on arrival at altitude could be predicted from low altitude hypoxic tests when therewas hypocapnia and hypoxic depression, whereas the acclimatized ventilation could be predicted from the acuteisocapnic hypoxic ventilatory response at low altitude. Adapted with permission from Huang SY, Alexander JK,Grover RF, et al. Hypocapnia and sustained hypoxia blunt ventilation on arrival at high altitude. J Appl Physiol.1984;56:604.
Medical Aspects of Harsh Environments, Volume 2
654
sidered a ventilatory inhibitor—increases. Con-comitantly, the hypoxic ventilatory response in-creases.4,24 Paradoxically therefore, both ventilationand the acute ventilatory response to hypoxia in-crease under conditions not usually considered con-
ducive to such an increase.Simultaneously defending both arterial PaO2 and
acid–base balance presents a physiological dilemmafor the lowlander on arrival at altitude. The di-lemma is that a large increase in ventilation to raisePaO2 would cause severe alkalosis, whereas con-straining ventilation at altitude to maintain normalsea-level PaCO2 and pH would result in severe hy-poxemia. The dilemma arises because the ventila-tory response to hypoxia occurs immediately, butthe renal compensation to respiratory alkalosis re-quires several days. The body resolves the dilemmawith a compromise where the initial increase inventilation is incomplete on arrival at altitude, thusthe acid–base derangement is minimal. The passage
0 2,000 4,000 6,000 8,0000
10
20
30
40
Acc
limat
izat
ion
Tim
e (d
)
Altitude Ascended (m)
Fig. 21-7. The time required for ventilatory acclimatizationvaries with elevation ascended above residence altitude.The curve was drawn from three points reflecting alti-tude gains of 2,700 m (Denver to Pikes Peak1), 4,300 m(sea level to Pikes Peak2), and 7,380 m (sea level to simu-lated altitude3). The time indicated for ventilatory accli-matization to an ascent of 8,100 m (30 d) should be con-sidered hypothetical because the data at this point werederived from a progressively staged ascent (as opposedto a continuous ascent as in the other data points), and acontinous ascent to that elevation is not physiologicallytolerable.Data sources: (1) Huang SY, Alexander JK, Grover RF, etal. Hypocapnia and sustained hypoxia blunt ventilationon arrival at high altitude. J Appl Physiol. 1984;56:602–606. (2) Green HJ, Sutton JR, Wolfel EE, Reeves JT,Butterfield GE, Brooks GA. Altitude acclimatization andenergy metabolic adaptations in skeletal muscle duringexercise. J Appl Physiol. 1992;73:2701–2708. (3) Reeves JT,Groves, BM, Sutton R, et al. Adaptations to hypoxia: Les-sons from Operation Everest II. In: Simmons DH, ed.Current Pulmonology. St Louis, Mo: Mosby–Year Book;1991: 23–50.
PA
CO
2 (m
m H
g)
7.48
90
100
14
13
12
11
10
940
35
30
25
7.46
7.44
7.42
7.40
95
85
800 1 2 3 4 5
Days at 4,300 m
SaO
2 (
%)
pH
aV
E (L
/min
)
Fig. 21-6. Ventilatory acclimatization at altitude is char-acterized by time-dependent changes in ventilation. Thefour panels in this figure show (a) ventilation (V
•E), (b)
the partial pressure of alveolar carbon dioxide (PACO2),(c) arterial pH (pHa), and (d) oxygen saturation of arte-rial blood (SaO2) measured in 11 normal men at their resi-dence altitude of 1,600 m and on days 1 through 5 afterarriving at 4,300 m. Adapted with permission fromHuang SY, Alexander JK, Grover RF, et al. Hypocapniaand sustained hypoxia blunt ventilation on arrival at highaltitude. J Appl Physiol. 1984;56:603.
a
b
c
d

655
Human Adaptation to High Terrestrial Altitude
of time for development of the large increase inventilation that is characteristic of full acclimatiza-tion provides time for renal compensation by bi-carbonate excretion to limit alkalosis. Althoughother factors may play a role, the principal mecha-nisms mediating this ventilatory acclimatizationinvolve the central chemoreceptors (pH receptorsin the medulla) and the peripheral chemoreceptors(PO2 receptors in the carotid body).
Central (Medullary) Chemoreceptor Mechanisms
Ventilation is sensitive to small changes in medul-lary pH, increasing with increased concentration ofhydrogen ions [H+], and decreasing with decreased[H+]. An early view considered that ventilatory ac-climatization reflected a progressive withdrawal ofthe inhibitory effects exerted by the centralchemoreceptor in response to hypocapnic alkalo-sis. As acclimatization proceeds, the concentrationof bicarbonate [HCO3
–] in the blood and cerebralspinal fluid falls due to renal compensation con-comitant with the decline in PCO2, thus limiting thefall in [H+]. In addition, hypoxia may increase meta-bolic production of lactate in the brain, which couldincrease [H+] concentration near the medullarychemoreceptor. Either mechanism would tend torestore normal pH in or near the medullarychemoreceptor, despite decreased arterial PCO2. Theventilatory response to carbon dioxide is shifted tolower PCO2 values, and the slope of the responsebecomes somewhat steeper. While this early viewimplicating the central chemoreceptor in the accli-matization process is attractive and may be correct,there is little direct evidence to support it.12,25
Peripheral (Carotid) Chemoreceptor Mechanisms
An alternative view attributes ventilatory accli-matization to an increase in hypoxic sensitivity ofthe carotid (ie, peripheral) chemoreceptor. Studieswith animals show neural activity from the carotidbody progressively increasing over time at alti-tude.26 In goats, acclimatization occurs within hourswhen the hypoxia is limited to the carotid bodies,but does not occur when the hypoxia is limited tothe central nervous system.9 Further, acclimatiza-tion occurs with carotid body hypoxia whether ornot there is accompanying hypocapnia.12,25 The stud-ies have suggested that acclimatization occurswithin the carotid body, possibly independent ofthe changes within the central nervous system.
Experiments involving human subjects appear toconfirm the conclusions from those with animals.
In one study, maintaining normocapnia reportedlyprevented ventilatory acclimatization in humanswho were exposed for 100 hours to hypobaric hy-poxia27; however, these experiments appearedflawed4,9,25 in that there was poor control of carbondioxide, particularly during the first 24 hours ofaltitude exposure, during which time only one mea-surement was made. In more-recent and better-con-trolled human studies, ventilation and the ventila-tory response to acute hypoxia were observed toincrease progressively during the first 8 hours ofhypoxia—even though PCO2 was tightly maintainedat sea-level values.4,24 These results indicate that inman, as in the goat, ventilatory acclimatization tohypoxia can develop in the absence of hypocapniaand, therefore, is not merely a matter of overcom-ing central hypocapnic alkalosis. Still, ventilationappears to rise more rapidly during hypoxia withnormocapnia than with hypocapnia,4,27 so the pos-sibility of some role for the central chemoreceptorin the process of ventilatory acclimatization cannotbe entirely ruled out.4,24 Nevertheless, the weightof current evidence suggests that acclimatization re-sults primarily from a progressive effect of hypoxiaon the carotid body.
Acclimatization to Altitude: Rest
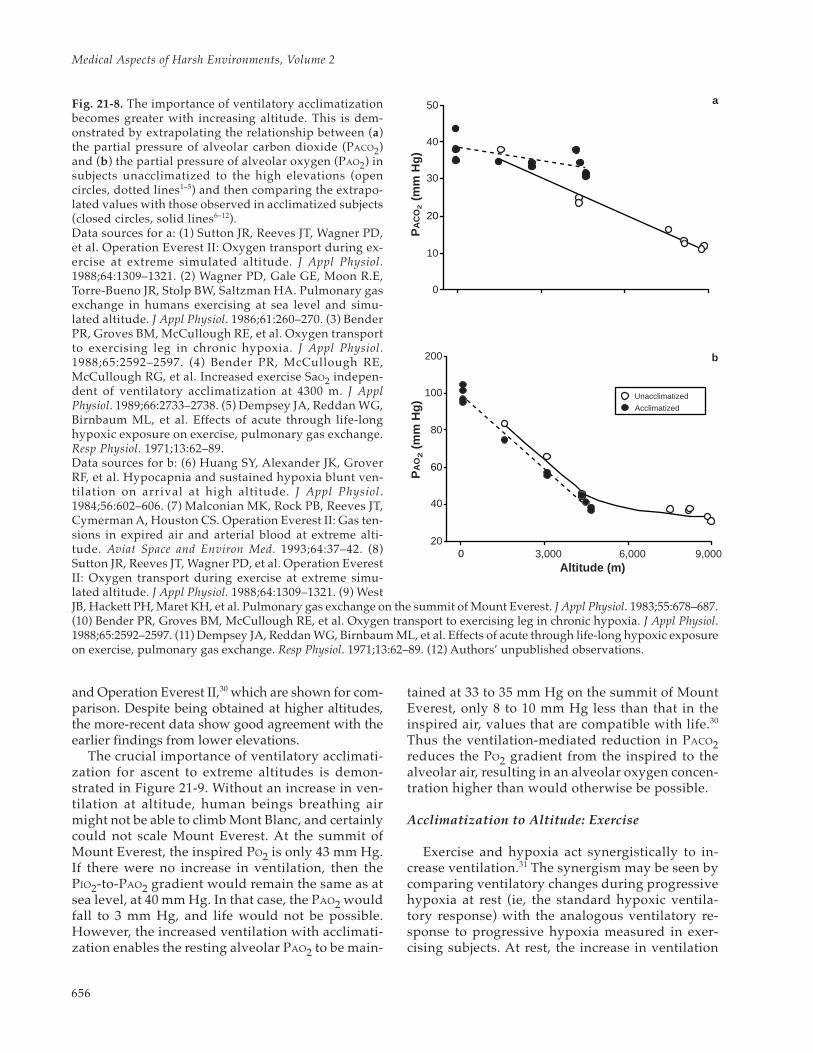
The reduction in PaCO2 and the increase in PAO2with ventilatory acclimatization at altitude becomesmore pronounced with increasing altitude (Figure21-8). For ethical reasons, unacclimatized subjectsare not studied at altitudes above approximately4,500 m. In unacclimatized subjects, PaCO2 valuesobserved at 4,300 to 4,500 m were approximately10 mm Hg higher than in acclimatized subjects atthe same altitudes. The higher PaCO2 values main-tained in the unacclimatized subjects dictate lowerPAO2 values than in acclimatized subjects, thus lim-iting the altitude to which the unacclimatized areable to ascend. Inspection of Figure 21-8b indicatesthat the unacclimatized subjects at 4,300 to 4,500 mhad PAO2 values similar to the values in acclima-tized subjects above 7,000 m.
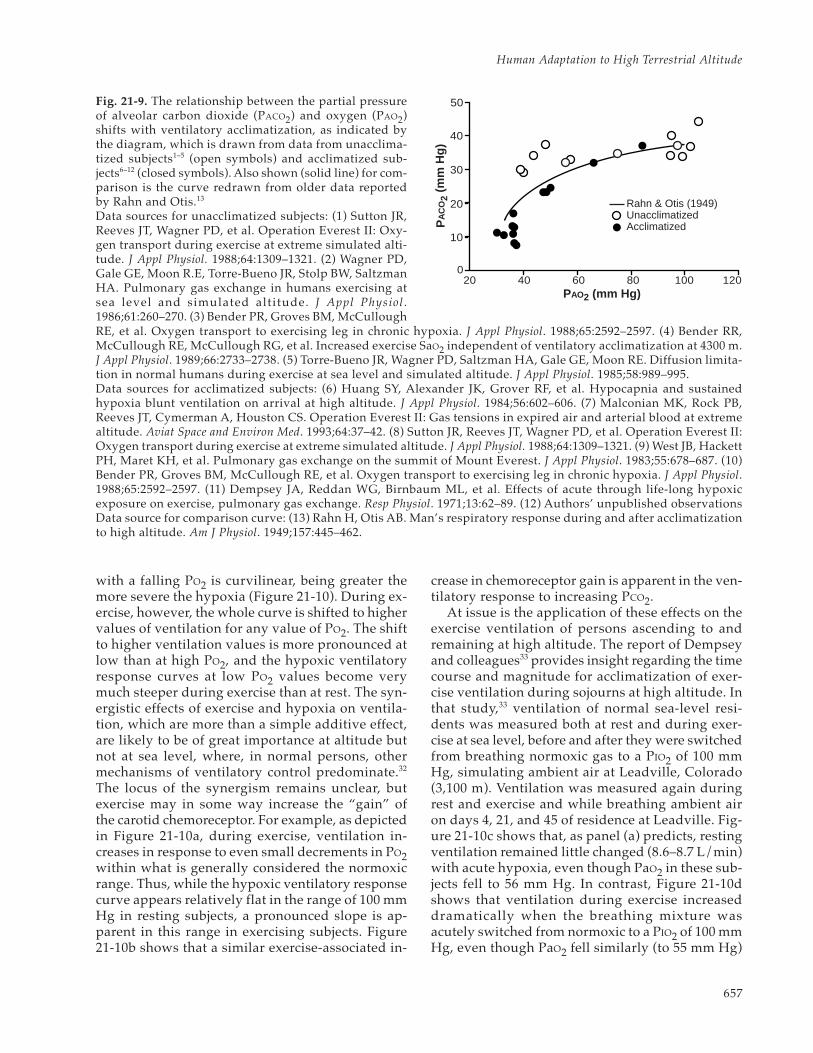
The increasing importance of ventilatory acclima-tization with increasing altitude was first noted byFitzgerald,28 and later by Rahn and Otis,29 who illus-trated this relationship by plotting their observationson a PACO2 – PAO2 diagram. This classical representa-tion of the effects of ventilatory acclimatization is de-picted in Figure 21-9, in which the early observationsby Rahn and Otis29 are displayed along with more-recent data that were obtained during the AmericanMedical Research Expedition to Everest (AMREE)1
Medical Aspects of Harsh Environments, Volume 2
656
and Operation Everest II,30 which are shown for com-parison. Despite being obtained at higher altitudes,the more-recent data show good agreement with theearlier findings from lower elevations.
The crucial importance of ventilatory acclimati-zation for ascent to extreme altitudes is demon-strated in Figure 21-9. Without an increase in ven-tilation at altitude, human beings breathing airmight not be able to climb Mont Blanc, and certainlycould not scale Mount Everest. At the summit ofMount Everest, the inspired PO2 is only 43 mm Hg.If there were no increase in ventilation, then thePIO2-to-PAO2 gradient would remain the same as atsea level, at 40 mm Hg. In that case, the PAO2 wouldfall to 3 mm Hg, and life would not be possible.However, the increased ventilation with acclimati-zation enables the resting alveolar PAO2 to be main-
tained at 33 to 35 mm Hg on the summit of MountEverest, only 8 to 10 mm Hg less than that in theinspired air, values that are compatible with life.30
Thus the ventilation-mediated reduction in PACO2reduces the PO2 gradient from the inspired to thealveolar air, resulting in an alveolar oxygen concen-tration higher than would otherwise be possible.
Acclimatization to Altitude: Exercise
Exercise and hypoxia act synergistically to in-crease ventilation.31 The synergism may be seen bycomparing ventilatory changes during progressivehypoxia at rest (ie, the standard hypoxic ventila-tory response) with the analogous ventilatory re-sponse to progressive hypoxia measured in exer-cising subjects. At rest, the increase in ventilation
Fig. 21-8. The importance of ventilatory acclimatizationbecomes greater with increasing altitude. This is dem-onstrated by extrapolating the relationship between (a)the partial pressure of alveolar carbon dioxide (PACO2)and (b) the partial pressure of alveolar oxygen (PAO2) insubjects unacclimatized to the high elevations (opencircles, dotted lines1–5) and then comparing the extrapo-lated values with those observed in acclimatized subjects(closed circles, solid lines6–12).Data sources for a: (1) Sutton JR, Reeves JT, Wagner PD,et al. Operation Everest II: Oxygen transport during ex-ercise at extreme simulated altitude. J Appl Physiol.1988;64:1309–1321. (2) Wagner PD, Gale GE, Moon R.E,Torre-Bueno JR, Stolp BW, Saltzman HA. Pulmonary gasexchange in humans exercising at sea level and simu-lated altitude. J Appl Physiol. 1986;61:260–270. (3) BenderPR, Groves BM, McCullough RE, et al. Oxygen transportto exercising leg in chronic hypoxia. J Appl Physiol.1988;65:2592–2597. (4) Bender PR, McCullough RE,McCullough RG, et al. Increased exercise SaO2 indepen-dent of ventilatory acclimatization at 4300 m. J ApplPhysiol. 1989;66:2733–2738. (5) Dempsey JA, Reddan WG,Birnbaum ML, et al. Effects of acute through life-longhypoxic exposure on exercise, pulmonary gas exchange.Resp Physiol. 1971;13:62–89.Data sources for b: (6) Huang SY, Alexander JK, GroverRF, et al. Hypocapnia and sustained hypoxia blunt ven-tilation on arrival at high altitude. J Appl Physiol.1984;56:602–606. (7) Malconian MK, Rock PB, Reeves JT,Cymerman A, Houston CS. Operation Everest II: Gas ten-sions in expired air and arterial blood at extreme alti-tude. Aviat Space and Environ Med. 1993;64:37–42. (8)Sutton JR, Reeves JT, Wagner PD, et al. Operation EverestII: Oxygen transport during exercise at extreme simu-lated altitude. J Appl Physiol. 1988;64:1309–1321. (9) West
20
0
60
Altitude (m)3,000 6,000 9,000
20
40
80
100
200
PA
O2 (
mm
Hg
)P
AC
O2
(m
m H
g)
0
10
30
40
50
Unacclimatized
Acclimatized
a
b
JB, Hackett PH, Maret KH, et al. Pulmonary gas exchange on the summit of Mount Everest. J Appl Physiol. 1983;55:678–687.(10) Bender PR, Groves BM, McCullough RE, et al. Oxygen transport to exercising leg in chronic hypoxia. J Appl Physiol.1988;65:2592–2597. (11) Dempsey JA, Reddan WG, Birnbaum ML, et al. Effects of acute through life-long hypoxic exposureon exercise, pulmonary gas exchange. Resp Physiol. 1971;13:62–89. (12) Authors’ unpublished observations.
657
Human Adaptation to High Terrestrial Altitude
with a falling PO2 is curvilinear, being greater themore severe the hypoxia (Figure 21-10). During ex-ercise, however, the whole curve is shifted to highervalues of ventilation for any value of PO2. The shiftto higher ventilation values is more pronounced atlow than at high PO2, and the hypoxic ventilatoryresponse curves at low PO2 values become verymuch steeper during exercise than at rest. The syn-ergistic effects of exercise and hypoxia on ventila-tion, which are more than a simple additive effect,are likely to be of great importance at altitude butnot at sea level, where, in normal persons, othermechanisms of ventilatory control predominate.32
The locus of the synergism remains unclear, butexercise may in some way increase the “gain” ofthe carotid chemoreceptor. For example, as depictedin Figure 21-10a, during exercise, ventilation in-creases in response to even small decrements in PO2within what is generally considered the normoxicrange. Thus, while the hypoxic ventilatory responsecurve appears relatively flat in the range of 100 mmHg in resting subjects, a pronounced slope is ap-parent in this range in exercising subjects. Figure21-10b shows that a similar exercise-associated in-
crease in chemoreceptor gain is apparent in the ven-tilatory response to increasing PCO2.
At issue is the application of these effects on theexercise ventilation of persons ascending to andremaining at high altitude. The report of Dempseyand colleagues33 provides insight regarding the timecourse and magnitude for acclimatization of exer-cise ventilation during sojourns at high altitude. Inthat study,33 ventilation of normal sea-level resi-dents was measured both at rest and during exer-cise at sea level, before and after they were switchedfrom breathing normoxic gas to a PIO2 of 100 mmHg, simulating ambient air at Leadville, Colorado(3,100 m). Ventilation was measured again duringrest and exercise and while breathing ambient airon days 4, 21, and 45 of residence at Leadville. Fig-ure 21-10c shows that, as panel (a) predicts, restingventilation remained little changed (8.6–8.7 L/min)with acute hypoxia, even though PaO2 in these sub-jects fell to 56 mm Hg. In contrast, Figure 21-10dshows that ventilation during exercise increaseddramatically when the breathing mixture wasacutely switched from normoxic to a PIO2 of 100 mmHg, even though PaO2 fell similarly (to 55 mm Hg)
PAO2 (mm Hg)20 40 60 80 100 120
0
PA
CO
2 (m
m H
g)
20
10
30
40
50
Rahn & Otis (1949)�Unacclimatized�Acclimatized
Fig. 21-9. The relationship between the partial pressureof alveolar carbon dioxide (PACO2) and oxygen (PAO2)shifts with ventilatory acclimatization, as indicated bythe diagram, which is drawn from data from unacclima-tized subjects1–5 (open symbols) and acclimatized sub-jects6–12 (closed symbols). Also shown (solid line) for com-parison is the curve redrawn from older data reportedby Rahn and Otis.13
Data sources for unacclimatized subjects: (1) Sutton JR,Reeves JT, Wagner PD, et al. Operation Everest II: Oxy-gen transport during exercise at extreme simulated alti-tude. J Appl Physiol. 1988;64:1309–1321. (2) Wagner PD,Gale GE, Moon R.E, Torre-Bueno JR, Stolp BW, SaltzmanHA. Pulmonary gas exchange in humans exercising atsea level and simulated altitude. J Appl Physiol .1986;61:260–270. (3) Bender PR, Groves BM, McCulloughRE, et al. Oxygen transport to exercising leg in chronic hypoxia. J Appl Physiol. 1988;65:2592–2597. (4) Bender RR,McCullough RE, McCullough RG, et al. Increased exercise SaO2 independent of ventilatory acclimatization at 4300 m.J Appl Physiol. 1989;66:2733–2738. (5) Torre-Bueno JR, Wagner PD, Saltzman HA, Gale GE, Moon RE. Diffusion limita-tion in normal humans during exercise at sea level and simulated altitude. J Appl Physiol. 1985;58:989–995.Data sources for acclimatized subjects: (6) Huang SY, Alexander JK, Grover RF, et al. Hypocapnia and sustainedhypoxia blunt ventilation on arrival at high altitude. J Appl Physiol. 1984;56:602–606. (7) Malconian MK, Rock PB,Reeves JT, Cymerman A, Houston CS. Operation Everest II: Gas tensions in expired air and arterial blood at extremealtitude. Aviat Space and Environ Med. 1993;64:37–42. (8) Sutton JR, Reeves JT, Wagner PD, et al. Operation Everest II:Oxygen transport during exercise at extreme simulated altitude. J Appl Physiol. 1988;64:1309–1321. (9) West JB, HackettPH, Maret KH, et al. Pulmonary gas exchange on the summit of Mount Everest. J Appl Physiol. 1983;55:678–687. (10)Bender PR, Groves BM, McCullough RE, et al. Oxygen transport to exercising leg in chronic hypoxia. J Appl Physiol.1988;65:2592–2597. (11) Dempsey JA, Reddan WG, Birnbaum ML, et al. Effects of acute through life-long hypoxicexposure on exercise, pulmonary gas exchange. Resp Physiol. 1971;13:62–89. (12) Authors’ unpublished observationsData source for comparison curve: (13) Rahn H, Otis AB. Man’s respiratory response during and after acclimatizationto high altitude. Am J Physiol. 1949;157:445–462.

Medical Aspects of Harsh Environments, Volume 2
658
during hypoxic exercise and during hypoxic rest.The exercise increased V
•O2 8-fold above the resting
rate, to 2.3 L/min. Ventilation during normoxic ex-ercise was 70 L/min, also 8-fold higher than theresting level; however, during hypoxic exercise,ventilation was almost 12-fold greater than the rest-ing level. After 4 days’ residence at Leadville, the
effects of ventilatory acclimatization increased rest-ing ventilation by 38% (to 3.7 L/min), whereas ex-ercise ventilation increased only an additional 9%(6 L/min). There were no further changes in rest-ing or exercise ventilation over the remainder of the45-day stay at Leadville, indicating that, at least foraltitudes around 3,100 m, ventilatory acclimatiza-
Fig. 21-10. The effect of exercise on ventilation is synergistic with those of hypoxia and hypercapnia. (a) Ventilation atstandard temperature, pressure, and dry (PH2O = 0) (V
•E STPD), is measured during acute progressive hypoxia in subjects
resting (solid line) or exercising at three different intensities (broken lines) on a supine cycle ergometer. As indicated,increasing metabolism results in increasing ventilation at all partial pressures of alveolar oxygen (PAO2), but the incre-ments in ventilation with increasing metabolism are greatest at the lowest PAO2. (b) A similar synergism on ventilation ofthe effects of increasing metabolism is seen with increasing partial pressure of alveolar carbon dioxide (PACO2).
The duration of exposure to altitude affects the ventilatory response to exercise. (c) Resting ventilation and (d)exercise (V
•O2 = 2.29 L/min) ventilation at body temperature, pressure, and saturated (V
•E BTPS) are shown in subjects
at sea level breathing normoxic air and hypoxic air (indicated by the arrow) simulating 3,100 m, and breathing ambi-ent air at Leadville, Colorado (3,100 m), on days 4, 21, and 45. The stimulating effect of acute hypoxia on ventilationat sea level is more pronounced during exercise (seen in d) than at rest (seen in c), whereas the effect of ventilatoryacclimatization appears more pronounced when measured during rest than during exercise. The relation betweenoxygen uptake V
•O2) and ventilatory response (V
•E BTPS) at different altitudes is shown in (e). As elevation increases, so
does the increment in ventilation for a given V•
O2, but ventilation during maximal effort is only slightly increased ataltitude.Graphs a and b: Adapted with permission from Weil JV, Bryne-Quinn E, Sodal IE, Kline JS, McCullough RE, Filley GF.Augmentation of chemosensitivity during mild exercise in normal man. J Appl Physiol. 1972;33:813–819. Graphs c andd: Adapted with permission from Dempsey JA, Forster HV, Birnbaum ML, et al. Control of exercise hyperpnea undervarying durations of exposure to moderate hypoxia. Respir Physiol. 1972;16:213–231. Graph e: Adapted with permis-sion from Sutton JR, Reeves JT, Wagner PD, et al. Operation Everest II: Oxygen transport during exercise at extremesimulated altitude. J Appl Physiol. 1988;64:1309–1321.
40
VE
ST
PD
(L/
min
)
0
20
60
80
50
0
100
150
200
120 100 80 60 40PAO2 (mm Hg)
30 40 45 50
0.78 L/min
Rest0.58 L/min
1.1 L/min
35 55
12
10
8
Rest
120
90
60
Exercise
SL 4 21 45
VE
BT
PS
(L
/min
)
0 1 2 3 4
VE
BT
PS
(L
/min
)
O2 Uptake (L/min)8,
848
m
6,50
0 m
4,80
0 m
SL
PACO2 (mm Hg)
Days at 3,100 m
a b
c e
d
659
Human Adaptation to High Terrestrial Altitude
tion was complete in 4 days.Why ventilatory acclimatization appears to have
a lesser effect on exercise ventilation than on rest-ing ventilation remains unclear, because mecha-nisms linking ventilation to metabolism are notfully understood. One possibility is that during ex-ercise when the metabolic rate is high, chemorecep-tor sensitivity is augmented so that stimulation ofventilation is very near the maximal levels in re-sponse acute hypoxia, with little further potentialincrease possible following acclimatization. Further,during rest, ventilation rates are low and respira-tory muscle fatigue would not be expected to de-velop or limit ventilatory increases with acclimati-zation; but during exercise at high altitude, highventilation rates may well lead to respiratorymuscle fatigue, precluding manifestation of venti-latory acclimatization during exercise. Another po-tential modulating mechanism involves (a) the ac-cumulation of metabolic acid (primarily lactic) dur-ing exercise and (b) the buffering capacity of bloodplasma (ie, plasma [HCO3
–]), both of which changewith acute hypoxic exposure and altitude acclima-tization. Thus during ventilatory acclimatization,ventilatory stimulation due to changes in blood pHand acid concentration during exercise will be vary-ing. Clearly, mechanisms regulating exercise venti-lation during ventilatory acclimatization require
further study.Therefore, subjects acclimatized to high altitude
have higher ventilations for a given V•
O2 at altitudethan sea level, although maximal ventilation is simi-lar for all altitudes. Further, as the elevation in-creases, so does the increment in ventilation for agiven V
•O2, as depicted in Figure 21-10e. This in-
crease in exercise ventilation at high altitude shouldbe viewed in perspective, however. For many yearsit has been recognized that when ventilation is ex-pressed under standard (STPD) rather than body(BTPS) conditions, the ventilation during rest andexercise at different intensities is relatively indepen-dent of altitude.34 This suggests that for a given V
•O2,
the same number of oxygen molecules is respiredat all altitudes, including sea level. The respiratorysystem seems to function in a remarkably well-reg-ulated manner, regardless of the individual’s eleva-tion, acclimatization status, or severity of effort,such that ventilation brings to the lung approxi-mately 1.7 • 1023 molecules of oxygen for each literof oxygen consumed.3
Blood Acid–Base Balance Following VentilatoryAcclimatization
The bicarbonate buffer system is the body’s mostimportant regulator of body fluid pH because of the
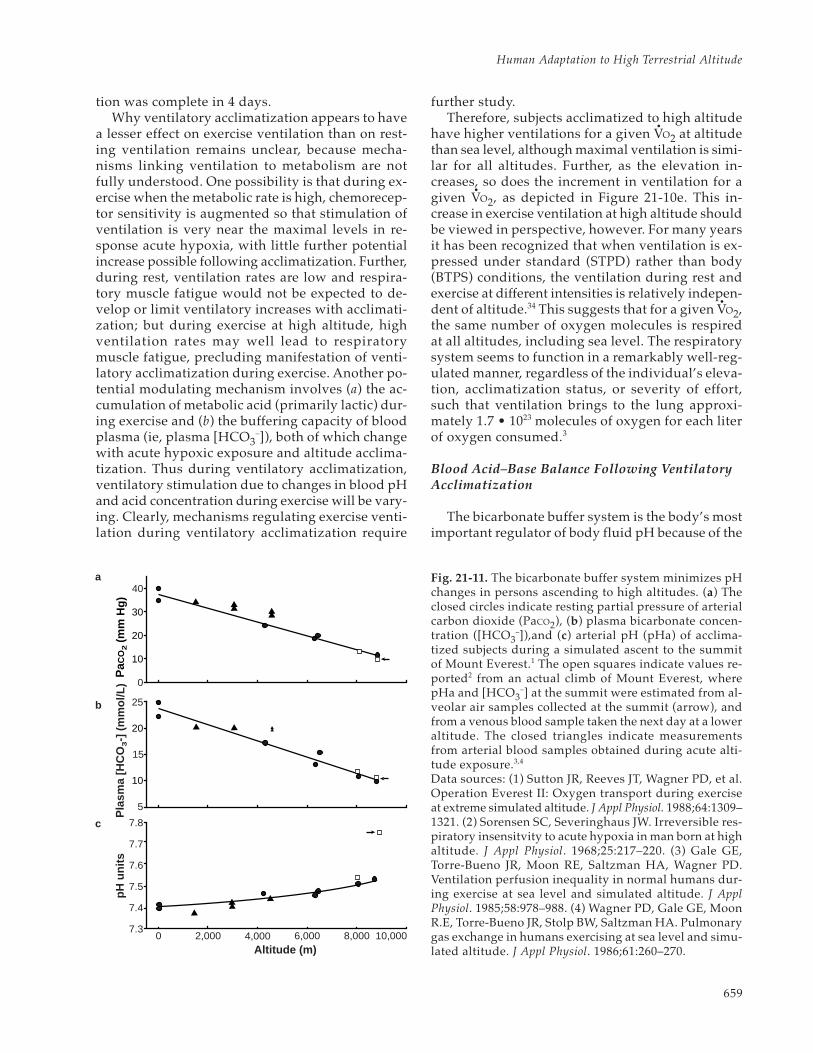
Fig. 21-11. The bicarbonate buffer system minimizes pHchanges in persons ascending to high altitudes. (a) Theclosed circles indicate resting partial pressure of arterialcarbon dioxide (PaCO2), (b) plasma bicarbonate concen-tration ([HCO3
–]),and (c) arterial pH (pHa) of acclima-tized subjects during a simulated ascent to the summitof Mount Everest.1 The open squares indicate values re-ported2 from an actual climb of Mount Everest, wherepHa and [HCO3
–] at the summit were estimated from al-veolar air samples collected at the summit (arrow), andfrom a venous blood sample taken the next day at a loweraltitude. The closed triangles indicate measurementsfrom arterial blood samples obtained during acute alti-tude exposure.3,4
Data sources: (1) Sutton JR, Reeves JT, Wagner PD, et al.Operation Everest II: Oxygen transport during exerciseat extreme simulated altitude. J Appl Physiol. 1988;64:1309–1321. (2) Sorensen SC, Severinghaus JW. Irreversible res-piratory insensitvity to acute hypoxia in man born at highaltitude. J Appl Physiol. 1968;25:217–220. (3) Gale GE,Torre-Bueno JR, Moon RE, Saltzman HA, Wagner PD.Ventilation perfusion inequality in normal humans dur-ing exercise at sea level and simulated altitude. J ApplPhysiol. 1985;58:978–988. (4) Wagner PD, Gale GE, MoonR.E, Torre-Bueno JR, Stolp BW, Saltzman HA. Pulmonarygas exchange in humans exercising at sea level and simu-lated altitude. J Appl Physiol. 1986;61:260–270.
10
20
30
40
0
PaC
O2
(mm
Hg)
0 2,000 4,000 8,000 10,000Altitude (m)
10
20
25
15
5
7.3
7.4
7.5
7.6
7.7
7.8
6,000
Pla
sma
[HC
O3-]
(m
mo
l/L)
pH u
nits
a
b
c
Medical Aspects of Harsh Environments, Volume 2
660
large body stores of bicarbonate and the link be-tween ventilation and PaCO2. Changes in blood pH,PaCO2, and bicarbonate concentration [HCO3
–] in-fluence each other, as described by Equation 11, alsoknown as the Henderson-Hasslebach Equation:
(11) pH = pK + log ([HCO3–] ÷ 0.03 • PCO2)
where [HCO3–] represents plasma bicarbonate con-
centration (in mmol/L), PCO2 is expressed in mmHg, and pK represents the equilibrium constant forthe formation of carbonic acid from CO2 and H2O,which is about 6.1 at body temperature. The equa-tion shows that if a fall in PaCO2 is not accompa-nied by an offsetting fall in plasma [HCO3
–], thenblood pH will rise. The decline in PaCO2 that occurswith ventilatory acclimatization during ascent tomoderate elevations (< 5,000 m) is accompanied bya fall in plasma [HCO3
–], which maintains higherblood pH values in acclimatized2,35 compared withunacclimatized36,37 subjects (Figure 21-11). Overtime, HCO3
– is eliminated from the body in theurine; however, the body stores of HCO3
– are quitelarge. For example, a 70-kg person living at sea levelwith plasma [HCO3
–] of 25 mEq/L, has approxi-mately 90 mEq [HCO3
–] in the blood, 260 mEq inthe interstitial fluid, and 700 mEq in the intracellu-lar fluid. Elimination of approximately 400 mEq ofHCO3
– to allow blood concentration to fall to 15mEq/L, the value normally seen after acclimatiza-tion at 4,300 m, requires 10 to 14 days.
In well-acclimatized subjects, the PACO2 andplasma [HCO3
–] continue to decrease with ascentto higher altitudes, but not sufficiently to prevent arise in pH. In fact, findings reported from AMREEsuggest that pH may rise extraordinarily high inpersons ascending to the summit of Mount Everest.2
During AMREE, a pH of 7.78 was calculated indirectlyfrom PACO2, which was determined by measuring (a)PCO2 in a subject’s alveolar air sample, obtainedshortly after he reached the summit (8,848 m), and (b)plasma [HCO3
–], which was determined from a bloodsample obtained at a lower altitude the followingday.38 In contrast, direct measurements of resting ar-terial pH in subjects participating in the OperationEverest II altitude chamber study35 averaged 7.56 atthe barometric pressure equivalent of the summit ofMount Everest (PB = 253 mm Hg). The extreme exer-tion required to actually reach the summit ofEverest, the nonsimultaneous sampling of bloodand alveolar air, and the substantially lower pHvalues in Operation Everest II subjects at the simu-lated summit raise questions about the validity ofextreme alkalotic arterial pH estimated from the
AMREE measurements. Figure 21-11 shows that thecalculated pH values reported from AMREE at theslightly lower elevation of 8,050 m, where the bloodand alveolar air were sampled at the same altitudeand time, fell close to the arterial pH values mea-sured directly at the equivalent pressure during theOperation Everest II study. However, a chamberstudy does not reproduce all the conditions of aclimb, so the issue of how high arterial pH can riseat high altitude remains open, pending direct mea-surements of arterial pH in subjects actually ascend-ing Everest.
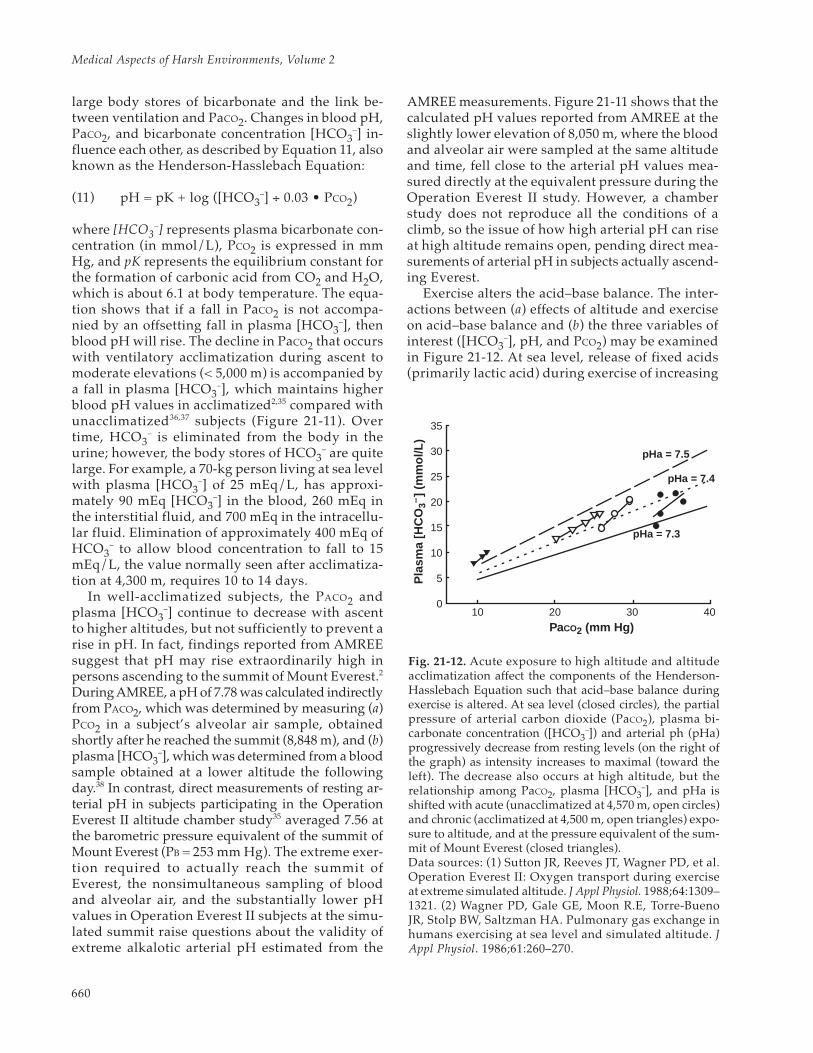
Exercise alters the acid–base balance. The inter-actions between (a) effects of altitude and exerciseon acid–base balance and (b) the three variables ofinterest ([HCO3
–], pH, and PCO2) may be examinedin Figure 21-12. At sea level, release of fixed acids(primarily lactic acid) during exercise of increasing
0
5
10
15
20
25
30
35
10 20 30 40
PaCO2 (mm Hg)
Pla
sma
[HC
O3–
] (m
mol
/L)
pHa = 7.5
pHa = 7.4
pHa = 7.3
Fig. 21-12. Acute exposure to high altitude and altitudeacclimatization affect the components of the Henderson-Hasslebach Equation such that acid–base balance duringexercise is altered. At sea level (closed circles), the partialpressure of arterial carbon dioxide (PaCO2), plasma bi-carbonate concentration ([HCO3
–]) and arterial ph (pHa)progressively decrease from resting levels (on the right ofthe graph) as intensity increases to maximal (toward theleft). The decrease also occurs at high altitude, but therelationship among PaCO2, plasma [HCO3
–], and pHa isshifted with acute (unacclimatized at 4,570 m, open circles)and chronic (acclimatized at 4,500 m, open triangles) expo-sure to altitude, and at the pressure equivalent of the sum-mit of Mount Everest (closed triangles).Data sources: (1) Sutton JR, Reeves JT, Wagner PD, et al.Operation Everest II: Oxygen transport during exerciseat extreme simulated altitude. J Appl Physiol. 1988;64:1309–1321. (2) Wagner PD, Gale GE, Moon R.E, Torre-BuenoJR, Stolp BW, Saltzman HA. Pulmonary gas exchange inhumans exercising at sea level and simulated altitude. JAppl Physiol. 1986;61:260–270.

661
Human Adaptation to High Terrestrial Altitude
intensity up to maximal effort causes pH to fall pro-gressively below the resting value with an accom-panying slight decrease in PaCO2 and plasma[HCO3
–]. At altitude, the release of fixed acids dur-ing exercise also results in acidosis. However, thechanges in pH during exercise at altitude are modu-lated by the respiratory hypocapnic alkalosis, lac-tate production and disposal, and the buffering ca-pacity of the blood, all of which begin changing onarrival at high altitude. With acute altitude expo-sure, the exercise-related metabolic acidosis is su-perimposed over the initial altitude-related respi-ratory alkalosis that slightly elevates resting pH. Foracclimatized subjects at altitude, the hypocapnicalkalosis is fully developed, as evidenced by themore marked fall in resting PaCO2 and plasma[HCO3
–], and the rise in resting pH. As at sea level,pH falls with progressively increasing exercise in-tensity up to maximal, accompanied by slight de-creases in PCO2 and [HCO3
–]. The important pointis that the lactic acid concentration in arterial bloodcorrelates closely with developing acidosis duringprogressively increasing exercise intensity to maximalboth at sea level and at high altitude (Figure 21-13).
Summary of Ventilation at High Altitude
The ventilatory changes experienced by lowlanderswho ascend to high altitudes and remain can besummarized as follows. As barometric pressurefalls, ventilation (the first step in the oxygen cas-cade) increases, raising alveolar oxygen tension andlimiting the fall in the PO2 pressure gradient fromthe inspired air to the alveolus. The increased ven-tilation at altitude is driven primarily by the in-creased carotid chemoreceptor activity. The in-creased ventilation also increases the removal ofcarbon dioxide from the blood. The resultinghypocapnic alkalosis, which accompanies the in-
creased ventilation, may be partially responsible fordelaying the full increase in ventilation (ie, ventila-tory acclimatization), which can require a week ormore to develop at moderately high altitudes. Ven-tilation (V
•E BTPS) during maximal exercise appears
to be similar at all altitudes, but the number of oxy-gen molecules that can be transported V
•E STPD de-
creases with altitude. Given the close relationshipof the number of oxygen molecules ventilated andthose taken up, then at low barometric pressure,ventilation is particularly important in limiting thefall in maximum exercise capacity.
Arterial pH
Art
eria
l Lac
tate
(m
mol
/L)
8
6
4
2
0
7.3 7.4 7.5 7.6
Fig. 21-13. Changes in arterial lactate concentration andarterial pH are closely related during progressive inten-sity exercise from rest to maximal, both at sea level andat high altitudes, even in acclimatized lowlanders exer-cising at extreme altitudes, when lactate concentrationsdo not increase much. The circles, squares, triangles, anddiamonds represent measurements that were made at sealevel and at simulated altitudes of 4,900, 6,100, and 7,620 m.Data source: Sutton JR, Reeves JT, Wagner PD, et al. Opera-tion Everest II: Oxygen transport during exercise at extremesimulated altitude. J Appl Physiol. 1988;64:Tables 2–5.
ALVEOLAR–ARTERIAL OXYGEN PRESSURE GRADIENT
The PO2 gradient from alveolus (PAO2) to artery(PaO2) has two components: (1) venous admixtureof arterial blood and (2) the oxygen diffusion gradi-ent from alveolus to the lung capillary blood. Al-though under normal circumstances, systemic arte-rial PO2 is only slightly less than the PO2 of bloodleaving a pulmonary capillary, certain physiologicalstates create a rapid capillary transfer that may notallow for anywhere near normal diffusion time. Thiseffect becomes increasingly apparent during exer-cise at altitude and can be quantitated by measuringthe difference between alveolar PO2 and systemicartery PO2 (PAO2 – PaO2), by convention this being
taken as pressure that drives diffusion. Systemic PaO2,which can easily be measured, is taken as a surro-gate for PO2 at the end of a capillary, which cannotbe measured. One characteristic of the PAO2 – PaO2shown in Figure 21-14 is that it increases with in-creasing oxygen uptake at all altitudes. However,the relative contribution to the PAO2 – PaO2 byvenous admixture versus diffusion changes withincreasing altitude.
The ODC is not, strictly speaking, a componentof the PAO2 – PaO2 gradient. However, the ODC de-fines the relationship between changes in PaO2,SaO2, and CaO2. The ODC is determined by the af-

Medical Aspects of Harsh Environments, Volume 2
662
finity of hemoglobin for oxygen, which varies withPaO2 as shown in Figure 21-15. The CaO2 is deter-mined by Equation 12:
(12) CaO2 = SaO2 • [Hb] • A
where CaO2 represents arterial oxygen content, SaO2represents the oxygen saturation of arterial blood,[Hb] represents arterial hemoglobin concentration,and the constant A defines the maximal amount ofoxygen that can bind to a unit of hemoglobin (thevalue of which varies among individuals from 1.34to 1.36 mL of oxygen per gram of hemoglobin). Theshape of the ODC allows SaO2 and CaO2 to fall mini-mally with the changes in PaO2 that occur duringthe initial ascent from sea level to altitudes around1,000 m. The changes in PaO2 that occur when as-cending higher, however, occur on the steeper por-tion of the ODC, and thus cause a disproportion-ately greater decline in SaO2 and CaO2. Thus, as wediscuss next, the shape of the ODC causes morepronounced pulmonary diffusion limitations andventilation–perfusion inequities during exercise ataltitude than at sea level.
Pulmonary Venous Admixture
Venous admixture (the mixing of non-reoxygenatedvenous blood with oxygenated blood) reduces theCaO2 and increases the PAO2 – PaO2 by two primarymechanisms. First, oxygen-depleted blood draining
Blood P O2 (mm Hg)
Blood O
2 Content (m
L/100 mL)
8,840 m
6,100 m
4,300 m
1,600 m
20100
80
60
40
20 4
8
12
16
20 40 60 80 100
% S
atur
atio
n of
Hem
oglo
bin
Sea Level
Fig. 21-15. The percentage of hemoglobin that is boundand combined with oxygen, and thus the amount of oxy-gen in the blood, is not linear over the physiological rangeof oxygen tension in the blood (blood PO2), as depictedin the classic oxygen–hemoglobin dissociation curve.
00 1
5
10
15
20
25
2 3 4
Diffusion
VE / Q
Sea Level
00 1
5
10
15
20
25
2 3 4
00 1
5
10
15
20
25
2 3 4
Diffusion
VO2 (L /min)
Diffusion
Total Difference Observed
Difference due to VE / Q
VE / Q
6,500 m
8,100 m
A -
a D
iffer
ence
(m
m H
g)
Fig. 21-14. The alveolar – arterial difference in the par-tial pressure of oxygen (PAO2 – PaO2) widens with increas-ing exercise intensity and oxygen consumption per unittime (V
•O2), both at (a) sea level and (b and c) high alti-
tude (6,100 m and 8,100 m, respectively). The PAO2 – PaO2can be partitioned into components of diffusion andvenous admixture. Venous admixture results from shunt-ing and ventilation–perfusion mismatch (V
•E/Q
•), with the
latter predominating during exercise or at high altitude.When the V
•E/Q
• component (open symbols) of the PAO2
– PaO2 accounts for less than the total PAO2 – PaO2 mea-sured (closed symbols), the difference represents the dif-fusion component. As exercise intensity increases, the dif-fusion accounts for increasingly more of the total PAO2 –PaO2. As elevation increases, the diffusion component be-comes significant at lower exercise intensities than at sealevel. Adapted with permission from Wagner PD, SuttonJR, Reeves JT, Cymerman A, Groves BM, Malconian MK.Operation Everest II: Pulmonary gas exchange during asimulated ascent of Mt Everest. J Appl Physiol. 1987;63:2354.
a
b
c

663
Human Adaptation to High Terrestrial Altitude
from the intrapulmonary bronchi veins into the pul-monary veins, a process referred to as shunt, mixeswith the oxygenated blood draining the pulmonarycapillaries. Second, blood flow and ventilation arenot uniformly distributed over even the normal lungat sea level, nor is the distribution of flow perfectlymatched to the distribution of ventilation. The ratioof the rates of ventilation and perfusion (V
•E/Q
•)
quantifies this inequality. Capillary blood perfusingpoorly ventilated lung (ie, lung units having a lowV•
E/Q•
) is inadequately oxygenated, which lowersPaO2 and contributes to the PAO2 – PaO2 at all altitudes.
At sea level, bronchial venous flow is normallyless than 1% of resting pulmonary capillary flow.Nevertheless, this small flow of poorly oxygenatedblood entering the pulmonary veins measurablydecreases the PO2 before the blood reaches the sys-temic arteries and is the major component of theapproximately 10-mm Hg PAO2 – PaO2 gradient atsea level. This is because pulmonary capillary bloodPO2 is on the flat part of the ODC, where small re-ductions in arterial content correspond to relativelylarge changes in PO2. In contrast, the lung capillaryPO2 at high altitude is on the steep part of the ODC,so while shunt from intrapulmonary bronchi mayreduce oxygen content similarly to the reduction atsea level, the corresponding reduction in PO2 issmaller, and it contributes relatively less to the PAO2– PaO2.37,39 Furthermore, during exercise, the in-crease in pulmonary capillary blood flow is muchgreater than the increase in shunt, so the relativecontribution of shunt to the venous admixture com-ponent of the PAO2 – PaO2 declines with exercise,both at sea level and at altitude.37,39 Thus, shunt con-tributes to the PAO2 – PaO2 during rest at sea level,but during exercise or at high altitude, the venousadmixture component of the PAO2 – PaO2 is pre-dominately due to V
•E/Q
• mismatch.
It is possible to estimate the contribution of V•
E/Q•
mismatch to the PAO2 – PaO2 using a complexmethod, the multiple inert gas elimination tech-nique, which involves inhalation of a mixture ofgases having different solubilities and measuringthese gases in exhaled air and arterial blood.40 TheV•
E/Q•
mismatch and the resulting PAO2 – PaO2 in-crease during exercise (see Figure 21-14). Even innormal healthy subjects at sea level, the contribu-tion of low V
•E/Q
• areas to the PAO2 – PaO2 increased
with increasing exertion, and at high altitude, thelow V
•E/Q
• areas still contribute to the PAO2 – PaO2
with exercise. Note in Figure 21-14 that with increas-ing V
•O2, the observed PAO2 – PaO2 exceeds that
which is accounted for by V•
E/Q•
mismatch, and thatthe exercise intensity V
•O2 at which this becomes ap-
parent decreases with increasing altitude. The dif-ference between the observed PAO2 – PaO2 and thatwhich can be accounted for by V
•E/Q
• mismatch is
assumed to represent a component of the PAO2 –PaO2 due to the diffusion limitation.39
Diffusing Capacity
Having reached the alveolus, the oxygen mol-ecule must diffuse across the alveolar–capillarymembrane and into the red blood cells in the pul-monary capillary blood. This diffusion occurs alongthe oxygen pressure gradient from alveolus toblood. Moving from upright to a supine posture,increasing ventilation, initiating exercise, and ex-posure to hypoxia all increase distension and re-cruitment of pulmonary microcirculation (arteri-oles, capillaries, and venules), increasing the lungsurface area for gas exchange, as does an exercise-induced increased microvascular pressure. Duringmaximal effort, lung diffusion capacity for oxygenis maximal (DLO2max). The DLO2max is proportionalto the maximal oxygen uptake (V
•O2max) divided
by the oxygen pressure gradient from alveolus(PAO2) to pulmonary capillary blood (PC’O2), asshown in Equation 13:
(13) DLO2max = k • [V•
O2max ÷ (PAO2 – PC’O2)]
where the constant k represents the oxygen conduc-tivity of the alveolar capillary and the red blood cellmembrane. However, membrane thickness, mem-brane surface area, and reaction of oxygen in thered blood cell are unlikely to be changed by mov-ing to high altitude. Therefore, during maximal ex-ercise in health, microvascular surface area and dif-fusing membrane thickness are likely to be similarat sea level and at altitude.
In humans, PC’O2 cannot be measured directly.However, if we assume that during exercise at sealevel and during rest and exercise at high altitude, thereduction in arterial content resulting from venous ad-mixture causes but little fall in the PaO2, then the PC’O2can be taken to be approximately equal to PaO2 underthose conditions. Therefore, subtracting the contribu-tion of V
•E/Q
• from the total PAO2 – PaO2 allows us to
estimate the contribution of diffusion, as describedabove and shown in Figure 21-14. As altitude in-creases, the relative contributions of shunt and V
•E/Q
•
to the PAO2 – PaO2 decrease, while the contribution ofdiffusion increases. Further, Figure 21-14 shows thatat sea level the diffusion limitation of the lung foroxygen transfer does not become apparent until oxy-gen uptakes exceeds 2.5 L/min, whereas at altitude,
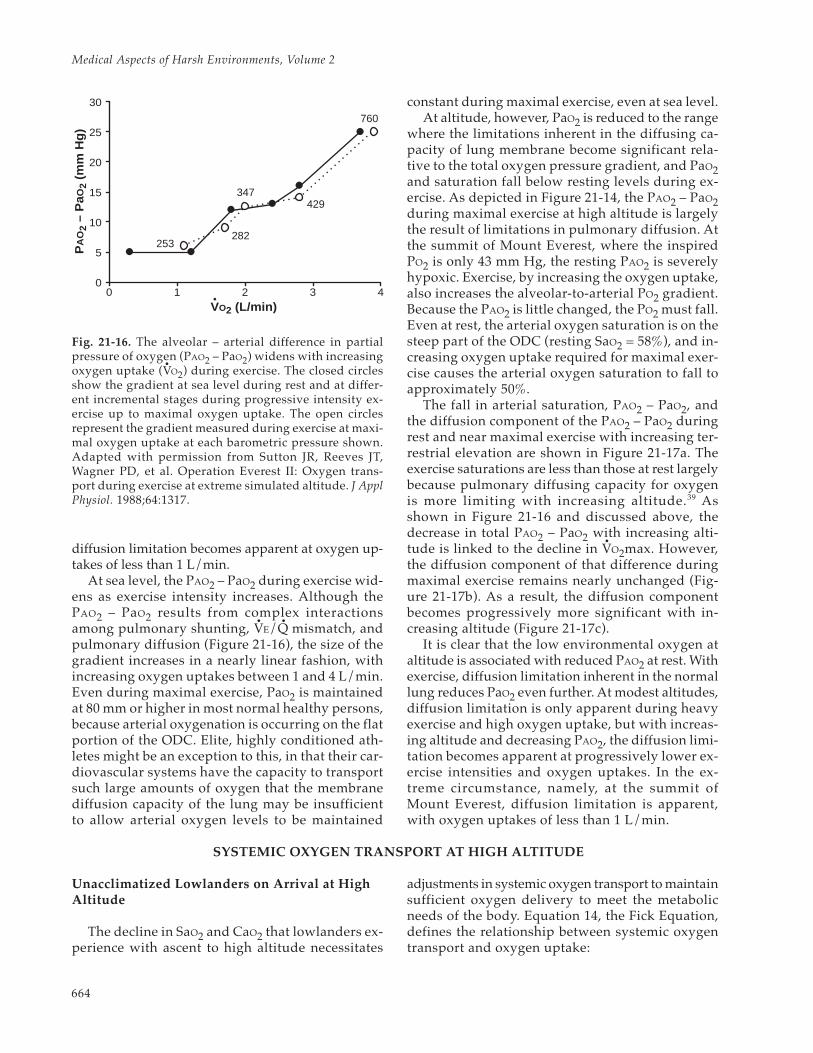
Medical Aspects of Harsh Environments, Volume 2
664
diffusion limitation becomes apparent at oxygen up-takes of less than 1 L/min.
At sea level, the PAO2 – PaO2 during exercise wid-ens as exercise intensity increases. Although thePAO2 – PaO2 results from complex interactionsamong pulmonary shunting, V
•E/Q
• mismatch, and
pulmonary diffusion (Figure 21-16), the size of thegradient increases in a nearly linear fashion, withincreasing oxygen uptakes between 1 and 4 L/min.Even during maximal exercise, PaO2 is maintainedat 80 mm or higher in most normal healthy persons,because arterial oxygenation is occurring on the flatportion of the ODC. Elite, highly conditioned ath-letes might be an exception to this, in that their car-diovascular systems have the capacity to transportsuch large amounts of oxygen that the membranediffusion capacity of the lung may be insufficientto allow arterial oxygen levels to be maintained
constant during maximal exercise, even at sea level.At altitude, however, PaO2 is reduced to the range
where the limitations inherent in the diffusing ca-pacity of lung membrane become significant rela-tive to the total oxygen pressure gradient, and PaO2and saturation fall below resting levels during ex-ercise. As depicted in Figure 21-14, the PAO2 – PaO2during maximal exercise at high altitude is largelythe result of limitations in pulmonary diffusion. Atthe summit of Mount Everest, where the inspiredPO2 is only 43 mm Hg, the resting PAO2 is severelyhypoxic. Exercise, by increasing the oxygen uptake,also increases the alveolar-to-arterial PO2 gradient.Because the PAO2 is little changed, the PO2 must fall.Even at rest, the arterial oxygen saturation is on thesteep part of the ODC (resting SaO2 = 58%), and in-creasing oxygen uptake required for maximal exer-cise causes the arterial oxygen saturation to fall toapproximately 50%.
The fall in arterial saturation, PAO2 – PaO2, andthe diffusion component of the PAO2 – PaO2 duringrest and near maximal exercise with increasing ter-restrial elevation are shown in Figure 21-17a. Theexercise saturations are less than those at rest largelybecause pulmonary diffusing capacity for oxygenis more limiting with increasing altitude.39 Asshown in Figure 21-16 and discussed above, thedecrease in total PAO2 – PaO2 with increasing alti-tude is linked to the decline in V
•O2max. However,
the diffusion component of that difference duringmaximal exercise remains nearly unchanged (Fig-ure 21-17b). As a result, the diffusion componentbecomes progressively more significant with in-creasing altitude (Figure 21-17c).
It is clear that the low environmental oxygen ataltitude is associated with reduced PAO2 at rest. Withexercise, diffusion limitation inherent in the normallung reduces PaO2 even further. At modest altitudes,diffusion limitation is only apparent during heavyexercise and high oxygen uptake, but with increas-ing altitude and decreasing PAO2, the diffusion limi-tation becomes apparent at progressively lower ex-ercise intensities and oxygen uptakes. In the ex-treme circumstance, namely, at the summit ofMount Everest, diffusion limitation is apparent,with oxygen uptakes of less than 1 L/min.
0 1 2 3 40
5
10
15
20
25
30
253282
347429
760
VO2 (L/min)
PA
O2
– P
aO2
(mm
Hg)
Fig. 21-16. The alveolar – arterial difference in partialpressure of oxygen (PAO2 – PaO2) widens with increasingoxygen uptake (V
•O2) during exercise. The closed circles
show the gradient at sea level during rest and at differ-ent incremental stages during progressive intensity ex-ercise up to maximal oxygen uptake. The open circlesrepresent the gradient measured during exercise at maxi-mal oxygen uptake at each barometric pressure shown.Adapted with permission from Sutton JR, Reeves JT,Wagner PD, et al. Operation Everest II: Oxygen trans-port during exercise at extreme simulated altitude. J ApplPhysiol. 1988;64:1317.
SYSTEMIC OXYGEN TRANSPORT AT HIGH ALTITUDE
Unacclimatized Lowlanders on Arrival at HighAltitude
The decline in SaO2 and CaO2 that lowlanders ex-perience with ascent to high altitude necessitates
adjustments in systemic oxygen transport to maintainsufficient oxygen delivery to meet the metabolicneeds of the body. Equation 14, the Fick Equation,defines the relationship between systemic oxygentransport and oxygen uptake:
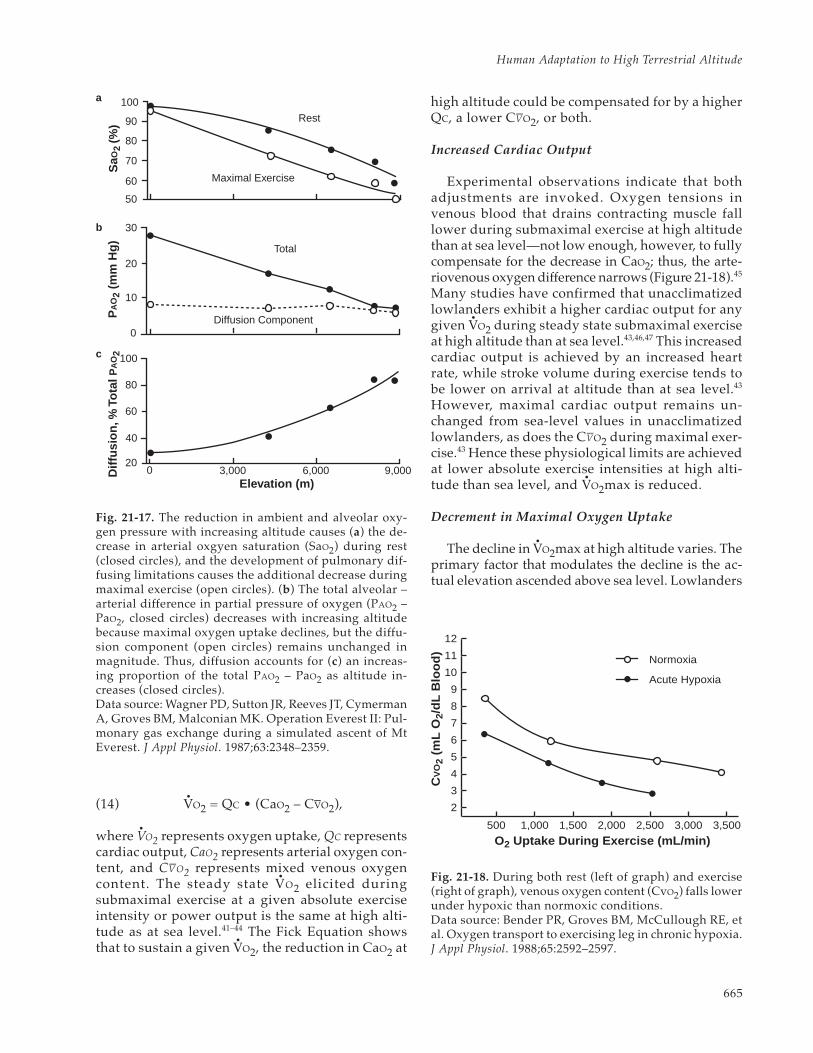
665
Human Adaptation to High Terrestrial Altitude
(14) V•
O2 = QC • (CaO2 – CV–O2),
where V•
O2 represents oxygen uptake, QC representscardiac output, CaO2 represents arterial oxygen con-tent, and CV–O2 represents mixed venous oxygencontent. The steady state V
•O2 elicited during
submaximal exercise at a given absolute exerciseintensity or power output is the same at high alti-tude as at sea level.41–44 The Fick Equation showsthat to sustain a given V
•O2, the reduction in CaO2 at
high altitude could be compensated for by a higherQC, a lower CV–O2, or both.
Increased Cardiac Output
Experimental observations indicate that bothadjustments are invoked. Oxygen tensions invenous blood that drains contracting muscle falllower during submaximal exercise at high altitudethan at sea level—not low enough, however, to fullycompensate for the decrease in CaO2; thus, the arte-riovenous oxygen difference narrows (Figure 21-18).45
Many studies have confirmed that unacclimatizedlowlanders exhibit a higher cardiac output for anygiven V
•O2 during steady state submaximal exercise
at high altitude than at sea level.43,46,47 This increasedcardiac output is achieved by an increased heartrate, while stroke volume during exercise tends tobe lower on arrival at altitude than at sea level.43
However, maximal cardiac output remains un-changed from sea-level values in unacclimatizedlowlanders, as does the CV–O2 during maximal exer-cise.43 Hence these physiological limits are achievedat lower absolute exercise intensities at high alti-tude than sea level, and V
•O2max is reduced.
Decrement in Maximal Oxygen Uptake
The decline in V•
O2max at high altitude varies. Theprimary factor that modulates the decline is the ac-tual elevation ascended above sea level. Lowlanders
20
40
60
80
100
0
10
20
30
0 3,000 6,000 9,000
Diffusion Component
Total
50
60
70
80
90
100
Maximal Exercise
Rest
Elevation (m)
Diff
usio
n, %
Tot
al
PA
O2
PA
O2
(mm
Hg)
SaO
2 (%
)
Fig. 21-17. The reduction in ambient and alveolar oxy-gen pressure with increasing altitude causes (a) the de-crease in arterial oxgyen saturation (SaO2) during rest(closed circles), and the development of pulmonary dif-fusing limitations causes the additional decrease duringmaximal exercise (open circles). (b) The total alveolar –arterial difference in partial pressure of oxygen (PAO2 –PaO2, closed circles) decreases with increasing altitudebecause maximal oxygen uptake declines, but the diffu-sion component (open circles) remains unchanged inmagnitude. Thus, diffusion accounts for (c) an increas-ing proportion of the total PAO2 – PaO2 as altitude in-creases (closed circles).Data source: Wagner PD, Sutton JR, Reeves JT, CymermanA, Groves BM, Malconian MK. Operation Everest II: Pul-monary gas exchange during a simulated ascent of MtEverest. J Appl Physiol. 1987;63:2348–2359.
O2 Uptake During Exercise (mL/min)
CV
O2
(mL
O2/
dL B
lood
)
500 1,000 1,500 2,000 2,500 3,000 3,500
12
11
10
9
8
7
6
5
4
3
2
Normoxia
Acute Hypoxia
Fig. 21-18. During both rest (left of graph) and exercise(right of graph), venous oxygen content (CvO2) falls lowerunder hypoxic than normoxic conditions.Data source: Bender PR, Groves BM, McCullough RE, etal. Oxygen transport to exercising leg in chronic hypoxia.J Appl Physiol. 1988;65:2592–2597.
a
b
c

Medical Aspects of Harsh Environments, Volume 2
666
experience no measurable decline in V•
O2max untilthey ascend above about 900 to 1,000 m, and only asmall decrement between 1,000 and 2,000 m abovesea level.48 Above 2,000 m elevation, the decrementaverages about 10% for every 1,000 meters as-cended.49,50 Although the average decrement inV•
O2max at any given altitude is predictable for agroup of subjects, the decrement varies consider-ably between individuals.51 For example, in a groupof 51 male sea-level residents, the decrement inV•
O2max at 4,300 m altitude compared with the dec-rement at sea level was normally distributed in arange from 9% to 54%, and averaged 27%.51
The physiological factors that account for thevariability in the decrement in V
•O2max experienced
at a given altitude are not fully understood.Intraindividual variability in hypoxic ventilatoryresponsiveness, hemoglobin affinity for oxygen,and body fluid movements are a few factors thatmight play a role. However, one factor in particu-lar, the individual’s level of aerobic physical fitness,has received considerable attention.50–53 As Fulcoand Cymerman point out in Chapter 22, PhysicalPerformance at Varying Terrestrial Altitudes, thedecrement in V
•O2max with ascent to high altitude
is more pronounced in aerobically fit, comparedwith less fit, persons. In fact, variability in aerobicfitness may account for as much as one third of thevariability in the altitude-induced decrement inV•
O2max.51 One explanation that has been postulatedfor this, although it is unproven, is that highly aero-bically fit persons exhibit relative hypoventilationduring maximal exercise,54 and their maximal car-diac outputs, hence maximal pulmonary capillaryblood flows, are higher and pulmonary capillarytransit times shorter than in less fit persons.55 Bothfactors could exaggerate pulmonary diffusion limi-tations and ventilation perfusion inequalities athigh altitude in fit compared with less-fit persons.
Acclimatization Effects on Systemic OxygenTransport
The initial physiological adjustments in the com-ponents of systemic oxygen transport (increasedcardiac output, tachycardia, etc) elicited whenlowlanders first ascend to high altitude occur at theexpense of increases in cardiac work, myocardialoxygen uptake, and coronary blood flow.56–58 Theseresponses increase cardiovascular strain and prob-ably contribute to the decreased endurance thatmost lowlanders experience when they arrive athigh altitude. However, in lowlanders who remainat high altitude and acclimatize, the acute responses
are progressively replaced by physiological adjust-ments that alleviate the increased demand on theheart while still allowing systemic oxygen transportrequirements of activity to be sustained.
Cardiac Output Declines
One of the more pronounced effects of altitudeacclimatization at moderate altitudes is a reductionin cardiac output. The acclimatization-induced re-duction in cardiac output is observable duringrest59–61 as well as during both submaximal59,61 andmaximal41,59,62 exercise. Most studies indicate thatthis reduction in cardiac output is more pronouncedthan the initial increase observed on arrival at highaltitude. Thus, for any given V
•O2, cardiac output is
not only lower after acclimatization than on arrivalat altitude but it is also lower than it was at sea levelbefore ascent (Figure 21-19). At altitudes between3,000 and 5,000 m, this adjustment first becomesobservable in as few as 2 days of acclimatization61,62
and continues to develop over the following 8 to 10days.41,59,61,62 Staging (ie, gradual ascent with stopsat intermediate altitudes) appears to blunt both theinitial increase in cardiac output and the subsequentdecline,47 and persons who continue ascending to veryextreme altitudes (> 6,000 m) do not appear to exhibita decline in cardiac output below sea-level values.63
21
18
15
12
9
6
0 1 2 3 4
Sea Level
4,350 m, day 10
Oxygen Uptake (L/min)
Car
diac
Out
put (
L/m
in)
Fig. 21-19. Following altitude acclimatization (closedsymbols), cardiac output during exercise is lower than itis at sea level (open symbols).Data source: Vogel JA, Hartley LH, Cruz JC, Hogan RP.Cardiac output during exercise in sea-level residents atsea level and high altitude. J Appl Physiol. 1974;36:169–172.

667
Human Adaptation to High Terrestrial Altitude
The reduction in cardiac output with altitudeacclimatization results primarily from reducedstroke volume and, to a lesser extent, alleviation ofthe exercise tachycardia exhibited on arrival at highaltitude.64 Stroke volume, both at rest and duringsubmaximal and maximal exercise, clearly declineswith altitude acclimatization, and the time coursefor this adjustment parallels the decline in cardiacoutput.59,61,62 On the other hand, as a comprehen-sive review64 details, some reports indicate no ef-fect of acclimatization on heart rate responses, whileothers indicate that the initial altitude-induced ta-chycardia abates. Differences in altitude, exposureduration, ascent profile, and individual variabilitycontribute to the disparate observations.64 Acclima-tization effects on heart rate may also vary withexercise intensity. Altitude-induced tachycardia hasbeen reported65 to be attenuated at high, near-maxi-mal intensities, but not at low intensities.
Conceivably, a depression in myocardial contrac-tility, decreased cardiac filling, or both could causethe decline in stroke volume. The possibility that ahypoxia-related decline in myocardial contractilityand function contributed to the decline in strokevolume that was postulated earlier by some inves-tigators60,61 is not consistent with the most recentexperimental observations. Lowlanders who arechronically exposed to very high altitudes exhibitno change in the cardiac filling pressure–strokevolume relationship,63 and their ejection fraction in-creases despite reduced ventricular volumes66 whenbreathing either hypoxic or normoxic air. Thus, areduction in cardiac filling is probably the princi-pal mechanism mediating the decrease in strokevolume with altitude acclimatization. The hemato-logical and hemodynamic adjustments experiencedas the lowlander acclimatizes to high altitude mayact to limit cardiac filling.
Development of Hemoconcentration
The lowlanders’ hematocrit and hemoglobin con-centration increase during the first 7 to 14 days ofaltitude acclimatization, concomitant with the de-cline in stroke volume. The increases in the hemat-ocrit and the hemoglobin concentration during thefirst 2 to 3 weeks at high altitude are sometimes mis-takenly attributed to an increase in circulating redblood cells, but that response does not develop un-til later in the acclimatization process. The early risein hematocrit and hemoglobin, in fact, results froma hemoconcentration in which plasma volume islost61,67–69 while erythrocyte volume remains un-changed69; thus blood volume decreases.61,67–69 At
moderate elevations (3,000–4,300 m), the magnitudeof this effect is modest, with plasma volume lossesreported averaging 250 to 500 mL61,67,69; but at higheraltitudes the loss of plasma volume is more pro-nounced.70 At face value, this hemoconcentrationappears to be the mechanism responsible for thedecline in stroke volume that is experienced aslowlanders acclimatize at altitude, because experi-mental manipulations that prevent the altitude-in-duced hemoconcentration also prevent the reduc-tion in stroke volume.71
Exactly how hemoconcentration exerts this effectremains unresolved, but several mechanisms couldbe acting to limit cardiac output and stroke volumein acclimatized lowlanders. A reduction in bloodvolume might reduce stroke volume, according tothe Frank-Starling curve, in which cardiac outputor stroke volume can be plotted in relation to enddiastolic volume. However, infusing 500 mL of dex-tran into two lowlanders acclimatized 10 days at3,100 m expanded blood and plasma volume topreacclimatization levels without restoring strokevolume during exercise.61 In contrast, when 450 mLof whole blood was removed from five lowlandersacclimatized at 4,300 m and replaced with Ringerslactate, hematocrit and viscosity returned topreacclimation levels without a change in bloodvolume, and stroke volume during exercise increasedback to preacclimatization levels.72 Horstman,Weiskopf, and Jackson suggested that the findingsthey reported were consistent with the developmentof a viscosity-related limitation to cardiac filling andstroke volume.72 However, erythrocyte infusion(also known as blood doping) experiments at sealevel demonstrate that hematocrit and viscosity in-creases that are comparable to changes that occurduring acclimatization at moderate altitude do notproduce a viscosity impairment of stroke volumeand cardiac output.73 The most plausible explana-tion for the changes in cardiac output and strokevolume during the first 2 weeks of altitude accli-matization is that the reduced CaO2 and partial pres-sure of venous oxygen (PvO2) on arrival at high al-titude cause a dilation of peripheral vasculaturewith concomitant elevation in cardiac output(metaboreflex), which is then reversed when theacclimatization-induced hemoconcentration raisesCaO2 and PvO2.
Arterial Oxygen Content Increases
Regardless of the precise mechanism for the re-duction in stroke volume and cardiac output inlowlanders remaining at altitude, the lower cardiac

Medical Aspects of Harsh Environments, Volume 2
668
output for a given oxygen uptake necessitates com-pensatory adjustments in systemic oxygen transportand delivery. The Fick Equation (see Equation 14above) indicates that an increased tissue oxygen ex-traction must accompany the reduction in cardiacoutput at a given oxygen uptake. This has been ex-perimentally demonstrated.45,60,74 Figure 21-20 showsthat during rest and submaximal exercise, the differ-ence between arterial and venous oxygen contents,which narrowed with ascent to altitude, widens afterabout 10 days of acclimatization. Following acclima-tization, the oxygen content of venous blood drain-ing active muscle during exercise at altitude is thesame45 or only slightly lower74,75 than it was before.Therefore, the key factor that enables systemic oxy-gen transport requirements to be achieved with lowercardiac output than before, for a given oxygen uptakeafter altitude acclimatization, is an increased oxygenextraction that is primarily due to an increased CaO2.
After 7 to 10 days of acclimatization, lowlanderssojourning at high altitude exhibit higher CaO2 dur-ing both rest and exercise. For example, Hannon andVogel76 observed that the average resting CaO2 ofsix lowlanders sojourning at 4,300 m increased by2.6 milliliters of oxygen per 100 milliliters of bloodbetween the 2nd and 14th day of altitude acclima-tization. Several physiological adjustments contrib-ute to this increase in CaO2 with acclimatization. As
described before and illustrated in Figure 21-21, ahemoconcentration develops over this same time,increasing hematocrit and owing to a decrease inplasma volume, while erythrocyte volume remainsunchanged.61,69 This hemoconcentration increasedhemoglobin concentration by 0.7 grams per 100milliliters of blood, accounting for about 25% of theincrease in CaO2 over that same time. The remainderof the increase in CaO2 observed in Hannon andVogel’s study76 was attributable to an increase in SaO2.
During the first week or so of acclimatization,lowlanders sojourning at high altitude experiencean increase in SaO2 measured during both rest andexercise. For example, in lowlanders ascendingfrom sea level to the summit of Pikes Peak (4,300m), resting SaO2 generally falls to 78% to 80% onarrival, after which it rises, reaching about 84% af-ter 3 to 4 days and 87% after 9 to 10 days.16,77,78 Ithas been generally accepted that the increase insaturation reflects the effects of the increase in ven-tilation that develops progressively over the firstfew days after arriving at high altitude (ventilatoryacclimatization). However, while resting SaO2
500 1,000 1,500 2,000 2,500 3,000
13
3,500 4,000
10
11
12
14
15
16
17
NormoxiaHypoxia, UnacclimatizedHypoxia, Acclimatized
Oxygen Uptake (mL/min)
CA
O2
– C
vO2
mL
O2/
dL B
lood
Fig. 21-20. For a given intensity of exercise and oxgyenuptake, extraction of oxgyen (the alveolar – venous oxy-gen contents, as measured in milliliters of oxygen perdeciliters of blood, or CAO2 – CvO2) decreases on arrivalat high altitude compared with at sea level, but with ac-climatization extraction increases above sea level values.Data source: Bender PR, Groves BM, McCullough RE, etal. Oxygen transport to exercising leg in chronic hypoxia.J Appl Physiol. 1988;65:2592–2597.
Blo
od V
olum
e (m
L)
0
2,000
4,000
6,000
Sea Level 3,100 (m)Day 10
Erythrocyte VolumePlasma Volume
Fig. 21-21. During the first 2 weeks of high-altitude ac-climatization, the mass of red blood cells does not change,but a modest decrease in the volume of plasma increasesthe hematocrit.Data source: Alexander JK, Hartley LH, Modelski M,Grover RF. Reduction of stroke volume during exercisein man following ascent to 3,100 m altitude. J Appl Physiol.1967;23:849–858.

669
Human Adaptation to High Terrestrial Altitude
reaches a plateau after about 8 days of acclimatiza-tion, SaO2 maintained during exercise continues torise between the 8th and 22nd day of acclimatiza-tion, despite the fact ventilation during exerciseremains the same over this period.77 Thus, the risein SaO2 that lowlanders experience as they acclima-tize to high altitude is only partially explained bythe effects of ventilatory acclimatization. A decreasedpulmonary capillary transit time secondary to thedecline in cardiac output with acclimatization (dis-cussed above) also contributes to an increase in SaO2in the acclimatizing lowlander, along with otheradjustments that may develop, such as a decreasedpulmonary diffusion limitation (increased diffus-ing capacity), improved V
•E/Q
•, and, as will be dis-
cussed below, a left shift in the ODC.While increased erythrocyte volume does not
account for the initial rise in hematocrit, hemoglo-bin concentration, and CaO2 that lowlanders expe-rience during their first 2 weeks at high altitude,69
an increased erythrocyte volume is manifested laterduring acclimatization.70,79 The time course for theincrease in erythrocyte volume has not been ad-equately investigated and remains unclear, al-though this appears to be one of the slower adjust-ments elicited during altitude acclimatization.70,79
No changes in erythrocyte volume are apparent inlowlanders after 8 days’ residence at 1,600 m,80 10days at 3,100 m,61 or 13 days at 4,300 m.69 However,Pugh81 observed a 33% increase in erythrocyte vol-ume in two lowlanders who had remained above5,800 m for at about 8 weeks and about a 17% in-crease in three other lowlanders who had residedbetween 4,650 and 5,800 m for 14 weeks. Pugh’s dataalso indicate that after 3 to 4 months at high alti-tude, some of the plasma volume lost during theinitial phase of acclimatization has been recovered.81
This blunts further increases in blood hemoglobinconcentration despite the expanding erythrocytevolume, and lowlanders who become well acclima-tized to altitude (4–6 mo, 4,000–5,800 m elevation)exhibit hemoglobin concentrations (17–20 mg/100mL blood) that are similar to those of healthy, na-tive-born, high-altitude residents.70 Thus, whileshort-term acclimatization brings about a relativelyrapid increase in arterial oxygen content by hemo-concentration, in long-term acclimatization, in-creased arterial oxygen content is sustained by ex-pansion of erythrocyte volume.
Oxyhemoglobin Dissociation Curve Shifts
In lowlanders who ascend to altitudes between1,800 and 4,500 m and remain, blood samples ob-
tained during rest demonstrate a decrease inhemoglobin’s affinity for oxygen. Blood P50 (the PO2when SaO2 is 50%) increases due to a rightward shiftin the ODC.82–84 This adjustment occurs within hoursafter arriving at high altitude83,84 and persists evenin lifelong high-altitude residents.82,83 The rightwardshift in the ODC at these moderately high altitudesrepresents the net effect of opposing factors. A risein the erythrocyte concentration of the glycolyticintermediate 2,3 diphosphoglycerate (2,3 DPG)mediates a rightward shift84 in the ODC. This effectmore than compensates for the tendency of bloodalkalosis and decreased PCO2 to shift the curve left-ward (the Bohr effect). Interestingly, it is the bloodalkalosis associated with increased ventilation thatappears to be the factor that stimulates 2,3 DPG toincrease at high altitude. Pharmacological interven-tion to maintain experimental subjects at an acidoticpH during altitude sojourns prevents the rise in 2,3DPG and the right shift in the ODC.84 Above about4,500 m, the Bohr effect becomes sufficient to over-come the 2,3 DPG effect on hemoglobin affinity foroxygen, and the ODC is shifted to the left.
Right shifts in the ODC facilitate oxygen unloadingin capillaries of active tissue, because decreased hemo-globin–oxygen affinity allows greater desaturation ata given blood PO2; whereas left shifts facilitate oxy-gen loading in the pulmonary capillaries, because in-creased hemoglobin–oxygen affinity allows highersaturation to be attained at given blood PO2. Whethera left or a right shift in the ODC confers an advantageor disadvantage to lowlanders sojourning at high al-titude appears to depend on the elevation ascendedand the intensity of activity. A theoretical analysis ofoptimal P50 suggests that up to moderate altitudes(PaO2 > ~ 75 mm Hg), a high P50 (ie, right-shifted ODC)allows a higher partial pressure of venous oxygen(PvO2) to be sustained, which facilitates oxygen un-loading in the tissues without compromising oxygenloading in the pulmonary capillaries, as the ODC atPaO2 higher than 75 mm Hg is relatively flat.83,85 Asaltitude increases and PaO2 decreases, the advantageof a high P50 for maintaining high PvO2 diminishes,and at altitudes where PaO2 is lower than 40 mm Hg,a lower P50 (left-shifted ODC) maintains the PvO2 at ahigher level. Thus, the right shift in the ODC that isexperienced when lowlanders sojourn at low alti-tudes, followed by the left shift as they ascend higher,both serve to optimize oxygen transport under theconditions in which the shifts occur.
Exercise-induced acidosis would increase the P50and shift the ODC rightward. During exercise,which increases oxygen extraction, the advantageof a left-shifted ODC becomes apparent at either

Medical Aspects of Harsh Environments, Volume 2
670
higher PaO2 or lower elevations, rather than dur-ing rest.85 As is discussed below, exercise-inducedshifts due to acidosis are exacerbated in unacclima-tized lowlanders on arrival at high altitude com-pared with sea level, and this effect abates after afew weeks of acclimatization. Thus, the rightwardshifts in the ODC may be pronounced when unac-climatized persons exercise at altitude, but the shiftswill be less pronounced after acclimatization.
Net Effects of Systemic Oxygen Transport Adjustments
During the first month or so at high altitude, thedecline in cardiac output and the increase in CaO2with acclimatization appear to offset each otherwith respect to the net effects on systemic oxygentransport during exercise. Whole-body V
•O2 during
steady state submaximal exercise at a given abso-lute intensity or power output at altitude is un-changed with acclimatization.78,86–88 The lowlander’sV•
O2max remains reduced to the same degree afterup to 3 weeks of acclimatization as it was on ar-rival at altitude,65,78,86,88,89 perhaps because the hy-povolemia and elevated viscosity that result fromhemoconcentration limit maximal cardiac output.
However, the hemoconcentration that rapidlyincreases CaO2 at the expense of decreased blood
volume and increased viscosity during short-termacclimatization is eventually replaced by expansionof erythrocyte volume, which sustains the increasedCaO2 with long-term acclimatization. The expandederythrocyte volume, in combination with a partial re-covery of lost plasma volume, restores normovolemiaor may even expand blood volume, and the increasein blood viscosity is to some degree alleviated. Ifthe hypovolemia and elevated viscosity associatedwith hemoconcentration are indeed the factors lim-iting stroke volume and cardiac output duringmaximal exercise for the first month or so thatlowlanders live at altitude, as some have sug-gested,72,73 then this secondary adaptation withlong-term (> 4 mo) sustaining of CaO2 with a morenormal blood volume and viscosity could amelio-rate that limitation, perhaps ultimately leading tosome recovery of V
•O2max. The reductions in
V•
O2max and maximal cardiac output at 4,350 mcompared with sea level are smaller for high-alti-tude natives,90 who are presumably fully acclima-tized, than they are for lowlanders acclimatized for10 days at 4,350 m,59 tending to support this sug-gestion, but confirmatory studies of maximal exer-cise responses in persons acclimatizing for sufficienttime (ie, > 4 mo) to fully develop the expansion oferythrocyte volume are required.
METABOLISM AT HIGH ALTITUDE
High-Altitude Weight Loss
Lowlanders who ascend to high altitude and re-main for more than a few days typically lose weight.The magnitude of weight loss observed varies con-siderably, with values reported in different investi-gations ranging from 80 to nearly 500 g/d.91 Thelarge range of weight losses observed undoubtedlyrelates to discrepancies among the studies with re-spect to such factors as hydration and dietary con-trol, rate of ascent, altitude attained, duration of ex-posure, and the activity level of subjects under inves-tigation. Both hypohydration and negative energybalance contribute to the body weight loss experi-enced by lowlanders sojourning at high altitude.91–94
Body Water Changes
Lowlanders usually experience an apparent pro-gressive reduction in total body water when theyascend to high altitude and remain.67,92,95 At moder-ate altitudes (eg, 3,500–5,000 m), the reduction inbody water is measurable after as few as 3 days andpersists for at least 12 days.67,92,95 Some92,95 have sug-
gested that this hypohydration causes the decreasein plasma volume described above, as well asdecreases in intracellular and extracellular fluidvolumes. However, in other studies, lowlanderssojourning at altitude reportedly experienced adecrease in plasma volume or extracellular fluidvolume69,80,96 without a change in total body water.These observations have been interpreted as sug-gesting that acclimatization causes a redistributionof fluid from extracellular to intracellular compart-ments, rather than just dehydration. Longitudinalstudies have not documented how intracellular andextracellular fluid volumes and total body waterrespond during altitude sojourns longer than 2weeks, but cross-sectional studies suggest that to-tal body water is not reduced in either lowlanderswho have been acclimatized at altitude for at least10 weeks97 or native-born, high-altitude residents.98
Both decreased water intake and increased wa-ter loss can affect water balance in lowlanders ac-climatizing to high altitude. The primary mecha-nisms for water loss include respiratory and cuta-neous evaporation and urine formation. It is widelybelieved that increased pulmonary ventilation ex-
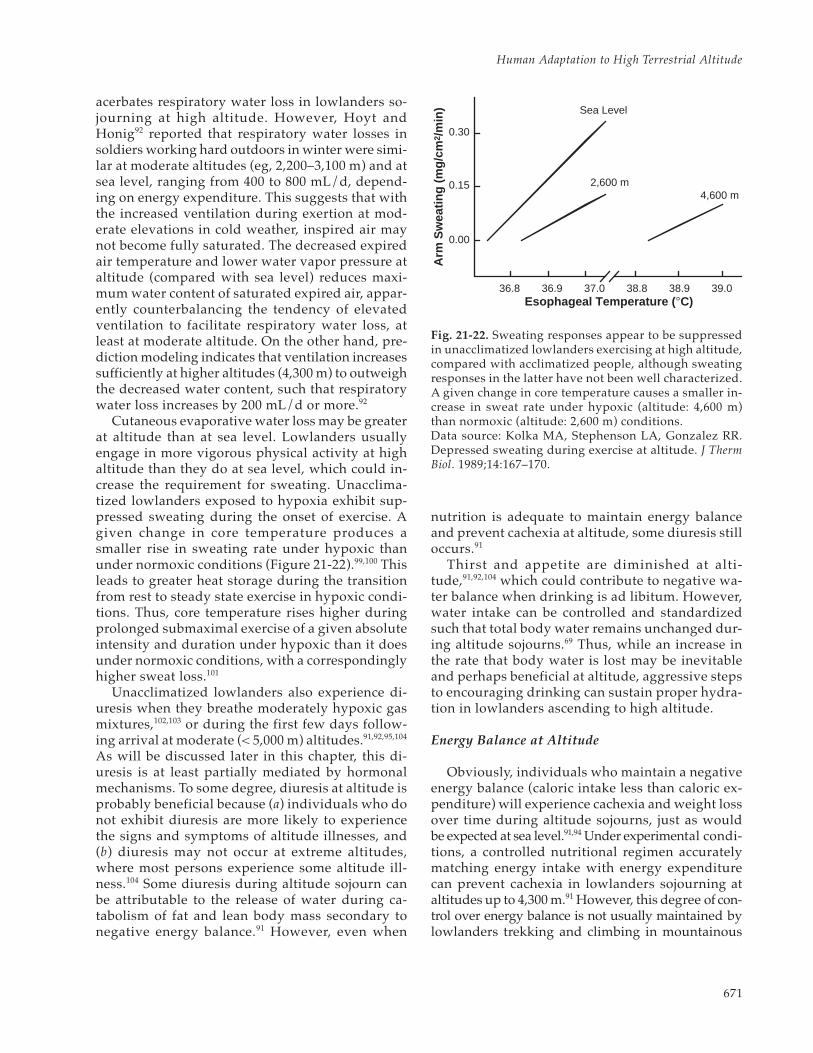
671
Human Adaptation to High Terrestrial Altitude
acerbates respiratory water loss in lowlanders so-journing at high altitude. However, Hoyt andHonig92 reported that respiratory water losses insoldiers working hard outdoors in winter were simi-lar at moderate altitudes (eg, 2,200–3,100 m) and atsea level, ranging from 400 to 800 mL/d, depend-ing on energy expenditure. This suggests that withthe increased ventilation during exertion at mod-erate elevations in cold weather, inspired air maynot become fully saturated. The decreased expiredair temperature and lower water vapor pressure ataltitude (compared with sea level) reduces maxi-mum water content of saturated expired air, appar-ently counterbalancing the tendency of elevatedventilation to facilitate respiratory water loss, atleast at moderate altitude. On the other hand, pre-diction modeling indicates that ventilation increasessufficiently at higher altitudes (4,300 m) to outweighthe decreased water content, such that respiratorywater loss increases by 200 mL/d or more.92
Cutaneous evaporative water loss may be greaterat altitude than at sea level. Lowlanders usuallyengage in more vigorous physical activity at highaltitude than they do at sea level, which could in-crease the requirement for sweating. Unacclima-tized lowlanders exposed to hypoxia exhibit sup-pressed sweating during the onset of exercise. Agiven change in core temperature produces asmaller rise in sweating rate under hypoxic thanunder normoxic conditions (Figure 21-22).99,100 Thisleads to greater heat storage during the transitionfrom rest to steady state exercise in hypoxic condi-tions. Thus, core temperature rises higher duringprolonged submaximal exercise of a given absoluteintensity and duration under hypoxic than it doesunder normoxic conditions, with a correspondinglyhigher sweat loss.101
Unacclimatized lowlanders also experience di-uresis when they breathe moderately hypoxic gasmixtures,102,103 or during the first few days follow-ing arrival at moderate (< 5,000 m) altitudes.91,92,95,104
As will be discussed later in this chapter, this di-uresis is at least partially mediated by hormonalmechanisms. To some degree, diuresis at altitude isprobably beneficial because (a) individuals who donot exhibit diuresis are more likely to experiencethe signs and symptoms of altitude illnesses, and(b) diuresis may not occur at extreme altitudes,where most persons experience some altitude ill-ness.104 Some diuresis during altitude sojourn canbe attributable to the release of water during ca-tabolism of fat and lean body mass secondary tonegative energy balance.91 However, even when
nutrition is adequate to maintain energy balanceand prevent cachexia at altitude, some diuresis stilloccurs.91
Thirst and appetite are diminished at alti-tude,91,92,104 which could contribute to negative wa-ter balance when drinking is ad libitum. However,water intake can be controlled and standardizedsuch that total body water remains unchanged dur-ing altitude sojourns.69 Thus, while an increase inthe rate that body water is lost may be inevitableand perhaps beneficial at altitude, aggressive stepsto encouraging drinking can sustain proper hydra-tion in lowlanders ascending to high altitude.
Energy Balance at Altitude
Obviously, individuals who maintain a negativeenergy balance (caloric intake less than caloric ex-penditure) will experience cachexia and weight lossover time during altitude sojourns, just as wouldbe expected at sea level.91,94 Under experimental condi-tions, a controlled nutritional regimen accuratelymatching energy intake with energy expenditurecan prevent cachexia in lowlanders sojourning ataltitudes up to 4,300 m.91 However, this degree of con-trol over energy balance is not usually maintained bylowlanders trekking and climbing in mountainous
Esophageal Temperature ( °C)
Arm
Sw
eatin
g (m
g/cm
2 /m
in)
0.30
0.15
0.00
36.8 36.9 37.0 38.8 38.9 39.0
Sea Level
2,600 m4,600 m
Fig. 21-22. Sweating responses appear to be suppressedin unacclimatized lowlanders exercising at high altitude,compared with acclimatized people, although sweatingresponses in the latter have not been well characterized.A given change in core temperature causes a smaller in-crease in sweat rate under hypoxic (altitude: 4,600 m)than normoxic (altitude: 2,600 m) conditions.Data source: Kolka MA, Stephenson LA, Gonzalez RR.Depressed sweating during exercise at altitude. J ThermBiol. 1989;14:167–170.
Medical Aspects of Harsh Environments, Volume 2
672
regions under expedition conditions.Several factors may disrupt energy balance in
lowlanders sojourning at altitude. Anorexia is com-mon among newcomers at altitude, especially thoseexperiencing symptoms of acute mountain sickness(AMS).91 Furthermore, appetite suppression canpersist even after acclimatization alleviates AMSsymptoms.94 Anecdotal observations105 and one limitedexperimental study106 suggest that in lowlanderssojourning at altitudes above 6,000 m, gastrointes-tinal fat absorption may deteriorate, which couldlimit effective energy intake. However, extensivecontrolled evaluations failed to confirm this obser-vation or demonstrate any evidence that gas-trointestinal fat, protein, or carbohydrate absorp-tion is impaired in lowlanders sojourning at more-moderate altitudes up to 5,500 m.91
An increase in energy expenditure may shiftoverall energy balance to negative in lowlanderssojourning at altitude. Energy expenditure requiredto sustain a given activity (at a given absolute in-tensity or power output) for a given duration is thesame at both altitude and sea level.107 However,lowlanders typically engage in strenuous activitieswhen they ascend to high altitudes, which increasestheir energy expenditure. Furthermore, the basalmetabolic rate (BMR) increases 7% to 17% over thefirst 2 to 3 days after arrival at high altitude, declin-ing thereafter.4,91,106,108,109 Some investigators reportthat the BMR returns to sea-level values by 7 to 20days,106,108 while others report a sustained eleva-tion.109 Butterfield91,109 reviewed these discrepantobservations and suggested that in those studies inwhich the BMR fell completely back to sea-levelvalues, negative energy balance and loss of meta-bolically active tissue had suppressed the subjects’BMRs, whereas when positive energy balance wasmaintained, the subjects’ BMRs remained somewhatelevated throughout the duration of the altitudesojourn.
Thus, a decrease in fluid and energy intake, anincrease in energy expenditure, or both can contrib-ute to the inability of lowlanders sojourning at highaltitude to maintain proper hydration and energybalance in situations where diet is ad libitum anduncontrolled. The magnitude and composition (ie,water, fat, lean tissue) of the weight loss at altitudewill depend on the severity and duration of peri-ods of negative water and energy balance. It is, how-ever, possible to institute countermeasures (eg, nu-tritional supplementation, enforced eating anddrinking regimens) that can ameliorate these effects,minimize dehydration and cachexia, and sustain
body mass during altitude sojourns, at least at mod-erate elevations below 5,000 m.
Energy Metabolism During Exercise at HighAltitude: The Lactate Paradox
The energy demands of contracting skeletalmuscle are supplied by the breakdown of biochemi-cal compounds containing high-energy phosphatebonds. The metabolic processes involved in thebreakdown and regeneration of these high-energyphosphate compounds during exercise undernormoxic conditions are reviewed in detail else-where.110–117 This section of the chapter will consider(1) the pronounced effects that hypoxia and altitudeacclimatization have on energy metabolism duringexercise, and (2) how these effects contribute tochanges in physical work capacity and performanceof lowlanders sojourning at high altitude.
The collective manifestation of the effects of hy-poxia and subsequent altitude acclimatization onenergy metabolism during exercise is a phenom-enon referred to as the “lactate paradox.” This phe-nomenon, first reported by Dill118 and subsequentlyconfirmed by Edwards,119 is characterized by higherblood lactate concentrations during exercise at alti-tude than at sea level in unacclimatized persons,but lower blood lactate levels—sometimes evenlower than at sea level—in acclimatized personsexercising at altitude. If it is assumed that the hy-poxia accelerates blood lactate accumulation inunacclimatized persons exercising at altitude, viaPasteur’s effect, then a paradox arises in explain-ing the decline that acclimatized persons exhibit inlactate accumulation during exercise at high alti-tude since hypoxia continues unrelieved.
Accelerated Glycolytic Metabolism BeforeAcclimatization
In one of the earliest studies of altitude effectson blood lactate, Edwards119 observed that restingconcentrations of unacclimatized lowlanders werethe same on their first day at high altitude (2,810 m)as at sea level, whereas postexercise concentrationswere higher at altitude, despite the fact that themetabolic rate during exercise was the same as atsea level for a given power output. Many subse-quent studies have repeated these observations.Hypoxia (rather than hypobaria or other stressesassociated with the mountainous environment)causes the higher blood lactate accumulation at al-titude, because the same effects can be produced in

673
Human Adaptation to High Terrestrial Altitude
hypobaric decompression chambers120–123 or bybreathing hypoxic gas mixtures under normobaricconditions.124,125
The elevation ascended (ie, the magnitude ofhypoxia) and the metabolic rate modulate the alti-tude effect on blood lactate responses to exercise.In general, the increment in lactate accumulationduring exercise becomes greater at a given altitudewith increasing exercise intensity,122,126 and the alti-tude-induced increment in lactate accumulation atany particular exercise intensity becomes greater asthe elevation increases and PIO2 falls.123,125–127 Thus,elevations in resting lactate concentrations are notobserved unless unacclimatized persons are acutelyexposed to altitudes above 4,600 m,120,121 which isfairly rare outside of experimental circumstances.At moderate elevations (2,000 to 4,500 m), bloodlactates of unacclimatized lowlanders are similar tosea-level values during rest or low intensity exer-cise, but when V
•O2 exceeds about 1.5 L/min, an el-
evation in lactate concentration becomes appar-ent.122,126,127 Lactate concentration in unacclimatizedpersons following maximal exercise is the same athigh altitude as at sea level, but because of the re-duction in maximal work capacity at altitude, maxi-mal lactate concentrations are achieved at lower
power outputs.78,124,126,128–131
Interestingly, the altitude effect just described isnot observed when lactate concentrations are com-pared at the same relative intensity (ie, at the samepercentage of V
•O2max) (Figure 21-23). Hermansen
and Saltin126 first observed this phenomenon, butothers78,122 have subsequently confirmed that al-though blood lactate concentrations in unacclima-tized lowlanders exercising on arrival at high alti-tude or during acute hypoxic exposure were higherthan during normoxic exercise for a given absoluteintensity, lactate concentrations are similar whenexercise of the same relative intensity is compared.A similar relationship has been observed for theeffect of hypoxia on muscle lactate concentrationsduring short exercise bouts122 and during longer(10–30 min) steady state exercise.89,132 Further, theso-called “lactate threshold” during progressive-intensity exercise occurs at a lower power outputand V
•O2 in unacclimatized lowlanders at 4,200 m
simulated altitude than in normoxia; however, thisthreshold, expressed as relative exercise intensity,occurred at about 50% V
•O2max at both simulated
high altitude and sea level.131
The increased blood lactate accumulation duringhypoxic exercise reflects increased lactate release
8�
6�
4�
2�
0
8�
6�
4�
2�
00 1 2 3 4
Sea Level�4,300 m, day 1�4,300 m, day 9
20 40 60 80 100L/min % Maximum
Oxygen Uptake
Blo
od L
acta
te (
mm
ol/L
) Blood Lactate (m
mol/L)
Sea Level�4,300 m, day 1�4,300 m, day 9
Fig. 21-23. The effects of high altitude on blood lactate accumulation during exercise differ, depending on whethercomparisons are made at a given absolute or at a relative exercise intensity. (a) For a given absolute exerciseintensity, lactate accumulation is accelerated in lowlanders on arrival at high altitude, as compared with sea level.(b) In contrast, lactate accumulation in unacclimatized lowlanders exercising at a given percentage of maximumoxygen uptake (V
•O2max) is the same at sea level and on arrival at high altitude. Regardless of whether compari-
sons are made of similar absolute or relative intensities, following 1 to 3 weeks of altitude acclimatization, areduction in lactate accumulation during exercise is apparent. Because the lactate accumulation is blunted withaltitude acclimatization while the hypoxia persists, this adaptation is referred to as the “lactate paradox” by manyaltitude researchers.Data source: Young AJ, Sawka MN, Boushel R, et al. Erythrocyte reinfusion alters systemic O2 transport duringexercise at high altitude. Med Sci Sports Exerc. 1995;27:S109.
a b

Medical Aspects of Harsh Environments, Volume 2
674
from active muscle rather than a decrease in lactateclearance. Rowell and colleagues133 showed thathepatic blood flow increased approximately 10%and hepatic lactate extraction (ie, arterial–hepaticvenous lactate difference) increased 5-fold whensubjects performing steady state submaximal exer-cise were switched from a normoxic to a hypoxic(FIO2 ~ 0.11) breathing mixture. Thus, lactate up-take by the liver (and probably also by inactive skel-etal muscle) is greater during exercise under acutehypoxic conditions than during normoxia. Benderand colleagues134 observed, on the other hand, an80% increase in leg muscle lactate release (femoralarterial–femoral venous difference multiplied byfemoral blood flow) during steady state exercisewhile breathing hypoxic (PIO2 = 83 mm Hg), as com-pared with normoxic, air mixtures. More recently,Brooks and colleagues135 measured simultaneousrates of appearance and removal of blood lactateduring exercise at sea level and high altitude, andconcluded that both were exaggerated on arrival athigh altitude.
Muscle lactate efflux during exercise is increasedby acute hypoxia.134 Muscle lactate efflux increasesduring exercise because the rate that lactate appearsin muscle exceeds the capacity of the muscle to oxi-dize the lactate. The accelerated muscle lactateefflux in unacclimatized lowlanders exercising un-der hypoxic conditions could reflect an increase inmuscle lactate production, a decrease in lactate oxi-dation within the muscle, or both. The effects ofacute hypoxic exposure on muscle lactate produc-tion and oxidation have not been directly measuredindependent of one another. However, lactic acidformation during exercise is probably acceleratedunder conditions of acute hypoxia. Lactate dehy-drogenase activity is stimulated by increasing cy-tosolic nicotinamide adenine dinucleotide (reducedform, NADH) availability, and total muscle NADHconcentration increases more during exercise withrespiratory hypoxia than with normoxia.136 Whethermitochondrial hypoxia per se is directly responsiblefor the accelerated muscle NADH accumulationremains controversial.137 Further, the rate of lactateformation is closely linked to the overall rate of gly-colysis due to the mass-action effect of pyruvateaccumulation, and there is evidence that muscleglycolysis is accelerated during exercise with acutehypoxic exposure compared with normoxic exercise.
Uptake and clearance of blood glucose by activemuscle were observed to increase more on the dayof arrival at high altitude than during the same ex-ercise at sea level138; however, the investigatorsquestioned whether the increase was sufficient to
entirely account for the concomitant increase inblood lactate.135 Other studies have investigated theeffects of hypoxia or acute high-altitude exposureon muscle glycogenolysis during exercise in unac-climatized lowlanders. Young and colleagues89 ob-served no difference in muscle glycogen utilizationwhen unacclimatized lowlanders exercised at thesame relative intensity (85% V
•O2max) for 30 min-
utes at sea level and at 4,300 m simulated altitude.In those experiments, however, absolute poweroutput was lower in the hypoxic than in thenormoxic experiment to offset the reduction inV•
O2max and to maintain relative intensity constantfor both trials.89 This led to the suggestion thatmuscle glycogenolysis would have been greaterunder acute hypoxic conditions than normoxia ifthe exercise had been done at the same absolutepower output,49 but in subsequent experiments,muscle glycogenolysis was found to be the same oreven slightly less during 45 minutes of exercise atgiven absolute exercise intensity on the first day athigh altitude as at sea level.139 Thus, the acceleratedlactate accumulation exhibited by unacclimatizedlowlanders exercising at high altitude may reflectan accelerated muscle glycolytic rate fueled by en-hanced uptake of glucose by active muscle.
The accelerated muscle glycolysis and lactateaccumulation in unacclimatized lowlanders exer-cising on arrival at high altitude is usually attrib-uted to Pasteur’s effect. That is, the decreased CaO2at high altitude is thought to cause muscle hypoxia,which, in turn, limits oxidative energy productionand necessitates an increase in glycolytic metabo-lism to satisfy the adenosine 5'-triphosphate (ATP)requirements of muscle contraction.140 However,experimental findings suggest that this may not bethe actual mechanism for the increased lactate ac-cumulation. For one thing, compensatory mecha-nisms increase blood flow to active muscle whenCaO2 is reduced, allowing the same oxygen deliv-ery and uptake by the muscle to be maintained dur-ing exercise at a given absolute intensity under bothacute hypoxic conditions and at sea level.45,127,141
Furthermore, if oxygen availability limited aerobicmuscle metabolism during exercise in hypoxic envi-ronments, then V
•O2 during steady state submaximal
exercise at a given power output should be reducedat high altitude compared with sea level, which itis not. Lastly, as depicted in Figure 21-24, net lac-tate release by the muscle at a given level of oxy-gen delivery was greater under acute hypoxic thannormoxic conditions.134
Muscle glycogen breakdown and lactate accumu-lation during exercise could be accelerated during

675
Human Adaptation to High Terrestrial Altitude
acute hypoxic exposure by mechanisms other thantissue oxygen lack. Experiments with animals indi-cate that epinephrine stimulates glycolysis in con-tracting fast-twitch muscle fibers, even at exerciseintensities that are otherwise too low to elicit gly-cogenolysis in the absence of epinephrine.142 Circulat-ing epinephrine levels of unacclimatized lowlandersexercising under acute hypoxic conditions are elevated,compared with the levels in normoxic conditions,and the elevation in epinephrine concentrations iscorrelated with the elevation in lactate accumula-tion.143 Thus, elevated epinephrine levels in unac-climatized lowlanders exercising at altitude maystimulate muscle glycogenolysis, particularly infast-twitch (type II) fibers, which have a greatercapacity for glycolysis and lactic acid productionthan slow-twitch (type I) fibers.
Glycogen Sparing With Altitude Acclimatization
Changes in blood lactate responses to exercisewere the first reported indication that altitude ac-climatization affected muscle metabolism. As men-tioned, Edwards119 reported that acclimatized (6 wk)
subjects exercising at 2,810 m exhibited the same orsmaller increments in blood lactate as during sea-level exercise at the same power output. Shortlythereafter, Dill and colleagues118 reported similarobservations, and many subsequent investigatorshave confirmed and extended these findings.
The observation that blood lactate concentrationsare lower at altitude than at sea level when accli-matized lowlanders exercise maximally78,128,144–146
has generated some controversy. Because the reduc-tion in V
•O2max at altitude persists even after accli-
matization, those lower blood lactate values maysimply reflect the lower maximal power outputsachieved and reduced exercise durations ratherthan a metabolic adaptation.49 This explanation isconsistent with observations that the reduction inlactate accumulation during maximal exercise ataltitude after acclimatization is associated with areduced glycolytic flux unrelated to any metabolicimpairment due to substrate (ie, glycogen, glucose)availability146 or inhibition of maximal glycolytic orglycogenolytic enzyme activity.147 That acclimatizedsubjects achieve the same maximal lactate concen-trations 48 hours after returning to sea level as be-fore ascent is thought to confirm the absence of anymetabolic adaptation.147 One suggestion146 is that thecontractile apparatus does not become as fully ac-tivated during maximal exercise at altitude after ac-climatization as during maximal exercise at sealevel. However, Grassi and colleagues145 found thatin acclimatized lowlanders performing maximalexercise at 5,050 m, acute restoration of normoxiaenabled the subjects to attain higher power outputsthan while breathing ambient air, but maximal lac-tate levels did not increase. Collectively, these find-ings suggest that in acclimatized persons exercis-ing at high altitude, a central fatigue mechanismmay limit maximal muscle contractile activity, whileanother mechanism may limit maximal rates of gly-cogenolytic/glycolytic metabolism.
The lactate responses to steady state submaximalexercise also change with acclimatization. Maher,Jones, and Hartley132 observed that plasma lactateconcentrations of sea-level residents did not in-crease as much during 20 minutes of exercise at 75%V•
O2max on day 12 of residence at 4,300 m as on thesecond day at high altitude, or at sea level. Thatblood lactate accumulation during prolongedsteady state submaximal exercise decreases withaltitude acclimation has been confirmed in manysubsequent studies.89,131,134,135,148,149
The effect of altitude acclimatization on lactateaccumulation during exercise probably reflects adecrease in lactate production and release into the
Arterial O 2 Delivery (mL/min)200 400 600 800 1,000 1,200
Net
Lac
tate
Rel
ease
(m
mol
/min
)
0
2
4
6
8
10
12
NormoxiaAcute Hypoxia
Fig. 21-24. Net lactate release from muscle during exer-cise (ie, the product of the muscle blood flow rate andthe arterial – venous lactate concentration difference) isgreater during hypoxia (squares) than normoxia (circles)for any given rate of arterial oxygen delivery to themuscle. This indicates that the mechanism for theaccleration in lactate accumulation during exercise athigh altitude is not a simple Pasteur effect.Data sources: (1) Bender PR, Groves BM, McCulloughRE, et al. Oxygen transport to exercising leg in chronichypoxia. J Appl Physiol. 1988;65:2592–2597. (2) Bender PR,Groves BM, McCullough RE, et al. Decreased exercisemuscle lactate release after high altitude acclimatization.J Appl Physiol. 1989;67:1556–1462.

Medical Aspects of Harsh Environments, Volume 2
676
blood rather than an increase in metabolic clearance.Studies involving infusion of radioactively labeledmetabolites demonstrate decreases in both lactateremoval from the blood and metabolic clearancefollowing altitude acclimatization, secondary to adecrease in the rate of lactate appearance in theblood. This observation (combined with earlier find-ings that net lactate release from muscle,134 musclelactate accumulation,148 and the decrease in musclepH139,149 during submaximal exercise at altitude areall less pronounced after acclimatization, whereaspyruvate oxidation appears unchanged139) indicatesthat the lower lactate concentrations reflect a de-creased glycolytic production of lactate in contract-ing muscle.
Indeed, experimental evidence confirms that al-titude acclimatization enables a decreased muscleglycogenolysis during exercise. Young and col-leagues89 measured muscle glycogen utilization ofsea-level residents during 30 minutes of exercise at85% V
•O2max at sea level, during the first 2 hours at
a simulated altitude of 4,300 m, and again after 18days of acclimatization at 4,300 m; the two altitudetrials were at the same absolute intensity. Muscleglycogen utilization and blood lactate accumulationduring exercise at high altitude before acclimatiza-tion were the same as at sea level, but were bothreduced after 18 days of altitude acclimatization.89
Green and colleagues139 confirmed and extendedthose findings using a similar altitude protocol butemploying the same absolute exercise intensity forall three trials.
The mechanism enabling the glycogen-sparingeffect of altitude acclimatization is not fully under-stood. Young and colleagues89 originally suggestedthat an increase in fat oxidation during exercisemight provide the energy to enable a decreasedmuscle glycogenolysis. This speculation was basedon differences observed in blood–free fatty acid and-glycerol concentrations during exercise at sea leveland at altitude. However, while subsequent stud-ies employing strict dietary control and more-pre-cise approaches to measuring fat metabolism haveconfirmed the glycogen-sparing effect of altitudeacclimatization,139 the most current findings dem-onstrate that muscles, in fact, decrease utilizationof fat as an energy substrate following altitude ac-climatization.150 On the other hand, uptake andclearance of blood glucose by muscle during exerciseat altitude is greater following acclimatization, indi-cating that increased availability of glucose may per-mit sparing of glycogen stores within the muscle.131
The glycogen-sparing adaptation appears to bedue to different mechanisms than the metabolic
adaptation resulting from chronic aerobic endur-ance-type training. In the case of endurance train-ing, increased oxidative enzyme activity in skeletalmuscle appears to account, at least in part, for meta-bolic adaptations to physical training at sea level.However, humans acclimatized for 3 weeks at 4,300m exhibited no change in hexokinase, glycogenphosphorylase, lactate dehydrogenase, malate de-hydrogenase,149 or citrate synthetase (unpublishedobservations from this laboratory—AJY) activitiesin the vastus lateralis muscle. Similarly, during a40-day altitude exposure simulating a progressiveascent to the summit of Mount Everest (282 mmHg), eight male subjects exhibited no change invastus lateralis enzyme activities of 3-hydroxyacylCoA dehydrogenase, pyruvate kinase, or alpha-glycerophosphate dehydrogenase, decreases in suc-cinic dehydrogenase, and citrate synthetase.147 Thus,the changes in metabolic responses to exercise ob-served after 2 to 3 weeks of altitude acclimatiza-tion do not appear to be due to changes in muscleglycolytic or oxidative enzyme activities.
A progressive rise in resting plasma norepineph-rine with unchanged epinephrine occurs during thesame time frame that the aforementioned metabolicadaptations to high altitude take place.148,151 Thisprompted Young and colleagues89 to speculate thatincreased sympathetic nervous activity mediatedthose adaptations, based on their conclusion thatthe glycogen-sparing effect of altitude acclimatiza-tion had resulted from increased fatty acid mobili-zation and subsequent oxidation by muscle, becauseat sea level, increased sympathetic activity stimu-lates lipolysis. More-recent observations, however,demonstrate that an increased utilization of fattyacids does not necessarily accompany the reductionin glycogen utilization and lactate accumulationthat occur with altitude acclimatization.148,150 Anotherpossibility is that chronically elevated circulatingnorepinephrine levels during altitude acclimatiza-tion induces a decrease in the number or sensitiv-ity, or both, of muscle β2-adrenergic receptors. Car-diac β2-adrenergic receptor density and sensitivityin lowlanders declines during altitude acclimatiza-tion.152,153 Stimulation of β2-adrenergic receptors inmuscle activates glycogenolysis, so down-regula-tion of these receptors could blunt glycogenolysisand lactate accumulation during exercise. However,β2-adrenergic blockade with propranolol duringaltitude acclimatization does not prevent the gly-cogen-sparing adaptation.148
These findings suggest that chronic β2-adrener-gic stimulation during altitude acclimatization maynot cause the reduction in glycogen utilization and

677
Human Adaptation to High Terrestrial Altitude
lactate accumulation during exercise. However, thisis not to say that changes in β2-adrenergic stimula-tion play no role in the changes in muscle energymetabolism induced by altitude acclimatization.Epinephrine release into the blood during exercise,which is greatly exaggerated on arrival at high alti-tude compared with that at sea level, is blunted fol-lowing 2 to 3 weeks of acclimatization.143,148 As de-scribed above, the increase in lactate accumulationduring exercise that unacclimatized lowlandersexhibit on arrival at high altitude is closely corre-lated with the more pronounced increment in epi-nephrine levels. Thus, a blunting of epinephrinerelease into the blood appears to be the most likelymechanism by which muscle glycogenolysis andlactate accumulation during exercise at high alti-tude could be diminished following acclimatization,but this requires experimental verification.
Endocrine Responses at High Altitude
The preceding section described how epineph-rine, and perhaps norepinephrine, appeared tomediate the effects of altitude acclimatization onglycogenolysis and lactate accumulation duringexercise. While the catecholamines appear to playa principal role in the mechanism by which adjust-ments in energy metabolism occur during altitudeacclimatization, other hormones involved in meta-bolic regulation may also be affected by sojourn tohigh altitude. In addition, other hormonal responsesto ascent to high altitude and subsequent acclima-tization may also modulate the body water adjust-ments discussed at the beginning of this section.
Insulin and glucagon act to regulate the relativecontribution of carbohydrate and fat metabolism tothe overall metabolic energy requirements. Gluca-gon levels appear unchanged in lowlanders so-journing at high altitude, during either rest or ex-ercise.154 However, changes in the insulin responseto exercise, or in the insulin sensitivity of muscletissue, may contribute to the changes in muscle en-ergy metabolism during exercise at high altitude.Acute hypoxic exposure does not affect resting insu-lin concentrations in unacclimatized lowlanders upto about 3,000 m.155 In unacclimatized lowlandersascending to 4,300 m and higher, resting insulin lev-els at altitude appear to be elevated, compared withthose at sea level.131,156,157 During exercise at altitude,insulin remains constant at these elevated lev-els131,154,156 or increases if the exercise intensity is maxi-mal.155 Insulin levels, both at rest and during exercise,decrease back to sea-level values with 2 or more weeksof acclimatization,131,156 unless the sojourner contin-
ues ascending to more extreme altitudes.154
Thus, on arrival at high altitude, an increase ininsulin levels may facilitate glucose uptake bymuscle to sustain the accelerated glycolysis andincreased lactate accumulation that are apparentlystimulated by an exaggerated epinephrine releaseduring exercise. This is consistent with the appar-ent increase in the uptake and utilization of bloodglucose by muscle when unacclimatized lowlandersexercise at high altitude. However, the subsequentdecline in insulin levels back to sea-level values thatoccurs during altitude acclimatization is not consis-tent with the finding that glucose uptake and utiliza-tion by muscle remain elevated. Insulin sensitivity ofmuscle tissue might increase during acclimatization,but this possibility remains to be investigated. Al-ternatively, the increased uptake of blood glucoseduring exercise in acclimatized lowlanders mayreflect the actions of growth hormone. Acutely,changes in growth hormone concentrations exerteffects on glucose uptake that are similar to thoseof insulin. Although circulating growth hormonelevels during rest are unaffected by sojourn at alti-tude, growth hormone levels increase more rapidlyduring exercise at altitude after acclimatization.87
The transient elevation in BMR during the firstfew days after lowlanders arrive at high altitude,which was discussed earlier in this section, appearsto be mediated by the thyroid hormones. Within 24hours after lowlanders arrive at high altitude,plasma thyroxine (T4) and triiodothyronine (T3)concentrations both begin to increase.158 The T4 andT3 levels appear to peak between the third andeighth day at altitude,106,159 and thereafter levels de-cline.158,159 This time course parallels that of changesin the BMR.5,91,106,108,109 When the elevation ascendedis extreme (> 5,400 m), thyroid stimulating hormone(TSH) increases along with T4 and T3.160 However,it is interesting to note that at lower altitudes, anincrease in TSH has not always been observed toaccompany the increase in T4 and T3.158,159 Thismight suggest that the elevated T4 and T3 levels maynot be mediated by altitude effects on the hypotha-lamic-pituitary-thyroid axis activity. Because T4 andT3 are transported bound to plasma proteins,changes in these hormone levels may simply reflectthe reduction in volume of distribution for theplasma proteins, owing to hemoconcentration dur-ing the first week at altitude.
Hormonal responses are thought to be involvedin mediating adjustments on body fluid homeosta-sis experienced by lowlanders during sojourns athigh altitude; however, the exact mechanisms areunclear. Arginine vasopressin (AVP), or antidiuretic

Medical Aspects of Harsh Environments, Volume 2
678
hormone, regulates water loss in urine by increas-ing the permeability of the collecting duct to water,thus promoting water resorption. Unacclimatizedlowlanders exposed to moderate hypoxia (at eleva-tions of about 11,000 ft [3,385 m]) exhibit a decreasein AVP over the first 2 hours.161 Exposure to moreextreme elevations appears to have no effect orcause no increase in AVP levels.161 Furthermore, af-ter 24 hours of hypoxic exposure, and thereafter ataltitude, AVP levels are similar to those at sealevel.161 Thus, AVP might play a role in initiatingthe decrease in body water and plasma volume thatlowlanders experience during altitude sojourns, butother mechanisms are involved in sustaining thatresponse.
It is generally agreed that on arrival at high alti-tude, aldosterone levels in lowlanders are de-creased, both at rest and during exercise.161,162 Al-dosterone normally functions to defend normalfluid volume. Aldosterone acts on the kidney toincrease sodium and water resorption; thus, a de-crease in aldosterone levels would contribute to theincreased urine formation and decrease in plasmavolume that unacclimatized lowlanders experienceon arrival at altitude. With several weeks of alti-tude acclimatization, aldosterone returns topreascent levels, although the reduction in plasmavolume appears to persist longer.162
At sea level, aldosterone secretion is controlledby the renin–angiotensin mechanism, in which re-duced blood volume or pressure stimulates the kid-ney to secrete renin, which catalyzes conversion ofblood angiotensinogin to angiotensin I, which inturn is converted to angiotensin II by the action ofangiotensin-converting enzyme (ACE) in the vas-cular endothelium. Angiotensin II stimulates releaseof aldosterone, and exerts a vasoconstrictor effectas well. One frequently cited investigation reportedthat the acute altitude exposure disrupted the con-trol mechanism at the conversion from angiotensinI to II, based on observations that plasma ACE lev-els decreased in unacclimatized lowlanders newlyarrived at high altitude.38,163 However, the authorsrepeatedly failed to confirm their observations, ei-ther in subsequent follow-up studies or even whenarchived blood samples from the original studywere reanalyzed, which ultimately led them to re-tract their conclusion. Thus, Maher and col-leagues’162 observations that renin, both at rest andduring exercise, decreases along with aldosteroneafter 14 hours at 4,300 m, and that resting levels ofangiotensin II were also decreased (although exer-cise levels were not), indicate that the fall in aldos-terone secretion on arrival at altitude is appropri-
ate and normally regulated by the renin–angio-tensin system.
The decrease in aldosterone synthesis may be aresponse to what is sensed as, but is not, a progres-sive increase in blood volume. Within several hoursafter arrival at high altitude, lowlanders exhibit asustained peripheral venoconstriction, which pro-gressively increases over the first week of acclima-tization.164,165 Peripheral venoconstriction decreasesvenous vascular capacity, translocating blood to thecentral circulation (possibly signaling an increasein blood volume to the kidney, which then decreasesrenin secretion), and ultimately effecting a decreasein aldosterone levels. Alternatively, the decline inaldosterone levels may reflect a decrease in aldos-terone synthesis mediated by a hypoxia-induceddecrease in expression of genes for enzymes re-quired in the metabolic synthesis of aldosterone.166
Another hormonally mediated process altered inlowlanders sojourning at altitude is erythropoieses,which at sea level is stimulated by an increase incirculating erythropoietin levels. Erythropoietin isreleased mainly by the kidney (and to a lesser de-gree by the liver and other extrarenal sites) in re-sponse to hypoxemia or blood loss. The expansionof erythrocyte volume that lowlanders experienceafter several months’ acclimatization at high alti-tude is usually attributed to this hormonal mecha-nism.70,167 However, the time course for the changesin erythropoietin in lowlanders sojourning at highaltitude is difficult to reconcile with the time courseof the expansion of erythrocyte volume.
In contrast to the expansion of erythrocyte vol-ume, which is not manifested until the lowlanderhas spent several months at high altitude, erythro-poietin begins increasing within several hours af-ter ascent.69,70,167 In one study,69 erythropoietin lev-els were elevated 3-fold over sea-level values within10 to 14 hours after rapid ascent from sea level to4,300 m. Yet, this increase is short lived. Peak eryth-ropoietin levels are achieved between 24 and 48hours after arrival at 4,300 m,168 but decline there-after, reaching preascent values by the ninth day atthis altitude.69,168 A similar response pattern andtime course have been reported at lower169, 170 andhigher171 elevations, but a more pronounced in-crease in circulating erythropoietin is observed171
with ascent above 5,000 m. Given that the acclimatiz-ing lowlander’s hormone levels return to sea-levelvalues well before the expansion of erythrocytes ismanifested and without alleviation of hypoxemia,the role of this response in the mechanism of eryth-rocyte volume expansion is unclear and remains tobe fully investigated.

679
Human Adaptation to High Terrestrial Altitude
CONCLUDING THOUGHTS
At sea level, circulation is thought to be the domi-nant factor limiting maximal exercise perfor-mance.172 Indeed, maximum oxygen uptake at sealevel varies markedly among subjects, and that vari-ability is closely linked to the variability in maxi-mum cardiac output.173 However, this variabilityamong subjects in their maximum oxygen uptakeis markedly reduced as elevation is increased.174
Considering the limitation imposed on the numberof oxygen molecules that can be ventilated at highaltitude, and the limitation of lung diffusing capac-ity at altitude, one might conclude that the respira-tory rather than circulatory system limits maximaloxygen uptake at high altitude. If oxygen does notreach the arterial blood, then increasing cardiacoutput might not greatly facilitate oxygen transportto the tissues. Wagner’s analysis172 indicates that atthe summit of Mount Everest, a doubling of maxi-mal cardiac output will increase maximum oxygenuptake by less than 10%. The altitude limitations intotal body oxygen transport begin to appear above2,000 m, where these respiratory limitations mightbe expected. Thus, the respiratory system imposesgreater limitations on overall exercise performanceat altitude than at sea level.
Even if respiratory factors limit maximal oxygenuptake at high altitude more than circulatory factors,this is not to say that the systemic oxygen transportand muscle energy metabolism adjustments that oc-cur at high altitude do not affect physical performance.Most physical activities elicit oxygen uptakes wellbelow the maximal, and thus are not limited byV•
O2max, either at sea level or at high altitude. Whileascent to high altitude does causes V
•O2max to de-
crease, it is not until extreme altitudes are reached thatthe reduction is sufficient that the oxygen uptake re-quired for activities such as walking approaches maxi-mal. In unacclimatized lowlanders arriving at highaltitude, steady state submaximal exercise is sustainedby an increase in cardiac output and an acceleratedglycolysis and lactate accumulation. Both factorscould limit endurance for a given activity at high alti-tude more than at sea level, the first by increased car-diac work and the second by an increased rate of en-ergy substrate depletion.
With as few as 12 to 16 days of acclimatization,submaximal exercise endurance increases 40% to60% compared with exercise endurance on arrivalat altitude, even though maximal oxygen uptakeremains lower.132,175 After altitude acclimatization,systemic oxygen transport requirements duringexercise at altitude can be satisfied with a lowercardiac output, and thus reduced cardiac work, thanon arrival.56 In large part, this adaptation is enabledby the higher SaO2 resulting from ventilatory accli-matization, which, along with hemoconcentrationdue to high-altitude diuresis during the initialweeks at altitude and expanded erythrocyte volumeafter several months, raises CaO2.
The development of a glycogen-sparing adapta-tion further contributes to the improvement in ex-ercise performance. Thus, in lowlanders ascendingto high altitude, maximal performance appears tobe limited by respiratory factors and submaximalperformance by nonrespiratory factors, but bothrespiratory and nonrespiratory factors appear tocontribute importantly to performance improve-ments with acclimatization.
REFERENCES
1. Ward MP, Milledge JS, West JB. High Altitude Medicine and Physiology. New York, NY: Oxford University Press;2000.
2. West JB, Hackett PH, Maret KH, et al. Pulmonary gas exchange on the summit of Mount Everest. J Appl Physiol.1983;55:678–687.
3. Reeves JT, Groves BM, Sutton JR, et al. Adaptations to hypoxia: Lessons from Operation Everest II. In: SimmonsDH, ed. Current Pulmonology. St. Louis, Mo: Mosby–Year Book; 1991: 23–50.
4. Howard LSGE, Robbins PA. Ventilatory response to 8 h of isocapnic and poikilocapnic hypoxia in humans. JAppl Physiol. 1995;78:1092–1097.
5. Moore JM, Cymerman A, Huang SY, et al. Propranolol blocks metabolic rate increase but not ventilatory accli-matization to 4300 m. Respir Physiol. 1987;70:195–204.

Medical Aspects of Harsh Environments, Volume 2
680
6. Hornbein TF. The relation between stimulus to chemoreceptors and their response. In: Torrance RW, ed. Arte-rial Chemoreceptors. Edinburgh, Scotland: Blackwell Scientific Publications; 1968: 65–78.
7. von Euler US, Liljestrand G, Zotterman Y. The excitation mechanism of the chemoreceptor in the carotid body.Scand Arch Physiol. 1939;83:132–152.
8. Weil JV, Byrne-Quinn E, Sodal IE, Filley GF, Grover RF. Hypoxic ventilatory drive in normal man. J Clin Invest.1971;50:186–195.
9. Bisgard GE. The role of arterial chemoreceptors in ventilatory acclimatization to hypoxia. Adv Exp Med Biol.1994;360:109–122.
10. Lopez-Barneo J, Lopez-Lopez JR, Urena J, Gonzales C. Chemotransduction in the carotid body: K+ modulatedby PO2 in type 1 chemoreceptor cells. Science. 1988;242:580–582.
11. Benot AR, Ganfornia MD, Lopez-Barneo J. Potassium channel modulated by hypoxia and the redox status inglomus cells of the carotid body. In: Weir EK, Hume JR, Reeves JT, eds. Ion Flux in Pulmonary Vascular Control.New York, NY: Plenum Press; 1992: 177–188.
12. Weil JV. Ventilatory control at high altitude. In: Fishman AP, Cherniak NS, Widdicombe JG, Geiger SR, eds.Handbook of Physiology: The Respiratory System. Control of Breathing, Vol 2 Bethesda, Md: American PhysiologicalSociety; 1986: 703–728.
13. Stea A, Jackson L, Macintyre L, Nurse CA. Long-term modulation of inward currents in O2 chemoreceptors inchronic hypoxia and cyclic AMP in vitro. J Neurosci. 1995;15:2192–2202.
14. Hirschman CA, McCullough RE, Weil JV. Normal values for hypoxic and hypercapnic ventilatory drives inman. J Appl Physiol. 1975;38:1095–1098.
15. Collins DD, Scoggin CH, Zwillich CW, Weil JV. Hereditary aspects of decreased hypoxic response. J Clin Invest.1978;62(1):105–110.
16. Huang SY, Alexander JK, Grover RF, et al. Hypocapnia and sustained hypoxia blunt ventilation on arrival athigh altitude. J Appl Physiol. 1984;56:602–606.
17. Reeves JT, McCullough RE, Moore LG, Cymerman A, Weil JV. Sea-level PCO2 relates to ventilatory acclimatiza-tion at 4300 m. J Appl Physiol. 1993;75:1117–1122.
18. Van Beek JHGM, Berkenbosch A, Degoode J, Olievier CN. Effects of brainstem hypoxemia on the regulation ofbreathing. Respir Physiol. 1984;57:171–188.
19. Nilsson GE, Lutz PL. Role of GABA in hypoxia tolerance, metabolic depression, and hibernation: Possible linksto neurotransmitter evolution. Comp Biochem Physiol Comp Pharmacol. 1993;105:329–336.
20. Kazemi H, Hoop B. Glutamic acid and gamma-aminobutyric acid neurotransmitters in central control of breath-ing. J Appl Physiol. 1991;70:1–7.
21. Weil JV. Ventilatory responses to CO2 and hypoxia after sustained hypoxia in awake cats. J Appl Physiol.1994;76:2251–2252.
22. Robbins PA. Commentary: Hypoxic ventilatory decline. J Appl Physiol. 1995;79:373–374.
23. Butterfield GE, Gates J, Fleming S, Brooks GA, Sutton JR, Reeves JT. Increased energy intake minimizes weightloss in men at high altitude. J Appl Physiol. 1992;72:1741–1748.
24. Howard LSGE, Robbins PA. Alterations in respiratory control during 8 h of isocapnic and poikilocapnic hy-poxia in humans. J Appl Physiol. 1995;78:1098–1107.

681
Human Adaptation to High Terrestrial Altitude
25. Dempsey JA, Forster HV. Mediation of ventilatory adaptations. Physiol Rev. 1982;62:262–331.
26. Visek M, Pickett CK, Weil JV. Increased carotid body sensitivity during acclimatization to hypobaric hypoxia. JAppl Physiol. 1987;63:2403–2410.
27. Cruz JC, Reeves JT, Grover RF, et al. Ventilatory acclimatization to high altitude is prevented by CO2 breathing.Respiration. 1980;39(3):121–130.
28. Fitzgerald MP. Further observations on the changes in the breathing and the blood at various high altitudes.Proc Royal Soc. 1914;88:248–258.
29. Rahn H, Otis AB. Man’s respiratory response during and after acclimatization to high altitude. Am J Physiol.1949;157:445–462.
30. Malconian MK, Rock PB, Reeves JT, Cymerman A, Houston CS. Operation Everest II: Gas tensions in expiredair and arterial blood at extreme altitude. Aviat Space and Environ Med. 1993;64:37–42.
31. Weil JV, Bryne-Quinn E, Sodal IE, Kline JS, McCullough RE, Filley GF. Augmentation of chemosensitivity dur-ing mild exercise in normal man. J Appl Physiol. 1972;33:813–819.
32. Waldrop TG, Eldrige FL, Iwamoto GA, Mitchell JH. Central neural control of respiration and circulation dur-ing exercise. In: Rowell LB, Sheperd JT, eds. Handbook of Physiology. Section 12: Exercise: Regulation and Integra-tion of Multiple Systems. New York, NY: Oxford University Press; 1996: 333–380.
33. Dempsey JA, Forster HV, Birnbaum ML, et al. Control of exercise hyperpnea under varying durations of expo-sure to moderate hypoxia. Resp. Physiol. 1972;16:213–231.
34. Christensen EH. Sauerstoff aufnahme and repiratorische functionen in gross hohen [in German]. Skand ArchPhysiol. 1937;76:88–100.
35. Sutton JR, Reeves JT, Wagner PD, et al. Operation Everest II: Oxygen transport during exercise at extremesimulated altitude. J Appl Physiol. 1988;64:1309–1321.
36. Gale GE, Torre-Bueno JR, Moon RE, Saltzman HA, Wagner PD. Ventilation perfusion inequality in normalhumans during exercise at sea level and simulated altitude. J Appl Physiol. 1985;58:978–988.
37. Wagner PD, Gale GE, Moon RE, Torre-Bueno JR, Stolp BW, Saltzman HA. Pulmonary gas exchange in humansexercising at sea level and simulated altitude. J Appl Physiol. 1986;61:260–270.
38. Milledge JS, Catley DM, Ward MP, Williams ES, Clarke CRA. Renin-aldosterone and angiotensin–convertingenzyme during prolonged altitude exposure. J Appl Physiol. 1983;55:699–702.
39. Wagner PD, Sutton JR, Reeves JT, Cymerman A, Groves BM, Malconian MK. Operation Everest II: Pulmonarygas exchange during a simulated ascent of Mt Everest. J Appl Physiol. 1987;63:2348–2359.
40. Evans JW, Wagner PD. V•
/Q•
distributions from analysis of experimental inert gas elimination. J Appl Physiol.1977;42:889–898.
41. Saltin B, Grover RF, Blomqvist CG, Hartley LH, Johnson RL. Maximal oxygen uptake and cardiac output after2 weeks at 4300 m. J Appl Physiol. 1968;25:400–409.
42. Valeri CR, Pivacek LE, Gray AD, et al. The safety and therapeutic effectiveness of human red cells stored at–80°C for as long as 21 years. Transfusion. 1989;29:429–437.
43. Stenberg J, Ekblom B, Messin R. Hemodynamic response to work at simulated altitude, 4000 m. J Appl Physiol.1966;21:1589–1594.

Medical Aspects of Harsh Environments, Volume 2
682
44. Pugh LGCE, Gill MB, Lahiri S, Milledge JS, Ward MP, West JB. Muscular exercise at great altitudes. J ApplPhysiol. 1964;19:431–440.
45. Bender PR, Groves BM, McCullough RE, et al. Oxygen transport to exercising leg in chronic hypoxia. J ApplPhysiol. 1988;65:2592–2597.
46. Hartley LH, Vogel JA, Landowne M. Central, femoral, and brachial circulation during exercise in hypoxia. JAppl Physiol. 1973;34:87–90.
47. Vogel JA, Hansen JE, Harris CW. Cardiovascular responses in man during exhaustive work at sea level andhigh altitude. J Appl Physiol. 1967;23:531–539.
48. Squires RW, Buskirk ER. Aerobic capacity during acute exposure to simulated altitude, 914 to 2286 meters. MedSci Sports Exerc. 1986;14:36–40.
49. Young AJ. Energy substrate utilization during exercise in extreme environments. In: Pandolf KB, Holloszy JO,eds. Exercise and Sport Sciences Reviews. Baltimore, Md: Williams & Wilkins; 1990: 65–117.
50. Buskirk ER. Decrease in physical working capacity at high altitude. In: Hegnaurer AH, ed. Biomedicine Problemsof High Terrestrial Elevations. Natick, Mass: US Army Research Institute of Environmental Medicine; 1969: 204–222.
51. Young AJ, Cymerman A, Burse RL. The influence of cardiorespiratory fitness on the decrement in maximalaerobic power at high altitude. Eur J Appl Physiol. 1985;54:12–15.
52. Grover RF, Reeves JT, Grover EB, Leathers JE. Muscular exercise in young men native to 3100 m altitude. J ApplPhysiol. 1967;22:555–564.
53. Saltin B. Aerobic and anaerobic work capacity at an altitude of 2250 meters. In: Goddard RF, ed. The Effects ofAltitude on Physical Performance. Albuquerque, NM: The Athletic Institute; 1967: 97–102.
54. Powers SK, Lawler J, Dempsey JA, Dodd S, Landry G. Effects of incomplete pulmonary gas exchange on V•
O2max.J Appl Physiol. 1989;66:2491–2495.
55. Astrand PO, Cuddy TE, Saltin B, Stenberg J. Cardiac output during submaximal and maximal work. J ApplPhysiol. 1964;19:268–274.
56. Grover RF, Lufschanowski R, Alexander JK. Alterations in the coronary circulation of man following ascent to3100 m altitude. J Appl Physiol. 1976;41:832–838.
57. Hultgren HN. Coronary heart disease and trekking. J Wild Med. 1990;1:154–161.
58. Grover RF, Tucker CE, McGroaty SR, Travis RR. The coronary stress of skiing at high altitude. Arch Intern Med.1990;150:1205–1208.
59. Vogel JA, Hartley LH, Cruz JC, Hogan RP. Cardiac output during exercise in sea-level residents at sea level andhigh altitude. J Appl Physiol. 1974;36:169–172.
60. Hartley LH, Alexander JK, Modelski M, Grover RF. Subnormal cardiac output at rest and during exercise inresidents at 3,100 m altitude. J Appl Physiol. 1967;23:839–848.
61. Alexander JK, Hartley LH, Modelski M, Grover RF. Reduction of stroke volume during exercise in man follow-ing ascent to 3,100 m altitude. J Appl Physiol. 1967;23:849–858.
62. Klausen K. Cardiac output in man in rest and work during and after acclimatization to 3,800 m. J Appl Physiol.1966;21:609–616.

683
Human Adaptation to High Terrestrial Altitude
63. Reeves JT, Groves BM, Sutton JR, et al. Operation Everest II: Preservation of cardiac function at extreme alti-tude. J Appl Physiol. 1987;63:531–539.
64. Grover RF, Weil JV, Reeves JT. Cardiovascular adaptation to exercise and high altitude. In: Pandolf KB, ed.Exercise and Sport Sciences Reviews. New York, NY: Macmillan; 1986: 269–302.
65. Moore LG, Cymerman A, Shao-Yung H, et al. Propranolol does not impair exercise oxygen uptake in normalmen at high altitude. J. Appl Physiol. 1986;61:1935–1941.
66. Suarez J, Alexander JK, Houston CS. Enhanced left ventricular performance at high altitude during OperationEverest II. Am J Cardiol. 1987;60:137–142.
67. Jain SC, Bardhan J, Swamy YV, Krishina B, Nayar HS. Body fluid compartments in humans during acute high-altitude exposure. Aviat Space Environ Med. 1980;51:234–236.
68. Jung RC, Dill DB, Horton R, Horvath SM. Effects of age on plasma aldosterone levels and hemoconcentrationat altitude. J Appl Physiol. 1971;31:593–597.
69. Sawka MN, Young AJ, Rock PB, et al. Altitude acclimatization and blood volume: Effects of erythrocyte vol-ume expansion. J Appl Physiol. 1996;81:636–642.
70. Ward MP, Milledge JS, West JB. Haematological Changes and Plasma Volume. London, England: Chapman & Hall;1989: Chap 9.
71. Grover RF, Reeves JT, Maher JT, et al. Maintained stroke volume but impaired arterial oxygenation in man athigh altitude with supplemental CO2. Circ Res. 1976;38:391–396.
72. Horstman D, Weiskopf R, Jackson RE. Work capacity during 3–wk sojourn at 4,300 m: Effects of relative poly-cythemia. J Appl Physiol. 1980;49(2):311–318.
73. Ekblom B, Wilson G, Astrand PO. Central circulation during exercise after venesection and reinfusion of redblood cells. J Appl Physiol. 1976;40:379–383.
74. Young AJ, Sawka MN, Boushel R, et al. Erythrocyte reinfusion alters systemic O2 transport during exercise athigh altitude. Med Sci Sports Exerc. 1995;27:S109.
75. Dempsey JA, Thomson JM, Forster HV, Cerny FC, Chosy LW. HbO2 dissociation in man during prolongedwork in chronic hypoxia. J Appl Physiol. 1975;38:1022–1029.
76. Hannon JP, Vogel JA. Oxygen transport during early altitude acclimatization: A perspective study. Eur J ApplPhysiol. 1977;36:285–297.
77. Bender PR, McCullough RE, McCullough RG, et al. Increased exercise SaO2 independent of ventilatory accli-matization at 4300 m. J Appl Physiol. 1989;66:2733–2738.
78. Young AJ, Sawka MN, Muza SR, et al. Effects of erythrocyte infusion on V•
O2max at high altitude. J Appl Physiol.1996;81:252–259.
79. Heath D, Williams DR. The blood. In: Man at High Altitude. Edinburgh, Scotland: Churchill Livingston; 1977:39–53.
80. Surks MI, Chinn KSK, Matoush LO. Alterations in body composition in man after acute exposure to high alti-tude. J Appl Physiol. 1966;21:1741–1746.
81. Pugh LGCE. Blood volume and haemoglobin concentration at altitudes above 18,000 ft (5500 m). J Physiol.1964;170:344–354.

Medical Aspects of Harsh Environments, Volume 2
684
82. Torrance JD, Lenfant C, Cruz J, Marticorena E. Oxygen transport mechanisms in residents at high altitude. RespPhysiol. 1970;11:1–15.
83. Mairbaurl H. Red blood cell function in hypoxia at altitude and exercise. Int J Sports Med. 1994;15:51–63.
84. Goldberg SV, Schoene RB, Haynor D, et al. Brain tissue pH and ventilatory acclimatization to high altitude. JAppl Physiol. 1992;72:58–63.
85. Willford DC, Hill EP, Moores WY. Theoretical analysis of optimal P50. J Appl Physiol. 1982;52:1043–1048.
86. Reeves JT, Grover RF, Cohn JE. Regulation of ventilation during exercise at 10,200 ft in athletes born at lowaltitude. J Appl Physiol. 1967;22:546–554.
87. Raynaud J, Drouet L, Martineaud JP, Bordacha J, Coudert J, Durand J. Time course of plasma growth hormoneduring exercise in humans at altitude. J Appl Physiol. 1981;50:229–233.
88. Brotherhood J, Brozavic B, Pugh LGC. Haematological status of middle- and long-distance runners. Clin Sciand Mol Med. 1975;48:139–145.
89. Young AJ, Evans WJ, Cymerman A, Pandolf KB, Knapik JJ, Maher JT. Sparing effect of chronic high-altitudeexposure on muscle glycogen utilization. J Appl Physiol. 1982;52:857–862.
90. Vogel JA, Hartley LH, Cruz JC. Cardiac output during exercise in altitude natives at sea level and high altitude.J Appl Physiol. 1974;36:173–176.
91. Butterfield GE. Maintenance of body weight at altitude: In search of 500 kcal/day. In: Marriot BM, Carlson SJ,eds. Nutritional Needs in Cold and in High-Altitude Environments. Washington, DC: National Academy Press;1996: 357–378.
92. Hoyt RW, Honig A. Environmental influences on body fluid balance during exercise: Altitude. In: Buskirk, ER,Puhl SM, eds. Body Fluid Balance: Exercise and Sport. New York, NY: CRC Press; 1996: 183–196.
93. Fulco CS, Cymerman A, Pimental NA, Young AJ, Maher JT. Anthropometric changes at high altitude. AviatSpace Environ Med. 1985;56:220–224.
94. Sutton JR. Effect of acute hypoxia on the hormonal response to exercise. J Appl Physiol. 1977;42:587–592.
95. Hoyt RW, Honig A. Body fluid and energy metabolism at high altitude. In: Fregley ML, Blatteis CM, eds. Hand-book of Physiology. Section 4. Environmental Physiology, Vol 2. New York, NY: Oxford University Press; 1995:1277–1289.
96. Hannon JP, Chinn KSK, Shields JL. Effects of acute high altitude exposure on body fluids. Fed Proc. 1969;38:1178–1184.
97. Anand IS, Chandrashekhar Y, Rao SK, et al. Body fluid compartments, renal blood flow and hormones at 6,000m in normal subjects. J Appl Physiol. 1993;74:1234–1239.
98. Picon-Reategui E, Lozano R, Valdivieso J. Body composition at sea level and high altitudes. J Appl Physiol.1961;16:589–592.
99. Kolka MA, Stephenson LA, Rock PB, Gonazlez RR. Local sweating and cutaneous blood flow during exercisein hypobaric environments. J Appl Physiol. 1987;62:2224–2229.
100. Kolka MA, Stephenson LA, Gonzalez RR. Depressed sweating during exercise at altitude. J Therm Biol.1989;14:167–170.
101. Greenleaf JE, Greenleaf CJ, Card DH, Saltin B. Exercise-temperature regulation in man during acute exposureto simulated altitude. J Appl Physiol. 1969;26:290–296.

685
Human Adaptation to High Terrestrial Altitude
102. Tucker A, Reeves JT, Robertshaw D, Grover RF. Cardiopulmonary response to acute altitude exposure: Waterloading and denitrogenation. Respir Physiol. 1983;54:363–380.
103. Ashack R, Farber MO, Weinberger M, Robertson G, Fineberg N, Manfredi F. Renal and hormonal responses toacute hypoxia in normal individuals. J Lab Clin Med. 1985;106:12–16.
104. Anand IS, Chandrashekhar Y. Fluid metabolism at high altitudes. In: Marriott BM, Carlson SJ, eds. NutritionalNeeds in Cold and High-Altitude Environments. Washington, DC: National Academy Press; 1996: 331–356.
105. Pugh LGCE. Physiological and medical aspects of the Himalayan Scientific and Mountaineering Expedition,1960–61. Br Med J. 1962;2:621–627.
106. Surks MI, Beckwitt HJ, Chidsey CA. Changes in plasma thyroxine concentration and metabolism, catechola-mine excretion and basal oxygen consumption in man during acute exposure to high altitude. J Clin Endocrinol.1967;27:789–799.
107. Cymerman A, Pandolf KB, Young AJ, Maher JT. Energy expenditure during load carriage at high altitudes. JAppl Physiol. 1981;51:14–18.
108. Grover RF. Basal oxygen uptake in man at high altitude. J Appl Physiol. 1963;18:909–912.
109. Butterfield GE, Gates J, Fleming S, Brooks GA, Sutton JR, Reeves JT. Increase energy intake minimizes weightloss in men at high altitude. J Appl Physiol. 1992;72:1741–1748.
110. Holloszy JO, Coyle EF. Adaptations of skeletal muscle to endurance exercise and their metabolic consequences.J Appl Physiol. 1984;56:831–838.
111. Arner P. Impact of exercise on adipose tissue metabolism in humans. Int J Obes Relat Metab Disord. 1995;19:S18–S21.
112. Sherman WM. Metabolism of sugars and physical performance. Am J Clin Nutr. 1995;62:228S–241S.
113. Wasserman DH. Regulation of glucose fluxes during exercise in the postabsorptive state. Annu Rev Physiol.1995;57:191–218.
114. Coyle EF. Substrate utilization during exercise in active people. Am J Clin Nutr. 1995;61:968S–979S.
115. Brooks GA. Balance of carbohydrate and lipid utilization during exercise: The “crossover” concept. J ApplPhysiol. 1994;76:2253–2261.
116. Conlee RK. Muscle glycogen and exercise endurance: A twenty-year perspective. In: Pandolf KB, ed. Exerciseand Sport Sciences Reviews. New York, NY: Macmillan; 1987;15:1–28.
117. Aragon JJ, Lowenstein JM. The purine nucleotide cycle: Comparison of the levels of citric acid cycle intermedi-ates with the operation of the purine nucleotide cycle in rat skeletal muscle during exercise and recovery fromexercise. Eur J Biochem. 1980;110:371–377.
118. Dill DB, Edwards HT, Folling A, Oberg SA, Pappenheimer AM, Talbot JH. Adaptations of the organism tochanges in oxygen pressure. J Physiol. 1931;71:47–63.
119. Edwards HT. Lactic acid in rest and work at high altitude. Am J Physiol. 1936;116:367–375.
120. Friedemann TE, Haugen GE, Kmieciak TC. The level of pyruvic and lactic acids and lactic pyruvic ratio in theblood of human subjects: The effect of food, light muscular activity, and anoxia at high altitude. J Biol Chem.1945;157:673–689.
121. Harboe M. Lactic acid content in human venous blood during hypoxia at high altitude. Acta Physiol Scand.1957;40:248–253.
Medical Aspects of Harsh Environments, Volume 2
686
122. Knuttgen HG, Saltin B. Oxygen uptake, muscle high-energy phosphates, and lactate in exercise under acute,hypoxic conditions in man. Acta Physiol Scand. 1973;87:368–376.
123. Lorentzen FV. Lactic acid in blood after various combinations of exercise and hypoxia. J Appl Physiol. 1962;17:661–664.
124. Hogan MC, Cox RH, Welch HG. Lactate accumulation during incremental exercise with varied inspired oxy-gen fractions. J Appl Physiol. 1983;55:1134–1140.
125. Naimark A, Jones NL, Lal S. The effect of hypoxia on gas exchange and arterial lactate and pyruvate concentra-tion during moderate exercise in man. Clin Sci. 1965;28:1–13.
126. Hermansen L, Saltin B. Blood lactate concentration during exercise at acute exposure to altitude. In: MargariaR, ed. Exercise at Altitude. New York, NY: Excerpta Medica Foundation; 1967: 48–53.
127. Linnarsson D, Karlsson J, Fagraeus L, Saltin B. Muscle metabolites and oxygen deficit with exercise in hypoxiaand hyperoxia. J Appl Physiol. 1974;36:399–402.
128. Dill DB, Myhre LG, Phillips EE, Brown DK. Work capacity in acute exposures to altitude. J Appl Physiol.1966;21:1168–1176.
129. Boouissou P, Guezennec CY, Defer G, Pesquies P. Oxygen consumption, lactate accumulation, and sympatheticresponse during prolonged exercise under hypoxia. Int J Sports Med. 1987;8:266–269.
130. Fagraeus L, Karlsson J, Linnarsson D, Saltin B. Oxygen uptake during maximal work at lowered and raisedambient air pressures. Acta Physiol Scand. 1973;87:411–421.
131. McLellan T, Jacobs I, Lewis W. Acute altitude exposure and altered acid–base states, I: Effects on the exerciseventilation and blood lactate responses. Eur J Appl Physiol. 1988;57:435–444.
132. Maher JT, Jones LG, Hartley LH. Effects of high-altitude exposure on submaximal endurance capacity of men.J Appl Physiol. 1974;37:895–898.
133. Rowell LB, Blackmon JR, Kenny MA, Escourrou P. Splanchnic vasomotor and metabolic adjustments to hy-poxia and exercise in humans. Am J Physiol. 1984;247:H251–H258.
134. Bender PR, Groves BM, McCullough RE, et al. Decreased exercise muscle lactate release after high altitudeacclimatization. J Appl Physiol. 1989;67:1556–1462.
135. Brooks GA, Butterfield GE, Wolfe RR, et al. Decreased reliance on lactate during exercise after acclimatizationto 4,300 m. J Appl Physiol. 1991;71:333–341.
136. Katz A, Sahlin K. Role of oxygen in regulation of glycolysis and lactate production in human skeletal muscle. In:Pandolf KB, Holloszy JO, eds. Exercise and Sport Sciences Reviews. Baltimore, Md: Williams & Wilkins; 1990: 1–28.
137. Stainsby WN, Brooks GA. Control of lactic acid metabolism in contracting muscles and during exercise. In:Pandolf KB, Holloszy JO, eds. Exercise and Sport Sciences Reviews. Baltimore, Md: Williams & Wilkins; 1990: 29–63.
138. Brooks GA, Butterfield GE, Wolfe RR, et al. Increased dependence on blood glucose after acclimatization to4300 m. J Appl Physiol. 1991;70:919–927.
139. Green HJ, Sutton JR, Wolfel EE, Reeves JT, Butterfield GE, Brooks GA. Altitude acclimatization and energymetabolic adaptations in skeletal muscle during exercise. J Appl Physiol. 1992;73:2701–2708.
140. Hill AV, Lupton H. Muscular exercise, lactic acid and the supply and utilization of oxygen. Q J Med. 1923;16:135–171.
141. Horstman DH, Gleser M, Delehunt J. Effects of altering O2 delivery on V•
O2 of isolated, working muscle. Am JPhysiol. 1976;230:327–334.
687
Human Adaptation to High Terrestrial Altitude
142. Richter EA, Ruderman NB, Gavras H, Belur ER, Galbo H. Muscle glycogenolysis during exercise: Dual controlby epinephrine and contractions. Am J Physiol. 1982;242:E25–E32.
143. Mazzeo RS, Bender PR, Brooks GA, et al. Arterial catecholamine responses during exercise with acute andchronic high-altitude exposure. Am J Physiol. 1991;261:E419–E424.
144. Cerretelli P, di Prampero PE. Aerobic and anaerobic metabolism during exercise at altitude. Med Sports Sci.1985;19:1–19.
145. Grassi B, Marzorati M, Kayser B, et al. Peak blood lactate and blood lactate vs workload during acclimatizationto 5050 m and in deacclimatization. J Appl Physiol. 1996;80:685–692.
146. Green HJ, Sutton J, Young P, Cymerman A, Houston CS. Operation Everest II: Muscle energetics during maxi-mal exhaustive exercise. J Appl Physiol. 1989;66:142–150.
147. Green HJ, Sutton JR, Cymerman A, Young PM, Houston CS. Operation Everest II: Adaptations in human skel-etal muscle. J Appl Physiol. 1989;66:2454–2461.
148. Young AJ, Young PM, McCullough RE, Moore LG, Cymerman A, Reeves JT. Effect of beta-adrenergic blockadeon plasma lactate concentration during exercise at high altitude. Eur J Appl Physiol. 1991;63:315–322.
149. Young AJ, Evans WJ, Fisher EC, Sharp RL, Costill DL, Maher JT. Skeletal muscle metabolism of sea level na-tives following short-term high altitude residence. Eur J Appl Physiol. 1984;52:463–466.
150. Roberts AC, Butterfield GE, Cymerman A, Reeves JT, Wolfel EE, Brooks GA. Acclimatization to 4,300-m alti-tude decreases reliance on fat as a substrate. J Appl Physiol. 1996;81:1762–1771.
151. Cunningham WL, Becker EJ, Kreuzer F. Catecholamines in plasma and urine at high altitude. J Appl Physiol.1965;20:607–610.
152. Richalet JP, Le-Trong JL, Rathat C, et al. Reversal of hypoxia-induced decrease in human cardiac response toisoproterenol infusion. J Appl Physiol. 1989;67:523–527.
153. Richalet JP, Larmignat P, Rathat C, Keromes A, Baud P, Lhoste F. Decreased cardiac response to isoproterenolinfusion in acute and chronic hypoxia. J Appl Physiol. 1988;65:1957–1961.
154. Young PM, Sutton JR, Green HJ, et al. Operation Everest II: Metabolic and hormonal responses to incrementalexercise to exhaustion. J Appl Physiol. 1992;73:2574–2579.
155. Kullmer T, Gabriel H, Jungmann E, et al. Increase of serum insulin and stable c-peptide concentrations withexhaustive incremental graded exercise during acute hypoxia in sedentary subjects. Exp Clin Endocrinol Diabe-tes. 1995;103:156–161.
156. Young PM, Rock PB, Fulco CS, Trad LA, Forte VA, Cymerman A. Altitude acclimatization attenuates plasmaammonia accumulation during submaximal exercise. J Appl Physiol. 1987;63:758–764.
157. Young PM, Rose MS, Sutton JR, Green HJ, Cymerman A, Houston CS. Operation Everest II: Plasma lipid andhormonal responses during a simulated ascent of Mt Everest. J Appl Physiol. 1989;66:1430–1435.
158. Rastogi GK, Malhotra MS, Srivastava MC, et al. Study of the pituitary-thyroid functions at high altitude inman. J Clin Endocrinol Metab. 1977;44:447–452.
159. Stock MJ, Chapman C, Stirling JL, Campbell IT. Effects of exercise, altitude, and food on blood hormone andmetabolite levels. J Appl Physiol. 1978;45:350–354.
160. Mordes JP, Blume FD, Boyer S, Zheng MR, Braverman LE. High-altitude pituitary-thyroid function on MountEverest. N Engl J Med. 1983;308:1135–1138.
Medical Aspects of Harsh Environments, Volume 2
688
161. Claybaugh JR, Wade CE, Cucinell SA. Fluid and electrolyte balance and hormonal response to the hypoxicenvironment. In: Claybaugh JR, Wade CE, eds. Hormonal Regulation of Fluid and Electrolytes. New York, NY:Plenum; 1989: 187–214.
162. Maher JT, Jones LG, Hartley LH, Williams GH, Rose LI. Aldosterone dynamics during graded exercise at sealevel and high altitude. J Appl Physiol. 1975;39:18–22.
163. Milledge JS, Catley DM, Williams ES, Withey WR, Minty BD. Effect of prolonged exercise at altitude on therenin–aldosterone system. J Appl Physiol. 1983;55:413–418.
164. Weil JV, Byrne-Quinn E, Battock DJ, Grover RF, Chidsey CA. Forearm circulation in man at high altitude. ClinSci. 1971;40:235–246.
165. Wiel JV, Battock DJ, Grover RF, Chidsey CA. Venoconstriction in man upon ascent to high altitude: Studies onpotential mechanisms. Fed Proc. 1969;28:1160–1162.
166. Raff H, Janowski BM, Engeland WC, Oaks MK. Hypoxia in vivo inhibits aldosterone synthesis and aldosteronesynthase mRNA in rats. J Appl Physiol. 1996;81:604–610.
167. Winslow RM. High-altitude polycythemia. In: West JB, Lahiri S, eds. High Altitude and Man. Bethesda, Md:American Physiological Society; 1984: 163–172.
168. Abbrecht PH, Littell JK. Plasma erythropoietin in men and mice during acclimatization to different altitudes. JAppl Physiol. 1972;32:54–58.
169. Gunga HC, Kirsch K, Rocker L, Schobersberger W. Time course of erythropoietin, triiodothyronine, thyroxineand thyroid-stimulating hormone at 2,315 m. J Appl Physiol. 1994;76:1068–1072.
170. Gunga HC, Rocker L, Behn C, et al. Shift working in the Chilean Andes (> 3,600 m) and its influence on eryth-ropoietin and the low-pressure system. J Appl Physiol. 1996;81:846–852.
171. Richalet JP, Souberbielle JC, Antezana AM, et al. Control of erythropoiesis in humans during prolonged expo-sure to the altitude of 6,542 m. Am J Physiol. 1994;266:R756–R764.
172. Wagner PD. An integrated view of the determinants of maximum oxygen uptake. In: Gonzales NC, Fedde MR,eds. Oxygen Transfer From Atmosphere to Tissues. New York, NY: Plenum Press; 1988: 245–256.
173. Reeves JT, Groves BM, Cymerman A, et al. Cardiac filling pressures during cycle exercise at sea level. RespirPhysiol. 1990;80:147–154.
174. Cymerman A, Reeves JT, Sutton JR, et al. Operation Everest II: Maximal oxygen uptake at extreme altitude. JAppl Physiol. 1989;66:2446–2453.
175. Khanna PK, Dham SK, Hoon RS. Exercise in an hypoxic environment as a screening test for ischaemic heartdisease. Aviat Space Environ Med. 1976;47:1114–1117.