chapter 1: introductionstudentsrepo.um.edu.my/3818/2/2._chapter_1_–_6.pdf · 2013-03-21 · 1...
TRANSCRIPT

1
CHAPTER 1: INTRODUCTION
1.1 Optics Communication
The total internal reflection principle which is responsible for guiding of light in
optical fibers has been demonstrated since 1840s (Bates, 2001). The practical applications
of this phenomena such as image transmission through tubes and then optical glass fiber is
only realized in the 1950s (Hecht, 1999), when the glass fiber can be coated with a
transparent cladding layer to suggest a more suitable refractive index in its guiding
characteristics. Optical fibers have been demonstrated in 1970 for a short distance light
transmission with an enormous loss of ∼1000 dB/km for possible application in
communication. However, by removing the impurities in the fiber material and offering
pure silica, loss can be reduced to less than 20 dB/km in the same year (Kapron, et al.,
1970). This opens the possibility to use an optical fiber for long haul communication with
many repeaters at spacing, which is comparable to that of electrical copper cable systems.
Further progress in providing low-loss optical fibers led to the era of fiber-optic
communications.
From 1978 onwards, single mode fiber (SMF) became available commercially
(Sanferrare, et al., 1987) for long distance communication application, which operates at
the wavelength of ~800 nm. During the second generation of optical fiber, it had been
realized that the repeater spacing could increase significantly by shifting the operating
wavelength to the 1300 nm region, which has a lower loss of less than 1 dB/km and
minimum dispersion. It had led to the using of InGaAsP hetero-junction laser diodes as
optical sources. In the third generation system which operating in 1550 nm region, optical

2
fiber operates at even a lower loss of about 0.2 dB/km (Miya, et al., 1979). Due to the large
dispersion in such wavelength region, the dispersion-shifted fiber was designed to have
minimum dispersion. In addition, single-longitudinal-mode lasers operating near 1550 nm
region was also introduced commercially in year 1990 to increase the system capacity up to
10 Gb/s bit rate (Nakagawa, 1995). Light wave systems operating at 1550 nm region has a
problem that the signal had to be regenerated every 60-70 km distance by using electronic
repeaters. In the fourth generation, optical amplifiers were used to replace the electronic
repeaters. This amplifier was fabricated by doping an optical fiber with rare-earth elements
such as Erbium to provide amplification in 1550 nm region via stimulated emission
process. Then, the whole transmission and reception in communication system can be
performed optically without any conversions to electrical signal. Optical amplifiers not only
increased the repeater spacing but also introduced wavelength-division-multiplexing to
raise the bit rate. It led to a so much cheaper inter-continental communication system an
optical amplifier-based system. All in all, these developments has made it feasible that
silica fiber carries large amount of information over long space and caused optical
communication system as a backbone of today’s telecommunication network system.
The emergence of multimedia systems, its various type of data transmission, and
the internet had led to an explosion in traffic and bandwidth demand. One solution is using
new fibers to increase the bandwidth of optical telecommunications network, but it is not
cost effective. Another alternative in increasing the bandwidth is raising the capacity of
fibers by the number of channel wavelength. Dense wavelength division multiplexing
(DWDM) has the potential in transmitting large number of relatively closely spaced
channels along an optical SMF. Employing optical amplifiers as a regenerator of channels
without requiring de-multiplexing of individual channels in multi-channel light wave

3
systems makes a revolution in the design of multi-wavelength optical systems. This creates
a need for multi-wavelength light source.
The development of multi-wavelength fiber lasers based on nonlinear effects
(Cowle, et al., 1996) has indicated significant outcomes that it could be implemented as a
laser source of DWDM (dense wavelength division multiplexing) system in optical
telecommunication network system. Fiber laser applies an optical fiber doped with rare
earth elements as the active gain medium. This optical fiber doped with elements such as
erbium, thulium, and ytterbium also provides light amplification without lasing which is
known as the doped fiber amplifier. Today, Bismuth-based Erbium doped fiber (Bi-EDF)
can be employed as the gain medium for both amplifiers and fiber lasers instead of the
conventional silica-based erbium doped one. This is attributed to the Bi-EDF, which is
capable to be doped with high Erbium ions concentration without causing any deleterious
ion quenching and clustering effects (Harun, et al., 2008a). Recently, many new fibers
such as photonic crystal fibers (PCFs), highly nonlinear fibers, Bi-EDFs and dispersion
compensating fibers were developed and studied for various applications. In these fibers,
zero dispersion wavelength shifts toward the visible band and their nonlinearity increased
due to the relatively small core size (Knight, et al., 1996; Broeng, et al., 1999; Monro, et
al., 1999 and Koyamada, et al., 2004).
PCF is a microstructure fiber which is constructed based on a single material with a
periodic array of air and holes running along the entire length (Russel, 2003). PCFs are
designed with small core size and large air-filling fraction so that it can confine light tightly
in the core. Therefore they have an extremely small effective mode area Aeff . The research
on these fibers has attracted a great attention recently due to their special optical properties

4
such as dispersion, polarization and nonlinearity. High nonlinearity per length can be
observed by launching enough high intensity of light within the core of these fibers which
is 10-100 times higher than that of the conventional fiber (Monro, et al., 1999). The
utilization of PCF would enable various nonlinear effects to happen by using only a
relatively short length of fiber and at a modest pump power level. Fiber nonlinearities
effects, such as stimulated Brillouin scattering (SBS) or four-wave-mixing (FWM) are also
able to provide gain and hence, incorporated as a gain medium in a fiber laser
configuration. Moreover, fiber optic amplifiers based on FWM have been also developed
with an attractive attention because of its potential for ultrafast signal processing (Yaman,
et al., 2006). As multi-wavelength fiber lasers are devices which can be generated based on
the nonlinear effects, incorporating PCFs as nonlinear gain media would be beneficial in
the construction of efficient and compact fiber lasers in the real optical world applications.
Therefore, nonlinear fiber optics has made a remarkable progress and it is expected to be
considered as an effective and a significant research area in optical telecommunication
network system.
1.2 Stimulated Brillouin scattering and its applications
When the light is propagating along the fiber, it can be scattered with same
frequency as elastic scattering or with different frequency of inelastic scattering process.
Rayleigh scattering is an elastic scattering which is one of the main loss factors in optical
fiber (Born et al., 1999 and Jenkins, et al., 2001). There are other famous inelastic
scatterings such as Brillouin and Raman scattering with the downshifted frequencies (Boyd,
2008). From quantum aspect, these inelastic scatterings can be explained as the conversion
of a launched photon of the pump wave to a scattered photon with lower frequency

5
regarding the Stokes wave. The energy difference appears as a phonon of induced acoustic
wave to conserve the energy and momentum. The main difference between Raman and
Brillouin scattering is on their generation process, which involves different types of
phonons. Acoustic phonons originated by moving grating incorporate in Brillouin
scattering whereas optical phonons caused by vibrations of medium molecules participate
in Raman scattering. A different type of incorporating phonons in scattering process makes
a basic difference; Raman scattering occurs in both forward and backward directions
whereas Brillouin scattering happens mainly in the backward direction. These nonlinear
effects are negligible if the incident pump power and interaction length are insufficient.
However, the nonlinear effects such as SBS and stimulated Raman scattering (SRS) will be
generated if the pump power is above the threshold level, which also dependent on the
interaction length. The threshold power of SRS is normally much higher than that of SBS.
Since the higher pump power wasn’t available during this study, this research is
concentrating on only the SBS nonlinear effect.
Brillouin scattering was discovered by Brillouin in 1922 through his report on the
light scattering process resulted from thermally excited acoustic waves (Brillouin, 1922).
Later Gross (1930) experimentally confirmed the Brillouin’s prediction by using liquids
and crystals as the Brillouin gain media. The observation of SBS effect also became
possible by the reinforcing of the backscattered Brillouin light after lasers invention in 1964
(Chiao, et al., 1964). Nonlinear effects such as SBS can be detrimental with a considerable
effect on the performance of the optical systems. SBS effect generates Stokes wave by
depleting the launched light pump power. It also can make Brillouin induced cross talk
effect in an optical multi-wavelength communication system. In SBS phenomenon, these
effects happens by converting the portion of incident channel power to the neighboring

6
longer wavelength channel with wavelength difference of about 0.08 nm spacing (about 11
GHz). However, the channel spacing must be almost the Brillouin shift of around 11 GHz
in silica fiber and the channels also must counter propagates to cause the Brillouin-induced
cross talk. Therefore, Brillouin crosstalk can be easily avoided with employing a proper
structure of multi-wavelength communication systems (Christodoulides, et al., 1996 and
Ho, 2000). Although SBS with generating crosstalk doesn’t effect on the channels
propagating in the same direction, it can be harmful by the way of depleting the transmitted
channel power due to the very low threshold power. This is attributed to the Brillouin
threshold power, which is only about a few miliwatts, within the output power of the
communication laser diodes. Several methods have been applied for suppressing SBS by
raising the Brillouin threshold power that are rely on increasing either the Brillouin gain
bandwidth or the spectral width of the optical channel waves (Horiuchi, et al., 1998 and
Lee, et al., 2001 (b)).
On the other hand, SBS phenomenon can be used to advantage. For example, it can
be used to amplify an optical light wave by converting energy from a pump beam to the
light wave, whose wavelength is properly chosen (Headly, et al., 2005 and Strutz, et al.,
2001). Indeed SBS can also be applied for constructing fiber sensors to measure
temperature and strain variations over a relatively long distance. This is attributed to the
fact that the Brillouin shift is dependent on refractive index of the fiber which varies with
the local environment changes such as temperature and pressure (Parker, et al., 1998 and
Cho, et al., 2005). Another most interesting applications of SBS is Billouin fiber lasers
(BFL) or Brillouin Erbium fiber lasers (BEFL) which have been studied with a great
attention since it was proposed as early as 1976 (Hill, et al., 1976; Bayvel, et al.,1989;
Smith, et al., 1991 and Geng, et al., 2008). In these type of lasers, a standard SMF or a
7
highly nonlinear fibers was used as the nonlinear Brillouin gain medium. In some cases, the
lasers are constructed by applying any optical fiber doped with rare-earth elements of
erbium (Tausenev, et al., 2008), and ytterbium (Shen, et al., 2004) as both nonlinear and
linear gain medium. A laser with Erbium doped fiber (EDF) or hybrid of EDF and SMF i is
denoted as BEFL. The laser signals generated by a BEFL operate just in a special
wavelength region provided by optical doped fiber characteristics in the cavity. The BEFL
normally operates at 1550 nm wavelength region; hence it can be used for communication
application. Since BFL and BEFL generates laser with extremely narrow linewidth which
could be a few Hz (Smith, et al., 1991 and Geng, et al., 2006) and due to the low intensity
noise, low frequency noise specifications it can also used in coherent lidar detection,
interferometric sensing material processing, and medicine (Hack, 2003; Koroshetz, 2005;
Polynkin, et al., 2007 and Polynkin, et al., 2007). The main advantages of BFLs are their
very high coherency, low threshold, and high efficiency besides the directional sensitivity
of the Brillouin gain, which are important for many applications. Among all these
applications, the generation of multiwavelength laser by cascading process of Brillouin
Stokes is one of the most popular topic in current research. This source has a potential
application in wavelength-division-multiplexing (WDM) transmission optical systems.
1.3 Brillouin Fiber Lasers (BFLs)
Fiber lasers are lasers where the active gain medium is an optical fiber , although some
lasers with a semiconductor gain medium (a semiconductor optical amplifier) and a fiber
resonator have also been known as fiber lasers (or semiconductor fiber lasers). Fiber laser
is pumped by a laser denoted as a pump with a spectral wavelength selection of radiation.
The gain medium can be an optical fiber doped with rare-earth ions such as Erbium (Er3+),

8
Neodymium (Nd3+), Thulium (Tm3+), and Ytterbium (Yb3+) pumped by some laser diodes
to amplify as a gain media in these fibers. The Brillouin nonlinear gain can also be used to
provide fiber laser known as BFL which can be radiated any wavelength once the Brillouin
pump is prepared. The BFL oscillates once the Brillouin pump (BP) power exceeds a
certain power called the SBS threshold power. A suitable design must be considered for
adding a feedback to a SBS system in the form of a Fabry-Perot (linear) cavity or a ring
cavity (Agrawal, 2007 and Cowle, et al., 1997). In order to provide a proper BFL
oscillation inside the cavity, Brillouin Stokes amplification must over-compensate the
cavity loss. The BFL will radiate at a frequency shifted from the BP frequency due to the
Doppler effect in the backward scattered light through moving grating acoustic waves
generated in electrostriction phenomenon.
Another fiber laser is the hybrid of Brillouin and Erbium incorporated in the fiber laser
construction denoted as BEFL which manipulates the nonlinear Brillouin gain in a fiber
with the linear gain from EDF as an amplifier to yield laser source with the BFL
specifications and the large output power from EDFA (Cowle, et al., 1996a). BEFLs are
capable of generating optical multiwavelength, which is also known as multi-wavelength
Brillouin Erbium fiber lasers (MBEFLs), with channel spacing about 10 GHz at room
temperature due to the Brillouin Stokes-shifted frequency from the incident Brillouin
pump. Such combs with higher number of lines in comparison with MBFLs
(multiwavelength Brillouin fiber laser) have been used as sources for DWDM systems
(Cowle, et al., 1996b and Zhan, et al., 2005).

9
1.4 FWM effect and FWM-based fiber laser
FWM phenomenon arises from the interaction of two or more coherent optical
waves through the third order nonlinear susceptibility denoted as the optical Kerr effect
such that produces the fourth signal. Generally FWM happens when light of two or three
different wavelengths is launched into a fiber, giving rise to a wave of new
wavelength known as an idler. This effect is a strongly dependent on the relative
phases of all incident signals. This process can efficiently accumulate along the optical
fibers only if a phase-matching condition is satisfied. This condition can be feasible if the
frequencies involved of launched signals are close to each other, or if the chromatic
dispersion spectra has a suitable shape. Moreover, it is difficult to fulfill the phase matching
condition over a relatively long length of fiber. Therefore, the FWM-based devices focus
on incorporating highly nonlinear fibers such as dispersion-shifted fiber (Gross, et al.,
1930), highly nonlinear fiber and photonic crystal fiber (Yusoff, 2004; Belardi, et al., 2002
and Aso, et al., 2000). Since these types of fibers have a considerable nonlinear coefficient,
using just a short length can be sufficient to provide an efficient FWM effect.
Although FWM is detrimental for signal transmission in the DWDM network
systems, but it provides an effective technological basis for optical fiber devices. This
phenomenon has capability of the basic technology to measure the nonlinearity and
chromatic dispersion of fiber. This phenomenon have also proven to be of utility in many
numbers of applications in optical systems, phase conjugate optics, and the measurement of
atomic energy structures and decay rates. FWM effect is a kind of optical parametric
oscillation and it is also able to generate multi-wavelength laser for WDM applications
(Sharping, et al., 2001). Multi-wavelength fiber laser can be obtained with a more stable
output and wider tenability using highly nonlinear fibers.

10
1.5 Multi-wavelength Laser
Transmitting data at lower rates over multiple fibers can be converted to the
transmitting at higher rates over a single fiber by applying channel multiplexing technique
which makes a larger capacity of the transmission. One of the major concerns in optical
transmission systems is the ultimate transmission capacity which critically depends on the
temporal and spectral characteristics of light. This dependence leads to a time-division
multiplexing (TDM) and WDM technology. There are some more physical limitations in
applying WDM technique such as nonlinear effects of self-phase modulation (SPM), cross-
phase modulation (CPM), SBS, SRS, FWM and parametric generation (Kim et al., 1993).
Early WDM system, denoted as wideband WDM, started the applying of the two
widely spaced in the 1310 nm and 1550 nm wavelengths. Later, the narrow-band WDM as
the second generation of WDM system was provided by incorporating two to eight
wavelengths spaced at an interval of nearly 400 GHz in the 1550 nm region in 1990s
(Derickson, 1998). Today, using multimedia applications such as TV, video conferencing
and internet causes an unprecedented need for having higher capacity. Therefore, a DWDM
system has to be introduced with a higher capacity which enables to provide a considerable
number of wavelengths with precise wavelength spacing, every wavelength with very
narrow bandwidth, and extremely little drift due to environmental condition tolerance
during the multi-wavelength operation (Fiber System-Technology survey, 1999).
Several researchers have studied Erbium doped fiber lasers (EDFLs) to produce
multiwavelength lasers with a constant wavelength spacing. One process was that EDF
were cooled by liquid nitrogen to prevent mode competition between the adjacent laser
lines and homogeneous broadening of lasing modes (Desurvive, et al., 1990). In order to
11
obtain inhomogeneous broadening, twin-core EDF has been used to produce a triple
frequency EDFL (Graydon, et al., 1996). The other method which has attracted a great
attention is generating a comb of laser lines knows as multiwavelength laser based on
Brillouin or FWM nonlinear effects, known as multi-wavelength Brillouin fiber laser
(MWBFL) or multi-wavelength fiber laser (MWFL) (Sun, et al., 2000), multi-wavelength
Raman lasers (Yamada, et al., 2001 and Koch et al., 2001) and multi-wavelength
generation incorporating semiconductor optical amplifiers (SOA) (Pleros, et al., 2002). To
meet the mentioned demand of WDM system, the proposed multiwavelength laser has to
operate with a high signal to noise ratio and flat channel power with a considerable
stability. Generally, in order to produce the multiwavelength, we have to employ intra-
cavity filter in the EDFL cavity. In some works, a polarization controller (PC) is applied
inside the cavity to control both the number of lasing lines and spacing of the
multiwavelength channels (Desuvire, et al., 1987 and Hill, et al., 1976). All in all,
multiwavelength laser is highly desirable due to the cost and size reduction, development
of the system integration and compatible with optical communication networks.
1.6 Research Objectives
The main objective of this research is to investigate and demonstrate MWFLs based
on nonlinear effects employing either Bi-EDF or PCF, or a hybrid of both for possible
applications in DWDM systems. The Bismuth host glass is used in Bi-EDF which enables
the fiber to be doped heavily with Erbium ions for use in a compact optical amplifier
design. The Bi-EDF exhibits a relatively high fiber nonlinearity, which has the potential for
realizing new nonlinear based devices such as multi-wavelength fiber laser with narrow
linewidth. Therefore, one of the aims of this research is to study the Bi-EDF amplification

12
characteristic as well as nonlinear characteristic so that it can be used to improve the
performance of the nonlinear based multi-wavelength fiber lasers. Besides Bi-EDF, PCF
also has proved unique guiding and enhancing optical nonlinear properties led to the
demonstration of a number of nonlinearity-based devices. PCFs are a class of micro-
structured fiber which possesses a solid core surrounded by a cladding region that is
defined by a fine array of air holes that extend along the full fiber length. Hence, the other
aim of this work is to propose new configurations for Brillouin and FWM based fiber laser
configurations by employing a short length of PCF. To achieve this goal, a comprehensive
study on the PCF nonlinear characteristics has also been done. At the end of this work,
enhanced configurations of the multi-wavelength fiber laser are demonstrated to produce a
flat and stable output lines as well as a constant spacing based on either SBS or FWM
effects using either Bi-EDF or/and PCF.
1.7 Thesis Overview
This thesis comprehensively studies the PCF and Bi-EDF for applications in BEFL,
BFL and FWM-based fiber laser which consists of 6 main chapters. The current chapter of
this thesis presents a brief introduction on the fiber optics field which also includes the
motivations and the objectives of this research. Chapter 2 gives an overview background on
the fundamentals of the nonlinear fiber optics such as SBS and FWM effects as well as
their applications in multi-wavelength fiber laser generation. It also introduces briefly the
main characteristics of the Bi-EDF and PCF.
Chapter 3 describes numerically and experimentally nonlinear characterization of
both PCF and Bi-EDF using a basic configuration. The pump power requirements,

13
attainable gain and saturation characteristics of the SBS process are evaluated in PCF. The
amplification and nonlinear characteristics of Bi-EDF are then investigated. In the end of
this chapter, nonlinear effect of FWM is numerically and experimentally studied by
incorporating two tunable laser sources in the configuration. The FWM efficiencies in both
PCF and Bi-EDF are then estimated using the most common and basic experimental setup.
Chapter 4 demonstrates various new architectures for BFL using either PCF or Bi-
EDF as the gain medium to reduce the threshold power of the SBS effect as well as to
increase the efficiency of the BFL. A compact fiber laser set-up is also demonstrated using
a 49 cm long Bi-EDF as the gain medium. Dual wavelength laser is then demonstrated
applying 100 m long PCF. Fiber laser based on FWM is discussed at the end of this chapter
using a Bi-EDF as the gain medium. Chapter 5 proposes advanced compact multi
wavelength fiber laser structures based on SBS and FWM effects using both PCF and Bi-
EDF. Compact configurations of BFL are investigated to achieve channels with different
order of Brillouin spacing. Then, to provide the efficient and enhanced multi-wavelength
laser, the hybrid nonlinear gain media of PCF and Bi-EDF has also been investigated and
demonstrated. The results and analysis of these studies are summarized and concluded in
chapter 6. The recommendation for further research work is also presented in this chapter.
In appendix, some selected published papers during the PhD in which the author had
actively involved is also included.

14
CHAPTER TWO: NONLINEAR EFFECTS IN OPTICAL FIBERS
2.1 Introduction
The tremendous growth of the data traffic and the internet has caused an enormous
demand for transmission bandwidth for dense wavelength-division-multiplexed (DWDM)
optical communication systems. Deployment of multi-channel laser source has become one
of the prominent and possible solutions to meet the strong demand of higher capacities in
optical network systems. The usable spectral band for a WDM system strongly depends on
the linear and nonlinear gain provided by the fiber amplifiers. The linear and nonlinear
terms in optics, mean intensity independent and intensity dependent phenomena,
respectively. When high intensity light passes through optical fibers or bulk materials,
various nonlinear effects may be observed (Agrawal, 2001). The nonlinear effects
commonly observed are second harmonic generation (SHG), third harmonic generation
(THG), four-wave mixing (FWM), stimulated Raman scattering (SRS), stimulated
Brillouin scattering (SBS), and many others. Nonlinear effects are related to the inharmonic
motion of the bound electrons under the influence of an applied electromagnetic field.
Since the silica-based transmission fibers have a wide-band operating window
ranging from 1400 - 1700nm, optical amplifiers with a wider amplification bandwidth are
required to cover all these ranges for DWDM systems. In order to extend the wavelength
range, several glass hosts such as tellurite (Wang, et al. 2008), multi-component silicate
(Ellison, et al. 1999), and Bismuth oxide based glass (Tanabe, et al. 2000) have been
developed. Now a days, Bismuth-based Erbium-doped fibers (Bi-EDFs) have been
extensively studied for use in compact amplifiers with short gain medium lengths. These
15
fibers incorporate Lanthanum (La) ions to decrease the concentration quenching of the
Erbium ions in the fiber (Shahia, 2009), which in turn allows the Erbium ion concentration
to be increased to above 1000 ppm. A fiber with such a high Erbium dopant concentration
is expected to have enormous potentials in realizing compact EDFAs and EDFA-based
devices. Additionally, the advent of small-core photonic crystal fibers (PCFs) with their
unique guiding properties and increased optical nonlinearities led to the demonstration of a
number of nonlinear-based devices (Ju, 2004; Wang, 2008). In PCFs with a solid silica
core, the guidance mechanism is somewhat similar to the total internal reflection that
occurs in conventional fibers, except that the effective cladding index is an appropriate
average of the air and silica refractive indices. The PCF is used to significantly reduce the
length of nonlinear gain medium. The nonlinear based fiber lasers configurations can be
implemented based on the Erbium gain or without Erbium in the main structure.
In this chapter, the physics governing the process of nonlinear effects in optical fiber
is presented especially SBS and FWM effects in optical fiber waveguides starting with
Maxwell’s equations. One of the main applications of nonlinear effects in optical fiber is
fiber laser to generate a laser source. The operation principle and the characteristics of fiber
laser based on nonlinear effects will be investigated in this chapter with presenting a
literature survey on the experimental analysis, measurements, and applications of nonlinear
fiber laser. Generally, this chapter reviews the nonlinear effects that occur in a typical SMF
and some background information about Bi-EDF and PCF.

16
2.2 Origin of Nonlinear effects in optical fiber
The nonlinear phenomena are studied by considering the electromagnetic wave
theory in optical waveguides as dispersive nonlinear media. The wave equations of light
propagating in a medium can be obtained by Maxwell’s equations in a dielectric material
with no free currents or charges as follows (Jackson, 1998):
Where B, E, D and H denote magnetic field, electric field, Electric displacement
field, magnetizing field, respectively. A dielectric medium exposed in the presence of an
electric field can be anticipated as a grouping of dipoles bound together for representing
electrons with ion nuclei. Along the field propagation through the material, negatively
charged electrons move against the launched field while positively charged ions move with
the field. The lattice forming the solid dielectric constrains the charged particles which can
be evenly distributed in any directions or in some certain direction stronger than others to
form an anisotropic material.
As the incident field interacts with the material, oscillation among the bound
dipoles happens. The polarization P of the material is denoted as the dipole moment per
unit volume, and the electric displacement is then defined as:
t
BE
(2.1) 0. B
t
DH
(2.2)
(2.3)
(2.4)
0. D
PED 0 (2.5)
17
where ε0 is the permittivity of free space. The polarization of the material influenced by the
radiation in optical region dominantly and strongly arises from the motions of the electrons,
because the nuclei are much more massive than the electrons. In case that the incident field
amplitude is small, electrons oscillates with the same frequency of the incident field. As
high enough field amplitude interacts with material, the electrons motions begin to deviate
from the used field and the polarization vector consists of frequencies not included in the
launched field (Boyd, 2003). The material’s polarization is represented by an expansion
series of the electric field as follow:
where χ(1) represents the linear susceptibility of the material, and the nonlinear
susceptibilities are denoted by χ(2), χ(3), and successive higher orders. The first-order
polarization represents a linear material response to the applied field as follows:
The resulting electric displacement from a linear material polarization is
The relation between the induced polarization P of the material and the incident electric
field E is expressed in the following equation as a function of the electric field,
where χ(1) is a 2nd rank tensor, χ(2) is a 3rd rank tensor, χ(3) is a 4th rank tensor, etc.
(2.6) EEEEP ...)3()2()1(0
(2.7) EP )1(0
)1(
(2.8) ED )1( )1(0
(2.9) EEEED ...)1( )3()2()1(0

18
The value of χ(2) is zero in any isotropic and centrosymmetric material such as
glasses, liquids, and gases which is left invariant in the form under inversion. The electric
displacement is caused by the first and third-order susceptibility terms. Consequently, χ(2)
diminishes in silica glasses made by symmetrical molecules of SiO2. For more
simplification, terms higher than fourth order can be neglected and χ(1) converts to a scalar
function represented by the index of refraction where n2= 1+ χ(1) (Boyd, 2003). With
vanishing of both χ(2) and χ(4), the nonlinear susceptibility in an isotropic material can be
approximated by the lowest order nonlinear effects originate from χ(3) term in the expansion
of Equation (2.6). With these approximations, Equation (2.9) becomes
where P(3)=ε0χ(3)EEE, and ε is the first-order permittivity of the material. Then for
materials exhibiting a non-negligible Kerr effect, the 3rd order susceptibility, χ(3) , is
responsible for the phenomena such as third harmonic generation, nonlinear refraction and
FWM.
The nonlinear effects happened based on the 3rd order susceptibility χ(3) that are
divided in two named categories. Firstly, this mentioned phenomena will be elastic such
that there is no energy exchanged between the matter and the incident electromagnetic
field. Since, the refractive index of the material depends on the incident light intensity,
some nonlinear effects as self-phase modulation (SPM), cross-phase modulation (XPM)
and FWM happens depending on the type of input signal, as shown in Figure 2.1.
Secondly, the inelastic scattering effect can also occur due to the third-order effects. This
)3()3()2()1(0 )1( PEEEEED (2.10)
19
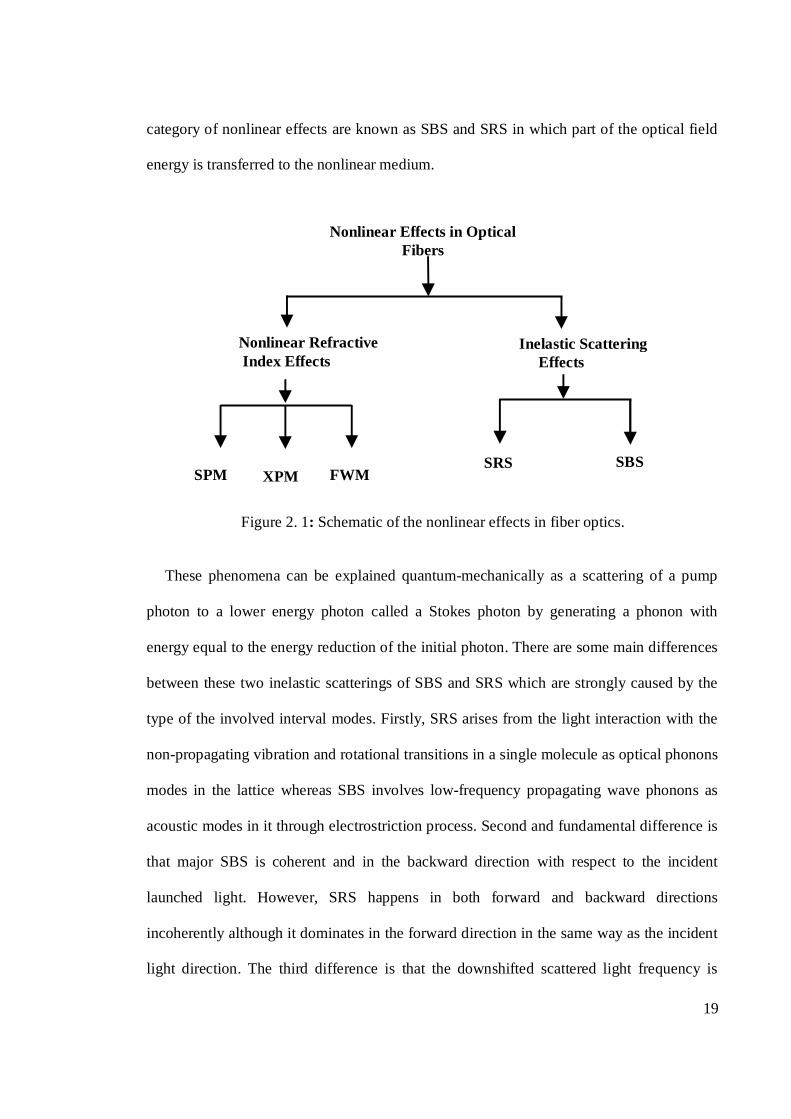
category of nonlinear effects are known as SBS and SRS in which part of the optical field
energy is transferred to the nonlinear medium.
Figure 2. 1: Schematic of the nonlinear effects in fiber optics.
These phenomena can be explained quantum-mechanically as a scattering of a pump
photon to a lower energy photon called a Stokes photon by generating a phonon with
energy equal to the energy reduction of the initial photon. There are some main differences
between these two inelastic scatterings of SBS and SRS which are strongly caused by the
type of the involved interval modes. Firstly, SRS arises from the light interaction with the
non-propagating vibration and rotational transitions in a single molecule as optical phonons
modes in the lattice whereas SBS involves low-frequency propagating wave phonons as
acoustic modes in it through electrostriction process. Second and fundamental difference is
that major SBS is coherent and in the backward direction with respect to the incident
launched light. However, SRS happens in both forward and backward directions
incoherently although it dominates in the forward direction in the same way as the incident
light direction. The third difference is that the downshifted scattered light frequency is
SPM XPM FWM
Nonlinear Refractive Index Effects
Inelastic Scattering Effects
SRS SBS
Nonlinear Effects in Optical Fibers

20
approximately 10 GHz for SBS but 13 THz for SRS with respect to the incident light
frequency in the single mode fibers. Finally, the Brillouin-gain spectrum bandwidth is less
than 100 MHz which is very narrow when comparing with the Raman-gain spectrum
bandwidth which is more than 20 to 30 THz (Diament, 1990) Since the threshold power of
SBS in long haul fibers is low, SBS provides some harmful effects in optical fiber
telecommunication network systems, however it has also been observed as a useful
applications in Brillouin amplifiers, Brillouin/erbium fiber lasers (BEFL), Brillouin fiber
lasers (BFL) which are of particular interest in this thesis and temperature sensors. The
SRS requires a relatively high incident power as a threshold power which was not available
in our lab. In the next sections, the nonlinear effects such as SBS and FWM which are
relevant to this study are especially explained.
2.3 Principles of Stimulated Brillouin Scattering (SBS)
SBS is one of the important nonlinear effects in a SMF which can shift the input
laser wavelength with certain frequency of the Brillouin shift. SBS is able to produce
Brillouin Stokes cascading process such that it can generate a laser comb with dense
constant spacing (Digonnet, 1993; Lamminpaa, 2003). Such laser comb is attractive and
has potential to become a laser source in future DWDM development. SBS can be
explained physically by a nonlinear interaction between the incident light as a Brillion
pump wave, Stokes wave or Brillouin backscattered light, and an acoustic wave generated
via electrostriction process. Through the electrostriction process, the pump signal give rise
to acoustic wave by periodically modulating the refractive index of the medium. The
principle of SBS generation in optical fibers is illustrated in Figure 2.2. The SBS was first
discovered by Leon Brillouin in 1922 in bulk media (Brillouin, 1922) and then in 1972 in

21
optical fibers and it has been considered extensively since then due to its effects for optical
systems (Agrawal, 2001). Similar to SRS, Brillion scattered light also denotes as a Stokes
wave whose frequency is downshifted from the incident launched wave with a mount
depending on the type of nonlinear medium (Cotter, 1983). Hence, the energy of the
launched high-frequency channel can be transferred to a low-frequency by SBS process
with the channel spacing of the Brillouin shift.
Figure 2. 2: Schematic plot of the SBS generation in optical fibers.
According to this fact that the scattered light frequency is very close to the incident
signal frequency, acoustic phonons provides a relatively small frequency shift of about
(~10 GHz or ~0.08 nm at 1550 nm) (Cotter, 1983). This small difference between the
backscattered light and incident signal frequency is due to the Doppler shift associated with
an induced grating propagating in the fiber at the acoustic velocity (Agrawal, 2001).
Therefore, classically, the SBS process can be described as the Bragg grating reflection of
light by a wave traveling through fiber, and ultimately incident light frequency is
downshifted due to the optical Doppler effect. The acoustic wave is propagating along the
medium or fiber at a velocity of Va corresponding to a frequency of ωa with the induced
refractive index grating period. The pump frequency ωp with the wave number of kp will
Refractive index creates a grating which moves with acoustic velocity
V ACOUSTIC
POUT
PIN
PREFLECTED
22
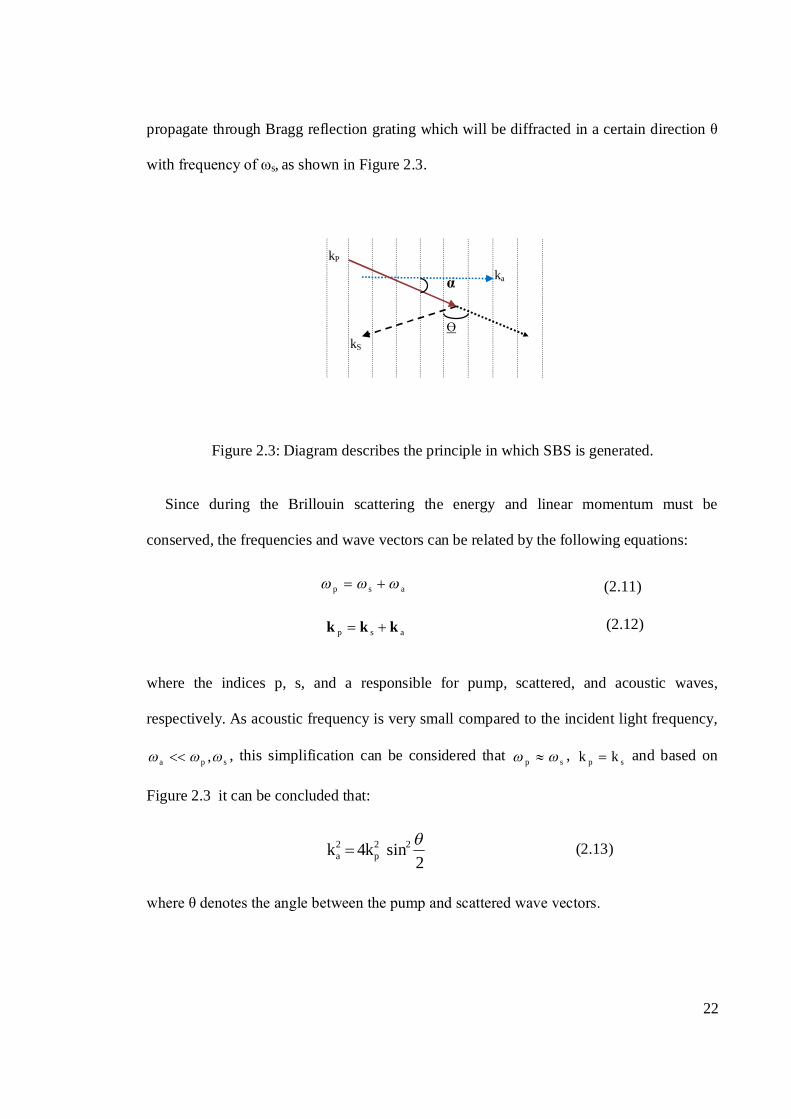
propagate through Bragg reflection grating which will be diffracted in a certain direction θ
with frequency of ωs, as shown in Figure 2.3.
Figure 2.3: Diagram describes the principle in which SBS is generated.
Since during the Brillouin scattering the energy and linear momentum must be
conserved, the frequencies and wave vectors can be related by the following equations:
where the indices p, s, and a responsible for pump, scattered, and acoustic waves,
respectively. As acoustic frequency is very small compared to the incident light frequency,
spa , , this simplification can be considered that sp , sp kk and based on
Figure 2.3 it can be concluded that:
where θ denotes the angle between the pump and scattered wave vectors.
(2.11)
(2.12)
(2.13)
asp
asp kkk
2sink4k 22
p2a
α
Ɵ
kP
kS
ka

23
According to the wavenumber and frequency relation asa
aa v
k , and
p
pp v
k
, it can be
obtained as:
where vp refers to the pump light wave velocity. It is clear that the backscattered Brillouin
frequency depends on the angle θ, the scattering angle. Hence, Brillouin frequency shift
diminishes when the pump and scattered fields propagate in the same direction and has its
maximum value of pp
a
vv
2 when the scattered Brillouin Stokes propagates in the opposite
direction )( corresponding to the incident light propagation in optical fibers. When
the incorporated medium is a typical type of single mode fiber, only the backward
scattering is monitored in which the Brillouin frequency shift νB is given by
where ne is the refractive index of the medium. For the typical kind of silica fiber which is
made from SiO2 mainly, it can be assumed that Va = 5.96 km/s, ne = 1.45 and p =1.55μm,
then from Equation 2.3, νB =11.2 GHz or ∆λ≈ 0.09 nm as the Brillouin wavelength shift. To
simulate the SBS nonlinear effect, the propagating signals equations studied along the fiber.
This will be discussed in the remaining part of this section.
A material density function ρ [kg/m3] which is satisfying the wave equation driven
via electrostrictive process in position z and at time t can be written as (Boyd, 1990):
(2.14)
(2.15)
(2.16)
spa EEi
t
2
)2
sinvv21(
p
aps
p
aeaB
Vnv
22

24
where ρ (z, t) is responsible for the complex amplitude of the variation from the mean
value ρ0 in the fiber. The phonon intensity decay rate is referred to the Γa and the Brillouin
coupling constant Λ will be introduced below. Es (z, t) and Ep(z, t) are the complex optical
fields amplitude of the backscattered Stokes and the pump waves along the Brillouin-active
medium, which can be identified with the following equations:
The refraction index is n, the light speed is c, and α is the attenuation coefficient. It
is worth noting that Stokes field is propagating in the negative z direction as assumed in
this equation and the transverse variation of the pump and Stokes fields have been ignored
(Agrawal, 2001). According to the reference (Boyd, 1990), the constants k and Λ are then
defined as
The acoustic or sound wave frequency is related to the wave vectors of the pump and
Stokes waves kP and kS by the relationship Ω = qν, where q = kP + kS ≈ 2k=2ωn/c is the
acoustic wavenumber (Boyd, 1990). The parameter γe=ρ (δεr / δρ) is denoted as the
electrostrictive constant, where εr is the relative permittivity (Melloni, 1998).
(2.17) Sp
PP EikEt
Ecn
zE
2
PSSS EikE
tE
cn
zE
2
(2.18)
(2.19)
(2.20)
nck e
04
ncqe
2
2
25
In the steady state, all explicit derivatives respect to time t are set to zero so that the
material density is modified as:
In order to solve the equations (2.17 - 2.18) and (2.16), it is common to consider that the
pump, Stokes, and acoustic waves are plane waves traveling in the z direction along the
fiber length (Yeniay, 2002).
(2.22)
(2.23)
in which c.c. denotes the complex conjugate of the first term with the assumption that the
amplitudes E0p, E0s are not functions of time according to the steady-state regime.
Substituting the pump and Stokes intensities, IP and IS which are defined based on the
Equations (2.22 and 2.23) by substituting in Equations (2.17 and 2.18) results in the
following coupled differential equations:
where Bg , known as the Brillouin gain coefficient is:
)(2
SPa
EEi (2.21)
(2.24)
(2.25)
(2.26)
..)(E21),(E )(
0pp cceztz zkti pp
..)(E21),(E )(
0ss cceztz zkti ss
sssBs g III
dzdI
p
pppp III
dzdI
sBg
a
e
aB nc
kg
3
0
224

26
In a conventional single mode optical fiber, the Brillouin gain coefficient Bg will be
divided by a factor of 1.5 due to randomly variation of the relative polarization angle
between the pump and Stokes wave (Deventer, et al. 1994). By solving the SBS coupled
equations, the most important factors characterizing SBS effect such as the threshold input
power and sufficient active length of fiber can be obtained. Therefore, finding a technique
or method to estimate the proper conditions of input pump power and fiber length is very
significant and critical. In order to solve analytically the coupled equations of representing
SBS effect, these transformations can be used as the following (Jenkins et al., 2007) terms:
sp II V , sp II U
and
22 VUS
Such that the differential equations can be modified as
UzV
dd
VSgzU B
2dd
Noting that VdVdUUdVdS 2)(2 , the coupled equations can be modified to the
following equation:
zVSg
zB
dd
ddS
By a direct integration the last equation over the fiber length, a conservation relation will be
considered as:
constant)Ln(S)Ln(S0
z
BB VgVg
Therefore, U can be obtained in terms of V by transferring the Equation (2.31) to the
exponential function as:
(2.27)
(2.28)
(2.29)
(2.30)
(2.31)
(2.32)
27
2
02
020 )](exp[)( VVVgVUU B
where )0(0 zVV and )0(0 zUU . Finally, from Equations (2.29) and (2.32), it is
revealed that V can be obtained exactly by solving the following integration
)(
)0( 20
20
20 )](exp[)
zx
x B
zxVx
gVU
(
dx
Since it has not been any closed form solution for this integral so far, it should be solved
numerically (Jenkins et al., 2007). To solve these equations, it is convenient to consider
some assumptions as ignoring the pump depletion term. In this approximation known as the
no depletion pump, the pump intensity IP is only a function of fiber loss. Due to the
relatively small amounts of the acoustic wave frequency ωa, it is assumed that ωP ≈ ωS and
then sp . In the case of a weak nonlinear coupling, such that Is << Ip, the solutions
of the coupled SBS Equations (2.75) and (2.76)
and
)])A/Pexp[()(I)0(I eff.eff.0 LLgL Bss
In this relation, effp0 A)0(IP is denoted as the incident pump power, Aeff. = πr2 is the
effective core area of the Stokes wave in the optical fiber where 2r is the mode field
diameter of the beam, and Leff is the effective interaction length defined as
)]exp(1[1eff. LL
The effective interaction length, effL , is slightly smaller than the actual fiber length L due
to fiber linear loss. In the case that the fiber is very long, the approximation 1)exp( L ,
for instance, the effective interaction length of a SMF with 25 km long is about
(2.33)
(2.34)
(2.35)
(2.36)
(2.37)
)exp()0(I)(I pp zz

28
where .(km)0.0437dB/km)(19.0 -1 The Equation (2.36) indicates how a Stokes
signal grows exponentially in the backward direction along the active nonlinear medium
due to the Brillouin amplification that happens as a result of SBS scattering. Hence, the
described phenomenon is a SBS process in which the backward Brillouin Stokes input
originates from spontaneous Brillouin scattering and Rayleigh scattering occurring within
the fiber. It is evident that the assumption of ignoring the pump depletion breaks when the
amount of Is becomes a comparable level with that of the input pump intensity Ip.
One of the most significant features of the characterizing Brillouin scattering
process is the SBS threshold power. For a common case, there is no Stokes input by
another external laser at the end of the fiber. Brillouin scattering arises from thermal
fluctuations in the density as spontaneous Brillouin scattering, threshold power defined
analytically by Smith’s definition. This definition assumes in the absence of pump
depletion, threshold power is the input pump power at which the backscattered Stokes
power is equal to the incident pump power (Smith, 1972):
eff
(0)B
effth Lg
A21P
In optical communication systems at 1550nm, the conventional values for optical single
mode fibers are 2eff 50A m , km21Leff , and W/m105 11)0( Bg , Equation (2.39)
results in mW1Pth . It is such a low threshold power that makes SBS a dominant
nonlinear phenomenon in optical fibers.
)km(86.22/1eff L (2.38)
(2.39)
29
2.4 Nonlinear refractive index effects
As described above, optical fiber responds nonlinearly under the influence of the
high intensity due to the inharmonic motion of the medium bound electrons (Agrawal,
2007; Saleh et al., 1999). A change in the refractive index of a medium in responding to an
incident intense electric field is called Kerr effect. As it is relevant to this study, namely
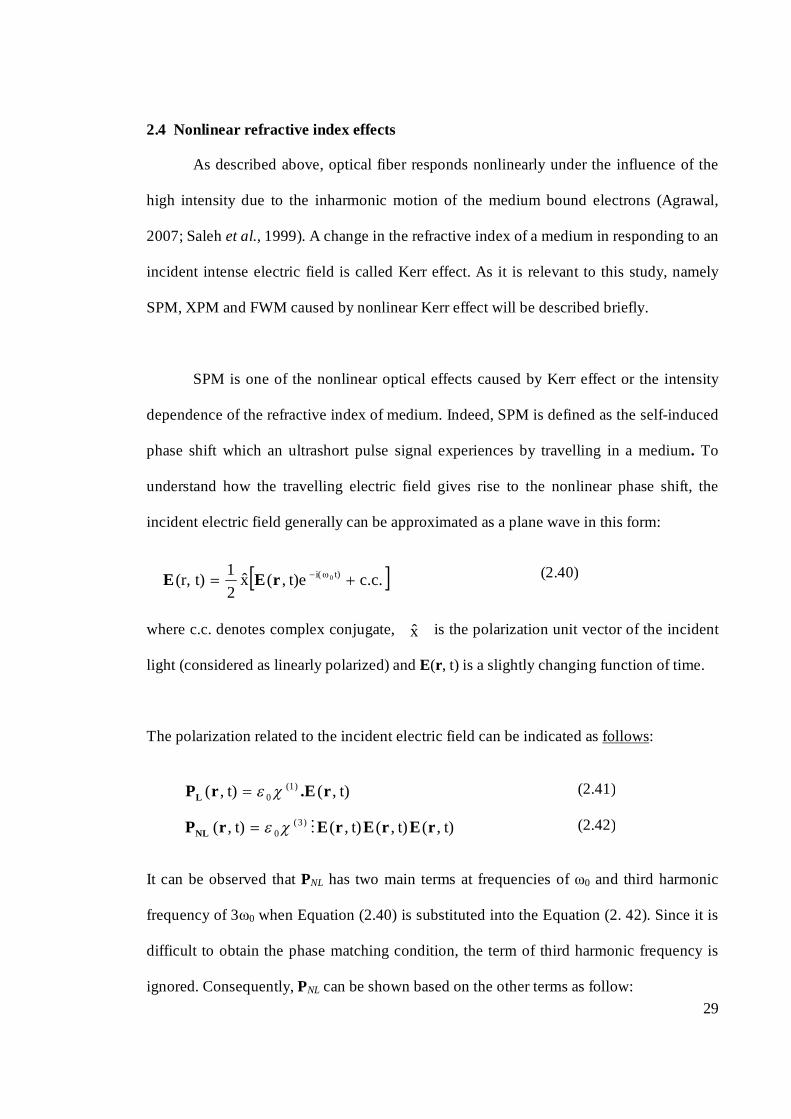
SPM, XPM and FWM caused by nonlinear Kerr effect will be described briefly.
SPM is one of the nonlinear optical effects caused by Kerr effect or the intensity
dependence of the refractive index of medium. Indeed, SPM is defined as the self-induced
phase shift which an ultrashort pulse signal experiences by travelling in a medium. To
understand how the travelling electric field gives rise to the nonlinear phase shift, the
incident electric field generally can be approximated as a plane wave in this form:
where c.c. denotes complex conjugate, is the polarization unit vector of the incident
light (considered as linearly polarized) and E(r, t) is a slightly changing function of time.
The polarization related to the incident electric field can be indicated as follows:
It can be observed that PNL has two main terms at frequencies of ω0 and third harmonic
frequency of 3ω0 when Equation (2.40) is substituted into the Equation (2. 42). Since it is
difficult to obtain the phase matching condition, the term of third harmonic frequency is
ignored. Consequently, PNL can be shown based on the other terms as follow:
(2.40)
x̂
c.c.t)e,(x̂21t)(r, t)i( ω 0 rEE
(2.41)
(2.42)
t),(t),( )1(0 r.ErPL
t),(t),(t),(t),( )3(0 rErErErPNL

30
where εNL is the nonlinear term of the dielectric constant defined by :
As a result, the total dielectric constant can be described as follow:
The dielectric constant can be substituted to describe the refractive index n(ω) and the
absorption coefficient α (ω) incorporating the definition of ε = (n + i α/2k0)2 . As mentioned
above, n (ω) depends on the launched light intensity due to the εNL and can be described as:
And so the nonlinear phase shift is obtained by
where Leff is effective fiber length by Equation (2. 37), n2 is the nonlinear-index coefficient
which its value can be around of 2.16 × 10⁻²⁰ m2/W (Agrawal, 2001). According to this
equation the nonlinear phase shift is a function of effective area and incident pump power
as well by this relation
Hence, higher value of φNL can be obtained by incorporating a fiber with smaller value of
Aeff , longer Leff and/or higher launched pump power. To find a suitable fiber, these factors
play significant roles for generating nonlinear effects.
(2.43)
(2.44)
t),(t),( 0 rErPNL NL
2t),(43 rE3
xxxx NL
(2.45) NLL
220)( Ennn (2.46)
(2.47) 222)( E
nLt eff
NL
effAPE /2 (2.48)

31
According to the equation (2.47) the time varying of nonlinear phase shift leads to a
spectral modification of the transmitted pulse which typically makes the pulse shape
broader. To look how the transmitted pulse spectrum is modified, the instantaneous
frequency ω (t) of the pulse will be described by:
in which
where δω(t) stands for the variation of the instantaneous frequency. Therefore, it can be
observed that the spectrum frequency of the transmitted pulse will be modified by SPM
nonlinear effect originated from Kerr effect. This nonlinear effect which causes the spectral
broadening in optical fibers can realize many nonlinear devices as a nonlinear loop optical
mirror (Petropoulos et al., 2001), and optical 2R regenerator( Lee, et al., 2001(a)).
In addition to the SPM which is a self-induced phase shift, there are some other
nonlinear effects caused by the Kerr effect as XPM and FWM effects. XPM refers to the
induced phase shift of an optical field propagating in a fiber caused by another optical field
having either a different wavelength, or direction, or polarization form (Agrawal, 2001).
However, in this explanation, the case of optical fields with different wavelengths is
considered with the same state of the polarization and direction. FWM is also another
nonlinear effects which occurs when two or more frequencies of optical fields propagate
through a medium (Inoue, 1992). Provided that phase matching condition is satisfied,
incident optical power can be converted and generate new frequencies. From the quantum
mechanics perspective, FWM occurs when photons from one or more waves are annihilated
(2.49) )()( 0 tt
)()( tdtdt NL (2.50)

32
and new photons are created at different frequencies such that the net energy and
momentum are conserved (Agrawal, 2001). FWM caused by the third-order optical
nonlinearity term can be explored by considering four optical fields at frequencies ω1, ω2,
ω3 and ω4 which are linearly polarized and propagating along the same direction as the z
axis. Then, the total electric fields propagating in the medium can be written as
where kj = nj ωj / c , which nj is the refractive index while c.c. refers for complex conjugate.
By substituting Equation (2.51) in Equation (2.42), nonlinear polarization indicates the
following form
..)(expP21ˆ
4
1cctzkix
jjjNL
jP
where Pj includes a large number of terms which is involving the three terms of electric
fields production. For example, P4 can be represented as
...))exp(2)exp(2
)(2(4
3P
321321
42
32
22
12
130
iEEEiEEE
EEEEExxxx4
tzkkkk )()( 43214321
tzkkkk )()( 43214321
It is worth noting that the terms proportional to E4 in Equation (2.53) stand for SPM and
XPM nonlinear effects. The remaining terms which represent new waves at different
frequencies are responsible for FWM effect. Since FWM is a phase-sensitive phenomenon,
the efficiency strongly depends on the phase matching of the relative phases of E4 and P4 as
shown by θ+, θ-. The term that includes θ+ is responsible for a condition that three photons
converting energy to a single photon at frequency ω4 = ω1+ ω2+ ω3. The term with θ-
(2.51)
(2.52)
(2.53)
(2.54)
(2.55)
..)(expE21ˆ
4
1cctzkix
jjj
jE

33
represents the case that two photons at frequencies ω1 and ω2 converting energy to the other
photons at frequencies ω3 and ω4 such that
2143 ,
Consequently, it leads to the phase-matching requirement as follow
0/)( 221144332143 cnnnnkkkkk
Dispersion is the key parameter that plays a significant role in satisfying the phase
matching condition. Providing that zero-dispersion wavelength is localized in the middle
among the four interacting waves, the phase matching condition will be fulfilled for a
uniform zero-dispersion wavelength along the fiber (Inoue, 1992a). Besides the fiber
dispersion, channel spacing of incident lights also affects the FWM efficiency. According
to the dispersion variation with wavelength, the incident and generated waves are found to
have different group velocities. This fact causes phase mismatching of the interacting
waves and reduces the efficiency of the converting power to the new generated waves. The
higher value of the group velocity and the wider value of the channel spacing provide the
lower FWM efficiency. The generation of new frequency waves through FWM effect can
induce crosstalk in WDM network system and limit its performance especially around the
zero-dispersion wavelength. However, this process can also be useful to build nonlinear
fiber devices such as wavelength converters (Inoue, et al., 1992; Dorman et al., 1999),
phase conjugators (Yariv, et al., 1979), optical parametric oscillator (OPO) (Sharping et al.,
2002) squeezing (Slusher et al., 1985 and Levenson et al., 1985), frequency metrology
(Washburn et al., 2004; Diddams et al., 2001 and Jones et al., 2000) and spectroscopy.
Four-wave mixing in a dispersion-shifted fiber was used for yielding comb-like spectra
(Chen et al., 2010), and a rational harmonic fiber ring laser was successfully constructed
(2.56)
(2.57)

34
(Yu et al., 2001). In this thesis, FWM will be applied to build a multi wavelength
generation (comb-like spectrum) and will be discussed in the following chapters.
2.5 Nonlinear effects applications in optical fibers
The fiber optics research has progressed well recently especially in field of laser,
communication network and sensors (Yu et al., 2001; Huang et al., 2010 and Sun et al.,
2010). Recently, the most common and significant nonlinear effects such as SBS and FWM
plays key roles as possible solutions to meet the strong demand of higher capacities in
WDM communication network. One of the main solutions is multi-wavelength (multi-
channel) laser source to make the WDM cost-effective. Multi-wavelength fiber laser has
many possible applications such as in DWDM systems and sensors. Today, Brillouin
Erbium fiber lasers (BEFL) have been investigated extensively using various configurations
to produce multiple wavelengths in both the C band and L band regions (Zhao et al., 2010;
Li et al., 2010 and Liu et al., 2009). Although it suffers the disadvantage of low tuning
range due to homogenous effect in the Erbium doped fiber (EDF) that caused free running
modes to oscillate in the laser’s cavity. A number of different configurations of multi-
wavelength BEFL in a ring and in a linear cavity have been proposed and demonstrated by
many researchers (Doug et al., 2010 and Liu et al., 2009). To mitigate the limitation of
tuning range, multi-wavelength Brillouin fiber laser (BFL) can be used, even though the
use of BFLs has not been considered seriously because of the limited number of lasing lines
and undesirable power flatness. To look how this laser source can be generated, firstly the
characteristics of fiber laser should be investigated. In the next section, it will be discussed
about the basic principle of the linear gain provided by EDF and nonlinear gain originated
from the cascading of the SBS and FWM in a conventional single mode fiber.

35
2.5.1 Fiber laser principle
The primary and main purpose of optical fiber fabrication firstly was only about
light transmission. This low loss light guiding property quickly results in other applications
such as optical amplifiers and fiber lasers. Optical fiber utilized as a laser gain medium was
first introduced in 1964 (Koester et al., 1964), shortly after the first laser appeared (Maiman
Koester et al., 1960), the first fiber lasers were realized in the 1970s in both pulsed (Stone,
et al., 1973) and continuous-wave (CW) (Stone, et al., 1974) forms. Fiber lasers (FLs) are
lasers with an optical rare-earth doped fibers as the active gain medium. These rare earth
ions incorporated as the active gain medium in FLs are mostly Erbium, Neodymium,
Thulium and Ytterbium which can make laser over a wide wavelength range from 0.4 m
to 4 m.
Fiber lasers configurations can be designed based on the various schematics of laser
cavities. The most common sort of these cavities are Fabry-Perot (linear), ring and figure-
of-eight configuration which includes three basic elements as the pump source, gain
medium and oscillation cavity (France, 1991). Figure 2.4 illustrates a simple schematic of
conventional fiber laser cavities set-up.
The Fabry-Perot cavity (resonator) illustrated in Figure 2.4(a) contains a gain
medium which is localized between two highly reflecting mirrors. In optical fibers, the
mirrors of cavity can be fiber Bragg grating (FBG) or loop mirrors made from optical
circulators and optical couplers as shown Figure 2.4(a). In case that optical circulators or
optical couplers are being used as reflectors, the loss might be higher than the FBG usage

36
case. This can be attributed to this fact that FBG can reflect special band of wavelength
and with less power losses in splicing and connections.
(a) Fabry-Perot (linear) Cavity
(b) Ring Cavity
Figure 2. 4: Schematic plots of Fiber lasers cavities.
Ring cavities are the other choice of fiber laser configurations which often used to
provide unidirectional oscillation of a laser. In the case of optical fiber lasers, a main and
useful feature of ring cavity is that it can be designed without utilizing any mirrors. In the
simplest configuration, two ports of an optical coupler are connected together to form a ring
oscillation including the doped fiber as the gain medium as shown in Figure 2.4(b). An
isolator is incorporated within the loop to realize the unidirectional operation. One
Pump Output
Reflector Reflector
Oscillation
Gain Media
Pump Output
WDM / Coupler
Isolator
Oscillation
Cavity
Gain Media

37
significant advantage of the ring cavity configuration is that it can be made-up of all fiber
optics components, and then making such designs is much easier to be set-up.
The advances in optical fiber lasers are targeted to be utilized today as high average
power CW lasers, high quality low power seed lasers, and compact lasers. Fiber lasers as
used in the mentioned applications have many advantages compared to the bulk lasers. In
the case of high power use, the cooling process is easier as well as they are compact and
easy to build, to manipulate and align, and to transport. Fiber laser architectures can be also
robust when they are made of fibers only. They are easy to integrate and do not require any
complicated alignment or coupling. Indeed, fiber lasers are starting to replace the bulk and
solid state lasers in many areas.
Another type of fiber lasers known as Brillouin /Raman fiber lasers (BFLs and
RFLs) are relying on inelastic nonlinear effects associated with using nonlinearity of the
gain medium such as Brillouin and Raman scatterings. Raman fiber laser can realize a
relatively high power laser about a few Watt with considering also requirement of high
input pump power. However, Brillouin fiber lasers can happen with a relatively low
threshold power with a small linewidth output. According to the limitation of high power
Raman pump in our laboratory and it is not relevant to this thesis, only Brillouin fiber laser
will be described in the following section.
2.5.2 Brillouin fiber laser and Brillouin Erbium Fiber Lasers
BFLs have been studied with increasing attention and interests since 1976 (Hill et
al., 1976 and Montes et al., 1999). The generated Brillouin scattering can be controlled and

38
amplified within a cavity to realize a suitable Brillouin laser wave. The transmission fiber
and specially designed nonlinear fiber can be used as the nonlinear gain medium to
overcome the cavity loss by providing sufficient Brillouin gain function Bg within the
cavity. As described earlier, one of the significant features of SBS generation is its
threshold power introduced as Equation (2.39). In order to measure the threshold power, a
very conventional and basic configuration was used which will be discussed with more
details in chapter 3. As described earlier, the Brillouin gain is a function of fiber
characteristics and then according to Equation (2.39), its value effects on the SBS threshold
power. In most cases, threshold power is very high within basic and conventional
measurement backward configurations. Note that when the threshold power should be
measured, a basic and common set-up must be used. However, in some cases we want to
reduce the threshold power because insufficient length of the gain medium, an advanced
configuration can be used. In this case, the configuration design functions to compensate
the input power and/or the fiber length shortages. Furthermore, the type of cavities
mentioned earlier can be used to design an efficient Brillouin fiber laser. It is worth noting
that the output laser should be monitored in the backward direction according to the SBS
characteristic.
Other important characterizing features of SBS effect are the Brillouin shift
frequency and linewidth. The Brillouin frequency shift is denoted as the difference in the
Brillouin Stokes generated of BFL and launched Brillouin pump (BP) frequencies (Smith et
al., 1991 and Shirazi et al., 2007). It is depended on the operating wavelength region as
described in Equation 2.15. The Brillouin Stokes linewidth is very narrow compared to the

39
other fiber lasers. It becomes significantly narrower than the Brillouin pump linewidth with
reductions of up to a few Hertz (Smith et al., 1991).
Brillouin Stokes lasers can be produced by either BFL or BEFL. Each of lasers has
their own specific advantages and drawbacks. Generally, it is preferable to use a medium
with a higher Brillouin gain coefficient to lower the required power and also to shorten the
incorporated fiber length. Cowle and Stepanov (1996) had introduced BEFL using a hybrid
gain media; nonlinear fiber and EDF to assist in laser generation. Further developments of
this laser have been carried out by many researchers (Harun et al., 2003 and Lim et al.,
1998). The 980/1480 nm pumped EDF generates amplified spontaneous emission, which
oscillates in the BEFL cavity to produce free running modes. In order to amplify the
Brillouin scattered waves generated by single mode fiber within the cavity, the BP
wavelength will be launched at the same wavelength of free running modes. Therefore,
only a certain Brillouin Stokes wavelengths can be amplified according to the free running
modes. It causes a limitation in the Brillouin scattered tuning wavelength range. On the
other hand, BFL has no limitation on the wavelength tuning range but requires a higher BP
power and lower loss cavity compared to BEFL to efficiently generate single and cascaded
Brillouin laser. Both types of Brillouin lasers will be thoroughly investigated in this thesis.
2.5.3 Multi-wavelength operation
Multi-wavelengths laser sources have attracted a great interest in many applications
such as WDM transmission systems, optical sensors, and spectroscopy (Han, et al., 2005
and During et al., 2002). Many researches have been done on nonlinear fiber lasers to
generate multiple wavelengths with an equal constant wavelength spacing (Desurvive et
al., 1990 and Graydon et al., 1996) using SBS or FWM nonlinear effects. For instance, a

40
comb of laser lines can be generated by a BFL via a cascading process of the Stokes. In this
process, each Stokes wave acts as a Brillouin pump for generation of successive Stokes.
The laser cavity should be efficient enough to provide the Stokes with a sufficient power to
fulfill the requirement of threshold power. This can be easily achieved by providing an
Erbium gain in the laser cavity to assist the cascading process as in a BEFL. During this
process, anti-Stokes waves with higher frequency are also generated via FWM effect
occurring between co-propagating pump and Stokes waves and increases the number of
laser lines.
As explained in the previous section, BEFL manipulates the nonlinear Brillouin
gain in an optical fiber to produce a narrow linewidth laser at the higher output power with
assistance of Erbium gain (Cowle, et al., 1996). The new BEFLs with a short piece of Bi-
EDF as the gain medium will be demonstrated in Chapter 5 of this thesis. The comb lasers
can also be produced by FWM effect as long as the phase match conditions will be
satisfied. In this case the wavelength spacing value is not fixed as happening in SBS
cascading effect which is around 0.08 nm. In FWM laser, multi-wavelength spacing
depends on many conditions such as used fiber nonlinear coefficient and configuration
design. This topic will be further discussed in the next following chapters.
2.6 Nonlinear Optical Fibers
2.6.1 Bi-EDF
Many works have been done to study the properties of Bismuth Borate glass in
many conditions such as un-doped (Becker, et al., 2003), Er3+-doped (Chen et al., 2004) or
Nd3+-doped (Chen et al., 2005). For instance, Tanabe et al., (2000) indicated that the

41
luminescence lifetime and efficiency of Er3+ doped Bi2O3 and SiO2 glasses reduce with
B2O3 content increment. Similar results were also reported by Yang et al., (2004) for Bi2O3
glasses. Becker et al. (2003) reported that the refractive index of the Bismuth Borate glass
can be widely varied, which is useful in fiber fabrication.
The fabrication of Bismuth oxide fiber was demonstrated by incorporating three
main former elements, Bismuth oxide Bi2O3, silicon oxide SiO2 and alumina Al2O3. The
core and cladding refractive index of this fiber are nearly 2.03 and 2.02, respectively at 1.55
μm, whereas these are about 1.45 for SMF. This fiber has a relatively small core size,
which can confine the light in the center of fiber core for a better pump and signal
absorption and thus improves amplification process. This feature also increases the
nonlinearity of the fiber, which creates another application in the nonlinear fiber laser. This
fiber also has a capability to be doped with higher Er+3 ions concentration compared to the
conventional silica-based EDF. The utilization of Bismuth glass as fiber elements allows
the erbium ion concentration to be more than 3000 ppm (Sugimoto et al., 2004) without
experiencing the ion clustering and quenching effects compared to SiO2 glass. This type of
fiber also has a wider amplification bandwidth due to suppression of excited state
absorption.
Indeed, the larger values of Judd-Ofelt intensity coefficients, Ω2, 4, 6, of Bi2O3
results in higher peak emission cross-section and wider emission bandwidth (Sugimoto et
al., 2006). According to the optical fluorescence emission and absorption measurements,
Bi-EDF possesses a higher peak coefficient of 7.58 × 10⁻²⁵ m2 and broader full width half
maximum (FWHM) value of nearly 80 nm in comparison with silica based EDFA (Si-
EDFA) especially at a longer wavelength region. Figure 2.5 shows the schematic plot of the

42
gain bandwidth of Si- and Bi-EDFA against fiber length and Er+3 ions concentration. As
shown in this figure, the Bi-EDFA in comparison with Si-EDFA performs better in term of
bandwidth and compactness. The Bi-EDFA has a broad band gain profile covering 1530 to
1620 nm and a short gain medium length, which 1/100 to 1/10 shorter than a Si-EDF due
to high Er+3 ions concentration.
Figure 2. 5: Schematic plot of the gain bandwidth of silica and Bismuth EDF against fiber length and Er+3 ions concentration.
The base structure of Bi-EDF is illustrated in Figure 2.6, which contains the
yellowish powder of Bismuth oxide atoms with melting temperature point of 817oC. In this
study, the Bi-EDF used has Er+3 ions concentration of 3250 wt.ppm (weight parts per
million) and La ion concentration of 4.4wt%. Lanthanum ion is used to suppress the ions
quenching as the erbium ions concentration is increased (Sugimoto et al., 2004). The Bi-
EDF used is a commercially available from Asahi Glass Co. with different lengths of 49
and 215 cm. The cross section of the Bi-EDF is presented in Figure 2.7. The Bismuth fiber

43
also has a large content of the group velocity dispersion (GVD), which is mainly caused by
the material dispersion of the high refractive index of the glass (Agrawal, 2001).
Figure 2. 6: Schematic plot of the distribution of erbium ions in bismuth-based glass (Jusoh, 2008).
Figure 2. 7: The cross-section image of the Bi-EDF, provided by AGC.
Since the melting point of Bi-EDF (~ 800oC) is much lower than that silica fiber
(nearly more than 1000oC), the fusion splicing of Bi-EDF is the main problem to splice the
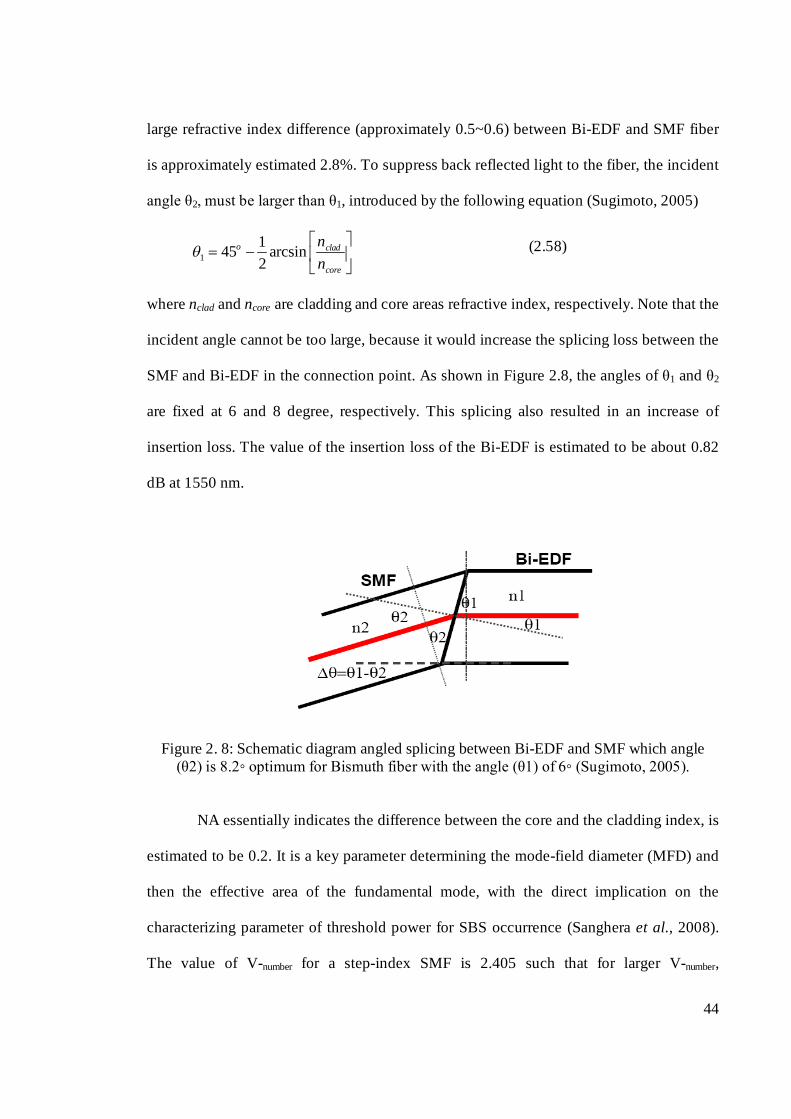
Bi-EDF to standard telecommunication fiber. Therefore, the Bi-EDF used is angled-spliced
with a standard high numerical aperture (NA) silica fibers (as Nufern 980-HP) as depicted
in Figure 2.8. The mixed angled-cleaving fusion splicing is applied to suppress the
reflection effect, which arises from the large refractive index difference between the Bi-
EDF and silica fiber (Sugimoto, 2005). Fresnel reflection loss which is caused due to the
44
large refractive index difference (approximately 0.5~0.6) between Bi-EDF and SMF fiber
is approximately estimated 2.8%. To suppress back reflected light to the fiber, the incident
angle θ2, must be larger than θ1, introduced by the following equation (Sugimoto, 2005)
1145 arcsin2
o clad
core
nn
where nclad and ncore are cladding and core areas refractive index, respectively. Note that the
incident angle cannot be too large, because it would increase the splicing loss between the
SMF and Bi-EDF in the connection point. As shown in Figure 2.8, the angles of θ1 and θ2
are fixed at 6 and 8 degree, respectively. This splicing also resulted in an increase of
insertion loss. The value of the insertion loss of the Bi-EDF is estimated to be about 0.82
dB at 1550 nm.
Figure 2. 8: Schematic diagram angled splicing between Bi-EDF and SMF which angle (θ2) is 8.2◦ optimum for Bismuth fiber with the angle (θ1) of 6◦ (Sugimoto, 2005).
NA essentially indicates the difference between the core and the cladding index, is
estimated to be 0.2. It is a key parameter determining the mode-field diameter (MFD) and
then the effective area of the fundamental mode, with the direct implication on the
characterizing parameter of threshold power for SBS occurrence (Sanghera et al., 2008).
The value of V-number for a step-index SMF is 2.405 such that for larger V-number,
(2.58)

45
corresponds with higher potential for the number modes. Using these parameters of NA and
V-number, the MFD of the BI-EDF is calculated to be approximately 6.12 μm using the
Marcuse empirical formula (Marcuse, 1977). Consequently, the effective area Aeff of the
fiber is obtained at about 29.4 (μm)2 when it is evaluated by (π/4)(MFD)2. The Bi-EDF also
exhibits another striking feature which is its ultrahigh nonlinear coefficient due to its high
refractive index and Erbium ion concentration characteristics. The nonlinear coefficient of
the Bi-EDF is approximately 100 times larger than that of silica-based highly nonlinear
fiber (HNLF) (Sugimoto et al., 2004). Hence, it can be utilized as a promising nonlinear
gain material for realizing nonlinear based devices (Harun et al., 2008; Ahmad et al., 2009)
which will be explored more in detail in the following chapters of this thesis.
2.6.2 Photonic crystal fiber
PCF which is also known as holey fibers (HF) or microstructure fibers (MF) is a
new class of fibers with novel and unique properties. PCFs are able to confine light in
hollow core and provide high effective nonlinearity and managed dispersion characteristics
(Sinha et al., 2003). Since PCFs have specifications that are not achievable with the
conventional standard fiber technology, PCFs has been attracted a remarkable attention in
the research community. Therefore, among the other fibers, these interesting abilities have
resulted in many applications in communications, spectroscopy and metrology. For
instance, a small size of core of this fiber is useful for fiber laser and super-continuum
generation applications (Genty et al., 2002).
PCFs are designed as an array of air holes in the fiber’s cladding region surrounding
the silica core such that run along the entire fiber length (Russell, 2003). Figure 2.9

46
illustrates a standard structure of the PCF. The air holes reduce the cladding’s refractive
index and lead to light confinement inside the core. In fact, the size and arrangement
manner of air holes arrays, and also core size determine the guidance property of the PCF.
The main parameters governing guidance properties of PCF are the hole size d, the distance
between adjacent holes Λ (which is nearly on the light wavelength scale) and their ratio d /
Λ, named as the air fill fraction to indicate the air percentage inside the PCF. A schematic
profile of a common PCF’s refractive index is shown in Figure 2.9.
Figure 2. 9: Refractive index profile of the PCF with silica core.
The effective refractive index neff of the cladding needs to be calculated for each
PCF. Since the neff is determined with the air existence, it can be considered that light is
confined to the core by the holes and the guidance is much more efficient. The most
common choices of materials to fabricate PCF are pure silica glass and some percentage
Germanium doped silica glass (Zou et al., 2005). Figure 2.10 illustrates scanning electron
microscope images (SEM) of various types of PCFs which can be classified into two
fundamental categories, solid-core and hollow-core.

47
Figure 2. 10: SEM micrographs of a photonic-crystal fiber with silica core (upper figure)
and hollow core (lower figure).[Russel, 2003]
V-number defines the number of modes supported by fiber which depends on air
hole diameter d, pitch Λ and wavelength in PCFs cases as following equation:
where D is core radius, ncore is refractive index of silica and ncladding is effective index of the
space filling mode. It has been studied that for V<4.2, PCF propagates only the single
fundamental mode while V-number for conventional standard fibers is 2.405 (Russell,
2006). Therefore, PCF is suitable for single mode operation in short wavelengths region.
Indeed the PCF’s structure practically determines the modal behavior of the fiber.
Providing that PCF is with air-hole diameter d/Λ<0.48, it operates as a single mode fiber
for a wide range of wavelength which are suitable for high power delivery in
telecommunication system (Knight, et al., 1998 and Baggett, et al., 2001).
222claddingcore nnDV
(2.59)

48
Tight light confinement within the PCF’s core region leads to a high intensity and
high nonlinearity effects in this fiber. The parameter determining optical nonlinearity of
fibers is normally measured in terms of its effective nonlinear coefficient
effcA
n 2 (2.60)
where c is the light speed, Aeff is the effective area of traveling mode, ω is the frequency of
propagating optical field and n2 is responsible for the nonlinear refractive index as defined
in Kerr effect intensity which is dependent on the incident intensity. Small pitch size Λ and
large d/Λ in PCFs confines light strongly within the core region so that results in small
effective mode area (Finazzi et al., 2003). Such a small Aeff leads to a high nonlinear
coefficient and then low level of incident intensity will be required for a certain
nonlinearity value. For instance, PCF based on pure silica core has n2= 2.16 10-20 m2/W
and γ up to 168 W-1km-1 (known as NL-1.5-670 Blaze Photonics), which is nearly 150
times greater than standard silica fiber with γ equals 1.1 W-1km-1. Noting that there is a
limitation for decreasing the core size for higher nonlinearity, because it leads to higher loss
and then it has to be a tradeoff between these effects.

49
CHAPTER THREE: NONLINEAR CHARACTRIZATION OF
PHOTONIC CRYSTAL FIBRE AND BISMUTH BASED ERBIUM
DOPED FIBRE
3.1 Introduction
Photonic crystal fibres (PCFs) exhibit unique and dramatic nonlinear optical effects
due to their periodic microstructure which forms the core and cladding (Russell et al., 2006
and Laude et al., 2005). For instance, one of the most interesting classes of PCFs is
composed of a small-scale solid core with multiple air holes typically arranged in a
hexagonal lattice around the core acting as the cladding. With the combination of a large
refractive index contrast between the silica core and the air field microstructure, PCFs can
be designed to enable tight mode confinement that results in a low effective mode area and
thereby high nonlinear characteristics. Nonlinear effects in PCFs have been reported in
many recent literatures which show that the fibre can achieve dramatic nonlinear effects,
even with short fibre lengths (Di Teodoro et al., 2005; Chremmos et al.,2005; Geng et al.,
2007 and Beugnot et al., 2007).
Bismuth-based-erbium-doped fibres (Bi-EDFs) have been extensively investigated
as a short gain medium length in compact optical amplifiers. This fibre incorporates
lanthanum (La) ions to provide heavily doped Erbium ions with decreasing the
concentration quenching in the fibre (Desurvire et al., 1990), which allow compact optical
amplifier design. Therefore, it is expected that this fibre has enormous potential in realizing
EDFA based devices. The Bi-EDFAs can provide a flat and high value of gain by a short
length of a few ten cm long fibre in C and/or L band region from 1520 nm to 1620 nm for

50
optical communication networks. In addition to the amplification characteristics, Bi-EDF
also exhibits a very high fibre nonlinearity, which can be used to generate nonlinear devices
such as Brillouin Erbium Fibre Laser (BEFL) (Harun et al., 2008).
Recently, various works have been reported on Stimulated Brillouin scattering
(SBS) and Four Wave Mixing (FWM) effects in optical fibres. SBS and FWM are very
important nonlinear effects in optical fibres which may limit the performance of optical
communication system. These effects also have a possible application in developing
nonlinear devices such as fibre lasers, fibre amplifiers and sensors. SBS has a significant
influence on the operation of optical transmission systems as well as many applications
such as in distributed fibre sensors using narrow-linewidth single frequency lasers (Harun
et al., 2009). Many recent works have also been reported on the development of Brillouin
fibre lasers (BFLs) using a highly nonlinear fibre as a gain medium(Wu et al., 2010; Guan
et al,.2010).The highly nonlinear fibres such as PCF and Bi-EDF can also be applied to
realize optical soliton (Yulin et al., 2004), wavelength conversion (Andersen et al., 2004),
and with the proper design of dispersion these fibres have been used to generate new
frequency resulting from four-wave mixing (FWM) (Chow et al., 2005). In comparison
with conventional optical fibres, the significant FWMs in PCFs can occur at relatively low
peak powers and over short propagation distances.
In this chapter, nonlinear effects are investigated numerically and experimentally in
both PCF and Bi-EDF using a basic configuration. The power budget requirements
(threshold pump power), the achievable gain and saturation characteristics of Brillouin
amplifiers, precise and quantitative treatment of the SBS process are evaluated in PCF. The
amplification and nonlinear characteristics of Bi-EDF are then studied. In the last part of
51
this chapter, a FWM effect is numerically studied and experimentally demonstrated using
two tunable laser sources. The FWM efficiencies in both PCF and Bi-EDF are then
estimated using the simplest experimental arrangement.
3.2 Performance of Stimulated Brillouin Scattering in Optical Fibres
As described in chapter 2, the acoustic phonons involved in the Brillouin scattering
and the interactions occurs typically over a narrow order of tens of MHz of Brillouin gain
linewidth, such as 35 MHz for fused silica, with the downshifted frequency nearly 10 GHz
from the Brillouin pump (BP) wave in the wavelength 1550 nm ( Smith et al., 1972;
Shibata et al., 1987; Azuma et al., 1988 and Shibata et al., 1989) The shift is determined by
the velocity of the acoustic grating along the fibre and is therefore dependent on the
mechanical properties of the fibre such as the elasto-optic coefficient, applied strain and
ambient temperature ( Nobuyuki et al., 1993 and Nicklès et al., 1996). SBS provides gain
in the opposite direction of the direction of the BP wave source. The pump power is
depleted to be converted to a potentially strong Brillouin Stokes wave propagating
backward to the pump direction. The Brillouin Stokes (BS) distorts communication signal
in optical communication systems, which may harmful in some cases. Therefore, an optical
isolator is normally deployed in the system to eliminate the back-propagating signals.
Figure 3.1 shows the simplest experimental setup to demonstrate SBS effect. In this
setup, BS propagates in the backward direction which can be monitored through the port 3
of the optical circulator (OC) by using optical spectrum analyzer (OSA) with the resolution
of 0.01 nm. In the experiment, a piece of 25 km long standard single mode fibre (SMF) is
used as the gain medium. OC functions to protect the tunable laser source (TLS) from any

52
backward reflected powers as well as to isolate and route the Brillouin signal to be
monitored by OSA. In this experiment, TLS with the maximum peak power approximately
5 dBm and linewidth of about 15 MHz is used as the BP. An amplifier (Erbium doped fibre
amplifier, EDFA) can be incorporated after the TLS to amplify the pump power when the
higher power is needed in Brillouin fibre lasers (BFLs) structures. With the amplifier, the
BP has the maximum output power of about 15 dBm. The evolution of the anti-Stokes, the
BP reflection, and the Brillouin Stokes waves are investigated at various pump powers.
Index matching gel is applied at the free end side of the fibre under test to eliminate Fresnel
reflection and thus ensure that the back-propagating light constitutes only the Brillouin
Stokes.
Figure 3. 1: Experimental setup for generating Brillouin scattering in the backward direction. Ip and Is denote the intensities of the pump and Brillouin signal lights,
respectively.
Figure 3.2 compares the launched BP and back-propagating Brillouin when the BP
is fixed at 1560 nm. The anti-Stokes, the BP Rayleigh reflection and the Brillouin Stokes
are observed at powers of around -54 dBm, -5.1 dBm, and -30.5 dBm, respectively. The
Brillouin Stokes light wavelength is shifted upward by 0.088 nm from the BP wavelength
whereas the anti-Stokes wavelength is downshifted by the same spacing. The BS is
Index Matching
IP IS
Circulator
OSA
Brillouin pump
TLS
Fibre under test

53
obtained due to the interactions between the gain media and BP. According to the SBS
theory, the beat frequency between the Brillouin scattered wave and the incident BP light is
equal to the frequency of the acoustic wave. As long as the Brillouin laser pump and the
Brillouin Stokes wave interactions reinforce the acoustic waves, it amplifies the scattered
Brillouin Stokes wave so that the stimulated Brillouin scattering (SBS) occurs. Rayleigh
scattering in the fibre causes some portion of BP is reflected back as shown in the figure
3.2. The anti-Stokes is caused by the degenerate four-wave mixing effect which happening
between the BP and Brillouin Stokes waves.
Figure 3. 2: The spectra of the launched BP and the back propagating Brillouin Stokes.
Figure 3.3 shows the evolution of the BS spectrum with BP power. By increasing
BP power from 6 dBm to 15 dBm, the BS power is observed to increase from -61.7 dBm to
-5.1dBm due to SBS nonlinear phenomena. The anti-Stokes and the BP Rayleigh reflection
peak powers are increased by only about 5 dB and 11 dB, respectively. This shows that BS
gain is so much higher than the gains of anti-Stokes and the Rayleigh scattering. This is
-60
-50
-40
-30
-20
-10
0
10
20
1559.7 1559.9 1560.1 1560.3
Out
put p
ower
(dBm
)
Wavelength (nm)
10 GHz
BP Brillouin Stokes
BP Rayleighreflection
Anti-Stokes

54
attributed to the fact that anti-Stokes signal was generated at a shorter wavelength region,
which has a higher energy. Therefore, it has a less probability of occurrence than the Stokes
signal (Agrawal, 2003). The Brillouin threshold power is defined as the Brillouin pump
power at which Brillouin Stokes power suddenly increases. As shown in figure 3.3, the
threshold power is estimated at around 9.9 dBm since the BS power is growing up abruptly
with a remarkable value at this pump power. One method to reduce the Brillouin threshold
power is to modify the waveguide structures of the optical fibres (Kuzin et al., 1985;
Eichler et al., 1997 and Harrison et al., 1999) so that high pump intensity is distributed
along the full length of fibre. The SBS effect in a closed loop configuration also is expected
to have a lower threshold value. The detail study on this will be presented in Chapters 4
and 5.
Figure 3. 3: The evolution of the BS spectra with the BP power.
-80
-70
-60
-50
-40
-30
-20
-10
0
1559.4 1559.6 1559.8 1560 1560.2 1560.4
Out
put p
ower
(dBm
)
Wavelength (nm)
15 dBm12.3 dBm9.9 dBm6.01 dBm

55
3.3 Numerical evaluation of Brillouin threshold power in PCF
Brillouin scattering has been implemented in a wide range of applications as a
narrowband fibre laser source (Shirazi, et al., 2008), narrow band filtering (Trach et al.,
1989), and Brillouin fibre amplifier (BFA) (Ravet et al., 2008). Since the Brillouin
frequency shift is dependent on the material composition, the temperature and pressure of
the medium, the Brillouin scattering can also be applied in various optical fibre sensors
(Culverhouse et al., 1989). In a development of distributed Brillouin sensors (DSB), the
Brillouin shift is measured along the fibre length based on frequency (or time) domain
modulation of the input pump wave (Ravet et al., 2006). One of the main characteristics of
the nonlinear Brillouin scattering effect in optical fibres is its threshold power condition for
the occurrence of the SBS. The threshold power is normally defined as the input pump
power, Pth, at which the output Stokes is some fraction (r), used as threshold criterion, of Pth
(Kovalev et al., 2007). This threshold input pump power value is strongly depended on the
providing Brillouin gain medium or fibre length which plays an important role in SBS
generation for lasers and sensors applications. For sensors application, a uniform resolution
measurement over the entire sensing length cannot be achieved in case of strong pump
depletion (Ravet et al., 2008). Consequently, a precise and comprehensive theoretically
measurement of the threshold input pump power with considering the pump depletion as
well as fibre length variation is required.
PCFs are a class of micro-structured fibre which possesses a solid core surrounded
by a cladding region that is defined by a fine array of air holes that extend along the full
fibre length. PCFs are typically made of a single material, usually pure silica, and guide
light through a modified form of total internal reflection since the volume average index in
the core region of the fibre is greater than that of the surrounding micro-structured cladding

56
(Russel, 2003). Since the average refractive index of the cladding due to presence of air
holes lowers the average refractive index from that of a pure fused silica and hence a
modified total internal reflection could explain light guidance in such fibers. One of the
most promising applications of PCFs is in the developmentof nonlinear optical devices for
fibre-optic communication systems. Fibre fabrication technology has advanced
significantly in recent years and has resulted in the production of high quality PCFs with
low loss, ultrahigh nonlinearity, and controllable dispersion. In this section, the Brillouin
scattering process in a piece of PCF is theoretically studied for possible use in a
development of a Brillouin fibre laser. In this work, the Stokes emission is considered to be
initiated by spontaneous Brillouin scattering, SpBS, and the 1% criterion is used for the
threshold definition (Kovalev et al., 2007). The theoretical result is also experimentally
verified.
3.3.1 Theoretical principle of SBS generation
If the input pump intensity is sufficient, SBS in optical fibres will convert a
pump field with frequency p to a scattered counter-propagating probe field with frequency
s (Stokes waves), through an electrostrictive process. Indeed, Brillouin scattering arises
from the nonlinear interaction of launched light with propagating density waves or acoustic
phonons. Since momentum and energy can be conserved during these scattering events, the
SBS effect is remarkable (Singh et al., 2007). The interaction between the three fields of
input pump signal, Brillouin scattered wave, and acoustic wave (phonon) along a single
mode fibre of length can be represented by a set of differential equations as follows
(Agrawal, 2001):
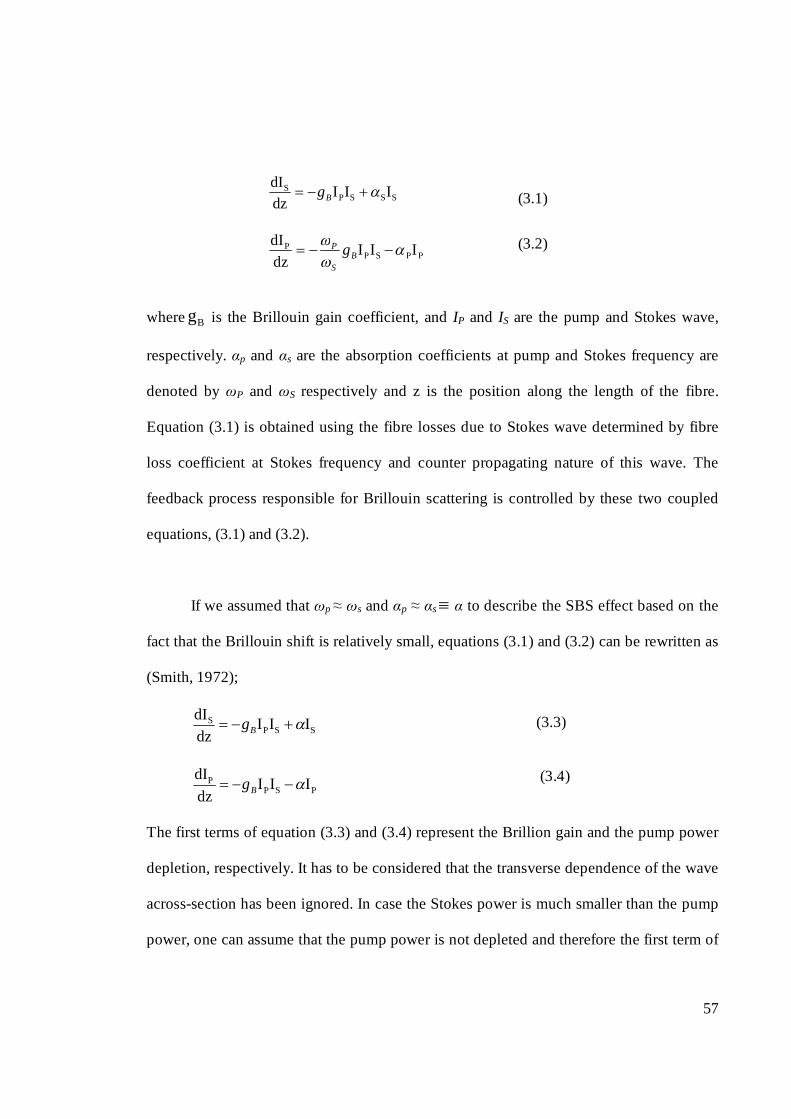
57
where Bg is the Brillouin gain coefficient, and IP and IS are the pump and Stokes wave,
respectively. αp and αs are the absorption coefficients at pump and Stokes frequency are
denoted by ωP and ωS respectively and z is the position along the length of the fibre.
Equation (3.1) is obtained using the fibre losses due to Stokes wave determined by fibre
loss coefficient at Stokes frequency and counter propagating nature of this wave. The
feedback process responsible for Brillouin scattering is controlled by these two coupled
equations, (3.1) and (3.2).
If we assumed that ωp ≈ ωs and αp ≈ αs α to describe the SBS effect based on the
fact that the Brillouin shift is relatively small, equations (3.1) and (3.2) can be rewritten as
(Smith, 1972);
SSPS III
dzdI Bg
PSPP III
dzdI Bg
The first terms of equation (3.3) and (3.4) represent the Brillion gain and the pump power
depletion, respectively. It has to be considered that the transverse dependence of the wave
across-section has been ignored. In case the Stokes power is much smaller than the pump
power, one can assume that the pump power is not depleted and therefore the first term of
SSSPS III
dzdI Bg
PPSPP III
dzdI
BS
P g
(3.1)
(3.2)
(3.3)
(3.4)

58
equation (3.4) can be neglected (Smith, 1972). Thus, a more familiar closed-form
expression of the SBS threshold power can be obtained as follow (Smith, 1972):
eff(0)B
effth Lg
A21P
where ))exp(1(Leff L is the effective length of interaction.
Equation (3.5) is one of the approaches to define SBS threshold in optical fibres
(Bayvel et al., 1990 and Tang, 1966). It is based on the condition in which the reflected
Stokes optical power at the beginning of the fibre ( 0z ) equals the input pump power
)( inreflected PP in the absence of pump depletion. Practically the SBS threshold power is
identified as the amount of input power producing a reflected power that is equal to a
fraction, r, of the pump ( inreflected PrP ). This fraction factor or threshold criterion can
vary between 410 and 110 according to various literatures (Kovalev et al., 2007 and
Jenkins et al., 2007). Actually, for accurate determination of the threshold condition, the
influence of pump power depletion term should be considered. Thus, considering pump
depletion factor for a proper threshold definition, the simulation of the Brillouin scattering
process in an optical fibre is revised by returning to Equations (3.3) and (3.4). It should be
noted that the boundary conditions, which are known as the launched pump and Stokes
intensities, are specified at the opposite ends of the fibre and small enough as initial
spontaneous Brillouin scattering at the fibre end. This makes the equations slightly more
complicated to be solved without writing a special code. Equations (3.3) and (3.4) are
solved using the above mentioned boundary conditions. The algorithm adopted is based on
the fourth order Runge-Kutta algorithm with 10-3 accuracy and shooting method to meet
the complicated boundary condition.
(3.5)

59
3.3.2 Comparison of numerical and experimental results
The Brillouin scattering generation in a piece of PCF can be explained as
schematically illustrated in Figure 3.4. The backward signal composed of Rayleigh and
spontaneous Brillouin scattering (PS) is generated when the BP is injected into the fibre.
The SBS threshold in PCF is experimentally measured by using the setup of Figure 3.1. In
the experiment, a tunable laser source (TLS) is used as a narrow linewidth laser with a
maximum peak power of approximately 5 dBm at a fixed operating wavelength of 1550
nm. The pump wavelength is amplified by Erbium doped fibre amplifier (EDFA) to achieve
a maximum power of around 21 dBm before it is launched into the PCF through ports 1 and
2 of the optical circulator. The reflected signal is observed and measured through port 3 of
the OC using the optical spectrum analyzer (OSA) with a resolution of 0.01 nm.
Figure 3. 4: Schematic diagram to explain the Brillouin scattering process.
The PCF used as the gain medium has a triangular core with an average diameter of
2.1 μm and cladding diameter of 128 μm. The scanning electron micrograph (SEM) image
of the fibre is shown in Figure 3.5. It has a triangular core with average diameter of 2.1±
0.3 μm, cladding diameter of 128 ± 5 μm, and an effective core area Aeff of 6.1 μm2. The
PS (L)
PP(0)
z=0 z=L z+dz
P (z) = 0 P (z+dz)
PS

60
average air hole diameter of the fibre is 0.8 μm with 1.5 μm pitch. The PCF is made from
pure silica with 17.4 wt% of Ge-doped core region. The Ge-doped core functions to
increase the nonlinear refractive index of the core, creates a smaller mode field diameter
and reduces the confinement loss. This effect can reduce acoustic loss and avoid the
broadening of Brillouin spectrum linewidth. The PCF is spliced to an intermediate fibre and
then a single mode fibre (SMF) with a splice loss of 0.35 dB at each ends. The PCF is 100
m long with and an attenuation coefficient of less than 9 dB/km or α (km-1)=α (dB/km)×(ln
(10)/10)=2.07 km−1.
Figure 3. 5: SEM image of the PCF used in this study.
To explore the numerical results for a given length of the single mode fibre, L, we
first assume that a pump wave with intensity of Ip(0) is launched into the fibre, which
initiates the Brillouin scattering in the fibre core (Singh et al., 2007). The Brillouin gain
coefficient, gB, is measured to be 1.93×10⁻¹¹m/W at room temperature (Nicklès, M et al.,
1997). Based on these parameters, we iteratively solve the equations over a range of values
of the launched pump power IP(0) to determine the reflected Stokes intensity and its
conversion efficiency.
Figure 3.6 depicts the experimental and the numerically simulated results of the
transmitted pump and backscattered Stokes power as a function of the incident BP power.

61
In reality, the experimental value of the backscattered power is the sum of the Rayleigh and
Brillouin scatterings. Below the line of 20 dB of Pp(0), which represents the criterion of
1% input pump power, Rayleigh scattering is dominant whereas in the neighborhood above
this line, Brillouin scattering is the main contributor to the backscattering wave output. The
threshold determination by 1% criterion as illustrated in Figure 3.6 shows that Rayleigh
scattering does not play a significant role in dictating the threshold value. Rayleigh
scattering has been disregarded in the simulation of the Brillouin scattering power resulting
in the difference between the numerical and experimental results for the BP power of less
than 15 dBm. Ideally, the SBS threshold is likely to be higher still considering other
sources of loss in the experimental configuration. Nevertheless, the result shows a good
agreement between the experimental outcome and the numerical prediction.
Figure 3. 6: Plot of the transmitted pump and backscattered Stokes power obtained by the theoretical and experimental results against the input pump power.
-40
-30
-20
-10
0
10
20
30
0 5 10 15 20 25
Out
put p
ower
(dBm
)
Brillouin pump power (dBm)
Transmitted PP (L), numerically
Transmitted PP (L), experimentally
Brillouin Stokes PS(0),experimentally
Brillouin Stokes PS(0), numerically
PP(0)-

62
3.3.3 Threshold pump power evaluation
Spontaneous Brillouin scattering or Stokes wave is generated as the BP is launched
into a PCF due to thermal fluctuations, which modulates the refractive index. The BP also
interacts with the Stokes wave in a Brillouin gain medium to initiates SBS. To fulfill the
threshold condition for the SBS generation, the single-pass gain obtained by the Brillouin
gain medium, G=gBIP(0)Leff, must exceed the Brillouin gain threshold, Gth, which is
provided by the input pump at threshold power. The Brillouin gain threshold is estimated at
a constant value of 21 by Smith’s definition. Later, Bayvel has suggested that the value
should be 19 for the modern single mode fibres (Bayvel et al., 1989). The threshold pump
power for SBS generation is strongly depended on the specifications of the fibre such as the
fibre length used as the Brillouin gain medium, fibre’s linear loss and the Brillouin gain
coefficient. It is worth noting that the Brillouin Stokes, which arises from spontaneous
Stokes intensity initiates at z = L. The intensity is speculated to be 10-9 times of the input
pump power in this simulation.
In this study, the calculation is done to determine the optimum PCF length for the
SBS generation, which depends on the linear loss and Brillouin gain coefficient
characteristics of the fibre. The calculated results are used to further investigate the
theoretical pump depletion and the Stokes power saturation regions as well as the optimum
input pump power. The transmitted pump and Stokes powers are calculated against the
input pump power variation for different PCF lengths using the Equations (3.3) and (3.4).
The result is depicted in Figure 3.7. In this calculation, the input pump power is varied from
0 mW to 300 mW while the PCF length is varied from 10 m to 400 m. The amount of
transmitted pump power at the end of the PCF is dependent on the absorbed light by the
fibre and the light converted to backscattered Stokes waves. In the case where pump

63
depletion is not considered, the transmitted power should rise linearly as the input pump
power increases. However, as shown in Figure 3.7 (a), the transmitted pump power only
increases linearly with input pump power before the depletion region. This initial level of
the depletion region is dependent on fibre length. The residual pump power, which is not
absorbed along the fibre, is converted to the backscattering Stokes through the
electrostrictive process which results in the SBS as shown in Figure 3.7(b).

64
Figure 3. 7: Plots of (a) transmitted pump and (b) backscattered Brillouin Stokes power against input pump power for different fibre length.
The optimized length for the SBS generation can be determined from Figure 3.7(a) by
observing the pump depletion. The transmitted pump power is also observed to be smaller
with a longer fibre. This is attributed to the fact that the longer length allows the pump to
interact more with the gain medium to produce a higher gain. This contributes to a more
Pump depletion
Stokes saturation region
(a)
(b)
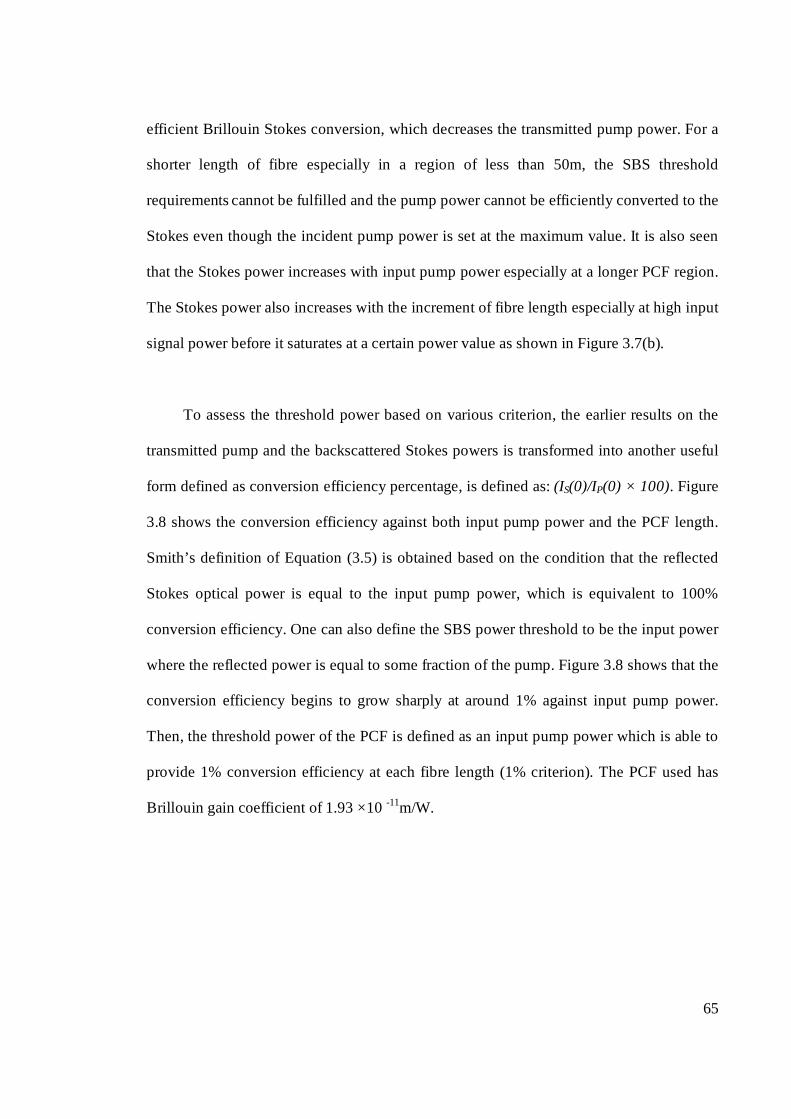
65
efficient Brillouin Stokes conversion, which decreases the transmitted pump power. For a
shorter length of fibre especially in a region of less than 50m, the SBS threshold
requirements cannot be fulfilled and the pump power cannot be efficiently converted to the
Stokes even though the incident pump power is set at the maximum value. It is also seen
that the Stokes power increases with input pump power especially at a longer PCF region.
The Stokes power also increases with the increment of fibre length especially at high input
signal power before it saturates at a certain power value as shown in Figure 3.7(b).
To assess the threshold power based on various criterion, the earlier results on the
transmitted pump and the backscattered Stokes powers is transformed into another useful
form defined as conversion efficiency percentage, is defined as: (IS(0)/IP(0) × 100). Figure
3.8 shows the conversion efficiency against both input pump power and the PCF length.
Smith’s definition of Equation (3.5) is obtained based on the condition that the reflected
Stokes optical power is equal to the input pump power, which is equivalent to 100%
conversion efficiency. One can also define the SBS power threshold to be the input power
where the reflected power is equal to some fraction of the pump. Figure 3.8 shows that the
conversion efficiency begins to grow sharply at around 1% against input pump power.
Then, the threshold power of the PCF is defined as an input pump power which is able to
provide 1% conversion efficiency at each fibre length (1% criterion). The PCF used has
Brillouin gain coefficient of 1.93 ×10 -11m/W.

66
Figure 3. 8: Plot of conversion efficiency percentage against input pump power for different length of fibre.
Figure 3.9 shows the threshold pump power versus fibre length for both 1% and
100% criterions, which indicates that the threshold pump power is dependent on the fibre
length. As shown in the figure, both threshold pump powers indicate a similar trend
whereby the threshold power decreases with the increase in fibre length. If the fibre length
is divided into two sections; less and more than 100 m, a sharp decrease of threshold pump
power can be clearly seen for the length of less than 100 m. Therefore, the optimum length
is considered to be around 100 m for achieving the highest Brillouin gain.

67
Figure 3. 9: Plot of the threshold pump power versus fibre length using 1% and 100% (Smith’s definition) criterions.
The threshold pump power is also experimentally measured for 100 m long PCF. The
measurement for other lengths is not carried out due to unavailability of the fibre. The
experimental value is 18.5 dBm, which is in good agreement with numerical estimated
value of 18.0 (1% criterion) as shown in Figure 3.9. The calculated threshold pump power
based on Smith’s estimation is basically higher than both the simulation and experimental
results. This can be attributed to two facts that firstly, the pump depletion has not been
considered in the Smith’s calculation and secondly, the threshold condition is defined as the
input pump power for which this power equals the backscattered Stokes power at z = 0
based on Smith’s definition (Ip = IS). In reality, these conditions are not experimentally
observable since pump depletion inevitably occurs and consequently the backscattered
Stokes power is less than the input pump power. As it can be observed in Figure 3.8, the
threshold power decreases with the PCF length until a convergence is reached. Depending
on the values of Aeff and gB, the optimum length changes due to the changes in pump power
11
13
15
17
19
21
23
25
20 70 120 170 220 270 320 370 420 470 520
Thre
shol
d pu
mp
pow
er (d
Bm)
Fibre length (m)
Smith’s Definition
Experimental 1% Criterion
Numerical 1% Criterion
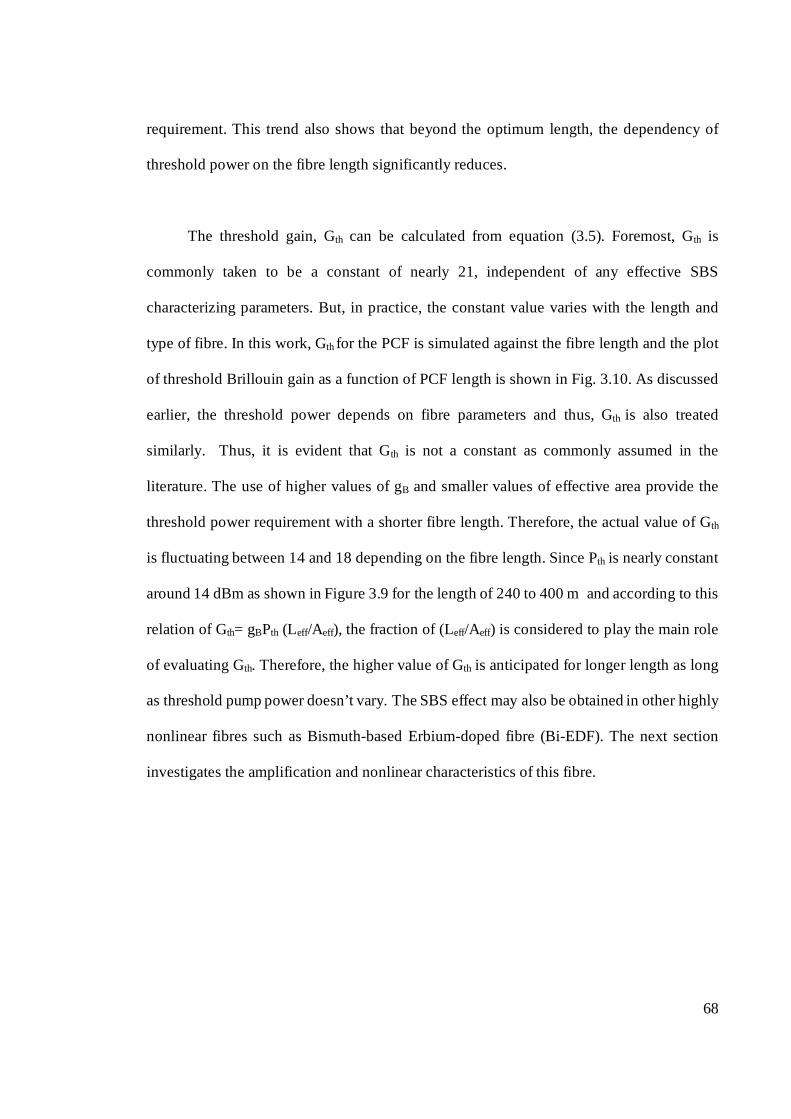
68
requirement. This trend also shows that beyond the optimum length, the dependency of
threshold power on the fibre length significantly reduces.
The threshold gain, Gth can be calculated from equation (3.5). Foremost, Gth is
commonly taken to be a constant of nearly 21, independent of any effective SBS
characterizing parameters. But, in practice, the constant value varies with the length and
type of fibre. In this work, Gth for the PCF is simulated against the fibre length and the plot
of threshold Brillouin gain as a function of PCF length is shown in Fig. 3.10. As discussed
earlier, the threshold power depends on fibre parameters and thus, Gth is also treated
similarly. Thus, it is evident that Gth is not a constant as commonly assumed in the
literature. The use of higher values of gB and smaller values of effective area provide the
threshold power requirement with a shorter fibre length. Therefore, the actual value of Gth
is fluctuating between 14 and 18 depending on the fibre length. Since Pth is nearly constant
around 14 dBm as shown in Figure 3.9 for the length of 240 to 400 m and according to this
relation of Gth= gBPth (Leff/Aeff), the fraction of (Leff/Aeff) is considered to play the main role
of evaluating Gth. Therefore, the higher value of Gth is anticipated for longer length as long
as threshold pump power doesn’t vary. The SBS effect may also be obtained in other highly
nonlinear fibres such as Bismuth-based Erbium-doped fibre (Bi-EDF). The next section
investigates the amplification and nonlinear characteristics of this fibre.
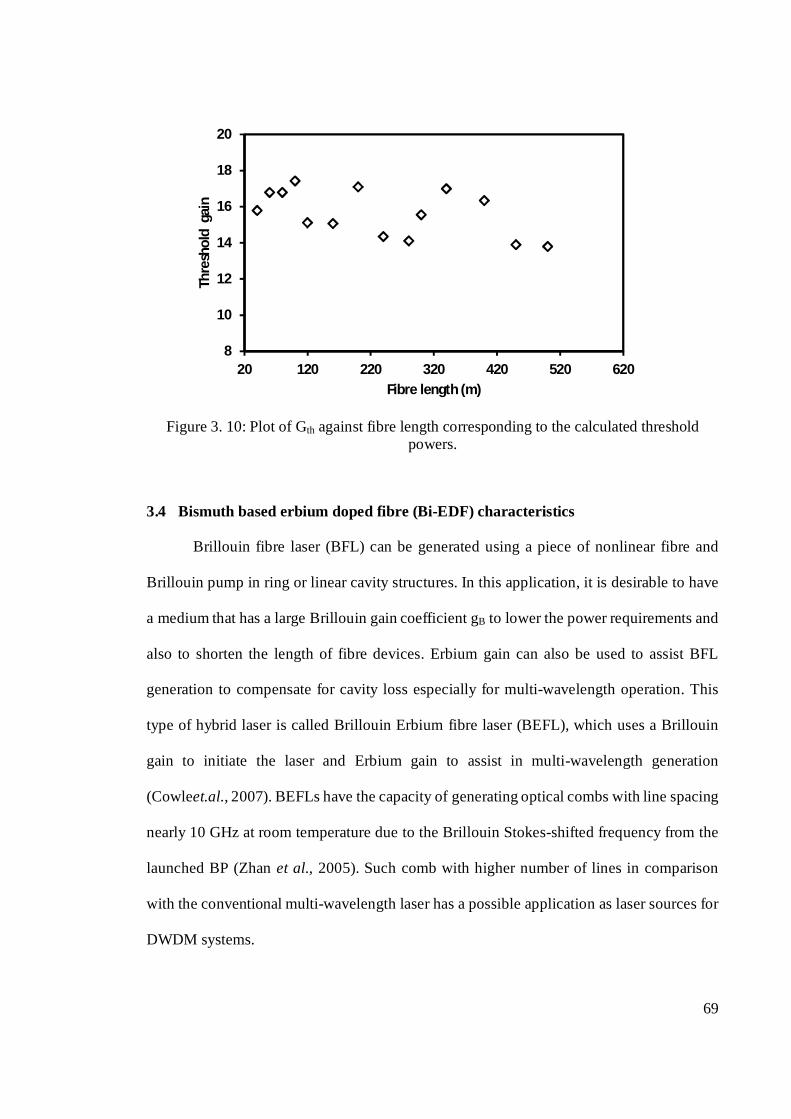
69
Figure 3. 10: Plot of Gth against fibre length corresponding to the calculated threshold powers.
3.4 Bismuth based erbium doped fibre (Bi-EDF) characteristics
Brillouin fibre laser (BFL) can be generated using a piece of nonlinear fibre and
Brillouin pump in ring or linear cavity structures. In this application, it is desirable to have
a medium that has a large Brillouin gain coefficient gB to lower the power requirements and
also to shorten the length of fibre devices. Erbium gain can also be used to assist BFL
generation to compensate for cavity loss especially for multi-wavelength operation. This
type of hybrid laser is called Brillouin Erbium fibre laser (BEFL), which uses a Brillouin
gain to initiate the laser and Erbium gain to assist in multi-wavelength generation
(Cowleet.al., 2007). BEFLs have the capacity of generating optical combs with line spacing
nearly 10 GHz at room temperature due to the Brillouin Stokes-shifted frequency from the
launched BP (Zhan et al., 2005). Such comb with higher number of lines in comparison
with the conventional multi-wavelength laser has a possible application as laser sources for
DWDM systems.
8
10
12
14
16
18
20
20 120 220 320 420 520 620
Thre
shol
d g
ain
Fibre length (m)

70
Recently, a bismuth-based erbium-doped fibre (Bi-EDF) has been extensively
studied for use in compact amplifiers with short-gain medium lengths. It has inherently
differentiated performance over conventional silica-based glass as host material for
Erbium-doped fibre amplifier (EDFA). This fibre incorporates lanthanum (La) ions to
decrease the concentration quenching of the erbium ions in the fibre (Harun et al., 2009),
which allows the erbium ion concentration to be increased to more than 3000 ppm. A fibre
with such a high erbium dopant concentration is expected to have enormous potential in
realizing a compact erbium-doped fibre amplifiers (EDFAs) and EDFA based devices. The
Bi-EDF has also a very high fibre nonlinearity, which can be used for realizing a compact
BFL. In addition, this fibre is also fusion splice-able to ordinary silica fibre using a special
method. Compared to silica-based EDFA, the higher refractive index of Bismuth-based
glass (Yang et al., 2003) provides a broader amplification bandwidth up to extended L-
band region which is desirable for WDM network systems. The high refractive index
resulted in a relatively shorter lifetime at4I13/2 level in Bi-EDF compared to silica EDF (Si-
EDF).
Figure3.11 depicts the measured and calculated emission cross-section using the
modified McCumber’s relation defined as in Equation (3.6) and also the Si-EDF emission
cross-section as a comparison (Desurvire et al., 1994 and Harun et al., 2009). Based on the
modified McCumber’s relation the absorption cross section function is given by;
where
(3.7)
Tk
h
B
peak
peake
a)(exp()()(
(4.1)
(3.6)
peaka
peakepeak

71
, kB is Boltzmann constant and T is temperature. The absorption cross-section was
calculated using emission cross-sections, e provided by Asahi Glass Co, and it can be seen
in the figure that the calculated emission cross-section agrees well with the experimental
data. This optical emission peaks at 1.53 μm, which is obtained due to the population
inversion between energy level 4I13/2 and 4I15/2.
Figure 3. 11: Absorption and emission cross-section of Bi-EDF and Si-EDF. (The Bismuth absorption cross-section is obtained from Asahi Glass Co.). The calculated Bismuth
emission curve coincides very well with the measured curve (Harun et al., 2009)
From Figure 3.11, it can be also observed that the Bi-EDF has wider emission
spectra as compared to Si-EDF, especially at the longer wavelengths of 1620 nm because of
its larger emission cross-section. The Si-EDF has a bandwidth of only 40 nm while the Bi-
EDF bandwidth is almost double at 80 nm for the same emission intensity. The widening of
the emission spectra is attributed to the Stark level of the Er3+ ions in the Bi-EDF, which is
separated to a larger degree due to the larger ligand field as reported earlier (Harun et al.,
Suggesting broad gain in C and Lband
Suggesting pump wavelength of Bismuth oxide

72
2009). As shown in Figure 3.11, despite the Bi-EDF having a higher absorption cross-
section of 7.58 × 10⁻²⁵ m2 at the 1530 nm peak as compared to the Si-EDF absorption
cross-section (which is only 4.39 × 10⁻²⁶ m2), the peak full-width half maximum (FWHM)
of the Bi-EDF is narrower than the FWHM of the Si-EDF. This is due to the larger
inhomogeneous energy level degeneracy that the ligand field of the Bismuth host glass
induced as a result of site to site variations, also known as the Stark effect (Desurvire et al.,
1994), causing the widened optical transitions. Other elements such as potassium oxide also
have similar glass basicity expander effects (Tanabe et al., 1992) and are used in the
fabrication of Bi-EDF to obtain a broader amplification region. It is worth noting that the
higher value of absorption of Bismuth oxide in wavelength 1480 nm suggests that it is
preferable to use the pump wavelength of1480 nm. Thus, this fibre is a promising candidate
for compact amplifier applications with broadband transmission capability.
Theoretical analysis and modeling of the amplification characteristics of Bi-EDF
The general theory light amplification in optical fibres is based on simple rate
equations which describe the fractional light amplification as it propagates along a certain
distance in an active medium (Desurvire, 1989 and Becker et al., 1997). This theory
explains the interaction of the atom (absorption or emission) when an electromagnetic field
is launched in a fibre by using fundamental properties of the atom in a special environment
as the energy level ion population density, pump intensity and rate equations. The energy
level diagram of the erbium is shown in Figure 3.12. The ground level has a structure of 4I,
which splits into 9/2, 11/2, 13/2, and 15/2 due to the ligand field interaction between the
non-central electrostatic fields, electron spin and its orbital angular momentum (Naito et
al., 2004). The absorption bands of 980 nm and 1480 nm depicted in the figure according to

73
transitions from the ground level 4I15/2 to the top of the 4I13/2 and 4I11/2 levels, respectively.
The emission of excited Er+3 ion includes radiative and nonradiative emission. The radiative
emission defines by the energy gap between the energy levels ranging from 103 to 104cm-1.
The electron is excited by the pump from ground state (4I15/2)to excited state (4I11/2) and
then non-radioactively transits to the meta-stable energy level (4I13/2). After that, it transits
from the meta-stable level to the ground state with emission of 1550nm photons.
Figure 3. 12: Simplified energy-level diagrams and various transition processes of Er3+ ions in silica.
Rate equations are given by atomic energy levels to explain the effect of absorption,
stimulated emission and spontaneous emission. Assume that the population densities of
Er3+ ions at the ground level of 4I15/2, meta-stable level (the so-called 4I13/2 level) and the
4I11/2pump level are N1, N2 and N3, respectively. The denoted name of the meta-stable
explains that the lifetimes of the transitions from this level to the ground level are very long
compared to the lifetimes of the levels that led to this level. Therefore, the steady- state rate
equations for the Bi-EDFA system can be written as (Hayashi et al., 2006b):
N1 0
5
10
4I15/2
A21
Ccup
W32
RP21
RS12
RS21
RASE12
RASE21
N2
N3
4I13/2
4I11/2
Ener
gy (x
103 cm
-1)

74
So, the total population density N is expressed as:
N= N1+N2+ N3
HereA21 is the spontaneous emission probability of the 1.55 μm band calculated by the
Fuchtbauer–Ladenburg formula (Bameset al., 1991), and W32 is the non-radiative decay
rate from the 4I11/2 level that calculated by the measured lifetime. C is the corporative
upconversion coefficient evaluated by Snoek’s method (Snokes et al., 1995).We neglect the
non-radiative decay rate of the 4I13/2level and the spontaneous emission from the 4I11/2 level
because A21 and W32are dominant in those levels.
Equations (3.8) - (3.11) can be solved by considering the steady state regime where
the populations are time independent, dNi/dt=0 (i=0,1 ,…5). The average Er+3 ion
concentration in the core is denoted as ρ and is quantified by (Desurvire et al., 1994):
where b is the doping radius and n(r) is the Er+3ions concentration profile. R represents the
radiative decay rate of the signal, pump and ASE provided from the interaction of the
electromagnetic field with the ions or the transition rate is expressed as follows:
0
2)(2 rdrrn
b
(3.11)
221121212221212121
1 )()( CNNRRRNRRRAdt
dNASEPSASEPS (3.8)
(3.10)
332221121212
2212121212
2)(
)(
NWCNNRRR
NRRRAdt
dN
ASEP
ASEPS
(3.9)
22332
3 CNNWdt
dN
(3.12)

75
where h, Aeff are the plank constant and effective area, respectively. PP And
ASEP are the
forward and backward propagating pump power and ASE powers while SP , EP and A
P
are the signal power, emission and absorption cross sections at the pump wavelength,
respectively. EP and A
P are the functions of the input signals estimated from (Harun et al.,
2009). We assume that all the Er3+ions excited to the 4I9/2 levels by the cooperative up-
conversion process relax to the 4I11/2 immediately.
The evolution of the pump power, ASE powers and signal power along the Bi-EDF
fibre (z) is given as (Desurvire et al., 1994);
(3.13) SSeff
ES
S PhA
R )(21
(3.14)
(3.15)
(3.16)
SSeff
AS
S PhA
R )(12
))((21 Pp
Peff
EP
P PPhA
R
))((12 Pp
Peff
AP
P PPhA
R
))((21 ASEASE
Seff
EP
ASE PPhA
R
))((12 ASEASE
Seff
AP
ASE PPhA
R
(3.17)
(3.18)
SSSaS
eSs
S PPNNdz
dP ))(( 12
PPPaP
ePP
P PPNNdz
dP ))(( 12
(3.19)
(3.20)

76
Where Γ is the overlap factor of every wavelength (Hayashi et al., 2006a) and α is the fibre
background loss measured (Desurvire et al., 1994). The subscripts s and ASE mean the
signal and the ASE, respectively. In the ASE equation, ∆ν represents the effective ASE
bandwidth that is the resolution of the measuring device such as an optical spectrum
analyzer. The overlapping factors between each radiation and the fibre fundamental mode,
Г (λ) can be expressed as (Desurvire et al., 1994):
20
22
1)( wb
e
(3.22)
65.10
429.1237.1761.0VV
aw (3.23)
where w0 is the mode field radius defined by Equation (3.23), a is the core radius, b is the
thulium ion-dopant radius and V is the normalized frequency.
The pump, signal power, population densities and ASE rate equations described in
the previous section are required to be solved numerically. There is a basic difficulty in
numerical solution of the rate equations of Ps, Pp and PASE as the evaluation of boundary
condition. Regardless of the pumping configuration, the PASE distribution along the fibre is
not known priori. Although only the forward pumping is considered in single pass
structure, but the backward ASE power has to be applied for double pass pumping
structure. While P+ASE power is zero at the input of EDFA, corresponding P-
ASE power is
maximum at this point. Thus, in order to perform the numerical method of the equation
ASEASEe
ASE
ASEae
ASEASEASE
PNh
PNNdz
dP
3
12
)(
))(()((3.21)
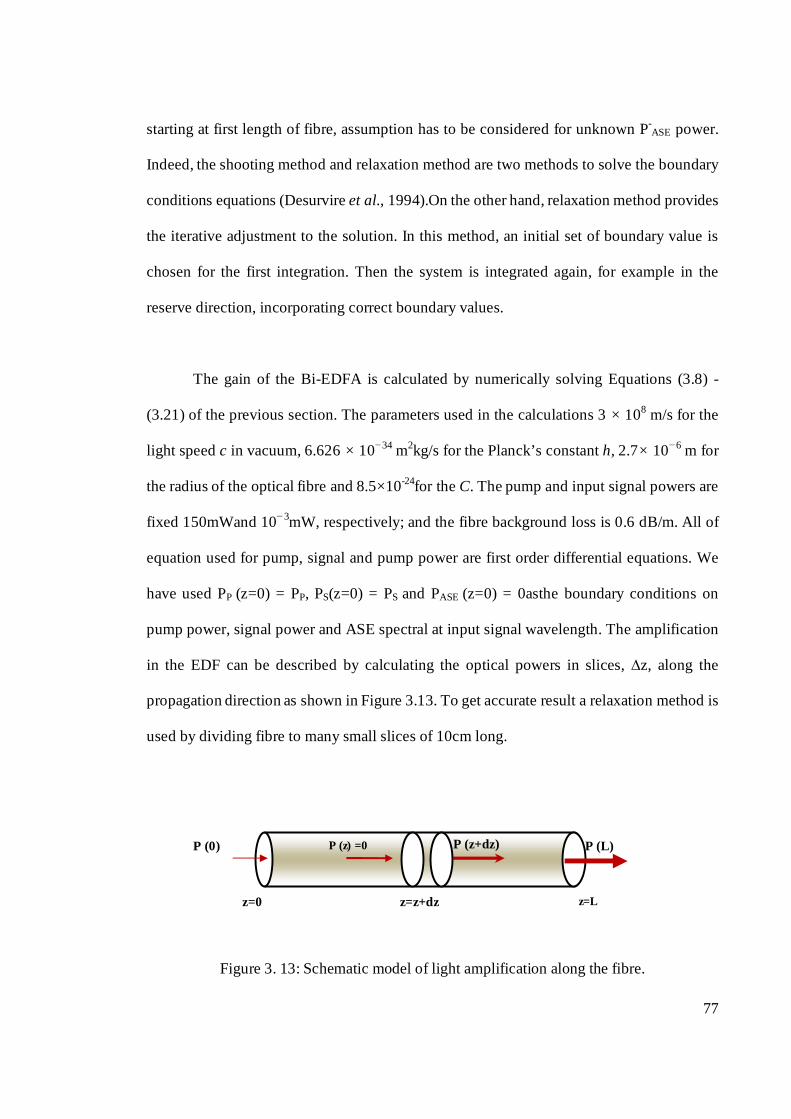
77
starting at first length of fibre, assumption has to be considered for unknown P-ASE power.
Indeed, the shooting method and relaxation method are two methods to solve the boundary
conditions equations (Desurvire et al., 1994).On the other hand, relaxation method provides
the iterative adjustment to the solution. In this method, an initial set of boundary value is
chosen for the first integration. Then the system is integrated again, for example in the
reserve direction, incorporating correct boundary values.
The gain of the Bi-EDFA is calculated by numerically solving Equations (3.8) -
(3.21) of the previous section. The parameters used in the calculations 3 × 10⁸ m/s for the
light speed c in vacuum, 6.626 × 10⁻³⁴ m2kg/s for the Planck’s constant h, 2.7× 10⁻⁶ m for
the radius of the optical fibre and 8.5×10⁻²⁴for the C. The pump and input signal powers are
fixed 150mWand 10−3mW, respectively; and the fibre background loss is 0.6 dB/m. All of
equation used for pump, signal and pump power are first order differential equations. We
have used PP (z=0) = PP, PS(z=0) = PS and PASE (z=0) = 0asthe boundary conditions on
pump power, signal power and ASE spectral at input signal wavelength. The amplification
in the EDF can be described by calculating the optical powers in slices, ∆z, along the
propagation direction as shown in Figure 3.13. To get accurate result a relaxation method is
used by dividing fibre to many small slices of 10cm long.
Figure 3. 13: Schematic model of light amplification along the fibre.
P (L)
P (0)
z=0 z=L z=z+dz
P (z) =0 P (z+dz)

78
Noise figure is generated by spontaneous emission and therefore is closely related to
ASE which can be calculated using the following equation;
NF=1/G + PASE / (G×h×ν×∆ν) (3.24)
where PASE is the ASE power, h is Planck’s constant, ν is the frequency of the signal and ∆ν
is the resolution of the measuring device such as an optical spectrum analyzer (Desurvireet
al., 1994).
Experimental measurement
The experimental setup of the forward pumped Bi-EDFA is illustrated in Figure
3.14. It consists of a Wavelength Selective Coupler (WSC), two optical isolators, one
Variable Optical Attenuator (VOA) and a piece of Bi-EDF. Both optical isolators are used
to avoid the reflection and ensure unidirectional operation in the amplifier. The 1480nm
laser diode is used to pump the Bi-EDF. WSC is used to combine the pump light with
1550nm signal. AVOA is incorporated immediately after the TLS to control the input
signal power into the optical amplifier. The gain and noise figure of this amplifier is
investigated using an OSA in conjunction with TLS.
Figure 3. 14: Experimental set-up for the forward pumped Bi-EDFA.
WSC OSA
VOA
Bi-EDF 1480nm, LD
TLS
Isolator Isolator
Signal in
Pump
Amplified signal
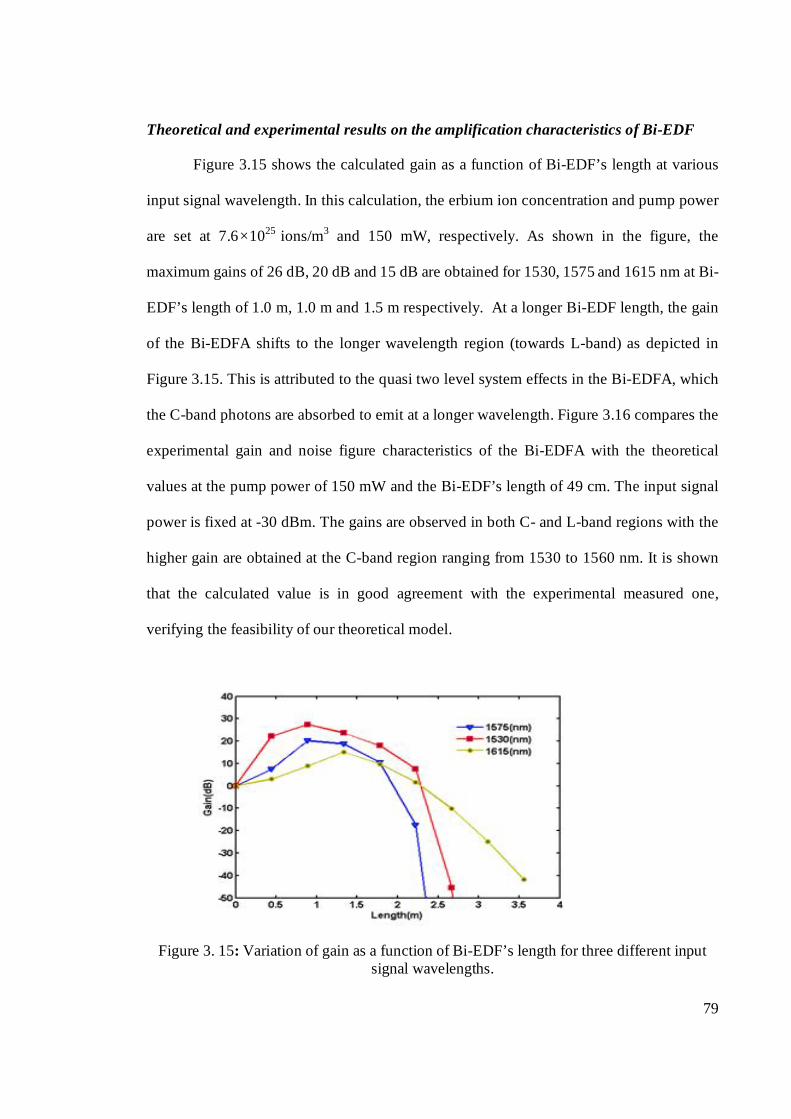
79
Theoretical and experimental results on the amplification characteristics of Bi-EDF
Figure 3.15 shows the calculated gain as a function of Bi-EDF’s length at various
input signal wavelength. In this calculation, the erbium ion concentration and pump power
are set at 7.6×1025 ions/m3 and 150 mW, respectively. As shown in the figure, the
maximum gains of 26 dB, 20 dB and 15 dB are obtained for 1530, 1575 and 1615 nm at Bi-
EDF’s length of 1.0 m, 1.0 m and 1.5 m respectively. At a longer Bi-EDF length, the gain
of the Bi-EDFA shifts to the longer wavelength region (towards L-band) as depicted in
Figure 3.15. This is attributed to the quasi two level system effects in the Bi-EDFA, which
the C-band photons are absorbed to emit at a longer wavelength. Figure 3.16 compares the
experimental gain and noise figure characteristics of the Bi-EDFA with the theoretical
values at the pump power of 150 mW and the Bi-EDF’s length of 49 cm. The input signal
power is fixed at -30 dBm. The gains are observed in both C- and L-band regions with the
higher gain are obtained at the C-band region ranging from 1530 to 1560 nm. It is shown
that the calculated value is in good agreement with the experimental measured one,
verifying the feasibility of our theoretical model.
Figure 3. 15: Variation of gain as a function of Bi-EDF’s length for three different input
signal wavelengths.

80
Figure 3. 16: Comparison of calculated gain and noise figure with experimental results for the Bi-EDFA with 49cm long Bi-EDF.
As shown in Figure 3.16, the theoretical and experimental gains of the Bi-EDFA are
obtained within 20 to 23dB at C-band region. The theoretical gain is flat within 35nm
bandwidth from 1530nm to 1565 nm. The slightly lower gain for the experimental results
especially at longer wavelengths is expected due to the effect of multiple reflections from
both the fiber splice points whereby the signal is reflected back into the Bi-EDF due to the
large refractive index difference. This causes the increased cavity loss and spurious laser
generation which suppresses the gain of the Bi-EDFA. As shown in Figure 3.16, the Bi-
EDFA gain bandwidth covers until the extended L-band region and is also much wider than
that of the standard Si-EDFA. This is attributed to the suppression of Excited State
Absorption (ESA) effect by the incorporation of La ions in the Bi-EDFA. The suppression
of ESA reduces the dissipation of pump energy and increases the population inversion
especially at extended L-band region. The experimental noise figure is obtained at
1
3
5
7
9
11
13
15
0
5
10
15
20
25
1515 1525 1535 1545 1555 1565 1575 1585 1595 1605 1615
Noi
se F
igur
e(dB
)
Gai
n(dB
)
Wavelength(nm)
Numerical gain
Experimental gain
Numerical noise figure
Experimental noise figure

81
approximately 7 dB within the C-band region as shown in Figure 3.16. The high erbium ion
doping concentration and high insertion loss of the Bi-EDF incur a high noise figure for the
Bi-EDFA. The theoretical noise figure is lower since the insertion loss of the Bi-EDF was
ignored during simulation.
Figure 3.17 shows the theoretical gain spectrum of the Bi-EDF with variation of Bi-
EDF length from 0 to 1m. The input signal and pump powers are set at -30dBm and
150mW, respectively. As shown in Figure 3.17, the gain of the Bi-EDFA is remarkable in
C band with a shorter length of Bi-EDF and as the length increases the gain increment is
more pronounced in L band region. The optimum length for the Bi-EDFA to operate in C-
band is around 0.5 to 0.8m.
Figure 3. 17: Theoretical gain versus input signal wavelength and Bi-EDF’s length for the Bi-EDFA.
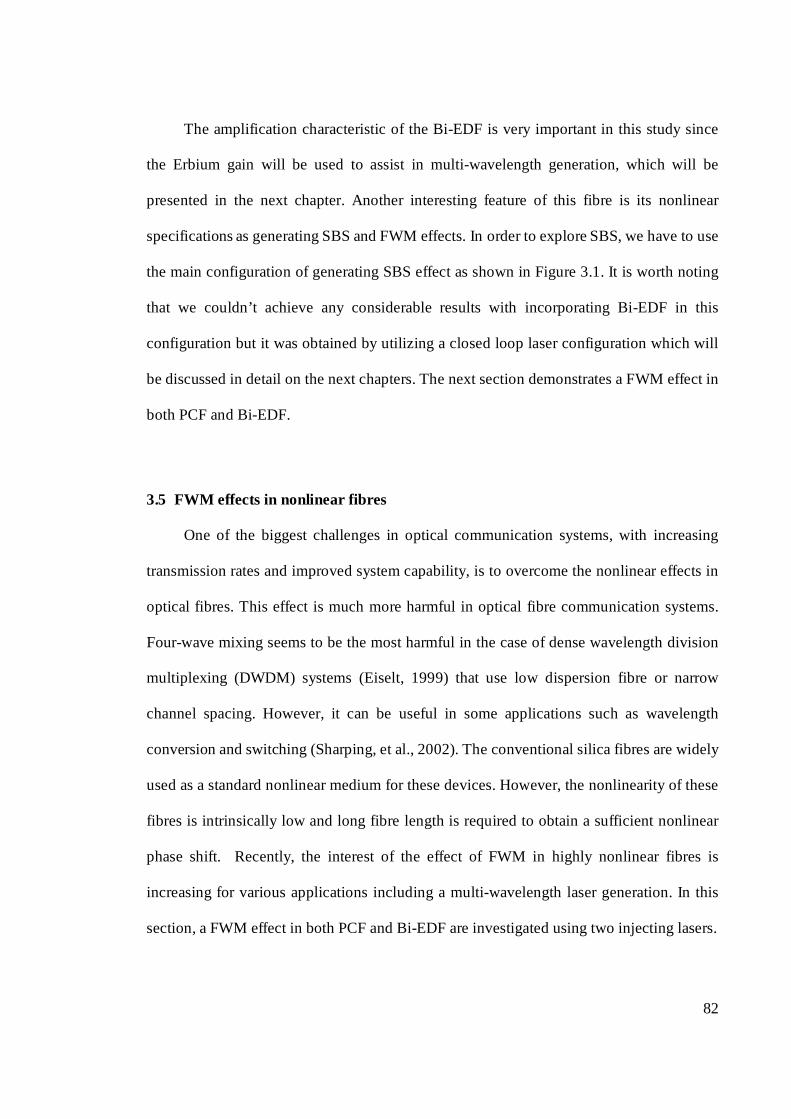
82
The amplification characteristic of the Bi-EDF is very important in this study since
the Erbium gain will be used to assist in multi-wavelength generation, which will be
presented in the next chapter. Another interesting feature of this fibre is its nonlinear
specifications as generating SBS and FWM effects. In order to explore SBS, we have to use
the main configuration of generating SBS effect as shown in Figure 3.1. It is worth noting
that we couldn’t achieve any considerable results with incorporating Bi-EDF in this
configuration but it was obtained by utilizing a closed loop laser configuration which will
be discussed in detail on the next chapters. The next section demonstrates a FWM effect in
both PCF and Bi-EDF.
3.5 FWM effects in nonlinear fibres
One of the biggest challenges in optical communication systems, with increasing
transmission rates and improved system capability, is to overcome the nonlinear effects in
optical fibres. This effect is much more harmful in optical fibre communication systems.
Four-wave mixing seems to be the most harmful in the case of dense wavelength division
multiplexing (DWDM) systems (Eiselt, 1999) that use low dispersion fibre or narrow
channel spacing. However, it can be useful in some applications such as wavelength
conversion and switching (Sharping, et al., 2002). The conventional silica fibres are widely
used as a standard nonlinear medium for these devices. However, the nonlinearity of these
fibres is intrinsically low and long fibre length is required to obtain a sufficient nonlinear
phase shift. Recently, the interest of the effect of FWM in highly nonlinear fibres is
increasing for various applications including a multi-wavelength laser generation. In this
section, a FWM effect in both PCF and Bi-EDF are investigated using two injecting lasers.
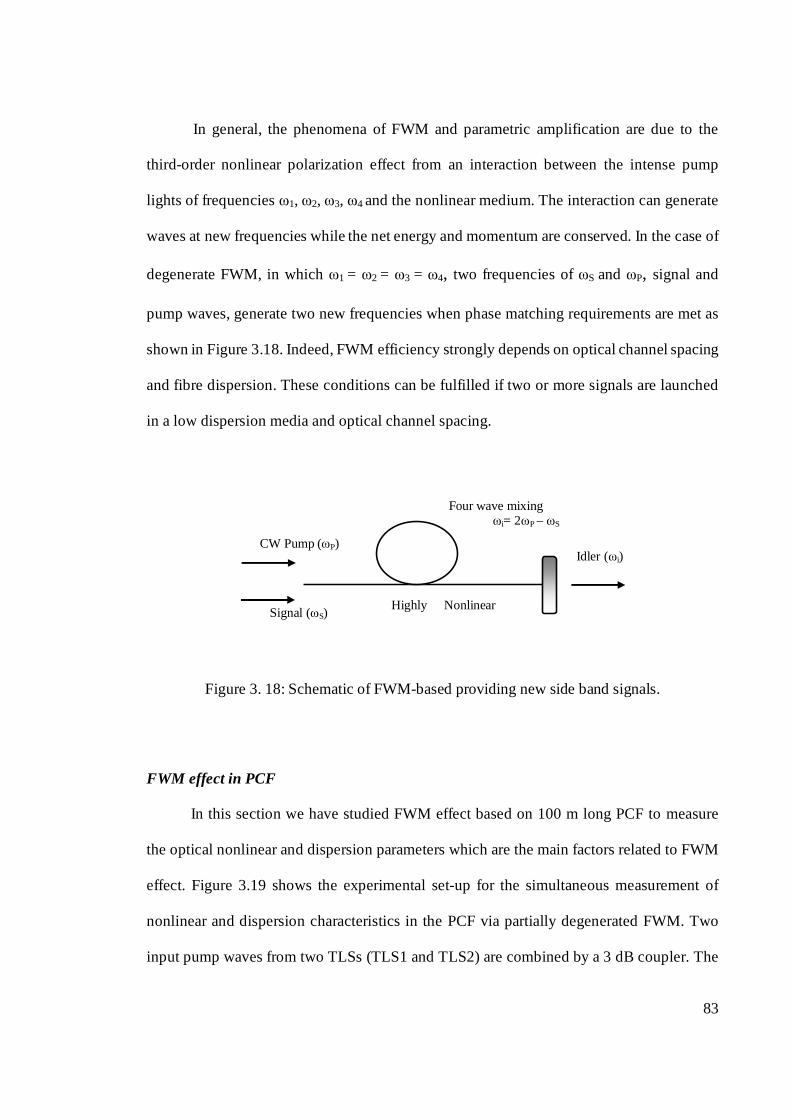
83
In general, the phenomena of FWM and parametric amplification are due to the
third-order nonlinear polarization effect from an interaction between the intense pump
lights of frequencies ω1, ω2, ω3, ω4 and the nonlinear medium. The interaction can generate
waves at new frequencies while the net energy and momentum are conserved. In the case of
degenerate FWM, in which ω1 = ω2 = ω3 = ω4, two frequencies of ωS and ωP, signal and
pump waves, generate two new frequencies when phase matching requirements are met as
shown in Figure 3.18. Indeed, FWM efficiency strongly depends on optical channel spacing
and fibre dispersion. These conditions can be fulfilled if two or more signals are launched
in a low dispersion media and optical channel spacing.
Figure 3. 18: Schematic of FWM-based providing new side band signals.
FWM effect in PCF
In this section we have studied FWM effect based on 100 m long PCF to measure
the optical nonlinear and dispersion parameters which are the main factors related to FWM
effect. Figure 3.19 shows the experimental set-up for the simultaneous measurement of
nonlinear and dispersion characteristics in the PCF via partially degenerated FWM. Two
input pump waves from two TLSs (TLS1 and TLS2) are combined by a 3 dB coupler. The
Idler (ωi) CW Pump (ωP)
Signal (ωS)
Four wave mixing ωi= 2ωP – ωS
Highly Nonlinear

84
combined waves are amplified by an EDFA before it is launched into the PCF, which is
also a polarization maintaining fibre. Since the FWM efficiency depends on the light‘s
polarizations, two polarization controllers (PCs) are incorporated to adjust the polarization
at the input to obtain maximum FWM efficiency. When the pump wave and signal wave
propagate in the fibre, FWM is generated as an optical side-band by the third order optical
nonlinearity. The FWM products are measured with OSA at the output.
Figure 3.19: Experimental setup for providing new side band signals based on FWM effect.
Figure 3.20 illustrates the optical spectrum at the output of the 100 m long PCF
when the channel spacing is fixed at 1and 0.5nm. In this experiment the TLS1 is
considered as a pump with a fixed wavelength of 1560 nm. The TLS acts as a signal source
with a variable wavelength. As shown in the figure, an optical side-band is observed at the
output spectrum even in quite short-length of PCF for both signal source wavelengths of
1560.5 and 1561nm, which a closer wavelength generates a relatively higher power side-
band. This shows that the pump power of 14 dBm and the gain medium of 100m are
sufficient for providing and exploring the nonlinear FWM effect. FWM of degenerated
pump wave and signal wave appears at the frequency of 2ωP-ωS, which is 1nm from the
TLS1
TLS2
Pump at 1560nm
PC
Signal at 1560nm+∆λ
PC
EDFA
3 dB, Coupler
Pump
Signal FWM
λ
PCF, 100m
OSA

85
pump as shown in Figure 3.20. Two peaks also are generated on the right side of the pump
wavelength due to the FWM as well. Because FWM effect can happen mutually even we
change the definition of the pump and signal waves names. These peaks are produced in the
equal spacing with the left side generated peaks that this is the specifications of FWM
effect.
Figure 3. 20: FWM spectrum by 100 long PCF with the wavelength detuning is ∆λ=1 and 0.5 nm.
The stability of the side-band generations is playing a vital role in practical
applications. Figure 3.21 shows the spectral evolutions of the FWM side-band in terms of
time. In the experiment, the output spectral is repeatedly scanned for every 20 min. The
side-band power is observed to very stable with power fluctuations of less than 0.5 dB for
more than 4 hours. To indicate that this short length of PCF can assess the practical
implication even in L-band, we have tried to amplify the input signals in L-band region and
then launch them to the fibre. Figure 3.22 shows the output of FWM effect by 100 m long
PCF provided by injected signals with the wavelength detuning of ∆λ=1, 0.5, and 0.3 nm
from 1600 nm wavelength of pump wave. It is seen that the similar effect is also observed
-60
-50
-40
-30
-20
-10
0
10
1558 1559 1560 1561 1562 1563
Out
put p
ower
(dBm
)
Wavelength (nm)
at 1561 nm
at 1560.5 nm
FWM
Signal
Pump

86
in L-band region. These results show that the proposed configuration is suitable for the
studying of FWM and related nonlinear parameters as chromatic dispersion and nonlinear
coefficient.
Figure 3. 21: Spectral evolutions of the FWM effect structure output against time. (The laser spectra scanned over every 20 minutes).
Figure 3. 22: FWM spectrum by 100 long PCF with the wavelength detuning is ∆λ=1, 0.5, and 0.3 nm in L-band region.
-60
-50
-40
-30
-20
-10
0
10
1598.5 1599.5 1600.5 1601.5 1602.5
Out
put p
ower
(dBm
)
Wavelength (nm)
at 1600.3 nm
at 1600.5 nm
at 1601 nm
Signal
FWM
Pump
Wavelength (nm)
Times duration
Out
put p
ower
(dB
m)

87
effAn
22
2 2 2 2exp( )9FWM P S effP d P P L L
3.6 Simultaneous measurement of nonlinearity and dispersion parameters of PCF
using the FWM effect
In this section, the FWM effect is used to simultaneous measure the nonlinearity
and dispersion parameters of PCF. FWM efficiency in PCF is experimentally measured and
the result is used to estimate the nonlinearity and dispersion parameters theoretically. In the
situation where pump continuous-wave is partially degenerated, power of launched signal is
PS and the spacing is ∆f, the FWM sideband power is given by (Bogoni et al., 2003)
Where η is the FWM efficiency, d is the degeneracy factor (d = 3 and 6 in case of two and
three channels, respectively), γ is the nonlinearity parameter, α is the fibre attenuation
coefficient, L and Leffare the length and the effective length of the fibre respectively. This
equation is the master formula, which has been widely used in recent years to evaluate the
FWM induced crosstalk in WDM systems.
Nonlinearity parameter is defined as follows (Agrawal, 1986):
where Aeff is the effective core area, λ is the vacuum wavelength, andn2is the nonlinear-
index coefficient which is defined based on the nonlinear susceptibility χ(3) by
where n is denoted the refractive index of the fibre core and c is the vacuum speed of light.
Effective length, Leff, of the fibre with linear loss of α is defined as
(3.25)
(3.27)
(3.26)
)3(2
2
248
cnn

88
1 (1 exp( ))effL L
2 2
2 2 2
4.exp( ).sin ( . 2)[1 ](1 exp( ))
L LL
The FWM efficiency η can be expressed as
The phase mismatch Δβ which depends on the fibre chromatic dispersion and channel
frequency spacing is then given by (Hasegawa et al., 2008)
where D is the chromatic dispersion parameter and ∆f is the detuned spacing between signal
and pump wavelength. Since ∆β is not a function of signal powers, it is also known as
linear phase-matching factor (Song et al., 1999). The dispersion parameter can be
expressed as;
whereβ2 is the group velocity dispersion (GVD) parameter (Hasegawa et al., 2008).From
Equation (3.25), the maximum FWM signal power can be used to determine the nonlinear
coefficient by carefully measuring input pump and signal powers, PCF length and fibre
loss. To assess the practical evaluation of this theoretical analysis, we estimate the
dispersion of incorporated PCF as a simple example. Since s is closed enough to p, FWM
efficiency is estimated to be around 1. Therefore, the nonlinear coefficient of the PCF is
calculated to be about 43(WKm)-1 at 1560nm according to equation (3.25). The averaged
zero dispersion wavelengths is estimated to be around 1560nm due to the maximum FWM
intensity that was observed in this wavelength region.
(3.29)
222 D f
c
(3.30)
2
22D
c (3.31)
(3.28)

89
The measured FWM signal intensity against wavelength is analyzed to extract the
fibre dispersion characteristic by tuning signal laser wavelength while the pump laser
wavelength is fixed. Figure 3.23 shows the measured FWM spectra when the pump
wavelength is fixed at 1560 nm and the signal wavelength is changed from 1560.5 nm to
1565 nm. The FWM is observed in anti-stokes side to the signal wave. With detuning the
signal wavelength, the FWM efficiency also changes because of the phase mismatching.
Figure 3.24 indicates the relation between the channels spacing ∆f and the FWM power
conversion efficiency. The theoretical results are obtained by solving and fitting Equations
(3.25), (3.30) and (3.31) as a function of the spacing detuning. The theoretical fitting is
found to be in a good agreement to the experimental results as shown in Figure 3.24. In
order to demonstrate the vital role of nonlinear coefficient in the FWM power conversion
efficiency, the theoretical data is also investigated for higher values of γ; 60 and 100
(Wkm)-1 for comparison purpose. This comparison shows that the FWM power conversion
efficiency increases with the fibre nonlinearity and this trend is not linear.
Figure 3. 23: Wavelength detuning FWM spectra in PCF. The pump wavelength is fixed at 1560nm.
-60
-50
-40
-30
-20
-10
0
10
1554 1556 1558 1560 1562 1564 1566
outp
ut p
ower
(dB
m)
Wavelength (nm)
FWM
Pump Signal
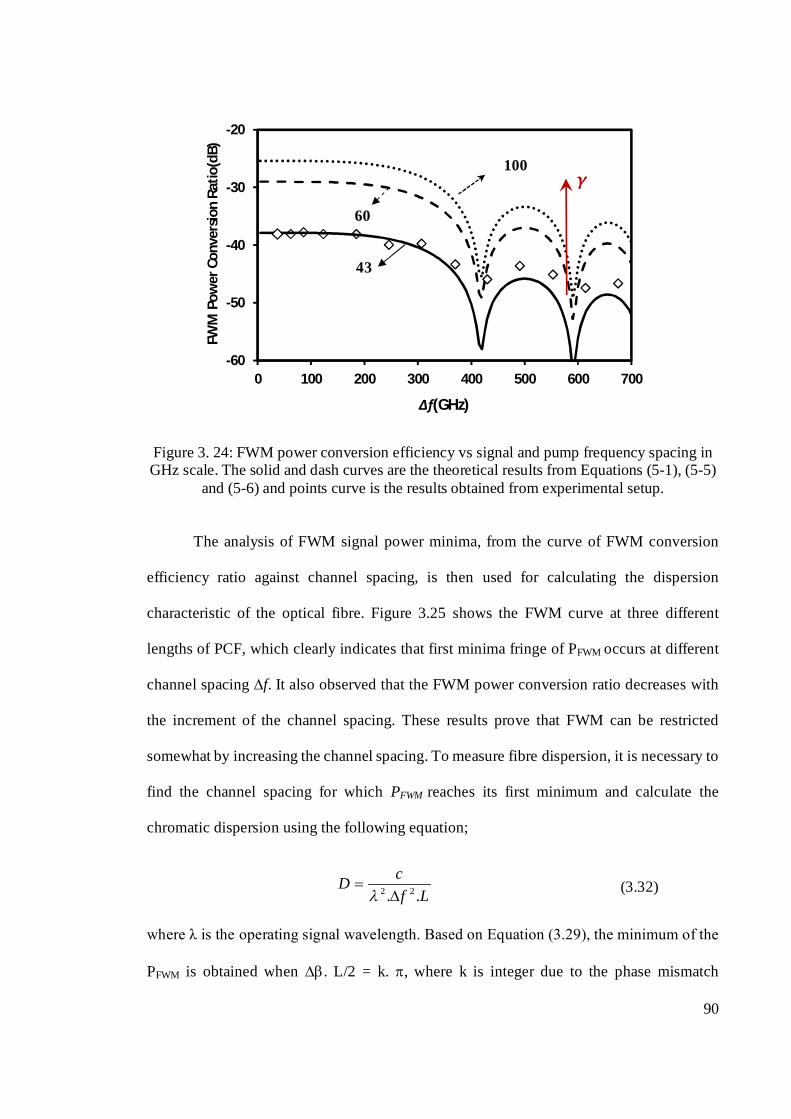
90
Figure 3. 24: FWM power conversion efficiency vs signal and pump frequency spacing in GHz scale. The solid and dash curves are the theoretical results from Equations (5-1), (5-5)
and (5-6) and points curve is the results obtained from experimental setup.
The analysis of FWM signal power minima, from the curve of FWM conversion
efficiency ratio against channel spacing, is then used for calculating the dispersion
characteristic of the optical fibre. Figure 3.25 shows the FWM curve at three different
lengths of PCF, which clearly indicates that first minima fringe of PFWM occurs at different
channel spacing ∆f. It also observed that the FWM power conversion ratio decreases with
the increment of the channel spacing. These results prove that FWM can be restricted
somewhat by increasing the channel spacing. To measure fibre dispersion, it is necessary to
find the channel spacing for which PFWM reaches its first minimum and calculate the
chromatic dispersion using the following equation;
where λ is the operating signal wavelength. Based on Equation (3.29), the minimum of the
PFWM is obtained when . L/2 = k. , where k is integer due to the phase mismatch
-60
-50
-40
-30
-20
0 100 200 300 400 500 600 700
FWM
Pow
er C
onve
rsio
n Ra
tio(d
B)
∆f(GHz)
γ
43
100
60
2 2. .cDf L
(3.32)

91
between the signals that propagate inside the fibre. As shown in Figure 3.25, the first
minimum of the FWM power conversion efficiency is obtained at 430 GHz spacing for the
PCF with 100m length. Assuming c = 3 x 10⁸ m/s and = 1560 nm, the chromatic
dispersion of the PCF is calculated to be around 6.05ps/nm.km. The numbers of fringes
depend on the FWM mismatch factor or k integer, which increases with the fibre length for
the case of same phase mismatching. Therefore, the number of fringes is observed to be
higher at 300m compared with 100m by 3 times as shown in Figure 3.25.
Figure 3. 25: FWM power conversion efficiency against the frequency spacing detuning at various PCF lengths.
Evaluation of the Kerr nonlinearity Figure-of-merit
If two beams of continuous light wave with a particular frequency difference are
injected into a fibre, a beat signal will be generated. When the beat signal propagates along
-55
-50
-45
-40
-35
-30
0 100 200 300 400 500 600 700
FWM
Pow
er C
onve
rsio
n Ra
tio(d
B)
∆f(GHz)
300m
200m
100m
1st, 300m
2nd, 300m 1st, 200m
Main fringe

92
the fibre, its spectrum will broaden due to the GVD and self-phase modulation (SPM)
(Agrawal, 1998). To evaluate the nonlinear performance of the PCF, a figure-of-merits
(FOMs) is derived based on the required input signal power to achieve a certain nonlinear
phase shift. The Kerr nonlinearity FOM is given by (Agrawal, 1998);
Figure 3.26 shows the nonlinear phase shift calculated against the input optical
power. As shown in the figure, the nonlinear phase shift is linearly increased with the input
signal power. The slope of the linear curve determines twice of the FOM, which evaluates
the nonlinear performance of this fibre. As shown in Figure 3.26, the FOM for the 100 long
PCF is observed to be around 0.737 (W-1) which is comparable to the nonlinearity
performance of another PCF mentioned in Ref. (Song et al., 1999). It is probably attributed
to its special structure based on air and silica by making an efficient refractive index.
Figure 3. 26: Nonlinear phase shift calculated as a function of the input optical power.
3.7 Investigation of FWM effect in Bi-EDF
In this section, the FWM effect in Bi-EDF with two different lengths is investigated
by injecting two signals, which the experimental set-up is almost similar to Figure 3.19
0
0.002
0.004
0.006
0.008
0.01
0 5 10 15 20 25 30 35
Non
linea
r Pha
se sh
ift (r
ad)
Input Optical Power(mW)
Slope=2×FOM (W-1)

93
expected for the 1480 nm pump. The Bi-EDF is pumped by 120 mW to compensate for
absorption loss as well as to provide gain for the FWM pumps. Two different lengths of 49
and 215 cm Bi-EDF are used as a nonlinear gain medium to realize the FWM sideband.
This Bi-EDF has a nonlinear coefficient of ~60 (W·km)-1 which other special features have
been mentioned in previous chapters. Figure 3.28 shows optical spectra obtained when two
signals with different spacing are launched into a piece of 49 cm long Bi-EDF. In this
experiment, the spectral spacing of the three wavelengths was changed by tuning TLS2. As
shown in the figure, only dual-wavelength output is observed in the output. This shows that
this fibre is not able to provide any idler signal probably due to insufficient interaction
length.
These investigations show that FWM signal cannot be achieved in the open-loop
configuration of Figure 3.27 with 49 cm long Bi-EDF. To enhance its FWM efficiency and
operating in the C-band region, the 49 cm Bi-EDF is used in closed loop such as in linear
and ring cavities as explained in the following chapters. Figure 3.28 shows the output
spectrum obtained when two signals with 1.0 nm spacing are launched into a longer piece
of 215 cm long Bi-EDF. The Bi-EDF provides amplification in L-band with this length and
therefore the pump wavelength operates in L-band region. By incorporating a longer length
of fibre, the product is larger and somehow 215 cm of Bi-EDF is sufficient to
generate FWM sideband signals as shown in Figure 3.28. is the nonlinear coefficient of
the fibre, P is the optical power passing through the fibre and L isthe effective length of the
used fibre.
PL

94
-65
-55
-45
-35
-25
-15
-5
5
15
1610.5 1611 1611.5 1612 1612.5 1613 1613.5 1614 1614.5
Out
put p
ower
(dBm
)
Wavelength(nm)
Figure 3. 27: Optical spectra obtained from the different spacing-tunable dual-wavelength source using 49 cm long Bi-EDFA.
Figure 3. 28: Optical spectra obtained from the different spacing-tunable dual-wavelength source using 215 cm long Bi-EDFA with the inset graph of stability of this achieved FWM.
In the next chapter, performances of nonlinear fibre lasers are investigated using two
different gain media of PCF and Bi-EDF. Various configurations of Brillouin fibre lasers
will be proposed and demonstrated for both single- and dual-wavelength operations. FWM-
based fibre laser will also be demonstrated for multi-wavelength operation.
-60
-50
-40
-30
-20
-10
0
10
1558 1558.5 1559 1559.5 1560 1560.5 1561 1561.5 1562
Out
put p
ower
(dBm
)
Wavelength (nm)
at 1560.1 nm
at 1560.3 nm
at 1560.5 nm
FWM
Pump Signal

95
CHAPTER FOUR: COMPACT NONLINEAR FIBRE LASER
CONFIGURATIONS EMPLOYING PHOTONIC CRYSTAL FIBRE
AND BISMUTH BASED ERBIUM DOPED FIBRE
4.1 Introduction
In the previous section, both Stimulated Brillouin Scattering (SBS) and Four-Wave
Mixing (FWM) effects are observed in Photonic Crystal Fibre (PCF) and Bismuth-based
Erbium-doped fibre (Bi-EDF). Brillouin fibre lasers (BFLs) can be generated by the SBS
and has many potential applications in instrument testing and sensing, as well in an optical
source for dense wavelength division multiplexing (DWDM) systems (Yang et al., 2005).
Provided that SBS induced Brillouin amplification overcompensates the cavity loss,
Brillouin Stokes waves oscillates and it generates BFLs. Furthermore, the Brillouin
threshold reduces when operating in a closed loop such as ring and linear cavities. The BFL
device is desirable to use a gain medium with a large Brillouin gain coefficient such as PCF
and Bi-EDF to lower the power requirements and to shorten the length of the device (Inoue,
1995; McIntosh et al., 1997 and Lee et al., 2005 (a)). The use of Erbium gain in BFL’s
cavity such as in Brillouin erbium fibre laser (BEFL) would also reduce the power
requirement and enhances the efficiency of the Stokes generation process in the laser. On
the other hand, the FWM effect can also be used to construct nonlinear fibre laser.FWM-
based fibre laser has many applications in multi-wavelength generation as well as a
wavelength convertor.
In this chapter, a conventional BFL set-up is introduced. Various new architectures
for BFL have been proposed using either PCF or Bi-EDF as the gain medium to reduce the

96
threshold power of the SBS effect as well as to increase the efficiency of the BFL. A
compact laser is also demonstrated using a 49 cm long Bi-EDF as the gain medium. Dual
wavelength laser is then demonstrated using PCF. FWM-based laser is demonstrated at the
end of this chapter using a Bi-EDF as a gain medium.
4.2 A conventional Brillouin Fibre Laser
This section demonstrated a BFL generation using a piece of PCF as the gain
medium in a ring configuration. The configuration of the conventional ring BFL is
illustrated in Figure 4.1, which consists of an optical circulator, a 3dB coupler and a piece
of PCF. The Brillouin pump (BP) is an external cavity Tunable Laser Source (TLS) with a
line-width of approximately 20MHz, which is amplified by an Erbium-doped fibre
amplifier (EDFA) to provide sufficient power for this study. The BP wavelength is fixed at
1560 nm in this experiment. The BP is launched through the optical circulator to generate a
backward propagating SBS, which oscillates inside the resonator to generate the laser at
wavelength downshifted by 0.08 nm from the BP wavelength. The clockwise oscillating
laser is extracted from the resonator via the 3dB coupler to route into the Optical Spectrum
Analyzer (OSA) via optical circulator. In this BFL, only single-wavelength of the Brillouin
Stokes line is obtained because the Brillouin Stokes cannot act as subsequent BP to create
higher order Brillouin Stokes signals. The output of the BFL is characterized using an OSA
with a resolution of 0.015 nm. The experiments are carried out for three different lengths of
PCF; 100m, 50m and 20m.

97
Figure 4. 1: Experimental configurations of the PCF-based BFL conventional ring cavity. Figure 4.2 demonstrates the output spectrum of the BFL at different lengths of PCF
while the BP power is fixed at 15.7 dBm. The line spacing is obtained at approximately
0.08 nm in the wavelength domain, as measured by the OSA. The 3dB spectral bandwidth
of the BFL is measured to be less than 0.02 nm, limited by the OSA resolution. The peak
power of the laser is obtained as 0.9 dBm and -3.6 dBm at 50 m and 100 m, respectively.
The peak power of 100 m long PCF is less than 50 m long PCF due to more absorption by
longer length. However, as shown in Figure 4.2, side mode suppression ratios (SMSRs) of
the BFL are obtained at 26.4 dB and 22.2 dB with 100 m and 50 m long PCF respectively
due to the Brillouin gain by longer length of PCF. Although the longer PCF in the BFL
resonator increases the cavity’s loss, it provides a better nonlinearity characteristic to
achieve an efficient SBS using a micro-structured cladding region with air holes to guide
light in a pure silica core. No lasing is observed with the 20 m long PCF due to the
insufficient fibre length is not enough to generate an adequate Brillouin gain to compensate
for the cavity loss.
PCF
Circulator
Output
3dB, Coupler
Brillouin pump
TLS

98
Figure 4. 2: Output spectra of the ring BFL with different long PCF.
Figure 4.3 shows the measured peak power of the BFL against the input BP power.
As shown in the figure, the peak power increases with the BP power. The threshold power
is the BP power at the point where the resonator starts to generate laser via SBS. It is
defined as the input BP power at which a sudden jump of the BFL’s peak power is
observed (as was discussed in detail on section 3.2). Below this threshold power, only
spontaneous scattering emission is oscillating in the resonator. The SBS thresholds are
obtained at about 8.1and 9.9dBm with the use of 100 and 50 m PCF respectively. As shown
in Figure 4.3, the BFL power increment with BP power starts to saturate at around 13 dBm
due to the power transfer to the higher order Stokes meanwhile for the 20 m PCF the
threshold requirements are not met by this pump power using the conventional
configuration. With 20 m long PCF, no abrupt change from spontaneous scattering to the
stimulated scattering is observed as shown in Figure4.3 due to insufficient interaction
-65
-55
-45
-35
-25
-15
-5
5
1559.7 1559.8 1559.9 1560 1560.1 1560.2 1560.3 1560.4
Out
put p
ower
(dBm
)
Wavelength (nm)
100m50m20m
Backscattered
Residual Pump
Anti-Stokes
Brillouin Peak

99
length. The output of the BFL is observed to be stable at room temperature with only minor
fluctuations observed coinciding with large temperature variances. Therefore, the threshold
power of the BFL reduces with increasing PCF length.
Figure 4. 3: Brillouin Stokes power as a function of BP power at different gain medium.
4.3 Measurement of Brillouin frequency shift
Brillouin scattering happens when an intense light interacts with the medium to
generate Stokes in the backward direction at a frequency, which is downshifted by the
characteristic of the acoustic frequency (Agrawal, 2003).The typical Brillouin frequency
shifts for liquids and gases media are of the order of 1–10 GHz and for silica fibres, it is of
the order of nearly10–20 GHz. Since, the frequency shift is reasonably small, a high
resolution device is normally required to directly measure the shift. Therefore, a heterodyne
method is proposed to measure the frequency shift by using a configuration as depicted in
Figure 4.4. The configuration consists of a Brillouin pump, an Erbium-doped fibre
amplifier (EDFA), a ring cavity Brillouin gain block and a frequency shift measurement
-70
-60
-50
-40
-30
-20
-10
0
10
5 6 7 8 9 10 11 12 13 14 15 16
Peak
Pow
er (d
Bm)
Brillouin Pump Power (dBm)
100m, 1st stoke100m,Reflected Pump50m, 1st stoke50m, Reflected pump20m, 1st stoke20m, Reflected pump

100
setup. The gain block consists of a piece of PCF and a 3 dB coupler, in which the Brillouin
gain oscillates in an anti-clockwise direction to generate a BFL. The gain block is
constructed with a ring cavity to provide sufficient Brillouin laser due to the high threshold
power of the 100 m long PCF in the open loop configuration. The BP light operating at
1555 nm is split into the reference and probe signals, by using a 10 dB coupler. The probe
signal from the 10 % part is optically amplified by an EDFA to provide a sufficient output
power of 14 dBm for this study. Since the peak power of the beating signals of TLS and
Brillouin laser is nearly same, the 90% is separated and 10% is amplified to reach that one.
This amplified signal is launched into the PCF through an optical circulator, which is also
used to couple out the backward propagating light from the ring cavity, including a BFL
operating at wavelength downshifted by 0.08 nm from the BP wavelength, into the
photodiode. The output Brillouin signal is combined with the reference or BP signal by a 3
dB coupler for the Brillouin shift measurement. The combined optical signal is converted
into an electrical signal by a phodiode which is connected to an RF spectrum analyzer. The
threshold power of SBS effect in this PCF is more than 19 dBm as mentioned in section
3.2; however, the power of injected signal is about 14 dBm and thus the ring BFL setup is
used in this study. The ring laser is capable to reduce the threshold power for SBS
generation. The experiment is repeated by changing the gain medium of the BFL to a piece
of 25 km long standard SMF instead of the PCF.

101
Figure 4. 4: The experimental setup utilizing the heterodyne technique for Brillouin frequency shift measurement in PCF by using a BFL.
The Brillouin Stokes laser is generated from interactions between the optical mode
and acoustic modes in the fibre core. Thermally excited acoustic waves (acoustic phonons)
produce a periodic modulation of the refractive index. Brillouin scattering occurs when the
light is diffracted backward on this moving grating, giving rise to frequency shifted Stokes
and anti-Stokes components. This process can be stimulated when the interferences of the
laser light and the Stokes wave reinforce the acoustic wave through electrostriction. Since
the scattered light undergoes a Doppler frequency shift, the Brillouin shift depends on the
acoustic velocity and is given by (Alahbabi et al., 2005):
where푉 is the acoustic velocity within the fibre, n is the refractive index and λ is the
vacuum wavelength of the incident lightwave. The strong attenuation of sound waves in
a
BnV2
(4.1)
10%
90%
TLS EDFA
1
3
50%
100% PM
PM
ISO
Photodiode 20GHz
RF spectrum analyzer
Stokes
Fibre under test
50%
Brillouin Pump
Brillouin ring cavity
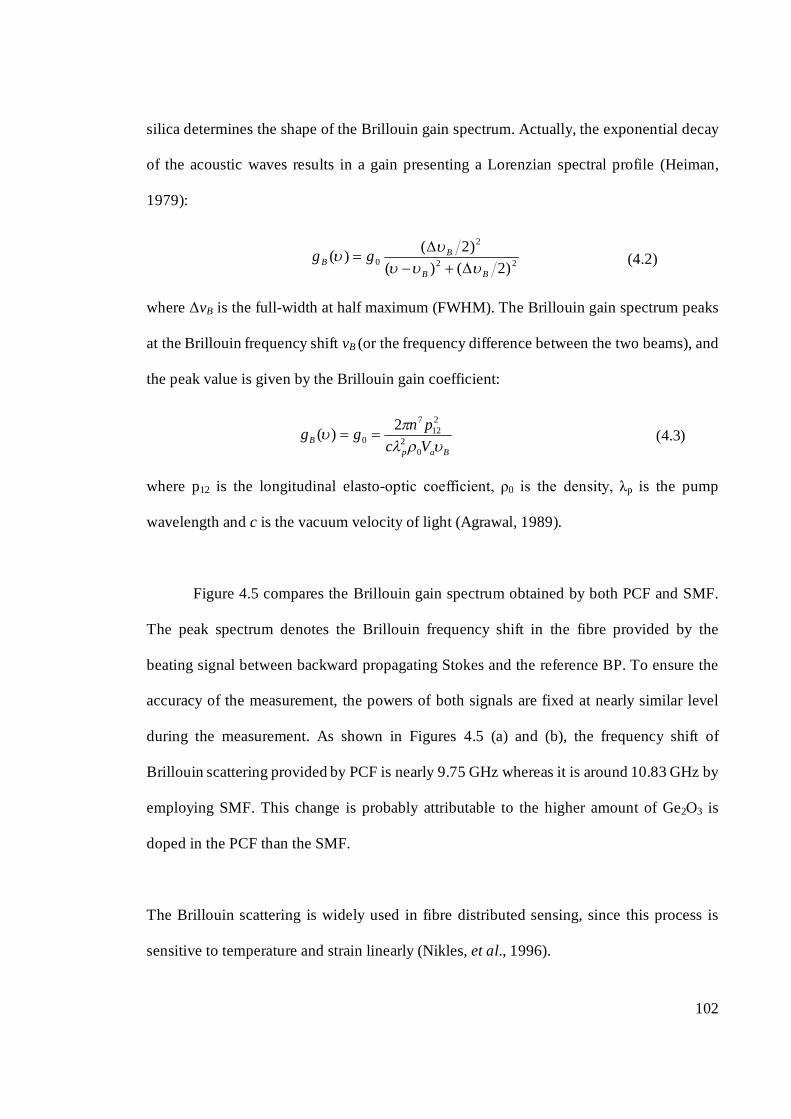
102
silica determines the shape of the Brillouin gain spectrum. Actually, the exponential decay
of the acoustic waves results in a gain presenting a Lorenzian spectral profile (Heiman,
1979):
where ΔvB is the full-width at half maximum (FWHM). The Brillouin gain spectrum peaks
at the Brillouin frequency shift vB (or the frequency difference between the two beams), and
the peak value is given by the Brillouin gain coefficient:
where p12 is the longitudinal elasto-optic coefficient, ρ0 is the density, λp is the pump
wavelength and c is the vacuum velocity of light (Agrawal, 1989).
Figure 4.5 compares the Brillouin gain spectrum obtained by both PCF and SMF.
The peak spectrum denotes the Brillouin frequency shift in the fibre provided by the
beating signal between backward propagating Stokes and the reference BP. To ensure the
accuracy of the measurement, the powers of both signals are fixed at nearly similar level
during the measurement. As shown in Figures 4.5 (a) and (b), the frequency shift of
Brillouin scattering provided by PCF is nearly 9.75 GHz whereas it is around 10.83 GHz by
employing SMF. This change is probably attributable to the higher amount of Ge2O3 is
doped in the PCF than the SMF.
The Brillouin scattering is widely used in fibre distributed sensing, since this process is
sensitive to temperature and strain linearly (Nikles, et al., 1996).
22
2
0 )2()()2()(
BB
BB gg
BapB Vc
pngg
0
2
212
7
02)( )3.4(
(4.2)

103
Figure 4. 5: The Brillouin gain spectrum measured by RF spectrum analyzer for (a) 100 m PCF and (b) 25 km SMF.
(a)
(b)
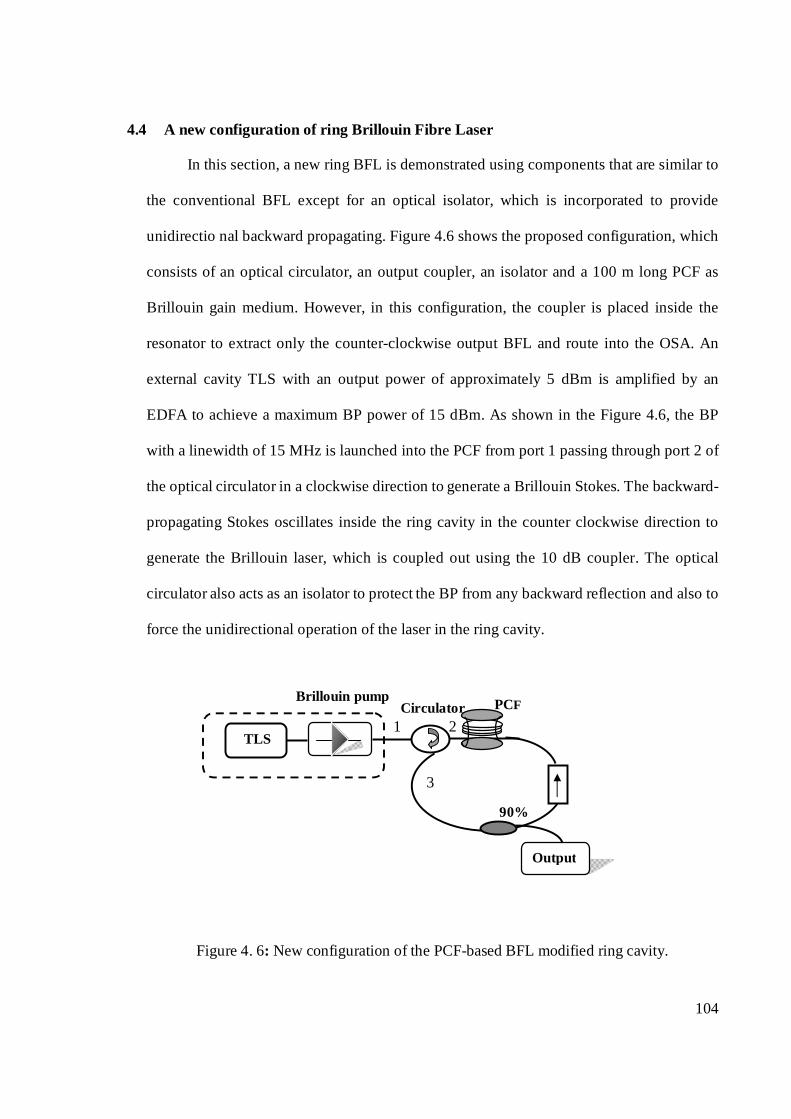
104
4.4 A new configuration of ring Brillouin Fibre Laser
In this section, a new ring BFL is demonstrated using components that are similar to
the conventional BFL except for an optical isolator, which is incorporated to provide
unidirectio nal backward propagating. Figure 4.6 shows the proposed configuration, which
consists of an optical circulator, an output coupler, an isolator and a 100 m long PCF as
Brillouin gain medium. However, in this configuration, the coupler is placed inside the
resonator to extract only the counter-clockwise output BFL and route into the OSA. An
external cavity TLS with an output power of approximately 5 dBm is amplified by an
EDFA to achieve a maximum BP power of 15 dBm. As shown in the Figure 4.6, the BP
with a linewidth of 15 MHz is launched into the PCF from port 1 passing through port 2 of
the optical circulator in a clockwise direction to generate a Brillouin Stokes. The backward-
propagating Stokes oscillates inside the ring cavity in the counter clockwise direction to
generate the Brillouin laser, which is coupled out using the 10 dB coupler. The optical
circulator also acts as an isolator to protect the BP from any backward reflection and also to
force the unidirectional operation of the laser in the ring cavity.
Figure 4. 6: New configuration of the PCF-based BFL modified ring cavity.
PCF Circulator
Brillouin pump
1
3
2
90%
Output
TLS
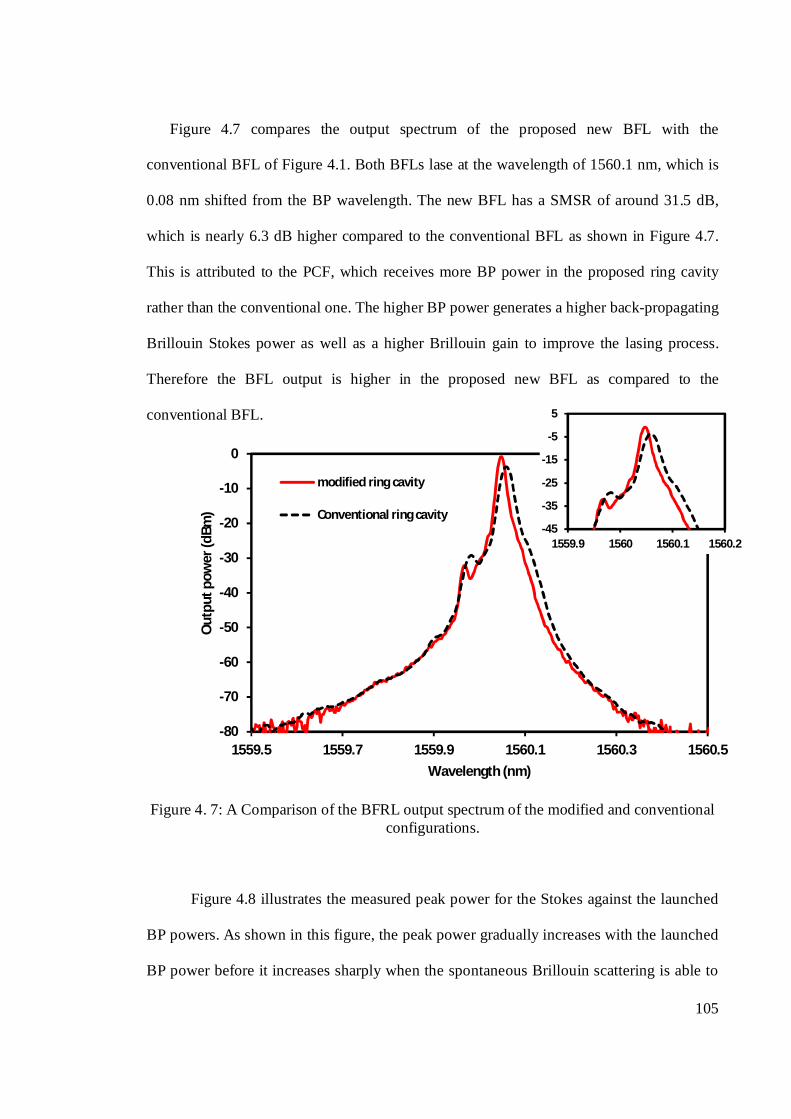
105
Figure 4.7 compares the output spectrum of the proposed new BFL with the
conventional BFL of Figure 4.1. Both BFLs lase at the wavelength of 1560.1 nm, which is
0.08 nm shifted from the BP wavelength. The new BFL has a SMSR of around 31.5 dB,
which is nearly 6.3 dB higher compared to the conventional BFL as shown in Figure 4.7.
This is attributed to the PCF, which receives more BP power in the proposed ring cavity
rather than the conventional one. The higher BP power generates a higher back-propagating
Brillouin Stokes power as well as a higher Brillouin gain to improve the lasing process.
Therefore the BFL output is higher in the proposed new BFL as compared to the
conventional BFL.
Figure 4. 7: A Comparison of the BFRL output spectrum of the modified and conventional configurations.
Figure 4.8 illustrates the measured peak power for the Stokes against the launched
BP powers. As shown in this figure, the peak power gradually increases with the launched
BP power before it increases sharply when the spontaneous Brillouin scattering is able to
-80
-70
-60
-50
-40
-30
-20
-10
0
1559.5 1559.7 1559.9 1560.1 1560.3 1560.5
Out
put p
ower
(dBm
)
Wavelength (nm)
modified ring cavity
Conventional ring cavity-45
-35
-25
-15
-5
5
1559.9 1560 1560.1 1560.2

106
generate Stokes via SBS. The laser thresholds for the conventional and the proposed new
BFL are obtained at around 12.7 and 10.4 dBm, respectively. The threshold power is
defined as the BP power where the resonator starts to generate laser or Stokes via SBS and
abrupt changes happening as discussed in the previous chapter of section 3.2. Below this
threshold power, only spontaneous scattering emission oscillates in the resonator, which
provides no Brillouin gain to overcome the cavity loss. Besides having a better SMSR, the
proposed BFL has also a smaller threshold power compared to that of the conventional
BFL as shown in Figure 4.8. This is most probably due to the cavity loss which is lower in
the proposed configuration.
Figure 4. 8: Brillouin Stokes power as a function of BP power for both new and conventional BFLs.
4.5 Brillouin Stokes generation with a Bismuth-based EDF (Bi-EDF)
As discussed in Chapter 3, the Bi-EDF is an effective gain medium for realizing the
compact optical amplifier. Another striking feature of the Bi-EDF is its ultrahigh nonlinear
coefficient, which is 100 times larger than that of silica-based highly nonlinear fibre
(HNLF) (Guan et al., 2003). Therefore, it can offer strong nonlinear effect in a relatively
-70
-60
-50
-40
-30
-20
-10
0
2 4 6 8 10 12 14 16 18
Brill
ouin
Sto
kes p
eak
pow
er (d
Bm)
Brillouin pump power (dBm)
Proposed ring cavity
Conventional ring cavity

107
very short length (~0.5 m) of fibre for realizing a compact BFL or BEFL. To date, many
works have been reported on compact BFLs using a reduced length of nonlinear fibre
(Sugimoto et al., 2004). In an earlier study, a compact BEFL has been demonstrated using a
215-cm-long Bi-EDF as the gain medium (Harunet al., 2008). In this section, a BEFL is
demonstrated using a further reduced length of Bi-EDF (49 cm) as the gain medium.
Although the maximum peak power obtained is just approximately -4 dBm, the BFL has a
very narrow linewidth and low relative intensity noise (RIN).
Figure 4.9 illustrates the architecture of the proposed BEFL, which consists of an
optical circulator, output coupler and Bi-EDF in a ring configuration. The Brillouin gain
medium is provided by a piece of 49-cm-long Bi-EDF. The Bi-EDF is pumped by a 1480-
nm laser diode to provide amplification in C-band region from 1525 to 1570 nm so that it
can amplify the SBS Stokes. The circulator used in this ring cavity laser system also act as
an isolator to direct the propagation of Brillouin–Stokes into a counterclockwise direction.
The measured results were extracted from the laser system by using a 90/10 coupler where
10% power is used for monitoring and measurement purpose while the 90% power is
circulated back into the laser cavity. The 1480-nm pump is injected into the Bi-EDF via the
1480/1550-nm wavelength selective coupler (WSC).

108
Figure 4. 9: Configuration of ring cavity based Bi-EDF.
Figure 4.10 shows the output spectrum of the BEFL at various 1480-nm pump
powers. In the experiment, the BP power and wavelength is fixed at 6 dBm and 1559.40
nm, respectively. As shown in the figure, the BEFL operates at 1559.49 nm, which is 0.09
nm shifted from the BP wavelength at the maximum 1480-nm pump power of 144 mW.
The 0.09-nm difference between the wavelengths of the BEFL and BP is the Brillouin
frequency shift of the Bi-EDF. The operating wavelength of the BEFL is determined by the
Bi-EDF gain and cavity loss in the ring, and therefore, the BP wavelength should be
adjusted to match the peaks of the free-running Bi-EDF laser. The inset of Figure 4.10
illustrates a free running Bi-EDF laser (without the BP) spectrum of the BEFL system
which shows multiple peaks at 1559-nm region. The multiple peaks are obtained due to the
mode competition in the Bi-EDF, which has an inhomogeneous broadening gain
characteristic. Due to the small Brillouin gain, the wavelength of operation of the BEFL
must be close to the peak of Bi-EDF free-running laser. Therefore, the BP signal is
TLS
Bi-EDF, 49cm LD, 1480nm
Coupler
WSC, 1480/1550 nm
OSA
1
3
2
90%
10%

109
launched at this wavelength region to make use of the Bi-EDF gain. The 3-dB bandwidth of
the BEFL is measured to be approximately 0.02 nm limited by the OSA resolution.
Figure 4. 10: Brillouin spectra at 1559.4 nm and free-running spectrum of Bi-EDFA.
At the maximum 1480-nm pump power, the SMSR is obtained at approximately 14
dB. In this work, the SMSR is defined as the power difference between the BEFL’s peak
and the second highest peak, which is the residual backscattered BP signal. The SMSR
decreases with the reduction of the 1480-nm pump power as shown in Figure 4.10.Figure
4.11 depicts the output spectrum of the BEFL at various BP wavelengths. In this
experiment, the BP and 1480-nm pump power are fixed at 6 dBm and 144 mW,
respectively. As shown in the figure, the BP can be tuned from 1558.8 nm to 1560.0 nm
and the maximum power of the generated BEFL is approximately -4 dBm.
-55
-45
-35
-25
-15
-5
5
1558.6 1558.8 1559 1559.2 1559.4 1559.6 1559.8
Out
put p
ower
(dB
m)
Wavelength (nm)
74.5mW114mW144mW
BS
BP
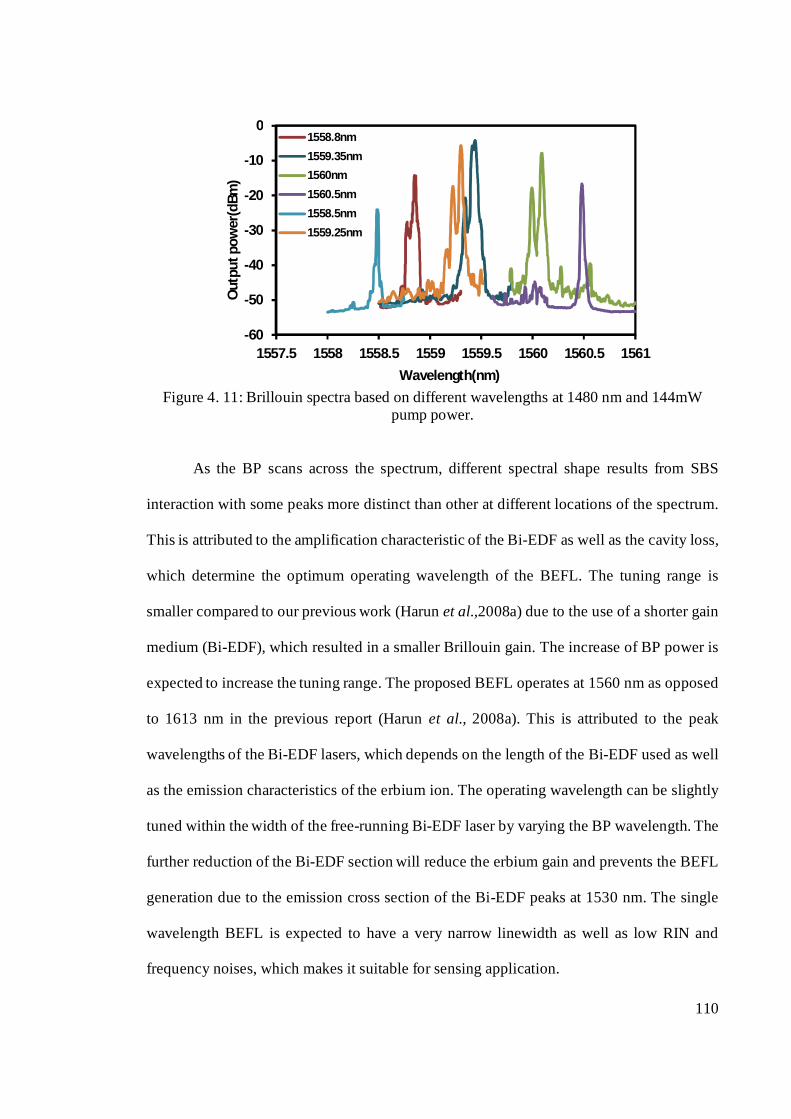
110
Figure 4. 11: Brillouin spectra based on different wavelengths at 1480 nm and 144mW pump power.
As the BP scans across the spectrum, different spectral shape results from SBS
interaction with some peaks more distinct than other at different locations of the spectrum.
This is attributed to the amplification characteristic of the Bi-EDF as well as the cavity loss,
which determine the optimum operating wavelength of the BEFL. The tuning range is
smaller compared to our previous work (Harun et al.,2008a) due to the use of a shorter gain
medium (Bi-EDF), which resulted in a smaller Brillouin gain. The increase of BP power is
expected to increase the tuning range. The proposed BEFL operates at 1560 nm as opposed
to 1613 nm in the previous report (Harun et al., 2008a). This is attributed to the peak
wavelengths of the Bi-EDF lasers, which depends on the length of the Bi-EDF used as well
as the emission characteristics of the erbium ion. The operating wavelength can be slightly
tuned within the width of the free-running Bi-EDF laser by varying the BP wavelength. The
further reduction of the Bi-EDF section will reduce the erbium gain and prevents the BEFL
generation due to the emission cross section of the Bi-EDF peaks at 1530 nm. The single
wavelength BEFL is expected to have a very narrow linewidth as well as low RIN and
frequency noises, which makes it suitable for sensing application.
-60
-50
-40
-30
-20
-10
0
1557.5 1558 1558.5 1559 1559.5 1560 1560.5 1561
Out
put p
ower
(dBm
)
Wavelength(nm)
1558.8nm
1559.35nm
1560nm
1560.5nm
1558.5nm
1559.25nm

111
Figure 4.12 shows the Stokes power against the 1480-nm pump power. As shown in
the figure, the 1480-nm pump power threshold is approximately within 80 to 90 mW.
Below this pump power, the amplifier gain is very low and cannot sufficiently compensate
for the loss inside the laser cavity, and thus, no Stokes is observed. After the threshold
power, the Stokes power is observed to linearly increase with the 1480-nm pump power.
Compared with the earlier report which uses 215-cm Bi-EDF to generate BEFL (Harunet
al.,2008), this BFL has a lower threshold power. This is attributed to a lower cavity loss in
this setup, which is obtained by removing an optical isolator and optimization of the output
coupler by allowing more power to oscillate in the ring cavity. Figure 4.13 shows the curve
of Stokes power against BP power. The BP power threshold is approximately within 0 to 2
dBm. Below this pump power, the Brillouin gain is very small and cannot support the SBS
process in the cavity. The use of optical circulator in the ring cavity allows the
unidirectional operation of the BEFL. This suppresses the four-wave mixing process in the
cavity and therefore no anti-Stokes is observed. These results shows that that a single
wavelength BEFL can be achieved using only a 49-cm Bi-EDF as a gain medium.

112
Figure 4. 12: Brillioun Stokes (BS) peak power against 1480 nm pump power in the BEFL system at fixed BP power of 6 dBm.
Figure 4. 13: Output spectra of the BFL Bi-EDF based on different power of Brillouin pump with pump wavelength 1480 nm at fixed output power of 144 mW.
4.6 Various configurations of BEFL
In the previous section, a BEFL with a SMSR of about 14 dB was demonstrated
using only a piece of 49 cm long Bi-EDF as a gain medium in a ring configuration. In this
section, the BEFL with the same length of (Bi-EDF) is optimized to achieve a better
SMSR. Two different configurations; ring and linear are used to generate BEFL and their
-40
-30
-20
-10
0
40 60 80 100 120 140 160
Stok
e po
wer
(dBm
)
Pump power(mW)
-20
-16
-12
-8
-4
-10 -8 -6 -4 -2 0 2 4 6 8 10
Stok
e po
wer
(dBm
)
BP power(dBm)

113
performances are compared in this work. Figures 4.14 (a) and (b) show the proposed ring
and linear BEFL, respectively. The ring BEFL is configured to be almost similar to the
previous configuration of Figure 4.9 except for the incorporation of an optical isolator and a
polarization controller (PC) in the new configuration. The Bi-EDF is pumped by a 1480nm
laser diode via a WSC at pump power of 144mW to provide amplification in C-band region
so that it can amplify the generated SBS Stokes in both configurations. In the ring
configuration, a circulator is used to direct the propagation of Brillouin–Stokes into an
counterclockwise direction while an isolator is incorporated in the ring to block the
backward propagating ASE and thus improves the SBS nonlinear phenomenon in the
forward direction. In the linear set up, an optical circulator and a broadband FBG that
operating in the C band region are used as reflector at the end of the cavity to provide
oscillation for the SBS Stokes. In both cavities, the output BEFL is extracted from the laser
system by using 90/10 coupler where 10% power is used for monitoring and measurement
purpose while the 90% power is circulated back into the laser cavity. PC has been used to
control the polarization and the birefringence inside the cavity for both configurations. An
external laser source from TLS is used as a BP, which is injected into the cavity via a
circulator for the ring configuration and via a 20 dB coupler in the loop mirror for linear
cavity configuration. For the ring cavity, the experiment is also repeated for the case of
backward pumping (for Bi-EDF) which is obtained by shifting the WSC to a new location
in between the Bi-EDF and optical circulator. In this case, the 1480 nm pump light is
injected in an opposite direction of the oscillating Brillouin laser.
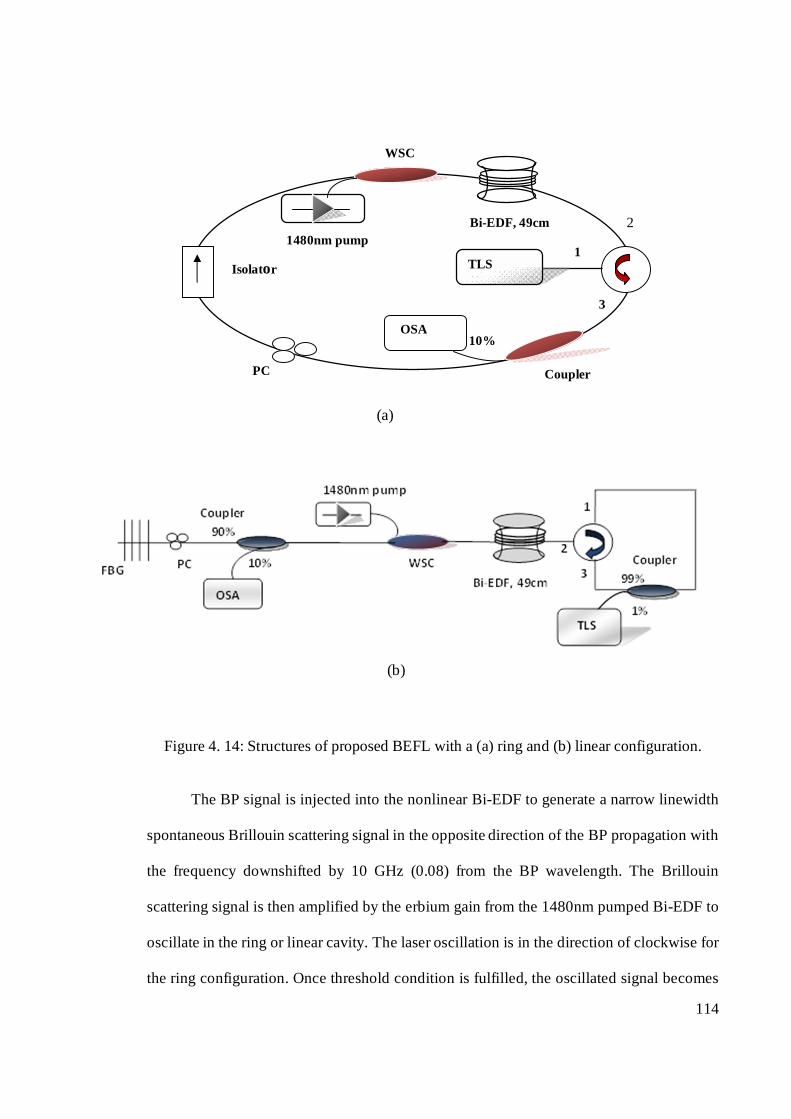
114
Figure 4. 14: Structures of proposed BEFL with a (a) ring and (b) linear configuration.
The BP signal is injected into the nonlinear Bi-EDF to generate a narrow linewidth
spontaneous Brillouin scattering signal in the opposite direction of the BP propagation with
the frequency downshifted by 10 GHz (0.08) from the BP wavelength. The Brillouin
scattering signal is then amplified by the erbium gain from the 1480nm pumped Bi-EDF to
oscillate in the ring or linear cavity. The laser oscillation is in the direction of clockwise for
the ring configuration. Once threshold condition is fulfilled, the oscillated signal becomes
(a)
(b)
1
2
3
Coupler PC
TLS
OSA
3
1 1480nm pump
Bi-EDF, 49cm
10%
WSC
Isolator

115
Brillouin laser Stokes via a SBS process with assistance from the Erbium gain. Figure4.15
compares the output of the proposed BEFL at various configurations. In the experiment, the
BP wavelength is launched at the optimum wavelengths of 1562.5, 1563.0 and 1564.5nm
for the forward ring, backward ring and linear configuration, respectively to make use of
the linear gain of the Bi-EDF. Forward and backward ring represent the BEFLs with
forward and backward 1480 nm pumped Bi-EDF respectively. The BP and 1480nm pump
power are fixed at 6 dBm and 144mW, respectively. The optimum wavelengths were close
to the peak of Bi-EDF free-running laser and are also dependent on the cavity loss. For the
linear configuration, the optimum wavelength is the longest because the effective cavity
loss is the lowest.
Figure 4. 15: Output spectrum of the BEFL at various configurations when the BP and 1480 nm pump power are fixed at 6dBm and 144mW, respectively.
Brillouin peak
29
dB
236dB
Residual BP
Brillouin peak

116
The SMSR of the BEFL are obtained at around 29, 23 and 6dB for the forward ring,
backward ring and linear configurations, respectively as shown in Figure 4.15. The forward
ring shows the highest SMSR compared to both backward ring and linear cavity. The ring
cavity shows a reasonably higher SMSR compared to the linear one. The bidirectional
operation in the linear cavity encourages the mode competition and reduces SMSR.
Compared to the previous ring cavity of Figure 4.9, the proposed forward ring BEFL
provides a higher SMSR by 15dB due to the incorporation of the isolator and the PC. The
isolator functions to ensure the unidirectional operation of the ring BEFL which in turn
reduces the noise. The PC function to filter out the unnecessary modes in the cavity so as to
improve the SMSR. Figure 4.16 shows the Stokes peak power characteristic against the BP
power at various configurations. The threshold of the BEFL is easily identified by the
sudden increase in the peak Stokes signal against the BP. After the threshold power is
reached, the Stokes power is maintained since most of the BP is transferred to the Stokes
wave. As shown in Figure 4.16, the SBS threshold power of the BEFL is -2 dBm, 0 dBm
and 4 dBm for forward and backward ring and linear configuration, respectively.

117
Figure 4. 16: SBS peak powers against input BP peak power for forward, backward and linear cavity configurations with pump wavelength 1480 nm at fixed output power of 144
mW.
Figure 4.17 shows the Stokes power against the 1480-nm pump power for all BEFLs
configured with ring and linear configurations. As shown in the figure, the1480-nm pump
power threshold is obtained at approximately within 90 to 100 mW for all configurations.
Below this threshold pump power, the amplifier gain is very low and cannot sufficiently
compensate for the loss inside the laser cavity, and thus, no Stokes is observed. After the
threshold power, the Stokes power is observed to be increasing abruptly with the 1480-nm
pump power to reach the saturation region. The ring configuration has a slightly lower
threshold due to unidirectional operation of the laser obtained by incorporating an optical
isolator as well as the optimization of the output coupler by allowing more power to
oscillate in the laser cavity.
-14
-12
-10
-8
-6
-4
-2
0
2
4
-12 -10 -8 -6 -4 -2 0 2 4 6 8 10
Stok
es p
ower
(dBm
)
BP power (dBm)
Forward ring
Backward ring
linear

118
Figure 4. 17: Brillouin Stokes powers against the 1480nm pump power at the fixed BP power of 6 dBm.
Figure 4. 18: Output spectra of the BEFL at various BP wavelengths when the BP and 1480nm pump power are at the fixed 6 dBm and 144 mW respectively. (Solid and dash
lines denote the backward and forward ring configurations respectively).
Tuning range of the BEFL is also investigated for various configurations as shown
in figure 4.18. This graph shows the output spectra of the ring BEFL at various BP
-60
-50
-40
-30
-20
-10
0
10
50 70 90 110 130 150
Stok
es p
ower
(dBm
)
1480 nm pump power (mW)
Forward ring
Backward ring
Linear
-55
-45
-35
-25
-15
-5
5
1561 1562 1563 1564 1565 1566 1567
Out
put p
ower
(dBm
)
Wavelength(nm)
1562 1562.4
1563
1563.5 1564
1565
1565.6
1566
1562.5 Backward ring
Forward ring

119
wavelengths for both forward and backward pumping schemes. The tuning range is very
limited in the linear configuration, which is probably due to the high loss at the broadband
FBG and loop mirror components. Therefore the tuning range of the linear BEFL is not
included in Figure 4.18. In this experiment, the BP and 1480nm pump power is fixed at 6
dBm and 144 mW, respectively. As can be seen in this figure, the tuning ranges are
obtained within 1562.5nm to 1565.6 for the forward ring configuration and within 1562 to
1564 nm for the backward ring configuration. This is attributed to the injected BP power
into the Bi-EDF, which is slightly lower in the backward ring configuration. The insertion
loss of the WSC reduces the initial BP power and thus limits the tuning range.
4.7 Dual-wavelength BFL
Dual-wavelength fibre lasers have been of interest for recent years because of their
potential applications in optical communications, fibre optical sensors and microwave
photonics systems. In order to achieve narrow linewidth and single longitudinal mode
output, various techniques have been proposed and demonstrated, includes introducing an
ultra-narrow dual-transmission-peak band-pass filter in the laser cavity (Dai et al., 2006 and
Li et al., 2008), cascading distributed feedback fibre lasers (Kim et al., 2008) and utilizing
the superimposed chirp FBGs (SCFBGs) in the photosensitive erbium–ytterbium co-doped
fibre laser (Sun, et al., 2007). Another way to achieve the dual-wavelength lasing is using a
passive triple-ring cavity and a hybrid gain medium. But the parameters of the laser need to
be properly adjusted to guarantee the dual wavelength operation (Pan, et al., 2008). A
multi-wavelength lasing can also be achieved using a SBS process in single-mode fibre
(SMF) (Shahi, et al., 2009 and Harun, et al., 2005).

120
SBS has potential applications in sensors (Han, et al., 2005) and in the realization of
very narrow linewidth BFLs to achieve dual- or multi-wavelength lasing, whereby the
Stokes linewidthbecomes significantly narrower than the pump linewidth with reductions
of up to a few hertz (Harun, et al., 2005).Moreover, a BFL can be designed to operate at
any wavelength, provided that the required pump laser is available, thus showing a high
potential for applications in metrology and spectroscopy. In section 4.4, PCF-based BFLs
have been demonstrated for single-wavelength operation. In this section, the PCF-based
BFL is experimentally investigated for dual-wavelength operation. The proposed laser uses
a piece of 100 m PCF as a Brillouin gain medium and a broadband FBG operating in C-
band region as a reflector in dual-pass architecture. This type of laser does not require a
linear gain medium such as EDF to increase the effect. Therefore it can operate at any
wavelength depending on the BP wavelength.
The experimental setup of the proposed dual-wavelength laser is depicted in Figure
4.19, in which a high-reflectivity broad band FBG is placed at the cavity end. The FBG has
a 40nm bandwidth centered at 1545nm with a reflectivity of more than 99%.An external
cavity of TLS is amplified by an EDFA to provide sufficient power for this study and acts
as BP. The BP is launched into the PCF through an optical circulator to generate the
Brillouin Stokes in the backward direction at wavelength downshifted by 0.08nm from the
BP wavelength. The broad band FBG allows dual-pass of BP inside the gain medium to
further enhance the Stokes power, which oscillates in the linear cavity to form BFL. The
linear cavity is formed between the splice joint at port 2 of the circulator and the FBG due
to spurious reflection as well as scattering effects. The residual BP and the Stokes lines
oscillate in the linear cavity to increase the nonlinear gain in the resonator which in turn
improves the dual-wavelength lasing process. The performance of dual-wavelength BFL is
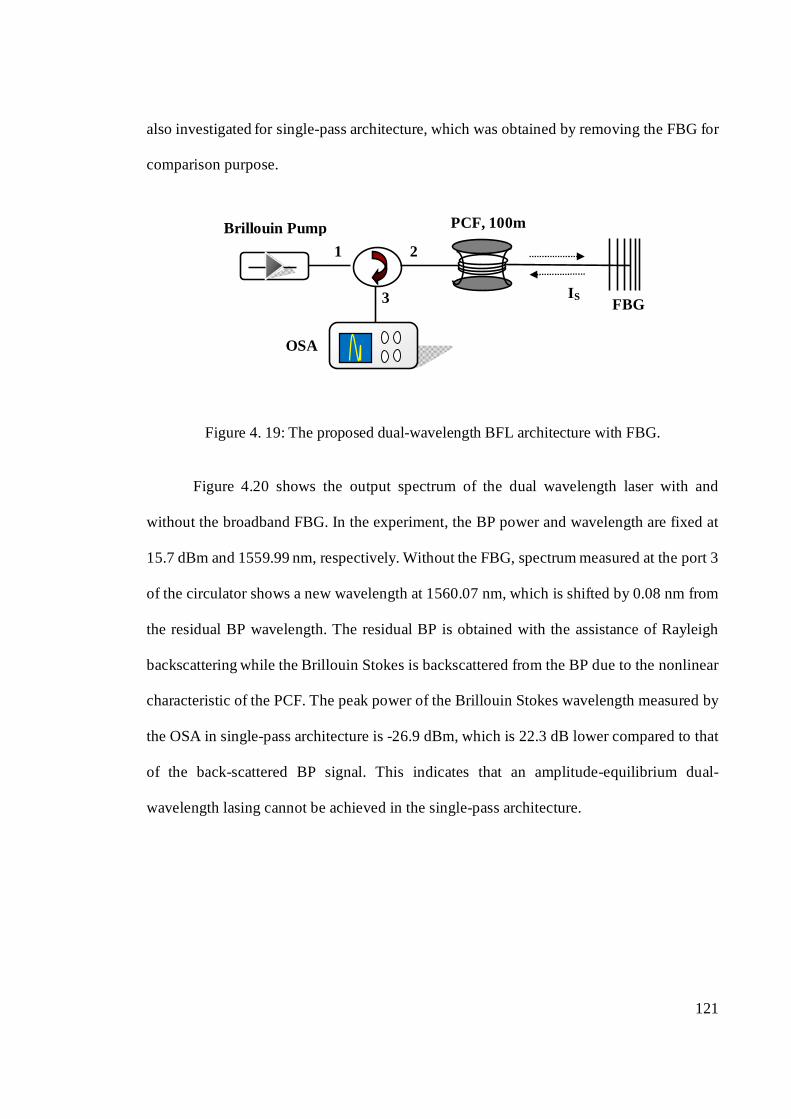
121
also investigated for single-pass architecture, which was obtained by removing the FBG for
comparison purpose.
Figure 4. 19: The proposed dual-wavelength BFL architecture with FBG.
Figure 4.20 shows the output spectrum of the dual wavelength laser with and
without the broadband FBG. In the experiment, the BP power and wavelength are fixed at
15.7 dBm and 1559.99 nm, respectively. Without the FBG, spectrum measured at the port 3
of the circulator shows a new wavelength at 1560.07 nm, which is shifted by 0.08 nm from
the residual BP wavelength. The residual BP is obtained with the assistance of Rayleigh
backscattering while the Brillouin Stokes is backscattered from the BP due to the nonlinear
characteristic of the PCF. The peak power of the Brillouin Stokes wavelength measured by
the OSA in single-pass architecture is -26.9 dBm, which is 22.3 dB lower compared to that
of the back-scattered BP signal. This indicates that an amplitude-equilibrium dual-
wavelength lasing cannot be achieved in the single-pass architecture.
OSA
FBG
1 2
3
Brillouin Pump PCF, 100m
IS

122
Figure 4. 20: Output spectra of the BFL in single-pass and dual-pass configurations.
In dual-pass architecture, the forward Brillouin Stokes and residual BP are reflected
back by the FBG and oscillates in the linear configuration (due to spurious reflection or
scattering at the input part of the system) to generate dual-wavelength output. Figure 4.20
shows two simultaneous lasing lines at 1559.09 nm and 1560.06 nm with a wavelength
separation of 0.08 nm at a BP power of 15.7 dBm when the FBG is incorporated at the end
of linear system. The optical signal to noise ratio of each line is over 21 dB. By applying
the FBG, the amount of oscillating BP power in the PCF is increased and therefore more
power is converted to the Stokes. The Stokes power is also improved due to the increased
Brillouin gain in the dual-pass system. As shown in the spectrum of Figure 4. 20, the output
peak powers at the two wavelengths of residual BP and Brillouin Stokes are 8.9 dBm and
9.8 dBm, respectively.
-45
-35
-25
-15
-5
5
15
1559.7 1559.9 1560.1 1560.3
Ouu
put p
ower
(dBm
)
Wavelength (nm)
Dual-passconfiguration
Single-passconfiguration
Rayleigh
of Stokes
Residual BP First Stokes
21

123
The impact of BP power on the peak power of Brillouin Stokes and the transmitted
residual BP generated by the single-pass and dual-pass BFL is shown in Figure 4.21. The
BP wavelength is set at around 1559.99 nm, while the BP power is varied from 12.2 dBm
to 15.7 dBm. Below BP power of 12.2 dBm, the experiment is not continued as the SBS
gain cannot sufficiently compensate for the loss inside the laser cavity and thus cannot
support dual-wavelength generation. The peak power of generated Stokes is observed to
increase as the BP increases and this can be attributed to the increase of the nonlinear
Brillouin gain as the BP power arises. As shown in Figure4.21, Brillouin Stokes line of
single-pass configuration cannot meet the threshold requirement. However, due to the
stronger oscillation of the BP signal through nonlinear gain media, Brillouin Stokes of the
dual-pass architecture can satisfy threshold power of about 14.5 dBm and reach to the
saturation condition. Figure 4.22 also depicts the 14 times repeated scanning spectra of the
two-wavelength lasing oscillations with a time interval of 10 minutes, which indicates the
stability of the laser. The maximum peak wavelength shifts at the two wavelength were
both less than 0.002 nm measured by the OSA. The maximum power fluctuations at the
peak wavelength of 1559.99 nm and 1560.07 nm were below 0.5 dB, which indicate an
excellent stability in the dual-wavelength oscillation. The small power fluctuation is mainly
due to the fluctuation of the input BP signal and a small quantity of Rayleigh components
in the two lines which are unstable. Perhaps more stable dual-wavelength lasing output can
be achieved if we try to improve the stability of the input BP and restrain or reduce the
Rayleigh scattering.

124
Figure 4. 21: Residual BP and Stokes wave powers plotted against BP power.
Figure 4. 22: the spectral evolutions of the proposed BFL against time, which is repeatedly scanned every 10 minutes.
By tuning the BP wavelength, the wavelength of the Brillouin-stokes line is also changed
correspondingly. As such, tunable dual-wavelength lasing output with a certain wavelength
spacing of 0.08 nm can be achieved by adjusting the input BP wavelength. Figure 4.23
shows the tunable dual-wavelength lasing spectra at the same BP power (~15.7dBm). As
one can see from this figure, amplitude-equilibrium dual-wavelength lasing outputs could
be obtained in a tunable wavelength range of at least 35 nm from 1530 nm to 1565 nm,
-45
-35
-25
-15
-5
5
15
11 12 13 14 15 16 17 18 19
Peak
pow
er (d
Bm)
BP Peak power (dBm)
Transmitted BP (D)
First Stokes (D)
Transmitted BP (S)
First Stokes (S)
Wavelength (nm)
Time duration
Out
put p
ower
(dB
m)

125
with a difference between the two peaks being less than 4 dB. The tuning range is limited
by the viability of broadband FBG and BP power. This is one of the remarkable advantages
of Brillouin laser which can provide multi wavelength lasing in a broadband region of
tuning wavelength as long as the BP with the fixed power in any wavelength is launched to
the setup and the FBG’s reflection region is used.
Figure 4. 23: Residual BP and Stokes wave powers plotted against the input signal BP power.
4.8 Four-wave mixing based Multi-wavelength Erbium fibre laser
Various approaches have been proposed by researchers for multi-wavelength laser
generation. One of the approaches is based on Erbium-doped fibre laser (EDFL) that has
attracted tremendous interest because of its many important applications in fibre optic test
and measurement (Lee et al., 2005 (b)), fibre communications (Teodoro et al., 2005) and
fibre sensing (Chremmos et al., 2005) systems. These lasers exhibit wide tunable range,
Out
put p
ower
(dBm
)
Wavelength

126
narrow line width and could be tuned at high speed allowing fast component
characterization. Multi-wavelength lasers are also achievable by utilizing the hybrid
integration of two gain media, the nonlinear gain in optical fibres and the linear gain from
Erbium doped fibre as reported in many literatures and also earlier discussed in this chapter
(Yamashida et al., 1992). Recently, Bismuth-based erbium-doped fibres (Bi-EDFs) have
been extensively explored for use in compact amplifiers with short gain medium lengths. A
fibre with a high Erbium dopant concentration is expected to have enormous potentials in
realizing compact EDFAs and EDFA-based devices as mentioned in chapter 3. In this
section, a four-wave mixing (FWM) based multi-wavelength laser is proposed using a Bi-
EDF as both linear and nonlinear gain media in conjunction with a broadband FBG.
FBGs are ideal wavelength-selective components for fibre lasers. Various types
and arrangements of FBG have been used to achieve multi-wavelength fibre laser operation
such as cascaded FBG cavities (Cowle et al., 1996) and Hi-Bi fibre based FBG (Zhang et
al., 2005 and Sugimoto et al., 2004). For instance, FBGs written in multimode or few-mode
optical fibres have multiple resonance peaks in the transmission and reflection spectra and
therefore they are normally used in multi-wavelength laser set-up. In this work, a
broadband FBG operating in C-band is inserted in the laser cavity to remove the other
wavelengths and improve the multi-wavelength output characteristic of the laser. This
technique suppresses other potential modes to circulate in the laser cavity, thus the self-
lasing modes are eliminated and hence rectifies the multi-wavelength line numbers
limitations faced by the previously reported multi-wavelength EDFL architectures (Harun
et. al., 2009). Also, the proposed structure that consists of only 3 optical components in the
resonator is simple, cost effective and devoid of the complexity normally associated with
the enhancement of feedback mechanism found in the previous report.

127
Figure 4.24 shows two different cavity designs of the FWM-based multi-
wavelength EDFL system. Figures 4.24 (a) and (b) depict the ring- and linear-cavity EDFL,
respectively. The gain block used in both configurations is made up of 49 cm long Bi-EDF,
which is pumped by a 1480 nm laser diode via WDM coupler. A 1480 nm pump laser has
the maximum power of 160mW. The Bi-EDF used has an erbium concentration of 3250
wt.ppm with a cut-off wavelength of 1440 nm and a pump absorption rate of 130dB/m at
1480 nm. The ring resonator of Figure 4.24 (a) consists of the gain block, a circulator, a
broadband FBG, a PC, an output coupler and an isolator. An isolator is used to ensure a
unidirectional operation of the laser. The linear resonator of Figure 4.24 (b) incorporates a
loop mirror and a broad band FBG as the reflectors using the same gain block as the
previous setup. The FBG used in both setup allows only a certain laser modes to oscillate
by suppressing other modes so that the stability and the number of output channels can be
increased. A 10 dB coupler is used to tap the output while allowing 90% of the light to
oscillate in the cavity. In both configurations, a PC has been used to control the polarization
and the birefringence inside the cavity, which in turn control the number of lines generated,
channel spacing and the peak power.

128
Figure 4. 24: (a) ring (b) linear-cavity design of MWEDFL to enhance FWM.
Figure 4.25 compares the output spectrum of the proposed EDFL for different cavity
scheme with the same pump power fixed at 160mW. The operating wavelength of the
EDFL is determined by the Bi-EDF gain spectrum which covers the C-band window from
1530 to 1560 nm as well as the cavity loss. The multi-wavelength comb is generated in the
region where the difference between Bi-EDF’s gain and cavity loss is the largest. The
forward pumped Bi-EDF generates ASE at the FBG region which oscillates in the ring
cavity to generate at least two oscillating lines with a constant spacing due to the
longitudinal modes interference. The multi-wavelength laser generation with a constant
spacing is assisted by the four-wave mixing process, which annihilates photons from these
(a)
Gain block
OSA
FBG
Coupler
90%
10% PC
Bi_EDF, 49cm LD, 1480nm
Gain block
(b)
OC Coupler
PC
OSA
FBG
90%
10%
Bi_EDF, 49cm LD, 1480nm

129
waves to create new photons at different frequencies. Compared to the loop mirrors that
reflect all wavelengths back into the linear-cavity, the FBG filter only selectively reflects
about 40 nm of wavelengths (1520–1560±2 nm) back into the cavity of the laser system.
The wavelengths in the region where self-lasing occurs (>1560 nm) were not reflected by
the FBG i.e. they are removed from the cavity. On the other hand, incorporating the FBG
filter in place of the loop mirror in the ring-cavity design would make the self-lasing to be
more efficient by removing the other wavelengths from the oscillation. As shown in Figure
4.25, the ring configuration provides a higher number of lines compared to that of the linear
one. This is attributed to the unidirectional operation of the ring EDFL, which increases the
population inversion in the Bi-EDF and thus support more oscillating lines.
Figure 4. 25: Multi-wavelength FWM spectrum for Ring-cavity and linear-cavity MWEFL.
Figure 4.26 compares the output spectrum of the EDFL with and without the FBG
for the ring configuration. In the configuration without FBG, both circulator and FBG are
removed from the setup. As shown in the figure, the multi-wavelength operation is
improved with the FBG. This is attributed to the FBG which suppresses other modes to
-55
-45
-35
-25
-15
-5
5
1560 1561 1562 1563 1564 1565 1566
Out
put p
ower
(dB
m)
Wavelength(nm)
Ring-cavity Linear-cavity

130
provide a lower noise in the laser cavity and thus enhances a FWM interaction. The
strongest line has a peak power of approximately 1.26 dBm as shown in Figure 4.26.
Figure 4. 26: Multi-wavelength FWM spectra with and without FBG by same pump power at 1480 nm.
The number of lines is limited by the availability of the 1480nm pump power, fibre
nonlinearity, polarization filtering effect in the ring cavity laser and the length of the ring
cavity laser. As shown in Figure 4.27, by optimizing the state of polarization in the ring
cavity by a PC, a better comb spectrum can be obtained. This shows that the PC is capable
of controlling the number of line generated, channel spacing and the peak power. The
numbers of generated multi-wavelength increases up to 7 lines with nearly 0.3 nm fixed
spacing in optimized condition.
-55
-45
-35
-25
-15
-5
5
1560 1561 1562 1563 1564 1565 1566 1567
Out
put p
ower
(dB
m)
Wavelength(nm)
Without FBG
With FBG

131
Figure 4. 27: Multi-wavelength FWM spectra with and without PC by 147mW pump power fixed at 1480 nm.
In the next chapter, advanced configurations of the multi-wavelength laser will be
presented. The proposed lasers use nonlinear effects such as SBS and FWM for assisting
multi-wavelength generation as well as high nonlinear fibres such as PCF and Bi-EDF to
reduce the interaction length and produce a compact design for the lasers.
-60
-50
-40
-30
-20
-10
0
1559 1560 1561 1562 1563 1564 1565
Out
put p
ower
(dBm
)
Wavelength (nm)
not optimized
Optimized
132
CHAPTER FIVE: ADVANCED CONFIGURATIONS FOR
MULTIWAVELENGH NONLINEAR LASERS
5.1 Introduction
To date, Stimulated Brillouin Scattering (SBS) based multi-wavelength lasers have
been investigated extensively (Shirazi, et al., 2008 and Gross, et al., 2010) due to their
many advantages such as low threshold and narrow line-width. The multi-wavelength lasers
have many potential applications such as in microwave photonics (Banchi, et al., 2010),
fibre sensors (Han, et al., 2005) and high capacity wavelength division multiplexing
(WDM) communication networks (Song, et al., 2004) Normally, a hybrid
Brillouin/Erbium ( Harun et. al., 2009a; Shahi, et al., 2009; Zhan. et al., 2006) or
Brillouin/Raman fibre lasers (Liu, et al., 2008a; Liu, et al., 2008b ) are used to achieve a
multiple Stokes lines with a constant spacing and a high number of Stokes lines as reported
in many literatures. For instance, the generation of 160 Brillouin Stokes has been
experimentally demonstrated using a linear cavity self-seeded Brillouin/Erbium fibre laser
(BEFL) (Zhan. et al., 2006). Stable Brillouin/Raman fibre laser has also been demonstrated
with 30 lasing lines by Liu et al., (2008a). Another versatile alternative to generate multi
wavelength laser is Four-Wave Mixing (FWM) effect which is able to create channels with
a larger spacing than SBS effect. However, Four-wave mixing seems to be the most
harmful in the case of dense wavelength division multiplexing (DWDM) systems (Eiselt,
1999) that use low dispersion fibre or equal channel spacing. Nevertheless, it can be useful
in some applications such as multi wave length generation, wavelength conversion and
switching.
133
In this chapter, various multi wavelength fibre lasers are proposed using nonlinear
effect in conjunction with a piece of highly nonlinear fibre. SBS based multi-wavelength
lasers are demonstrated using a Photonic Crystal Fibre (PCF) and a hybrid of PCF and
Bismuth-based Erbium-doped Fibre (Bi-EDF). FWM-based multi-wavelength lasers are
also proposed and demonstrated using a Bi-EDF as well as a hybrid of PCF and Bi-EDF. In
the next section, a new configuration of multi-wavelength BFL is proposed using a dual-
pass approach. This approach is used to reduce the cavity loss so that it can provide an
efficient output. The proposed BFL can operate at any wavelength depending on the
Brillouin pump (BP) wavelength.
5.2 Multi-wavelength Brillouin Fibre Laser with Dual-Pass Configuration
The proposed multi-wavelength BFL architecture is depicted in Figure 5.1, which
consists of a short piece of PCF, a 3dB coupler and a high-reflectivity broad band FBG at
the cavity end. The new configuration has two main sectors; a ring cavity as a Brillouin
gain block which includes a piece of PCF and a 3 dB coupler, and a broad band FBG
operating in C band region at the end of this linear structure to allow dual-pass Stokes lines
oscillation in the ring resonator. This can improve the output powers of the cascading
Stokes lines which in turn increases the number of Stokes obtained. The BP is an external
cavity tunable laser source (TLS) with a line-width of approximately 20MHz, which is
amplified by an Erbium-doped fibre amplifier (EDFA) to provide sufficient power for this
study. The BP is launched into the PCF through a 3 dB coupler via optical circulator to
generate the first order Brillouin Stokes in the clockwise direction at wavelength
downshifted by 0.08nm from the BP wavelength. The Brillouin Stokes oscillates inside the
ring resonator to generate Brillouin laser. When the laser power exceeds the threshold

134
condition, it will then create the second order Stokes signal in the opposite direction. In the
same way, the second order Stokes signal will create the third order Stokes signal. The
process will continue until the next higher order Stokes signals power is too small to exceed
the threshold condition and hence creation of subsequent Stokes order signal will diminish.
The residual BP and even order Stokes lines propagating in the clockwise direction are
reflected by the broadband FBG to double propagate inside the ring resonator in the
opposite direction. This will increase the nonlinear gain in the resonator which in turn
improves the multi-wavelength lasing process.
Figure 5. 1: The proposed multi-wavelength BFL architecture.
Figure 5.2 compares the output spectrum of the BFL in different configurations at
the maximum BP power of 15.7 dBm. First of all, the output of the BFL in the presence of
the ring cavity but without FBG was studied. With this configuration, only the first
Brillouin Stokes is achieved at 1560 nm wavelength with side mode suppression ratio
(SMSR) of 26 dB. However, by incorporating the broad band FBG as in the proposed
configuration of Figure 5.1, seven Stokes waves and four anti-Stokes waves with nearly 13
OSA
FBG
1
3dB, Coupler
Ring Cavity Brillouin Pump Circulator
PCF
IS

135
dB signal to noise ratio (SNR) are obtained by 100 m PCF around the oscillated BP at
1559.98 nm, whereas we have only the first Stokes wave in the same configuration by
incorporating 50 m PCF. This is attributed to that the 50 m long PCF is not sufficient to
create multi-wavelength in this configuration. By incorporating the 100 m long PCF, four
anti-Stokes waves also arises due to four-wave mixing (FWM) between co-propagating BP
and BFL photons during the oscillation. The bi-directional operation of the laser also
contributes to the anti-Stokes generation. The output spectrum of the BFL is also
investigated in the absence of ring cavity where the ring cavity is replaced by the PCF. In
this BFL, only the first Stokes is observed with 2.5 dB SMSR. These results show that the
presence of ring cavity and FBG is very important for multi-wavelength generation. The
presence of FBG at the end side allows the BP and SBS light beams to propagate twice into
the ring cavity section and thus the cavity is able to make more Stokes lines.
Figure 5. 2: Output spectra of the BFL with different configurations and PCF’s lengths.
-55
-45
-35
-25
-15
-5
5
15
1559.5 1559.7 1559.9 1560.1 1560.3 1560.5 1560.7
Out
put P
ower
(dBm
)
Wavelength (nm)
With FBG & ring cavity,100m PCFWith ring cavity &Without FBG, 100m PCFWith FBG & Withoutring cavity, 100m PCFWith FBG & ring cavity,50m PCF
Anti-Stokes
Backscattered
Residual Pump

136
The impact of the BP power on the number of Stokes generated by the BFL is
shown in Figure 5.3. The BP wavelength is set at around 1560 nm, while the BP power is
varied from 6.1 dBm to 15.7dBm. Below BP power of 6dBm, the experiment is not
continued as the SBS gain cannot sufficiently compensate for the loss inside the laser cavity
and thus cannot support multi-wavelength generation. The number of generated Stokes is
observed to increase as the BP increases and this can be attributed to the increase of the
nonlinear Brillouin gain as the BP power rises. This situation provides sufficient signal
power for higher order Stokes signals to pump the PCF and maintain the cascading process
of the Stokes into multiple Stokes. However, the power of each subsequent Stokes line is
typically lower than that of the previous Stokes line as each subsequent Stokes is generated
with the energy of the previous Stokes, thus slightly reducing the Stokes line’s power. As
shown in Figure 5.4, the output of the BFL is stable at room temperature with only minor
fluctuations observed coinciding with large temperature variances.

137
Figure 5. 3: The output spectrum of the proposed BFL at various input BP power.
Figure 5. 4: the spectral evolutions of the proposed BFL against time, which is repeatedly scanned every 10 minutes.
Figure 5.5 demonstrates the output Brillouin Stokes power and the transmitted
residual BP power against the input signal BP power. As shown in the figure, all the Stokes
powers increase as the BP power increases. However, the Stokes lines begin to saturate as
-55
-45
-35
-25
-15
-5
5
15
1559.6 1559.8 1560 1560.2 1560.4 1560.6
Out
put P
ower
(dBm
)
Wavelength (nm)
15.7 dBm 15.3 dBm 13.2 dBm 9.9 dBm 6.1 dBm
Wavelength (nm)
Time duration
Out
put p
ower
(dB
m)

138
the BP power increases above the threshold power of the subsequent Stokes. For instance,
the second Stokes line saturates as the threshold for the third Stokes is reached. This is due
to the power transfer from the second Stokes to the third Stokes, which occurs when the BP
power is approximately at 14.7 dBm. For the higher order Stokes, however, the threshold
BP powers are obtained at almost the same level of 15.3 dBm. This is probably due to the
FWM between the oscillating BP and Stokes signals which improves the conversion
efficiency by providing amplification for the higher order Stokes generation.
Figure 5. 5: Residual BP and Stokes wave powers plotted against BP power.
5.3 Double spacing multi-wavelength BFL
In this section, a double spacing multi-wavelength BFL is demonstrated using a
short piece of PCF as a nonlinear Brillouin gain medium in conjunction with a figure-of-
eight configuration. The proposed BFL can achieve stable multi-wavelength simultaneous
lasing with 20 GHz or 0.16 nm line spacing, less threshold power and also capable to
-55
-45
-35
-25
-15
-5
5
15
0 3 6 9 12 15 18
Peak
Pow
er (d
Bm)
Brillouin Pump Power (dBm)
Reflected Pump1st Stokes2nd Stokes3rd Stokes4th Stokes5th Stokes6th Stokes

139
mitigate the limitation of tuning range. Compared to the previous BFLs and hybrid
Brillouin lasers, the line spacing of the proposed BFL is twice as wide due to the removal
of odd-order Stokes waves with the proposed figure-of-eight configuration and therefore it
has more potential to be implemented in future WDM systems.
The configuration of the proposed figure-of-eight PCF-based multi wavelength BFL
is shown in Figure 5.6. The BFL resonator consists of an optical circulator, two couplers,
and a 100 m long PCF as the Brillouin gain medium. The PCF is used to significantly
reduce the length of Brillouin gain medium. The BP is sent into a piece of PCF from port 1
through port 2 of the optical circulator and 3 dB coupler (C1) to generate backward-
propagating SBS. The backward-propagating SBS oscillates inside the first loop and the
secondary loop in the clockwise (CW) and counter clockwise (CCW) directions
respectively, to generate another Brillouin Stokes in the opposite direction (counter
clockwise inside the first loop). The first Stokes signal is re-injected into the other end of
the PCF in a clockwise direction to act as a BP to generate the next Stokes. The cascading
process continues to generate multi-wavelength lasing. In the secondary loop, the odd-order
Stokes lines are blocked by the circulator and the even-order Stokes lines are allowed to
oscillate and build-up their intensity. The oscillating light inside the secondary loop is
extracted from the laser system by using 90/10 coupler where 10% power is used for
monitoring and measurement purpose while the 90% power is circulated back into the laser
cavity. The output spectrum is characterized by OSA with a resolution of 0.015 nm. The
experiment is carried out for two different lengths of PCF; 50 m and 100 m. The
experiments are also repeated with the conventional single ring cavity system, which is
obtained by disconnecting the secondary loop and monitoring the output at port 3 of the
optical circulator for comparison purpose.

140
Figure 5. 6: Configuration of the figure-of-eight PCF-based BFL.
Figure 5.7 shows the output spectra of the BFL with a single-ring cavity and a
figure-of-eight configuration at two different lengths of PCFs; 50 m and 100 m. In the
experiment, the BP power is fixed at 15.3 dBm. In the conventional set-up of single ring
cavity, only the first Stokes travelling in the clockwise direction is obtained from the OSA
as shown in Figure 5.7.Due to this fact, the single-ring cavity cannot provide sufficient
nonlinear gain to assist in cascading process for multiple Stokes generation. It is found that
the signals to noise ratios of 23.4 and 24.1 dB are achieved by the BFL with 50 m and 100
m PCF, respectively. In case of the figure-of-eight configuration as shown in Figure 5.7, the
BP generates the first Stokes, which has a higher peak power compared to the conventional
configuration at a wavelength shifted by 0.08nm from the BP. The backward propagating
Stokes generates the second Stokes which propagates in the opposite direction (counter
clockwise direction in this setup). If the threshold condition is satisfied, this will generate a
Odd-order
First loop
Second loop C2
IBP
1
BP
3 2
C1
10%
PCF

141
cascading Brillouin effect as a comb of lines. As shown in Figure 5.6, the oscillated signals
in clockwise direction (odd order of Stokes lines) in the first cavity can be routed from C1
to port 3 of the circulator to oscillate in the second loop in the counter clockwise direction.
The circulator functions to ensure unidirectional oscillation in the second loop. The output
of the proposed BFL is observed from the 10% port of the output coupler and the remaining
power is re-injected into the first cavity and act as a BP for the next even-order Stokes
lines. As shown in Figure 5.7, the spacing between two consecutive odd-order Stokes lines
is observed to be approximately 0.16 nm (~ 20 MHz in 1560 nm region). The anti-Stokes
lines are also observed at wavelengths shorter than the BP, which occurs when various
Stokes waves interact with the pump wave through the FWM process. At the BP of
15.3dBm and PCF length of 100 m, 7 lines are observed with the line spacing of 0.16 nm.
Only 3 lines are observed with a shorter PCF length of 50 m.

142
Figure 5. 7: Output spectra of the BFL with single ring cavity and figure-of-eight configurations at PCF lengths of 50 m and 100 m. The BP power is fixed at 15.3 dBm.
Figure 5.8 shows the measured peak power for the Stokes at different BP powers for
two different lengths of 50 m and 100 m PCF in the proposed figure-of-eight MWBFL
configuration. The threshold power is defined as the BP power where the resonator starts to
generate laser via SBS and below this threshold power, only spontaneous scattering
emission is oscillating in the resonator. As shown in the figure, the peak power increases
with the BP power. With PCF length of 100 m, the threshold powers for the 2nd, and 4th
order Stokes lines are obtained at about 6.5 dBm and 13.6 dBm respectively. The 2nd
Stokes of the conventional ring laser has a threshold power of larger than the maximum BP
power of 15.3 dBm and therefore only the 1st Stokes is observed in Figure 5.7. However,
with the addition of the secondary cavity in the proposed figure-of-eight cavity we
managed to reduce the threshold pump power and thus generate additional Stokes lines
without the need to add any linear or nonlinear gain media in the configuration. It was also
-60
-50
-40
-30
-20
-10
0
10
1549.5 1549.7 1549.9 1550.1 1550.3 1550.5 1550.7
Out
put p
ower
(dBm
)
Wavelength (nm)
Figure-of-eightcavity, (100m)Figure-of-eightcavity, (50m)Single-ring cavity,(100m)Single-ringcavity,(50m )
Transmitted BP
First
Second Stokes
Fourth Stokes
Anti Stokes

143
found that the Stokes power begin to saturate as the BP power increases above a certain
level. For instance, with 100 m long PCF, the second Stokes line saturates as the threshold
for the fourth Stokes is reached. This is due to the power transfer from the second Stokes to
the fourth Stokes, which occurs when the BP power is approximately at 12.1dBm. The
threshold power is also observed to be lower when a longer PCF is used.
Figure 5.8: Brillouin Stokes power as a function of BP power for the proposed figure-of-eight BFL.
Figure 5.9 illustrates the output spectra of the proposed BFL as the BP wavelength
is varied from 1520 nm to 1600 nm. It is found that the output spectrum is maintained over
the 80 nm of tuning range. This is attributed to the multiple wavelength operation of the
proposed BFL which is solely dependent on the SBS in the PCF but not much dependent on
the operating wavelength. As shown in the Figure 5.9, at least 3 even-order Brillouin
Stokes lines are obtained at BP power of 12 dBm. This result shows that the proposed BFL
has a remarkable advantage that it can provide multi-wavelength operation in a broad band
-55
-45
-35
-25
-15
-5
5
-2 0 2 4 6 8 10 12 14 16
Peak
Pow
er (d
Bm)
Brillouin Pump Power (dBm)
Reflected Pump, 100m
2nd Stokes, 100m
4th Stokes, 100m
6th Stokes, 100m
Reflected Pump, 50m
2nd Stokes, 50m

144
tuning range as long as the BP with the fixed power can be launched into the setup. The
stability of the multi-wavelength operation is also investigated since it plays a vital role for
practical applications.
Figure 5. 9: Output Spectra of the tunable MWFBL with 3 Brillouin Stokes lines with 0.16 nm line spacing and over 80 nm tuning range.
Figure 5.10 depicts the spectral evolutions of the proposed multi-wavelength BFL
against time. In the experiment, the output spectral is repeatedly scanned for every 20 min.
The multi-wavelength BFL lases stably with power fluctuations of less than 0.5 dB for
more than 3 hours.Temperature variations and mechanical vibrations were small as the
experiment was conducted in a laboratory; thus the drift of the spectral profile was
minimal. These results show that the proposed configuration has potentials for applications
inthe future WDM optical communication networks.
Wavelength (nm)
Pow
er (d
Bm
)
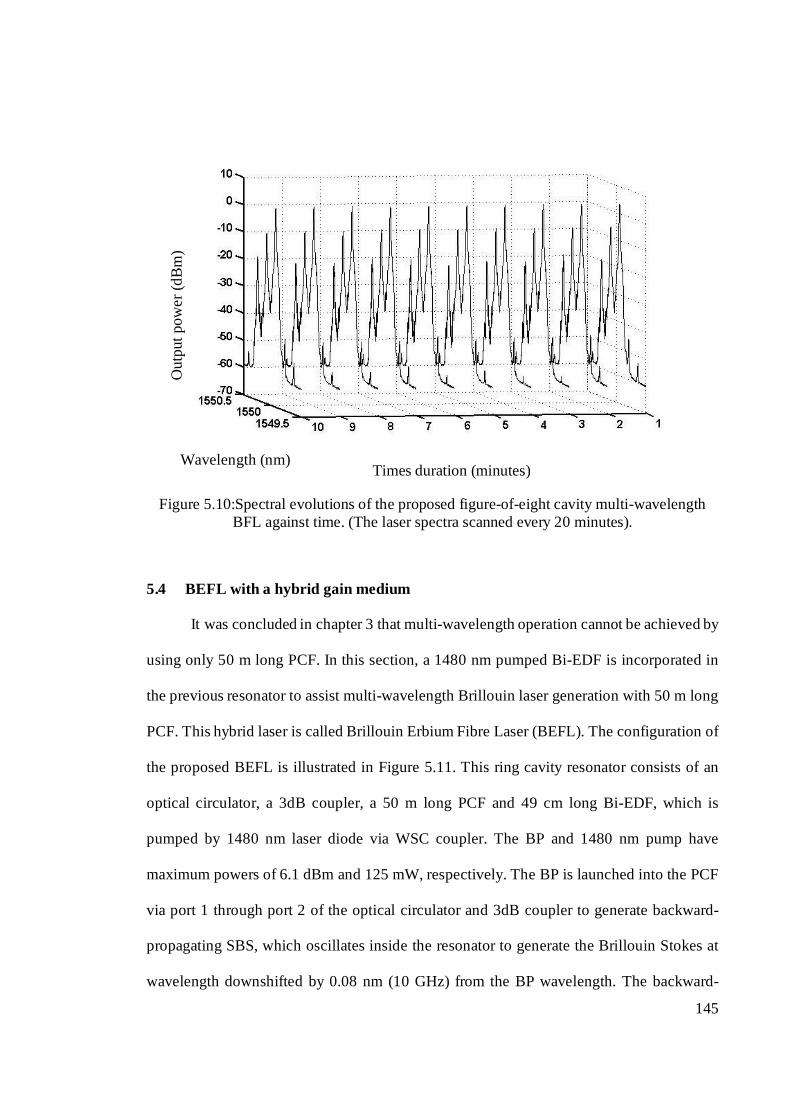
145
Figure 5.10:Spectral evolutions of the proposed figure-of-eight cavity multi-wavelength BFL against time. (The laser spectra scanned every 20 minutes).
5.4 BEFL with a hybrid gain medium
It was concluded in chapter 3 that multi-wavelength operation cannot be achieved by
using only 50 m long PCF. In this section, a 1480 nm pumped Bi-EDF is incorporated in
the previous resonator to assist multi-wavelength Brillouin laser generation with 50 m long
PCF. This hybrid laser is called Brillouin Erbium Fibre Laser (BEFL). The configuration of
the proposed BEFL is illustrated in Figure 5.11. This ring cavity resonator consists of an
optical circulator, a 3dB coupler, a 50 m long PCF and 49 cm long Bi-EDF, which is
pumped by 1480 nm laser diode via WSC coupler. The BP and 1480 nm pump have
maximum powers of 6.1 dBm and 125 mW, respectively. The BP is launched into the PCF
via port 1 through port 2 of the optical circulator and 3dB coupler to generate backward-
propagating SBS, which oscillates inside the resonator to generate the Brillouin Stokes at
wavelength downshifted by 0.08 nm (10 GHz) from the BP wavelength. The backward-
Out
put p
ower
(dB
m)
Wavelength (nm) Times duration (minutes)
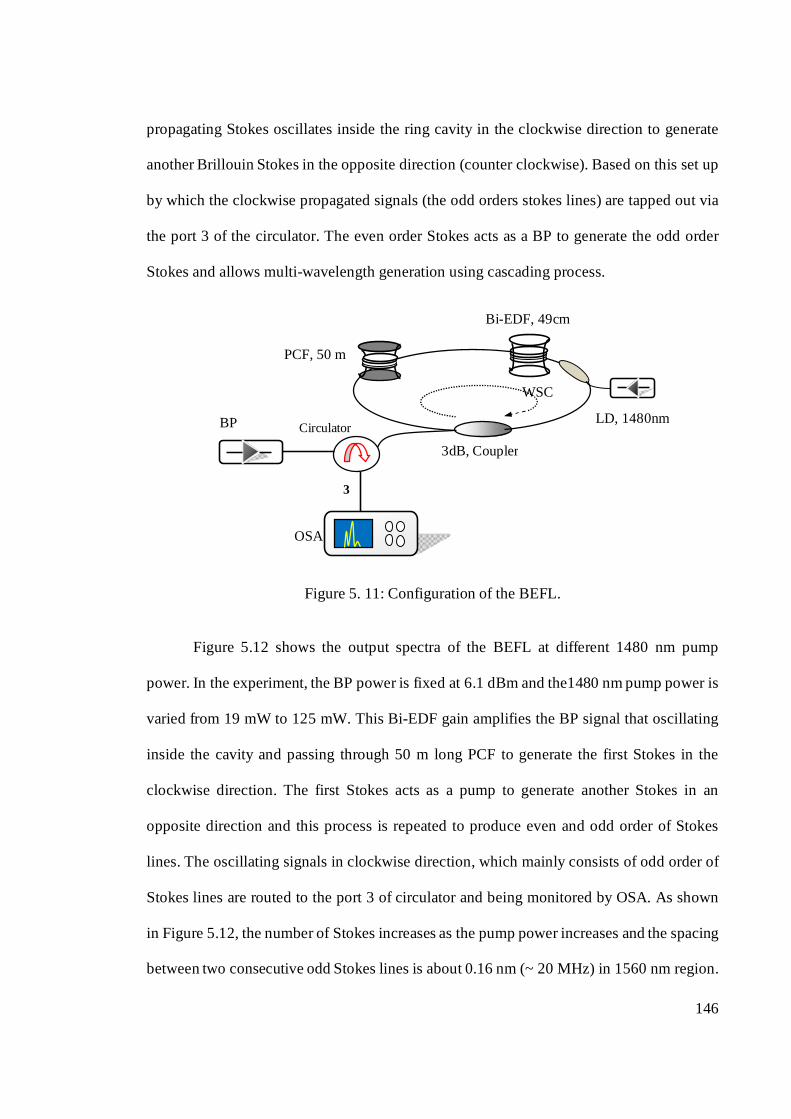
146
propagating Stokes oscillates inside the ring cavity in the clockwise direction to generate
another Brillouin Stokes in the opposite direction (counter clockwise). Based on this set up
by which the clockwise propagated signals (the odd orders stokes lines) are tapped out via
the port 3 of the circulator. The even order Stokes acts as a BP to generate the odd order
Stokes and allows multi-wavelength generation using cascading process.
Figure 5. 11: Configuration of the BEFL.
Figure 5.12 shows the output spectra of the BEFL at different 1480 nm pump
power. In the experiment, the BP power is fixed at 6.1 dBm and the1480 nm pump power is
varied from 19 mW to 125 mW. This Bi-EDF gain amplifies the BP signal that oscillating
inside the cavity and passing through 50 m long PCF to generate the first Stokes in the
clockwise direction. The first Stokes acts as a pump to generate another Stokes in an
opposite direction and this process is repeated to produce even and odd order of Stokes
lines. The oscillating signals in clockwise direction, which mainly consists of odd order of
Stokes lines are routed to the port 3 of circulator and being monitored by OSA. As shown
in Figure 5.12, the number of Stokes increases as the pump power increases and the spacing
between two consecutive odd Stokes lines is about 0.16 nm (~ 20 MHz) in 1560 nm region.
PCF, 50 m
BP
OSA
Circulator
3
3dB, Coupler
Bi-EDF, 49cm
LD, 1480nm
WSC

147
The Rayleigh scattered light from even order Stokes lines are also observed in the figure,
which shows a significantly reduced peak power compared to the Stokes power. The anti-
Stokes lines are also observed in the output spectrum due to the interaction among various
Stokes waves and the pump wave via the FWM process. At the maximum 1480 nm pump
power of 125 mW, at least three BEFL lines are obtained with line spacing of 0.16 nm. The
signal to noise ratio of approximately 21 dB is also achieved for the three odd Stokes lines.
Figure 5. 12: Output spectra of the common ring cavity ring MWBFL of Bi-EDF and PCF hybrid vs different pump power.
Figure 5.13 shows the measured peak power of the Stokes against 1480 nm pump
power. As shown in the figure, the peak power increases with the pump power with the
thresholds for the 1st, 3rd, 5th, and 7th Stokes lines are obtained at about 31, 41, 63, and 80
mW respectively. The Stokes lines saturate as the 1480 nm pump power is further increased
since the pump energy is used to generate next Stokes. For instance, the first Stokes line
-55
-45
-35
-25
-15
-5
5
1562 1562.2 1562.4 1562.6 1562.8 1563
Out
put p
ower
(dBm
)
Wavelength (nm)
125 mW
80 mW
51 mW
41 mW
19 mW

148
saturates as the threshold for the second Stokes is reached. This is due to the power transfer
from the first Stokes to the second Stokes, which occurs when the BP power is
approximately at 41 mW. The actual power transfer can be observed from Figure 5.13 due
to invisibility of the even order Stokes lines in the output spectrum.
Figure 5. 13: Brillouin Stokes power against 1480 nm pump power for the BEFL.
5.5 Multi-wavelength fibre laser operating in L-band region
In our previous sections, various multi-wavelength lasers have been reported using a
SBS effect. However, the spacing of this laser is fixed at 0.08 nm or 0.16 nm, which is very
narrow for WDM applications. In this work, a multi-wavelength laser is demonstrated with
a larger channel spacing using a FWM effect instead of SBS. To make the device very
compact, a Bi-EDF is used as the nonlinear gain medium. As concluded in the previous
chapter, 49 cm long Bi-EDF cannot effectively support the FWM process, a 215 cm long
-55
-45
-35
-25
-15
-5
5
15
0 20 40 60 80 100 120 140
Stok
es p
eaks
pow
er (d
Bm)
1480nm pump (mW)
Residual Brillouinpump1st Stokes
3rd Stokes
5th Stokes
7th Stokes

149
Bi-EDF is used in this study and therefore the operating wavelength of the proposed multi-
wavelength Erbium-doped fibre laser (EDFL) is in long wavelength band (L-band) region.
The effect of different pumping schemes on the performance of the laser is also
investigated. Figures 5.14 (a) and (b) show the configuration of the multi-wavelength
EDFL with forward and backward pumping schemes respectively. Both ring resonators
consist of a piece of Bi-EDF, tWSC couplers, two isolators, a polarization controller (PC)
and a 10 dB output coupler. The 215 cm long Bi-EDF is pumped by a 1480 nm laser diode
via the WSC to provide an amplified spontaneous emission (ASE) in L-band region. Two
optical isolators are used to ensure a unidirectional operation of the proposed EDFL. A PC
has been used to control the polarization and the birefringence inside the cavity, which in
turn control the number of line generated, channel spacing and the peak power. The total
cavity length of the ring resonator is approximately 7 m. The output of the proposed laser is
tapped from the 10% port of the output coupler. The experiment is also repeated with the
shorter length of Bi-EDF (49 cm) for comparison purpose. The used two isolators inside the
ring cavity can probably be replaced with one higher isolation component.

150
Figure 5. 14: Configurations of the multi-wavelength ring EDFL with (a) backward
pumping and (b) forward pumping scheme.
Figure 5.15 compares the output spectrum of the proposed EDFL for different
pumping scheme. The 1480 nm pump power is fixed at 147 mW. As shown in the figure,
the laser comb is generated at wavelength region of approximately 1613.5 and 1615.5 nm
for the forward and backward pumping respectively. The operating wavelength of the
EDFL is determined by the Bi-EDF gain spectrum which covers the L-band region from
1560 to 1620 nm as well as the cavity loss. The multi-wavelength comb is generated in the
region where the difference between Bi-EDF’s gain and cavity loss is the largest. The
forward pumping provides a slightly higher gain at shorter wave-length and therefore the
operating wavelength of the EDFL moves to a shorter wavelength with the forward
pumping. However, the backward pumping generates a higher number of lines compared to
the forward pumping. This is attributed to the backward pumping which provides a lower
noise in the laser cavity and thus enhances a FWM interaction.
Coupler
WSC
OSA
Bi-EDF
10%
1480nm, LD
PC
(a) Coupler
WSC
OSA
Bi-EDF
10%
1480nm, LD
(b)
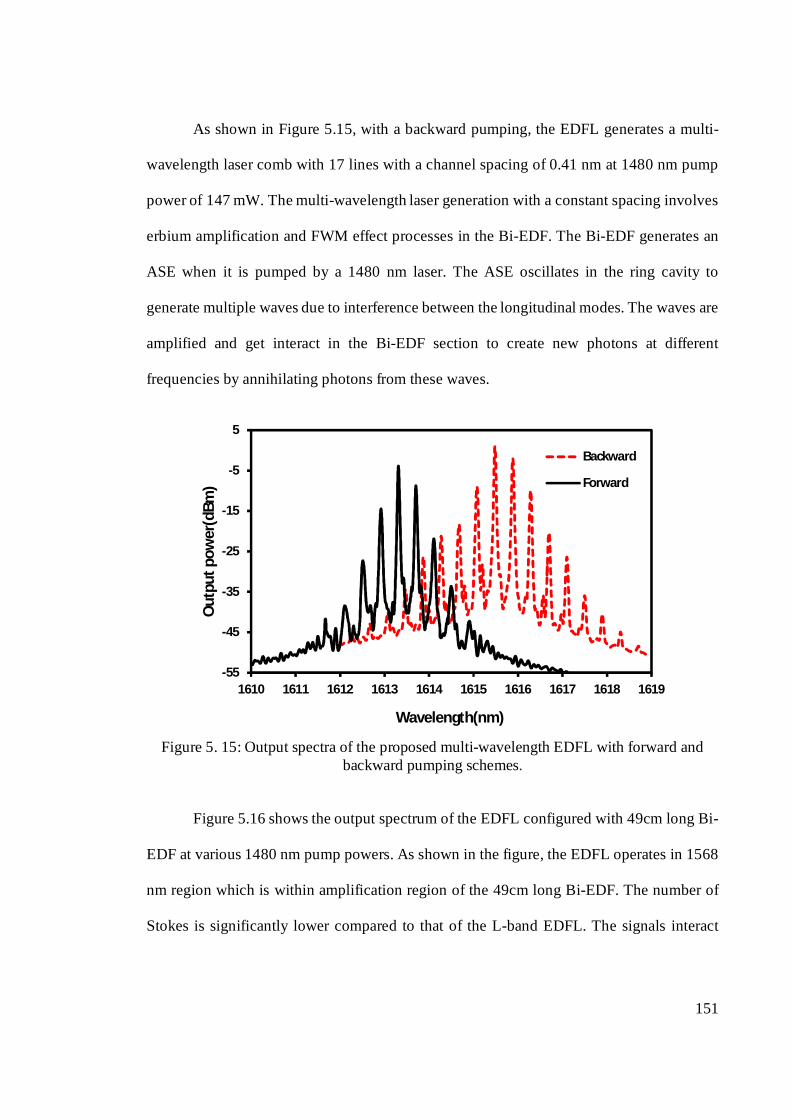
151
As shown in Figure 5.15, with a backward pumping, the EDFL generates a multi-
wavelength laser comb with 17 lines with a channel spacing of 0.41 nm at 1480 nm pump
power of 147 mW. The multi-wavelength laser generation with a constant spacing involves
erbium amplification and FWM effect processes in the Bi-EDF. The Bi-EDF generates an
ASE when it is pumped by a 1480 nm laser. The ASE oscillates in the ring cavity to
generate multiple waves due to interference between the longitudinal modes. The waves are
amplified and get interact in the Bi-EDF section to create new photons at different
frequencies by annihilating photons from these waves.
Figure 5. 15: Output spectra of the proposed multi-wavelength EDFL with forward and
backward pumping schemes.
Figure 5.16 shows the output spectrum of the EDFL configured with 49cm long Bi-
EDF at various 1480 nm pump powers. As shown in the figure, the EDFL operates in 1568
nm region which is within amplification region of the 49cm long Bi-EDF. The number of
Stokes is significantly lower compared to that of the L-band EDFL. The signals interact
-55
-45
-35
-25
-15
-5
5
1610 1611 1612 1613 1614 1615 1616 1617 1618 1619
Out
put p
ower
(dBm
)
Wavelength(nm)
Backward
Forward

152
longer in the 215 cm Bi-EDF and therefore the number of lines is higher with this fibre
compared to that of EDFL with 49 cm Bi-EDF.
Figure 5.16: Output spectra of the proposed EDFL at various 1480 nm pump power for 49 cm Bi-EDF length.
Figure 5.17 illustrates the peak power of the best 4 lines of laser comb against 1480
nm pump power. The peak power as well as the number of generated lines is observed to
increase as the 1480 nm pump power increases. It is also observed that the pump threshold
for all lines is roughly 110 mW. At this pump power, the Bi-EDF provides an efficient gain
to allow the higher order FWM Stokes to be generated by the assistance of nonlinear gain
in the Bi-EDF. Below 1480 nm pump power, the erbium gain is very low and cannot
sufficiently compensate for the loss inside the laser cavity and thus no wavelength comb is
observed. The number of lines is limited by the availability of the 1480 nm pump power,
fibre nonlinearity, and polarization filtering effect in the ring cavity laser as well as the
length of the gain medium in the ring resonator. The multi-wavelength output was observed
to be stable at room temperature with only minor fluctuations observed according to large
temperature variances.
-60
-50
-40
-30
-20
-10
0
1562 1564 1566 1568 1570 1572
Out
put p
ower
(dBm
)
Wavelength(nm)
150mW
68mW
28mw
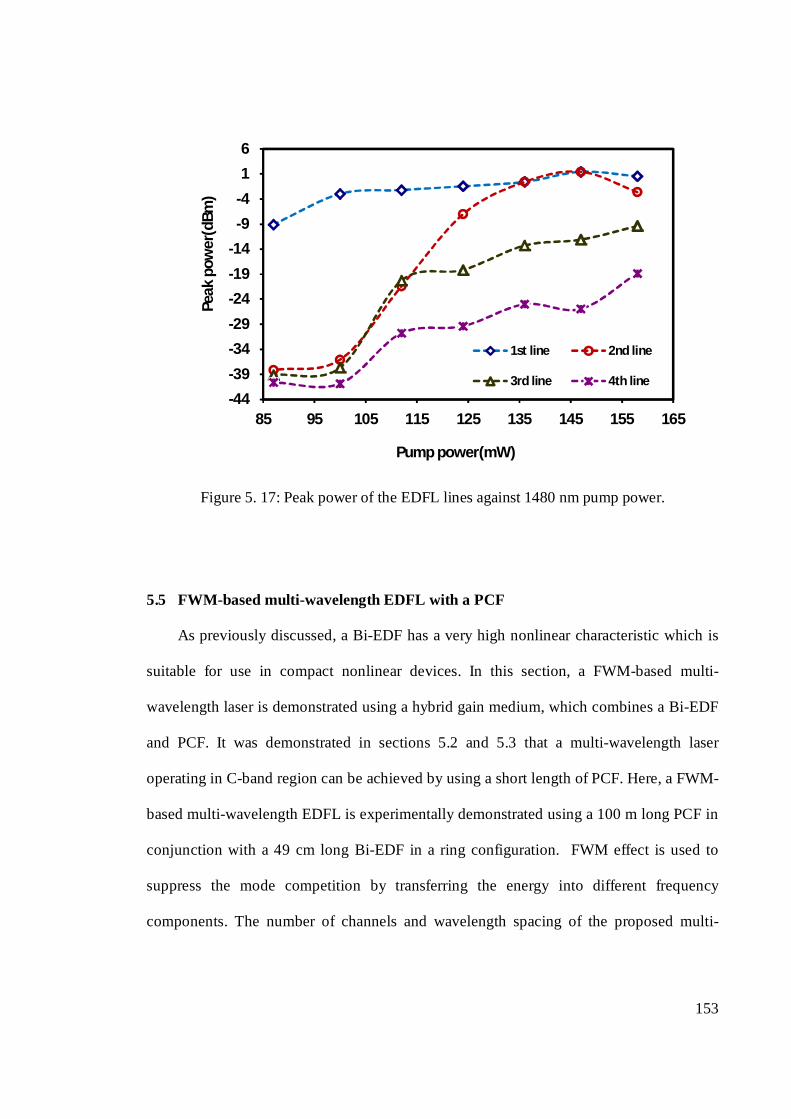
153
Figure 5. 17: Peak power of the EDFL lines against 1480 nm pump power.
5.5 FWM-based multi-wavelength EDFL with a PCF
As previously discussed, a Bi-EDF has a very high nonlinear characteristic which is
suitable for use in compact nonlinear devices. In this section, a FWM-based multi-
wavelength laser is demonstrated using a hybrid gain medium, which combines a Bi-EDF
and PCF. It was demonstrated in sections 5.2 and 5.3 that a multi-wavelength laser
operating in C-band region can be achieved by using a short length of PCF. Here, a FWM-
based multi-wavelength EDFL is experimentally demonstrated using a 100 m long PCF in
conjunction with a 49 cm long Bi-EDF in a ring configuration. FWM effect is used to
suppress the mode competition by transferring the energy into different frequency
components. The number of channels and wavelength spacing of the proposed multi-
-44
-39
-34
-29
-24
-19
-14
-9
-4
1
6
85 95 105 115 125 135 145 155 165
Peak
pow
er(d
Bm)
Pump power(mW)
1st line 2nd line
3rd line 4th line

154
wavelength laser can be flexibly controlled by changing the ratio of the output coupler in
the ring configuration.
The schematic diagram of the experimental set-up for the proposed multi-
wavelength EDFL is shown in Figure 5.18. The main components are the forward pumped
Bi-EDF, a 100 m long of PCF, an isolator, a PC and optical output coupler. The Bi-EDF is
pumped by a 1480 nm laser diode with the maximum power of 140 mW to produce ASE
operating in 1550 nm region. The ASE oscillates in the ring cavity to generate laser, by
which its operation can be control by the external laser. The laser beam from a TLS is
injected via an optical circulator to the ring cavity to control the operating wavelength as
well as to realize a stable simultaneous multi-wavelength oscillation via FWM process. The
TLS signal interacts with the oscillating free running laser in the opposite direction to
enhance the phase matching condition and generate FWM Stokes signals. An optical
isolator is used to block the TLS signal from oscillating in the cavity and to ensure
unidirectional operation of the laser. A PC is used to control the polarization state in the
cavity and thus maximize the FWM effect. The output of the EDFL is tapped out from the
coupler with a larger portion of the light is allowed to oscillate in the ring cavity. The
output spectrum is measured using the OSA.
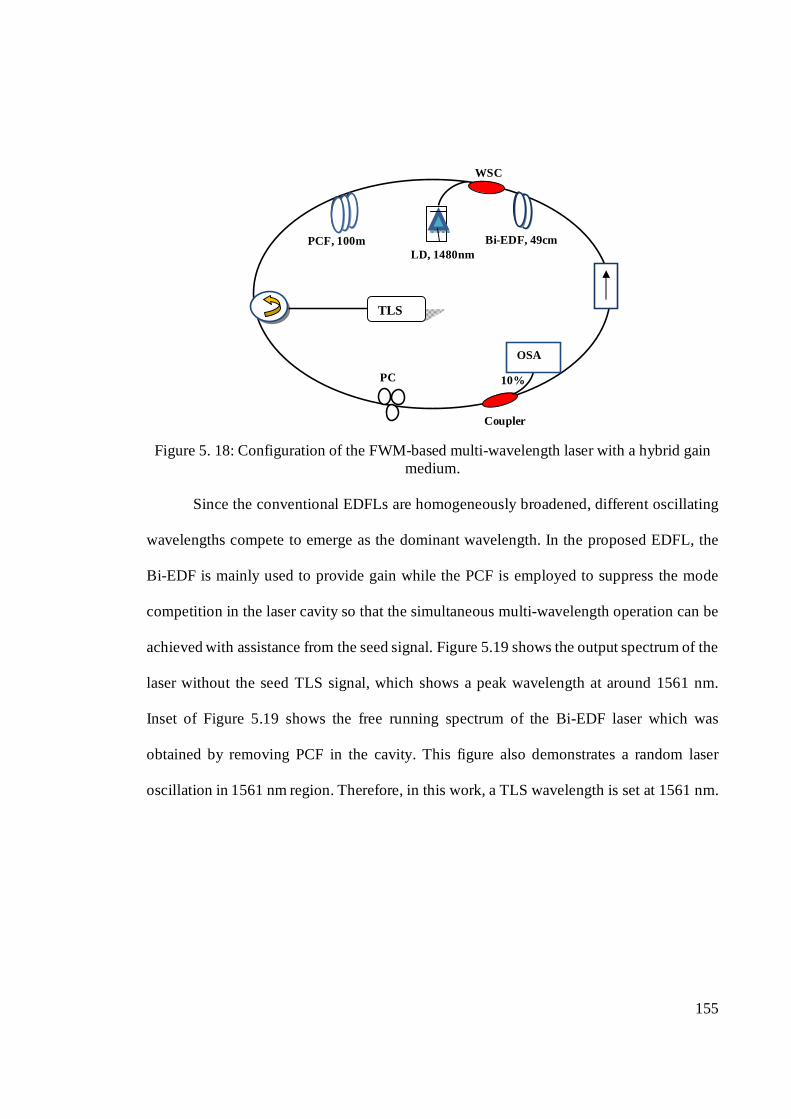
155
Figure 5. 18: Configuration of the FWM-based multi-wavelength laser with a hybrid gain medium.
Since the conventional EDFLs are homogeneously broadened, different oscillating
wavelengths compete to emerge as the dominant wavelength. In the proposed EDFL, the
Bi-EDF is mainly used to provide gain while the PCF is employed to suppress the mode
competition in the laser cavity so that the simultaneous multi-wavelength operation can be
achieved with assistance from the seed signal. Figure 5.19 shows the output spectrum of the
laser without the seed TLS signal, which shows a peak wavelength at around 1561 nm.
Inset of Figure 5.19 shows the free running spectrum of the Bi-EDF laser which was
obtained by removing PCF in the cavity. This figure also demonstrates a random laser
oscillation in 1561 nm region. Therefore, in this work, a TLS wavelength is set at 1561 nm.
Coupler
WSC
TLS
OSA
Bi-EDF, 49cm
10%
LD, 1480nm PCF, 100m
PC

156
Figure 5. 19: Free running spectrum of the hybrid laser without seed signal. Inset shows the free running Bi-EDF laser.
Figure 5.20 shows the output spectrum of the proposed FWM-based multi-
wavelength laser with a seed signal at 1561 nm for various 1480 nm pump powers. In the
experiment the 10 dB output coupler is used and the TLS power is fixed at the maximum
value of 5.5 dBm. As shown in the figure, at least 5 oscillating laser lines are obtained with
a channel spacing of 2.15 nm at the maximum 1480 nm pump power of 140 mW. The
signal to noise ratio of these lines is observed to be more than 20 dB. With the use of highly
nonlinear PCF in the ring cavity, a wave with stronger energy can transfer part of the
energy into another wave with weaker energy via FWM processes (Zhang et al., 2006).
This can effectively increase the stability and uniformity of the output multi-wavelength
lines due to the self-stability function of FWM effect (Zhang et al., 2006). By adjusting the
PC to obtain a proper polarization state, the FWM effect can be maximized and the mode
competition in the EDF can be further reduced.
-60
-50
-40
-30
-20
-10
0
1545 1550 1555 1560 1565 1570 1575
Out
put p
ower
(dBm
)
Wavelength(nm)
-60
-50
-40
-30
-20
-10
0
1558 1560 1562
Free running of Bi-EDFA

157
Figure 5. 20: The output spectrum of the multi-wavelength laser at different 1480 nm pump power employing 10 dB coupler as the output coupler.
The number of lines and its flatness are expected to be improved if the FWM effect
can be maximized. The FWM efficiency is proportional to the product of PL, where
the nonlinear coefficient of the PCF, P is the optical power passing through the PCF and L
is the effective length of the PCF. As mentioned earlier, the effectiveness of the FWM can
be enhanced by using a longer length of PCF, and/or using a fiber with larger , and/or
using higher gain and/or a larger saturation power EDFA to get a high cavity power P. In
this case we try to incorporate longer length of nonlinear gain media and also more value of
to enhance the FWM efficiency. It is also observed in Figure 5.20 that the number of
oscillating laser lines increases with the 1480 nm pump power, which verifies the above
expectation. It is also expected that when a coupler with a different coupling ratio is used,
the bandwidth and the spacing between laser output lines will change. Figure 5.21 shows
-60
-50
-40
-30
-20
-10
0
10
1550 1555 1560 1565 1570
Out
put p
ower
(dB
m)
Wavelength (nm)
78mW106mW140mW
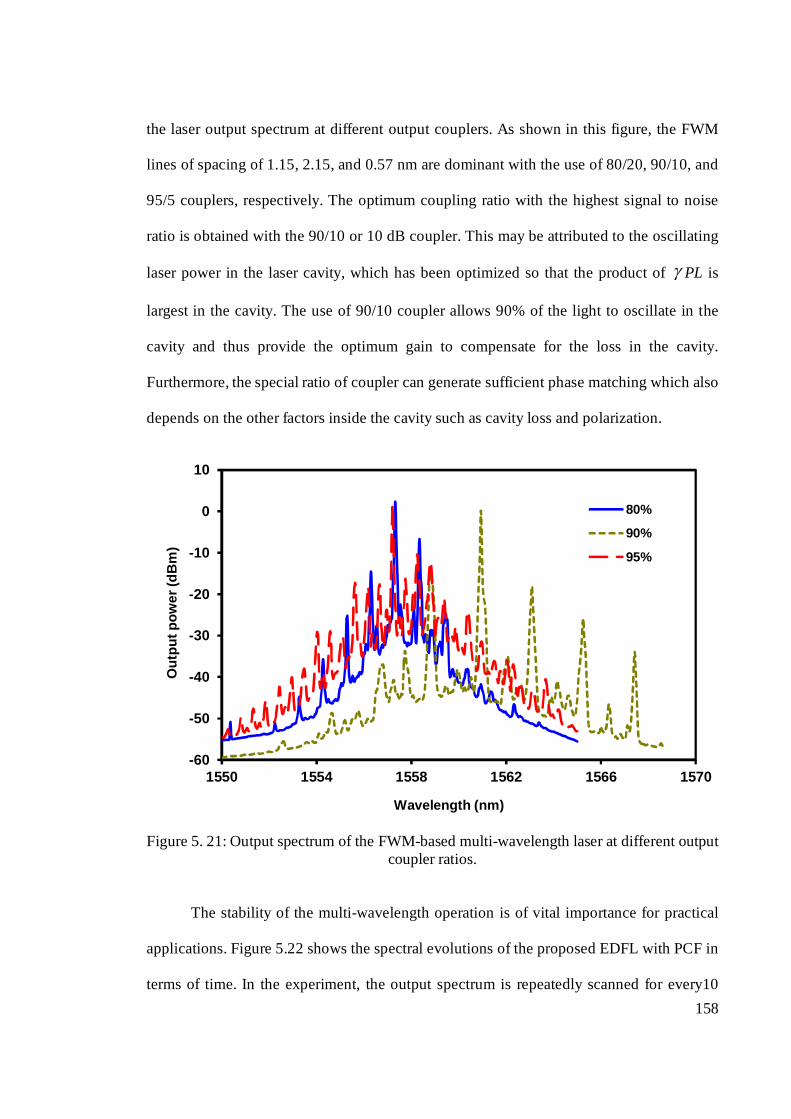
158
the laser output spectrum at different output couplers. As shown in this figure, the FWM
lines of spacing of 1.15, 2.15, and 0.57 nm are dominant with the use of 80/20, 90/10, and
95/5 couplers, respectively. The optimum coupling ratio with the highest signal to noise
ratio is obtained with the 90/10 or 10 dB coupler. This may be attributed to the oscillating
laser power in the laser cavity, which has been optimized so that the product of PL is
largest in the cavity. The use of 90/10 coupler allows 90% of the light to oscillate in the
cavity and thus provide the optimum gain to compensate for the loss in the cavity.
Furthermore, the special ratio of coupler can generate sufficient phase matching which also
depends on the other factors inside the cavity such as cavity loss and polarization.
Figure 5. 21: Output spectrum of the FWM-based multi-wavelength laser at different output coupler ratios.
The stability of the multi-wavelength operation is of vital importance for practical
applications. Figure 5.22 shows the spectral evolutions of the proposed EDFL with PCF in
terms of time. In the experiment, the output spectrum is repeatedly scanned for every10
-60
-50
-40
-30
-20
-10
0
10
1550 1554 1558 1562 1566 1570
Out
put p
ower
(dB
m)
Wavelength (nm)
80%
90%
95%
159
min. The multi-wavelength EDFL lases stably with power fluctuations of less than 0.5 dB
over 2.5 hours. There are two main factors that contribute to the operation instability in the
conventional EDFL. They are mode competition in the laser cavity and the drift of the
spectral profile as a result of the thermal fluctuation. In the proposed set-up, a 100 m long
PCF is used to reduce the mode competition inside the ring cavity via the nonlinear effect.
Therefore, multi-wavelength operation may be self-stabilized by taking the combination of
PCF and Bi-EDF as a promising candidate for nonlinear and linear gain media. In addition,
temperature variations and mechanical vibrations were small as the experiment was
conducted in a laboratory; thus the drift of the spectral profile was minimal. These results
show that the phase matching condition for FWM in the PCF has been enhanced using a
seed signal and a suitable state of polarization in the ring laser cavity. The number of
channels and wavelength spacing can be controlled by varying the output coupler ratio.
Therefore, the proposed configuration is suitable for multi-wavelength generation. The laser
also has a potential in wavelength conversion application for optical communication
networks.

160
Figure 5. 22: The EDFL output spectrum against time.
5.6 FWM-based multi-wavelength EDFL operating in L-band region
In this section, we investigate the performance of the FWM-based multi-wavelength
EDFL with combination of the 49 cm and 215cm long highly nonlinear Bi-EDF as the gain
medium. This configuration incorporates two 1480 nm pumps with power of 150 mW and a
broadband FBG operating in C band region. The combination of these two gain media has
successfully produced a FWM-based multi-wavelength laser operating with injection of a
seed signal from a TLS. This laser operates in L-band region due to the use a longer Bi-
EDF with a total length of 264 cm. The experimental setup for the proposed new EDFL is
illustrated in Figure 5.23. This ring cavity consists of a 49 cm long Bi-EDF, a 215 cm long
Bi-EDF, two 1480 nm pump diodes, two WSC, an optical isolator and a TLS which acts as
a BP.
Wavelength (nm)
Out
put p
ower
(dBm
)
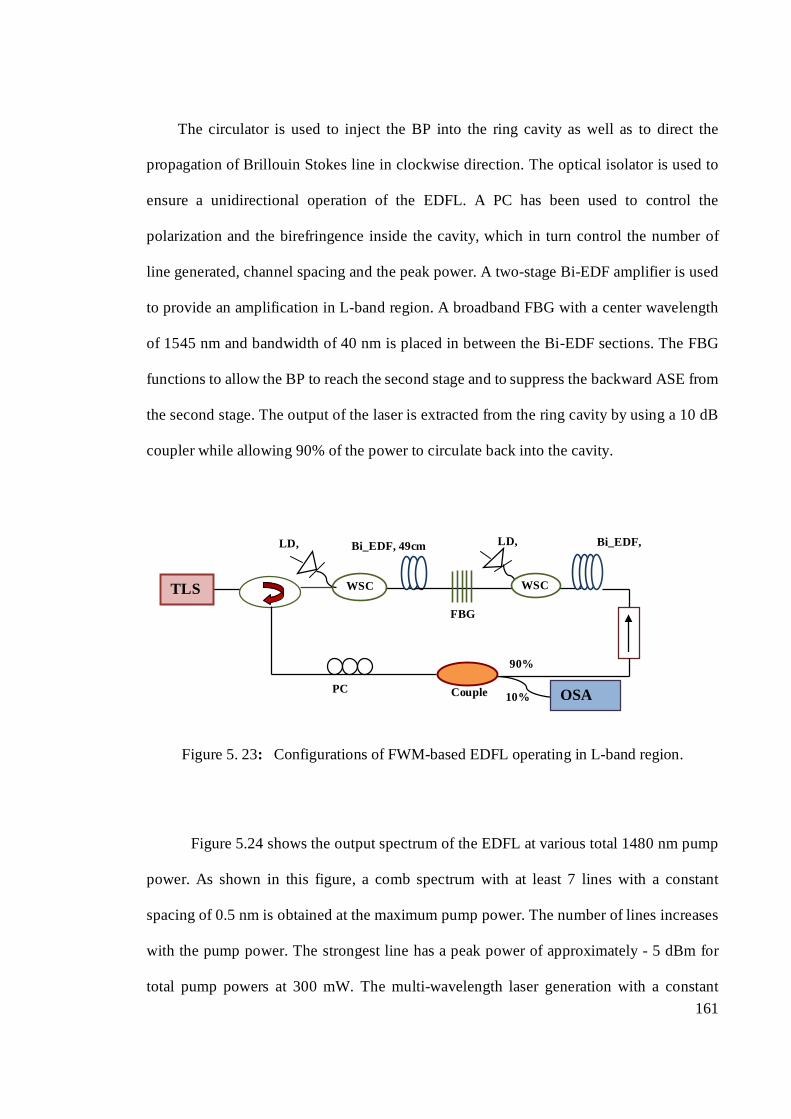
161
The circulator is used to inject the BP into the ring cavity as well as to direct the
propagation of Brillouin Stokes line in clockwise direction. The optical isolator is used to
ensure a unidirectional operation of the EDFL. A PC has been used to control the
polarization and the birefringence inside the cavity, which in turn control the number of
line generated, channel spacing and the peak power. A two-stage Bi-EDF amplifier is used
to provide an amplification in L-band region. A broadband FBG with a center wavelength
of 1545 nm and bandwidth of 40 nm is placed in between the Bi-EDF sections. The FBG
functions to allow the BP to reach the second stage and to suppress the backward ASE from
the second stage. The output of the laser is extracted from the ring cavity by using a 10 dB
coupler while allowing 90% of the power to circulate back into the cavity.
Figure 5. 23: Configurations of FWM-based EDFL operating in L-band region.
Figure 5.24 shows the output spectrum of the EDFL at various total 1480 nm pump
power. As shown in this figure, a comb spectrum with at least 7 lines with a constant
spacing of 0.5 nm is obtained at the maximum pump power. The number of lines increases
with the pump power. The strongest line has a peak power of approximately - 5 dBm for
total pump powers at 300 mW. The multi-wavelength laser generation with a constant
Bi_EDF,
OSA
FBG
Bi_EDF, 49cm LD, LD,
TLS
Couple
WSC WSC
90%
10% PC
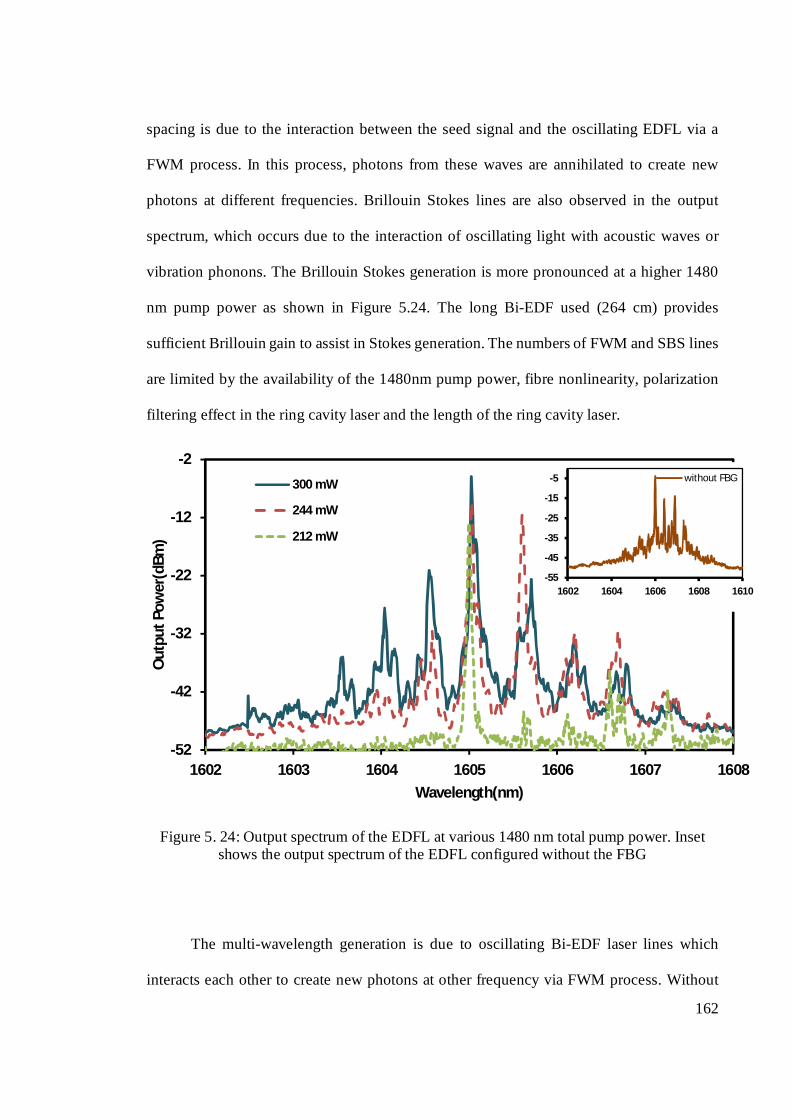
162
spacing is due to the interaction between the seed signal and the oscillating EDFL via a
FWM process. In this process, photons from these waves are annihilated to create new
photons at different frequencies. Brillouin Stokes lines are also observed in the output
spectrum, which occurs due to the interaction of oscillating light with acoustic waves or
vibration phonons. The Brillouin Stokes generation is more pronounced at a higher 1480
nm pump power as shown in Figure 5.24. The long Bi-EDF used (264 cm) provides
sufficient Brillouin gain to assist in Stokes generation. The numbers of FWM and SBS lines
are limited by the availability of the 1480nm pump power, fibre nonlinearity, polarization
filtering effect in the ring cavity laser and the length of the ring cavity laser.
Figure 5. 24: Output spectrum of the EDFL at various 1480 nm total pump power. Inset shows the output spectrum of the EDFL configured without the FBG
The multi-wavelength generation is due to oscillating Bi-EDF laser lines which
interacts each other to create new photons at other frequency via FWM process. Without
-52
-42
-32
-22
-12
-2
1602 1603 1604 1605 1606 1607 1608
Out
put P
ower
(dBm
)
Wavelength(nm)
300 mW
244 mW
212 mW
-55
-45
-35
-25
-15
-5
1602 1604 1606 1608 1610
without FBG

163
the FBG, only a random laser lines with inconsistent spacing is observed as shown in the
inset of Figure 5.24. The broadband FBG reflects the C-band ASE and allows it to intensify
and oscillates in the anti-clockwise direction. The ASE suppress the erbium gain as well as
the nonlinear gains in the ring cavity and thus disturbs the multi-wavelength generation
process.

164
CHAPTER SIX: CONCLUSIONS AND FUTURE SCOPE OF WORK
6.1 Conclusions
This thesis concentrated on a thorough study on the use of photonic crystal fibre
(PCF) and Bismuth-based Erbium-doped fibre (Bi-EDF) for nonlinear fibre laser
applications. Various configurations on the continuous-wave (CW) single-wavelength and
multi-wavelength fibre lasers have been proposed and demonstrated using either PCF
or/and Bi-EDF as a nonlinear gain medium. Nonlinear effects such as the stimulated
Brillouin scattering (SBS) and four-wave mixing (FWM) are used in the fibre lasers for
generating stimulated fibre laser and multi-wavelength comb lines either through a
Brillouin fibre laser (BFL), Brillouin/Erbium fibre laser (BEFL) or FWM-based fibre laser.
The aim of these works is to produce a compact and efficient nonlinear fibre lasers using a
highly nonlinear fibre. This study involves three main parts; nonlinear characterization of
the nonlinear fibres, development of compact nonlinear fibre lasers and advanced
configurations of a compact multi-wavelength fibre laser.
Nonlinear Characterization of PCF and Bi-EDF
In chapter 3, a new approach has been described to calculate SBS threshold power
provided by a piece of PCF. In this investigation, threshold pump power has been evaluated
against fibre length and incident pump power by considering 1% criterion as well as the
pump depletion. It is observed that the simulated results are in a good agreement with
experiment. The Brillouin threshold gain was also calculated to be varying from 14 to 18

165
depending on the PCF length. The gain and noise figure characteristics of the Bi-EDFA
were also experimentally and theoretically investigated. In the theoretical analysis, the rate
and power propagation equations are solved to examine the effect of the fibre length on the
bandwidth of the gain spectra. The Bi-EDFA operates in C-band region with the use of 0.49
m long Bi-EDF and the operating wavelength slowly shifts to the L-band region as the
length of gain medium increases. The optimum length for the Bi-EDFA to operate in C-
band is theoretically around 0.5 to 0.8m. The nonlinear effect inside a piece of 0.5 long Bi-
EDF was also experimentally investigated. It is observed that this length was not sufficient
to demonstrate both SBS and FWM effects in a common basic configuration without
looping.
A simple technique for simultaneous measurements of the nonlinear and dispersion
properties of the PCF was presented using a FWM process. A theoretical analysis simulates
the experimental conditions and is exploited to determine nonlinear Kerr coefficient,
chromatic dispersion and nonlinear phase shift with high accuracy. The nonlinear Kerr
coefficient γ and chromatic dispersion are calculated to be about 43 (Wkm)-1 and 6.05 ps
/nm km respectively at 1560nm for the 100m long PCF. The nonlinear figure-of-merit is
obtained at around 0.737 (W-1) that shows that the PCF offer a significant performance in
compact nonlinear devices due to its special structure based on air and silica.
Compact nonlinear fibre lasers
In Chapter 4 compact nonlinear fibre laser configurations employing PCF or Bi-
EDF were presented. Firstly, a single wavelength conventional BFL is demonstrated using
three different length of PCFs as the gain medium. At PCF length of 100 m, the BFL has a
peak power of 0dBm which translates to 10% power conversion efficiency with a side

166
mode suppression ratio (SMSR) of more than 30 dB. The spacing between the BP and the
Stokes is measured to be approximately 0.08 nm. However the threshold of the BFL is
measured to be approximately 9.4 dBm, which is much less compared to the BFL
configured with 50 even 20m long PCF. In this study, the Brillouin gain spectrum obtained
by both PCF and SMF were also compared. The frequency shift of Brillouin scattering
achieved by PCF is around 9.75 GHz whereas it is around 10.83 GHz by employing SMF.
This change is probably attributed to the higher amount of Ge2O3 is doped in the PCF than
the SMF. In order to reduce the threshold power of SBS laser, a new configuration was
demonstrated by rearranging the components of the BFL to reduce the cavity loss. The laser
thresholds for the conventional and the proposed new BFL are obtained at around 12.7 and
10.4 dBm, respectively and the new BFL has a SMSR of around 31.5 dB, which is nearly
6.3 dB higher compared to the conventional BFL.
To reduce the length of the gain medium of BFL, a single wavelength BEFL is
proposed and successfully demonstrated using only a 49-cm Bi-EDF as the gain medium.
The BEFL is achieved by reducing and optimization of the cavity loss in the ring
configuration. At the BP power of 6 dBm and 1480-nm pump power of 144 mW, the BEFL
operates at 1550.49 nm, which is upshifted by nearly 0.09 nm from the BP with a peak
power of approximately -4 dBm and an SMSR of 14 dB. The BP wavelength is also tunable
within a wavelength range from 1558.8 nm to 1560.0 nm. The generated BEFL has a
narrow linewidth, as well as low relative linewith noise and frequency noises, which makes
it suitable for sensing applications. To improve the performance of the BEFL, an isolator
and PC are included in the enhanced configuration. The enhanced BEFL operates at 1563
nm region to achieve a SMSR of 29 dB when the BP and 1480 nm pump power are fixed at
6 dBm and 144 mW, respectively.

167
A compact nonlinear fibre laser is also demonstrated based on FWM effect using
49cm long Bi-EDF. By deploying the ring cavity, the EDFL is able to generate a laser
comb with more than 5 lines and peak powers above –35 dBm. The channel spacing of 0.5
nm is obtained with the PC in the cavity. The incorporation of broadband FBG in the cavity
reduces the noise and enhances the FWM interaction to make the multi-wavelength
generation to be more efficient.
Multi-wavelength nonlinear laser generation utilizing advanced configurations
In chapter 5, many new configurations of multi-wavelength fibre laser were
demonstrated using either SBS or FWM effect. Firstly, a stable room temperature multi-
wavelength lasing oscillation was experimentally demonstrated by exploiting SBS in a
short length of PCF in conjunction with dual-pass configuration. Nearly 7 Brillouin Stokes
lines with a constant spacing of 0.08 nm are achieved by 15.7 dB BP power and 100 m long
PCF. Four anti-Stokes lines are also obtained due to four wave mixing and bidirectional
operation. Depending on the BP wavelength and FBG region used, the proposed
configuration can work at any wavelength which is the advantage compared to other
schemes. When the pump power exceeds the SBS threshold power, it is also revealed that
the previous stokes line starts to saturate and thus a flat output lines can be achieved. In
order to generate multiwavelength laser with different order of Brillouin spacing, a figure-
of-eight configuration is proposed using a 100 m length of PCF. With a BP of 15.3 dBm, at
least 4 even-order BFL lines are obtained with a line spacing of 0.16 nm. The anti-Stokes
lines are also obtained due to FWM processes. It was found that the output spectrum can be
tuned by at least 80 nm, depending on the availability of BP source. The multi-wavelength
BFL operates stably with power fluctuations of less than 0.5 dB for more than 3 hours.
168
In a BEFL, Bi-EDF acts as both nonlinear and linear gain medium. In this study, a
50m long PCF is incorporated as additional nonlinear gain medium PCF besides the 49 cm
long Bi-EDF inside the ring BEFL to generate double-spacing Brillouin Stokes lines. With
BP and 1480 nm powers of 6 dBm and 125 mW respectively, 4 odd-order lines are
obtained with a line spacing of 0.16 nm, which is comparable with the previously proposed
figure-of-eight BFL. The thresholds for the 1st, 3rd, 5th, and 7th odd order Stokes lines are
obtained at about 31, 41, 63, and 80 mW respectively. To increase the number of lines and
channel spacing, a multi-wavelength EDFL was then demonstrated using a piece of 215 cm
long Bi-EDF via FWM process in a ring configuration. The proposed FWM-based EDFL is
able to generate up to 17 lines with a constant channel spacing of 0.41 nm at 1615.5 nm
region using 147 mW of 1480 nm pump power. However, the number of lines reduces to
two with the use of 49 cm of Bi-EDF. The proposed multi-wavelength EDFL is stable at
room temperature and also compact due to use of only a very short length of gain medium.
A hybrid multi-wavelength EDFL was also experimentally demonstrated at room
temperature based on FWM effect using a 100 m long PCF and a forward pumped 49 cm
long Bi-EDF. At maximum 1480 nm pump power of 147 mW, 5 lines are stably produced
with nearly 2.15 nm spacing between the lines and a signal to noise ratio of more than 20
dB. The phase matching condition for FWM in the PCF has been enhanced using a seed
signal and a suitable state of polarization in the ring laser cavity. The number of channels
and wavelength spacing can be controlled by varying the output coupler ratio.
It is concluded that a multi-wavelength generation can be easily achieved in a very
short length nonlinear fibres such as PCF and Bi-EDF. BFL can obtain a wavelength
spacing of either 0.08 or 0.16 nm. If a larger spacing is required, a FWM-based nonlinear

169
laser can be used. The proposed multi-wavelength fibre lasers have many possible
applications such as WDM network, sensor and etc.
6.2 Recommendations for future works
For future work, SBS and FWM effects on other types of PCF should be studied.
The composition and geometrical structure of different PCF can be tailored to achieve a
lower threshold and the maximum gain for both SBS and FWM effects. Since the numbers
of channels in the proposed PCF based BFL is limited due to the insufficient incident pump
power, the comb generation can be further investigated using more enhanced configurations
such as hybrid of two stages or including an amplifier in the structure to boost up the BP.
The study should also concentrate on reducing further the length of used nonlinear fibre or
to replace the Bi-EDF and PCF with other enhanced rare earth dopant fibres likes Zirconia-
Yttria doped fibre that can maintain high flat gain per length coefficient of compact
amplifiers.
Furthermore, the multi-wavelength generation should also be investigated using
another type of nonlinear effect such as stimulated Raman scattering (SRS). The use of
Raman gain to replace Erbium gain in the hybrid BFL or FWM-based laser can be also
experimented. Additionally, the compact multi-wavelength fibre laser can be improved
with the present of suitable Fibre Bragg Grating (FBG). Highly nonlinear fibres such as
Chalcogenide fibre or Bismuth based PCF can also be used as a gain medium. In future
work, theoretical works on high efficiency BFL should also be directed towards further
improvement of the proposed linear and ring BFL cavities. This investigation should also
concentrate on the four-wave mixing and the simulation of close loop BFL configurations

170
which seems to be important factors in determining the threshold condition in the BFL
generation. As an active significant area of research in nonlinear fibre optics, it seems that
BFLs, MBFLs, and MBEFLs remain as an important issue of the future.