chapter 1 introduction 1.1 general conceptstudentsrepo.um.edu.my/3805/2/2._chapter_1_–_5.pdf ·...
TRANSCRIPT

1
CHAPTER 1
INTRODUCTION
1.1 GENERAL CONCEPT
Malaysia, enclave in the tropical region, has enjoy the abundance of rainfall and
green landmasses, which contributed to the abundance of groundwater resource from
the annual rainfall of 3,000mm and the estimated groundwater storage of 5,000 BCM
(Azuhan 1990), as illustrated in Table 1.1 . With groundwater storage and groundwater
usage currently at 197 Ml/d (Malaysia Water Guide, 2009) in Malaysia, groundwater
resources are still underutilized.
Table 1.1: Water Resources in Malaysia
HYDROLOGY PARAMETER TOTAL ANNUAL VOLUME (BCM)
Annual Rainfall (3,000 mm) 990
Evo-transpiration 360
Effective Rainfall 630
Surface Runoff 566
Groundwater Recharge 64
Surface Artificial Storage 25
Groundwater Storage 5000

2
For the state of Kelantan, where groundwater is being significantly utilized for
potable water supply, is the leading state and largest groundwater operator in Malaysia.
Traditionally people in Kelantan have used groundwater resource as the potable use
since early civilization, before fully developed into industrial potable use in 1935 (W
Ismail 2009), taking the advantage of the rich groundwater alluvial basin especially in
the north region of Kelantan.
The groundwater resources of the Sg.Kelantan river basin (Fig.1.1:Map of
Kelantan Hydrogeology) are the main sources of fresh water and also are vitally needed
to supplement surface water sources. Professional and scientific practice shows that an
intergranular aquifer found in Kelantan offers the greater potential in maximizing the
utilization of this precious resource. It contributes to the safety of water supply and to a
general improvement of groundwater quality. However, despite their importance, the
groundwater resources are under stress of exploitation and contamination. The
maintenance and protection of groundwater ecosystems should therefore be a major
topic in the coming years in groundwater water management.
Information on groundwater resources and potential threats is also an important
first step in effective source protection. The information and analysis generated by
studies will support the development of local and regional groundwater strategies.
Information from studies is vital since studies can provide data to support the
development of a statewide watershed-based source water protection framework.
Groundwater used to be a virtually inexhaustible source of water supply, and was
convenient because it was accessible, and because it continued to deliver a good quality

3
of water. On the other hand, groundwater as well as surface water is finite resources.
With the increasing rates of abstraction and the broadening scope of human activity, it
has led to increased constraints on water management, including the use and protection
of groundwater. Water use and water management can be divided into three stages:
Stage 1: Abundance: Water use and water pollution are low relative to
available resources.
Stage 2: Depletion: Water use and water pollution are considerable relative to
available resources, leading to a gradual depletion of
resources.
Stage 3: Sustainable development: Water management must be implemented
in such a way as to conserve good water status and avoid
the depletion of resources to future detriment.
(Source: UN/ECE Task Force on Monitoring and Assessment 2004)
Fig.1.1 : Kelantan Hydrogeology Map: Sg.Kelantan River Basin (in light blue legend)
4
In Sg.Kelantan river basin, the widely observed effects are the decline of the
water table as well as deterioration of groundwater quality and in certain isolated coastal
areas of the basin, seawater intrusion and probably land subsidence, as of description of
Stage 2. Although it might be in its premature stage 2, but with these problems growing,
the awareness of the need for sustainable management of the groundwater resources, as
laid in stage 3 for sustainable development of groundwater, will have to be increased.
Water management needs to be adaptive. It should take into account the
specificities associated with the natural and socio-economic status of individual areas,
as well as those associated with potential climate changes, while striving to achieve
sustainability.
Monitoring of water quality, water levels, and water extraction in an aquifer is,
therefore, of fundamental importance as a basis for groundwater resources management.
Monitoring, data collection and analysis provide the information that permits rational
management decisions on all kinds of groundwater resources sustainability issues.
The role and importance of the aquifers of the Sg.Kelantan river basin demand a
careful and consistent assessment and monitoring of these resources. An integrated
approach to monitoring design together with a unified and consistent information base
on basic hydrological processes is a prerequisite for the sustainable management of its
aquifers, where the already complex interplay of geology, climate and human activities
that defines a groundwater catchments or groundwater body.
5
1.2 INTEGRATED WATER RESOURCE MANAGEMENT (IWRM)
The Global Water Partnership has defined “Integrated Water Resources
Management (IWRM)” as a process which promotes the coordinated development and
management of water, land and related resources, in order to maximize the resultant
economic and social welfare in an equitable manner without compromising the
sustainability of vital ecosystems.
The IWRM key principle is best described in the Dublin Principles, a set of four
principles for effective and efficient water management that were the outcome of a
major conference on Water and Environment held in Dublin in January 1992, which
narrates that, in summary:-
Water is a finite and vulnerable resources, essential for life, development
and environment
Water development and management should be based on stakeholders
participation
Women plays an important role in water management
Water has an economic value and should be recognized as an economic
good
(IWRM in Action, Jan Hassing et. al. UNESCO 2009)
Malaysia has yet to set and develop a National Integrated Water Resource
Management (IWRM), where geographical and political context is set within to develop
the national framework of policies, legislation and institutions in which water resource
management in river basins and sub-basins can take place. With an exception, where

6
recently the Federal government through Jabatan Pengairan dan Saliran (JPS) under the
Ministry of Natural Resources and Environment have carried out a study to formulate a
National Water Resources Policy for the Malaysia.
Malaysia has reached the development threshold that makes it necessary for the
country to move to next stage of IWRM progress, i.e inter-sectoral management of
water resources and its use. This implies the need to develop a policy, law and
institutional framework that can support the inter-sectoral planning and coordination of
water resources management.(Review of National Water Resources and Formulation of
National Water Resources Policy, Ranhill Consulting Sdn.Bhd. June 2010)
A National IWRM will take into account all activities and developments, among
others ecological requirements, water supply, sanitation, irrigation, land use and
forestry, within each basins and sub-basin that require water or influencing the water
resources, to be planned and monitored. The goal for National IWRM is for
sustainability in water management with representation in environmental sustainability,
social equity and economic efficiency. The thematic areas required to provide a detailed
and effective water resources management, are:-
Rivers, lakes and coastal management
Groundwater management
Water quality management
Floods & drought management
Water resources allocation

7
1.3 INTEGRATED RIVER BASIN MANAGEMENT (IRBM)
Integrated River Basin Management (IRBM) is defined as "the coordinated
management of resources in natural environment (air, water, land, flora, fauna) based
on river basin as a geographical unit, with the objective of balancing man's need with
necessity of conserving resources to ensure their sustainability" (Global Water
Partnership, 2000). When IRBM is implemented in river basins, it is focused towards
integrating and coordinating policies, activities and practices, which addresses water
and river related issues. Similar to IWRM, the implementation of IRBM requires
professional capacity building and financial backing, legislative, managerial and
political capacity. The main objective of the IRBM is to establish a balance between the
existing natural functions of the river system and the developed aspects of the system.
The management actions should fulfill the expectations of the society for industrial use,
recreation, nature management, and agricultural purposes. (Council of the European
Communities 2000. Directive 2000/60/EC)
1.4 GROUNDWATER RESOURCE MANAGEMENT (GWRM)
Prerequisite for developing a more informed assessments of the implications of
groundwater conditions for industrial use and scientifically founded courses of action
for managing the resource base, is a sound and good groundwater resources
management system. These can be focused on the development of adaptive responses to
water problems and policy approaches that reflect and respond to uncertainty, change
and the absence of real understanding of systems and their interactions. Inherent

8
limitations in the nature of scientific information in conjunction with the dynamic
process of social and institutional change occurring in many parts of the world make the
assessment at least as important as the scientific studies.
Basic research on groundwater is fundamental to any attempt to manage
groundwater or respond to the problems related to groundwater use in the region. It is
important to conduct further research (in spite, of many studies that have been
conducted in the study area) to identify techniques for the rapid and accurate evaluation
of water-balance components under the developing conditions. Development of
improved water-balance models will certainly help the implementation of Groundwater
Resource Management (GWRM) system in the study area.
Objectives of GWRM are set within the scope of overall water resources
management i.e. monitoring, data collection and analysis providing the information that
permits rational management decisions on all kinds of groundwater resources
sustainability issues and achieving goals, that are:-
i. Understanding the flow system and assessing the current groundwater
status,
ii. Quantifying inter-relationships between surface water and groundwater,
iii. Determining and detecting trends in groundwater levels and quality
identifying actual and emerging problems,
iv. Assessing the magnitude and impact of pressures and the rate of use of
the resource,

9
v. Assessing changes in status with time in response to the application of
measures for improvement or prevention of deterioration and evaluating
the effectiveness of management actions.
(source: Groundwater in large river basin, IWA publishing 2008)
A data management tool for groundwater resources data will have to be
established. It is a web based GIS application that allows you to access, integrate, query,
and visualize multiple sets of data. It is also a one stop shop for state-wide groundwater
resources information management system. Embedded in the system, is the creation of
numerical groundwater models of field problems that requires careful attention to
describing the problem domain, selecting boundary conditions, assigning model
parameters, and calibrating the model. It integrates multi-disciplinary data to support
Integrated Resource Water Management (IRWM) and Integrated River Basin
Management (IRBM). This will also increase efficiency in data download and
dissemination of useful information through flexible, expandable, and user
customization functionalities.
The Groundwater Monitoring System is made available for groundwater
development and management and on the planning and management level there is a
need for coordination between the federal agencies (Ministries, national institutions and
federal departments) and the state agencies (Jabatan Pengairan & Saliran (JPS), Jabatan
Air Negeri Kelantan (JANK), Air Kelantan Sdn.Bhd. (AKSB) and other state
government departments).

10
1.5 PROBLEM IDENTIFICATION
In Sg.Kelantan river basin, while there have been many investments in
exploiting groundwater resources for potable use by Air Kelantan Sdn.Bhd.(AKSB) and
for irrigation purposes by Jabatan Pengairan Dan Saliran (JPS), not much attention has
been paid to monitoring the condition of the resource and assessing its sustainability in
terms of quantity and quality. Despite the obvious benefits of monitoring programs, it is
common to find that it is the first function to be cut back when financial resources are
scarce, as they are often regarded as an optional luxury that is costly and resource-
consuming. Regarding groundwater monitoring, the actual situation in the Sg.Kelantan
river basin is generally not satisfactory:
i. Groundwater monitoring has not been a system to be managed.
ii. Not much significant and systematic groundwater monitoring going on,
except on project-wise or problem-driven and for small scale monitoring
measures done by Jabatan Mineral & Geosains (JMG). In these cases,
data on groundwater levels or groundwater quality are monitored within
the framework of local and temporal projects.
iii. Until recently many monitoring networks in the region were developed
for the assessment only of the groundwater quantitative status (water
level). The quantitative aspects were the only aspects that policy makers
were interested in. Groundwater quality management became an issue
only recently.
iv. There is a lack of standard groundwater monitoring procedures and thus
datasets from different part of the region, in many cases, cannot be
compared.

11
Concerning the available information on groundwater resources in the
Sg.Kelantan river basin, there is inadequate knowledge of both the groundwater
resources and the present and forecasted demand for water. More specifically:-
i. There is a lack of detailed and reliable information on many aquifers
(e.g., dimensions, hydraulic relations, volumes of water stored in both
saturated and unsaturated zones, recharge rates, chemical composition of
water, etc.).
ii. For many aquifers, water quantity and water use data are available but
there is a significant lack of analytical information on groundwater
quality.
iii. Consistent and large data gaps can be identified both temporally and
geographically.
iv. Moreover, for many aquifers, the existing data are unsuitable, or poorly
suited, for regulatory or planning use and irrelevant to the management
process.
At general, existing data are not sufficient or reliable enough to plan regional
actions for the sustainable use of groundwater. The lack of sufficient and reliable data
causes a considerable risk of deterioration of the groundwater status, both quantity and
quality, without sufficient warning.
12
1.6 THE STUDY OBJECTIVES
The abstraction of groundwater in the area is increasing by the year, in order to
suffice the growing need for more water. An effective management system should be
installed to control the use and exploitation of groundwater, to control the quality
together with the control of land use and pollution control. Thus, the main objective of
this study is to establish a Groundwater Resource Management System (GWRM) for
the state of Kelantan to assess, control and ensure sustainable potable groundwater
supply in terms of quantity and quality. To support and realize this objective, a few sub-
objectives are to be met, as follows:
i. To define the aquifers resources of an area and watershed through a
series of verified data and maps.
ii. To conduct analysis on the available data with a systematic methodology
to ensure accurate final products.
iii. To propose a constant groundwater monitoring, evaluation and auditing.
To ensure that these objectives are achieved and to demonstrate the application of
the groundwater management system in ensuring the sustainable potable groundwater
supply, a recent survey and data gathering exercise was conducted to produce an up-to-
date modeling of the study area and later to be used in the GWRM processes of
monitoring and responding effect of the system.

13
CHAPTER 2
BACKGROUND AND PREVIOUS STUDIES
2.1 DELINEATION OF STUDY AREA
2.1.1 Geology of Kelantan
The first geological survey in Kelantan was carried out in 1922-1925
and later from 1950-1960 by Savage, followed by MacDonald, Slater and
Santokh Singh (MacDonald, 1967) The geology of Kelantan is shown in
Fig.2.1. The geological formations range in age from Quaternary to Lower
Palaeozonic and can be divided into 3 major chronological groups, i.e
Palaeozoic, Mesozoic and Quarternary (Noor, 1980) The Quaternary
deposits, consists of unconsolidated and semi-consolidated sediments,
mainly found in the coastal region of the state, believed to be deposited
since Pleistocene times while the recent deposits is the first 13 to 15 m
(Zakaria, 1970; Noor, 1980). According to C. S. Hutchison and D.N.K. Tan
14
of Geological Society Of Malaysia, the Simpang Formation is found within
the broad valley of Sg.Kelantan and its delta. Low winding ridges occur in
the south, which are wider to the west and narrower towards the east.
2.1.2 General Hydrogeology of the Northern Kelantan
The major potential area for groundwater in Kelantan is the northern
Kelantan, which is underlain by Quaternary alluvium, as shown in Fig.2.2.
This alluvium region covers area of about 1,500 km2
from total area of
Kelantan state of 14,922 km2, which is approximately 10% of the State area.
According to MacDonald (1967), the alluvium may be of marine or
fluviatile origin, but it is not always possible to differentiate the two types of
deposits. The alluvium is underlain by granitic and sedimentary or
metasedimentary bedrock, the latter consisting mainly of shale, sandstone,
phyllite and slate. The granitic bedrock occurs generally east and parallel to
the northerly-flowing Kelantan River, while the sedimentary or
metasedimentary rocks are confined essentially to the western part. The
sedimentary and metasedimentary rocks consist of shale, sandstones,
phyllite and slate occurred in the west. The thickness of the Quaternary
alluvium is from a few meters near the foot of the mountain up to more than
150 m reaching the shore. It consists of clay, sand, silt and gravels (Ang &
Ismail, 1996). There are two main aquifer systems (Saim, 1997):
i. shallow aquifer - mostly unconfined but occasionally semi-
confined, thickness normally 2-3 m and may reach up to 17.5
m. It is usually referred to as first aquifer, and

15
ii. deep aquifer - mainly confined, thickness usually more than 15
m. This deep aquifer comprises three different layers,
separated from each other by semipermeable strata of silt,
normally referred to as the second, third and fourth aquifer.
In the pumping test of a production well with screen located at 14-31
m carried out by Noor (1980) at Kampung Chap, Bachok, it is found that the
first and second aquifer systems in this area are hydraulically interconnected
as they are only separated by semi-permeable strata of silt. The pumping test
affected the drawdown of observation wells located 200 m away with screen
set at different depth of 6 , 36 and 96 m. However, in the earlier work by
Pfeiffer and Chong (1974), it is reported that pumping test carried out at the
Kota Bharu Water Works revealed no connection between shallow and
deeper aquifers. So, it could be concluded that the interconnection between
the shallow and deeper aquifer or leakage from the lower or upper aquifers
depends significantly on the lithology of the aquifer at that particular
location. Nevertheless, from the data gathered in this study strongly suggest
the significant interconnection between the upper and lower aquifer systems.

16
Fig.2.1: The Geology Map of Kelantan (Courtesy of JMG sources)

17
Fig.2.2: General Hydrogeology Map Of Kelantan(Courtesy of JMG sources)

18
The first aquifer is notably productive for abstraction in potable use
because of its high recharge rate and chemically, it is not significantly high
in organics minerals, such as iron and manganese. The second aquifer is
generally thin and does not contain the amount of groundwater for large-
scale exploitation even though in places it forms significantly thick aquifer
layer. The third aquifer is the most promising in terms of production and
also protection from potential pollution, but since its chemical contents in
the water is fairly high and difficult to treat, the preference for potable
abstraction has less priority compared to the first aquifer. The fourth aquifer
is not distributed throughout the entire region of North Kelantan Basin as it
forms the contact with the underlying granite. Generally, the aquifers consist
of interbedded medium-sized sand to medium-sized gravel as well as some
coarse gravel and the scale of interbedding varies from place to place. The
percentage of course materials generally increases with depth.
Regionally, the groundwater flows north to north-east (Pfeiffer and
Tiedemann, 1986). In the recent study carried out by Nuklear Malaysia in
2011, based on the result measured by the Colloidal Borescope System, the
groundwater flow directions dominantly flowed towards to the north-east in
the study area. However, extensive study carried out to monitor the
fluctuation of groundwater level in various layers of aquifer indicates that
the various aquifer layers actually show distinct trend of groundwater flow
direction.

19
2.1.3 The Brief Description of the Study Area
The study area located at the northern part of the state of Kelantan,
with Sungai Golok up to Rantau Panjang as the establish boundary at the
North-west; South China sea to the state boundary of Terengganu at the
North-east; and Tanah Merah and Pulai Chondong at the west of the study
area. In general, this study area is an alluvium plain with the elevation less
than 20 m (Figure 2.3).
Fig. 2.3: The Study Area (Generated from GIS AKSB records)

20
The study area, northern Kelantan, is covered by Quaternary
alluvium and underlain by granite and metasediment rocks. The alluvium
covers an estimated area of about 1,500 km2. According to MacDonald
(1967), the alluvium may be of marine or fluviatile origin, but it is not
always possible to differentiate the two types of deposits. The alluvium is
underlain by granitic and sedimentary or metasedimentary bedrock, the
latter consisting mainly of shale, sandstone, phyllite and slate. The granitic
bedrock occurs generally east of the northerly-flowing Kelantan River,
while the sedimentary or metasedimentary rocks are confined essentially to
the west part. In general, granitic rocks are found in the east and towards the
north and are parallel with the Kelantan river. While sedimentary and
metasediment rocks that consist of shale, sandstones, phylite and slate are
spotted in the west.

21
Fig. 2.4: The Fence Diagram of Aquifers In The Study Area (Courtesy of JMG sources)
Quaternary alluvium has the thickness from a few meters near the
foot of the mountain up to more than 150m reaching the shore. It consists of
clay layer, sand, silt and gravels (Ang & Ismail, 1996). Fig. 2.4 shows the
different thickness of aquifers in fence diagram of the study area.

22
In the aspect of the lithology of the alluvium layer, it is highly
variable horizontally and vertically due to the processes of deposition. The
permeability figures ranges from 28 to 337 m/d with an average specific
yield value of 0.06.
2.1.4 Landuse
The relation of landuse, landuse changes and ground conditions have
to be analysed to gauge the changes in groundwater effects.
Geomorphology, landuse, depth to water table, water level fluctuation and
land degradation will be prepared on field data and to be used in simulation
of groundwater model.
The current landuse for state of Kelantan is illustrated Fig. 2.5,
where the built-up area and cleared land constitute only about 18%,
agricultural use at about 38.5% and forest land with more than 42%, with
other use constitute the rest.
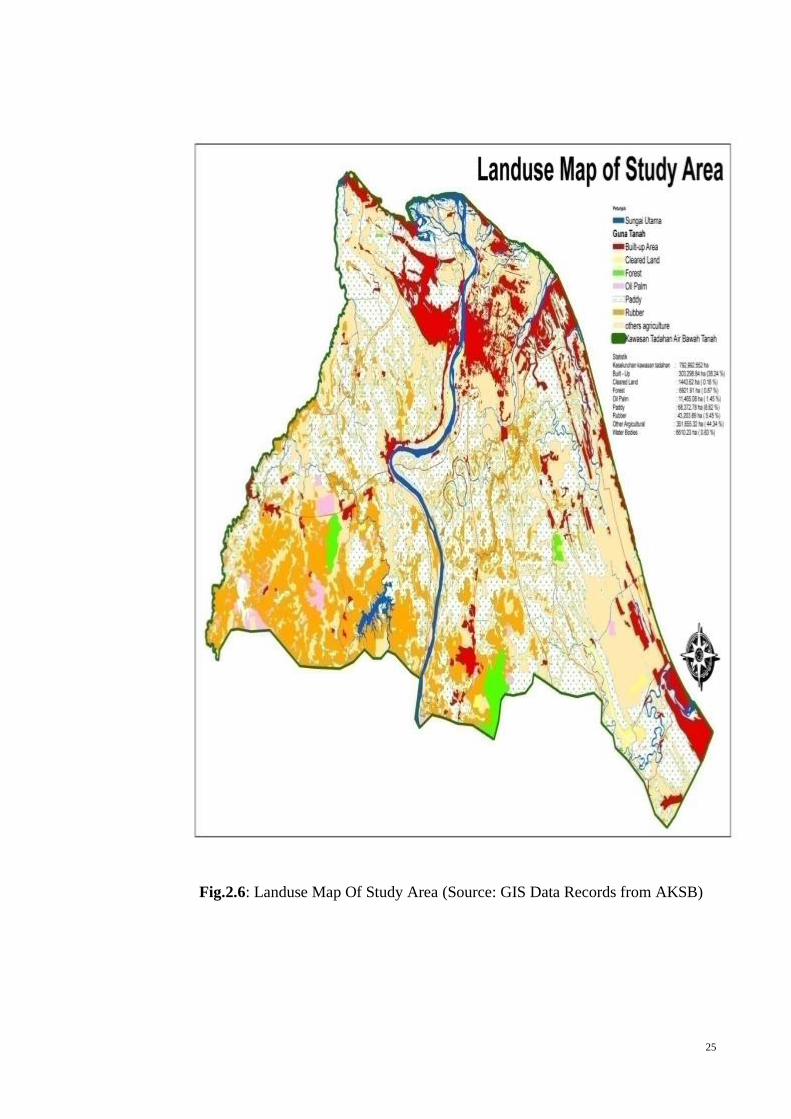
For the study area, the landuse map is shown in Fig. 2.6. The largest
landuse is agricultural use with about 60% of the area, while the built-up
area at 38.24% and water bodies of 0.83%. With the large built-up area, it is
anticipated that the geophysical works using SkyTEM method will be
difficult and requires more correction to the data received from the surveys.
It can also be said that the agricultural activities with its large landuse have
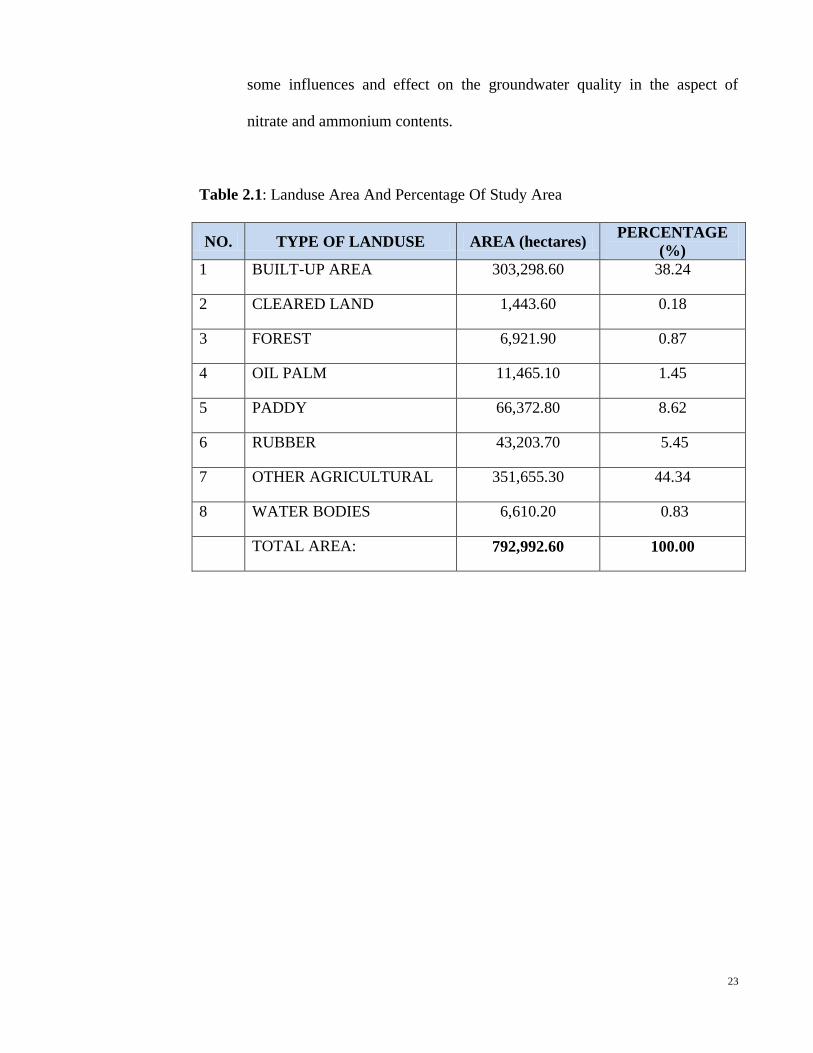
23
some influences and effect on the groundwater quality in the aspect of
nitrate and ammonium contents.
Table 2.1: Landuse Area And Percentage Of Study Area
NO. TYPE OF LANDUSE AREA (hectares) PERCENTAGE
(%)
1 BUILT-UP AREA 303,298.60 38.24
2 CLEARED LAND 1,443.60 0.18
3 FOREST 6,921.90 0.87
4 OIL PALM 11,465.10 1.45
5 PADDY 66,372.80 8.62
6 RUBBER 43,203.70 5.45
7 OTHER AGRICULTURAL 351,655.30 44.34
8 WATER BODIES 6,610.20 0.83
TOTAL AREA: 792,992.60 100.00

24
Fig. 2.5: Landuse Map Of Kelantan State (Source: GIS Data Records from AKSB
25
Fig.2.6: Landuse Map Of Study Area (Source: GIS Data Records from AKSB)

26
2.2 GROUNDWATER USAGE
In Malaysia, groundwater resources are underutilized. The use of groundwater
for domestic purpose is mainly confined to rural areas. Especially in Kelantan and
Perlis, groundwater is being significantly utilized for potable water supply.
Groundwater is treated before bottling in the mineral water industry. For industrial
purposes, groundwater is usually utilized in cleaning and cooling. Groundwater
utilization for agricultural purposes is not very well developed and is normally confined
to isolated agricultural areas or areas outside the many irrigation schemes. In theory,
ground water resources have not yet been fully developed through exploration and
research for maximum utilization of the precious resource.
For the state of Kelantan, groundwater is fully developed for potable use since
1935, taking the advantage of the rich groundwater alluvial basin especially in the north
region of the Kelantan. The public water supply in Kelantan is handled by Air Kelantan
Sdn.Bhd.(AKSB), through a concessionaire agreement with the State government and is
responsible for the development, operation and maintenance of the groundwater water
supply system in the state. Since then, Kelantan has been the largest groundwater
operator in Malaysia. In the northern region, which comprises of Kota Bharu, Bachok,
Pasir Mas and Tumpat district, most of the locals have their own indigenous private
wells which is shallow, hand-dug and usually open type wells. Private wells
predominate in the sub-urban and rural areas in the region where potable water is
unavailable. But the expansion programme to extend the coverage of potable water in
the state done by AKSB, have significantly made most of these private wells being
abandoned or are left as supplement use during a crisis. Outside the northern region,

27
groundwater availability is limited the certain pocket areas, namely Pasir Puteh
(alluvium), Kuala Krai/Gua Musang (volcanic rock) and Jeli (igneous rock), yet to be
develop and exploited. Other usage of groundwater such as agricultural purposes is
prevalent for the agricultural schemes like the Kemasin-Semarak projects, the Kandis
resettlement scheme and the Bendang Pauh, Meranti and Sri Pinang irrigation schemes.
Groundwater explorations in Kelantan has been under the jurisdiction of Jabatan
Mineral dan Geosain (JMG), known then as, Geological Survey Department (GSD), and
have assisted the Public Works Department (which was responsible for water supply
before AKSB), to construct the first tube well (first generation wells) in 1935. These
wells were in operation until 1979 when they replaced by the next generation wells,
known as Second generation Wells. Before the construction of the second generation
wells was carried out, a large scale study and systematic investigation was carried out
between 1974 and 1977 by GSD with the professional assistance of the German
Hydrogeological Survey Mission. Based on these survey and study, the forecasting of
future water demand and proposed development programme was made available and
works were underway in the 4th
Malaysian Plan. The second large scale study was
carried out by Syed Muhammad, Hooi and Binnie, which include field investigations
and site survey, between the year 1984 and 1986. The study was further developed by
Sepakat Setia Perunding in 1990. The result of the these studies was the cornerstone of
the recently developed water treatment works and construction of new generation wells,
known as Third generation wells.
The demand in groundwater for potable use has risen steadily over the last 30
years. The groundwater production was 36.37 MLD in 1981, increased to 45 MLD in
1984 and was 65 MLD in 1989. During the years 1986 - 2000, there was not any

28
significant development project that was carried out and as a result, the water supply
went acute to meet the water demand. Concurrently, the production from the plants also
dropped to 57 MLD in 1990 with a slight increase to 66 MLD in 1993. This
phenomenon was due to over pumping of water in the existing tube wells to cope with
the water demand that had made the performance of the tube wells went bad to worst.
Under the Bekalan Air Kelantan Utara (BAKU) project implementations in 1993, 72
nos. new Third Generation wells were constructed which had a total abstraction of
115.6 MLD. With these new wells constructed and taking into accounts the 51 nos. old
wells in operation, the total group capacity of these tube wells are 184.35 MLD. Only in
2003, when the construction of new treatments plants in 8th
Malaysian Plan were
implemented and completed, the third generation tubewells were fully utilized and
groundwater are being abstracted to be fully treated before supplying to the public. The
production of groundwater in 2003 was 114 MLD. In 2009, the total groundwater
consumption is 134 Ml/d, which constitutes about 41% of the total water production in
AKSB’s water treatment plants. The demand for groundwater in potable use is at 145
Ml/d in 2010, as fresh groundwater supply is obtained from 91 numbers of active
production wells located at 13 well-fields. Groundwater for these all well-fields is
drawn from shallow aquifer system except in Tanjung Mas and new wells at Pintu Geng
and will increase at pace of 2.5% per year (W Ismail, 2009). The total production of
potable water from groundwater sources from the year 1990 to 2010 is shown in Fig 2.7
and the total groundwater abstraction from well-fields in study area is shown in Table
2.2. The locations of existing well-fields and treatment plants is shown if Fig. 2.8.

29
Fig 2.7: The total production of potable water from groundwater sources (1990-2010)
(Source : Air Kelantan Sdn Bhd Data Records)
30
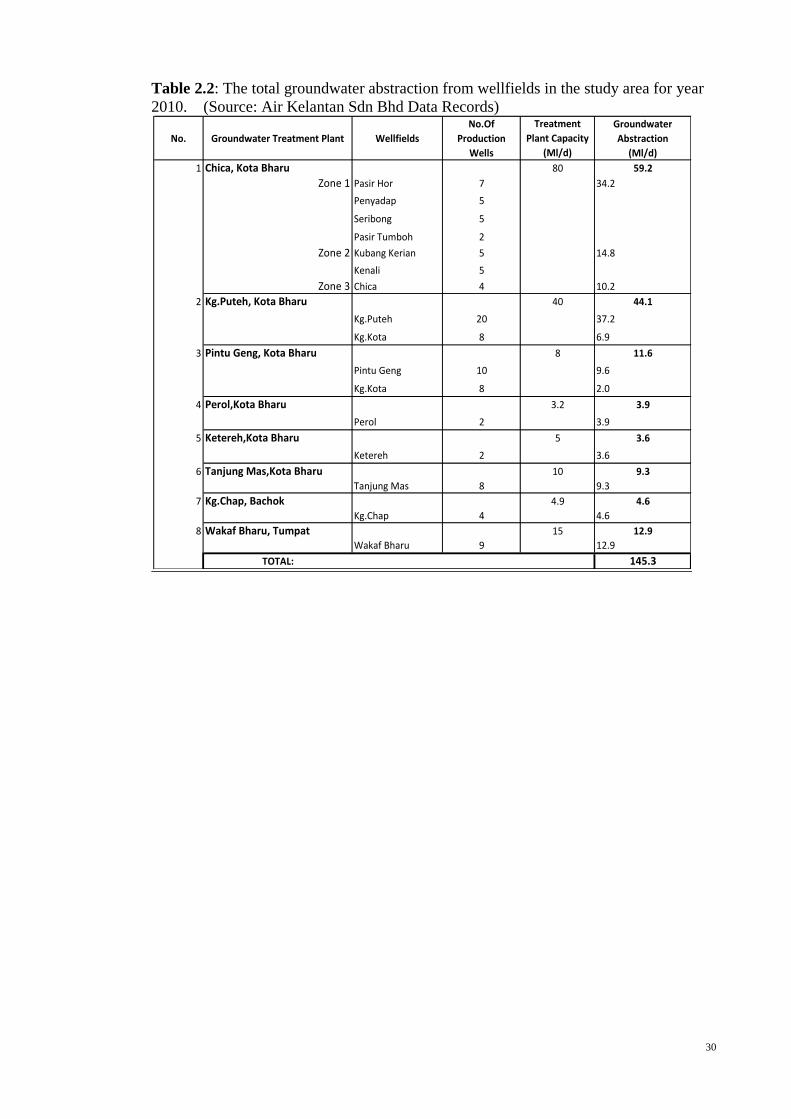
Table 2.2: The total groundwater abstraction from wellfields in the study area for year
2010. (Source: Air Kelantan Sdn Bhd Data Records)
No. Groundwater Treatment Plant Wellfields
No.Of
Production
Wells
Treatment
Plant Capacity
(Ml/d)
Groundwater
Abstraction
(Ml/d)
1 Chica, Kota Bharu 80 59.2
Zone 1 Pasir Hor 7 34.2
Penyadap 5
Seribong 5
Pasir Tumboh 2
Zone 2 Kubang Kerian 5 14.8
Kenali 5
Zone 3 Chica 4 10.2
2 Kg.Puteh, Kota Bharu 40 44.1
Kg.Puteh 20 37.2
Kg.Kota 8 6.9
3 Pintu Geng, Kota Bharu 8 11.6
Pintu Geng 10 9.6
Kg.Kota 8 2.0
4 Perol,Kota Bharu 3.2 3.9
Perol 2 3.9
5 Ketereh,Kota Bharu 5 3.6
Ketereh 2 3.6
6 Tanjung Mas,Kota Bharu 10 9.3
Tanjung Mas 8 9.3
7 Kg.Chap, Bachok 4.9 4.6
Kg.Chap 4 4.6
8 Wakaf Bharu, Tumpat 15 12.9
Wakaf Bharu 9 12.9
TOTAL: 145.3

31
Figure 2.8: Location of Groundwater Well-fields and Treatment Plants
(Courtesy of JMG sources)
2.3 PREVIOUS STUDY AND EXISTING GROUNDWATER MONITORING
A systematic investigation was carried out between 1974 and 1977 by GSD with
the professional assistance of the German Hydrogeological Survey Mission, covering
coastal alluvial areas in Kelantan, Terengganu and Pahang. This was followed up with
another programme of groundwater investigations during the Third Malaysia Plan
(1976-1980), for the states of Kelantan, Terengganu, Pahang, Kedah and Perlis
successfully carried out by the GSM together with the same German Hydrogeological
Mission. Before that, a hydrogeological map for Peninsular Malaysia on the scale of
1:500,000 has been prepared by Chong and Pfeiffer (1975). A series of hydrogeological

32
activities in Peninsular Malaysia is done by Chong and Tan (1986). Areas covering the
North Kelantan River Basin have been studied by GSM, which include works by Chong
et al. (1976) that covers the area of Tumpat district, on the western bank of the Kelantan
River. This study found a significant amount of exploitable groundwater sources from a
number of wells in the investigated area that would be able to meet the demand of
Tumpat district. This particular work has also identified the presence of up to four
major aquifer layers in the Quaternary alluvial sequence, known as firstly, second, third,
and fourth aquifers. In 1976, Sidhu and Pfeiffer carried out an investigative works on
the western bank, which include the construction of two wells in the first aquifer to
supply the village of Pengkalan Kubor. Pfeiffer and Sidhu (1977) carried out to
investigate to supply groundwater for a water supply scheme in Wakaf Bharu, with
requirement of 3.0 Ml/d. A hydrogeological investigation on the groundwater potential
of the alluvial plain west of Kelantan River has been carried out by Ang and Kwan
(1980). A considerable numbers of water wells were constructed during this
investigation tapping groundwater from the first and second aquifers for the rural water
supply scheme. This investigation has also contributed significantly towards
understanding the hydrogeological characteristic of the area. Hydrogeological
investigations to examine the potential of groundwater from the shallow aquifer were
carried out by Mohd. Nazan (1985a) and Abdul Rashid (1989a).
Whereas, the investigative works on the eastern bank of the Kelantan River
Basin are basically concentrated around the Kota Bharu area. These include, the works
carried out by Chong et al. (1974), for the water supply scheme in the Kota Bharu and
Kubang Kerian area, in which revealed the thickness of the first aquifer is between 15-
18 m, overlain by 1.2-1.5 m of clay layer. The second aquifer is only 3 m thick (at 27-
30 m depth) and the thickness of the third aquifer which is believed to overlie the

33
granitic rock is not known but is at least 15 m. Thin layers of silt and clay separate the
three aquifers. An assessment on the immediate water requirement at the particular time
and a proposal for the future water abstraction system was prepared by Pfeiffer and
Chong (1974). A study made by Ang and Kwan (1978) on the groundwater potential of
the Kampong Panji area, Kota Bharu, has revealed that the first aquifer is overlain by
impermeable/semi permeable layer of silt and clay with thickness ranging from 20-34 m
thickness of the first aquifer is from 8-30 m, while the second aquifer averages l0m
thick. The third aquifer exceeds 30 m in thickness. Porosity values from the tests carried
out on the samples taken from the first and second aquifer lie in the narrow range of
14.5-15.5%. Abdul Rashid (1989b) carried out an investigation to study the lateral
extension of the first aquifer in the Kampong Puteh of Kota Bharu district.
Further works carried out on the eastern bank are of, Doll Said (1984), which
located sufficient amount of groundwater supply for a small community using 38 mm
diameter well-point systems from the first aquifer which is 2-3 m thick and Mohd.
Nazan (1985b), who carried out an exploration study on the availability of groundwater
for domestic use and tobacco cultivation in Pasir Putih area, while Abdul Rashid
(1989c) carried out an investigation on the possibility of increasing groundwater supply
from 2.9 Ml/d to 4.1 Ml/d from the Kampong Chap and Jelawat waterworks.
Using radio isotopes, Khoo (1979) prepared a proposal for the use of the
isotopes in the groundwater studies in Kelantan. In a proposal to carry out groundwater
monitoring works in the Tanjung Mas wellfield, Bina Runding Sdn. Bhd. (1986), it is
found out that the principal threats identified were saline water intrusion from the South
China Sea and pollution potential from urban and industrial developments such as Batik
Industries around the area.

34
In another study made by Noor (1980) on the extent of aquifer distribution
within the Kelantan Coastal Plain, has provided an appraisal of the groundwater
resources and a guide to their distribution and their order of magnitude to form a basis
for regional groundwater resources development. A hydrogeological model has been
constructed and verified, to provide initial assessments of the groundwater potential in
the area studied. In the study, Noor (1980) concluded that the Sg. Kelantan river basin is
a plain of extensive highly transmissive but anisotropic aquifers which are largely
unconfined layer. Due to the process of deposition, the lithology of the alluvium in the
area is highly variable horizontally and vertically. The permeability value is in the range
of 28 to 337 m/d, with an average specific yield value of 0.06. Noor (1985) made an
assessment based on available information at that time and estimated the through flow
of the Northern Kelantan aquifer to be 174 MCM/year (~483 Ml/d). Greatest through
flow is in the shallow aquifer due to higher transmissivity and the suggested allowable
exploitation of groundwater at 54 MCM/year (~150 Ml/d).
The application of the concept of conjunctive use of ground and surface water
was initiated by Afzal Hossain (1989). A conjunctive use model of surface and
groundwater was developed to study both the ground and surface water resources
availability in the coastal area of Sg. Kelantan river basin, which predicted that
optimum combination of resources comprising of surface reservoir with active storage
capacity of 50.0 MCM, groundwater pumping capacity of 15.0 MCM/month (~500
Ml/d) and a canal capacity of 100.0 MCM/month (~3,333 Ml/d) are required to meet the
future total dry period water requirement for two major agricultural schemes (Kemubu
and Kemasin-Semerak Projects) in the area. An estimation of the optimum yield of
groundwater system is to be 72.25 MCM/year (~200.7 Ml/d).

35
Tan and Singh (1989) have carried out an investigative work to evaluate the
groundwater resources that would suffice to the water supply demand of the Northern
Kelantan until the year 2000. It is proposed to utilise both shallow and deep aquifers to
provide raw water supplies of up to 172 Ml/d until the year 2000 for Kota Bharu and
Bachok districts, and the shallow aquifer of Wakaf Bharu should be able to supply 22.8
Ml/d for the district of Tumpat. A proposed wellfield in the Pasir Puteh district can
contribute 10 Ml/d, to meet the projected demand for the year 2010. The utilisation of
the shallow aquifer is the best option for further development as it is readily recharged
and wells are shallow (less than 20 m deep), giving rise to competitive construction
expenditures and lower pumping costs.
The Environmental Impact Assessment (EIA) carried out by Sepakat Setia
Perunding (1990) in the Northern Kelantan, suggests that the shallow aquifer can
provide the cheapest source of groundwater in terms of construction and operational
costs. Nevertheless, the EIA has also identified potential adverse long term impacts
from the additional groundwater exploitation namely, drying up of existing domestic
and agricultural groundwater wells through the lowering of the groundwater table,
lowering of water table will lead to land subsidence, reduction of soil moisture content
in agricultural soils, groundwater abstraction will lead to reduction of groundwater flow
into the river, and during the dry season water from the river will be drawn into the
groundwater system, thus introducing contamination to the aquifer, inland movement of
the fresh / saline water interface and introduction of groundwater vertical leakage
among the various aquifer layers in the system which may transfer contamination from
the shallow to the deeper aquifer.

36
In the study of Nawang (1988) for the river-aquifer interrelationship in North
Kelantan, revealed that the recharge from the river into the aquifer varies from 0 to a
maximum of 8.54 m3/d per meter width of the Sg. Kelantan river. The recharge varies
with the river water level and groundwater level in the aquifer. Awadalla and Noor
(1988) initiated a digital model to study the estimated recharge value to the saturated
zone along the length of the aquifer. A two dimensional numerical groundwater model
has been developed by Awadalla et al. (1989) for simulation of current and future
groundwater development in the area.
A fresh/saline interface model using a Galerkin finite-element method was
developed by Nawang and Kishi (1990) to investigate potential salt water intrusion
resulting from the present groundwater pumping from the third aquifer in Tanjung Mas.
There is a significant time difference between water level decline and movement of
fresh/saline water interface, with the interface responding very slowly. Abstraction of
11,000 m3/d resulted in a rapid drawdown in water level, but the toe of fresh/saline
interface moved inland only by 250-500 m over 30 years.
Abdul Rashid (1990) has carried out a pilot groundwater monitoring system
consisting of nineteen 75 mm diameter wells, was installed by the depth of wells ranges
from 30-130 m. Five wells each are located in Kota Bharu and Pengkalan Chepa, and
nine wells are in Tanjung Mas area. At present, there are 69 wells which are parts of the
monitoring system, where the additional monitoring wells were installed by Ismail
(1992; 1993a). Periodic sampling and analyses of groundwater, and measurements of
head are being undertaken as part of long-term groundwater surveillance programme to
monitor and manage the groundwater resources of the area.
37
According to Mohammed Hatta et.al. (2001), the groundwater monitoring work
was initiated by the Geological Survey Department (GSD) in 1989 (now known as The
Department of Minerals and Geoscience (JMG)) when a network of monitoring wells
was designed and built to monitor the groundwater regime in the Sungai Kelantan delta
in north Kelantan. Initially, the monitoring wells were located in the northern part of the
delta, subsequently the network was expanded to cover the entire alluvial aquifer
system in the area. In addition to the monitoring wells constructed by the GSD, some 20
abandoned JKR wells were rehabilitated and added to the monitoring system. The
monitoring network established in Malaysia such as in the northern Kelantan area
represents a regional system designed to monitor changes in the groundwater regime
over a regional scale. While for DOE, it is designed to detect point sources of
contamination, such as from waste disposal sites of a localised nature.

38
CHAPTER 3
SCOPE AND METHODOLOGY
3.1 RESEARCH CONCEPTUAL FRAME WORK
3.1.1 Hydrogeological Assessment
In order to understand the nature of various hydrogeological
characteristics of the study area, an assessment exercise was carried out
based on the available data and taking into account the varying factors
and conditions attached to groundwater system. Various parameters were
studied, such as hydraulic conductivity, permeability, aquifer thickness,
barrier boundary conditions etc., since these parameters are vital for the
progress of the research. Identification of hydrogeological and geological
conditions governing the flow system, abstraction patterns, pollution
potentials and climate changes prediction were also studied.

39
3.1.2 Groundwater Flow Simulation
Applications of groundwater models will have to be developed in
order to assess the groundwater flow, contaminants transport and aquifer
effects. In this particular study, only mathematical modeling would be
carried out using the most suitable software Visual MODFLOW. This
modelling exercise would able to verify the representation of the real
system in the modeled area. For this study, the purposes of modelling
are:-
i. To better understand of the specific small area and larger
regional groundwater flow system from the idealisation of
the aquifer system in the study area.
ii. To simulate the flow characteristics and the future
changes caused by variable discharges and climate
changes in the study area.
The hydrogeological models can therefore be used in assessing
the impact of changes of the groundwater system, setting up and
optimising monitoring networks, and setting up groundwater monitoring
system. The finding of the modeling work will enable the water operator
to sustainably manage the groundwater resources.

40
3.1.3 Groundwater Resources Management (GWRM) System
The management of monitoring aspect of the Groundwater
Resource Management System would be based on the SCADA and
telemetry system. The transmitted data is automatically processed by
application software, so that data that exceeded limit values/standards
could be highlighted and an alarm alert system will be triggered.
WebPages with template for data retrieval and data management
will be displayed on a web based system. The website would display all
relevant data creating a good overview and shall function as a portal for
the GWRM System giving all relevant staff in the agencies, an easy
access to the data and newly updated information.
3.2 LITERATURE REVIEW AND DATA COLLECTION
In the early part of the research, few selected literature related to the present
study were reviewed and analyzed, to include the followings:-
i. Well Data
The existing well data which include historical water quality samples
results were collected and evaluated before further use. These include
data for production wells of AKSB and JKR, and for monitoring wells of
JMG, DOE, NAHRIM and JPS.
ii. Geophysical Data

41
The geophysical data were gathered from the previous geophysical
survey results and were evaluated in regards to data acquisition, data
interpretation, methodology etc. Inaccurate data will not be used in the
study.
iii. GIS Data
AKSB has installed and use ArcGIS ver. 9.3 in its mapping system and
has helped tremendously in putting this research into a better
prospective. The evaluation and data cleaning process need to be carried
out before it can be used in the GIS application, in order to ensure the
quality and accuracy of the collected GIS data.
3.3 GIS APPLICATION
Water resources engineering is concerned with the analysis and design of
systems to manage the quantity, quality, timing and distribution of water to meet the
needs of human societies and the natural environment (Chin 2006). GIS can help with
the groundwater modeling process by coordinating data collection, providing
comprehensive database management, supporting systematic model parameter
assignments, conducting spatial analysis functions, and displaying model results in
understandable color-map formats (Johnson 2008). The list of varieties GIS operations
supportive of groundwater modeling processes, as illustrated in the table 3.1.
Table 3.1: GIS Operations Supportive of Groundwater Modeling (after Johnson 2008)
Data Management:
Database of spatial data keyed to location and depth
Capture of archived site inventory data and conversion to GIS formats

42
Collation of aquifer attributes data on hydrogeologic factors,
hydrology and quality
Design of model grids and mesh
Automatic formulation of model input data
Visualization of input data for error checking and consistency
Statistical interpolation to assign field data to aquifer extent
Groundwater System Modeling:
Establishment of aquifer model boundary conditions
Systematic assignment of model parameter
Interactive model simulations
Sensitivity analysis aided by GIS-based parameter changes
Model Output Review:
Display of model outputs in color-coded map
Map and graphical comparisons of aquifer simulation results with
field calibration data
Model reporting and archive
All the land-based maps i.e. road, river, drainage, contour, geological, land use
and landcover, etc were acquired from the relevant agencies i.e Jabatan Ukur dan
Pemetaan Malaysia, Jabatan Pengairan dan Saliran, Jabatan Perancang Bandar dan
Desa, etc. As required, those relevant land maps were converted to the chosen GIS
software format.
43
3.4 SOFTWARE APPLICATION
SCADA (Supervisory Control And Data Acquisition) system software is
required for data acquisition, access and storage. The SCADA system overall blueprint,
including its system architecture, the full-fledged functionalities of all equipment in the
system, the establishment of the database of the system, the architecture of the backhaul,
to form an establishment of a comprehensive SCADA system in providing the relevant
information to be integrated with other components of the Groundwater Resource
Management System (GWRM). It is anticipated with proper integration with other
major component of the GWRM, it will provide sufficient information for the
management in identifying its direction and taking necessary steps in either to maintain
the current system and production of groundwater or to decide whether to use other
resources for instance surface water and when.
The other software usable in this GWRM is the modeling of the study area by
the application of Visual MODFLOW software. Groundwater modeling is
accomplished by using MODFLOW a modeling program developed by the USGS. This
is the most widely used finite-difference groundwater model and considered a standard
for groundwater modeling. The development of input files are compiled using Visual
MODFLOW a commonly used pre-processor of data that is used to speed up and
facilitate the development of the MODFLOW model. Development of a MODFLOW
groundwater model also facilitates the use of MODPATH and MT3D, which is a USGS
modeling program that extends MODFLOW for analyzing particle tracking and
pollution movement. A 3-dimensional representation of the study area was created in
Visual MODFLOW.

44
3.5 SCADA AND TELEMETRY
Wireless monitoring systems which can effectively assist management of water
companies with efficient data management and cost effective. This is crucial as wireless
monitoring system provides:
i. Relatively low technical manpower and less expensive human capital
requirement.
ii. Relatively low cost of equipments and monitoring tools.
iii. Effective standard operating procedures.
iv. Consistently monitoring and providing real time data with low marginal
error.
v. Historical data and trends for future water management studies and
planning.
With excellence telecommunication infrastructure, Kelantan can provide the
wireless monitoring system for the whole area. With the right technology adoption, the
locals can minimize the dependency on foreign technologies, which involve huge
investment and high maintenance cost. Wireless monitoring system or SCADA is
generally referred to as industrial control system that usually consists of:-
i. Communication Backhaul Protocol
ii. Device Controller
iii. Remote Terminal Units
iv. Computer Database Center
v. Interfacing software (HMI)

45
3.6 DATA MANAGEMENT SYSTEM
A proper Database Management System (DBMS) has to be installed in order to
cater for large amounts of data that will be acquired every day. The DBMS, including
GIS, has to be designed for handling all kind of data types (water levels, water quality,
pumping capacity, geophysical data, etc). The database integrates collection of data
records, files, and other database objects needed by an application and allows different
user application programs to concurrently access the same database.
Detailed data acquisition program required for the successful implementation of
the study and provide expertise to acquire the followings:-
i. Various elements of information for conceptual model such as water
abstraction and contaminant sources,
ii. Geophysical Survey of aquifers for regional area and ground geophysics
for local/priority areas,
iii. New and Existing Wells
- Detailed work program (elevation measurements, well logging
program) for new and existing wells to be drafted.
- A procedure for construction of new wells with pumping tests to
be created,
iv. Water Quality Analysis, and
v. Procedures together with the water quantity analysis, to be prepared
for:-
- Water level recording including surface and ground water
- Setting spatial minimum water level, h (x,y,t) criterion function
- Setting up abstraction rate criterion Q (x,y,t)

46
3.7 CREATION AND CALIBRATION OF HYDROGEOLOGICAL MODELS
In general, conceptual models are approximations that describe physical systems
using mathematical equations. Mathematically the model represents a simplified version
of a hydrogeological system, reasonable alternative scenarios can be predicted, tested,
and compared. The applicability or usefulness of a model depends on how closely the
mathematical equations approximate the physical system being modeled. In order to
evaluate the applicability or usefulness of a model, it is necessary to have a thorough
understanding of the physical system and the assumptions embedded in the derivation
of the mathematical equations. Applications of groundwater models have been
developed in order to assess the groundwater flow, solute transport, heat flow and
aquifer deformation, and they include physical scaled model, analogue models and
mathematical models (Fetter, 1994). In this particular study, only mathematical
modeling would be carried out using the most suitable software available in the market,
namely Visual MODFLOW.
The modeling exercise is expected to be able to verify the representation of the
real system in the modeled area. For this study, the purposes of modeling are:-
i. To improve the understanding of the specific small area and larger
regional groundwater flow system from the idealisation of the aquifer
system in the study area.
ii. To predict by simulation processes in the flow characteristics and the
future changes caused by variable discharges in the study area.

47
Application of these groundwater models include water balance, gaining
knowledge about the quantitative aspects of the unsaturated zone, simulating of
groundwater flow and chemical migration in the saturated zone including river-
groundwater relations, assessing the impact of changes of the groundwater regime on
the environment, setting up and optimising monitoring networks, and setting up
groundwater protection zones. The finding of the modeling work will enable the water
operator to sustainably manage the groundwater resources.
3.8 GROUNDWATER RESOURCE MANAGEMENT SYSTEM
The monitoring aspect of the Groundwater Resource Management System
would be based on the SCADA system. Each relevant monitoring well would be
equipped with the appropriate instruments to transmit daily data to a server. The data is
automatically processed by application software, so that inaccurate data and exceeded
limit values/standards could be highlighted.
WebPages with template for data acquiry and data management will be
displayed on a website. Furthermore, a notification/alarm would be sent to relevant
agencies if limit value/standards have been exceeded. The website would display all
relevant data creating a good overview and shall function as a portal for the GWRM
System giving all relevant staff in the agencies, an easy access to the data and newly
updated information. The system has to be designed in order to assist groundwater
management and administration in:-

48
i. Wireless data collection and able to reduce data errors that may cause
faulty alarms or supersede limits to groundwater management in
providing clean and undisrupted water supply,
ii. Extraction of statistical data, by means of analysing historical data, that
will ensure the right data to be used for remedial and long term water
supply planning,
iii. Ensuring close monitor on ground water extraction performance, thus
insuring the sustainable values and eliminating the potential water supply
failure and disruption,
iv. Utilising state of the art infrastructure, that will ensure the future success
of ground water sustainable supply, and
v. Minimizing the capital investment cost in short term and long term basis.
Each water production site, i.e groundwater wellfields, will be able to send
information indicating real time ground water level. The water level study is a very
important data which provide:
i. The rate of water level recovery from different production flow rate,
ii. Actual ground water performance of certain areas, and
iii. Actual ground water level behaviour due to external factors such as river
level, nearby.
The integration exercise of the study would able to produce the list of the
necessary requirement, specification and integration of the user-friendly system that
would allow the water operator, AKSB to continue to provide safe, clean drinking water
to the public sourced from the ground. Therefore a detail plan is produced to provide a

49
reliable and stable SCADA system capable of transmitting real time data to provide
information as in table 3.2:-
Table 3.2: Information related to SCADA
Based on this information, an optimal management strategy for each production
well can be set up daily. The minimum recharging time step for a day is established
while the infiltration rates is kept constant, which fluctuates seasonally and changes
throughout the year. The phenomenon of climate change can also be adapted in the
groundwater management.
No Information Activity Results
1. The size of the aquifer
(volumetric value of
ground water).
Pumping the water out
from the ground to
certain water level.
The volume of water
(V/t) will be calibrated
and the time requires
to meet certain water
level (L/t) will be
recorded.
2. The recovery rate from
specific well.
Recording the water
volume extracted over
time.
The water volume
over time is V/t and
the water level is L,
The recovery rate =
[(V/t)2/L2 ] –
[(V/t)1/L1 ]
3. The potential total
water well production
capacity
Doing several specific
volumetric pumping
over a specific period
of time.
The recovery rate per
day (WR) is recorded
over a specified time.
4.
Water level that has
decreasing water
quality.
Specific water level
pumping is recorded
and water quality
sample will be taken.
Each of the water
levels will be recorded
and the water quality
test will be recorded
on that specific water
level.
5. Water well actual
capacity.
After getting all the
information, the
system software can
provide a summary
report.
Actual potential
capacity = bad Water
Level (LB) – Potential
Water Well capacity
(PWC).

50
When a groundwater standard is reached or exceeded at a point of standards
application, the water authority shall initiate a response. The proposed response to
include:
i. The timeframe of commencement and conclusion of the action;
ii. A plan for continual reporting to the custodian agency, the effectiveness
of the ongoing action;
iii. The estimated costs of implementation; and
iv. A plan for public notification of the proposed response.
If is required for a response to address a violation of a groundwater standard(s),
then authorities to be notified, as follows:-
i. That the action was successful in achieving the objectives of the
response; or in the event the original response was inadequate.
ii. Submit a report to the authorities addressing the cause of and
significance of the inadequacy, and propose an alternative response.
From time to time, it is required to improve the data collection systems.
Monitoring systems provide specific data, namely the data that the systems are designed
to produce. Information needs may change over time. Changed information needs in
turn necessitate adjustments in the data collection system.
The monitoring cycle (Fig.3.1) will eventually come into effect and suggests that
the process of monitoring and assessment should principally be seen as a sequence of
related activities that starts with the definition of information needs and ends with the
use of the information product (UN/ECE Task Force on Monitoring and Assessment).

51
Figure 3.1: Monitoring cycle (after UN/ECE Task Force on Monitoring and
Assessment 2002)

52
CHAPTER 4
RESULTS AND DISCUSSIONS
4.1 TASK IMPLEMENTATION AND WORK PLAN
The basis of this work plan is referred to the objectivity of the study mentioned
before. The tasks identified for the implementation of this plan are:-
i. Data collections and evaluation,
ii. Spatial data management design,
iii. Field geophysical investigation plan,
iv. Monitoring wells development plan,
v. Raingauge and stickgauge establishment plan,
vi. SCADA system establishment,
vii. Creation and calibration of hydrogeological models, and
viii. Groundwater monitoring system operation plan.

53
4.2 DATA COLLECTION AND EVALUATION
The basis for data collection and evaluation in this study was centred on the data
gathering and review of information on site, i.e at the wellfield, geophysical data, the area
physical and built environment, and socio-economic information available from the study
area. Data collection comes from various fields, such as wells data, geophysical data and
biophysical resources data.
The data will be stored and managed in databases, before it can be prepared to
house all data collected from drawings, documents, and other records in systematic domain.
Data would be classified and organised for efficiency and easy retrieval according to
several lists of attributes and there should be amended following completion of need
analysis. The database server would be selected based on the amount of data involved, the
type of data to be stored and the type of retrieval system to be implemented.
4.2.1 Well and Well-field Data
The data from past studies and development records of production wells or
monitoring wells would be gathered and screened for its reliability and accuracy of
the data. The data was collected from various agencies, namely AKSB (then
JBA/JKR), JMG, DOE, and consultants/contractors, that were involved in most of
the construction works of the wells and some reports were prepared dated 40 years
ago.

54
Elements information, such as the exact well location, well depth, elevation
and numbering system needed for the data collection, was found to be incomplete
and missing from some records. Some other previous data on drilling activities,
details of exploration wells and pumping tests were not updated and safe kept and
thus has caused some limitations on compilation and analysis of the hydrogeological
data. The amounts of data were limited and difficult to obtain from various agencies
and departments such as JMG, AKSB Sdn. Bhd., and DOE. There were no official
collaboration in data sharing among the various agencies, except mutual
understanding in giving out data for departmental use. Consequently, the data
collection exercise were time consuming more than expected, as data has to be
salvaged and searched from these agencies. Most wells sites were revisited to carry
out new survey works.
The list of wells at the wellfields are listed in Appendix A. There are a total
of 164 wells out of which 105 wells are production wells and 59 wells are
categorize as monitoring wells. The production wells are located in 13 well fields
and all wells are actively in service, except for Kg.Teluk wells which are domant at
the moment of time and 18 wells that are closed or unused, as shown in Appendix
B.1- B.14. While the monitoring wells are mostly managed by JMG, NAHRIM and
DOE for their routine water level and quality monitoring and data gathering
exercises.

55
4.2.2 Geophysical Data
The geophysical data will be useful in the model creation and simulations
for the settings of parameters in boundary conditions and characteristics. A number
of geophysical investigations were carried out in study area in the years 1970s to
produce aquifer resources mapping and hydrogeological study results and wells
construction. Not many wide-scale geophysical investigations were carried out,
except for the Geoelectrical Investigation done by Prof.Dr.H Flathe, from BGR in
collaboration with German Hydrogeological Mission in 1974 to produce aquifer
resources mapping and hydrogeological study results for wells construction. The
Appendix D, shows the the excerpt report of results of the surveys.
The data collection and examination could include those available from
survey done by the German Hydrogeological Missions and later investigations by
JMG (the then GSD) and others.
The parameters setting for boundary conditions and characteristics in the
hydrogeological model creation, was using geophysical data interpretations and
results.
56
4.2.3 Biophysical Resources
Biophysical resources are soil, nutrients, water, plants and wildlife.
Information on these resources can be used to assess how well landscapes conserve
soils and recycle plant nutrients and how the condition of landscapes is changing.
Information on these physical and built environment including topography, landuse
activities, surface soil and geology, surface water hydrology (rainfall, water level in
rivers and lakes), water quality, socioeconomic/industrial activities, pollution
sources etc. These data can be gathered in the GIS representation before an
evaluation could be carried and being transfered for inclusion into the
implementation plan. The raw data will be subsequently uploaded into GIS.
4.3 SPATIAL DATA MANAGEMENT DESIGN
Geographic Information System (GIS) has been used in many applications of
groundwater assessments and modeling, primarily to represents large spatial data in the
application involved. GIS has the capability to integrate the surface water and groundwater
hydrology to be managed in data system and applied to models created from it. The GIS
assisted database system would help to apply groundwater management practices such as;
proper groundwater resource management in terms of groundwater quality & quantity,
Integrated management of water, landuse and the environment; to optimize pumping rates
with respect to the capacity of the aquifer system, and to prevent groundwater quality

57
deterioration through proper monitoring & evaluation. Raw spatial data are taken from
aerial photos, maps, ready GIS data, etc. All data collected from secondary sources and the
field would be entered into the system that may also involve data conversion.
A systematic approach of groundwater management must involves the groundwater
system assessments in hydrologic equation-balance, pumping rates of groundwater
abstraction and the effects from it, and water quality evaluation. Human factors in climatic
and environmental changes will be taken into account that might affect the groundwater
conditions, given the natural hydrologic and geologic conditions it contained.
In this study area, the unconfined aquifers play a direct role in the linkage function
between surface water and groundwater resource where groundwater makes some
contribution to stream flow and rivers lose some water by outflow to groundwater. Any
changes that may occur in between may affect the flows in either rivers or groundwater,
particularly pumping wells activities that can change quantity and directions of flow
between rivers and aquifers in respond to the abstraction rates occurred. A river and
groundwater flow relation in flow model can therefore be developed and simulated. The
design will be able to offer the linkages to hydrogeological conceptual model and
groundwater model, using the agreed spatial coordinate system. The integration would
facilitate implementation of the plan and subsequent groundwater monitoring operations.
A management system of river-aquifer decision tool support system can also be
developed in this North Kelantan River Basin. This GIS aided management tool will be
used to administer daily groundwater production, contingencies plan, recharge and

58
discharge management, and surveillance on water quality, so as to improve the North
Kelantan River basin’s area management strategies.
Groundwater systems are often represented using gridded data; grids are used to
efficiently create and visualize spatial distributions for pre- and post-processing of the
model (Radin 2006). GIS data grids and shapefiles are then used to be integrated with
modeling software, such as MODFLOW, the modeling tool for this study. The integration
will involve the data inputs sets for hydrogeologic parameters, boundary conditions and
initial elements. Coverage area in shapefiles to represent the rivers, landuse and production
wells. Then the geoprocessing method is used to create polygons with aquifers
characterization, rainfall, evapotranspiration, which then be able to generate groundwater
recharge arrays and allowable abstraction rates arrays over the area.
4.4 FIELD GEOPHYSICAL INVESTIGATION PLAN
The purpose of this plan is to gain the degree of aquifer resources in Kelantan that
would add to the past historical data, generally available in North Kelantan, using
appropriate technique, for regional and local area investigations especially the important
zones that require more detailed aquifer profiling.
The result of this plan will be a spatial distribution of aquifers mapping across the
study area that will suited for identifying the potential aquifers development in the future

59
and areas necessary for placement of monitoring wells for the sustainable management of
groundwater for the area.
This vast potential of groundwater in the study area needs to be protected. However,
no comprehensive studies have been carried out, to identify the productive aquifers over the
vast tract of alluvium. The groundwater regime and the aquifer characteristics must be fully
understood and comprehend in order to have an effective monitoring system. A wide-
ranging and overall study has to be done, involving geological & geophysical (including
airborne) investigations, pumping tests to determine the hydraulic parameters of the
aquifers, groundwater modelling, sampling and analysis. The data obtained will be used as
inputs for the development and establishment of an effective groundwater system.
4.4.1 Airborne Time domain Electromagnetic (SkyTEM)
With ground surveys only, effort to identify and map these aquifers will take
considerable time and laborious. SkyTEM, a helicopter-borne transient
electromagnetic (TEM) technique, provides a viable alternative to rapidly and
efficiently map these aquifers for the regional area coverage technique and using
ground geophysics methods for local area investigations.
This new method developed in Denmark especially with focus of surveying
ground water aquifers and condition would be planned in the study. SkyTEM is a
time-domain, helicopter-borne electromagnetic system originally designed for
hydrogeophysical and environmental investigations (Esben Auken et al, 2009). It is

60
an airborne geophysical method suitable for geology survey, for down to a depth of
400m below terrain, the only airborne method developed specific for ground water
mapping purposes. This technique is frequently used for hydrogeological mapping
for locating groundwater reservoirs. Daily production could reach 200km profile
equivalent to 40km2 and equipment borne by a helicopter, employing the transient-
electromagnetic technique (TEM) for groundwater exploration. It has proven to be a
very effective geophysical tool in mapping groundwater aquifers, especially in
alluvium areas. SkyTEM has recently been employed in Malaysia for groundwater
exploration in Batang Padang District, Perak and in the coastal areas of Selangor.
General operation of the SkyTEM operation is shown in Fig. 4.1.
Fig. 4.1: The figure shows an outline of the transmitter frame with attached devices, tilt
(T), lasers (L) and receiver coils (R). The transmitter wires are attached to the
octagonal lattice frame.
A key feature in the processing is the use of an integrated interactive GIS
map where the helicopter location is highlighted. Combined with proper GIS
61
themes, it is in most cases possible to explain most features in data, e.g. that the
sudden increase in altitude and somewhat coherent noise is an effect of the
helicopter crossing a power line, that the lasers get bad reflections because the
helicopter is moving across a forest, etc.( Esben A. et al, 2009).
When implemented later, the SkyTEM will be employed as the single main
geophysical technique to be employed for the development of a GWRM system in
North Kelantan. It is recommended that the fly line spacing of 200 m and a
sampling interval of 20 – 30 m be engaged in this setup.
SkyTEM has also its limitation in detailing the geophysical survey in built-
up area and hard-standing surfaces. The alternative to the problem is to employ the
Regional ground transient electromagnetic (TEM) survey method.
4.4.2 Regional ground transient electromagnetic (TEM) survey
This method is an alternative to the SkyTEM survey, where hard surfaces
and airborne restricted areas is not possible by SkyTEM method. Ground TEM
technique would be the best substitute for SkyTEM in alluvium environment. It has
the facility to be used as, a mapping and sounding tool. The possibility to map the
study area is practically achievable, with the changes in apparent resistivity values
which directly translate into changes in subsurface geology at various depths. It
would then be possible to select profiles and carry out 1-dimensional (1D) inversion
by obtaining information on the subsurface layering. This technique 1D inversion

62
will provide information on the thickness and true resistivity values of each layer.
The penetration depth is considerably less than SkyTEM technique and important
information related to the basement of the lowest aquifers could be lost, which is
crucial for future ground water modelling.
The TEM technique involves transfer of primary magnetic flux into the
ground, created by passing current through a wire loop. The returning secondary
magnetic field will then intercepted to provide indication of the subsurface profiles.
The equipment used for the ground survey should be able to penetrate to a
depth of about 150 m below ground level, depending on the geology. Typically a
rectangular 40m x 40m loop size will be suitable for the depth of about 150 m. The
spacing should be decided based on the different conditions and nature of interest.
The typical ground TEM survey method is shown in Fig. 4.2.
The raw data from the fields are obtained in transient voltages which then be
changed into apparent resistivity values. Subsequently, the inversions are carried out
using specialized proprietary software.

63
Figure 4.2: Typical Ground TEM survey method at site
The resistivity of ground water varies from 10 to 100 ohm•m. depending on
the concentration of dissolved salts. This makes the resistivity method an ideal
technique for mapping the saline and fresh water interface in coastal areas. Table
4.1 shows the different resistivities of common rock, minerals and chemicals used
in the interpretation of the readings in resistivity meters at site (Loke M H, 1999).
The main output of the ground TEM geophysical investigation is a 1D layered earth
resistivity-depth profile for each individual line. It is also possible to produce
apparent resistivity contour maps which will reflect changes in subsurface geology
at selected delay times (windows/gates) The later delay times indicate a deeper
depth of penetration.

64
Table 4.1: Resistivities of common rocks, mineral and chemicals (Source JMG)
The other significant aspect is the present of spiky changes in apparent
resistivity data, either from low to high or vice versa. This is described on the map
as a sharp gradient due to either the saline/fresh water interface or the boundary
between alluvium and hard rock.
4.4.3 Resistivity and Induce Polarisation (IP) technique
At present, the resistivity and IP technique is the most widely used
geophysical technique in groundwater exploration in alluvium area. It is favoured
over the usual technique, as it is able to detail and map the subsurface geology
effectively. The current feature in resistivity instrumentation permits a 4/8/12
channels input in which will provide a better acquisition of data. This equipment

65
offers the 2D resistivity imaging survey coupled with a minimum of 56 electrodes
configuration. However, field tests to be carried out prior to the actual field data
acquisition to be used for the survey in order to establish the most suitable electrode
configuration and electrode intervals.
This resistivity method includes passing a direct electrical current of a pre-
determine strength into the earth through two electrodes. Several electrode
arrangements are possible; Wenner, Schlumberger (Figure 4.3) and dipole-dipole
are the most common. The resulting potential distribution is measured between two
potential electrodes, in a position centre between them. Subsequently, the apparent
resistivity, ρa, can be deduced from the current strength, the potential and a
geometrical factor k, correlated by the type of electrode configuration.
Figure 4.3: Schlumberger electrode configuration
Raw field data is to be scrutinised for quality checks and should be
consistent before it can be processed. Modern day field equipments can do this
processing and checks on-site. RES2DINV or EARTHIMAGER software will be
C1 C2 P1 P2
V
I
Electrode
a = electrode interval; Resistance R = V/I
C = current electrode ; P = potential electrode
2L
2l

66
used to inverse of the 2D imaging data. The software will further validate and verify
for errors before the inversion proceed. A sounding curve will be produced from the
apparent resistivities, plotted as a function of the electrode interval. The sounding
curve can then be interpreted using curve-matching technique to produce a 1D
model of the subsurface. The 2D imaging data can be presented in resistivity-depth
profiles for each individual line. Any changes in resistivity distribution in the lateral
or vertical line will reflect the changes in the geology of the subsurface. An
illustration of the 2D inversion is shown in Fig.4.4.
Figure 4.4: General setup and the resulting image processed by 2D inversion

67
4.5 MONITORING WELL DEVELOPMENT PLAN
This study on groundwater management for Sg.Kelantan basin builds the
assessment on the regional groundwater availability, in which can be implemented for the
national groundwater assessment as part of the science strategy to meet nationwide water
on water availability and its quality checks. In order to implement the task, an
establishment of a groundwater monitoring system is inevitable. The monitoring
programme is carried out primarily to:
i. Acquire a continuous and updated data on groundwater manually;
ii. Observe on groundwater quality, based on the monthly data acquisition;
iii. Oversees and manage the groundwater supplies, which includes monitoring
against over pumping, indicated by the decline of groundwater table and salt
water intrusion in the coastal area and exercising the safe yield policy on the
amount of water that can be withdrawn from an aquifer annually without
causing undesirable effects;
iv. Having a mitigation action against pollution from point and non-point
sources, which include sanitary landfills and waste disposal facilities for
point source and for non-point sources include the, leakages from sewerage
and septic tanks, urban runoff, and infiltration contaminated by agricultural
products.
68
4.5.1 Existing Monitoring Wells and its programmes
The existing groundwater monitoring system was designed and implemented
for the Kota Bharu, Tanjung Mas and Pengkalan Chepa areas in 1989 by JMG, as a
pilot study and was followed by a system of collection of groundwater samples and
measurement of piezometric levels.
JMG has constructed 69 monitoring wells in various parts of Kelantan River
Basin since 1989. Water samples and groundwater levels in the monitoring wells
were acquire in monthly intervals. The monitoring wells were constructed as
individual well and in some places, a cluster of a few wells at the same location,
namely the KB1-5, KB6-14, KB15-19, KB20-21, KB22-24, KB25-27, KB28-30,
KB3l-35, KB59-60 and KB62-64 which are the monitoring wells installed as
clusters at different locations able to monitor groundwater levels and quality of the
different aquifer layers. As examined at site, the monitoring wells were mainly
constructed within the compound of the groundwater treatment plants and water
storage tank sites, for security reasons and vandalism. These monitoring wells have
been the mechanism for continuous observation and monitoring of the groundwater
quality and piezometric heads ever since.
The list of monitoring wells are shown in Table 4.2: List of JMG's
monitoring wells, Table 4.3: List of DOE's monitoring wells, Table 4.4: List of
NAHRIM's monitoring wells. In GIS format, the locations of the existing JMG,
DOE and NAHRIM monitoring wells are shown in Fig. 4.5.

69
Table 4.2: List Of JMG’s Monitoring Wells
No Well
ID
No
HYDROdat Easting Northing Location
Elevation
(m)
Depth
(m)
Diameter
(mm)
Screen
Depth Status
1 KB 1 PD000066 478112 681482 Loji Air
Pengkalan Chepa 5.931 100 75
98.5-
100.0 Active
2 KB 2 PD000067 478109 681481 Loji Air
Pengkalan Chepa 5.925 87 75
85.5-87.0
Active
3 KB 3 PD000068 478106 681481
Loji Air
Pengkalan Chepa
5.872 68.5 75 67.0-
68.5 Active
4 KB 4 PD000069 478104 681481 Loji Air
Pengkalan Chepa 5.847 59.5 75
58.0-
59.5 Active
5 KB 5 PD000070 478103 681483 Loji Air
Pengkalan Chepa 5.794 24.5 75
23.0-24.5
Active
6 KB 6 PD000071 475211 678945 Loji Air Tanjung
Mas 4.487 129 75
127.5-
129.0 Active
7 KB 7 PD000072 475211 678947 Loji Air Tanjung
Mas 4.438 99 75
97.5-99.0
Active
8 KB 8 PD000073 475210 678949 Loji Air Tanjung
Mas 4.523 80 75
78.5-
80.0 Active
9 KB 9 PD000074 475212 678949 Loji Air Tanjung
Mas 4.493 55.5 75
54.0-55.5
Active
10 KB 10 PD000075 475174 678991 Loji Air Tanjung
Mas 4.648 31.5 75
30.0-
31.5 Active
11 KB 11 PD000076 475122 678959 Loji Air Tanjung
Mas 4.501 32 75
30.5-32.0
Active
12 KB 12 PD000077 475215 678949 Loji Air Tanjung
Mas 4.488 32 75
30.5-
32.0 Active
13 KB 13 PD000078 475111 678894 Loji Air Tanjung
Mas 4.408 31.5 75
30.0-31.5
Active
14 KB 15 PD000080 472560 678352 Tangki Air Jalan
Merbau 6.571 126.5 75
125.0-
126.5 Active
15 KB 16 PD000081 472573 678341 Tangki Air Jalan
Merbau 6.581 110 75
108.5- 110.0
Active
16 KB 18 PD000083 472572 678339 Tangki Air Jalan
Merbau 6.546 65.5 75
64.0-
65.5 Active
17 KB 19 PD000084 472569 678337 Tangki Air Jalan
Merbau 6.466 28.5 75
27.0-28.5
Active
18 KB 20 PD000085 472425 666130 Perol Booster
Pump 8.839 41 75
39.5-
41.0 Active
19 KB 21
** PD000086 472427 666128
Perol Booster Pump
8.811 24.5 75 23.0-24.5
Active
20 KB 23 PD000088 486852 664740 Loji Air Jelawat 3.578 26.5 75 25.0-
26.5 Active
21 KB 24 PD000089 486855 664739 Loji Air Jelawat 3.609 7 75 5.5-7.0 Active
22 KB 25 PD000090 476552 673352 Loji Air Jelawat 6.441 52.9 75 51.4-52.9
Active
23 KB 26 PD000091 476552 673352 Loji Air Jelawat 6.442 33.5 75 32.0-
33.5 Active
24 KB 28 PD000093 471731 674363
Loji Air Taman
Guru (Pintu
Geng)
6.066 71.5 75 70.0-71.5
Active
25 KB 29 PD000094 471733 674362 Loji Air Taman
Guru (Pintu
Geng)
6.083 59.5 75 58.0-
59.5 Active
26 KB 30 PD000095 471743 674360 Loji Air Taman
Guru (Pintu
Geng)
6.01 10.5 75 9.0-
10.5 Active
27 KB 49 PD000114 471792 674386
Loji Air Taman
Guru (Pintu Geng)
7.44 14 100 5.0-
14.0 Active
28 KB 31 PD000096 486188 671836
Pusat Kesihatan
Beris Kubur Besar
3.386 107.5 75 106.0-
107.5 Active
29 KB 32 PD000097 486190 671837 Pusat Kesihatan 3.601 95 75 93.5- Active

70
No Well
ID
No
HYDROdat Easting Northing Location
Elevation
(m)
Depth
(m)
Diameter
(mm)
Screen
Depth Status
Beris Kubur
Besar
95.0
30 KB 33 PD000098 486188 671834 Pusat Kesihatan
Beris Kubur
Besar
3.332 77.5 75 76.0-
77.5 Active
31 KB 34 PD000099 486189 671836 Pusat Kesihatan
Beris Kubur
Besar
3.341 39.8 75 38.3-
39.8 Active
32 KB 35 PD000100 486190 671836
Pusat Kesihatan
Beris Kubur Besar
3.388 25.5 75 24.0-
25.5 Active
33 KB 36 PD000101 477214 665840 Pusat Kes.
Peringat 5.872 35 75
33.5-
35 Active
34 KB 37 PD000102 477203 674100 HUSM Kbg.
Kerian 4.114 11.5 75
4.0-11.5
Active
35 KB 39 PD000104 478943 672145 Kg. Binjai
(Amarda Tractor) 5.884 16 100
8.0-
16.0 Active
36 KB 42 PD000107 474711 673407 Sek.Keb.Pasir
Hor 6.179 10.5 100
3.5-10.5
Active
37 KB 43 PD000108 475126 670852 Sek.Keb.Seribon
g 6.264 14.5 100
7.5-
14.5 Active
38 KB 44 PD000109 476599 671137 Pasir Tumboh 5.669 14.3 100 4.5-14.3
Active
39 KB 45 PD000110 476453 672484 Kg. Chicha 6 11 100 3.0-
11.0 Active
40 KB 51 PD000116 475894 678784 S.K.Rambutan
Rendang 4.989 11.6 100
3.0-
11.6 Active
41 KB 52 PD000291 477608 677561 Loji Air Kg.
Teluk 4.914 19.8 100
3.0-
19.8 Active
42 KB 53 PD000118 472048 675934 Kg. Puteh (Baru) 2.515 12.5 100 3.0-
12.5 Active
43 KB 57 PD000122 468409 677020 Loji Air Wakaf
Bharu 6.059 11.5 40
10.0-
11.5 Active
44 KB 58 PD000123 484104 668209 Loji Air Kg Chap 4.284 24.5 40 22.0-
24.5 Active
45 KB 89 PD000313 489250 648129 Bkt. Gedombak
P. Puteh N/A N/A 75 N/A Active
46 KB94 PD000326 459998 685283 Kg. Kok
Bedullah N/A N/A 75 N/A Active
47 KB95 PD000327 460212 685220 Kg. Kok
Bedullah N/A N/A 75 N/A Active
48 KB96 PD000328 460384 685175 Kg. Kok
Bedullah N/A N/A 75 N/A Active
49 KB97 PD000329 460699 685196 Kg. Kok
Bedullah N/A N/A 75 N/A Active
50 KB98 PD000330 460683 685062 Kg. Kok
Bedullah N/A N/A 75 N/A Active
51 KB99 PD000331 460721 684895 Kg. Kok
Bedullah N/A N/A 75 N/A Active
52 KB100 PD000332 460815 685161 Kg. Kok
Bedullah N/A N/A 75 N/A Active
53 KB101 PD000333 460682 685139 Kg. Kok Bedullah
N/A N/A 75 N/A Active
54 KB102 PD000334 456002 662419 Pusu 40 Rantau
Panjang N/A N/A 75 N/A Active
55 KB103 PD000335 455671 662411 Pusu 40 Rantau
Panjang N/A N/A 75 N/A Active
56 KB104 PD000336 455617 662216 Pusu 40 Rantau
Panjang N/A N/A 75 N/A Active
57 KB105 PD000337 455968 662266 Pusu 40 Rantau
Panjang N/A N/A 75 N/A Active
58 KB106 PD000338 455767 662421 Pusu 40 Rantau
Panjang N/A N/A 75 N/A Active
59 KB107 PD000339 455635 662308 Pusu 40 Rantau
Panjang N/A N/A 75 N/A Active
60 KB108 PD000340 455590 662302 Pusu 40 Rantau
Panjang N/A N/A 75 N/A Active

71
No Well
ID
No
HYDROdat Easting Northing Location
Elevation
(m)
Depth
(m)
Diameter
(mm)
Screen
Depth Status
61 KB109 PD000341 455655 662124 Pusu 40 Rantau
Panjang N/A N/A 75 N/A Active
62 KB 61 N/A 477900 681700 Loji Air
Pengkalan Chepa 5.8 4 75 2.5-4.0 IN/Active
63 KB 17 N/A 473300 678500 Tangki Air Jalan
Merbau 6.596 85 75
83.5-
85.0 In-active
64 KB 22 N/A 486700 664700 Loji Air Jelawat 3.614 47.5 75 46.0-47.5
In-active
65 KB 27 N/A 476300 673500 Loji Air Kubang
Kerian 6.419 12 75
10.5-
12.0 In-active
66 KB 38 N/A 477400 675800 Loji Air Kg. Kota 3.299 13.5 100 12.0-13.5
In-active
67 KB 40 N/A 480000 675900 Sek.Keb.Kedai
Lalat 3.889 18.9 100
8.5-
18.9 In-active
68 KB 41 N/A 474300 671500 Kg. Pdg.
Penyadap 5.649 14.5 100
7.5-
14.5 In-active
69 KB 46 N/A 473700 674100 Kg. Bunut
Payong 3.77 5.4 100 3.0-5.4 In-active
70 KB 47 N/A 472300 673400 Wakaf Che Yeh 6.52 13.5 100 3.5-13.5
In-active
71 KB 54 N/A 471700 676600 Bawah Lembah 2 10.5 100 5.0-
10.5 In-active
72 KB 55 N/A 470200 676800 S.K.Pasir Pekan 6.527 11.2 100 7.5-11.2
In-active
73 KB 56 N/A 465100 683400 Loji Air Kg.
Sedar 4.636 31.5 40
30.0-
31.5 In-active
74 KB 59 N/A 471900 676200 Loji Air Kg.Puteh 7.232 11.4 40 9.7-
11.4 In-active
75 KB 60 N/A 471900 676200 Loji Air Kg.Puteh 6.936 13 40 11.5-
13.0 In-active
76 KB 62 N/A 465400 673800 Bunut Susu 7.075 47.5 75 46.0-
47.5 In-active
77 KB 63 N/A 465400 673800 Bunut Susu 7.025 30 75 28.5-
30.0 In-active
78 KB 64 N/A 465400 673800 Bunut Susu 7.09 8 40 6.0-7.5 In-active
79 KB 69 N/A 474900 677400 Jln. Pekeliling
(S.K. Islah) 4.255 9.5 40 8.0-9.5 In-active
80 KB 70 N/A 477100 673900 Tok Kenali,
K.Kerian 3.97 34 100
32.5 -
34 In-active
81 KB 71 N/A 472800 659700 Loji Air Ketereh N/A 41 200 27.0-
31.0 In-active
82 KB 72 N/A 477800 656000 Loji Air Puspa
Jaya N/A 25 80
7.0-
11.0 In-active

72
Table 4.3: List Of DOE’s Monitoring Wells
No Code Well No. Location Category Depth
(m) X Y
1 D3A MW(7)-D3-1-6.90
KELAB GOLF
& DESA PKLN CHEPA
PADANG GOLF 6.9 479644.7 680612.0
2 D3B MW(7)-D3-1-6.37
KELAB GOLF
& DESA PKLN
CHEPA
PADANG GOLF 6.37 479547.1 681165.1
3 D6-4A MW(7)-D6-4-31.27
KELAB GOLF
D'RAJA
KUBANG KERIAN
PADANG GOLF 31.27 476743.7 672994.7
4 D6-4B MW(7)-D6-4-4.47
KELAB GOLF
D'RAJA
KUBANG KERIAN
PADANG GOLF 4.47 476746.8 672985.5
5 D6-3A MW(7)-D6-3-13.43
PANJI
LANDFILL, PANJI, KOTA
BHARU
TAPAK
BUANGAN
PEPEJAL
13.43 477904.7 678519.4
6 D6-3B MW(7)-D6-3-5.34
PANJI
LANDFILL, PANJI, KOTA
BHARU
TAPAK
BUANGAN
PEPEJAL
5.34 477904.7 678516.3
7 D6-2A MW(7)-D6-2-51.28
EASTERN GARMENT
MFG., PKLN
CHEPA
PERINDUSTRIAN 51.28 478954.7 679679.1
8 D6-2B MW(7)-D6-2-4.24
EASTERN
GARMENT
MFG., PKLN CHEPA
PERINDUSTRIAN 4.24 478957.8 679697.6
9 D8-1A MW(7)-D8-1-5.22
PASIR MAS
LANDFILL,
KG. PUSU 40, PASIR MAS
TAPAK BUANGAN
PEPEJAL
5.22 455798.4 662268.2
10 D7-1A MW(7)-D7-1-20.23
SEK. MEN.
KEB. RANTAU
PANJANG
PERBANDARAN 20.23 442627.6 665180.3
11 D7-1B MW(7)-D7-1-6.10
SEK. MEN.
KEB. RANTAU
PANJANG
PERBANDARAN 6.1 442612.3 665214.1
12 D11-
1A MW(7)-D11-1-6.10
SEK. KEB. JELAWAT,
BACHOK
LUAR BANDAR 6.1 486861.4 664790.9
13 D11-2A
MW(7)-D11-2-5.09
SEK. MEN.
KEB. JELAWAT,
BACHOK
LUAR BANDAR 5.09 486449.1 664644.0
14 D6-1A MW(7)-D6-1-7.58
KAMPUNG JEMBAL,
KOTA
BHARU
PERTANIAN 7.58 482014.3 664428.9
15 D15A MW(7)-D15-1-4.05
SEK. KEB.
BERIS
LALANG, BACHOK
PERTANIAN 4.05 491701.4 657249.2

73
Table 4.4: List Of NAHRIM’s Monitoring Wells
No. WELL
NO LOCATION CROP X Y
Depth
(m)
Diameter
(m) Screen
1 NW 33 KG. AMAN AGRI
(TABACOO) 495026 655013 25.0 100 3.0-7.0
2 NW 13 KG. PADANG
TENGAH KETEREH AGRI (PADDY) 470568 659077 25.0 100 3.0-7.0
3 NW 14 KG. SENENG
JELAWAT RESIDENTIAL 487552 663687 25.0 100 3.0-7.0
4 NW 19 KG. PENGKALAN
NANGKA RESIDENTIAL 476598 680668 25.0 100 2.0-4.0
5 NW 5 KG. KUBANG GOLOK AGRI (VEG.) 487934 673948 25.0 100 11.0-14.0

74
Figure 4.5: Existing JMG, DOE and NAHRIM monitoring well at the study area.

75
4.5.2 New Monitoring Well Location
In the new wells identification and network design, the combined
hydrogeological information (existing and new) is used, where a new set of
monitoring well locations would be identified across the study area. The selected
network would be based on derived technical, environmental and cost criteria,
classified as regional, local and at source levels.
Well network are planned in regional and local scale using spatial
method, particularly across the North Kelantan alluvium, covering various
landuse and polluting sources (point or nonpoint), soil group, recharge areas,
multi-layered aquifers system and within groundwater catchment protection
zone around the wellfields. The networks are designed such that water quantity
and quality patterns could be assessed at different spatial scales.
Regional monitoring wells network are established based on two regional
scale monitoring well networks, namely areal networks and transect networks. It
is designed to provide a broad areal assessment of quantity and ambient water
quality condition across the area. For the Areal Networks, the study area is to be
systematically subdivided into polygons and then possible sites are chosen and
identified as monitoring wells sites within each polygon, characterised by the
types of landuse, soil and hydrogeology that overlay the geometric of each
polygon concerned. For the Transect Network, the monitoring well sites are

76
chosen from the transect lines drawn along, that stretches across the
groundwater basins in easterly to westerly pattern. The transects lines are then
spaced to provide a broad north-south bound coverage of the study area. It is
very important that the representiveness of the well sites in this network is
specifically applied, that targets the areas representing the different
hydrogeomorphic regions along each transect lines.
This network is also applied for designing monitoring well distribution in
priority areas such as in Kota Bharu Municipal Council (MPKB). The sites
would also be chosen to investigate water quality variations in urban, industrial,
residential, agricultural and natural areas in accordance with local shallow
groundwater flow patterns using local areal network and transect network
concepts. This higher network density area can be used for ambient and source
monitoring.
This network is also be implemented in small area, in which probable
point source of groundwater pollution exist, such as landfill and possible leaking
sewage points. The outcome of the network would define the groundwater
contaminant plume extent and geometry in the vicinity of the facility. The study
has established the new locations of monitoring wells for groundwater
monitoring network, as listed in Table 4.5 below.
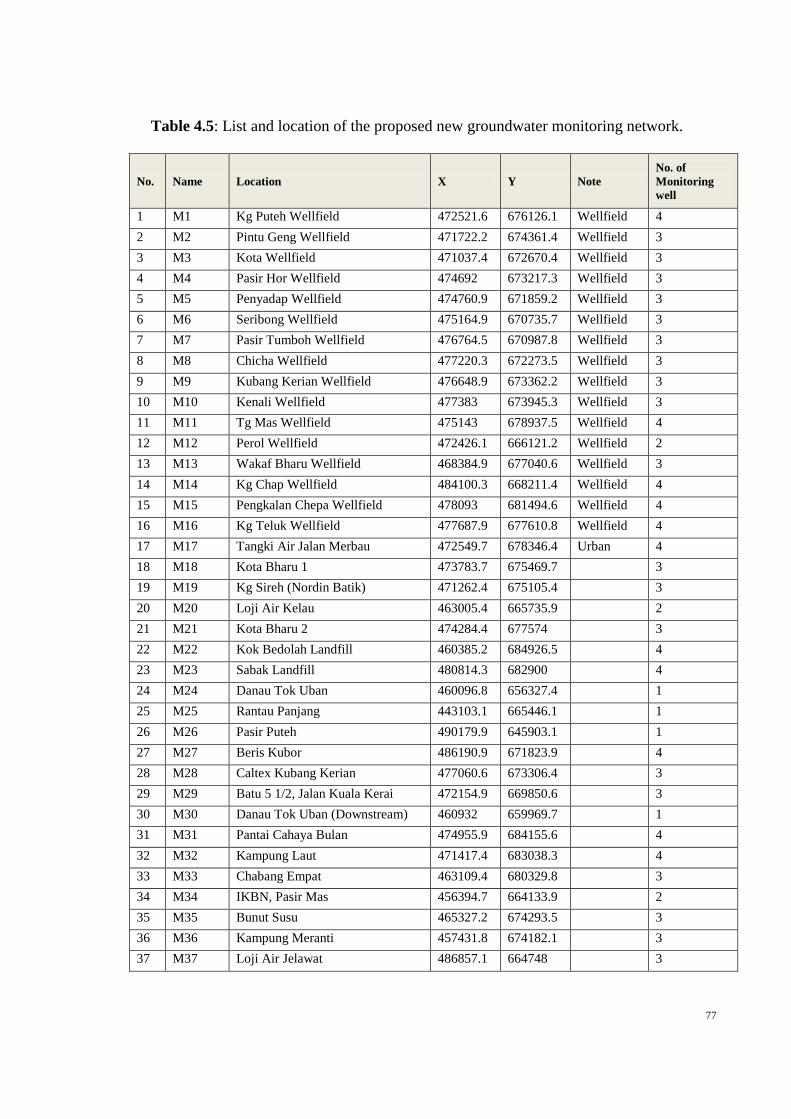
77
Table 4.5: List and location of the proposed new groundwater monitoring network.
No. Name Location X Y Note
No. of
Monitoring
well
1 M1 Kg Puteh Wellfield 472521.6 676126.1 Wellfield 4
2 M2 Pintu Geng Wellfield 471722.2 674361.4 Wellfield 3
3 M3 Kota Wellfield 471037.4 672670.4 Wellfield 3
4 M4 Pasir Hor Wellfield 474692 673217.3 Wellfield 3
5 M5 Penyadap Wellfield 474760.9 671859.2 Wellfield 3
6 M6 Seribong Wellfield 475164.9 670735.7 Wellfield 3
7 M7 Pasir Tumboh Wellfield 476764.5 670987.8 Wellfield 3
8 M8 Chicha Wellfield 477220.3 672273.5 Wellfield 3
9 M9 Kubang Kerian Wellfield 476648.9 673362.2 Wellfield 3
10 M10 Kenali Wellfield 477383 673945.3 Wellfield 3
11 M11 Tg Mas Wellfield 475143 678937.5 Wellfield 4
12 M12 Perol Wellfield 472426.1 666121.2 Wellfield 2
13 M13 Wakaf Bharu Wellfield 468384.9 677040.6 Wellfield 3
14 M14 Kg Chap Wellfield 484100.3 668211.4 Wellfield 4
15 M15 Pengkalan Chepa Wellfield 478093 681494.6 Wellfield 4
16 M16 Kg Teluk Wellfield 477687.9 677610.8 Wellfield 4
17 M17 Tangki Air Jalan Merbau 472549.7 678346.4 Urban 4
18 M18 Kota Bharu 1 473783.7 675469.7 3
19 M19 Kg Sireh (Nordin Batik) 471262.4 675105.4 3
20 M20 Loji Air Kelau 463005.4 665735.9 2
21 M21 Kota Bharu 2 474284.4 677574 3
22 M22 Kok Bedolah Landfill 460385.2 684926.5 4
23 M23 Sabak Landfill 480814.3 682900 4
24 M24 Danau Tok Uban 460096.8 656327.4 1
25 M25 Rantau Panjang 443103.1 665446.1 1
26 M26 Pasir Puteh 490179.9 645903.1 1
27 M27 Beris Kubor 486190.9 671823.9 4
28 M28 Caltex Kubang Kerian 477060.6 673306.4 3
29 M29 Batu 5 1/2, Jalan Kuala Kerai 472154.9 669850.6 3
30 M30 Danau Tok Uban (Downstream) 460932 659969.7 1
31 M31 Pantai Cahaya Bulan 474955.9 684155.6 4
32 M32 Kampung Laut 471417.4 683038.3 4
33 M33 Chabang Empat 463109.4 680329.8 3
34 M34 IKBN, Pasir Mas 456394.7 664133.9 2
35 M35 Bunut Susu 465327.2 674293.5 3
36 M36 Kampung Meranti 457431.8 674182.1 3
37 M37 Loji Air Jelawat 486857.1 664748 3
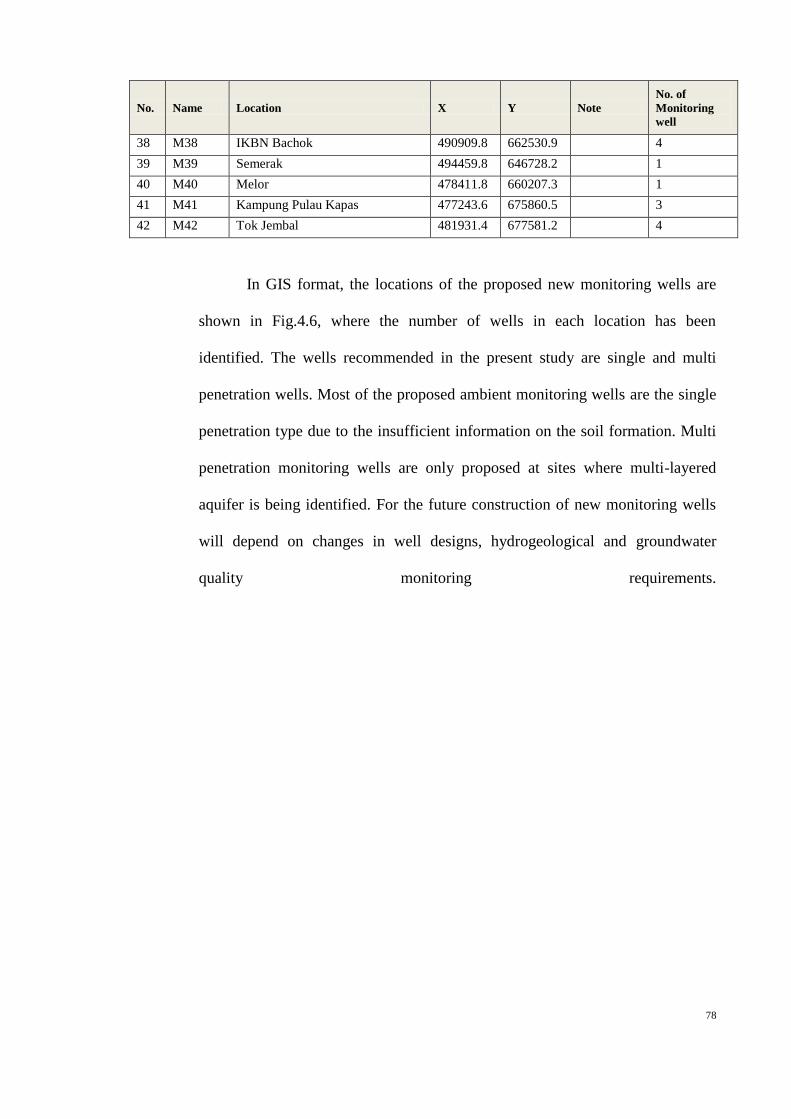
78
No. Name Location X Y Note
No. of
Monitoring
well
38 M38 IKBN Bachok 490909.8 662530.9 4
39 M39 Semerak 494459.8 646728.2 1
40 M40 Melor 478411.8 660207.3 1
41 M41 Kampung Pulau Kapas 477243.6 675860.5 3
42 M42 Tok Jembal 481931.4 677581.2 4
In GIS format, the locations of the proposed new monitoring wells are
shown in Fig.4.6, where the number of wells in each location has been
identified. The wells recommended in the present study are single and multi
penetration wells. Most of the proposed ambient monitoring wells are the single
penetration type due to the insufficient information on the soil formation. Multi
penetration monitoring wells are only proposed at sites where multi-layered
aquifer is being identified. For the future construction of new monitoring wells
will depend on changes in well designs, hydrogeological and groundwater
quality monitoring requirements.

79
Figure 4.6: Location of the proposed new groundwater monitoring network
80
Briefly, the description of the wells to include, the well casing diameter of 4
inches (100 mm), the borehole diameter minimum of 4 to 6 inches (100 to 150 mm)
larger than the well casing and the screen large enough in allowing proper
placement of annular materials and accommodate minimum thickness of filter pack.
The well screens are to be placed in the layer for easy monitoring and be
surrounded by coarser and higher hydraulic conductivity materials than natural
formation material, for an efficient monitoring well design in unconsolidated
geologic materials. The design allows undisturbed flow of groundwater into the
well from the adjacent alluvium formation and also to minimise or eliminate the
entrance of fine grained materials from the sand layer formation into the well.
Water samples are then collected and making sure of free of sediment to
reduce the potential for sample interference. The length of well screen in the
monitoring well is normally shorter than the production wells because it’s used only
to obtain water to monitor the conditions within an individual water-bearing unit.
Whereas, for the production well design, a longer optimized length of the well is
installed within an individual water-bearing zone, or in multiple water-bearing
zones. For that some of the production well can be used as monitoring well.
A filter pack layer is installed in between the screen and the soil formation.
The design of filter pack grain size and well screen slot size are determined by the
grain-size distribution of the formation material. The filter pack acts as the principal
hydraulic structure of the well and is designed to protection of the screens.

81
In monitoring wells design, the well screen are able to retain 90% to 100%
of filter pack materials, because development is generally done after the well has
been completed, and it is important to avoid excessive settling of the materials
surrounding the well. To retain 99% to 100% of the filter pack, the well screen slot
size equal to the D, size of the filter pack. To retain 90% of the filter pack use the
D10 sizes. The typical monitoring well design is shown in Fig. 4.7 and the wellhead
design is illustrated in Fig. 4.9.
This monitoring operation plan will establish further data collections in the
groundwater level monitoring sequence that provides:
i. The rate of water level recovery at certain production rate;
ii. The groundwater drawdown limitation of production rate;
iii. The trending behavioural groundwater responding to external factors.
The groundwater level data collected is to be used in the integration with
SCADA, GIS and the hydrogeological model coupled with other external data.

82
Figure 4.7: Typical monitoring well design.

83
Hinge (Client to approve)
Identification tag
100mm dia PVC
500mm
150mm 150mm
Figure 4.8: Wellhead design.

84
4.5.3 Groundwater Sampling and Analysis
The groundwater sampling forms the integral part of the groundwater
monitoring system and as an identifying tool for regional and seasonal variation and
long-term changes of groundwater quality of the study area. The results from the
sampling provide the early indication of contamination problems exist in any area.
The groundwater sample is designed to represent the particular zone of the water
being sampled. The basis of interpretations of the quality of water is the chemical
analysis in relation to source, geology, climate and its use.
Water samples are taken from the constant discharge pumping test sequence
that provides information on water quality and its variability. The samples are taken
during initial, middle and at the end of each pumping test.
The samples are then sent to laboratory further chemical analyses. The
laboratory chemical test parameters are listed in Table 4.6. For on-site and in-situ
analysis, the procedures are conducted at the site. The parameters for on-site
analysis to include Biological Oxygen Demand (BOD), Chemical Oxygen Demand
(COD), manganese, iron, total iron, nitrate nitrogen (NO3-N), nitrite nitrogen (NO2-
N), phosphate (PO4-), water temperature, pH and conductivity.

85
Table 4.6: List of Parameters for Groundwater Quality Analysis
Category Parameters to be Analysed
Physical
Temperature
Turbidity
Colour
pH
Conductivity
Inorganic
Dissolved Oxygen (DO)
Biochemical Oxygen Demand (BOD)
Chemical Oxygen Demand (COD)
Manganese (Mn)
Iron (Fe)
Total Iron (Fe-T)
Nitrate Nitrogen (NO3-N)
Nitrite Nitrogen (NO2-N)
Total Dissolved Solids (TDS)
Total Solids (TS)
Chloride (Cl)
Anionic Detergent MBAS
Ammoniacal Nitrogen (NH3-N)
Fluoride (F)
Carbonate (CO3)
Hydrogen Carbonate (HCO3)
Total Hardness (CaCO3)
Sodium (Na)
Calcium (Ca)
Potassium (K)
Aluminium (Al)

86
Heavy metals and
others
Magnesium (Mg)
Mercury (Hg)
Cadmium (Cd)
Selenium (Se)
Arsenic (As)
Cyanide (CN)
Lead (Pb)
Chromium (Cr)
Silver (Ag)
Copper (Cu)
Zinc (Zn)
Sulphate (SO4)
Silica (SiO2)
Phosphorus (P)
Oil & Grease
Phenol
Chloroform
Category Parameters to be Analysed
Biocides and others
Organochlorine Pesticides
Organophosphorus Pesticides
BTEX
VOC (Volatile Organic Compounds)
SVOC (Semivolatile Organic Compounds)
Total Petroleum Hydrocarbon (TPH)
Microbiology Total Coliform Bacteria
E. Coli (Escherichia Coli)

87
4.6 RAINGAUGE AND STICKGAUGE ESTABLISHMENT PLAN
4.6.1 Surface Water Monitoring
To establish excellent hydrogeological models in the groundwater
management operation and decision, establishment of aquifer interaction with
surface water bodies is of principal importance. External factors such as rain fall,
river flow, canal and lake outflows must be monitored so as to gather information as
an input to the system and model. Thus monitoring rainfall/rainfall infiltration and
river, lake and canal water levels are monitored, particularly within the study area
bounded by the Kelantan River and Mulong/Pengkalan Datu River where extensive
wellfields are located. Adjacent external systems that might have an effect on the
study area are also monitored. River flows can be determined by installations of
stick gauges and rain falls are observed by rain gauges installations.
4.6.2 Stick Gauges and Rain gauges
Selection of stick gauge locations is determined by factors such as stagnant
water body and at defined intervals along moving and gradient waters. For rain
gauges the existing facilities provided by Meteorological Department can provide
sufficient information in the study area. Both gauges would be tied to SCADA
system and their readings would serve as boundary condition (BC) for groundwater
model elements. The list of proposed locations of stick gauges are shown in Table

88
4.7, alongside with the existing stick gauges. Further illustration in GIS map of the
locations of the existing and proposed stick gauges are shown in Fig. 4.9.
Table 4.7: List and location of the existing and proposed stick gauges.
No. Station No. Station Location YEAR
OPEN
YEAR
CLOSED OWNER Latitude Longitude
1 5621401 Sg. Sokor di Kg. Tegawan 01/83 JPS 102.1014 5.629167
2 5721442 Sg. Kelantan di Jambatan. Guillemard/Kusial
1949 JPS 102.15 5.7625
3 5824401 Sg. Semerak di Pasir Puteh JPS 102.4944 5.859722
4 6019411 Sg. Golok di Rantau Panjang 1938 JPS 101.975 6.0225
5 6021401 Sg. Lemal At Jambatan Repek 01/81 08/93 JPS 102.1028 6.013889
6 6022421 Sg. Kemasin At Peringat 10/61 01/92 JPS 102.2861 6.030556
7 6120401 Sg. Golok di Kuala Jambu 06/81 08/91 JPS 102.0958 6.163889
8 6122441 Sg. Kelantan di Jeti Kastam 12/62 JPS 102.2333 6.133333
9
Sg. Golok di Janob New 101.8904 5.84217
10 DSG-1 Sg. Kelantan At Jambatan Wakaf
Bharu New 102.23 6.116932
11 DSG-2 Sg. Kelantan At Jambatan Tendong New 102.2146 6.056694
12 DSG-3 Sg. Kelantan At Jambatan Pasir Mas New 102.1474 6.032392
13 DSG-4 Sg. Pengkalan Datu at Pasir Tumboh New 102.2813 6.061033
14 DSG-5 Sg. Pengkalan Datu at Pulau Melaka New 102.2979 6.117385
15 DSG-6 Danau Tok Uban New 102.131 5.934887
16 DSG-7 Sg. Golok New 102.0567 6.080916
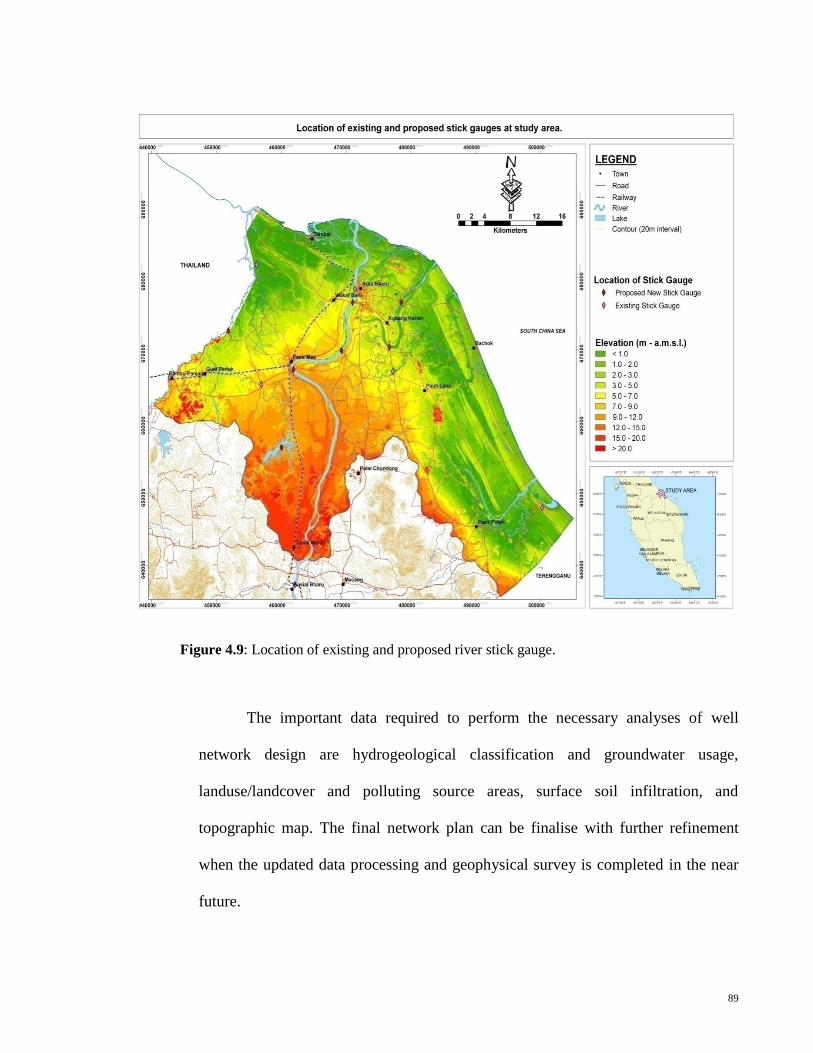
89
Figure 4.9: Location of existing and proposed river stick gauge.
The important data required to perform the necessary analyses of well
network design are hydrogeological classification and groundwater usage,
landuse/landcover and polluting source areas, surface soil infiltration, and
topographic map. The final network plan can be finalise with further refinement
when the updated data processing and geophysical survey is completed in the near
future.

90
4.7 SCADA SYSTEM ESTABLISHMENT PLAN
4.7.1 Systems concepts
The term SCADA usually refers to centralized systems which monitor and
control entire sites, or complexes of systems spread out over large areas. An
effective wireless monitoring system can be installed, to assist water management
companies, with relatively low capital investment. This wireless monitoring system
provides:
i. Relatively low technical manpower and less expensive human capital
requirement.
ii. Relatively low cost of equipments and monitoring tools.
iii. Effective standard operating procedures.
iv. Consistently monitoring and providing real time data with low marginal
error.
v. Historical data and trends for future water management studies and
planning.
Most control actions are performed automatically by Remote Terminal Units
(RTU) or by programmable logic controllers (PLC). Host control functions are
usually restricted to basic overriding or supervisory level intervention. Data
acquisition starts at the RTU or PLC level and includes meter readings and
91
equipment status reports that are communicated to SCADA as required. Data is then
compiled and formatted to make supervisory decisions operators easy to adjust or
override normal RTU (PLC) controls.
SCADA implementations require the setup of its alarm handling. The
system will monitors where certain alarm conditions are met, to determine when a
predetermine event has occurred. Once an alarm event has been detected, one or
more actions are taken (such as the activation of one or more alarm indicators, and
perhaps the generation of email or text messages so that management or remote
SCADA operators are informed). Alarm conditions is an over-the-limit point where
a digital status point that has either the value normal or alarm that is calculated by a
formula based on the values in other analogue and at these digital points, the
SCADA system will automatically monitor whether the value in an analogue point
lies outside high and low limit values associated with that point.
4.7.2 Current SCADA system
There are many SCADA technologies that have been implemented for
different purposes and usage but it is important for users to define their main
objective and future requirement as to determine the potential scalability and
extensions of functions. These are the most important and critical success factor of
SCADA system to be considered which were:
i. Backhaul and protocol for hardware interchange ability.
ii. System language and database programming.

92
iii. Power management system.
AKSB has already installed the SCADA system using hot-wired and
wireless GSM backhaul in its water production plants. The system is a
comprehensive water production system that controls the overall operation of water
treatment processes that include the opening of valves and running water pumps, by
either manually or on a parameter control setting. Without proper planning and
appropriate technology transfer, the system installed are unable to perform to it’s
specified requirement. This is due to:
i. No proper planning on hardware preventive maintenance on replacement of
parts within certain period of time as critical system function.
ii. Minimum technical support since the system is not locally developed and no
proper technology transfer and product training by technology provider.
Continuous on job training and appointment of management trainees will
ensure the continuity of technological advancement in SCADA system.
iii. Being a closed system that does not allow any integration with other
software or hardware. It is advisable that software selection must consider
the scalability of the database where programming source codes have to be
transferred to user for future usage.
iv. The GSM backhaul used is expensive in long run, unless the system is for
temporary usage such as periodical study. Short term monitoring GSM is
best suit the system. For continuous all year round monitoring and multiple
sensory devices function and execution control, it is advisable to use a

93
permanent data transfer and monitoring backhaul such as Wife or UHF
communication backhaul.
v. The installation of hardware from various models and brands unable to
communicate with the HMI system. By designing an open system with
access protocol interface (API) system application and the appropriate
selection of HMI with database system, it is able to integrate with various
models and brand that come with API.
Some of the water treatment plants are located in remote places and for the
purpose of ground water monitoring system installations and workability of the
monitoring system, therefore the possible base requirement that are to be
considered:
i. It must be an open database system for it to enable hardware from various
brands and model can communicate with the HMI system;
ii. Installed with permanent communicate backhaul with minimum monthly
subscription fees such as Internet WiFi or UHF communication system,
which is the best option for the ground water monitoring system since there
are multiple monitoring well within a specified compound;
iii. Ability for hardware installations to integrate with any communication
system without having expensive hardware or gadgets and costs less
maintenance;
iv. The hardware installation must have safety aspect of the hardware where
sufficient protection against external element to prevent disruption or
damage the hardware itself; and

94
v. Automatically, the hardware must be able to transfer the information without
human interference.
The functions of ground water monitoring system are designed to:
i. Automatically gather continuous water level data at production wells in
operation;
ii. Be able to provide graphical and summary reports, water level historical data
and also record the data collected manually; and
iii. Wireless, easy and friendly access to ground water level data and its reports
anytime, anywhere through web base applications.
4.7.3 Proposed SCADA system in GWRM
The SCADA System proposed for the GWRM system shall be crucial to the
safe operation of the current and future water production wells for AKSB. The
SCADA System allows the water manager to:
i. Monitoring functions:
The effect of ground water level in regards to raw water production;
The peak performance of water level recovery in order to maximize
the capacity of the ground water without affecting the ground water
volume; and
The ground water production volume to ensure the continuity of
water supply as the depletion rate.
ii. Recording function:
95
Fluctuation of the ground water level in natural climatic variation;
Fluctuation in river, canal and lakes for surface water; and
Rain water or precipitation rate.
iii. Study and analysis functions:
Analyse the water level behaviour and interdependency with rain
intensity, river surface level and surface level of water catchment
area such as lake;
Correlate between these 3 above factors to provide a better
understanding on the ground water recovery rate as the catchment
area in terms of provision of raw water supply to the production
well; and
Study the effect and relation between water contamination and
ground water level. As the water production increased, the will be
some depletion of ground water level.
To ensure the stability of communication backhaul with the data
continuously retrieved from the production sites, the web base application system is
used for data retrieval and processes with status reporting via the internet. The
database is connected to the main database in real time via production site data
collection server connected to the central database via wireless backhaul either UHF
antenna or Wi-Fi Mesh network. For monitoring wells application with more than 1
ground water level sensor, the system network proposed as illustrated in Fig. 4.10.

96
Figure 4.10: System Architecture Topology for SCADA System
For monitoring well with only 1 ground level sensor, a GSM system which is
less expensive setup of system network, as illustrated in Fig. 4.11.
Internet
Monitoring
well
Data
Data
Data
Internet
RTU
Server
Data
base
Internet
Data
User
User User

97
Figure 4.11: Wireless System Topology Backhaul for SCADA System.
The hardware consists of RTU and water level sensor which send the water
level readings in 3 domain catogery:
i. Time interval,
ii. Water level.
iii. Time interval and water level.
The Human-Machine Interface (HMI) is a medium of interaction between
human and the sensor devices in data and reporting language. This HMI-system
software combination is based on web base application system that combines data
storage and data management system via Internet. The system can be divided into 3
main system components, namely:
i. Client server system application:
Multiple remote sensor data collection system from within the
specified area and identification tag. The client server system will be
Wireless communication backhaul
Internet

98
installed with hardware system enabler within a specified distance
depending on the communication protocol either RFID, USB,
TCPIP, RS232 or others.
Minimal data storage before transferring it to the server. The system
will store the data reading with in specific time or size so that when
the data failed to be transferred automatically, it is still available to
manual transfer.
Updating the sensor status, power supply status and the
communication signal status and updating it into the server. The
client server system will open data transfer channel in specified time
so that real time data information can be updated into the system
server without having it to become prone to hacking.
Client server browser will enable registered personnel via login ID
and password to access the information on the monitoring site via
public IP.
ii. Web server system application:
Data base management system where every client server from each
site will share their data through automatic push and pull data in one
fixed format.
The web server can also browse the entire client server and do
manual data extraction in case of communication network broken.
The server will provide a mirror database as a backup for the entire
system and details records on every user activity.

99
The server software has interface panel of each monitoring well that
can be projected in real time records where the additional
information such as water quality, water level, production rate,
production volume and other information can be written and
recorded into the database. The interface panel will also retrieve data,
statistic and also graphical reports on each criterion versus any of the
criteria.
Several site visit has been conducted and a number of well has been
identified. All existing and new proposed production wells and monitoring wells are
to be fitted and connected with the Wireless SCADA System. The SCADA software
and hardware are then able to take effective remedial action that could guaranteed
the safety of the public's drinking water.
4.8 GROUNDWATER MONITORING OPERATION PLAN
Groundwater monitoring provides data on groundwater quality and quantity and is
an integral aspect of groundwater management. Continual monitoring of groundwater
assesses the impact of human activities on groundwater systems. Ideally groundwater
monitoring should be carried out regularly in all areas where groundwater resources are
extracted for a variety of uses.

100
4.8.1 Groundwater Monitoring Objectives
The main objectives of groundwater monitoring are:
i. To collect data documenting any change in groundwater storage over
time
ii. To provide both long-term and short-term data necessary to assess
and predict the response of hydrologic systems to natural climatic
variations and human-induced stresses
iii. To establish as accurately as possible the baseline quality of
groundwater occurring naturally in aquifers
iv. To detect trends in the concentrations of these groundwater
constituents, this may pose a risk to human health or impact on other
human activities.
Groundwater monitoring systems must consist, at a minimum, of an
adequate number of wells installed into the aquifers to yield samples that
comprise of:-
a) Groundwater level monitoring
The principle purposes of groundwater level monitoring are to
provide data about groundwater system behaviour and overall impacts on the
groundwater situation caused by groundwater exploitation and other
interventions. Groundwater levels are affected by natural climatic conditions

101
(amount of recharge reaching the aquifer) as well as by a range of human
activities, such as land use and groundwater extraction. It is of vital
importance to monitor changes in the water level within the aquifers as it
helps to manage the groundwater resources properly and plan land use
activities to minimize their impact on the environment. Seasonal and yearly
changes in groundwater levels are represented in a hydrograph.
Frequent (monthly or even weekly) and regular groundwater level
monitoring reveals important elements such as:
The groundwater depth;
The groundwater rising or falling over time;
The effect of irrigation or other management practices have on water
table movement;
The magnitude of effect of rain events on the water table;
The time effects of a rain event on the water table; and
The effect of a prolonged dry spell on the water table.
Data collected over long periods (years) can provide information on
long-term effects of the climate and extraction levels on the aquifer.
b) Groundwater quality monitoring
Groundwater quality monitoring networks provide information on
the chemical status of groundwater systems and the effects on groundwater
quality and establish the presence of any significant upward trend in

102
pollutant concentrations and the reversal of such trends. Groundwater
quality monitoring can be done for the purposes of:-
To understand the current state of water quality in the aquifer
To check compliance with standards
To detect long-term trends in groundwater quality
To determine suitability for specific uses
To understand the causes of salinity
To detect suspected contamination
To prevent and/or remediation of saltwater intrusion in coastal
aquifers
To trace movement of contamination within the aquifer.
Depending on the purpose of the monitoring, a variety of parameters
can be tested. Comprehensive chemical analysis of groundwater involves
specific sampling protocols for different water constituents and
contaminants and some analyses can be done only in a laboratory, as
specialised equipment is necessary. Often only certain parameters pertaining
to a specific problem are tested.
Electrical conductivity (EC) is one of the most important and
commonly measured parameters. It provides information on the salt content
(salinity) of groundwater. Seawater intrusion, the most common pollutant of
fresh groundwater, is a growing problem in areas where coastal aquifers are
used as a source of drinking water for growing populations of coastal
103
communities. As little as 2% seawater in freshwater can render the water not
potable. The salinity of the groundwater also determines its uses in
agriculture and industry. Long-term salinity monitoring helps identify and
possibly prevent and/or remedy problems of groundwater salinity.
c) Monitoring groundwater discharge and abstraction
Data on the amount of groundwater discharged from the groundwater
system through different manners (springs, wells, etc.) is indispensable
information for groundwater resources assessment and in particular for
estimates of the potential of the system for water supply. Daily volume of
groundwater abstraction is necessary to be collected.
At present, the volume of groundwater abstraction for individual
production wells is monitored at only at Kg. Puteh wellfield. The rest of the
wellfield, only the total estimation of the abstraction from the wellfields was
recorded.
d) Monitoring seawater intrusion
Seawater intrusion occurs when natural discharge and abstraction of
groundwater in a coastal zone exceed average groundwater recharge and
inflow. The key to controlling this problem is to maintain the proper balance
between water being pumped from the aquifer and the amount of water
recharging it. Constant monitoring of the seawater interface is necessary in
determining proper control measures.

104
e) Land Subsidence
The land subsidence measurement is an important monitoring for the
groundwater environment because land subsidence is one of the negative
impacts caused by groundwater over extraction. The previously installed
land subsidence measurement network at the locations shown in Table 4.8
and the Figure 4.12 and the monitoring work should be conducted regularly.
Table 4.8: List of Land Subsidence monitoring location.
Bil Location Type X Y Elevation
1 Wakaf Bharu Benchmark 468423.7 677043.1 5.155
2 Wakaf Bharu TBM 468483.7 677037.1 N/A
3 Wakaf Bharu TBM 468404.7 677015.1 N/A
4 Wakaf Bharu TBM 468454.7 676980.1 N/A
5 Kenali Benchmark 477399 673992 7.713
6 Kenali TBM 477300 674075 N/A
7 Kenali TBM 477324 674011 N/A
8 Kenali TBM 477435 673909 N/A
9 Pasir Hor Benchmark 474626 673138 3.843
10 Pasir Hor TBM 474635 673113 N/A
11 Pasir Hor TBM 474670 673197 N/A
12 Pasir Hor TBM 474719 673239 N/A
13 Pintu Geng Benchmark 471758 674359 5.724
14 Pintu Geng TBM 471777 674362 N/A
15 Pintu Geng TBM 471800 674405 N/A
16 Pintu Geng TBM 471708 674396 N/A

105
Figure 4.12: Location of the existing land subsidence monitoring datum.
4.8.2 Management Concept
The management of the complete groundwater resource management system
uses the groundwater model, whereby the amount of infiltration water from the
source, i.e. Kelantan River and surface runoff, is calculated from the observed flow
from the sources. This model is further employed to control the groundwater flow in
the management area. In Fig. 4.13, summarizes the flow processes of groundwater
monitoring concept in GWRM system.

106
Figure 4.13: Summary of groundwater monitoring system.
GROUNDWATER MONITORING
MONITORING OF GROUNDWATER
CHEMICAL STATUS
LEVEL MONITORING NETWORK
MONITORING OF GROUNDWATER
QUALITATIVE STATUS
SURVEILLANCE
MONITORING
OPERATIONAL
MONITORING
Purpose:
Provide data to (a)Supple -
ment and validate risk (b)
Help assessment trends in
pollutants and natural
trends (c) Inform the
design of the operational
monitoring network
Where:
Sufficient points in bodies,
at risk and not at risk to
achieve the purpose.
Sufficient points in cross-
border bodies to assess risk
to all uses
What: O2, pH, NO3, NH4,
conductivity. Indicators of
pollutants relevant to the
risks to the objectives or to
uses of transboundary
groundwater flow
When:
For each plan period
Purpose:
Provide data to (a)
Establish the status of
bodies at risks; (b) the
presence ogb trends in
pollutant concentrations;
and (c) the reversal of such
trends
Where:
Sufficient points in bodies,
at risk to reliably classify
the bodies (e.g confidence
level in model) and des-
cribe significant pollutant
trends.Sufficient points in
cross-border bodies
What:
Indicators for pollutants
causing the bodies to be at
risk
When:
Periods between
surveillance monitoring at
sufficient frequency to
detect impacts but
minimum of once per
annum
Purpose: Provide validate conceptual model of groundwater flow system, to enable classification of status calculation of available raw water resource & estimation of flows across boundary
Where:
Sufficient points in bodies,
at risk and not at risk to
adequately validate the
conceptual model
What:
Data on levels, monsoon
flows, base-flows in rivers
for validating conceptual
model
When:
Sufficient frequency to
distinguish short and long
term variations in recharge
from the abstraction and
discharges

107
4.9 CREATION AND CALIBRATION OF HYDROGEOLOGICAL MODELS
4.9.1 Introduction
A major concern in Malaysia in recent years is the development of water
management policies. The groundwater usage and preservation of ecosystem are
not being monitored enough. This brings much anxiety to the Government and
public alike, recognizing the future potential of groundwater as an important source
of water for the country.
One of the main tasks under the present study is the creation and calibration
of groundwater model. Models are tools that often used during the investigations of
groundwater resources and abstraction of an area. Models are also commonly used
in investigation of water abstraction in connection with groundwater contamination
and stream flow depletion. The data obtained from the existing setup and collected
from the surveys carried out will be evaluated and optimally interpreted. The results
from the interpretation are usually presented in relation with the geographical
location, using tools like GIS software to achieve the purposes. The model will
address the needs of existing and future management of groundwater in Kelantan by
proposing affordable short-term and long-term development plan for the
groundwater monitoring in the new and existing wells within the study area,
consistent with the Government, other stakeholders and community expectations.

108
In this scope of the study, the creation and calibration of flow model is
critical and entails the very importance of this exercise in the whole study.
Nevertheless, the large of area of northern Kelantan limits the effort to create such a
comprehensive model in this study. To the order of good representation for the
whole study area, it is decided that the creation and calibration the flow model to be
concentrated in a Pilot Project Area (Figure 4.18) which involved the followings:
i. Construction of the Hydrogeological Conceptual Model
ii. Construction, Run, Calibration and Validation of flow model of multilayered
aquifer using MODFLOW Software for transient flow. Output of the
modelling work shall consists:
Water balanced of the modelled area
Sustainable amount of groundwater for development
Delineation of the flow direction to well-field and well-field capture
zones
iii. Simulation of few scenarios to ascertain future conditions.
The proposed groundwater model will provide the AKSB and other
interested parties a critical management tool. The model will be used to test out
possible future scenarios of groundwater use and how they would impact water
levels for other neighboring users. It would help to ascertain whether there would be
a need to lower pumps, re-drill wells, or in extreme cases even draw water from
another aquifer. AKSB And Geological Survey staffs could modify the current
model as needed to test various scenarios of concern. These scenarios could involve

109
a point demand such as how will a major industry such as a textiles impact this
resource if additional demand is placed on the North Kelantan, or how would the
aquifer be impacted if a major industry converts from using groundwater to surface
water as a source water to meet its needs.
Other scenarios could involve how changes in agricultural demand could
impact the Kelantan aquifer, the spreading out of community demands through
different configurations of supply wells, or even impacts of global warming and
associated possible climate change on recharge rates and ultimately supply within
the Kelantan Aquifer. Thus, this management tool can be use to foreworn
communities of possible impacts on neighbours from the impact of major new
groundwater users hence allowing for accommodations prior to impacts and thus
avoiding costly laws suits as communities are surprised by impacts that were not
expected.
4.9.2 Transient State Groundwater Modelling
4.9.2.1 Introduction
In this chapter, the transient state groundwater modelling is
discussed. The discussions focus on the background to transient model
simulation and its parameterizations. The model calibration as well as
the sensitivity analysis with the model are also discussed. A calibrated
transient model has been proposed and validated. The model has been

110
used to assist the design and installation of the horizontal well and
horizontal well collector.
4.9.2.2 Background to Transient State Modelling
Transient simulations are needed to analyse time-dependent
problem and typically begins with steady state initial conditions
(Anderson and Woessner, 1992). The transient modelling is more
complicated as the storage properties and starting head must be
defined. The time dimension must also be discritized and the
hydrologic stresses may propagate to boundaries. The objective of
transient simulation is generally to predict head distributions at
successive times, given the initial head distribution, the boundary
conditions, the hydraulic parameters and external stresses (McDonald
and Harbaugh, 1988).
In this modelling study, the transient modelling has been
carried out since the model can be used to evaluate the transient
effect of recharge on groundwater resource and future planning of plant
development. This can be done by assigning the different recharge
inputs estimated from the average monthly rainfall and examine the
change in hydrogeological conditions such as water levels. It is
assumed that the stress imposed on the system will not propagate to
the boundary.
111
The period for the transient simulations of the area is from
2000 to 2005. The aims of the transient modelling is to reproduce field
water level hydrographs (monthly basis) for a few selected boreholes in
the catchments.
There are some special needs for transient simulations as
described by Anderson and Woessner (1992) are discussed below;
i) Storage Parameters
In this modelling study, the confining layer which is the silty
clay has also been modelled, so the layer should also be assigned the
storage parameter which is specific yield (Sy) in this case.
ii) Stress Period and Time Step
In transient modelling, the simulation time is divided into stress
periods, the time intervals during simulation which all the external
stresses are constant. In turn, a stress period is divided into time steps
(McDonald and Harbaugh, 1988). Modflow groundwater model allows
the use of stress periods which may have variable length. The use of
stress periods offer the option of changing some of the parameters or
stresses while the simulation is on progress. Modflow also use a time
step multiplier which may be reset at the beginning of each stress
period with a new time step. Selection of the time step in transient
simulation is critical steps in model design because the value of time

112
discretezation strongly influence the numerical results. Space
discretezation also has a strong influence on numerical analysis.
For this transient state modelling, each month from 2009 to
2010 will be treated as one stress period with pumping stresses
remain unchanged.
This modelling study also assumed that the water abstractions
for each stress period remain the same and would not have any effect
on model solution. A reason which leads to this assumption was that
the monthly abstraction data is not available. It is also assumed that
the steady state boundary conditions would not affect model solution.
4.9.2.3 Groundwater Modeling
i. Modelled area
The area to be modelled for this project is shown in Figure
4.14. The regional conceptual model was developed for the area with
few assumptions on the aquifer layers and hydraulic properties. The
model was calibrated and validated against the measured field data
on water levels.
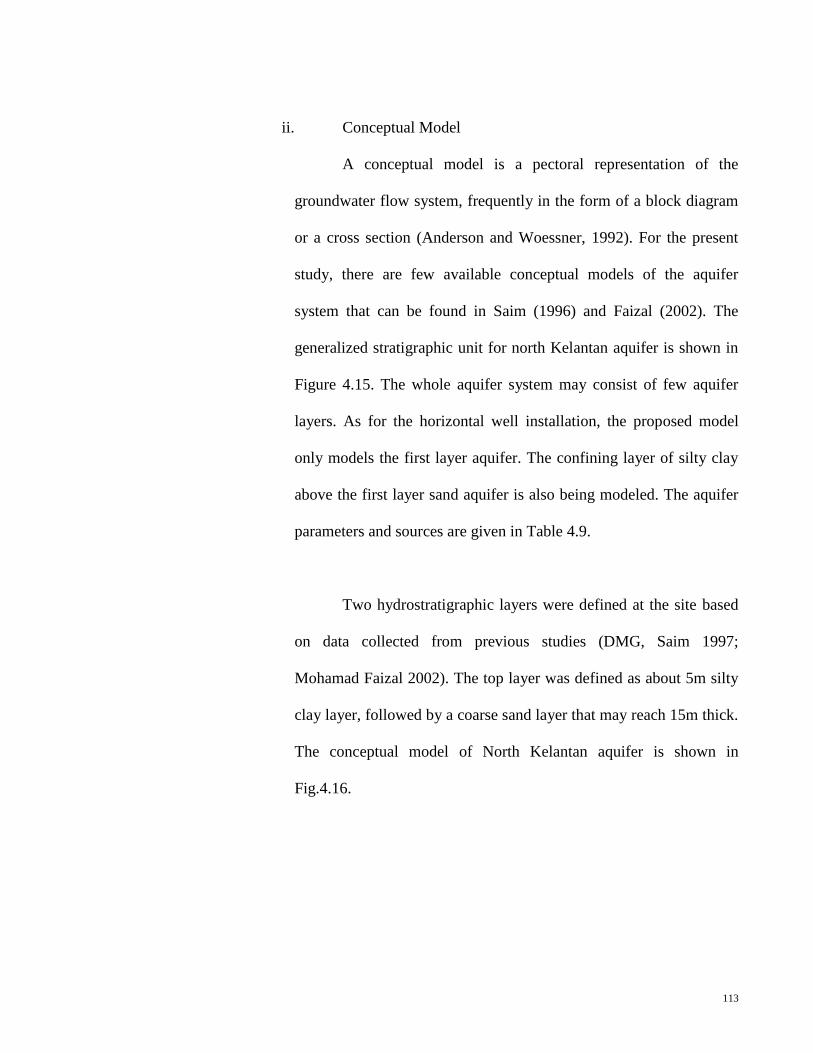
113
ii. Conceptual Model
A conceptual model is a pectoral representation of the
groundwater flow system, frequently in the form of a block diagram
or a cross section (Anderson and Woessner, 1992). For the present
study, there are few available conceptual models of the aquifer
system that can be found in Saim (1996) and Faizal (2002). The
generalized stratigraphic unit for north Kelantan aquifer is shown in
Figure 4.15. The whole aquifer system may consist of few aquifer
layers. As for the horizontal well installation, the proposed model
only models the first layer aquifer. The confining layer of silty clay
above the first layer sand aquifer is also being modeled. The aquifer
parameters and sources are given in Table 4.9.
Two hydrostratigraphic layers were defined at the site based
on data collected from previous studies (DMG, Saim 1997;
Mohamad Faizal 2002). The top layer was defined as about 5m silty
clay layer, followed by a coarse sand layer that may reach 15m thick.
The conceptual model of North Kelantan aquifer is shown in
Fig.4.16.
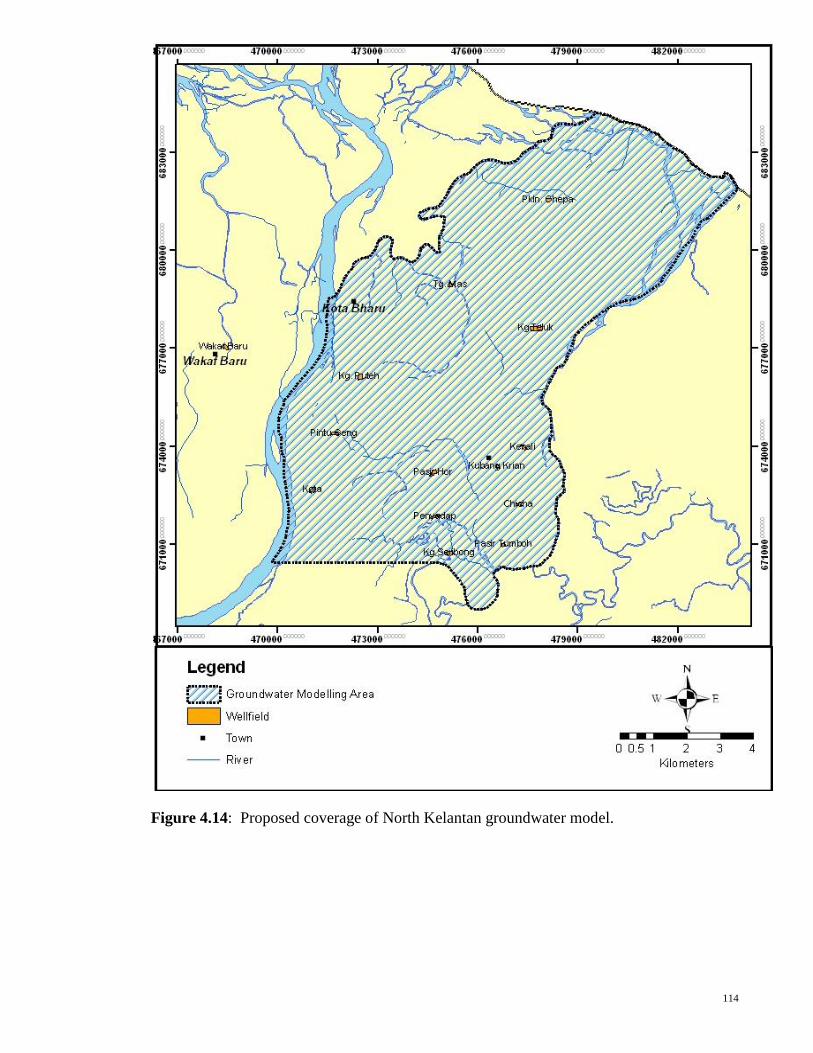
114
Figure 4.14: Proposed coverage of North Kelantan groundwater model.

115
Table 4.9 : Model Parameters and Sources
Item Parameter Source
1 Model boundaries
Northern and Eastern boundary
Western boundary
Southern boundary
Saim (1997) and Mohamad Faizal (2002)
Geology, hydrogeology map, JMG reports
2 Model layer Saim (1997) and Mohamad Faizal (2002)
Borehole information, JMG report
3 Aquifer Thickness
and bottom elevation
Borehole information, JMG report
Saim (1997) and Mohamad Faizal (2002)
4 Aquifer hydraulic conductivity Saim (1997) and Mohamad Faizal (2002)
JMG reports, established value,
5 Recharge Estimation from Rainfall data (Jan 2000 –
Dec 2005) & (Jan2009 – Dec 2010)
6 Water abstraction Air Kelantan Sdn. Bhd.
JMG records
7 Groundwater level JMG records

116
Figure 4.15: Generalized hydrostratigraphy of North Kelantan aquifer

117
Figure 4.16 : Conceptual model of North Kelantan Aquifer

118
4.9.2.4 Numerical Modeling
Groundwater modeling is accomplished by using MODFLOW a
modeling program developed by the USGS. This is the most widely used
finite-difference groundwater model and considered a standard for
groundwater modeling. The development of input files are compiled using
Visual Modflow a commonly used pre-processor of data that is used to
speed up and facilitate the development of the MODFLOW model. The
proposed pilot groundwater model for North Kelantan is shown in Figure
4.17.
A 3-dimensional representation of the Site was created in Visual
MODFLOW. This model domain was created as a 17200m by 17200m
mesh in the X and Y (corresponding with east-west and north-south,
respectively) directions, respectively, with a general uniform grid spacing of
345m between grid nodes (Figure 4.17). Vertically, the grids are refined to:
i. 0.2 m uniform spacing between nodes in the area around Pintu Geng
well field.
ii. 23m uniform spacing between nodes around the active pumping well
fields. However Pengkalan Chepa (inactive well field) also included
for prediction purpose.
iii. 69m uniform spacing between nodes of the pumping well fields in
the area where groundwater development takes place (Figure 4.17).

119
Horizontally, finer spacing is designed for the well field in Pintu
Geng up to 8 inch (0.2m) x 1m grid size in order to handle the horizontal
well designed diameter, as a result, the horizontal refining process was only
limited to immediate area around the Pintu Geng because the maximum
number of rows in Modflow discretization process shouldn’t exceed 499
rows.
The discretization of the modelled area consists of 50 columns and
50 rows. The areas surrounding the modelled area are made inactive. A
digitized map of the study area was superimposed on the model as a base
map. The model consists of two layers. These include layer1 ( 4 m of silty
soil) and layer 2 ( 10m of coarse sand) which represents the shallow aquifer
in the Kelantan area. The less permeable layer on the surface that partially
confined the aquifers has been modelled as a continuous layer with a
reasonable value of hydraulic conductivity (1E-7 m/s).
4.9.2.5 Boundary Conditions
As shown in Figure 4.16, the South China Sea in the north-eastern
boundary of the modelled area was assigned as constant head. River
boundaries were assigned for the northern, eastern (and south-eastern), and
western edges of the modelled area which bound by three rivers which
namely include Pengkalan Chepa, Pengkalan Datu, and Kelantan. All the

120
rivers have been modelled using the River Package of MODFLOW
groundwater model.
A value of between 5% and 20% of annual precipitation is
recommended as an estimate of recharge when other data are not available
(Waterloo, 2005). Based on this guidance, recharge was set equal to 12% of
average annual precipitation subject to revision through model calibration
and validation.

121
Figure 4.17: Proposed coverage of North Kelantan aquifer system with the model grid area for
pilot aquifer model

122
4.9.2.6 Model Calibration and Validation
The Visual MODFLOW model was run at transient state then
calibrated to hydraulic heads recorded in monthly rate from January 2000 to
December 2005 at six groundwater monitoring wells for calibration. Table
4.10 presents parameters of the calibrated model. Most of the groundwater
monitoring wells are located outside the well field and within the modelled
area.
Model calibration consists basically of modifying the recharge and
conductance parameters to minimize the error between predicted and
observed heads. Estimated recharge rate is to be 12% of the rainfall. The
model validated to hydraulic heads recorded in monthly rate from January
2009 to December 2010 at six groundwater monitoring wells located on-site.
Estimated recharge rate is 12% of the average rainfall.

123
Table 4.10 : Parameters to be used for the Calibrated Model
Parameter Value
Zone 1 (Silt) Zone 2 (coarse sand) Zone3 (Fine sand)
Kx (m/s) 1E-7 0.006 0.0002
Ky(m/s) 1E-7 0.006 0.0002
Kz(m/s) 1E-8 0.0006 1E-5
Ss 1E-5
Sy 0.27
Recharge 12% of rainfall
Total Porosity 0.20
Effective
porosity 0.11
Kelantan River Pengkalan Datu Pengkalan Chepa
Conductance
(m2/day)
309 305 278
Groundwater
pumping
(m3/day)
Kubang
Kerian
Pasir
Hor
Pintu
Geng
Pasir
Tumboh
Kg
Sbg Kota
Kg
Puteh Pdp
10800 14680 8000 4200 7800 10000 27200 8800
4.9.2.7 Calibration Results
Model calibration is aimed at minimizing the normalized residual
mean squared (nRMS) error and maximizing the correlation coefficient (r)
between predicted and observed groundwater heads by modifying the
conductance parameters and recharge parameters. Usually in the early stages
of any simulation, any model experiences some instability due to un-
equilibrium condition. Thus, the earlier stages of the current model
Kg: Kampung (village); Sbg: Seribong; Pdp: Penyadap

124
simulation are considered the stages of un-equilibrium between aqueous and
dry phases.
Following calibration, of the MODFLOW groundwater flow model
exhibits nRMS and r ranges between 19 67 % and 0.70 0.90 respectively
as presented in the calibration plots for the calculated and observed heads
(Figures 4.18 to 4.25). Figure 4.26 illustrates the simulated and observed
head versus time. The storage is 80,655,448 m3/day and the model was
calibrated up to 95% confidence interval.
Figure 4.18: Calibration scatter plot – stress period 35

125
Fig.4.19: Calibration scatter plot – stress period 38
Figure 4.20: Calibration scatter plot – stress period 41

126
Fig. 4.21: Calibration scatter plot – stress period 44
Fig. 4.22: Calibration scatter plot – stress period 50
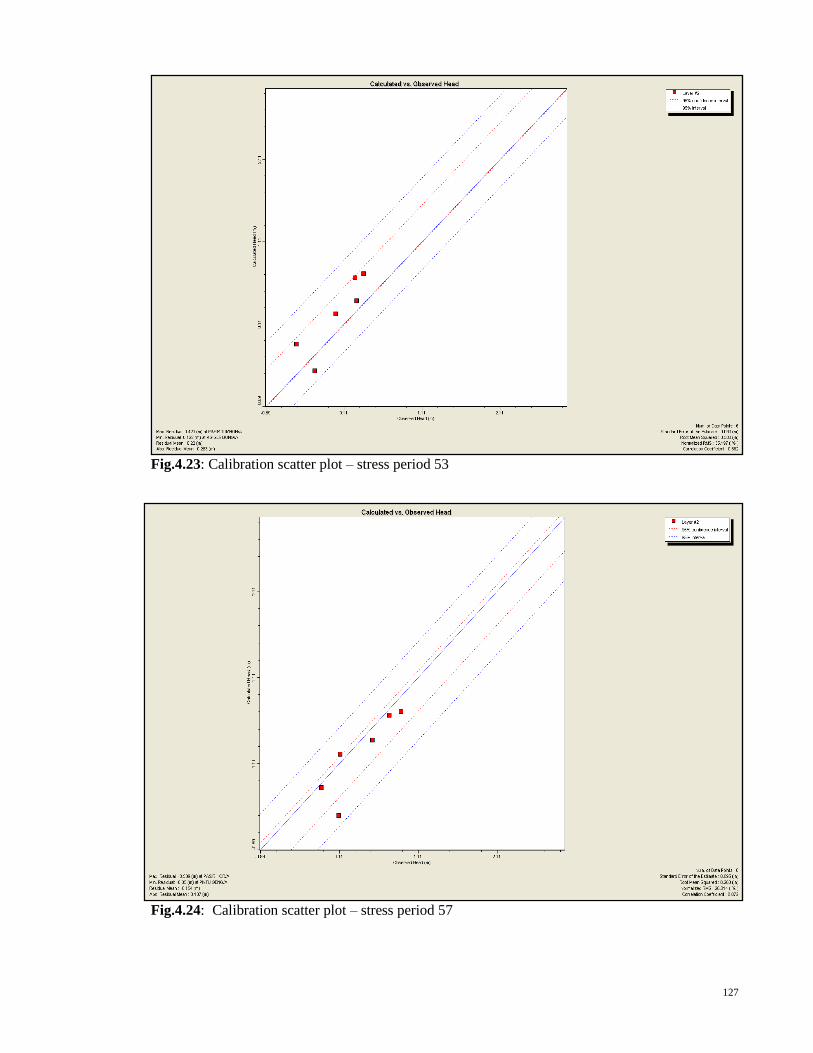
127
Fig.4.23: Calibration scatter plot – stress period 53
Fig.4.24: Calibration scatter plot – stress period 57

128
Fig.4.25: Calibration scatter plot – stress period 62
Fig. 4.26: Head versus time during the calibration period

129
4.9.2.8 Validation
For validation process, a transient simulation of groundwater heads
was performed and then the calculated values were compared to most recent
set of transient data of groundwater heads and rainfall (estimated recharge)
recorded during the period January 2009 – December 2010.
Following calibration, of the MODFLOW groundwater flow model
exhibits nRMS and r ranges between 20 46% and 0.75 0.86 respectively
as presented in the calibration plots for the calculated and observed heads
(Figures 4.27 to 4.34). Figure 4.35 illustrates the simulated and observed
head versus time. The model was calibrated up to 95% confidence interval.
The results of the model validation indicate that predicted head
values correlate well with heads observed compared to calibration period.

130
Fig.4.27: Calibration scatter plot – stress period
Fig.4.28: Calibration scatter plot – stress period

131
Fig.4.29: Calibration scatter plot – stress period
Fig.4.30: Calibration scatter plot – stress period 13

132
Fig.4.31: Calibration scatter plot – stress period 16
Fig.4.32: Calibration scatter plot – stress period 17
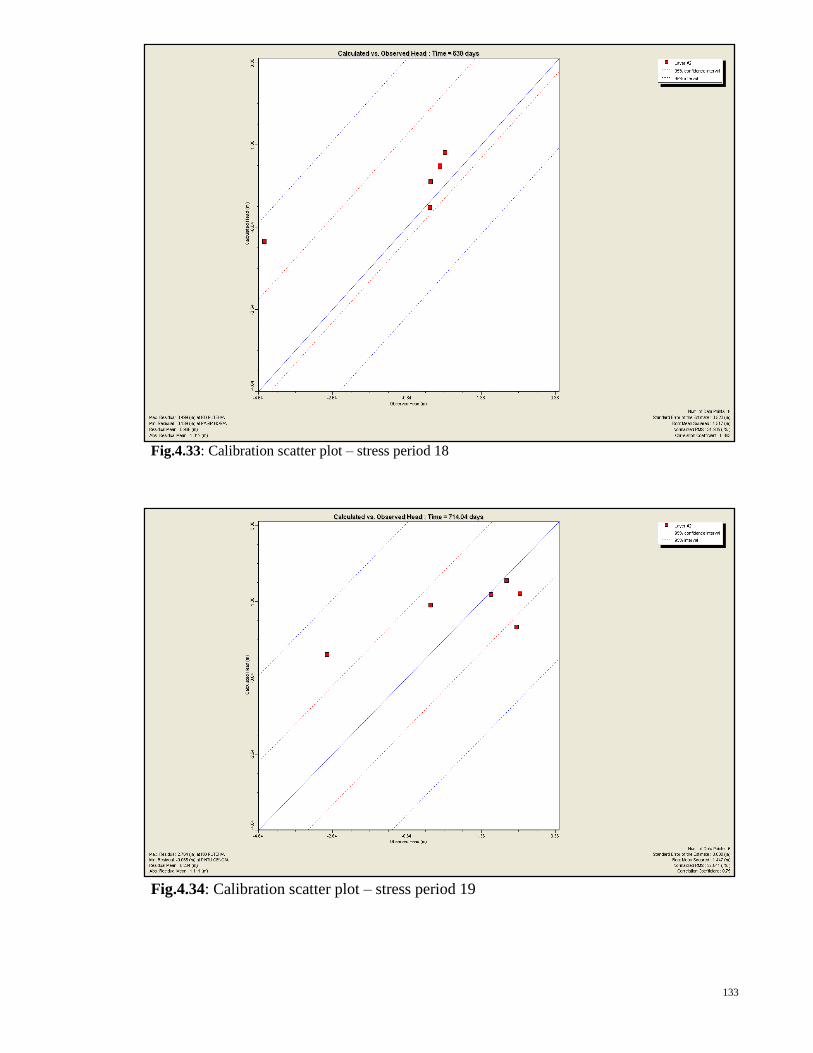
133
Fig.4.33: Calibration scatter plot – stress period 18
Fig.4.34: Calibration scatter plot – stress period 19

134
Fig.4.35: Head versus time during the validation period
4.10 MODEL RESULTS
4.10.1 Updating Hydrogeological Information: Groundwater head and flow
pattern
In general groundwater in the aquifer layer flows towards the South China
Sea and nearby rivers under normal conditions. However, at present time,
groundwater is flowing towards the well fields to support the abstraction rate
(Figure 4.36).

135
Some of the groundwater flows towards the sea especially in the lower part
of the basin. Rivers also support the abstraction rate by the well fields (Fig. 4.36).
Groundwater head ranges between 0.0 -6.0 m (m.s.l) upstream part of the
modelled area where groundwater development steadily and extensively takes place.
Fig. 4.36: Groundwater head and flow pattern
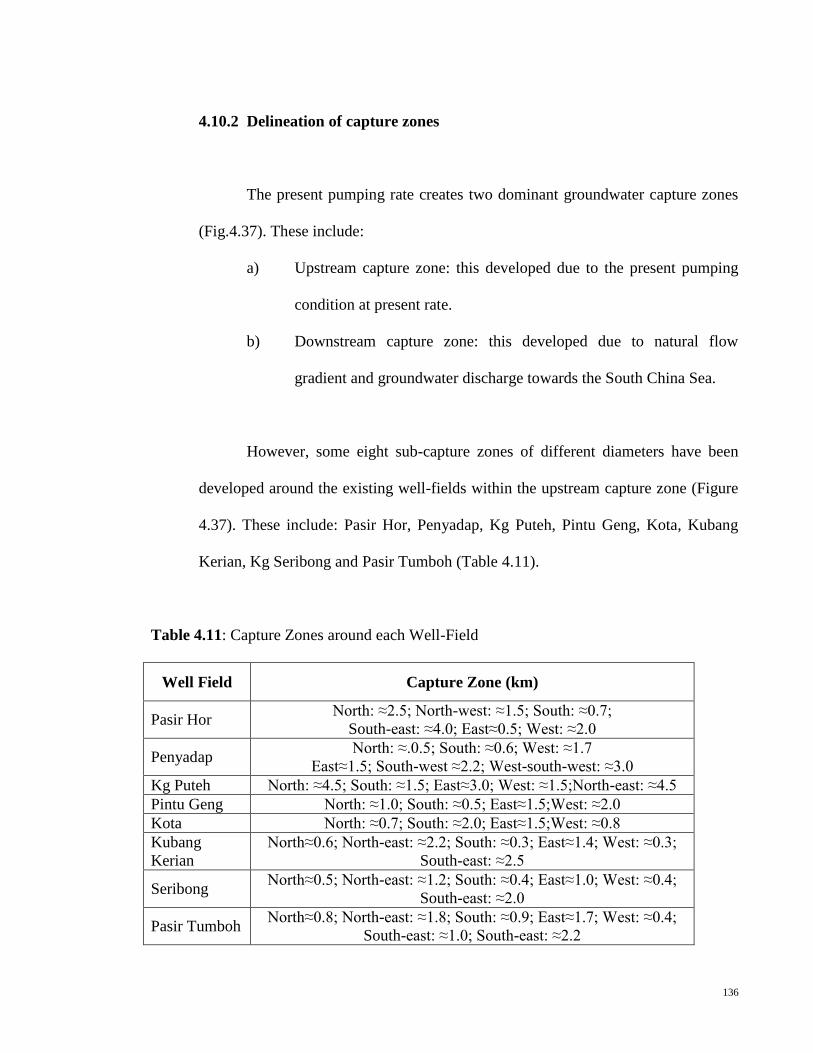
136
4.10.2 Delineation of capture zones
The present pumping rate creates two dominant groundwater capture zones
(Fig.4.37). These include:
a) Upstream capture zone: this developed due to the present pumping
condition at present rate.
b) Downstream capture zone: this developed due to natural flow
gradient and groundwater discharge towards the South China Sea.
However, some eight sub-capture zones of different diameters have been
developed around the existing well-fields within the upstream capture zone (Figure
4.37). These include: Pasir Hor, Penyadap, Kg Puteh, Pintu Geng, Kota, Kubang
Kerian, Kg Seribong and Pasir Tumboh (Table 4.11).
Table 4.11: Capture Zones around each Well-Field
Well Field Capture Zone (km)
Pasir Hor North: ≈2.5; North-west: ≈1.5; South: ≈0.7;
South-east: ≈4.0; East≈0.5; West: ≈2.0
Penyadap North: ≈.0.5; South: ≈0.6; West: ≈1.7
East≈1.5; South-west ≈2.2; West-south-west: ≈3.0
Kg Puteh North: ≈4.5; South: ≈1.5; East≈3.0; West: ≈1.5;North-east: ≈4.5
Pintu Geng North: ≈1.0; South: ≈0.5; East≈1.5;West: ≈2.0
Kota North: ≈0.7; South: ≈2.0; East≈1.5;West: ≈0.8
Kubang
Kerian
North≈0.6; North-east: ≈2.2; South: ≈0.3; East≈1.4; West: ≈0.3;
South-east: ≈2.5
Seribong North≈0.5; North-east: ≈1.2; South: ≈0.4; East≈1.0; West: ≈0.4;
South-east: ≈2.0
Pasir Tumboh North≈0.8; North-east: ≈1.8; South: ≈0.9; East≈1.7; West: ≈0.4;
South-east: ≈1.0; South-east: ≈2.2
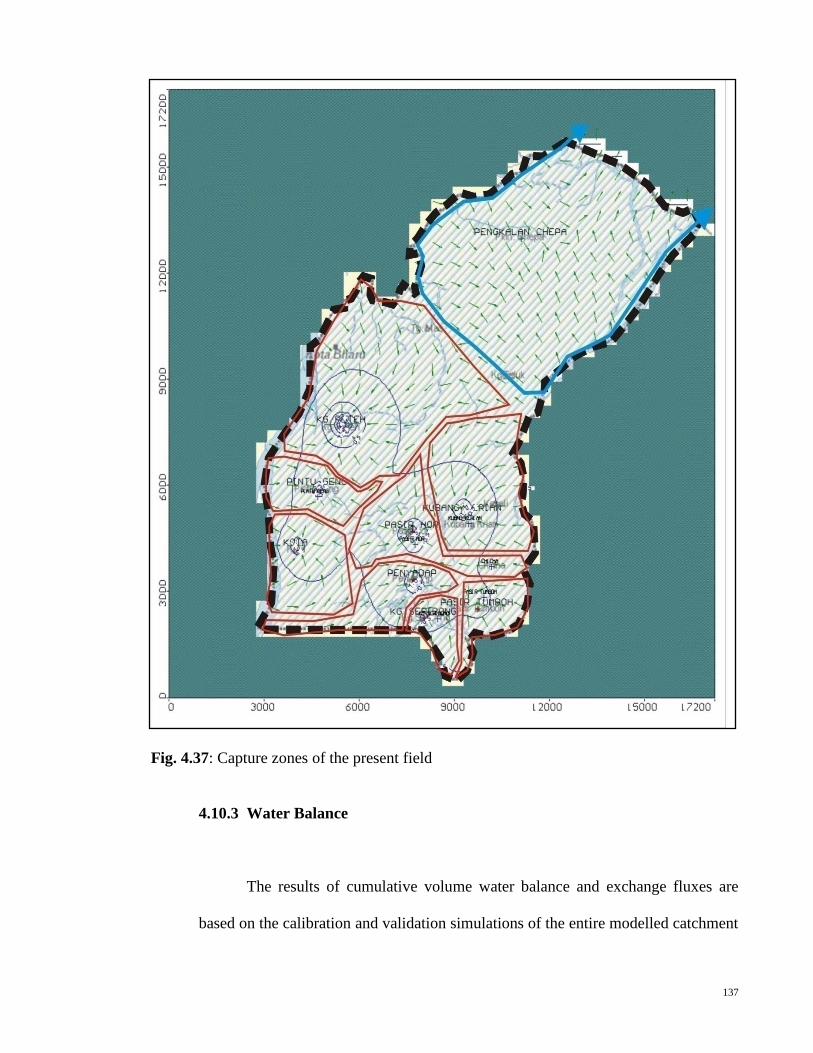
137
Fig. 4.37: Capture zones of the present field
4.10.3 Water Balance
The results of cumulative volume water balance and exchange fluxes are
based on the calibration and validation simulations of the entire modelled catchment
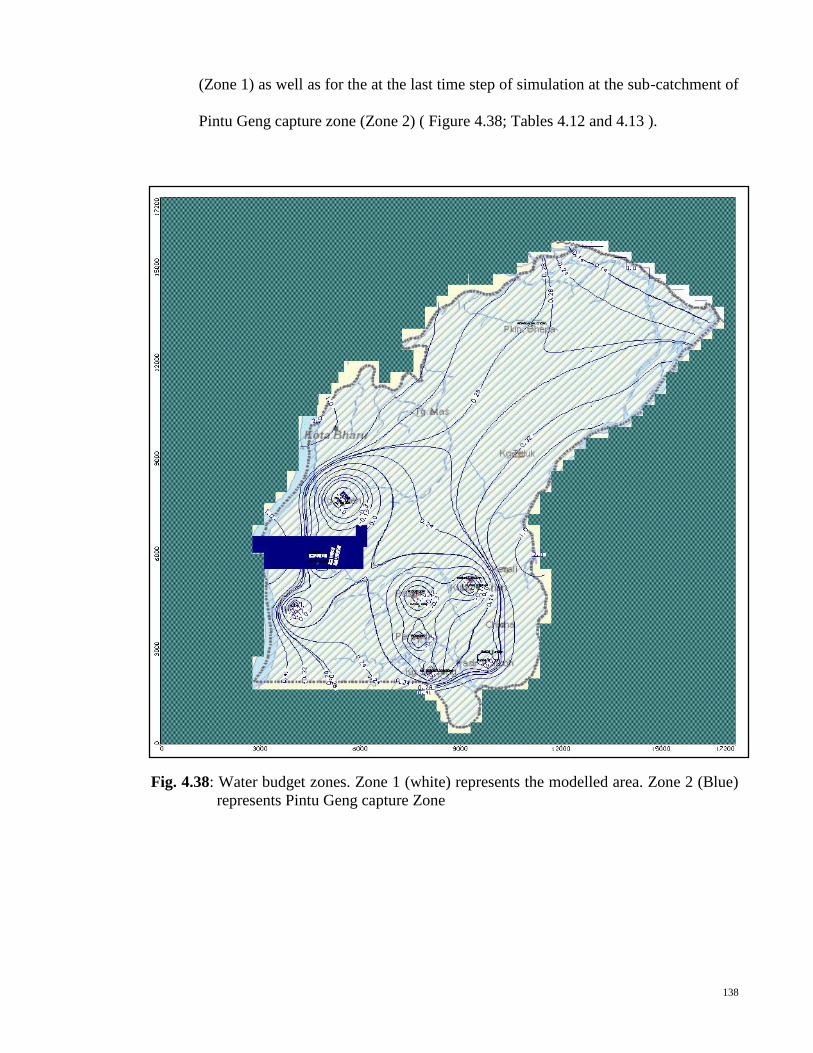
138
(Zone 1) as well as for the at the last time step of simulation at the sub-catchment of
Pintu Geng capture zone (Zone 2) ( Figure 4.38; Tables 4.12 and 4.13 ).
Fig. 4.38: Water budget zones. Zone 1 (white) represents the modelled area. Zone 2 (Blue)
represents Pintu Geng capture Zone
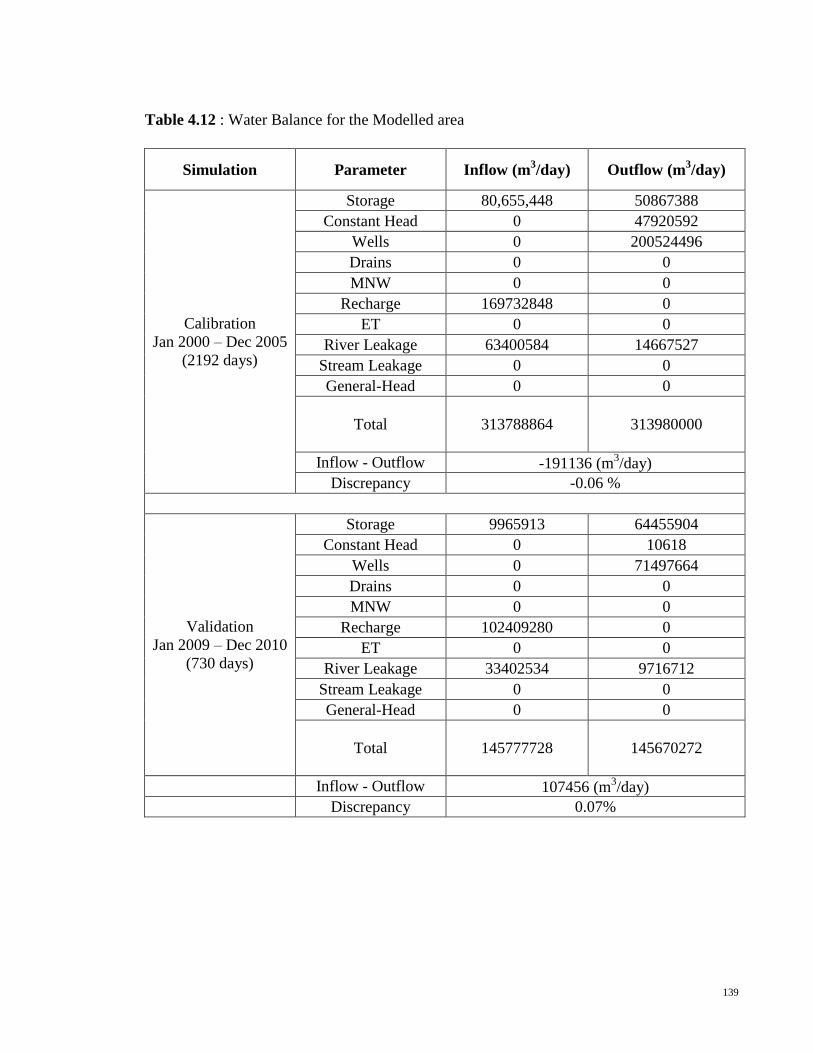
139
Simulation Parameter Inflow (m3/day) Outflow (m
3/day)
Calibration
Jan 2000 – Dec 2005
(2192 days)
Storage 80,655,448 50867388
Constant Head 0 47920592
Wells 0 200524496
Drains 0 0
MNW 0 0
Recharge 169732848 0
ET 0 0
River Leakage 63400584 14667527
Stream Leakage 0 0
General-Head 0 0
Total 313788864
313980000
Inflow - Outflow -191136 (m3/day)
Discrepancy -0.06 %
Validation
Jan 2009 – Dec 2010
(730 days)
Storage 9965913 64455904
Constant Head 0 10618
Wells 0 71497664
Drains 0 0
MNW 0 0
Recharge 102409280 0
ET 0 0
River Leakage 33402534 9716712
Stream Leakage 0 0
General-Head 0 0
Total 145777728
145670272
Inflow - Outflow 107456 (m3/day)
Discrepancy 0.07%
Table 4.12 : Water Balance for the Modelled area

140
Table 4.13: Water Budget for Zone 2 (Pintu Geng Capture Zone)
Simulation Parameter Inflow (m3/day) Outflow (m
3/day)
Calibration
Jan 2000 – Dec 2005
(2192 days)
Storage 2619.3 0
Constant Head 0 0
Wells 0 8000
Drains 0 0
MNW 0 0
Recharge 0 0
ET 0 0
River Leakage 2349.6 14667527
Stream Leakage 0 0
General-Head 0 0
Zone 1 to 2 5370.9 -
Zone 2 to 1 - 2464
Inflow - Outflow 10340 - 10464 = -124.1 (m3/day)
Discrepancy -1.19%
Validation
Jan 2009 – Dec 2010
(730 days)
Storage 3351.7 0.44259
Constant Head 0 10618
Wells 0 71497664
Drains 0 0
MNW 0 0
Recharge 0 0
ET 0 0
River Leakage 6465 9716712
Stream Leakage 0 0
General-Head 0 0
Zone 1 to 2 3940.6 -
Zone 2 to 1 - 5656.9
Inflow - Outflow 13757 – 13657 = 99.997 (m3/day)
Discrepancy 0.73%

141
4.10.4 Scenarios
i. Impacts of Pintu Geng Horizontal Collector Well (PGHCW)
Different scenarios were run to investigate the impact of
pumping of PGHCW on the groundwater head and drawdown inside
the PGHCW itself and also within a radius of some 300 m from the
Pintu Geng well-field.
The horizontal wells were modeled using the Drain package
of Modflow model. The horizontal well (drain) is 0.2m diameter and
50m long. The horizontal wells flow to the central collector well
having diameter of 3m. The model setup for the horizontal and
collector wells is shown in Fig. 4.39. The centre of the horizontal
well (drain) was assigned as the drain elevation. The hydraulic
conductivity within the drain was assigned thousand times higher
compared to the aquifer value. The drain bed material was assumed
to be the same as the aquifer material.
The results are presented in Table 4.14. The model
demonstrates that under natural flow condition at -3 m depth, the six
collectors (drains) may tap a volume of groundwater ranges between
19,200 – 43,700 m3/day (12% of stress periods are above 30.000
m3/day). The variation in the rate is due to the variation in the

142
recharge input (12% of the monthly rainfall. This rate is feasible if
considering that the model is running the pumping for 24 hour a day,
while in reality pumping process is much less lasting than in the
model. On the other hand, it seems that as much as deepening the
location of the collectors (drains) is considered i.e. up to -6 m, the
more water can be tapped (Table 4.14). This situation is basically
due to the remarkable increase of hydraulic gradient which in turn,
increases the rate of groundwater flow into the drains regardless the
seasonal fluctuations of the watertable. In both cases the predicted
drawdown of 0.5 – 1.0 m (Figures 4.40 and 4.41) is within the safe
limit (maximum limit is 3 m for this area around the PGHCW).
Fig. 4.39: Layout of Pintu Geng well-field and the horizontal well PGHCW
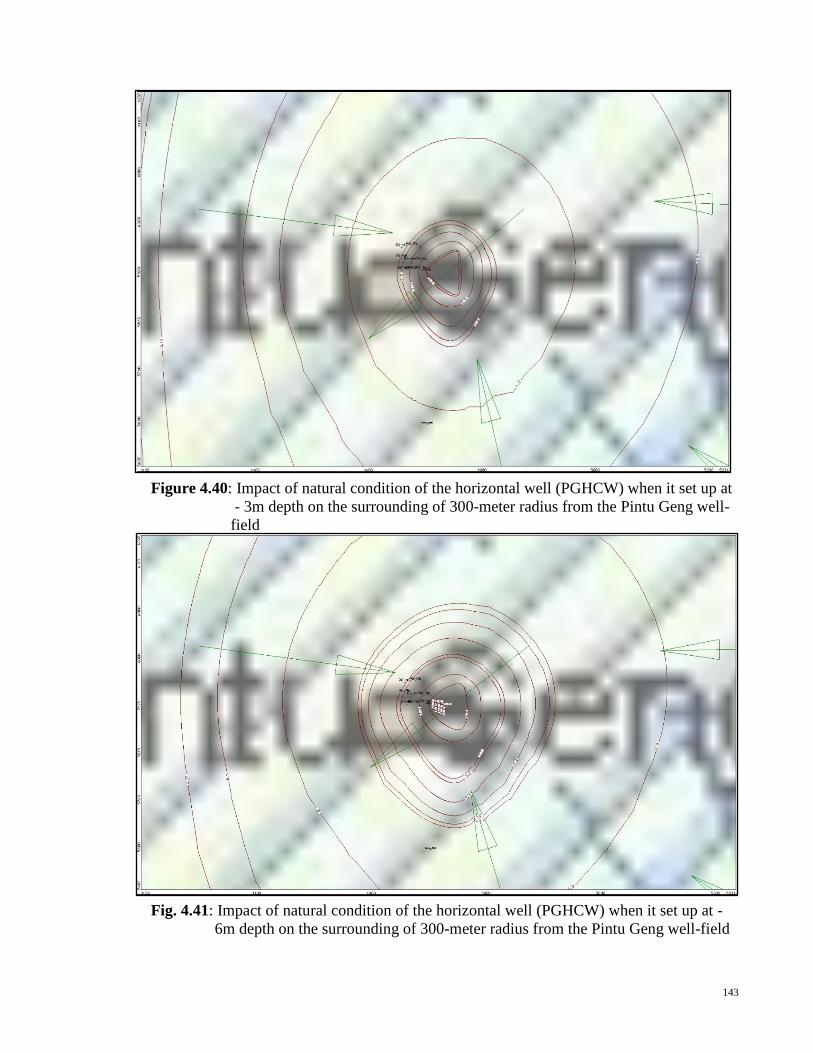
143
Figure 4.40: Impact of natural condition of the horizontal well (PGHCW) when it set up at
- 3m depth on the surrounding of 300-meter radius from the Pintu Geng well-
field
Fig. 4.41: Impact of natural condition of the horizontal well (PGHCW) when it set up at -
6m depth on the surrounding of 300-meter radius from the Pintu Geng well-field
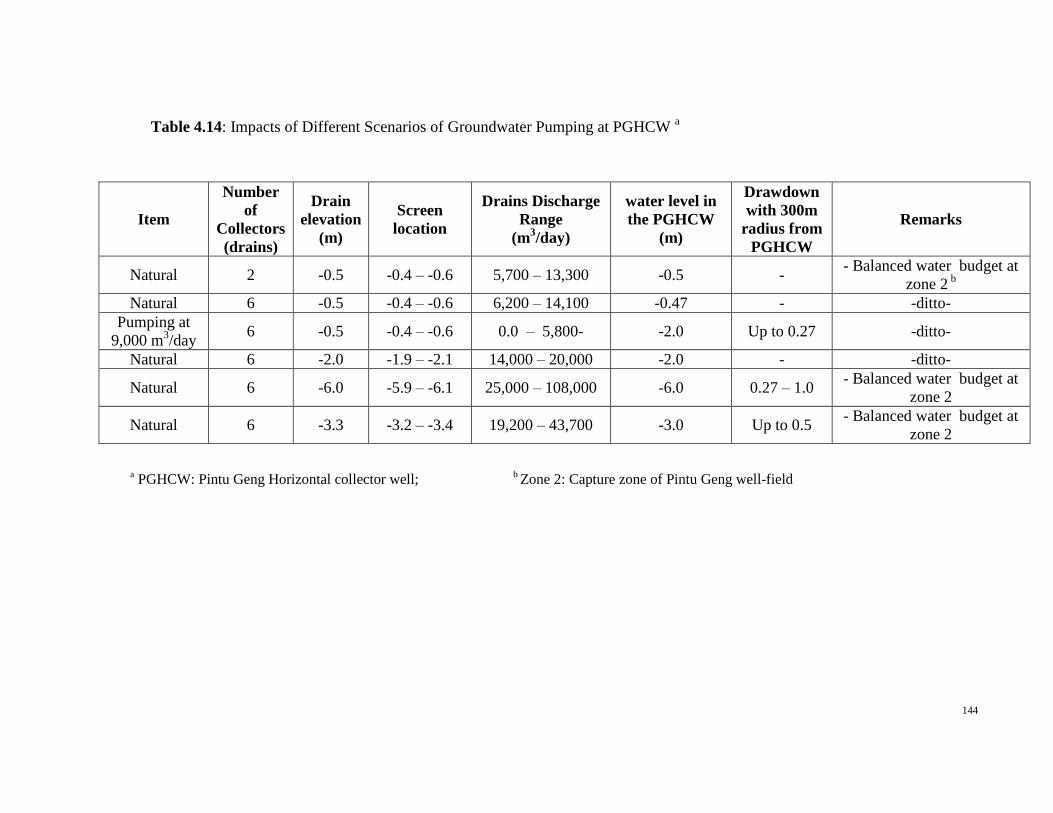
144
Table 4.14: Impacts of Different Scenarios of Groundwater Pumping at PGHCW a
Item
Number
of
Collectors
(drains)
Drain
elevation
(m)
Screen
location
Drains Discharge
Range
(m3/day)
water level in
the PGHCW
(m)
Drawdown
with 300m
radius from
PGHCW
Remarks
Natural 2 -0.5 -0.4 – -0.6 5,700 – 13,300 -0.5 - - Balanced water budget at
zone 2 b
Natural 6 -0.5 -0.4 – -0.6 6,200 – 14,100 -0.47 - -ditto-
Pumping at
9,000 m3/day
6 -0.5 -0.4 – -0.6 0.0 – 5,800- -2.0 Up to 0.27 -ditto-
Natural 6 -2.0 -1.9 – -2.1 14,000 – 20,000 -2.0 - -ditto-
Natural 6 -6.0 -5.9 – -6.1 25,000 – 108,000 -6.0 0.27 – 1.0 - Balanced water budget at
zone 2
Natural 6 -3.3 -3.2 – -3.4 19,200 – 43,700 -3.0 Up to 0.5 - Balanced water budget at
zone 2
a PGHCW: Pintu Geng Horizontal collector well;
b Zone 2: Capture zone of Pintu Geng well-field

145
ii. Impacts of Pengkalan Chepa well-field
It seems that the Pengkalan Chepa well-field will cause a
significant seawater intrusion if the previous running capacity of
6462 m3/day is considered for operation as illustrated in Figure
4.42.
Fig.4.42: Seawater intrusion as a result of pumping Pengkalan Chepa well-field
at 6462 m3/day
146
4.10.5 Conclusions on Model Results
i. The calibrated and validated MODFLOW models were
successfully established in transient state for the North Kelantan
Shallow Aquifer only. The first silty clay layer seems to be not
continuous where the shallow aquifer exposes downstream of the
modelled area, about 1 to 2 km north of Tg Mas and Teluk
villages respectively. The area from the South China Sea coastal
area up to 1.4 km onshore is covered by fine sand.
ii. The model calibrated using time serious data of the period
between January 2000 to December 2005. While the validation
period extended from January 2009 to December 2010.
iii. The model demonstrated satisfactory simulation results and
labeled with good statistic measures.
iv. The present pumping rate divided the modeled area into two
dominant groundwater capture zones i.e. upstream and
downstream. The upstream one is further subdivided into eight
sub-capture zones that developed around each well-field site due
to the present pumping.
v. The model demonstrates that under natural flow condition at -3 m
depth, the six collectors (drains) may tap a volume of
groundwater ranges between 19,200 – 43,700 m3/day (12% of
stress periods are above 30,000 m3/day). This rate is feasible if
considering that the model is running the pumping for 24 hour a

147
day, while in reality pumping process is much less lasting than in
the model.
vi. The model demonstrates that as much as deepening the location
of the collectors (drains) is considered i.e. up to -6 m, the more
water can be tapped.
vii. The model predicts a drawdown between 0.5 – 1.0 m for the
area within 300m radius from the HCW and this value is
considered environmentally impact free (maximum allowable
drawdown for this area is 3 m).
viii. The model demonstrates that the Pengkalan Chepa well-field will
cause a significant seawater intrusion if the previous running
capacity of 6462 m3/day is considered for operation.
4.10.6 Web-based GIS Application on Modeling Results
GIS technology is an effective means of bridging and integrating the
information gathered and models results. GIS applications provide an accurate
and manageable way of estimating model input parameters and provide an easily
updated database for simulations of future conditions. Among the objectives of
the GIS integration for model results, are:-
i. Collect data wirelessly, thus reducing data error that may cause
catastrophic effect to water management in providing clean and
undisrupted water supply.
ii. Extract statistical data, through historical data collection, that will
ensure the most precise data to be used for remedial and long

148
term water supply planning
iii. Ensure close monitor on ground water extraction performance,
thus eliminating the potential water supply failure and disruption.
iv. Utilise state of the art infrastructure that will ensure the future
success of ground water sustainable supply.
In this study, it can be demonstrated that using GIS software like ArcGIS
with the intergration of MODFLOW model results, there are few useable
modules that be developed in Web-based applications, to further enhance the
model results, namely:-
i. As in Fig. 4.43, the area coverage of WIFI or UHF transmissions
and internet connectivity area within the study area can be
determined for the placement of receivers and transmitters of the
radio stations for the telemetry functions using the GIS functions.
ii. A Geographical Information Systems(GIS) prototype model was
developed for improving and expediting GWRM monitoring
system. Data gathered for the prototype model was gathered from
historical databank and on-site wireless data connectivity, with
Internet Web-based application. The results of this case study
indicate that a GIS for the Air Kelantan is feasible. This web
template prototype demonstrated how a GIS and GWRM
combined standard data collection with advanced computer
capabilities, allowing the users to more easily maintain historical
data, predict future environmental impacts more quickly, better
optimize their resources, which provided added project control

149
and better response time. The web template prototype is shown in
Fig. 4.44 and Fig. 4.45 below.
iii. Statistical analysis with graphical representation can be
developed in the same web-based application for managerial use
in creating decision-making tools and key performance indicators
for the water operator, as illustrated in Fig. 4.46 .
Fig.4.43: Determination of coverage area of WIFI/UHF and Internet/GPRS connectivity in
study area.

150
Fig.4.44: Web template of GWRM monitoring system for the study area.
Fig.4.45: Data Management of GWRM monitoring system for the study area.

151
iv. A flow diagram of Databases Management and Groundwater Resource
Management is illustrated in Fig. 4.47, to better understand the complete
process of data input and sharing, for an effective groundwater
evaluation and resource planning and management in the future.
Fig.4.46: Statistical Analysis of GWRM monitoring system for the study area.

152
GEOGRAPHICAL
INFORMATION SYSTEM
(ArcGIS)
HYDROGEOLOGICAL
FLOW MODELS
PARTICLE TRACKING
MODELS
GWRM
PLANNING &
MANAGEMENT
SPATIAL
DATA
POINT
DATA
GEOLOLOGICAL DATA HYDROGEOLOGY GEOLOGY HYDROLOGY GROUNDWATER RECHARGE WATER BALANCE
OTHER DATA TOPOGRAPHY METEOROLOGY LANDUSE INFRASTRUCTURAL INFO
STATE DATA STATE PLANNING WATER USAGE DEVELOPMENT PLAN
LOCAL AUTHORITHY DATA LOCAL DEV.PLAN FUTURE PLANNING LAW & ENFORCEMENT
Fig. 4.47: Databases Management and Groundwater Resource Management Flow Diagram

153
4.11 DISCUSSIONS
There are few issues that can be put forward for discussions on the subject
matters, namely:-
i. The organizational framework of the GWRM is an important prerequisite
issue for a sound and effective ground water management system. The
present weak water conservation and resource management in the state
will need a plan to implement the ‘Integrated Water Resource
Management’ (IWRM), a framework to ensure that the development
needs in potable water from groundwater sources are not at the expense
of the environment and its components. This dissertation does not reflect
the issue thoroughly, but the mechanism on how to achieve the said plan
has been mentioned and discussed. Transformation of the GWRM into a
more meaningful system, called the Integrated Groundwater
Management System, where it integrates the eco-system elements with
the influences it has on groundwater, will be the next agenda of relevant
agencies in the state.
ii. With the implementation of GWRM’s system network, the pools of data
gathered with more time series data, will enable the administrator to fine-
tune the hydrogeological models and develop transient models with more
accurate data and entails simulations of different elements and factors.
This dissertation has gathered the relevant data based on previous data
and recently collected data to develop the up-to-date model in the study
area.
154
iii. The water operator or the custodian authority would be able to take the
opportunity to expand and emulate the management system elsewhere
and at the same time transverse their businesses outwards.
iv. The Well Head Protection Action (WHPA) will be practically put in
place for enforcement functions due to better monitoring abilities of the
GWRM system in beaming information on water quality with standards
on contaminants content in the groundwater. Alarms functions will be
triggered when limits are violated and future sustainable issues on
groundwater usage will be managed wisely and systematically.
v. The vulnerability map in GIS format can be prepared with relative data
gathered from the implementation of this GWRM system. A
vulnerability mapping with reliable and effective management will
ensure a realistic and practical groundwater protection programme for
the state of Kelantan.
vi. The calibrated and validated MODFLOW models were successfully
established in transient state for the North Kelantan Shallow Aquifer
only. The future work can be expanded to cover the models in transient
state for deep aquifers and regional influence of it.
vii. The establishment of closer cooperation among the stakeholders in
databases maintenance and groundwater resource management is
inevitable to ensure the sustainability issues in groundwater usage should
be effectively addressed. The proposed cooperation framework among
the stakeholders of sustainable groundwater governance is described in
Table 4.15.

155
Table 4.15: Proposed Cooperation and Roles of Stakeholders to Sustainable
Groundwater Development Framework in the State Of Kelantan.
Governance Authorithy/Agency
Policy, Programme, Plan
1.National Groundwater Policy
2.Groundwater Development Programme
(5yr.
Malaysia Plans)
3. Master Plan and Feasibility Studies
4. Kelantan Basin Management Plan
National Water Resources Council
(NWRC), Economic Planning Unit
(EPU), State Economic Planning Unit
(UPEN), Treasury, JMG, NAHRIM,
Forestry Dept., Pejabat Tanah dan Galian
(PTG), Department of Environment
(DOE), Drainage and Irrigation Dept.
(DID), Jabatan Perancangan Bandar dan
Desa (JPBD), Local Councils, Air
Kelantan Sdn. Bhd. (AKSB)
Infrastructure Development
(planning, design, construction and
maintenance)
1. Groundwater production well
2. Groundwater Distribution
AKSB, JMG
Laws/Enforcement
1. Laws and regulations on groundwater
development and management
2.Licencing for well drilling, groundwater
abstraction and monitoring
3. Pollution Control Enforcement
4. Guidelines and Standards
State Water Authority, JMG, DOE,
Kementerian Kesihatan Malaysia (KKM)
Monitoring
1.Groundwater Monitoring
(comprehensive
monitoring, water quality, land
subsidence, water level, inflow and
outflow)
2. Pollution Control Monitoring
3. Drinking Water Quality Monitoring
JMG, AKSB, State Water Authority,
DOE, KKM
Education and Research
1. Public Awareness/Education
2. Emergency Response Management
3. Research and Development
4. Training
JMG, NAHRIM, University, Local
Councils, Schools, DOE, NGO (MWA
etc), DOE, District Office, State Water
Authority, DID Note: Lead agencies are presented in bold letters.

156
CHAPTER 5
CONCLUSIONS AND RECOMMENDATIONS
5.1 INTRODUCTION
In this thesis, the task of having a sustainable management of groundwater
particularly for potable use is fully addressed. The adverse impacts to the environment
can be minimized or controlled. Groundwater flow modeling and contaminant
movement simulation of the alluvial aquifer is needed to support the sustainable
groundwater management, as its being named Groundwater Resource Management
(GWRM).
It is confident that with the implementation of this system, groundwater sources
will be better managed and future development plans for groundwater will be fully
controlled within the limits for a safe and sustainable environment.
The study aimed to facilitate the application of groundwater models and
software tools, in order to allow better management decision-tools in groundwater

157
management programmes. It has been demonstrated that using groundwater flow model
in a pilot area, establishment of monitoring plans and employing software in integration
efforts, a significant insights have been achieved on the groundwater management can
be implemented for the sustainable groundwater management system. Conclusions
drawn from this study can be discussed in the following aspects:-
i. Physical and groundwater properties of the study area; and
ii. Groundwater modeling and application of software.
5.2 PHYSICAL AND GROUNDWATER PROPERTIES OF THE STUDY
AREA
The geology of the study area comprises of flat lying Quaternary alluvium with
thickness from a few meters, deepening towards the coast to more than 200 meters in
the north-eastern area of the state. The alluvium is underlain by granitic and
sedimentary or metasedimentary bedrock, the latter consisting mainly of shale,
sandstone, phyllite and slate. The granitic bedrock occurs generally east and parallel to
the northerly-flowing Kelantan River, while the sedimentary or metasedimentary rocks
are confined essentially to the western part.
These two main aquifer systems are hydraulically interconnected especially the
first and the second aquifer as they are only separated by semi-permeable strata of silt as
demonstrated by pumping test of a test well with screen located at 14-31 m carried out
by Noor (1980) at Kampung Chap, Bachok. It is also reported that pumping test carried
out at the Kota Bharu Water Works revealed no connection between shallow and deeper
aquifers. So, it could be concluded that the interconnection between the shallow and

158
deeper aquifers, or leakage from the lower or upper aquifers depends significantly on
the lithology of the aquifer at that particular location. However, data gathered in this
study indicate strongly that there is significant interconnection between the upper and
lower aquifers.
The aquifers consist of interbedded medium-sized sand to medium-sized gravel
as well as some coarse gravel and the scale of interbedding varies from place to place.
The percentage of course materials generally increases with depth. The first aquifer is
notably productive for exploitation; however, since it is shallow, it is threatened by
pollution as the groundwater development is quite concentrated in the populated area of
Kota Bharu town. The second aquifer is generally thin and does not contain significant
amount of groundwater worth for large-scale exploitation even though in places it forms
significantly thick aquifer layer. The third aquifer is the most promising in terms of
production and also protection from potential pollution. The fourth aquifer is not
distributed throughout the entire region of North Kelantan Basin as it forms the contact
with the underlying granite.
It is observed that regionally the groundwater flows north to north-east.
However, extensive study carried out to monitor the fluctuation of groundwater level in
various layers of aquifer indicates that the various aquifer layers actually show distinct
trend of groundwater flow direction.
The permeability of the aquifers ranges from 130 to 2,200 m/d, while the
transmissivity ranges from 1,200 to 24,000 m2/d, significantly higher figures in
permeability and transmissivity in the first and second aquifers.

159
Presently, fresh groundwater supply is obtained from 91 numbers of production
wells located at 13 well-fields. Groundwater for these all well-fields is drawn from
shallow aquifer system except in Tanjung Mas and new wells at Pintu Geng. In 2009,
the total groundwater consumption is 134Ml/d, which constitutes about 41% of the total
water production in AKSB’s water treatment plants. The demand for groundwater in
potable use is at 145Ml/d in 2010 and will increase at pace of 2.5% per year.
It is observed from previous studies that the groundwater in the study area has
been contaminated with nitrate, ammonium, pesticides and coliforms, especially in the
first aquifer, which is contributed by human wastewater and agricultural activities.
5.3 GROUNDWATER MODELLING AND APPLICATION OF SOFTWARE
Significant estimations and assumptions were made in building up the
hydrogeological models in this complexity of the groundwater properties and its
surrounding characteristics. In order to model and simulate this complex
hydrogeological successfully, the details and data incorporated in the MODFLOW
software was carefully studied for a good representation of the real conditions.
The GIS assisted database system has demonstrated to help groundwater
management practices such as; proper groundwater resource management in terms of
groundwater quality & quantity, Integrated management of water, landuse and the
environment; to optimize pumping rates with respect to the capacity of the aquifer
system, and to prevent groundwater quality deterioration through proper monitoring &
evaluation. This GIS aided management tool is to be used to administer daily
160
groundwater production, contingencies plan, recharge and discharge management, and
surveillance on water quality, so as to improve the North Kelantan River basin’s area
management strategies.
5.4 FUTHER WORK
5.4.1 General
Any plans to further develop the groundwater sources, especially for
potable water, the water authority is to engage in the use of this study, as a
decision tools for a sustainable groundwater management, hence minimizing any
deteriorating elements to the groundwater sources in the future.
The groundwater hydrogeological model is to be used often for the
planning and development of future needs of groundwater in the study area, in
order to predict the future behaviour of the aquifer systems when subject to
additional pumping.
5.4.2 Groundwater Modelling
In order to improve the successful performance of the model, more
reliable and accurate data must be made available, which include hydrology data
of rivers and water bodies, geophysical data of soil, production figures from
wells and hydraulic properties of aquifers.
161
With the implementation of the installation of more piezometers and
monitoring wells in the plan, more accurate information will be gained and
administered for the development of finer model creation. This implementation
should be carried out soon according to the numbers and locations recommended
in this study.
5.4.3 Groundwater Protection Policy
AKSB should have a sustainable policy for the exploitation of
groundwater from aquifers, which should be based not on the volume of
abstraction, but on the basin's recharge capacity. A mass balance is to be used to
evaluate the components of the water cycle, on an annual basis. Detailed
hydrological and hydrogeological studies are required to determine the water
balance, which would be the ideal steps towards protecting the groundwater
resources.
5.4.4 Transport Model On Pollution Movement Prediction
The transport model of the study area on pollution movement prediction
is giving protection to the groundwater resources a chance from future quality
deteriorating, by having simulated prediction of future changes in resources in
cases of point-source contaminations or regional violations.

162
5.4.5 Assessment Using The Horizontal Collector Well Method Of
Abstraction
A horizontal well method of abstraction is an improved method over the
conventional method of vertical tubewells, which provides better inflow to an
abstraction point and less possibility of deteriorating the ground conditions
caused by over pumping in abstraction flow.
Data on aquifer media composition (particle size analysis) should be
collected from available literature and augmented with samples collected at the
site, as well as data on water properties and lateral well screens are important
functions in horizontal collector well system calculations. Simulations using
MODFLOW will be suitable to evaluate the suitability and viability of this
method in a given area.
5.4.6 A vulnerability assessment
A vulnerability assessment based on hydrogeological aspects from field
observations has to be carried out to identify the degree of vulnerability of the
groundwater to contamination and potential sources of pollution to the
groundwater system in the area. At present there is no groundwater wellhead
protection policy being implemented in Malaysia. It is suggested that wellhead
areas in Kelantan River Basin should be protected but no definite work was
carried out to achieve this goal (Ismail 1993).

163
5.5 CONCLUDING REMARKS
5.5.1 General
The monitoring network establishment in the northern Kelantan area will
eventually represents a regional system designed to monitor changes in the
groundwater regime over a regional scale. It is designed to detect point sources
of contamination and its effect on the regional groundwater resources. Water
quality changes on a regional scale, if any, is usually a slow process and records
from several years of surveillance are necessary to establish prevailing trends.
This study is to better understand the importance of a balanced
development of groundwater as to preservation of good ecosystems in Kelantan
through the establishment of “Groundwater Resource Management (GRWM)”
system, with a decision support tool of GIS, a hydrogeological model and
database system to handle and store all water resource relevant information, and
to establish a monitoring system with observation wells for level and quality of
groundwater by evaluation of all existing use of water and redefine sustainable
use and regulate permits of abstraction.
Future development of groundwater can be guided by implementation of
GWRM system and functions to safeguard any further contamination in a
regional basis. This can benefits water operators and water stake-holders in
understanding and managing the groundwater resources in the study area
particularly.

164
5.5.2 Groundwater Model
A validated groundwater flow model was created for a groundwater sub-
basin within the north Kelantan regional groundwater basin to support the water
resources management in the Kelantan State. The first silty clay layer seems to be
not continuous, where the shallow aquifer exposes downstream part of the modelled
area, some 1.1 km to 1.8 Km to the north of the villages Tg. Mas and Kg. Teluk
respectively. Furthermore, the area from the South China Sea coast up to a distance
of about 1.4 Km onshore is covered by fine sand.
Overall, the groundwater quality in other areas monitored remains good
and is suitable for exploitation for drinking purposes. However, due to rapid
urbanisation and industrial as well as agricultural developments, there is an
increasing threat of contamination to the groundwater, and groundwater quality
degradation over the long term is a potential problem to contend with.