chap013 lecture
TRANSCRIPT
08/26/2013
1
Chapter 13
The Environment, Health, and Safety
Copyright © 2013 by The McGraw-Hill Companies, Inc. All rights reserved.McGraw-Hill/Irwin
13-2
Learning Objectives
1. Use economic analysis to show how U.S. health care system can be improved
2. Compare and contrast the ways in which taxes and tradable permits can be used to reduce pollution
3. Apply the Cost-Benefit Principle to improve workplace safety
4. Show how economic analysis contributes to debates regarding public health and domestic security spending
08/26/2013
2
13-3
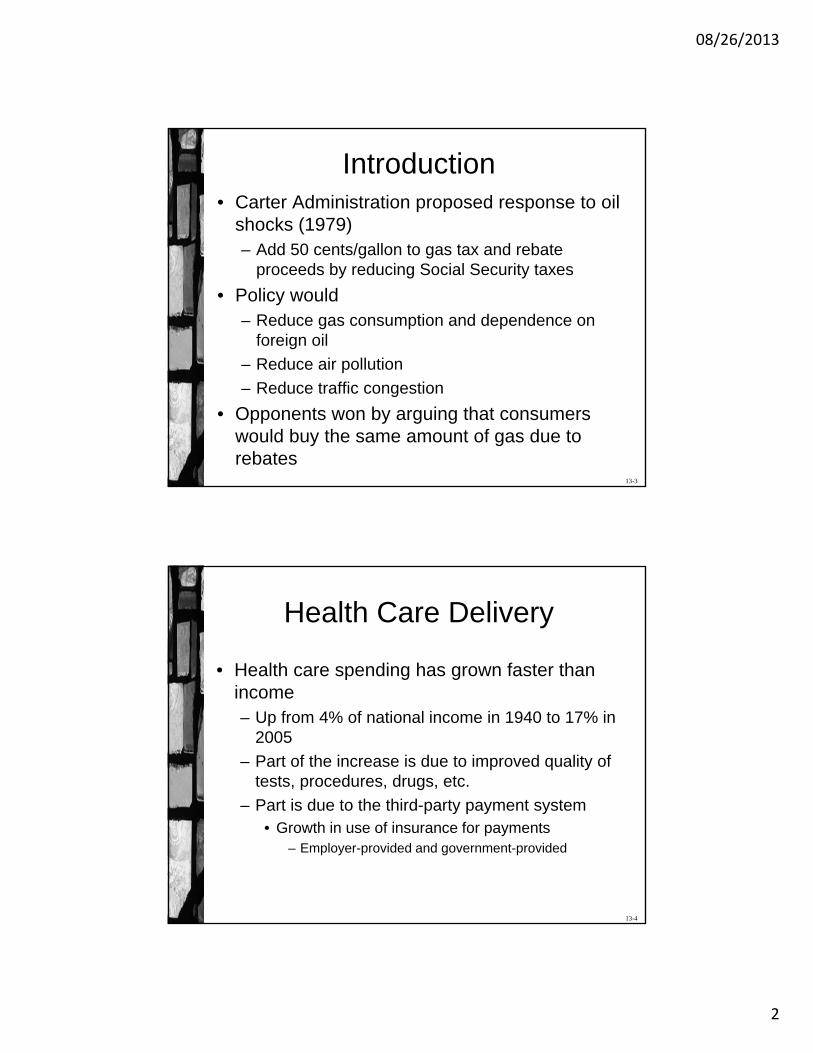
Introduction• Carter Administration proposed response to oil
shocks (1979)– Add 50 cents/gallon to gas tax and rebate
proceeds by reducing Social Security taxes
• Policy would– Reduce gas consumption and dependence on
foreign oil
– Reduce air pollution
– Reduce traffic congestion
• Opponents won by arguing that consumers would buy the same amount of gas due to rebates
13-4
Health Care Delivery
• Health care spending has grown faster than income– Up from 4% of national income in 1940 to 17% in
2005
– Part of the increase is due to improved quality of tests, procedures, drugs, etc.
– Part is due to the third-party payment system• Growth in use of insurance for payments
– Employer-provided and government-provided
08/26/2013
3
13-5
Health Care Delivery
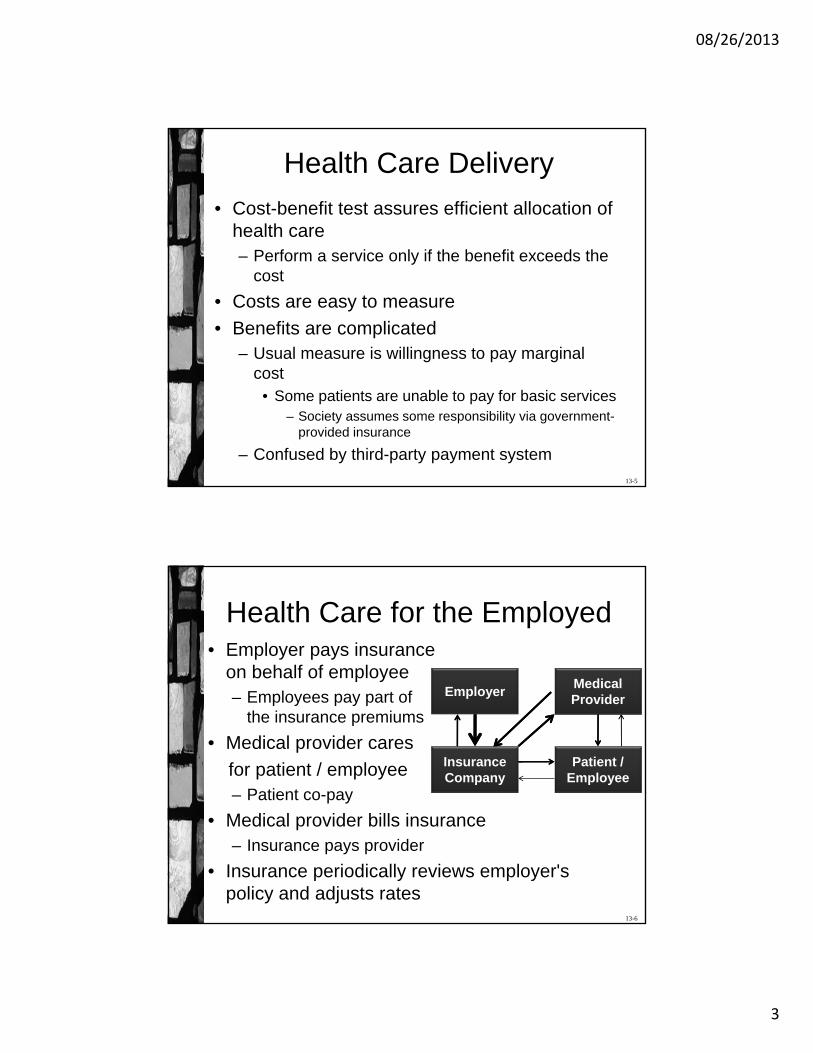
• Cost-benefit test assures efficient allocation of health care– Perform a service only if the benefit exceeds the
cost
• Costs are easy to measure
• Benefits are complicated– Usual measure is willingness to pay marginal
cost• Some patients are unable to pay for basic services
– Society assumes some responsibility via government-provided insurance
– Confused by third-party payment system
13-6
Health Care for the Employed• Employer pays insurance
on behalf of employee– Employees pay part of
the insurance premiums
• Medical provider cares
for patient / employee– Patient co-pay
• Medical provider bills insurance– Insurance pays provider
• Insurance periodically reviews employer's policy and adjusts rates
Medical Provider
Patient / Employee
Employer
Insurance Company
08/26/2013
4
13-7
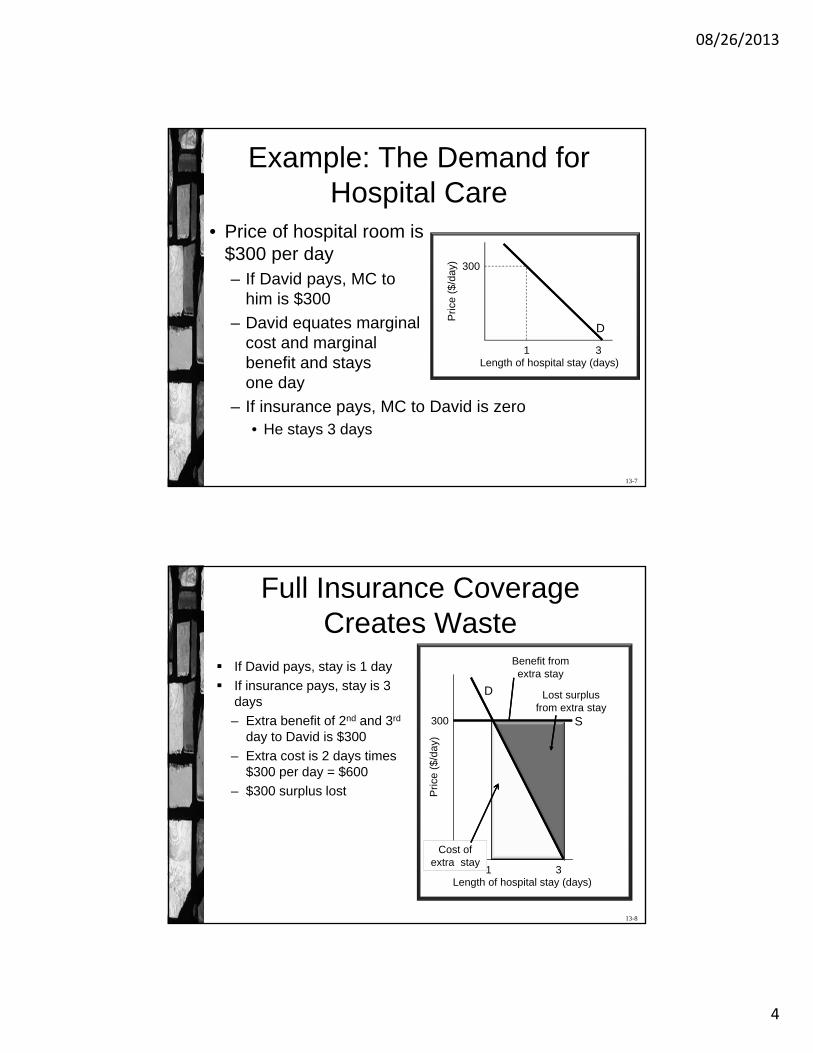
Example: The Demand for Hospital Care
• Price of hospital room is$300 per day– If David pays, MC to
him is $300
– David equates marginal cost and marginal benefit and stays one day
– If insurance pays, MC to David is zero• He stays 3 days
Length of hospital stay (days)
Pric
e ($
/day
)
D
1 3
300
13-8
Full Insurance Coverage Creates Waste
If David pays, stay is 1 day
If insurance pays, stay is 3 days
– Extra benefit of 2nd and 3rd
day to David is $300
– Extra cost is 2 days times $300 per day = $600
– $300 surplus lost
Length of hospital stay (days)
Pric
e ($
/day
)
D
1
300
3
S
Benefit from extra stay
Cost of extra stay
Lost surplus from extra stay

08/26/2013
5
13-9
Alternative Coverage Scheme• Insurance company pays
David $700– Insurance company
saves $200 compared to a 3-day stay
• David stays 1 day– Pays hospital $300
– David keeps $400• The $300 benefit he would get from staying 3 days
PLUS $100 pure surplus
• Total surplus increases $300
Length of hospital stay (days)
Pric
e ($
/day
)
D
1 3
300
13-10
Insurance, Demand, and Waste
• Amount of waste from full insurance depends on the price elasticity of demand for medical services
• Research compared patients with first dollar coverage to those with $1,000 deductibles– First-dollar coverage pays all expenses for the
insured's health care
– $1,000 deductible pays all expenses after the patient has paid $1,000
– Deductible patients spent 40 – 50% less on health care and had the same health outcomes
08/26/2013
6
13-11
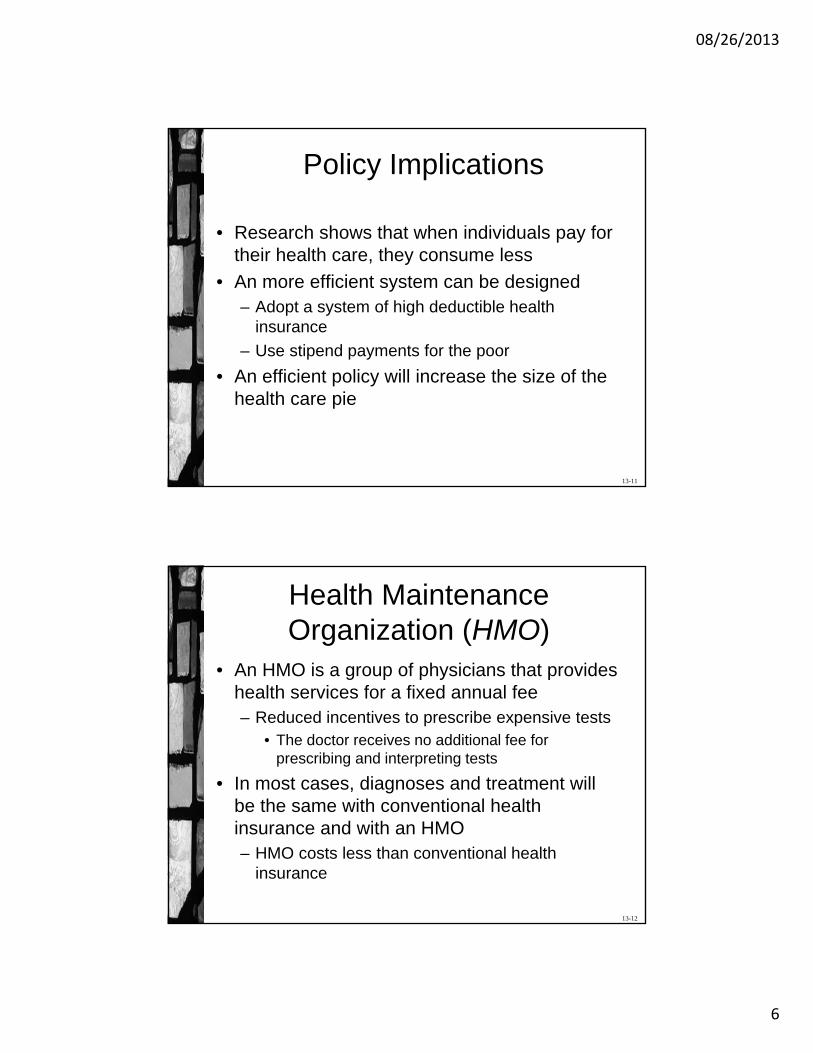
Policy Implications
• Research shows that when individuals pay for their health care, they consume less
• An more efficient system can be designed– Adopt a system of high deductible health
insurance
– Use stipend payments for the poor
• An efficient policy will increase the size of the health care pie
13-12
Health Maintenance Organization (HMO)
• An HMO is a group of physicians that provides health services for a fixed annual fee– Reduced incentives to prescribe expensive tests
• The doctor receives no additional fee for prescribing and interpreting tests
• In most cases, diagnoses and treatment will be the same with conventional health insurance and with an HMO– HMO costs less than conventional health
insurance
08/26/2013
7
13-13
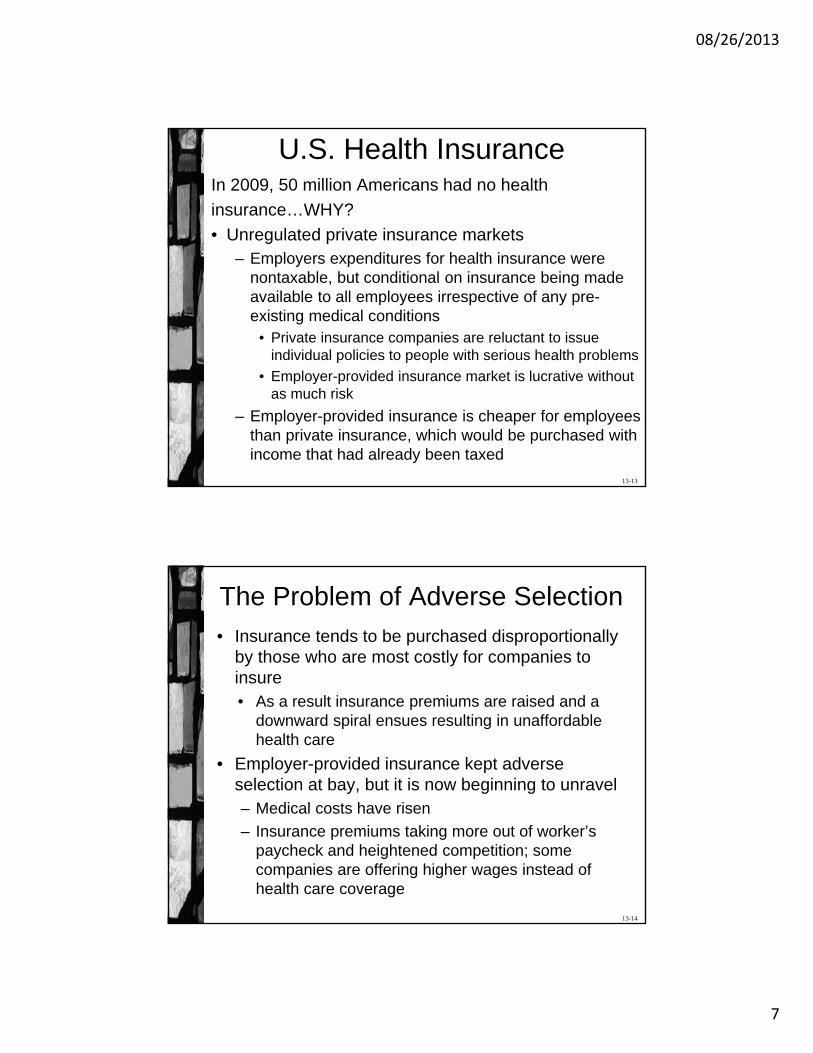
U.S. Health InsuranceIn 2009, 50 million Americans had no health
insurance…WHY?
• Unregulated private insurance markets– Employers expenditures for health insurance were
nontaxable, but conditional on insurance being made available to all employees irrespective of any pre-existing medical conditions
• Private insurance companies are reluctant to issue individual policies to people with serious health problems
• Employer-provided insurance market is lucrative without as much risk
– Employer-provided insurance is cheaper for employees than private insurance, which would be purchased with income that had already been taxed
13-14
The Problem of Adverse Selection• Insurance tends to be purchased disproportionally
by those who are most costly for companies to insure• As a result insurance premiums are raised and a
downward spiral ensues resulting in unaffordable health care
• Employer-provided insurance kept adverse selection at bay, but it is now beginning to unravel– Medical costs have risen
– Insurance premiums taking more out of worker’s paycheck and heightened competition; some companies are offering higher wages instead of health care coverage
08/26/2013
8
13-15
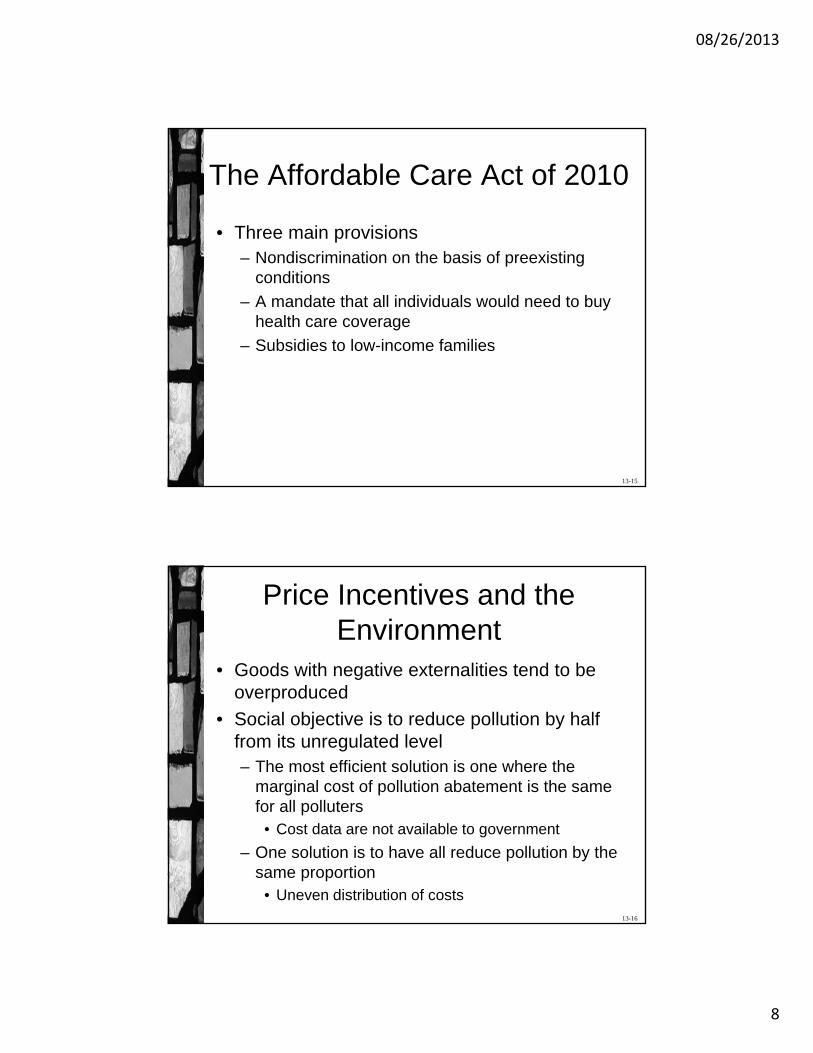
The Affordable Care Act of 2010
• Three main provisions– Nondiscrimination on the basis of preexisting
conditions
– A mandate that all individuals would need to buy health care coverage
– Subsidies to low-income families
13-16
Price Incentives and the Environment
• Goods with negative externalities tend to be overproduced
• Social objective is to reduce pollution by half from its unregulated level– The most efficient solution is one where the
marginal cost of pollution abatement is the same for all polluters
• Cost data are not available to government
– One solution is to have all reduce pollution by the same proportion
• Uneven distribution of costs
08/26/2013
9
13-17
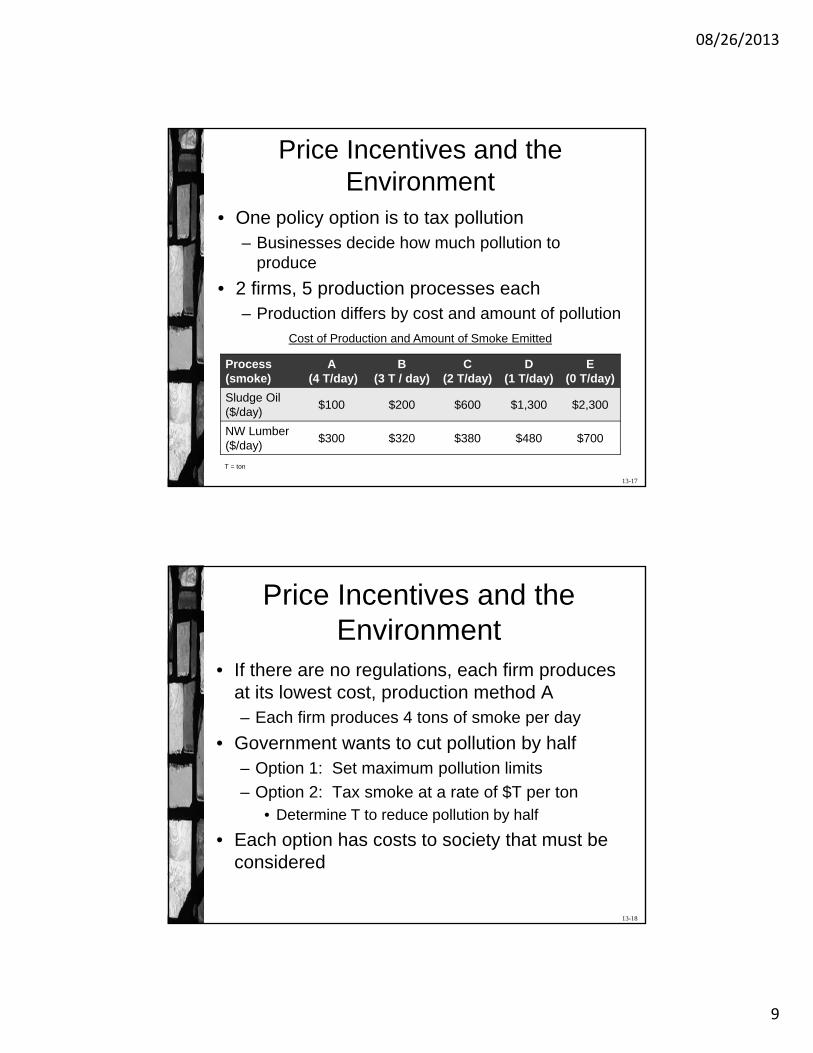
Price Incentives and the Environment
• One policy option is to tax pollution– Businesses decide how much pollution to
produce
• 2 firms, 5 production processes each– Production differs by cost and amount of pollution
Process (smoke)
A(4 T/day)
B(3 T / day)
C(2 T/day)
D(1 T/day)
E(0 T/day)
Sludge Oil ($/day)
$100 $200 $600 $1,300 $2,300
NW Lumber ($/day)
$300 $320 $380 $480 $700
Cost of Production and Amount of Smoke Emitted
T = ton
13-18
Price Incentives and the Environment
• If there are no regulations, each firm produces at its lowest cost, production method A– Each firm produces 4 tons of smoke per day
• Government wants to cut pollution by half– Option 1: Set maximum pollution limits
– Option 2: Tax smoke at a rate of $T per ton• Determine T to reduce pollution by half
• Each option has costs to society that must be considered
08/26/2013
10
13-19
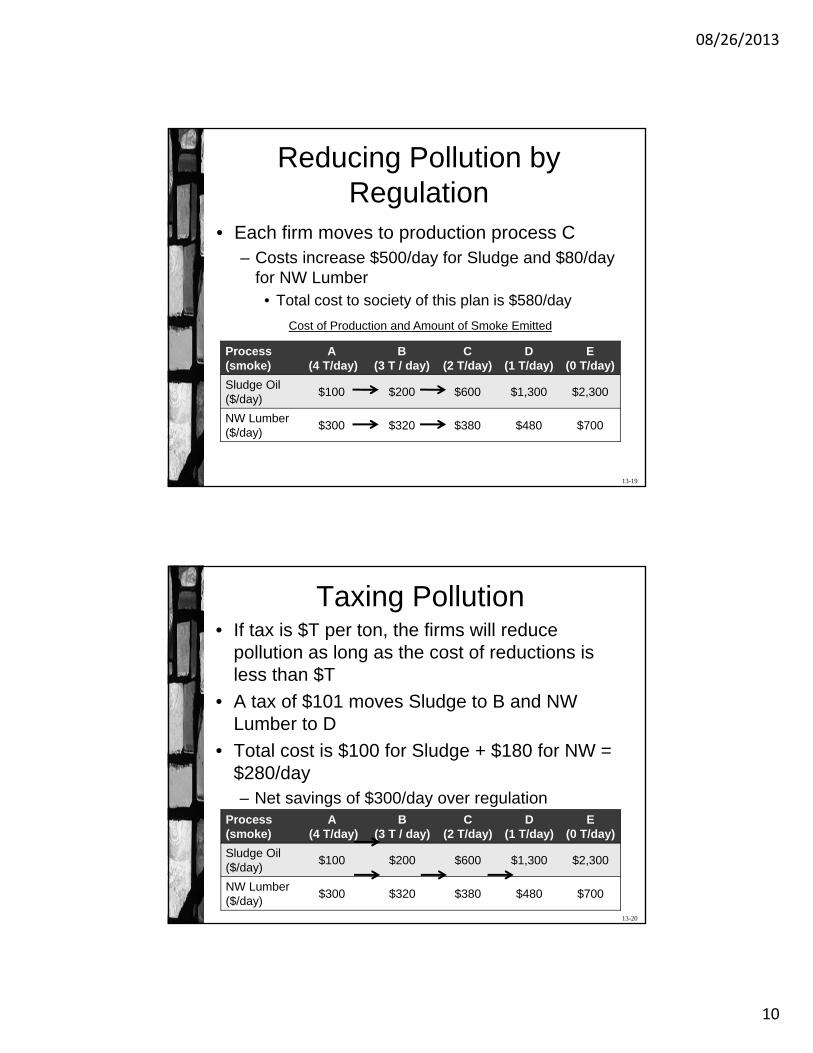
Reducing Pollution by Regulation
• Each firm moves to production process C– Costs increase $500/day for Sludge and $80/day
for NW Lumber• Total cost to society of this plan is $580/day
Process (smoke)
A(4 T/day)
B(3 T / day)
C(2 T/day)
D(1 T/day)
E(0 T/day)
Sludge Oil ($/day)
$100 $200 $600 $1,300 $2,300
NW Lumber ($/day)
$300 $320 $380 $480 $700
Cost of Production and Amount of Smoke Emitted
13-20
Taxing Pollution• If tax is $T per ton, the firms will reduce
pollution as long as the cost of reductions is less than $T
• A tax of $101 moves Sludge to B and NW Lumber to D
• Total cost is $100 for Sludge + $180 for NW = $280/day– Net savings of $300/day over regulation
Process (smoke)
A(4 T/day)
B(3 T / day)
C(2 T/day)
D(1 T/day)
E(0 T/day)
Sludge Oil ($/day)
$100 $200 $600 $1,300 $2,300
NW Lumber ($/day)
$300 $320 $380 $480 $700
08/26/2013
11
13-21
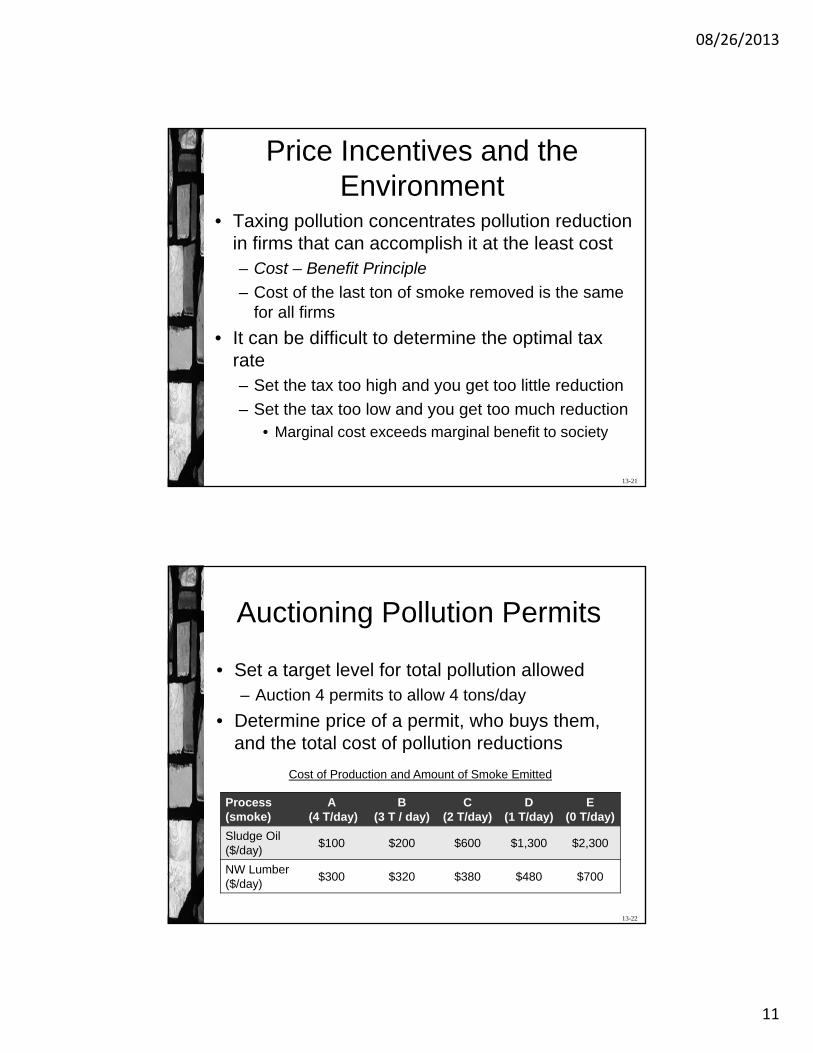
Price Incentives and the Environment
• Taxing pollution concentrates pollution reduction in firms that can accomplish it at the least cost– Cost – Benefit Principle
– Cost of the last ton of smoke removed is the same for all firms
• It can be difficult to determine the optimal tax rate– Set the tax too high and you get too little reduction
– Set the tax too low and you get too much reduction• Marginal cost exceeds marginal benefit to society
13-22
Auctioning Pollution Permits
• Set a target level for total pollution allowed– Auction 4 permits to allow 4 tons/day
• Determine price of a permit, who buys them, and the total cost of pollution reductions
Process (smoke)
A(4 T/day)
B(3 T / day)
C(2 T/day)
D(1 T/day)
E(0 T/day)
Sludge Oil ($/day)
$100 $200 $600 $1,300 $2,300
NW Lumber ($/day)
$300 $320 $380 $480 $700
Cost of Production and Amount of Smoke Emitted

08/26/2013
12
13-23
Auctioning Pollution Permits
Process (smoke)
A(4 T/day)
B(3 T / day)
C(2 T/day)
D(1 T/day)
E(0 T/day)
Sludge Oil ($/day)
$100 $200 $600 $1,300 $2,300
NW Lumber ($/day)
$300 $320 $380 $480 $700
Cost of Production and Amount of Smoke Emitted
# permits 1 2 3 4
Sludge Oil ($/day)
$1,000 $700 $400 $100
NW Lumber ($/day)
$220 $100 $60 $20
Benefit of Permits
13-24
Auctioning Pollution Permits
• At a price of $90, 6 permits are demanded– 4 for Sludge and 2 for NW Lumber
• At a price of $100, 5 permits are demanded
• At a price of $101, 4 permits are demanded
• Sludge uses process B and NW uses process D
# permits 1 2 3 4
Sludge Oil ($/day)
$1,000 $700 $400 $100
NW Lumber ($/day)
$220 $100 $60 $20
08/26/2013
13
13-25
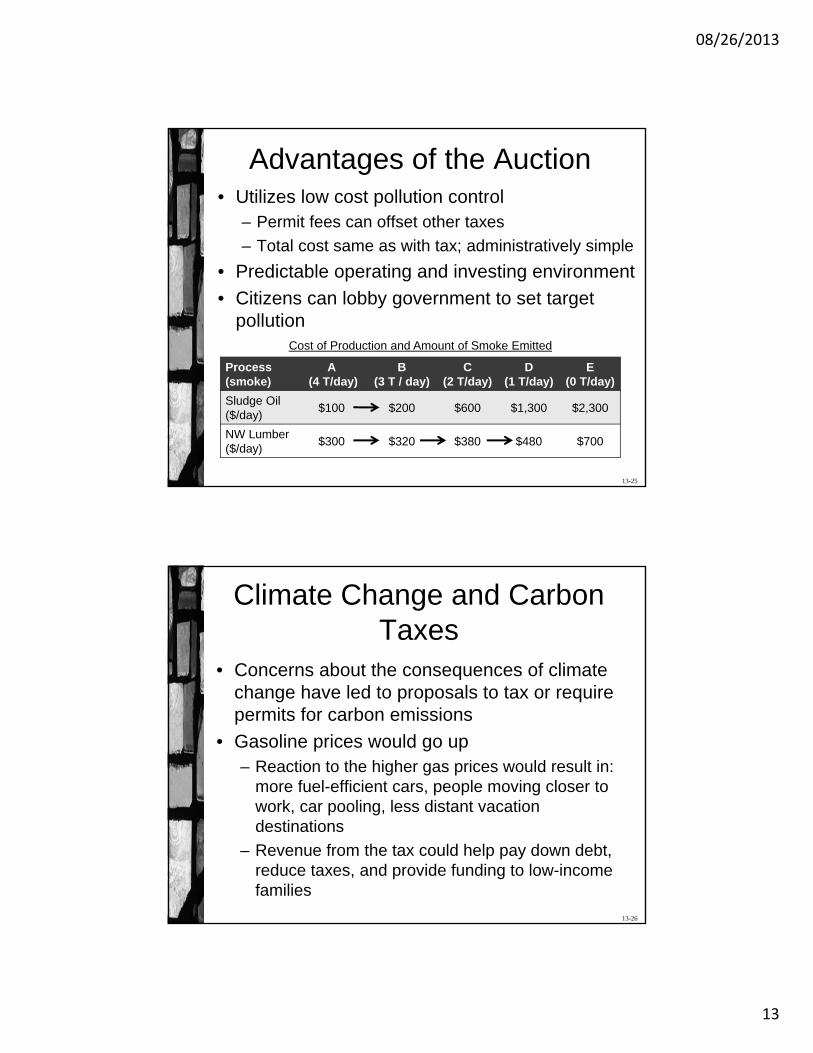
Advantages of the Auction• Utilizes low cost pollution control
– Permit fees can offset other taxes
– Total cost same as with tax; administratively simple
• Predictable operating and investing environment
• Citizens can lobby government to set target pollution
Process (smoke)
A(4 T/day)
B(3 T / day)
C(2 T/day)
D(1 T/day)
E(0 T/day)
Sludge Oil ($/day)
$100 $200 $600 $1,300 $2,300
NW Lumber ($/day)
$300 $320 $380 $480 $700
Cost of Production and Amount of Smoke Emitted
13-26
Climate Change and Carbon Taxes
• Concerns about the consequences of climate change have led to proposals to tax or require permits for carbon emissions
• Gasoline prices would go up – Reaction to the higher gas prices would result in:
more fuel-efficient cars, people moving closer to work, car pooling, less distant vacation destinations
– Revenue from the tax could help pay down debt, reduce taxes, and provide funding to low-income families
08/26/2013
14
13-27
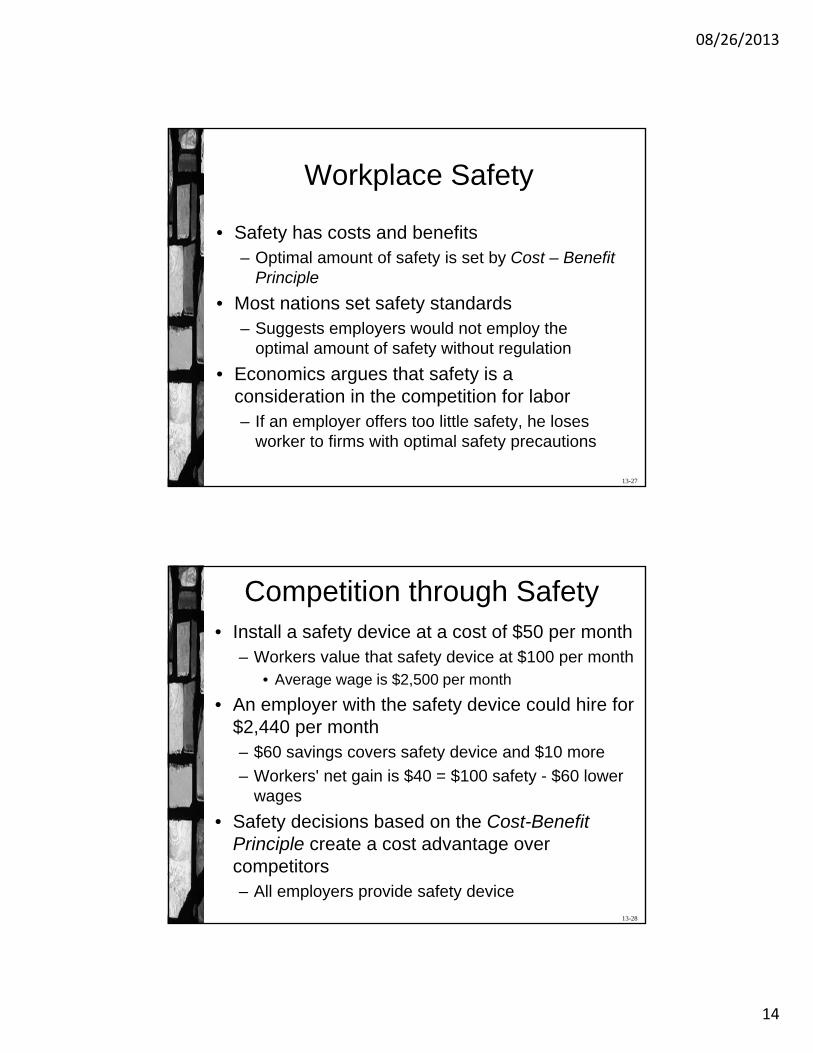
Workplace Safety
• Safety has costs and benefits– Optimal amount of safety is set by Cost – Benefit
Principle
• Most nations set safety standards– Suggests employers would not employ the
optimal amount of safety without regulation
• Economics argues that safety is a consideration in the competition for labor– If an employer offers too little safety, he loses
worker to firms with optimal safety precautions
13-28
Competition through Safety• Install a safety device at a cost of $50 per month
– Workers value that safety device at $100 per month• Average wage is $2,500 per month
• An employer with the safety device could hire for $2,440 per month– $60 savings covers safety device and $10 more
– Workers' net gain is $40 = $100 safety - $60 lower wages
• Safety decisions based on the Cost-Benefit Principle create a cost advantage over competitors– All employers provide safety device

08/26/2013
15
13-29
Market Mechanism and Safety
• For markets to work, information about safety must be available
• The only employer in the area has a $50 incentive to install safety device in our previous example– Without the device, there is cash on the table
• Employers have an incentive to educate workers on the safety they offer
13-30
Market Mechanism and Safety• For markets to provide safety, workers must be
mobile– Firms with good safety records can start a plant near
the current employer with low safety standards
– Evidence shows that workers are mobile and new firms enter existing market
• If firms exploit workers by providing too little safety, these firms should have higher profits– Evidence shows that high-wage firms are highly
profitable
• Therefore, there is a weak justification for safety regulation due to employer exploitation
08/26/2013
16
13-31
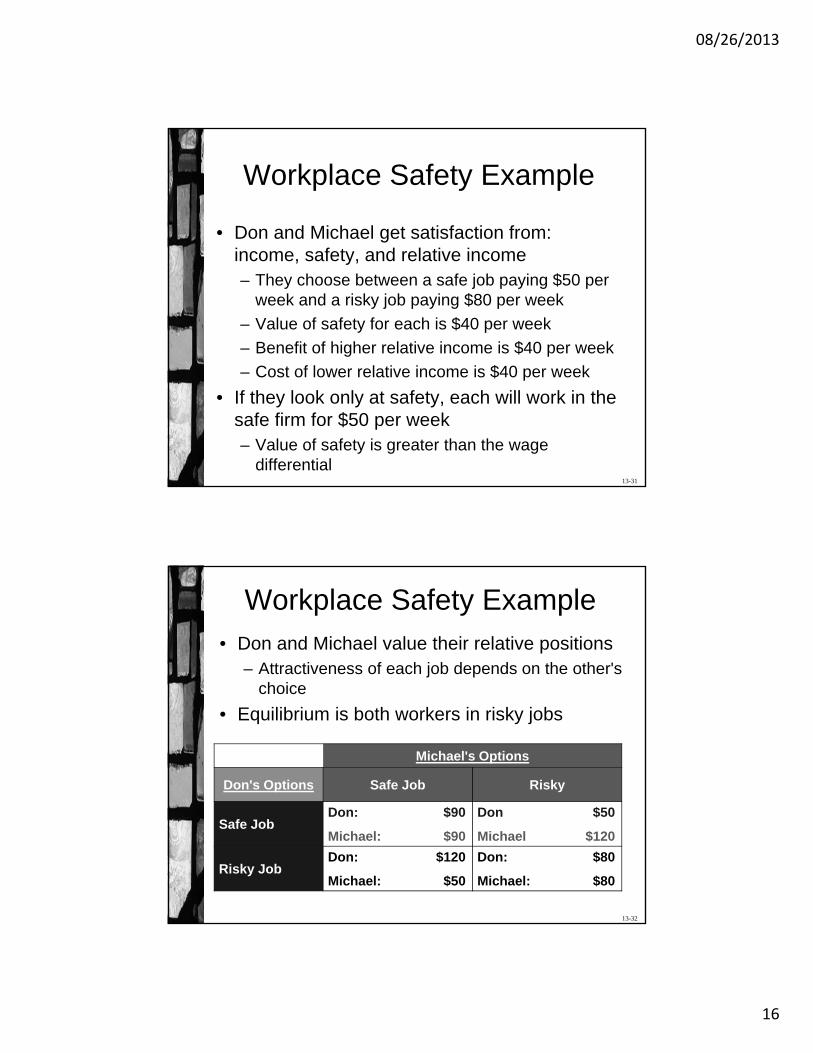
Workplace Safety Example
• Don and Michael get satisfaction from: income, safety, and relative income– They choose between a safe job paying $50 per
week and a risky job paying $80 per week
– Value of safety for each is $40 per week
– Benefit of higher relative income is $40 per week
– Cost of lower relative income is $40 per week
• If they look only at safety, each will work in the safe firm for $50 per week– Value of safety is greater than the wage
differential
13-32
Workplace Safety Example• Don and Michael value their relative positions
– Attractiveness of each job depends on the other's choice
• Equilibrium is both workers in risky jobs
Michael's Options
Don's Options Safe Job Risky
Safe JobDon: $90
Michael: $90
Don $50
Michael $120
Risky JobDon: $120
Michael: $50
Don: $80
Michael: $80
08/26/2013
17
13-33
Workplace Safety Regulation
– Valuing relative income does not always lead to efficient outcomes in the labor market
– If Don and Michael could act collectively, they would take the save jobs and be better off
• Collective action leads to regulations
• Prescriptive safety regulation can also create inefficient results
– Regulation handled by Occupational Safety and Health Administration (OSHA)
– Difficulty in drafting regulations that capture costs and benefits in a variety of circumstances
13-34
Workplace Safety Regulation• Workers compensation is the government
insurance system that provides benefits to workers injured on the job– Funded by employer payments, creating
incentives to implement optimal safety precautions
• Rates independent of employer's safety record
• Adjusting premiums to reflect safety record would increases efficiency– Incentive Principle
– Premiums would be a tax on injuries
08/26/2013
18
13-35
Public Health and Public Safety• Cost – Benefit Principle applies to health and
safety– Optimal policies to prevent illness should equate
the marginal social benefit with the marginal social cost
• Individual cost – benefit calculations are different
• Vaccinations have a small but serious risk– Low probability, high cost
– Disease itself has risks
– Vaccinate until marginal cost of the vaccination is equal to the marginal benefit of the illnesses prevented
13-36
Immunization Required
• A child who is not vaccinated has a risk of contracting the disease– This is a private cost balanced against the private
benefit of avoiding complications of vaccination
• The infected child risks infecting others– This is a social cost
• Market forces alone result in too few vaccinations
• Laws allow parents to opt-out of vaccinations– Where opt-out rates are high, incidence of the
disease is high
08/26/2013
19
13-37
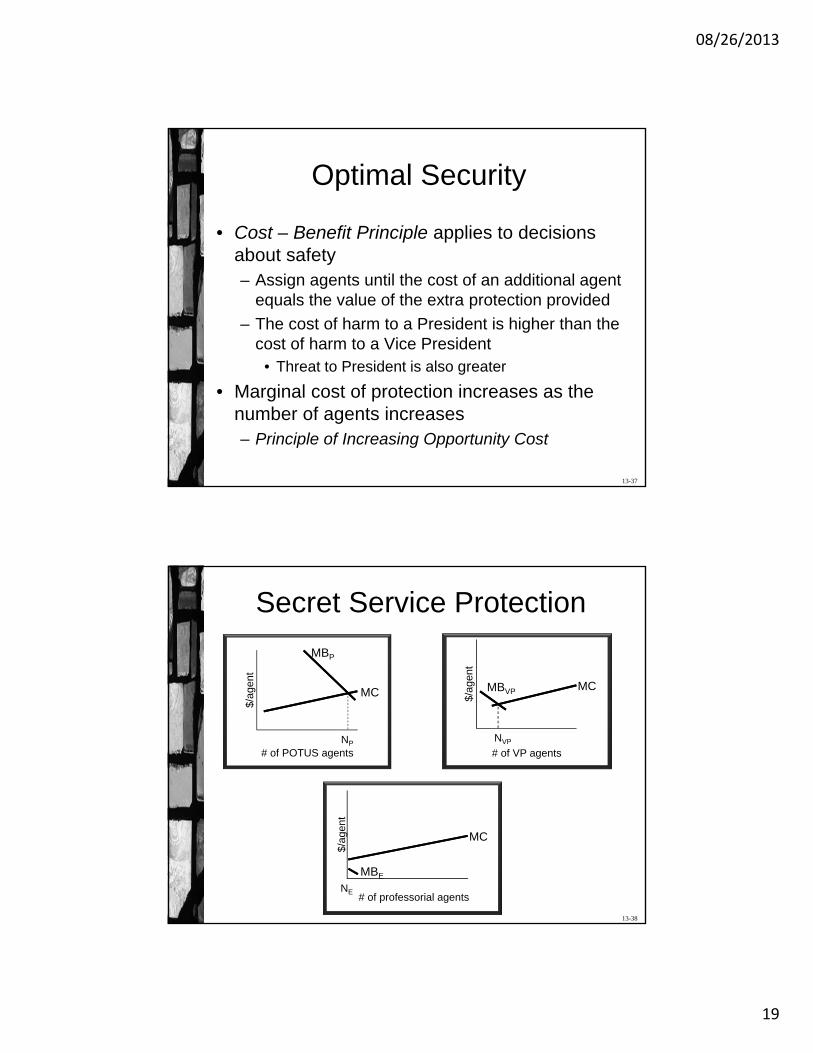
Optimal Security
• Cost – Benefit Principle applies to decisions about safety– Assign agents until the cost of an additional agent
equals the value of the extra protection provided
– The cost of harm to a President is higher than the cost of harm to a Vice President
• Threat to President is also greater
• Marginal cost of protection increases as the number of agents increases– Principle of Increasing Opportunity Cost
13-38
Secret Service Protection
# of POTUS agents
$/ag
ent
MC
NP
MBP
# of VP agents
$/ag
ent
MC
NVP
MBVP
# of professorial agents
$/ag
ent
MC
NE
MBE
08/26/2013
20
13-39
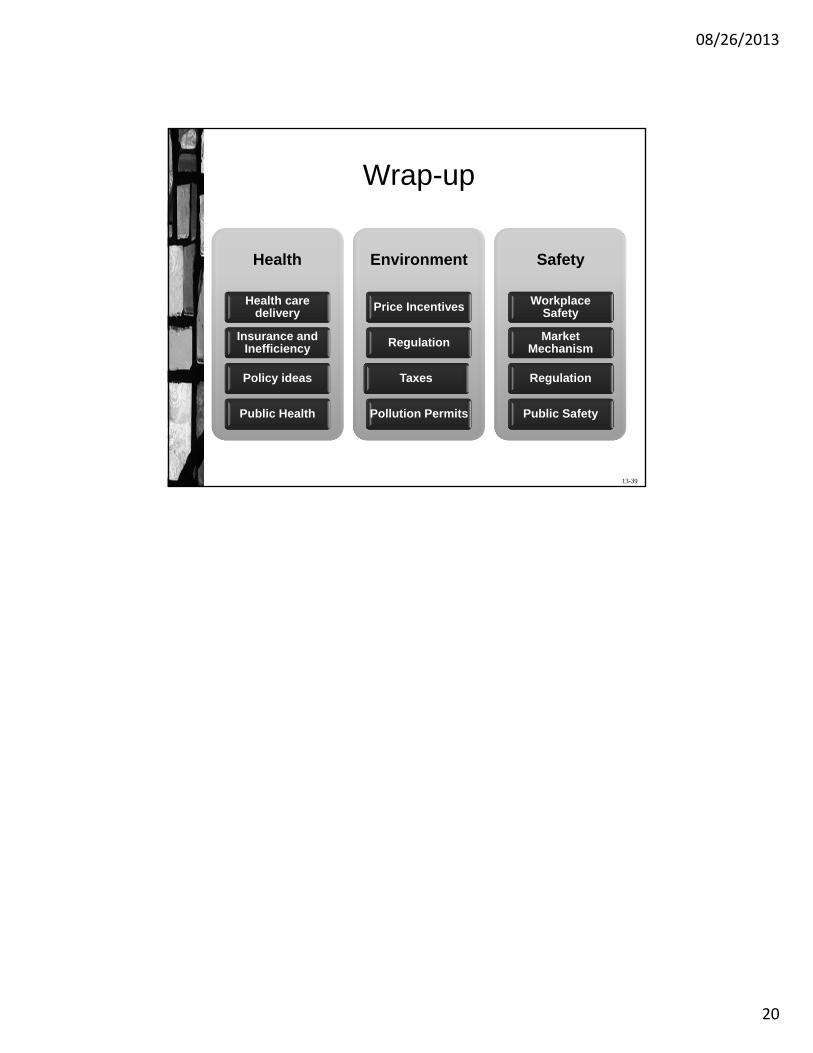
Wrap-up
Health
Health care delivery
Insurance and Inefficiency
Policy ideas
Public Health
Environment
Price Incentives
Regulation
Taxes
Pollution Permits
Safety
Workplace Safety
Market Mechanism
Regulation
Public Safety