changes in public attitudes about water
TRANSCRIPT

Changes in Public Attitudes and Actions about Water Resources in the Pacific Northwest since 2002
Robert L. MahlerUniversity of Idaho
Water Concerns• Since the late 1980’s a major
emphasis has been placed on addressing water concerns▫Regulatory approach▫Voluntary through education
approach
•Schools have emphasized water education▫K-12-youth education▫Universities-adult education
•In the PNW, LGUs, through Extension, have targeted adults
Objectives
• To document voluntary actions the general public has taken to address water quality and quantity concerns over the last 10 years
• To document how the public views agriculture in the region
Methodology
• 60 Question survey developed in 2001▫ Delivered in 2002▫ Delivered in 2007▫ Delivered in 2012
• Goal-950 completed surveys▫ Sampling error of 4 to 6 percent ▫ 50% return rate▫ Mail-based surveys
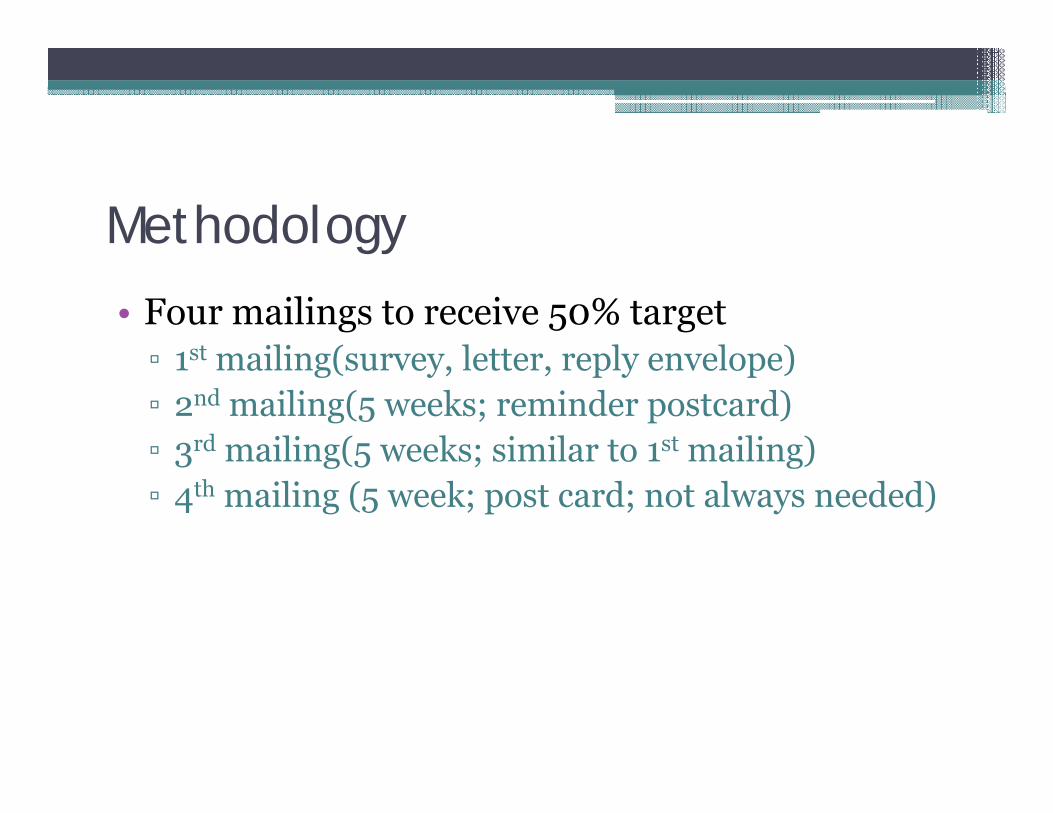
Methodology
• Four mailings to receive 50% target▫ 1st mailing(survey, letter, reply envelope)▫ 2nd mailing(5 weeks; reminder postcard)▫ 3rd mailing(5 weeks; similar to 1st mailing)▫ 4th mailing (5 week; post card; not always needed)

Methodology
• Data:▫ Achieved 50%+ target rate for each survey▫ Analyzed by SAS First level – frequencies Second level – demographic factors
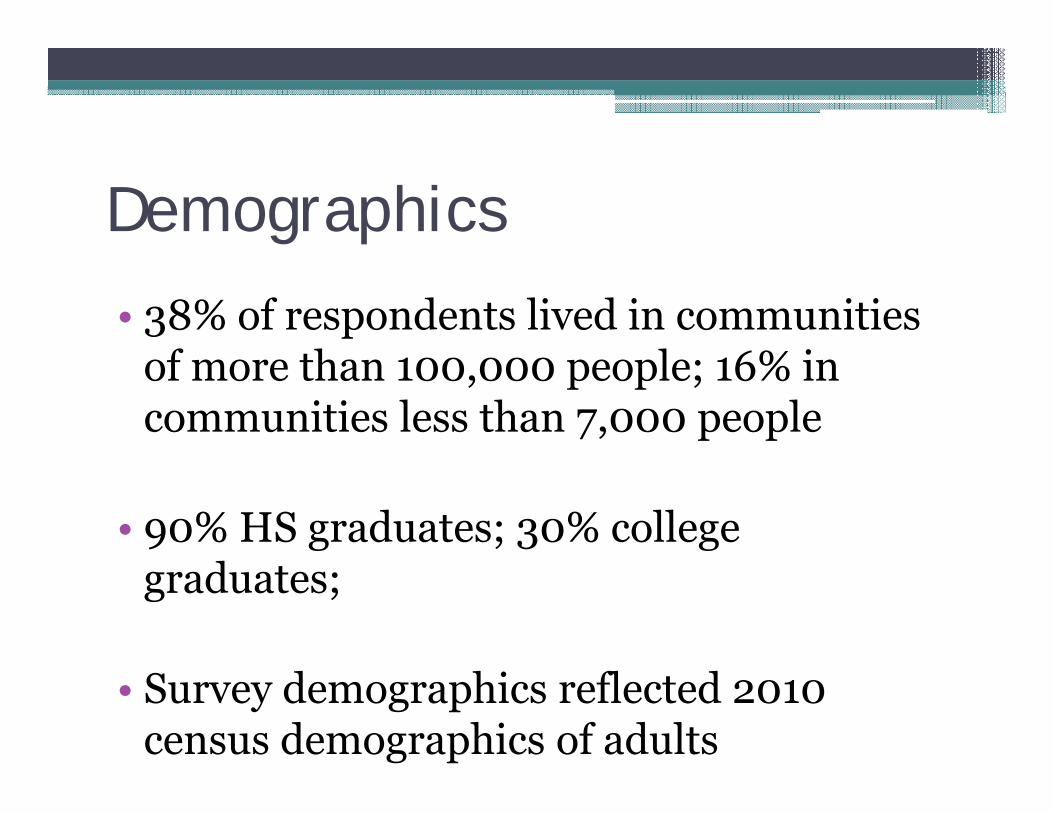
Demographics
• 38% of respondents lived in communities of more than 100,000 people; 16% in communities less than 7,000 people
• 90% HS graduates; 30% college graduates;
• Survey demographics reflected 2010 census demographics of adults

VIEW OF AGRICULTURE

Water use for irrigated agriculture is important or very important
2002 2007 2012All residents
74% 70% 70%
Urban residents
65% 62% 61%

Agriculture is an important long-term industry for the PNW
2002 2007 2012All residents
80% 77% 77%
Urban residents
75% 74% 71%
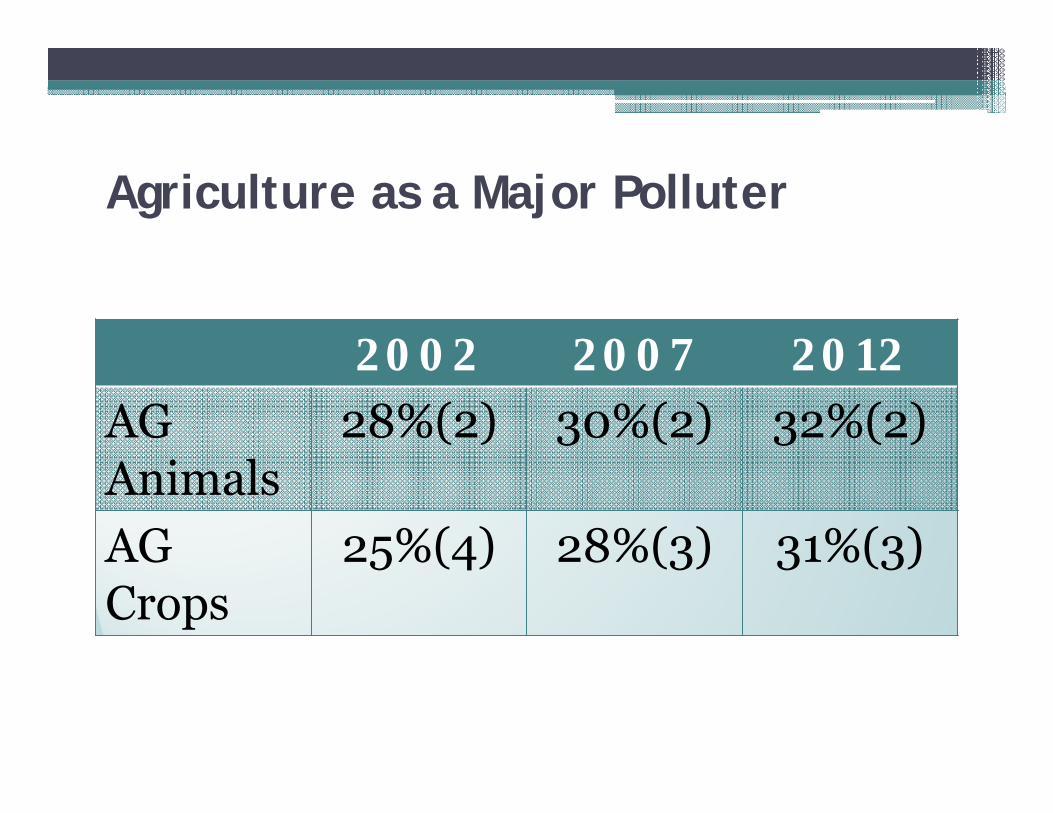
Agriculture as a Major Polluter
2002 2007 2012AGAnimals
28%(2) 30%(2) 32%(2)
AGCrops
25%(4) 28%(3) 31%(3)
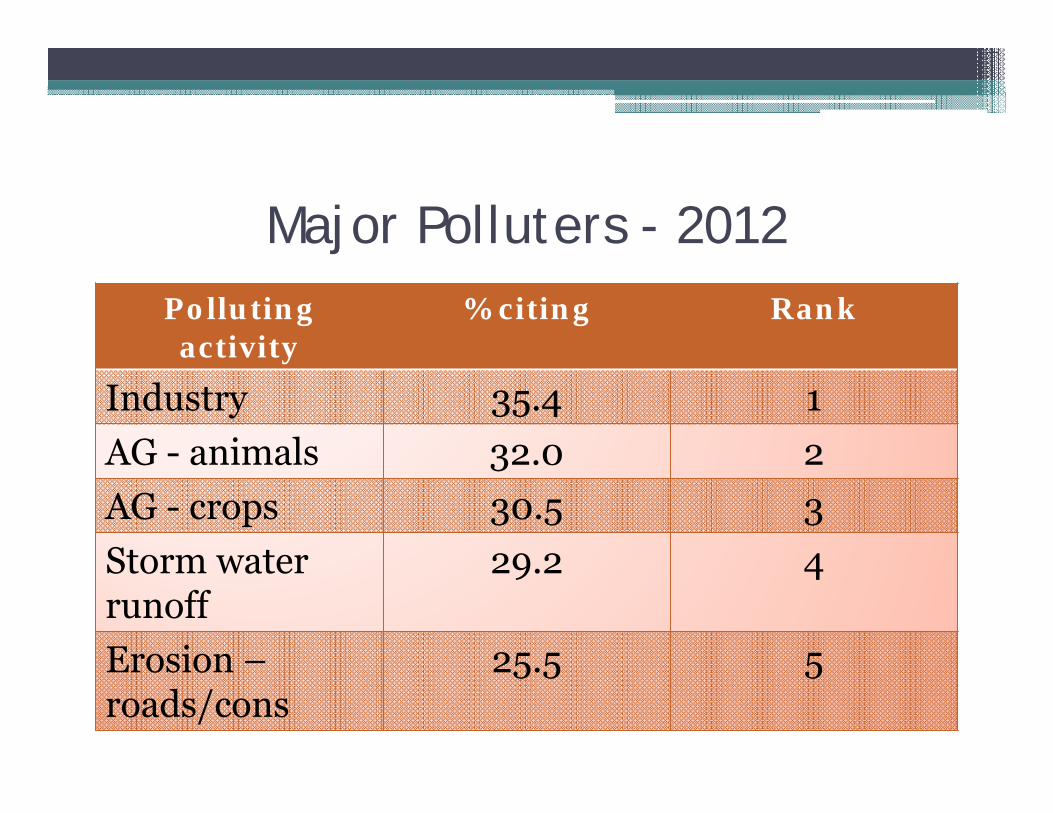
Major Polluters - 2012Polluting activity
% citing Rank
Industry 35.4 1AG - animals 32.0 2AG - crops 30.5 3Storm water runoff
29.2 4
Erosion –roads/cons
25.5 5

AGRICULTURE• Perception that AG is responsible for
significant surface water pollution is correct
• In fact, AG receives less blame than it should based on regulatory data
• AG is the major source of soil erosion and nutrient and pesticide additions to surface waters
VOLUNTARY ACTIONS AS A CONSEQUENCE
OF EDUCATION
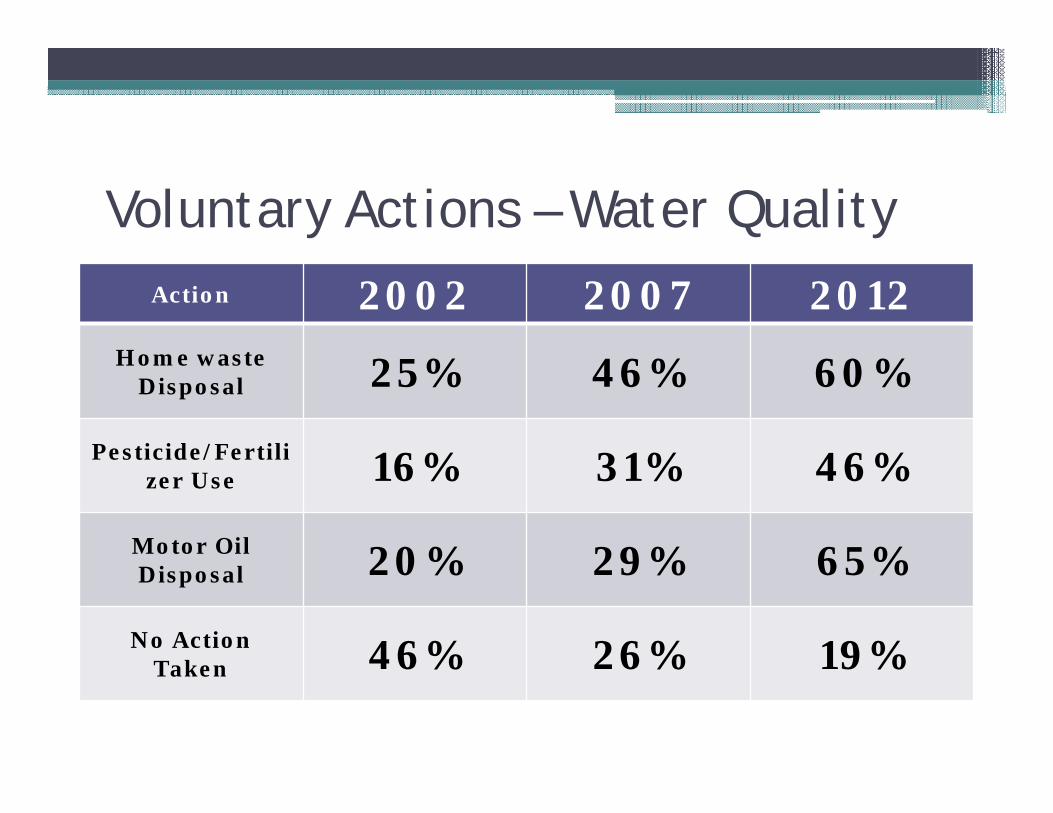
Voluntary Actions – Water QualityAction 2002 2007 2012
Home waste Disposal 25% 46% 60%
Pesticide/Fertilizer Use 16% 31% 46%
Motor Oil Disposal 20% 29% 65%
No Action Taken 46% 26% 19%
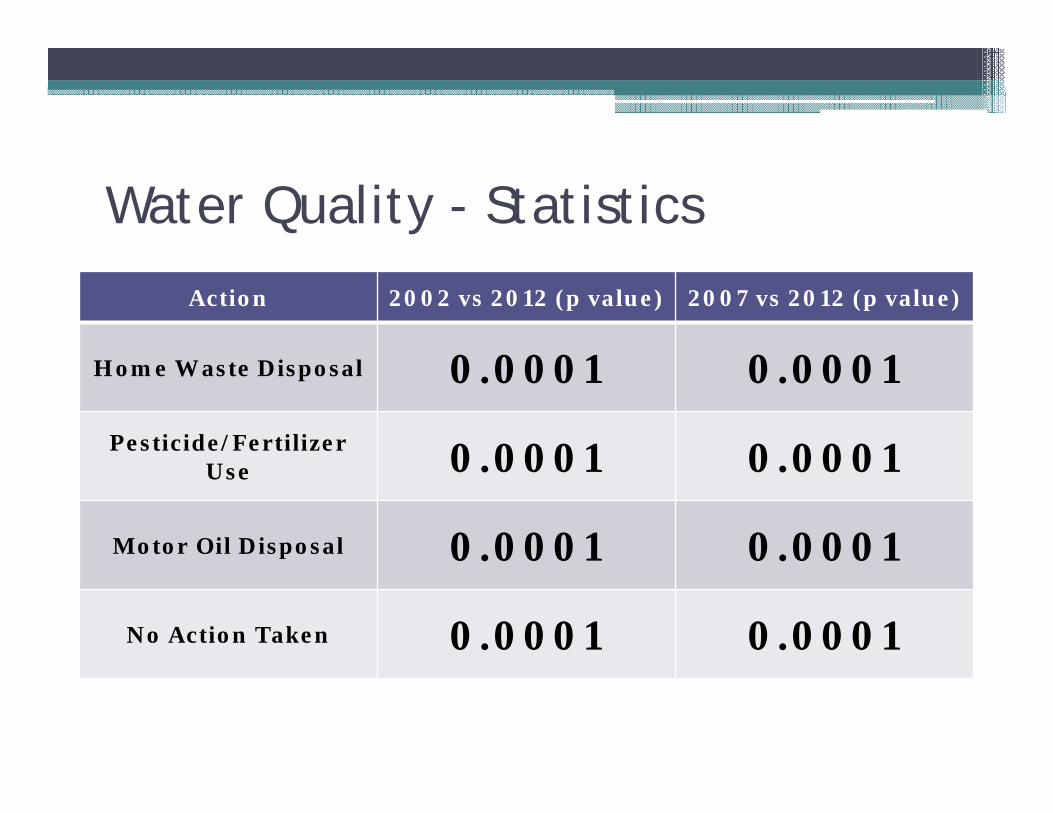
Water Quality - Statistics
Action 2002 vs 2012 (p value) 2007 vs 2012 (p value)
Home Waste Disposal 0.0001 0.0001Pesticide/Fertilizer
Use 0.0001 0.0001
Motor Oil Disposal 0.0001 0.0001
No Action Taken 0.0001 0.0001

Water Quality – Demographic FactorsAge **
Gender **
Community Size **
State NS
Occupation NS
Education Level NS
Residence Length NS
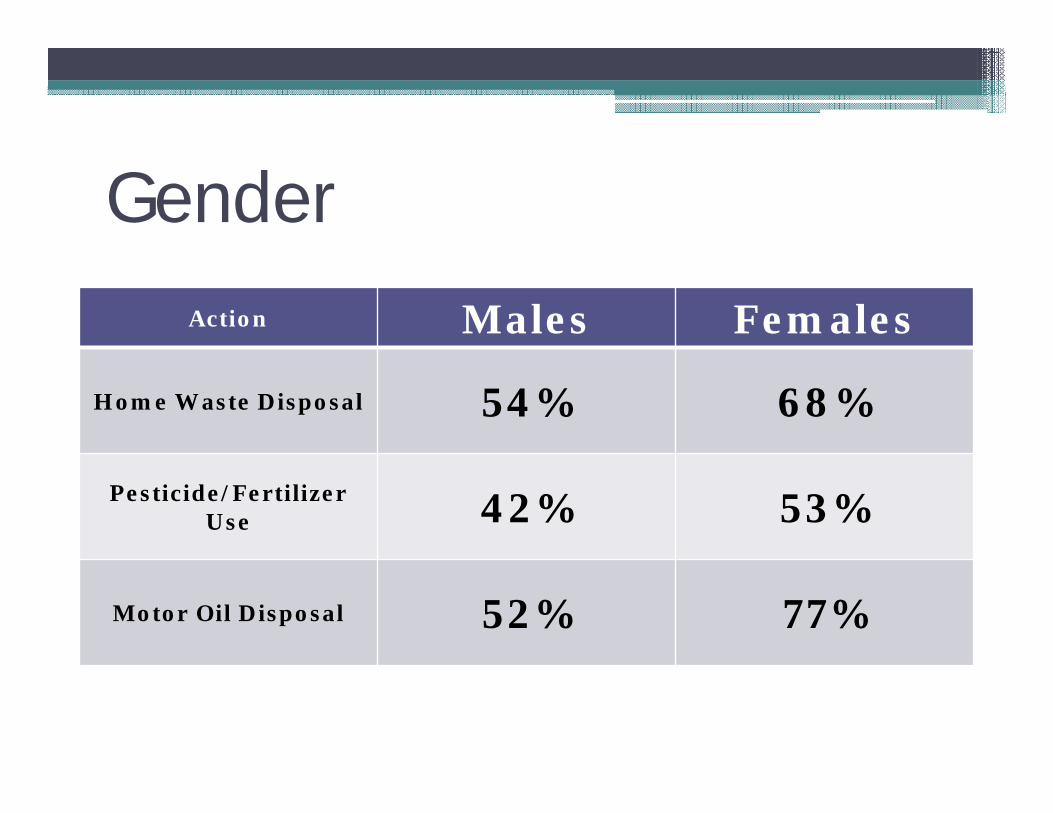
GenderAction Males Females
Home Waste Disposal 54% 68%
Pesticide/Fertilizer Use 42% 53%
Motor Oil Disposal 52% 77%
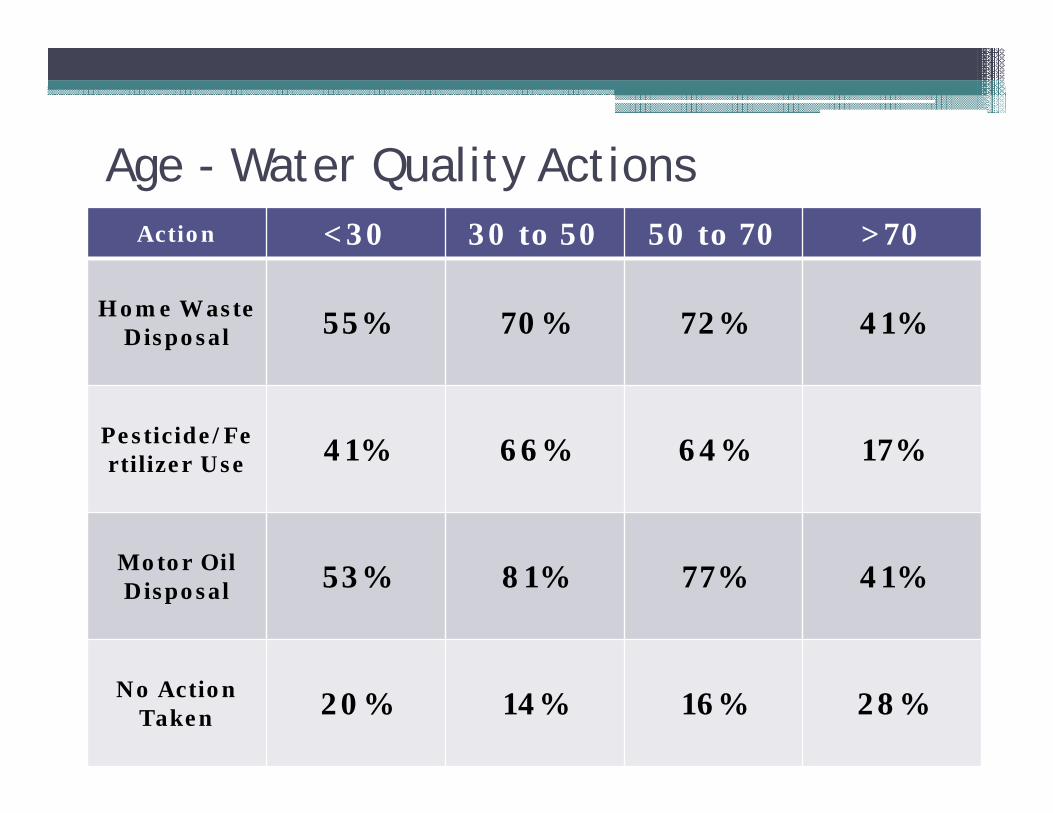
Age - Water Quality ActionsAction <30 30 to 50 50 to 70 >70
Home Waste Disposal 55% 70% 72% 41%
Pesticide/Fertilizer Use 41% 66% 64% 17%
Motor Oil Disposal 53% 81% 77% 41%
No Action Taken 20% 14% 16% 28%
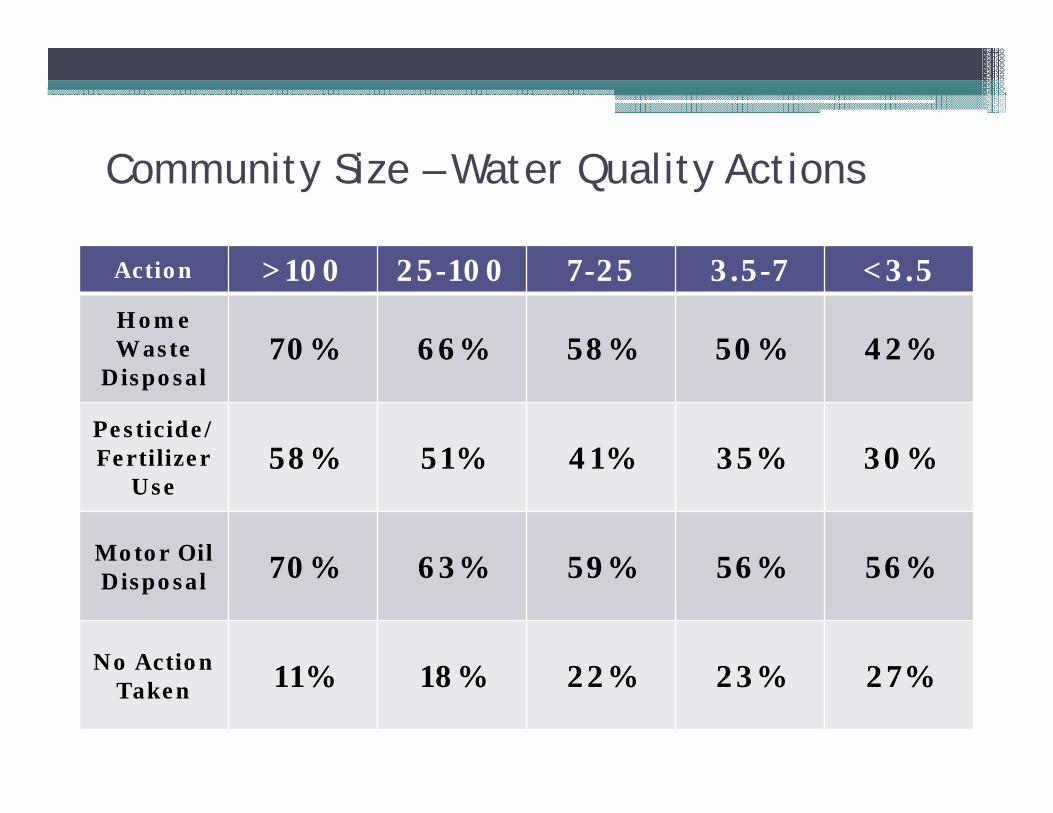
Community Size – Water Quality Actions
Action >100 25-100 7-25 3.5-7 <3.5Home Waste
Disposal70% 66% 58% 50% 42%
Pesticide/Fertilizer
Use58% 51% 41% 35% 30%
Motor Oil Disposal 70% 63% 59% 56% 56%
No Action Taken 11% 18% 22% 23% 27%

Home Waste Disposal
1. Eliminating sink disposal of products containing metals
2. Saving products considered hazardous for specific collection days
3. Safe disposal of unused pharmaceutical products
4. Composting food wastes
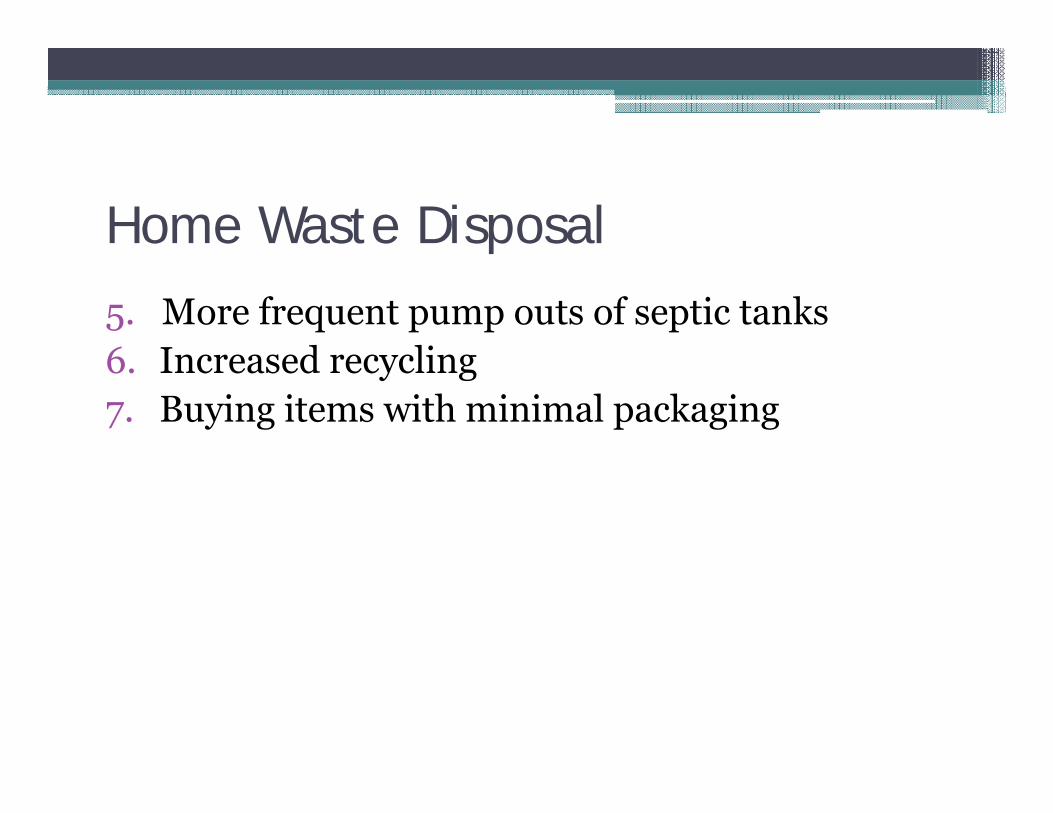
Home Waste Disposal
5. More frequent pump outs of septic tanks6. Increased recycling7. Buying items with minimal packaging
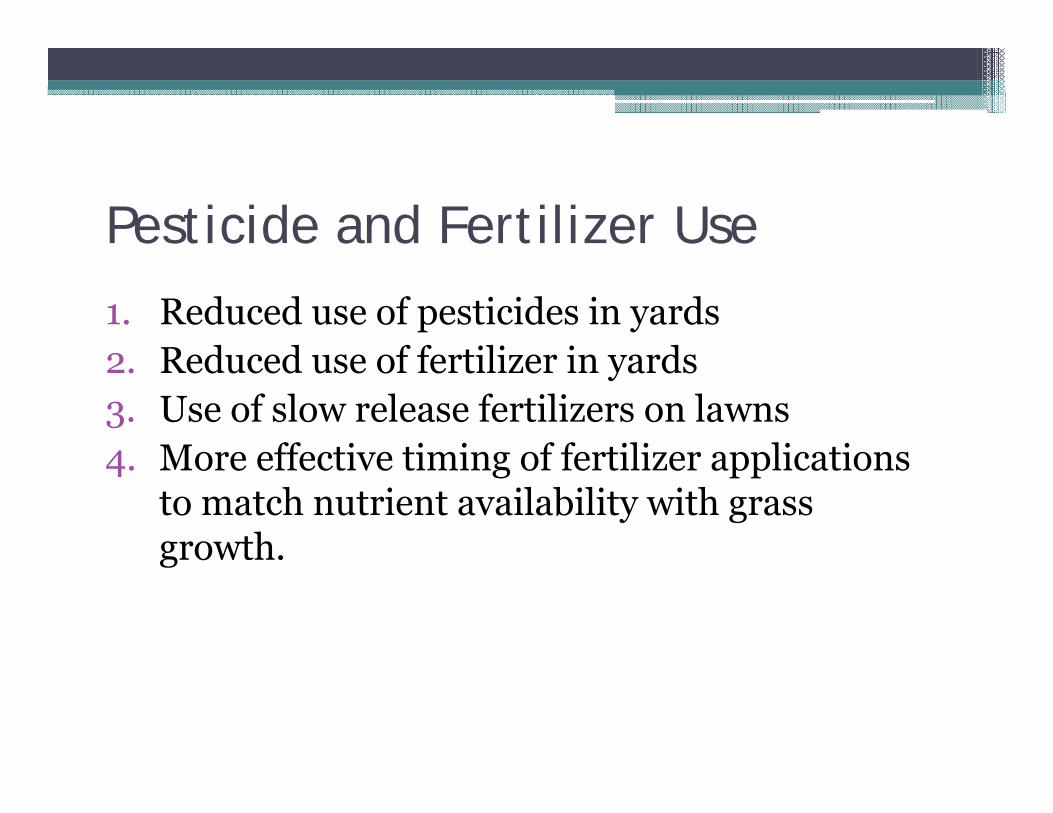
Pesticide and Fertilizer Use
1. Reduced use of pesticides in yards2. Reduced use of fertilizer in yards3. Use of slow release fertilizers on lawns4. More effective timing of fertilizer applications
to match nutrient availability with grass growth.

Pesticide and Fertilizer Use (continued)5. Adhering to pesticide application rate levels on
products purchased from home and garden centers.
6. Making sure that target pests are present on plants prior to pesticide application
7. Using natural pesticides such as soaps which are less harmful to water quality

Action 2002 2007 2012Installed Water
Saving Appliance
25% 46% 60%
Changed YardWatering 16% 31% 46%Changed
Household Water Use
20% 29% 65%Changed Vehicle
Washing27% 30% 32%
No Action Taken 46% 26% 19%
Voluntary Actions – Water Quantity

Action 2002 vs 2012 (p value)
2007 vs 2012 (p value)
Installed Water Saving Appliance 0.0001 0.0008
Changed YardWatering 0.0001 NS
Changed Household Water Use 0.0001 0.0001
Changed Vehicle Washing 0.0140 NS
No Action Taken 0.0001 0.042
Water Quantity – Statistical Significance
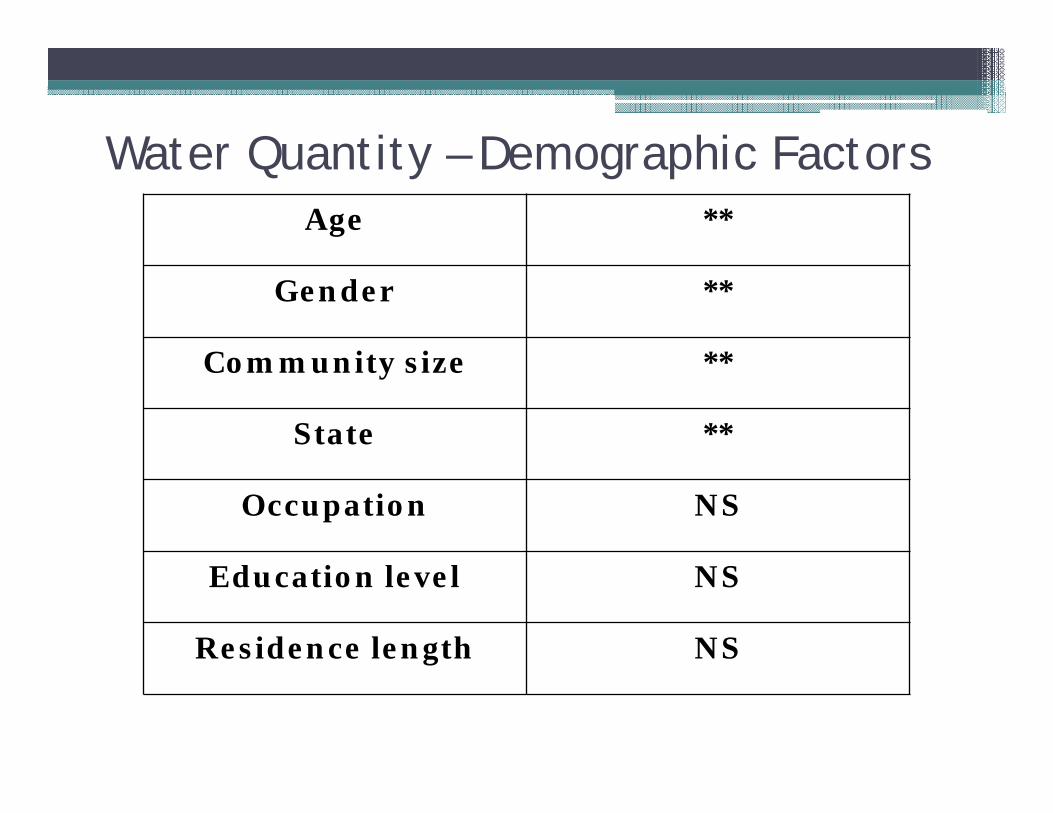
Water Quantity – Demographic FactorsAge **
Gender **
Community size **
State **
Occupation NS
Education level NS
Residence length NS
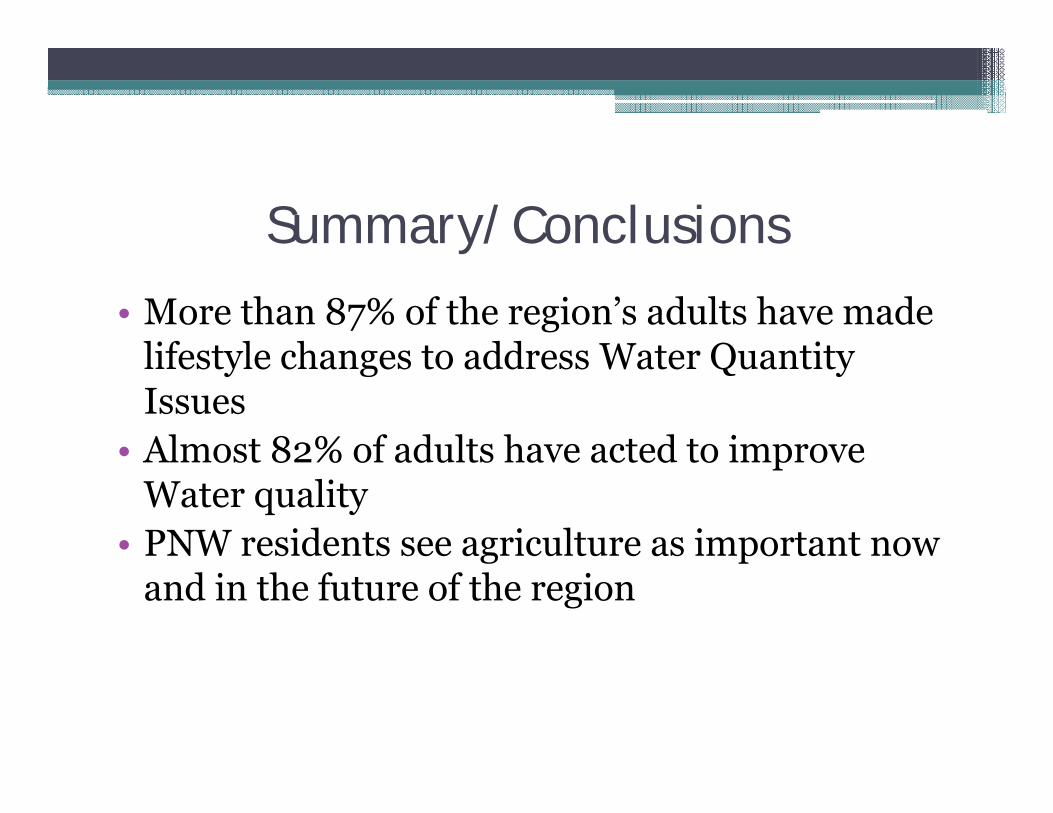
Summary/Conclusions
• More than 87% of the region’s adults have made lifestyle changes to address Water Quantity Issues
• Almost 82% of adults have acted to improve Water quality
• PNW residents see agriculture as important now and in the future of the region
Summary/Conclusions• Education to cause positive voluntary actions is
effective, and may work better than regulatory actions in this part of the USA.
• Education at the adult level works!
Why has education worked?
• Residents place a high value on water resources and they know that these resources are limited
• Voluntary actions have both positive environmental and economic benefits.