citizens’ attitudes to re-establish a permanent water flow
TRANSCRIPT
Citizens’ Attitudes to Re-Establish a Permanent Water
Flow for the Colorado River Delta, North Western Mexico
by
Xochitl Itzel Hernández Morlán
A thesis
presented to the University of Waterloo
in fulfillment of the
thesis requirement for the degree of
Master of Environmental Studies
in
Environment and Resource Studies
Waterloo, Ontario, Canada, 2007
© Xochitl Itzel Hernández Morlán 2007

ii
AUTHOR'S DECLARATION
I hereby declare that I am the sole author of this thesis. This is a true copy of the thesis, including any
required final revisions, as accepted by my examiners.
I understand that my thesis may be made electronically available to the public.

iii
Abstract
Ecosystem services and goods are non-market values that are increasingly being accounted through
contingent valuation methods and more specifically by studying people’s willingness-to-pay for them.
Large ecosystem restoration is an area that benefits from economic valuation because placing a
monetary value proves that restoration efforts are justified to preserve resources for future
generations, wanted by a community, and even a profitable investment of public funds. However,
what determines that a community supports and understands restoration efforts is linked to their
social, economic, cultural, and geographic reality. In this study I adopted the idea of willingness-to-
pay to examine people’s attitudes towards river flow restoration efforts in the Colorado River Delta.
The Colorado River Delta is a resilient ecosystem that has endured severe river flow depravation for
more than 70 years now; yet, this ecosystem still provides many environmental services and goods
and its restoration is well justified for that. This research mainly reveals that the Colorado River Delta
is still an undervalued ecosystem despite its resiliency and the many regional benefits it still provides.
This study has two research questions. Fist, I determined what factors influence Mexicali’s
willingness-to-pay. Second, I compared willingness-to-pay attitudes between the cities of Mexicali
and San Luis Rio Colorado (SLRC); two neighboring Mexican cities of different size and economic
structure but of similar social, ecologic and geographical conditions. The instrument to collect field
data was a survey that posed a realistic river flow restoration scenario at a range of prices from 10 to
90 pesos in order to test people’s willingness-to-pay; a total of 564 surveys were delivered face to
face in Mexicali. Subsequently, I compared Mexicali survey results with a previous SLRC survey.
Descriptive statistics, non-parametric analysis, and qualitative analysis were the main instruments to
arrive to my conclusions. Within Mexicali, I found that parenthood and the perception of received
benefits from the river were the most significant factors that determined people’s willingness-to-pay.
Migration was also a salient socio-demographic factor that probably has an influence on people’s
attitudes towards river flow restoration. When making comparisons between cities I found that SLRC
is more willing to pay than Mexicali, which confirmed my hypothesis that environmental awareness
influences willingness-to-pay in each city given that SLRC is a true river city while Mexicali is 64 km
away from the river. Pricing was also influential in both cities. People’s exposure to the river varied
from one city to the other –SLRC people have more interactions with the river than people from
Mexicali do, thus matching again the difference in willingness-to-pay attitudes of each city. Although
income, education, frequency of visits, and awareness of dry river conditions were expected to have a
clear connection to willingness-to-pay within Mexicali, I found only a marginal statistical relationship
that was very close to be significant. This was due to the fact that I analyzed the dependency of those
variables for all prices and not at a specific price range where the actual average willingness-to-pay
resides. Finding that average and then analyzing the relationships again should clarify this issue.
What motivates people to pay was related to resource conservation and the recognition of the river’s
ecological importance. What motivates people to not pay relates to negative attitudes such as
incredulity and lack of trust in Mexican institutions. My main recommendations are to raise local
environmental awareness of river issues with environmental education, to address local negative
attitudes towards river restoration, and to explore the analysis of these data with other approaches
such as socio-psychological models.
iv
Acknowledgements
There are many people who helped this thesis become possible. I want to thank you all even if you do
not find your names in the list below. I extend my recognition and sincere gratitude to the following
people and institutions:
CONACYT, for their exemplar scholarship program and use of Mexico’s federal resources
to sponsor students like me.
My two supervisors: Dr. Stephen Murphy and Dr. Paul Kay for their time, and constructive
critiques of my work.
Dr. Osvel Hinojosa Huerta and PRONATURA Noroeste, A.C. (SLRC, Mexico), for
allowing me to learn from them, use their facilities, access their reports, as well as for their
economic support to complement the survey expenses of 2006.
Dr. Francisco Zamora Arroyo and the Sonoran Institute (Arizona, USA), for their solidarity
to finance most of the survey expenses of 2006.
Dr. Enrique Sanjurjo Rivera of INE (Mexico City), for the exchange of information, ideas,
and his guidance throughout this study.
Biol. Jose Campoy and the offices of the Biosphere Reserve of the Upper Gulf of
California and Colorado River Delta (SLRC, Sonora), for the exchange of ideas, and the
access to their library and facilities.
Professor Bob Gibson (U. Waterloo) for helping me to find additional financial support to
conduct my research.
Dr. Lilia Leticia Ramirez, for her unconditional support both academic and emotional; a
true friend that held me together during many difficult times.
The Statistics Consulting Service of the Department of Statistics and Actuarial Sciences at
the University of Waterloo.
My family and friends, for their love, support, and patience.

v
Dedication
My thesis is dedicated to the Colorado River Delta, and to the people and organisms that live there,
depend on it, and care for it. My work is also dedicated to all those researchers, environmental
activists, and organizations that have not given up in their long journey to understand and protect this
vast and stoic ecosystem. The determination of these people and the Delta itself has been exemplar to
me, thanks to all of you for leading me in this journey.
“Esta lucha es para todos…‖
Elvira Arellano, activista y migrante en lucha, 2007.

vi
Table of Contents
AUTHOR'S DECLARATION ............................................................................................................... ii
Abstract ................................................................................................................................................. iii
Acknowledgements ............................................................................................................................... iv
Dedication .............................................................................................................................................. v
Table of Contents .................................................................................................................................. vi
List of Figures ..................................................................................................................................... viii
List of Tables ........................................................................................................................................ ix
Frequent Acronyms ................................................................................................................................ x
1 INTRODUCTION ........................................................................................................................... 1
1.1 Context of the Study ................................................................................................................. 1
1.2 Research Questions and Objectives .......................................................................................... 3
1.3 Study Area ................................................................................................................................ 4
1.4 Methodology ............................................................................................................................. 5
1.5 Thesis Organization .................................................................................................................. 5
2 CONTEXT AND CONCEPTUAL FRAMEWORK ....................................................................... 6
2.1 Research Context of the Colorado River Delta ........................................................................ 6
2.2 Hydrology of the Colorado River Basin ................................................................................... 7
2.3 Transboundary Water Management ......................................................................................... 9
2.4 Colorado River Delta Ecology................................................................................................ 10
2.5 Conservation and Restoration Opportunities in the Delta ...................................................... 12
2.6 Environmental Services and Willingness-to-Pay ................................................................... 15
2.7 Willingness-to-pay in a Latin American context .................................................................... 17
2.8 Importance of valuating the environment ............................................................................... 17
2.9 Socio-psychological models and willingness-to-pay .............................................................. 18
2.10 Conceptual Framework of the Study .................................................................................... 19
3 METHODOLOGY ........................................................................................................................ 21
3.1 Introduction ............................................................................................................................ 21
3.2 Area of Study .......................................................................................................................... 21
3.2.1 SLRC survey.................................................................................................................... 24
3.3 Research Methods ................................................................................................................... 24
vii
3.3.1 Mexicali Survey ............................................................................................................... 24
3.3.2 Secondary Data ................................................................................................................ 30
3.3.3 Direct Observation ........................................................................................................... 31
3.4 Analysis ................................................................................................................................... 31
3.5 Ethics ....................................................................................................................................... 31
4 RESULTS ...................................................................................................................................... 32
4.1 Descriptive statistics of Mexicali survey ................................................................................ 32
4.1.1 Participants’ socioeconomic profile ................................................................................. 32
4.1.2 Visitor-river interactions .................................................................................................. 35
4.1.3 Willingness-to-pay for a constant water flow .................................................................. 37
4.1.4 Willingness-to-pay for potential recreational opportunities ............................................. 42
4.2 Cross-tabulation analysis of Mexicali variables ...................................................................... 46
4.3 Mexicali and SLRC analysis ................................................................................................... 49
4.3.1 San Luis Rio Colorado and Mexicali descriptive statistics .............................................. 49
4.3.2 Chi-square test for independence of SLRC and Mexicali ................................................ 52
5 DISCUSION .................................................................................................................................. 58
5.1 Environmental awareness influence on willingness-to-pay differences ................................. 58
5.2 Factors influencing willingness-to-pay in Mexicali ................................................................ 60
5.3 Other factors (Mexicali) .......................................................................................................... 61
5.4 Mexicali and SLRC differences in willingness-to-pay ........................................................... 63
6 CONCLUSIONS and RECOMENDATIONS ............................................................................... 64
APPENDIX A –Mexicali (2006) .......................................................................................................... 66
APPENDIX B –SLRC (2005) .............................................................................................................. 84
viii
List of Figures
Figure 1.1. Study area delimiting the ecological zones currently identified in the Colorado River Delta
(adapted from Zamora-Arroyo et al., 2005). .................................................................................. 4
Figure 2.1. The conceptual framework of this study. .......................................................................... 20
Figure 3.1. The state of Baja California with its five municipalities: Mexicali, Ensenda, Playas de
Rosarito, Tijuana, and Tecate (Gobierno del Estado de Baja California, 2007). ......................... 22
Figure 3.2. The city of Mexicali including its 208 AGEBs (Gobierno del Estado de Baja California,
2007). ........................................................................................................................................... 27
Figure 3.3. Example of an AGEB, the intermediate survey area to survey Mexicali (Bimsa-Focus,
2006). The stars indicate starting points (red) and sampled households (green). ........................ 28
Figure 4.1. Five-number summary of participants’ age and years of residency in Mexicali. ............. 32
Figure 4.2. Histogram of participants’ number of years living in Mexicali. ........................................ 33
Figure 4.3. Participants' income in a five-number summary. .............................................................. 34
Figure 4.4. Preferred activities associated to river visits in the Colorado River (n=131). .................. 36
Figure 4.5. Summary of affirmative support (%Yes) to pay Offer1 and Offer2 in Mexicali. ............. 39
Figure 4.6. People who changed their mind and agreed to pay Offer3 (right side columns), after
stating ―No‖ support to Offer1. .................................................................................................... 40
Figure 4.7. Main reasons to not pay to re-establish constant water flow. ............................................ 41
Figure 4.8. Perceived personal benefits associated to the Colorado River. ......................................... 43
Figure 4.9. Perceived regional benefits associated to the Colorado River. .......................................... 44
Figure 4.10. Potential visitors' ranges of expenditure for a river trip (pesos/person/day). .................. 45
Figure 4.11. Collective ideas to improve the quality of their visits to the Colorado River.................. 46
Figure 4.12. Comparison of annual ranges of income between SLRC and Mexicali (2006). ............. 52
Figure 4.13. Comparison of answers to all Offer1 prices (Mexicali, n= 563; SLRC n= 302). ............ 54
Figure 4.14. Comparison of answers to all Offer2 prices (Mexicali n= 252; SLRC n= 213). ............. 54
Figure 4.15. Comparison of answers to all Offer3 prices (Mexicali n= 311; SLRC n= 89). ............... 55
Figure 4.16. Comparison of all answers, all prices, and all Offers, for both locations (Mexicali n=563;
SLRC n=302). .............................................................................................................................. 56

ix
List of Tables
Table 4.1. Percentage of people reflecting their willingness-to-pay to restore a constant river flow. . 38
Table 4.2. Percentage of people reflecting less willingness-to-pay to restore a constant river flow. ... 38
Table 4.3. Descriptive summary of willingness-to-pay. ....................................................................... 39
Table 4.4. Relevant associations of variables from Mexicali survey. .................................................. 48
Table 4.5. Mexicali and SLRC associations of willingness-to-pay. ..................................................... 53
x
Frequent Acronyms
AGEB – Area Geoestadistica Basica (Basic Geostatistic Area)
CILA – Comison Internacional de Limites de Aguas, Mexico
CONAGUA – Comision Nacional del Agua (National Waters Commission)
CONANP – Comision Nacional de Areas Naturales Protegidas (National Commission for Natural
Protected Areas, Mexico)
CONEPO – Consejo Estatal de Poblacion, Baja California (Population State Council)
df – Degrees of freedom
EVRI – Environmental Valuation Reference Inventory
GNP – Gross National Product
IBWC – International Boundary and Water Commission, U.S.
INE – Instituto Nacional de Ecologia (National Institute of Ecology, Mexico)
INEGI – Instituto Nacional de Estadistica, Geografia e Informatica (National Institute of Statistics,
Geography and Informatics, Mexico)
MODE – Wellton-Mohawk Main Outlet Drain Extension Canal
NGO(s) – Non-Governmental Organizations
ppm – parts per million, salinity measure (1/1,000,000)
ppt – parts per thousand, salinity measure (1/1,000)
RC/ CR – Rio Colorado
RH/ HR – Rio Hardy
SEMARNAT – Secretaria del Medio Ambiente y Recursos Naturales (Environment and Natural
Resource Secretariat, Mexico)
SER – Society for Ecological Restoration
SLRC – San Luis Rio Colorado
SPSS – Statistical Package for the Social Sciences
TFDD – Transboundary Freshwater Dispute Database by the Department of Geosciences of Oregon
State University
WTP – Willingness-to-Pay
1
1 INTRODUCTION
1.1 Context of the Study
Ecosystem services are non-market values whose importance society has just begun to
recognize, especially after events such as hurricane Katrina, in 2005. The immediate devastation of
Katrina is perhaps one of the best cost-benefit examples ever given by nature. Were decades of
development and economic accomplishments worth the multidimensional costs of Katrina, roughly
estimated in 1,836 lives and $156 U.S. billion (Burton and Hicks, 2005); or are Katrina’s immediate
and long-term losses higher than the benefits extracted? These types of questions are slowly emerging
to shed some light on how society has undervalued ecosystem services over time. Answering this type
of questions is both a challenge and a necessity. This study looks at the Colorado River delta, a case
study where environmental services at the end of the river were also never taken into consideration
before damming the river, and where remnant environmental services are still undervalued. Restoring
damaged ecosystems is an alternative to conserve species, ecosystem functions, and biodiversity as a
whole. However, the ecological restoration of large ecosystems is a major task and it can only be
successful with citizen support and participation. This thesis is about assessing citizens’ attitudes
towards restoring a permanent river flow in the Colorado River delta; their attitudes directly relate to
the level at which they value a restored ecosystem service.
Documents and citizens’ collective memory recognize that the Colorado River delta, including
the Upper Gulf of California, was once one of the world’s greatest desert estuaries. During most of
the twentieth century, water diversions and dams prevented the Colorado River from reaching the sea.
For decades, the generalized thought was that the Colorado River delta’s ecosystems had been
condemned to collapse. Although the delta’s original abundance of water and wildlife will be
remembered mostly through pictures, documents, and stories, recently the delta has also shown
unpredicted signs of recovery. Despite all odds, years ago the delta made a meaningful comeback as a
result of unusual wet years during the period 1980-1993, which saw El Niño events and the filling of
major structures upstream (Pitt, 2001). A decade of incidental flows triggered the delta’s ecosystem
resilience, a slow process witnessed by local communities and a few researchers from both sides of
the border. After damming the river and during dry years, agricultural waste flows have been the only
fresh water source maintaining what is left of the Colorado River delta (Glenn, 1998; Luecke, et al.,
1999). Luecke et al. (1999) describe today’s delta as ―a remnant of small wetlands and brackish
2
mudflats‖ covering about 60,000 Ha, an area that equals 8% of its original surface (Glenn et al.,
1999).
According to many authors (Glenn, 1998; Luecke et al., 1999; Pitt, 2001; Zamora-Arroyo et
al., 2005), the Colorado River delta in Mexico merits conservation due to the value of its remaining
habitat and wildlife resources. Progress to restore and conserve the remaining Colorado River delta is
just beginning. Two recent milestones have shown some changing views on water use and users
(Hyun, 2005). In 2000, the first diplomatic agreement towards recognizing the Colorado River delta’s
water needs was signed under the name of Minute 306. This milestone proves that the delta’s
environmental agenda is gaining importance, but it will take a while before these changing views
translate into legislation and action. Minute 306 did not grant water for environmental purposes in the
delta; it only recognized that the two countries cooperate in studies, with an aim to conserve the
delta’s environmental assets (Pitt, 2001). Prompted by Minute 306, in 2002, many scientists, NGOs,
and land managers gathered at a binational meeting to produce a document titled ―Conservation
Priorities in the Colorado River Delta‖ (Zamora-Arroyo et al., 2005). Although this document cannot
be considered a restoration or conservation plan per se, it constitutes an important step in organizing
knowledge and experts in the region. Conservation Priorities is the first collective transboundary
document that visualizes a direction for conservation and restoration efforts in the Colorado River
delta. Among many recommendations, evaluating the economic costs and benefits of restoration is
one of the research needs identified in that document.
The Society for Ecological Restoration (SER) International defines ecological restoration as
―an international activity that initiates or accelerates the recovery of an ecosystem with respect to its
health, integrity, and sustainability. Frequently, the ecosystem that requires restoration has been
degraded, damaged, transformed or entirely destroyed as the direct or indirect result of human
activities.‖ Ehrenfeld (2000) recognizes three common levels of goals in the fields of conservation
and restoration: species, ecosystems, and environmental services, each level with varying strengths
and weaknesses. One of the advantages of using environmental services as a goal for restoration is its
obvious human interest that generates economic and political support. Given that the Colorado River
is subjected to greater institutional control than perhaps any other river in the world (Cohen, 2002), it
seems logical to strengthen an economic approach in the restoration efforts of the delta, aiming to
convince and gain support from citizens and decision makers in both nations.
In Conservation Priorities (Zamora-Arroyo et al., 2005), most restoration research has already tackled
restoration work by focusing on species and ecosystems. An ecosystem service approach has just

3
begun to be examined through studies of economic valuation of ecosystem services. The National
Institute of Ecology (INE, Mexico) recently finished an economic valuation of the in-stream flows in
the Colorado River delta. In San Luis Rio Colorado (SLRC), Sonora, INE used a contingent valuation
method to determine the non-use value of restoring a constant river flow. With this study INE
concluded that the Mexican government should invest in restoration efforts, given that restoring the
river will also derive modest economic benefits to the region (Sanjurjo and Carrillo, 2006a).
Gathering more information about citizens’ levels of interest on flow restoration, in large cities such
as Mexicali, will contribute to further justify a federal restoration plan for the delta.
Willingness-to-pay surveys are common tools used for the economic valuation of ecosystem
services and goods that are not part of the world’s markets (Carson, 2000). Estimating people’s
willingness-to-pay to conserve or restore the environment is useful for planning, policymaking,
taxation, and resource conservation. Understanding why people is in favor or opposed to restore an
ecosystem service can be approached using socio-psychological models which basically evaluate the
systems of beliefs, motivations and behaviors that characterize a group of people. In this study I
specifically look at the motivations behind willingness-to-pay to restore a river flow.
1.2 Research Questions and Objectives
This study seeks to answer two main research questions:
1. What factors influence the attitudes of Mexicali citizens towards re-establishing a permanent
water flow for the Colorado River?
2. Is there a difference in people’s attitudes towards re-establishing a permanent water flow in
the Colorado River, between the cities of Mexicali and SLRC, Mexico?
The main research hypothesis is:
Hypothesis: Mexicali and SLRC have different willingness-to-pay attitudes due to differences in
levels of environmental awareness in each city.
In order to answer these research questions and test my hypothesis, this study had three specific
objectives: 1) to survey Mexicali and gather evidence of citizens’ attitudes towards the potential
restoration of a permanent water flow for the Colorado River; 2) to compare results between Mexicali
and SLRC surveys, in order to identify patterns and differences in levels of citizens’ interests to
4
support river flow restoration in each city: 3) to collect high-quality information that can be
transferred to INE for its econometric analysis. Expanding our understanding of the economic costs
and benefits of restoration will contribute to design an integral restoration plan for the Colorado delta.
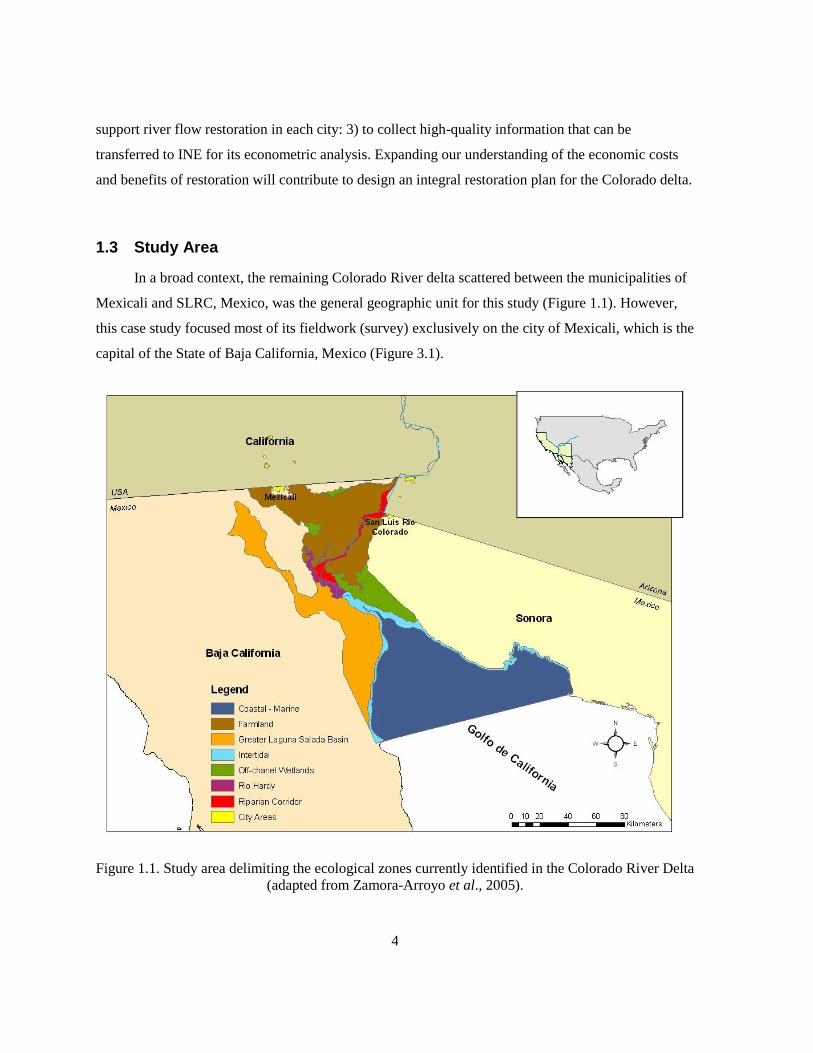
1.3 Study Area
In a broad context, the remaining Colorado River delta scattered between the municipalities of
Mexicali and SLRC, Mexico, was the general geographic unit for this study (Figure 1.1). However,
this case study focused most of its fieldwork (survey) exclusively on the city of Mexicali, which is the
capital of the State of Baja California, Mexico (Figure 3.1).
Figure 1.1. Study area delimiting the ecological zones currently identified in the Colorado River Delta
(adapted from Zamora-Arroyo et al., 2005).

5
1.4 Methodology
This study mostly uses a case study approach to achieve its goals. Two specific tools for data
collection and analysis were used: a field survey in Mexicali, and cross tabulation analysis (Pearson’s
Chi-square). The results of the Mexicali survey are the prime material for most of our analysis and
they are presented in the descriptive statistics (Section 4.1). The cross tabulation analysis is used to
assess dependency across Mexicali variables. The Chi-square test for independence focuses on testing
if there is a difference in willingness-to-pay between Mexicali and SLRC. Other tools to collect
complementary data included direct observation, and secondary sources such as the SLRC survey
results (2005), academic reports, and government records.
1.5 Thesis Organization
This thesis has been divided into six chapters, two Appendixes, and a bibliography. This
introductory chapter presents the problem statement, purpose, research questions, and hypothesis
underpinning the study, as well as a general explanation of the methodology and the structure of the
document. Chapter 2 delves into a broader background explanation of the Colorado River Delta
environmental issues and it explains the conceptual framework of this study. To explain the
theoretical context of the study I examine how citizens’ attitudes to support ecological restoration can
be assessed with willingness-to-pay surveys. Chapter 3 provides a detailed explanation of the
methodology followed during this study. Chapter 4 contains the study’s results divided in three main
blocks: Mexicali survey descriptive statistics; cross tabulation analysis of relevant Mexicali variables;
and a comparison of willingness-to-pay distributions of Mexicali and SLRC (Chi-square test for
independence). Graphical and numeric evidence to discuss and answer the two initial research
questions is provided during this chapter. Chapter 5 discusses the main findings of this study. Chapter
6 presents conclusions and recommendations for the direction of future research. Finally, Appendix A
and B provide Mexicali and SLRC supporting materials, respectively.

6
2 CONTEXT AND CONCEPTUAL FRAMEWORK
2.1 Research Context of the Colorado River Delta
According to Sykes (1937), the first records of explorations conducted in the Colorado River
delta took place in 1539 by Francisco de Ulloa, a captain in the service of Hernan Cortes. Despite
those first attempts, ―the delta remained almost a terra incognita for the coming two centuries
thereafter‖. Most of the records left by the first explorers merely contribute small glimpses of an
―unattractive land, traversed by a great river that was difficult to access, surrounded by inhospitable
deserts of unknown extent, and guarded from a sea approach by great and violent tides‖. In his
physiographic study of the Colorado River delta, one of the earliest academic studies of this area,
Sykes (1937) provided valuable information through 45 years of personal observations of the delta.
This study was unique because it was done at a time of major environmental changes in the delta’s
ecosystem, and because the Colorado River delta had not been formally studied before 1937 – at that
time, the Mississippi and the Fraser River deltas were the only deltas previously studied in North
America. Sykes was particularly interested in the Colorado River delta because of its size, its
peculiarities as a desert delta that alternately discharged its waters into land-locked basins and the sea
(one of the few deltas with this characteristic in the world), and because of the magnitude and effects
of tides on the deposited sediments (tides three times bigger than those of the Tigris-Euphrates in the
Persian Sea, its nearest analogue). Sykes (1937) rightly predicted most of the major environmental
changes that would affect the delta after the damming of the river was completed, which included
changes in vegetation cover, erosion at the delta and head of the Gulf of California, elimination of
flood hazards in the lower Colorado River, new hydrological conditions, landscape changes, and
transboundary political tension for water resources.
According to Cohen (2002), the development of water resources has brought economic growth
to entire regions, generated relatively clean power, provided regular-dependable supplies for urban,
industrial and agricultural users, and allowed the settlement of new areas that otherwise, without
massive hydrologic infrastructure and institutions, would have not been possible. The Colorado River
has not been the exception; it has brought economic growth to most of the southwestern United States
and northwestern Mexico. This area provides today a valuable example about the complexity of the
interactions of human development, economic progress, water management, politics, and
environmental degradation across international borders. Several authors such as Sykes (1937),
Leopold (1948), Luecke et al. (1999), Pitt (2001), Cohen (2002), and Ward (2003) highlight that
7
progress had come to the Colorado River Basin at a high environmental costs: developing agricultural
oases transformed the region’s landscape in less than a century.
In 1981, Fradkin concluded in his book A River No More, that the Colorado River Delta was
dead after more than 50 years of extreme fresh water depravation. However, despite all predictions the
delta showed signs of recovery in response to small incidental floods during the late 1980s. According
to Glenn et al. (1996, 2001), the delta has been partially revegetated following 20 years of
unintentional water releases from the United States, which brought back native trees and other original
vegetation to its riparian corridor. Similarly, Galindo-Bect et al. (2000) correlated peak shrimp catches
of the last two decades, in the Gulf of California, with pulses of water released to the Colorado River
delta. Evidence like this motivated scientists and local and international conservationist groups in 2000
to join efforts to awaken federal and binational attention: to persuade them to work together in the
conservation and restoration of the remaining, but resilient Colorado River delta.
2.2 Hydrology of the Colorado River Basin
The Colorado River basin covers 655,000 km2, from the snow-covered Rocky Mountains range
in the United States to the arid salt flats of the remaining Colorado River delta in Mexico. Miller
(1998) states that the Colorado River has a total length of about 2,300 km before reaching the Gulf of
California in Mexico. About 98.4% of the Colorado River basin lies within the United States, and the
rest (1.6%) is in Mexico (TFDD, 2002). Within the basin, the Rocky Mountains receive most of the
precipitation, primarily as snow. Much of the rest of the basin is extremely arid, with less than 80 mm
of annual precipitation (Harding et al., 1995). Harding et al. (1995) report that 70% of the river’s
annual natural flow occurs from May through July, when the spring and summer heat melts the snow
in the Rockies. Ohmart et al. (1998) also report that intra-annual fluctuations vary, depending on the
size of the Rockies’ snow pack and how quickly it melts, with peak flows in June and the lowest flows
in mid-winter.
The Colorado River’s hydrologic history can basically be divided in two: before and after major
dam construction and water diversion projects along the river. Cohen (2002) argues that marked
volume fluctuations used to characterize the Colorado, both between and within years prior to any
man-made modifications of the river. The maximum reconstructed annual flow (i.e., the flow that
would have occurred without dams or withdrawals) during the period of record occurred in 1983, with
an estimated flow of 31 km3; the minimum reconstructed flow occurred in 1934, with an estimated
flow of 7.7 km3. According to other researchers, the average annual flow could have varied from a

8
long-term mean of 16.7 km3, based on tree-ring records (Meko et al., 1995), to 18.6 km
3 for the past
century of instrumental record (Owen-Joyce and Raymond, 1996).
The new hydrology of the Colorado River is strictly subjected to institutional control through
nearly 50 dams (Nijhuis, 2005) and more than 80 major diversions that move water out of the
Colorado River to irrigate more than 1.5 million Ha and serve about 30 million people in the U.S and
Mexico (Pontius, 1997; Luecke et al., 1999). The first diversions for agricultural purposes were in
1896, but it was not until the completion of Hoover Dam (1935) that the flow of the river was
completely controlled (Glenn et al., 1996; Cohen, 2002; Ward, 2003). These major dams succeeded at
holding water and large amounts of sediments that used to characterize the river (from there its name
―Colorado‖), but by 2000, Kowalewski et al. reported reverse sedimentary processes in the delta,
which means that the tides currently are removing more sediments than what the river discharges.
Now that the Colorado River hydrology is controlled by predictable sets of releases (timed to meet city
and irrigation needs, and maximize peak power generation), the river below dams rises and falls as
much as 1.2 m/day (4 ft/day) (Reclamation, 1996). Also, each drop of the Colorado River water is
estimated to be used an average of 17 times (Cohen, 2002), but while irrigated agriculture is the top
tier user, evaporation from reservoirs is the second largest consumer in the Colorado Basin. Diversions
such as the water piped to Los Angeles are the third largest withdrawal.
Although a complete hydrologic model for the delta area is in the top five research priorities
(Zamora-Arroyo et al., 2005), some advances have been made in this respect. For instance, Glenn et
al. (1996) list five main sources of water for the Colorado River delta. The first one is Rio Hardy, a
tributary of the Colorado River, which originates from a geothermal well discharge and from
agricultural return flows (Payne et al., 1992). Flow volumes of this tributary are not well documented
but a mean discharge of agricultural return, for 1971-1976, averaged 1.3 km3. The second source is the
Wellton-Mohawk main outlet drain extension (MODE) canal, which since 1977 has carried 1.2-1.8
km3/year of mildly saline (3ppt) ground water from the irrigation district of Wellton-Mohawk, Arizona
(Burnett et al., 1993). The third source of water is the Riito Drain with approximately 0.25 km3/year
of agricultural drain water (4ppt) from the San Luis irrigation district. The fourth source comes from
natural seepage, via artesian springs of groundwater onto the mudflats, though its exact volume is
unknown. Estimations made by Glenn et al. (1996), report 0.1 km3/year of artesian flow; this small
flow is important because it provides a constant source of water in core delta areas. The last source of
water is seawater from the Gulf of California. Although hypersaline (40 ppt), this source is significant
because of the extreme tide ranges of the Upper Gulf, some of the highest of any coastline (Thompson,
1968).
9
Additionally, Cohen et al. (2001) calculated a preliminary water balance for the lower Colorado
River main stream, Ciénega de Santa Clara, and El Indio wetlands in the delta, for the period of 1992
to1998. Among the main findings of this research was that during non-flood years, agriculture and
domestic returns to the main stream contributed 180% of discharge at the International Border (at San
Luis Rio Colorado, Sonora, Mex.), but that such volume may not be sufficient to meet the flood
requirements demanded by native riparian species. The most consistent source of water to the delta
was agricultural drainage, which provided the majority of the discharge for most of the wetlands (El
Indio) and Ciénega de Santa Clara. The quality of the returned flow was assumed to be low.
2.3 Transboundary Water Management
The allocation of the Colorado River waters between Mexico and the United States lies in a
complex legal framework called ―The Law of the River‖. This law is a collection of legal documents
that reflect the negotiations between both countries since the Mexico-U.S. Water Treaty of 1944. In
this treaty Mexico was guaranteed an annual volume of 1.85 km3 (plus an annual surplus), and a later
amendment also prescribed a salinity range of 115 ppm ± 30 ppm U.S count (IBWC, 1973; Varady et
al., 2001; Cohen, 2002; Ward, 2003). The two commissions that rule international water negotiations
are the International Boundary and Water Commission (IBWC) representing the United States, and the
Comisión Internacional de Limites y Aguas (CILA) on behalf of Mexico.
According to Glenn et al. (1996), Mexico was allotted approximately 10% of the base river
flow, through the Water Treaty of 1944, but left the delta with no water rights for nature’s use (the
remaining 90% is used by the U.S.). Nevertheless, he points to a change that took place in the early
1980s, when up stream dams reached their capacity (Lake Mead and Lake Powell, in 1979 and 1977,
respectively), combined with the occurrence of a wet period (1980-1983, during El Niño events). Such
a change allowed water to reach the delta, through water releases up to 10 times higher than water
treaty allotments (average excess flows were 4.8 km3/ year, or three times the treaty allotment). That
amount of water represented 25% of the historic flow that reached the delta, before the dams were
constructed (Glenn et al., 1996). These unintended floods were responsible for the partial recovery
that the delta has experienced since 1981, which demonstrated the resiliency of the delta’s ecosystem
and the need for restoration and conservation of this area.
An important milestone in ―The Law of the River‖ for conservation purposes of the delta is
Minute 306, signed by IBWC and CILA in 2000. Minute 306 represents the first bilateral recognition
10
of the ecological importance of the delta. Nevertheless, this minute falls short because it does not go
beyond recognizing the need to study the delta’s ecological needs. Overall, so far academics and
NGOs have been the only ones to make significant contributions to move the delta’s research,
conservation, and restoration efforts forward.
Given the river impoundment’s storage capacity and flood control capabilities, Glenn et al.
(1996) conclude that during new wet years, excess flow could be expected to be released into the delta
again (Holburt, 1982, 1984; Rhodes et al., 1984). Although the storing capacity is 740 km3, the total
space needed for flood control is only 66 km3, thus during wet years storage capacity and distribution
of excess water are limited.
According to the Global International Waters Assessment (GIWA) for the Gulf of California
(Arias et al., 2004), there are two major problems in the legal framework that have had a considerable
impact on the Colorado River delta: the Colorado River waters are over-allocated (up to 30% by some
estimates), and ecosystems are not considered beneficial users of that water. The combination of these
two problems means that the Colorado River delta is last in line of a valuable and over-allocated
resource.
2.4 Colorado River Delta Ecology
The delta of the Colorado River was once one of the world’s great desert estuaries, supporting
vast riparian freshwater, brackish, and inter-tidal wetlands in the most arid portion of the Sonoran
desert (McDougal, 1904; Sykes, 1937; Leopold, 1949). Today, the Colorado River delta is still
considered the largest desert estuary in North America, and is comparable in size, ecological, and
economic importance to the Nile, the Tigris-Euphrates, and Indus deltas (Sykes, 1937; Kowalewski et
al., 2000). Historically, the Colorado River delta encompassed 780,000 Ha of land near or below sea
level in the United States and Mexico, including two evaporation basins, the Salton Depression (now
the Salton Sea) and Laguna Salada (Sykes, 1937). After modern human settlements began and
agriculture expanded (for the last 100 years), the Colorado’s wetland area was reduced to less than a
tenth of its former size, to approximately 60, 000 Ha (Luecke et al., 1999; Pitt, 2001).
The Colorado River delta was formed by the deposition of sediments from periodic Colorado
River floods that date back to the Tertiary period (beginning 65 million years ago). Its shape and up-
building were influenced by three main factors: the relatively narrow space available for sub-aerial
sedimentary deposition, the pre-existing topography toward and into which the river flow was
directed, and major tidal forces at the head of the Gulf of California (Sykes, 1937). Tides are the most
11
important forces that influence the shape of the delta, which has been characterized by extensive mud
flats and a diurnal tidal range that reaches 8 to 10 m (Thompson, 1968). Thompson (1968) was one of
the first researchers to report environmental changes in the inter-tidal zone after the shutdown of the
river and the cutoff of the sediment supply. He reported that tidal currents and waves eroded intertidal
mud, resulting in the exhumation of millions of mollusk shells and making the shoreline into residual
beach ridges. Subsequent studies by Kowalesky et al. (2000) concluded that the land area of the
Colorado River delta could be expected to decrease over time, similar to the events occurring in the
Nile delta (Stanley and Warne, 1993).
Early explorers reported jaguars, beavers, deer, and coyotes in addition to the legendary
abundance of waterfowl, fish, and other marine and estuarine organisms (Leopold, 1948; Spamer,
1990). Early explorers also encountered the Cucapá tribe, or the ―People of the River‖, who are
descendents of the Yuman-speaking Native Americans and have inhabited the delta for nearly 1,000
years. The Cucapá used the delta floodplain extensively for harvesting Palmer’s salt grass (a wild
grain), and for cultivating corn, beans, and squash. Other foods included mesquite, wild boar, wild
geese, ducks, doves, quail, and fish (Williams, 1983). Nowadays, the Cucapás have been reduced in
number and have difficulty sustaining their traditional livelihood, which depends upon the river’s flow
(Ward, 2003).
In 1904, when the delta’s channels were still navigable, McDougal provided one of the earliest
inventories of its flora. McDougal described the delta’s vegetation as a gallery forest of cottonwoods
(Populus fremontii) and willow (Salix gooddingii), grading at the southern end into a tidally
influenced plain of salt grass (Distichlis spicata), and other halophytes with widely separated screw
bean (Prosopis pubescens), honey mesquite trees (P. glandulossa), and saltbushes (e.g., Artiplex
lentiformis).
By 1977, Felger’s field trips reported the absence of gallery trees and their subsequent
substitution for salt-tolerant vegetation; a substitution that was due to the replacement of natural flood
flows by brackish irrigation return flows from 1904 to 1977 (Glenn et al., 1996). Additionally, some
nonnative species appeared and extended over the delta, like the shrub salt cedar (Tamarix
ramosissima), noted already by Sykes in 1935 (Sykes, 1937).
Later on, Glenn et al. (1992, 1996) provided the most complete flora inventories of the
contemporary delta, emphasizing wetland impacts of transboundary water management. These authors
argue that 100 years of upstream water diversion has resulted in a reduced flow of water and
sediments, and thus, in a loss of natural wetland habitat, and the conversion of the upper flood-plain
vegetation from gallery forest to lower-growing halophytic plants.

12
Some endangered species present in the delta are the desert pupfish (Cyprinodon macularis), the
Yuma clapper rail (Rallus longirostris yumanensis), and the southwest willow flycatcher (Empidonax
traillii extimus). The estuarine and marine portions support two additional endangered species: the
totoaba (Totoaba macdonaldi), and the vaquita porpoise (Phocoena sinus).
In 2000, Kowaleski et al. combined paleontological and geological data to estimate the past and
current abundance of mollusks, used as a proxy to estimate the benthic productivity of the Colorado
Estuary. This approach allowed researchers to make a comparison of biotic and environmental
conditions before and after major human perturbations. According to their findings, the most
conservative calculation indicated that during the time of natural river flow, an average population
density of 50/m2 bivalve mollusks thrived on the delta. In contrast, in 1999-2000, the population
density of the same benthic mollusks was 3/m2 (94% lower). Researchers concluded that such a
dramatic decrease in mollusks’ populations proves the severe loss of benthic productivity resulting
from diversion of the river flow and the inadequacy of its partial resumption (since 1981 to the
present). A notable increase in the levels of selenium and other harmful pollutants associated with the
agricultural water waste (Glenn et al., 1996) may have also played a negative role.
Nutrient levels and phytoplankton productivity on the delta have been reported as being high
(Hernandez-Ayon et al., 1993), but both were presumably even higher during times of river input
(Kowaleski et al., 2000). According to Kowaleski et al., the recent partial reestablishment of the
Colorado River flow resulted in some revival of riparian habitats, which has been proclaimed a
hopeful sign for a partial restoration of the delta's ecosystems (Luecke et al., 1999); however,
Kowaleski et al., argued that they found strong evidence against a similar revival for the marine part of
the estuary.
2.5 Conservation and Restoration Opportunities in the Delta
Some steps towards conserving and restoring the remnant delta’s ecosystems have been slowly
happening over the last decade. For instance, on June 10 of 1993, Mexico declared the delta and its
surrounding marine areas as the Biosphere Reserve of the Upper Gulf of California and Colorado
River Delta, a United Nations designation to protect world-class ecosystems while encouraging to
continue sustainable economic activities in surrounding buffer areas (Luecke et al., 1999). According
to SEMARNAT (the Environment and Natural Resource Secretariat, Mexico) the Colorado River
delta and Upper Gulf of California acquired a Biosphere Reserve status given that such areas are ―in
need of conservation and restoration‖, and because they are ―inhabited by species that represent

13
national biodiversity, including those that are considered endemic, threaten, or endangered‖. Today,
the Biosphere Reserve includes 934,756 Ha, of which 164,780 Ha (17.6%) are designated a core area,
and 769,976 Ha (82.3%) are designated as a buffer zone (CONANP). The Biosphere Reserve was
designated to protect an estimated 19% of the plant species found in Mexico, 22 of the 37 saltwater
fish species endemic to the Gulf of California, and the desert pupfish, the only surviving native
freshwater fish of the delta (Luecke et al., 1999).
Soon after the Biosphere Reserve was declared, the Colorado River delta wetlands were also
listed as ―wetlands of international importance‖ under the RAMSAR Convention (1996).
Perhaps the biggest contribution to the conservation and restoration of the delta has been the many
years of scientific research in the area, mostly led by universities and NGOs from both sides of the
border. Eventually, those who have participated in that research process collected their experiences in
2000 and delivered a document that identifies the top ―Conservation Priorities‖ for the delta (Zamora-
Arroyo et al., 2005). The following paragraphs present some of the most prominent scientific research
findings and recommendations to conserve and restore the delta, from many of the leading authors.
In 1996, Glenn et al. identified two main threats to the remnant Colorado delta’s wetlands:
water management decisions and flood control projects that do not treat such areas as assets to be
protected. These authors also offered a valuable comparison between the ecological state of the
Colorado River delta and the state of the Nile and Indus river deltas. The authors concluded that
conservation challenges in the Colorado River delta are not nearly as severe as the conservation
problems faced in the other two river basins. For instance, the Colorado delta’s population (below 1.5
million people, INEGI, 2000) is not as large as that of the Nile or the Indus (10-15 million people in
each basin). At the moment, conservation efforts in those two deltas focus on reducing the rate at
which urban and agricultural land will erode within the next 50 years, rather than preserving wetlands
(Stanley and Warne, 1993). The conclusion was that in the Colorado River delta, Mexico and the
United States still have the opportunity to recover and maintain wetlands, but it will require active,
rather than passive efforts (Fredrickson and Reid, 1990), probably by building on the status of the
delta as a Mexican biosphere reserve, and on the environmental provisions of the North America Free
Trade Agreement (NAFTA)(Appleton, 1994).
Glenn et al. (1996) also suggests two specific actions to stabilize the delta wetlands: restoration
of the lower Rio Hardy wetland through implementation of a new earthen dam at the freshwater-
intertidal intersection on the Colorado River channel (Payne et al., 1992), and a commitment by the
U.S. Department of the Interior to continue to provide Wellton-Mohawk drain water for Ciénega de
Santa Clara (Glenn, 1992).

14
The Biosphere Reserve’s office has also identified other influential factors that threaten the
remnant ecosystems, which include invasive species, agricultural run-off, illegal hunting,
archeological artifacts looting, solid waste accumulation, underground water depletion, lack of
superficial water, and abuse and misuse of the superficial water that is currently available. Recently,
the Reserve authorities have also requested that the National Waters Commission (CONAGUA)
concede the ecosystem some water rights on the Colorado waters that Mexico receives from the U.S.,
so that in the future the delta can be legally considered a user of the same river (CONANP, 2005).
In 1999, Luecke et al. reported the latest scientific findings about the delta’s partial recovery
and made recommendations for managing the existing flows to further benefit the delta’s ecosystem.
According to this research team, key areas of the delta can be conserved through deliberate water
management of its current flow, and without adverse effects on other Colorado Basin water users.
Managing agricultural drainage, wastewater, and floodwater into the delta is their main proposal based
in the modest water needs that the delta requires to sustain and rehabilitate its current protected areas
(about 1% of the mean river’s flow; Pitt, 2001). Luecke et al. also argue for a long-term vision where
economical, social, and ecological values of the delta have to be recognized in future deliberations
over the allocation of water surpluses and where in-stream flows may be dedicated to sustain the delta.
Pitt (2001) suggested the creation of a water market for the region in which water can be
dedicated for environmental purposes by means of leasing or buying water rights from the agriculture
sector. Similarly, Arias et al. (2004) suggested that to minimize conflict while enhancing ecological
responsibility, restoration plans should include leasing water rights in Mexico and the U.S. for transfer
to the delta. They also suggested the decoupling of subsidies to decrease water consumption. Carrillo-
Guerrero (2002) concluded that restoration efforts could be embraced and enhanced by the
participation of local communities in Mexico, either by leasing water or land rights.
According to Cohen (2002), dedicating water to the Colorado River delta will require several
steps. These include: developing local capacity and linking economical development in the region to
the health of the environment; developing specific policies that acknowledge the needs of water users
for consistency and reliability in the system; increasing public awareness and appreciation of the delta;
expanding research efforts to refine and document the delta’s water needs; and increasing
communication among stake holders. Cohen also argued that perhaps the greatest challenge to restore
the delta will be to array real and perceived legal and institutional obstacles to dedicate some of the
river flow for environmental use.
Finally, Zamora-Arroyo et al. (2005) concluded four main things: that sufficient scientific
information already exists about the delta’s ecosystems to determine priorities and begin action in
conservation and restoration; that the principal threat to the delta’s ecosystems is the lack of fresh
15
water inputs; that large-scale improvements in the ecosystem health will not be attained until the
governments of the United States and Mexico make significant commitments to conserve and restore
the delta; and that each of the delta’s ecosystems is threatened with loss of resource value. The same
document established the following recommendations: implement immediate bilateral policies to
ensure no further harm to the delta’s ecosystems; use Minute 306 as a platform to launch a
conservation and restoration plan; implement binational collaboration either through treaty
agreements, national policies or market-based mechanisms; seek funding from multilateral parties
such as the Commission for Environmental Cooperation of NAFTA; include consultation to local
communities before deploying any project; and support further research.
It is expected that in the future the demand for water resources and land will increase in the
region, and that global warming will impact water availability. Thus, conservation and restoration
efforts will have to compete with tighter human needs and come up with creative solutions to secure
water for the environmental purposes of the delta.
2.6 Environmental Services and Willingness-to-Pay
Only recently have researchers begun to estimate dollar prices on environmental services, often
with the intention of demonstrating how essential these services are for our economy, and for the very
existence of humans. Despite criticism of assigning dollar prices to environmental services, the aim of
this approach seems to offer a missing perspective on the decision-making puzzle of economic
development. For instance, Costanza et al. (1997) provided one of the first examples of economic
valuation of global ecosystem services. They estimated that the annual average global value of 17
ecosystems services was 1.8 times higher than the 1997 global GNP. Global environmental services
were valued at US $33 trillion/year, versus the value of the 1997 global GNP of US $18 trillion/year.
Two implications from this study were drawn: first, that this type of studies could help modify systems
of national accounting to better reflect the value of ecosystems services and natural capital; and
second, they could aid project appraisal to include ecosystem services lost during cost-benefit
assessments.
Valuation of a non-market service or an endangered species is not an easy task. There is
controversy of why we do it and how reliable and accurate are the current methods to achieve it
(Carson et al., 2001). The contingent valuation method is a popular survey-based methodology that
helps to establish the dollar value of an environmental good or service (Carson, 2000). Willingness-to-
pay surveys are common tools in contingent valuation methods. The idea of measuring people’s

16
willingness-to-pay for an environmental service or good is the foundation of the contingent valuation
method (Whitehead et al., 1997). Willingness-to-pay is based on the theory of economic value through
which our society assumes that environmental goods and services are anthropogenic and thus
subjected to be paid for.
Willingness-to-pay is one of two standard procedures to measure economic value. It is an
appropriate measure to use when an agent wants to acquire a good or a service. The other standard
measure of economic value is willingness-to-accept and is an appropriate measure when a person with
legal entitlement to a good is asked to give it up through compensation. Because we do not have legal
entitlements to environmental services or goods, the appropriate measure to use here is willingness-to-
pay (Carson, 2000). For this study, willingness-to-pay was appropriate because the remaining
wetlands of the delta are a public good providing many environmental services, and because their
restoration depends on a solid economic justification of the profitability of federal investments to
purchase water for the river itself (Sanjurjo and Carrillo, 2006b). Proving that people are willing to
pay to have water back in the river and that they will benefit from it could strengthen a restoration
strategy for the Delta.
Typically, a willingness-to-pay survey constructs scenarios that offer possible future
government actions. Survey participants are asked to state their monetary preference concerning those
actions. During the survey participants are also informed of the context of those actions and their
repercussion before they state their preference; the idea is that participants make an informed choice
and reflect their realistic willingness-to-pay. For this study, I adopted a hypothetical water flow
restoration scenario and then asked people to state what prices they preferred to pay for restoration.
The final part of a contingent valuation is to analyze participants’ choices in a similar manner as the
choices made by consumers in a real market. A variety of econometric models exist to determine what
is the maximum, minimum, and the average that people is willing-to-pay for an environmental good or
service. Most models are based on linear regressions. However, to match my experience level and
accomplish the purposes of this study, I decided to take a non-parametric approach to assessing
people’s willingness-to-pay. I used willingness-to-pay at a descriptive level to define people’s
attitudes and motivation towards restoration efforts in the Colorado River delta. I assumed that linking
resource use and willingness-to-pay can provide a good platform to examine motivation to support
restoration in the delta.
Standard features of a willingness-to-pay survey are: (1) an introductory section that gives
background information about the decision to be made; (2) a description of the good under valuation;
(3) an instrument to capture the participant’s monetary contribution; (4) an explanation of how he or
she will pay; (5) the debriefing questions of why participants responded un they way they did; (6) a

17
survey method to elicit respondent preferences; (7) the collection of supporting socioeconomic data
form each participant. In this study, both surveys had all the above elements recommended by Carson
et al., 2001. In addition, the Mexicali survey considered double-dichotomous choices to comply with
the previous SLRC survey design but also to provide an interval of choices for participants.
2.7 Willingness-to-pay in a Latin American context
Willingness-to-pay surveys are common tools in contingent valuation methods. Contingent
valuation is a relatively new approach that has developed over the last 40 years, mostly used by
Federal agencies and international organizations with environmental responsibilities (Carson, 2000).
Contingent valuation is growing in importance. By 2000, some 200 academic papers in many fields of
study, in many places around the world, had been published (Carson, 2000). A quick search on the
Environmental Valuation Reference Inventory (EVRI) yielded 1194 studies around the world, for the
term ―willingness-to-pay‖. EVRI is a large online database assembled for policy making purposes by
Environment Canada, the European Union, the Environmental Protection Agencies of the U.S, Mexico
and Chile, the World Bank, and the Economy and Environmental Program for South Asia. For Latin
America contingent valuation is even newer; a search on EVRI yielded only 21 studies, the earliest
ones from 1994 on air quality and forest value, in Chile and Mexico respectively. Other Latin
American countries with this type of study include Costa Rica (4), Brazil (4), Ecuador (1), Dominican
Republic (1), Uruguay (1), Haiti (1), Colombia (1), Peru (1), and Bolivia (1). Currently, EVRI has on
record five contingent valuation studies in Mexico on air quality, water supply, biodiversity, and
forestry. The 2005 SLRC study on which I have focused my research is not part of the EVRI database.
2.8 Importance of valuating the environment
The economic valuation of environmental services has evolved on at least three main lines of
estimation: total value, passive use value, and natural resource damage (Costanza et al., 1997; Carson
et al., 2001; Carson et al., 2003). The Biodiversity in Development Project (2001) defined total value
as the sum of use values (direct use of products and services), and passive use values. When an agent
does not need to make use of a good to receive benefit from it (e.g., an agent benefits from the
existence of glaciers in the Antarctic, even if he or she never interacts with them), that use is passive,
(Carson et al., 2001). Natural resource damage is a popular application of contingent valuation and
large studies such as the one on the 1989 EXXON Valdez oil spill in Alaska illustrate one of the best

18
examples available today (Carson et al., 20003). During a later valuation of environmental damages,
Carson et al. (2003) found that the 3 billion dollars (1990) paid by EXXON on oil spill response,
restoration, and compensation to the state of Alaska, actually matched the lower bound estimation of
2.8 billion dollars, originally estimated with a national contingent valuation. From this experience,
these authors argue that requesting restoration or compensation for damaged natural resources requires
knowledge of the monetary value the public places on a resource, and therefore the utility of the
contingent valuation approach.
Sanjurjo and Carrillo (2006a) gave a first estimate of the present passive use value of a constant
river flow in the Colorado River Delta. The present passive use value of a constant water flow in the
Delta was estimated at $38 million pesos/year (or US$3.45 million/year; at an exchange rate of 1:11
dollars to pesos, in 2006)(Carrillo and Sanjurjo, 2006a). The estimation is qualified as conservative
and it only expressed the opinion of SLRC and a few other river communities. According to the
authors, estimating the passive value that larger neighboring cities such as Mexicali, Yuma, or San
Diego place on a constant river flow should notably increase their initial estimate. Both authors have
also clarified their aim to emphasize the importance of revealing contemporary passive use value of
remnant environmental services in the Delta, rather than to open the debate on transboundary
environmental justice. This thesis supports the same point of view and strives to make contributions in
the same direction.
2.9 Socio-psychological models and willingness-to-pay
Socio-psychological models are tools to dissect the interactions of people’s decisions and
opinions and public policy strategies. These types of models look at people’s systems of beliefs,
attitudes, motivations, and behaviors (Brunson and Shindler, 2004). Although developing this type of
models can vary depending on the object and group of people under study, there are common elements
to all of them. For instance, all attitudes are the result of cognitive beliefs, emotional responses and
value orientations towards an object in people’s lives (Bright et al., 2002; Brunson and Shindler,
2004). Relevant theories that are commonly used during social psychology studies of natural resource
management and valuation are the theory of planed behavior (Pouta and Rekola, 2001) and the theory
of reasoned action (Fishbein and Ajzen, 1971). Pouta and Rekola (2001) argue that using the theory of
planed behavior is appropriate in natural resource valuation, given that those types of resources
involve non-market benefits. The theory of planed behavior uses willingness-to-pay as a behavioral
intention where participants state their support or oppositions to protect a resource at their own cost.

19
The theory of planed behavior basically explains how behavior relates to intended behavior and how
this relates to attitudes and norms. Three types of attitudes have been already related to willingness-to-
pay studies, those are: attitudes towards the public good, attitudes towards policies dealing with the
public good, and attitudes towards paying for the public good (Pouta and Rekola, 2001). In this study I
mostly dealt with the attitudes towards paying for a public good although not exactly following any of
the above theories and mostly relaying on my own intuition.
2.10 Conceptual Framework of the Study
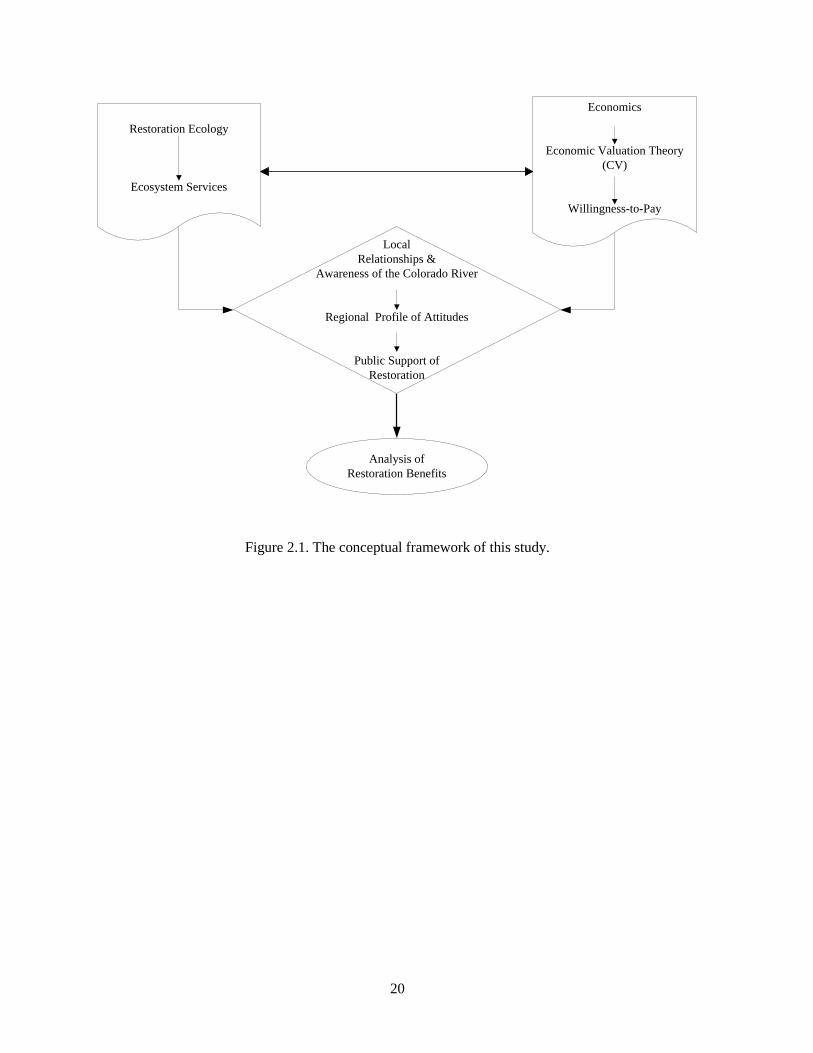
Figure 2.1 outlines the disciplines and methods underpinning this study. The two leading
disciplines of this study are restoration ecology and economics. Those disciplines converge into a
strategy to study the economic costs and benefits of restoration through an analysis of people’s
willingness-to-pay (attitudes). The expected contribution of this work is to record and yield more
information on potential regional benefits and barriers related to restoration efforts. The methods used
in the analysis of this study were fieldwork and the analysis of secondary sources. Fieldwork focused
on surveying Mexicali’s households, and on gathering direct observations during a three-month stay in
key locations of the study area. Other tools to collect complementary data were the 2005 SLRC
survey results, academic reports, and government records. The study had exploratory, descriptive, and
explanatory purposes.
20
Restoration Ecology
Ecosystem Services
Economics
Economic Valuation Theory
(CV)
Willingness-to-Pay
Local
Relationships &
Awareness of the Colorado River
Regional Profile of Attitudes
Public Support of
Restoration
Analysis of
Restoration Benefits
Figure 2.1. The conceptual framework of this study.

21
3 METHODOLOGY
3.1 Introduction
This thesis uses a case study research strategy and most of its findings were achieved through
non-parametric statistic analysis of data. According to Yin (2003), a case study approach is used when
there is a need to understand complex social phenomena in a contemporary domain. The case study is
used in many situations to contribute towards knowledge of individual, group, organizational, social,
political, economic, and related phenomena (Yin, 2003). According to Cohen (2002), the Colorado
River delta provides a valuable case study for several reasons. On the one hand, the Colorado River
delta offers a unique example of transboundary ecological degradation, as a direct consequence of
extensive physical infrastructure and a complex legal framework. On the other hand, it also represents
a valuable transboundary restoration opportunity due to the proven resilience of this ecosystem.
The contingent valuation method is a survey-based economic method that focuses on asking people
how much they are willing to pay for an environmental good or service. This method yields a number
that represents how much that environmental good or service is valued by a specific group of people
(community). In this study I used the core ideas and procedures of contingent valuation to investigate
what determines people’s attitudes to support a water flow restoration for the Colorado River delta.
3.2 Area of Study
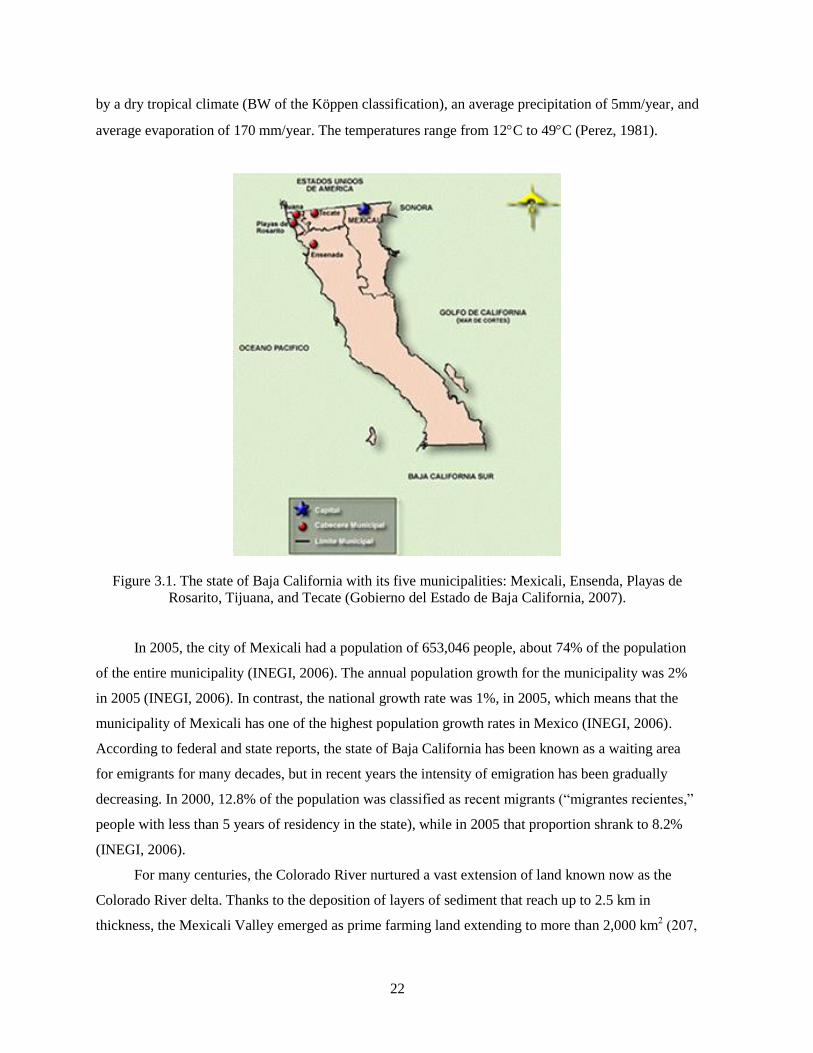
First, it is worth distinguishing between the municipality of Mexicali, the city of Mexicali, and
the Mexicali Valley. Basically, the last two are contained within the larger geographic and politic unit
of the municipality. As a municipality, Mexicali is one of five municipalities in the state of Baja
California, and it is also the state’s capital (Figure 3.1). When talking about the municipality, I will
refer to it as ―the municipality of Mexicali,‖ and it will include the city of Mexicali. However, for this
study the survey efforts focused only on the city area to which I will refer as the ―city of Mexicali‖ or
―Mexicali.‖ Finally, when talking about the rural area and crop production land, I will refer to it as the
―Mexicali Valley‖ (Figure 1.1).
The city of Mexicali is bordered by California to the north, the Colorado River and Sonora to
the east, the Mexicali Valley to the south, and the municipality of Tecate to the west (Figure 3.1).
Mexicali is a border city located within 64 km of the Colorado River, at an elevation of 3-10 m, and
with a municipal territory of 13,700 km2. This city lies within the Sonoran Desert biome characterized
22
by a dry tropical climate (BW of the Köppen classification), an average precipitation of 5mm/year, and
average evaporation of 170 mm/year. The temperatures range from 12C to 49C (Perez, 1981).
Figure 3.1. The state of Baja California with its five municipalities: Mexicali, Ensenda, Playas de
Rosarito, Tijuana, and Tecate (Gobierno del Estado de Baja California, 2007).
In 2005, the city of Mexicali had a population of 653,046 people, about 74% of the population
of the entire municipality (INEGI, 2006). The annual population growth for the municipality was 2%
in 2005 (INEGI, 2006). In contrast, the national growth rate was 1%, in 2005, which means that the
municipality of Mexicali has one of the highest population growth rates in Mexico (INEGI, 2006).
According to federal and state reports, the state of Baja California has been known as a waiting area
for emigrants for many decades, but in recent years the intensity of emigration has been gradually
decreasing. In 2000, 12.8% of the population was classified as recent migrants (―migrantes recientes,‖
people with less than 5 years of residency in the state), while in 2005 that proportion shrank to 8.2%
(INEGI, 2006).
For many centuries, the Colorado River nurtured a vast extension of land known now as the
Colorado River delta. Thanks to the deposition of layers of sediment that reach up to 2.5 km in
thickness, the Mexicali Valley emerged as prime farming land extending to more than 2,000 km2 (207,

23
000 Ha) of irrigated land (Sykes, 1937; Cohen and Henges-Jeck, 2001). The Mexicali Valley is the
agricultural heart of the state of Baja California and it is still responsible for some of the largest crop
productions in Mexico (Sanchez-Lopez, 2000). Historically, this valley focused its production on
cotton and became the leading national cotton exporter in the 1950s and 1960s (Gobierno del Estado
de Baja California, 2007). Since the 1960s, the valley has diversified its production and now exports
wheat, asparagus, broccoli, green onions, and radishes. Overall, crop production for internal and
external markets includes about 40 commercial varieties between cereals, oilseeds, fodder, vegetables,
flowers, and fruit trees (Sanchez-Lopez, 2000). In general, the valley’s production is subjected to two
productive cycles: spring-summer, and fall-winter. During the first cycle, cotton is the most important
crop due to its value, while during the second cycle wheat is the most important crop (Gobierno del
Estado de Baja California, 2007).
Gradually, Mexicali has been experiencing more economic changes thanks to the decree of a
tax-free zone for imports and to the North American Free Trade Agreement (Mexicali Tourism Board,
2006). Mexicali’s economy is now reoriented towards industrial activities, services, commerce, and
tourism. Industrial activities for instance, are now dominated by assembly and manufacturing plants
(―maquiladoras‖) that focus their production on electronics, textiles, cars, and trucks (Secretaria de
Desarrollo Economico, Gobierno del Estado de Baja California, 2007). There are 24 large industrial
zones within the municipality of Mexicali. In a national context, the state of Baja California has also
one of the highest living standards in Mexico reflected by high investments in education and low
unemployment rates. In 2006, Baja California’s unemployment rate was 1.8% while the national rate
was 4% in 2007. Both the state and municipal governments recognize that the economic life of this
region is directly linked to water availability from the Colorado River.
Carrillo-Guerrero (2002) argued that community participation from private landowners could
contribute to further conserve and restore the Colorado River delta. In her thesis work, Carrillo-
Guerrero interviewed residents along the Colorado’s riparian corridor (within the Mexicali Valley) and
assessed their willingness-to-lease land and water rights under hypothetical conservation and
restoration scenarios. Carrillo-Guerrero’s work unveiled local interest, support, and commitment
towards restoration efforts, which included retiring marginal cropland and leasing water rights. This
author argued that gaining community participation is another crucial factor to overcome regional
historic trends in wetland conservation. Therefore, gaining more knowledge about other rural
communities or large urban centers associated with the delta will contribute towards a more integrated
and inclusive restoration and conservation plan. As the state’s capital and largest city in the Colorado
River delta, Mexicali is an important site to study people’s attitudes to support the ecological
restoration of the delta.

24
Additionally, San Luis Rio Colorado, Sonora, was a secondary area of study that allowed me to
make comparisons between a large city (Mexicali) and a small city (SLRC). Both cities are associated
with the Colorado River but while SLRC has been characterized as a true river city, Mexicali is at
least 64 km away from the river’s influence. This variation in ―distance to the river‖ was expected to
influence people’s environmental awareness and attitudes towards hypothetical water flow restoration
efforts. SLRC is also a border city (Figure 1.1). In 2005, INE investigated people’s willingness-to-pay
in SLRC and found that people is willing-to-pay a maximum of 52 pesos/person/visit to a restored a
Colorado River Delta area. During my study, I took the results of the SLRC study and made a non-
parametric comparison of two things: levels of people’s willingness-to-pay, and their motivation to
support restoration efforts.
3.2.1 SLRC survey
This study used a previous willingness-to-pay survey from SLRC, Sonora, done by INE in 2005
(Carrillo-Guerrero, 2005). The sample size of this survey was n= 306, the error was 5%, and had a
significance level of 90%. The rate of ―no response‖ was not reported in that study. The SLRC survey
had a total of 19 questions and all of them were also used in the Mexicali survey allowing me to
follow the same survey design. Data collection followed a simple random sampling approach. The size
of this city (145,006 people according to census of INEGI, 2000) allowed researchers to include all
neighborhoods with a quota of 20 surveys from each of the 15 neighborhoods that compose this small
city. Each neighborhood was delimited in a map and then systematically sampled starting from the
most northwestern corner and then skipping four houses to collect the next survey.
3.3 Research Methods
3.3.1 Mexicali Survey
A survey was implemented during October of 2006 and targeted the heads of households in
Mexicali. A total of 564 households were surveyed in three weeks. The unit of analysis, the household
head, was considered as any adult (18 years or older) representing a family, specifically those making
budget decisions or administering the resources of a home such as a mother or a father. On average,
each survey took 15-25 minutes and was given in Spanish. To execute the survey, the researcher hired

25
the services of a market-research agency named FOCUS, a company with ample experience and
headquarters in Mexicali. FOCUS provided five interviewers, one field supervisor, AGEB maps, and
transportation. The researcher participated as a trainer, coordinator, and interviewer. All surveys were
done face-to-face and captured on paper (Appendix A).
The survey design complied with standard contingent valuation methods building one realistic
scenario with 4 price variations in the initial offer, randomly assigned to participants (Survey Type1 to
4, Appendix A). Each participant was asked to state his or her preference of price twice (double
bounded dichotomous questions). With a binary survey design I investigated preferences at three
levels: a baseline price or Offer1 that all participants received (20, 40, 60, 80 pesos); a higher price or
Offer2 (30, 50, 70, 90 pesos); and a lower price or Offer3 (10, 30, 50, 70 pesos). Each participant was
given an initial offer (Offer1), then, according to their Yes/No answer a second choice (Offer2 or
Offer3). Offer2 comprised higher prices and was given only to those who already agreed to pay
Offer1. Offer3, on the other hand, comprised lower prices and was given only to those who refused to
pay Offer1.In other words, Offer2 tested participants’ limits to pay above the initial offer, while Offer3
lowered the price seeking to shift negative responses into positive at a lower price.
3.3.1.1 Sample Size
The sample size was obtained primarily by reconstructing the standard deviation and the mean
for the monthly income per household in Mexicali. To reconstruct that data I used the state of Baja
California’s census of population and housing CONTAR 2000, from INEGI. Precautions were taken
to minimize the sampling error of the statistical estimators in accordance to our time and budget
constrains. Under those considerations, the sampling size was finally established at n=561 households,
with a margin of error (e) of 6.5%, and a confidence level of 95% (z). The final sample was rounded to
n=564 households.
The sample was representative of the population because it was based on calculations of central
income estimators (average and variance) of the population under study, which was later corroborated
with state reports. The last available state report from 2003 locates Baja California’s GDP at US 9,571
per person/year (Secretaria de Desarrollo Social del Estado de Baja California, 2007). This state report
confirms and validates the income estimations made in this study (9,554 pesos/month of average
income; 7522 deviation standard). The Statistical Consulting Service of the Statistics and Actuarial
Science Department, at the University of Waterloo, provided support throughout the design and
analysis of this study.

26
3.3.1.2 Sampling Procedure
In order to select 564 households from the city of Mexicali (Figure 3.2), I used a combination of
random and systematic sampling design. First of all, I used random sampling at an AGEB (Basic
Geostatistic Area) level and then systematic sampling of households within each AGEB. An
immediate sampling need was to build the geographic limits of the sampling area. For that I adopted
the AGEB as an intermediary area unit for this survey, aware that drawing a random sample from a
city with 133,345 households would have been unviable with my resources. AGEB units are widely
recognized and used for demographic and economic research by INEGI. In Mexico, one AGEB groups
city blocks in sets of 50, approximately; the final area will always vary from one AGEB to the other
(Figure 3.3). Based on the total number of AGEBs reported in the city of Mexicali (208), I discarded
any remote AGEB (eight satellite urban areas), and those AGEBs that reported under100 households
(three) during the 2000 population census (SCINCE por Colonias de Baja California, XII Censo
General de Poblacion y Vivienda 2000, INEGI).
Once the survey area was delimited, a total of 47 AGEBS and 18 replacements were drawn
using the random number function of Excel. An example of an AGEB’s map is provided in Figure 3.3.
I used similar maps for each AGEB visited during the survey. Subsequently, a quota of 12
surveys/AGEB was established based on two things: resources availability and direct
recommendations from two marketing research agencies that usually implement 10 to 30
surveys/AGEB when surveying Mexican cities by AGEB.
Though this study tried to gather information from all socioeconomic levels, the highest
socioeconomic levels of Mexicali were not reached. Access to households with the highest income
levels of the city was not possible due to barriers to reach such strata (e.g. vigilance and security in
rich neighborhoods). The original random sampling of AGEBs did include two rich neighborhoods but
obtained zero response and thus I substituted them with a similar AGEB of a lower income. I believe
that the data collected during this study is still representative given that the majority of the populations
is medium/low class and thus very well represented in this work.

27
Figure 3.2. The city of Mexicali including its 208 AGEBs (Gobierno del Estado de Baja California, 2007).
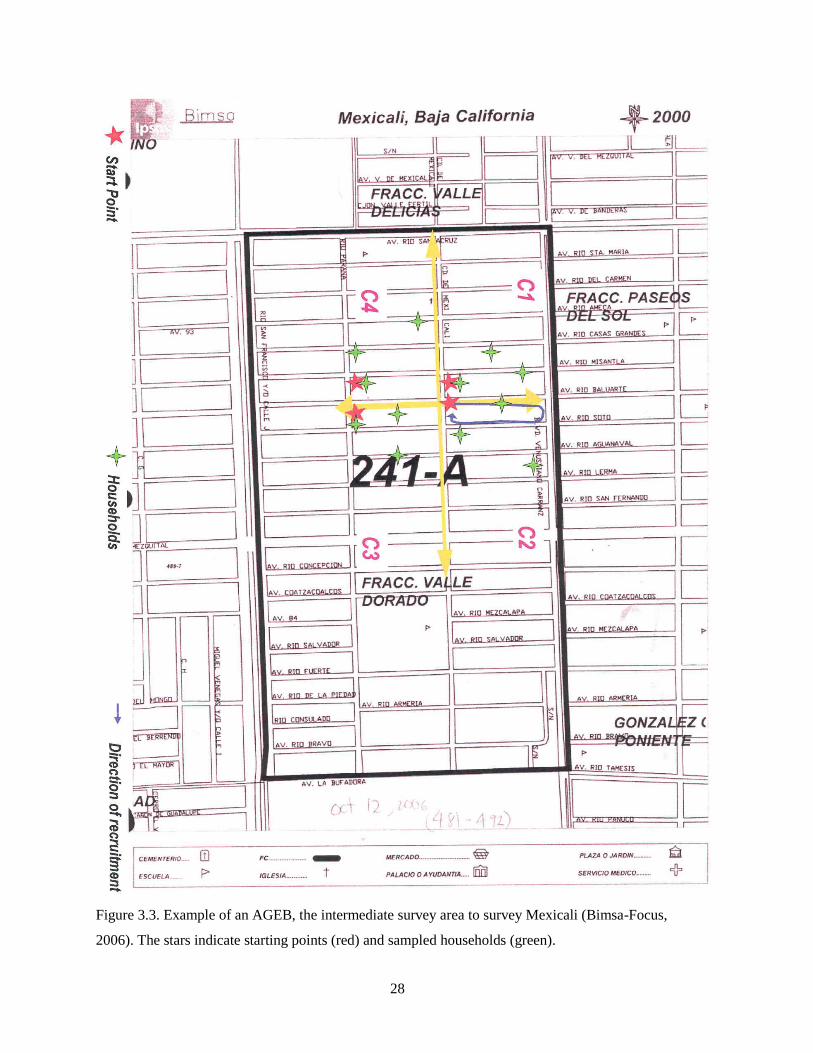
28
Figure 3.3. Example of an AGEB, the intermediate survey area to survey Mexicali (Bimsa-Focus,
2006). The stars indicate starting points (red) and sampled households (green).
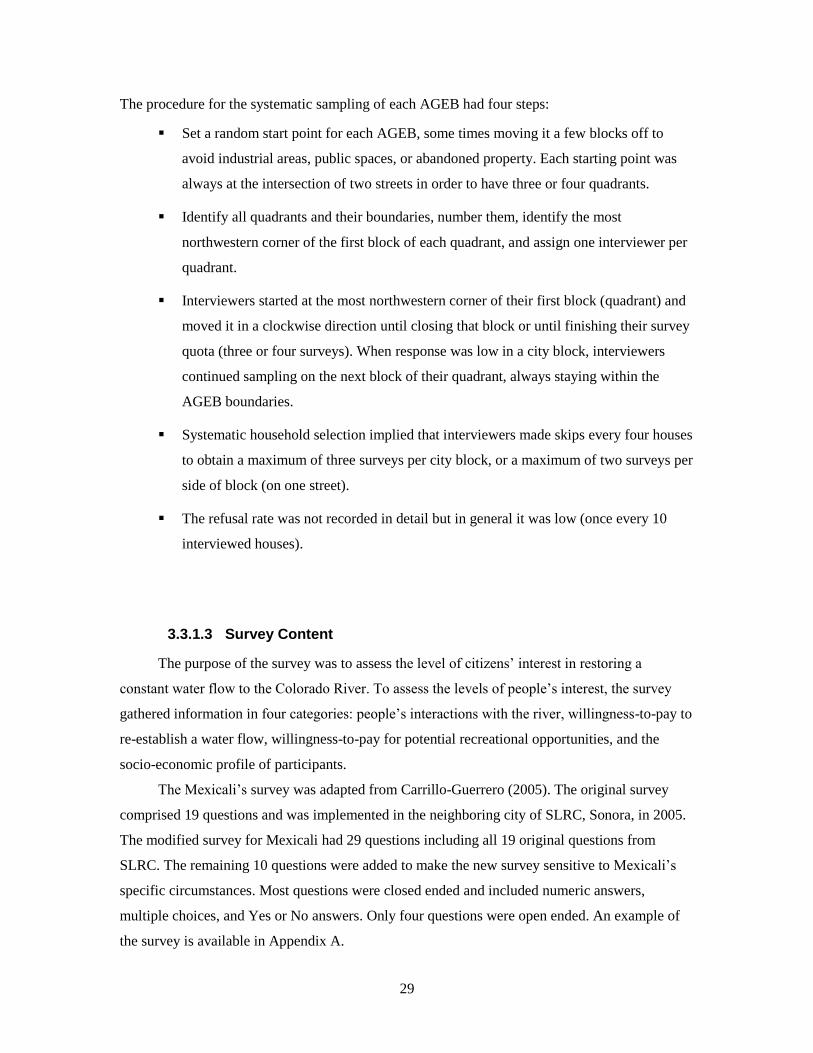
29
The procedure for the systematic sampling of each AGEB had four steps:
Set a random start point for each AGEB, some times moving it a few blocks off to
avoid industrial areas, public spaces, or abandoned property. Each starting point was
always at the intersection of two streets in order to have three or four quadrants.
Identify all quadrants and their boundaries, number them, identify the most
northwestern corner of the first block of each quadrant, and assign one interviewer per
quadrant.
Interviewers started at the most northwestern corner of their first block (quadrant) and
moved it in a clockwise direction until closing that block or until finishing their survey
quota (three or four surveys). When response was low in a city block, interviewers
continued sampling on the next block of their quadrant, always staying within the
AGEB boundaries.
Systematic household selection implied that interviewers made skips every four houses
to obtain a maximum of three surveys per city block, or a maximum of two surveys per
side of block (on one street).
The refusal rate was not recorded in detail but in general it was low (once every 10
interviewed houses).
3.3.1.3 Survey Content
The purpose of the survey was to assess the level of citizens’ interest in restoring a
constant water flow to the Colorado River. To assess the levels of people’s interest, the survey
gathered information in four categories: people’s interactions with the river, willingness-to-pay to
re-establish a water flow, willingness-to-pay for potential recreational opportunities, and the
socio-economic profile of participants.
The Mexicali’s survey was adapted from Carrillo-Guerrero (2005). The original survey
comprised 19 questions and was implemented in the neighboring city of SLRC, Sonora, in 2005.
The modified survey for Mexicali had 29 questions including all 19 original questions from
SLRC. The remaining 10 questions were added to make the new survey sensitive to Mexicali’s
specific circumstances. Most questions were closed ended and included numeric answers,
multiple choices, and Yes or No answers. Only four questions were open ended. An example of
the survey is available in Appendix A.

30
To comply with the original survey design, Mexicali’s study also used four survey
variations (Survey Type1 to 4). On a typical willingness-to-pay survey, prices are set in a way the
participant can be tested for a range of prices, usually through binary choices (Carson, 2000).
Four initial prices conformed Offer1 in question 17. Questions 18 and 19 presented Offer2
and Offer3, respectively. All other questions were kept the same for all surveys. In survey Type1,
participants were asked to choose from monetary values of 20 and 30 or 10 pesos. Survey Type2
participants have to state their preference at 40 and 50 or 30 pesos. Survey Type3 offered choices
of 60 and 70 or 50 pesos. Survey Type4 offered choices of 80 and 90 or 70 pesos. The price range
of 10 to 90 pesos was set by INE, according to the regional minimum daily wage of $48.67 pesos
(INEGI, 2005). This spectrum of prices allowed participants to have choices, selecting a realistic
monthly monetary contribution to restore water to the river. Appendix A contains the four
surveys with their respective field materials (map and pictures). Each household was randomly
assigned one survey type. The number of surveys was approximately uniform across the types.
The final tally included 142 surveys of Type1, 141 surveys of Type2, 140 surveys of Type3, and
141 surveys of Type4, for 564 surveys in all.
3.3.2 Secondary Data
Secondary sources and a detailed literature review provided the conceptual framework and
context for this study. The literature review covered two main categories: an overview of historic
environmental issues and conservation and restoration opportunities in the Colorado River Delta;
and an overview of economic valuation and willingness-to-pay methods. These subjects were
looked at to demonstrate the link between people’s attitudes towards restoration efforts and the
economic benefits from ecosystem restoration.
Secondary data such as federal and state publications aided this study from three different
angles: building the study’s framework, determining a sample size, and to providing a basis for
qualitative comparisons during the results’ analysis. Some of the most useful secondary sources
were the demographic and economic reports from INEGI. Other useful materials were academic
and internal reports with the latest recommendations on how to approach conservation and
restoration challenges in the delta.
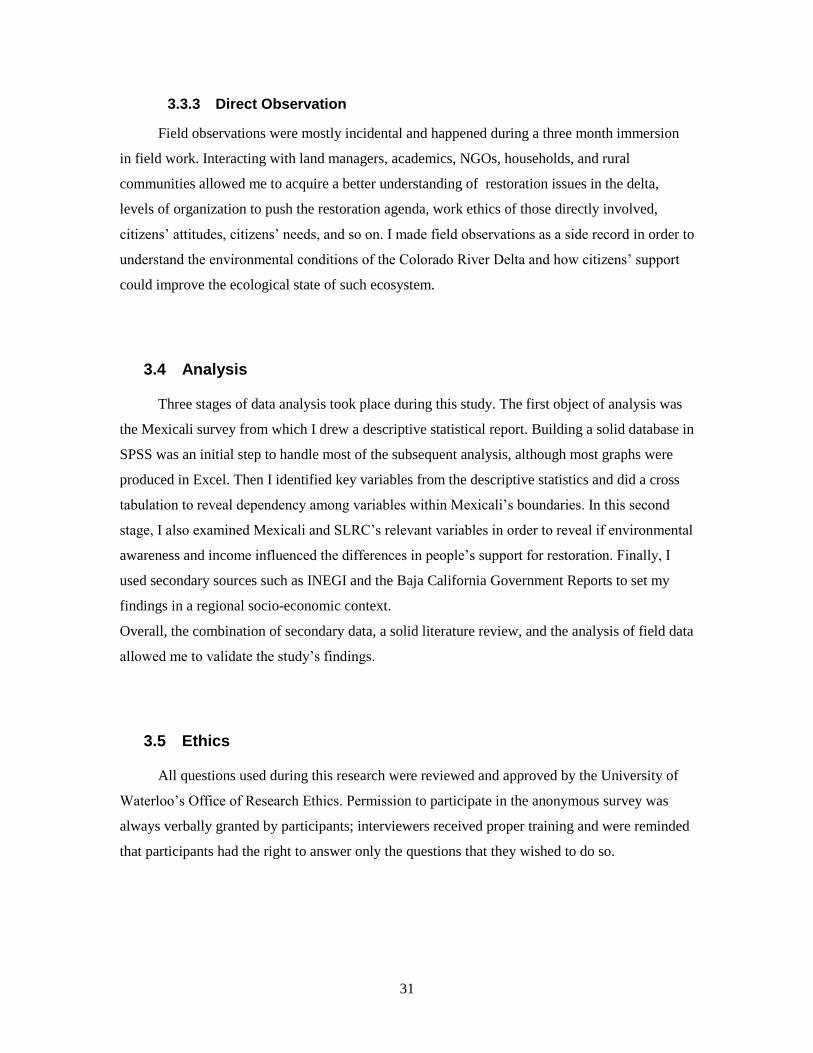
31
3.3.3 Direct Observation
Field observations were mostly incidental and happened during a three month immersion
in field work. Interacting with land managers, academics, NGOs, households, and rural
communities allowed me to acquire a better understanding of restoration issues in the delta,
levels of organization to push the restoration agenda, work ethics of those directly involved,
citizens’ attitudes, citizens’ needs, and so on. I made field observations as a side record in order to
understand the environmental conditions of the Colorado River Delta and how citizens’ support
could improve the ecological state of such ecosystem.
3.4 Analysis
Three stages of data analysis took place during this study. The first object of analysis was
the Mexicali survey from which I drew a descriptive statistical report. Building a solid database in
SPSS was an initial step to handle most of the subsequent analysis, although most graphs were
produced in Excel. Then I identified key variables from the descriptive statistics and did a cross
tabulation to reveal dependency among variables within Mexicali’s boundaries. In this second
stage, I also examined Mexicali and SLRC’s relevant variables in order to reveal if environmental
awareness and income influenced the differences in people’s support for restoration. Finally, I
used secondary sources such as INEGI and the Baja California Government Reports to set my
findings in a regional socio-economic context.
Overall, the combination of secondary data, a solid literature review, and the analysis of field data
allowed me to validate the study’s findings.
3.5 Ethics
All questions used during this research were reviewed and approved by the University of
Waterloo’s Office of Research Ethics. Permission to participate in the anonymous survey was
always verbally granted by participants; interviewers received proper training and were reminded
that participants had the right to answer only the questions that they wished to do so.

32
4 RESULTS
The results are presented in three parts: descriptive statistics of Mexicali survey, cross-
tabulation analysis of Mexicali variables, and Mexicali-SLRC analysis. The answer to the first
research question relies on the findings of Section 4.1 and 4.2, while the answer to the second
question is in Section 4.3. Regional and national socioeconomic information is provided with the
Mexicali survey results to give the reader a context to interpret results.
4.1 Descriptive statistics of Mexicali survey
4.1.1 Participants’ socioeconomic profile
The sample consisted of 40% (222) males and 60% (332) female participants. The
participants’ age averaged 43.6 years, while the median was 42 years (recall that the survey
targeted people of 18 years or older). The number of years of residency in Mexicali or its vicinity
averaged 31 years. The box plots of Figure 4.1 present a visual summary of age and years of
residency. The summary includes the median, minimum, maximum, lower quartile (q1), and
upper quartile (q3) for each variable.
18
42
31
87
70
33
19
0.25
54
42
0
10
20
30
40
50
60
70
80
90
Age Years in Mexicali
#
Years
Q1
Min.
Median
Max.
Q3
Figure 4.1. Five-number summary of participants’ age and years of residency in Mexicali.

33
The number of years of residency in Mexicali, in general was high. The histogram of
Figure 4.2 shows a higher concentration of answers in the 20-50 years range (65%), than in the
0.25-19 years range (25%), or the 51-70 years range (10%). Only 6% of the participants were
recent immigrants to the state with 5 or less years of residency in the area. These findings match
trends of diminishing migration to the region (INEGI, 2000 and 2006 census). In 2000, INEGI
reported that 12.8% of the state’s population was considered recent immigrants, by 2005 the
percentage of recent immigrants diminished to 8.2%. Our findings yielded 6% of recent
immigrants (in 2006), which in general correspond to the regional tendency of diminishing
migration.
0
10
20
30
40
50
60
70
80
90
0 5 10 15 20 25 30 35 40 45 50 55 60 65 70 or
more
Years of residency (n=564;min=0.25; max=70)
Fre
qu
en
cy
Figure 4.2. Histogram of participants’ number of years living in Mexicali.
Nearly 46% of participants were born in Baja California (261), and more specifically in the
municipality of Mexicali (45%). In this study I confirmed that neighboring states such as Sinaloa,
Sonora, Jalisco, Michoacan, and Nayarit were the main sources of emigrants into Mexicali (35%).
The rest come from other states (19%). Over time, state and federal demographic reports have
discussed the migratory nature of Mexican border cities like Mexicali and Tijuana. In Baja
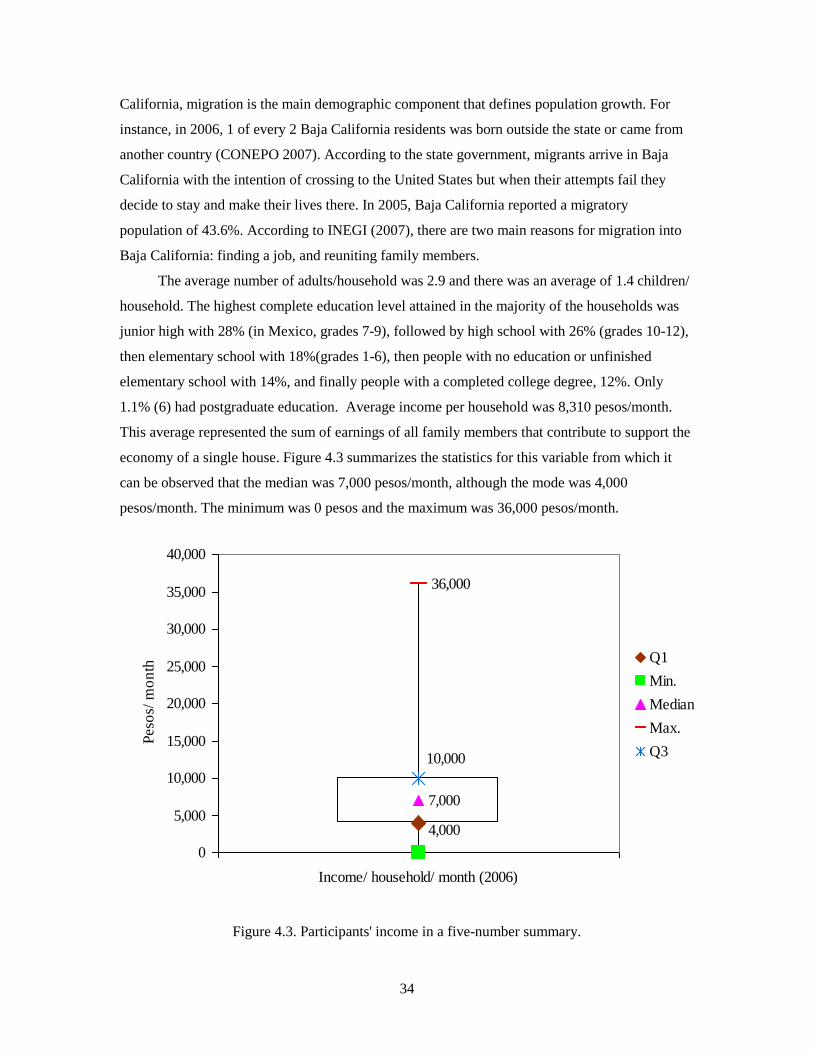
34
California, migration is the main demographic component that defines population growth. For
instance, in 2006, 1 of every 2 Baja California residents was born outside the state or came from
another country (CONEPO 2007). According to the state government, migrants arrive in Baja
California with the intention of crossing to the United States but when their attempts fail they
decide to stay and make their lives there. In 2005, Baja California reported a migratory
population of 43.6%. According to INEGI (2007), there are two main reasons for migration into
Baja California: finding a job, and reuniting family members.
The average number of adults/household was 2.9 and there was an average of 1.4 children/
household. The highest complete education level attained in the majority of the households was
junior high with 28% (in Mexico, grades 7-9), followed by high school with 26% (grades 10-12),
then elementary school with 18%(grades 1-6), then people with no education or unfinished
elementary school with 14%, and finally people with a completed college degree, 12%. Only
1.1% (6) had postgraduate education. Average income per household was 8,310 pesos/month.
This average represented the sum of earnings of all family members that contribute to support the
economy of a single house. Figure 4.3 summarizes the statistics for this variable from which it
can be observed that the median was 7,000 pesos/month, although the mode was 4,000
pesos/month. The minimum was 0 pesos and the maximum was 36,000 pesos/month.
4,000
7,000
36,000
10,000
0
5,000
10,000
15,000
20,000
25,000
30,000
35,000
40,000
Income/ household/ month (2006)
Peso
s/ m
on
th
Q1
Min.
Median
Max.
Q3
Figure 4.3. Participants' income in a five-number summary.

35
4.1.2 Visitor-river interactions
To determine different levels of visitor-river interactions I used several questions that
differentiated levels of interactions. First, I asked whether participants ever saw or visited the
Colorado or Hardy Rivers (Q2). Affirmative answers accounted for 74.3% (419) and negative
answers for 25.7% (145). Participants with negative answers were excluded from other visitor-
river interaction questions, and directed to another question to determine their indirect exposure
to the river (Q8).
The next question (Q3) asked 416 participants (3 missing responses) to verify what
sections of the river they have seen or visited with the aid of a map (Appendix A). About 84%
(351) easily differentiated between the two rivers on the map. On the other hand, 16% (65) got
confused between the two rivers, thus reflecting that perhaps these people has been visiting the
Hardy instead of the Colorado River. Those participants who got confused were directed to
Question 8.
People who correctly identified the Colorado River as the area they had previously seen or
visited were classified into five categories of interactions (Q4). Out of 351 people, 62% (216)
declared to have ―only seen‖ the river but ―never visited‖. The rest of them, 38% (131
participants), have indeed ―visited‖ the river to varying degrees: 30% had visited ―a little‖, and
8% had visited the river ―a lot‖. The number of annual-river visits with specific recreational
purposes of the 131 people who have visited the Colorado River averaged 0.9
visits/participant/year.
Figure 4.4 displays what sort of activities people preferred during their visits to the
Colorado River (Q7). All activities were day trips and not overnight stays, except for a single case
that reported camping. The most popular activity was to visit the river for a family ―picnic‖ (―días
de campo con la familia‖), which represented 36% of the preferred activities. Fishing, day hikes,
and swimming were the next preferred activities during river visits accounting for 17.4%, 16.5%
and 15.3%, respectively. Other activities that were less frequently chosen included dirt road
biking and wood gathering.
36
3.4%
4.7%
6.8%
15.3%
16.5%
17.4%
36%Picnic
Fishing
Day hikes
Swimming
Dirt rode biking
Wood gathering
Other
Figure 4.4. Preferred activities associated to river visits in the Colorado River (n=131).
Another strategy to measure how often people from Mexicali interact with the Colorado
River was to look at how often they drive over the SLRC Bridge, a bridge connecting the states of
Baja California and Sonora via the main regional highway. That specific site was selected
because the tollbooths are located a few meters away from the river’s course and all vehicles have
to use the bridge, even when the river is now dry most of the year. These questions (Q8-Q9)
included all participants (564), including those who say they ―never visit/see the river,‖ as it was
a way of estimating their indirect exposure to the river. The average of SLRC Bridge crossing
was 0.52 times/participant/month, which broadly means, that one person from Mexicali made one
round trip (crossed twice the bridge) every four months, approximately.
The remaining questions assessed people’s awareness of the river’s environmental issues
and their interest to protect the river in the future. First I found how many people reported ever
seeing the Colorado River dry (Q10). For this variable, affirmative answers accounted for 51%
(287). Other people declared to have never seen the river dry, 37% (210); while the remaining
12% (67 people) said they did not know what were the water conditions of the river. Participants
reported dry river conditions in 2006, 2005, 2004, 2003, 2002, 2001, 2000, 1999, 1996, 1995,

37
1994, 1991, 1990, 1987, 1985, 1983, 1970, 1960 and 1953. Most of these years matched periods
of dry river years reported in the literature (Glenn et al., 2001; Zamora-Arroyo et al., 2001).
Participants were also asked if they could recall the 1997-98 wet years (Q11), which
increased the river’s flow due to ―El Niño‖ event. In this question 60% (337) of the total sample
answered ―Yes‖ while the other 40% (226) answered ―No.‖
Subsequently, participants were provided with two statements with which they had to
agree, disagree, or express their lack of awareness (Q12-Q13). In the first case, 83% (464) agreed
that ―when the river carries more water, environmental improvements manifest along the river’s
corridor‖. Only 5.5% (31) disagreed and the remaining 12% (67) expressed not knowing about it.
The second statement was ―the scarcity of river water is one of the causes why the totoaba (giant
sea bass) is currently endangered‖. With this statement, 47% (261) of participants agreed, 9%
(51) disagreed, and 44% (244) admitted to not know about the issue.
Approximately 99% (557) of participants stated they were in favor of legally protecting the
Colorado River and its adjacent forests (Q14). Only 1% (6) participants responded ―No‖ to
seeking legal protection for the river.
In regards to participants’ preference for a desirable constant water level in the river (Q15),
the preferred river condition was an ―abundant flow‖ with 66% (373) of preferences; the ―1997-
98 pictures‖ represented this condition. A ―moderate flow‖ condition accounted for 33% (188) of
preferences. The remaining 0.4% (2) indicated no preference for either of the water levels. A
picture representing ―dry-river‖ conditions was also showed to participants but nobody selected
it. Appendix A has the pictures of the three river conditions presented to participants.
All participants were also asked if they were currently enrolled in any group advocating
environmental activism as its main trait. Only 2 people (0.4%) provided an affirmative answer,
which reflects citizens’ lack of involvement in regional and local environmental matters.
4.1.3 Willingness-to-pay for a constant water flow
Willingness-to-pay to reinstate a constant flow to the river was addressed in Questions 17,
18, and 19. The survey had three offers but each participant received only two at the time. The
mechanism to deliver offers was to first ask everyone if they were willing to pay Offer1, which
included randomly assigning initial prices of either 20, 40, 60, or 80 pesos. Then, depending on
their ―Yes‖ or ―No‖ answer, they were given a second choice (Offer2 or Offer3, respectively).
On one hand, those with affirmative answers were asked if they were willing to pay a higher price
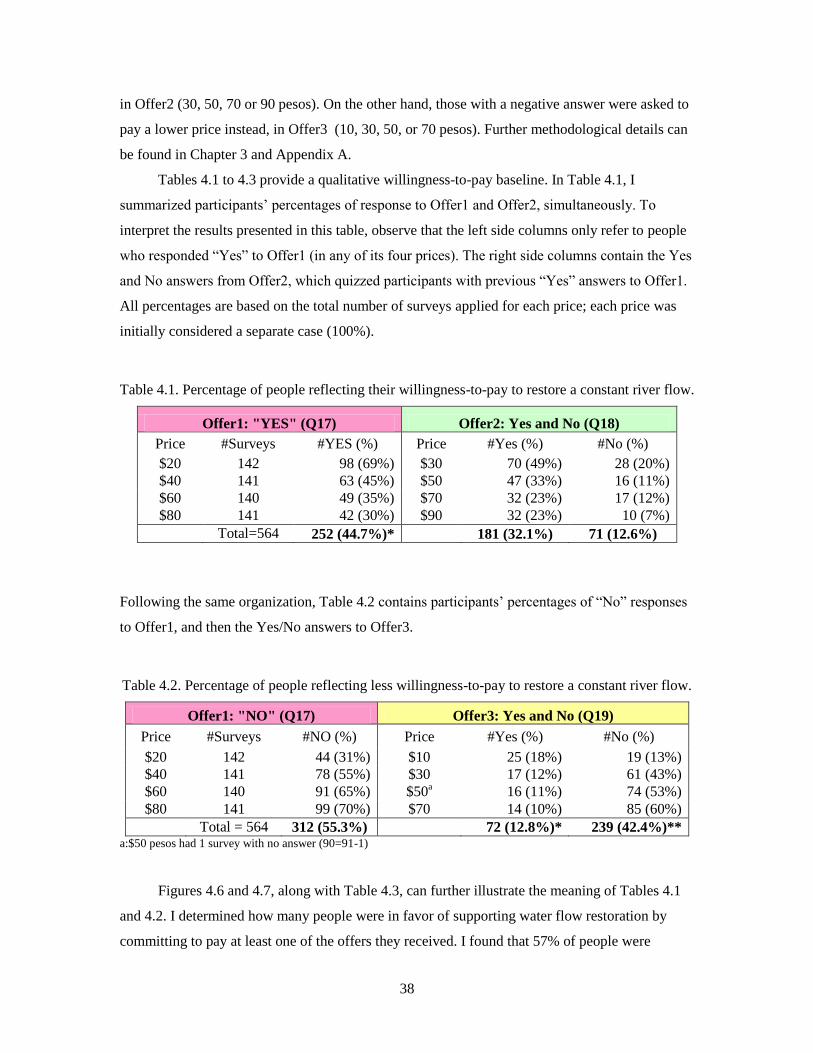
38
in Offer2 (30, 50, 70 or 90 pesos). On the other hand, those with a negative answer were asked to
pay a lower price instead, in Offer3 (10, 30, 50, or 70 pesos). Further methodological details can
be found in Chapter 3 and Appendix A.
Tables 4.1 to 4.3 provide a qualitative willingness-to-pay baseline. In Table 4.1, I
summarized participants’ percentages of response to Offer1 and Offer2, simultaneously. To
interpret the results presented in this table, observe that the left side columns only refer to people
who responded ―Yes‖ to Offer1 (in any of its four prices). The right side columns contain the Yes
and No answers from Offer2, which quizzed participants with previous ―Yes‖ answers to Offer1.
All percentages are based on the total number of surveys applied for each price; each price was
initially considered a separate case (100%).
Table 4.1. Percentage of people reflecting their willingness-to-pay to restore a constant river flow.
Offer1: "YES" (Q17) Offer2: Yes and No (Q18)
Price #Surveys #YES (%) Price #Yes (%) #No (%)
$20 142 98 (69%) $30 70 (49%) 28 (20%)
$40 141 63 (45%) $50 47 (33%) 16 (11%)
$60 140 49 (35%) $70 32 (23%) 17 (12%)
$80 141 42 (30%) $90 32 (23%) 10 (7%)
Total=564 252 (44.7%)* 181 (32.1%) 71 (12.6%)
Following the same organization, Table 4.2 contains participants’ percentages of ―No‖ responses
to Offer1, and then the Yes/No answers to Offer3.
Table 4.2. Percentage of people reflecting less willingness-to-pay to restore a constant river flow.
Offer1: "NO" (Q17) Offer3: Yes and No (Q19)
Price #Surveys #NO (%) Price #Yes (%) #No (%)
$20 142 44 (31%) $10 25 (18%) 19 (13%)
$40 141 78 (55%) $30 17 (12%) 61 (43%)
$60 140 91 (65%) $50a 16 (11%) 74 (53%)
$80 141 99 (70%) $70 14 (10%) 85 (60%)
Total = 564 312 (55.3%) 72 (12.8%)* 239 (42.4%)** a:$50 pesos had 1 survey with no answer (90=91-1)
Figures 4.6 and 4.7, along with Table 4.3, can further illustrate the meaning of Tables 4.1
and 4.2. I determined how many people were in favor of supporting water flow restoration by
committing to pay at least one of the offers they received. I found that 57% of people were

39
willing to pay at least one of the offers; the other 42% showed no commitment since they
answered ―No‖ twice (Table 4.3).
Table 4.3. Descriptive summary of willingness-to-pay.
Willingness-to-pay overall percentages
Total Yes*
(to at least one offer) 324 (57.5%)
Total No**
(to both offers) 239 (42.4%)
TOTAL 563 (100%)
AVERAGE*** 42.8
pesos/household *I added totals of ―Yes‖ from Offer1 and Offer3.
***I made a simple calculation with Offer1 (Yes).
I also wanted to infer what was the preferred price that people was willing to pay. Figure
4.5, shows how many people initially answered ―Yes‖ to Offer1 (left side columns), and then how
many of them were willing to pay a higher price in Offer2 (right side columns). Overall, Offer1
of 20 pesos received the greatest support from participants (―Yes‖= 69%; ―No‖=31%), and
Offer1 of 80 pesos was the least supported price (―No‖=70%; ―Yes‖=30%).
Yes to Offer1 & Yes to Offer2
30%35%
45%
69%
23%23%
33%
49%
0
20
40
60
80
100
120
140
20&30 40&50 60&70 80&90
Prices in Pesos
# o
f P
eople
Figure 4.5. Summary of affirmative support (%Yes) to pay Offer1 and Offer2 in Mexicali.
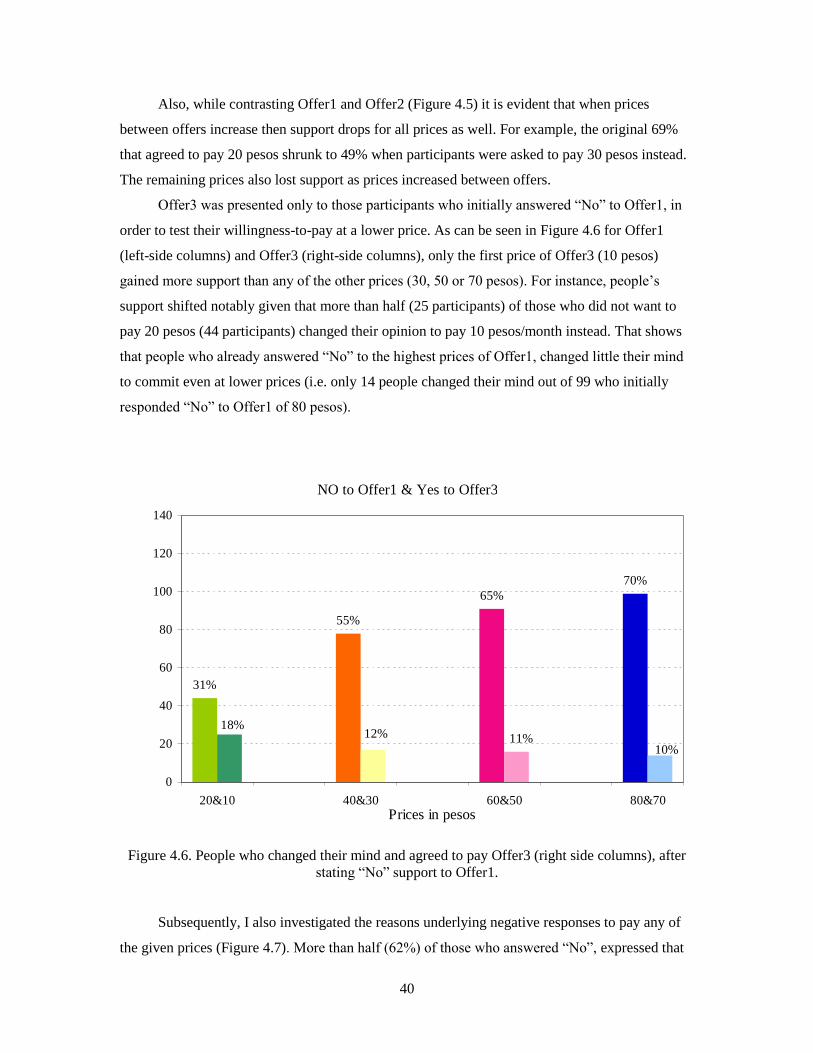
40
Also, while contrasting Offer1 and Offer2 (Figure 4.5) it is evident that when prices
between offers increase then support drops for all prices as well. For example, the original 69%
that agreed to pay 20 pesos shrunk to 49% when participants were asked to pay 30 pesos instead.
The remaining prices also lost support as prices increased between offers.
Offer3 was presented only to those participants who initially answered ―No‖ to Offer1, in
order to test their willingness-to-pay at a lower price. As can be seen in Figure 4.6 for Offer1
(left-side columns) and Offer3 (right-side columns), only the first price of Offer3 (10 pesos)
gained more support than any of the other prices (30, 50 or 70 pesos). For instance, people’s
support shifted notably given that more than half (25 participants) of those who did not want to
pay 20 pesos (44 participants) changed their opinion to pay 10 pesos/month instead. That shows
that people who already answered ―No‖ to the highest prices of Offer1, changed little their mind
to commit even at lower prices (i.e. only 14 people changed their mind out of 99 who initially
responded ―No‖ to Offer1 of 80 pesos).
NO to Offer1 & Yes to Offer3
70%
65%
55%
31%
10%11%12%
18%
0
20
40
60
80
100
120
140
20&10 40&30 60&50 80&70
Prices in pesos
# o
f P
eople
Figure 4.6. People who changed their mind and agreed to pay Offer3 (right side columns), after
stating ―No‖ support to Offer1.
Subsequently, I also investigated the reasons underlying negative responses to pay any of
the given prices (Figure 4.7). More than half (62%) of those who answered ―No‖, expressed that
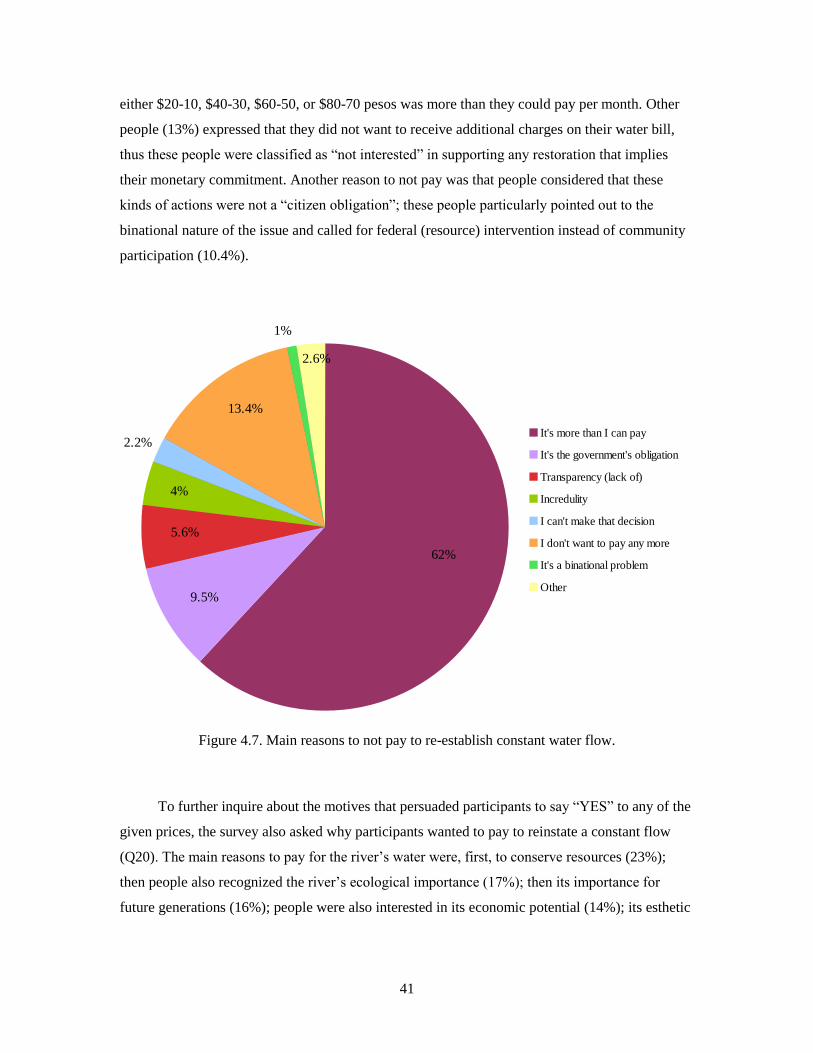
41
either $20-10, $40-30, $60-50, or $80-70 pesos was more than they could pay per month. Other
people (13%) expressed that they did not want to receive additional charges on their water bill,
thus these people were classified as ―not interested‖ in supporting any restoration that implies
their monetary commitment. Another reason to not pay was that people considered that these
kinds of actions were not a ―citizen obligation‖; these people particularly pointed out to the
binational nature of the issue and called for federal (resource) intervention instead of community
participation (10.4%).
2.6%
13.4%
2.2%
5.6%
9.5%
1%
4%
62%
It's more than I can pay
It's the government's obligation
Transparency (lack of)
Incredulity
I can't make that decision
I don't want to pay any more
It's a binational problem
Other
Figure 4.7. Main reasons to not pay to re-establish constant water flow.
To further inquire about the motives that persuaded participants to say ―YES‖ to any of the
given prices, the survey also asked why participants wanted to pay to reinstate a constant flow
(Q20). The main reasons to pay for the river’s water were, first, to conserve resources (23%);
then people also recognized the river’s ecological importance (17%); then its importance for
future generations (16%); people were also interested in its economic potential (14%); its esthetic

42
contribution to the regional landscape (12%); and finally in the protection of an element that is
part of their regional identity (12%).
4.1.4 Willingness-to-pay for potential recreational opportunities
(Questions 21 to 24)
This last section of questions focused on the potential for future recreational preferences
and demands from participants. First, I asked if they thought they were already receiving any
direct benefits from the Colorado River, in its current state (dry), at two levels: personal (or
family) and regional levels.
At a personal or family level most participants expressed that the river did not benefit them
at all (45%; Figure 4.8). A second group of people, 35%, thought that the river’s water is directly
supplying households with residential tap water. In fact, most Mexicali tap water comes from
Mesa Arenosa ground-well field (Alvarez1, 2007) and thus the Colorado benefits them through
ground water recharge, in an indirect way. A third group, 10%, admitted to not know what sort of
benefits they already receive from the Colorado River. Adding up these three groups, I concluded
that 90% of people either has the wrong information about where their tap water is coming from,
neglects the importance of the river in their lives, or ignore how the river really supports their
lives overall. Other perceived personal benefits included tourism, environmental services, trees
and shade, a beautiful landscape, agriculture, and reception of the city’s sewage. Only 1%
considered that the current state of the river (―dry‖) had negative impacts in their lives such as
insecurity, hidden drug traffic, depressing landscapes, and the region’s bad reputation. This
specific answer deserves some attention because although the question did not focused on the
negative impacts, 1% of participants brought it up and perhaps the question should have been
expanded to gather opinions on the negative impacts of a ―dry river‖.
1 Alvarez, Manuel. 2007. Personal communication from a CILA retired engineer.
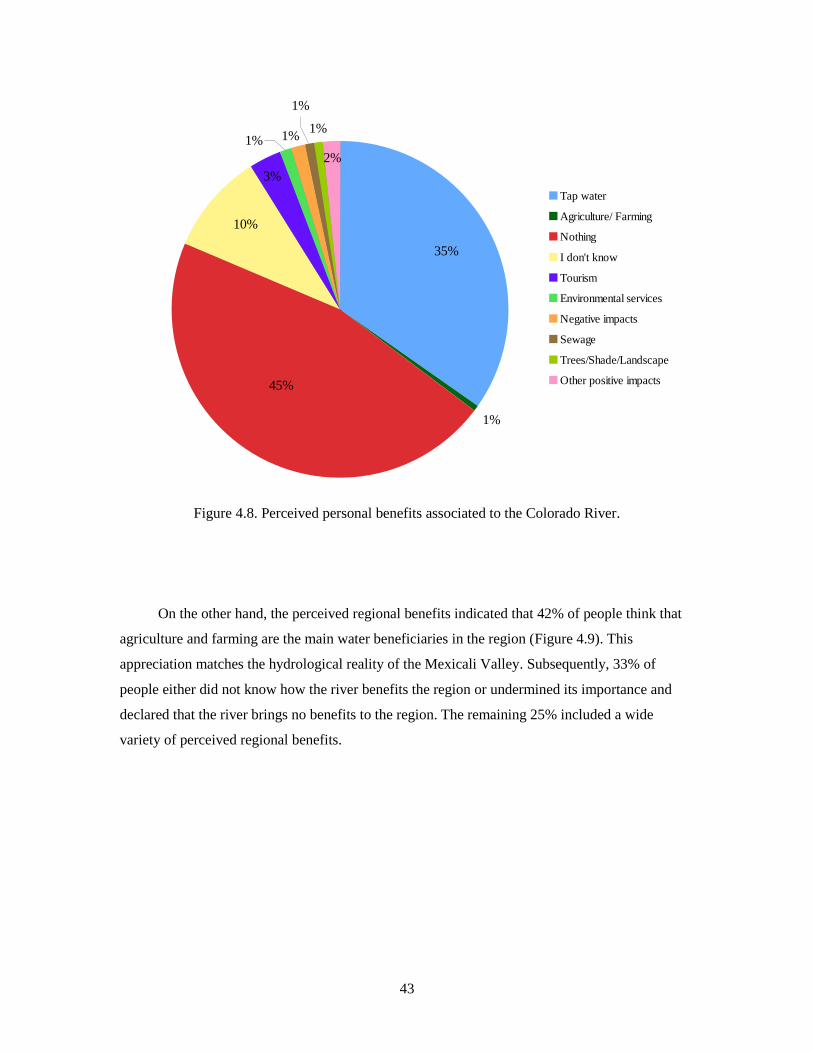
43
1%
1%
1%
35%
45%
10%
3%
2%
1% 1%
Tap water
Agriculture/ Farming
Nothing
I don't know
Tourism
Environmental services
Negative impacts
Sewage
Trees/Shade/Landscape
Other positive impacts
Figure 4.8. Perceived personal benefits associated to the Colorado River.
On the other hand, the perceived regional benefits indicated that 42% of people think that
agriculture and farming are the main water beneficiaries in the region (Figure 4.9). This
appreciation matches the hydrological reality of the Mexicali Valley. Subsequently, 33% of
people either did not know how the river benefits the region or undermined its importance and
declared that the river brings no benefits to the region. The remaining 25% included a wide
variety of perceived regional benefits.

44
42%
20%
13%
6%
4%3%
2%
2%
2%
2%
2%
2%
Tap water
Agriculture/ Farming
Nothing
I don't know
Tourism
Environmental Services
Fishing
Wildlife
Negative Impacts
Direct economic benefis
Trees/ Shade/ Landscape
Other
Figure 4.9. Perceived regional benefits associated to the Colorado River.
When asked if they would consider the Colorado and Hardy Rivers as future recreational
options in the region (Q22), 93% said Yes and 7% said No.
In regards to participants’ willingness-to-spend on a day trip to the Colorado River with their
families (Q23; Figure 4.10), I found that most people preferred to spend between 50-100 pesos
per person per day (44%, 246); followed by 100-200 p/p/d (29%, 163); then 200-300 p/p/d
(14%); and finally >300 pesos (9%). Ranges of expenditure varied from 50 to more than 500
pesos.
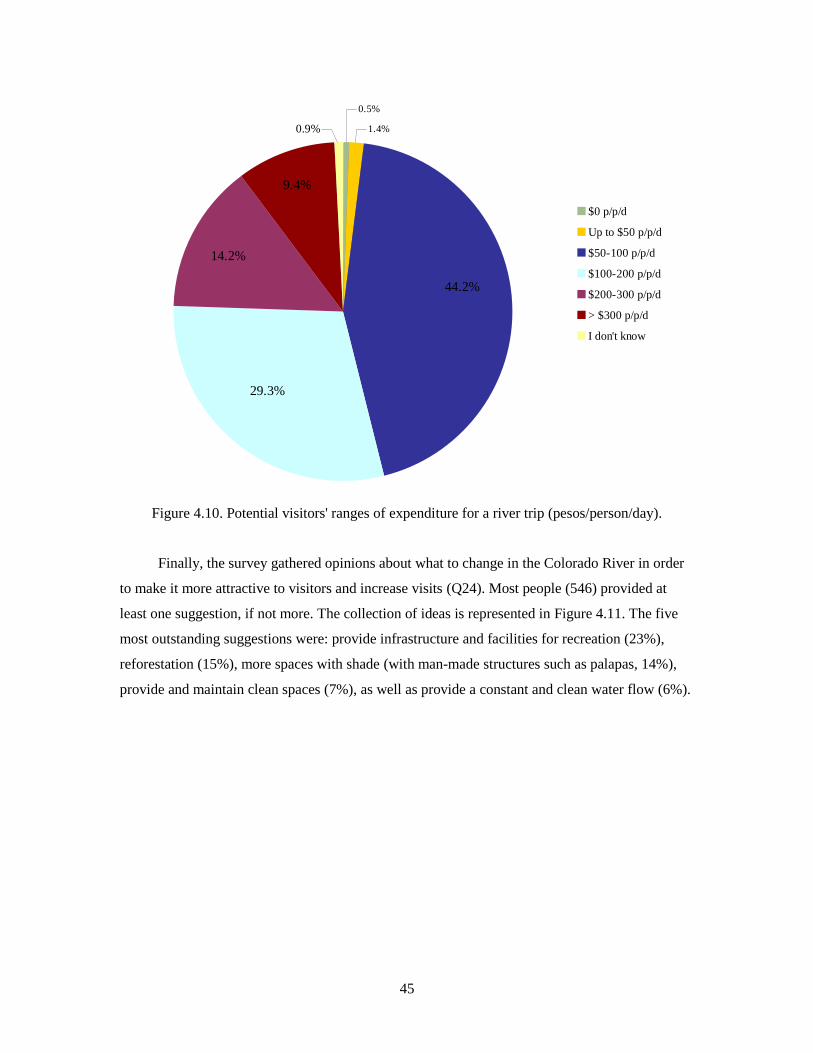
45
9.4%
14.2%
29.3%
44.2%
0.9%
0.5%
1.4%
$0 p/p/d
Up to $50 p/p/d
$50-100 p/p/d
$100-200 p/p/d
$200-300 p/p/d
> $300 p/p/d
I don't know
Figure 4.10. Potential visitors' ranges of expenditure for a river trip (pesos/person/day).
Finally, the survey gathered opinions about what to change in the Colorado River in order
to make it more attractive to visitors and increase visits (Q24). Most people (546) provided at
least one suggestion, if not more. The collection of ideas is represented in Figure 4.11. The five
most outstanding suggestions were: provide infrastructure and facilities for recreation (23%),
reforestation (15%), more spaces with shade (with man-made structures such as palapas, 14%),
provide and maintain clean spaces (7%), as well as provide a constant and clean water flow (6%).

46
3%
4.3%
4.4%3%5.4%
2%
1.2%
15.2%
6.4%
23%7.4%
14.2%
1.2%
3%
3%
1.4%
2%
I don't know
More security & vigilance
Public WC
Reforestation/ healthy ecosystems
Constant water flow/ clean water
Facilities for recreation
Clean spaces & their maintenance
Shade/ Palapas
Giftshops & grocery stores
Organize activities & events
Rent of equipment
Improve vehicular access/ public
transportationPromote fishing
Control acces & regulate activities
Food services
Camping areas, bungalows, a hotel
Other facilities & actions
Figure 4.11. Collective ideas to improve the quality of their visits to the Colorado River.
4.2 Cross-tabulation analysis of Mexicali variables
To study the dependence among Mexicali variables I relied on non-parametric statistic
analysis, and I cross-tabulated the variables of interest to obtain their Pearson Chi-square (2) and
p-value. I initially based variable association on suggestions made by INE, relying on their
experience working with SLRC in 2005. Table 4.4 summarizes the analyses presenting Chi-
square values, p-values, and the resulting conclusion for each association, expressed as the
―Significance of the Relationship.‖ Detailed tables of results for each variable association are in
Appendix A.
The null (H0) and alternative (H1) hypotheses tested for each pair of associations are:
H0: There is no relationship between the two variables being compared
H1: There is a relationship between the two variables being compared

47
The analyses concentrate on testing the dependency of willingness-to-pay Offer1 against
ten other relevant variables (Table 4.4). I choose Offer1 (Q17) as the only offer to test because it
was the only one presented to all participants. The variables tested in association with
willingness-to-pay (Q17) were: people who visit or do not visit the river; degree of people-river
interactions; frequency of visits; frequency of bridge crossings; awareness of dry river conditions;
advocacy for legal protection of the river; perceived personal benefits from the river; presence of
children at home; level of education; and income. Additionally, I decided to complement those
associations testing two other associations: ―dependency of willingness-to-pay for potential
services‖ (from Q23, not Q17) vs. ―perception of received personal benefits from the Colorado
River‖; and ―perception of received personal benefits‖ vs. “levels of education.‖
To draw conclusions on associations, researchers first have to estimate the Pearson’s Chi-
square statistic, compare it to critical values using the calculated degrees of freedom, df, and
finally arrive to the p-value. The p-value is then used to decide whether or not to reject the null
hypothesis (H0). In social sciences, the null hypothesis (H0) can be rejected when the calculated p-
value is less than 0.05. I found that most variable associations (9) were independent (p-value
>0.05) and that only 3 associations were actually dependent (p-value <0.05) (Table 4.4). The
three dependent associations were between:
- Willingness-to-pay for river flow restoration and the perception of receiving personal
benefits from the river (p <0.001)
- Willingness-to-pay and presence of kids in a household (p = 0.016)
- Willingness-to-pay for potential recreational services and perceived personal benefits (p
<0.001).

48
Table 4.4. Relevant associations of variables from Mexicali survey.
Cross-tabs Description of each association Chi-square p-value Significance of
Relationship
Q17-Q2 Willingness-to-pay vs. People who have seen or
visited the CR or HR
1.26 0.150 NO
Q17-Q4 Willingness-to-pay vs. Degree of people-river
interactions
8.35 0.080 NO
Q17-Q5
Willingness-to-pay vs. Frequency of visits/ year 5.1 0.078 NO
Q17-Q8 Willingness-to-pay vs. Frequency of CR crossings/
month at SLRC bridge
1.33 0.722 NO
Q17-Q10 Willingness-to-pay vs. Awareness of dry river
conditions
5.05 0.080 NO
Q17-Q14 Willingness-to-pay vs. Wanting legal protection for
the CR
0.32 0.570 NO
Q17- Q21a Willingness-to-pay vs. Perceived personal benefits
received from the CR
17 <0.001 YES
Q17- Q26 Willingness-to-pay vs. Presence of children in
households
5.8 0.016 YES
Q17- Q27
Willingness-to-pay vs. Level of education 9.06 0.107 NO
Q17- Q29
Willingness-to-pay vs. Income 13.05 0.071 NO
Q21a-Q23 Perceived personal benefits from the CR vs.
Willingness-to-pay for potential services (recreation)
22.2 <0.001 YES
Q21a-Q27 Perceived personal benefits from the CR vs. Level of
education
9.13 0.100 NO
49
Within the independent associations there were also two slightly different groups, though.
The first group showed a strong variable independence in five associations with p-values clearly
above 0.05 (Appendix A- Tables 1, 4, 6, 9, and 12). The second group showed borderline p-
values in 4 associations, by which I mean that although values were above 0.05 they were so
close to 0.05 that H0 might have been rejected if I had analyzed the data within a limited range of
prices and not with all the prices at once. This specific issue is discussed in Section 5.4. The
variables that showed borderline associations with willingness-to-pay were: degrees of river
interactions; frequency of visits to the Colorado River; awareness of dry river conditions; and
income (Appendix A- Tables 2, 3, 5, and 10).
4.3 Mexicali and SLRC analysis
Answering the second research question of this study lies within the analysis presented in
this section, where common variables from the Mexicali survey are contrasted with their
counterpart in SLRC. I present the comparison of both localities in two parts. First, I compare
relevant variables drawn from the descriptive statistics of both surveys (Section 4.3.1). Then, I
present the results of a qualitative comparison of willingness-to-pay from both locations (Section
4.3.1.).
4.3.1 San Luis Rio Colorado and Mexicali descriptive statistics
The following summary compares 14 common variables divided into three categories
relevant to both localities: people-river interactions, socioeconomic profile, and willingness-to-
pay to reinstate a constant water flow. I present people-river interactions first and then the
socioeconomic comparison in order to build at the end a qualitative analysis of willingness-to-pay
between the two localities.
4.3.1.1 People-river interactions in SLRC and Mexicali
a) Frequency of visits to the Colorado River/year
In Mexicali, residents averaged 0.9 visits/household/year while in SLRC residents
averaged 1.9 visits/household/year (Carrillo-Guerrero, 2005). This means that on average, people
from SLRC visit the Colorado River twice as often as people from Mexicali.
50
b) Preferred activities during river visits
In Mexicali, the top three preferred visitor activities were family trips for picnics (36%),
fishing (17%), and day hikes (16%). In SLRC the top three preferred activities were family trips
for picnics (21%), swimming (21%), and fishing (7%).
c) Awareness of dry river conditions
In Mexicali, only 51% of interviewees have witnessed dry river conditions while in SLRC more
people are familiar with that condition (90%). Additionally, in Mexicali 37% of participants said
that they have ―never seen the Colorado River dry‖ and another 12% said they ignore the rivers’
flow conditions. Overall, these data reflect less awareness of the river’s flow conditions in
Mexicali than in SLRC, which is understandable due to the distance of each city to the river
(SLRC is right next to the river while Mexicali is at least 65 km away).
d) Awareness of river floods (1997-1998)
In Mexicali, only 60% of participants were aware of the 1997-1998 floods while in SLRC
up to 84% confirmed to be aware of those floods. Thus, people in Mexicali are less aware of the
river’s flow conditions than people in SLRC. Distance to the river can again explain variations in
levels of awareness of the river’s conditions.
e) Environmental improvements in the delta associated to larger river flows.
In Mexicali, 83% of people agreed that environmental improvements in the delta are
associated with larger river flows. Nearly the same proportion confirmed the same in SLRC,
88%. In this question, people from both cities have similar opinions regardless of river-to-city
distance.
f) Totoaba’s endangered status.
In SLRC 83% of people agreed that the endangered status of the totoaba was directly
related to lower river flows. In contrast, in Mexicali only 47% agreed to the same statement,
while 44% said they did ―not know‖. This strong contrast in levels of awareness of environmental
issues associated to the lack of water in the Colorado River Delta is probably a direct reflection of
river-to-city distances. However, this conclusion is only tentative, as the SLRC survey did not
include a ― do not know‖ choice of answers, and thus people in SLRC did not have the
opportunity to express their lack of knowledge.

51
g) Legal protection for the Colorado River.
Strong majorities in both localities advocated for setting up legal protection for the
Colorado River and its riparian forests: 99% in Mexicali, and 96% in SLRC.
h) Preferred river flow condition.
The preferred flow condition for both localities was ―an abundant flow‖, with 86% of
participants’ support in SLRC and 66% of support in Mexicali. The second preferred river
condition was a ―moderate flow‖ with 12% of participant’s support in SLRC and 33% of in
Mexicali. The same set of pictures was used in both surveys (Appendix A).
4.3.1.2 Socioeconomic profiles of SLRC and Mexicali
I drew a basic comparison of the socioeconomic profile of participants from both cities.
Similar levels of female/male participation were found (60% females and 40% males in Mexicali;
63% females and 37% males in SLRC). The average age of participants was similar as well, 43
years in SLRC and 43.6 years in Mexicali.
I also found that in SLRC the length of residency was lower (24 years) that in Mexicali (31
years), which makes sense considering that Mexicali is the largest city in the region and that its
growth has attracted a large number of immigrants. The average number of children/household
was 2 in SLRC while in Mexicali it was lower, 1.4 children/household. The average number of
adults/household was 2 in SLRC and 2.9 in Mexicali. Overall, the differences in ratio of adults
and children between localities reflect again the migratory nature of Mexicali where the working
force is expected to be higher than in a small city such as San Luis Rio Colorado.
Education levels in both cities were similar, junior-high is the prevalent education level in
the region (32% in SLRC and 28% in Mexicali). Other relevant findings were the lack of citizens’
engagement in environmental groups or activism, in both locations.
Finally, the level of annual income was also compared (Figure 4.12). It is necessary to
clarify that there were some structural survey changes advised by INE, in order to improve the
data for econometric purposes. In SLRC annual income was estimated by asking participants to
indicate the range into which their annual income fell, while in Mexicali participants were asked

52
to state a precise amount of either annual or monthly income. I used income ranges for both. To
make comparisons, the Mexicali annual income data were grouped into categories using the same
ranges as in the SLRC study.
I found that in SLRC half of the people earned between 21,000 and 40,000 pesos/year (in
2005), while in Mexicali people have higher incomes in general. For instance, 37% of Mexicali
participants earned 100,000 pesos/year or more, followed by 22% that earned between 40,000 and
60,000 pesos/year. Figure 4.12 shows comparisons of ranges of income between cities.
0
0.1
0.2
0.3
0.4
0.5
0.6
<20 20-40 40-60 60-80 80-100 >100
Ranks of annual income (pesos/household/year)
Rel
ativ
e fr
equ
ency
Mexicali SLRC
Figure 4.12. Comparison of annual ranges of income between SLRC and Mexicali (2006).
4.3.2 Chi-square test for independence of SLRC and Mexicali
In this study I also wanted to see if there was any difference in willingness-to-pay between
Mexicali and SLRC, under the assumption that differences in willingness-to-pay, from one city to
the other, reflect changes in people’s attitudes to support restoration efforts in each site. To
accomplish that goal I relied on two complementary analyses: Chi-square test for independence

53
and a graphic analysis of relative frequencies. Thus, I established a new set of null and alternative
hypotheses:
H0: The two locations have the same distribution
H1: The two locations do not have the same distribution
These hypotheses are valid to compare the distribution of willingness-to-pay responses,
across all offers, between the two cities (Table 4.5). I used all willingness-to-pay results from
Mexicali (Tables 4.1 and 4.2) and SLRC (see table in Appendix B). After calculating the Chi-
square test for independence in Excel, at a significance level of 0.05 (), and then looking at the
graphical comparisons, I concluded that there is strong evidence to say that willingness-to-pay
does vary from one city to the other. The Chi-square test for independence yielded observed
values much higher than the critical Chi-square value of 7.81, at 3 df. Thus, I rejected H0 and
accepted H1.
Table 4.5. Mexicali and SLRC associations of willingness-to-pay.
Comparison of distributions Chi-square test for
independence
p-value * df Conclusion
Offer1: Mexicali vs. SLRC 84.25 < 0.05 3 Reject H0
Offer2: Mexicali vs. SLRC 68.75 < 0.05 3 Reject H0
Offer3: Mexicali vs. SLRC 36.39 < 0.05 3 Reject H0 The critical value was 7.81 at 3 df; the p-value= 3.22e
-8 which is < 0.05.
Furthermore, to complement the test for independence findings I graphically compared the
relative frequencies of choices for all offers. In Figures 4.13 to 4.15, I simultaneously compared
all relative frequencies from all answers to all prices in both locations, and observed that SLRC
provided more affirmative answers to Offer1. That can be seen in Figure 4.13 where SLRC’s Yes
columns are taller for the lowest three prices, but just slightly smaller for the last price of $80
(Mexicali =0.74 vs. SLRC= 0.69).
Similarly, Figure 4.14 shows the same trend again where participants from SLRC gave
more affirmative support to pay the lower three prices, while the last price of $90 received less
support in SLRC than in Mexicali (Mexicali= 0.12 vs. SLRC= 0.093). Notice that Figure 4.14
refers to a new set of answers from people who already answered ―Yes‖ to Offer1, but now tested
at a higher price.

54
Offer1
0
0.1
0.2
0.3
0.4
0.5
0.6
Yes $20 Yes $40 Yes $60 Yes $80 No $20 No $40 No $60 No $80
Offer1: Answers & Prices
Rel
ativ
e fr
equ
ency
Mexicali SLRC
Figure 4.13. Comparison of answers to all Offer1 prices (Mexicali, n= 563; SLRC n= 302).
Offer2
0
0.1
0.2
0.3
0.4
0.5
0.6
Yes $30 Yes $50 Yes $70 Yes $90 No $30 No $50 No $70 No $90
Offer2: Answers & Prices
Rel
ativ
e fr
equ
ency
Mexicali SLRC
Figure 4.14. Comparison of answers to all Offer2 prices (Mexicali n= 252; SLRC n= 213).

55
Offer3
0
0.1
0.2
0.3
0.4
0.5
0.6
Yes $10 Yes $30 Yes $50 Yes $70 No $10 No $30 No $50 No $70
Offer3: Answers & Prices
Rel
ativ
e fr
equen
cy
Mexicali SLRC
Figure 4.15. Comparison of answers to all Offer3 prices (Mexicali n= 311; SLRC n= 89).
Figure 4.15, on the other hand shows less support from SLRC participants, however here
we have to remember that this graph represents the new answer of all the people who already
answered ―No‖ to Offer1. Therefore, in this graph I basically observe that people who already
answered ―No‖ to Offer1, change their mind very little to pay even at a lower price, in both
locations.
Two other important graphical trends can also be observed if we consider the influence of
distance (to the river) and prices, on the decisions of people from both locations. The assumption
that living close or far from the river influences participants’ response is based on my
observations and conclusion that people from SLRC interact more with the Colorado River (see
Section 4.3.1.1). Figure 4.16 shows the combination of people’s responses to the two offers of
prices that they received, thus observing four possible responses for each price. The first
association ―yy‖ means that people answered yes to both offers (to an initial price and then a
higher price); ―yn‖ represents people who originally answered yes but then rejected the second
offer; ―ny‖ represents people who originally rejected the initial offer but then changed their mind
with a lower price; and finally ―nn‖ represent people who did not want to pay at all.
In SLRC more people answered ―yy‖ for all four prices and vice versa, more people
answered ―nn‖ in Mexicali.

56
All Offers
0
0.05
0.1
0.15
0.2
0.25
20-yy 20-yn 20-ny 20-nn 40-yy 40-yn 40-ny 40-nn 60-yy 60-yn 60-ny 60-nn 80-yy 80-yn 80-ny 80-nn
All Offers: Answers & Prices
Rel
ativ
e fr
equ
ency
Mexicali SLRC
Figure 4.16. Comparison of all answers, all prices, and all Offers, for both locations (Mexicali n=563; SLRC n=302).

57
More people in Mexicali are willing-to-pay only when the original price is reduced in the
second offer (―ny‖). These results are consistent with the suggestion that proximity of residence to the
river influences people’s willingness-to-pay.
In the case of the influence of price, Figure 4.16 also shows that in SLRC slightly more people
reject the highest price of $80-90 pesos (―nn‖) than in Mexicali. This is consistent with the pattern in
Figure 4.15. These patterns are consistent with the suggestion that income is an influence on
willingness-to-pay.
Finally, looking across all graphs from Figure 4.15 to 4.18, we also observe that most
participants from both locations preferred to pay monthly prices between 10 to 60 pesos, while at the
same time strongly rejecting the highest prices of $70, $80, or $90. Taking these data into a further
econometric analysis will yield a firmer approximation of how much Mexicali people are willing to
pay for a constant river flow.

58
5 DISCUSION
The main goal of this study was to answer two research questions. The first one was to find
―what factors influence the attitudes of Mexicali citizens to re-establish a permanent water flow for
the Colorado River delta‖. The second one was to find if there is ―a difference in people’s
willingness-to-pay between Mexicali and SLRC‖. Throughout the data presented in my results
section and these discussions I was able to answer each question and validate my research findings.
In the past, authors such as Carson (1993) made comparisons of national willingness-to-pay
estimates for water quality (n = 813), with similar studies at city level (Boston) or previous pilot
studies at national level (n = 773), and with different time frameworks (1973 and 1981 versus 1993
estimates), arguing that with differences in sample size, methods, and time accounted for, this type of
comparison is valid. At my own level of data analysis, I believe that the comparisons I make here are
valid as well, given the similarities in the socio-economic profiles of these two cities, their
geographical proximity, the homogeneity of both surveys and data gathering procedures, and
common research themes. I use Sanjurjo and Carrillo’s (2006a) estimation of 46.5 pesos/visit and
3.45 USD million/year of passive use value of a constant water flow in the Delta as reference points
for my arguments.
5.1 Environmental awareness influence on willingness-to-pay differences
My initial hypotheses was that exposure to the river affects people’s environmental awareness
and therefore their willingness-to-pay (attitudes) for environmental services. This relationship has
been noticed elsewhere. In a study conducted by Menegaki et al. (2007) of willingness-to-pay for
recycled water in agriculture, in Crete, Greece, factors such as participant’s environmental awareness,
income, and pricing were influential. Similarly, Carson and Mitchell (1993) concluded that national
willingness-to-pay for clean water in the U.S. was determined by the quality of the water offered, the
recreational benefits associated, participants’ income, and their environmental attitudes.
In the two cities that I studied I found that people’s environmental awareness of river issues
varies from one city to the other. For instance, in Mexicali only half of interviewees (51%) is aware
of dry river conditions while in SLRC most people (90%) is aware of those conditions. When I asked
if they have noticed river flooding (in 1997-1998), 60% of interviewees in Mexicali said yes vs. 84%
59
in SLRC. Similarly, when participants were asked about the relationship between the lack of normal
river flow and the endanger status of the totoaba in the Upper Gulf of California, more people agreed
with this statement in SLRC (83%) than in Mexicali (47%). Thus, SLRC showed more environmental
awareness in regards to river issues than Mexicali. An evident explanation to this difference is the fact
that SLRC is a true river city having the river at its doorstep while Mexicali is at least 60 km away
from it. I argue that the fact that SLRC is more river aware than Mexicali corresponds to its higher
willingness-to-pay as it is shown in Figures 4.13-4.16 in Section 4.3.2.
Subsequently, I also argue that my study reveal that river awareness is determined by people’s
exposure to the river. Only 25% of people in Mexicali crosses the river at least once every month,
while in SLRC 84% of people do. On average, people in Mexicali cross the river 0.52 times/month
while in SLRC people cross the river 3.27 times/month. Evidently, people from SLRC are more
exposed to the Colorado River because they have to cross it more often than people from Mexicali do.
Given that Mexicali is the capital of the state, it constitutes the largest city in the delta and many
people from SLRC commute to work there daily. Those who migrate to Mexicali and stay in the city
are not as exposed to the river because they only cross it twice a year (when they arrive and to go see
their families in the main land), while those commuting to work from SLR have the opportunity to
drive by the river very often. Thus, from these observations exposure to the river does affect people’s
river awareness and therefore their willingness-to-pay.
Other authors argue that socioeconomic and geographic factors influence collective attitudes
towards resource management and conservation efforts. These types of parallel examples reinforce
the idea that socioeconomic factors can also influence environmental awareness and general attitudes.
In 2004, Brunson and Shindler argued that citizen’s acceptance (attitudes) and knowledge about
resource management practices vary across geographic space, time, and social affiliations. According
to them, collective judgment and acceptance varies from one place to another due to local-specific
social and environmental factors that affect local knowledge. On the other hand, Kideghesho et al.,
(2007) argues that factors such as history, politics, ecology, socio-demographics, culture, and
economics play a role in defining local conservation efforts in the Serengeti, Tanzania. In a Mexicali
context, migration for example is the biggest influencing force that shapes citizens’ environmental
awareness due to a local working culture, the population’s mobility and its consequent
underdeveloped attachment to the region. As half of Mexicali’s population is migrant, people most
likely did not spend their first years in the city looking for opportunities to participate in
environmental causes; instead they probably spent their time working and adjusting to the new city.

60
5.2 Factors influencing willingness-to-pay in Mexicali
In addition to environmental awareness, I found that parenthood and perception of received
benefits from the river were significant influential factors in Mexicali’s willingness-to-pay. These
two factors reveal specific motives affecting willingness-to-pay. Similar relationships are reported in
the literature. McConnell (1997) illustrated the importance of altruistic motives with a harbor
porpoise example from New England. In his example people were asked if they were willing to pay a
state tax to eliminate porpoise by-catch in gill nets. The example illustrated the importance of
perceived benefits as an altruistic motivation to influence willingness-to-pay by informing only half
of the sample that the harbor porpoise is rarely seen, and the other half without telling them that fact.
The results of the study proved that when people do not perceive use value or a benefit from the
environmental good or service in question, their willingness-to-pay declines. In that case, only when
people heard that no one (other people) would benefit from protecting this animal did they show less
interest in paying for its protection, which is a specific type of altruistic behavior (non-paternalistic).
Similarly, Brunson and Steel (1996) argue that attitudes towards resource management are strongly
associated with value orientations towards the role of humans in nature. Additionally, in Kideghesho
et al. (2007) study in Tanzania, conservation attitudes were positive only when interests of local
communities were not affected over the use of protected areas. My findings are congruent with both
altruistic motives and received benefit perceptions: when Mexicali citizens perceived that the river
actually benefits them, or that it could benefit them in the future (option value), or that their children
and grandchildren could benefit from it latter, then they were more inclined to pay for restoration
efforts.
According to many authors, studying attitudes and motives is important for understanding how
the public values environmental goods (Blamey, 1988; Spash, 2000; Rosemberg et al., 2003; Milon
and Scrogin, 2006). Asking participants why they preferred to pay or not pay for a given survey price
is highly recommended to insure the reliability of contingent valuation estimates (Arrow et al., 1993;
Carson et al., 2003). In accordance with that principle, I then corroborated what influenced
willingness-to-pay in Mexicali, by asking participants directly why they were willing-to-pay. I found
that resource conservation and the recognition of the ecologic importance of the delta ecosystems
were the top two reason (40%). Chi-square analysis also showed dependency between willingness-to-
pay for future options of recreation and participants’ perception of river-derived benefits. Similar
results were reported by Bright et al. (2002), who studied attitudes in Chicago towards ecological
restoration in urban areas and found that positive and negative attitudes were determined by perceived

61
outcomes of restoration initiatives. They also concluded that positive attitudes are related to values
while negative attitudes are related to emotions.
This last observation was visible in Mexicali’s results when asking people about their reasons
to not pay. For example, negative attitudes were evident in responses such as ―it is the government’s
obligation, not mine‖, or ―I do not believe that this type of programs can achieve their goals‖ (general
incredulity), or ―no, because the government is corrupted‖ (lack of trust in institutions).
It is evident that receiving utility or a benefit from river restoration is important for Mexicali people.
The three main requests for improvement of river visits were actually two in type of services (Figure
4.11) –first people requested material infrastructure improvements and maintenance (―more recreation
facilities and clean areas‖), then people requested specific environmental services such as ―shade‖
(from trees and palapas) and water to swim. If investment is going to be made to improve the river’s
attractions, the best economic results would come from providing infrastructure, shade and water.
Restoring the natural assets of the river seems to be something that people would support in the area
because it will directly benefit them.
5.3 Other factors (Mexicali)
Other factors that could potentially affect willingness-to-pay in Mexicali were: frequency of
visits to the river, awareness of dry river conditions, and income. These three factors were not found
to be statistical significant with my analysis approach for Mexicali’s variable associations, but were
very close. I believe that they were not significant because when I determined the relationship of
those variables with willingness-to-pay (Pearson Chi-square) I used the full pricing range from10 to
90 pesos. Instead, I should have used only the range of prices where the actual Mexicali willingness-
to-pay lies (below 46 pesos/visit using the average SLRC-WTP estimated by Sanjurjo and Carrillo,
2006a) and then have tested its dependency to confirm the influence of any one of the three factors.
Commonly, income determines people’s willingness-to-pay (Carson and Mitchell, 1993;
Carson et al., 2001; Carson et al., 2003; Sanjurjo and Carrillo, 2006b; Menegaki et al., 2007). With a
non-parametric analysis of all prices my results did not correspond to this expectation, but were very
close to make the relationship of willingness-to-pay and income significant. Having the specific
amount that Mexicali people is willing to pay could clarify the influence of income.

62
A general expectation was that our graphic results would conform to economic theory that says
that ―the percentage of respondents willing to pay falls as the price they are asked to pay increases‖
(Carson et al., 2001). This was the only income influence that I fully corroborated in both cities.
Other income observation that I was able to make were limited; for example, there was an obvious
shift from positive to negative willingness-to-pay in SLRC in the last set of prices (80, 70, 90 pesos;
Figures 4.13 to 4.15). Lower income in SLRC deterred people from expressing their willingness to
pay at the highest prices surveyed; on the other hand in Mexicali, less environmental awareness
influenced people’s willingness-to-pay instead.
Education is often found to influence willingness-to-pay (Carrillo-Guerrero, 2005; Sanjurjo
and Carrillo, 2006b). The influence of education on willingness-to-pay did not seemed to be
determinant in my study. For instance, the SLRC 2005 study argued that there was a relationship
between education and willingness-to-pay, however I was not able to associate those variables
significantly for Mexicali. Rather than literacy, environmental education and raising awareness are
likely more relevant for Mexicali. As Menegaki et al., (2007) illustrate for Crete, farmers’ education
is not synonymous with experience in agriculture, therefore willingness-to-pay to use recycled water
in Crete was not influenced by levels of education. I believe that a similar parallel applies to Mexicali
citizens: environmental awareness is lacking at all education levels and it is not education per se that
affects willingness-to-pay. In other words, the fact that a person in Mexicali has 17 years of education
(completed college degree) does not outweigh environmental awareness, or that a person only knows
how to write and read (unfinished elementary school) does not mean that he or she is less
environmentally aware than a person with more yeas of education. If a person is exposed to the river
and he or she interacts with it often, then this person is more environmentally aware regardless of his
or her education level. Hours spent in a classroom can expand certain perspectives to understand
society and the world we live in but they do not substitute time spent in contact with nature.
I also inferred that current access to environmental education for most citizens is absent given
that 55% of Mexicali citizens either perceived that the river does not benefit them at all or ignored
that the river benefits them. Another 3% of survey participants suggested deliving more river
information to the general public to improve people-river interactions; and only 2 Mexicali
participants recognized to participate in environmental matters associated to their academic career.
Similarly, in SLRC only 8 people recognized to be currently involved in environmental matters. Thus,
a conservationist or environmentalist culture is lacking in both cities.
63
5.4 Mexicali and SLRC differences in willingness-to-pay
People in Mexicali are less willing than people in SLRC to pay to restore water flow to the
Colorado River. This conclusion directly addresses the second research question of finding
differences in attitudes towards restoring a water flow between these two neighboring cities. Similar
results of the relationship of attitude to willingness-to-pay have been reported elsewhere. Pouta and
Rekola (2001) tested a socio-psychological model to demonstrate that people’s attitudes can predict
willingness-to-pay (for forest regeneration in Finland), and that people’s systems of beliefs determine
those attitudes. An underlining assumption of this study was that willingness-to-pay is a visible
expression of positive or negative attitudes towards river flow restoration. The interpretation of
results from the Chi-square tests for independence (Table 4.5) and the graphical analysis presented in
Section 4.3.2, showed that willingness-to-pay response was more positive in SLRC than in Mexicali
(Fig. 4.13, 4.14, 4.15), across prices. Accordingly, in Mexicali people’s average willingness-to-pay is
expected to be below SLRC’s average of 46.5 pesos/visit, estimated by Sanjurjo and Carrillo (2006a).
Although finding the exact monetary value that Mexicali people are willing to pay is necessary
to make further monetary comparisons with SLRC, I argue that attitudes and their underlying
motivations did influence willingness-to-pay in each location. According to McConnell (1997)
contrasting responses between what people state that they will do and what they actually do depict a
motivation vs. behavior pattern, where motives such as altruism can play a big role in defining
people’s willingness-to-pay. Motives may range from a broad concern for the natural order, to a
desire to save large mammals, or to altruism. Similarly, Bright et al. (2002) argues that attitudes
towards urban ecological restoration in Chicago can be predicted from cognitive, affective, and
behavioral responses to the object being evaluated. The importance of the object or situation being
valuated also influences people’s responses. According to these authors, cognitive components relate
to perceived outcomes and people’s objective knowledge of ecological restoration. The affective
component represent emotional responses to ecological restoration, while behavioral components
measure actions related to ecological restoration and the environment. In this study we found good
examples that reflect specific attitudinal responses for each of the factors enumerated by Bright et al.
For example, when people were asked if they would like to see legal protection for the river corridor,
positive attitudes were displayed in both Mexicali and SLRC (99% and 96%, respectively), and the
preferred flow condition was ―an abundant flow‖ in both cities, which portrays people’s expectations
for benefits. In contrast, behavioral components were reflected when people were tested about their
environmental awareness of river issues, the numbers differed from one city to the other, and when
64
they were asked if they belonged to any environmental organization, the prevalent response was ―no‖
in both cities. Finally, emotional components emerged when asking people why they were not
willing-to-pay to restore river flow, obtaining disbelief and lack of trust in public institutions as the
main influential factors.
6 CONCLUSIONS and RECOMENDATIONS
The two research questions of this study were answered and its three specific objectives were
also accomplished. Willingness-to-pay does vary between Mexicali and SLRC. People in Mexicali
are generally less willing to pay for water flow restoration than people in SLRC. A non-econometric
estimation averaging the number of Yes responses to Offer 1 gave me a result of 42.8 pesos per
household. In Mexicali, people’s average willingness-to-pay is probably below SLRC’s average of
46.5 pesos/visit. Distance of each city to the Colorado River affects environmental awareness of
citizens and therefore their motivation to pay for water flow restoration.
Additionally, in Mexicali willingness-to-pay is associated with parenthood and perception of
received benefits from the river. I argue that citizens’ perception of benefits is determined by citizens’
exposure to the river because, in many senses, perceptions are an expression of a citizen’s
environmental awareness. Other factors that might count later, once the average willingness-to-pay
for Mexicali is estimated, are income, level of people-river interactions (such as frequency of river
visits), and awareness of dry river conditions. Factors such as level of education, gender, or number
of people per household were not influential on willingness-to-pay.
Overall, I found that present environmental services associated to the Colorado River Delta are
undervalued, and locally underappreciated. Mexicali in particular is a city that has very little contact
with the Colorado River while SLRC still interacts and benefits from the remnant environmental
services associated to the river, such as recreation, its landscape, and shade.
Relevant recommendations derived from this study are that environmental education must
receive emphasis to improve Mexicali citizens’ understanding and appreciation of ecosystem services
associated with the Colorado River. Support and acceptance of future river restoration projects can be
improved by raising people’s environmental awareness as well.
From my observations of negative attitudes towards restoration efforts I conclude that building
transparency is an area for improvement because citizen trust of government institutions is weak. In
65
this study, many citizen opinions reflected negative attitudes towards institutional capacity. The
participation of local or national NGOs should take into account the presence of negative attitudes
towards government actions and build transparent processes that involve the community. Community
participation must also be enhanced and developed. Strategies that raise community awareness of
local environmental issues and integrate the community to solve them could probably be of great
benefit for large ecosystem restoration projects like the delta. Once again, delivering information on
what is happening with the delta’s restoration will be fundamental to gain support and acceptance
from citizens.
Other salient factors that were not discussed here but that did call my attention during my filed
research were the need to improve security to promote future recreational activities in the delta, as the
region is known for drug trafficking and illegal migration trafficking as well. Efforts to promote
activities in this area must consider this large external social driver that should be addressed in the
long term, in order to gain community support for the area under restoration.
Potential research directions for this work will be to analyze the present results of this study
within a socio-psychological model for example. As this study progressed towards its end, I realized
that other research approaches exist to study people’s attitudes with psychological and behavioral
models; such models have allowed researchers to deliver parametric results about citizen attitudes. I
believe that most of the Mexicali survey material can be used to build a psychological model, aside
from the econometric models that this information can already sustain.

66
APPENDIX A –Mexicali (2006)
I. Mexicali survey
NOTE: A copy of SURVEY TYPE 1 is shown below, questions 1 to 29. Afterwards, surveys TYPE 2,3,
and 4 only show the questions with price variations (17-19), for the sake of avoiding repetition.
SURVEY TYPE 1
Interviewer code: ____________________ Colony’s name: _________________________
AGEB#:_______________ Survey #: _________________ Date: ____________________
Participant’s gender: M F
Good morning (afternoon), we are conducting this survey in order to learn about the interest of
Mexicali people on the restoration and conservation of the Colorado River Delta. The answers you
provide us with will help us study how to conserve the environment and its natural resources, your
answers will also help us to better understand how to restore the Delta.
This survey is part of a Master Thesis research at the University of Waterloo, Canada and results will
also be useful for its sponsors: Pronatura A.C., The Sonoran Institute and The National Institute of
Ecology. Your participation is voluntary, anonymous, and confidential. If you decide to participate
you will be helping our project enormously. Thank you!
Survey began at: ___________ (hour)
Section 1: Perceptions and interactions with the Colorado River
1. How long have you been living in the municipalities of Mexicali or San Luis Rio Colorado
(SLRC)? ____________(Years)
2. Have you ever seen or visited the Colorado or Hardy Rivers? Yes No
(If No, go to #8)

67
3. Please, look at the map and point out what sections of these Rivers you have seen or visited before.
a b a & b Other
(If answer was “b”/”Other”, then go to #8)
4. At what of the following degrees you will say that you know the Colorado River? (Check only one
of the following options)
I have seen it a few times but I have never visited the river (go to #8)
I have seen it a few times and I have visited it a few times
I have seen it many times and I have never visit the river (go to #8)
I have seen it many times and I have visited it a few times
I have seen it and visited many times
5. During the last 12 months, how many times have you visited the Colorado River for recreational
purposes? (Not for work) ___________________ (times)
6. During the last 5 years, how many times have you visited the Colorado River for recreational
purposes (2000-06)? (Not for work) _______________ (times)
7. If you do/did visit the river, what type of activities you do/did when you visit the river? (Please
mark all that apply)
Swimming
Fishing
Pick nick
Hike around the river and forest
Hunting
Dirt road motorcycling
Wood gathering
Other, which? _______________________
8. Approximately, how many times, per month, do you cross the bridge set before the SLRC pay-toll
highway? ________________ (Times/month)

68
9. Approximately, how many times, per year, do you cross the bridge set before the SLRC pay-toll
highway? ________________ (Times/year)
Please clarify the participant that “the river that goes underneath the SLRC’s bridge is actually the
Colorado River and that right besides it there is a concrete irrigation channel that has flowing water
all year round”.
10. Have you ever seen the Colorado River dry?
Yes, when was the last time? _____________ (year)
No
I don’t know, I have never paid close attention
In 1997 and 1998 the river carried more water than in any other years, this made that the river
increased its volume and size, to a size bigger than we normally see it in these days.
11. Did you see or hear about those events?
Yes No
Please say if you agree, disagree or do not know what to say about the following affirmations:
12. When the river carries larger flows of water there are environmental improvements along the river
corridor (like in 1997-1998).
Yes No I do not know
13. The scarcity of water in the Colorado river is one of the causes why the totoaba is currently
endangered.
Yes No I do not know
In your opinion,
14. Would you lake to see legal protection for the Colorado River and its willow and cotton wood
forests?
Yes No
69
Show the participants the pictures in the following order: a dry river bed (1996), with a moderate
water level (2004), and a river with abundant water (1997-98). Once they see the pictures, please ask
for their preference.
15. Comparing the pictures of a normal river condition (1996), with the pictures of the restored sites
produced after the larger floods of 1997-1998 and 2004, please select the set of pictures that best
represent the condition in which you would prefer to see the river on a constant basis.
a) 1996 picture (almost dry)
b) 2004 picture (moderate volume)
c) 1997-98 picture (large volumes of water)
Section 2. Willingness to Pay
For the next section it will be important that you have your water bill at hand. We will be glad to wait
for you while you go and find one; it does not matter if it is not the most recent you have, it could be
any water bill of this year.
16. What was the water consumption charged in your water bill?
Consumption in m3 = ____________
Consumption in $ = ____________ (just monthly consumption, no late charges)
Right now there are some projects to restore a constant minimum water flow for the Colorado River,
nevertheless these project need funding. In order to achieve restoration goals, many sources of
funding will be required. Potential funding sources would be households of the cities that lay within
the Mexican Colorado delta, like Mexicali and SLRC households. Other funding sources could be
federal and International funds.
The vision for the Colorado River restoration seeks to benefit the environment, so that any water put
back in the river will not be dedicated to direct human consumption or agriculture. Taking that vision
in consideration, now we introduced you to different scenarios for you to choose from.
17. If you could vote for one of the following options, which one would you select?
a. That there was a guaranteed constant river flow (at least moderate), all year around; even if I
have to pay $20 pesos extra in each water bill.
b. That all stay the same as today; that the river flow depends on its own sake and that my water
bill is not affected with extra-charges. (Go to # 19)

70
18. If the extra charge on you receipt rose by $30 pesos instead of $20, would you keep your vote the
same?
Yes, I would continue voting in favor (go to #21)
No, I would change my vote and vote against paying more (Go to #21)
19. If the water bill charges rose for only $10 pesos instead of $20, would you change your vote?
Yes, I would change my vote in favor (go to #22)
No, my vote would stay the same
If your answered No, why did you say No? ___________________________ (Go to #23)
Now, please make note of the first three responses of the participant, when possible, classify each
answer into one of the following categories. If the answer does not fit any of the categories, just write
down the answer.
20. Could you please tell us, why did you answer (at least once) that you will be in favor to see a
constant restored river flow in the Colorado?
Recognition of its ecological importance
Recognition of its esthetic values
Recognition of its economic potential and values
Ethical values: to improve the environment for the wellbeing of all
To protect an important element of the regional identity
For the future generations
Other reasons; please specify: _________________
21. In its current conditions, what type of services and benefits does the Colorado river already
provides to: (list at least one for each)
a) you or your family?: ____________________________________________________
b) the region?: ___________________________________________________________
22. Would you consider the Colorado/Hardy river as an option for recreation in the future?
Yes No

71
A restored river would have a great ecological and use potential. If the Colorado river was turned into
a site for the recreation for the Mexicali families, then…
23. How much would you be willing to spend with your family/friends in a visit to the Colorado
River? Please consider your personal expenses in food, and services like bathroom use or equipment
rental. Exclude gas expenses. Expenses will be in pesos/person/day
$100-$200 $200-$300 $300-$400 $400-$500
Other amount $: _________ (pesos/person/day)
24. What would you change in the river or its promotion in order for you and others to visit it more
often?_________________________________________________________________
Section 3. Personal and household information
25. Place and year of birth: _________________________________
26. Number of people in your house: # Adults __________ # Children _________
27. What is the maximum academic grade accomplished by the head of this house (father or mother)?
No studies or unfinished elementary school
Completed elementary school
Completed secondary school
Completed high school
Completed technical school
Completed College
Postgraduate studies
28. Do you belong to any environmentalist group?
Yes, which one? _____________ No
The following information is important for this study. Please take a few minutes to answer on your
own. Please remember that your answer is voluntary, that it will be strictly confidential and that it will
be well secured. For your safety the interviewer will give you an empty envelope, please double

72
check that it has no marks and once you finish fold the survey, seal the envelope and deposit it in the
box we use to collect all surveys.
29. Approximately, what is the monthly total income in your household? (Please add up all the
salaries of the people that live in this house and that contribute to pay for the family’s expenses)
Total income of this household is = $ ________________ (pesos/month)
Survey ended at: _______________ (hour)
Thanks for your participation and have a nice day!
(close the envelope and deposit it in the box).
SURVEY TYPE 2
17. If you could vote for one of the following options, which one would you select?
a. That there was a guaranteed constant river flow (at least moderate), all year around; even if I
have to pay $40 pesos extra in each water bill.
b. That all stay the same as today; that the river flow depends on its own sake and that my water
bill is not affected with extra-charges. (Go to # 19)
18. If the charge on you receipt rose by $50 pesos instead of $40, would you keep voting the same?
Yes, I would continue voting in favor (Go to #21)
No, I would change my vote and vote against paying more (Go to #21)
19. If the water bill charges rose for only $30 pesos instead of $40, would you change your vote?
Yes, I would change my vote in favor (Go to #22)
No, my vote would stay the same
If your answered No, why did you say No? ___________________________ (Go to #23)
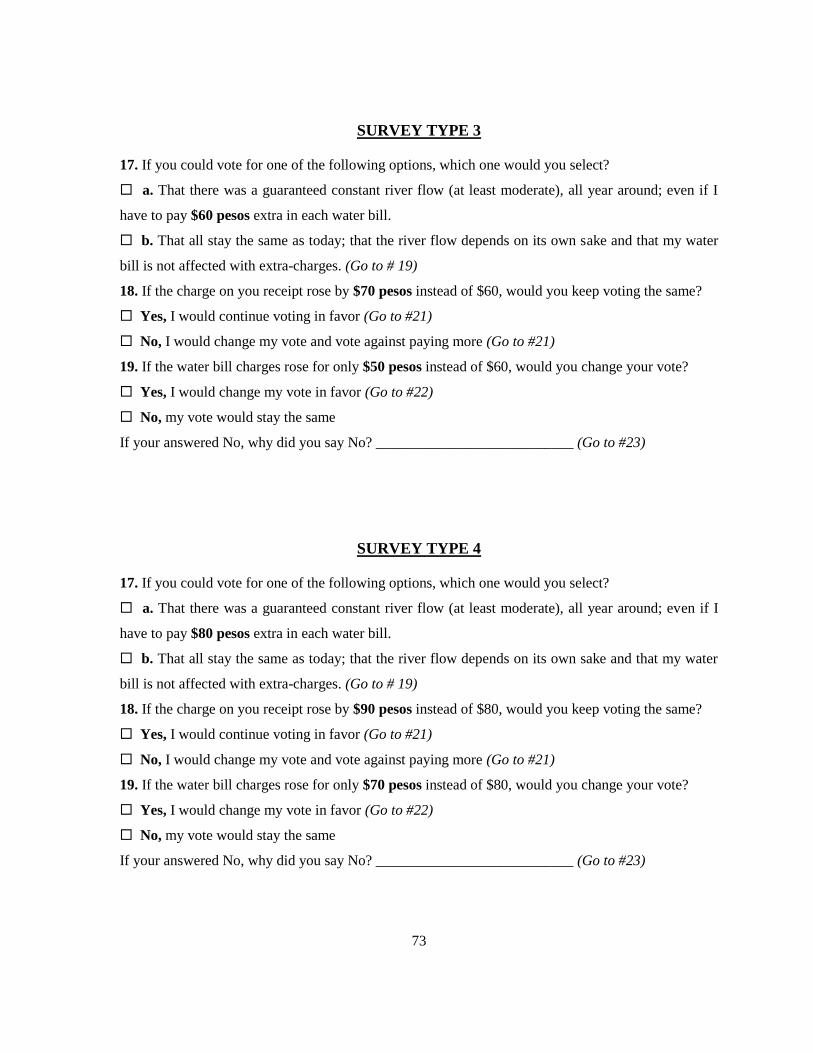
73
SURVEY TYPE 3
17. If you could vote for one of the following options, which one would you select?
a. That there was a guaranteed constant river flow (at least moderate), all year around; even if I
have to pay $60 pesos extra in each water bill.
b. That all stay the same as today; that the river flow depends on its own sake and that my water
bill is not affected with extra-charges. (Go to # 19)
18. If the charge on you receipt rose by $70 pesos instead of $60, would you keep voting the same?
Yes, I would continue voting in favor (Go to #21)
No, I would change my vote and vote against paying more (Go to #21)
19. If the water bill charges rose for only $50 pesos instead of $60, would you change your vote?
Yes, I would change my vote in favor (Go to #22)
No, my vote would stay the same
If your answered No, why did you say No? ___________________________ (Go to #23)
SURVEY TYPE 4
17. If you could vote for one of the following options, which one would you select?
a. That there was a guaranteed constant river flow (at least moderate), all year around; even if I
have to pay $80 pesos extra in each water bill.
b. That all stay the same as today; that the river flow depends on its own sake and that my water
bill is not affected with extra-charges. (Go to # 19)
18. If the charge on you receipt rose by $90 pesos instead of $80, would you keep voting the same?
Yes, I would continue voting in favor (Go to #21)
No, I would change my vote and vote against paying more (Go to #21)
19. If the water bill charges rose for only $70 pesos instead of $80, would you change your vote?
Yes, I would change my vote in favor (Go to #22)
No, my vote would stay the same
If your answered No, why did you say No? ___________________________ (Go to #23)

74
II. Mexicali survey field materials: map and pictures
Map 1. Regional map presented to survey participants in Question 3. Fine details were not provided
on this map in order to distinguish between visits to the Colorado River and to the Hardy River.
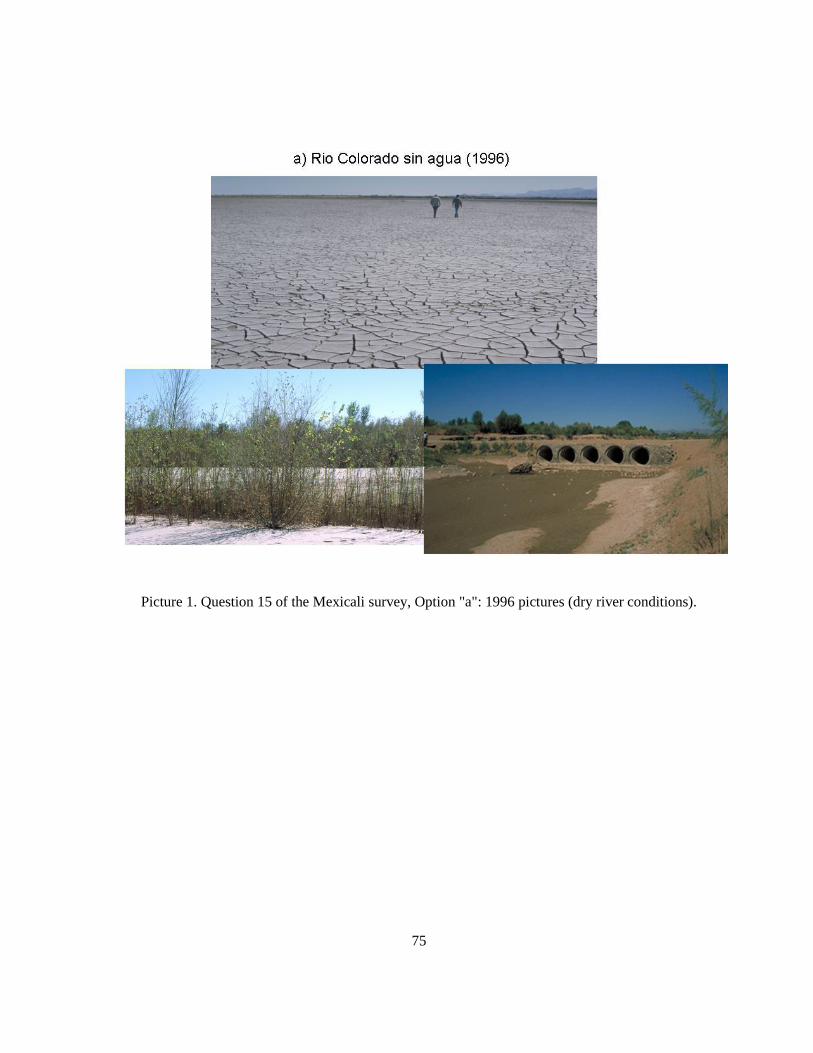
75
Picture 1. Question 15 of the Mexicali survey, Option "a": 1996 pictures (dry river conditions).

76
b)
Picture 2. Question 15 of the Mexicali survey, Option "b": 2004 pictures (moderated river flow).

77
c)
Picture 3. Question 15 of the Mexicali survey, Option "c": 1997-1998 pictures (abundant river flow).

78
III. Mexicali contingency tables and Pearson Chi-square results
Appendix A-Table 1. Contingency table of "People who have seen or visited the Colorado and Hardy
Rivers vs. Willingness-to-pay Offer1."
Q17-Q2
Willingness-to-pay
Offer1 (20,40,60,80)
Total Yes No
People who have seen
or visited the CR or
HR
Yes 193 226 419
No 59 86 145
Total 252 312 564
Chi-square = 1.26 df = 1 p-value = 0.150
Appendix A-Table 2. Contingency table of "Degree of interaction vs. Willingness-to-pay Offer1."
Q17-Q4
Willingness-to-pay
Offer1 (20,40,60,80)
Total Yes No
Degree of
people-river
interactions
Seen a little/Never
visited 94 89 183
Seen a little/ Visited a
little 38 48 86
Seen many times/ Never
visited 9 24 33
Seen many times/
Visited a little 10 6 16
Seen a lot/ Visited a lot 13 15 28
Total 164 182 346
Chi-square = 8.35 df = 4 p-value = 0.080
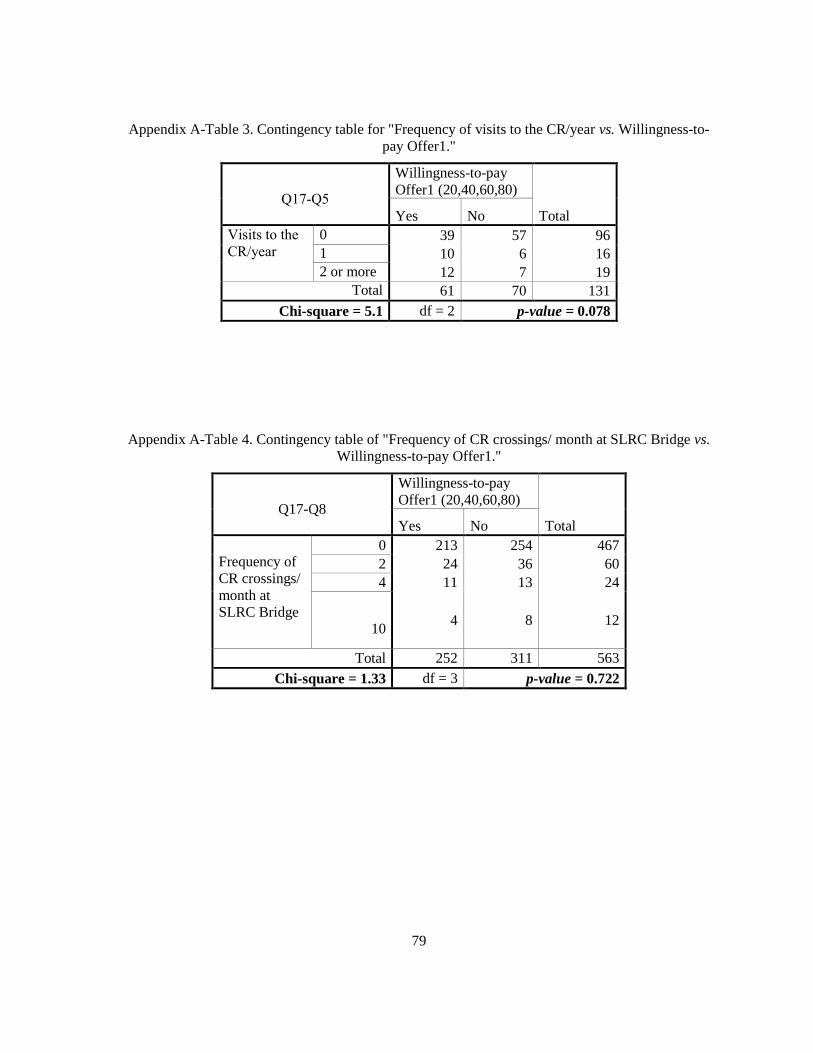
79
Appendix A-Table 3. Contingency table for "Frequency of visits to the CR/year vs. Willingness-to-
pay Offer1."
Q17-Q5
Willingness-to-pay
Offer1 (20,40,60,80)
Total Yes No
Visits to the
CR/year
0 39 57 96
1 10 6 16
2 or more 12 7 19
Total 61 70 131
Chi-square = 5.1 df = 2 p-value = 0.078
Appendix A-Table 4. Contingency table of "Frequency of CR crossings/ month at SLRC Bridge vs.
Willingness-to-pay Offer1."
Q17-Q8
Willingness-to-pay
Offer1 (20,40,60,80)
Total Yes No
Frequency of
CR crossings/
month at
SLRC Bridge
0 213 254 467
2 24 36 60
4 11 13 24
10 4 8 12
Total 252 311 563
Chi-square = 1.33 df = 3 p-value = 0.722

80
Appendix A-Table 5. Contingency table of "Awareness of dry river conditions vs. Willingness-to-pay
Offer1.‖
Q17-Q10
Willingness-to-pay
Offer1 (20,40,60,80)
Total Yes No
Awareness of
dry river
conditions
Yes 125 162 287
No 104 106 210
I don't
know 23 44 67
Total 252 312 564
Chi-square = 5.05 df = 2 p-value = 0.080
Appendix A-Table 6. Contingency tables of "Support of CR's legal protection vs. Willingness-to-pay
Offer1."
Q17-Q14
Willingness-to-pay
Offer1 (20,40,60,80)
Total Yes No
Support of
CR’s legal
protection
Yes 247 304 551
No 2 4 6
Total 249 308 557
Chi-square= 0.32 df = 1 p-value = 0.570
Appendix A-Table 7. Contingency table of "Perceived personal benefits from the CR vs. Willingness-
to-pay Offer1."
Q17-Q21a
Willingness to pay
Offer1 (20,40,60,80)
Total Yes No
Perceived personal
benefits from the
Colorado River
YES 127 104 231
NO 123 206 329
Total 250 310 560
Chi-square = 17 df = 1 p-value < 0.001

81
Appendix A-Table 8. Contingency table of "Presence of kids in households vs. Willingness-to-pay
Offer1"
Q17-Q26
Willingness to pay
Offer1 (20,40,60,80)
Total Yes No
Presence of
kids in
households
Yes 175 187 362
No 76 125 201
Total 251 312 563
Chi-square= 5.8 df = 1 p-value = 0.016
Appendix A-Table 9. Contingency table of "Level of education vs. Willingness-to-pay Offer1."
Q17-Q27
Willingness-to-pay
Offer1 (20,40,60,80)
Total Yes No
Level of
education * Finished
Unfinished
element. school 33 47 80
Elementary * 37 63 100
Secondary * 77 81 158
High School * 76 72 148
College * 27 41 68
Post graduate 1 5 6
Total 251 309 560
Chi-square = 9.06 df = 5 p-value = 0.107

82
Appendix A-Table 10. Contingency table of "Total annual income vs. Willingness-to-pay Offer1".
Q17-Q29
Willingness to pay
Offer1 (20,40,60,80)
Total Yes No
Ranks of
total annual
income/
household (in pesos)
20,000 5 13 18
20,001- 40,000 25 38 63
40,001- 60,000 48 73 121
60,001- 80,000 24 38 62
80,001- 100,000 45 31 76
100,001-140,000 36 51 87
140,001- 200,000 38 41 79
Up to 432,000 20 18 38
Total 241 303 544
Chi-square = 13.05 df = 7 p-value = 0.071
Appendix A-Table 11. Contingent table of "Perceived personal benefits form the CR vs. Willingness-
to-pay for potential services."
Q23-Q21a
Willingness-to-pay
for potential
services(recreation)
Total YES NO
Perceived
personal
benefits from
the CR
50 pesos 6 10 16
50-100 pesos 78 166 244
100-200 pesos 87 74 161
200-300 pesos 39 40 79
> 300 pesos 19 33 52
Total 229 323 552
Chi-square = 22.2 df = 4 p-value < 0.001
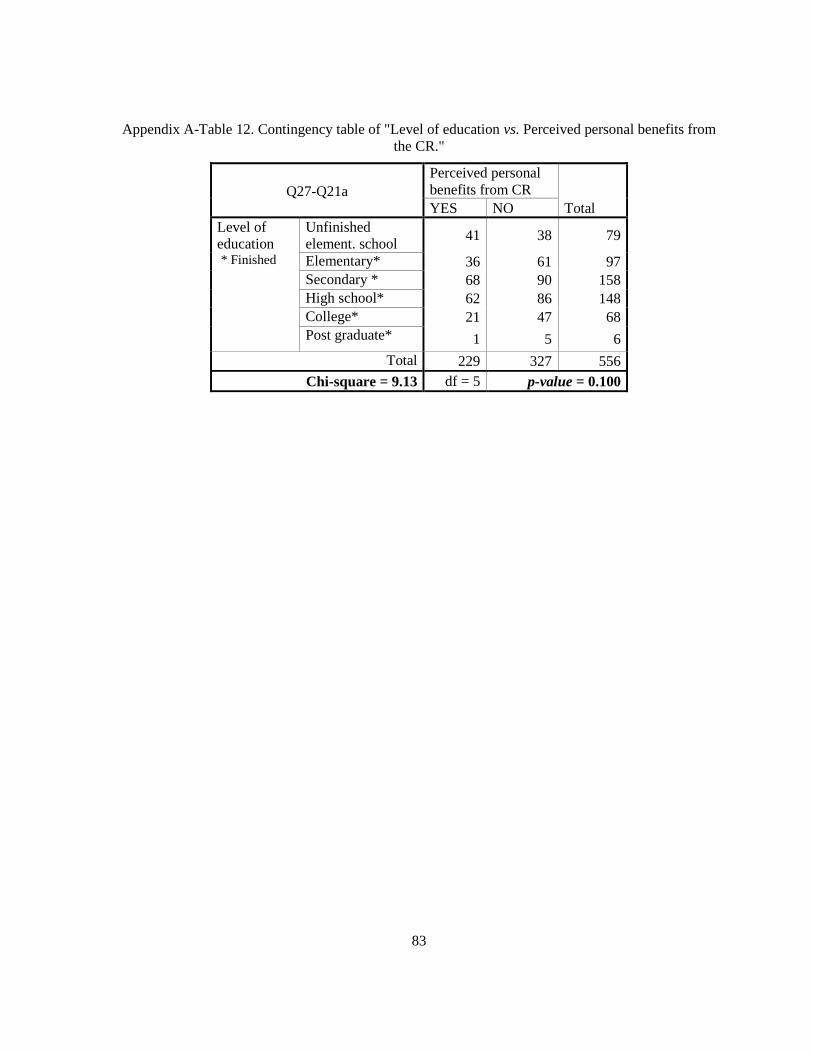
83
Appendix A-Table 12. Contingency table of "Level of education vs. Perceived personal benefits from
the CR."
Q27-Q21a
Perceived personal
benefits from CR
Total YES NO
Level of
education * Finished
Unfinished
element. school 41 38 79
Elementary* 36 61 97
Secondary * 68 90 158
High school* 62 86 148
College* 21 47 68
Post graduate* 1 5 6
Total 229 327 556
Chi-square = 9.13 df = 5 p-value = 0.100

84
APPENDIX B –SLRC (2005)
I. Tables of results from the SLRC survey done by INE and PRONATURA (2005).
Appendix B-Table 1. SLRC willingness-to-pay (Carrillo-Guerrero, 2005).
Offer1: "YES" (Q12) Offer2: Yes and No (Q13)
Price #Surveys #YES (%) Price #Yes (%) #No (%)
$20 76 71 (93%) $30 70 (92%) 1 (1%)
$40 75 68 (91%) $50 66 (88%) 2 (2.6%)
$60 76 53 (70%) $70 53 (70%) 0
$80 75 21 (28%) $90 20 (27%) 1 (1%)
Total=302 213 (70.5%) 209 (69.2%) 4 (1.3%)
Appendix B-Table 2. SLRC willingness-to-pay (Carrillo-Guerrero, 2005).
Offer1: "NO" (Q17) Offer3: Yes and No (Q14)
Price #Surveys #NO (%) Price #Yes (%) #No (%)
$20 76 5 (7%) $10 1 (1%) 4 (5.3%)
$40 75 7 (9%) $30 3 (4%) 4 (5.3%)
$60 76 23 (30%) $50 4 (5%) 19 (25%)
$80 75 54 (72%) $70 2 (2.6%) 52 (69.3%)
Total=302 89 (29.5%) 10 (3.3%) 79 (26.15%)
85
Bibliography
Appleton, B. (1994). Navigating NAFTA, A Concise User’s Guide to the North America Free Trade
Agreement. Carswell Publishing, Scarborough, Ontario.
Arias, E., M. Albar, M. Becerra, A. Boone, D. Chia, J. Gao, C. Munoz, I. Parra, M. Reza, J. Sainz,
and A. Vargas. (2004). Gulf of California/Colorado River Basin. GIWA Regional Assessment 27.
UNEP. University of Kalmar, Kalmar, Sweden.
Arrow, K., R. Solow, P. R. Portney, E. E. Leamer., R. Radner., and H. Schuman. (1993). Report of
the NOAA Panel on Contingent Valuation. Federal Register 58: 4601-4614.
Biodiversity in Development Project. (2001). Strategic Approach for Integrating Biodiversity in
Development Cooperation. European Commission, Brussels, Belgum/IUCN, Gland, Switzerland
and Cambridge, UK.X.
Blamey, R., J. W. Bennett, and M. D. Morrison (1999). Yes-Saying in Contingent Valuation Surveys.
Land Economics 75: 126-141.
Bright, A. D., S. C. Barro, and R. T. Burtz. (2002). Public Attitudes Toward Ecological Restoration in
the Chicago Metropolitan Region. Society & Natural Resources, 15(9): 763-785.
Brunson, M. W., and B. S. Steel. (1996). Sources of Variation in Attitudes and Beliefs about Federal
Rangeland Management. Journal of Rangeland Management No. 49: 69-75.
Brunson, M. W., and B. A. Shindler. (2004). Geographic Variation in Social Acceptability of Wild
Land Fuels Management in the Western United States. Society & Natural Resources, 17(8): 661-
678.
Buckingham, A. D., and P. Saunders. (2004). Survey Methods Workbook: From Design to Analysis.
Cambridge, UK ; Malden, MA: Polity.
Burnett, E., E. Kandl, and F. Croxen. (1993). Cienega de Santa Clara: Geologic and Hydrologic
Comments. U.S. Bureau of Reclamation, Yuma Projects Office, Yuma, Arizona.
Burton, M. L., and M. J. Hicks. (2005). Hurricane Katrina: Preliminary Estimate of Commercial and
Public Sector Damages. Center for Business and Economic Research. Marshall University.
Huntington, WV.
Carrillo-Guerrero, Y. (2002). Wetland Restoration in Private and Ejido Land in the Colorado River
Delta Mexico. School of Renewable Natural Resources. University of Arizona.
86
Carrillo-Guerrero, Y. (2005). Estudio Estadistico y Levantamiento de Encuestas Sobre el Valor de
Existencia de los Flujos de Agua en el Rio Colorado. Reporte no publicado de PRONATURA
Noroeste al Instituto Nacional de Ecologia. Mexico.
Carson, R. T., and R. C. Mitchell. (1993). The Value of Clean Water: The public’s Willingness-to-
Pay for Boatable, Fishable, and Swimmable Quality Water. Water Resources Research, 29(7):
2445-2454.
Carson, R. T. (2000). Contingent Valuation: A User's Guide. Environmental science & technology,
34(8): 1413-1418.
Carson, R. T., N. E. Flores, and N.F. Meade. (2001). Contingent Valuation: Controversies and
Evidence. Environmental & Resource Economics, 19(2): 173-210.
Carson, R. T., R. C. Mitchell, M. Hanemann, R. J. Kopp, S. Presser, and P. A. Ruud. (2003).
Contingent Valuation and Lost Passive Use: Damages from the Exxon Valdez Oil Spill.
Environmental & Resource Economics, 25(3): 257-286.
Cohen, M. J., C. Henges-Jeck, and G. Castillo-Moreno. (2001). A Preliminary Water Balance for the
Colorado River Delta, 1992-1998. Journal of Arid Environments, 49(1): 35-48.
Cohen, M. (2002). Managing Across Boundaries: The Case of the Colorado River Delta. In The
World’s Water: The Biennial Report on Freshwater Resources 2002-2003. Edited by Gleick, P.
Island Press, Washington, D.C.
Comisión Nacional de Áreas Naturales Protegidas (CONANP), Gobierno Federal de México.
Electronic access: http://www.conanp.gob.mx/anp/rb.php
Costanza, R., R. d’Arge, R, de Groot, S. Farber, M. Grasso, B. Hannon, K. Limburg, S. Naeem, R. V.
O’Neill, J. Paruelo, R.G. Raskin, P. Sutton, and M. Van den Belt. (1997). The value of the world's
ecosystem services and natural capital. Nature, 387(6630), 253-260.
Ehrenfeld, J. G. (2000). Defining the limits of restoration: The need for realistic goals. Restoration
Ecology, 8(1), 2-9.
Fishbein, M., and I. Ajzen. (1975). Belief, Attitude, Intention and Behavior: An Introduction to
Theory and Research. Reading, MA: Addison-Wesley.
Fradkin, P. (1981). A River No More: The Colorado River and the West. Alfred A. Knopf, New York.

87
Fredrickson, I. H., and F A. Reid. (1990). Impact of Hydrologic Alteration on Management of
Freshwater Wetlands. In J.M. Sweeny editor. Management of Dynamic Ecosystems. The Wildlife
Society, West Lafayette, Indiana.
Galindo-Bect, M., E. P. Glenn, H. Page, K. Fitzsimmons, L. Galindo-Bect, J. Hernandez-Ayon, R.
Petty, J. Garcia-Hernandez, and D. Moore. (2000). Analysis of Penaeid shrimp landings in the
upper Gulf of California in relation to Colorado River freshwater discharge. Fishery Bulletin, Vol.
98: 222-225.
Glenn, E., R. S. Felger, A. Burquez, and D.S. Turner. (1992). Cienega de Santa Clara: Endangered
wetland in the Colorado River delta, Sonora, Mexico. Natural Resource Journal, Vol. 32: 817-824.
Glenn, E. P., C. Lee, R. Felger, and S. Zengel. (1996). Effects of Water Management on the
Wetlands of the Colorado rRver Delta, Mexico. Conservation Biology, 10(4): 1175-1186.
Glenn, E. P. (1998). Impacts of water flows from the united states. Tucson, Arizona: Defenders of
Wildlife and Southwest Center for Biological Diversity.
Glenn, E. P., J. Garcia-Hernandez, R. Tanner, C. Congdon, and D. Luecke. (1999). Status of wetlands
supported by agricultural drainage water in the Colorado River Delta, Mexico. HortScience, 34(1):
39-45.
Glenn, E. P., F. Zamora-Arroyo, P.L. Nagler, M. Briggs, W. Shaw, and K. Flessa. (2001). Ecology
and Conservation Biology of the Colorado River Delta, Mexico. Journal of Arid Environments,
49(1): 5-15.
Harding, B.L., T.B. Sangoyomi, and E.A. Payton. (1995). Impacts of a Severe Sustained Drought on
Colorado River Water Resources. Water Resources Bulletin, Vol. 31: 815-824.
Hernandez-Ayon, J., M. Galindo-Bect, B. Flores-Baez, and S. Alvarez-Borrego. (1993). Nutrient
Concentrations are High in the Turbid Waters of the Colorado River Delta. Estuaries, Coastal,
and Shelf Science. 37: 593-602.
Holburt, M.B. (1982). International Problems on the Colorado River. Water Supply and Management
6: 105-124.
Holburt, M.B. (1984). The 1983 high flows on the Colorado River and their aftermath. Water
International 9: 99-105.

88
Hyun, K. (2005). Transboundary Solutions to Environmental Problems in the Gulf of California
Large Marine Ecosystem. Coastal Management, 33(4), 435-445.
INEGI. XII Censo General de Poblacion y Vivienda, CONTAR 2000. Gobierno de Mexico.
Kideghesho, J. R., E. Roskaft, and B. P. Kaltenborn. (2007). Factors Influencing Conservation
Attitudes of Local People in Western Serengeti, Tanzania. Biodiversity and Conservation, 16(7):
2213-2230.
Kowalewski, M., G. Avila-Serrano, K. Flessa, and G. Goodfriend. (2000). Dead Delta’s Former
Productivity: Two Trillion Shells at the Mouth of the Colorado River. Geology, Vol. 28: 1,059-
1,062.
Leopold, A. (1948). A Sand County Almanac: With Other Essays on Conservation from Round River.
Oxford University Press, New York.
Luecke, D.F., J. Pitt, C. Congdon, E. P. Glenn, C. Valdez-Casillas, and M. Briggs. (1999). A Delta
Once More: Restoring Riparian and Wetland Habitat in the Colorado River Delta. Environmental
Defense Publications, Washington D.C.
McConnell, K. E. (1997). Does altruism undermine existence value? Journal of Environmental
Economics and Management, 32(1): 22-37.
McDougal, D.T. (1904). Delta and Delta Vegetation. Botanical Gazette 38: 44-63.
Meko, D., C. W. Stockton, and W. R. Bogges. (1995). The Three-ring Record of Severe Sustained
Drought. Water Resources Bulletin, Vol. 31, No. 5: 789-801.
Menegaki, A. N., N. Hanley, and K. P. Tsagarakis. (2007). The Social Acceptability and Valuation of
Recycled Water in Crete: A study of Consumers' and Farmers' Attitudes. Ecological Economics,
62(1): 7-18.
Miller, T. G. (1998). Living in the Environment: Principles, Conflicts, and Solutions. Wadsworth
Pub. 10th.Ed. USA.
Milon, W. J., and D. Scrogin. (2006). Latent Preferences and Valuation of Wetland Ecosystem
Restoration. Ecological Economics 56: 162-175.
Nijhuis, M., and J. Trotter. (2005). The Accidental Wetland: A plumbing Mistake Fills a Mexican
Desert with Water, Wildlife, and Irony. Orion, Vol. 24, No. 2: 24-35.

89
Ohmart, R.D., B.W. Anderson, and W.C. Hunter. (1988). The Ecology of the Lower Colorado River
from Davis Dam to the Mexico-United States International Boundary: A Community Profile. U.S.
Fish and Wildlife Service Biological Report 85 (7.19).
Owen-Joyce, S.J., and L.H. Rymond. (1996). An Accounting System for Water and Consumptive Use
Along the Colorado River, Hoover Dam to Mexico. U.S. Geological Survey Water-Supply Paper
2407. Denver, Colorado.
Payne, J.M., F.A. Reid, and E. C. Gonzalez. (1992). Feasibility Study for the Possible Enhancement
of the Colorado Delta Wetlands, Baja California Norte, México. Report to ducks Unlimited, Inc.,
and Ducks Unlimited de México, Sacramento, California.
Perez, B. D. (1981). Ordenamiento Ecologico del Valle de Mexicali, B.C. Tesis Profesional, Facultad
de Ciencias, U.N.A.M.
Pitt, J. (2001). Can we restore the Colorado River delta? Journal of Arid Environments, 49(1): 211-
220.
Pontius, D. (1997). Colorado River Basin Study. Final Report to the Western Water Policy Review
Advisory Commission.
Pouta, E., and M. Rekola. (2001). The Theory of Planned Behavior in Predicting Willingness-to-Pay
for Abatement of Forest Regeneration. Society & Natural Resources, 14(2): 93-106.
Rhodes, S.L., D. Ely, and J. A. Dracup. (1984). Climate and the Colorado River: the Limits of
Management. Bulletin of the American Meteorological Society 65: 682-691.
Rosenberg, R.S., G.L. Peterson, A. Clarke, T. C. Brown. (2003). Measuring Disposition for
Lexicographic Preferences of Environmental Goods: Integrating Economics, Psychology and
Ethics. Ecological Economics 44(1): 63-76.
Sanchez-Lopez, E. (2000). Agriculture in Our Binational Region. California Center for Border and
Regional Economic Studies. Characteristics of our Binational Region: A Series of Discussion
Workshop Led by a Binational Panel of Regional Experts.
Sanjurjo-Rivera E., and Carrillo-Guerrero Y. (2006a). Beneficios Economicos de los Flujos de Agua
en el Delta del Rio Colorado: Consideraciones y Recomendaciones Iniciales. Instituto Nacional de
Ecologia. Mexico. Gaceta Ecologica No. 80: 51-62.

90
Sanjurjo-Rivera E., and Carrillo-Guerrero Y. (2006b). Valoracion Economica de la Actividad
Recreativa en el Rio Colorado. No impreso, reporte interno al Instituto Nacional de Ecologia.
Mexico. 18 pp.
Spamer, E.E. (1990). Bibliography of the Grand Canyon and Lower Colorado River from 1540.
Publication of the Grand Canyon Natural History Association, Grand Canyon, Arizona.
Spash, C. L. (2000). Multiple Value Expression in Contingent Valuation: Economics and Ethics.
Environmental science & technology, 34(8): 1433-1438.
Stanley, D. J. and A. G. Warne. (1993). Nile Delta: Recent Geological Evolution and Human Impact.
Science 260: 628-634.
Sykes, G. (1937). The Colorado Delta. Kenniat Press. Port Washington, N.Y.
Thompson, R.W. (1968). Tidal Flat Sedimentation on the Colorado River Delta, Northwestern Gulf
of California. Geological Society of America Memoir, 107-133 pp.
Transboundary Freshwater Dispute Database (TFDD). 2002. Available electronically at:
http://www.transboundarywaters.orst.edu/publications/register/tables/IRB_table_4.html
Varady, R. G., K. B. Hankins, A. Kaus, E. Young, and R. Merideth. (2001). …to the sea of Cortes:
Nature, Water, Culture, and Livelihood in the Lower Colorado River Basin and Delta—An
Overview of Issues, Policies, and Approaches to Environmental Restoration. Journal of Arid
Environments, 49(1): 195-209.
Ward, E. R. (2003). Border Oasis: Water and Political Ecology of the Colorado River Delta, 1940-
1975. Tuxon, Arizona: University of Arizona Press. 208 pp.
Whitehead, J. C. (2005). Combining Willingness-to-Pay and Behavior Data with Limited
Information. Resource and Energy Economics, 27(2): 143-155.
Williams, A. Alvarez de. (1983). ―Cucapa‖ in A. Ortiz, ed. Handbook of North American Indians.
Smithsonian Institution Press. Vol. X: 99-113.
Yin, R.K. (2003). Case Study Research: Design and Methods. Thousand Oaks, California. Third
Edition. Sage Publications. 181 pp.
Zamora-Arroyo, F., P. L. Nagler, M. Briggs, D. Radtke, H. Rodriquez, J. Garcia-Hernandez, C.
Valdez-Casillas, A. Huete, E. P. Glenn. (2001). Regeneration of Native Trees in Response to

91
Flood Releases from the United States into the Delta of the Colorado River, Mexico. Journal of
Arid Environments, 49(1): 163-171.
Zamora-Arroyo, F., J. Pitt, S. Cornelius, E. P. Glenn, O. Hinojosa-Huerta, M. Moreno, J. Garcia-
Hernandez, P. Nagler, M. De la Garza, and I. Parra. (2005). Conservation Priorities in the
Colorado River Delta, Mexico and the United States. Prepared by the Sonoran Institute,
Environmental Defense, University of Arizona, Pronatura Noroeste Direccion de la Conservacion
Sonora, Centro de Investigacion en Alimentacion y Desarrollo, and World Wildlife Fund –Gulf of
California Program.