central asia expanding trade by connecting with...
TRANSCRIPT
Report No. 53556-ECA
Central Asia
Expanding Trade by Connecting with Markets
Kazakhstan, Kyrgyz Republic, Tajikistan
June 21, 2010
Poverty Reduction and Economic Management Unit
Europe and Central Asia Region
Document of the World Bank

Currency Equivalents
Currency Unit = Sum
USD 1 = T 150
USD 1 = SOM 37
USD 1 = SM 3
Weights & Measures
Metric System
Abbreviations and Acronyms
BEEPS Business Environment and Enterprise Performance Survey
CAREC Central Asia Regional Economic Cooperation
CIS Commonwealth of Independent States
EU European Union
GDP gross domestic product
HACCP hazard analysis critical control point
ICT information and communication technology
km kilometer
SPECA United Nations Special Program for Economies in Central Asia
WTO World Trade Organization
Vice President : Philippe Le Houerou
Country Director : Motoo Konishi
Sector Director : Luca Barbone
Sector Manager : Kazi Matin
Task Leader : Souleymane Coulibaly

CONTENTS
1. The Need for Central Asian Countries to Diversify Their Trade ................................... 8
Recent Export Performance .......................................................................................... 9
Diversification Potential ............................................................................................. 14
2. The Constraints Facing Central Asian Leading Cities .................................................. 21
The Constraints to Production Capacity within Countries ......................................... 21
The Constraints to Market Accessibility across Countries ......................................... 34
3. Why Agglomeration is Important: Potential of Leading Cities as Drivers of
Diversification................................................................................................................... 45
The Competitive Advantage of Leading Cities .......................................................... 46
The Need for an Explicit Space-Based Export Diversification .................................. 57
Mainstreaming Space-Based Economic Policies ........................................................ 63
4. The ―How to‖ of Expanding Trade in Central Asia ..................................................... 67
A Framework for a City-Led Diversification Strategy ............................................... 67
How to Promote Economic Density in Leading Cities ............................................... 70
How to Improve Leading Cities‘ Connections with their Agricultural Hinterlands ... 70
How to Secure Accessibility to Key Regional Markets .............................................. 71
References ......................................................................................................................... 81
Tables
Table 1. Summary of Policy Actions to be Considered ...................................................... ii
Table 1.1. Trade Structure, Central Asia and Southeast Europe, 2003 and 2008 ............. 10
Table 1.2. Complementarity Gap between Kazakhstan, the Kyrgyz Republic, and
Tajikistan and Major Regional Markets, 2008 ......................................................... 16
Table 2.1. Access to Selected Backbone Services in Leading Cities of Kazakhstan, the
Kyrgyz Republic, and Tajikistan, and in Europe and Central Asia, 2008 and 2009 . 23
Table 2.2. ICT Performance in Kazakhstan, the Kyrgyz Republic, and Tajikistan, 2007 24
Table 2.3. International Bazaars, Selected Cities, 2008 ................................................... 26
Table 2.4. Storage Capacity, Leading Cities and Their Hinterlands, Kyrgyz Republic,
2008 ........................................................................................................................... 29
Table 2.5. Storage Facilities, Sughd Region Districts, Tajikistan, 2006 .......................... 30
Table 2.6. External Business Environment Constraints, Kazakhstan, the Kyrgyz Republic,
Tajikistan, and Europe and Central Asia ................................................................... 32
Table 2.7. Main Business Environment Constraints Facing Distribution and Transport
Service Firms, Leading Cities of Kazakhstan, the Kyrgyz Republic, and Tajikistan,
2009 ........................................................................................................................... 33
Table 2.8. Domestic Freight Rates, Tajikistan, 2009 ........................................................ 34
Table 2.9. Truck Cargo between Tajikistan and Selected Destinations, 2007 and 2008 .. 37
Table 2.10. Average Carriage Costs to Selected Destinations by way of Almaty,
Kazakhstan, 2009....................................................................................................... 41
Table 2.11. Cost of Air Freight from Almaty to Selected Destinations, 2009 ................. 42
Table 2.12. Haulage Rates and Times for a 86-Square Meter, 19-Ton Truck from Almaty
to Selected Destinations............................................................................................. 43
Table 3.1. Top 10 Products Produced in Kazakhstan's Three Leading Cities, 2007 ........ 48
Table 3.2. International Flights from Almaty, 2009 ......................................................... 53
Table 3.3. Agricultural Production, Bishkek and Its Hinterland, Kyrgyz Republic, 2008 58
Table 3.4. Agricultural Production, Osh and Its Hinterland, Kyrgyz Republic, 2008 ...... 59
Table 3.5. Main Manufactured Products Produced in Osh, 2008 ..................................... 60
Table 3.6. Main Manufactured Production in Bishkek, 2008 ........................................... 60
Figures
Figure 1.1. Destination of Nonnatural-Resource-Intensive Exports from the Central
Asian Countries, 2003 and 2007................................................................................ 11
Figure 1.2. Sources of Export Growth, Nonnatural-Resource-Intensive Products,
Kazakhstan, the Kyrgyz Republic, and Tajikistan, 2003-08 ..................................... 13
Figure 1.3. Average Trade Complementarity with Leading Regional Markets,
Kazakhstan, the Kyrgyz Republic, and Tajikistan, 2002–04 and 2005–08 ............... 15
Figure 1.4. The North-South Road Corridor Linking the Six Leading Cities .................. 20
Figure 2.1. The Kyrgyz Republic‘s Direct Connections to China .................................... 36
Figure 3.1. Standardized Herfindahl Index by Oblasts for Kazakhstan, the Kyrgyz
Republic, and Tajikistan, Various Years ................................................................... 47
Figure 3.2. Market Accessibility in Kazakhstan ............................................................... 50
Figure 3.3. Market Accessibility in the Kyrgyz Republic ................................................ 50
Figure 3.4. Market Accessibility in Tajikistan.................................................................. 51
Figure 3.5. Travel Time to Leading Cities of Kazakhstan, the Kyrgyz Republic, and
Tajikistan ................................................................................................................... 55
Figure 3.6. Travel Time to Leading Cities of Kazakhstan, the Kyrgyz Republic, and
Tajikistan ................................................................................................................... 56
Figure 3.7. Spatial Interaction between Bishkek and Osh and Their Surroundings ......... 58
Boxes
Box 1.1. The Thai Experience of Agriculture-led Industrialization ................................. 18
Box 2.1. Policies for Competitiveness with Inclusiveness in the Supermarket Revolution,
................................................................................................................................... 27
East and Southeast Asia .................................................................................................... 27
Box 2.2. Yashar Bar, a Multimodal Freight Forwarding Company Operating from
Khujand ..................................................................................................................... 38
Box 3.1. Vertical Contracting in Global Value Chains .................................................... 62
Box 3.2. The World Development Report 2009 Framework Applied to Central Asia .... 64
Box 4.1. Space-Based Policy in the Republic of Korea ................................................... 69
Appendices
Appendix 1. Production Data ........................................................................................... 74
Appendix 2. Transport and distribution data ................................................................... 76
Appendix 3. Land cover of the hinterland of the leading cities ....................................... 78

ACKNOWLEDGMENTS
This report was prepared by a team led by Souleymane Coulibaly and comprising Asset
Nussupov (Kazakhstan Country Office consultant); Zarina Kosymova and Shuhrat Mirzoev
(Tajikistan Country Office consultants); Shamsia Ibragimova (Kyrgyz Republic Country Office
consultant); and Alexander Kitain, Vilas Pathikonda, and Lotte Thomsen (Washington Office
consultants). Local World Bank economists Damir Esenaliev (Kyrgyz Republic), Ilyas Sarsenov
(Kazakhstan), and Utkir Umarov (Tajikistan) made important contributions. Galen Evans (Urban
Department) and Siobhan Murray (GIS Lab) produced all the the maps included in this report.
Liberty Alexandra Reposar provided valuable support to the team. Christophe Bosch and Cordula
Rastogi (Europe and Central Asia Sustainable Development Department), Sudharshan
Canagarajah, Chorching Goh, John Litwack and Ekaterina Vashakmadze (Europe and Central
Asia Economic Policy Department), Uwe Deichmann (Research Department), Andreas Kopp
(Transport Department), Jean-Pierre Chauffour, Thomas Farole, Charles Kunaka, and Philip
Schuler (International Trade Department), and Mehrnaz Teymourian (Central Asia Country Unit)
provided valuable comments at various stages of this work. Motoo Konishi (Central Asia Country
Director), Indermit Gill (Europe and Central Asia Chief Economist), Luca Barbone (Sector
Director, Europe and Central Asia Economic Policy Unit), and Kazi Matin (Sector Manager,
Europe and Central Asia Economic Policy Unit) provided general guidance.
This work benefited from the financial support of the governments of Finland, Norway,
Sweden, and the United Kingdom through a contribution from the Multi-Donor Trust Fund for
Trade and Development.

-i-
EXECUTIVE SUMMARY
1. The five countries of Central Asia expanded their trade significantly since beginning
their transition with exports quadrupling to almost $70 million between 2003 and 2008 but
without substantial diversification . These countries achieved this by promoting private
investment, property rights, trade liberalization, and transport infrastructure in varying degrees.
The proceeds from exports of crude material and mineral fuels reached USD 49 billion, nearly
four times the 2003 level, while exports of food and manufactured products (not including
machinery and transport equipments) reached USD 18 billion in 2008. As of 2008 the bulk of
exports still came from a narrow range, with more than 80 percent of total export proceeds from
just two sectors in Kazakhstan (mineral fuel and metal products) and Tajikistan (cotton and
aluminum products), and one sector in Turkmenistan (mineral fuels). Only Kyrgyz Republic and
Uzbekistan exported 80 percent of their exports from three or more sectors. Central Asian
countries need to diversify their export bases.
2. Export diversification and growth will be integral to future growth and development of
this region. Diversifying production and exports exposes firms to domestic and international
competition, which enhances productivity. Such diversification drives a country‘s structural
transformation from agriculture to industry to service, accompanied by a spatial transformation as
leading cities and their hinterlands play a stronger role in production and trade.
3. This study focuses on three countries of Central Asia —Kazakhstan, the Kyrgyz
Republic, and Tajikistan—and applies the framework used by the World Development Report
(WDR 2009). These countries agreed to participate in the study, but the results of this work are
also relevant for others in the Central Asia region. The global crisis reduced trade and exports of
the three countries in 2009 as it did for the world. Nevertheless, as the world economy recovers,
these countries must think strategically about how to diversify and expand their exports in the
medium to long term. This is particularly challenging for these countries that have small
domestic markets and are landlocked and relatively remote from large markets; they suffer from
low domestic economic density, long distances to markets, and significant economic divisions
between trading partners and major markets, making the framework of the World Development
Report 2009 (World Bank 2009c) relevant. The study recommends that Kazakhstan, the Kyrgyz
Republic, and Tajikistan anchor their export diversification and growth strategy on three spatial
scales—urban (leading city), area (city-hinterland), and regional (integration with regional
markets). This corresponds to the 3 Ds of Density, Distance, and Division in WDR 2009. Policy
makers in these countries must take actions along the above three dimensions, and in parallel, to
obtain results. Without competitive connections to large markets abroad, investors will not
invest in productive capacity in cities even when major cities are competitive producers of goods
because such investments will not be profitable. While cities can be the best and most
competitive locations for agro-processing, manufacturing and exporting within a country, they
may not be if the policy environment is too unfavorable or basic services too inefficient. In
addition, even if cities policies and basic services are significantly improved, they cannot work as
islands; they need effective connections to their immediate hinterlands within the country.

-ii-
Table 1. Summary of Policy Actions to be Considered
Economic geography dimensions
Instruments Urban level
(city)
Area level
(city-hinterland)
Regional level
(city-markets
abroad)
Policy actions
needed in all
three countries
Institution Remove
restrictions on
services sectors;
Establish North–
south corridor
management
institution
Participate more
vigorously in
existing regional
institutions
Infrastructure Invest in relevant
infrastructure
Improve Road
connections
between leading
city and
immediate
hinterland
Incentive Policies to
improve private
investment
climate in cities
generally
Some form of
Special
Economic Zone
(SEZ) in the two
leading cities
Reduce/remove
restrictions on
goods movement
within country
Examples of
country-specific
policy actions
Institution Land use
regulation in
Astana which is
rapidly
urbanizing
Freedom to farm
enforced in
hinterlands of
Dushanbe and
Khujand
Tripartite transit
agreement
between China,
the Kyrgyz
Republic, and
Tajikistan
Infrastructure Scaled-up ICT
infrastructure in
Modern storage
facilities in
Improvement of
the Osh–Batken

-iii-
Almaty to
support its
regional hub
function
hinterlands of
Bishkek,
Dushanbe,
Khujand, and
Osh
road connection
Incentive Establishment of
regional food
cluster in Almaty
Extension
services to
farmers in
hinterlands of
Bishkek and Osh
Advantageous
backhaul cargo
services offered
by Kazakh trucks
to Kyrgyz and
Tajik traders
Source: Authors. Adapted from the World Development Report 2009.
4. Policy and investment actions at the urban (city) level are needed to promote more open
and competitive environments and foster agglomeration economies (table 1). Policy makers in
each country are advised to focus on its two leading cities—Almaty and Astana in Kazakhstan,
Bishkek and Osh in the Kyrgyz Republic, and Dushanbe and Khujand in Tajikistan—and explore
various possibilities, including establishing some form of a Special Economic Zones (SEZs) or
industrial/export processing zone (IZ/EPZ). Establishing some form of a ―zone‖ in a defined area
of the city with potential to expand it over time, could allow a country to jump start its export
diversification and trade expansion through appropriate infrastructure investments and a better
policy environment (e.g. simpler business registrations and operations, easier tax regimes, etc)
within that targeted area . The larger the targeted area of this ‗zone‘, the larger the likely impact,
even as countries continue to improve infrastructure and policy environment for the entire city.
5. At the area (city-hinterland) level, policy actions must increase mobility of production
factors within macro-regions anchored on leading cities. Better connections between leading
cities and immediate agricultural hinterlands, such as improved road connections and extension
services to farmers and storage and market places, will provide a sound basis for intensifying
agro-industrial activities within the country.
6. At the regional (six cities-large markets) level investments and policy actions are needed
to reduce transport costs and transport time to key regional markets. But the long-term success of
Central Asian regional integration rests on the bedrock of better connections between the macro-
regions within countries (i.e. between leading cities and their hinterlands) and between these six
leading cities and major regional markets (i.e. China, India, Russia, and Turkey). First, this
requires investing and upgrading the north–south road corridor, which links the cities of
Dushanbe, Khujand, Osh, Bishkek, Almaty, and Astana to the Afghan-Tajik border at Nijny Panj
(southern Tajikistan) and to the Kazakh-Russian border at Petropavlovsk (northern Kazakhstan)
(figure 1). While the road connection between Bishkek, Osh and Khujand is currently not part of
CAREC regional road corridor, it is the most integrative, with the potential to intensify direct and
transit trade between Kazakhstan, the Kyrgyz Republic and Tajikistan. Second, this requires
improvements in policies and agreements related to the operation and trade and transit facilitation
in border crossings connecting these markets. Third, this requires that country policies in respect
of trucking and logistic services are made more favorable for their expansion.

-iv-
Figure 1: The North-South road corridor linking six Central Asian leading cities (green line
added)
Source: Authors.

-v-
7. But the growth and diversification of nonnatural-resource-based exports are limited by
constraints to competitive production and poor connections to markets. The study identified two
types of production capacity constraints in the leading cities: backbone services and
infrastructure (for example, expensive financial services, unreliable power supply, and limited
and expensive telecommunications services); and business environments (such as excessive red
tape, poor public services including tax issues, and too much involvement by political elites in
business biasing competition). Two types of market connectivity constraints were also identified:
transport and logistics services (limited freight consolidation services and multimodal transport
services, and inadequate regional logistics services, even in Almaty, an aspiring regional logistics
hub); and challenges to international transit (issues related to customs and border crossings, high
transport costs, inefficient rail services, and problems in transiting Uzbekistan, for example).
8. For a regional production network to emerge between the six leading cities of
Kazakhstan, the Kyrgyz Republic, and Tajikistan, the East Asian experience suggests three basic
principles: start small, to maintain coordination challenges at a manageable level; think global, to
reach a larger market instead of seeing neighbors as competitors; and help the less advanced parts
of the production network to secure quality, quantity, and timely intermediate and final products.
The north–south road corridor offers huge potential for export diversification and should drive the
regional integration agenda. To secure access to key regional markets, the first major policy
action should be to establish a three-tier north–south corridor management institution, consisting
of a stakeholder group, a working group, and a secretariat.
9. Overall policies would be made by the stakeholder group, to consist of high-level
officials in Kazakhstan, the Kyrgyz Republic, and Tajikistan who are involved in regulating trade
and transport facilitation activities. Working groups in each country should consist of national
implementation committees designed as problem-solving sub-groups with operational procedures
to encourage flexibility and responsiveness and ensure public-private interaction at all levels.
Different working groups formed on an ad hoc basis, as needed, can address specific issues and
can then be disbanded once an objective is met. The secretariat of the corridor management
institution should be located in one of the six leading cities, to maximize the secretariat‘s
involvement in high-level policy making on regional integration issues.
10. The stakeholder group could consider pursuing various multipartite transit agreements,
complemented by trade agreements allowing products with export potential to reach new markets
such as agroprocessed products to western China (Urumchi and Kashgar). While some bilateral
transit agreements already exist between China and Central Asian countries, none of them secure
access to the Chinese market by the three central Asian countries as a group, thus effectively
reducing their actual access to Chinese markets.
11. Another policy action aimed at securing access to key regional markets would be to
rehabilitate and upgrade the legs of the poorly-maintained north–south road corridor, along the
route from Nijny–Panj–Dushanbe–Khujand–Batken–Osh–Bishkek–Almaty–Astana–
Petropavlovsk. For instance, improving the Osh–Batken–Isfara–Khujand–Dushanbe segment
would allow both the Kyrgyz Republic and Tajikistan to bypass Uzbekistan in reaching markets
in Russia or Turkey. The entire road badly needs upgrading and rehabilitation. The Khujand–
Dushanbe connection currently operates well below its potential, while the Shakrishtan tunnel
remains under construction; the Anzob tunnel is deteriorating, according to operators using this
route. Upgrading and completing this road corridor would increase competition with the other
routes going through Uzbekistan and would ultimately improve transit trade via Uzbekistan.

-vi-
12. Once priority highway investments in each country are agreed on, complementary policy
instruments will be needed to facilitate trade and transport and address various administrative
barriers, as well as border crossing and transit constraints. To take advantage of Kazakhstan‘s
more advanced and efficient trucking industry, such policy instruments should also include a
clause to allow cross-border truck trade and/or to facilitate foreign direct investment in the
trucking industry between Kazakhstan, the Kyrgyz Republic, and Tajikistan.
13. Finally, policy makers should consider some type of compensation mechanism to ensure
the long-term viability of deepened regional integration. Based on Almaty‘s leading role in the
region, Kazakhstan is likely to gain the most in the short term from deepened regional integration.
One obvious choice would be some form of subsidy to reduce transport costs to Almaty from the
Kyrgyz Republic and Tajikistan. This might consist of advantageous backhaul cargo services
offered by Kazakh trucks, of favorable joint-ventures with Kyrgyz or Tajik trucking companies,
or of subsidized gas prices for Kyrgyz and Tajik truckers shipping goods to Almaty for
consolidation. This would be a win-win deal for Kyrgyz and Tajik traders, who would see a
decrease in transport costs in reaching regional markets, and for Almaty, whose regional hub
function would be realized, promoting a wide range of multi-modal and intermediation services.
14. The most important policy action at the urban level would be to establish, in each leading
city, some type of Special Economic Zone (SEZ) where infrastructure conditions and economic
regulations are more hospitable than in the rest of the country. An SEZ would make each city‘s
business environment more attractive to domestic and foreign investors. The downside of SEZs is
the inevitable distortion created in the rest of the national economy, but the larger the privileged
area, the lower such distortion will be, making citywide SEZs logical. This was the case in China
in 1984, when 14 coastal cities were granted SEZ status, and in 1988, when the entire island of
Hainan was assigned SEZ status. But this may not be feasible in these leading cities of Central
Asia at this time. Instead focusing on a more limited area —such as an industrial zone/export
processing zone in each city —may provide a useful start to creating highly competitive locations
for production and export in these cities. As these limited Special ―zones‖ demonstrate results in
terms of investment, employment and exports, they could be expanded to include an increasingly
larger area.
15. The single most important area-level policy action is to scale up the backbone
infrastructure and services provided in the macro-regions. To facilitate innovation, production,
and trade, improvements are needed to systems and regulations for governing intra-urban and
interurban transport, retail and wholesale distribution, and logistics and financial services. For
instance, public investments may be needed to provide the transport infrastructure needed to
connect the core city to its mainly agricultural hinterland, as well as the market infrastructure
investments needed to facilitate rural-urban interactions, such as marketplaces, storage capacity
with power and water connection as needed, and price information systems.
16. Such policy actions, representing the core of the city-led diversification strategy proposed
in this study should be undertaken for all six leading cities in Central Asia. This diversification
strategy involves three types of policy makers: city-level authorities for city-level interventions,
oblast-level authorities for the hinterlands of leading cities, and national authorities for regional-
level policy actions. A close collaboration between all three levels of decision-making is
paramount to the success of the diversification strategy.
17. Additional measures recognizing the specific needs of each leading city should be
considered. For instance, because Almaty is at a more advanced stage of urbanization than are
the five other cities, Almaty may require additional infrastructure in mass transportation, ICT, and

-vii-
financial services to sustain and expand its regional hub function. In Dushanbe and Khujand and
their hinterlands, the process of land titling need to be strengthened, because Tajik farmers do not
have yet the freedom to farm their products and no land market exists in Tajikistan.
18. Kazakhstan, the Kyrgyz Republic, and Tajikistan have a comparative advantage in some
agricultural products demanded by major regional markets. Horticulture in the hinterlands of
Almaty, Bishkek, Dushanbe, Khujand, and Osh and grain in the hinterland of Astana could
benefit from complementary policies aimed at improving quality and quantity of products grown.
Dairy and meat complexes around Bishkek and Dushanbe could benefit from upgraded livestock
activities in their hinterlands. Providing a business-friendly environment and improved access to
credit, along with rehabilitated feeder roads and marketplaces and stronger access to technical
assistance to meet quality requirements would help transform agriculture into a more dynamic
sector. In addition, improving access to efficient and affordable transport and distribution services
to consolidate production, along with stronger connections to external markets via multimodal
means of transport, would help forge closer links with manufacturing and business services.
19. With the north–south corridor management institution established and macro-regions
consolidated around the six leading cities, the creation of an innovation-intensive food cluster in
Almaty with stronger connections to other cities becomes part of a sound regional diversification
strategy. Such a strategy could benefit from supply links with intermediate products from the
hinterlands of Bishkek, Dushanbe, and Khujand, and would help meet demand both from the
Kazakh domestic market and other regional markets easily accessible from Almaty via road, rail,
and air.

-8-
1. THE NEED FOR CENTRAL ASIAN COUNTRIES TO
DIVERSIFY THEIR TRADE
1. In 2005, the Europe and Central Asia Region‘s flagship report, From Disintegration to
Reintegration: Eastern Europe and the Former Soviet Union in International Trade (Broadman
2005), unveiled two emerging trade blocs: one diversifying and tending to trade with most
advanced Western countries and the other remaining concentrated on natural-resource-intensive
production and tending to pull back toward a trading area centered on the Russian Federation.
This report concluded that countries of the second trade bloc needed to pursue further trade policy
reforms beyond those already in place, and identified domestic market-facilitating reforms as the
bulk of the unfinished agenda. The first bloc consisted of the eight new European Union (EU)
members,1 while the second bloc consisted primarily of the countries of the Commonwealth of
Independent States (CIS). As the transition from centrally planned economies approaches its third
decade, now may be a good time to revisit the implications of this dichotomy.
2. Recent empirical work confirms that development and growth are associated with
increasing production and trade diversification. For example, Imbs and Wacziard (2003) focus on
the link between development and diversification and Herzer and Nowak-Lehman (2006)
examine the link between growth and diversification. Economists continue to debate the direction
of the causality. But extensions of the endogenous growth model, which links growth to the
accumulation of human capital, clearly demonstrate that developing countries can increase their
productivity, and thus their prospects of achieving higher per capita incomes, as they move from
agriculture-based economies to industry-based and service-based economies (Chuang 1998).
Developing countries can accomplish this by learning through the diversification process, through
competition and intersectoral spillovers.
3. Furthermore, diversification of products and markets spreads the risk associated with
external shocks. Haddad and others (2010) show that for a wide range of countries expanding
their export bases, the correlation between trade openness and growth volatility turns negative
when export diversification indicators cross a threshold. The current economic crisis gives a new
resonance to this stabilizing effect of diversification.
4. This study focuses on merchandise trade development in the Central Asian countries
since 2003, to ascertain whether new trends in markets are apparent and whether the countries
have diversified their products. Ideally, all five Central Asian countries would be studied, but the
lack of data available for Turkmenistan and Uzbekistan with respect to city-level or disaggregated
trade information makes that impossible. Beginning in chapter 2, this study, therefore, focuses
only on Kazakhstan, the Kyrgyz Republic, and Tajikistan, and refers to those three as ―Central
Asia.‖ In chapter 1, where only aggregate trade statistics are used, the term Central Asia still
refers to all five countries, unless otherwise noted.
1 The Czech Republic, Estonia, Hungary, Latvia, Lithuania, Poland, the Slovak Republic, and Slovenia.

-9-
Recent Export Performance
5. Central Asian countries face two daunting challenges: they are landlocked, and their
production base is skewed toward natural resources. Their landlocked geography significantly
reduces their market accessibility, which limits their prospects for offshore export diversification
strategies. Their heavy reliance on natural resources also significantly reduces the
competitiveness of their other exports because of their appreciating currencies. For instance,
during 2003–08, the share of total exports from Central Asia going to the EU-15 grew from 27
percent to 35 percent.2 But whether this expansion was due to an explicit diversification strategy
is hard to say, given the autarkic stance of Turkmenistan and Uzbekistan. High commodity prices
have certainly affected Central Asian countries‘ proceeds from exports of aluminum, cotton, gas,
gold, and oil. Yet a look at the countries‘ export structure and export destinations indicates the
potential of a well-thought-out diversification strategy.
Export Structure
6. Central Asian merchandise exports increased from almost USD 17 billion in 2003 to
almost USD 70 billion by 2008 (table 1.1). To a large extent, this reflects the growth in exports of
mineral fuels, lubricants, and related materials and of crude inedible materials except fuels by
4.9 times during the period to reach USD 49 billion. Mineral fuels, lubricants, and related
materials accounted for 62 percent of Central Asia‘s exports in 2008, up from 47 percent in 2003.
Meanwhile, nonnatural resource-intensive exports (excluding crude materials inedible, and
mineral fuels) increased only 3.3 times to reach USD 21 billion. By comparison, during this
period Southeast Europe‘s top three exports were manufactured goods, machinery and transport
equipment, and textile products.
2 EU-15 refers to the 15 countries that were members of the EU before the May 1, 2004, enlargement, namely, Austria,
Belgium, Denmark, Finland, France, Germany, Greece, Ireland, Italy, Luxembourg, the Netherlands, Portugal, Spain,
Sweden, and the United Kingdom.

-10-
Table 1.1. Trade Structure, Central Asia and Southeast Europe, 2003 and 2008
Percentage of total exports
Regions/
Year
Food
& live
animals
Beverages & tobacco
Crude inedible
materials
except fuels
Mineral
fuels,
lubricants, and
related
materials
Animal &
vegetable oils, fats,
and waxes
Chemicals
and related
products
Manufac-
tured
goods
Machinery
and transport
equipment
Textile products
Commodities
not classified
elsewhere
Total
Trade (USD
million)
2003
Central
Asia
6.47 0.32 14.38 47.41 0.03 3.02 23.31 1.75 1.23 2.08 16,730
Southeast
Europe
5.58 1.19 6.75 4.71 0.18 6.25 21.54 16.95 35.92 0.94 35,946
Europe and
Central
Asia 5.19 0.63 5.23 20.39 0.27 6.49 21.79 24.92 12.63 2.48 455,874
2008
Central
Asia
4.36 0.13 8.42 61.70 0.02 3.16 16.69 1.99 0.51 3.03 70,187
Southeast
Europe
6.08 1.59 6.88 8.11 0.45 7.50 24.35 24.53 18.56 1.96 94,668
Europe and
Central Asia
4.66 0.63 4.54 29.09 0.32 6.80 18.95 23.69 7.10 4.22 1,343,808
Source: United Nations commodity trade database.
Note: Column headings reflect Standard International Trade Classification categories, revision 3.
7. Using the five-digit Standard International Trade Classification nomenclature for
products, Central Asian countries exported a total of 1,731 products in 2008, up from 1,707 in
2003, compared with Southeast European3 countries‘ exports of 2,631 products in 2008, up from
2,615 in 2003. In 2008, Central Asian countries‘ top three export products accounted for 36
percent of total exports, compared with only 8 percent for Southeast European countries,
indicating an extremely concentrated export base in Central Asia and a diversified export base in
Southeast Europe. In 2008, the Herfindahl-Hirschman index (also called the Herfindahl index), a
commonly accepted measure of market concentration, was 0.50 for Central Asia. This indicates
an extremely concentrated export base, compared with an index of 0.08 for Southeast European
countries (0 indicates equal distribution and 1 indicates maximum concentration).4
8. How can Central Asia match the diversification performance of Southeast Europe? The
answer lies in what Southeast Europe did: it favored the expansion of economic activities in its
leading cities well-connected to the EU, which helped diversify its exports into manufacturing
products. This study makes the case that by targeting relevant markets, connecting leading urban
centers to those markets, and facilitating trade along the transportation links connecting them,
Central Asia could maximize its market accessibility and expand and diversify its exports much
as Southeast Europe is now doing.
3 Here, Southeast Europe refers to Albania, Bulgaria, Bosnia and Herzegovina, Croatia, FYR Macedonia, Montenegro,
Serbia and Romania. 4 The Herfindahl-Hirschman index is calculated as , where xi/x is the share of
product in the total exports of a country and n is the total number of products exported.

-11-
Exports of Nonnatural-Resource-Intensive Products
9. In 2003, the top export destinations for nonnatural-resource-intensive products from the
Central Asian countries were Europe and Central Asia, including Russia and Turkey (32 percent);
the EU-15 (27 percent); and China (20 percent) (figure 1.1). By 2008, the EU-15 had taken the
top spot (35 percent), followed by Europe and Central Asia (34 percent) and China (13 percent).
While overall exports to Europe and Central Asia remained stable, exports to countries other than
Russia and Turkey decreased from 15 percent to 9 percent. Exports within Central Asia remained
low, at 1 percent. Central Asian exports are transported overland, suggesting that the north–south
corridor linking this region to regional markets (such as China and Russia toward the north and
Turkey toward the south) is a major axis of trade expansion.
Figure 1.1. Destination of Nonnatural-Resource-Intensive Exports from the Central Asian
Countries, 2003 and 2007 (percent) a. 2003 b. 2008
Source: International Monetary Fund direction of trade statistics database.
10. In 2007, 80 percent of Central Asian countries‘ nonnatural-resource-intensive exports
consisted of manufactured goods (which accounted for 68 percent of the nonnatural-resource-
intensive exports), transported mainly to the EU-15, China, Russia, and Turkey, and food
products (10 percent), exported mainly to Russia, the EU-15, and the Middle East and North
Africa. Three-quarters of the manufactured goods exported were metal products from Kazakhstan
and Tajikistan destined mainly for the EU-15, China, Russia, and Turkey. Although still limited,
production and export of food products and light manufacturing could be intensified with the
appropriate set of policy measures to tap into the region‘s comparative advantage in agricultural
products such as cotton and horticulture.
11. Furthermore, in 2007, imported foods and chemicals represented 15 percent of imported
nonnatural-resource-intensive products, all from two sources: Russia (5 percent) and the EU-15
(5 percent). Intraregional trade among the Central Asian countries accounted for 3 percent.
Central Asia could scale up its intra-regional and extra-regional trade of these goods, which
require fairly accessible technology and skills.

-12-
Breakdown of Export Growth of Nonnatural-Resource-Intensive Products5
12. The challenge of diversification in Central Asia is clearly illustrated by figure 1.2, which
shows sources of export growth during 2003–08. Following Brenton and Newfarmer (2008),
export growth is broken down into six components. Three components highlight diversification
by intensification of existing trade flows (intensive margin): increase in exports of existing
products to existing markets; fall in exports of existing products to existing markets; and
cessation of exports of existing products to existing markets. The other three cover diversification
by expansion of existing trade flows to cover new products or new trading partners (extensive
margin): exports of existing products to new markets; exports of new products to existing
markets; and exports of new products to new markets.6
5 This section and the following sections focus only on Kazakhstan, the Kyrgyz Republic, and Tajikistan and refer to
them as Central Asia, using their five-digit mirror exports to all trading partners under the third revision of the Standard
International Trade Classification. 6As used here, ―new product‖ means a product not exported by a Central Asian country to a given trading partner in
2003, but that was exported to that same trading partner in 2007, with the product not being necessarily new in the
basket of products exported.

-13-
Figure 1.2. Sources of Export Growth, Nonnatural-Resource-Intensive Products,
Kazakhstan, the Kyrgyz Republic, and Tajikistan, 2003-08 (percent) Kazakhstan
Kyrgyz Republic
Tajikistan
Source: United Nations commodity trade database; authors‘ calculations.
13. As is the case for many developing countries, the intensive margin appears to be the
strongest contributor to Central Asian exports of nonnatural-resource-intensive products (Brenton
and Newfarmer 2008). Increases in exports of existing products to existing markets accounted for
89 percent of the USD 8.2 billion increase in trade in Kazakhstan during 2003–08; for 108
percent of the USD 400 million increase in trade in the Kyrgyz Republic; and for 120 percent of
the USD 350 million increase in trade in Tajikistan. Kazakhstan has increased its exports of
chemicals and manufactured metal goods to China and Russia and other large economies. The
Kyrgyz Republic has increased its exports of both processed and unprocessed horticultural
products to Russia, Kazakhstan, and Turkey. Tajikistan has intensified its exports of aluminum
products and some processed and unprocessed horticultural products to the EU-15, Russia, and
Turkey.

-14-
14. During the same period, the Kyrgyz Republic and Tajikistan experienced a larger
cessation of exports: –23 percent for Kyrygz Republic and –22 percent for Tajikistan and –7
percent for Kazakhstan. The cessation of exports of existing products to existing markets is an
indicator of the viability of exporters‘ export relationships. The failure rates of exports from
Central Asia appear to be quite high. Using Vietnam for comparison purposes, while only 6
percent of products exported by Vietnam during 2002–05 were no longer exported by Vietnam in
2006 or 2007, this number was 36 percent for the Kyrgyz Republic and Tajikistan, and 21 percent
for Kazakhstan (United Nations commodity trade database). The largest failure rates appear to be
for chemicals in Kazakhstan (30 percent) and the Kyrgyz Republic (56 percent) and for beverages
in Tajikistan (50 percent). Vietnam‘s dramatically lower rate may suggest that its firms have
solidified their marketing channels and transport links to continue exporting its current set of
exports, a worthwhile lesson for the Central Asian countries.
15. Exports of existing products to new markets have been the driver of the extensive margin
in the three countries, accounting for 25 percent of exports by Tajikistan during 2003–08 and 14
and 13 percent by Kazakhstan and the Kyrgyz Republic, respectively. This includes products
exported in 2008 to existing trading partners that did not import those products in 2003, that is,
the opening up of new bilateral country-product relationships. For Kazakhstan, the products were
mainly metal products exported to some European countries, Russia and Korea; for the Kyrgyz
Republic, mainly refined metals and food products exported to Kazakhstan and Russia, China and
other Asian countries; and for Tajikistan, mainly aluminum products exported to some European
countries, India and the United States. The Kyrgyz Republic‘s experience shows that diversifying
agro-industry activities at the Central Asian level is an achievable goal.
Diversification Potential
16. Because Central Asian countries tend to rely too heavily on a few natural-resource-
intensive exports, increasing the share of non-natural-resource-intensive exports is the first step in
diversification. This may well be equivalent to intensifying the export of very limited products
such as agroprocessed products or clothing. Another issue is whether the Central Asian countries
can succeed in diversifying their trading partners. Diversifying nonnatural-resource-intensive
products into distant markets may be a long shot given Central Asia‘s geographical and logistical
disadvantages. A first step might therefore be to target regional markets such as China, India,
Russia, and Turkey, and perhaps the EU via Russia, where the demands for agroprocessed
products and clothing far exceed Central Asia‘s production capacity.
Potential Avenues for Market Diversification
17. The trade complementarity index for non-natural resource-intensive goods with China,
India, Russia, Turkey, and the EU-15 can indicate how well the export structures of Kazakhstan,
the Kyrgyz Republic, and Tajikistan match the import structures of those markets.7 The index is
zero when no goods are exported by one country or imported by the other, and 100 when the
export and import shares match exactly. The complementarity index between Kazakh exports and
imports by China, India, and Russia was stable at around 7 percent during 2002–08, while
Kazakhstan‘s complementarity index with the EU-15 and Turkey increased slightly from 2002–
04 to 2005–08 (figure 1.3). This compares with higher matches between exports from the Kyrgyz
Republic and imports by China, India, Russia, Turkey, and the EU-15. Between 2002–04 and
7 The trade complementarity index between countries k and j is defined as
TC, where xij is the share of good i in the global exports of country j and mik is the share of good i in
all imports of country k.

-15-
2005–08, the Kyrgyz Republic‘s trade complementarity with India was halved from 16.8 to 8.6
percent primarily because of variations in the imports and export of mainly three products: gold,
for which the Kyrgyz Republic‘s export share fell from 13 percent to 1 percent while India‘s
imports share stayed high at 14 to 15 percent; nonwired float glass, for which the Kyrgyz
Republic‘s export share rose from 5 to 10 percent while India‘s import share stayed low at 0.04
percent; and electrical machinery parts, for which the Kyrgyz Republic‘s export share rose from
less than 1 percent to 7 percent and for which India‘s import share remained low at less than 1
percent. Tajikistan‘s trade complementarity with these regional markets stayed constant at around
5 percent, with Turkey providing the best match at 6.1 percent during 2005–08.
Figure 1.3. Average Trade Complementarity with Leading Regional Markets, Kazakhstan, the
Kyrgyz Republic, and Tajikistan, 2002–04 and 2005–08
Kazakhstan Kyrgyz Republic Tajikistan
Source: United Nations commodity trade database; authors‘ calculations.
18. By comparison, over the period of 2002-07 the trade complementarity of Cambodia and
the Lao People‘s Democratic Republic with China, Japan, and the Republic of Korea ranged from
2.9 percent to 9.8 percent, with an average value of 6 percent. Given the now more integrated
trade between Cambodia and the Lao People‘s Democratic Republic with China, Japan, and
Korea, the complementarity of Kazakhstan, the Kyrgyz Republic, and Tajikistan with their major
regional markets seems not to be too low a base to build on. Furthermore, when looking at the
types of products imported instead of their value, the export potential of Central Asia to China,
India, Turkey, Russia, and the EU-15 becomes stronger, as illustrated by table 1.2, which shows
the share of the complementarity gap attributable to nonmatching product varieties and the share
arising from unmet demand for existing export products.
-16-
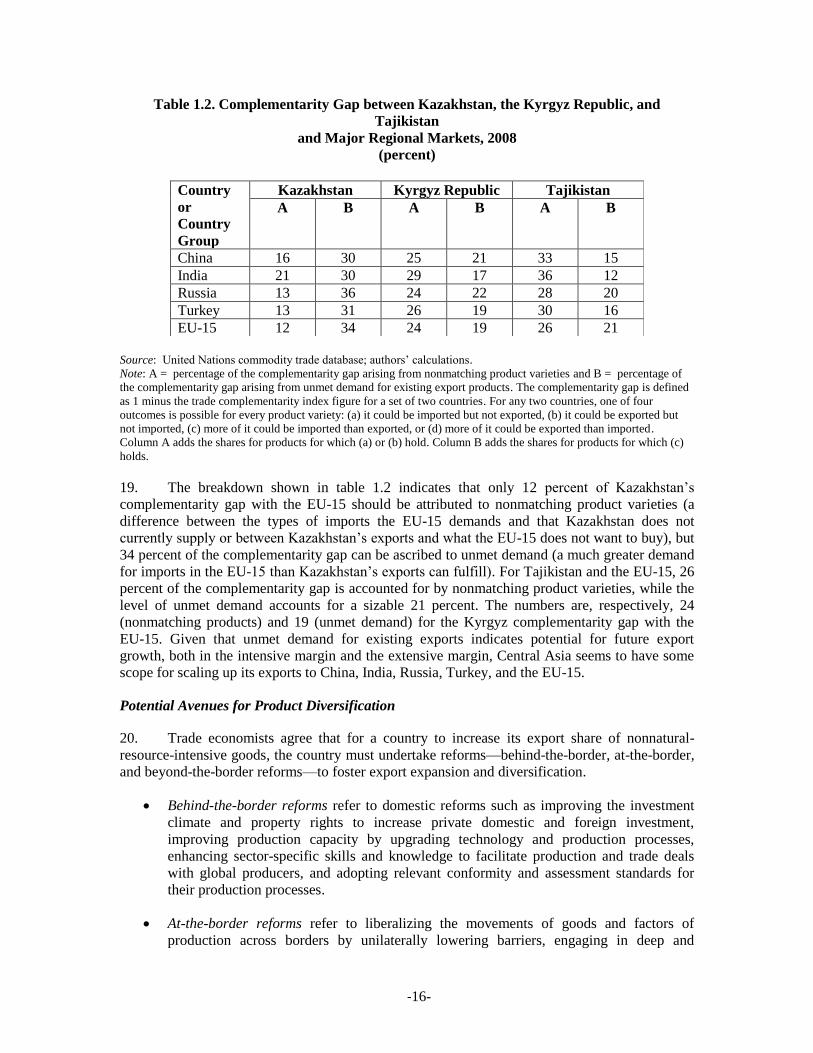
Table 1.2. Complementarity Gap between Kazakhstan, the Kyrgyz Republic, and
Tajikistan
and Major Regional Markets, 2008
(percent)
Country
or
Country
Group
Kazakhstan Kyrgyz Republic Tajikistan
A B A B A B
China 16 30 25 21 33 15
India 21 30 29 17 36 12
Russia 13 36 24 22 28 20
Turkey 13 31 26 19 30 16
EU-15 12 34 24 19 26 21
Source: United Nations commodity trade database; authors‘ calculations.
Note: A = percentage of the complementarity gap arising from nonmatching product varieties and B = percentage of
the complementarity gap arising from unmet demand for existing export products. The complementarity gap is defined
as 1 minus the trade complementarity index figure for a set of two countries. For any two countries, one of four
outcomes is possible for every product variety: (a) it could be imported but not exported, (b) it could be exported but
not imported, (c) more of it could be imported than exported, or (d) more of it could be exported than imported.
Column A adds the shares for products for which (a) or (b) hold. Column B adds the shares for products for which (c)
holds.
19. The breakdown shown in table 1.2 indicates that only 12 percent of Kazakhstan‘s
complementarity gap with the EU-15 should be attributed to nonmatching product varieties (a
difference between the types of imports the EU-15 demands and that Kazakhstan does not
currently supply or between Kazakhstan‘s exports and what the EU-15 does not want to buy), but
34 percent of the complementarity gap can be ascribed to unmet demand (a much greater demand
for imports in the EU-15 than Kazakhstan‘s exports can fulfill). For Tajikistan and the EU-15, 26
percent of the complementarity gap is accounted for by nonmatching product varieties, while the
level of unmet demand accounts for a sizable 21 percent. The numbers are, respectively, 24
(nonmatching products) and 19 (unmet demand) for the Kyrgyz complementarity gap with the
EU-15. Given that unmet demand for existing exports indicates potential for future export
growth, both in the intensive margin and the extensive margin, Central Asia seems to have some
scope for scaling up its exports to China, India, Russia, Turkey, and the EU-15.
Potential Avenues for Product Diversification
20. Trade economists agree that for a country to increase its export share of nonnatural-
resource-intensive goods, the country must undertake reforms—behind-the-border, at-the-border,
and beyond-the-border reforms—to foster export expansion and diversification.
Behind-the-border reforms refer to domestic reforms such as improving the investment
climate and property rights to increase private domestic and foreign investment,
improving production capacity by upgrading technology and production processes,
enhancing sector-specific skills and knowledge to facilitate production and trade deals
with global producers, and adopting relevant conformity and assessment standards for
their production processes.
At-the-border reforms refer to liberalizing the movements of goods and factors of
production across borders by unilaterally lowering barriers, engaging in deep and

-17-
comprehensive regional agreements, or joining the multilateral WTO framework. This
openness can generate general benefits such as a peaceful neighborhood supported by
intertwined economic interests or a more predictable trade environment in addition to
lowering the costs of importing intermediate inputs.
Beyond-the-border reforms are measures to facilitate trade and transport with respect to
international transit and to improve logistics services to reduce the costs of trading.
21. Aside from Chile‘s example of successful unilateral trade liberalization, the East Asian
countries that engaged in promoting Special Economic Zones (SEZs) have experienced more
impressive results than have other developing countries. China, for example, relied heavily on the
SEZs along its eastern coast.
22. Another example is Thailand, which moved successfully from traditional agriculture to
modern food processing to major manufacturing by adopting such a spatial approach. Thailand
relied heavily on agro-industry during the early stages of its industrialization, an experience that
may suggest some lessons for Kazakhstan, the Kyrgyz Republic, and Tajikistan (box 1.1). Even
though it might sound like a picking winner strategy, Thailand‘s industrialization strategy was
rooted in the country‘s comparative advantage (agriculture) and competitive advantages
(Bangkok‘s hub function and agglomeration economies) and focused on scaling up agro-industry
and agroprocessing before testing out other manufacturing sectors, such as integrated circuits in
the late 1980s. The strategy unleashed Thailand‘s agricultural potential by ensuring access to
land, establishing institutions to complement fundamental macroeconomic policies, developing
the infrastructure necessary for the development of agro-industry, and providing targeted
interventions to some promising sectors.

-18-
Box 1.1. The Thai Experience of Agriculture-led Industrialization
At the beginning of the industrialization process, the Thai government stabilized the price of rice at a low
level while promoting agro-industry diversification for export. Thailand achieved this by putting in place a
variety of taxes, including a variable export tax on rice; providing access to agricultural land; and offering
incentives to large, export-oriented agroprocessors. The latter incentives ranged from reduced import duties
on agricultural machinery to tax exemptions for up to seven years; exemptions from import duties on raw
or essential materials, export taxes, and value added taxes on exports and local goods used to produce
exports; and reduced electricity charges, domestic air cargo charges, and rail charges for firms in selected
provinces. Agroprocessing industries also benefited from the extension of subsidized credit to farmers
participating in contract farming and outgrowing schemes, the government‘s bilateral negotiations with key
importing countries to lower tariffs on imports, and a government program to enhance the quality of agro-
exports.
The government created specific institutions to accompany this industrialization policy, including the
National Economic and Social Development Board, the Joint Public and Private Sector Consultative
Committee, two coordinating agencies between the government and the business community, and the
Board of Investment to provide incentives to develop new businesses in some selected sectors. The
experience of the Charoen Pokphand Group, a Bangkok-based food giant, illustrates how this
industrialization strategy was targeted at the private sector.
Charoen Pokphand was created in 1921 as a trading company importing seeds and vegetables and exporting
pigs and eggs. The company registered with the Thai government in 1951 and opened a feed mill in 1954.
With this mill, the company took the first steps toward vertical integration, as the group not only sold seeds
to farmers, but also bought and processed farmers‘ crops. In 1976, the company moved into poultry
farming following an announcement by the Board of Investment that incentives to develop new businesses
were available for this activity. Because of the difficulties of breeding local chickens, the company entered
into a joint venture with an American company, Arbor Acres, that continues to provide the Charoen
Pokphand Group with chickens. The Charoen Pokphand Group also entered into joint ventures with
Japanese firms to market frozen chicken meat in Japan. The company pioneered contract farming in
Thailand, including guaranteeing loans to farmers from commercial banks, from the Bank of Agriculture,
and from agricultural cooperatives.
By 1979, the company controlled 90 percent of Thailand‘s poultry exports and 40 percent of the domestic
animal feed business. It also used Board of Investment incentives to establish its own trading company, CP
Intertrade, and established plantations to grow beans and maize. Today, with businesses and affiliates
operating within the agribusiness, retail, and telecommunications markets, the company employs more than
250,000 people worldwide and its sales for 2006 were USD 14 billion.
Source: Hewison 1989; Jomo and Rock 1998; Manarungsan and Suwanjindar 1992; Pasuk and Baker 1995; Board of Investment 1996
http://www.cpthailand.com.
23. Even Chile‘s diversification success is an outcome of state intervention through the
Fundación Chile, a public-private agency designed to develop firms in new areas in which private
investors were not interested and to involve the private sector at a later stage. For example, the
Fundación Chile is credited with helping develop the salmon farming industry and turning Chile
into one of the world‘s top salmon exporters (The Patagonia Times, 29 October 2007).
24. Is there a middle way between unilateral liberalization and heavy state intervention in
industrialization and diversification that the Central Asian countries can consider? Building on
the 2009 World Development Report framework (World Bank 2009c), this study proposes a way

-19-
that focuses on increasing the explicit role of leading cities in the diversification strategy and then
improving their connectivity to targeted regional markets. As in the WDR2009, policy makers are
advised to look at three spatial levels to design their export diversification strategy, by using three
main policy instruments: institutions that unite places, infrastructures that connect places, and
incentives that target areas of special need.
25. First, at the city level, economic density is the main challenge. Trade needs to be driven
by urban based activities and services; in small countries with a thin urban hierarchy, the largest
city or cities will be the focus. The key here is that these cities may not be delivering localization
economies to help producers become more productive and competitive, pre-requisites for
increasing exports. Thus policy makers need an intensification strategy, so that the cities become
good enough at producing, say, processed food products to be able to sell it abroad. This means
that cities need to attract the right businesses (such as food processing firms and closely related
services/suppliers), provide them with a good regulatory environment, and provide the local
services that are needed for their operation. If the only way to do this is by using some form of
SEZ, then policy makers will need to set up the right institutions, and provide the needed
infrastructure as well as incentives to make it work.
26. Second, at the city-hinterland level—defined here as a one-hour drive away from the city-
center—distance to economic density is the main challenge. How best to connect farmers within
feasible range of the cities to food processing firms in the main cities? This is not a one-way
relationship, because urban firms also need to work with farmers to increase quality and perhaps
even help trigger agricultural intensification. Here, policy makers may also consider establishing
institutions to facilitate the economic interaction between the city and its hinterland, along with
local infrastructure to connect production and market, as well as targeted incentives such as
extension services or credit access for farmers.
27. Third, at the regional level, economic and political divisions between different countries
are the challenges to be overcome. Regional integration can help to scale up supply capacity,
while global integration will help to scale up demand. Because Central Asian countries are
isolated, quite small, and obviously highly interdependent, formal and informal mechanisms are
necessary to pool resources and punch above their individual weight when negotiating access to
Chinese or EU markets, for instance. The principle suggested in the WDR2009 is to ―start small,
think global, and compensate the least fortunate.‖
Start small: Do not go for big formal agreements, but start with manageable, mutually
beneficial actions with quick payoffs such as upgrading and better management of the
north–south transport corridor connecting Kazakhstan, the Kyrgyz Republic, and
Tajikistan.
Think global: Domestic markets are rather small, so think about exporting elsewhere,
such as China, Russia, and Turkey, as argued in this chapter.
Compensate the least fortunate: Not all countries will benefit equally. For instance,
Almaty may become a main export hub, capturing most of the benefits from
complementary service activities, so policy makers would need to provide some targeted
incentives to better foster the connection of the production networks of the region‘s other
leading cities to the hub.
28. In countries with tough economic and physical geography, leading cities and their
hinterlands have the strongest diversification potential, and for landlocked countries such as those

-20-
in Central Asia, the leading cities are the exit points to regional and global markets. Economy-
wide liberalization, which is the best option for trade expansion and export diversification, is not
inconsistent with this middle approach.
29. This study looks at the trade diversification potential of the macro-regions anchored on
the two leading cities of Kazakhstan (Almaty and Astana), the Kyrgyz Republic (Bishkek and
Osh), and Tajikistan (Dushanbe and Khujand) (figure 1.4). The study is limited to these three
countries because of easy access to the data needed, but the framework developed could easily be
replicated in other Central Asian countries if their data became available. The study examines
constraints facing each country‘s two leading cities with respect to the business environment and
the connectivity to markets, and proposes a framework for a city-led diversification strategy.
Figure 1.4. The North-South Road Corridor Linking the Six Leading Cities (green line added)
Source: Authors.

-21-
2. THE CONSTRAINTS FACING CENTRAL ASIAN
LEADING CITIES
30. Central Asia‘s largest cities—Almaty and Astana in Kazakhstan, Bishkek and Osh in the
Kyrgyz Republic, and Dushanbe and Khujand in Tajikistan—are also the places with the most
diverse production and the main exit points for exports of goods and services. Yet their potential
for trade expansion will materialize only if the agglomeration economies generated by these
leading cities are better harnessed, and if the leading cities are better connected to the sources of
the intermediate products and services they need and to the markets for their final products.
Although Central Asia‘s leading cities are in better shape than other places in the region, with
respect to agglomeration economies generated, diversification of the production base, and better
connections to domestic and external markets, the six cities lack scale in production and still face
high transport costs to their export markets.
31. To assess the constraints facing these leading cities, the study team undertook three
background studies. The first involved focus group discussions with managers of clothing and
food firms in Almaty, Astana, Bishkek, Dushanbe, Khujand, and Osh to identify their constraints
to participating in global value chains (Thomsen 2009). The second was a survey of 300 firms
operating in the trade and transport services sectors in the six cities (100 firms in each country) to
assess the business environment in which they operate and identify constraints to their expansion
(M-Vector 2009a, 2009b, 2009c). The third was an in-depth study of the export potential of
horticulture in the hinterlands of Bishkek, Khujand, and Osh (Global Development Solutions
2009). These background studies were complemented by data from Doing Business (International
Finance Corporation and World Bank 2009), the 2008 and 2009 business environment and
enterprise performance survey (BEEPS), and statistics provided by the statistical agencies of the
three countries.
The Constraints to Production Capacity within Countries
32. In Central Asia, as in other developing regions with disadvantageous geography, rent-
seeking behavior and elite capture of local governments in cities and their hinterlands have
limited the potential of positive spatial externalities, reducing access to quality intermediate
goods and services and contributing to low returns on investment. Furthermore, because some
national governments tend to spread their limited capital expenditures thin to provide growth-
sustaining infrastructure for lagging regions, authorities in leading cities are often responsible for
raising capital needed for expanded infrastructure. This increases perceptions of risk among
potential investors, both domestic and foreign, who tend to prefer to engage in activities with safe
returns, such as real estate, or to operate in the shadow economy. A successful diversification
strategy to harness the agglomeration economies generated by Central Asia‘s leading cities
should build on the comparative advantages of each city‘s hinterlands to establish production
networks to channel raw materials to processing facilities in the leading cities. The means for
facilitating such internalization are backbone services and infrastructure, and business-friendly
business environments.

-22-
Constrained Backbone Services and Infrastructure
33. Companies that provide services important for export diversification tend to be based in
cities. These include enterprises providing backbone services such as financial services;
communications; logistics and warehousing; various business and professional services,
especially those needed for developing new products and identifying new markets; and
processing and packaging services (for instance, to transform low-value and perishable fresh
cherries into higher-value cherry soda, cherry jam, and cherry candy). Such activities benefit from
a city‘s agglomeration economy, but cities also generate diseconomies of scale because of the
congestion costs caused by overcrowded urban transportation systems or sprawling informal
retail trading. Unless economies of scale in key backbone services are high enough and
diseconomies of scale caused by congestion costs are contained, a city‘s production capacity will
be constrained. This seems to be the case for Central Asia‘s leading cities.
Limited Backbone Services for Firms
34. The global value chain analysis (Thomsen 2009) of the food and clothing sectors
conducted for this study indicated that a lack of finance is a common barrier to expansion of these
sectors in the six leading cities. Few of the firm managers or owners interviewed have borrowed
from local banks. Most respondents noted that loans from local banks are possible to obtain, but
only on a short-term basis, at high interest rates, and subject to bureaucracy and corruption.
Hence firms commonly use their own capital or attempt to have wholesalers pay 50 to 100
percent of product prices up-front. As a consequence, most businesses tend to use their capital
just as working capital, for example, to buy supplies, and consider investment in new equipment
to be beyond their reach.
35. The latest BEEPS data confirm such findings (table 2.1). Even though the value of the
collateral required for a loan in Almaty, Bishkek, and Dushanbe is lower than the average
collateral required in Europe and Central Asia as a whole (133 percent), the percentage of firms
with credit line or loans from financial institutions is lower in these three cities than the 44
percent average in Europe and Central Asia. Furthermore, 30 percent or more of firms in Almaty,
Bishkek, and Dushanbe reported access to finance as a major constraint, compared with an
average of 24 percent for Europe and Central Asia. Almaty may be Central Asia‘s financial hub,
but surprisingly, a larger share of firms in Almaty identified access to finance as a major
constraint than did firms in Bishkek and Dushanbe.

-23-
Table 2.1. Access to Selected Backbone Services in Leading Cities of Kazakhstan, the Kyrgyz
Republic, and Tajikistan, and in Europe and Central Asia, 2008 and 2009
Backbone
services BEEPS indicators Almaty Bishkek Dushanbe
Europe &
Central Asia
Financial
services
Percentage of firms with a
line of credit or loans from
financial institutions 31 27 33 44
Value of collateral needed for
a loan
(Percentage of the loan
amount) 108 126 125 133
Percentage of firms
identifying access to finance
as a major constraint 36 30 30 24
Power services Number of power outages in a
typical month 4 6 9 5
Average duration of power
outage (hours) 6 5 19 n.a.
Losses due to power outages
(percentage of total annual
sales) 6 13 19 4
Information and
communication
technology
Delay in obtaining a mainline
telephone connection (days) 26 12 8 17
Percentage of firms using e-
mail to communicate with
clients and suppliers 92 63 59 n.a.
Percentage of firms having
their own website 69 40 31 48 Source: BEEPS data. The data are for 2009 for Almaty and Bishkek and 2008 for Dushanbe. Information on Astana, Osh,
and Khujand is not readily available.
n.a. = Not available.
36. BEEPS data also indicate that the power supply is more unreliable in Bishkek and
Dushanbe than in Almaty (table 2.1). The economic impact of power unreliability is important in
the Kyrgyz Republic and Tajikistan given estimated losses of 13 and 19 percent, respectively, of
the value of annual sales. The unevenness of the power supply in Dushanbe makes the situation
there worse than the reported figure, with 40 percent of Tajikistan‘s total electricity supply
directed to the unprofitable state-owned Tajikistan Aluminum Company, which manufactures
aluminum products from imported ores.
37. While firms in Almaty experience greater difficulties in obtaining telephone mainlines
than do firms in Bishkek and Dushanbe, firms in Almaty are more likely to use information and
communication technology (ICT). ICT plays an important role in reducing the economic distance
to markets and integrating urban centers. Such technology helps with negotiations, reduces the
need for travel and transportation, and reduces information distortions by allowing easy cross-
checking of available information.
38. Despite significant recent progress, Kazakhstan, the Kyrgyz Republic, and Tajikistan lag
substantially behind developed countries with respect to the Internet and the ICT sector in general
(table 2.2). For example, in developed countries, 20 to 36 percent of the population connects to

-24-
the Internet via broadband, compared with 7 to 14 percent with a basic Internet connection overall
in Kazakhstan, the Kyrgyz Republic, and Tajikistan. Total Internet traffic in Kazakhstan in 2008
was only marginally higher than that in Tajikistan (table 2.2), perhaps because of higher prices
paid by business users than by household users in Kazakhstan.
Table 2.2. ICT Performance in Kazakhstan, the Kyrgyz Republic, and Tajikistan, 2007
Item Kazakhstan
Kyrgyz
Republic Tajikistan
Mobile cellular subscriptions (percent) 80 41 35
Telephone lines (percent) 21 9 5
Internet users (percent) 12 14 7
Digital subscriber lines (monthly payment, USD) a 31 265 104
Internet traffic (incoming + outgoing, terabytes) a 67,539 n.a. 56,000
Source: World Development Indicators database; countries‘ statistical agencies.
n.a. = Not available. a Data are for 2008.
39. Unleashing the potential of Central Asia‘s leading cities will require collaborative
initiatives to scale up infrastructure related to ICT, power supplies, and financial markets. By
coordinating and cooperating on providing and improving infrastructure, smaller countries can
benefit from economies of scale. The World Bank (2009c) identifies three types of regional
infrastructure that enhance productivity, mobility, and trade between countries:
Productivity-enhancing regional infrastructure. While private firms generally provide
regional infrastructure when doing so is profitable—for example, the South Atlantic 3
marine cable that connects West Africa to the global fiber optic network—regional
cooperation can help build a sound regulatory framework, as illustrated by rising use of
mobile telephones and the Internet in many developing countries. This increases
productivity and enhances both intraregional and global trade, for instance, by keeping
traders informed about problems along transit corridors and reducing the costs and risks
of transport.
Mobility-enhancing regional infrastructure. Developing countries need to foster mobility
of production factors. Regional cooperation on financial infrastructure can increase
capital mobility, especially vital for small countries, because small financial markets lack
economies of scale and tend to be less competitive and less efficient. Small financial
markets are also more likely to be incomplete and less able to diversify investments and
operational risks. In addition, regulatory infrastructure tends to be more costly and of
lower quality than in large markets, and ancillary services such as credit information are
more difficult to maintain in smaller markets.
Trade-enhancing regional infrastructure. Good transport infrastructure reduces transport
costs, which in turn increases trade flows. Upgrading roads in Central Asia could have a
major impact on trade, exceeding the likely gains from tariff reductions or trade

-25-
facilitation programs (Shepherd and Wilson 2006). However, physical upgrades alone
may not be sufficient. Traders face significant bureaucratic delays and other delays, both
at border crossings and within countries, highlighting the need for complementary
behind-the-border and beyond-the-border reforms.
Overcrowded Urban Transportation Systems
40. Kazakhstan‘s first sector-specific loan from the World Bank, in 1994, was for an urban
transport project (World Bank 1999). One objective was to restore public transport capacity to
adequate levels of service quality in its three largest cities, Almaty, Karaganda, and Shymkent;
the project was extended to Astana in 1997, when it became the capital. Another objective was to
improve the institutional framework for urban transport by making municipal bus fleets legally
independent of local governments and allowing all qualified operators, private and public, to offer
public transport services. This project stimulated the emergence of thriving urban transport
services across the country, to a point where the main challenge now is the large number of
individual transport service providers operating under different regulatory provisions. Indeed,
after city governments began awarding route licenses by competitive bidding, many small private
operators have also exercised their right to do business without route licenses under general
competition laws. The lively competition has greatly benefited the traveling public and kept fares
low. But the overlapping of these two mutually exclusive approaches (competition for market
share and competition in the market) has caused confusion among operators and has exacerbated
their already precarious financial situation.
41. This regulatory challenge also needs to be addressed in the Kyrgyz Republic and
Tajikistan. In addition to regulation constraints, the leading cities of both the Kyrgyz Republic
and Tajikistan also face decaying urban roads because of poor maintenance. Intra-urban roads in
Bishkek and Osh are in particularly poor condition, with potholes along major arteries more the
rule than the exception. Municipal budgets and national road funds, the main sources of financing
for repairing and maintaining urban roads, are insufficient even to cover routine repairs. What is
needed is a more sustainable way to ensure the competitiveness of each country‘s two leading
cities, at least, by providing them with urban road networks and appropriate transport regulations.
Underdeveloped Distribution Systems
42. Shops and bazaars are the main distribution outlets in many Central Asian cities, although
to a somewhat lesser extent in Almaty and Astana, where trade firms (formally registered
distribution service providers) account for 55 percent of goods distributed and bazaars account for
45 percent. In 2007, Almaty had 51 bazaars with 15,687 trading spots for 9,014 trade firms, of
which 2,912 were retail stores. By contrast, Astana had just 24 bazaars with 13,815 trading spots
for 3,004 trade firms, of which 994 were retail stores—the lowest such numbers for any oblast in
Kazakhstan.
43. The World Bank (2009a) documents the role that bazaars play in trade in Central Asia.
The study describes three types of bazaars: international bazaars, which service the domestic
market and also supply bazaars in other Central Asian countries and in Russia, operating as
regional distribution hubs (table 2.3); countrywide bazaars, which target a large part of a country;
and local bazaars, usually located in urban areas and targeting the local urban population.
International hub bazaars offer a wide range of products and often act as re-export platforms as
well as venues for exports of domestic products. Bazaars are cheaper to build than more formal
trade venues, such as malls, and this major advantage helps explain the rapid expansion of
bazaars over the last decade.

-26-
Table 2.3. International Bazaars, Selected Cities, 2008
Bazaar and city
Number
of sales outlets
Estimated
monthly sales
(USD millions)
Share of estimated
monthly sales that
is wholesale
(percent)
Barakholka, Almaty 15,450 211 60
Dordoi, Bishkek 40,300 331 80
Karasuu, Osh 10,200 94 80
Korvon, Dushanbe 5,430 19 30
Source: World Bank (2009a).
44. Although the largest bazaars seem to be efficient in facilitating interactions between
traders and sellers, most bazaars lack modern sanitation and storage systems, raising hygiene and
food safety concerns, and tend to have poor water and electricity services. Some of the bazaars
are literally wet markets with mud surrounding the stalls. The bazaars also add to urban
congestion. To unleash the potential of their distribution service in leading cities, policy makers
must find the right balance between allowing this traditional distribution channel to thrive while
ensuring that bazaars are endowed with the minimum public amenities needed to guarantee food
safety and traders‘ security. Programs undertaken in East and Southeast Asia to upgrade the
traditional distribution sector provide some insights on how to proceed (box 2.1). A number of
developing countries have adopted policies that encourage the development of supermarkets and
that regulate wet markets to modernize commerce, lower food prices and congestion, and increase
public hygiene and economic competitiveness.

-27-
Box 2.1. Policies for Competitiveness with Inclusiveness in the Supermarket Revolution,
East and Southeast Asia
As the supermarket revolution proceeds in developing countries, governments have several options for
helping small farmers participate in supermarket channels (or gain access to viable alternatives) and
helping traditional retailers coexist or compete with the modern retail sector.
Option 1: regulate modern retail. To the extent that developing countries have regulated modern retail
trade, their goal has been to reduce the speed and scope of its spread to protect traditional distribution
channels. Regulations have mainly limited the location and hours of modern retail sales. On balance, these
regulations have done little to limit the spread of supermarkets. While the regulations tend to target large
stores—and thus do not limit small, traditional stores—modern retail outlets come in a wide variety of
formats, including neighborhood stores and convenience stores. Few developing countries have policies
that favor traditional or mall retail outlets. Instead, most developing countries usually take a laissez-faire
approach to small shops and hawkers and make minimum public investments in open and covered
municipal markets.
Option 2: upgrade traditional retail. A number of good examples of programs to upgrade traditional retail
outlets exist, for example, in China; Hong Kong, China; the Philippines; Singapore; and Taiwan, China.
In most of these economies, the programs are municipal, sometimes falling under a national umbrella
policy. The programs
have several elements in common. The governments involved in these programs have a ―broad
tent‖ approach, allowing the development of supermarkets as well as of traditional retailers.
are proactive. The Hong Kong, China, Consumer Council‘s dictum of ―managing and facilitating
change,‖ rather than leaving wet markets to founder and collapse, characterizes all the East and
Southeast Asian approaches studied, for example.
promote modernization and competitiveness of traditional retailers. Singapore‘s approach, for
instance, is to cherish but upgrade, while Hong Kong, China‘s, policy is to retain but modernize.
accept the social and market roles of wet markets, hawkers, and small traditional shops, but
encourage them to locate in uncongested areas and on fixed sites and providing training for
operators in business skills, food safety, and hygiene. This results in improved hygiene and
increased tax payments, while helping improve their physical infrastructure.
experiment with privatizing wet market management in some cases, for instance, as in China and
in Hong Kong, China.
Option 3: upgrade wholesale markets to better serve retailers and farmers. Small shops and wet market
stall operators typically source their products from wholesale markets, which typically buy from small
farmers. Upgrading wholesale markets‘ infrastructure and services is thus important to the whole
traditional supply chain. Private sector actors are helping traditional retailers (and supermarket
independents and chains) obtain the services and products they need. Examples are modern cash-and-
carry chains that act as wholesalers, such as Bharti/Wal-mart in India, Metro in China, and Marko in
Pakistan. However, governments and wholesalers‘ associations also need to invest in upgrading wholesale
markets to maximize access by farmers and retailers. Such programs have been undertaken in China.
Option 4: help farmers become competitive suppliers to supermarkets. Private sector programs are
emerging to help small farmers acquire the assets and services they need to supply supermarkets. China‘s
Metro, for example, has direct procurement links to fish and vegetable farmers. Agrifood businesses in
India, such as ITC, Tata, Godrej, Reliance, and DSCL Hariyali, have rural business hubs that offer
consumable farm inputs and technical assistance to farmers and procure from farmers. Governments need

-28-
to supplement private efforts with public investments in improving farmers‘ access to assets, services,
training, and information. Some of these assets are public goods, such as regulations on relationships
between retailers and suppliers to promote fair commercial practices, wholesale market upgrading, market
information, and physical infrastructure such as cold chains and roads. Other assets are semipublic or
private goods, such as assisting with market links between small farmers‘ cooperatives and supermarket
chains; providing training in postharvest handling; and providing credit facilities for making the kinds of
on-farm investments needed to meet quality and volume requirements, such as irrigation systems and
greenhouses.
Source: Adapted from Reardon and Gulati 2008.
45. Another important constraint facing the distribution sector in Central Asia‘s leading cities
is inadequate storage facilities. While Kazakhstan is well ahead of the two other countries in
terms of storage, problems exist in all six leading cities. Kazakhstan‘s overall storage capacity is
estimated at more than 5 million square meters, with nearly 30 percent in Almaty and Astana
alone. Almaty offers dozens of storage facilities with rail access as well as facilities to store
railroad cars. The cost of storing a railroad car is approximately USD 300 for the first 10 days and
USD 0.9 per cubic meter per day thereafter; the cost of storing an 86-cubic meter truck is about
USD 167 for the first 10 days. Approximately 45,000 square meters of cold storage exist close to
the airport, with more in surrounding areas and further away. Cold, warm, and dry storage are all
available. Representatives of all the facilities interviewed for this study noted that they charge
rent by the month, with the average cost for dry storage per square meter, inclusive of value
added tax, utilities, and security about USD 5 per month, and that for cold or warm storage, about
USD 8 per month, with long-term leases negotiable on 10-year terms (Global Development
Solutions 2009).
46. Kyrgyz entrepreneurs interviewed for this study report uncompetitive behavior in the
storage sector in Almaty, where storage space is readily available for Kazakh entrepreneurs, but
entrepreneurs from other countries appear subject to rent-seeking. This practice prevents
modernization of agriculture, due to limited storage capacity in the Kyrgyz Republic (table 2.4).
Furthermore, in the hinterlands of the two leading Kyrgyz cities, farmers are reluctant to store
their produce in storage facilities because of frequent electricity outages; the facilities are
underutilized, old, and, in many cases, failing. New cold storage units need to be built; at a
minimum, many old units need to be repaired.

-29-
Table 2.4. Storage Capacity, Leading Cities and Their Hinterlands, Kyrgyz Republic,
2008
Location
Number of
Warehouses
Total storage
capacity (in m2)
Total cold
storage
capacity (in tons)
Kyrgyz Republic 2,053 350,428 3,848
Osh 209 31,306 51
Aravanski - 0 0
Kara-Suu 7 510 0
Uzgen 1 220 0
Batken 29 1,579.00 7
Bishkek 884 248,870.40 3,631
Kara-Balta 10 2,475 0
Kant 4 400 0
Tokmok 0 0 0 Source: Statistical Agency, Kyrgyz Republic.
47. The situation is not much better in Tajikistan, where most storage facilities were built
during the Soviet era and few have been renovated since. Many Tajik storage facilities are
operating inefficiently, are not working at full capacity, and do not meet current needs.
Mennonite Economic Development Associates (2005) evaluated service providers for the fruit
and vegetables processing sector in the Sughd region (capital, Khujand) in December 2005;
according to their data, storage facilities in the districts of Bobojon Gafurov, Isfara, Istaravshan,
and Kanibadam are, on average, filled to only 18 percent of their total capacity. Much of the fruit
and vegetable harvests every year spoil because of inadequate or no storage facilities. Even
though prices of agricultural produce increase in the winter, farmers still prefer to sell their
produce at a lower price during the harvest season, rather than risk storage to sell their produce in
the winter. While the Sughd region seems to have ample storage facilities (table 2.5), unreliable
electricity supply is a major constraint given that electricity is rationed during the winter in
Tajikistan and storage facilities are not guaranteed access to electricity.

-30-
Table 2.5. Storage Facilities, Sughd Region Districts, Tajikistan, 2006
District
Fixed asset
value
(USD
thousands)
Number of
warehouses
Storage area
(m2)
Vegetables
stored (tons)
Melons
stored (tons)
Nuts stored
(tons)
Asht 17 3 181 30 9 0.3
Bobojon
Gafurov 2 4 900 300 0 55.0
Isfara 246 3 3,500 190 38 5.0
Istaravshan 51 2 385 300 95 6.0
Jabbor
Rasulov 86 3 657 110 3 45.0
Kanibadam 85 2 496 165 36 2.0
Mastchoh 20 2 132 35 15 0.0
Spitamen 11 2 500 140 25 0.0
Zafarabad 4 1 60 160 55 3.0
Source: Global Development Solutions 2009.
Constrained Business Environment
48. Heavy administrative burdens on firms, such as frequent and lengthy inspections, bribe
extortions, and excessive involvement of the political elite in business, tend to weaken property
rights, threaten profits, and reduce a country‘s attractiveness to domestic and foreign investors. In
countries with weak institutions such as Kazakhstan, the Kyrgyz Republic, and Tajikistan,
overcoming these kinds of constraints may take a long time. If leading cities could improve their
business environment, this could initiate transformation of the private sector. But firms in all six
leading cities face obstacles in both their internal and external operating environments.
49. Constrained Internal Operating Environment. The latest BEEPS surveys raise major
concerns about the internal business environment for firms operating in Central Asia. Just 11
percent of firm representatives interviewed in Kazakhstan, 16 percent of those in the Kyrgyz
Republic, and 17 percent of those in Tajikistan reported having an internationally recognized
quality certificate; this compares with 43 percent in Chad, one of the world‘s poorest countries.
Only 15 percent of the interviewees in Kazakhstan, 19 percent in the Kyrgyz Republic, and 24
percent in Tajikistan reported using technologies licensed from foreign companies, compared
with 36 percent in Mozambique; and only 27 percent of interviewees in Kazakhstan, 26 percent in
the Kyrgyz Republic, and 21 percent in Tajikistan reported having their own Web sites, compared
with 63 percent in Armenia. Of firm employees interviewed, only 21 percent in Kazakhstan, 16
percent in the Kyrgyz Republic, and 22 percent in Tajikistan were offered some kind of formal
training, compared with 63 percent in Kenya.
50. These statistics are well illustrated by the case of Ojsc Textilshik, a textile firm located at
the periphery of Osh that is serviced by a railway junction, a high voltage power line, and hot
water pipes. The plant covers 40 hectares, including an 8-hectare factory that produces textile
products. Formerly one of the leading firms in Osh and employing thousands of people, the plant
closed because of decreasing demand during the global recession of 2008. The firm‘s major
constraint to repositioning itself in the competitive textile sector is its obsolete production
equipment, which cannot compete with more efficient producers in China and Turkey. The firm is
seeking foreign investors to upgrade its equipment and expand the reach of its products, but

-31-
potential investors have so far been discouraged by perceived low returns to investment, along
with the current economic downturn. The firm‘s situation is echoed across Central Asia, where
the bulk of production equipment still dates back to the Soviet area.
51. Another constraint to industrial expansion, particularly in the food and textile industries,
appears to be fragmentation of the production chain into small-scale, poorly equipped operators.
Such fragmentation leads to low quality and low quantity of raw materials for the food industry,
and therefore to safety and quality issues. Fragmentation has also blocked development of a
shadow textiles sector, whose production and market knowledge cannot be harnessed to scale up
the sector.
52. While Kazakh, Kyrgyz, and Tajik food products have so far enjoyed easy access to CIS
markets, the increasing share of supermarkets in Russia‘s retail trade will soon make food safety
and quality the main binding constraints facing exports to CIS markets. Almaty and Astana are
following the Russian lead. CIS standards, which are the same standards employed in the former
Soviet Union, have little modern relevance, given their poor oversight and safety mechanisms.
More robust systems for managing microbiological risks are therefore needed (Wrathall and
Haigh 2005). As many countries have adopted the hazard analysis critical control point (HACCP)
system as their reference food safety systems, successful export diversification in Central Asia
should include HACCP certification of all firms involved in the production chain to jump start
and sustain expansion of the food industry.
53. Urban consumers‘ tastes and quality perceptions are becoming a major factor in
production of food and textiles. Wrathall and Haigh (2005, p. 12) define nonexportable products
as ―anonymous products, poorly labeled, in unfashionable, outdated packaging that are difficult to
store and even more difficult to open, with indifferent, inconsistent quality, with sensory and
physical characteristics impaired by insensitive over-processing, produced in indifferent
surroundings that are unclean and unhygienic by untrained staff.‖ The need to address these kinds
of issues sets the agenda for export diversification in Central Asian cities. All the necessary
upgrading processes are increasing returns to scale activities and could benefit from coordinated
implementation involving leading cities and their hinterlands through public-private partnerships.
54. Constrained External Operating Environment. The country-level BEEPS indicators
provide a broad look at the external environment in which firms in leading Central Asian cities
are operating. The most challenging issues appear to be permits and licensing, regulation and tax
issues, and corruption (table 2.6). With respect to permits and licensing, the average indicator
values for the three countries overall appear to be better than for Europe and Central Asia as a
whole, although some of the individual country indicators are worse. The situation appears to be
worse in Kazakhstan than in the Kyrgyz Republic and Tajikistan, although Kazakhstan fares
slightly better on regulation and tax issues. The corruption indicators for all three Central Asian
countries are worse than the average for Europe and Central Asia, although the main source of
corruption may differ in each one.

-32-
Table 2.6. External Business Environment Constraints,
Kazakhstan, the Kyrgyz Republic, Tajikistan, and Europe and Central Asia
BEEPS indicators
Europe &
Central
Asia, 2009
Kazakhstan,
2009
Kyrgyz
Republic,
2009
Tajikistan,
2008
Permits and
Licensing
Number of days to obtain an
operating license 26 32 18 23
Number of days to obtain a
construction-related permit 78 68 65 63
Number of days to obtain an
import license 16 23 10 14
Percentage of firms
identifying business licensing
and permits as a major
constraint 16 25 16 17
Regulation
and tax
issues
Percentage of senior
management time spent on
dealing
with requirements of
government regulations 11 5 5 12
Average number of visits or
required meetings with tax
officials in a typical month 2 3 2 2
Percentage of firms
identifying tax rates as a
major constraint 40 46 48 56
Percentage of firms
identifying tax administration
as major constraint 21 24 32 17
Corruption
Percentage of firms expected
to pay informal payments
to public officials (to get
things done) 17 23 38 41
Percentage of firms expected
to give gifts to get an
operating license 13 30 26 39
Percentage of firms expected
to give gifts at meetings with
tax officials 13 25 39 33
Percentage of firms expected
to give gifts to secure a
government contract 26 55 56 31
Percentage of firms
identifying corruption as a
major constraint 34 44 59 38 Source: BEEPS data.
55. To determine how private operators involved in trade were faring in the current business
environment, a survey covering distribution and transport logistics service firms was conducted
for this study in the six leading cities (M-Vector 2009a, 2009b, 2009c). Major constraints to the
business environment (table 2.7) include the two most common administrative barriers reported:
unregulated competition from the informal sector (leading to high congestion costs and a
distribution and transport logistics services sector that is financially nonviable); and too much

-33-
involvement by officials in the business sphere (increasing their opportunities for extorting
bribes). Respondents reported that public services whose quality most affects distribution and
logistics service firms are tax administration, communication services, and electricity supply,
reflecting poor backbone infrastructure endowments in the cities. Respondents also mentioned
customs and trade regulation, high utility costs, and lack of qualified people as external factors
adding to the poor business climate.
Table 2.7. Main Business Environment Constraints Facing Distribution and Transport
Service Firms, Leading Cities of Kazakhstan, the Kyrgyz Republic, and Tajikistan, 2009
Constraint
Astana and Almaty,
Kazakhstan
Bishkek and Osh,
Kyrgyz Republic
Dushanbe and
Khujand, Tajikistan
Top three bureaucratic
issues affecting transport
and logistics services
Unregulated
competition from
the informal sector
Rules of the game
are unpredictable
Lack of clear
regulations in some
areas
Rules and
regulations change
too frequently
Rules of the game
are unpredictable
Unregulated
competition from
the informal sector
Public services are
unpredictable and
wages are too high
Unregulated
competition from the
informal sector
Too much time spent
on dealing with
authorities
Top three public services
affecting transport and
logistics services
Tax administration
Telephone and
Internet access
Electricity supply
Tax administration
Electricity supply
Telephone and
Internet access
Electricity supply
Tax administration
Business licensing and
operating permits
Top three other external
factors affecting transport
and logistics services
Utility costs
Customs and trade
regulations
Lack of qualified
people
Customs and trade
regulations
Utility costs
Lack of qualified
people
Customs and trade
regulations
Lack of qualified
people
Anticorruption policy Source: M-Vector 2009a, 2009b, 2009c.
56. Distribution and transport companies tend to sell almost all their products or services
within a specific country. For instance, Almaty-based companies sell 95 percent of their products
or services within Kazakhstan, and of the 54 percent who intend to expand their businesses, 42
percent want to expand outside Astana and Almaty, but within Kazakhstan (the highest
proportion of the six cities surveyed). Similar situations in the five other leading cities translate
into high transport costs, as illustrated by the case of Tajikistan, where domestic transport costs
between Dushanbe and Khujand are higher than the cost of exporting a container of the same
weight from Moldova to the United States (table 2.8).

-34-
Table 2.8. Domestic Freight Rates, Tajikistan, 2009
Distance (km) USD per 10 tons of freight
Within Dushanbe 12 14–112
Dushanbe–Tursunzade 56 242
Dushanbe–Kurgan-tyube 99 546
Dushanbe–Kulyab 204 909
Dushanbe–Nijny Panj 206 1,091
Dushanbe–Jirgatal 287 1,697
Moldova to United Statesa 7,668 1,895
Dushanbe–Khujand 341 1,940
Dushanbe–Kanibadan 421 2,424
Dushanbe–Isfara 448 2,546
Dushanbe–Khorog 524 2,606 Source: International Finance Corporation and World Bank 2009; Ministry of Transport, Tajikistan. aData from Doing Business 2009.
The Constraints to Market Accessibility across Countries
57. Central Asia‘s transport network was built to reinforce the interdependence of the then
Soviet republics, whereas conflicting economic interests now make cooperation difficult. A
second-best solution would be to identify common economic interests between Kazakhstan, the
Kyrgyz Republic, and Tajikistan and mobilize policy makers and business communities to
cooperate on a regional initiative, with the understanding that such cooperation could result in
increasing returns to scale in transport and logistics. By cooperating with Kazakhstan on transport
and trade logistics, the Kyrgyz Republic and Tajikistan could significantly improve their market
accessibility. The main constraints to market accessibility fall into two categories: transport and
logistics services, and international transit.
Constrained Transport and Logistics Services
58. A recent World Bank (2009b) study identified the three major factors affecting transport
costs in landlocked developing countries as unreliability of deliveries, monopolistic trucking
services, and unnecessary overheads and informal payments. Few traders in landlocked
developing countries have access to door-to-door logistics services and instead rely on an
extended chain of distinct operations involving many procedures, agencies, and services, all of
them prone to rent-seeking and overregulation. Transporters along trade corridors operate under
systems that limit productivity, discourage competition, and often perpetuate poor quality
services and excess capacity, raising prices up to as much as double what they should be. The
study estimates that the complications of border crossings add additional overhead charges that
make prices to shippers between 150 and 200 percent higher than costs borne by transport
providers. This cumbersome environment is confirmed by field work conducted in Central Asia
for this study (Global Development Solutions 2009; M-Vector 2009a, 2009b, 2009c; Thomsen
2009) that revealed a constrained business environment leading to untapped backhaul cargo
capacity. The increasing cargo capacity bringing imports to Central Asia could be harnessed to
scale up exports to the countries of origin of these trucks.
59. A two-tiered trucking industry seems to have emerged in Kazakhstan, the Kyrgyz
Republic, and Tajikistan. This consists of a modern sector using relatively new, environmentally
clean, safe trucks that offer higher-quality service at a higher price, and an informal sector that

-35-
offers low tariffs by using old, polluting, and possibly unreliable and unsafe trucks. As the World
Bank (2009b) highlights, this two-tiered system can create a dilemma for regulators, who in
principle should strive to enhance the workings of the market while balancing the interests of
customers, carriers, and the environment, and among carriers, who balance the interests of the
modern and informal sectors. More often than not, the regulators are captured by the modern
sector and may design a queuing system to keep informal operators out of the organized part of
the market and keep tariffs high. Yet the system also allows the truckers‘ associations who
manage the system to charge commissions as forced intermediaries between shippers and carriers.
This tends to reduce truck utilization, increasing unit costs per ton-km of carriage. Restricting
competition protects monopolistic pricing and inhibits the development of higher-quality services
required by modern supply chains.
60. Another problem is the inability to utilize available cargo capacity. Most traffic is one-
way, mainly bringing cargo from China to Central Asia. This is due to sizable Chinese customs
duties, high transport costs within Central Asia, and poor cargo consolidation services.
61. Although the Osh–Bishkek–Almaty and Osh–Batken–Khujand routes are used for both
imports and exports, the Osh–Sary Tash–Irkeshtam road in the south of the Kyrgyz Republic has
so far been used only to import Chinese goods to the Kara Suu bazaar (figure 2.2). Of the 30
transport companies operating in Kara Suu, only three import products from Dubai, the Islamic
Republic of Iran, and Turkey (through Uzbekistan), while all the other firms import from China
via the Osh–Sary Tash–Irkeshtam road (highlighted in yellow in figure 2.2). Goods imported are
garments, electronics, and some food products (cotton oil and rice), with nonfood products
representing more than 95 percent of the imports. Transporting a 25-ton truck from China costs
from USD 3,500 to USD 4,000, but goods are reloaded onto smaller trucks at Irkeshtam to pass
through the mountainous border region.

-36-
Figure 2.1. The Kyrgyz Republic’s Direct Connections to China
(CLEARED BY WB CARTOGRAPHER)
Source: Authors.
62. The Tajik situation illustrates how many more Central Asian products could reach
regional markets by using the cargo capacity of empty trucks departing the leading cities.
Thousands of trucks leave Tajikistan empty each year. Between 2007 and 2008, the number of
empty trucks departing from Tajikistan increased by 10,000 to reach 21,317 (table 2.9). Of empty
trucks departing in 2008, 43 percent were Tajik trucks and 42 percent were from non–CIS
countries. By facilitating freight consolidation services, Tajikistan could tap into this potential to
scale up its existing exports of agricultural and agro-processed products.
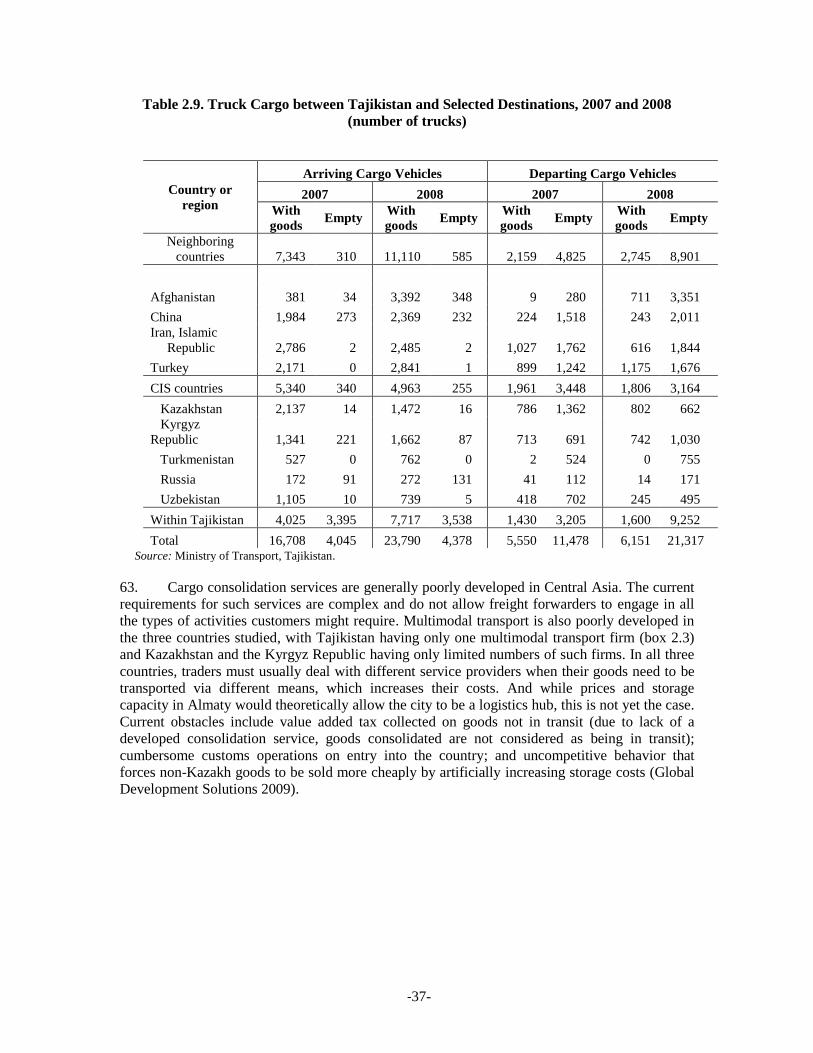
-37-
Table 2.9. Truck Cargo between Tajikistan and Selected Destinations, 2007 and 2008
(number of trucks)
Country or
region
Arriving Cargo Vehicles Departing Cargo Vehicles
2007 2008 2007 2008
With
goods Empty
With
goods Empty
With
goods Empty
With
goods Empty
Neighboring
countries 7,343 310 11,110 585 2,159 4,825 2,745 8,901
Afghanistan 381 34 3,392 348 9 280 711 3,351
China 1,984 273 2,369 232 224 1,518 243 2,011
Iran, Islamic
Republic 2,786 2 2,485 2 1,027 1,762 616 1,844
Turkey 2,171 0 2,841 1 899 1,242 1,175 1,676
CIS countries 5,340 340 4,963 255 1,961 3,448 1,806 3,164
Kazakhstan 2,137 14 1,472 16 786 1,362 802 662
Kyrgyz
Republic 1,341 221 1,662 87 713 691 742 1,030
Turkmenistan 527 0 762 0 2 524 0 755
Russia 172 91 272 131 41 112 14 171
Uzbekistan 1,105 10 739 5 418 702 245 495
Within Tajikistan 4,025 3,395 7,717 3,538 1,430 3,205 1,600 9,252
Total 16,708 4,045 23,790 4,378 5,550 11,478 6,151 21,317 Source: Ministry of Transport, Tajikistan.
63. Cargo consolidation services are generally poorly developed in Central Asia. The current
requirements for such services are complex and do not allow freight forwarders to engage in all
the types of activities customers might require. Multimodal transport is also poorly developed in
the three countries studied, with Tajikistan having only one multimodal transport firm (box 2.3)
and Kazakhstan and the Kyrgyz Republic having only limited numbers of such firms. In all three
countries, traders must usually deal with different service providers when their goods need to be
transported via different means, which increases their costs. And while prices and storage
capacity in Almaty would theoretically allow the city to be a logistics hub, this is not yet the case.
Current obstacles include value added tax collected on goods not in transit (due to lack of a
developed consolidation service, goods consolidated are not considered as being in transit);
cumbersome customs operations on entry into the country; and uncompetitive behavior that
forces non-Kazakh goods to be sold more cheaply by artificially increasing storage costs (Global
Development Solutions 2009).

-38-
Box 2.2. Yashar Bar, a Multimodal Freight Forwarding Company Operating from Khujand
In 2002, Yashar Bar, an Iranian trucking company, established a Tajik affiliate in Khujand to provide
multimodal transport services by using empty Iranian trucks to export Tajik products to China, Korea,
Thailand, and Vietnam. The goods are transported to the port of Bandar-Abbas in the Islamic Republic of
Iran, which takes 8 to 10 days, and then shipped overseas. The company uses the same modes of transport
(road and sea) to export ginned cotton, silk, hides, and other products from Tajikistan and to import tea and
coffee from India and various consumer goods from Indonesia, Malaysia, and the Persian Gulf countries.
In 2009, shipping a 20-foot container to Bandar-Abbas cost USD 1,800, including insurance, from Khujand
and about USD 2,000 from Dushanbe. Shipping a 40-foot container from Dushanbe or Khujand to Bandar-
Abbas cost USD 2,650, compared with USD 1,800 from Tashkent. But, these tariffs can vary substantially.
The return trip from Tajikistan is cheaper if the product transported does not require refrigeration.
Transport from Dushanbe sometimes requires filling in two invoices to avoid the additional costs of using a
40-foot container for shipping freight insufficient to fill up such a container. In such cases, the company
pays for trucks to transport such small cargos and consolidates them in Khujand before shipping to Bandar-
Abbas, although domestic freight rates can be high.
Since Yashar Bar started its operations in Khujand, the company has transported Tajik goods worth USD
12 million, which suggests that the freight consolidation concept could be scaled up to improve the market
accessibility of Tajik products.
Source: Interview by a local consultant with a Yashar Bar representative in Khujand, May 2009.
Challenges Posed by International Transit
64. Given their challenging physical geography and limited domestic markets, Central Asian
countries need to promote trade and become globally integrated to improve their export
competitiveness. In doing so, however, they face numerous hurdles, such as border delays, visa
requirements, corruption, and poor transport facilities, which make international transit a
significant challenge. Inefficient border crossing operations are the second most important market
accessibility constraint facing Central Asia‘s leading cities and are particularly burdensome along
the north–south road corridor linking the six leading cities.
65. Constraints along the North–South Road Corridor. Inefficiencies along the north–south
corridor, as well as for the other corridors crossing Central Asia, include customs valuation
problems, inefficiencies at border crossing points, uncertainty created by transit through
Uzbekistan, and costs of informal payments and convoying. Across the entire region, customs
valuation is unclear and inconsistent and is based mainly on importers‘ declared value or weight,
which favors informal payments to lower the valuation and which also reduces customs proceeds.
Customs declarations are largely handled manually, although they are partly automated in
Kazakhstan and the Kyrgyz Republic. The documents required for clearance vary from country to
country and are excessively numerous (10 to 13 documents, compared with 6 in Moldova). In
addition, brokerage services for customs operations seem quite expensive for small and medium-
sized traders: USD 150 in the Kyrgyz Republic, USD 250 in Tajikistan, and USD 300 in
Kazakhstan for a typical declaration.
66. Two other sources of inefficiency in border crossing-related operations are the limited
use of risk management to control trucks and of payment guarantees. By regulation in all three
countries, all import cargo must be unloaded for inspection prior to clearance and release (no risk

-39-
management), a costly and time-consuming process that encourages informal payments to speed
it up. In the Kyrgyz Republic and Tajikistan, customs payments are made directly to customs
officers, increasing informal payments and corruption; no bank or guarantee system is in use.
Kazakhstan‘s customs guarantee system handles each customs-related operation separately—in-
bond transportation, bonded warehousing, and customs brokerage—thus promoting informal
payments to simplify the procedure.
67. Another challenge is that transiting Uzbekistan by either road or rail creates uncertainties
about delivery times and costs. Otherwise, Central Asian countries would likely diversify their
food product exports to Afghanistan, Bahrain, Jordan, and the United Arab Emirates. Transiting
through Uzbekistan is also becoming increasingly difficult, with Kyrgyz and Tajik truckers
reporting many breaches of Transport International Routier seals—a violation of international
transit law that increases delays and uncertainty about final delivery. In addition to official transit
fees of USD 300 per truck (plus an extra USD 30 for non-Transport International Routier trucks),
truckers are assessed an estimated USD 1,000 in informal payments per truck. Non-Uzbek
Central Asian truckers need a visa to drive through Uzbekistan and must pay an escort fee of
USD 1 per kilometer. Even Kazakh truckers, who used to pass freely through Uzbekistan, have
now difficulties obtaining third-country transport permits that allow them to transport Uzbek
products on empty Kazakh trucks. In 2006, only 1,000 such permits were issued, one-third of the
3,000 requested. Tajik truckers report that each time they cross Uzbekistan, they are deliberately
delayed for at least four hours, in addition to the time taken for unloading and loading and waiting
at customs control points, thereby incurring additional expenses in bribe payments and operating
costs. Finally, Uzbek border closings have become pervasive; closings in June 2009, for instance,
lasted nearly the entire month, creating disruptions in trade and transport operations.
68. Once the Osh–Batken road that avoids Uzbek territories (road highlighted in green in
figure 2.2) is rehabilitated, and the Anzob and Shakrishtan tunnels between Khujand and
Dushanbe are fully operational, crossing Tajikistan via Isfara, Khujand, Dushanbe, Kurgan Tybe,
and Nijny Panj en route to Kabul will become user-friendly and competitive. This will allow
access to markets such as the Islamic Republic of Iran, Turkey, and the Gulf countries. If the
Kyrgyz Republic and Tajikistan cooperated in a joint declaration to CAREC, listing this corridor
as their first connectivity priority and requesting assistance to speed up its completion, this road
could be added to the list of CAREC priority corridors. Until then, the best road corridor for
traders in the Kyrgyz Republic and Tajikistan is the northern connection via Bishkek, Almaty,
Astana, and Petropavlovsk toward Moscow. Yet despite this corridor‘s better physical condition,
administrative barriers translate into large informal payments that deter trade expansion along this
route.
69. In 2008, the Agribusiness Competitiveness Center in the Kyrgyz Republic conducted a
monitoring study that documented all administrative barriers and informal payments along the
Kyrgyz corridor for a 19-ton refrigerated truck of black cherries from the rural Markaz District in
Batken region to Russia via Osh, Bishkek, Almaty, and Astana (Agribusiness Competitiveness
Center 2008). To obtain the required shipping documents, the local customs office asked for USD
700 (allegedly for informal payments to the financial police, the local government, law
enforcement bodies, the public prosecution department, and other local authorities). By contrast,
the services of a customs broker in Bishkek cost just USD 150. (The only legal requirements are a
land plot ownership certificate to indicate the origins of the product and a purchase certificate,
both free.) Along the way from Osh to Bishkek, the trucker made the following informal
payments at various checkpoints:

-40-
Frontier veterinary quarantine (245 km from Osh), to control the spread of
animal diseases—the trucker paid the equivalent of USD 7 so that the control
agent would not open the refrigerator;
General road directorate (280 km from Osh)—the official fee is USD 60, but the
trucker paid an unofficial fee of USD 30;
Axle load road control terminal in the Jalal-Abad region (295 km from Osh)—the
officer estimated an overload of 1 ton and asked for USD 160, and the trucker
made an informal payment of USD 100; and
Chychkan ecological control terminal (419 km from Osh)—the trucker made an
informal payment of USD 24 to pass through.
70. Truckers driving Kyrgyz trucks incur all these costs on the domestic leg of a journey.
Reportedly, foreign carriers pay almost twice as much. Truckers must also make additional
informal payments of USD 750 while transiting Kazakhstan (for example, for passport
registration, load registration, certificate registration, and Transport International Routier
document checking) and of USD 295 in Russia. Such informal payments can easily add up to
about 5 percent of the value of the products transported.
71. Truckers can face many other challenges, including how long they must stay in transit or
destination countries. Consider a truck going to an EU country. The number of EU members has
increased significantly since 2004, along with the accession of many Eastern and Central
European countries that must now abide by EU regulations governing such matters as how long
truckers may drive without a rest break. Because of such regulations, plus the time needed for
transit, loading, unloading, traffic jams, and so forth, a driver might need to spend up to 20 days
in EU countries. Yet transit visas are valid only for 10 days and visa extensions are not
guaranteed.
72. Finally, in the absence of a guarantee against the value of the load, convoying is usually
required for customs transit under the national road transit systems in Kazakhstan and Russia. But
one major problem with convoying is the high fee charged for the service. According to existing
regulations, customs convoying rates in Kazakhstan range from USD 14 for less than 50
kilometers to USD 900 for more than 2,000 kilometers; in Russia, the fees range from USD 60
for less than 50 kilometers to USD 30 per 100 kilometers beyond 200, with a minimum of USD
180. Usually one customs official escorts convoys of fewer than 10 trucks. A drawback to
convoys is that accumulating sufficient vehicles for a convoy takes time, as much as a day or
more at light traffic border crossing points. Finally, all vehicles in a convoy must arrive at the
exit border crossing point together, causing a significant additional delay for processing.
73. Constraints to the Regional Hub Function of Almaty. Almaty has the potential to serve as
the major Central Asian hub, but those transporting goods via Almaty to reach larger neighboring
economies face many constraints, including the underdevelopment of international logistics and
issues associated with the railway system. Air transport is still extremely expensive. Road
transport is competitive and an area of potential growth, but is still hampered by multiple
informal barriers to international transit and cumbersome border crossing operations.
74. Almaty has 2,050 warehouses, or 14 percent of Kazakhstan‘s 5.3 million square meters of
active warehouse space. The distribution network is quite well developed, with suppliers working
directly with trade firms. Yet in terms of international transportation, Almaty‘s multimodal

-41-
transportation is not well developed, forcing traders to use different freight forwarding companies
for each leg of their shipments. In addition, modern, fully equipped logistic centers that could
provide freight forwarding and customs services at an international level do not yet exist.
75. While rail is the most used mode of transportation in Kazakhstan, the future of rail transit
through Almaty will depend on the city‘s ability to absorb high maintenance costs for planned rail
additions, to overcome problems related to incompatible rail infrastructure between Kazakhstan
and its trading partners, and to remove unnecessary delays and regulatory bottlenecks. The 272
million tons of rail freight transported in Kazakhstan in 2008 are not disaggregated by oblast, so
determining how much rail transport moves in and out of Almaty is difficult. In 2008, a total of
6,750 tons of freight were transported from Almaty by air and 129 million tons by road (appendix
2). Kazakhstan‘s 14 international railway junctions include 9 with Russia, 3 with Uzbekistan, 1
with the Kyrgyz Republic, and 1 with China—at Dostyk–Alashankou, the main railway
connection between China and Central Asia, with traffic going to Aktogai station, then through
Almaty to other destinations (transit trade accounts for only a small share of freight passing
through Dostyk–Alashankou). Estimated carriage costs between Almaty and major regional
markets by different modes of transport are shown in table 2.10.
Table 2.10. Average Carriage Costs to Selected Destinations by way of Almaty, Kazakhstan,
2009
Item
Destination
Delhi Istanbul Moscow Urumqi
Airfreight (USD per 1 kilogram) a 2 1.90 2.20 2
Number of carriers 2 2 3 1
Available tonnage per week (tons) 20+ 20+ 20+ 20+
Dry trucks hauling up to 20 tons (USD/load) n.a. 5,500 4,000 5,000
Refrigerated trucks hauling less than 20 tons
(USD/load) n.a. 6,500 4,500 6,000
Rail (dry), 24 tons in 20-foot container
(USD/container) n.a. 4,000 2,000 1,500
Rail, 55-ton load in 1 wagon (USD/wagon) 20,000 n.a. n.a. n.a.
Cost of storage at point of departure (Almaty)
(USD/m2/month)
n.a. 5-9 n.a. n.a.
Processing fees (USD) n.a. 0-200 n.a. n.a.
Customs fees for export (USD) n.a. 50-500 n.a. n.a.
Bribes (USD) n.a. 300-1,000 n.a. n.a.
Other costs and fees n.a. 0-50 n.a. n.a.
Source: Data from Global Development Solutions 2009.
n.a. = Not available. a Costs are approximations.

-42-
76. Excellent rail connections between Almaty and Moscow do not traverse Uzbekistan.
Turkey and India are accessible via Uzbekistan and Turkmenistan. But because Central Asia‘s
rail gauge is different from the standard gauge used in China and the Islamic Republic of Iran,
and from the separate Indian gauge, shipping fresh produce via rail to China, India, and Turkey
requires reloading, a risky process; produce must also be shipped in containers to lessen potential
damage during unloading and reloading. Such extra hurdles reduce the benefits normally
associated with rail and increase the costs of rail shipments. Yet regardless of destination, rail
remains the most cost-effective way to ship goods that do not require refrigeration, or when
shipment time is not critical.
77. Kazakhstan‘s railways still lack technical capabilities, especially in the fields of
signalization, computer systems, and communication, although its rail system is generally more
mature than those in the Kyrgyz Republic and Tajikistan. Kazakh authorities plan to build two
main railway links totaling 4,800 kilometers from Astana to Aktogai via Pavlodar and Semey and
from Shu and Arys to Kokshetau via Kandyagash in Aktobe Oblast.
78. Railway shippers complain regularly about poor up-front examinations before trips on
rolling stock required by the state railway company, Kazakhstan Temir Zholy, which uses old and
worn-out freight cars. Shippers must lease cars and reorganize wagons to the desired length at
their own expense. Burdensome informal payments, collected via the queuing system managed by
Kazakhstan Temir Zholy, cause delays for shippers waiting to be assigned cars. Because
Kazakhstan Temir Zholy is a quasi-monopoly with limited cars, shippers must submit requests
one month before they require the cars to allow Kazakhstan Temir Zholy time to coordinate
transportation with targeted countries; shippers providing less than a month‘s notice must pay
fines. Such challenges only compound the railway monopoly‘s overall inefficiency. Rail
transport in Kazakhstan will require much more time, effort, and money to achieve full
efficiency, more than either air or road transport.
79. Although much more open to competition than rail, air transport services remain
extremely expensive. All air freight out of Almaty is brokered by a single agent, Europe Asia
Transit, and it is impossible to purchase cargo space directly from any airline. Air cargo rates
from Almaty to key destinations, listed in table 2.11, make the cost of shipping fresh produce to
any of these markets by air prohibitive, even without analyzing other costs involved in growing
and delivering produce to Almaty.
Table 2.3. Cost of Air Freight from Almaty to Selected Destinations, 2009
(USD)
Flat rate Additional cost per kilogram
Destination
Up to 20
kg
20 to 45
kg
46 to 100
kg
101 kg to 300
kg
301 to
500 kg
More than
500 kg
Beijing 64.8 2.60 2.40 2.20 2.20 2.20
Delhi 53.3 2.60 2.40 2.40 1.60 2.00
Istanbul 71.9 3.28 2.20 1.90 1.80 1.60
Moscow 88.4 3.00 2.90 2.20 2.20 2.10
Source: Global Development Solutions 2009.
Note: Urumqi is not shown in the table. Only one airline, China Southern Airlines, flies to Urumqi from Almaty, but
Europe Asia Transit stated that no cost information was available at the time of the study. The following is a
breakdown of the charges.

-43-
• Airlines fees (Astana Air):
Fuel fee: USD 0.14/kg
Invoice fee: USD 11
• Europe Asia Transit fees:
Processing, handling at warehouse: USD 0.13/kg (minimum charge of USD 13)
Air documents: USD 23
Temporary storage warehouse entrance fee: USD 8/entry
Heavy baggage (over 80 kg): USD 11
• Customs procedures:
Broker fee: USD 175 + USD 12 for each additional page of the manifest.
Passport of business owner if invoice is greater than USD 10,000
Documentation of customs value: USD 12/page
Mandatory customs fee: USD 75
• Shipping fresh fruits and vegetables requires a one-time export license from the Committee of Industry and Trade
with the approval of Ministry of Agriculture that is usually free, but requires reporting to various government
entities.
• Normal processing time for all the above is three days, but it can be done in advance or in one day with a minimum
bribe of USD 300.
80. Kazakhstan‘s road transport services are the most competitive of all Central Asian
countries, with haulage rates from Almaty to key destinations shown in Table 2.12. Yet the price
of trucking varies significantly depending on various factors, including truck availability and
direction of travel. A truck hired to go from Almaty to Urumqi, for example, can cost USD
1,500, but if the truck brings goods back from Urumqi to Almaty, the cost may be 4 times as
much. Similarly, dry shipments from Moscow to Almaty, which cost as much as USD 5,000,
ship for 30 percent less (USD 3,500) when shipped from Almaty to Moscow. For refrigerated
trucks, the price could be USD 6,500 from Moscow to Almaty, or USD 1,000 more than from
Almaty to Moscow.
Table 2.12. Haulage Rates and Times for a 86-Square Meter, 19-Ton Truck from Almaty to
Selected Destinations
Destination
Price (USD)
Time (days)
Refrigerated
truck
Canvas-covered
truck
Istanbul 6,500 5,500 10–12
Moscow 4,500 4,000 4–5
Urumqi 5,000 6,000 4–6
Source: Global Development Solutions 2009.
Notes: Rates to India could not be obtained. Rates vary depending on various factors (cargo, season, packaging, and so
on). The rates shown do not include customs procedures at departure and destination points, optional cargo insurance
(0.3 percent of the value of the shipment), and bribes.
81. The rates shown appear reasonable, especially when compared with the cost of trucking
from Bishkek to Moscow, which averages USD 8,000 when using a Kyrgyz company. Kazakh
trucks obviously enjoy some privileges that Kyrgyz and Tajik truckers do not; for example,
Kazakh trucks can cross Uzbekistan relatively more easily than either Kyrgyz or Tajik trucks.
But whether transport is by road or rail (or possibly by air), it appears that everything is subject to
negotiation.
82. Trucking is the most common means of transporting perishable goods out of Almaty. The
large trucking fleet and favorable conditions for Kazakh-registered trucks guarantee availability
and good prices. With Almaty as a transport hub, trucks and railroads (particularly westbound)

-44-
would be the most economically feasible modes of transport. Rail could serve the more durable
commodities (dried fruits and processed goods), while trucks could be used for perishable items
requiring refrigeration and shorter delivery times.

-45-
3. WHY AGGLOMERATION IS IMPORTANT:
POTENTIAL OF LEADING CITIES AS DRIVERS OF
DIVERSIFICATION
83. In the early 1980s, China opened its economy to world trade by establishing four special
economic zones (SEZs) along its southeastern coast in Shantou, Shenzhen, Zhuhai in Guangdong
Province, and Xiamen in Fujian Province. Since then China has established many other SEZs,
and is now the world‘s largest manufacturing country, exporting everything from textiles to
advanced electronic goods. During the same period, Bangladesh also embraced the SEZ idea and
opened the Chittagong export processing zone in the south of the country. Currently, Bangladesh
has eight economic processing zones involved in producing a range of manufactured goods and
run under the auspices of a single authority that promotes the government‘s diversification
strategy. Mauritius provides another early example of successful SEZs. By 1985, goods
manufactured in Mauritian export processing zones overtook traditional sugar exports to become
the country‘s main sources of foreign exchange, employment, and exports. These and other
developing countries such as India, Mexico, and Tunisia have managed to engage successfully in
offshore export diversification strategies by creating SEZs, sometimes going against orthodox
economic advice that focuses first on such reforms as country-wide liberalization.
84. An SEZ can result in trade expansion and growth if it exploits natural and economic
geography advantages, but an SEZ is not an economic panacea. Of more than 2,000 export
processing zones in existence today, few are success stories, possibly because of such
fundamental geographical factors as the size of domestic markets and the lack of access to
leading world markets. So why do some succeed? China has a large domestic economy, and
chose to locate its first SEZs close to Hong Kong, China, with an eye to Japanese and U.S.
markets. Bangladesh wisely sited its Chittagong export processing zones three kilometers from
the country‘s major seaport and seven kilometers from an international airport. Mauritius has
always been a strategic transit point on Indian Ocean transport routes. The success of Mexico‘s
maquiladoras and of Tunisia‘s offshore export sector is due to their proximity to the large U.S.
market, in Mexico‘s case, and to EU markets for Tunisia.
85. By contrast, Central Asian countries must cope with extremely disadvantageous
geography. The Kyrgyz Republic and Tajikistan are cut off from China by high mountain ranges
and deserts, while security concerns in Afghanistan present a transit barrier to the south. The
western route via Turkmenistan and the Islamic Republic of Iran to the port of Bandar Abbas or
to Turkey is considered a second-best alternative because of uneasy relations between Tajikistan
and Uzbekistan; complicated transshipment must occur at the border between Turkmenistan and
the Islamic Republic of Iran, due to the change in railway gauge.
86. Central Asian logistical performances also rank among the poorest in the world. In 2009,
Tajikistan, Kazakhstan, and the Kyrgyz Republic ranked 177th, 180
th, and 181
st, respectively, out
of 181 countries on the Doing Business trading across borders indicator (International Finance
Corporation and World Bank 2009). The number of documents required to export products
ranged from 10 to 13, compared with 6 documents in Moldova; the number of days required to
export a standard container ranged from 64 to 89 compared with 32 days in Moldova; and the
score on the logistics performance index ranged from 1.9 to 2.3 on a scale of 1–5, with 5 being

-46-
the best score. Another example: the location of Almaty, a major regional transportation hub,
more than 4,600 kilometers from the closest seaports of Poti in Georgia and Novorossiysk in
Russia. Astana, Kazakhstan‘s capital and a potential transportation hub, is only 400 to 900
kilometers closer to the ports of northwestern Europe and about the same distance further away
from the ports of Bandar Abbas in the Persian Gulf and Shanghai in China. In addition to such
daunting logistical and geographical challenges, the region lacks economic density. In 2008, the
total population of the five Central Asian countries was 59 million people and their total GDP
was USD 148 billion. Both were unequally distributed, with Kazakhstan and Uzbekistan together
accounting for 71 percent of the region‘s population and 85 percent of the region‘s GDP.
87. Given poor market accessibility, shallow domestic markets, and overspecialization in
natural-resource-intensive products, no offshore export diversification strategy will succeed
unless Central Asian countries adopt bold measures to intensify the production of few
nontraditional export products and improve their connections to markets. By focusing on a few
locations that generate enough agglomeration economies and provide also exit points to regional
and global markets, each government can minimize the costs of such industrialization and
external connectivity. The likeliest locations are each country‘s main cities. Policy measures to
stimulate economic concentration within these leading cities, to tap into the agricultural potential
of the hinterlands of these cities (within an hour‘s drive away from city centers), and to connect
them to regional and global markets through a priority transport corridor will form the basis for a
sound space-based export diversification strategy.
The Competitive Advantage of Leading Cities
88. All around the world, leading cities play a key role in production and export by delivering
a whole range of services sustaining economic activities. Leading cities tend to be well-connected
domestically and externally, and tend to offer the most diversified production in a specific
country. Leading cities in Central Asian countries are no exception.
Leading Cities Have a Diversified Production Structure
89. Common sense suggests that the larger a city, the more diversified it will be to provide
the necessary goods and services for its workers, firms, and consumers. An examination of
subnational statistical data confirms this assumption for Central Asian countries. For Kazakhstan,
the study used more than 300 products, classified as five-digit products using the Standard
International Trade Classification, produced in the 16 oblasts to compute the standardized
Herfindahl index, an indicator of a location‘s diversification.8 For the Kyrgyz Republic, the study
used industrial production data aggregated for 26 sectors for the country‘s nine oblasts. For
Tajikistan, in-kind production data are available for the country‘s five oblasts. After transforming
the subnational in-kind production data into a ranking index to make them comparable, the study
used the data to calculate the standardized Herfindahl index for the three countries by oblast, as
shown below.
8 The standardized Herfindahl index (H*) can be used to easily assess whether a location is diversified or
not diversified:
, where si is the share of sector i in total production and N is the total number
of sectors.

-47-
Figure 3.1. Standardized Herfindahl Index by Oblasts for
Kazakhstan, the Kyrgyz Republic, and Tajikistan, Various Years Kazakhstan The Kyrgyz Republic
Tajikistan
Source: Authors‘ computations based on data from the statistical agencies of Kazakhstan, the Kyrgyz Republic, and Tajikistan.
Note: A location is extremely diversified if the Herfindahl index is less than 0.1, moderately diversified if the index is between 0.1 and 0.3, and
extremely specialized if the index is higher than 0.3.
90. Almaty, Bishkek, and Dushanbe appear to be the most diversified locations in Central
Asia. This result is particularly interesting, because these three cities are more diversified than
larger oblasts containing many cities, towns, and rural settlements, which should boost their
diversification potential. But as shown in figure 3.1, each country offers its own unique situation.

-48-
Almaty, which lost the status of capital to Astana in 1997, remains the most diversified location
in Kazakhstan, just ahead of the oblasts of North Kazakhstan and South Kazakhstan; Astana lags
far behind, in seventh place. Bishkek is the only strongly diversified urban region in the Kyrgyz
Republic; by contrast, Osh appears to be extremely specialized. The oblasts of Kathlon and the
Tajik districts of republican subordination, both geographically close to and relatively well-
connected with Dushanbe, also have strongly diversified production bases; by contrast, Sughd
oblast is only moderately diversified.
91. A look at the top 10 products produced by Kazakhstan‘s three largest cities (Almaty,
Astana, and Shymkent) gives a concrete sense of the diversification potential of Kazakhstan‘s
leading cities (table 3.1). The products can be classified into three groups: food, information
sharing, and manufacturing. In Almaty, 63 percent of the top 10 products fall into the food
category, with 19 percent in manufacturing and 18 percent related to information sharing. In
Astana, 52 percent of the top 10 products fall into the manufacturing category, with 43 percent in
food and 5 percent related to information sharing. By contrast, Shymkent shows 93 percent of its
top 10 products in the food category, with 4 percent related to information sharing and just 3
percent in manufacturing.
Table 3.1. Top 10 Products Produced in Kazakhstan's Three Leading Cities, 2007
(USD millions)
Category Products Almaty Astana Shymkent
Food Mineral water and other nonalcoholic drinks 150 2.0 5.0
Information
sharing Publishing 144 9.0 4.0
Food Brewing 139 0.4 49.0
Manufacturing Manufacture of light metal structures 102 10.0 0.6
Food Fruit and vegetable juices 73 3.0 0.5
Food
Milk processing, (excluding preservation); cheese
production 73 11.0 0.5
Food Bread and fresh pastries 56 12.0 0.8
Manufacturing Manufacture of plastic products 35 29.0 3.0
Food Flour production 18 39.0 57.0
Manufacturing Processing and coating of metals 18 42.0 0.3
Source: Kazakhstan Statistical Agency data.
Note: Data excludes financial and construction activities.
92. These figures confirm the concept of locations with different agglomeration economies,
and thus different functions. As used here, the term agglomeration economies means either the
positive externalities derived from the co-location of a large number of firms operating in the
same sector, with easy and cheap access to intermediate products and/or a specialized labor pool
(localization economies), or the positive externalities derived from the co-location of a large
number of firms operating in different sectors, with significant cross-sectoral information sharing
(urbanization economies).
93. Almaty seems to be closer to becoming a knowledge-based city, with information sharing
accounting for a significant share of its production, although food production to feed its more
than 1 million inhabitants is still a significant activity. Astana seems to be delivering localization
economies for food production, particularly of flour, and some manufacturing activities.

-49-
Shymkent appears to be far more dependent on agricultural activities. Almaty, Astana, and
Shymkent are typical of leading Central Asian cities. Because of their capital city status, Bishkek
and Dushanbe could be closer to delivering urbanization economies. The urban sprawl
developing around Khujand in Tajikistan also makes it a good candidate for delivering
urbanization economies. In the Kyrgyz Republic, natural endowments in the fields of agriculture
and construction materials, as well as its strategic location as the gateway connecting the Fergana
Valley to China, make Osh a good candidate to deliver localization economies.
Leading Cities Are Well Connected Domestically
94. A country grows economically as its leading cities grow and become increasingly
connected with each other, with the rest of the country, and with the rest of the world. As stated in
Reilly‘s law (or the urban version of the ―gravity law‖ in physics), larger settlements interact
more with each other economically than with smaller settlements, with the interaction increasing
as travel time between them is reduced. Geographic information system data can be used to assess
the market accessibility of settlements in Kazakhstan, the Kyrgyz Republic, and Tajikistan.
Using the size of settlement populations and the travel time between them allows computation of
the market accessibility index for all settlements for which population estimates are available.9
Conclusions for each country are as follows:
Kazakhstan is a polycentric country with many hub cities that allow relatively good
access to the domestic market (figure 3.2), but Almaty and Shymkent provide the best
connections with concentrations of population in the southern and southeastern regions.
The Kyrgyz Republic‘s major hub appears to be the Chu Valley around Bishkek (figure
3.3). The mountainous nature of the terrain significantly reduces the connectivity
between the country‘s northern and southern hubs.
Mountains also reduce the connectivity between northern and southern Tajikistan,
although Dushanbe appears to be well connected with locations in south Tajikistan
(figure 3.4).
9 The index is calculated using the gravity-type relationship , where Ai is the
accessibility measure of settlement i, Wj is the population of settlement j, cij is the generalized cost of
reaching market j from i, g(.) is activity function, and f(.) is the impedance function.

-50-
Figure 3.2. Market Accessibility in Kazakhstan (CLEARED BY WORLD BANK CARTOGRAPHER)
Source: Authors.
Figure 3.3. Market Accessibility in the Kyrgyz Republic
Source: Authors.

-51-
Figure 3.4. Market Accessibility in Tajikistan (CLEARED BY WORLD BANK CARTOGRAPHER)
Source: Authors.
95. Roads are the main domestic transport infrastructure connecting the leading cities in each
country to their hinterlands. Railways also reinforce the connectivity of these leading cities,
which were the node points of the former Soviet Union‘s railway network. Domestic connections
are also available by means of air transport.
96. Just an hour‘s drive west of Almaty, Kazakhstan‘s route to Bishkek passes through Esik,
Uzynagash, and Kaskelen, all towns specializing in agricultural production and supplying
Almaty‘s processed food sector with raw materials, and in return supplied by Almaty with food
and nonfood products. The route east from Almaty passes through Talgar and Kapchagai, towns
which specialize in construction materials. Astana‘s hinterland specializes in grain production,
with the industrial cities of Termitau and Karaganda less than two hours south by road.
Shymkent, a major agriculture and transit point in south Kazakhstan, is near the towns of Lenger,
which specializes in agricultural production, and Arys, which is heavily involved in rail freight.
97. In the Kyrgyz Republic, the regional bazaars of Dordoi and Kara Suu dominate the
economic activity of the hinterlands of the two leading cities. Dordoi is less than 30 minutes
driving time from the center of Bishkek, while Kara Suu is a 30-minute drive from the center of
Osh, at a border crossing point with Uzbekistan. The large bazaars receive everything from
textiles to electronics goods imported from China, the Islamic Republic of Iran, and Turkey,
goods that are mainly re-exported to neighboring Central Asian countries. Dordoi and Kara Suu
also play a significant role in the Kyrgyz Republic‘s distribution system, and their proximity to
leading cities ensures the wide reach of the domestic market.
-52-
98. In Tajikistan, the boundaries of the separate cities of Bobojon Gafurov, Chkalovsk, and
Khujand in the north are hard to identify because of the adjacent built-up areas, which are home
to more than 300,000 people. The railway terminal serving Khujand is located in Bobojon
Gafurov, while Khujand‘s airport is located in Chkalovsk. The cities bordering the Kyrgyz
Republic and Uzbekistan—Isfara and Kanibadam, respectively—are also well connected with
Khujand, a two-hour drive to the east. In the south, Dushanbe is located less than an hour‘s drive
from Tursunzoda in the direction of Uzbekistan, Vahdat, and the Rasht Valley. Dushanbe is also
only three hours away from the Afghan border at Nijny Panj.
99. Compared with the extensive Kazakh railway network, which links major cities and
leading cities, the railway networks of the Kyrgyz Republic and Tajikistan are sparse. The
Kyrgyz Republic‘s railway system consists of just two isolated sections of track, from Lugovaya
in Kazakhstan to Bishkek to Balykchi in the north (75 percent of the system) and several short
connections in the south between Osh, Jalal-Abad, Kyzyl-Kya, Kok-Yangak, and Tash-Kumyr
(25 percent, including portions in Uzbekistan). The Kyrgyz Republic has no direct rail
connections linking the country‘s north to its south. Tajikistan has three railway lines. The
northern line connects Isfara, Kanibadan, and Khujand to Bekabad at the border with Uzbekistan;
the central line connects Dushanbe to Uzbekistan via Tursunzoda, site of the country‘s largest
aluminum plant, the Tajikistan Aluminum Company; and the southern line connects Yavan,
which is less than an hour‘s drive from Dushanbe, and Kulyab, in the eastern part of the Kathlon
region, to Uzbekistan via Kurgan Tyube, Tajikistan‘s third largest city.
100. Finally, domestic air transport also reinforces the connectivity of the leading cities. In
Kazakhstan, most incoming and outgoing air freight is shipped via the Almaty airport, which
boats the best infrastructure and facilities for handling international freight. In the Kyrgyz
Republic, flights travel the Bishkek–Osh–Bishkek route at least twice a day, while flights
between other internal destinations and Bishkek are available only one to three times per week. In
Tajikistan, where air transport is less developed, half of all domestic flights depart from and
arrive in Dushanbe, with 40 percent departing from and arriving in Khujand.
Leading Cities Are Well Connected Externally
101. In terms of international air transport, Dushanbe is by far the least well-connected Central
Asian capital city. But the city does enjoy direct connections to Frankfurt twice a week by means
of the newly created Somon Air, as well as twice weekly connections to Dubai, Istanbul,
Moscow, and Urumqi in China. Bishkek offers daily flights to Istanbul, London, and Moscow
and flights four times a week to Urumqi, while Osh offers weekly flights to Moscow and
Novosibirsk in Russia. Among Central Asian countries, Kazakhstan is by far the best connected,
offering direct flights to some European countries from both Almaty and Astana. Almaty offers
weekly flights to a wide range of cities, and the prices charged by the two Kazakh national
carriers, Air Astana and Skat, seem competitive when compared with fares of the 19 foreign
carriers, as shown in table 3.2.

-53-
Table 3.2. International Flights from Almaty, 2009
Destinations
Domestic carriers Foreign carriers
Flights/
week
Lowest average
fare,
economy class
round trip
(USD)
Flights/
week
Lowest average
fare,
economy class
round trip
(USD)
Abu Dhabi, United Arab Emirates 0 n.a. 5 448
Amsterdam, Netherlands 4 758 5 897
Ashkhabad, Turkmenistan 0 n.a. 3 537
Baku, Azerbaijan 0 n.a. 2 405
Bangkok, Thailand 4 731 0 n.a.
Beijing, China 5 715 0 n.a.
Bishkek, Kyrgyz Republic 4 111 5 111
Delhi, India 3 495 5 591
Dubai, United Arab Emirates 7 491 0 n.a.
Dushanbe, Tajikistan 2 168 3 219
Frankfurt, Germany 6 751 7 1,056
Istanbul, Turkey 5 536 0 n.a.
Kabul, Afghanistan 0 n.a. 1 1,129
Kiev, Ukraine 0 n.a. 4 479
London, United Kingdom 2 909 5 1,231
Moscow, Russian Federation 7 413 7 355
Novosibirsk, Russian Federation 0 n.a. 1 326
Prague, Czech Republic 0 n.a. 3 794
Riga, Latvia 0 n.a. 3 1,300
Seoul, Republic of Korea 2 694 2 1,011
St. Petersburg, Russian Federation 0 n.a. 4 484
Tashkent, Uzbekistan 2 122 5 227
Tbilisi, Georgia 0 n.a. 1 631
Ulgii, Mongolia 1 521 0 n.a.
Urumqi, China 0 n.a. 7 555
Source: Data collected by local consultant.
Note: Fares were converted to USD at the March 12, 2009, rate of T150.52= USD 1
n.a. = Not applicable.
102. The modern airport in Astana has advanced meteorological equipment that permits all
types of aircraft to land with no weight limitations and under difficult weather conditions.
Astana‘s airport offers new international flights to Baku in Azerbaijan, Dubai, Bishkek in the
Kyrgyz Republic, Novosibirsk in Russia, Dushanbe in Tajikistan, Antalya and Istanbul in Turkey,
Sharjah in the United Arab Emirates, and Tashkent in Uzbekistan. In addition, the frequency of
flights from Astana to Minsk in Belarus, Frankfurt in Germany, and Kaliningrad and Moscow in
Russia was recently increased. The Astana airport has also opened additional checkpoints to
accelerate border and customs controls. Yet its multimodal logistics services remain poorly
developed, as evidenced by Lufthansa Cargo‘s recent relocation of its Central Asia hub from
Astana to Krasnoyarsk in Siberia, a move estimated to reduce travel time from Germany to
Southeast Asia by 40 percent.

-54-
103. Of the five railway corridors that the Eurasian Development Bank considers technically
suitable for cargo transportation, three pass through Almaty. They are the central trans-Asian rail
corridor linking Kiev, Volgograd, Almaty, Aktogai, Dostyk, Alashankou, and Lianyungang; the
southern trans-Asian rail corridor linking Istanbul, Ankara, Tabriz, Tehran, Mashhad, Seraks,
Tashkent, and Almaty and continuing to Lianyungang via Dostyk at the border between China
and Kazakhstan; and the Europe–Caucasus–Central Asia rail corridor connecting Cantanta,
Varna, Ilychevsk, Poti, Batumi, Baku, Tashkent, and Almaty and continuing to Lianyungang in
China. A Eurasian Development Bank (2009) report on Eurasian Economic Community transport
corridors assesses the potential of the three Almaty-linked corridors, noting the following:
The central trans-Asian corridor is the shortest route from Asia to Central Europe. It is
double-tracked and electrified within the territory of the former Soviet Union and
provides access to Poland via Mostiska and to Slovakia and Hungary via Chop.
The southern trans-Asian corridor has the potential to be an alternative corridor to the
central trans-Asian corridor connecting Central Asia with the Black Sea, but faces the
problem of different gauges that force transshipment of cargo at two locations, adding to
costs and transit time.
The Europe–Caucasus–Central Asia corridor‘s major problem is the tough competition
from Russian Railways, whose tariffs are 70 percent lower than those of the Europe–
Caucasus–Central Asia corridor for transporting grain, cotton, and containers and 20
percent lower for oil and nonferrous metals.
104. Road transport is also becoming important. CAREC has identified six corridors as
priority roads connecting Central Asia to Eastern and Western markets (CAREC 2008). The
International Road Union has developed a new Eurasian land transport initiative focusing on
three of the CAREC road corridors that it believes have the potential to compete with maritime
transport between Asia and Europe (International Road and Transport Union 2009). The three
roads are:
The northern route, connecting Korgas on the Kazakh-Chinese border to Warsaw via one
leg through Almaty, Astana, Petropavlovsk, and Moscow and a second leg through
Almaty, Taraz, Tashkent, Atyrau, Astrakhan, and Moscow, with Bishkek connected via a
direct road connection to Almaty;
The central route, connecting Kashgar in China to Irkeshtam on the Kyrgyz-Chinese
border, Osh, Tashkent, Bukhara, Ashgabat, Turkmenbashi, Baku, Tbilisi, Poti, and
beyond; and
The southern route, connecting Almaty or Osh to Tashkent, Bukhara, Tabriz, Ankara,
Istanbul, and beyond.
Even though these roads pass through some of the leading cities considered in this study,
Dushanbe has only a poor connection to these routes—between Irkeshtam and Bukhara via the
Rasht Valley—and Khujand is not connected to these routes at all. A north–south connection
between Nijny Panj in south Tajikistan to Almaty via Dushanbe, Khujand, Batken, Osh, and
Bishkek would be an important stimulus to regional trade via road.
105. The borders between Kazakhstan and the Kyrgyz Republic have little impact on travel
time, because the hinterlands of Almaty, Bishkek, and Shymkent overlap. By contrast, the border

-55-
between the Kyrgyz Republic and Tajikistan is less densely populated, meaning longer travel
times before reaching an urban center. Kazakhstan, the Kyrgyz Republic, and Tajikistan are
viewed as autarkical in figure 3.5, with travel times shown to the two leading cities of each
country. The three countries are then shown as a single integrated country (figure 3.6), with
travel times shown to the six leading cities of this hypothetical country. Travel times are
estimated based on the quality of the road network connecting each settlement to leading cities.
Both figures represent limit cases, with different assumptions: with border controls so
cumbersome that no cross-border traffic occurs (figure 3.6), or with no controls at the border
(figure 3.7). The contrast between the two extremes illustrates how facilitating cross-border
controls and operations can connect production locations at the regional level.
Figure 3.5. Travel Time to Leading Cities of Kazakhstan, the Kyrgyz Republic, and
Tajikistan
(No Integration with Kazakhstan and Tajikistan) (CLEARED BY WORLD BANK CARTOGRAPHER)
Source: Authors.

-56-
Figure 3.6. Travel Time to Leading Cities of Kazakhstan, the Kyrgyz Republic, and
Tajikistan
(Full integration with Kazakhstan and Tajikistan)
(CLEARED BY WB CARTOGRAPHER)
Source: Authors.

-57-
106. The area circled in figures 3.5 and 3.6 includes the Batken region in the Kyrgyz Republic
and Khujand in Tajikistan. A closer look at this area can illustrate the effects of better integration
for both countries. Currently, the key challenge is access to markets. For example, if business
operators in Batken must route their horticultural exports through Osh, to avoid the administrative
barriers involved in crossing an international border, the additional travel time required may make
exports uncompetitive. One alternative is to route Batken‘s exports through Khujand to take
advantage of the railway connection to Kazakhstan and Russia via Uzbekistan. If the Kyrgyz
Republic and Tajikistan were fully integrated (figure 3.6), a trip from Batken to Khujand would
take much less time than the trip from Batken to Osh. Because of border crossing issues and poor
road conditions in the Kyrgyz–Tajik border region, travel between Khujand and Batken currently
takes longer than it might otherwise. By improving their connectivity, the Kyrgyz Republic and
Tajikistan could scale up their horticultural and other exports. By ensuring that regional roads
promoted by CAREC maximize connectivity between leading cities, and by providing
complementary institutional reforms to facilitate trade and transport in the territories through
which the roads pass, the governments of the Kyrgyz Republic and Tajikistan could design an
effective city-led export diversification strategy.
The Need for an Explicit Space-Based Export Diversification
107. The area within an hour‘s drive of a leading city is a unique space: it has a core urban
center that provides a range of services and access to secondary cities whose economic activities
are dominated by surrounding rural areas. The urban center provides good connections with
business services and external markets, while secondary cities provide close connections with
agricultural production. Yet without a credible mechanism to bind such a unique area into a
coherent whole, coordination problems might impede provision of necessary infrastructure,
consolidation of production to enhance economies of scale, control of production quality,
provision of competitive and good quality transport and distribution services, and establishment
of a business-friendly and efficient tax regime. Limited economic interaction between leading
cities and their hinterlands and narrowly defined enclave economies are two major constraints
facing Central Asian cities.
Limited Economic Interaction between Leading Cities and Their Hinterlands
108. A good example of limited economic interaction between Central Asia‘s leading cities
and their hinterlands is provided by Bishkek and Osh. Bishkek and its hinterland have an
estimated population of 770,000 people. Bishkek is within an hour‘s drive of a number of
secondary cities, ranging from Tokmok in the east (59,000 inhabitants) to Kara Balta in the west
(47,000 people) via Kant (22,000 people), all of them connected by one major road (figure 3.7).
These settlements form an urban sprawl encompassing a 100-kilometer road corridor that passes
through land suitable for large-scale agriculture. Osh has a reported population of 320,000 people,
including a number of settlements within an hour‘s drive from the city center. Osh is one of the
largest cities in the Fergana Valley, which stretches across the Kyrgyz Republic, Tajikistan, and
Uzbekistan. Osh also has the Kara Suu international bazaar in its hinterland.

-58-
Figure 3.7. Spatial Interaction between Bishkek and Osh and Their Surroundings (CLEARED BY WB CARTOGRAPHER)
Source: Authors.
109. Better connections between Bishkek and Osh and their respective hinterlands, where
agricultural production is strong, could improve the supply of raw materials to the food industry
(tables 3.3 and 3.4). An effective diversification strategy would expand agricultural production in
Kant, Kara Balta, and Tokmok and better connect these areas to processors in Bishkek, thus
linking production with domestic and external markets. The same could be done for Osh and its
hinterland. Yet Bishkek, Kant, Kara Balta, and Tokmok together produce only 1 percent of Chui
Oblast‘s vegetables, 2 percent of its raw milk, 2 percent of its potatoes, 3 percent of its livestock
products, and 6 percent of its eggs. By contrast, the cities of Osh, Aravan, Kara Suu, and Uzgen
together account for 60 percent of Osh Oblast‘s vegetable production, 14 percent of its raw milk,
27 percent of its potatoes, 27 percent of its livestock products, and 17 percent of its eggs. An
export-led agro-industry strategy similar to the one developed in Thailand in the 1970s could
easily expand agricultural production in both areas.
Table 3.3. Agricultural Production, Bishkek and Its Hinterland, Kyrgyz Republic, 2008
Chui
Oblast
of which
City of
Bishkek Product
Kara
Balta Kant Tokmok
Livestock products (tons) 76,822 780 372 772 644
Raw milk (tons) 322,117 2,411 1,089 2,305 1,497
Eggs (thousands) 167,367 1,648 1,122 3,806 2,730
Grain (tons, weight after processing) 561,515 - - - 1
Potatoes (tons) 181,641 640 841 2,001 202
Vegetables (tons) 381,885 2,393 846 880 1,572
Fruits and berries (tons) 1,617 4 2 4 1 Source: Statistical Agency, Kyrgyz Republic.

-59-
Table 3.4. Agricultural Production, Osh and Its Hinterland, Kyrgyz Republic, 2008
Osh
Oblast
of which
City of
Osh
City of
Batken
City of
Jalal-Abad Product
Aravan
Rayon
City of
Kara-Suu
City of
Uzgen
Livestock (tons) 69,523 5,047 12,429 649 1,344 984 524
Raw milk (tons) 251,705 26,088 336 2,403 6,676 2,568 3,898
Eggs (thousands) 40,217 5,155 141 456 1,122 1,191 1,090 Wool (tons, physical
weight) 2,138 123 2 16 24 28 19
Grain (tons, weight after processing) 268,648 32,110 89,907 - 3,916 21,583 2,396
Potatoes (tons) 139,148 18,421 16,569 - 2,566 4,639 124
Vegetables (tons) 117,342 16,635 48,546 954 9,433 3,465 2,067
Fruits and berries (tons) 44,106 5,417 12,104 121 1,132 21,855 160 Raw cotton (tons, weight
after processing) 31,515 14,446 n.a. n.a. n.a. n.a. 4
Tobacco (tons, weight after processing) 11,309 1,697 n.a. n.a. n.a. n.a. n.a.
Source: Statistical Agency, Kyrgyz Republic.
n.a. = Not available.
110. While the agricultural production in the hinterlands of Bishkek and Osh are of
comparable magnitude, the production value of foods and beverages in Bishkek is nearly 15 times
that of Osh, indicating that the agricultural potential of Osh‘s hinterland is poorly linked with the
city‘s industrial production in comparison with Bishkek (tables 3.5 and 3.6). In Osh, small firms
account for the bulk of food and beverage production, while large firms account for the bulk of
textiles and garments, even though 75 percent of textiles and garment firms are small firms
(appendix 1 contains further details).

-60-
Table 3.5. Main Manufactured Products Produced in Osh, 2008
Item
Total value of
production
(USD
millions)
Percentage of
production
value produced
by small firms
Total
number
of firms
Percentage
of small
firms
Total
number of
employees
Percentage of
employees in
small firms
Manufacturing 14.5 67 108 94 1,709 41
Food and
beverages
6.8 87 29 97 396 75
Nonmetallic
mineral
products
4.5 42 17 82 528 23
Textiles and
garments
1.3 4 12 75 529 4
Rubber and
plastic products
0.7 100 8 100 54 100
Finished
metal products
0.5 100 9 100 23 100
Paper industry
and printing
0.4 100 16 100 66 100
Machinery
and equipment
0.2 100 6 100 67 100
Chemicals 0.0 100 4 100 65 100
Source: Statistical Agency, Kyrgyz Republic.
Table 3.6. Main Manufactured Production in Bishkek, 2008
Item
Total value
of production
(SOM
millions)
Percentage of
production
value
produced by
small firms
Total
number
of firms
Percentage
of small
firms
Total
number of
employees
Percentage
of employees
in small
firms
Manufacturing 316.6 33 688 90 14,900 24
Food and
beverages
99.6 15 92 83 3,293 14
Nonmetallic
mineral products
35.5 29 46 78 1,558 12
Paper industry
and printing
27.0 52 172 95 2,136 41
Rubber and
plastic products
26.7 44 82 96 567 66
Machinery and
equipment
20.7 33 42 90 1,808 13
Metallurgy and
metal products
16.9 57 63 87 1,119 29
Vehicle
equipment
9.8 5 4 75 549 6

-61-
Electrical,
electronic, and
optical
equipment
7.4 40 38 87 685 11
Chemicals 6.7 53 41 95 318 57
Textiles 6.5 72 19 84 596 12
Garments 6.2 91 28 93 480 51
Leather products
and footwear
1.2 23 6 83 109 35
Source: Statistical Agency, Kyrgyz Republic.
111. Labor productivity differences between Osh and Bishkek reveal a good deal about
agglomeration economies. While a worker in Osh produces USD 17,000 of food and beverages
during a year, a worker in Bishkek produces triple that amount in the nonmetallic minerals sector.
Bishkek is 2.70 times as productive as Osh, and in the textile and garments sector, Bishkek‘s
productivity difference jumps to 4.75 times that of Osh. Yet Bishkek faces its own challenges.
For instance, small operators account for most of the meat processing activity in Bishkek, most of
whom work outside the formal economy, do not pay taxes, and are not subject to regular health
inspections (World Bank 2007a). Another major challenge in developing the milk and meat
industries in Bishkek is the rising prices of raw milk and meat bought from local suppliers, which
is due to limited livestock feed, low productivity in stock breeding due to poorly fed livestock,
low levels of mechanization of milk processing, and farmers‘ price-based strategy to increase
their profitability. In the case of raw meat, some processing firms are experiencing a profit
decrease of as much as 20 to 30 percent because of rising supply prices.
112. By developing some form of SEZ in Bishkek and its hinterland and in Osh and its
hinterland, policy makers could facilitate economic interaction between city and hinterlands,
thereby enhancing city productivity. But the export processing zones established in the Kyrgyz
Republic to date are narrowly defined with respect to spatial coverage and instruments used to
attract investment.
Narrowly Defined Economic Enclaves
113. The idea of SEZs is not unfamiliar in Central Asia. In the early 2000s, Kazakhstan
became involved in a project to identify promising clusters in various parts of the country, one of
which was Almaty as a logistics cluster. While ―cluster fever‖ has since abated, policy makers
are still considering how to design a space-based growth strategy. Bishkek has a free economic
zone, and Osh‘s municipal authorities proposed to the Kyrgyz Parliament that the city‘s industrial
zone—located at the periphery of the city and serviced by a railway, high voltage power, and
water pipes—be converted into a free economic zone, although to date this has not happened.
Tajikistan has three free economic zones, located in Khorog, in the periphery of Khujand, and in
Nijny Panj on the border with Afghanistan.
114. All these initiatives have so far centered on narrowly defined areas where tax incentives,
and sometimes infrastructure provision, are expected to attract foreign direct investment. This is a
tough sell for Central Asian countries facing such cumbersome economic and physical
geography. First, they are newcomers in adopting a diversification strategy that has been
underway since the 1970s, with well-established global production networks anchored on entire
regions like in East Asia. Second, their poor logistics performance adds to their disadvantageous
geography to isolate from leading and emerging markets. If an SEZ strategy is to be adopted, it
needs to be comprehensive: build on the country‘s comparative advantage in designing the

-62-
features of the SEZs, connect them to the domestic sources of labor and raw materials, and link
them to the most attractive regional markets. Farole (2010) suggests for such newcomers to re-
orient themselves toward resources-based and labor-intensive sectors (agriculture, minerals, oil
and gas, tourism), using economic zones to improve competitiveness in first- and later-stage
processing of these resources.
115. The resource-based and labor-intensive natures of such SEZs require them to be closely
integrated to the leading cities receiving them as well as the ―resource-rich‖ hinterlands of these
leading cities. Indeed, most of the factors that determine the success of SEZ programs cannot be
confined to the zone program alone but require actions at the city, city-hinterland, national and
even regional levels. As documented by Farole (2010), one of the main differences between SEZs
that have been successful and sustainable and those that have either failed to take off or have
become stagnant enclaves is the degree to which they have been integrated to the broader
economic policy framework of the country. Successful SEZ programs do not simply view zones
as a static instrument of trade and investment policy, put in place and then left to operate on their
own, with little effort to support domestic investment into the zones, to promote linkages,
training, and upgrading. Unlocking the potential of zones requires clear strategic integration of
the program along with government playing a leading, active role along with the private sector.
116. Broader SEZs anchored in such leading cities as Almaty, Astana, Bishkek, Dushanbe,
Khujand, and Osh, and tapping into the agricultural comparative advantage of their hinterlands,
are more appropriate for boosting Central Asia‘s export and growth prospects. For instance,
upgrading small-scale suppliers of milk and meat in the hinterlands is more important for
securing quality and quantity of supply to support an agro-industry-led diversification strategy in
an SEZ located in a transport hub within the leading city, than a traditional SEZ where tax
incentives are the only instrument to attract high-tech firms to an industrial complex in the middle
of nowhere.
117. In Central Asia for instance, local producers seem to supply processors only in the form
of spot-market types of transactions where price is a dominant coordination mechanism. Little
coordination or cooperation among small-scale suppliers takes place, that is, producers work on
their own instead of taking advantage of clustering effects. This reduces producer profits because
of small sales volumes, repeated price negotiations, and poorly specified quality grades.
Upgrading small-scale producers requires development of a stronger coordination mechanism
between them and other production chain nodes located in the leading cities. A vertical
contracting model of the type outlined in box 3.1 could be considered along with the SEZ
program to broaden its impact.
Box 3.1. Vertical Contracting in Global Value Chains
Vertical contracting represents a move from spot-market types of links between firms to increased use of
contracts as a mediator of exchange between chain actors. Contracts may vary as to how long they are valid
and how binding they are. Benefits of contracts for small producers and suppliers include: greater security,
improved access to market information, and increased quality when training and support are provided as
part of the contract terms. At the same time, contracts also include higher performance requirements related
to quality, volume, certification, and the like. With the proper policy support, vertical contracting systems
can result in the upgrading of entire industrial sectors.
Source: Bolwig and others 2008.
118. The ultimate goal of broader SEZs is to use the transformation of agricultural production
as a driving force for diversification as suggested by the 2008 and 2009 World Development

-63-
Reports (World Bank 2008, 2009c) and exemplified by Thailand‘s experience in the 1970s. This
implies that within the sphere of influence of leading cities, land markets are working properly
and farmers are free to grow what they want. Kazakhstan and the Kyrgyz Republic have a fairly
good land market with private ownership and their farmers have the freedom to grow what they
want. But the land market is nonexistent in Tajikistan, where farmers are still forced by various
means to grow only cotton.
Mainstreaming Space-Based Economic Policies
119. For many decades, economists have equated space-based policies with the failed policy
of subsidizing industrialization in a country‘s lagging regions. A prime example is Italy‘s regional
development policy to reduce the development gap between the north and the south under the
intellectual leadership of Rosenstein-Rodan, creator of the ―big push‖ model of development
(Boltho, Carlin, and Scaramozzino 1997). Instead of boosting the economic base of southern
Italy, whose firms and workers were already limited, the extensive road and railway infrastructure
built contributed to the region‘s depopulation; afterward, about 2 million workers left the targeted
region. In Europe and Central Asia, many single-firm towns and remote economic areas failed
after the collapse of the Soviet system, along with its planned economy model and subsidized
transportation costs. However, the success of SEZs in Bangladesh, China, and Mauritius shows
that sound space-based policies still have their place, but only by strengthening economic
concentration in leading regions and not by trying to divert economic activities to lagging
regions. The new economic geography mainstreamed by Krugman (1991) boosts this view, and
policymakers may increasingly urge economists to propose space-based policy recommendations.
This chapter anticipates such a trend and proposes a framework for a sound space-based
economic policy.
Structural and Spatial Transformations
120. In 1971, Kuznets was awarded the Nobel Prize in economics for his work showing that as
a country moves from low to medium to high income levels, it goes though a structural
transformation from agriculture to industry to services (Kuznets 1971). Traditional agriculture
tends to be replaced slowly as agribusiness activities emerge in response to increased demand
from urban areas both within and outside a country (World Bank 2008). These agribusiness
activities—storage, sorting, quality control, packaging, transport, processing, distribution, and
services related to risk management—are already increasing returns to scale activities where
internal and external economies of scale drive productivity and the ability to export. As
industrialization takes over in a country, the share of manufacturing and business-related services
becomes increasingly important.
121. As this structural transformation occurs, cities tend to play a larger role in production and
trade as traditional agriculture activities require fewer workers and excess workers migrate to
cities to participate in the advanced division of labor. In 2008, Krugman was awarded the Nobel
Prize in economics for his work showing that the structural transformations proposed by Kuznets
were facilitated by this spatial transformation favoring concentration of economic activities in
leading urban centers. Krugman‘s work suggests that growth is lumpy in relation to space and
that fighting this lumpiness is fighting growth. This finding clearly challenges the justification for
space-based policies that divert economic activities to lagging regions, but leaves room for policy
measures that would use space efficiently to maximize benefits from economic concentration.
The issue thus becomes the fate of lagging regions in such fully market-led economies. To date,
the economic literature has failed to propose a coherent framework that addresses both

-64-
concentration in leading areas and convergence of lagging regions. The 2009 World Development
Report (World Bank 2009c) fills this gap.
The 2009 World Development Report Framework
122. The 2009 WDR proposes a policy framework that combines economic benefits of
increasing concentration in leading cities with improved welfare in lagging regions by
investments in the people living there. The underlying economic principle is to ensure that places
are integrated by means of a relevant set of institutions, infrastructure, and incentives. The spatial
dimensions characterizing development of the developed countries and the rapidly growing Asian
countries are: higher economic density, shorter economic distance, and less cumbersome border
crossing operations. The importance of spatial dimensions depends on the geographic scale,
primarily on these factors:
Density is the most important dimension at the local level. Distances are short and
cultural and political divisions are few and shallow. The policy challenge is to get the
density right by harnessing market forces to encourage and promote economic
concentration. No country has ever achieved high income levels without urbanizing.
Distance to density is the most important dimension at the national level. For a small
country, the challenge is how to improve all connections to its leading areas. Growth
seldom comes without the need to move closer to economic density.
Division is the most important dimension at the regional level. While distance also
matters at the regional level, divisions associated with the impermeability of borders and
different currencies and regulations pose serious obstacles to accessing regional and
global markets. Isolated countries seldom achieve growth.
123. The 2009 WDR framework is applied to Central Asia in box 3.2. For Tajikistan, for
instance, the three geographical scales are Dushanbe (density), its hinterland (distance), and
regional markets (division). Understanding the transformations along all three dimensions
(increasing density, declining distance, and declining division) can help Tajik policy makers
identify the main market forces and the appropriate policy responses at each of these geographical
scales by applying one simple rule: invest in growth-sustaining infrastructure in leading locations
and invest in people in lagging locations. By investing in education and health in lagging
locations, policy makers can help endow residents with portable skills to use wherever they find
economic opportunities, whether in the lagging region, the leading region, or outside the country.
By investing in a country‘s leading locations, policy makers can endow these cities with the
economic infrastructure necessary to generate localization or urbanization economies that will
assist the country in its eventual structural transformation.
Box 3.2. The World Development Report 2009 Framework Applied to Central Asia
The three spatial dimensions are approximated by the following proxy variables: (a) the economic density
dimension is approximated by the agglomeration index, a more elaborated urbanization index that takes
into account the spatial distribution of the population; (b) the distance dimension is approximated by the
index of shipping difficulty; and (c) the division dimension is approximated by the foreign market potential
index. The table below reports these proxy variables for the Central Asian countries.
Scores on Selected Indexes, Selected
Regions and Countries
Economic
density index
(2000)
Distance index
(2008)
Division index
(2003)

-65-
Organisation for Economic Co-
operation and Development 60.09 24.92 13.68
Europe and Central Asia 38.63 99.75 3.02
Kazakhstan 46.20 178.00 1.12
Kyrgyz Republic 20.20 177.00 1.42
Tajikistan 17.60 176.00 0.79
Turkmenistan 26.60 174.00 0.81
Uzbekistan 42.90 165.00 0.71 Source: Economic density and distance index: World Bank 2009c; division index: Mayer 2008.
Economic density in Central Asia is low, particularly in Tajikistan and the Kyrgyz Republic, where fewer
than 20 percent of the population can be classified as urban. Central Asia‘s distance index is also sizable,
with an average difficulty in shipping index of 174, compared with about 25 for countries of the
Organisation for Economic Co-operation and Development (OECD). Divisions imposed by borders and
other nontariff barriers result in an index value of less than 1.5 for all Central Asian countries, or about one-
tenth of the index for OECD countries, thus limiting the OECD‘s market potential for Central Asia.
The 2009 World Development Report identifies regions facing such geographical challenges as ―3D‖
neighborhoods (for low density, long distances, and high divisions). These regions are Central, East, and
West Africa; the South Caucasus; Central Asia; and the small Pacific islands. For countries in these six
regions, the greatest challenges for diversification away from traditional products are generating domestic
economic density (to attract domestic and foreign investment in nontraditional sectors) and ensuring their
productive connections to leading external markets.
Source: World Bank 2009c.
From Spatial Transformations to Trade
124. The cities, towns, and rural settlements of a country coexist and deliver different services
to firms and people. Rural settlements tend to engage in agricultural activities, while towns
engage in the nonfarm activities that increase the marketability of agricultural products in urban
areas and outside the country. Cities permit sharing of private and public factors of production,
pooling of labor markets, and sharing of information. The diversity of cities favors an advanced
division of labor allowing specialization in various activities. As a country moves through a
structural transformation from agriculture to industry to services, some of its city-based activities
become more prominent to the point of being exported—that is, the country starts to diversify
away from its traditional export base. Thus a fundamental relationship exists between a city‘s
potential for specialization and diversification of its export base.
125. When exploring diversification potential, one must also keep in mind cities‘ nontraded
goods and services. The heterogeneous firm framework developed by Melitz (2003), now driving
all new theoretical and empirical work on international trade, suggests that a particular area of
activity comprises three types of firms, based on their productivity levels and distinguished by the
markets they can reach. The most productive firms serve global, regional, and domestic markets;
the average productive firms serve regional and domestic markets; and the less productive firms
serve only domestic markets. Using plant-level data, Yoshino (2008) empirically confirms this
market segmentation for Africa. Using firm-level export data for 1996–2005, Eaton and others
(2007) find a significant creation of small exporting firms in Colombia from one year to the next,
with most failing the following year, but for those that survive, their share in export expansion
exceeds that of large firms in less than 10 years.

-66-
126. As a country moves from low to high levels of income, the country first tends to diversify
away from its traditional export base, before specializing at high-income level (Imbs and
Wacziard 2003). Hence the growth of cities tends to occur hand-in-hand with higher incomes and
more diversified production and exports, implying that a sound diversification strategy needs to
put leading cities at the forefront of trade policy.
127. The low economic density of Central Asian countries and their limited production base,
skewed toward natural-resource-intensive products, point to the need for an explicit strategy built
on leading cities driving the diversification agenda. The last chapter suggests how to draw on the
potential of leading cities to design a successful diversification strategy.
-67-
4. THE “HOW TO” OF EXPANDING TRADE IN
CENTRAL ASIA
129. The introduction to The East Asian Miracle notes that ―in a large measure the eight high
performing Asian countries achieved high growth by getting the basics right . . . But these
fundamental policies do not tell the entire story. In most of these economies, in one form or
another, the government intervened—systematically and through multiple channels—to foster
development, and in some cases the development of specific industries. Policy interventions took
many forms: targeting and subsidizing credit to selected industries, keeping deposit rates low and
maintaining ceilings on borrowing rates to increase profits and retained earnings, protecting
domestic import substitutes, subsidizing declining industries, establishing and financially
supporting government banks, making public investments in applied research, establishing firm-
and industry-specific export targets, developing export marketing institutions, and sharing
information widely between public and private sectors. Some industries were promoted, while
others were not‖ (World Bank 1993, pp. 5–6).
130. Such a detailed list seems to dare any creative policy maker to devise new ways to
intervene in economic development. Yet while the basics—macroeconomic stability and
investment in people—were unanimously recognized as essential to the impressive East Asian
economic performance, singling out the most efficient policy interventions has still been difficult.
131. This chapter uses a city-led export diversification framework to lay out specific policy
actions to be pursued by policy makers in Kazakhstan, the Kyrgyz Republic, and Tajikistan
seeking to expand their exports in nonnatural-resource-intensive products. This diversification
strategy involves three types of policy makers: city-level authorities for city-level interventions,
oblast-level authorities for the hinterlands of leading cities, and national authorities for regional-
level policy actions. Close collaboration between the three decision-making levels is paramount
to the success of the proposed diversification strategy.
A Framework for a City-Led Diversification Strategy
132. According to the World Bank (2008, p. 2), ―In urbanized countries, which include most
of Latin America and much of Europe and Central Asia, agriculture can help reduce the
remaining rural poverty if smallholders become direct suppliers in modern food markets, good
jobs are created in agriculture and agro-industry, and markets for environmental services are
introduced.‖ Leading cities in nonurbanized countries could play an even more important role in
the transformation of their agriculture sectors, and more generally, in their production and trade
diversification,10
because (a) the cities facilitate the consolidation and transportation of
agricultural products at low cost as a benefit from the agglomeration economies generated by
these cities; (b) the cities are well connected to their agricultural hinterlands, providing a basis for
transforming traditional agriculture; and (c) the cities are well connected regionally, allowing the
10
In 2005, the share of each country‘s population living in urban areas was 57 percent in Kazakhstan, 37
percent in the Kyrgyz Republic, and 25 percent in Tajikistan. The largest city accounted for 13 percent of
the total urban population in Kazakhstan, for 43 percent of the total in the Kyrgyz Republic, and for 37
percent of the total in Tajikistan (World Bank 2009c).

-68-
establishment of a regional production network that taps into the competitive advantage of each
leading city.
Promoting Economic Density in Leading Cities
133. Leading cities need to attract the right businesses (food processing firms and closely
related services/suppliers, for example), provide them with a good regulatory environment, and
provide the local services that are needed for their operation. Given Central Asia‘s cumbersome
economic geography, the only way to make these events happen is by using some form of SEZs.
This should be the main policy intervention in all six cities considered in this study.
134. Ideally, the SEZ should cover the entire city, as is the case in China, from its cigarette
lighter town of Wenzhou, which produces 95 percent of the world output, to Yanbu, its
underwear capital. Indeed, an SEZ that covers the entire city and its immediate hinterland is
larger than an SEZ limited to an industrial park or a transportation hub in the city, implying a
lower cost of distortion. However, such larger SEZs may generate more resistance from vested
interests deriving a large share of their income from that larger area. Depending on the political
economy of each leading city, a ―concentric-circle‖ approach may be considered: first, start with
a narrow SEZ but drawing on the country‘s comparative advantage and major transportation hubs
that connect to regional markets; second, progressively include parts of the leading city that are
directly involved in the production process in the SEZ (such as labor pockets and other industrial
settlements); and at a final stage integrate the hinterland of the leading city providing access to
the raw materials transformed in the SEZ. This approach provides for a flexible regulatory regime
that becomes more comprehensive as the political economy challenges in the leading cities ease.
135. The second policy instrument that policy makers may consider is scaling up the urban
infrastructure, including the public transportation network, market places, and storage facilities,
as needed. The larger the city, the more extended the infrastructure network should be to contain
congestion costs.
136. Finally, in countries where the land market is not well-developed, a set of institutions
may be needed to facilitate the rapidly changing land use that may accompany expansion of a
city‘s economic activities.
Improving Leading Cities’ Connections with Their Agricultural Hinterlands
137. Applying geographic information system mapping techniques to Almaty, Astana,
Bishkek, Dushanbe, Khujand, and Osh helps illustrate how these leading cities and their
hinterlands could provide the means for a space-based export diversification strategy. For each
country, build-up areas, as well as the land cover around its leading cities and their hinterlands,
are shown in Appendix 3.
138. The leading cities of Kazakhstan, the Kyrgyz Republic, and Tajikistan, are each
surrounded by agricultural hinterlands which may support the intensification of agroprocessed
activities in these leading cities. But for this to occur, policymakers must provide the necessary
infrastructure to connect the cities and their hinterlands, including inter-urban transportation
networks, market places for collection and consolidation of agricultural products, and adequate
storage facilities in the city-hinterlands.
139. If existing administrative arrangements are not efficient enough, policy makers may
consider an institution to facilitate economic interaction between the leading cities and their

-69-
hinterlands. One solution might be to emulate the area approach developed for Daegu in Korea
(box 4.1).
Box 4.1. Space-Based Policy in the Republic of Korea
Between 1950 and 1990, Daegu‘s population swelled from 355,000 people to nearly 2 million, as its
thriving textile industry pulled in rural migrants. Korea‘s policy response was to develop a so-called area
approach in which Daegu was integrated with its hinterland by expanding its administrative zone in 1987
and again in 1995, followed by construction of a subway system and expansion of the city‘s bus system. As
a result, manufacturing has deconcentrated from Daegu into the surrounding Gyeongsangbukdo Province,
and the local economy has diversified, reducing its reliance on textiles and moving into sectors with higher
value added production, such as electronics and automobiles. Daegu now sits at the center of a vibrant
urban system surrounded by five cities, all with easy transport access to Daegu.
Source: World Bank 2009c.
140. Finally, policy makers could consider targeted incentives to foster industrial agriculture
in the city-hinterlands, as in the beginning of Thailand‘s industrialization, to scale up horticulture
or livestock activities, if such action is economically viable.
Securing Accessibility to Regional Markets
141. Central Asia is a 3D region where thick borders, long distance to large markets, and low
domestic economic density are compounded. The third level of policy intervention—securing
accessibility to regional markets—is therefore of critical importance. All three instruments
suggested in the WDR2009 should be thoroughly applied: a key institution to unite the three
countries, key connective infrastructure between domestic and regional markets, and targeted
interventions to compensate countries for short-term losses from this deepened economic
integration.
142. As shown in chapter 1, an intensification of food or light manufacturing in the six Central
Asian leading cities would make sense only if access were secured to large regional markets such
as those in China, India, Russia, Turkey and the EU via Russia. This means that the north–south
road corridor linking these cities—Dushanbe, Khujand, Osh, Bishkek, Almaty and Astana—from
the border of Tajikistan with Afghanistan at Nijny Panj to the border of Kazakhstan with Russia
at Petropavlovsk forms the backbone of Central Asia trade integration to regional and global
markets. To secure this access to markets, policy makers should provide the right institutions that
will unite the region‘s production places and better connect them to targeted markets.
143. The second policy action needed is to improve connectivity infrastructure on the poorly
maintained legs of the most integrative transport corridor to smooth out traffic flow and reduce
transport costs.
144. Finally, because all countries will not benefit equally from this deepened trade and
transport facilitation initiative, policy makers in Kazakhstan should provide targeted incentives to
reduce the transport costs faced by Kyrgyz and Tajik traders in the short term. Such deep
integration would transform Almaty into the region‘s main export hub, helping it capture most of
the benefits from complementary service activities.

-70-
How to Promote Economic Density in Leading Cities
145. At the city level, the key challenge for policy makers is to foster localization or
urbanization economies to improve the productivity of firms operating there. Although authorities
of leading cities are the main counterparts pursuing this goal, both national authorities and the
business communities operating in Almaty, Astana, Bishkek, Dushanbe, Khujand, and Osh are
strategic players who need to buy in to any city-level policy action, given the weight of these
cities in their national economies. One necessary institution is an implementation body bringing
these three actors together, to be chaired by city-level authorities.
146. The implementation body‘s most important policy goal is to establish in each leading city
a form of SEZ, where infrastructure conditions and economic regulations are more hospitable
than those typical in the rest of the country. Such action makes each leading city‘s business
environment attractive to domestic and foreign investors.
147. One specific action that the implementation body should consider is to publicly commit
to a business-friendly charter within the SEZ, along the lines of the Doing Business indicators
(IFC and World Bank 2009). This charter should cover starting a business, dealing with
construction permits, employing workers, registering properties, obtaining credit, protecting
investors, paying taxes, trading across borders, enforcing contracts, and closing down businesses.
The charter should reflect international best practices in all aspects of the investment climate, and
the implementation body should be endowed with the power to enforce them. Such a credibility-
building mechanism will be a powerful marketing tool for attracting foreign direct investment to
each city.
148. The second specific policy action should be to consider scaling up the provision of
backbone infrastructures in the SEZ according to the type of agglomeration economy the leading
city expects to deliver. For Astana, Bishkek, Dushanbe, Khujand, and Osh, where localization
economies are important to tap into the agricultural potential of their hinterlands, the focus should
be on improving transportation infrastructure connecting with their hinterlands, on market places
and information systems facilitating the collection and consolidation of agricultural products, and
on adequate storage facilities in cities and hinterlands. For Almaty, already close to delivering
urbanization economies, the focus should be on providing additional infrastructure to support
development of a metropolitan area, such as a subway mass-transportation system and cheap ICT
and financial services. Better connecting the other five other leading cities to Almaty will allow
them to take advantage of Almaty‘s additional infrastructures.
149. Finally, Central Asia‘s growing urban population means that all the cities should pursue
establishment of institutions to improve access to urban land for residential and business
purposes. Issues to be addressed include urban land titling, transparency of land markets, and
flexible land use regulations to adjust to the rapidly changing use of urban land.
How to Improve Leading Cities’ Connections with their Agricultural Hinterlands
150. Almaty, Astana, Bishkek, Dushanbe, Khujand, and Osh are each surrounded by an
agricultural hinterland within an hour‘s drive or less from the city center. The export
diversification strategies of Kazakhstan, the Kyrgyz Republic, and Tajikistan should be anchored
on these macro-regions to intensify agro-industrial activities. The key policy makers for measures
proposed here are oblast-level authorities: in Almaty oblast for Almaty, Akmola oblast for
Astana, Chu oblast for Bishkek, Osh oblast for Osh city, Sughd oblast for Khujand, and the
Region of Republican Subordination for Dushanbe. Given the key role to be played by private

-71-
operators located in the leading cities, the implementation body should also be extended to
leading city authorities, as well as to business communities operating in the cities and their
hinterlands.
151. Because providing inter-urban infrastructure is the main policy action at this level,
national authorities may be involved to secure the financing needs of this infrastructure. Policy
makers need to show their commitment to such a city-led export diversification strategy by
scaling up the backbone infrastructure and services provided in the macro-regions. The systems
and regulations needed to govern intra-urban and interurban transport, retail and wholesale
distribution, and logistics and financial services should be improved to facilitate innovation,
production, and trade. For instance, public investments may be needed to provide transport
infrastructure needed to connect the core city to its mainly agricultural hinterland, as well as to
provide market infrastructure investments such as marketplaces, serviced storage capacity, and
price information systems to facilitate rural-urban interactions.
152. In countries such as Tajikistan, where access to agricultural land is not secured, the
second policy action should cover enforcing an agricultural land market and land titles in the rural
parts of the macro-regions anchored to Dushanbe and Khujand, facilitating industrial agriculture,
and providing collateral to farmers. Tajik farmers still lack the freedom to farm. A land market
would allow Tajik farmers to sell their land if they wish to move to the core city to seek new
economic opportunities.
153. Finally, policy makers should consider targeted incentives to boost agro-industry and
food processing. Such incentives could go hand-in-hand with improved logistics services that
Almaty, with its current competitive advantage, could provide, while Astana, Bishkek, Dushanbe,
Khujand, and Osh and their hinterlands continue to focus on the production of cotton, cotton
fabrics, and food. A vertical contracting system would secure quality, quantity, and timeliness of
the intermediate products needed for the food processing and clothing sectors. To date, all
attempts to develop outgrower schemes in the southern part of the Kyrgyz Republic and northern
Tajikistan have failed because of the lack of trust among farmers, traders, and processors. The
credibility-building mechanisms proposed here could help build this trust. Contracting schemes
would need to be complemented by enforced safety and quality control systems to ensure the
marketability of the food and clothing products. By building on Almaty‘s advanced food-
processing sector, policy makers and the business community of all three countries can work to
establish a regional food production network that will ensure their competitiveness in regional
and global markets.
154. By providing easy access to a relatively large population, Almaty, Astana, Bishkek,
Dushanbe, Khujand, and Osh can drive the intensification of processed agricultural products and
clothing. Urbanites everywhere prefer variety, which partly drives intra-industry trade. Safe, well-
packaged, and well-marketed products can find their way to any supermarket or bazaar, but the
food industry remains poorly developed in the Kyrgyz Republic and Tajikistan, where safety and
packaging are major concerns. An industrial upgrading strategy that includes implementation of
the HACCP system, quality control, and modern packaging processes will add to the
diversification potential of the leading Central Asian cities and their hinterlands.
How to Secure Accessibility to Key Regional Markets
155. As a 3D region, Central Asia faces the core challenge of securing accessibility to regional
and global markets in the drive for trade expansion. Policy makers at the highest levels in
Kazakhstan, the Kyrgyz Republic, and Tajikistan should therefore put the issue of accessibility at

-72-
the top of their agendas. Indeed, the economic geography challenges facing 3D regions call for a
bolder regional integration agenda to overcome high economic divisions between trading partners
and reduce the distance to major regional markets, as well as to boost economic density
domestically. If integration succeeds, the new economic geography should help the region‘s
major metropolitan area, Almaty, capture most of the benefits of agglomeration economies,
attracting increasing return to scale activities from the other leading cities, in the short and
medium terms. Kazakhstan should play the leading role in the cross-country implementation body
needed to secure accessibility to regional markets, thus balancing unevenness of short-term gains
from the regional integration initiative and securing long-term survival and success.
156. If export diversification is the underlying goal for Kazakhstan, the Kyrgyz Republic, and
Tajikistan as a group, the north–south road corridor linking the six leading cities to Afghanistan
and Russia appears to be the highest priority connection (cf. chapters 1 and 2). The major
products produced by all three Central Asian countries are traded along this north–south road
corridor going to Moscow and all the way to the EU on the northern leg of the corridor, and to
Turkey and the Gulf countries via Kabul on the southern leg. The corridor also links the two
leading cities of each country. Regional integration anchored on facilitating trade and transport
along this north–south corridor should be the bedrock of the connectivity policy of Kazakhstan,
the Kyrgyz Republic, and Tajikistan. Integration will strengthen production capacity of their
leading cities and will secure the countries‘ access to attractive regional markets such as China,
India, Russia, Turkey, and the EU-15.
157. To secure access to the key regional markets, the first policy action must be to establish a
north–south corridor management institution. The World Bank‘s Sub-Saharan Africa Transport
Policy Program identified as a best practice the establishment of a three-tier corridor management
institution for regional transport corridors, to consist of a stakeholder group, a working group, and
a secretariat (Adzigbey and others 2008). For Central Asia, the stakeholder group should consist
of high-level officials in Kazakhstan, the Kyrgyz Republic, and Tajikistan who are involved in
regulating trade and transport facilitation activities and who would serve as the policy-making
body. The region‘s working groups should consist of national implementation committees
established in each country and designed as problem-solving groups, with operational procedures
encouraging the flexibility necessary for responsiveness to ensure public-private interaction at all
levels. Different core groups can be formed on an ad hoc basis, as needed, to address specific
issues and to be disbanded once the objective is met. The secretariat of the corridor management
institution should be located in one of the six leading cities, maximizing the secretariat‘s
involvement in high-level policy making on regional integration issues.
158. A major task for the stakeholder group of the north-south corridor management
institution is to pursue a quadripartite transit agreement between China, Kazakhstan, the Kyrgyz
Republic, and Tajikistan, and complemented by a trade agreement allowing agricultural product
imports from Central Asia to reach China via Urumchi or Kashgar, thereby securing access to the
Chinese market for their agriculture-related products. So far, the only transit agreement in place
between Tajikistan and China covers the Kulma Pass near Murgab in the Gorno-Badakhshan
Autonomous Oblast—a mountainous region containing few significant settlements, where long
portions of the road are in poor condition, and where severe winter weather closes the road for
long periods. The importance of a quadripartite transit agreement with China, covering both the
Irkeshtam border crossing point between the Kyrgyz Republic and China (close to Kashgar) and
the Korgas border crossing point between Kazakhstan and China, near Urumchi, is obvious.
While some bilateral transit agreements exist between China and Central Asian countries, none of
them secure access to the Chinese market for the three Central Asian countries as a group, and
effectively reduce their actual access to the Chinese market.

-73-
159. The second major policy action needed to secure access to key regional markets is to
rehabilitate and upgrade the poorly-maintained legs of the north-south road corridor, along the
route Nijny Panj-Dushanbe-Khujand-Batken-Osh-Bishkek-Almaty-Astana-Petropavlovsk. For
instance, improving the Osh–Batken–Isfara–Khujand–Dushanbe connection would allow the
Kyrgyz Republic and Tajikistan to bypass Uzbekistan in reaching Russia or Turkey. The entire
road badly needs upgrading and rehabilitation. The Khujand-Dushanbe connection currently
operates below its potential while the Shakrishtan tunnel remains under construction, and
according to operators using this route, the Anzob tunnel is deteriorating. Establishment of this
suggested road corridor would increase competition with other routes through Uzbekistan and
would ultimately improve transit trade via Uzbekistan.
160. Once the priority highway investments in each country are agreed on, complementary
policy instruments—to be implemented by the core group of the proposed corridor management
institution—are needed to facilitate trade and transport by addressing various administrative
barriers, as well as border crossing and transit constraints. Corridor efficiency (in cost, time,
reliability, and flexibility) is imperative for trade competitiveness, particularly for landlocked
countries (Arnold and others 2005; World Bank 2009b). To take advantage of Kazakhstan‘s more
advanced and efficient trucking industry, such new regulations should also include either a clause
allowing cross-border trade in trucking services, or a clause facilitating foreign direct investment
in the trucking industry between Kazakhstan, the Kyrgyz Republic, and Tajikistan, or both.
161. Finally, policy makers (particularly those in Kazakhstan) should consider a compensation
mechanism to ensure the long-term viability of a deepened regional integration initiative. An
obvious choice would be to provide some form of subsidy for reducing transport costs between
the Kyrgyz Republic and Tajikistan and the regional hub, Almaty. The subsidy could take the
form of advantageous backhaul cargo services offered by Kazakh trucks, of favorable joint-
ventures with Kyrgyz or Tajik trucking companies, or of subsidized gasoline prices for Kyrgyz
and Tajik truckers shipping goods to Almaty for consolidation. Such a win-win deal would give
Kyrgyz and Tajik traders the lower transport costs they need to reach regional markets, while
enhancing Almaty‘s future as a regional hub, promoting its large range of multi-modal and
intermediation services.
162. Combining these three main policy actions with the two others suggested earlier to
promote economic density (SEZs in leading cities) and to improve connections between leading
cities and their agricultural hinterlands (adequate inter-urban transportation infrastructure, market
places, and storage facilities in the city-hinterlands), is the core of the city-led diversification
strategy. Some additional measures may be considered given the specific needs of each leading
city.

-74-
Appendix 1. Production Data
Table A1.1. Production by Sector, Leading Cities of Kazakhstan, the Kyrgyz Republic, and Tajikistan,
2008, in USD millions
Country and City Industry Mining Manufacturing
Electricity, gas,
and watera
Kazakhstan 84,692 52,129.0 28,083 4,480
Almaty 3,180 7.1 2,838 307
Astana 919 0.0 748 143
Kyrgyz Republic 2,345 52.0 1,918 375
Bishkek 521 0.1 415 106
Osh 47 0.0 17 31
Tajikistan 1,722 n.a. n.a. n.a.
Sughd oblastb 323 n.a. n.a. n.a.
Dushanbe 149 n.a. n.a. n.a.
Source: Statistical agencies of Kazakhstan, the Kyrgyz Republic, and Tajikistan. a Includes distribution. b No data are available for Khujand; data are available only for the Sughd oblast region as a whole.
n.a. = Not available.
Table A1.2. Domestic Production, Leading Cities of Kazakhstan and the Kyrgyz Republic, 2008
Top Items USD millions
Percentage of all city
production
Almaty 2,563.1 100.00
Ready-mixed concrete 167.3 6.50
Copper 141.4 5.50
Mineral water and other nonalcoholic drinks 123.1 4.80
Polygraphist activity 118.0 4.60
Brewing 113.7 4.40
Cacao, chocolate, and sugar confectionary 91.1 3.60
Light metal structures 83.3 3.30
Astana 806.0 100.00
Ready-mixed concrete 204.4 25.40
Concrete products 73.3 9.10
Maintenance of railway rolling stock 70.6 8.80
Wall blocks 35.8 4.40
Bishkek 394.9 100.00
Foodstuffs, including beverages 100.6 25.47
Electricity, gas and water a 74.9 18.96
Nonmetallic mineral products 35.9 9.10
Pulp and paper industry, publishing 27.2 6.90
Rubber and plastic products 27.0 6.83
Tobacco 26.8 6.78
Textiles and clothing 21.0 5.32
Osh 45.5 100.00
Electricity, gas and water a 30.9 67.83
Foodstuffs, including beverages 6.9 15.05
Nonmetallic mineral products 4.5 9.97
Textiles and clothing 1.3 2.91
Source: Statistical agencies of Kazakhstan and the Kyrgyz Republic. a Includes distribution.

-75-
Table A1.3. Number of Firms by Type of Economic Activity, Leading Cities of Kazakhstan, the
Kyrgyz Republic, and Tajikistan, 2008
Country and City All Firms Large firms Medium firms Small firms
Total
Kazakhstan 85,014 1,732 5,010 78,272
Almaty 21,961 348 982 20,631
Astana 7,976 144 369 7,463
Kyrgyz Republic 22,418 1,625 3,366 17,427
Bishkek 8,607 584 776 7,247
Osh 1,075 119 128 828
Mining
Kazakhstan 848 117 147 584
Almaty 47 3 3 41
Astana 18 2 1 15
Kyrgyz Republic 78 n.a. n.a.
n.a.
Bishkek 6 n.a. n.a. 6
Osh 2 n.a. n.a. 2
Manufacturing
Kazakhstan 7,798 361 766 6,671
Almaty 2,164 58 137 1,969
Astana 523 16 42 465
Kyrgyz Republic 1,681 n.a. n.a. n.a.
Bishkek 688 18 53 617
Osh 108 2 5 101
Tajikistan 798 (a) n.a. (b) n.a. (c) n.a.
Dushanbe 234 n.a. n.a. n.a.
Sughd oblasta 233 n.a. n.a. n.a.
Services and other
Kazakhstan 76,368 1,254 4,097 71,017
Almaty 19,750 287 842 18,621
Astana 7,435 126 326 6,983
Kyrgyz Republic 20,659 n.a. n.a. n.a.
Bishkek 7,913 566 723 6,624
Osh 965 117 123 725
Source: Statistical agencies of Kazakhstan, the Kyrgyz Republic, and Tajikistan. a No data are available for Khujand; data are available only for the Sughd oblast region as a whole.
n.a. = Not available
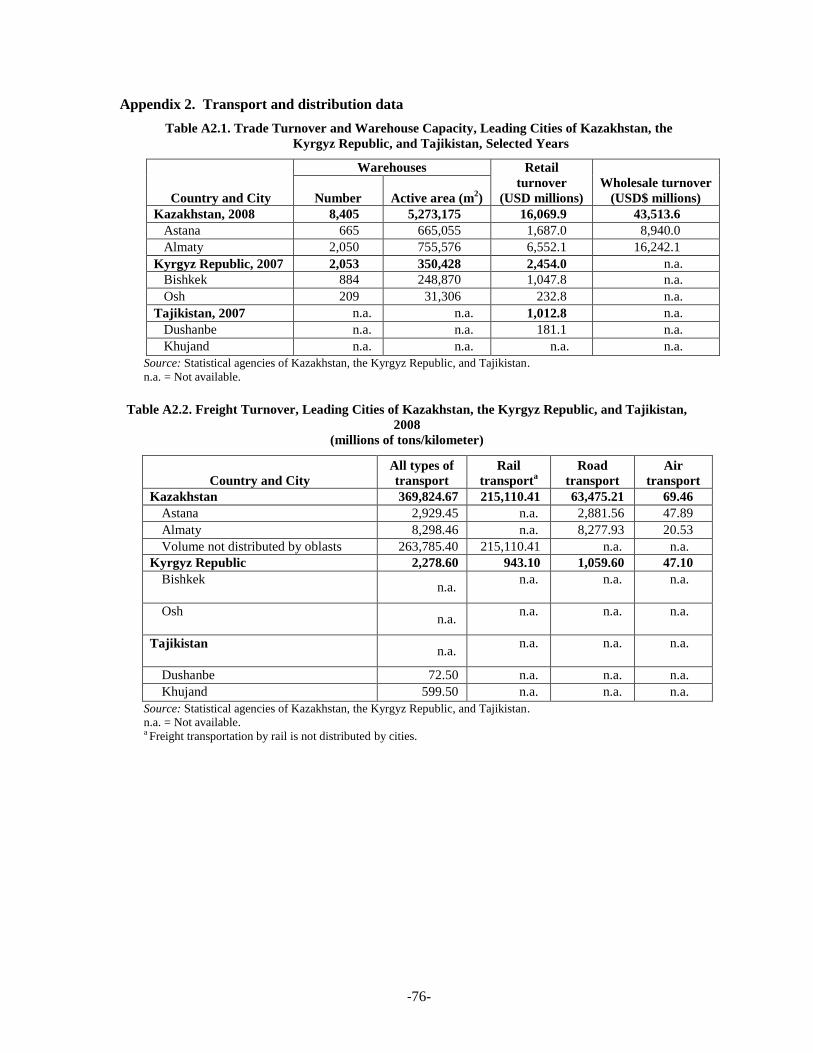
-76-
Appendix 2. Transport and distribution data
Table A2.1. Trade Turnover and Warehouse Capacity, Leading Cities of Kazakhstan, the
Kyrgyz Republic, and Tajikistan, Selected Years
Country and City
Warehouses Retail
turnover
(USD millions)
Wholesale turnover
(USD$ millions) Number Active area (m2)
Kazakhstan, 2008 8,405 5,273,175 16,069.9 43,513.6
Astana 665 665,055 1,687.0 8,940.0
Almaty 2,050 755,576 6,552.1 16,242.1
Kyrgyz Republic, 2007 2,053 350,428 2,454.0 n.a.
Bishkek 884 248,870 1,047.8 n.a.
Osh 209 31,306 232.8 n.a.
Tajikistan, 2007 n.a. n.a. 1,012.8 n.a.
Dushanbe n.a. n.a. 181.1 n.a.
Khujand n.a. n.a. n.a. n.a.
Source: Statistical agencies of Kazakhstan, the Kyrgyz Republic, and Tajikistan.
n.a. = Not available.
Table A2.2. Freight Turnover, Leading Cities of Kazakhstan, the Kyrgyz Republic, and Tajikistan,
2008
(millions of tons/kilometer)
Country and City
All types of
transport
Rail
transporta
Road
transport
Air
transport
Kazakhstan 369,824.67 215,110.41 63,475.21 69.46
Astana 2,929.45 n.a. 2,881.56 47.89
Almaty 8,298.46 n.a. 8,277.93 20.53
Volume not distributed by oblasts 263,785.40 215,110.41 n.a. n.a.
Kyrgyz Republic 2,278.60 943.10 1,059.60 47.10
Bishkek n.a.
n.a. n.a. n.a.
Osh n.a.
n.a. n.a. n.a.
Tajikistan n.a.
n.a. n.a. n.a.
Dushanbe 72.50 n.a. n.a. n.a.
Khujand 599.50 n.a. n.a. n.a.
Source: Statistical agencies of Kazakhstan, the Kyrgyz Republic, and Tajikistan.
n.a. = Not available.
a Freight transportation by rail is not distributed by cities.

-77-
Table A2.3. Freight Transportation, Leading Cities of Kazakhstan, the Kyrgyz Republic, and
Tajikistan, 2008
(thousands of tons)
Country and City
All types of
transport
Rail
transporta
Road
transport
Air
transport
Kazakhstan 2,191,838.66 271,547.47 1,720,924.06 23.71
Astana 58,645.18 n.a.
58,628.79 16.39
Almaty 128,568.35 n.a.
128,561.60 6.75
Volume not distributed by oblasts 397,371.51 271,547.47 n.a. n.a.
Kyrgyz Republic 31,700.00 1,800.00 29,234.30 0.90
Bishkek n.a. n.a. 5,481.30 n.a.
Osh n.a. n.a. 1,141.10 n.a.
Tajikistan 47,381.90 14,555.40 32,824.00 2.50
Dushanbe 11,912.20 n.a. n.a. n.a.
Khujand 1,441.90 n.a. n.a. n.a.
Source: Statistical agencies of Kazakhstan, the Kyrgyz Republic, and Tajikistan.
n.a. = Not available.
a Freight transportation by rail is not distributed by cities.
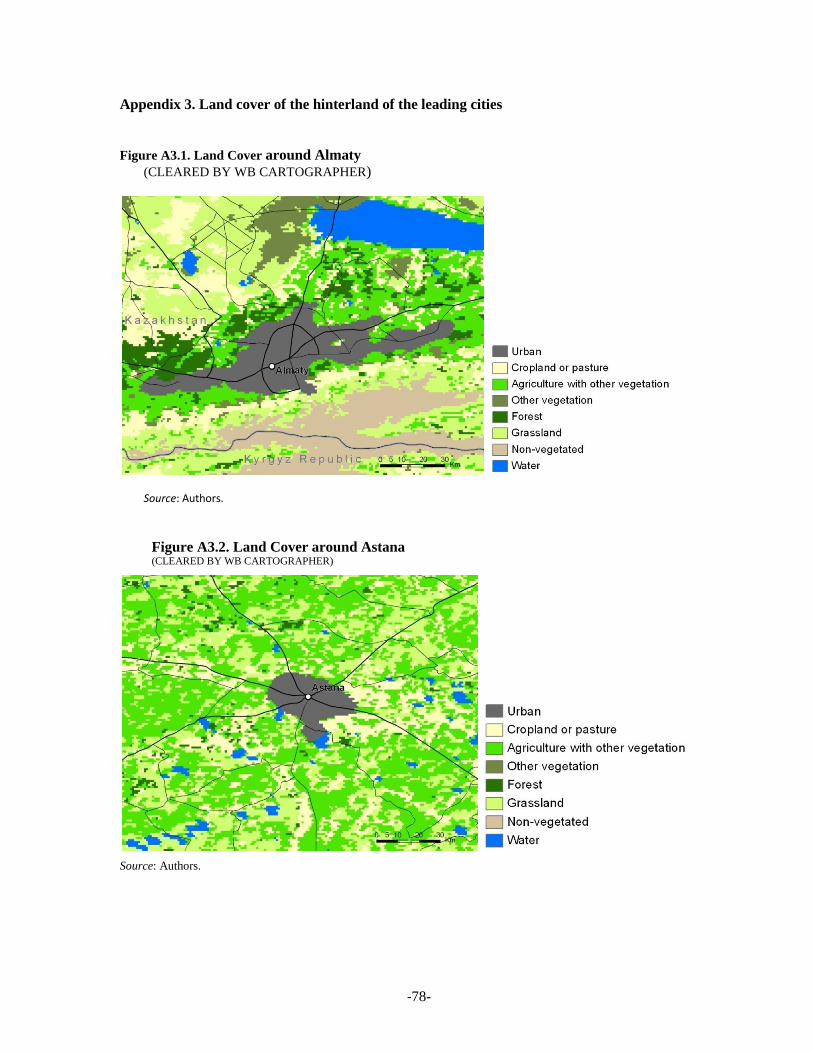
-78-
Appendix 3. Land cover of the hinterland of the leading cities
Figure A3.1. Land Cover around Almaty
(CLEARED BY WB CARTOGRAPHER)
Source: Authors.
Figure A3.2. Land Cover around Astana (CLEARED BY WB CARTOGRAPHER)
Source: Authors.

-79-
Figure A3.3. Land Cover around Bishkek
(CLEARED BY WB CARTOGRAPHER)
Source: Authors.
Figure A3.4. Land Cover around Osh
(CLEARED BY WB CARTOGRAPHER)
Source: Authors.

-80-
Figure A3.5. Land Cover aroundDushanbe
(CLEARED BY WB CARTOGRAPHER)
Source: Authors.
Figure A3.6. Land Cover around Khujand
(CLEARED BY WB CARTOGRAPHER)
Source: Authors.

-81-
REFERENCES
Adzigbey, Y., C. Kunaka, and T. N. Mitiku. 2008. Institutional Arrangements for Transport
Corridor Management in Sub-Saharan Africa. SSATP Working Papers No. 86,
Washington DC.
Agribusiness Competitiveness Center. 2008. Monitoring of Existing Barriers Restraining
Promotion of Products and Trade Development in the Region. Bishkek: Agribusiness
Competitiveness Center.
Arnold, J., J. F. Arvis, and G. Olivier. 2005. ―Best Practice in Corridor Management.‖ Working
Paper, World Bank, Washington, DC.
Board of Investment. 1996. Policies and Criteria for Investment Promotion and List of Activities
Eligible for Investment Promotion. Bangkok: Office of the Board of Investment.
Boltho, A., W. Carlin, and P. Scaramozzino. 1997. ―Will East Germany Become a New
Mezzogiorno?‖ Journal of Comparative Economics 24 (3): 241–64.
Bolwig, S., S. Ponte, A. D. Toit, L. Riisgaard, and N. Halberg. 2008. ―Integrating Poverty,
Gender and Environmental Concerns into Value Chain Analysis: A Conceptual
Framework and Lessons for Action Research.‖ Working Paper 16, DIIS.
Brenton, P., and R. Newfarmer. 2008. ―Watching More Than the Discovery Channel: Export
Cycles and Diversification in Development.‖ Policy Research Working Paper 4302,
World Bank, Washington, DC.
Broadman, Harry J. 2005. From Disintegration to Reintegration: Eastern Europe and the Former
Soviet Union in International Trade. Washington, DC: World Bank.
CAREC (Central Asia Regional Economic Cooperation). 2008. Action Plan for Implementation
of Trade Facilitation Strategy. Baku: CAREC.
Chuang, Y.-C. 1998. ―Learning by Doing, Technology Gap, and Growth.‖ International
Economics Review 39 (3): 697–721.
Eaton, J., M. Eslava, M. Kugler, and J. Tybout. 2007. ―Export Dynamics in Colombia: Firm-
Level Evidence.‖ NBER Working Paper No. 13531, Cambridge, MA.
Eurasian Development Bank. 2009. EURASEC Transport Corridors. Sector Report. Eurasian
Development Bank, Almaty.
Farole, Thomas. (forthcoming). Special Economic Zones in Africa: Comparing Performance and
Learning from International Experiences. Washington, DC: World Bank.
Finger, M. 2008. ―Trade Facilitation: The Role of a WTO Agreement.‖ Working Paper 01/2008,
ECIPE, Brussels.
Global Development Solutions. 2009. ―Horticulture Potential in Northern Tajikistan and Southern
Kyrgyz Republic.‖ Background paper for this study, Global Development Solutions,
LLC, Reston, VA.
Haddad, M., J. Lim, and C. Saborowski. 2010. ―Trade Openness Reduces Growth volatility When
Countries Are well Diversified.‖ Policy Research Working Paper 5222, World Bank,
Washington, DC.

-82-
Herzer, D., and F. Nowak-Lehman. 2006. ―What Does Export Diversification Do for Growth? An
Econometric Analysis.‖ Applied Economics 38: 1825–38.
Hewison, K. 1989. Bankers and Bureaucrats: Capital and the Role of State in Thailand. New
Haven, CT: Yale Center for International and Area Studies.
Imbs, J., and R. Wacziarg. 2003. ―Stages of Diversification.‖ American Economic Review 93 (1):
603–33.
International Finance Corporation and World Bank. 2009. Doing Business. Washington, DC:
International Finance Corporation and World Bank.
International Road and Transport Union. 2009. New Eurasian Land Transport Initiative. Final
report. International Road and Transport Union, Moscow.
Jomo, K. S., and M. Rock. 1998. ―Economic Diversification and Primary Commodity Processing
in the Second-Tier South-East Asian Newly Industrializing Countries.‖ Discussion
Papers 136, United Nations Conference on Trade and Development.
Krugman, P. 1991. ―Increasing Returns to Scale and Economic Geography.‖ Journal of Political
Economy 99 (3): 483–99.
Kuznets, S. 1971. Economic Growth of Nations: Total Output and Production Structure.
Cambridge, MA: Harvard University Press.
M-Vector. 2009a. ―Business Enabling Survey in Distribution and Transport: Kazakhstan Report.‖
Background paper for this study, M-Vector, Bishkek.
_____. 2009b. ―Business Enabling Survey in Distribution and Transport: Kyrgyz Republic
Report.‖ Background paper for this study, M-Vector, Bishkek.
_____. 2009c. ―Business Enabling Survey in Distribution and Transport: Tajikistan Report.‖
Background paper for this study, M-Vector, Bishkek.
Manarungsan, S., and S. Suwanjindar. 1992. ―Contract Farming and Outgrower Schemes in
Thailand.‖ In Contract Farming in South-East Asia, ed. D. Glover and Lim Teck Ghee.
Kuala Lumpur: University of Malaysia, Institute of Advanced Studies.
Mayer, T. 2008. ―Market Potential and Development.‖ Background paper for the World
Development Report 2009: Reshaping Economic Geography, World Bank, Washington,
DC.
Melitz, M. J. 2003. ―The Impact of Trade on Aggregate Industry Productivity and Intra-Industry
Reallocations.‖ Econometrica 71 (6): 1695–1725.
Mennonite Economic Development Associates. 2005. Evaluation of Service Providers in Fruit
and Vegetables Processing Sector in Sugd Region. Mennonite Economic Development
Associates, Khujand.
Pasuk, P., and C. Baker. 1995. Thailand: Economy and Politics. Kuala Lumpur: Oxford
University Press.
Patagonia Times. 2007. October 29. Santiago and Valparaiso, Chile.
Reardon, T., and A. Gulati. 2008. The Supermarket Revolution in Developing Countries: Policies
for Competitiveness with Inclusiveness. International Food Policy Research Institute
Policy brief No. 2, Washington DC.

-83-
Shepherd, B., and J. S. Wilson. 2006. ―Road Infrastructure in Europe and Central Asia: Does
Network Quality Affects Trade?‖ Policy Research Working Paper 4104, World Bank,
Washington, DC.
Thomsen, L. 2009. ―Accessing Markets from Central Asia: Background Work on Global Value
Chains.‖ Background paper for this study.
World Bank. 1993. The East Asian Miracle. Washington. DC: World Bank.
_____. 1999. ICR Kazakhstan Urban Transport Project (Loan 3725-KZ). Washington, DC:
World Bank.
_____. 2007a. Kyrgyz Republic Livestock Review: Embracing the New Challenges. Washington,
DC: World Bank.
_____. 2007b. Priorities for Sustainable Growth: A Strategy for Agriculture Sector Development
in Tajikistan. Washington, DC: World Bank.
_____. 2008. World Development Report 2008: Agriculture for Development. Washington, DC:
World Bank.
_____. 2009a. Bazaars and Trade Integration in CAREC Countries. Washington, DC: World
Bank.
_____. 2009b. Trade and Transport Facilitation in Landlocked Developing Countries.
Washington, DC: World Bank.
_____. 2009c. World Development Report 2009: Reshaping Economic Geography. Washington,
DC: World Bank.
_____. 2009d. Reshaping Economic Geography in East Asia. Washington, DC: World Bank.
Wrathall, K., and C. Haigh. 2005. Central Asia Project Stage 2: Enterprise Diagnosis:
Information and Communication Technology. Report prepared on behalf of ITC, Geneva.
Yoshino, Y. 2008. ―Domestic Constraints, Firm Characteristics, and Geographical Diversification
of Firm-Level Manufacturing Exports in Africa.‖ Policy Research Working Paper 4575,
World Bank, Washington, DC.