census of antarctic marine life scar-marine...
TRANSCRIPT
EDITED BY: Claude DE BROYER & Philippe KOUBBI (chief editors)
with Huw GRIFFITHS, Ben RAYMOND, Cédric d’UDEKEM d’ACOZ, Anton VAN DE PUTTE, Bruno DANIS, Bruno DAVID, Susie GRANT, Julian GUTT, Christoph HELD, Graham HOSIE, Falk HUETTMANN, Alexandra POST & Yan ROPERT-COUDERT
BIOGEOGRAPHIC ATLASOF THE SOUTHERN OCEAN
SCIENTIFIC COMMITTEE ON ANTARCTIC RESEARCH
Census of Antarctic Marine LifeSCAR-Marine Biodiversity Information Network
CHAPTER 2.2. Data distribution: Patterns and implications.
In: De Broyer C., Koubbi P., Griffiths H.J., Raymond B., Udekem d’Acoz C. d’, et al. (eds.). Biogeographic Atlas of the Southern Ocean. Scientific Committee on Antarctic Research, Cambridge, pp. 16-26.
Griffiths H.J., Van de Putte A.P., Danis B., 2014.
II
THE BIOGEOGRAPHIC ATLAS OF THE SOUTHERN OCEAN
The “Biogeographic Atlas of the Southern Ocean” is a legacy of the International Polar Year 2007-2009 (www.ipy.org) and of the Census of Marine Life 2000-2010 (www.coml.org), contributed by the Census of Antarctic Marine Life (www.caml.aq) and the SCAR Marine Biodiversity Information Network (www.scarmarbin.be; www.biodiversity.aq).
The “Biogeographic Atlas” is a contribution to the SCAR programmes Ant-ECO (State of the Antarctic Ecosystem) and AnT-ERA (Antarctic Thresholds- Ecosys-tem Resilience and Adaptation) (www.scar.org/science-themes/ecosystems).
Edited by: Claude De Broyer (Royal Belgian Institute of Natural Sciences, Brussels)Philippe Koubbi (Université Pierre et Marie Curie, Paris)Huw Griffiths (British Antarctic Survey, Cambridge)Ben Raymond (Australian Antarctic Division, Hobart)Cédric d’Udekem d’Acoz (Royal Belgian Institute of Natural Sciences, Brussels)Anton Van de Putte (Royal Belgian Institute of Natural Sciences, Brussels)Bruno Danis (Université Libre de Bruxelles, Brussels)Bruno David (Université de Bourgogne, Dijon)Susie Grant (British Antarctic Survey, Cambridge)Julian Gutt (Alfred Wegener Institute, Helmoltz Centre for Polar and Marine Research, Bremerhaven)Christoph Held (Alfred Wegener Institute, Helmoltz Centre for Polar and Marine Research, Bremerhaven)Graham Hosie (Australian Antarctic Division, Hobart)Falk Huettmann (University of Alaska, Fairbanks)Alix Post (Geoscience Australia, Canberra)Yan Ropert-Coudert (Institut Pluridisciplinaire Hubert Currien, Strasbourg)
Published by: The Scientific Committee on Antarctic Research, Scott Polar Research Institute, Lensfield Road, Cambridge, CB2 1ER, United Kingdom (www.scar.org).
Publication funded by:- The Census of Marine Life (Albert P. Sloan Foundation, New York)- The TOTAL Foundation, Paris. The “Biogeographic Atlas of the Southern Ocean” shared the Cosmos Prize awarded to the Census of Marine Life by the International Osaka Expo’90 Com-memorative Foundation, Tokyo, Japan.
Publication supported by:- The Belgian Science Policy (Belspo), through the Belgian Scientific Research Programme on the Antarctic and the “biodiversity.aq” network (SCAR-MarBIN/ANTABIF)- The Royal Belgian Institute of Natural Sciences (RBINS), Brussels, Belgium- The British Antarctic Survey (BAS), Cambridge, United Kingdom- The Université Pierre et Marie Curie (UPMC), Paris, France- The Australian Antarctic Division, Hobart, Australia- The Scientific Steering Committee of CAML, Michael Stoddart (CAML Administrator) and Victoria Wadley (CAML Project Manager)
Mapping coordination and design: Huw Griffiths (BAS, Cambridge) & Anton Van de Putte (RBINS, Brussels)Editorial assistance: Henri Robert, Xavier Loréa, Charlotte Havermans, Nicole Moortgat (RBINS, Brussels)Printed by: Altitude Design, Rue Saint Josse, 15, B-1210 Brussels, Belgium (www.altitude-design.be)Lay out: Sigrid Camus & Amélie Blaton (Altitude Design, Brussels).Cover design: Amélie Blaton (Altitude Design, Brussels) and the Editorial Team.Cover pictures: amphipod crustacean (Epimeria rubrieques De Broyer & Klages, 1991), image © T. Riehl, University of Hamburg; krill (Euphausia superba Dana, 1850), image © V. Siegel, Institute of Sea Fisheries, Hamburg; fish (Chaenocephalus sp.), image © C. d’Udekem d’Acoz, RBINS; emperor penguin (Aptenodytes forsteri G.R. Gray, 1844), image © C. d’Udekem d’Acoz, RBINS; Humpback whale (Megaptera novaeangliae (Borowski, 1781)), image © L. Kin-dermann, AWI.
Online dynamic version :A dynamic online version of the Biogeographic Atlas will be available on the SCAR-MarBIN / AntaBIF portal : atlas.biodiversity.aq.
Recommended citation: For the volume: De Broyer C., Koubbi P., Griffiths H.J., Raymond B., Udekem d’Acoz C. d’, Van de Putte A.P., Danis B., David B., Grant S., Gutt J., Held C., Hosie G., Huettmann F., Post A., Ropert-Coudert Y. (eds.), 2014. Biogeographic Atlas of the Southern Ocean. Scientific Committee on Antarctic Research, Cambridge, XII + 498 pp.
For individual chapter: (e.g.) Crame A., 2014. Chapter 3.1. Evolutionary Setting. In: De Broyer C., Koubbi P., Griffiths H.J., Raymond B., Udekem d’Acoz C. d’, et al. (eds.). Biogeographic Atlas of the Southern Ocean. Scientific Committee on Antarctic Research, Cambridge, pp. xx-yy.
ISBN: 978-0-948277-28-3.
This publication is licensed under a Creative Commons Attribution-NonCommercial 4.0 International License
Biogeographic Atlas of the Southern Ocean
16
Data gap analysis
2.2. Data distribution: Patterns and implications
Huw J. Griffiths1, Anton Van de Putte2 & Bruno Danis3
1 British Antarctic Survey, Cambridge, UK2 Royal Belgian Institute of Natural Sciences, Operational Directorate Natural Environment, Brussels, Belgium3 Marine Biology Laboratory, Université Libre de Bruxelles, Brussels, Belgium
1. IntroductionHuman interaction with Antarctica’s marine resources dates back to the 18th century, with true scientific research beginning in the 19th century. Amongst the first expeditions to undertake systematic sampling of the benthos and plankton were those of HMS Challenger, Belgica and the Discovery. The taxonomic work that resulted from these early expeditions has provided the basis of modern taxonomy applied to the region (Griffiths 2010).
More recent technological advances have enabled the exploration of previously unsampled regions, however, before we can undertake analy-ses of biogeographical or macroecological patterns, we need to ascer-tain how comprehensive our sampling is. The critical factors here are the extent to which the fauna has been described, and how extensive the sample coverage has been. Previous work has identified significant geo-graphic and bathymetric sampling gaps including the deep sea, Wilkes Land and in the Bellingshausen and Amundsen Seas (Clarke & Johnston 2003, Clarke et al. 2007, Griffiths 2010, Griffiths et al. 2011).
Digital taxonomic and biogeographic databases of Antarctic marine life such as the Register of Antarctic Marine Species (RAMS; De Broyer et al. 2013) and the SCAR Marine Biogeographic Information Network (SCAR-MarBIN; De Broyer & Danis 2013) have, for the first time, enabled researchers to access and contribute to the most comprehensive cata-logue of living organisms from the Southern Ocean. Data for many signifi-cant taxonomic groups were lacking during previous assessments of the data including: pycnogonids, isopods, sponges, annelids and bryozoans (Griffiths et al. 2011). Thanks to efforts made during the production of this Atlas many of these taxonomic gaps have now been addressed.
It is certain that further sampling, taxonomic and molecular work will update many of these distributions and totals. The aim of this chapter is to quantify, visualise and explore the data used to create this Atlas. This will allow us to ascertain how evenly and well-sampled our study region is and how the distribution of this sampling influences our understanding of the biogeography.
2. MethodsData were compiled on different taxonomic groups for this Atlas following a standard set for protocols and criteria (see Chapter 2.1). These datas-ets were then combined to form a single database for the purpose of the following analyses (~1.07 million distinct records). The database included the data used for all benthic taxa chapters and all records for the fish, however data from two chapters of the pelagic/planktonic partr could not be included due to the poor geographic resolution of the available data (Chapters 6.1 and 6.4).
Data were compiled at a range of taxonomic levels. For the overall counts of records it was important to include all records at the correct taxonomic resolution, however for counting species it was vital that only records with valid species names are included. This was done by using the most up to date species lists and taxonomy validated by the RAMS taxonomic editors and the chapter authors. For any records that weren’t validated by the chapter authors (e.g. additional records from OBIS), the validated species names list was then used to remove synonymies and to determine which data points were used in all species level analyses.
For the analyses presented here we define a station as a unique combination of latitude and longitude (to 4 decimal places) irrespective of sampling date. To avoid the potential problem of duplicate presence records in such a large dataset only the first occurrence of a species at a station was included in our working data set.
We mapped all data used in the Atlas from 40° south; with the under-standing that not all chapters include data which reaches this far north and that these northern regions may not have been comprehensively covered in those that do (Map 1). We confined our more detailed analyses to sta-tions within the primary area of interest for SCAR-MarBIN which is roughly equivalent to the region south of the mean position of the Polar Front (PF) and the area for which the most comprehensive data has been assembled (Map 1). The SCAR-MarBIN secondary area of interest (not shown) is the area north of the PF as far as the Sub-Tropical Front. For biogeographical analysis, each station was assigned to a unique cell in a 3° of latitude by 3° of longitude grid (Clarke et al. 2007).
Sampling depth was not available for all records and these records were excluded from any bathymetric analyses. As every station and spe-cies record had been assigned to a 3° grid cell it was possible to determine the number of distinct species and the number of distinct stations per cell
using simple queries run in Microsoft Access©. These counts were then linked to ESRI’s ArcGIS© to produce maps of species and site numbers per grid cell following the approach undertaken by Griffiths et al. (2011).
This approach allowed us to undertake analyses and plot maps at a range of taxonomic and functional scales. These included an analysis of all species combined (that is, the entire data set), analyses of individual phyla, and analyses of broad functional groups (benthic, planktonic, fish and endothermic higher predators). Marine invertebrate taxa were as-signed to either benthos or plankton on the basis of their chapter, the literature or, for the more difficult groups, information provided by the cor-responding taxonomic editors.
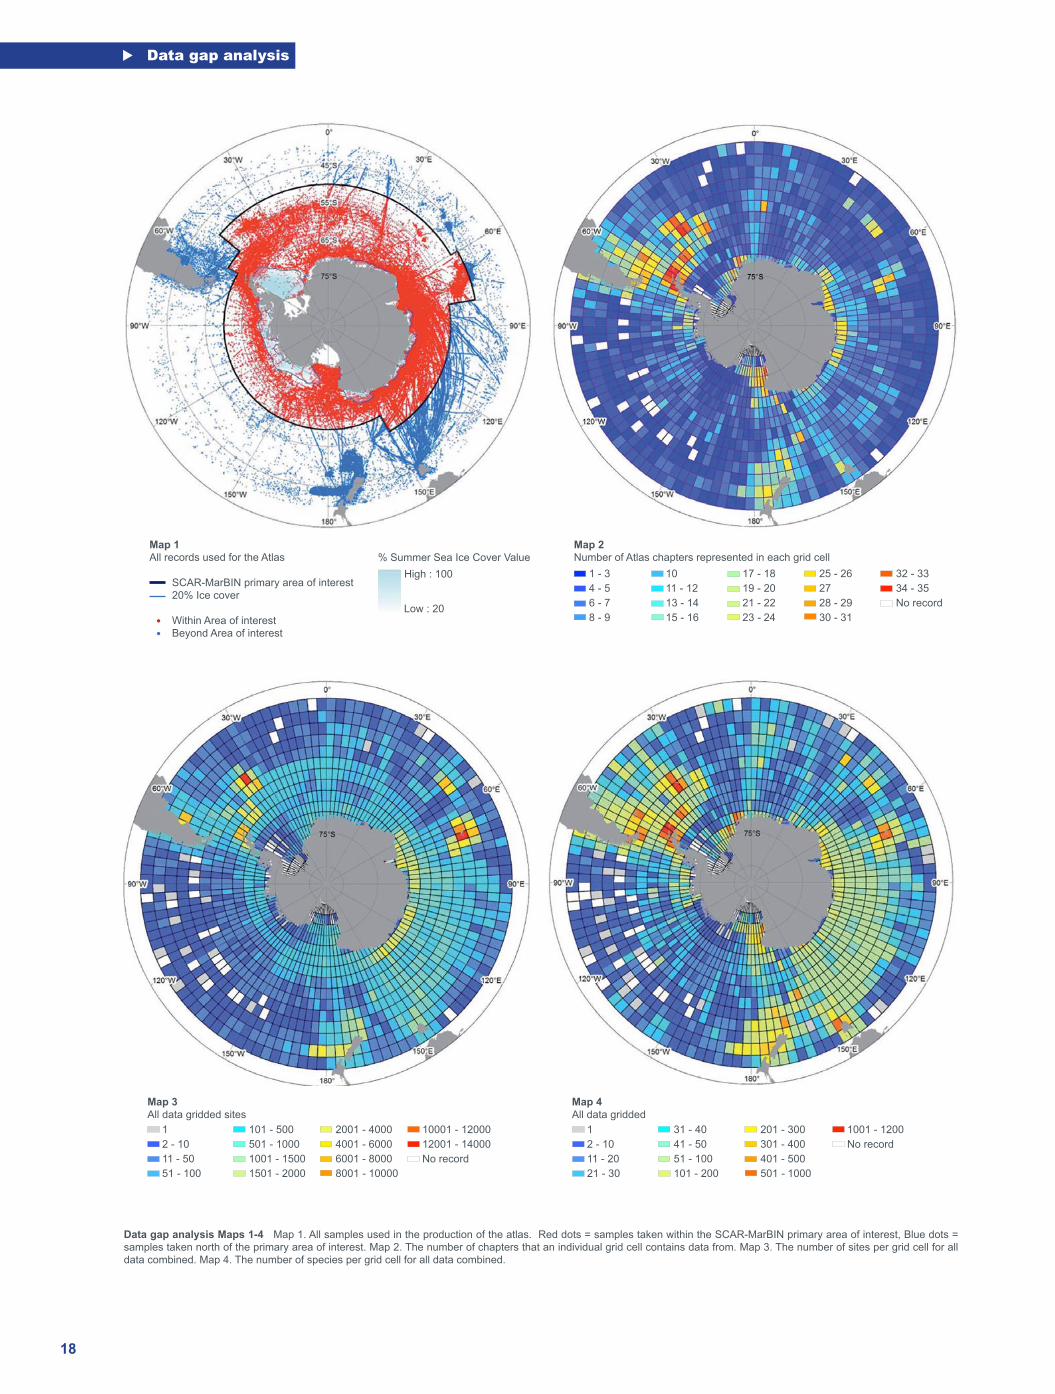
3. ResultsThe complete database, including records from beyond the SCAR-Mar-BIN primary area of interest up to 40°S, represents 1.07 million occur-rence records for 9064 valid species from ~434.000 distinct sampling sta-tions. These data are included in the 38 chapters of this Atlas (in Parts 5 to 8). The number of chapters of the Atlas represented per grid cell are shown in Map 2. This shows the geographic regions that are best repre-sented by the Atlas. These regions include the majority of the Scotia Sea (excluding the North Scotia Ridge and some cells of deeper water), the Eastern Weddell Sea, the Ross Sea, the coastal East Antarctic and the Sub-Antarctic Islands.
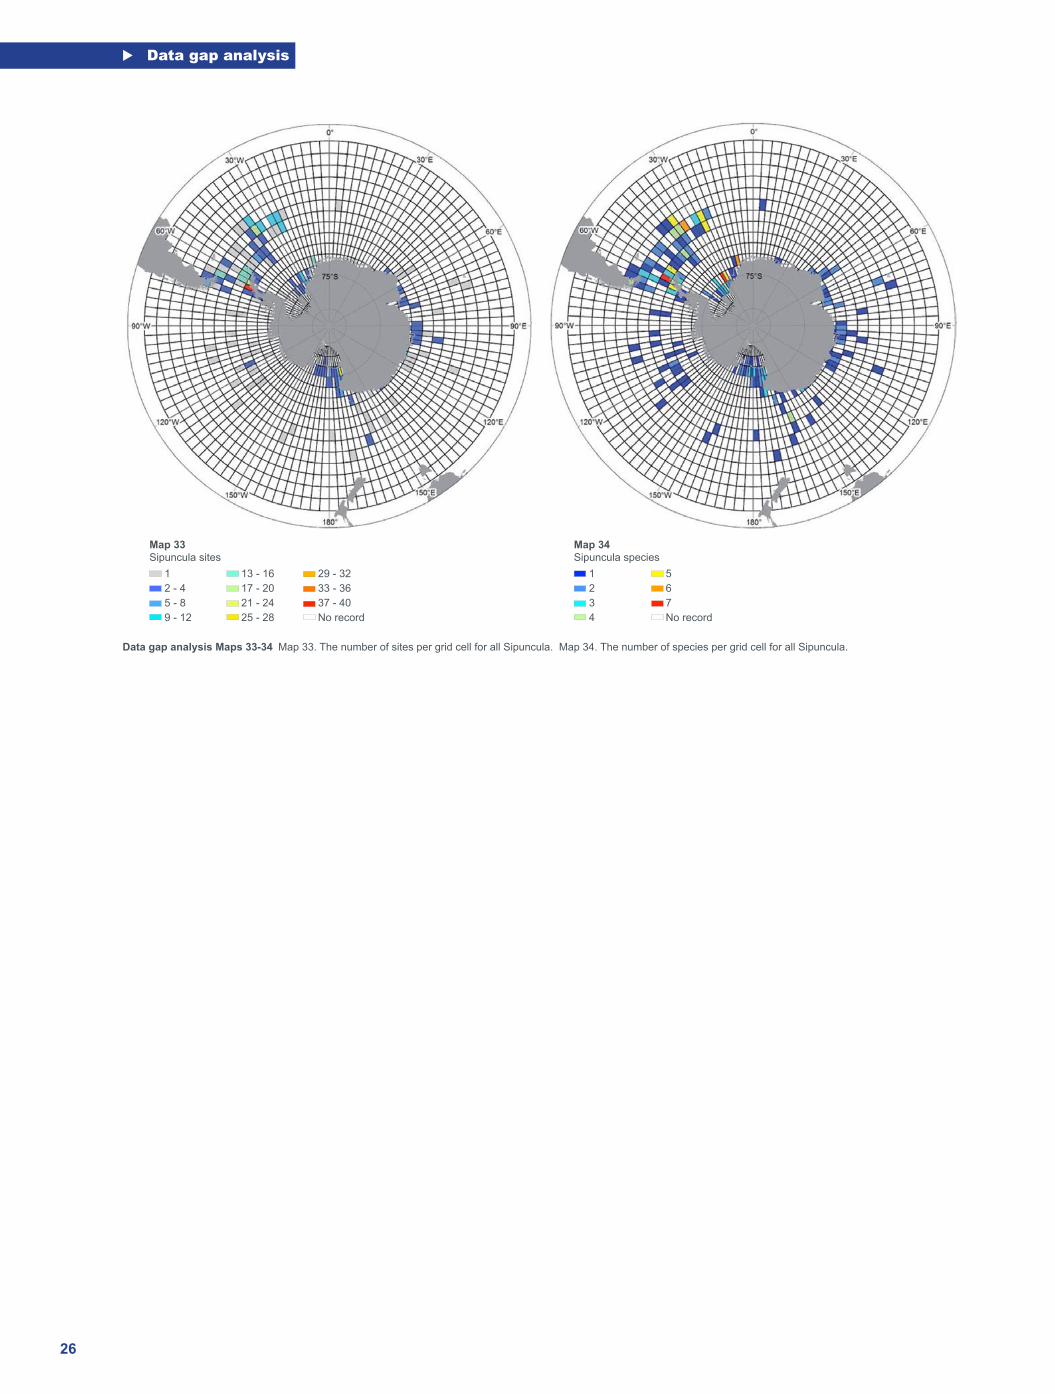
There are 1387 grid cells (3° latitude by 3° longitude) south of 40° south. Of these, 1364 cells (98%) contained at least one data record (Map 3). However the distribution of these records is far from even, with 144 cells containing fewer than 5 stations and, at the other extreme, 13 cells containing over 5000 stations. There is a similar pattern to the distribution of species numbers with 154 cells containing fewer than 5 species and 85 with more than 200 species (Map 4). Areas of combined intense sampling and high species richness fall in two broad areas: the West Antarctic Pen-insula (WAP) plus the South Shetland Islands (SSI), and the 50°E to 165° E section of East Antarctica (EA). In contrast two areas of high species richness, in the Eastern Weddell Sea (EWS) and the Ross Sea (RS), are not associated with high numbers of samples.
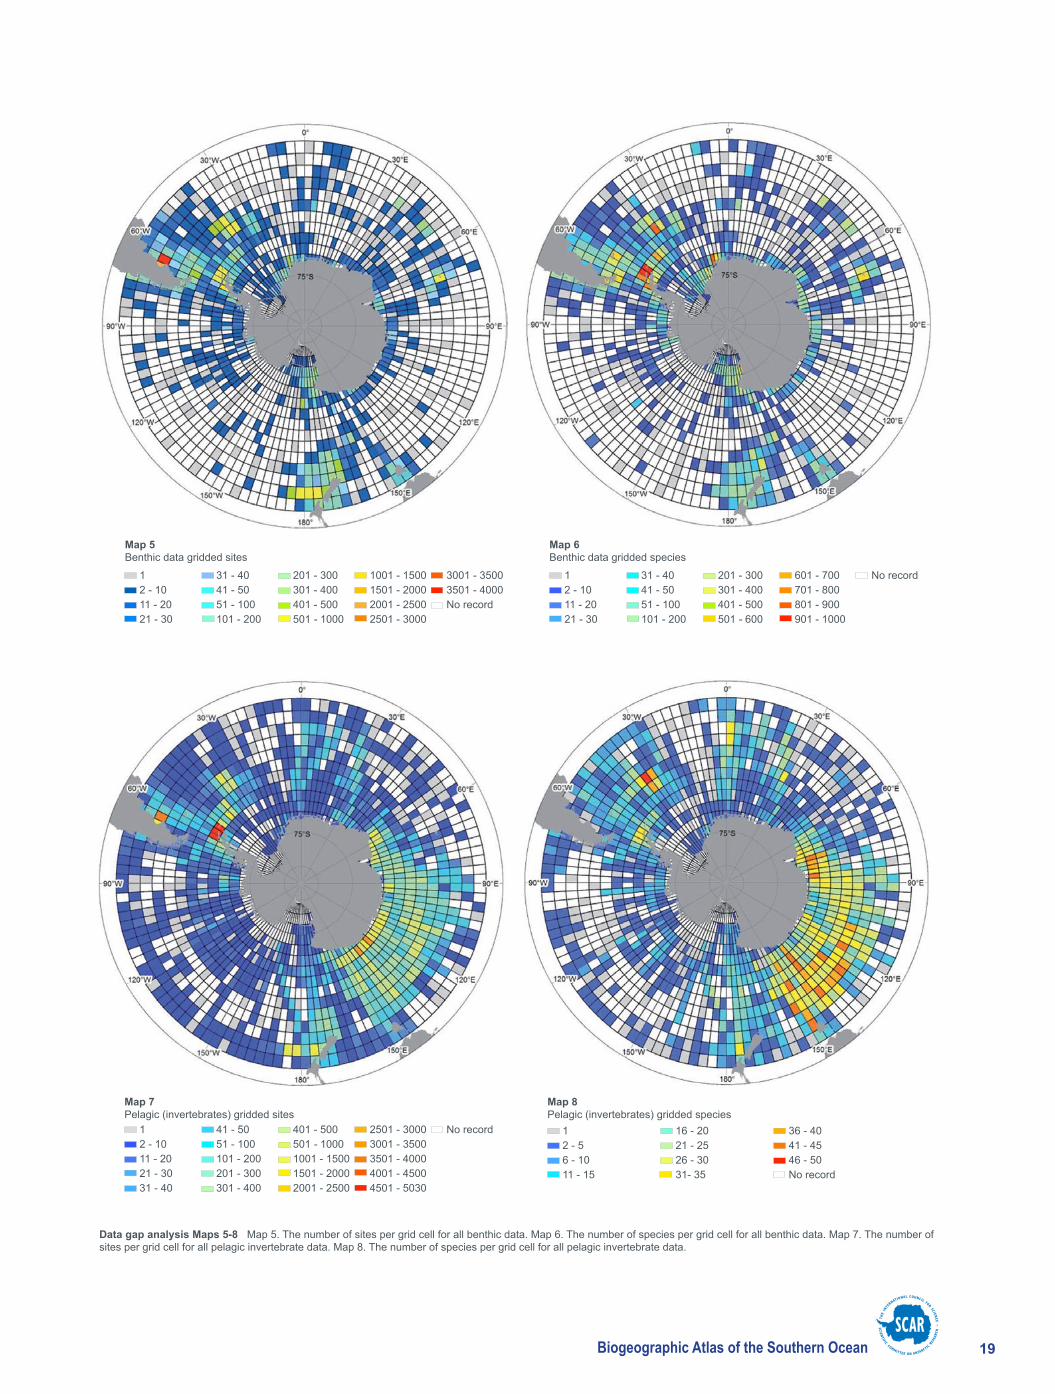
These broad patterns, however, mask important differences in the distribution of benthic and pelagic (planktonic invertebrate) samples. Ben-thic samples have been mostly taken on the continental shelf, whereas pelagic samples have been taken over both shallow and deep water, and this shows up clearly in the apparent distribution of richness (Maps 5-8).
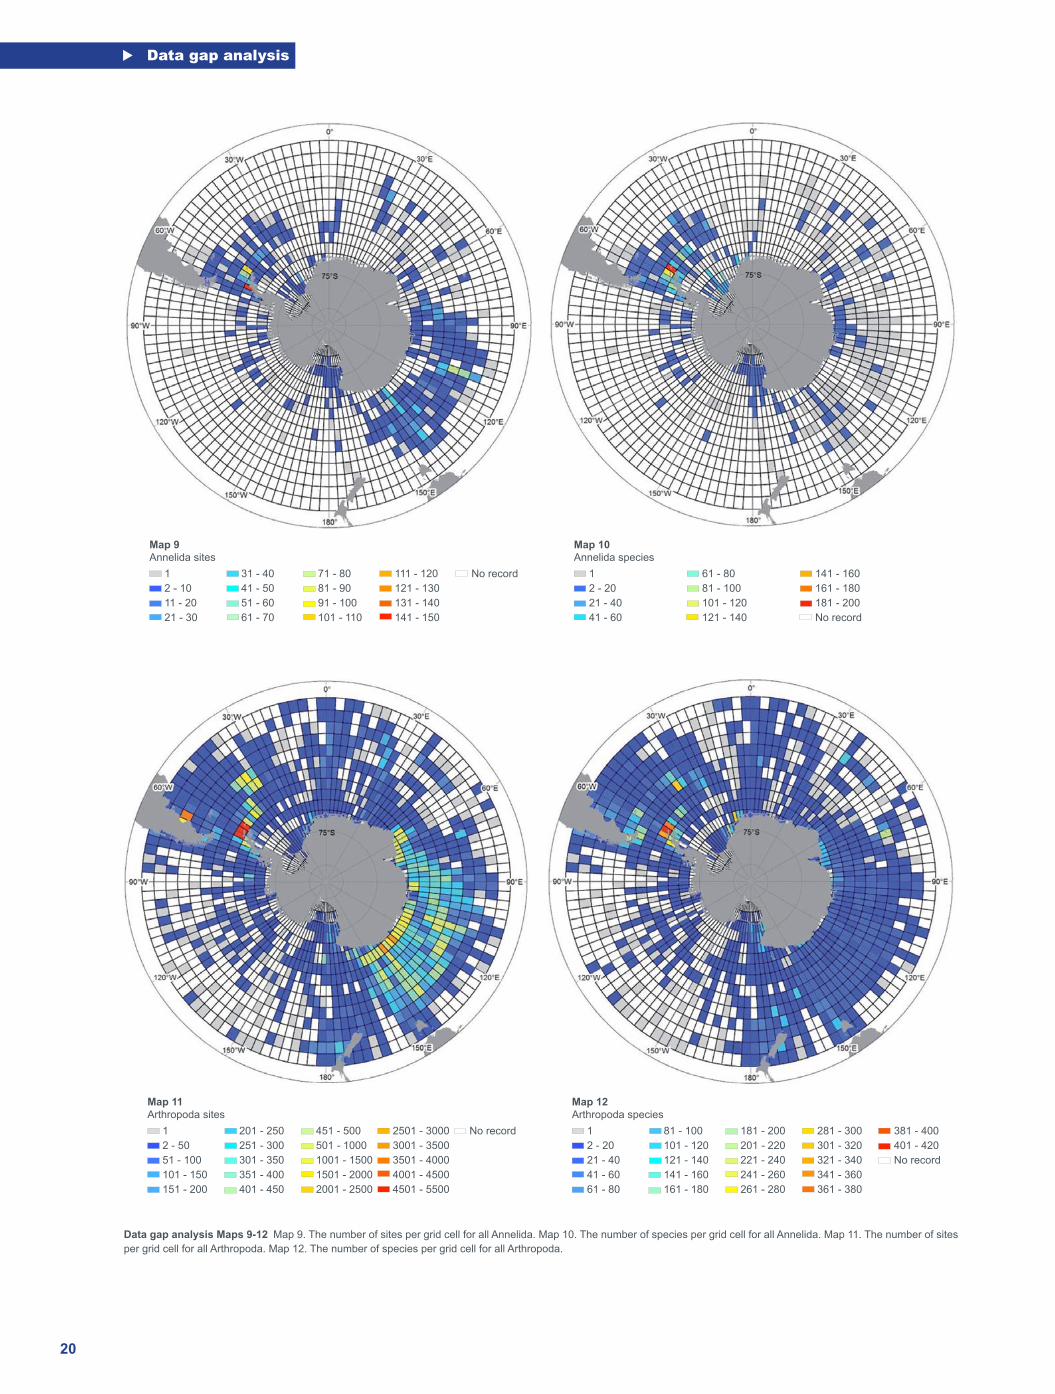
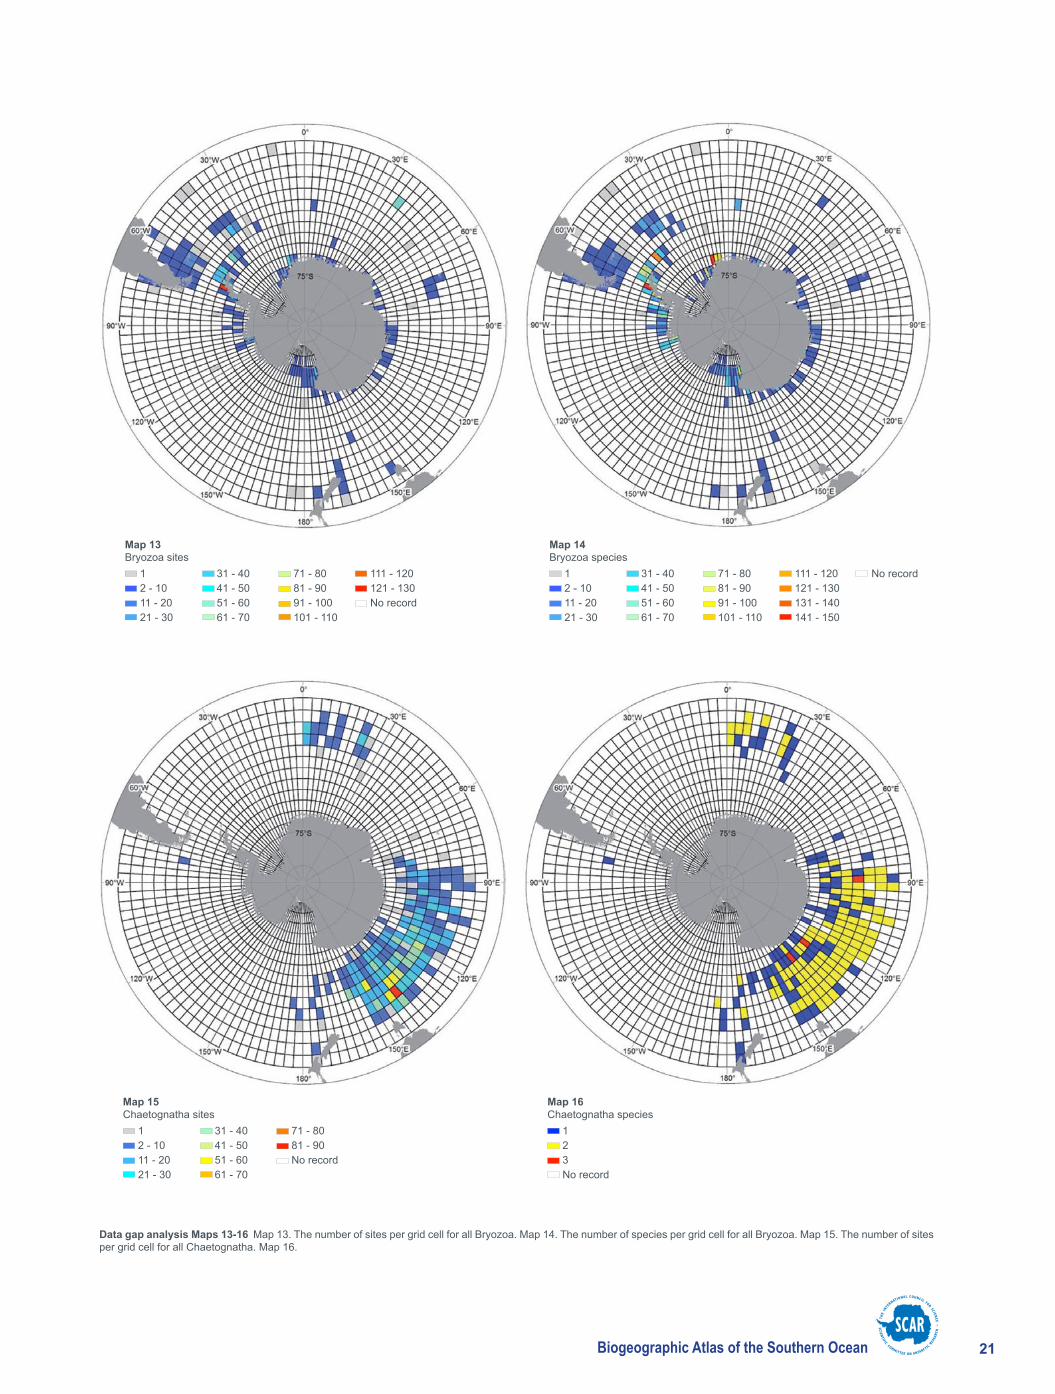
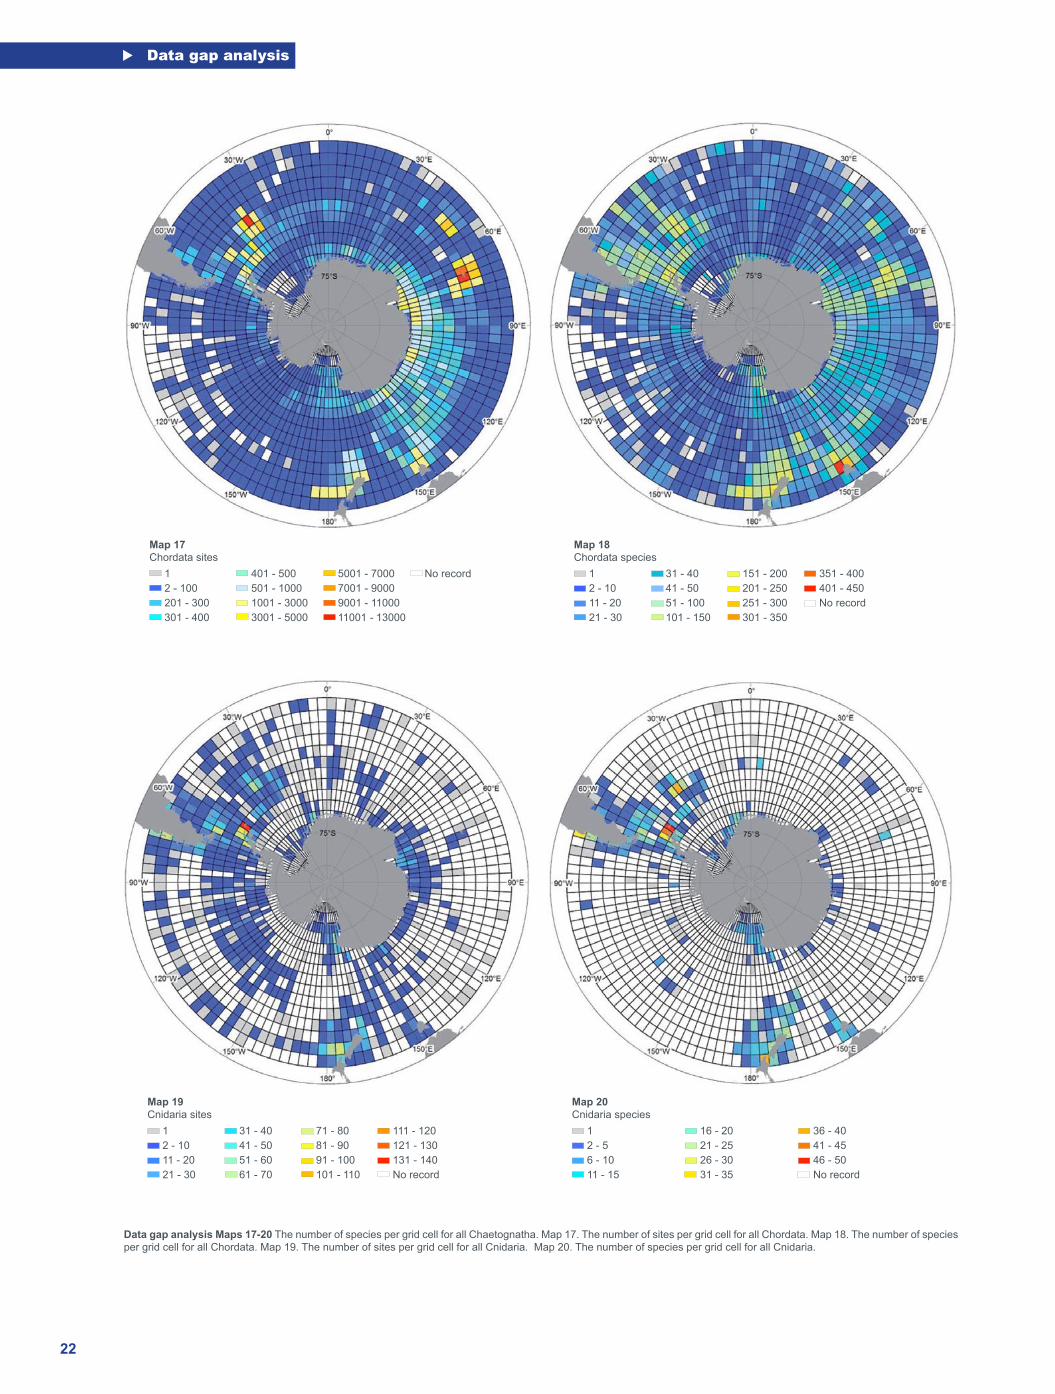
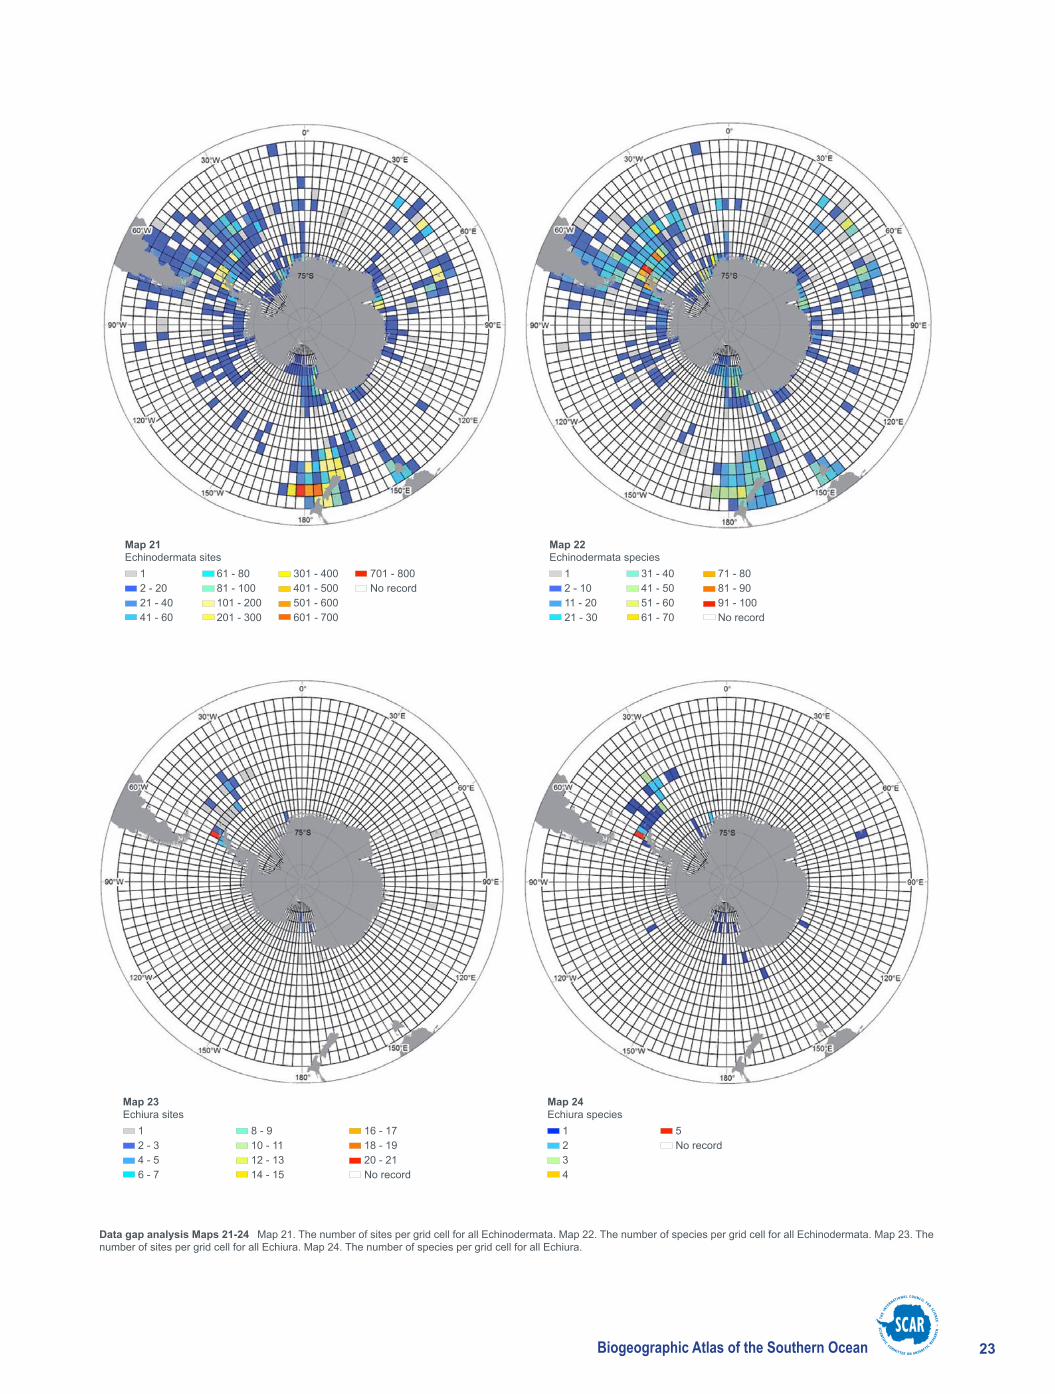
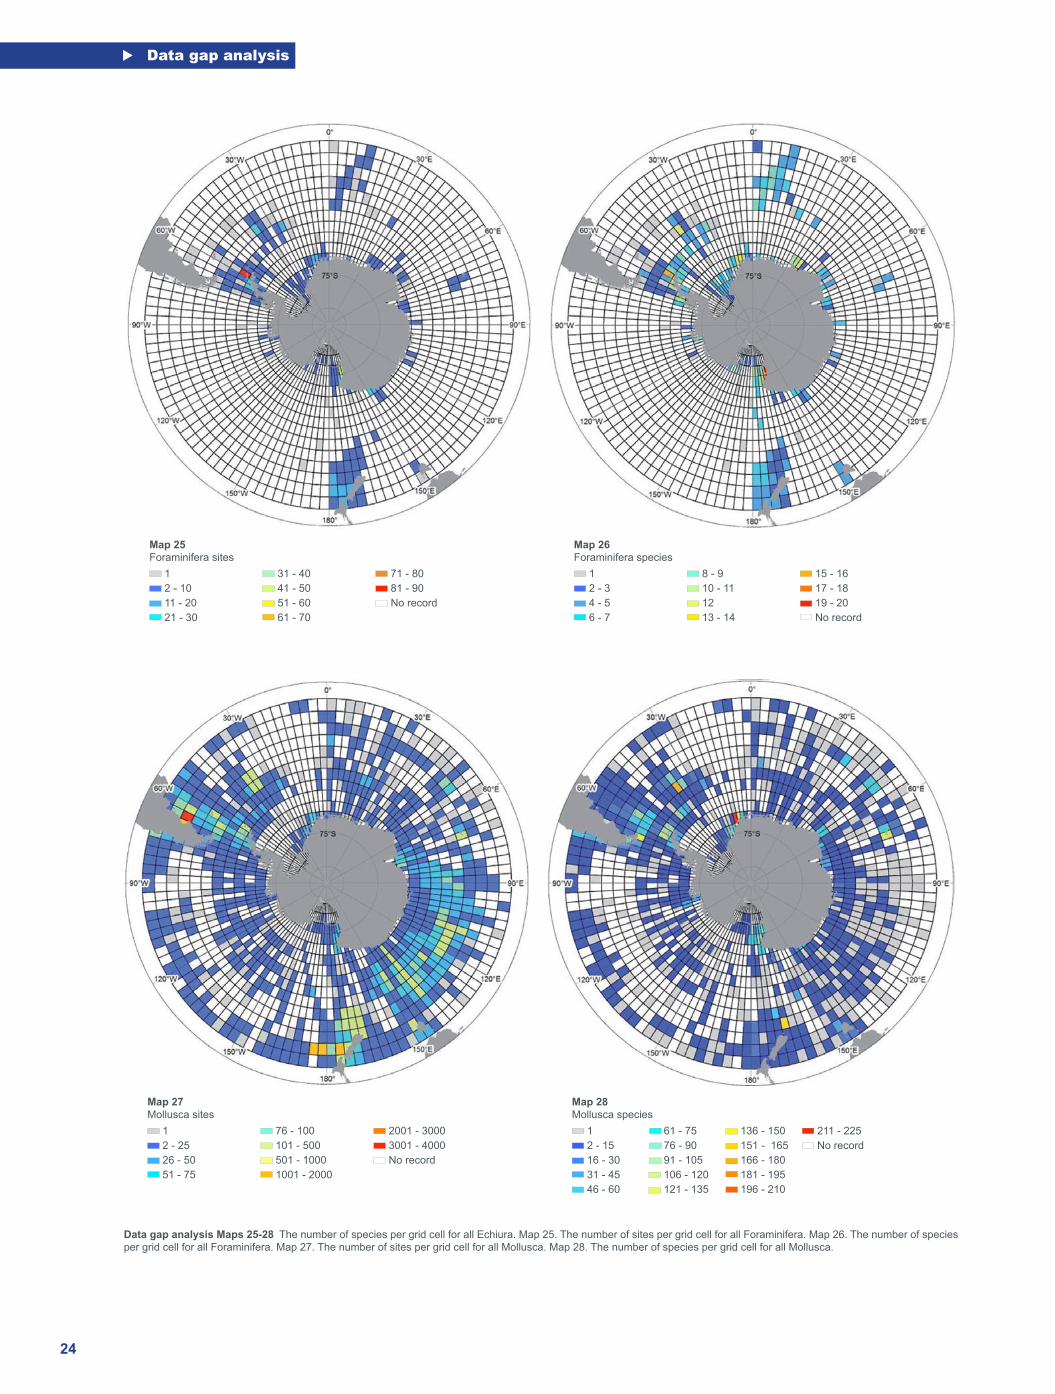
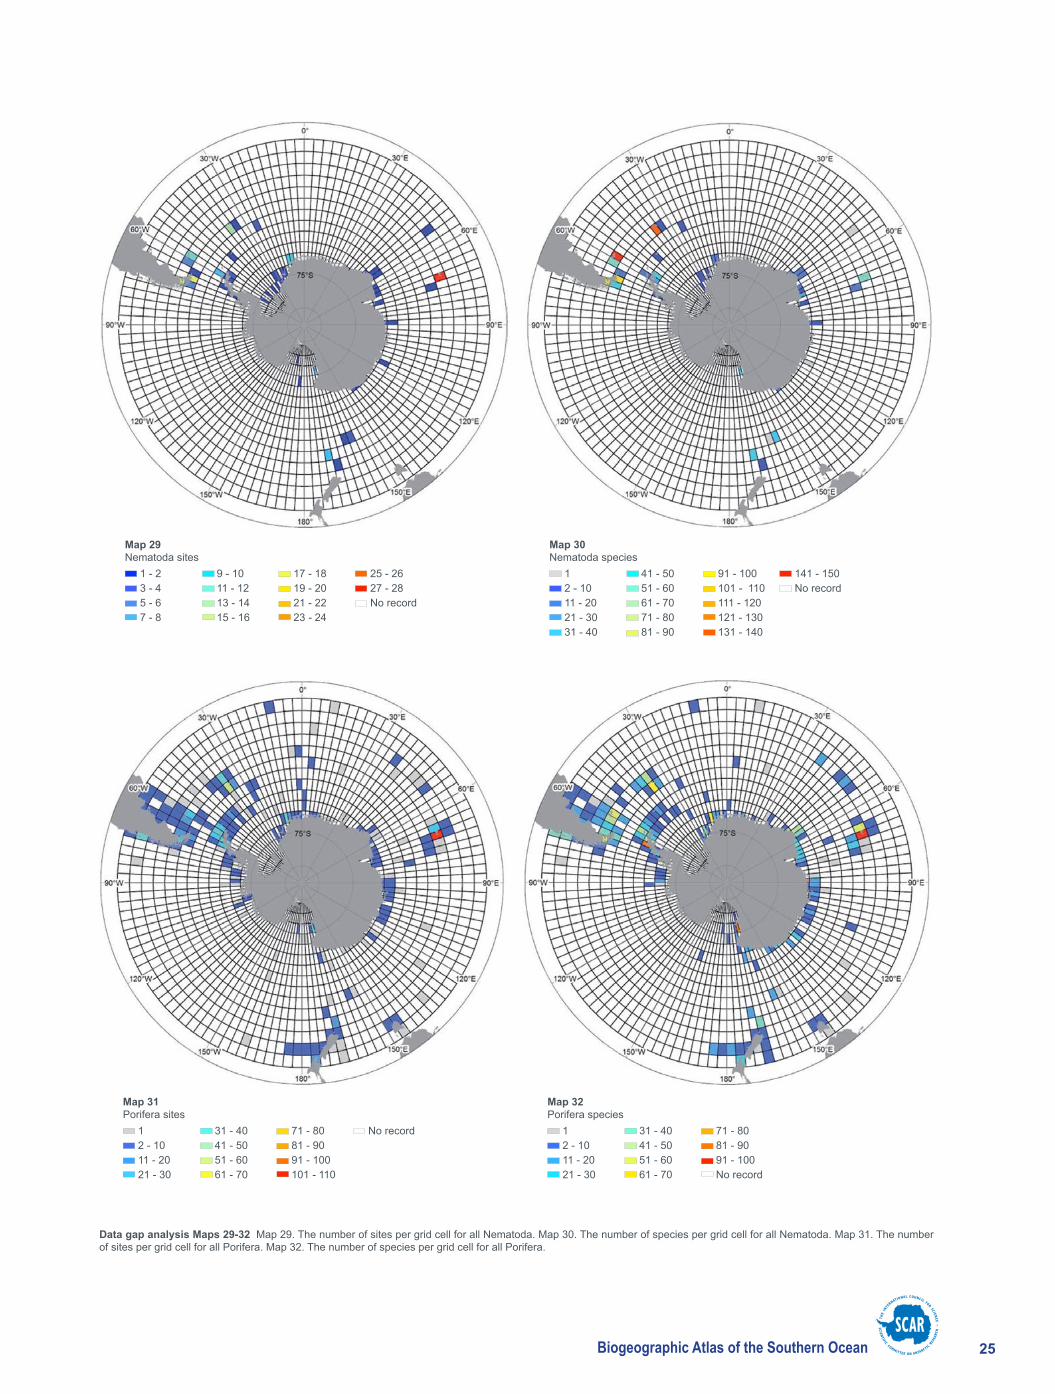
The remaining maps (9-34) represent the data used in the Atlas at the phylum level for the 13 major phyla included. The sampling patterns of individual phyla largely reflected the realm which they inhabit. The pre-dominantly benthic taxa or datasets such as Bryozoa, Echinodermata, Echiura, Foraminifera, Nematoda, Porifera and Sipuncula (Maps 13, 21, 23, 25, 29, 31 and 33), show sampling patterns and hotspots which largely reflect the overall benthic pattern (Map 5) of mainly coastal/shelf sampling with Southern Ocean hotspots at the Antarctic Peninsula/South Shetland Islands, Kerguelen, South Georgia, the eastern Weddell Sea and the Mc-Murdo region of the Ross Sea. For these phyla, species richness hotspots largely reflected sampling intensity (Maps 14, 22, 24, 26, 30, 32 and 34). However, for at least three phyla (Bryozoa, Foraminifera and Sipuncula) the Eastern Weddell Sea appeared as a species richness hotspot despite not being particularly highly sampled.
Taxa which had been sampled from both benthic and pelagic realms were in Annelida, Arthropoda, Chordata, Cnidaria and Mollusca. The sam-pling intensity patterns of these phyla largely reflected those of the pelagic sampling (Maps 9, 11, 17, 19 and 27) with many widespread records in-cluding the deep sea regions. Sampling hotspots for these taxa include those listed for the benthic phyla as well as the pelagic sampling hotspot 50°E to 165° E section of East Antarctica. For these phyla, which include both benthic and pelagic samples, the species richness patterns do not necessarily reflect the sampling hotspots (Maps 10, 12, 18, 20 and 28). For all of these taxa the species richness hotspots are concentrated on the continental shelf in similar areas to the benthic only taxa. The pelagic sampling hotspot off East Antarctica tends to show relatively low diversity compared to coastal regions, which included benthic sampling, despite the high number of sampled sites. The only phylum to be only report-ed from the pelagic realm in these data is the Chaetognatha and their sampling and species richness distributions are a reflection of planktonic sampling techniques including the Continuous Plankton Recorder (CPR) (Hosie et al. 2003).
Biogeographic Atlas of the Southern Ocean 17
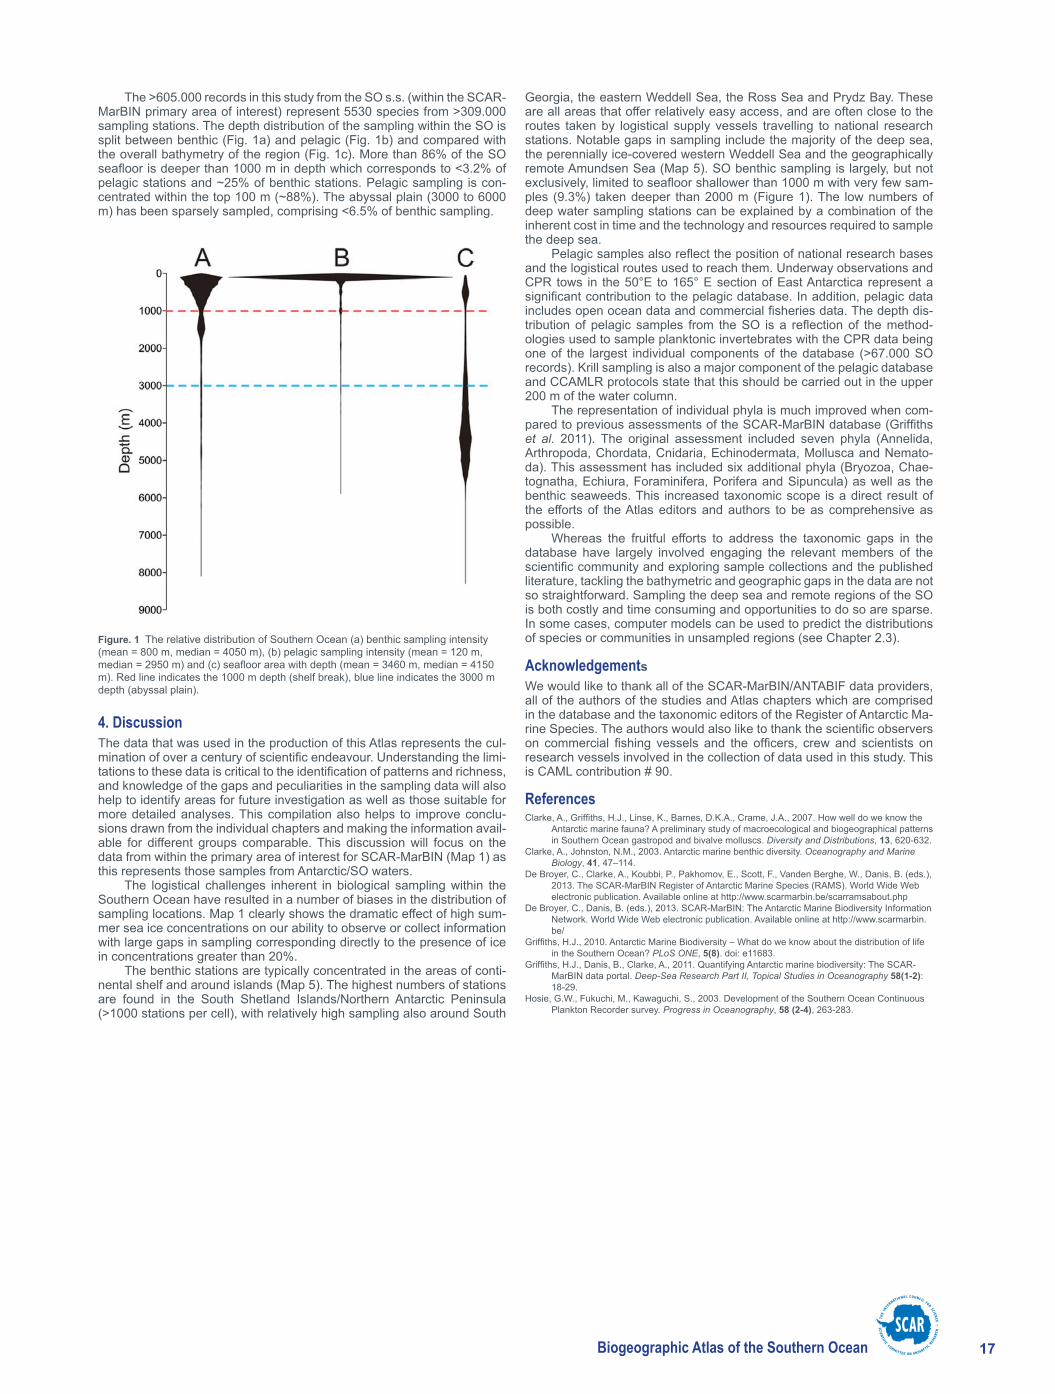
The >605.000 records in this study from the SO s.s. (within the SCAR-MarBIN primary area of interest) represent 5530 species from >309.000 sampling stations. The depth distribution of the sampling within the SO is split between benthic (Fig. 1a) and pelagic (Fig. 1b) and compared with the overall bathymetry of the region (Fig. 1c). More than 86% of the SO seafloor is deeper than 1000 m in depth which corresponds to <3.2% of pelagic stations and ~25% of benthic stations. Pelagic sampling is con-centrated within the top 100 m (~88%). The abyssal plain (3000 to 6000 m) has been sparsely sampled, comprising <6.5% of benthic sampling.
4. DiscussionThe data that was used in the production of this Atlas represents the cul-mination of over a century of scientific endeavour. Understanding the limi-tations to these data is critical to the identification of patterns and richness, and knowledge of the gaps and peculiarities in the sampling data will also help to identify areas for future investigation as well as those suitable for more detailed analyses. This compilation also helps to improve conclu-sions drawn from the individual chapters and making the information avail-able for different groups comparable. This discussion will focus on the data from within the primary area of interest for SCAR-MarBIN (Map 1) as this represents those samples from Antarctic/SO waters.
The logistical challenges inherent in biological sampling within the Southern Ocean have resulted in a number of biases in the distribution of sampling locations. Map 1 clearly shows the dramatic effect of high sum-mer sea ice concentrations on our ability to observe or collect information with large gaps in sampling corresponding directly to the presence of ice in concentrations greater than 20%.
The benthic stations are typically concentrated in the areas of conti-nental shelf and around islands (Map 5). The highest numbers of stations are found in the South Shetland Islands/Northern Antarctic Peninsula (>1000 stations per cell), with relatively high sampling also around South
Georgia, the eastern Weddell Sea, the Ross Sea and Prydz Bay. These are all areas that offer relatively easy access, and are often close to the routes taken by logistical supply vessels travelling to national research stations. Notable gaps in sampling include the majority of the deep sea, the perennially ice-covered western Weddell Sea and the geographically remote Amundsen Sea (Map 5). SO benthic sampling is largely, but not exclusively, limited to seafloor shallower than 1000 m with very few sam-ples (9.3%) taken deeper than 2000 m (Figure 1). The low numbers of deep water sampling stations can be explained by a combination of the inherent cost in time and the technology and resources required to sample the deep sea.
Pelagic samples also reflect the position of national research bases and the logistical routes used to reach them. Underway observations and CPR tows in the 50°E to 165° E section of East Antarctica represent a significant contribution to the pelagic database. In addition, pelagic data includes open ocean data and commercial fisheries data. The depth dis-tribution of pelagic samples from the SO is a reflection of the method-ologies used to sample planktonic invertebrates with the CPR data being one of the largest individual components of the database (>67.000 SO records). Krill sampling is also a major component of the pelagic database and CCAMLR protocols state that this should be carried out in the upper 200 m of the water column.
The representation of individual phyla is much improved when com-pared to previous assessments of the SCAR-MarBIN database (Griffiths et al. 2011). The original assessment included seven phyla (Annelida, Arthropoda, Chordata, Cnidaria, Echinodermata, Mollusca and Nemato-da). This assessment has included six additional phyla (Bryozoa, Chae-tognatha, Echiura, Foraminifera, Porifera and Sipuncula) as well as the benthic seaweeds. This increased taxonomic scope is a direct result of the efforts of the Atlas editors and authors to be as comprehensive as possible.
Whereas the fruitful efforts to address the taxonomic gaps in the database have largely involved engaging the relevant members of the scientific community and exploring sample collections and the published literature, tackling the bathymetric and geographic gaps in the data are not so straightforward. Sampling the deep sea and remote regions of the SO is both costly and time consuming and opportunities to do so are sparse. In some cases, computer models can be used to predict the distributions of species or communities in unsampled regions (see Chapter 2.3).
AcknowledgementsWe would like to thank all of the SCAR-MarBIN/ANTABIF data providers, all of the authors of the studies and Atlas chapters which are comprised in the database and the taxonomic editors of the Register of Antarctic Ma-rine Species. The authors would also like to thank the scientific observers on commercial fishing vessels and the officers, crew and scientists on research vessels involved in the collection of data used in this study. This is CAML contribution # 90.
ReferencesClarke, A., Griffiths, H.J., Linse, K., Barnes, D.K.A., Crame, J.A., 2007. How well do we know the
Antarctic marine fauna? A preliminary study of macroecological and biogeographical patterns in Southern Ocean gastropod and bivalve molluscs. Diversity and Distributions, 13, 620-632.
Clarke, A., Johnston, N.M., 2003. Antarctic marine benthic diversity. Oceanography and Marine Biology, 41, 47–114.
De Broyer, C., Clarke, A., Koubbi, P., Pakhomov, E., Scott, F., Vanden Berghe, W., Danis, B. (eds.), 2013. The SCAR-MarBIN Register of Antarctic Marine Species (RAMS). World Wide Web electronic publication. Available online at http://www.scarmarbin.be/scarramsabout.php
De Broyer, C., Danis, B. (eds.), 2013. SCAR-MarBIN: The Antarctic Marine Biodiversity Information Network. World Wide Web electronic publication. Available online at http://www.scarmarbin.be/
Griffiths, H.J., 2010. Antarctic Marine Biodiversity – What do we know about the distribution of life in the Southern Ocean? PLoS ONE, 5(8). doi: e11683.
Griffiths, H.J., Danis, B., Clarke, A., 2011. Quantifying Antarctic marine biodiversity: The SCAR-MarBIN data portal. Deep-Sea Research Part II, Topical Studies in Oceanography 58(1-2): 18-29.
Hosie, G.W., Fukuchi, M., Kawaguchi, S., 2003. Development of the Southern Ocean Continuous Plankton Recorder survey. Progress in Oceanography, 58 (2-4), 263-283.
Figure. 1 The relative distribution of Southern Ocean (a) benthic sampling intensity (mean = 800 m, median = 4050 m), (b) pelagic sampling intensity (mean = 120 m, median = 2950 m) and (c) seafloor area with depth (mean = 3460 m, median = 4150 m). Red line indicates the 1000 m depth (shelf break), blue line indicates the 3000 m depth (abyssal plain).
18
Data gap analysis
Data gap analysis Maps 1-4 Map 1. All samples used in the production of the atlas. Red dots = samples taken within the SCAR-MarBIN primary area of interest, Blue dots = samples taken north of the primary area of interest. Map 2. The number of chapters that an individual grid cell contains data from. Map 3. The number of sites per grid cell for all data combined. Map 4. The number of species per grid cell for all data combined.
Map 1All records used for the Atlas
SCAR-MarBIN primary area of interest20% Ice cover
Within Area of interestBeyond Area of interest
Map 2Number of Atlas chapters represented in each grid cell
1 - 34 - 56 - 78 - 9
10 11 - 1213 - 1415 - 16
17 - 1819 - 2021 - 2223 - 24
25 - 2627 28 - 2930 - 31
32 - 3334 - 35No record
Map 3All data gridded sites
Map 4All data gridded
12 - 1011 - 5051 - 100
101 - 500501 - 10001001 - 15001501 - 2000
2001 - 40004001 - 60006001 - 80008001 - 10000
10001 - 1200012001 - 14000No record
12 - 1011 - 2021 - 30
31 - 4041 - 5051 - 100101 - 200
201 - 300301 - 400401 - 500501 - 1000
1001 - 1200No record
High : 100
Low : 20
% Summer Sea Ice Cover Value
Biogeographic Atlas of the Southern Ocean 19
Data gap analysis Maps 5-8 Map 5. The number of sites per grid cell for all benthic data. Map 6. The number of species per grid cell for all benthic data. Map 7. The number of sites per grid cell for all pelagic invertebrate data. Map 8. The number of species per grid cell for all pelagic invertebrate data.
Map 5Benthic data gridded sites
Map 6Benthic data gridded species
Map 7Pelagic (invertebrates) gridded sites
Map 8Pelagic (invertebrates) gridded species
1 2 - 56 - 1011 - 15
16 - 2021 - 2526 - 3031- 35
36 - 4041 - 4546 - 50No record
1 2 - 1011 - 2021 - 30
31 - 40 41 - 5051 - 100101 - 200
201 - 300301 - 400401 - 500501 - 1000
1001 - 15001501 - 2000 2001 - 25002501 - 3000
3001 - 35003501 - 4000No record
1 2 - 1011 - 2021 - 30
31 - 40 41 - 5051 - 100101 - 200
201 - 300301 - 400401 - 500501 - 600
601 - 700701 - 800 801 - 900901 - 1000
No record
1 2 - 1011 - 2021 - 3031 - 40
41 - 5051 - 100101 - 200201 - 300301 - 400
401 - 500501 - 10001001 - 15001501 - 2000 2001 - 2500
2501 - 30003001 - 35003501 - 40004001 - 45004501 - 5030
No record
20
Data gap analysis
Data gap analysis Maps 9-12 Map 9. The number of sites per grid cell for all Annelida. Map 10. The number of species per grid cell for all Annelida. Map 11. The number of sites per grid cell for all Arthropoda. Map 12. The number of species per grid cell for all Arthropoda.
Map 9Annelida sites
Map 10Annelida species
1 2 - 2021 - 4041 - 60
61 - 8081 - 100101 - 120121 - 140
141 - 160161 - 180181 - 200No record
Map 11Arthropoda sites
Map 12Arthropoda species
1 2 - 1011 - 2021 - 30
31 - 4041 - 5051 - 6061 - 70
71 - 8081 - 9091 - 100101 - 110
111 - 120121 - 130 131 - 140141 - 150
No record
1 2 - 5051 - 100101 - 150151 - 200
201 - 250251 - 300301 - 350351 - 400401 - 450
451 - 500501 - 10001001 - 15001501 - 2000 2001 - 2500
2501 - 30003001 - 35003501 - 40004001 - 45004501 - 5500
No record 1 2 - 2021 - 4041 - 6061 - 80
81 - 100101 - 120121 - 140141 - 160161 - 180
181 - 200201 - 220221 - 240241 - 260 261 - 280
281 - 300301 - 320321 - 340341 - 360361 - 380
381 - 400401 - 420No record
Biogeographic Atlas of the Southern Ocean 21
Data gap analysis Maps 13-16 Map 13. The number of sites per grid cell for all Bryozoa. Map 14. The number of species per grid cell for all Bryozoa. Map 15. The number of sites per grid cell for all Chaetognatha. Map 16.
Map 13Bryozoa sites
Map 14Bryozoa species
Map 15Chaetognatha sites
Map 16Chaetognatha species
1 23No record
1 2 - 1011 - 2021 - 30
31 - 4041 - 5051 - 6061 - 70
71 - 8081 - 9091 - 100101 - 110
111 - 120121 - 130 No record
1 2 - 1011 - 2021 - 30
31 - 4041 - 5051 - 6061 - 70
71 - 8081 - 9091 - 100101 - 110
111 - 120121 - 130 131 - 140141 - 150
No record
1 2 - 1011 - 2021 - 30
31 - 4041 - 5051 - 6061 - 70
71 - 8081 - 90 No record
22
Data gap analysis
Data gap analysis Maps 17-20 The number of species per grid cell for all Chaetognatha. Map 17. The number of sites per grid cell for all Chordata. Map 18. The number of species per grid cell for all Chordata. Map 19. The number of sites per grid cell for all Cnidaria. Map 20. The number of species per grid cell for all Cnidaria.
Map 17Chordata sites
Map 18Chordata species
Map 19Cnidaria sites
Map 20Cnidaria species
1 2 - 56 - 1011 - 15
16 - 2021 - 2526 - 3031 - 35
36 - 4041 - 4546 - 50No record
1 2 - 100201 - 300301 - 400
401 - 500501 - 10001001 - 30003001 - 5000
5001 - 70007001 - 90009001 - 1100011001 - 13000
No record 1 2 - 1011 - 2021 - 30
31 - 4041 - 5051 - 100101 - 150
151 - 200201 - 250251 - 300301 - 350
351 - 400401 - 450 No record
1 2 - 1011 - 2021 - 30
31 - 4041 - 5051 - 6061 - 70
71 - 8081 - 9091 - 100101 - 110
111 - 120121 - 130 131 - 140No record
Biogeographic Atlas of the Southern Ocean 23
Data gap analysis Maps 21-24 Map 21. The number of sites per grid cell for all Echinodermata. Map 22. The number of species per grid cell for all Echinodermata. Map 23. The number of sites per grid cell for all Echiura. Map 24. The number of species per grid cell for all Echiura.
Map 21Echinodermata sites
Map 22Echinodermata species
Map 23Echiura sites
12 - 34 - 56 - 7
8 - 910 - 1112 - 1314 - 15
16 - 1718 - 1920 - 21No record
Map 24Echiura species
1234
5No record
1 2 - 2021 - 4041 - 60
61 - 8081 - 100101 - 200201 - 300
301 - 400401 - 500501 - 600601 - 700
701 - 800No record
1 2 - 1011 - 2021 - 30
31 - 4041 - 5051 - 6061 - 70
71 - 8081 - 9091 - 100No record
24
Data gap analysis
Data gap analysis Maps 25-28 The number of species per grid cell for all Echiura. Map 25. The number of sites per grid cell for all Foraminifera. Map 26. The number of species per grid cell for all Foraminifera. Map 27. The number of sites per grid cell for all Mollusca. Map 28. The number of species per grid cell for all Mollusca.
Map 25Foraminifera sites
Map 26Foraminifera species
Map 27 Mollusca sites
Map 28Mollusca species
12 - 1011 - 2021 - 30
31 - 4041 - 5051 - 6061 - 70
71 - 8081 - 90No record
12 - 34 - 56 - 7
8 - 910 - 1112 13 - 14
15 - 1617 - 1819 - 20No record
12 - 25 26 - 5051 - 75
76 - 100101 - 500501 - 10001001 - 2000
2001 - 30003001 - 4000No record
1 2 - 1516 - 3031 - 4546 - 60
61 - 7576 - 9091 - 105106 - 120121 - 135
136 - 150151 - 165166 - 180181 - 195 196 - 210
211 - 225No record
Biogeographic Atlas of the Southern Ocean 25
Data gap analysis Maps 29-32 Map 29. The number of sites per grid cell for all Nematoda. Map 30. The number of species per grid cell for all Nematoda. Map 31. The number of sites per grid cell for all Porifera. Map 32. The number of species per grid cell for all Porifera.
Map 29Nematoda sites
Map 30Nematoda species
Map 31Porifera sites
Map 32Porifera species
1 - 23 - 45 - 67 - 8
9 - 1011 - 1213 - 1415 - 16
17 - 1819 - 2021 - 2223 - 24
25 - 2627 - 28 No record
1 2 - 1011 - 2021 - 3031 - 40
41 - 5051 - 6061 - 7071 - 8081 - 90
91 - 100101 - 110111 - 120121 - 130 131 - 140
141 - 150No record
1 2 - 1011 - 2021 - 30
31 - 4041 - 5051 - 6061 - 70
71 - 8081 - 9091 - 100101 - 110
No record 1 2 - 1011 - 2021 - 30
31 - 4041 - 5051 - 6061 - 70
71 - 8081 - 9091 - 100No record
26
Data gap analysis
Data gap analysis Maps 33-34 Map 33. The number of sites per grid cell for all Sipuncula. Map 34. The number of species per grid cell for all Sipuncula.
Map 33Sipuncula sites
Map 34Sipuncula species
1 2 - 45 - 89 - 12
13 - 1617 - 2021 - 2425 - 28
29 - 3233 - 3637 - 40No record
1 234
567No record
Claude DE BROYER is a marine biologist at the Royal Belgian Institute of Natural Sciences in Brussels. His research interests cover structural and ecofunctional biodiversity and biogeography of crustaceans, and polar and deep sea benthic ecology. Active promoter of CAML and ANDEEP, he is the initiator of the SCAR Marine Biodiversity Information Network (SCAR-MarBIN). He took part to 19 polar expeditions.
Philippe KOUBBI is professor at the University Pierre et Marie Curie (Paris, France) and a specialist in Antarctic fish ecology and biogeography. He is the Principal Investigator of projects supported by IPEV, the French Polar Institute. As a French representative to the CCAMLR Scientific Committee, his main input is on the proposal of Marine Protected Areas. His other field of research is on the ecoregionalisation of the high seas.
Huw GRIFFITHS is a marine Biogeographer at the British Antarctic Survey. He created and manages SOMBASE, the Southern Ocean Mollusc Database. His interests include large-scale biogeographic and ecological patterns in space and time. His focus has been on molluscs, bryozoans, sponges and pycnogonids as model groups to investigate trends at high southern latitudes.
Bruno DANIS is an Associate Professor at the Université Libre de Bruxelles, where his research focuses on polar biodiversity. Former coordinator of the scarmarbin.be and antabif.be projects, he is a leading member of several international committees, such as OBIS or the SCAR Expert Group on Antarctic Biodiversity Informatics. He has published papers in various fields, including ecotoxicology, physiology, biodiversity informatics, polar biodiversity or information science.
Bruno DAVID is CNRS director of research at the laboratory BIOGÉOSCIENCES, University of Burgundy. His works focus on evolution of living forms, with and more specifically on sea urchins. He authored a book and edited an extensive database on Antarctic echinoids. He is currently President of the scientific council of the Muséum National d’Histoire Naturelle (Paris), and Deputy Director at the CNRS Institute for Ecology and Environment.
Susie GRANT is a marine biogeographer at the British Antarctic Survey. Her work is focused on the design and implementation of marine protected areas, particularly through the use of biogeographic information in systematic conservation planning.
Julian GUTT is a marine ecologist at the Alfred Wegener Institute Helmholtz Centre for Polar and Marine Research, Bremerhaven, and professor at the Oldenburg University, Germany. He participated in 13 scientific expeditions to the Antarctic and was twice chief scientist on board Polarstern. He is member of the SCAR committees ACCE and AnT-ERA (as chief officer). Main focii of his work are: biodiversity, ecosystem functioning and services, response of marine systems to climate change, non-invasive technologies, and outreach.
Christoph HELD is a Senior Research Scientist at the Alfred Wegener Institute Helmholtz Centre for Polar and Marine Research, Bremerhaven. He is a specialist in molecular systematics and phylogeography of Antarctic crustaceans, especially isopods.
Graham HOSIE is Principal Research Scientist in zooplankton ecology at the Australian Antarctic Division. He founded the SCAR Southern Ocean Continuous Plankton Recorder Survey and is the Chief Officer of the SCAR Life Sciences Standing Scientific Group. His research interests include the ecology and biogeography of plankton species and communities, notably their response to environmental changes. He has participated in 17 marine science voyages to Antarctica.
Falk HUETTMANN is a ‘digital naturalist’ he works on three poles ( Arctic, Antarctic and Hindu-Kush Himalaya) and elsewhere (marine, terrestrial and atmosphere). He is based with the university of Alaska-Fairbank (UAF) and focuses primarily on effective conservation questions engaging predictions and open access data.
Alexandra POST is a marine geoscientist, with expertise in benthic habitat mapping, sedimentology and geomorphic characterisation of the seafloor. She has worked at Geoscience Australia since 2002, with a primary focus on understanding seafloor processes and habitats on the East Antarctic margin. Most recently she has led work to understand the biophysical environment beneath the Amery Ice Shelf, and to characterise the habitats on the George V Shelf and slope following the successful CAML voyages in that region.
Ben RAYMOND is a computational ecologist and exploratory data analyst, working across a variety of Southern Ocean, Antarctic, and wider research projects. His areas of interest include ecosystem modelling, regionalisation and marine protected area selection, risk assessment, animal tracking, seabird ecology, complex systems, and remote sensed data analyses.
Cédric d’UDEKEM d’ACOZ is a research scientist at the Royal Belgian Institute of Natural Sciences, Brussels. His main research interests are systematics of amphipod crustaceans, especially of polar species and taxonomy of decapod crustaceans. He took part to 2 scientific expeditions to Antarctica on board of the Polarstern and to several sampling campaigns in Norway and Svalbard.
Yan ROPERT COUDERT spent 10 years at the Japanese National Institute of Polar Research, where he graduated as a Doctor in Polar Sciences in 2001. Since 2007, he is a permanent researcher at the CNRS in France and the director of a polar research programme (since 2011) that examines the ecological response of Adélie penguins to environmental changes. He is also the secretary of the Expert Group on Birds and Marine Mammals and of the Life Science Group of the Scientific Committee on Antarctic Research.
Anton VAN DE PUTTE works at the Royal Belgian Institute for Natural Sciences (Brussels, Belgium). He is an expert in the ecology and evolution of Antarctic fish and is currently the Science Officer for the Antarctic Biodiveristy Portal www.biodiversity.aq. This portal provides free and open access to Antarctic Marine and terrestrial biodiversity of the Antarctic and the Southern Ocean.
AnT-ERA
THE BIOGEOGRAPHIC ATLAS OF THE SOUTHERN OCEANScopeBiogeographic information is of fundamental importance for discovering marine biodiversity hotspots, detecting and understanding impacts of environmental changes, predicting future distributions, monitoring biodiversity, or supporting conservation and sustainable management strategies.The recent extensive exploration and assessment of biodiversity by the Census of Antarctic Marine Life (CAML), and the intense compilation and validation efforts of Southern Ocean biogeographic data by the SCAR Marine Biodiversity Information Network (SCAR-MarBIN / OBIS) provided a unique opportunity to assess and synthesise the current knowledge on Southern Ocean biogeography.The scope of the Biogeographic Atlas of the Southern Ocean is to present a concise synopsis of the present state of knowledge of the distributional patterns of the major benthic and pelagic taxa and of the key communities, in the light of biotic and abiotic factors operating within an evolutionary framework. Each chapter has been written by the most pertinent experts in their field, relying on vastly improved occurrence datasets from recent decades, as well as on new insights provided by molecular and phylogeographic approaches, and new methods of analysis, visualisation, modelling and prediction of biogeographic distributions.A dynamic online version of the Biogeographic Atlas will be hosted on www.biodiversity.aq.
The Census of Antarctic Marine Life (CAML)CAML (www.caml.aq) was a 5-year project that aimed at assessing the nature, distribution and abundance of all living organisms of the Southern Ocean. In this time of environmental change, CAML provided a comprehensive baseline information on the Antarctic marine biodiversity as a sound benchmark against which future change can reliably be assessed. CAML was initiated in 2005 as the regional Antarctic project of the worldwide programme Census of Marine Life (2000-2010) and was the most important biology project of the International Polar Year 2007-2009.
The SCAR Marine Biodiversity Information Network (SCAR-MarBIN)In close connection with CAML, SCAR-MarBIN (www.scarmarbin.be, integrated into www.biodiversity.aq) compiled and managed the historic, current and new information (i.a. generated by CAML) on Antarctic marine biodiversity by establishing and supporting a distributed system of interoperable databases, forming the Antarctic regional node of the Ocean Biogeographic Information System (OBIS, www.iobis.org), under the aegis of SCAR (Scientific Committee on Antarctic Research, www.scar.org). SCAR-MarBIN established a comprehensive register of Antarctic marine species and, with biodiversity.aq provided free access to more than 2.9 million Antarctic georeferenced biodiversity data, which allowed more than 60 million downloads.
The Editorial Team