cement foam stability: link with cement paste rheological
TRANSCRIPT

HAL Id: tel-02084040https://pastel.archives-ouvertes.fr/tel-02084040
Submitted on 29 Mar 2019
HAL is a multi-disciplinary open accessarchive for the deposit and dissemination of sci-entific research documents, whether they are pub-lished or not. The documents may come fromteaching and research institutions in France orabroad, or from public or private research centers.
L’archive ouverte pluridisciplinaire HAL, estdestinée au dépôt et à la diffusion de documentsscientifiques de niveau recherche, publiés ou non,émanant des établissements d’enseignement et derecherche français ou étrangers, des laboratoirespublics ou privés.
Cement foam stability : link with cement pasterheological properties
Blandine Feneuil
To cite this version:Blandine Feneuil. Cement foam stability : link with cement paste rheological properties. Materials.Université Paris-Est, 2018. English. NNT : 2018PESC1045. tel-02084040

THÈSE
pour obtenir le grade de docteur délivré par
Université Paris-EstSpécialité doctorale “Sciences des matériaux”
Stabilité des mousses de ciment :
lien avec les propriétés rhéologiques
de la pâte de ciment
Cement foam stability:link with cement paste rheological properties
présentée et soutenue publiquement par
Blandine FENEUIL
le 11 octobre 2018
devant le jury composé de
Mme Véronique SCHMITT Présidente du jury
Mme Anne-Laure BIANCE Rapporteure
M. Guillaume OVARLEZ Rapporteur
M. Jean-Baptiste D’ESPINOSE DE LACAILLERIE Examinateur
M. Pascal BOUSTINGORRY Invité
M. Nicolas ROUSSEL Co-directeur de thèse
M. Olivier PITOIS Directeur de thèse

ii

Abstract
Cement foam advantages compared to normal concrete are its low density, low mate-
rial need and thermal insulation capacity. To better understand how the morphology of
cement foam affects its properties, we wish to create solid samples with well controlled
structure. This involves two steps: the creation of a fresh cement foam with chosen struc-
ture, and the stability of this structure up to cement hardening. First step is ensured by
our preparation protocol, and second step is investigated in this thesis.
First, we study the interaction of surfactants and cement paste. Some surfactants can-
not stabilize foam in cement paste highly alkaline solution. Some others, mainly anionic
surfactants, adsorb on cement grain surface, which modifies interactions between ce-
ment grains and consequently the yield stress of the cement paste. At low surfactant
concentration, cement grain surface becomes hydrophobic and yield stress increases due
to hydrophobic attraction between cement grains. At high surfactant concentration, ad-
sorbed micelles create a steric repulsion between cement grains and make cement paste
yield stress drop.
Second, we study the effect of bubbles on the yield stress of aerated cement paste,
at air content below 40%. The measured yield stress is normalized by the yield stress of
the suspending cement paste. For a surfactant with low affinity to cement grains surface,
results are consistent with literature, whereas dimensionless yield stress is much higher
than expected when surfactant strongly adsorbs on cement grain surface. This effect is
attributed to the change of the bubble surface properties due to the adsorption of hy-
drophobic cement grains at the air-liquid interface.
Then, we focus on cement foam stability, at air content 83%. We first study three se-
ries of experiments at given water-to-cement ratio and bubble size. For each series, the
yield stress of the cement paste is changed by addition of superplasticizer or high amount
of anionic surfactant. Unexpectedly, the best foam stability is obtained for relatively low
yield stress. Rheological measurements on the fresh cement foams allowed us to under-
stand this improved stability as a consequence of the reorganization of cement grains
into denser packing. In a second part on stability, we study the influence of bubble size,
water-to-cement ratio and surfactant content. A stability criterion is defined from the
bubble size and the interstitial cement paste yield stress.
Eventually, we observe that cement foam structure affects water imbibition velocity.
Imbibition front is slowed down when it crosses the constrictions between the bubbles.
iii

ABSTRACT
iv

Résumé
Les mousses de ciment présentent d’intéressantes propriétés : une faible densité, une
faible consommation de matière première et une bonne résistance thermique. Certaines
de ces propriétés dépendent de sa morphologie. Pour mieux comprendre cette dépen-
dance, on veut créer des échantillons de mousse de ciment avec une structure bien con-
trôlée : les bulles sont de même taille, et les quantités d’air, de ciment, d’eau et de ten-
sioactif sont fixées. Pour ce faire, on mélange d’une part une mousse aqueuse de mor-
phologie contrôlée, stabilisée par des tensioactifs, et d’autre part une pâte de ciment. Le
but de cette thèse est d’étudier comment conserver cette structure jusqu’à la prise du ci-
ment.
Tout d’abord, nous étudions l’interaction entre tensioactifs et pâte de ciment. Cer-
tains tensioactifs ne sont pas compatibles avec la solution alcaline présente dans la pâte
de ciment et ne permettent pas de produire une mousse dans ces conditions. Parmi les
tensioactifs compatibles avec la solution interstitielle de ciment, certains s’adsorbent sur
les grains de ciment. Cette adsorption change les interactions entre grains de ciment et
par conséquent, la contrainte seuil de la pâte. A faible concentration en tensioactif, la
monocouche de molécules adsorbée rend les grains de ciment hydrophobes, ce qui pro-
duit une attraction hydrophobe entre grains et une augmentation de la contrainte seuil
de la pâte. A forte concentration en tensioactif, les micelles adsorbées engendrent une
répulsion stérique entre les grains de ciment et une chute de la contrainte seuil.
Dans un deuxième temps, nous étudions l’effet des bulles d’air sur la contrainte seuil
d’une pâte de ciment aérée, lorsque celle-ci contient moins de 40% d’air. Les mesures
sont normalisées par la contrainte seuil de la pâte interstitielle afin d’être comparées à la
littérature. Lorsque le tensioactif utilisé s’adsorbe peu sur les grains de ciment, les résul-
tats sont semblables à ceux de la littérature obtenus sur des fluides à seuil modèles. En
revanche, lorsque le tensioactif utilisé a une grande affinité avec les grains de ciment, la
contrainte seuil normalisée est bien supérieure aux prédictions. Notre hypothèse pour
expliquer ce résultat est une modification des propriétés de surface des bulles à cause de
l’adsorption des grains de ciment rendus partiellement hydrophobes par le tensioactif.
Ensuite, nous nous focalisons sur la stabilité des mousses de ciment avant la prise,
pour une fraction d’air de 83%. On s’intéresse tout d’abord à trois séries de mesures, en
gardant pour chacune d’elles le rapport eau/ciment et la taille des bulles constants. Pour
chacune des trois séries, seule la contrainte seuil de la pâte de ciment est changée par
l’addition de superplastifiant ou d’une grande quantité de tensioactif anionique. On ob-
tient alors un résultat inattendu : la meilleure stabilité est observée lorsque la pâte de
v

RÉSUMÉ
ciment utilisée pour faire la mousse est fluide. Les mesures des propriétés rhéologiques
de la mousse nous font émettre l’hypothèse que la bonne stabilité aux faibles contraintes
seuil de pâte de ciment est due à la réorganisation des grains de ciment en un réseau gran-
ulaire plus dense. Pour aller plus loin sur l’étude de la stabilité des mousses, nous faisons
ensuite varier la taille des bulles, le rapport eau/ciment et la quantité de tensioactif. Nous
définissons un critère de stabilité pour l’ensemble de ces mousses, qui dépend de la con-
trainte seuil interstitielle de la pâte de ciment confinée par les bulles et de la taille des
bulles.
Pour finir, nous mesurons la vitesse d’imbibition des échantillons solides. Nous ob-
servons que la vitesse est plus faible que celle attendue, à cause d’un ralentissement du
front d’eau lors du passage des constrictions entre les bulles.
vi

Remerciements
Ce travail a été financé par le Labex MMCD et s’est déroulé au laboratoire Navier.
Il a bénéficié des contributions d’un grand nombre de personnes que je tiens à re-
mercier, et dont je ne vais citer qu’une petite partie puisque la liste exhaustive remplirait
trop de pages.
Merci tout d’abord à mes encadrants Oliver et Nicolas, pour le temps que nous avons
passé à analyser les derniers résultats et décider de nouvelles expériences à mener.
Merci à tous les expérimentateurs croisés dans les laboratoires, jamais avares de con-
seils sur les méthodes de préparation et sur les dispositifs expérimentaux, pour votre
compassion devant les expériences ratées, votre aide pour qu’elles soient réussies, et votre
bonne humeur pendant les journées de ménage. Merci aux Kepleriens, Julie, Laurent,
Yacine, Florence, Jennifer, Ilham, Yousra, Michel, Marie, Meng, Xiao, Oumar, Francesco,
Gaétan, Thibault, Elie, etc ; à l’équipe de Bienvenüe, Patrick, Daniel, Hela, Nadia, Aileen,
etc; et tout particulièrement à l’équipe mousse, avec qui j’ai pu partager la joie d’admirer
la structure cristalline des mousses monodisperses ordonnées : Olivier, François, Aymeric,
Asmaa, Luana, Charles.
Merci à l’équipe technique, David, Cédric et Christophe pour votre patience lors des
demandes de nouvelles pièces et votre rapidité pour les fabriquer.
Merci pour l’aide pour les démarches administratives, tout particulièrement à San-
drine.
Merci pour les kilomètres parcourus pendant la pause déjeuner en nageant et (surtout !)
en courant, nécessaires à la concentration pendant les après-midi de bibliographie ou
d’expériences, à Julie, David, Laurent, Yacine, Cédric, Denis, Jennifer, Alizée, Marie, Rémy,
François, Asmaa, Gaétan, Thibault, Elie, etc.
Merci pour tous les moments de convivialité, très souvent autour d’une tasse de thé,
moments privilégiés pour échanger divers conseils et réflexions existentielles sur le but
de la recherche, à tous les collègues croisés à Kepler, à Bienvenüe, aux Ponts et au cours
des conférences, ainsi qu’à mes amis et ma famille.
vii

REMERCIEMENTS
viii

Contents
Contents viii
Introduction 1
1 State of the art 3
1.1 Introduction . . . . . . . . . . . . . . . . . . . . . . . . . . . . . . . . . . . . . . 4
1.2 Aerated concrete . . . . . . . . . . . . . . . . . . . . . . . . . . . . . . . . . . . 5
1.2.1 Production methods . . . . . . . . . . . . . . . . . . . . . . . . . . . . . 5
1.2.1.1 Chemical foaming . . . . . . . . . . . . . . . . . . . . . . . . . 5
1.2.1.2 Physical foaming . . . . . . . . . . . . . . . . . . . . . . . . . . 5
1.2.2 Properties . . . . . . . . . . . . . . . . . . . . . . . . . . . . . . . . . . . 6
1.2.2.1 Density and compressive strength . . . . . . . . . . . . . . . . 6
1.2.2.2 Thermal resistance . . . . . . . . . . . . . . . . . . . . . . . . . 7
1.2.2.3 Rheology . . . . . . . . . . . . . . . . . . . . . . . . . . . . . . . 8
1.3 Fresh cementitious materials . . . . . . . . . . . . . . . . . . . . . . . . . . . . 9
1.3.1 Suspension . . . . . . . . . . . . . . . . . . . . . . . . . . . . . . . . . . 9
1.3.2 Yield stress fluid . . . . . . . . . . . . . . . . . . . . . . . . . . . . . . . . 10
1.3.3 Hydration and thixotropic behavior . . . . . . . . . . . . . . . . . . . . 11
1.3.4 The role of chemical admixtures . . . . . . . . . . . . . . . . . . . . . . 12
1.3.5 Surfactants in cement paste . . . . . . . . . . . . . . . . . . . . . . . . . 13
1.4 Aqueous foams . . . . . . . . . . . . . . . . . . . . . . . . . . . . . . . . . . . . 14
1.4.1 Surface tension and Laplace’s law . . . . . . . . . . . . . . . . . . . . . 14
1.4.2 Role of surfactant in foams . . . . . . . . . . . . . . . . . . . . . . . . . 14
1.4.3 Foam structure . . . . . . . . . . . . . . . . . . . . . . . . . . . . . . . . 15
1.4.4 Foam stability . . . . . . . . . . . . . . . . . . . . . . . . . . . . . . . . . 17
1.4.4.1 Drainage . . . . . . . . . . . . . . . . . . . . . . . . . . . . . . . 17
1.4.4.2 Coalescence . . . . . . . . . . . . . . . . . . . . . . . . . . . . . 18
1.4.4.3 Ostwald ripening . . . . . . . . . . . . . . . . . . . . . . . . . . 19
1.4.5 Foam rheology . . . . . . . . . . . . . . . . . . . . . . . . . . . . . . . . 19
1.4.5.1 Solid regime . . . . . . . . . . . . . . . . . . . . . . . . . . . . . 20
1.4.5.2 Flow . . . . . . . . . . . . . . . . . . . . . . . . . . . . . . . . . 20
1.4.6 Conclusion on aqueous foams . . . . . . . . . . . . . . . . . . . . . . . 20
1.5 Complex foams and bubble suspensions . . . . . . . . . . . . . . . . . . . . . 21
1.5.1 Hydrophobic particles . . . . . . . . . . . . . . . . . . . . . . . . . . . . 21
ix

CONTENTS
1.5.2 Hydrophilic particles . . . . . . . . . . . . . . . . . . . . . . . . . . . . . 24
1.5.3 Yield stress fluid . . . . . . . . . . . . . . . . . . . . . . . . . . . . . . . . 25
1.5.4 Rheology of complex foams and bubble suspensions . . . . . . . . . . 26
1.5.4.1 Aerated yield stress fluids . . . . . . . . . . . . . . . . . . . . . 26
1.5.4.2 Granular foams . . . . . . . . . . . . . . . . . . . . . . . . . . . 28
1.6 Conclusion . . . . . . . . . . . . . . . . . . . . . . . . . . . . . . . . . . . . . . . 30
2 Effects of surfactants on the yield stress of cement paste 39
2.1 Introduction . . . . . . . . . . . . . . . . . . . . . . . . . . . . . . . . . . . . . . 40
2.2 Background . . . . . . . . . . . . . . . . . . . . . . . . . . . . . . . . . . . . . . 40
2.2.1 Surfactant molecules in cement paste . . . . . . . . . . . . . . . . . . . 40
2.2.2 Foam stability . . . . . . . . . . . . . . . . . . . . . . . . . . . . . . . . . 42
2.2.3 Yield stress of solid suspensions . . . . . . . . . . . . . . . . . . . . . . 43
2.3 Materials and methods . . . . . . . . . . . . . . . . . . . . . . . . . . . . . . . . 44
2.3.1 Materials . . . . . . . . . . . . . . . . . . . . . . . . . . . . . . . . . . . . 44
2.3.1.1 Cement . . . . . . . . . . . . . . . . . . . . . . . . . . . . . . . 44
2.3.1.2 Synthetic cement pore solution . . . . . . . . . . . . . . . . . 44
2.3.1.3 Surfactants . . . . . . . . . . . . . . . . . . . . . . . . . . . . . 44
2.3.1.4 Cement paste preparation . . . . . . . . . . . . . . . . . . . . 44
2.3.2 Methods . . . . . . . . . . . . . . . . . . . . . . . . . . . . . . . . . . . . 46
2.3.2.1 Surfactant compatibility with cement pore solution . . . . . 46
2.3.2.2 CMC . . . . . . . . . . . . . . . . . . . . . . . . . . . . . . . . . 46
2.3.2.3 Yield stress . . . . . . . . . . . . . . . . . . . . . . . . . . . . . 46
2.3.2.4 Adsorption . . . . . . . . . . . . . . . . . . . . . . . . . . . . . 47
2.3.2.5 Contact angle . . . . . . . . . . . . . . . . . . . . . . . . . . . . 47
2.4 Results and discussion . . . . . . . . . . . . . . . . . . . . . . . . . . . . . . . . 48
2.4.1 Surfactants in synthetic cement pore solution . . . . . . . . . . . . . . 48
2.4.2 Adsorption sites and surfactant distribution . . . . . . . . . . . . . . . 50
2.4.3 Relation between yield stress and adsorbed surfactant . . . . . . . . . 53
2.4.3.1 Yield stress drop at high concentration range . . . . . . . . . 53
2.4.3.2 Yield stress increase at low concentration range . . . . . . . . 54
2.5 Conclusion . . . . . . . . . . . . . . . . . . . . . . . . . . . . . . . . . . . . . . . 55
Bibliography . . . . . . . . . . . . . . . . . . . . . . . . . . . . . . . . . . . . . . . . . 58
Appendix A: Additional surfactants . . . . . . . . . . . . . . . . . . . . . . . . . . . 59
Appendix B: Compatibility with calcium hydroxide solution . . . . . . . . . . . . . 61
Appendix C: Delay of hydration . . . . . . . . . . . . . . . . . . . . . . . . . . . . . . 62
3 Yield stress of aerated cement paste 63
3.1 Introduction . . . . . . . . . . . . . . . . . . . . . . . . . . . . . . . . . . . . . . 63
3.2 Materials and methods . . . . . . . . . . . . . . . . . . . . . . . . . . . . . . . . 65
3.2.1 Materials . . . . . . . . . . . . . . . . . . . . . . . . . . . . . . . . . . . . 65
3.2.2 Method . . . . . . . . . . . . . . . . . . . . . . . . . . . . . . . . . . . . . 65
3.2.2.1 Preparation of aerated and reference cement paste . . . . . . 65
3.2.2.2 Foam generation . . . . . . . . . . . . . . . . . . . . . . . . . . 66
x
CONTENTS
3.2.2.3 Samples . . . . . . . . . . . . . . . . . . . . . . . . . . . . . . . 67
3.2.2.4 Yield stress measurement . . . . . . . . . . . . . . . . . . . . . 67
3.3 Results . . . . . . . . . . . . . . . . . . . . . . . . . . . . . . . . . . . . . . . . . 68
3.3.1 Reference yield stress . . . . . . . . . . . . . . . . . . . . . . . . . . . . . 68
3.3.2 Aerated cement paste . . . . . . . . . . . . . . . . . . . . . . . . . . . . 69
3.4 Discussion . . . . . . . . . . . . . . . . . . . . . . . . . . . . . . . . . . . . . . . 70
3.4.1 Reference yield stress with surfactant . . . . . . . . . . . . . . . . . . . 70
3.4.1.1 Reference yield stress with TTAB . . . . . . . . . . . . . . . . . 71
3.4.1.2 Reference yield stress with Bio-Terge . . . . . . . . . . . . . . 72
3.4.2 Dimensionless yield stress . . . . . . . . . . . . . . . . . . . . . . . . . . 72
3.4.3 Bare bubbles (TTAB) . . . . . . . . . . . . . . . . . . . . . . . . . . . . . 73
3.4.4 Particle covered bubbles . . . . . . . . . . . . . . . . . . . . . . . . . . . 75
3.5 Conclusion . . . . . . . . . . . . . . . . . . . . . . . . . . . . . . . . . . . . . . . 77
Bibliography . . . . . . . . . . . . . . . . . . . . . . . . . . . . . . . . . . . . . . . . . 80
4 Optimal cement paste yield stress for the production of stable cement foams 81
4.1 Introduction . . . . . . . . . . . . . . . . . . . . . . . . . . . . . . . . . . . . . . 82
4.2 Materials and methods . . . . . . . . . . . . . . . . . . . . . . . . . . . . . . . . 83
4.2.1 Materials . . . . . . . . . . . . . . . . . . . . . . . . . . . . . . . . . . . . 83
4.2.2 Methods . . . . . . . . . . . . . . . . . . . . . . . . . . . . . . . . . . . . 84
4.2.2.1 Protocol . . . . . . . . . . . . . . . . . . . . . . . . . . . . . . . 84
4.2.2.2 Precursor foam . . . . . . . . . . . . . . . . . . . . . . . . . . . 84
4.2.2.3 Mixing . . . . . . . . . . . . . . . . . . . . . . . . . . . . . . . . 84
4.2.2.4 Final stability . . . . . . . . . . . . . . . . . . . . . . . . . . . . 85
4.2.2.5 Rheological measurement . . . . . . . . . . . . . . . . . . . . 86
4.2.2.6 Water suction out of the cement pastes . . . . . . . . . . . . . 86
4.2.3 Cement paste yield stress . . . . . . . . . . . . . . . . . . . . . . . . . . 86
4.3 Results . . . . . . . . . . . . . . . . . . . . . . . . . . . . . . . . . . . . . . . . . 88
4.3.1 Stability . . . . . . . . . . . . . . . . . . . . . . . . . . . . . . . . . . . . . 88
4.3.2 Rheological measurements . . . . . . . . . . . . . . . . . . . . . . . . . 90
4.3.2.1 Foam yield stress . . . . . . . . . . . . . . . . . . . . . . . . . . 90
4.3.2.2 Elasticity . . . . . . . . . . . . . . . . . . . . . . . . . . . . . . . 90
4.3.3 Water suction . . . . . . . . . . . . . . . . . . . . . . . . . . . . . . . . . 91
4.4 Discussion . . . . . . . . . . . . . . . . . . . . . . . . . . . . . . . . . . . . . . . 92
4.4.1 Comparison with aqueous foams . . . . . . . . . . . . . . . . . . . . . 92
4.4.2 Early age rheological properties . . . . . . . . . . . . . . . . . . . . . . 93
4.4.3 Time evolution of rheological properties . . . . . . . . . . . . . . . . . 95
4.4.4 Stability loss at very high surfactant content . . . . . . . . . . . . . . . 97
4.5 Conclusion . . . . . . . . . . . . . . . . . . . . . . . . . . . . . . . . . . . . . . . 98
Bibliography . . . . . . . . . . . . . . . . . . . . . . . . . . . . . . . . . . . . . . . . . 101
xi

CONTENTS
5 Stability criterion for fresh cement foams 103
5.1 Introduction . . . . . . . . . . . . . . . . . . . . . . . . . . . . . . . . . . . . . . 104
5.2 Materials and methods . . . . . . . . . . . . . . . . . . . . . . . . . . . . . . . . 105
5.2.1 Materials . . . . . . . . . . . . . . . . . . . . . . . . . . . . . . . . . . . . 105
5.2.1.1 Cement . . . . . . . . . . . . . . . . . . . . . . . . . . . . . . . 105
5.2.1.2 Surfactants . . . . . . . . . . . . . . . . . . . . . . . . . . . . . 105
5.2.2 Methods . . . . . . . . . . . . . . . . . . . . . . . . . . . . . . . . . . . . 106
5.2.2.1 Precursor foam and mixing . . . . . . . . . . . . . . . . . . . . 106
5.2.2.2 Protocol . . . . . . . . . . . . . . . . . . . . . . . . . . . . . . . 106
5.2.2.3 Observation of stability . . . . . . . . . . . . . . . . . . . . . . 107
5.2.2.4 Stability of aqueous foam . . . . . . . . . . . . . . . . . . . . . 107
5.2.2.5 X-ray tomography . . . . . . . . . . . . . . . . . . . . . . . . . 108
5.2.3 Properties of cement paste . . . . . . . . . . . . . . . . . . . . . . . . . 108
5.2.3.1 Yield stress of cement paste . . . . . . . . . . . . . . . . . . . 108
5.2.3.2 Surface tension of cement paste . . . . . . . . . . . . . . . . . 109
5.3 Results . . . . . . . . . . . . . . . . . . . . . . . . . . . . . . . . . . . . . . . . . 110
5.3.1 Stability of aqueous foams . . . . . . . . . . . . . . . . . . . . . . . . . 110
5.3.2 Drainage and ripening . . . . . . . . . . . . . . . . . . . . . . . . . . . . 110
5.3.2.1 Smaller bubbles (R . 500 µm) . . . . . . . . . . . . . . . . . . 110
5.3.2.2 Bigger bubbles (R & 500 µm) . . . . . . . . . . . . . . . . . . 114
5.3.3 Influence of initial yield stress and bubbles size . . . . . . . . . . . . . 116
5.4 Discussion . . . . . . . . . . . . . . . . . . . . . . . . . . . . . . . . . . . . . . . 117
5.4.1 Destabilization mechanisms . . . . . . . . . . . . . . . . . . . . . . . . 117
5.4.2 Characteristic destabilization times . . . . . . . . . . . . . . . . . . . . 118
5.4.3 Effect of Bingham capillary number . . . . . . . . . . . . . . . . . . . . 119
5.4.4 15 min interstitial Bingham capillary number . . . . . . . . . . . . . . 121
5.5 Conclusion . . . . . . . . . . . . . . . . . . . . . . . . . . . . . . . . . . . . . . . 122
Bibliography . . . . . . . . . . . . . . . . . . . . . . . . . . . . . . . . . . . . . . . . . 124
Appendix A: aqueous foam stability . . . . . . . . . . . . . . . . . . . . . . . . . . . 125
6 Water imbibition of open-cell cement foams 127
6.1 Introduction . . . . . . . . . . . . . . . . . . . . . . . . . . . . . . . . . . . . . . 127
6.2 Materials and methods . . . . . . . . . . . . . . . . . . . . . . . . . . . . . . . . 128
6.2.1 Materials . . . . . . . . . . . . . . . . . . . . . . . . . . . . . . . . . . . . 128
6.2.2 Cement foam production . . . . . . . . . . . . . . . . . . . . . . . . . . 128
6.2.3 Characterization of the foam morphology . . . . . . . . . . . . . . . . 129
6.2.4 Permeability measurement . . . . . . . . . . . . . . . . . . . . . . . . . 130
6.2.5 Imbibition experiment . . . . . . . . . . . . . . . . . . . . . . . . . . . . 131
6.3 Results and discussion . . . . . . . . . . . . . . . . . . . . . . . . . . . . . . . . 131
6.4 Conclusion . . . . . . . . . . . . . . . . . . . . . . . . . . . . . . . . . . . . . . . 136
Bibliography . . . . . . . . . . . . . . . . . . . . . . . . . . . . . . . . . . . . . . . . . 137
Conclusion 139
xii

CONTENTS
A Compressive resistance I
A.1 Materials and methods . . . . . . . . . . . . . . . . . . . . . . . . . . . . . . . . I
A.1.1 Materials . . . . . . . . . . . . . . . . . . . . . . . . . . . . . . . . . . . . I
A.1.2 Sample preparation protocol . . . . . . . . . . . . . . . . . . . . . . . . I
A.1.3 Compression tests . . . . . . . . . . . . . . . . . . . . . . . . . . . . . . II
A.2 Results and discussion . . . . . . . . . . . . . . . . . . . . . . . . . . . . . . . . III
A.2.1 Curve shape . . . . . . . . . . . . . . . . . . . . . . . . . . . . . . . . . . III
A.2.1.1 Air content Φ> 75%, Steol and TTAB samples . . . . . . . . . III
A.2.1.2 Air content Φ< 40% . . . . . . . . . . . . . . . . . . . . . . . . IV
A.2.2 Compression resistance . . . . . . . . . . . . . . . . . . . . . . . . . . . IV
A.2.2.1 Comparison with literature . . . . . . . . . . . . . . . . . . . . IV
A.2.2.2 Effect of surfactant . . . . . . . . . . . . . . . . . . . . . . . . . V
A.2.2.3 Effect of W/C . . . . . . . . . . . . . . . . . . . . . . . . . . . . V
A.2.2.4 Effect of bubble size . . . . . . . . . . . . . . . . . . . . . . . . VI
A.3 Conclusion . . . . . . . . . . . . . . . . . . . . . . . . . . . . . . . . . . . . . . . VII
xiii

CONTENTS
xiv

Introduction
Environment impact of buildings is considerable, both because of the material need for
their construction and the energy demand during their life. Implementation of novel con-
struction materials is required to save raw material resources and build energy efficient
buildings. Partial replacement of solid by air bubbles offers a promising solution to ad-
dress these issues. Aerated concrete, with varying air content from a few percent to 98%,
provides a wide range of construction materials with reduced raw material need, reduced
transport costs because of it low density, and improved thermal insulation properties.
Microstructural features of solid foams have significant impact on several functional
properties. The size of the openings between the bubbles is known to play an important
role on cement foam permeability and acoustic absorption capacity. The study of well-
controlled cement foam samples is expected to provide better understanding of relation
between foam morphology and functional properties.
The production of cement foams with well controlled morphology requires two steps.
Firstly, a well-controlled fresh cement foam must be produced. Secondly, the controlled
structure must not evolve as long as the cement has not hardened. However, when cement
paste is fresh, the cement foam sometimes destabilizes: bubbles tend to raise and to grow.
The goal of this work is to give hints to formulate stable cement foams. The role of the
rheological properties of the cement paste is mainly investigated.
We describe in chapter 1 the preparation techniques and the main properties of the
cement foams reported in the literature. The diversity of the formulations of these foams
makes their comparison difficult. Then, we focus independently on the characteristics of
fresh cement paste and on the properties of aqueous foams. At the scale of the cement
grains, cement paste can be seen as solid particles interacting with each other, and sus-
pended in alkaline solution. At the macroscopic scale, cement paste behaves like a yield
stress fluid, i.e. it can flow under applied stress above its yield stress. Aqueous foams are
also yield stress fluids. Besides, they are unstable systems due to the difference of density
between liquid and air, and to the high energy required to create the numerous air-liquid
interfaces. Three destabilization mechanisms occur: drainage is due to gravity, Ostwald
ripening leads to gas transfer between the bubbles and coalescence is the breakage of
walls separating neighbor bubbles. Finally, in the last part of chapter 1, we analyze litera-
ture results on complex foams to understand how fresh cement paste can affect stability
and rheological properties of cement foams.
In chapter 2, we investigate the interaction between surfactants and cement paste,
1

INTRODUCTION
without adding bubbles. We study the efficiency of surfactants, first in cement paste in-
terstitial solution, and then in the presence of cement grains. In addition, we measure
how surfactants adsorb on cement grains, and how adsorption affects the surface prop-
erties of the grains, the consistency of the cement paste and the setting time. We show in
this chapter that if surfactant type and concentration are well chosen, it can be used as an
additive in cement paste to make cement grain surface hydrophobic and to monitor the
yield stress of the paste.
In chapter 3, we focus on aerated cement pastes at low air volume content, below
40%. We investigate the effect of the air inclusions on the yield stresses of the pastes and
we compare our results with models and measurements performed on model yield stress
fluids. We note and discuss a major difference between the cases when cement grains are
hydrophobic and hydrophilic.
In chapter 4 and 5, we focus on cement foam stability, at air content 83%. In chapter
4, we change the yield stress of the cement paste by varying the amount of surfactant or
superplasticizer, while water-to-cement ratio and bubble size are kept constant. Unex-
pectedly, remarkable stability is observed when cement paste yield stress is low, which
coincides with a major enhancement of the yield stress due to confinement between the
bubbles. In chapter 5, we study the influence of bubble size, water-to-cement ratio and
surfactant content, in order to define a stability criterion for cement foams from the bub-
ble size, the yield stress of the interstitial cement paste and the time evolution of the ce-
ment paste.
In chapter 6, we measure water imbibition of cement foams with open porosity, pre-
pared with two different surfactants. Classic model cannot account for the low measured
imbibition velocity. We attribute this effect to the morphology of solid foams. Indeed, we
observe that water front is slowed down when it crosses the windows between the bub-
bles.
Lastly, some measurements of the compressive stress of cement foams samples are
presented in Appendix A.
2

Chapter 1
State of the art
Sommaire1.1 Introduction . . . . . . . . . . . . . . . . . . . . . . . . . . . . . . . . . . . . 4
1.2 Aerated concrete . . . . . . . . . . . . . . . . . . . . . . . . . . . . . . . . . 5
1.2.1 Production methods . . . . . . . . . . . . . . . . . . . . . . . . . . . . 5
1.2.1.1 Chemical foaming . . . . . . . . . . . . . . . . . . . . . . . . 5
1.2.1.2 Physical foaming . . . . . . . . . . . . . . . . . . . . . . . . . 5
1.2.2 Properties . . . . . . . . . . . . . . . . . . . . . . . . . . . . . . . . . . 6
1.2.2.1 Density and compressive strength . . . . . . . . . . . . . . . 6
1.2.2.2 Thermal resistance . . . . . . . . . . . . . . . . . . . . . . . . 7
1.2.2.3 Rheology . . . . . . . . . . . . . . . . . . . . . . . . . . . . . . 8
1.3 Fresh cementitious materials . . . . . . . . . . . . . . . . . . . . . . . . . . 9
1.3.1 Suspension . . . . . . . . . . . . . . . . . . . . . . . . . . . . . . . . . 9
1.3.2 Yield stress fluid . . . . . . . . . . . . . . . . . . . . . . . . . . . . . . . 10
1.3.3 Hydration and thixotropic behavior . . . . . . . . . . . . . . . . . . . 11
1.3.4 The role of chemical admixtures . . . . . . . . . . . . . . . . . . . . . 12
1.3.5 Surfactants in cement paste . . . . . . . . . . . . . . . . . . . . . . . . 13
1.4 Aqueous foams . . . . . . . . . . . . . . . . . . . . . . . . . . . . . . . . . . 14
1.4.1 Surface tension and Laplace’s law . . . . . . . . . . . . . . . . . . . . 14
1.4.2 Role of surfactant in foams . . . . . . . . . . . . . . . . . . . . . . . . 14
1.4.3 Foam structure . . . . . . . . . . . . . . . . . . . . . . . . . . . . . . . 15
1.4.4 Foam stability . . . . . . . . . . . . . . . . . . . . . . . . . . . . . . . . 17
1.4.4.1 Drainage . . . . . . . . . . . . . . . . . . . . . . . . . . . . . . 17
1.4.4.2 Coalescence . . . . . . . . . . . . . . . . . . . . . . . . . . . . 18
1.4.4.3 Ostwald ripening . . . . . . . . . . . . . . . . . . . . . . . . . 19
1.4.5 Foam rheology . . . . . . . . . . . . . . . . . . . . . . . . . . . . . . . 19
1.4.5.1 Solid regime . . . . . . . . . . . . . . . . . . . . . . . . . . . . 20
3

CHAPTER 1. STATE OF THE ART
1.4.5.2 Flow . . . . . . . . . . . . . . . . . . . . . . . . . . . . . . . . 20
1.4.6 Conclusion on aqueous foams . . . . . . . . . . . . . . . . . . . . . . 20
1.5 Complex foams and bubble suspensions . . . . . . . . . . . . . . . . . . . 21
1.5.1 Hydrophobic particles . . . . . . . . . . . . . . . . . . . . . . . . . . . 21
1.5.2 Hydrophilic particles . . . . . . . . . . . . . . . . . . . . . . . . . . . . 24
1.5.3 Yield stress fluid . . . . . . . . . . . . . . . . . . . . . . . . . . . . . . . 25
1.5.4 Rheology of complex foams and bubble suspensions . . . . . . . . . 26
1.5.4.1 Aerated yield stress fluids . . . . . . . . . . . . . . . . . . . . 26
1.5.4.2 Granular foams . . . . . . . . . . . . . . . . . . . . . . . . . . 28
1.6 Conclusion . . . . . . . . . . . . . . . . . . . . . . . . . . . . . . . . . . . . . 30
1.1 Introduction
Construction industry faces everyday new challenges. Need of new infrastructures is
growing; architectural innovations call for stronger and more flexible materials. At the
same time, environmental issues require to save raw resources and to enhance energy
efficiency of the new and renovated buildings.
Therefore, new construction materials must be developed. However, a successful new
construction material has to meet lots of requirements such as low production cost, low
environmental impact, thermal insulation, sound insulation, mechanical strength, dura-
bility, fire resistance and manufacturing/placement efficiency.
Cementitious materials fulfill a lot of these requirements. They are composed of a
binder (usually a mixture including Portland cement), water and aggregates, most of which
can be found near the construction site. They can be poured into molds or easily shaped
during a few hours after mixing. After chemical reaction of cement with water, it pos-
sesses high compressive strength. In addition, it is fire resistant and lasts several decades,
up to centuries. But it raises a major environmental concern because of the high amount
of raw materials needed and the carbon dioxide released during cement manufacture.
Addition of small amount of air bubbles into concrete improves its life time in areas
exposed to freeze-thaw cycles. In larger amount, it helps to save resources, reduce the
material density and improve its thermal resistance. Aerated concrete is thus a promising
material, as it combines the advantages of concrete while improving its environmental
performance.
In this chapter, we will first briefly describe the fabrication methods and properties of
aerated cementitious materials (part 1.2). We will see that the formulations and manu-
facturing methods are very numerous, and, therefore, the range of the final properties of
these materials is very wide. This motivates the approach used in the following chapters,
where we choose to prepare and study aerated materials with well controlled formulation
and morphology. We will mainly deal with the manufacture and the early time evolution
of well-controlled cement foams (chapters 2 to 5). This requires proper understanding of
4

CHAPTER 1. STATE OF THE ART
the fresh properties of aerated cementitious material. These properties result from the
behaviors of both the continuous phase (concrete, cement or mortar) and the bubbles. In
part 1.3, we will give an overview of the properties of fresh cementitous materials. In parts
1.4 and 1.5, we will deal with foams.
1.2 Aerated concrete
1.2.1 Production methods
Two types of methods are used to add air bubbles into concrete, mortar or cement paste:
chemical methods or physical methods. Note that materials are usually named in the
literature accordingly to their fabrication method. Cellular concrete or autoclaved con-
crete refers to chemical foaming, while foamed concrete or cement foam refers to physical
foaming [1].
1.2.1.1 Chemical foaming
Chemical foaming consists in adding to the mix slurry an additive which is able to re-
act and produce gas. Produced gas remains stuck in the slurry and forms pores. This
method is used for autoclaved aerated concrete. Autoclaved aerated concrete is a solu-
tion patented in the 1920’s [2] to manufacture prefabricated lightweight concrete blocks.
In this case, the additive is aluminium powder [3] which releases hydrogen in cement or
concrete alkaline environment [4]. Aluminium grain size and quantity control the final
size and volume of porosity [1]. Mechanical strength of autoclaved concrete is enhanced
by curing at high temperature and pressure (190° C and 1.2 MPa) [1, 5]; this curing method
is called autoclaving. Another common foaming agent for chemical foaming is hydrogen
peroxide H202 [6, 7].
1.2.1.2 Physical foaming
Physical foaming methods require the use of surfactant molecules to avoid coalescence
of bubbles. The effect of surfactant is detailed later in the next sections: in part 1.3.5, we
study their effect in cement paste, and, in 1.4, how they stabilize aqueous foams.
Bubbles can be brought into cement/concrete slurry by two methods. First, bubbles
can be entrained by fast mixing of the slurry ([8, 9, 10]). Surfactants used for this method
are usually called air entraining agents (AEA). They are used, for instance, to create freeze-
thaw resistant concretes, where air volume fraction is between 4 and 8%. Higher air vol-
ume fraction can also be reached. For instance, the fiber reinforced foams prepared by
Akthar & Evans [11] have air volume content up to 95%. The morphology and the amount
of the entrained bubbles are however hard to control, and the resulting foam can be un-
stable [1].
Precursor foam method allows a better control of the foamed cement properties [12].
Some authors also suggest that these foams have better thermal insulation capacities [7].
5

CHAPTER 1. STATE OF THE ART
A separate precursor foam, i.e. an aqueous foam made of water and surfactant, is pre-
pared and then incorporated into the slurry [13, 14, 15]. The morphology of the hardened
cement depends on the bubble size distribution of the precursor foam and on the evolu-
tion of the bubbles during mixing and until cement hardening. Conservation of bubble
size during mixing is however challenging. Paste consistency must be well chosen: if it is
too fluid, bubbles tend to rise and escape from the mix, and if it is not fluid enough, bub-
bles tend to break [13, 16]. Both cases lead to a decrease of the incorporated air volume.
In this thesis, we focus on material with very well controlled structure, that is why
the chosen manufacturing method is the precursor foam method (see chapters 3 to 6).
Therefore, for the literature review on the properties of cement foams, we focus mainly on
the foams obtained with this method; materials obtained by air entrainment or chemical
foaming are only used when complements are necessary.
1.2.2 Properties
1.2.2.1 Density and compressive strength
Cement foams are first characterized by their low density. Many studies aim at improv-
ing the mechanical strength at a given density. For autoclaved aerated concrete, den-
sities range from 300 kg/m3 to 1200 kg/m3 with compressive strength from about 1 to
10 MPa [2].
Cement foams prepared using physical methods usually have lower strengths. In Fig.
1.1, we can see compression strength as a function of density for samples prepared with
precursor foam method as a function of density. On the whole, compression strength
increases with density. The graph however illustrates the heterogeneity of the measured
strengths: results obtained by Jones & McCarthy [14] are much below the measurements of
Tonyan & Gibson [17] and Abd & Abd [18] at similar densities. At a given density, mechan-
ical strength depends on the composition and on the preparation protocol of the cement
foam. For instance, Nambiar and Ramamurthy [13] (red symbols in Fig.1.1) have noticed
an important effect of the filler type on the cement foam resistance. Falliano et al. [19]
measured the yield stress of cement foams made by the precursor foam method with var-
ious cements, surfactants, curing methods and water to cement ratio and observed that
all these factors play a role on the hardened cement foam strength.
In many industrial applications, strength-density ratio of the cement foams must be
optimized. From the literature results, we can distinguish three methods to go to this
direction. The first one consists in increasing the strength of the concrete matrix. For in-
stance, as mentioned previously, this is the role of autoclaving during the fabrication of
autoclaved aerated concrete. The use of reinforcing fibers [11] and carbon nanotubes [20,
21] has also been studied. Secondly, some authors use a lighter concrete matrix; the air
content at given density is therefore smaller. Lighter matrix can be obtained for example
by the use of lightweight aggregates [12] and the replacement of sand by fly ash [13]. The
third optimization mean could be the control of the bubble morphology, though, the ef-
fect of bubble morphology raises no consensus. In the strength-density model proposed
6

CHAPTER 1. STATE OF THE ART
Figure 1.1: Compressive strength of some cement foams prepared by precursor foam method and
measured 28 days after preparation. Empty back squares correspond to foams containing mi-
crosilica, polyesther fibers and superplasticizer [17]; black crosses, sand [14]; black diamonds [18].
All red signs have been published in reference [13], different solid particles have been added to
cement paste: fly ash (asterisks), fly ash and sand (dots), fine sand (crosses) coarse sand (circles).
by Hoff [22] and checked by Kearsley & Wainwright [23], no effect of the bubble mor-
phology appears. However, Nambiar and Ramamurthy [13] suggest that the strength loss
observed when fine sand is replaced by coarse sand is due to a non-homogeneous distri-
bution of the air bubbles in the latter case. Some authors notice that decreasing water-
to-cement ratio, although it increases the strength of the concrete matrix, decreases the
cement foam compressive strength [19], they attribute this effect to the irregular shape
of the bubbles. Some authors mention that best mechanical resistance is obtained when
bubble size distribution is narrower [24, 25] and when bubbles are not connected [26, 27].
Others [1, 28] also suggest that the strength of chemically foamed concrete is better in the
case of small and spherical bubbles.
However, a major difficulty to study the effect of foam structure on cement foam strength
arises from the fact that, in the studies previously mentioned, the structure of the foam
is not modified independently from the composition of the matrix. On the contrary, it
results for instance from a change of paste fluidity or surfactant. As a consequence, the
effect of foam structure on its final strength can hardly be distinguished from the modifi-
cation of the strength of the cementitious matrix.
Some authors have also measured the tensile strength [7] as well as the compression
elastic modulus [12] of aerated concrete. Similarly to compression strength, these me-
chanical properties also decrease when density decreases and are strongly related to the
composition of the matrix.
1.2.2.2 Thermal resistance
Samson et al. [29] compare the thermal conductivities of lightweight concrete prepared
with various methods: chemical foaming, air entrainment, pre-formed foam and lightweight
7

CHAPTER 1. STATE OF THE ART
aggregate concretes (see Fig. 1.2). Thermal conductivity depends mainly on density, in-
deed, values obtained for lightweight aggregate concretes are similar to aerated concretes.
Some authors report a linear relation between density and thermal conductivity [7]. In a
minor extent, thermal conductivity depends also on the content on the continuous phase,
for instance its moisture content [3]. A small dependence of the thermal resistance on the
foam structure is observed by some authors[3, 30]. However, like mentioned previously
in the case of compressive strength, porosity morphology has been changed by a modifi-
cation of the formulation of the foam. For instance, in chemically produced metakaolin-
blast furnace slag foams studied in [30], the size of the pores is changed with the concen-
tration of added stabilizing surfactant.
Figure 1.2: Thermal conductivity of lightweight concretes. Graph extracted from [29]. In the leg-
end, LA corresponds to concrete containing lightweight aggregates; GF, to aerated concretes pre-
pared with chemical foaming method; MF, to air-entrained concretes; PF, to pre-foaming method;
G, to foamed gypsum.
1.2.2.3 Rheology
There is no consensus on the effect of bubbles on the fresh properties of cement foams.
Rixom and Mailvaganam [16] report a decreases of fluidity when bubbles are entrained
with some surfactant. On the contrary, Aïtcin [31] and Ahmed et al. [32] mention a reduc-
tion of the viscosity due to entrained bubbles.
8

CHAPTER 1. STATE OF THE ART
1.3 Fresh cementitious materials
In literature concerning cementitious materials, a distinction is made between concrete,
mortar and cement paste. Cement paste contains no aggregates whereas mortar includes
fine aggregates (sand) and concrete, fine and coarse aggregates. In this work, we want to
understand the interaction of foam and surfactant with cementitious materials. We there-
fore choose to study the most simple cementitious material, i.e. cement paste, containing
only water and Portland cement. For the same reason, alternative binders such as fly ash
and blast furnace slag, which are widely used in practice due to their lower environmental
footprint, are not investigated here.
1.3.1 Suspension
Portland cement is mainly composed of clinker, obtained from limestone and clay. It is
mixed, heated at 1450° and ground. It contains several oxides, mainly calcium oxide CaO
(∼ 60 %) and silicium oxide SiO2 (∼ 20%), as well as Al2O3, Fe2O3, MgO, K2O and Na2O
[33]. When it is mixed with water, some of the ions dissolve, and for several minutes up
to hours, cement paste can be considered as a suspension of rigid particles in a strongly
alkaline electrolyte solution. During this dormant period, the cement can be poured in
mold or shaped. Then, chemical reaction between the cement oxides and water takes
place and the formed hydration products bind the unreacted particles to form a solid
material. We will discuss here only the properties of the fluid cement paste, before cement
hydration.
Size of the cement grains range from about 1 µm to 100 µm with average about 10 µm
[34, 35]. The cement grains have irregular shape and very rough surfaces, the radius of
curvature of the edges are of the order of magnitude of 500 nm [34]. Cement powder
specific surface area measured by Blaine apparatus is often close to 3000-4000 cm2/g.
Figure 1.3: Example of volume distribution of cement grain size in water. Measure has been made
with a laser granulometer, in the presence of various amounts of superplasticizer (SP) [36].
Cement density is close to 3.15 g/cm3. Cement content of a paste is usually given in
terms of the mass water-to-cement ratio W/C. For a cement paste, solid fraction Φp is
related to the water-to-cement ratio byΦp = (W/C×ρC/ρE+1)−1, where ρC and ρE are the
9

CHAPTER 1. STATE OF THE ART
densities of cement and water.
1.3.2 Yield stress fluid
A yield stress fluid is a material which can flow only if applied stress is above a critical
stress, called yield stress and noted τy [37]. Below the yield stress, its behaves like an
elastic solid, whose properties are often measured in a rheometer by applying oscillations
of small strain amplitude. Above the yield stress, the material flows, and the shear rate γ
depends on the applied shear stress τ.
In the case of cement paste, yield stress arises from attractive interactions between ce-
ment grains. A model, called Yodel (for yield stress model) has been derived by Flatt and
Bowen [38] to relate the interactions at particle scale with the macroscopic yield stress of
a solid suspension. Authors calculate how the unbroken bonds between solid particles
affect the effective maximal solid volume fractionΦ∗max of the suspension: when particles
are connected to each other, they can be less effectively packed than unconnected parti-
cles, which reduces Φ∗max . Solid suspension can flow only if solid volume fraction Φp is
smaller than Φ∗max . The yield stress calculated with this approach is:
τy = m1
Φ2p (Φp −Φper c )
Φmax(Φmax −Φp )(1.1)
where Φper c is the minimum solid volume fraction required to create a percolated net-
work of solid grains and Φmax the maximal volume fraction of the grains with no attrac-
tive interaction. Φper c as well as Φmax depend on the particle shape and size distribu-
tion. m1 accounts for the intensity of the interparticle forces and is also related to the
size distribution of the particles. The major particle forces are the electrostatic repulsion
(for charged particles), the Van der Waals attraction and the steric repulsion (when some
polymers are adsorbed on cement grain surface). Cement grains are charged, but due to
high electrolyte content of cement paste interstitial solution, the range of the electrostatic
repulsion is short: Debye length is κ−1 ≈ 0.7 nm [39]. When molecules are adsorbed on
solid grains and form a layer of thickness hster above κ−1, they create a steric repulsion
between cement grains and increase the interparticle distance h up to 2hster . Van der
Waal attraction depends on interparticle distance FVdW ∝ 1/h2.
Flow properties of cement paste are well fitted with a Bingham model [34, 40, 41]:
τ= τy +µd γ (1.2)
with µd the plastic viscosity of the paste. Both τy and µd are affected by the formulation
of the paste. For instance, a rise of W/C increases not only the yield stress but also the
plastic viscosity of the paste.
One of the methods to measure the yield stress consists in measuring the shear stress
over a wide range of shear rates and fitting the results with Bingham model (equation
1.2). A second method is the start-of-flow curve: small constant shear rate is applied and
shear stress is measured as a function of deformation. Yield stress is the maximum value
10

CHAPTER 1. STATE OF THE ART
of the curve (see Fig. 1.4 (a) for a typical start-of-flow curve of cement paste). Different
measurement methods can result in different values of the yield stress [36]. Note that the
yield stress predicted by the Yodel corresponds to the start-of-flow method, and that this
method will be used in the following chapters (see chapters 3 and 4).
Figure 1.4: Example of start of flow curve of cement paste, with two different scales. Measured
yield stress is the maximum observed in graph (a), the corresponding critical strain is 2.5%. On
graph (b), the critical strain for C-H-S bonds is observed close to 0.05%. [35]
The formation of the structure of cement grains due to Van der Waals forces takes
place in a few seconds. The critical strain of the percolated structure, i.e. the deformation
needed to break the bonds, is a few percent.
When cement paste is at rest for several minutes, yield stress increases with time. Ini-
tial yield stress can be retrieved by a strong shearing of the cement paste. These obser-
vations remind the behavior of thixotropic materials [37, 41, 42]. Their cause is discussed
below.
1.3.3 Hydration and thixotropic behavior
Cement paste hardening takes place through the nucleation and growth of hydration
products, mainly calcium silicate hydrates (CSH). CSH nucleates preferentially in the pseu-
do contact zones between cement grains, i.e. at the places where the distance between
solid surfaces is h. CHS hydrates act as solid bonds between cement grains and can be
broken when cement paste is sheared. "Rigid" critical strain needed to break the CHS
bond is much lower than the critical strain associated to flocculation: only a few hun-
dredths of percent [35]. This small critical strain is illustrated in Fig. 1.4 (b). The elas-
tic properties of cement paste due to CHS bond can be measured with oscillations tests:
oscillations of strain amplitude ε0 < 10−4 are applied, and stress response recorded. In-
phase material response gives the elastic modulus, while out-of-phase response accounts
for the viscous dissipation.
A typical elasticity evolution curve is shown in Fig. 1.5 (a). The network of CSH bond
is formed in about 100 s. Then elastic modulus increases linearly with time due to the
increase of the area of CSH bonds. Formation and growth of CSH bonds are also respon-
sible for an increase of the yield stress. The stress at the rigid critical strain, i.e. about
11

CHAPTER 1. STATE OF THE ART
0.05%, increases with time. After a few minutes, it overcomes the stress at the soft critical
strain (about 2.5%). That is to say that the measured yield stress during the first minutes
is related to the Van der Waals forces, whereas, after about 15 min, it is related to the CSH
bonds and increases linearly with time [35] (see Fig. 1.5 (b)).
Figure 1.5: Evolution of the rheological properties of cement paste with time. (a): Elastic modulus,
measured with strain oscillations, amplitude 0.03 % and frequency 1 Hz [35]. (b): Yield stress
measured by start of flow curve [35].
1.3.4 The role of chemical admixtures
We have mentioned that, to prepare cement foams in chapters 3 to 5, we will add pre-
cursor aqueous foam to cement paste. The precursor foam contains surfactants. Adding
chemical additives to cement paste can strongly affect its properties in the fresh state. Let
us first say a few words about the common additives for concrete.
The most used of them are superplasticizers, which make the mix more fluid. Su-
perplasticizers are polymers which adsorb on cement grain surface. Layers of adsorbed
polymers (thickness hster is several nm) on neighboring grains cannot interpenetrate and
create a steric repulsion. The increased separation distance h reduces the intensity of Van
der Waals forces, which decreases the yield stress.
Rheological properties of cementitious materials can also be modified by the use of
viscosity-modifying admixtures. With notation defined previously (see equation 1.2), they
increase the plastic viscosity µd of the paste with no major modification of the yield stress
τy . These additives are used for instance for self-compacting concrete, whose yield stress
is very low, to maintain a homogeneous distribution of solid particles in the paste [43].
They are large polymers, which can either increase the viscosity of the interstitial solution,
create bridges between cement grains by adsorbing simultaneously on several particles or
produce depletion forces.
Some superplasticizers delay hydration of cement paste. This is often an undesirable
effect due to the surface coverage of cement grains by the adsorbed polymers. When hy-
dratation retardation is required, other additives called retarders are used. Most of them
are sugars. Their working mechanism is not yet perfectly understood; it may be related to
preferential adsorption of these additives on the most reactive cement phases [44].
12

CHAPTER 1. STATE OF THE ART
Other additives include setting accelerators and admixtures to prevent water from
freezing.
1.3.5 Surfactants in cement paste
Surfactants, or “surface active molecules", are also widely used concrete additives for two
aims: air-entrainment in the production of freeze-thaw resistant concrete and shrink-
age reduction. They are amphiphilic molecules, i.e. they are composed of a hydrophilic
head and a hydrophobic tail. Surfactants are classified according to the nature of the hy-
drophilic head. They are called anionic if the head is negatively charged, cationic if it is
positively charged, amphoteric or zwitterionic if both charges are present and non-ionic
when it is not charged. In addition to the different hydrophilic heads, surfactants also
differ by their molar mass. For usual synthetic surfactants, it is rather low: 288 g/mol for
anionic sodium dodecyl sulfate (SDS) studied by [45] and 336 g/mol for cationic tetrade-
cyltrimethylammonium bromide (TTAB). On the other hand, molar mass of proteins,
used by [12, 46], is much bigger than SDS or TTAB, about 20 000 g/mol for instance for
casein.
Several authors have observed that surfactants adsorb on cement grains. Fraction of
adsorbed surfactant depends both on their chemical formula and on the cement compo-
sition [8, 47, 48]. Reported consequences of surfactant adsorption are a change of cement
grains zeta potential [49], a hydrophobization of cement grains [49] and bridging between
cement grains [16]. In addition, surfactants may interfere in cement hydration. Complex-
ation with calcium ions is reported by [10, 45, 47] and modification of the structure of the
hydration product crystals, by [10, 50]. Some authors have also measured a delay of hy-
dration due to surfactants [47, 51, 52]; Kuzielová et al. [52] note that retardation can be
avoided if low amount of surfactant is used.
Surfactants used for air-entrainment are called air entraining agent (AEA). They stabi-
lize air bubbles which enter the paste during the mixing process. Most of AEA are nega-
tively charged [10, 16, 43]. Some authors mention that voids are more stable in this case
[8, 9]. Indeed, anionic surfactants tend to adsorb both on air-water interfaces and cement
grain surfaces. They create bonds between cement grains and air bubbles, which avoids
sedimentation of cement grains and rising of the bubbles.
Shrinkage reducing admixtures are often non-ionic surfactants. Shrinkage reduction
is due to their ability to reduce the surface tension [43], and therefore, to decrease the
internal stresses due to capillarity during hydration and drying of concrete (see parts 1.4.1
and 1.4.2 for the definition of surface tension and how it is affected by surfactants).
Effect of surfactant on the rheology of cement paste has hardly be studied indepen-
dently from the consequences of bubbles addition. We can however mention the study of
Rixom and Mailvaganam [16], who report an increase of apparent viscosity η(γ) = τ/γ =τy /γ+k for several mixing velocities (i.e. several shear rates γ) when anionic surfactant is
added. Non-ionic surfactant, on the other hand, has no effect on rheology.
This short literature review on surfactant in cementitious materials reveals that surfac-
tants sometimes have the same consequences as usually concrete admixtures: they may
13

CHAPTER 1. STATE OF THE ART
adsorb on cement grains, delay hydration, bridge the particles... Hovewer, these effects
depend of the chemical formula of the surfactants. Systematic investigation of several
surfactants is required to elucidate the consequences of surfactants in cement paste, in
order to facilitate the selection of surfactants to formulate cement foams.
1.4 Aqueous foams
Foams have raised a lot of attention in the last decades due to their application not only
in construction materials, but also in food industry, cosmetics, etc. They are materials
containing two phases: gas bubbles are dispersed in a continuous phase. For all these
materials, the final properties result, on the one hand, from the properties on the contin-
uous phase, and on the other hand, from the role of the air bubbles. Let us first focus on
liquid foams. The phenomena described in this part apply to precursor foams used for
the cement foam fabrication (see part 1.2.1). In addition, they enlighten the role of the
bubbles in the behavior of the cement foams. How the cement paste can affect this role is
discussed in part 1.5.
We will only focus on the most important points to produce and understand cement
foams. For a more detailled description of the physics of foams, the reader can refer to the
books [53] and [54].
1.4.1 Surface tension and Laplace’s law
The creation of an interface increases the free energy of the system proportionally to the
surface area of the interface [55]. This additional surface energy is called surface tension
and will be noted γ. In other words, surface tension is homogeneous to a force per unit
length; it acts as a force that tends to reduce the area of the interface.
Surface tension leads to a difference of pressure between the phases of each side of
the interface, called capillary pressure PC and given by Laplace’s law [53, 54, 55] (with R1
and R2 the major radii of curvature on the interface):
PC = γ(
1
R1+ 1
R2
)(1.3)
For example, in the case of an isolated bubble in a liquid, surface tension tends to
reduce the size of the bubble. Major radii of curvature are equal, R1 = R2 = R, and Laplace’s
law becomes:
PC = Pg as −Pl i q = 2γ
R(1.4)
1.4.2 Role of surfactant in foams
Due to their specific shape, surfactants in solution tend to settle at air-liquid interface,
with their hydrophilic head in the aqueous solution and their hydrophobic tail in the
air. First consequence is a reduction of the surface energy: when surfactant concentra-
tion increases, surface tension γ decreases down to a minimal value. The minimal value
14

CHAPTER 1. STATE OF THE ART
is reached at the surfactant critical micelle concentration (CMC), it is the concentration
above which surfactant molecules gather into agglomerates, with their hydrophobic tail
close to each other and hydrophilic head toward the solution. Surfactant agglomerates
are called micelles. Surfactant effect on surface tension and distribution in solution is
shown in Fig. 1.6.
Figure 1.6: Effect of surfactants on air-water surface tension and surfactant distribution as a func-
tion of their concentration.
In addition, surfactant adsorbed layer at interfaces lead to a repulsion between the
interfaces, which is essential to foam stability [53] (see paragraph 1.4.4).
Low molecular mass surfactant diffusion from bulk solution to interfaces is very fast
[56]. Time needed to diffuse from the bulk solution to the interface is longer for proteins
[56], therefore the surface tension value decreases slowly with time before reaching a min-
imum. This make the creation of a foam by shaking or strong mixing more difficult than in
the case of low molecular mass surfactants. On the other hand, once adsorbed, proteins
hardly desorb from the interface, which explains that the foams are very stable [53].
1.4.3 Foam structure
When the amount of air bubbles in a fluid is increased, surface tension tends to keep the
bubbles spherical as long as their are not deformed by their neighbors. We call aerated
materials with spherical bubbles “bubble suspensions". In the following, we will distin-
guish the suspension regime from the foam regime, where the bubbles are deformed by
their neighbors. Note that when continuous phase is a Newtonian liquid, bubble sus-
pensions are in practice unstable because of buoyancy forces. Bubble suspensions will
therefore not be studied in this part. We will mention them in part 1.5.
In a foam, air-liquid surface area is very large. Surface minimization strongly con-
straints the foam structure. The morphology of dry foams, i.e. when air fractionΦ is close
15

CHAPTER 1. STATE OF THE ART
to 100%, is ruled by three laws, known as Plateau’s laws from the name of the Belgian
physicist who stated them in 1873 [53].
1. Two bubbles are separated by a liquid film of constant average curvature.
2. Three films join in channels called Plateau border and form 120° angles.
3. At each node, four Plateau borders intersect and form 109.5° angles.
Figure 1.7: (a) Illustration of 2nd and 3r d Plateau’s laws. (b) Schema of a Plateau border and nota-
tion of r , the radius of curvature of the Plateau border. Figure taken from [53].
When foams are dry, the volume of nodes and Plateau border is small. When the liquid
volume fraction Φl = 1−Φ is increased, Plateau border volume increases and the surface
of the liquid film between two bubbles decreases. The capillary pressure Pc , i.e. pressure
difference between air and liquid in the Plateau borders, can be deduced from Laplace’s
law, which can be written with the notations defined in Fig. 1.7 (b) as:
Pc = Pg as −Pl i q = γ
r(1.5)
where r depends on the foam liquid fraction. To estimate its value, let us consider now
monodisperse foams, where all the bubbles have the same size. When Φl < 6.3%, bubble
configuration which minimizes the energy is body-centered cubic, whereas above 6.3%, it
is face-centered cubic. Bubble in the body-centered cubic configuration is called Kelvin-
Voigt cell. The following relation stands for Kelvin-Voigt cell when Φl . 1% [53]:
r ≈ R√Φl /0.33 (1.6)
Bubbles being not spherical, R is defined as the radius of the spheres having the same
volume as the bubbles.
16

CHAPTER 1. STATE OF THE ART
1.4.4 Foam stability
We have seen that the morphology of a foam follows Plateau’s laws and is affected by the
liquid fraction. This morphology evolves with time: gravity leads to drainage, and ripen-
ing and coalescence tend to make the bubbles grow bigger, which reduces the interface
quantity and therefore the total surface energy of the foam. The three foam destabiliza-
tion mechanisms are illustrated in Fig. 1.8. Let us focus on each of them.
Figure 1.8: Schema of the three foam destabilization mechanisms.
1.4.4.1 Drainage
“Drainage" refers to the destabilization of the foam due to gravity. The interstitial fluid,
denser than air bubbles, tend to flow towards the bottom of the foam.
In a liquid foam at equilibrium, the pressure in the liquid continuous phase is equal to
the hydrostatic pressure: Pl i q (z) = Pl i q (0)−ρl g z, where ρl is the liquid density and z = 0
at the bottom of the foam, where the bubbles are spherical and air fraction is equal to the
maximal volume fraction of disordered spheres Φc = 1−Φl ,c = 64%. Together with equa-
tions 1.5 and 1.6, it shows that in a foam at hydrostatic equilibrium, the liquid fraction is
imposed and depends on height [53]:
1√Φl (z)
− 1√Φl (0)
≈p
3ρ2l g 2Rz
γ2(1.7)
Examples of the liquid fraction profiles are drawn in Fig. 1.9.
When a liquid foam is not at hydrostatic equilibrium, liquid flows between the bub-
bles. Foam can be compared with a porous medium of porosity Φl and flow velocity can
be predicted by the Darcy’s law:
u = k
µ
(−dPl i q (z)
d z+ρl g
)(1.8)
17

CHAPTER 1. STATE OF THE ART
Figure 1.9: Liquid fraction as a function of height in a foam at hydrostatic equilibrium. Curves
are plotted from equation 1.7 with γ = 35 mN/m, ρl = 1000 kg/m3 and several bubble sizes: blue
curve, R = 150 µm; red curve, R = 300 µm and green curve, R = 750 µm.
where the permeability k depends on the bubble size and on the liquid content. It is also
affected by the surface viscosity and elasticity, which depends on the surfactant [53, 57].
The conclusion of this paragraph is that, for a given bubble size, gravity fixes the mor-
phology of a simple liquid foam: liquid fraction and the radius of curvature of the Plateau
borders are imposed at each height. As soon as the morphology of the foam differs from
this structure, liquid flows inside the Plateau borders and nodes. To create cement foams
and choose their air fraction, we will therefore need to rely on the complex behavior of
cement paste.
1.4.4.2 Coalescence
Two neighbor bubbles are separated with a liquid film made of two air-liquid interfaces.
Coalescence occurs when this film ruptures.
Film stability is due to the repulsion between the interfaces and is achieved thanks to
the surfactants. Layers of adsorbed surfactant of each interface repel each other due to
electrostatic repulsion (for ionic surfactants) and steric repulsion. The presence of non-
adsorbed surfactant micelles, or protein or polymer in the film can also enhance interface
repulsion [53]. The thickness of the film is typically a few tens of nanometers for low
molecular weight surfactants, and can be bigger for instance in the case of proteins [53,
57] .
Studies on an isolated film shows that the film ruptures when the pressure in air on
each side of the film reaches a critical value, the maximal disjoining pressure, which can
be deduced from the above described interface interactions. However, in a foam, film
rupture can be observed even if bubble pressure is below the maximal disjoining pressure.
Dynamic effect play also a role. For instance, creation of a new film during topological
rearrangement can lead to rupture if liquid fraction is too low [58].
18

CHAPTER 1. STATE OF THE ART
Key point is that the repulsion between interfaces depends not only on the chosen
surfactant and its concentration, but also on the liquid composition. In particular, elec-
trostatic repulsion has no effect if the distance separating the interfaces is above twice the
Debye length [56]. The Debye length decreases when the concentration of ions in the so-
lution decreases. Therefore, surfactant which are able to stabilize a foam in water might
not be as efficient in cement paste, where electrolytes concentration is very high.
1.4.4.3 Ostwald ripening
As a consequence of Laplace’s law, pressure in the smaller bubbles is higher that in the
bigger bubbles. As gas migrates from the high pressure areas to the lower pressure areas,
the size of the smaller bubbles keeps decreasing until they disappear. This phenomenon,
called Ostwald ripening, leads to a reduction of the number of bubbles in time and to an
increase of their average radius. In a foam, gas crosses the liquid films. A freshly prepared
foam first undergoes a transient regime, during which ripening occurs only locally. Then,
during the so-called auto-similar regime, the average radius of the bubbles is proportional
to the square root of the time. In a bubble suspension where there is no film between the
bubbles, ripening is slower: average radius increases as the cubic root of the time.
Ripening velocity of a 3D aqueous foam depends on several factors. Firstly, ripening
depends on the morphology of the foam. If the foam is initially monodisperse, ripening is
very slow at the beginning: after an induction period where no change can be observed,
the transient regime occurs. Then the auto-similar regime finally takes place. In addition,
ripening is faster if the initial bubble size is smaller. Secondly, the nature of the gas affects
ripening: the less soluble the gas is, the slower the ripening. Thirdly, surfactant plays
a major role: increasing the film thickness, creating of a less permeable layer near the
interface and increasing the surface elastic modulus all slow down ripening [57, 59].
1.4.5 Foam rheology
Let us say a few words about emulsions. Emulsions are a suspension of liquid drops in
a non-miscible liquid continuous phase. Like air-water interfaces, the interface between
both immiscible liquids can be stabilized by surfactants. Concentrated emulsions, i.e.
where dispersed phase volume fraction is above the maximal sphere volume fraction, pos-
sess a structure very similar to foams. Emulsion destabilization mechanisms are the same
as for foams, but they are usually slower, which makes their study easier. In particular,
liquid phases can have the same density and drainage effects can therefore be discarded.
This makes experimental investigation of the rheology of emulsions easier than for foams.
Most results obtained on emulsions are however true for foams [60, 61] and we will use
them in this paragraph.
Foams (and concentrated emulsions) are yield stress fluids. When applied stress is
small, bubbles stay in place while films and Plateau borders elongate: foams behave
like an elastic solid. When applied stress is above the yield stress, bubbles displacement
makes the foam flow.
19
CHAPTER 1. STATE OF THE ART
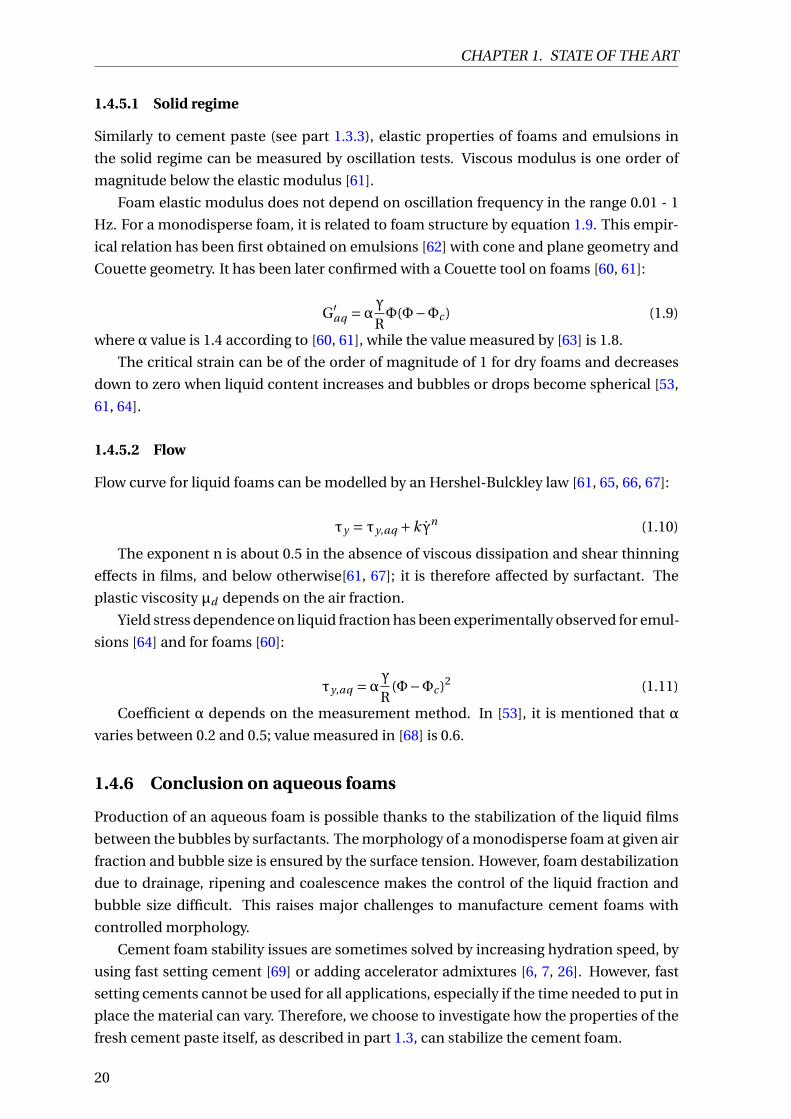
1.4.5.1 Solid regime
Similarly to cement paste (see part 1.3.3), elastic properties of foams and emulsions in
the solid regime can be measured by oscillation tests. Viscous modulus is one order of
magnitude below the elastic modulus [61].
Foam elastic modulus does not depend on oscillation frequency in the range 0.01 - 1
Hz. For a monodisperse foam, it is related to foam structure by equation 1.9. This empir-
ical relation has been first obtained on emulsions [62] with cone and plane geometry and
Couette geometry. It has been later confirmed with a Couette tool on foams [60, 61]:
G′aq = αγ
RΦ(Φ−Φc ) (1.9)
where α value is 1.4 according to [60, 61], while the value measured by [63] is 1.8.
The critical strain can be of the order of magnitude of 1 for dry foams and decreases
down to zero when liquid content increases and bubbles or drops become spherical [53,
61, 64].
1.4.5.2 Flow
Flow curve for liquid foams can be modelled by an Hershel-Bulckley law [61, 65, 66, 67]:
τy = τy,aq +kγn (1.10)
The exponent n is about 0.5 in the absence of viscous dissipation and shear thinning
effects in films, and below otherwise[61, 67]; it is therefore affected by surfactant. The
plastic viscosity µd depends on the air fraction.
Yield stress dependence on liquid fraction has been experimentally observed for emul-
sions [64] and for foams [60]:
τy,aq = αγR
(Φ−Φc )2 (1.11)
Coefficient α depends on the measurement method. In [53], it is mentioned that α
varies between 0.2 and 0.5; value measured in [68] is 0.6.
1.4.6 Conclusion on aqueous foams
Production of an aqueous foam is possible thanks to the stabilization of the liquid films
between the bubbles by surfactants. The morphology of a monodisperse foam at given air
fraction and bubble size is ensured by the surface tension. However, foam destabilization
due to drainage, ripening and coalescence makes the control of the liquid fraction and
bubble size difficult. This raises major challenges to manufacture cement foams with
controlled morphology.
Cement foam stability issues are sometimes solved by increasing hydration speed, by
using fast setting cement [69] or adding accelerator admixtures [6, 7, 26]. However, fast
setting cements cannot be used for all applications, especially if the time needed to put in
place the material can vary. Therefore, we choose to investigate how the properties of the
fresh cement paste itself, as described in part 1.3, can stabilize the cement foam.
20

CHAPTER 1. STATE OF THE ART
1.5 Complex foams and bubble suspensions
We have seen in section 1.3 that a cement paste is a suspension of solid grains and that it
behaves as a yield stress fluid. To investigate how this can affect the foam stabiliy, we first
focus on granular foams (parts 1.5.1 and 1.5.2), and then on the effect of yield stress (part
1.5.3).
1.5.1 Hydrophobic particles
Ramsden in 1904 [70] and Pickering in 1907 [71] studied respectively foams and emulsions
containing particles and reported a very good stability. Best stability is achieved when
contact angle θ of air-liquid interface on the solid surface is close to 90° (see example on
Fig. 1.10).
Figure 1.10: Effect of the addition hydrophobised Ballotini beads on the stability of aqueous foam.
Half life ratio is (tpar t − taq )/taq where tpar t is the half life duration of the foam with particles and
taq the half life of the aqueous foam. Graph taken from [72]
This remarkable stability is achieved thanks to the adsorption of the particles at air-
liquid interface [56, 73, 74]. Note that for partially hydrophobic particle adsorption to
occur, the particles must be small enough to be able to diffuse to the interface within the
time of the experiment. In addition, adsorption barrier, due for instance to electrostatic
repulsion between interface and particle, must be small enough [56]. When these con-
ditions are fulfilled and a spherical particle of radius a reaches the interface, desorption
energy is given by [73]:
EDes = γa2π(1−|cosθ|)2 (1.12)
Desorption energy is maximal and equal to γa2π when θ= 90°, drops to γa2π/4 when
θ = 60° and is equal to zero for fully hydrophilic (θ = 0°) or fully hydrophobic (θ = 180°)
particles.
Let us first mention that experiments have showed that adsorbed spherical particle
monolayer can stop the propagation of a hole in the film [75].
21

CHAPTER 1. STATE OF THE ART
Besides, particles tend to prevent the formation of holes in the film. Coalescence is
avoided when adsorbed particles in films can stop the reduction of liquid film thickness
to zero. The critical pressure which leads to zero film thickness depends on the configu-
ration of the particles in the film. It has been theoretically calculated for a closely packed
single layer and double layer of spherical particles [73, 76] (see illustration of configu-
rations in Fig 1.11). For both configurations, calculated critical pressure is higher when
θ = 0° and decreases with contact angle. Film ruptures if (1) particles desorb or (2) film
thickness between the adsorbed particles reaches zero. Combination of these two condi-
tions leads to an optimal contact angle for film stability for each configuration: 70° for a
single layer of particles and 86° for a double layer [76].
Figure 1.11: Left: illustration of double layer (A) and single layer (B) of particles [56]. Right: Di-
mensionless pressure leading to film rupture [77]
Several authors have studied foams stabilization with colloidal particles [78, 79, 80],
with diameter ranging from several 10 nm to a few 100 nm. Van der Waals and electro-
static attractions between particles lead to the formation of agglomerates in the films
which can enhance film stability. One possible explanation is the increase of the criti-
cal pressure at which the film thickness is zero due to a 3D organisation of the particles
in the films [76, 80]. Gautier et al.[78] also observed the stabilization of foams with inter-
faces weakly covered by particles and suggested that this stability is due to the formation
of patches of particles at contact areas between the bubbles.
In addition to reducing the risk of coalescence, adsorbed particles around a bubble
can prevent gas dissolution into liquid phase and gas transfer to the neighboring bubbles.
Ripening is stopped at one of the two following conditions:
• The overpressure inside the bubbles becomes zero: Pg as−Pl i q = 0, or in other words,
the macroscopic surface tension of the interface with particles becomes zero [56].
Observations of the shape of the bubbles [81, 82] and numerical simulations [83]
showed that when the size of an armored bubble decreases, its shape does not re-
main spherical, as shown in Fig. 1.12. When the bubble deforms, the shape of the
air-liquid interface between the particles also changes: it takes the form of a sad-
dle, with average curvature zero, which, as shown by Laplace’s law (equation 1.3),
cancels the overpressure [83].
22

CHAPTER 1. STATE OF THE ART
• Decrease of bubble volume leads to a decrease of gas pressure: dPg as/dR > 0. This
condition is fulfilled when the adsorbed particles form an elastic shell of elastic
modulus Es = −Σdγ/dΣ with Σ = 2πR2 and when this elastic modulus fulfills to
Gibbs criterion, Es > 2γ [79, 84].
Figure 1.12: Images of deformed armored bubbles at two different particle-bubble size ratio:
faceted shape for a/R = 0.19 (C) and crumpled shape for a/R = 0.008 (D). Scale bars are 8 µm
long [83].
How can particle adsorption at interfaces be used to prepare cement foams? A solu-
tion succesfully implemented by Krämer et al. [4, 21] is the use of hydrophobized nanosil-
ica particles in the precursor foams. We can also wonder in which conditions cement
grains can themselves stabilize the interfaces. It has been shown that adsorption barrier
is proportional to the radius of curvature of the edge of the particles [56]. In this extent,
cement grains, due to their irregular shape, are good candidates to adsorb at interfaces.
In addition, adsorption barrier is reduced when electrolyte concentration is high, which
is the case in cement paste interstitial solution. However, using cement grains to stabilize
the interfaces requires to make them hydrophobic.
In practice, hydrophobization of solid particles can be achieved by the adsorption of
surfactants. The review [85] describes adsorption mechanisms of ionic and non-ionic
surfactants on solid surfaces. In the case of ionic surfactant in presence of an oppositely
charged solid surface, adsorption takes place in two phases. At low surfactant concentra-
tions, surfactant charged head is oriented to the solid surface, and hydrophobic tail, to the
solution (see Fig. 1.13, (b)). In this regime, contact angle θ increases which increasing sur-
factant concentration until a maximal value. In the second regime, surfactant molecule
agglomerate on the solid surface. Hydrophilic heads of adsorbed molecules in the second
layer are directed toward the solution; thus, contact angle decreases when surfactant con-
centration increases (see Fig. 1.13, (c)). Contact angle of the solid particles can therefore
be monitored by surfactant concentration.
In the case of cement, adsorption for anionic surfactant is higher than cationic sur-
factant [48, 86]. When anionic surfactant concentration increases, cement grain contact
23

CHAPTER 1. STATE OF THE ART
Figure 1.13: Mechanism of cationic surfactant adsorption at the surface of negatively charged sil-
ica beads. Blue and red circles represent respectively negative and positive charges [86].
angle increases up to a maximal value and then decreases [48, 86]. Petit et al. [86] ob-
served that hydrophobic cement grains do adsorb at the surface of bubbles rising in a
cement paste. How they affect foam stability remains to be investigated.
1.5.2 Hydrophilic particles
Hydrophilic particles, i.e. θ = 0°, remain in bulk aqueous solution and do not adsorb at
interfaces. Experiments showed that the presence of particles increases the life time of a
foam. In particular, they decrease drainage velocity. A small reduction of ripening rate has
also been observed, but its was interpreted as a consequence of the higher liquid content
in the foam due to the slower drainage [87].
Fig. 1.14 summarizes several experiments where the drainage of model granular foams
has been measured. These foams have been prepared from a suspension of hydrophilic
beads of uniform size and same density of aqueous phase.
Figure 1.14: Left: Drainage behavior of hydrophilic particle foams. λ is the ratio of the sizes of the
particles and of the Plateau borders, φp the particle volume fraction in the continuous phase and
φp (0) its value forλ→ 0 [88]. Right: Illustration of sphere packing in a Plateau border section: solid
volume fractions in the corners and against the walls are smaller than the bulk volume fraction
[89].
24

CHAPTER 1. STATE OF THE ART
Drainage behavior depends onλ, the ratio of the particle size to the Plateau border size
rPB, i.e. the radius of the biggest particles which can enter the Plateau borders. Relation
of λwith liquid fraction has been obtained by numerical simulations for 0. λ. 0.26 [90]:
λ= a
RBP=
0.27√Φl +3.17Φ2.75
l
1+0.57Φ0.27l
(1.13)
When λ. 1, the particles are not individually stuck in the foams. Therefore, particles
can flow in the Plateau borders and nodes together with the liquid. The drainage veloc-
ity decreases when particle volume fraction increases and is stopped when φp reaches a
critical value φcr i tp which decreases when size ratio λ increases. For a given λ, effect of
particle fraction on suspension viscosity µ can be fitted with a Krieger-Dougherty law:
µ(Φp ) =µl i q
(1− φp
φcr i tp
)−2.5φcr i tp
(1.14)
where µl i q is the viscosity of the liquid phase of the suspension. Dependence of φcr i tp
on lambda is a consequence of the specific shape of the Plateau borders and nodes in the
foam. As illustrated by the schema on the right of Fig. 1.14, the beads cannot fill the whole
volume. Excluded volume, in the corners and near the walls, increases with increasing
bead size.
Stopping drainage with hydrophilic particles is facilitated when particles size increases
up to λ∼ 1. However, when λ exceeds 1, the particles remain stuck in the nodes, and the
liquid is free to move between the bubbles and the particles. Thus, drainage rate increases
again [91].
This study on a model solid suspensions highlights the major effect of particle critical
packing fraction. Critical packing fraction is expected to be affected by the particle shape,
the surface properties and distribution. To implement drainage arrest with cement grains,
the main issue would be to identify critical packing fraction and how it is affected by bub-
ble size. A decrease of drainage rate caused by confinement has already be reported in
foams containing coal fly ash particles [87] and clay nanoparticles [92].
Foams containing colloidal particles have also been investigated [93]. In this case
however, the authors suggest that drainage stabilization is due to the presence of a yield
stress in the colloidal suspension. Let us now focus on this point.
1.5.3 Yield stress fluid
As already mentioned, yield stress fluids do not flow when the stress they undergo is below
the yield stress. Therefore, to understand how the yield stress can stabilize the foam, yield
stress must be compared with the yield stress at stake during destabilization.
Regarding ripening, as we have seen in paragraph 1.4.4.3, destabilization is driven by
capillary pressure. Thus, ripening of a foamy yield stress fluid should stop if yield stress
is the same order of magnitude as the capillary pressure difference between the bubbles.
The critical yield stress to stop ripening is therefore [94]:
25

CHAPTER 1. STATE OF THE ART
τc,r ∼ γ
R(1.15)
To estimate the stresses leading to drainage, authors have compared the Plateau bor-
ders and nodes to a porous medium whose pore size can be estimated by rPB. Drainage is
expected to stop when the yield stress reaches a critical value [93, 94]:
τc,d ∼ ρg rPB (1.16)
where ρ is the density of the continuous phase. Drainage prevention due to yield stress
has been experimentally observed by Goyon et al.[95], who have successfully created foams
with constant air volume fraction (71%) over the sample height, stable for several hours
(ripening was stopped by using low-solubility gas).
In addition, the presence of a yield stress makes the existence of bubble suspensions
possible, with a stability of several hours. Indeed, bubble cannot rise if the buoyancy
force Fbuoy anc y = 4/3ρgπR3 is compensated by the drag force due to suspending fluid
yield stress Fdr ag = CdτyπR2. Cd is a coefficient which depends on the geometry of the
moving object and on the surface properties. The minimum yield stress to avoid bubble
rising is therefore:
τc,buoy anc y =4Rρg
3Cd(1.17)
The value measured for a smooth sphere is Cd = 6.7 [96]. With ρ≈ 2000 kg/m3 for ce-
ment paste, calculated values are τc,buoy anc y ≈ 4 Pa if R = 1 mm and τc,buoy anc y ≈ 0.04 Pa
if R = 10 µm.
Therefore, the presence of a yield stress in cement paste, mortar or concrete explains
why cement foams described in the literature can possess air content as low as 10% or
20% and still be stable.
1.5.4 Rheology of complex foams and bubble suspensions
Rheological behavior of foams described in part 1.4.5 is strongly affected by the rheologi-
cal properties of the continuous phase.
1.5.4.1 Aerated yield stress fluids
The elastic modulus and the yield stress of aerated yield stress fluids have been studied
both in the case of high air content (85 to 95%) and low air content (below 50%). Measure-
ments and model of the reduced elastic modulus (i.e. normalized by the elastic modulus
of the continuous phase G’i nt ) are shown in Fig. 1.15.
At given volume fraction, reduced elastic modulus depends on the elastic capillary
number Cael , which accounts for the deformability of the bubbles compared to the sur-
rounding continuous phase and is defined by1:
1Note that in reference [99] related to bubble suspensions, definition of elastic modulus differs from this
definition by a factor 2: Cael = RG′0/(2γ).
26

CHAPTER 1. STATE OF THE ART
Figure 1.15: Elastic modulus of aerated yield stress fluids, normalized by the elastic modulus of the
continuous phase, as a function of the volume fraction of the dispersed phase. Graph reproduced
from [97]; it summarizes data from [97] for emulsion foams (filled squares), from [98] for gelatine
foams (empty squares), from [99] for bubbles suspensions in emulsions (circles) and from [100]
for liquid droplet in silicone gel (empty diamonds).
Cael =RG′
i nt
γ(1.18)
At low air content, measurements of bubble suspension elastic modulus fit well with
a theoretical prediction from [101]. The suspension elastic modulus decreases when air
volume fraction increases for deformable bubbles, i.e. for large values of bubble radius or
continuous phase elasticity, so that Cael > 1/2 [99]. When bubbles are non-deformable
Cael < 1/2, suspension elastic modulus is expected to increase with air content. This
effect has not been experimentally measured with bubbles but has been observed with
small drops [100].
At high air content, macroscopic elasticity is a sum of the contribution of the bubbles
G′aq (see equation 1.9), the contribution of the elasticity of the interstitial fluid G′
sk and a
coupling term ψ [97]. The contribution of the interstitial fluid G′sk is given by Gibson and
Ashby relation [102]:
G′sk ≈ G′
i nt (1−Φ)2 (1.19)
The coupling termψ accounts for the deformation of bubbles due to embedding elas-
tic fluid. An empirical relation has been proposed by [97] as a function of elastic capillary
number and air fraction. ψ→ 0 whenΦ→ 0, i.e. when the volume of the suspending fluid
is very low. In fact, when air fraction is very high, yield stress fluid foam behaves like a
dry aqueous foam. ψ/G′i nt → 0 for large values of G′
i nt , that is to say that when the con-
tribution of the capillary effect becomes negligible compared to interstitial elasticity, the
contribution of the skeleton G′sk is the main term, like in solid foams.
Yield stress of aerated yield stress fluids has also raised attention. It is affected by the
27

CHAPTER 1. STATE OF THE ART
Bingham capillary number, defined by2:
Cay =Rτy,i nt
γ(1.20)
For low air contentΦ< 50%, behavior of indeformable bubbles (Cay → 0) and fully de-
formable bubble (Cay →∞) have both been determined theoretically [101] as a function
of the air content. The curves have been obtained experimentally in oil-in-water emul-
sion, respectively for Cay . 0.22 and Cay = 1.1 [99]. Theoretical curves and experimental
points are shown in Fig. 1.16. Non-deformable bubbles hardly change the yield stress of
the suspension for air fractions up to 50%, whereas in the case of deformable bubbles,
yield stress decreases when air volume content increases.
Figure 1.16: Yield stress of bubble suspensions in yield stress fluids. Measurements for Cay . 0.22
(grey points) and Cay = 1.1 (blue triangles) and theoretical curves for Cay → 0 (solid line) and
Cay →∞ (dotted line) [99].
In the foam regime, i.e. at high air content, macroscopic yield stress is related to Bing-
ham capillary number and to air fraction by the following empirical relation [97]:
τy, f oam(Φ)
τy,aq (Φ)= 1+ c(1−Φ)4/3Ca2/3
y (1.21)
where c = 110 is a fitting parameter.
1.5.4.2 Granular foams
The case of granular foams containing hydrophilic particles has also been investigated.
Elastic modulus and yield stress were measured after drainage of the foams. In particu-
lar, in the case of small particles (λ< 1), particle volume fraction in the continuous phase
is equal to the maximal packing fraction φp = φcr i tp . Size effects, described in part 1.5.2
on the drainage of granular foams, have a notable consequence on the rheological prop-
erties of the foams [63]. When the particle size a is much bigger than the bubble size,
aqueous foam behaves like a continuous medium at the scale of the particles [63, 68]. As
2Definition used in [99] is Cay = Rτy,i nt /(2γ).
28

CHAPTER 1. STATE OF THE ART
a consequence, the granular foam rheological properties fit well with the properties of a
yield stress fluid (i.e. the aqueous foam) reinforced by particles. On the other hand, when
λ¿ 1, the small particles stuck in the Plateau borders and nodes can be considered as
a continuous granular structure [68, 103]. As λ increases between those two asymptotic
behaviors, the number of particles in the Plateau border decreases and reaches zero when
λ≈ 1. Illustration of the particle configurations for increasing values of λ are shown in Fig
1.17.
Figure 1.17: Images of granular foams for R = 225 µm and increasing particle radius. (a) a = 5 µm,
(b) strings of particles a = 20µm, (c) isolated particles in foam nodes a = 40µm, and (d) isolated
large particles embedded in foam a = 250 µm [63].
At given particle and air volume fractions, the biggest values of elastic modulus and
yield stress are obtained for the small particles. Let us deal now with this small particle
regime. Elastic modulus and yield stress curve do not depend on particle size as long as
a/R . 0.05 [68, 103]. They are given by the same equations as yield stress fluid foams.
Elasticity and yield stress of the granular phase are obtained as the only fitting param-
eters in equations 1.19 and 1.21, their respective values are G′i nt = 150 kPa [103] and
τy,i nt = 120 Pa [68]. Note that coupling term was not taken into account for the calcu-
lation of G′i nt , but it is expected to be negligible at this high value of the interstitial elastic
modulus. These values of the interstitial elasticity and yield stress correspond to a dense
granular material under confinement pressure 400 Pa, which is the order of magnitude
of the pressure exerted by the bubbles on the continuous phase in the reported studies
[63, 68, 103].
This analysis of the behavior of complex foams shows that, in the case of cement
foams, interstitial cement paste is expected to strongly improve the stability of the foam
compared to aqueous foam. Indeed, drainage is strongly reduced in the presence of yield
stress or hydrophilic particles. Regarding coalescence, a proper choice of surfactant or the
use of hydrophobic particles is required. Lastly, ripening can be stopped by the presence
of yield stress or hydrophobic particles. Besides, cement paste rheological properties and
29

CHAPTER 1. STATE OF THE ART
particle content is promising to increase the yield stress and elastic modulus of the foams.
In addition, thanks to cement paste yield stress, aerated materials can be prepared with
small air fractions.
1.6 Conclusion
Cement foams properties are mainly related to their density, but also to their formula-
tion and preparation protocol. To study how they are affected by pore configuration, ce-
ment foams with well controlled morphological properties must be produced. Mixing
well controlled precursor foam with cement paste seems to be a promising manufacturing
method. However, the structure of fresh cement foam is endangered by three destabiliza-
tion mechanisms, encountered in all liquid foams: drainage because of gravity, Ostwald
ripening due to pressure differences between the bubbles, and coalescence when a liquid
film ruptures. Comparison of studies on liquid and complex foams shows that cement
paste characteristics offer promising hints to stop or slow down destabilization.
First, the presence of a high interstitial yield stress in foams can stop drainage and
ripening. The interstitial yield stress is expected to depend on the water-to-cement ratio.
Similarly to concrete admixtures, surfactant adsorption on cement grains is expected to
modify the yield stress. This effect is the subject of chapter 2.
Second, particles have a strong effect on foam stability. Hydrophilic particles can slow
down and stop drainage. Hydrophobic particles, on the other hand, adsorb at interfaces
and can avoid ripening and coalescence. For the implementation of cement particles
as stabilizers, we therefore have to monitor cement grain surface properties by choosing
adequate surfactant and concentration. We will discuss this aspect in chapters 4 and 5.
We have reviewed literature studies about the rheology of aqueous and complex foams.
They show that yield stress and elastic modulus of aerated yield stress fluid or particle
foams depend on the rheological properties of the continuous phase and on the charac-
teristics of the bubbles (size, volume fraction and surface tension). This analysis will be
used in the following chapters for two points. In chapter 3, we will compare the measured
yield stress of aerated cement pastes, prepared with two different surfactants, with yield
stress of a model aerated yield stress fluid. In chapter 4, rheological measurement of fresh
cement foams will be used to assess the properties of the interstitial cement paste.
Bibliography
[1] A. Just and B. Middendorf, “Microstructure of high-strength foam concrete,” Mate-
rials Characterization, vol. 60, pp. 741–748, 2009. 5, 7
[2] X. Qu and X. Zhao, “Previous and present investigations on the components, mi-
crostructure and main properties of autoclaved aerated concrete - a review,” Con-
struction and Building Materials, vol. 135, pp. 505–516, 2017. 5, 6
30

CHAPTER 1. STATE OF THE ART
[3] N. Narayanan and K. Ramamurthy, “Structure and properties of aerated concrete:
a review,” Cement & Concrete Composites, vol. 22, pp. 321–329, 2000. 5, 8
[4] C. Kramer, M. Schauerte, T. Kowald, and R. Trettin, “Three-phase-foams for foam
concrete application,” Materials Characterization, vol. 102, pp. 173–179, 2015. 5, 23
[5] S. I. Al-Noury, W. H. Mirza, and S. Huq, “Density and strength characteristics of
lightweight mortar,” Cement & Concrete Composites, vol. 12, 1990. 5
[6] Z. Pan, H. Li, and W. Liu, “Preparation and characterization of super low density
foamed concrete from Portland cement and admixtures,” Construction and Build-
ing Materials, vol. 72, pp. 256–261, 2014. 5, 20
[7] Z. Huang, T. Zhang, and Z. Wen, “Proportioning and characterization of Portland
cement-based ultra-lightweight foam concretes,” Construction and Building Mate-
rials, vol. 79, pp. 390–396, 2015. 5, 7, 8, 20
[8] L. Du and K. Folliard, “Mechanisms of air-entrainment in concrete,” Cement and
Concrete Research, vol. 35, pp. 1463–1471, 2005. 5, 13
[9] M. Kilgys, A. Laukaitis, M. Sinica, and G. Sezemanas, “The influence of some surfac-
tants on porous concrete properties,” Materials science, vol. 13, no. 4, pp. 310–316,
2007. 5, 13
[10] H. Atahan, J. C. Carlos, S. Chae, P. Monteiro, and J. Bastacky, “The morphology of
entrained air voids in hardened cement paste generated with different anionic sur-
factants,” Cement & Concrete Composites, vol. 30, pp. 566–575, 2008. 5, 13
[11] F. Akthar and J. Evans, “High porosity (<90%) cementitious foams,” Cement and
Concrete Research, vol. 40, pp. 352–358, 2010. 5, 6
[12] H. Weigler and S. Karl, “Structural lightweight aggregate concrete with reduced
density - lightweight aggregate foamed concrete,” The International Journal of
Lightweight Concrete, vol. 2, no. 2, pp. 101–104, 1980. 5, 6, 7, 13
[13] E. Kunhanandan Nambiar and K. Ramamurthy, “Influence of filler type on the prop-
erties of foam concrete,” Cement & Concrete Composites, vol. 28, pp. 475–480, 2006.
6, 7
[14] M. Jones and A. McCarthy, “Utilising unprocessed low-lime coal fly ash in foamed
concrete,” Fuel, vol. 84, pp. 1398–1409, 2005. 6, 7
[15] A. Hilal, N. Thom, and A. Dawson, “On entrained pore size distribution of foamed
concrete,” Construction and Building Materials, vol. 75, pp. 227–233, 2015. 6
[16] R. Rixom and N. Mailvaganam, Chemical Admixtures for Concrete. E. & F.N. Spon
Ltd, 3rd ed. ed., 1999. p106+. 6, 8, 13
31

CHAPTER 1. STATE OF THE ART
[17] T. D. Tonyan and L. J. Gibson, “Structure and mechanics of cement foams,” Journal
of Material Science, vol. 27, pp. 6371–6378, 1992. 6, 7
[18] A. M. Abd and S. M. Abd, “Modelling the strength of lightweight foamed concrete
using support vector machine (svm),” Case Studies in Construction Materials, vol. 6,
pp. 8–15, 2017. 6, 7
[19] D. Falliano, D. De Domenico, G. Ricciardi, and E. Gugliandolo, “Experimental in-
vestigation on the compressive strength of foamed concrete: Effect of curing con-
ditions, cement type, foaming agent and dry density,” Construction and Building
Materials, vol. 165, pp. 735–749, 2018. 6, 7
[20] G. Yakovlev, J. Keriene, A. Gailius, and I. Girniene, “Cement based foam concrete
reinforced by carbon nanotubes,” Materials science, vol. 12, no. 2, pp. 147–151, 2006.
6
[21] C. Krämer, M. Schauerte, T. Müller, S. Gebhard, and R. Trettin, “Application of re-
inforced three-phase-foams in UHPC foam concrete,” Construction and Building
Materials, vol. 131, pp. 746–757, 2017. 6, 23
[22] G. Hoff, “Porosity-strength considerations for cellular concrete,” Cement and Con-
crete Research, vol. 2, pp. 91–100, 1972. 7
[23] E. P. Kearsley and P. J. Wainwright, “The effect of porosity on the strength of foamed
concrete,” Cement and Concrete Research, vol. 32, pp. 233–239, 2002. 7
[24] K. Ramamurthy, E. Kunhanandan Nambiar, and G. Indu Siva Ranjani, “A classifi-
cation of studies on properties of foam concrete,” Cement & Concrete Composites,
vol. 31, pp. 388–396, 2009. 7
[25] A. Hajimohammadi, T. Ngo, and P. Mendis, “Enhancing the strength of pre-made
foams for foam concrete applications,” Cement and Concrete Composites, vol. 87,
pp. 164–171, 2018. 7
[26] J. Jiang, Z. Lu, Y. Niu, J. Li, and D. Zhang, “Study on the preparation and properties
of high-porosity foamed concretes based on ordinary Portland cement,” Materials
and Design, 2015. 7, 20
[27] G. Samson, Synthèse et propriétés des mousses minérales. PhD thesis, INSA de
Rennes, 2015. 7
[28] O. Hussein, S. A. Bernal, and J. L. Provis, “Bubble stabilisation improves strength of
lightweight mortars,” 37th Cement and Concrete Science Conference, 2017. 7
[29] G. Samson, A. Phelipot-Mardelé, and C. Lanos, “A review of thermomechanical
properties of lightweight concrete,” Magazine of Concrete Research, vol. 69, no. 4,
pp. 201–216, 2016. 7, 8
32

CHAPTER 1. STATE OF THE ART
[30] G. Samson, M. Cyr, and X. X. Gao, “Thermomechanical performance of blended
metakaolin - GGBS alkali-activated foam concrete,” Construction and Building Ma-
terials, vol. 157, pp. 982–993, 2017. 8
[31] P.-C. Aïtcin, “Entrained air in concrete: rheology and freezing resistance,” in Science
and Technology of Concrete Admixtures (P.-C. Aïtcin and R. J. Flatt, eds.), pp. 87–95,
Woodhead publishing, 2016. 8
[32] R. M. Ahmed, N. E. Takach, U. M. Khan, S. Taoutaou, S. James, A. Saasen, and
R. Godoy, “Rheology of foamed cement,” Cement and Concrete Research, vol. 39,
pp. 353–361, 2009. 8
[33] P. Aïtcin, “Phenomenology of cement hydration,” in Science and technology of con-
crete admixtures (P. Aïtcin and R. Flatt, eds.), pp. 15–25, Woodhead Publishing, 2016.
9
[34] N. Roussel, A. Lemaître, R. J. Flatt., and P. Coussot, “Steady state flow of cement
suspensions: A micromechanical state of the art.,” Cement and Concrete Research,
vol. 40, pp. 77–84, 2010. 9, 10
[35] N. Roussel, G. Ovarlez, S. Garrault, and C. Brumaud, “The origins of thixotropy in
fresh cement pastes,” Cement and Concrete Research, vol. 42, pp. 148–157, 2012. 9,
11, 12
[36] F. Mahaut, S. Mokéddem, X. Chateau, N. Roussel, and G. Ovarlez, “Effect of coarse
particle volume fraction on the yield stress and thixotropy of cementitious materi-
als,” Cement and Concrete Research, vol. 38, pp. 1276–1285, 2008. 9, 11
[37] P. Coussot, Rhéophysique - La matière dans tous ses états. EDP Sciences/CNRS Edi-
tions, 2012. 10, 11
[38] R. J. Flatt and P. Bowen, “Yodel: a yield stress model for suspensions,” Journal of the
American Ceramic Society, vol. 89, no. 4, pp. 1244–1256, 2006. 10
[39] R. J. Flatt and I. Schober, “Superplasticizer and the rheology of concrete,” in Under-
standing the rheology of concrete (N. Roussel, ed.), pp. 144–208, Woodhead publish-
ing, 2012. 10
[40] N. Roussel, “A thixotropy model for fresh fluid concretes: Theory, validation and
applications,” Cement and Concrete Research, vol. 36, pp. 1797–1806, 2006. 10
[41] O. H. Wallevik, D. Feys, J. E. Wallevik, and K. H. Khayat, “Avoiding inaccurate inter-
pretations of rheological measurements for cement-based materials,” Cement and
Concrete Research, vol. 78, pp. 100–109, 2015. 10, 11
[42] J. E. Wallevik, “Thixotropic investigation on cement paste: Experimental and nu-
merical approach,” Journal of Non-Newtonian Fluid Mechanics, vol. 132, pp. 86–99,
2005. 11
33

CHAPTER 1. STATE OF THE ART
[43] G. Gelardi, S. Mantellato, D. Marchon, M. Palacios, A. Eberhardt, and R. J. Flatt.,
“Chemistry of chemical admixtures,” in Science and Technology of Concrete Admix-
tures (P.-C. Aïtcin and R. J. Flatt, eds.), pp. 149–218, Woodhead publishing, 2016. 12,
13
[44] D. Marchon and R. J. Flatt, “Impact of chemical admixtures on cement hydration,”
in Science and Technology of Concrete Admixtures (P.-C. Aïtcin and R. J. Flatt, eds.),
pp. 414–432, Woodhead publishing, 2016. 12
[45] C. Jolicoeur, T. To, T. Nguyen, R. Hill, and M. Pagé, “Mode of action of anionic sur-
factants for air entrainment in cement pastes w-w/o fly ash,” in 2009 World of Coal
Ash (WOCA) Conference - May 4-7, 2009 in Lexington, KY, USA, 2009. 13
[46] E. P. Kearsley and P. J. Wainwright, “The effect of high fly ash content on the com-
pressive strength of foamed concrete,” Cement and Concrete Research, vol. 31,
pp. 105–112, 2001. 13
[47] H. Uchikawa, S. Hanehara, T. Shirasaka, and D. Sawaki, “Effect of admixture on
hydration of cement, adsorptive behavior of admixture and fluidity and setting of
fresh cement paste,” Cement and Concrete Research, vol. 22, pp. 1115–1129, 1992.
13
[48] T. Zhang, S. Shang, F. Yin, A. Aishah, A. Salmiah, and T. Ooi, “Adsorptive behavior of
surfactants on surface of Portland cement,” Cement and Concrete Research, vol. 31,
pp. 1009–1015, 2001. 13, 23, 24
[49] P. J. Andersen, “The effect of superplasticizers and air-entraining agents on the zeta
potential of cement particles,” Cement and Concrete Research, vol. 16, pp. 931–940,
1986. 13
[50] E. Gueit, E. Darque-Ceretti, P. Tintiller, and M. Horgnies, “Influence de tensioactifs
sur l’hydratation du ciment à l’interface béton-coffrage,” in Matériaux 2010, 2010.
13
[51] S. Wei, Z. Yunsheng, and M. Jones, “Using the ultrasonic wave transmission method
to study the setting behavior of foamed concrete,” Construction and Building Ma-
terials, vol. 51, pp. 62–74, 2014. 13
[52] E. Kuzielová, L. Pach, and M. Palou, “Effect of activated foaming agent on the foam
concrete properties,” Construction and Building Materials, vol. 125, pp. 998–1004,
2016. 13
[53] I. Cantat, S. Cohen-Addad, F. Elias, F. Graner, R. Höhler, O. Pitois, F. Rouyer, and
A. Saint-Jalmes, Foams - Structure and dynamics. Oxford University Press, 2013. 14,
15, 16, 17, 18, 20
[54] P. Stevenson, ed., Foam Engineering: Fundamentals and Applications. John Wiley &
Sons, 2012. 14
34

CHAPTER 1. STATE OF THE ART
[55] B. Cabane and S. Hénon, Liquides - Solutions, dispersions, émulsions, gels. Belin,
2007. 14
[56] S. Tcholakova, N. D. Denkov, and A. Lips, “Comparison of solid particles, globu-
lar proteins and surfactants as emulsifiers,” Physical Chemistry Chemical Physics,
vol. 10, pp. 1608–1627, 2008. 15, 19, 21, 22, 23
[57] A. Saint-Jalmes, “Physical chemistry in foam drainage and coarsening,” Soft Matter,
vol. 2, pp. 836–849, 2006. 18, 19
[58] A.-L. Biance, A. Delbos, and O. Pitois, “How topological rearrangements and liquid
fraction control liquid foam stability,” Physical Review Letters, vol. 106, p. 068301,
2011. 18
[59] O. Pitois, “Foam ripening,” in Foam Engineering: Fundamentals and Applications
(P. Stevenson, ed.), pp. 59–73, John Wiley & Sons, 2012. 19
[60] A. Saint-Jalmes and J. Durian, “Vanishing elasticity for wet foams: Equivalence with
emulsions and role of polydispersity,” Journal of Rheology, vol. 43, p. 1411, 1999. 19,
20
[61] S. Cohen-Addad and R. Höhler, “Rheology of foams and highly concentrated emul-
sions,” Current opinion in Colloid & Interface Science, vol. 19, pp. 536–548, 2014. 19,
20
[62] T. G. Mason, J. Bibette, and D. A. Weitz, “Elasticity of compressed emulsions,” Phys-
ical Review Letters, vol. 75, no. 10, pp. 2051–2054, 1995. 20
[63] F. Gorlier, Y. Khidas, and O. Pitois, “Elasticity of particle-loaded liquid foams,” Soft
Matter, vol. 13, pp. 4533–4540, 2017. 20, 28, 29
[64] T. G. Mason, J. Bibette, and D. A.Weitz, “Yielding and flow of monodisperse emul-
sions,” Journal of Colloid and Interface Science, vol. 179, pp. 439–448, 1996. 20
[65] H. M. Princen and A. D. Kiss, “Rheology of foams and highly concentrated emul-
sions. iv an experimental study of the shear viscosity and yield stress,” Journal of
Colloid and Interface Science, vol. 128, no. 1, pp. 176–186, 1989. 20
[66] N. D. Denkov, S. Tcholakova, K. Golemanov, K. P. Ananthapadmanabhan, and
A. Lips, “Viscous friction in foams and concentrated emulsions under steady shear,”
Physical Review Letter, vol. 100, p. 138301, 2008. 20
[67] S. Tcholakova, N. D. Denkov, K. Golemanov, K. P. Ananthapadmanabhan, and
A. Lips, “Theoretical model of viscous friction inside steadily sheared foams and
concentrated emulsions,” Physical Review E, vol. 78, p. 011405, 2008. 20
[68] F. Gorlier, Y. Khidas, and O. Pitois, “Yielding of complex liquid foams,” Journal of
Rheology, vol. 61, pp. 919–930, 2017. 20, 28, 29
35

CHAPTER 1. STATE OF THE ART
[69] G. Sang, Y. Zhu, G. Yang, and H. Zhang, “Preparation and characterization of
high porosity cement-based foam material,” Construction and Building Materials,
vol. 91, pp. 133–137, 2015. 20
[70] W. Ramsden, “Separation of solids in the surface-layers of solutions and ‘suspen-
sions’ - preliminary account,” Proceedings of the Royal Society of London, vol. 72,
pp. 156–164, 1904. 21
[71] S. U. Pickering, “Emulsions,” Journal of Chemical Society, vol. 91, pp. 2001–2021,
1907. 21
[72] R. Aveyard, B. P. Binks, P. D. I. Fletcher, T. G. Peck, and C. E. Rutherford, “Aspects
of aqueous foams stability in the presence of hydrocarbon oils and solid particles,”
Advances in Colloid and Interface Science, vol. 48, pp. 93–120, 1994. 21
[73] N. D. Denkov, I. B. Ivanov, and P. A. Kralchevski, “A possible mechanism of stabi-
lization of emulsions by solid particles,” Journal of Colloids and Interface Science,
vol. 150, no. 2, pp. 589–593, 1992. 21, 22
[74] B. P. Binks, “Particles as surfactants - similarities and differences,” Current Opinion
in Colloid & Interface Science, vol. 7, pp. 21–41, 2002. 21
[75] Y. Timounay, E. Lorenceau, and F. Rouyer, “Opening and retraction of particulate
soap films,” EPL - Europhysics Letters, vol. 111, no. 2, 2015. 21
[76] G. Kaptay, “On the equation of the maximum capillary pressure induced by solid
particles to stabilize emulsions and foams and on the emulsion stability diagrams,”
Colloids and Surfaces A, vol. 282-283, pp. 387–401, 2006. 22
[77] G. Kaptay and N. Babcsán, “Particle stabilized foams,” in Foam Engineering: Funda-
mentals and Applications (P. Stevenson, ed.), pp. 121–143, John Wiley & Sons, 2012.
22
[78] F. Gautier, M. Destribats, R. Perrier-Cornet, J. Dechézelles, J. Giermanska,
V. Héroguez, S. Ravaine, F. Leal-Calderon, and V. Schmitt, “Pickering emulsions with
stimulable particles: from highly- to weakly-covered interfaces,” Physical Chemistry
Chemical Physics, vol. 9, no. 48, pp. 6455–6462, 2007. 22
[79] A. Stocco, E. Rio, B. Binks, and D. Langevin, “Aqueous foams stabilized solely by
particles,” Soft Matter, vol. 7, no. 4, pp. 1260–1267, 2011. 22, 23
[80] Z. A. Al Yousef, M. A. Almobarky, and D. S. Schechter, “The effect of particle aggrega-
tion on surfactant foam stability,” Journal of Colloid and Interface Science, vol. 511,
pp. 365–373, 2018. 22
[81] O. Pitois, M. Buisson, and X. Chateau, “On the collapse pressure of armored bubbles
and drops,” European Physical Journal E, vol. 38, p. 48, 2015. 22
36

CHAPTER 1. STATE OF THE ART
[82] N. Taccoen, F. Lequeux, D. Z. Gunes, and C. N. Baroud, “Probing the mechanical
strength of an armored bubble and its implication to particle-stabilized foams,”
Physical Review X, vol. 6, no. 1, p. 011010, 2016. 22
[83] M. Abkarian, A. B. Subramaniam, S.-H. Kim, R. Larsen, S.-M. Yang, , and H. A.
Stone, “Dissolution arrest and stability of armored bubbles,” Physical Review Let-
ters, vol. 99, p. 188301, 2006. 22, 23
[84] A. Cervantes Martinez, E. Rio, G. Delon, A. Saint-Jalmes, D. Langevin, and B. Binks,
“On the origin of the remarkable stability of aqueous foams stabilised by nanopar-
ticles: link with microscopic surface properties,” Soft Matter, vol. 4, pp. 1531–1535,
2008. 23
[85] S. Paria and K. Khilar, “A review on experimental studies of surfactant adsorption
at the hydrophilic solid-water interface,” Advances in Colloid and Interface Science,
vol. 110, no. 3, pp. 75–95, 2004. 23
[86] P. Petit, I. Javierre, P.-H. Jézéquel, and A.-L. Biance, “Generation and stability of bub-
bles in a cement based slurry,” Cement and Concrete Research, vol. 60, pp. 37–44,
2014. 23, 24
[87] A. Britan, M. Liverts, G. Ben-Dor, S. Koehler, and N. Bennani, “The effect of fine
particles on the drainage and coarsening of foam,” Colloids and Surfaces A., vol. 344,
pp. 15–23, 2009. 24, 25
[88] B. Haffner, Y. Khidas, and O. Pitois, “The drainage of foamy granular suspensions,”
Journal of Colloid and Interface Science, vol. 458, pp. 200–208, 2015. 24
[89] B. Haffner, Y. Khidas, and O. Pitois, “Flow and jamming of granular suspensions in
foams,” Soft Matter, vol. 10, pp. 3277–3283, 2014. 24
[90] N. Louvet, R. Höhler, and O. Pitois, “Capture of particles in soft porous media,”
Physical Review E, vol. 82, p. 041405, 2010. 25
[91] Y. Khidas, B. Haffner, and O. Pitois, “Capture-induced transition in foamy suspen-
sions,” Soft Matter, vol. 10, pp. 4137–4141, 2014. 25
[92] R. Guillermic, A. Salonen, J. Emile, and A. Saint-Jalmes, “Surfactant foams doped
with laponite: unusual behaviors induced by aging and confinement,” Soft Matter,
vol. 5, pp. 4975–4982, 2009. 25
[93] S. Guignot, S. Faure, M. Vignes-Adler, and O. Pitois, “Liquid and particles reten-
tion in foamed suspensions,” Chemical Engineering Science, vol. 65, pp. 2579–2585,
2010. 25, 26
[94] I. Lesov, S. Tcholakova, and N. Denkov, “Factors controlling the formation and sta-
bility of foams used as precursors of porous materials,” Journal of Colloid and In-
terface Science, vol. 426, pp. 9–21, 2014. 25, 26
37

CHAPTER 1. STATE OF THE ART
[95] J. Goyon, F. Bertrand, O. Pitois, and G. ovarlez, “Shear induced drainage in foamy
yield-stress fluids,” Physical Review Letters, vol. 104, p. 128301, 2010. 26
[96] L. Jossic and A. Magnin, “Drag and stability of objects in a yield stress fluid,” AIChE
Journal, vol. 47, no. 12, pp. 2666–2672, 2001. 26
[97] F. Gorlier, Y. Khidas, and O. Pitois, “Coupled elasticity in soft solid foams,” Journal
of Colloid and Interface Science, vol. 501, pp. 103–111, 2017. 27, 28
[98] Y. Khidas, B. Haffner, and O. Pitois, “Critical size effect of particles reinforcing
foamed composite materials,” Composites Science and Technology, vol. 119, pp. 62–
67, 2015. 27
[99] L. Ducloué, O. Pitois, J. Goyon, X. Chateau, and G. Ovarlez, “Rheological behaviour
of suspensions of bubbles in yield stress fluids,” Journal of Non-Newtonian Fluid
Mechanics, vol. 215, pp. 31–39, 2015. 26, 27, 28
[100] R. W. Style, R. Boltyanskiy, B. Allen, K. E. Jensen, H. P. Foote, J. S.Wettlaufer, and E. R.
Dufresne, “Stiffening solids with liquid inclusions,” Nature Physics, vol. 11, pp. 82–
87, 2015. 27
[101] T. L. Nguyen Thi, L. Ducloué, G. Ovarlez, and X. Chateau, “Rhéologie des suspen-
sions de bulles dans un fluide à seuil,” in 21ème Congrès Français de Mécanique,
(Bordeaux, France), August 2013. 27, 28
[102] L. Gibson and M. Ashby, eds., Cellular Solids: Structure and Properties. Cambridge:
Cambridge University Press, 1997. 27
[103] F. Gorlier, Y. Khidas, A. Fall, and O. Pitois, “Optimal strengthening of particle-loaded
liquid foams,” Physical Review E, vol. 95, 2017. 29
38

Chapter 2
Effects of surfactants on the yield stress
of cement paste
Sommaire2.1 Introduction . . . . . . . . . . . . . . . . . . . . . . . . . . . . . . . . . . . . 40
2.2 Background . . . . . . . . . . . . . . . . . . . . . . . . . . . . . . . . . . . . 40
2.2.1 Surfactant molecules in cement paste . . . . . . . . . . . . . . . . . . 40
2.2.2 Foam stability . . . . . . . . . . . . . . . . . . . . . . . . . . . . . . . . 42
2.2.3 Yield stress of solid suspensions . . . . . . . . . . . . . . . . . . . . . 43
2.3 Materials and methods . . . . . . . . . . . . . . . . . . . . . . . . . . . . . . 44
2.3.1 Materials . . . . . . . . . . . . . . . . . . . . . . . . . . . . . . . . . . . 44
2.3.1.1 Cement . . . . . . . . . . . . . . . . . . . . . . . . . . . . . . 44
2.3.1.2 Synthetic cement pore solution . . . . . . . . . . . . . . . . 44
2.3.1.3 Surfactants . . . . . . . . . . . . . . . . . . . . . . . . . . . . 44
2.3.1.4 Cement paste preparation . . . . . . . . . . . . . . . . . . . 44
2.3.2 Methods . . . . . . . . . . . . . . . . . . . . . . . . . . . . . . . . . . . 46
2.3.2.1 Surfactant compatibility with cement pore solution . . . . 46
2.3.2.2 CMC . . . . . . . . . . . . . . . . . . . . . . . . . . . . . . . . 46
2.3.2.3 Yield stress . . . . . . . . . . . . . . . . . . . . . . . . . . . . 46
2.3.2.4 Adsorption . . . . . . . . . . . . . . . . . . . . . . . . . . . . 47
2.3.2.5 Contact angle . . . . . . . . . . . . . . . . . . . . . . . . . . . 47
2.4 Results and discussion . . . . . . . . . . . . . . . . . . . . . . . . . . . . . . 48
2.4.1 Surfactants in synthetic cement pore solution . . . . . . . . . . . . . 48
2.4.2 Adsorption sites and surfactant distribution . . . . . . . . . . . . . . 50
2.4.3 Relation between yield stress and adsorbed surfactant . . . . . . . . 53
2.4.3.1 Yield stress drop at high concentration range . . . . . . . . 53
2.4.3.2 Yield stress increase at low concentration range . . . . . . . 54
39

CHAPTER 2. EFFECTS OF SURFACTANTS ON THE YIELD STRESS OF CEMENT PASTE
2.5 Conclusion . . . . . . . . . . . . . . . . . . . . . . . . . . . . . . . . . . . . . 55
Bibliography . . . . . . . . . . . . . . . . . . . . . . . . . . . . . . . . . . . . . . . 58
Appendix A: Additional surfactants . . . . . . . . . . . . . . . . . . . . . . . . . 59
Appendix B: Compatibility with calcium hydroxide solution . . . . . . . . . . 61
Appendix C: Delay of hydration . . . . . . . . . . . . . . . . . . . . . . . . . . . 62
This chapter, without the appendices, has been published as:
B. Feneuil, O. Pitois and N. Roussel, "Effect of surfactants on the yield stress of cement paste",
Cement and concrete Research, vol. 100, pp. 32-39, 2017
2.1 Introduction
Cement foams are promising materials. Indeed, addition of air into cement paste may of-
fer, besides substantial material savings, improved thermal properties. This is why, since
several years, the study of aerated cementitious materials has become an active field of
research. In order to control cement foam morphology, the destabilisation mechanisms
of fresh cement foams, until cement hardening, must be stopped or slowed. Stabilisation
can be achieved by monitoring rheological properties of the fresh cement paste, espe-
cially its yield stress [1, 2, 3].
Most formulations of cement foams include chemicals known as surfactants. Surfac-
tants can either enhance air entrainment into cement paste (air entraining agents) during
fast stirring of the cement slurry, or they can be used to create a pre-formed aqueous foam
which is later incorporated into the cement slurry. In both processes, surfactants remain
in the cement paste and may thus affect the rheological and early age properties of the
cement matrix.
Besides cement foams, surfactants can be used as air entraining agents in frost-resistant
concrete and as shrinkage reducing admixtures [4].
In this study, we consider the interaction of surfactants with a cement paste. We first
investigate the effect of a synthetic pore solution on the foaming ability of these surfac-
tants. Then, we measure the effect of surfactant addition on the yield stress of the cement
paste. Our results show the major role played by the amounts of surfactant adsorbed at
the surface of the cement grains both on fresh cement paste yield stress and on the hy-
drophobization of the cement grains.
2.2 Background
2.2.1 Surfactant molecules in cement paste
Surfactant molecules are composed of a hydrophilic head and a hydrophobic hydrocar-
bon tail. In aqueous solution, some surfactant molecules adsorb at the air-water inter-
face, with their hydrophobic tails towards air, which reduces the liquid-air surface tension
40

CHAPTER 2. EFFECTS OF SURFACTANTS ON THE YIELD STRESS OF CEMENT PASTE
γ [5, 6]. Above the Critical Micelle Concentration (CMC), the air-water interface becomes
saturated with surfactant molecules while residual surfactant molecules in bulk solution
gather into elements called micelles. As a consequence, above CMC, liquid-air surface
tension does not decrease any more with increasing surfactant concentration as shown
in Fig. 2.1.
Figure 2.1: Surfactant distribution and surface tension
The hydrophilic head can either be charged (ionic surfactants) or polar (non-ionic
surfactants). Ionic surfactants are said cationic if their charge is positive, anionic if their
charge is negative and amphoteric when their head include both types of charge [5, 6].
Surfactants enhance foam creation and foam stability through several mechanisms. First,
lowering surface tension means that less energy is needed to create air-water interface.
Then, layers of surfactant on both sides of the water film separating two bubbles repel
each other due to some steric interactions and, in the case of ionic surfactants, some elec-
trostatic interaction. In addition, it was shown that micelles or other structures inside the
film may contribute to its stabilisation [5]. It is worth noting that dynamics of surfactant
adsorption at air-water interface is also an important aspect for foam generation and sta-
bility: to stabilize newly formed interfaces, surfactant adsorption must indeed be faster
than surface formation [5]. Length of stretched hydrocarbon chain in nm is related to the
number of carbon atoms nC by [7]:
l = 0.1275(nc −1)+0.19+0.23 (2.1)
Stretched length of a 10 carbon chain is therefore 1.57 nm, which gives an idea of the
size of these molecules compared to other organic compounds used as additives in the
cement and concrete industry, namely around 5 nm for water reducing agents such as
PCE comb copolymer coils [8, 9, 10] and around 50 nm for the coiled macromolecules
used as viscosity agents [11].
Most organic additives for cement adsorb on the cement grain surfaces [12, 13]. In the
case of large molecules, such as poly-carboxylic ethers, adsorption of polymer coils leads
41

CHAPTER 2. EFFECTS OF SURFACTANTS ON THE YIELD STRESS OF CEMENT PASTE
to steric repulsion between grains and to a decrease in the yield stress of the suspension
[14, 15].
Adsorption of surfactant molecules on cement grains has been reported by [6, 16, 17].
Due to their specific molecular structure, surfactant molecules may adsorb in various
configurations as single molecules adsorption is reported to find its origin in either the
hydrophilic head or the hydrophobic tail depending on the surface properties [12, 13].
While in 1992, Uchikawa et al. [16] made the hypothesis that hydrophilic heads were ori-
ented towards the bulk solution, the hypothesis of electrostatic adsorption of the head
was latter most common for ionic surfactants [6, 13, 17]. Zhang et al. [17] measured ad-
sorption on cement of three surfactants - cationic, anionic and non-ionic - and com-
pared adsorption isotherms with contact angle on compacted cement powder pastilles
(see details of a similar protocol in paragraph 2.3.2.5). They observed no adsorption with
the non-ionic surfactant, whereas partial adsorption of both tested ionic surfactants was
measured no matter their initial concentrations. For ionic surfactants, adsorption of ionic
heads on the cement particle surface is reported to lead to an hydrophobization of the
grain surface and thus to an increase of the contact angle with water of the resulting
hardened material up to a maximum value reached when the grain surface is saturated.
At higher concentrations, hydrophobicity of the cement grains surface was noted to de-
crease in the case of anionic surfactant. This effect was explained by the formation of
surfactant agglomerates at the surface of the grains. Recently, Petit et al. [18] also mea-
sured the above hydrophobicity maximum at intermediate concentrations for one an-
ionic surfactant. The experimental procedure was the imbibition of cement powder by
the surfactant solution. They observed no effect of cationic surfactant on cement surface
properties.
2.2.2 Foam stability
Before cement setting and hardening, the initial pores structure obtained after mixing
can get destabilized through three distinct mechanisms: (1) the gravity driven flow of the
paste through the rising bubbles leads to an heterogeneous distribution of air within the
sample, (2) difference in capillary pressure between bubbles of different sizes leads to gas
exchange (ripening); it leads to bubble rearrangements and a global increase of the aver-
age bubble size Rb as a function of time, and (3) foam films breakage induces the coarsen-
ing of the bubble assembly through coalescence events. It is to note that the magnitude
of the two latter mechanisms increases as the gas fraction increases, which is precisely a
consequence of gravity drainage.
Bubble coalescence is generally counteracted by a significant disjoining pressure aris-
ing in thin liquid films due to the presence of surfactants at concentrations above the
CMC. However, in cement pastes and more specifically in the high ionic strength inter-
stitial fluid, the ability of common surfactants to ensure the stability of thin water films is
not obvious and deserves specific investigation [6].
A relevant strategy to control the destabilizing mechanisms of a foam is to take advan-
tage of yield stress (τy ) properties of pastes [1, 2, 3]: basically, drainage stops as τy ∼ ρg r ,
42

CHAPTER 2. EFFECTS OF SURFACTANTS ON THE YIELD STRESS OF CEMENT PASTE
Figure 2.2: Destabilisation mechanisms in a foam
where ρ is the density of the paste and r is the typical size of interstices between the bub-
bles. Moreover, the ripening process is strongly dampened as τy ∼ γ/Rb , where γ is the
surface tension of the liquid/air interface. An alternative foam stabilization strategy in-
volves particles adsorption at the bubbles surface thanks to the in-situ hydrophobization
of the particles contained in the paste to be foamed [19], [18]. No matter the strategy cho-
sen to stabilize the foamed material, adsorption properties of surfactants at the surface of
cement grains appear in all literature available as a crucial parameter.
2.2.3 Yield stress of solid suspensions
Cement paste is a suspension a solid cement grains in aqueous phase. The yield stress
τy depends on the interaction of each solid particle with its closest neighbors. A relation
between macroscopic yield stress and particle interaction has been proposed in the so-
called Yodel [20]. In this model, the inter-particle force parameter G(h) is defined as
G(h) = FVdW +FES +FSter
ã(2.2)
where FVdW is Van der Waals attractive force between particles, FES is the electrostatic
interaction, FSter is the steric interaction and ã refers to the radius of curvature of the
particle surface. G depends on the distance h between solid grains. Flatt et al. [20] showed
that the yield stress of a suspension is proportional to the maximum value of G, obtained
at the minimal inter-particle distance.
Hence, to understand the change of yield stress with surfactant addition, analysis of
the interactions between cement grains must be carried out. First, attraction due to the
Van der Waals force is inversely proportional to the square of the interparticle distance:
FVdW ∝ 1/h2. Thus, increasing distance between the cement grains reduces the Van der
Waals interaction. Secondly, for a charged surface in an electrolyte solution, the range
of the electrostatic force is given by the Debye length κ−1. The Debye length gives the
thickness of the ions layer balancing the electrostatic close to the solid surface. In cement
paste, the Debye length is rather small because of the high ionicity of the interstitial solu-
43

CHAPTER 2. EFFECTS OF SURFACTANTS ON THE YIELD STRESS OF CEMENT PASTE
tion, i.e. κ−1 ' 0.7nm [14]. Thirdly, steric interaction depends on the thickness of the layer
of adsorbed molecules on grains surface. Adsorbed layers on grain surfaces can hardly
interpenetrate. For instance, poly-carboxylate superplasticizers are polymers which ad-
sorb on cement grain surface. The layer they form is at least 2.5nm thick. If hSter is the
thickness of the layer of adsorbed molecules, steric interaction imposes h ≥ 2hSter . The
increase of the distance between the grains leads to a lowering of the attractive Van der
Waals forces and thus to fluidification of the paste.
2.3 Materials and methods
2.3.1 Materials
2.3.1.1 Cement
Cement is a CEM I from Lafarge, Saint Vigor. Blaine specific surface provided by the man-
ufacturer is 0.359 m2/g. Chemical composition is given in table 2.1.
C3S C2S C3A C4AF CaO/SiO2 Al2O3
62.0% 16.0% 2.1% 15.2% 3 4%
MgO Na2O +0.658 K2O SO3 Gypsum L.O.I.
1.1% 0.34 % 2.58 % 2.4% 0.9%
Table 2.1: Chemical composition of CEM I cement from Lafarge, Saint-Vigor
2.3.1.2 Synthetic cement pore solution
To study the effects of ions from the cement paste on surfactants, a synthetic cement pore
solution is prepared by dissolving in distilled water 1.72 g/L of CaSO4 ·2H2O, 6.959 g/L of
Na2SO4, 4.757 g/L of K2SO4 and 7.12 g/L of KOH [21].
2.3.1.3 Surfactants
Surfactants are listed in table 2.2 with their charge, molar mass and active content when
given by the provider. Average values are presented when necessary. All of them have
been used as received from the provider. Fig. 2.3 gathers their molecular structures.
2.3.1.4 Cement paste preparation
The cement pastes studied here have a water-to-cement ratio of 0.5. They are prepared as
follows:
1. A cement paste at water-to-cement ratio 0.4 is prepared by adding cement to dis-
tilled water and is mixed by hand for 1 min.
44

CHAPTER 2. EFFECTS OF SURFACTANTS ON THE YIELD STRESS OF CEMENT PASTE
Name Charge Molar Mass Purity Provider
(g/mol) a%
TTAB + 336 ≥ 99% Sigma-Aldrich
TEGO® Betain F50 +/- 343 Evonik
SDS - 288 ≥ 98.5% Sigma-Aldrich
Steol® 270 CIT - 382 68-72% Stepan
Bio-Terge® AS-40K - 315 39.1% Stepan
Triton™ X-100 (labo-
ratory grade)
0 625 Sigma-Aldrich
Brij 700 0 4670 Sigma-Aldrich
Tween® 20 0 1225 97% Acros
Table 2.2: Surfactant properties. Molar weight is an average in the case of mixed molecules and a%
is the active content of the products
Figure 2.3: Surfactant molecular structures. Bio-Terge is a mix of several molecules close to the
one drawn here.
2. The paste rests for 20 min so that first hydration products (mostly sulfo-aluminates)
form [21] before surfactants are added.
3. A solution of surfactant in distilled water is added, in such a way that the final wa-
ter to cement ratio reaches W/C=0.5. Hence, if the surfactant concentration in the
added solution is Cadd , the concentration of the surfactant in the whole amount of
water contained in the cement paste is Ci = 1/5×Cadd .
4. The paste is mixed manually and slowly to avoid any air entrainment for 5 min.
A very important point to note here is that our mixing protocol is specifically chosen
45

CHAPTER 2. EFFECTS OF SURFACTANTS ON THE YIELD STRESS OF CEMENT PASTE
in order to avoid any air entrainment or any foaming. We focus here on the role of surfac-
tants only and we therefore chose to prepare pastes, in which the presence of a surfactant
and its concentration were the only varying parameters. For some samples, we checked a
posteriori that only very few bubbles were entrained through the surfactant addition pro-
tocol either by centrifugation of the sample or by addition of small amount of the paste
into distilled water. We did not visually detect any air bubbles release in these tests (results
not shown here).
2.3.2 Methods
2.3.2.1 Surfactant compatibility with cement pore solution
50mL tubes are filled with 10mL of solution containing 0.1 g of surfactant. Tubes are
shaken by hand during 15s, then placed vertically at rest. First, precipitation is visually
assessed, then samples are classified according to their foaming capacity:
• 0 : No foam
• + : Foam volume below 20 mL
• ++ : Moderately stable foam
• +++ : The tube is filled with foam for longer than 1h
For each surfactant, a sample prepared from the synthetic cement pore solution de-
scribed in paragraph 2.3.1.2 is compared to a reference sample prepared with distilled
water (pH=7).
2.3.2.2 CMC
CMC in water and in cement pore solution are obtained from surface tension measure-
ments using the Pendant Drop Method and a Teclis tensiometer (see figure 2.1). The test
consists in generating a drop of solution at the lower end of a vertical needle. The surface
tension is then computed from the drop profile, according to the Young-Laplace equation.
2.3.2.3 Yield stress
Yield stress is assessed using simple spread tests. Cement paste is poured on a horizontal
flat surface. When flow stops, two perpendicular diameters of the paste deposit are mea-
sured. The yield stress is then computed from the average radius R, the sample volume ω
and the material density ρ using the following formula [22]:
τy = 225ρgΩ2
128π2R5(2.3)
Note that Eq. 2.3 is valid if the thickness of the sample is small compared to its radius
and if the surface tension effects can be neglected. The second condition writes:
46
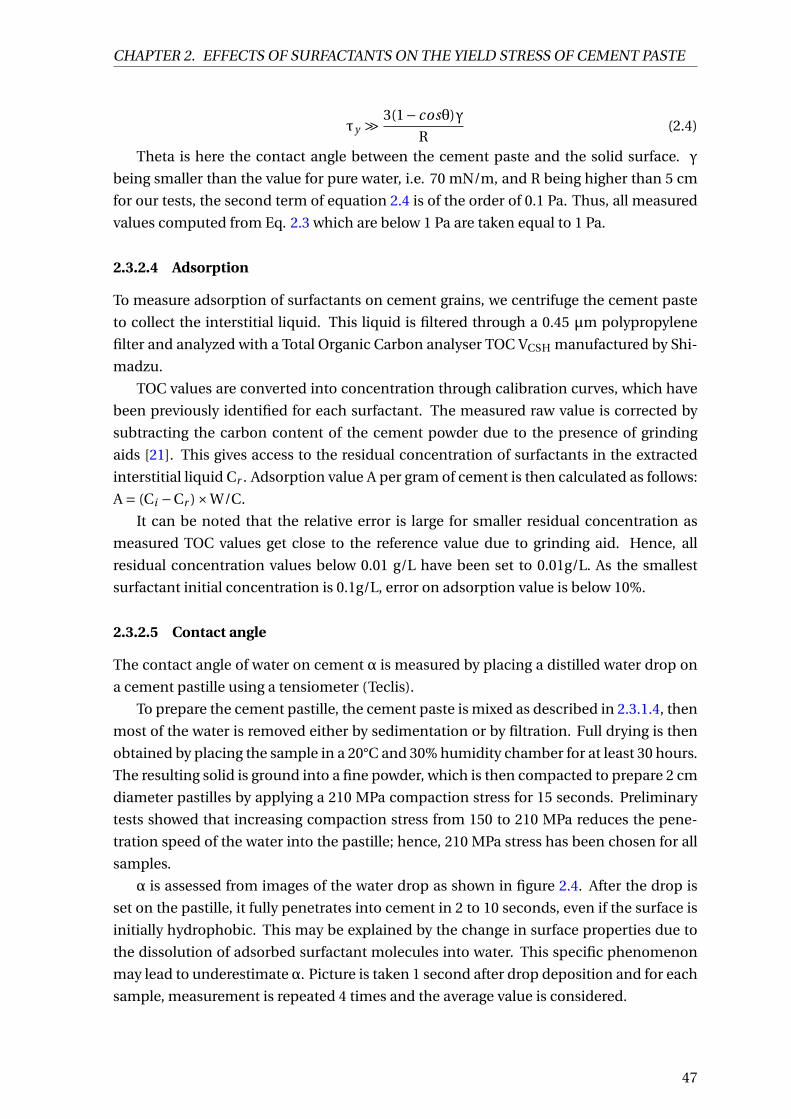
CHAPTER 2. EFFECTS OF SURFACTANTS ON THE YIELD STRESS OF CEMENT PASTE
τy À 3(1− cosθ)γ
R(2.4)
Theta is here the contact angle between the cement paste and the solid surface. γ
being smaller than the value for pure water, i.e. 70 mN/m, and R being higher than 5 cm
for our tests, the second term of equation 2.4 is of the order of 0.1 Pa. Thus, all measured
values computed from Eq. 2.3 which are below 1 Pa are taken equal to 1 Pa.
2.3.2.4 Adsorption
To measure adsorption of surfactants on cement grains, we centrifuge the cement paste
to collect the interstitial liquid. This liquid is filtered through a 0.45 µm polypropylene
filter and analyzed with a Total Organic Carbon analyser TOC VCSH manufactured by Shi-
madzu.
TOC values are converted into concentration through calibration curves, which have
been previously identified for each surfactant. The measured raw value is corrected by
subtracting the carbon content of the cement powder due to the presence of grinding
aids [21]. This gives access to the residual concentration of surfactants in the extracted
interstitial liquid Cr . Adsorption value A per gram of cement is then calculated as follows:
A = (Ci −Cr )×W/C.
It can be noted that the relative error is large for smaller residual concentration as
measured TOC values get close to the reference value due to grinding aid. Hence, all
residual concentration values below 0.01 g/L have been set to 0.01g/L. As the smallest
surfactant initial concentration is 0.1g/L, error on adsorption value is below 10%.
2.3.2.5 Contact angle
The contact angle of water on cement α is measured by placing a distilled water drop on
a cement pastille using a tensiometer (Teclis).
To prepare the cement pastille, the cement paste is mixed as described in 2.3.1.4, then
most of the water is removed either by sedimentation or by filtration. Full drying is then
obtained by placing the sample in a 20°C and 30% humidity chamber for at least 30 hours.
The resulting solid is ground into a fine powder, which is then compacted to prepare 2 cm
diameter pastilles by applying a 210 MPa compaction stress for 15 seconds. Preliminary
tests showed that increasing compaction stress from 150 to 210 MPa reduces the pene-
tration speed of the water into the pastille; hence, 210 MPa stress has been chosen for all
samples.
α is assessed from images of the water drop as shown in figure 2.4. After the drop is
set on the pastille, it fully penetrates into cement in 2 to 10 seconds, even if the surface is
initially hydrophobic. This may be explained by the change in surface properties due to
the dissolution of adsorbed surfactant molecules into water. This specific phenomenon
may lead to underestimate α. Picture is taken 1 second after drop deposition and for each
sample, measurement is repeated 4 times and the average value is considered.
47

CHAPTER 2. EFFECTS OF SURFACTANTS ON THE YIELD STRESS OF CEMENT PASTE
Figure 2.4: Example of pictures used for contact angle measurement. Left : reference sample, α
=19.6°; right : sample with initial concentration of Bio-Terge of 25 g/L, α =103°
2.4 Results and discussion
2.4.1 Surfactants in synthetic cement pore solution
Foamability of surfactant solutions in water and in cement pore solution are summarized
in table 2.3. For the latter case, the table reports whether a precipitate was observed.
Surfactant Preci- Foam Compati-
pitation in water in cement sol. bility
+ TTAB No +++ ++ YES
+/- Betain No ++ 0 no
-
SDS Yes +++ 0 no
Steol 270 No +++ +++ YES
Bio-Terge No +++ +++ YES
0
Triton X100 No ++ ++ YES
Brij 700 No + 0 no
Tween 20 Yes + 0 no
0 : No foam
+ : Foam volume below 20 mL
++ : Moderately stable foam
+++ : Tube filled with 40 mL foam
for longer than 1h
Table 2.3: Precipitation and foamability of surfactants in distilled water and synthetic cement pore
solution
For some surfactants, foam could not be obtained in presence of the synthetic cement
pore solution while foam could be generated with the same surfactant in distilled wa-
ter. Among them, SDS and Tween 20 precipitated when added to the cement solution.
This observation for SDS is in agreement with results reported by Jolicoeur [23], who no-
ticed that there is no residual surfactant in solution when SDS is added to a cement paste,
even at high surfactant dosage. Note however that air bubbles have been successfully en-
trained in the cement pastes containing SDS in [23, 24]. Some authors [4, 23] suggested
that the insoluble surfactant - calcium salts enhance stabilization of the bubbles. Similar
conclusion was obtained by Tunstall et al. [25], who observed the complexation of some
48

CHAPTER 2. EFFECTS OF SURFACTANTS ON THE YIELD STRESS OF CEMENT PASTE
commercial air-entraining agents in their synthetic cement pore solution. Besides, Petit
et al. [18] observed a modification of the surface properties of cement grains when adding
SDS to a cement paste, suggesting that, at the low concentration they studied, some SDS
molecules did not precipitate but adsorbed on cement grain surface.
Regarding Betain and Brij 700, even if no precipitate could be visually observed, no
foam could be generated in the synthetic cement pore solution. One hypothesis to explain
the incompatibility of Betain and Brij 700 with cement solution is the formation of soluble
complexes with ions (calcium, sulfate...).
The other four surfactants are compatible with the cement solution: one of them is
cationic (TTAB), two are anionic (Steol and Bio-Terge) and one is non ionic (Triton). In
the following, we will focus on these four surfactants.
Surface tension was measured for distilled water and synthetic cement pore solution
without surfactant. In both cases, it was around 71mN/m. Figure 2.5 gives the surface
tension curves for all four compatible surfactants. On the X-axis, concentration refers
to the total surfactant mass added to the solution whether they are under liquid or solid
form, which means that it includes some water in the case of Steol and Bio-Terge solutions
(see table 2.2).
Figure 2.5: Comparison on surface tension curves of compatible surfactants in distilled water and
synthetic cement pore solution
The cement solution has a strong effect on the surface tension of solutions containing
ionic surfactants. Because of the high ion content, electrolyte solution reduces the range
of the electrostatic repulsion between surfactant charged heads [5]. Therefore, surfactant
density increases at gas-water interfaces, which leads to a decrease of the surface tension.
As expected, this reduction is found to be small for non-ionic Triton. Tunstall et al. [25]
observed, with some of the anionic surfactants they tested, an increase of surface tension
in alkaline solutions containing calcium ions. This effect was related to the loss of surfac-
tant molecules available to settle at air-water interface due to the formation of complexes
49

CHAPTER 2. EFFECTS OF SURFACTANTS ON THE YIELD STRESS OF CEMENT PASTE
with calcium ions. This effect is not observed in figure 2.5 because the chosen surfactants
are not affected by calcium ions.
CMC are deduced from these curves as the intersection of two straight lines, each of
them being representative of the surfactant effect before and after the CMC. In the follow-
ing, the CMC measured in the synthetic cement pore solution is noted CMC*. All extracted
CMC in water and CMC* are given in table 2.4. For all ionic surfactants, CMCs are lower
in synthetic cement pore solution than in distilled water solutions whereas it stays almost
constant for the non-ionic surfactant. Indeed, reduction of the electrostatic force range
favors the agglomeration of ionic surfactant molecules into micelles.
Surfactant CMC CMC*
TTAB (+) 1.5 g/L 0.5 g/L
Steol (-) 1.5 g/L 0.3 g/L
Bio Terge (-) 2 g/L 0.5 g/L
Triton (0) 0.2 g/L 0.15 g/L
Table 2.4: CMC in distilled water and CMC* in synthetic cement pore solution. Values give weight
of the surfactants as sold by the providers.
It is worth noting that electrostatic repulsion between surfactant layers may contribute
to the stabilization of liquid films in foams. As a consequence, the above screening of
these forces may be at the origin of the faster destabilisation of the TTAB foam in cement
solution reported in Table 3 as well as the inability of Betain to form foam with the syn-
thetic cement solution.
2.4.2 Adsorption sites and surfactant distribution
Adsorption isotherms for the four compatible surfactants are given in figure 2.6.
Figure 2.6: Comparison of adsorption isotherms of compatible surfactants. On Y-axis, adsorption
is given in µmol per gram of cement and on X-axis, residual concentration is divided by the CMC*
in synthetic cement pore solution (see table 2.4).
First, let us note the difference of maximum adsorption for the surfactants. Measured
maximal adsorption is, for one gram of cement, 4.6 g of Steol and 13 g of Bio-Terge, that is
to say respectively 8.5 µmol and 16 µmol. Maximum adsorption of TTAB is 3.7 µmol (1.3
50

CHAPTER 2. EFFECTS OF SURFACTANTS ON THE YIELD STRESS OF CEMENT PASTE
g) per gram of cement. As mentioned in part 2.3.1.4, surfactants are added to the cement
paste 20 minutes after the first contact between cement and water. At this time, solid
surfaces in solution are hydroxylate surfaces of clinker phases, mainly C3S and C2S, and
first hydration products, C-S-H, ettringite and portlandite. In high electrolyte solution like
cement pore solution, calcium ions adsorb on negatively charged silicate surfaces (C3S,
C2S, C-S-H and portlandite), resulting in positive zeta potential [26]. On the other hand,
sulfate ions adsorbed on ettringite provide for negative zeta potential [26]. The diversity
of solid surfaces accounts for the different affinities of cationic and anionic surfactants.
Very low adsorption is measured for non-ionic Triton X100 (maximum 0.12 mg/g or
0.19 µmol/g), which is consistent with previous measurements of adsorption with this
surfactant [17].
Isotherms of Steol, Bio-Terge and TTAB in figure 2.6 can be compared with adsorption
isotherms of ionic surfactant from the literature. Such adsorption has indeed been exten-
sively studied [27, 28, 29, 30, 31] on silica or metal oxides. Typical adsorption isotherm
comprises four regimes: (1) isolated molecules adsorb "head on" thanks to electrostatic
attraction, (2) adsorption rate increases due to favorable hydrophobic interactions with
tails of previously adsorbed molecules, (3) starting from a residual concentration called
hemimicelle concentration (HMC) surface agglomerates form by attraction of the hy-
drophobic tails on hydrocarbon chains of the first layer of molecules. (4) at residual con-
centrations close to the CMC, adsorption reaches a plateau. This plateau may have two
origins: first, free molecule concentration varies slowly above CMC and micelles do not
adsorb on the surface [27, 30] (pseudophase separation model), secondly, the solid sur-
face may be saturated with surface agglomerates.
Figure 2.7: Four regimes model for adsorption of ionic surfactants on oppositely charged surfaces.
Schema is adapted from [29, 30].
The above four regimes cannot be clearly identified on Steol, Bio-Terge and TTAB
isotherms on figure 2.6. Main difference between cement and model systems from the lit-
erature are the diversity in potential adsorption sites in cement paste, to which one given
surfactant may have different affinities, making the dissociation of adsorption regimes
difficult. Though, we can observe that, for all of these three molecules, the adsorption
plateau is indeed reached close to the CMC*.
Regarding cationic TTAB, at lowest concentrations, adsorption is very low so that ini-
51

CHAPTER 2. EFFECTS OF SURFACTANTS ON THE YIELD STRESS OF CEMENT PASTE
tial slope is close to zero and adsorption isotherm has an S-shape. S-shaped adsorption
isotherms have been simulated by Zhu et al. [31] for systems where the equilibrium con-
stant of the formation of surface agglomerates is high compared to the constant related to
the adsorption of one molecule. In other words, in systems simulated by Zhu et al., an ad-
sorbed molecule hardly remains alone. This translates in a very low adsorption of single
molecules at low concentrations and a brutal rise in adsorption as soon as concentration
allows for the formation of agglomerates.
Contact angle of cement grain surface are plotted as a function of surfactant concen-
tration in Fig. 2.8.
For the reference sample, measurement has been carried out on 4 different cement
pastilles. The 15 obtained contact angle values range from 11 to 34 with average value
21 and standard deviation 7 (i.e. 33% of the average value).
Regarding samples containing surfactant, the drop imbibition takes more time, prob-
ably because surfactant dissolution is required prior to imbibition. For each surfactant
concentration, contact angle is measured on four different drops. Error bars in Fig. 2.8
give the highest and the lowest of the four values. They provide for an estimation of the
error related to the time of the measurement. Maximum relative error is 15% of the con-
tact angle for both anionic surfactants (Steol and Bio-Terge), 20% for cationic TTAB and
30% for Triton. Relative errors are smaller when surfactant adsorption is higher, which
tends to show that drop imbibition is delayed because of the surfactant desorption time.
Figure 2.8: Contact angle of cement surface after surfactant adsorption
Anionic surfactants increased the contact angle up to a maximal contact angle at inter-
mediate concentrations. No change of contact angle was observed for samples containing
TTAB or Triton.
Contact angle curves for anionic surfactants are consistent with previous results from
literature [17]. They confirm that surface agglomerates form at residual concentration
close to CMC*. Indeed, contact angle increases at low concentrations indicating that
a monolayer of surfactant forms on cement grain surface. In this concentration range,
molecules heads adsorb through electrostatic interaction and hydrocarbon chains are ori-
ented outwards. Contact angle increases as the number of adsorbed molecules increases.
In the higher concentration range, reduction of contact angle shows that orientation of
the additional molecules is opposite: hydrophilic heads are oriented toward the solution.
52

CHAPTER 2. EFFECTS OF SURFACTANTS ON THE YIELD STRESS OF CEMENT PASTE
Contact angle for TTAB cationic surfactant is constant. Eventually, contact angle mea-
surement and adsorption isotherm shape both seem to show that during adsorption of
TTAB, adsorbed molecules tend to agglomerate even at low concentrations while the am-
ount of free molecules adsorbed at low concentrations is too low to affect contact angle.
2.4.3 Relation between yield stress and adsorbed surfactant
Yield stress measurements of the reference paste without surfactant were repeated three
times. The average value was 11.9 Pa and the standard deviation was 0.6 Pa. Results for
surfactant containing samples are given in the graphs of figure 2.9.
Figure 2.9: Yield stress results of compatible surfactants on cement
Results presented in figure 2.9 show a drop in yield stress down to below 1 Pa above a
concentration threshold for two surfactants: Steol and Bio-Terge. A slight yield stress re-
duction, down to half the reference value, is also observed for TTAB. At low concentration
range, a large increase in yield stress is observed for Bio-Terge, and a small increase for
Steol. It remains close to the reference paste value for all other surfactants. No variation
of yield stress is observed for Triton, which is consistent with the very low adsorption and
the absence of contact angle variations.
We note CCr i t the critical residual concentration between higher yield stress regime
and low yield stress regime. It is for all three ionic surfactants close to CMC*.
2.4.3.1 Yield stress drop at high concentration range
Figure 2.9 shows that, for Steol and BioTerge, yield stress drops drastically above CCr i t
' CMC* the adsorption plateau is reached and the contact angle is maximal, i.e. when
surfactants agglomerate on cement grains surfaces. Besides, using the light scattering
method, the typical diameters of Steol and Bio-Terge micelles in synthetic cement pore
solution were measured to be around 10 nm. It is one order of magnitude above the Debye
length κ−1 ' 0.7nm [14], which means that these adsorbed micelles are large enough to
increase inter-particle distance through steric repulsive interactions. We can then suggest
that drop in yield stress is due to steric repulsion between cement grains related to the
agglomeration of adsorbed surfactant molecules.
Lower amounts of TTAB are adsorbed compared to anionic surfactants, so that some
surfaces are not covered by TTAB. This may cause the lower reduction of yield stress ob-
53

CHAPTER 2. EFFECTS OF SURFACTANTS ON THE YIELD STRESS OF CEMENT PASTE
served for this surfactant above CCr i t ' CMC*. Besides, TTAB micelle typical size mea-
sured in synthetic cement pore solution is slightly smaller than other surfactants, i.e. 5nm.
2.4.3.2 Yield stress increase at low concentration range
Regarding concentrations below the threshold, for both anionic surfactants, the yield
stress increases. A previous study showed a 40% increase of dynamic viscosity due to
added anionic surfactants (SDS, sodium abietate and petroleum sulfonate) at low con-
centration, i.e. 0.1wt% of cement [32]. As a comparison, in the present study the yield
stress drops when the initial concentrations of Steol and Bio-Terge are above respectively
0.3 and 1wt%. The present results shed new light on results from [32]: at low shear rate
γ, the apparent viscosity η of yield stress fluid is related to the yield stress by η ∼ τy /γ,
therefore, a relative increase of τy leads to the same relative increase of η.
We have already mentioned that, in the residual concentration regime below CMC*, a
single layer of adsorbed molecules turns the grains surface hydrophobic. Several authors
have shown that hydrophobic surfaces tend to attract each other [33, 34]. This hydropho-
bic interaction is for instance the driving mechanism for the formation of surfactant mi-
celles in solution [34].
The force between two hydrophobic surfaces FH can be estimated from the radius
of curvature of the surface ã and the surface tension between water and hydrocarbons
γH [33] at the distance h where both hydrocarbon layers are in contact :
FH = 2πãγH (2.5)
The irregular shape of cement grains makes the radius of curvature ã difficult to esti-
mate. Though FH can be compared with van der Waals force, which is also proportional
to ã [20, 33, 35]:
FVdW = 1
12A(h)
(ã
h2
)(2.6)
At separation distance of a few nanometers, Hamaker constant A(h) is close to the
reference value A(0), which is of the order of magnitude of 10−20J in cement pastes[35]. In
addition, the order of magnitude of γH is 10−2J/m2 [33]. The ratio of hydrophobic to van
der Waals interactions can be roughly estimated as:
FH/FVdW ∼ 24πh2γH/A(0) ∼ 102
This shows that hydrophobic attractive interaction potentially dominates van der Waals
attractive forces between hydrophobic particles at separation distance above h = 2 nm.
Number of carbons in hydrocarbon chains of surfactant molecules are 12 for Steol
and 14 to 16 for Bio-Terge. Estimation of their length with formula 2.1 gives thus 1.8nm
for Steol and 2.2nm for Bio-Terge. Either this length difference or simply the higher local
hydrocarbon density may explain why the yield stress increase is larger with Bio-Terge.
54

CHAPTER 2. EFFECTS OF SURFACTANTS ON THE YIELD STRESS OF CEMENT PASTE
2.5 Conclusion
We observed in this work several distinct behaviors for surfactants when they are intro-
duced into a cement paste:
1. precipitation, which in turn leads to loss of foamability of the molecule,
2. adsorption on cement grains surface and
3. no interaction with cement grains.
In case (2), the surfactant noticeably affect the rheology of the cement paste. At low
concentration, i.e. below a critical residual concentration CCr i t , molecules adsorb head
on. Hydrophobic forces between tails results in most cases in an increase of the yield
stress with respect to the surfactant-free paste. At high concentration range, above CCr i t ,
the formation of large surface agglomerates is at the origin of a brutal decrease in yield
stress due to steric hindrance.
To manufacture a cement foam, the low concentration regime Cr < CCr i t could be
promising. First, high yield stress values enhances foam stabilization. In addition, surfac-
tant monolayer induces hydrophobization of cement grains, and hydrophobic particles
are known to stabilize liquid films by setting at air-water interfaces.
Bibliography
[1] S. Guignot, S. Faure, M. Vignes-Adler, and O. Pitois, “Liquid and particles retention
in foamed suspensions,” Chemical Engineering Science, vol. 65, pp. 2579–2585, 2010.
40, 42
[2] I. Lesov, S. Tcholakova, and N. Denkov, “Factors controlling the formation and stabil-
ity of foams used as precursors of porous materials,” Journal of Colloid and Interface
Science, vol. 426, pp. 9–21, 2014. 40, 42
[3] I. Lesov, S. Tcholakova, and N. Denkov, “Drying of particle-loaded foams for pro-
duction of porous materials: mechanism and theoretical modeling,” RSC Advances,
vol. 4, pp. 811–823, 2014. 40, 42
[4] G. Gelardi, S. Mantellato, D. Marchon, M. Palacios, A. Eberhardt, and R. J. Flatt.,
“Chemistry of chemical admixtures,” in Science and Technology of Concrete Admix-
tures (P.-C. Aïtcin and R. J. Flatt, eds.), pp. 149–218, Woodhead publishing, 2016. 40,
48
[5] I. Cantat, S. Cohen-Addad, F. Elias, F. Graner, R. Höhler, O. Pitois, F. Rouyer, and
A. Saint-Jalmes, Foams - Structure and dynamics. Oxford University Press, 2013. 41,
49
55

CHAPTER 2. EFFECTS OF SURFACTANTS ON THE YIELD STRESS OF CEMENT PASTE
[6] L. Du and K. Folliard, “Mechanisms of air-entrainment in concrete,” Cement and
Concrete Research, vol. 35, pp. 1463–1471, 2005. 41, 42
[7] B. Cabane and S. Hénon, eds., Liquids : Solutions, dispersion, émusions, gels. Belin,
2003. 41
[8] P. Borget, L. Galmiche, J. Le Meins, and F. Lafuma, “Microstructural characterisa-
tion and behaviour in different salt solutions of sodium polymethacrylate-g-peo
comb copolymers,” Colloids and Surfaces, A: Physicochemical and Engineering As-
pects, vol. 260, pp. 173–182, 2005. 41
[9] J. Hot, H. Bessaies-Bey, C. Brumaud, M. Duc, C. Castella, and N. Roussel, “Adsorbing
polymers and viscosity of cement pastes,” Cement and Concrete Research, vol. 63,
pp. 12–19, 2014. 41
[10] G. Gelardi, N. Sanson, G. Nagy, and R. J. Flatt, “Characterization of comb-shaped
copolymers by multidetection sec, dls and sans,” Polymers, vol. 9, p. 61, 2017. 41
[11] C. Brumaud, H. Bessaies-Bey, C. Mohler, R. Baumann, M. Schmitz, M. Radler, and
N. Roussel, “Cellulose ethers and water retention,” Cement and Concrete Research,
vol. 53, pp. 176–184, 2013. 41
[12] C. Jolicoeur and M.-A. Simard, “Chemical admixture-cement interactions: Phe-
nomenology and physico-chemical concepts,” Cement & Concrete Composites,
vol. 20, pp. 87–101, 1998. 41, 42
[13] D. Marchon, S. Mantellato, and R. Eberhardt, A.B. an d Flatt, “Adsorption of chemi-
cal admixtures,” in Science and Technology of Concrete Admixtures (P.-C. Aïtcin and
R. Flatt, eds.), pp. 219–256, Woodhead publishing, 2016. 41, 42, 62
[14] R. J. Flatt and I. Schober, “Superplasticizer and the rheology of concrete,” in Under-
standing the rheology of concrete (N. Roussel, ed.), pp. 144–208, Woodhead publish-
ing, 2012. 42, 44, 53
[15] A. Perrot, T. Lecompte, H. Khelifi, C. Brumaud, J. Hot, and N. Roussel, “Yield
stress and bleeding of fresh cement pastes,” Cement and Concrete Research, vol. 42,
pp. 937–944, 2012. 42
[16] H. Uchikawa, S. Hanehara, T. Shirasaka, and D. Sawaki, “Effect of admixture on hy-
dration of cement, adsorptive behavior of admixture and fluidity and setting of fresh
cement paste,” Cement and Concrete Research, vol. 22, pp. 1115–1129, 1992. 42
[17] T. Zhang, S. Shang, F. Yin, A. Aishah, A. Salmiah, and T. Ooi, “Adsorptive behavior of
surfactants on surface of Portland cement,” Cement and Concrete Research, vol. 31,
pp. 1009–1015, 2001. 42, 51, 52
[18] P. Petit, I. Javierre, P.-H. Jézéquel, and A.-L. Biance, “Generation and stability of bub-
bles in a cement based slurry,” Cement and Concrete Research, vol. 60, pp. 37–44,
2014. 42, 43, 49
56
CHAPTER 2. EFFECTS OF SURFACTANTS ON THE YIELD STRESS OF CEMENT PASTE
[19] K. Ramamurthy, E. Kunhanandan Nambiar, and G. Indu Siva Ranjani, “A classifi-
cation of studies on properties of foam concrete,” Cement & Concrete Composites,
vol. 31, pp. 388–396, 2009. 43
[20] R. J. Flatt and P. Bowen, “Yodel: a yield stress model for suspensions,” Journal of the
American Ceramic Society, vol. 89, no. 4, pp. 1244–1256, 2006. 43, 54
[21] H. Bessaies-Bey, Polymères et propriétés rhéologiques d’une pâte de ciment : une ap-
proche physique générique. PhD thesis, Université Paris-Est - SIE, 2015. 44, 45, 47
[22] N. Roussel and P. Coussot, “Fifty-cent rheometer for yield stress measurements:
From slump to spreading flow,” Journal of Rheology, vol. 49, no. 3, pp. 705–718, 2005.
46
[23] C. Jolicoeur, T. To, T. Nguyen, R. Hill, and M. Pagé, “Mode of action of anionic surfac-
tants for air entrainment in cement pastes w-w/o fly ash,” in 2009 World of Coal Ash
(WOCA) Conference - May 4-7, 2009 in Lexington, KY, USA, 2009. 48
[24] H. Atahan, J. C. Carlos, S. Chae, P. Monteiro, and J. Bastacky, “The morphology of
entrained air voids in hardened cement paste generated with different anionic sur-
factants,” Cement & Concrete Composites, vol. 30, pp. 566–575, 2008. 48
[25] L. Tunstall, G. Scherer, and R. Prud’homme, “Studying AEA interaction in cement
systems using tensiometry,” Cement and concrete research, vol. 92, pp. 29–36, 2017.
48, 49
[26] A. Zingg, F. Winnefeld, L. Holzer, J. Pakusch, S. Becker, and L. Gauckler, “Adsorption
of polyelectrolytes and its influence on the rheology, zeta potential, and microstruc-
ture of various cement and hydrate phases,” Journal of Colloid and Interface Science,
vol. 323, pp. 301–312, 2008. 51
[27] F. J. Scamehorn, R. S. Schechter, and W. H. Wade, “Adsorption of surfactants on min-
eral oxide surfaces from aqueous solutions,” Journal of Colloid and Interface Science,
vol. 85, no. 2, pp. 463–478, 1982. 51
[28] L. Koopal, E. Lee, and M. Böhmer, “Adsorption of cationic and anionic surfactants
on charged metal oxide surfaces,” Journal of Colloid and Interface Science, vol. 170,
pp. 85–97, 1995. 51
[29] R. Atkin, V. Craig, E. Wanless, and S. Biggs, “Mechanism of cationic surfactant ad-
sorption at the solid-aqueous interface,” Advances in Colloid and Interface Science,
vol. 103, pp. 219–304, 2003. 51
[30] S. Paria and K. Khilar, “A review on experimental studies of surfactant adsorption
at the hydrophilic solid-water interface,” Advances in Colloid and Interface Science,
vol. 110, no. 3, pp. 75–95, 2004. 51
57

CHAPTER 2. EFFECTS OF SURFACTANTS ON THE YIELD STRESS OF CEMENT PASTE
[31] B. Y. Zhu and T. Gu, “Surfactant adsorption at solid-liquid interfaces,” Advances in
Colloid and Interface Science, vol. 37, pp. 1–32, 1991. 51, 52
[32] R. Rixom and N. Mailvaganam, Chemical Admixtures for Concrete. E. & F.N. Spon Ltd,
3rd ed. ed., 1999. p106+. 54
[33] J. N. Israelachvili and R. M. Pashley, “Measurement of the hydrophobic interaction
between two hydrophobic surfaces in aqueous electrolyte solutions,” Journal of Col-
loid and Interface Science, vol. 98, no. 2, 1984. 54
[34] E. Meyer, K. Rosenberg, and J. Israelachvili, “Recent progress in understanding hy-
drophobic interactions,” PNAS, vol. 103, no. 43, pp. 15739–15746, 2006. 54
[35] R. J. Flatt, “Dispersion forces in cement suspensions,” Cement and Concrete Research,
vol. 34, pp. 399–408, 2004. 54
[36] C. Dame, Étude des relations entre la stabilité des mousses de décontamination nu-
cléaire et leurs propriétés physico-chimiques. PhD thesis, Université Paul Cézanne,
2006. 60
58

CHAPTER 2. EFFECTS OF SURFACTANTS ON THE YIELD STRESS OF CEMENT PASTE
Appendix 2A: Additional surfactants
Materials
Alpha Foamer® is an anionic surfactant provided by Stepan. It is an ammonium alkyl
ether sulfate; average molar mass according to the manufacturer is 277 g/mol and purity
52 %. Chemical formula is not given, but as molar weight of sulfate group, 96 g/mol, and
each ether group 48 g/mol, we can assume that the average length of the hydrophobic
chain is below (277-96-48)/16=8 carbons. Hydrocabon chain is therefore shorter than in
the case of Steol 270 (12 carbons) and Bio-Terge (14 to 16).
Glucopon® 225 DK is an anionic surfactant provided by BASF. It is a mix of several
molecules of average molar mass 420 g/mol and its purity is 70%. Carbon chain length of
the molecules is comprised between 8 and 10 and chemical formulas are close to the one
drawn in Fig. 2.10.
Figure 2.10: Example of chemical formula of a molecule contained in Glucopon non-ionic surfac-
tant. Glucopon is a mix of molecules with carbon chain length between 8 and 10, and number of
glucoside group may vary.
As shown in Appendix B, their are both compatible with synthetic cement pore solu-
tion.
Surface tension measurements
Effect of synthetic cement pore solution on surface tension curves is very similar to other
surfactants: cement solution reduces the CMC and the surface tension at given surfac-
tant concentration. This effect is smaller for the non-ionic surfactant than for the anionic
surfactant.
Figure 2.11: Comparison on surface tension curves of Alpha Foamer and Glucopon in distilled
water and synthetic cement pore solution. Black dots refer to surface tension measurements in
water and grey diamonds, in synthetic cement pore solution.
59

CHAPTER 2. EFFECTS OF SURFACTANTS ON THE YIELD STRESS OF CEMENT PASTE
Surfactant CMC CMC*
Alpha Foamer (-) 6 g/L 2.5 g/L
Glucopon (0) 2 g/L 1.5 g/L
Table 2.5: CMC in distilled water and CMC* in synthetic cement pore solution. Values give weight
of the surfactants as sold by the providers.
Surfactants in cement paste
Adsorption, contact angle and yield stress results are given for Alpha Foamer and Gluco-
pon in Fig. 2.12.
Figure 2.12: Left: Adsorption isotherms of Alpha Foamer (-) and Glucopon (0); on Y-axis, adsorp-
tion is given in µmol per gram of cement and on X-axis, residual concentration is divided by the
CMC* in synthetic cement pore solution (see table 2.5). Center: Contact angle of cement surface
after surfactant adsorption. Right: Yield stress of cement pastes containing surfactant.
Results for Alpha Foamer are very similar to other anionic surfactants. It has a strong
affinity onto cement grains surfaces. Adsorption isotherms reaches a plateau value close
to 10 µmol per gram of cement when residual concentration overcomes the CMC*. Effect
on contact angle is minor, but large increase of yield stress appears before the CMC* and
yield stress drop after CMC* is noticeable.
Glucopon exhibits a more complex behavior. It is non-ionic and is not expected to
adsorb on cement grains, though, large adsorption amount have been measured, as well
as change of contact angle and a yield stress drop at high surfactant concentration. In ad-
dition, adsorption plateau and yield stress drop occur at residual concentration CCr i t ∼10CMC∗. Studies on molecules similar to Glucopon showed that the micelles can be neg-
atively charged [36]. We can therefore assume that individual molecules are not charged
and hardly adsorb onto cement surface, whereas micelles adsorb. Second hytothesis is
that molecules become charged in highly alkaline solution and that the high value of
CCr i t is a consequence of the fact that Glucopon is a mix of different molecules. Indeed,
if molecules have different affinity from cement grains and different CMC*, some of them
can adsorb on cement grains and form agglomerates while the others remain in solution,
which makes the residual concentration higher than if only high-affinity molecules were
present.
60

CHAPTER 2. EFFECTS OF SURFACTANTS ON THE YIELD STRESS OF CEMENT PASTE
Appendix 2B: Compatibility with calcium hydroxide solution
Table 2.6 gives foamability results including surfactants studied in Appendix A. In addi-
tion to compatibility with synthtetic cement pore solution, effect of a calcium hydroxide
solution at 0.85 g/L has been studied.
Precipitation in... Foam in...
Surfactant Ca(OH)2 cement sol. water Ca(OH)2 cement sol.
+ TTAB No No +++ ++ ++
+/- Betain No No ++ 0 0
-
SDS No YES +++ ++ 0
Steol 270 No No +++ +++ +++
Bio-Terge No No +++ +++ +++
Alpha Foamer No No +++ +++ ++
0
Triton X100 No No ++ ++ ++
Brij 700 No No + + 0
Tween 20 YES YES + 0 0
Glucopon No No +++ +++ +++
0 : No foam
+ : Foam volume below 20 mL
++ : moderately stable foam
+++ : Tube filled with 40 mL
foam for longer than 1h
Table 2.6: Results of foaming tests in synthetic cement pore solution and calcium hydroxide solu-
tion.
Effect of Ca(OH)2 solution is the same as synthetic cement pore solution for all sur-
factants but SDS, which does not precipitate in calcium hydroxide. SDS precipitation in
cement pore solution is therefore no caused by complexation with calcium ions. Addi-
tionnal tests for SDS at 10 g/L in solutions containing only some of the constituents of a
synthetic cement pore solution have been carried out.
• 7.12 g/L of KOH
• 1.72 g/L of CaSO4 ·2H2O, 6.959 g/L of Na2SO4 and 4.757 g/L of K2SO4
• 1.72 g/L of CaSO4 ·2H2O and 6.959 g/L of Na2SO4
We note that in all three cases, precipitation occurs.
61

CHAPTER 2. EFFECTS OF SURFACTANTS ON THE YIELD STRESS OF CEMENT PASTE
Appendix 2C: Delay of hydration
Method
Effect of surfactants on cement paste setting time is assessed by monitoring tempera-
ture in the samples with a thermocouple. Samples are casted in 2.8 cm diameter 5.5 cm
high cylinder and are thermally insulated. Initial temperature is about 25°. For all sam-
ples, temperature is constant for some hours, then it increases, reaches a maximal value
around 32°and finally decreases down to the intial value. Setting time is the time between
the start of the temperature measurement and the peak.
Results
Results are presented in Fig. 2.13 for TTAB (+), Steol and Bio-Terge (-) and Triton and
Glucopon (0). Setting time for reference sample with no surfactant is 12 h.
Figure 2.13: Effect of surfactants on cement paste setting time.
TTAB and Triton, i.e. the surfactants which have low or no affinity to cement grains
have no effect on setting time. Both anionic surfactant delay slightly hydration. We can
compare this retarding effect for similar observations made with several superplasticizers.
The reasons why superplasticizer tend to delay hydration are not fully understood. First
proposed mechanism is the complexation with calcium ions. In addition, coverage of
cement grains due to adsorbtion prevents the dissolution of ions and the nucleation of
hydrates on the solid surfaces [13]. Glucopon strongly delays hydration. At the highest
added amount, cement paste does not harden three days after casting. The structure of
Glucopon hydrophilic head is similar to sugars, which are known as efficient retarders for
cement setting [13].
62

Chapter 3
Yield stress of aerated cement paste
Sommaire3.1 Introduction . . . . . . . . . . . . . . . . . . . . . . . . . . . . . . . . . . . . 63
3.2 Materials and methods . . . . . . . . . . . . . . . . . . . . . . . . . . . . . . 65
3.2.1 Materials . . . . . . . . . . . . . . . . . . . . . . . . . . . . . . . . . . . 65
3.2.2 Method . . . . . . . . . . . . . . . . . . . . . . . . . . . . . . . . . . . . 65
3.2.2.1 Preparation of aerated and reference cement paste . . . . . 65
3.2.2.2 Foam generation . . . . . . . . . . . . . . . . . . . . . . . . . 66
3.2.2.3 Samples . . . . . . . . . . . . . . . . . . . . . . . . . . . . . . 67
3.2.2.4 Yield stress measurement . . . . . . . . . . . . . . . . . . . . 67
3.3 Results . . . . . . . . . . . . . . . . . . . . . . . . . . . . . . . . . . . . . . . 68
3.3.1 Reference yield stress . . . . . . . . . . . . . . . . . . . . . . . . . . . . 68
3.3.2 Aerated cement paste . . . . . . . . . . . . . . . . . . . . . . . . . . . 69
3.4 Discussion . . . . . . . . . . . . . . . . . . . . . . . . . . . . . . . . . . . . . 70
3.4.1 Reference yield stress with surfactant . . . . . . . . . . . . . . . . . . 70
3.4.1.1 Reference yield stress with TTAB . . . . . . . . . . . . . . . . 71
3.4.1.2 Reference yield stress with Bio-Terge . . . . . . . . . . . . . 72
3.4.2 Dimensionless yield stress . . . . . . . . . . . . . . . . . . . . . . . . . 72
3.4.3 Bare bubbles (TTAB) . . . . . . . . . . . . . . . . . . . . . . . . . . . . 73
3.4.4 Particle covered bubbles . . . . . . . . . . . . . . . . . . . . . . . . . . 75
3.5 Conclusion . . . . . . . . . . . . . . . . . . . . . . . . . . . . . . . . . . . . . 77
Bibliography . . . . . . . . . . . . . . . . . . . . . . . . . . . . . . . . . . . . . . . 80
3.1 Introduction
Yield stress of a cement paste, mortar or concrete is a crucial property. For instance, suf-
ficient yield stress can stop bleeding [1]. When material is poured in a formwork, yield
63

CHAPTER 3. YIELD STRESS OF AERATED CEMENT PASTE
stress can have negative effects when it prevents proper filling of the mold [1] but it helps
to reduce the lateral formwork pressure [2]. In the case of sprayed mortar, yield stress
dictates the maximum thickness of the sprayed layer [3].
Among cementitious materials, aerated materials raise growing interest. Entrainment
of air bubbles into concrete, up to 10% by volume, is known to improve its durability in en-
vironments exposed to freeze-thaw cycles [4]. At higher air content, aerated construction
materials are promising for various industrial applications thanks to their low densities,
low raw material needs, and improved thermal and acoustic properties.
The goal of this paper is to understand the effect of air bubbles on the yield stress of
cement pastes containing air below 40% by volume. These materials will be referred to as
"aerated cement paste" or "bubbles suspensions in cement paste" as the word "foams"
usually refers to materials with higher air volume content, above 64% [5], where bub-
bles are densely packed and deformed by their neighbors. In foams, bubble interactions
enhance the rheological properties, therefore the results described in this paper are not
applicable.
Various observations have been reported in the literature concerning aerated cement
pastes or mortars. Aïtcin [4] notes that entrained bubbles improve workability of concrete
whereas Rixom and Mailvaganam [6] reports a large increase of viscosity with the amount
of entrained air. These opposite results may arise from the different experimental proto-
cols and the different paste formulations. To quantify the effect of air inclusions on the
cement paste yield stress independently from the paste composition, we study the yield
stress of the aerated material, τy , normalized by the yield stress of the suspending paste
τr e f . Micromechanical analysis shows that the normalized yield stress is a function of air
volume content Φ and of the ability of the suspending fluid to deform the bubbles [7, 8].
Deformability of the bubbles can be characterized by the Bingham capillary number Cay ,
which compares the suspending fluid yield stress τr e f and the bubble capillary pressure
2γ/R:
Cay =τr e f
2γ/R(3.1)
where γ is the air-liquid surface tension and R is the bubble radius. These curves have
been confirmed experimentally when Cay → ∞ and Cay → 0 [9] for model yield stress
fluids.
In the case of aerated cement paste, comparison with the theoretical model requires
an accurate determination of the yield stress τr e f of the suspending paste. Indeed, this
yield stress depends on the water-to-cement ratio [10] and is affected by the presence of
additives, for instance water reducing agents.
In this study we prepare aerated cement paste by incorporating a precursor aqueous
foam, stabilized by surfactant molecules, into a cement paste. Consequences of addition
of aqueous foam into cement paste is an increase of water-to-cement ratio and possible
interaction between surfactant and cement. We will first study how these two effects af-
64

CHAPTER 3. YIELD STRESS OF AERATED CEMENT PASTE
fect τr e f . Afterwards, we will focus on dimensionless yield stress of aerated cement paste
τy (Φ)/τr e f for two types of surfactant.
3.2 Materials and methods
3.2.1 Materials
We use a CEM I cement from Lafarge, Saint Vigor. Specific surface area is 0.359 m2/g and
chemical composition is given in Table 3.1.
C3S C2S C3A C4AF CaO/SiO2 Al2O3
62.0% 16.0% 2.1% 15.2% 3 4%
MgO Na2O +0.658 K2O SO3 Gypsum L.O.I.
1.1% 0.34 % 2.58 % 2.4% 0.9%
Table 3.1: Chemical composition of CEM I cement from Lafarge, Saint-Vigor
Surfactants are TTAB and Bio-Terge®. TTAB (tetradecyltrimethylammonium bromide)
is a cationic surfactant provided by Sigma-Aldrich, its molar mass is 336 g/mol. Bio-
Terge® is an anionic surfactant provided by Stepan, its molar mass is 315 g/mol. Chemical
formulas for both molecules are given in Fig. 3.1.
Figure 3.1: Chemical formulas of studied surfactants (reproduced from [11])
Cement and both surfactants are the same as in reference [11].
3.2.2 Method
3.2.2.1 Preparation of aerated and reference cement paste
As the yield stress of cementitious material depends on their history, the same time sched-
ule has been followed for all the samples. It is given in Table 3.2.
Reference samples have been made with no foam. In these cases, the same procedure
was followed and surfactant solution was added 28 minutes after addition of cement to
mixing water.
We measure the weight of added foam in cement paste. Amount of water added to
the cement paste with the foam is then taken into account to calculate the final water-to-
cement ratio W/C f of the aerated paste. Final air content Φ is assessed by weighting the
aerated paste in the rheometer cup. By weighting reference samples, whose density can
65

CHAPTER 3. YIELD STRESS OF AERATED CEMENT PASTE
0:00 Addition of cement to water; water to cement ratio is W/Ci
0:30 - 1:00 Mixing of the paste 200 rpm
1:00 - 1:30 Mixing of the paste 800 rpm
1:30 - 3:30 Mixing of the paste 2000 rpm
21:00 - 21:30 Mixing of the paste 2000 rpm
24:00 - 28:30 Addition of foam on cement paste
29:00 - 30:30 Careful mixing of cement paste and foam by hand
30:30 - 31:30 Filling rheometer cup
31:30 Start of rheometer sequence
Table 3.2: Sample preparation protocol
be calculated from the water-to-cement ratio, we note that the maximum error between
theoretical and measured density was 4%. Therefore, we can assume that maximal error
on Φ is 4%.
Note that in the chosen procedure, foam or surfactant solution is added more than 20
minutes after first mixing of cement and water so that surfactant cannot interfere in the
formation of first hydration products [12].
3.2.2.2 Foam generation
Aqueous foam is generated with the device schematized in Fig. 3.2. Bubbles are created
with a small T junction with two inputs: surfactant solution and nitrogen. Bubble diam-
eter depends on the size of the T junction and the flow rates of liquid and gas. All the
bubbles are the same size for each sample. After generation, bubbles are collected in a
column and foam is wetted from the top to prevent it from drying and breaking.
Figure 3.2: Foam generation. All the bubbles are the same size and are generated by small T junc-
tion through with constant rates of surfactant solution and nitrogen flow.
Once foam is ready to use, it is pushed from the column at constant flow rate.
66

CHAPTER 3. YIELD STRESS OF AERATED CEMENT PASTE
3.2.2.3 Samples
We study seven sets of samples. For each of them, water-to-cement ratio before addition
of foam, and foam characteristics (surfactant and bubble size) are kept constant.
Surfactant Surfactant Bubble Initial
concentration diameter W/C
Set T1 TTAB 4.5 g/L 475 +/- 10 µm 0.382
Set T2 TTAB 4.5 g/L 270 µm 0.335
Set T3 TTAB 4.5 g/L 475 +/- 10 µm 0.325
Set T4 TTAB 4.5 g/L 475 +/- 10 µm 0.305
Set T5 TTAB 4.5 g/L 780 +/- 20 µm 0.335
Set B1 Bio-Terge 30 g/L 440 +/- 5 µm 0.329
Set B2 Bio-Terge 8 g/L 590 +/- 10 µm 0.335
Table 3.3: Characteristics of each set of experiments on bubble suspension in cement paste
Sets of reference samples are prepared to match with each set of bubble suspensions.
Their properties are given in Table 3. Same reference data R_T2 is used for T2 and T5
sets. In addition, reference set R_0 refers to yield stress measurement on pastes where no
surfactant solution is added.
Surfactant Surfactant concentration Initial W/C
concentration W/C
Reference set R_0 - - 0.305 to 0.405
Reference set R_T1 TTAB 4.5 g/L 0.382
Reference set R_T2 TTAB 4.5 g/L 0.335
Reference set R_T3 TTAB 4.5 g/L 0.325
Reference set R_T4 TTAB 4.5 g/L 0.305
Reference set R_B1 Bio-Terge 30 g/L 0.329
Reference set R_B2 Bio-Terge 8 g/L 0.335
Table 3.4: Characteristics of each set of experiments on reference cement paste
3.2.2.4 Yield stress measurement
Yield stress measurement are carried out with a vane-in-cup geometry in Ultra+ Kinexus
Rheometer from Malvern. The six-blade vane tool is 5 cm high and 25 mm wide. We
use striated cup to avoid wall slip, diameter is 37 mm and height 62.5 mm. Rheometer
cup is filled with aerated or non-aerated cement paste with a spoon, then vane tool is
slowly inserted in the paste. No pre-shear is carried out prior to yield stress measurement.
This method is chosen to avoid material flow before the measurement in order to prevent
bubble migration due to shear rate heterogeneities [13] and gravity. Indeed, bubble rise
67

CHAPTER 3. YIELD STRESS OF AERATED CEMENT PASTE
in sheared yield stress fluid [14] and particle migration to low shear rate zones [2, 13] are
phenomena which are known to lead to distorted rheological measurements.
Yield stress is measured with a start of flow sequence: shear rate is constant and equal
to 0.01 s−1 for 10 minutes. This shear rate value was chosen by Mahaut et al. [15] to mea-
sure the yield stress of particle suspension in cement paste. For all the samples, stress
increases up to the yield stress and then decreases. Maximum is reached when shear
strain of the sample is between 40 and 45%. Ovarlez et al. [16] showed that this value is
low enough to enable correct measurement of yield stress with a vane tool.
Figure 3.3: Start of flow curves for yield stress measurement of an aerated cement paste (a) and the
corresponding reference paste (b). Examples are from set T3 with air content 31% and set R_T3.
3.3 Results
3.3.1 Reference yield stress
Yield stresses for reference samples are plotted in Fig. 3.4. As expected, when no surfac-
tant is added (crosses on the graph), yield stress decreases when water-to-cement ratio
increases. For each reference data set containing surfactant, yield stress decreases when
the amount of added TTAB solution increases. Same trend is observed with Bio-Terge so-
lution at the smaller concentration (R_B2), even if the decrease is smaller than for TTAB.
On the contrary, when 30 g/L Bio-Terge surfactant solution is used (R_B1), yield stress
increases with added solution amount.
68

CHAPTER 3. YIELD STRESS OF AERATED CEMENT PASTE
Figure 3.4: Yield stress of cement paste without air. Final water-to-cement ratio is calculated from
both initial water and added surfactant solution. Yield stresses for pastes with no surfactant (R_0)
or TTAB surfactant (R_T1 to R_T4) are fitted with equation (1) withΦper c = 0.32,Φmax = 0.545 and
m1 = 65 Pa. In the case of Bio-Terge surfactant, linear regressions for each set of data are plotted
with dotted lines
3.3.2 Aerated cement paste
Yield stresses measured for each data set at different air contents are given in Figs. 3.5 and
3.6.
Evolution of yield stress with increasing foam content is not the same for all data sets:
it is constant in set T1, it decreases in sets T2 to T5 and increases for B1 and B2.
69

CHAPTER 3. YIELD STRESS OF AERATED CEMENT PASTE
Figure 3.5: Yield stresses of cement pastes mixed with TTAB foams. Bubble diameter is 475 µm
for T1,T3 and T4, 270 µmm for T2 and 780 µm for T5. Initial water-to-cement ratio is 0.382 for T1,
0.335 for T2 and T5, 0.325 for T3 and 0.305 for T4.
Figure 3.6: Yield stresses of cement pastes mixed with Bio-Terge foams. Bubble diameter is 440µm
for B1 and 590 µmm for B2. Initial water-to-cement ratio is 0.329 for B1 and 0.335 for B2.
3.4 Discussion
3.4.1 Reference yield stress with surfactant
We showed in a previous study that ionic surfactants, mainly anionic, can strongly affect
yield stress when they are added to a cement paste (see chapter 2 [11]). At low concentra-
tion, adsorbed surfactant monolayer tends to make the cement grain surface hydropho-
bic and creates hydrophobic attraction between cement grains. At macroscopic scale,
increase of yield stress has been measured. At high surfactant concentration, surfactant
agglomeration on the solid surfaces leads to steric repulsion between cement grains and a
drop of the paste yield stress. In Fig. 3.7, yield stress for cement paste containing TTAB and
Bio-Terge are given as a function of surfactant concentration for cement pastes at W/C f =0.5 prepared as in reference [11]. Even if W/C is not the same in the present study, we can
70

CHAPTER 3. YIELD STRESS OF AERATED CEMENT PASTE
use these curves to estimate the concentration regime for both surfactants.
Figure 3.7: Effect of surfactant concentration on the yield stress of cement pastes at W/C f =0.5
prepared following the protocol described in [11]. Doted line shows yield stress of the paste with
no surfactant (12 Pa). Grey areas show the surfactant concentrations used in the present chapter.
Let us calculate the final surfactant concentrations CTA, f after mixing foam and ce-
ment paste. They depend on the concentration in the foaming solution CTA,i , on the ini-
tial water-to-cement ratio of precursor cement paste W/Ci and the final water-to-cement
ratio W/C f .
CTA, f = CTA,iW/C f −W/Ci
W/C f(3.2)
Surfactant concentrations range from 0.03 to 0.2 g/L for samples containing TTAB and
between 0.08 and 0.8 g/L for Bio-Terge. We can see in Fig. 3.7 that for both surfactants,
these concentrations well below the concentrations at which maximum yield stresses are
expected. Surfactants are therefore in the low concentration regime, where yield stress
can be enhanced by hydrophobic interactions, but due to the very low concentrations
used, we can expect this effect to be minor. Further analysis is made below for each sur-
factant.
3.4.1.1 Reference yield stress with TTAB
In Fig. 3.4, all reference yield stresses, when no surfactant is added or when TTAB is added,
seem to follow a single curve. First of all, this shows that TTAB, at the concentrations we
use here, has no effect on yield stress. In addition, yield stress depends only on the water
content of the cement paste, including both initial mixing water and foaming solution
added later.
We choose to fit TTAB reference curve with equation 3.3 from the Yodel [10]:
τr e f = m1
Φ2p (Φp −Φper c )
Φmax(Φmax −Φp )(3.3)
In this equation, m1 accounts for the intensity of the interactions between cement
grains, whose major components are Van der Waals, electrostatic and steric forces [10].
Φp is the solid volume fraction and is related to the water-to-cement ratio and to the den-
sities of water ρw and cement ρc :
71

CHAPTER 3. YIELD STRESS OF AERATED CEMENT PASTE
Φp = 1/(1+ρc /ρw W/C) (3.4)
Φper c is the percolation threshold, Φmax is the maximal solid fraction .
This curve is shown in Figure 4 by a solid line with parameters Φper c = 0.32, Φmax =0.545 and m1 = 65 Pa.
3.4.1.2 Reference yield stress with Bio-Terge
When Bio-Terge solution is added to cement paste, yield stress is higher than for sam-
ples containing TTAB or no surfactant at the same water-to-cement ratio. In fact, addi-
tion of Bio-Terge solutions into cement pastes has two consequences: solid fraction Φp
decreases and the intensity of of the attractive forces between cement grains increases.
Therefore, reference yield stress τr e f cannot be fitted by an equation like 3.3. We choose
to use linear regressions:
τr e f = 1062 W/C−257 for experiment set B1 (3.5)
τr e f = 369−859 W/C for experiment set B2 (3.6)
3.4.2 Dimensionless yield stress
Results normalized with reference yield stresses from equations 3.3, 3.6 and 3.6 are shown
in Fig. 3.8.
Figure 3.8: Dimensionless yield stress for all samples. For samples made with TTAB, bubble diam-
eter is 475 µm for T1,T3 and T4, 270 µm for T2 and 780 µm for T5; initial water-to-cement ratio is
0.382 for T1, 0.335 for T2 and T5, 0.325 for T3 and 0.305 for T4. For samples made with Bio-Terge,
bubble diameter is 440 µm for B1 and 590 µm for B2. Initial water-to-cement ratio is 0.329 for B1
and 0.335 for B2.
The dimensionless yield stresses of bubble suspensions in cement paste exhibit dif-
ferent behaviors depending on the surfactant. In the case of cationic surfactant TTAB, it
is smaller than 1, that is to say that addition of air inclusions reduce the yield stress. On
the other hand, in the case of Bio-Terge (anionic), air inclusions enhance yield stress.
72

CHAPTER 3. YIELD STRESS OF AERATED CEMENT PASTE
Observation of bubbles shows that bubble surface aspect is very different in the TTAB
and Bio-Terge samples. In Fig. 3.9, picture on the right shows that bubbles in Bio-Terge
sample are covered with a layer of cement grains. We can see that as bubbles rise in the
paste, the grain layer cracks. On the contrary, no layer of cement grain is visible around the
bubbles stabilized by TTAB (Fig. 3.9, left). Observation of bubbles in samples containing
TTAB is difficult because they tend to break as soon as they reach the sample surface. On
the contrary, in samples from set B1, only few bubbles break.
Figure 3.9: Left: sample from set T1 containing TTAB. Right: sample from set B1 containing Bio-
Terge. Note that bubbles tend to break rapidly when exposed to air, especially for samples con-
taining TTAB, so that the number of the bubbles on each picture is not representative of the air
content. Width for each image is 1.5 mm.
The different effect of bubble incorporation on cement paste yield stress is presum-
ably related to the different aspects of bubble surface. In the following we compare the
dimensionless yield stress with theoretical models for each of the surfactants.
3.4.3 Bare bubbles (TTAB)
In order to compare TTAB data sets with the micromechanical model from [7, 8], we need
to calculate the capillary numbers Cay = τy,r e f R/(2γ). As mentioned previously, refer-
ence yield stress τy,r e f decreases with increasing liquid content as shown by equation 3.3.
Besides, at low surfactant concentration, surface tension γ decreases when concentra-
tion increases. Its variation for cement paste interstitial fluid containing TTAB is reported
in [11] and illustrated in Fig. 3.10 as a function of TTAB residual concentration Cr es , i.e.
concentration of TTAB molecules in solution. In concentration range 0.02-0.2 g/L, we can
assume, for γ in mN/m and Cr es in g/L that γ= 31−6.8∗ l n(Cr es).
We assume that the amount of adsorbed TTAB molecules is small compared to the
residual molecules in solution, so Cr es ≈ CCA, f . Therefore, Bingham capillary numbers for
each set of results are given in Table 3.5.
Theoretical dimensionless yield stress for non-deformable bubbles Cay → 0, is indi-
cated by a full line in Fig. 3.11 and is given by [7, 8]:
73

CHAPTER 3. YIELD STRESS OF AERATED CEMENT PASTE
Figure 3.10: Surface tension of TTAB solution in cement paste interstitial fluid used to calculate
Bingham capillary numbers. Grey dots are measurements taken from [11].
Set Cay
T1 0.08
T2 0.10
T3 0.21 - 0.23
T4 0.34 - 0.36
T5 0.28 - 0.30
Table 3.5: Bingham capillary numbers for experiments with TTAB
τy /τr e f =√
(1−Φ)5+3Φ
5−2Φwhen Cay → 0 (3.7)
When the bubble are fully deformable (Cay →∞), the relation becomes:
τy /τr e f =√
(1−Φ)3−3Φ
3+Φ when Cay →∞ (3.8)
This is shown by the dotted line in Fig. 3.11.
Both curves have also been obtained experimentally for bubble suspensions in a model
yield stress fluid (concentrated oil-in-water emulsion) by Ducloué et al. [9]. Experimental
results fitted with equation 3.7 for 0.0069 ≤ Cay ≤ 0.11 and with equation 3.8 for Cay =0.57.
In Fig. 3.11, dimensionless yield stress results of aerated cement paste with TTAB have
been plotted and can be compared with both theoretical curves.
At low air content, dimensionless yield stresses obtained from our measurement seems
to tend toward a value smaller than 1. This behavior must be an experimental artifact and
shows that despite all our effort to keep the same preparation protocol for aerated and
reference samples, shearing of the paste during hand mixing may be influenced by the
presence of bubbles.
However, all the results are located as expected between the two theoretical curves.
Moreover, dimensionless yield stress depends only on the capillary number (it does not
depend on the reference yield stress or the bubble size) as sets T1 and T2 follow the same
curve, and sets T4 and T5 are very close. This can be seen mainly at high air content. The
higher the capillary number, the lower the dimensionless yield stress.
74

CHAPTER 3. YIELD STRESS OF AERATED CEMENT PASTE
Figure 3.11: Dimensionless yield stress for samples made with TTAB. Theoretical curves, which
have been observed experimentally on model yield stress fluid by Ducloué [17], are indicated for
non-deformable bubbles (full line) and fully deformable bubbles (dotted line).
3.4.4 Particle covered bubbles
Surface tension of Bio-Terge in interstitial solution of cement paste can be approximated
by 30 mN/m if Cr es > 0.3 and 18−12ln(Cr es) at lower concentrations (see Fig. 3.12).
Figure 3.12: Surface tension of Bio-Terge solution in cement paste interstitial fluid used to calcu-
late capillary numbers. Grey dots are measurements taken from [11].
Bingham capillary numbers calculated following the same method as for TTAB are be-
tween 0.32 and 0.38 for B1 and between 0.24 and 0.30 for B2. Note that the assumption
Cr es ≈ C f ,TA may not be valid for Bio-Terge because of its high affinity to cement grain
surface. We probably overestimate of Cr es and thus overestimate the capillary numbers.
However, the values are the same order of magnitude as the capillary numbers calculated
for TTAB. Thus, the specific behavior of Bio-Terge bubbles cannot be related to the capil-
lary number.
The particle layer on the bubble surface suggests that the behavior in the case of Bio-
Terge lies in the modified surface properties of the bubbles. Particle covered interfaces
have first been reported by Ramsden [18] and Pickering [19]. Afterwards, particles covered
films, bubbles and foams have raised a lot of attention due to their increased life time
compared to surfactant stabilized systems [20, 21, 22, 23, 24]. First requirement to allow
solid particle adsorption at air-water or oil-water interface is that the particles must be
partially hydrophobic. Then, the elastrostic barrier to particle adsorption must be low
enough [25].
75

CHAPTER 3. YIELD STRESS OF AERATED CEMENT PASTE
Increase of contact angle of water on cement grains has been observed in the pres-
ence of low amount of Bio-Terge, so that we can assume that the first point is fulfilled.
Cement grains have size comprised between a few and 100 µm with average value close
to 10 µm [15]. Due to their irregular shape, radius of curvature of the edges is several or-
ders of magnitude below the grain size [26], which decreases the adsorption barrier [25].
In addition, cement solution contains a high concentration of dissolved ions [12], and this
high electrolyte content is known to reduce electrostatic repulsion between charged par-
ticles and interface, which also reduces the adsorption barrier [25]. All these aspects show
that cement particles covered by a monolayer of Bio-Terge molecules are good candidates
to adsorb at air-water interfaces.
Once partially hydrophobic solid particles are adsorbed at interfaces, energy required
to remove them is very high. Desorption energy EDes for spheres is given by the for-
mula [27]:
EDes = γa2π(1− | cosθ |)2 (3.9)
Where a is the radius of the particles and θ the contact angle. Note that in the case of
irregularly shaped particles, desorption energy is higher than in the case of spheres be-
cause anisotropic particles tend to settle at the interface with the orientation which max-
imizes the desorption energy [28]. In the case of cement, calculation with πγ∼100 mN/m
and a ∼ 10 µm gives EDes ∼ 10−11 J if θ=90°and EDes ∼ 10−12 J if θ=60°.
To evaluate if shearing of the cement paste can desorb the cement grains, we can com-
pare this value to the shear energy. For simple shear, energy per unit volume is τ ·ε, where
the shear stress τ is of the order of magnitude of the yield stress τy,r e f ∼ 100 Pa and the
deformation ε is about 1 in our experiments. Integration on the particle volume a3 gives
Eshear ∼ 10−13 J.
Therefore, the Bio-Terge covered cement grains cannot not desorb from bubbles sur-
face during yield stress measurement.
To understand the effect of the cement particle shell on the grain surface, we can com-
pare Bio-Terge results with dimensionless yield stress of solid particle suspensions in ce-
ment paste. Procedure followed for the tests is the same as described in paragraph 3.2.2.1;
at 27 minutes after preparation of the cement paste, we added to the paste 500 µm diam-
eter polystyrene beads or 2 mm diameter glass beads. These additional samples contain
no surfactant, so reference yield stress is given by equation 3.3.
Like for bubbles, micromechanical analysis provides a theoretical curve for unde-
formable solid particles. This theoretical analysis requires that the yield stress fluid is
continuous and homogeneous compared to the beads. In the case of cement paste, this
means that the beads must be much bigger than the cement grains. Moreover, it assumes
no slip condition at the bead surface [7]. Dimensionless yield stress of a bead suspension
in a yield stress fluid is :
τy /τr e f =√
(1−Φ)
(1−Φ/Φm)2.5Φm(3.10)
76

CHAPTER 3. YIELD STRESS OF AERATED CEMENT PASTE
where Φm is the maximal packing fraction of the beads when material is sheared. This
curve has been experimentally validated in model yield stress materials [13] and in ce-
ment paste [15]. Φm value measured in cement paste is 0.56. In Fig. 3.13, our experimen-
tal results for Bio-Terge bubbles and for beads can be compared with the bead theoretical
curve.
Figure 3.13: Dimensionless yield stress for samples made with Bio-Terge. Dotted line correspond
to the theoretical curve for a suspension of solid spheres with maximal solid fraction 0.56. Crosses
correspond to measurements carried out with 500 µm polystyrene beads or 2 mm glass beads.
Similarly to the theoretical curve, our bead experimental results show that dimension-
less yield stress increases when the volume fraction of inclusions increases. In addition,
no dependence on the bead size can be seen. However, experimental points are above
the expected values. This must be related to our experimental method and the difficulty
to follow accurately the same protocol for cement paste with and without inclusions.
No major effect of Bio-Terge concentration is observed on the dimensionless yield
stress. During preparation hovewer, we note incorporating aqueous foam in cement paste
was more difficult for B2 measurements, where Bio-Terge concentration is lower, because
the bubbles tend to break during hand mixing.
The main observation is that Bio-Terge data points coincide with experimental mea-
surements with polystyrene and glass beads. That is to say that the armored bubbles be-
have like solid inclusions. Our hypothesis is that adsorbed particles provide to the bubbles
a surface solid layer with roughness which prevents the slipping of the continuous phase
during shearing.
Striking point is that the armored bubbles behave like indeformable objects, even if
Bingham capillary number the Bio-Terge sets of experiments are below 0.38, a value cor-
responding to partially deformable bubbles in the case of TTAB. Evaluation of deforma-
bility by Bingham capillary number may not be relevant in the case of armored bubbles
because the adsorbed particle layer increases the surface elasticity of the bubbles [24]
which opposes deformation.
3.5 Conclusion
We have investigated the effect of added bubbles of chosen size on the yield stress of aer-
ated cement paste. Bubbles are stabilized with two surfactants, which are know to have
77

CHAPTER 3. YIELD STRESS OF AERATED CEMENT PASTE
different affinities to cement grains.
Behavior of the bubbles is strongly affected by the surfactant. When surfactant has low
affinity to cement grains, dimensionless yield stress depends on Bingham capillary num-
ber, which accounts for the deformability of the bubbles. While non-deformable bubbles
(Cay ∼ 0.1) do not change the yield stress, dimensionless yield stress decreases with air
volume content for deformable bubbles (Cay & 0.2).
Totally different behavior is observed when surfactant adsorbs on cement grains. Ef-
fect of bubbles is comparable to solid inclusions, and no effect of bubble size and sur-
factant amount can be seen. We attribute this effect to the irreversible adsorption of hy-
drobobic cement particles at the bubbles surface which change the surface properties of
the bubbles.
Bibliography
[1] N. Massoussi, E. Keita, and N. Roussel, “The heterogeneous nature of bleeding in
cement pastes,” Cement and Concrete Research, vol. 95, pp. 108–116, 2017. 63, 64
[2] G. Ovarlez, F. Bertrand, and S. Rodts, “Local determination of the constitutive law of
a dense suspension of noncolloidal particles through magnetic resonance imaging,”
Journal of Rheology, vol. 50, pp. 259–292, 2006. 64, 68
[3] F. Gorlier, Y. Khidas, and O. Pitois, “Yielding of complex liquid foams,” Journal of
Rheology, vol. 61, pp. 919–930, 2017. 64
[4] P.-C. Aïtcin, “Entrained air in concrete: rheology and freezing resistance,” in Science
and Technology of Concrete Admixtures (P.-C. Aïtcin and R. J. Flatt, eds.), pp. 87–95,
Woodhead publishing, 2016. 64
[5] I. Cantat, S. Cohen-Addad, F. Elias, F. Graner, R. Höhler, O. Pitois, F. Rouyer, and
A. Saint-Jalmes, Foams - Structure and dynamics. Oxford University Press, 2013. 64
[6] R. Rixom and N. Mailvaganam, Chemical Admixtures for Concrete. E. & F.N. Spon Ltd,
3rd ed. ed., 1999. p106+. 64
[7] X. Chateau, G. Ovarlez, and K. Trung, “Homogenization approach to the behavior
of suspensions of noncolloidal particles in yield stress fluids,” Journal of rheology,
vol. 52, no. 2, pp. 489–506, 2008. 64, 73, 76
[8] T. L. Nguyen Thi, L. Ducloué, G. Ovarlez, and X. Chateau, “Rhéologie des suspen-
sions de bulles dans un fluide à seuil,” in 21ème Congrès Français de Mécanique,
(Bordeaux, France), August 2013. 64, 73
[9] L. Ducloué, O. Pitois, J. Goyon, X. Chateau, and G. Ovarlez, “Rheological behaviour
of suspensions of bubbles in yield stress fluids,” Journal of Non-Newtonian Fluid Me-
chanics, vol. 215, pp. 31–39, 2015. 64, 74
78

CHAPTER 3. YIELD STRESS OF AERATED CEMENT PASTE
[10] R. J. Flatt and P. Bowen, “Yodel: a yield stress model for suspensions,” Journal of the
American Ceramic Society, vol. 89, no. 4, pp. 1244–1256, 2006. 64, 71
[11] B. Feneuil, O. Pitois, and N. Roussel, “Effect of surfactants on the yield stress of ce-
ment paste,” Cement and Concrete Research, vol. 100, pp. 32–39, 2017. 65, 70, 71, 73,
74, 75
[12] H. Bessaies-Bey, Polymères et propriétés rhéologiques d’une pâte de ciment : une ap-
proche physique générique. PhD thesis, Université Paris-Est - SIE, 2015. 66, 76
[13] F. Mahaut, X. Chateau, P. Coussot, and G. Ovarlez, “Yield stress and elastic modulus
of suspensions of non-colloidal particles in yield stress fluids,” Journal of Rheology,
vol. 52, pp. 287–313, 2008. 67, 68, 77
[14] J. Goyon, F. Bertrand, O. Pitois, and G. Ovarlez, “Shear induced drainage in foamy
yield-stress fluids,” Physical Review Letters, vol. 104, p. 128301, 2010. 68
[15] F. Mahaut, S. Mokéddem, X. Chateau, N. Roussel, and G. Ovarlez, “Effect of coarse
particle volume fraction on the yield stress and thixotropy of cementitious materi-
als,” Cement and Concrete Research, vol. 38, pp. 1276–1285, 2008. 68, 76, 77
[16] G. Ovarlez, F. Mahaut, F. Bertrand, and X. Chateau, “Flows and heterogeneities with a
vane tool: Magnetic resonance imaging measurements,” Journal of rheology, vol. 55,
pp. 197–223, 2011. 68
[17] L. Ducloué, Comportement rhéologique des fluides à seuil aérés. PhD thesis, Univer-
sité Paris Est, 2014. 75
[18] W. Ramsden, “Separation of solids in the surface-layers of solutions and ‘suspen-
sions’ - preliminary account,” Proceedings of the Royal Society of London, vol. 72,
pp. 156–164, 1904. 75
[19] S. U. Pickering, “Emulsions,” Journal of Chemical Society, vol. 91, pp. 2001–2021,
1907. 75
[20] B. P. Binks, “Particles as surfactants - similarities and differences,” Current Opinion
in Colloid & Interface Science, vol. 7, pp. 21–41, 2002. 75
[21] M. Abkarian, A. B. Subramaniam, S.-H. Kim, R. Larsen, S.-M. Yang, , and H. A. Stone,
“Dissolution arrest and stability of armored bubbles,” Physical Review Letters, vol. 99,
p. 188301, 2006. 75
[22] O. Pitois, M. Buisson, and X. Chateau, “On the collapse pressure of armored bubbles
and drops,” European Physical Journal E, vol. 38, p. 48, 2015. 75
[23] N. Taccoen, F. Lequeux, D. Z. Gunes, and C. N. Baroud, “Probing the mechani-
cal strength of an armored bubble and its implication to particle-stabilized foams,”
Physical Review X, vol. 6, no. 1, p. 011010, 2016. 75
79

CHAPTER 3. YIELD STRESS OF AERATED CEMENT PASTE
[24] A. Stocco, E. Rio, B. Binks, and D. Langevin, “Aqueous foams stabilized solely by par-
ticles,” Soft Matter, vol. 7, no. 4, pp. 1260–1267, 2011. 75, 77
[25] S. Tcholakova, N. D. Denkov, and A. Lips, “Comparison of solid particles, globu-
lar proteins and surfactants as emulsifiers,” Physical Chemistry Chemical Physics,
vol. 10, pp. 1608–1627, 2008. 75, 76
[26] N. Roussel, A. Lemaître, R. J. Flatt., and P. Coussot, “Steady state flow of cement
suspensions: A micromechanical state of the art.,” Cement and Concrete Research,
vol. 40, pp. 77–84, 2010. 76
[27] N. D. Denkov, I. B. Ivanov, and P. A. Kralchevski, “A possible mechanism of stabi-
lization of emulsions by solid particles,” Journal of Colloids and Interface Science,
vol. 150, no. 2, pp. 589–593, 1992. 76
[28] N. Ballard and S. A. F. Bon, “Equilibrium orientations of non-spherical and chemi-
cally anisotropic particles at liquid-liquid interfaces and the effect on emulsion sta-
bility,” Journal of Colloid and Interface Science, vol. 448, pp. 533–544, 2015. 76
80

Chapter 4
Optimal cement paste yield stress for the
production of stable cement foams
Sommaire4.1 Introduction . . . . . . . . . . . . . . . . . . . . . . . . . . . . . . . . . . . . 82
4.2 Materials and methods . . . . . . . . . . . . . . . . . . . . . . . . . . . . . . 83
4.2.1 Materials . . . . . . . . . . . . . . . . . . . . . . . . . . . . . . . . . . . 83
4.2.2 Methods . . . . . . . . . . . . . . . . . . . . . . . . . . . . . . . . . . . 84
4.2.2.1 Protocol . . . . . . . . . . . . . . . . . . . . . . . . . . . . . . 84
4.2.2.2 Precursor foam . . . . . . . . . . . . . . . . . . . . . . . . . . 84
4.2.2.3 Mixing . . . . . . . . . . . . . . . . . . . . . . . . . . . . . . . 84
4.2.2.4 Final stability . . . . . . . . . . . . . . . . . . . . . . . . . . . 85
4.2.2.5 Rheological measurement . . . . . . . . . . . . . . . . . . . 86
4.2.2.6 Water suction out of the cement pastes . . . . . . . . . . . . 86
4.2.3 Cement paste yield stress . . . . . . . . . . . . . . . . . . . . . . . . . 86
4.3 Results . . . . . . . . . . . . . . . . . . . . . . . . . . . . . . . . . . . . . . . 88
4.3.1 Stability . . . . . . . . . . . . . . . . . . . . . . . . . . . . . . . . . . . . 88
4.3.2 Rheological measurements . . . . . . . . . . . . . . . . . . . . . . . . 90
4.3.2.1 Foam yield stress . . . . . . . . . . . . . . . . . . . . . . . . . 90
4.3.2.2 Elasticity . . . . . . . . . . . . . . . . . . . . . . . . . . . . . . 90
4.3.3 Water suction . . . . . . . . . . . . . . . . . . . . . . . . . . . . . . . . 91
4.4 Discussion . . . . . . . . . . . . . . . . . . . . . . . . . . . . . . . . . . . . . 92
4.4.1 Comparison with aqueous foams . . . . . . . . . . . . . . . . . . . . 92
4.4.2 Early age rheological properties . . . . . . . . . . . . . . . . . . . . . 93
4.4.3 Time evolution of rheological properties . . . . . . . . . . . . . . . . 95
4.4.4 Stability loss at very high surfactant content . . . . . . . . . . . . . . 97
4.5 Conclusion . . . . . . . . . . . . . . . . . . . . . . . . . . . . . . . . . . . . . 98
81

CHAPTER 4. OPTIMAL CEMENT PASTE YIELD STRESS FOR THE PRODUCTION OFSTABLE CEMENT FOAMS
Bibliography . . . . . . . . . . . . . . . . . . . . . . . . . . . . . . . . . . . . . . . 101
4.1 Introduction
Cement foams are highly porous materials which offer interesting thermal insulation pro-
perties. When cement foam density decreases, thermal resistance is improved but me-
chanical strength decreases [1]. Control of bubble morphology is a crucial issue to op-
timize all macroscopic properties at a given density. For example, bubble size and pore
connections are control parameters for acoustic absorption [2] and flow permeability [3].
Several foam production methods have been reported in the literature, including che-
mical foaming, air entrainment and mixing with aqueous precursor foam. In the precur-
sor foam method, cement slurry and aqueous foam are prepared separately before being
mixed together. Resulting cement foam morphology depends on (1) the precursor foam
morphology, (2) the capacity of the mixing process to preserve the precursor foam bub-
ble sizes and (3) the bubble size evolution in the sample at rest until cement hydration.
Third point is challenging. As long as the material embedding the bubbles is not solid,
foam destabilization occurs through three mechanisms [4]: drainage is caused by specific
gravity difference between air bubbles and cement paste, ripening is a gas transfer from
smaller bubbles to bigger bubbles, and coalescence refers to thin film breakage between
two neighbor bubbles. Both drainage and ripening are affected by the consistency of the
suspending fluid. Promising method to stop or slow them down is to increase the fluid
yield stress in order to counteract bubble rise and deformation processes [5, 6, 7].
In the case of cement foams, yield stress results from attractive interaction between
cement grains. It depends on both the intensity of these interparticle forces and the par-
ticle volume content [8]. Particle volume content is related to the water-to-cement ratio
and interparticle forces can be tuned by additives. For instance, superplasticizers adsorb
on cement grains, which causes steric repulsion between cement grains and decrease of
yield stress [9]. In a cement foam made from precursor aqueous foam, surfactants are
needed to reduce air-fluid surface tension and stabilize the films separating the bubbles.
Some of them, mainly anionic surfactants, have been shown to have a strong affinity to-
wards cement grains and change the yield stress (see chapter 2 [10]). When they are added
in small amount in cement paste, adsorbed molecules form an hydrophobic layer on ce-
ment grains. Resulting hydrophobic attraction between cement grains leads to an in-
crease of the macroscopic yield stress. On the other hand, when large amount of anionic
surfactant is added to cement paste, surfactant molecules agglomerate into micelles on
cement grains surface and leads to steric repulsion and a strong decrease of yield stress.
In this paper we investigate the effect of yield stress on the stability of cement foams.
Yield stress is controlled by using additives, either superplasticizer or large amount of
anionic surfactant. Additionally, in order to assess the rheological behavior of the cement
paste as confined between the bubbles, we perform rheological measurements on cement
foams.
82
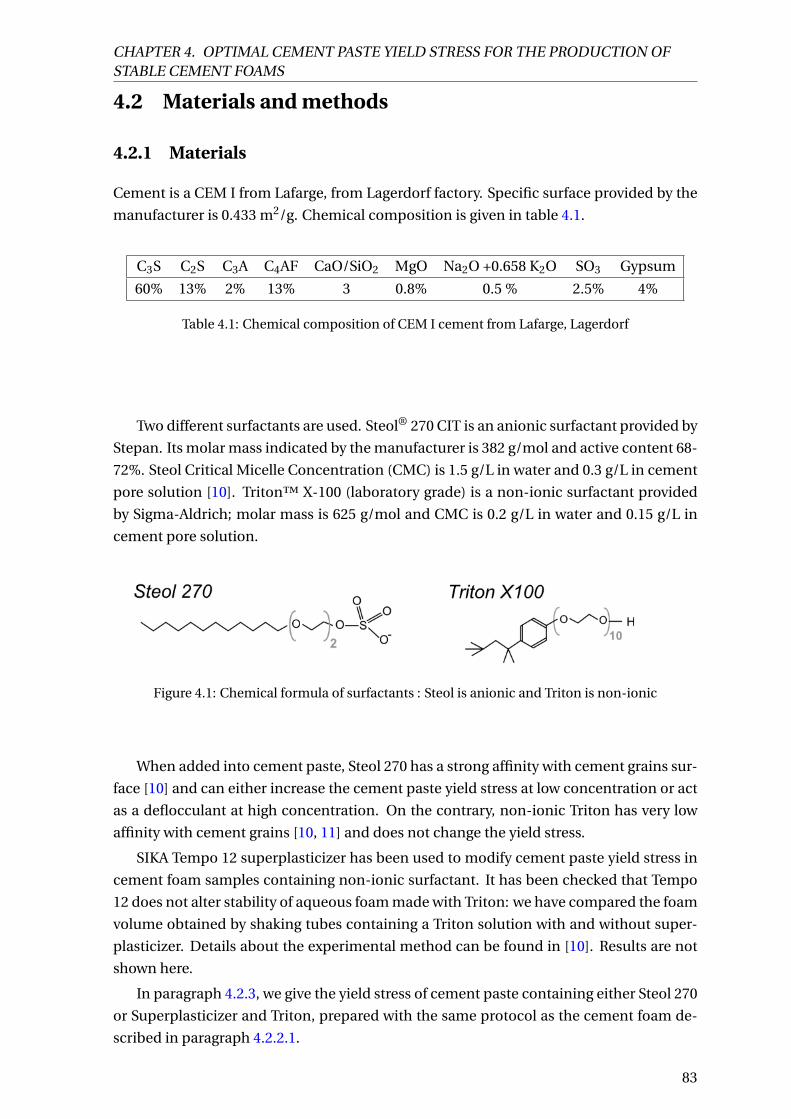
CHAPTER 4. OPTIMAL CEMENT PASTE YIELD STRESS FOR THE PRODUCTION OFSTABLE CEMENT FOAMS
4.2 Materials and methods
4.2.1 Materials
Cement is a CEM I from Lafarge, from Lagerdorf factory. Specific surface provided by the
manufacturer is 0.433 m2/g. Chemical composition is given in table 4.1.
C3S C2S C3A C4AF CaO/SiO2 MgO Na2O +0.658 K2O SO3 Gypsum
60% 13% 2% 13% 3 0.8% 0.5 % 2.5% 4%
Table 4.1: Chemical composition of CEM I cement from Lafarge, Lagerdorf
Two different surfactants are used. Steol® 270 CIT is an anionic surfactant provided by
Stepan. Its molar mass indicated by the manufacturer is 382 g/mol and active content 68-
72%. Steol Critical Micelle Concentration (CMC) is 1.5 g/L in water and 0.3 g/L in cement
pore solution [10]. Triton™ X-100 (laboratory grade) is a non-ionic surfactant provided
by Sigma-Aldrich; molar mass is 625 g/mol and CMC is 0.2 g/L in water and 0.15 g/L in
cement pore solution.
Figure 4.1: Chemical formula of surfactants : Steol is anionic and Triton is non-ionic
When added into cement paste, Steol 270 has a strong affinity with cement grains sur-
face [10] and can either increase the cement paste yield stress at low concentration or act
as a deflocculant at high concentration. On the contrary, non-ionic Triton has very low
affinity with cement grains [10, 11] and does not change the yield stress.
SIKA Tempo 12 superplasticizer has been used to modify cement paste yield stress in
cement foam samples containing non-ionic surfactant. It has been checked that Tempo
12 does not alter stability of aqueous foam made with Triton: we have compared the foam
volume obtained by shaking tubes containing a Triton solution with and without super-
plasticizer. Details about the experimental method can be found in [10]. Results are not
shown here.
In paragraph 4.2.3, we give the yield stress of cement paste containing either Steol 270
or Superplasticizer and Triton, prepared with the same protocol as the cement foam de-
scribed in paragraph 4.2.2.1.
83

CHAPTER 4. OPTIMAL CEMENT PASTE YIELD STRESS FOR THE PRODUCTION OFSTABLE CEMENT FOAMS
4.2.2 Methods
4.2.2.1 Protocol
In order to remove any effect of cement paste age on results, all cement foams are pre-
pared following the same time schedule, from initial water and cement mixing to sample
casting or rheometry measurement.
Water is mixed with cement paste at initial water-to-cement ratio W/Ci =0.35 or 0.32
and then left at rest for 20 minutes to allow the formation of sulfo-aluminate phases.
Then, a deflocculant is added. Deflocculant is either Steol surfactant added in large quan-
tity or SIKA Tempo 12 superplasticizer. Cement paste is then mixed with precursor foam.
This procedure is schematized in Fig. 4.2.
Figure 4.2: Preparation protocol of cement foams made with Steol anionic surfactant and Triton
non-ionic surfactant.
4.2.2.2 Precursor foam
Precursor aqueous foam generator is schematized in figure 4.3. Nitrogen and surfac-
tant solution (concentration 1 g/L for both surfactants) flow in T-junction. Characteristic
length of the T-junction is lT = 100 µm. The capillary pressure PC depends on the gas-
liquid surface tension γ ∼ 10 mN/m and is PC ∼ γ/lT ∼ 102 Pa. The hydrostatic pressure
PH depends on the liquid density ρl i q ∼ 1000 kg /m3: PH = ρl i q g lT ∼ 1 Pa. Therefore, as
PC À PH, capillary effects dominate gravity effects, and liquid and gas pass alternately,
which leads to the formation of bubbles. Bubble diameter depends on the flow rates of
surfactant solution and nitrogen respectively, and on the T junction size.
Then, created bubbles are collected in a vertical column. Imbibition flow at the foam
top compensates liquid loss due to drainage and is used to tune the precursor foam liquid
fraction. Precursor foam is mixed with cement paste about 40 minutes after the beginning
of the generation, when ripening has not started to occur in the column.
Bubble radius for all precursor foams is R = 390±20 µm and liquid fraction 1.4±0.1%.
4.2.2.3 Mixing
To mix precursor foam and cement paste, we use a convergent mixing device schematized
in Fig. 4.3, right. Cement paste flows in a conic tube, which length is L = 4 cm, smaller
diameter at cone exit 2 mm and cone angle 3°. Then, mixing of paste and precursor foam
84

CHAPTER 4. OPTIMAL CEMENT PASTE YIELD STRESS FOR THE PRODUCTION OFSTABLE CEMENT FOAMS
Figure 4.3: Schema of precursor foam generation (left) and mixing device (right)
takes place thanks to a 1.5 mm diameter constriction. Input flow rates are chosen so that
final air content is Φ = 83%±1%. Note that this mixing method involves the flow of the
precursor cement paste in small tubes, which requires moderate cement paste yield stress
(below a few 10 Pa). For each cement foam sample, we first fill the rheometer cup for yield
stress or elasticity measurement and then a mold for stability assessment.
4.2.2.4 Final stability
Samples are casted in 6 cm high 2.6 cm-diameter air-tight plastic cylinders. We checked
that foams do no break when they are in contact with the mold walls. Samples are de-
molded 7 days after casting. Cement foam stability is visually assessed and samples are
classified within the five categories illustrated in Fig. 4.4:
• 3: fully stable sample
• 2: large stable area
• 1: small stable area(s)
• 0: no stable area
• -1: sample collapse
Figure 4.4: Example of samples illustrating each stability class. Sample height is 6 cm.
85

CHAPTER 4. OPTIMAL CEMENT PASTE YIELD STRESS FOR THE PRODUCTION OFSTABLE CEMENT FOAMS
It can be noted that the final stability is the result of many competing phenomena
including the intrinsic stability of the foam and the time during which the foam is exposed
to destabilisation. This time relates to the setting time of the system.
4.2.2.5 Rheological measurement
To measure rheological properties of cement foams, we use stress controlled Kinexus Ul-
tra+ rheometer from Malvern with a Vane geometry. Cup is striated to avoid wall-slip,
height is 6 cm and diameter 37 mm. Six-blade Vane tool is 5 cm high and 25 mm large.
Each measurement sequence starts with stress relaxation during 30 s. Then, either yield
stress is measured with a start of flow curve at flow rate ε= 0.01 s−1, or elastic modulus is
monitored with 10−5 amplitude oscillations at 1 Hz.
In the elastic regime, energy balance shows that local deformation εl in the foam skele-
ton is related to the macroscopic deformation ε by the relation εl = εp
1−Φ [12] whereΦ is
the volume air content. Therefore, local strain amplitude during elastic measurements is
4.10−6. This value is well below both critical strains related to flocculation and formation
of CSH bridges between cement grains [13]. Therefore, we expect that elasticity mea-
surement does not affect material thixotropic behavior and is, as such, a non-destructive
measurement.
4.2.2.6 Water suction out of the cement pastes
Cement paste containing surfactant (and superplasticizer in the case of Triton) are pre-
pared as described in paragraph 4.2.2.1, but here only surfactant solution at 1 g/L is added
instead of foam. We call free cement paste this bulk paste whose composition is expected
to be the same as the foam interstitial paste.
We measure free cement paste ability to release water with the experimental device
schematized in Fig. 4.5. A 1.6-cm thick layer of cement paste containing Steol surfactant
is placed on one side of a U-shaped tube filled with water. A filter (0.45 µm) separates the
cement paste and the tube. It can be crossed by the water but not by the cement grains.
Surface of water in the other branch of the tube is free to move. When the cement paste
is raised above the free water surface at height h, pressure difference ∆P = ρl i q g h is cre-
ated at the bottom of the cement paste. Volume of extracted water can then be deduced
from the displacement of the free water surface. Note that h decreases during the time of
the experiment because water extraction makes the free water surface rise. For each ex-
periment, pressure is ∆P0 = 440 Pa and decreases to a value comprised between 400 and
375 Pa after 10 minutes. The value chosen for∆P0 accounts for the hydrostatic pressure in
the continuous phase in the 6-cm high foam samples which varies between 0 and 600 Pa.
4.2.3 Cement paste yield stress
In the following we will correlate the foam properties with the yield stress of the free ce-
ment paste. To measure free cement paste yield stress, paste is poured on a flat surface
86

CHAPTER 4. OPTIMAL CEMENT PASTE YIELD STRESS FOR THE PRODUCTION OFSTABLE CEMENT FOAMS
Figure 4.5: Experimental device used to measure the water volume extracted from the free cement
pastes at ∆P ' 440 Pa.
and average radius Rspr ead is measured. Yield stress τy is then obtained from the paste
density ρ and the poured volume Ω with the following formula [14]:
τy = 225ρgΩ2
128π2R5spr ead
(4.1)
Equation 4.1 is valid at intermediate yield stress values. On the one hand, it must be
high compared to capillary forces and on the other hand, the spread height hspr ead must
be small compared to the radius. As already discussed in [10], capillary forces can be
neglected when yield stress is above 1 Pa. We choose to set all the values measured below
1 Pa to 1 Pa. Regarding the second condition, maximal measured value is τy ' 100 Pa, in
this case, if poured volume is 30 mL, we obtain Rspr ead /hspr ead ' 3.
Measured free cement paste yield stresses are given in figure 4.6. Two water-to-cement
ratios W/C f = 0.38 and 0.41 have been studied in the case of Steol surfactant whereas only
W/C f =0.36 has been considered in the case of Tempo 12 and Triton mixes.
Exponential fit correlates well with each of the curves. Therefore, in the following,
we will use equations 4.2, 4.3 and 4.4 to estimate the free cement paste yield stress τy
from the Steol or Tempo 12 concentrations CSteol or CTempo 12 (with yield stresses in Pa
and concentrations in g/L):
τy = 6.87 ·109 e−1.89 CSteol with Steol and W/C f =0.41 (4.2)
τy = 8.30 ·1012 e−1.97 CSteol with Steol and W/C f =0.38 (4.3)
τy = 137 e−0.191 CTempo 12 with Tempo 12 and Triton (4.4)
87

CHAPTER 4. OPTIMAL CEMENT PASTE YIELD STRESS FOR THE PRODUCTION OFSTABLE CEMENT FOAMS
Figure 4.6: Yield stress of cement pastes prepared following the same protocol as cement foam.
Top: pastes containing Steol anionic surfactant with W/C f =0.38 (empty dots) and W/C f =0.41
(full dots). Bottom: superplasticizer and Triton non-ionic surfactant with W/C f =0.36.
4.3 Results
4.3.1 Stability
Fig. 4.7 illustrates a typical evolution of the morphology of an unstable foam with time.
Pictures of the sample are taken through the transparent mold. Cement paste appears in
light grey whereas air voids are black. Note that we can see only the morphology of the
side of the sample against the mold walls, where the movement of the bubbles deposes
a cement layer. Therefore, the apparent morphology after foam destabilization may not
be representative of the bulk morphology of the foam. However, we can neatly see that
major change of the foam structure takes place before 30 min after sample preparation.
The stability of cement foams samples containing either anionic or non-ionic surfac-
tant is plotted in figure 4.8 as a function of the yield stress of the corresponding free ce-
ment paste.
In all cases, best foam stability is obtained at moderately low free cement paste yield
stress. On the one hand, foams are unstable at high τy , i.e. above a critical value τ∗y '10 Pa. Increase of free yield stress above τ∗y leads consistently to unstable foams. This
behavior is particularly noticeable in Tempo 12 - Triton foams, where foam collapse was
observed for yield stress close to 25 Pa. On the other hand, very low free yield stress val-
ues, below τ∗∗y ' 2 Pa also lead to unstable foams. In this very low yield stress regime,
reproductibility of the results is poor, foams with the same formulation can sometimes
have different stability behavior.
These stability results are unexpected, because, as mentioned before, high interstitial
yield stress is expected to contribute to stopping drainage and ripening. These puzzling
results can be due to several effects including:
88

CHAPTER 4. OPTIMAL CEMENT PASTE YIELD STRESS FOR THE PRODUCTION OFSTABLE CEMENT FOAMS
0 min 10 min 20 min
30 min 40 min 50 min
Figure 4.7: Example of the evolution of the morphology of an unstable cement foam (W/C f = 0.41,
10.2 g/L of Steol, τy = 18 Pa). Foam on the pictures is seen through the transparent mold ; note
that the movement of the bubbles deposes a cement layer on the mold walls and that apparent
morphology after foam destabilization may not be representative of the bulk morphology of the
foam. Cement paste is in light grey and bubbles are black. Picture width is 1 cm.
Figure 4.8: Top: Stability of cement foams containing Steol anionic surfactant. Grey diamonds cor-
respond to foams made with initial W/C f =0.38 and black dots to foams with W/C f =0.41. Bottom:
Stability of cement foams containing superplasticizer and Triton.
• The cement paste inside the foam structure may have different behavior than the
free cement paste.
89

CHAPTER 4. OPTIMAL CEMENT PASTE YIELD STRESS FOR THE PRODUCTION OFSTABLE CEMENT FOAMS
• Time related effects, i.e. thixotropy and hydration kinetics, may play a dominant
role.
• Segregation of water and cement grains and water in the foam may occur.
Rheological investigation will be used to elucidate the first two points. Yield stress
measurement at foam early age is used to assess the behavior of the interstitial cement
paste. Then, as a non-destructive measurement, elastic modulus is monitored to evaluate
the evolution of the paste rheological properties with time.
Segregation of water and cement grains are then measured by the water suction ex-
periment.
4.3.2 Rheological measurements
4.3.2.1 Foam yield stress
We notice that two types of start-of-flow curve shape of fresh cement foams were ob-
tained. For some samples, the stress increases up to a plateau value. For other samples,
plateau value is lower than the yield stress and the curve exhibits an overshoot. In both
cases, yield stress τy, f oam is obtained for deformation between 40 an 75%. Examples for
both curve shapes are shown in figure 4.9.
Figure 4.9: Examples of the two types of start-of-flow curves. Both curves were obtained for sam-
ples with W/C f =0.41, for two different Steol concentrations. Curve with overshoot (empty circles)
is obtained with 11.4 g/L of Steol and τy =3 Pa, and curve without overshoot (black dots), with
10.4 g/L of Steol and τy =18 Pa.
τy, f oam for all the samples are plotted as a function of the yield stress of the free ce-
ment paste in figure 4.10. Presence of overshoot is indicated by empty dots and diamonds.
For the three sets of results, τy, f oam increases with τy but foam yield stress variation
is limited: while τy ranges from about 1 to 100 Pa, 5.7 Pa ≤ τy, f oam ≤ 14 Pa. Besides,
overshoot occurs when τy ≤ τ∗y .
4.3.2.2 Elasticity
Two different types of elastic modulus evolution are shown in figure 4.11. Curve slope can
either be constant during 50 min or decrease with time.
90

CHAPTER 4. OPTIMAL CEMENT PASTE YIELD STRESS FOR THE PRODUCTION OFSTABLE CEMENT FOAMS
Figure 4.10: Macroscopic yield stress of fresh cement foam. Black dots refer to cement pastes
containing anionic surfactant at W/C f = 0.41 and grey diamonds at W/C f = 0.38. Grey triangles
refer to samples with superplasticizer and non-ionic surfactant. Empty symbols refer to curves
where an overshoot was measured.
Figure 4.11: Examples of the two possible shapes of elastic modulus curves. Both curves were
obtained for samples containing Steol surfactant with W/C f =0.41. Linear curve (empty circles) is
obtained with 11.4 g/L of Steol and τy =3 Pa, and non-linear curve (black dots), with 10.4 g/L of
Steol and τy =18 Pa.
Elastic modulus at t=0 and t=40 min are plotted as a function of τy in Fig. 4.12. As
expected, the higher τy , the higher the initial elastic modulus. When free yield stress in-
creases by two decades, elastic modulus is increased by a factor 4. However, 40 minutes
after the start of the oscillation test, elastic modulus hardly increases with yield stress any-
more.
In addition, foams where G’ evolution is linear are shown by empty symbols in Fig. 4.12.
We note that for the low free yield stresses, elastic modulus increases linearly with time
whereas for the higher free yield stresses, elastic modulus slope decreases.
4.3.3 Water suction
Percentage of extracted water from free cement paste containing Steol whose W/C f = 0.41
are shown on Fig. 4.13. We note that the amount of extracted water decreases when τy
increases, mainly when τy > τ∗y
91

CHAPTER 4. OPTIMAL CEMENT PASTE YIELD STRESS FOR THE PRODUCTION OFSTABLE CEMENT FOAMS
Figure 4.12: Elastic modulus of fresh cement foam at t=0 and t=40 min. Black dots refer to cement
pastes containing anionic surfactant at W/C f = 0.41 and grey diamonds at W/C f = 0.38. Grey
triangles refer to samples with superplasticizer and non-ionic surfactant. In first graph, empty
symbols refer to linear elastic modulus curves.
Figure 4.13: Ratio of extracted water from free cement pastes at W/C f = 0.41 containing Steol
surfactant after 10 minutes at ∆P ' 400 Pa
4.4 Discussion
4.4.1 Comparison with aqueous foams
Aqueous foams are known to behave like an elastic solid at small deformations and to
exhibit a yield stress at higher deformation. Rheological properties depend on the bubble
radius R, the surface tension γ and the air volume content Φ. Yield stress is given by
equation 4.5 [15, 16] and elastic modulus by equation 4.6 [4].
τy,aq (Φ) = 0.6γ
R(Φ−Φc )2 (4.5)
G′aq (Φ) = 1.4
γ
RΦ(Φ−Φc ) (4.6)
92

CHAPTER 4. OPTIMAL CEMENT PASTE YIELD STRESS FOR THE PRODUCTION OFSTABLE CEMENT FOAMS
where Φc is the critical packing fraction above which there are films between the bubbles
and equals 0.64 in the case of disordered monodisperse foam.
Surface tension value depends on the surfactant and its concentration. After incorpo-
ration of precursor foam in cement paste, Triton concentration in cement foam is 0.11 g/L.
Surface tension of Triton solution in cement pore solution at this concentration is 35 mN/m
[10]. Regarding Steol, surface tension in cement pore solution for concentrations above
CMC is 27 mN/m [10]. As low yield stress is achieved when anionic surfactant residual
concentration is above CMC [10], we can assume that for both surfactants, when cement
paste yield stress is the lowest, surface tension is below 35 mN/m.
Therefore, aqueous foam yield stress for both surfactants is τy,aq (83%) ' 2 Pa and elas-
tic modulus is G′aq (83%) ' 20 Pa. Both are below the values measured on the cement
foams samples for all τy . This means that the interstitial cement paste strongly enhances
the foam rheological properties, even when τy is very low.
4.4.2 Early age rheological properties
Let us first discuss the fact that in low-yield stress regime, an overshoot appears on the
start-of-flow curve. This overshoot is not expected to result directly from thixotropy ef-
fects in the cement paste, as they appear only for low yield stress cement paste, that is
to say, for the highest concentrations of anionic surfactant or superplasticizer. Indeed,
we recall that apparent thixotropy in cement paste arises from two effects: creation of a
percolated network of colloidal cement grains during the first seconds after high shear
mixing, then nucleation and growth of CSH bond between the grains [13]. Our yield
stress measurements are carried out only a few minutes after foam production, so the
major contribution to the measured yield stress is the colloidal percolation network. As
attraction forces between cement grains are reduced in the presence of high amount of
Steol [10] or superplasticizer [9] due to steric repulsion, colloidal network is not expected
to be stronger or to form faster in the case of deflocculated pastes.
We stress that start-of-flow curve of granular material exhibits overshoot when grains
are densely packed [17, 18]. Moreover, Gorlier et al. [19] studied start-of-flow curves of
complex fluid foams. They showed that there is no overshoot when interstitial fluid is a
simple yield stress fluid (i.e. concentrated emulsion for example), whereas overshoot ap-
pears when aqueous foam is mixed with small beads suspension, even if the correspond-
ing unconfined granular suspension does not exhibit yield stress properties; that is to say
that yield stress results from the confinement of the beads by the bubbles. Authors ana-
lyzed the stresses at stake in the granular foam and concluded that small particles packed
in the foam structure behave as dense granular matter.
Yield stress of emulsion foams and small-particle foams can both be fitted by equa-
tion 4.7. This equation has been empirirically determined for samples where τy,i nt R/γ<0.5 [19].
τy, f oam(Φ)
τy,aq (Φ)= 1+ c(1−Φ)4/3
(τy,i nt R
γ
)2/3
(4.7)
93

CHAPTER 4. OPTIMAL CEMENT PASTE YIELD STRESS FOR THE PRODUCTION OFSTABLE CEMENT FOAMS
Where c = 110 is a fitting parameter, and τy,i nt is the yield stress of the interstitial fluid.
Using equation 4.7, we deduce from foam mascroscopic yield stress τy, f oam(Φ) (plotted in
Fig. 4.10) the yield stress of the interstitial cement paste τy,i nt . It is compared in Fig. 4.14
with τy , that is to say with the yield stress of the cement paste with the same composi-
tion and prepared following the same protocol, but not confined in the foam. This graph
shows that when cement paste yield stress is high, above 20 Pa, interstitial yield stress
is equal to free paste yield stress. When free yield stress is lower, yield stress is strongly
enhanced, up to a factor 10.
Figure 4.14: Comparison of yield stress of identical cement pastes when they are confined in the
foam τy,i nt and with no foam τy . Black dots refer to cement pastes containing anionic surfactant
at W/C f = 0.41 and grey diamonds at W/C f = 0.38. Grey triangles refer to samples with superplas-
ticizer and non-ionic surfactant.
To summarize, start-of-flow curve shape (Fig. 4.9) and estimations of interstitial yield
stress (Fig. 4.14) allow us to identify two cement paste rheological behaviors:
• When τy > τ∗y , cement paste acts as yield stress fluid because of the high Van der
Waals attraction between cement grains and rearrangement of grains cannot oc-
cur. Interstitial yield stress is similar to the yield stress of the free cement paste. In
this regime, that we call yield stress regime, cement foams are unstable within our
experimental conditions.
• When τy < τ∗y , cement paste behaves in part as a confined granular material. An
overshoot appears on the start-of-flow curve and interstitial yield stress is signif-
icantly increased with respect to free paste yield stress. This regime, that we call
granular regime because it is reminiscent of the behavior of confined granular pack-
ing, allows significant foam stability. The stability loss at the lower free yield stresses
will be discussed in part 4.4.4.
In the granular regime, the formation of a network of cement grains in contact re-
quires the removal of the excess water from the interstitial cement paste. Let us estimate
the amount of water which must be removed. After the mix of cement paste and foam,
the maximal water-to-cement ratio is 0.41. Corresponding solid volume content in the
cement paste is given byφp = (1+ρc /ρw W/C)−1; we obtainφp =44%. Random loose pack-
ing fraction is 0.8∗60% = 48% [20]; this corresponds to W/C=0.34. Water loss is therefore
94

CHAPTER 4. OPTIMAL CEMENT PASTE YIELD STRESS FOR THE PRODUCTION OFSTABLE CEMENT FOAMS
(0.48−0.44)/0.48 = 8% of the paste volume and less than 2% of the foam volume, which
cannot be visually observed with our samples.
Experimental estimation of the water-to-cement ratio 10 min after the foam produc-
tion is given by the water extraction curve. In graph in Fig. 4.15, we observe that when
τy < τ∗y , W/C reaches nearly 0.35 while it remains above 0.36 in the yield stress regime.
This observation tends to confirm that a denser granular network can be set up, thanks to
grains rearrangement, when τy < τ∗y but not when τy > τ∗y .
Figure 4.15: Ratio of extracted water from free cement pastes at W/C f = 0.41 containing Steol
surfactant after 10 minutes at ∆P ' 400 Pa
Note that τy,i nt in the granular regime is lower than the 120 Pa value obtained for
foams made with monodisperse spherical particles [19]. This suggests that the ideal gran-
ular regime is not fully achieved in cement foams. In fact several effects could be consid-
ered for explaining this deviation. (1) The large particle polydispersity in our case with re-
spect to the monodisperse particles assemblies studied in [19]. It has been shown in [19]
that confinement effect is strongly dependent on particles size: large ones, i.e. > 40 µm,
and small ones, i.e. <1 µm, are not expected to contribute to that effect. (2) The effective
friction coefficient is µ= 0.3 in the case of solid spheres. The yield stress of a granular ma-
terial, under confinement pressure P, is given by τy = µP. Friction coefficient is however
not known for polymer (or surfactant) covered cement grains.
Granular effect can account for the increase of yield stress of the interstitial cement
paste due to the confinement provided by the bubble interface when τy < τ∗y . However,
interstitial yield stress is still smaller in granular regime than in yield stress regime and
cannot account for the remarkable stability of the foams. One hypothesis to explain this
stability is that the time evolution of the interstitial cement paste rheological properties
may play a role on foam stability. Therefore, to understand the stability of cement foams,
we will focus in the next paragraph on the evolution of the rheological properties upon
aging.
4.4.3 Time evolution of rheological properties
Elastic modulus curves allow us to assess the evolution of the interstitial cement paste
with time. For foams in the granular regime, slope of foam elastic modulus curve is con-
stant. This linear increase at low amplitude oscillations is a typical evolution in cement
95

CHAPTER 4. OPTIMAL CEMENT PASTE YIELD STRESS FOR THE PRODUCTION OFSTABLE CEMENT FOAMS
pastes and it is known to result from the constant volume formation rate of hydrates be-
tween cement grains [13]. In the yield stress regime, however, elastic modulus slope be-
comes smaller with time. We can assume that the slow shearing induced by the bubbles
deformation during destabilization leads to a partial rejuvenation of the cement paste
and partially compensates the increase of elasticity caused by thixotropy.
Similarly to what we have done with yield stress, we can estimate the interstitial elastic
modulus from the measured value of the foam elastic modulus. Foam modulus is the
sum of the contribution of aqueous foam G′aq , and a contribution which depends on the
interstitial elastic modulus G′i nt [21, 22] :
G′f oam = G′
aq +G′i nt (1−Φ)2
(1+15(2Φ−1)
(γ
RG′i nt
)2/3)(4.8)
Equations 4.6 and 4.8 allow us to assess G′i nt at several times. Results are shown in
Fig. 4.16 for t=40 min.
Figure 4.16: Interstitial elastic modulus at time t=40 min. Black dots refer to cement pastes con-
taining anionic surfactant at W/C f = 0.41 and grey diamonds at W/C f = 0.38. Grey triangles refer
to samples with superplasticizer and non-ionic surfactant.
We see that rigidity increase is faster in the granular regime than in the yield stress
regime. Though, elastic modulus remains higher in most of the colloidal-type foams than
in the granular regime until 40 minutes. At this time, as shown in Fig. 4.7, ripening has
already started to occur in unstable foams. Therefore, the values of interstitial elasticity
up to 40 minutes after foam production cannot account for the better stability observed
in the granular regime.
In order to further investigate the effect of foam aging, we measured the evolution of
yield stress with time. Whereas elastic modulus is measured at low deformation, below
0.1%, yield stress is obtained at high shear strain. Therefore, elasticity and yield stress
measured in cement paste have different origins [13]: elasticity is caused only by the hy-
drates bonds between cement grains, whereas yield stress results from both colloidal in-
teraction and hydrate bonds. Second consequence of the high sample deformation dur-
ing start-of-flow experiment is that this measurement is destructive: yield stress for each
age must be measured with a different sample. Each sample is prepared following the
same protocol as described in 4.2.2.1 and placed in the rheometer geometry. Then a rest-
ing time between 0 and 45 min is chosen before the start of the yield stress measurement.
96

CHAPTER 4. OPTIMAL CEMENT PASTE YIELD STRESS FOR THE PRODUCTION OFSTABLE CEMENT FOAMS
Measured yield stresses are shown in Fig. 4.17. Curve shape in yield stress regime is typical
from cement paste [13] and exhibits a two-regime behavior with two different slopes: in
the first regime, yield stress is governed by colloidal interaction between cement grains,
and in the second regime, formation of hydrates bonds become predominant. For the
stable foam in the granular regime, very fast increase of yield stress in the first 15 minutes
of rest supports the hypothesis of the formation of a dense structure of cement grains in
contact. Both interstitial yield stress curves have the same slope after 15 minutes, which
shows that there is no major difference of hydration kinetics between these two types of
samples.
Figure 4.17: Increase of interstitial yield stress with time for cement foams W/Ci = 0.35 containing
Steol. Full dots to foams in the yield stress regime (Steol concentration 10.4 g/L, τy = 18 Pa), empty
dots refer to very stable foams in the granular regime (Steol concentration 11.4 g/L, τy = 3 Pa) and
grey crosses to less stable foams in the granular regime (Steol concentration 12.3 g/L, τy < 1 Pa)
We can therefore assume that the origin of stability of cement foams in the granular
regime lies in the formation of a dense cement grain structure, where dominant inter-
actions are frictional contacts. 15 minutes after the start of the experiment, this dense
structure exhibits a yield stress two times larger than the value obtained in the yield stress
regime and it appears to be able to stop foam destabilisation.
4.4.4 Stability loss at very high surfactant content
Last point that remains to be elucidated is the stability loss of Steol in the granular regime
when free cement paste yield stress is very low, i.e. τy < τ∗∗y . Interstitial yield stress evo-
lution for a foam corresponding to a free cement paste below 1 Pa is plotted in Fig. 4.17.
The increase of interstitial yield stress before 15 min is smaller than in the stable foam,
but higher than in the case τy > τ∗y .
The most probable explanation for the observed unstability is that at very low yield
stress, drainage of the cement paste can occur between the bubbles. Indeed, a layer of
cement can often be seen at the bottom of the highly deflocculated cement foam sample.
Flow of a yield stress fluid in the foam channels, called Plateau borders, and nodes can be
compared to the flow of a fluid in a porous media. Flow of a yield stress fluid in a porous
medium under gravity is expected to occur if the yield stress is below a critical value τc,d
with depends on the pore radius a [23].
97

CHAPTER 4. OPTIMAL CEMENT PASTE YIELD STRESS FOR THE PRODUCTION OFSTABLE CEMENT FOAMS
τc,d = ρg a (4.9)
In the case of a foam, we can assume that the equivalent pore size is of the order of
magnitude of the bigger spheres which can pass in the plateau borders. This radius is
given by [24]:
rPB = R0.27
p1−Φ+3.17(1−Φ)2.75
1+0.57(1−Φ)0.27(4.10)
When R=390µm andΦ = 83%, equation 4.10 gives rPB= 40µm. Therefore, τc,d ∼ 1 Pa ∼τ∗∗y , which explains that the drainage occurs when τy < τ∗∗y .
Note that drainage in the Plateau borders and nodes may induce a segregation of ce-
ment grains in the very deflocculated cement pastes. Diameter of the bigger spheres that
can pass in the Plateau borders is 2rPB=80 µm, which is close to the size of the bigger ce-
ment grains. Therefore, while bigger cement grains are potentially retained by the foam
nodes and channels, small grains can escape the structure and settle at the sample bot-
tom.
Hydration kinetics may also play a role on foam stability. Though, as mentioned in the
previous paragraph, the influence must be minor compared to the early age structuration
of the cement paste into a dense granular packing or colloidal network. We can note how-
ever that high amount of surfactant can delay hydration: this effect has been observed by
other authors [25] and is confirmed for Steol in Fig. 4.18.
Figure 4.18: Delay of the temperature peak of cement pastes containing Steol (W/C=0.5, CEM I
cement from St Vigor factory, Lafarge): (tpeak − tpeak,r e f )/tpeak,r e f where tpeak,r e f = 12 h is the
reference time in sample containing no surfactant.
4.5 Conclusion
We have studied the capacity of cement pastes for producing morphology-controlled ce-
ment foams. By using two distinct additives, our experimental approach allowed us to
tune finely the paste yield stress τy while keeping constant several control parameters,
namely the W/C ratio, the bubble size and the gas volume fraction. Our results reveal
that appropriate morphological control can be achieved, for each studied system, when
τ∗∗y < τy < τ∗y .
98

CHAPTER 4. OPTIMAL CEMENT PASTE YIELD STRESS FOR THE PRODUCTION OFSTABLE CEMENT FOAMS
This result is attributed to the additives-induced reduction of attractive van der Waals
interactions: weak attractive forces allow densification of the cement grains within the
foam network as well as the simultaneous drainage of the excess interstitial pore solu-
tion. Within this regime, the partially flocculated state of cement grains allows for these
particles to be retained within the foam skeleton. Combination of these effects has been
proved to enhance drastically the effective yield stress property of the bubble-embedded
cement paste, resulting in efficient immobilization of fresh foams, without resorting to
set accelerators. Such a mechanical behavior is reminiscent of aqueous foams made with
granular matter, i.e. grains without any other interaction than contacts, as studied re-
cently by Gorlier et al. [19]. We anticipate that the drainage of the excess interstitial pore
solution could be critical if the drained volume is large, i.e. for large W/C ratios.
For τy > τ∗y , cement foams were found to evolve significantly before setting, leading
to uncontrolled final morphology. In contrast to the above-described regime, attractive
van der Waals forces are strong enough to prevent cement particles from being reorga-
nized within a denser structure between the bubbles, and in the same time, pore cement
solution is hardly squeezed out through the interstitial cement paste. As a result, the in-
terstitial cement paste behaves as a “classical” yield stress material with yield stress equal
to τy . Within our experimental conditions, studied τy < 100 Pa values were not found
to allow morphology control. However, we anticipate that larger τy and/or larger bubble
size should allow for such a control.
Finally, we show that fresh cement foams with τy < τ∗∗y do not allow foam morphol-
ogy to be controlled. This result is attributed to the deflocculated state of cement colloidal
particles in this regime: deflocculated small cement particles exit the foam skeleton along
with the draining pore solution so the above-described densification mechanism is pre-
vented from occurring.
Bibliography
[1] G. Samson, A. Phelipot-Mardelé, and C. Lanos, “Thermal and mechanical properties
of gypsum-cement foam concrete: effects of surfactant,” Journal of Environmental
and Civil Engineering, vol. 21, no. 12, pp. 1502–1521, 2016. 82
[2] M. T. Hoang and C. Perrot, “Solid films and transports in cellular foams,” Journal of
Applied Physics, vol. 112, p. 054911, 2012. 82
[3] V. Langlois, V. H. Trinh, C. Lusso, C. Perrot, X. Chateau, Y. Khidas, and O. Pitois,
“Permeability of solid foam: Effect of pore connections,” Physical Review E, vol. 97,
p. 053111, 2018. 82
[4] I. Cantat, S. Cohen-Addad, F. Elias, F. Graner, R. Höhler, O. Pitois, F. Rouyer, and
A. Saint-Jalmes, Foams - Structure and dynamics. Oxford University Press, 2013. 82,
92
[5] S. Guignot, S. Faure, M. Vignes-Adler, and O. Pitois, “Liquid and particles retention
99
CHAPTER 4. OPTIMAL CEMENT PASTE YIELD STRESS FOR THE PRODUCTION OFSTABLE CEMENT FOAMS
in foamed suspensions,” Chemical Engineering Science, vol. 65, pp. 2579–2585, 2010.
82
[6] I. Lesov, S. Tcholakova, and N. Denkov, “Factors controlling the formation and stabil-
ity of foams used as precursors of porous materials,” Journal of Colloid and Interface
Science, vol. 426, pp. 9–21, 2014. 82
[7] I. Lesov, S. Tcholakova, and N. Denkov, “Drying of particle-loaded foams for pro-
duction of porous materials: mechanism and theoretical modeling,” RSC Advances,
vol. 4, pp. 811–823, 2014. 82
[8] R. J. Flatt and P. Bowen, “Yodel: a yield stress model for suspensions,” Journal of the
American Ceramic Society, vol. 89, no. 4, pp. 1244–1256, 2006. 82
[9] R. J. Flatt and I. Schober, “Superplasticizer and the rheology of concrete,” in Under-
standing the rheology of concrete (N. Roussel, ed.), pp. 144–208, Woodhead publish-
ing, 2012. 82, 93
[10] B. Feneuil, O. Pitois, and N. Roussel, “Effect of surfactants on the yield stress of ce-
ment paste,” Cement and Concrete Research, vol. 100, pp. 32–39, 2017. 82, 83, 87,
93
[11] T. Zhang, S. Shang, F. Yin, A. Aishah, A. Salmiah, and T. Ooi, “Adsorptive behavior of
surfactants on surface of Portland cement,” Cement and Concrete Research, vol. 31,
pp. 1009–1015, 2001. 83
[12] F. Gorlier, Y. Khidas, A. Fall, and O. Pitois, “Optimal strengthening of particle-loaded
liquid foams,” Physical Review E, vol. 95, 2017. 86
[13] N. Roussel, G. Ovarlez, S. Garrault, and C. Brumaud, “The origins of thixotropy in
fresh cement pastes,” Cement and Concrete Research, vol. 42, pp. 148–157, 2012. 86,
93, 96, 97
[14] N. Roussel and P. Coussot, “Fifty-cent rheometer for yield stress measurements:
From slump to spreading flow,” Journal of Rheology, vol. 49, no. 3, pp. 705–718, 2005.
87
[15] T. G. Mason, J. Bibette, and D. A.Weitz, “Yielding and flow of monodisperse emul-
sions,” Journal of Colloid and Interface Science, vol. 179, pp. 439–448, 1996. 92
[16] A. Saint-Jalmes and J. Durian, “Vanishing elasticity for wet foams: Equivalence with
emulsions and role of polydispersity,” Journal of Rheology, vol. 43, p. 1411, 1999. 92
[17] M. D. Bolton, “The strength and dilatancy of sands,” Géotechnique, vol. 36, no. 1,
pp. 65–78, 1986. 93
[18] A. Fall, G. Ovarlez, D. Hautemayou, C. Mézière, J.-N. Roux, and F. Chevoir, “Dry
granular flows: Rheological measurements of theµ(i )-rheology,” Journal of rheology,
vol. 59, no. 4, pp. 1065–1080, 2015. 93
100

CHAPTER 4. OPTIMAL CEMENT PASTE YIELD STRESS FOR THE PRODUCTION OFSTABLE CEMENT FOAMS
[19] F. Gorlier, Y. Khidas, and O. Pitois, “Yielding of complex liquid foams,” Journal of
Rheology, vol. 61, pp. 919–930, 2017. 93, 95, 99
[20] N. Roussel, A. Lemaître, R. J. Flatt., and P. Coussot, “Steady state flow of cement
suspensions: A micromechanical state of the art.,” Cement and Concrete Research,
vol. 40, pp. 77–84, 2010. 94
[21] L. Gibson and M. Ashby, eds., Cellular Solids: Structure and Properties. Cambridge:
Cambridge University Press, 1997. 96
[22] F. Gorlier, Y. Khidas, and O. Pitois, “Coupled elasticity in soft solid foams,” Journal of
Colloid and Interface Science, vol. 501, pp. 103–111, 2017. 96
[23] V. Chaplain, P. Mills, G. Guiffant, and P. Cerasi, “Model for the flow of a yield fluid
through a porous medium,” Journal de Physique II, vol. 2, pp. 2145–2158, 1992. 97
[24] N. Louvet, R. Höhler, and O. Pitois, “Capture of particles in soft porous media,” Phys-
ical Review E, vol. 82, p. 041405, 2010. 98
[25] S. Wei, Z. Yunsheng, and M. Jones, “Using the ultrasonic wave transmission method
to study the setting behavior of foamed concrete,” Construction and Building Mate-
rials, vol. 51, pp. 62–74, 2014. 98
101

CHAPTER 4. OPTIMAL CEMENT PASTE YIELD STRESS FOR THE PRODUCTION OFSTABLE CEMENT FOAMS
102

Chapter 5
Stability criterion for fresh cement foams
Sommaire5.1 Introduction . . . . . . . . . . . . . . . . . . . . . . . . . . . . . . . . . . . . 104
5.2 Materials and methods . . . . . . . . . . . . . . . . . . . . . . . . . . . . . . 105
5.2.1 Materials . . . . . . . . . . . . . . . . . . . . . . . . . . . . . . . . . . . 105
5.2.1.1 Cement . . . . . . . . . . . . . . . . . . . . . . . . . . . . . . 105
5.2.1.2 Surfactants . . . . . . . . . . . . . . . . . . . . . . . . . . . . 105
5.2.2 Methods . . . . . . . . . . . . . . . . . . . . . . . . . . . . . . . . . . . 106
5.2.2.1 Precursor foam and mixing . . . . . . . . . . . . . . . . . . . 106
5.2.2.2 Protocol . . . . . . . . . . . . . . . . . . . . . . . . . . . . . . 106
5.2.2.3 Observation of stability . . . . . . . . . . . . . . . . . . . . . 107
5.2.2.4 Stability of aqueous foam . . . . . . . . . . . . . . . . . . . . 107
5.2.2.5 X-ray tomography . . . . . . . . . . . . . . . . . . . . . . . . 108
5.2.3 Properties of cement paste . . . . . . . . . . . . . . . . . . . . . . . . 108
5.2.3.1 Yield stress of cement paste . . . . . . . . . . . . . . . . . . 108
5.2.3.2 Surface tension of cement paste . . . . . . . . . . . . . . . . 109
5.3 Results . . . . . . . . . . . . . . . . . . . . . . . . . . . . . . . . . . . . . . . 110
5.3.1 Stability of aqueous foams . . . . . . . . . . . . . . . . . . . . . . . . 110
5.3.2 Drainage and ripening . . . . . . . . . . . . . . . . . . . . . . . . . . . 110
5.3.2.1 Smaller bubbles (R . 500 µm) . . . . . . . . . . . . . . . . . 110
5.3.2.2 Bigger bubbles (R & 500 µm) . . . . . . . . . . . . . . . . . 114
5.3.3 Influence of initial yield stress and bubbles size . . . . . . . . . . . . 116
5.4 Discussion . . . . . . . . . . . . . . . . . . . . . . . . . . . . . . . . . . . . . 117
5.4.1 Destabilization mechanisms . . . . . . . . . . . . . . . . . . . . . . . 117
5.4.2 Characteristic destabilization times . . . . . . . . . . . . . . . . . . . 118
5.4.3 Effect of Bingham capillary number . . . . . . . . . . . . . . . . . . . 119
5.4.4 15 min interstitial Bingham capillary number . . . . . . . . . . . . . 121
103

CHAPTER 5. STABILITY CRITERION FOR FRESH CEMENT FOAMS
5.5 Conclusion . . . . . . . . . . . . . . . . . . . . . . . . . . . . . . . . . . . . . 122
Bibliography . . . . . . . . . . . . . . . . . . . . . . . . . . . . . . . . . . . . . . . 124
Appendix A: aqueous foam stability . . . . . . . . . . . . . . . . . . . . . . . . . 125
5.1 Introduction
When it is unconstrained, a bubble has a spherical shape because of the air-liquid surface
tension. Though, in a foam, bubbles are deformed by their neighbors. The structure of
a foam was studied in 1873 by Joseph Plateau, who stated three laws known as Plateau’s
laws [1]: (1) two bubbles are separated by a soap film of constant average curvature, (2)
three films join in a channel, called Plateau border, forming 120°angles, (3) four Plateau
borders join into a node at angle 109.5°. The resulting morphology of the foam tends
to evolve with time due to downward flow of interstitial fluid due to gravity (drainage),
air exchange between bubbles (ripening) and film breakage (coalescence), as shown in
Fig. 5.1.
Figure 5.1: Destabilisation mechanisms in a foam (taken from [2])
In cement foams, these destabilization mechanisms can occur until cement paste
hardening. Thus, to control the bubble size and air distribution in the foam, we have
to stop or slow down these three mechanisms. In this study, we want to define a stabil-
ity criterion for cement foams. The first step is to select the relevant foam characteristics
which should be included in such a criterion.
All destabilization mechanisms are affected by bubble size. Increasing bubble radius
R leads to large film areas between the bubbles, which enhances coalescence. It also in-
creases the Plateau borders and nodes width, which favors drainage [1]. Ripening, on
the contrary, is reduced when bubble size increases. Indeed, it is caused by the capillary
pressure inside the bubbles Pc = γ/R, where γ is the air-liquid surface tension.
Consistency of the continuous phase, i.e. of cement paste, is also expected to play
a major role in foam stability. High yield stress can stop drainage and ripening [3, 4].
However, we have shown in chapter 4 that for foams at given bubble size, air fraction
and water-to-cement ratio, best cement foam stability is obtained at intermediate cement
paste yield stress: on the one hand, it should be high enough to stop drainage and on the
104
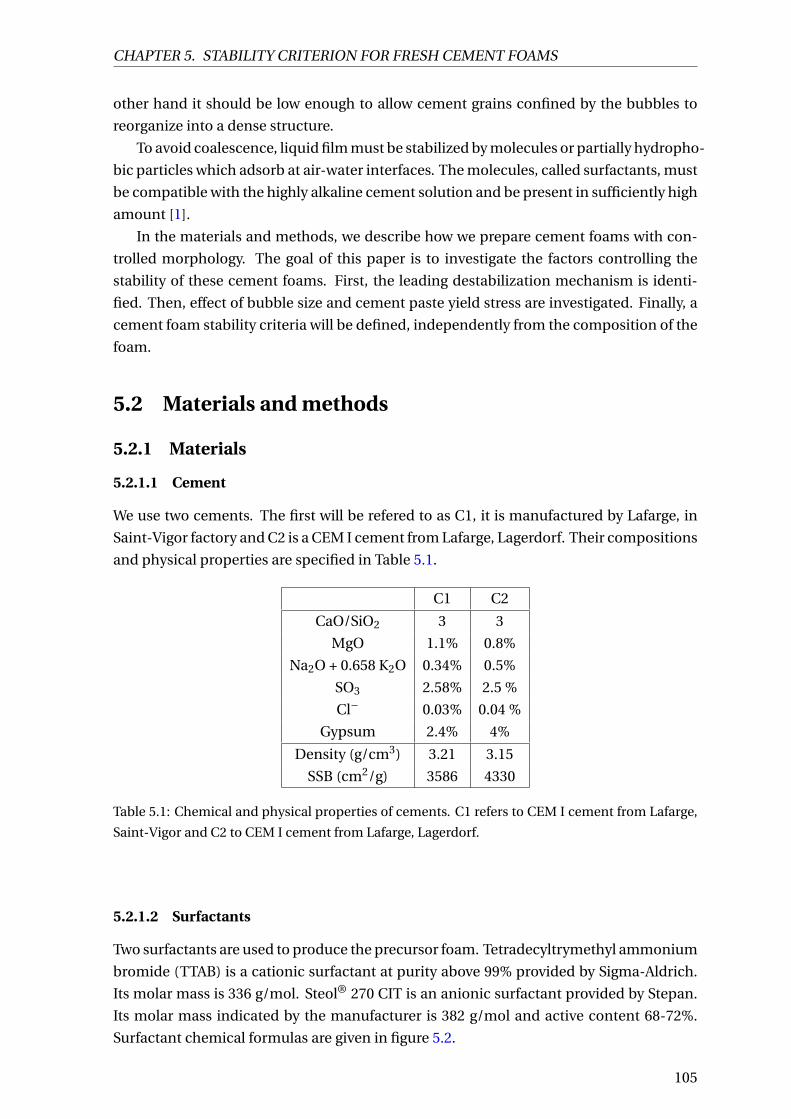
CHAPTER 5. STABILITY CRITERION FOR FRESH CEMENT FOAMS
other hand it should be low enough to allow cement grains confined by the bubbles to
reorganize into a dense structure.
To avoid coalescence, liquid film must be stabilized by molecules or partially hydropho-
bic particles which adsorb at air-water interfaces. The molecules, called surfactants, must
be compatible with the highly alkaline cement solution and be present in sufficiently high
amount [1].
In the materials and methods, we describe how we prepare cement foams with con-
trolled morphology. The goal of this paper is to investigate the factors controlling the
stability of these cement foams. First, the leading destabilization mechanism is identi-
fied. Then, effect of bubble size and cement paste yield stress are investigated. Finally, a
cement foam stability criteria will be defined, independently from the composition of the
foam.
5.2 Materials and methods
5.2.1 Materials
5.2.1.1 Cement
We use two cements. The first will be refered to as C1, it is manufactured by Lafarge, in
Saint-Vigor factory and C2 is a CEM I cement from Lafarge, Lagerdorf. Their compositions
and physical properties are specified in Table 5.1.
C1 C2
CaO/SiO2 3 3
MgO 1.1% 0.8%
Na2O + 0.658 K2O 0.34% 0.5%
SO3 2.58% 2.5 %
Cl− 0.03% 0.04 %
Gypsum 2.4% 4%
Density (g/cm3) 3.21 3.15
SSB (cm2/g) 3586 4330
Table 5.1: Chemical and physical properties of cements. C1 refers to CEM I cement from Lafarge,
Saint-Vigor and C2 to CEM I cement from Lafarge, Lagerdorf.
5.2.1.2 Surfactants
Two surfactants are used to produce the precursor foam. Tetradecyltrymethyl ammonium
bromide (TTAB) is a cationic surfactant at purity above 99% provided by Sigma-Aldrich.
Its molar mass is 336 g/mol. Steol® 270 CIT is an anionic surfactant provided by Stepan.
Its molar mass indicated by the manufacturer is 382 g/mol and active content 68-72%.
Surfactant chemical formulas are given in figure 5.2.
105

CHAPTER 5. STABILITY CRITERION FOR FRESH CEMENT FOAMS
Figure 5.2: Chemical formulas of TTAB and Steol 270 surfactants
Previous study showed that both surfactants are able to form stable foam in a highly
alkaline model solution of interstitial cement paste [2].
5.2.2 Methods
5.2.2.1 Precursor foam and mixing
Cement foams are prepared by mixing precursor aqueous foam and cement paste. Pre-
cursor foams are generated with the method described in chapter 4. They are monodis-
perse, i.e. they contain bubbles of the same size. Bubbles are generated with a ∼ 100 µm
diameter T junction, their radius depends on the entrance rates of the gas (nitrogen) and
the foaming liquid (water and surfactant). Bubbles are collected in a column, where liquid
fraction is controlled thank to addition of foaming liquid from the top of the foam. Bubble
radius are comprised between 200 µm and 900 µm. In TTAB precursor foams, concentra-
tion is 10 g/L and liquid fraction is between 0.5 and 2%. In Steol precursor foams, Steol
concentration is 1 g/L and liquid fraction, 1.6±1% when bubble radius is below 350 µm
and 1.4±1% otherwise.
Mixing of cement paste and precursor foam is carried with a flow focusing device as
described in chapter 4. The main advantage of this method is that bubbles are not broken
during the mixing process. Flow rates of the precursor foam and the cement paste are
chosen so that the final air content of cement foam is 83% ± 2%. Note however that flow
focusing method requires the flow of the cement paste in small channels (2 mm diameter)
and that therefore, yield stress of the paste must be limited to a few tens of Pascals to avoid
jamming in the channels.
Mold is filled by deposition of successive cement foam layers. Therefore, cement foam
does not undergo strong shearing after its preparation, and bubbles are not broken during
sample production.
5.2.2.2 Protocol
All cement foam samples, for each surfactant, are prepared using the same mixing proce-
dure, from water and cement mixing to casting. In the case of Steol samples, surfactant
is added to cement paste 20 minutes after cement paste preparation in large amount to
make consistency of the paste decrease (see chapter 4). For both surfactants, precursor
foam and cement paste are mixed 30 min after cement paste preparation. Protocol is
schematized in Fig. 5.3.
106
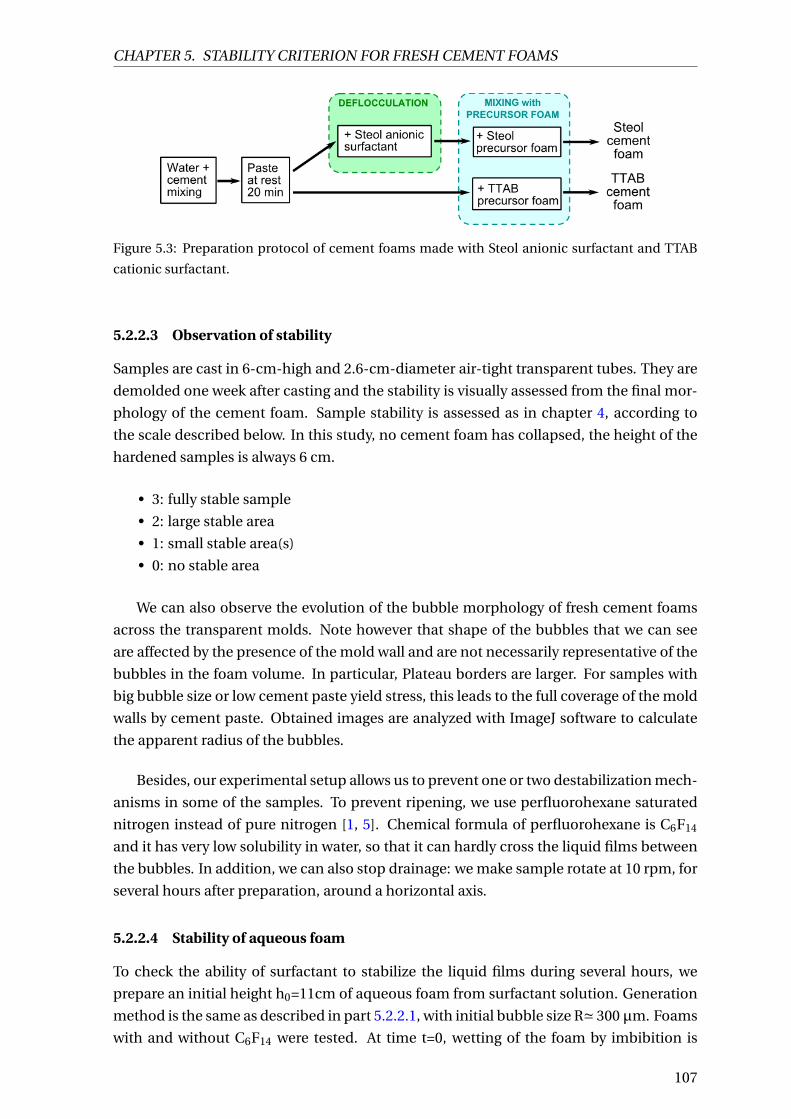
CHAPTER 5. STABILITY CRITERION FOR FRESH CEMENT FOAMS
Figure 5.3: Preparation protocol of cement foams made with Steol anionic surfactant and TTAB
cationic surfactant.
5.2.2.3 Observation of stability
Samples are cast in 6-cm-high and 2.6-cm-diameter air-tight transparent tubes. They are
demolded one week after casting and the stability is visually assessed from the final mor-
phology of the cement foam. Sample stability is assessed as in chapter 4, according to
the scale described below. In this study, no cement foam has collapsed, the height of the
hardened samples is always 6 cm.
• 3: fully stable sample
• 2: large stable area
• 1: small stable area(s)
• 0: no stable area
We can also observe the evolution of the bubble morphology of fresh cement foams
across the transparent molds. Note however that shape of the bubbles that we can see
are affected by the presence of the mold wall and are not necessarily representative of the
bubbles in the foam volume. In particular, Plateau borders are larger. For samples with
big bubble size or low cement paste yield stress, this leads to the full coverage of the mold
walls by cement paste. Obtained images are analyzed with ImageJ software to calculate
the apparent radius of the bubbles.
Besides, our experimental setup allows us to prevent one or two destabilization mech-
anisms in some of the samples. To prevent ripening, we use perfluorohexane saturated
nitrogen instead of pure nitrogen [1, 5]. Chemical formula of perfluorohexane is C6F14
and it has very low solubility in water, so that it can hardly cross the liquid films between
the bubbles. In addition, we can also stop drainage: we make sample rotate at 10 rpm, for
several hours after preparation, around a horizontal axis.
5.2.2.4 Stability of aqueous foam
To check the ability of surfactant to stabilize the liquid films during several hours, we
prepare an initial height h0=11cm of aqueous foam from surfactant solution. Generation
method is the same as described in part 5.2.2.1, with initial bubble size R' 300µm. Foams
with and without C6F14 were tested. At time t=0, wetting of the foam by imbibition is
107

CHAPTER 5. STABILITY CRITERION FOR FRESH CEMENT FOAMS
stopped and we record the evolution of the height h(t ) of the foam. Both surfactants
(TTAB at concentration 5 g/L and Steol at 1 g/L) were tested in distilled water and in a
synthetic cement pore solution containing 1.72 g/L of CaSO4 ·2H2O, 6.959 g/L of Na2SO4,
4.757 g/L of K2SO4 and 7.12 g/L of KOH [6].
5.2.2.5 X-ray tomography
Some stable cement foams have been studied by X-ray tomography one or two months
after the preparation.
Two types of experiments are performed. Laboratory tomograph gives images of the
whole 2.6-cm-diameter and 6-cm-high samples. One 11-cm-high sample has also been
prepared and studied. Resolution for the obtained images is 16.3 µm. On the other hand,
synchrotron provides high resolution images with voxel size 0.65 µm, on a few millimeter
wide pieces of the samples.
5.2.3 Properties of cement paste
5.2.3.1 Yield stress of cement paste
Cement foams prepared with TTAB surfactant are made with C1 cement and those with
Steol contain C2 surfactant. In both cases, we estimate the yield stress of the cement
pastes corresponding to cement foams, i.e. prepared following the protocol described
in 5.2.2.2 with addition of foaming solution (without bubbles) instead of foam. Yield
stresses of these pastes are measured by spread tests: paste is poured on a flat horizontal
surface and yield stress is obtained by the following formula [7]:
τy = 225ρgΩ2
128π2R5spr ead
(5.1)
where Ω and Rspr ead are respectively the volume and the average radius of the spread
cement paste and ρ its density. Note that this formula requires that 1 Pa . τy . 100 Pa [2,
7].
In the case of TTAB, we have seen in a previous study [2] that TTAB partially adsorbs
on C1 and has only a low effect on cement paste yield stress. Therefore, paste yield stress
depends mainly on the final water-to-cement ratio of the cement foam, W/C f . Water-to-
cement ratio of the precursor cement paste is W/Ci =0.37. As air content of the cement
foam is constant, W/C f and final TTAB concentration in cement foam both depend only
on the liquid content of the precursor foam. Measured yield stress is given as a function
of W/C f in Fig. 5.4. Yield stress of a solid suspension can be described by the Yodel [8],
which states that it is a product of the contribution of the intensity of the forces between
two neighboring solid particles m1 and a function of the solid volume fraction Φp :
τy = m1
Φ2p (Φp −Φper c )
Φmax(Φmax −Φp )(5.2)
108

CHAPTER 5. STABILITY CRITERION FOR FRESH CEMENT FOAMS
where Φper c is the percolation threshold and Φmax is the maximal solid fraction. In ce-
ment pastes, Φp is related to the water to cement ratio Φp = 1/(1+ρc /ρw W/C f ). TTAB
hardly affects interparticle interaction between cement grains, therefore, we choose to
use equation 5.2 to fit the yield stress of cement pastes containing TTAB. Obtained fitting
parameters are m1 = 15 Pa, Φper c = 0.32 and Φmax = 0.46.
Figure 5.4: Yield stress of cement pastes containing TTAB cationic surfactant (Fit with Yodel, equa-
tion 5.2 with m1 = 15 Pa, Φper c = 0.32 and Φmax = 0.46)
Regarding Steol surfactant, we have observed that it has a strong affinity with cement
grain surface [2]. Steol adsorption onto cement grains changes the interaction between
the particles and modifies the yield stress of the cement paste. At low Steol concentration,
yield stress increases due to hydrophobic interaction between cement grains. At high con-
centration, adsorbed Steol micelles create a steric repulsion between cement grains and
reduces the yield stress. For the present study, we choose to use two Steol concentrations
in the precursor cement paste: 11.4 and 12.4 g/L. In both cases, the addition of Steol into
cement paste makes the yield stress drop to very low values, respectively 4 Pa and 1 Pa.
Addition of Steol foaming solution at 1 g/L leads at the same time to an increase of W/C
and to a decrease of the final Steol concentration. We measured in chapter 4 that after
mixing with foam at liquid content 1.4%, the final water-to-cement ratio is W/C f = 0.41,
Steol concentration drops to 10.4 and 11.4 g/L and τy = 18 Pa and 3 Pa. When liquid
content in the precursor foam is higher, for instance 1.6%, W/C f increases and Steol con-
centration decreases, which have opposite effect on the yield stress. Therefore, we will
assume that paste yield stress in this case is also τy = 18 Pa and 3 Pa.
5.2.3.2 Surface tension of cement paste
For TTAB surfactant, concentration after mixing of the precursor foam into the paste is
between 0.7 and 2.4 g/L. Adsorption isotherms measured on pastes at W/C f =0.5 showed
that partial adsorption on cement grains leaves a residual concentration in solution be-
tween 0.2 and 1 g/L [2]. Surface tension of TTAB at these concentrations in synthetic
cement pore solution is comprised between 37 and 42 mN/m [2], so that we can assume
for TTAB cement foams γTTAB ' 40 mN/m.
For Steol surfactant, both yield stress values are smaller than the yield stress of the
same cement paste without surfactant. Therefore, they are both in the high Steol con-
109

CHAPTER 5. STABILITY CRITERION FOR FRESH CEMENT FOAMS
centration regime, and residual concentration is above Critical Micelle Concentration [2],
therefore, the surface tension of the cement pastes is γSteol = 27 mN/m.
5.3 Results
5.3.1 Stability of aqueous foams
Height of aqueous foams was monitored for at least one day. Note that the presence of
perfluorohexane tends to make the foam swell. Indeed, there is C6F14 in the bubbles but
not in the air in the column above the foam. Difference in C6F14 chemical potentials leads
to gas transfer from the air above the foam to the bubbles. This swelling is however not
reported on the graphs.
During the six experiments presented in Fig. 5.5, we observe that the foam becomes
more and more dry and that the size of air bubbles increases. However, the height of the
foam did not decrease for 10 hours in all cases. Foams made with synthetic cement pore
solution are less stable than in distilled water, and the absence of C6F14 also increases
destabilization speed; however, both these effects can be seen only after 10 hours.
Figure 5.5: Evolution of the height of aqueous foams with time made with TTAB solutions at 5 g/L
(left) and Steol solutions at 1 g/L. Black dots or triangles refers to surfactant solutions in distilled
water and grey signs to synthetic cement paste solutions. Dots refers to foams containing C6F14 to
slow down ripening and triangles to foams made of nitrogen only.
5.3.2 Drainage and ripening
5.3.2.1 Smaller bubbles (R . 500 µm)
All the samples presented in Table 5.2 are unstable if none of the destabilisation mecha-
nism is artificially counteracted. For all of them, preventing drainage by a rotation of the
samples does not stop destabilisation, whereas samples containing perfluorohexane are
stable.
110

CHAPTER 5. STABILITY CRITERION FOR FRESH CEMENT FOAMS
R Free drainage No drainage No ripening No ripening
(µm) and ripening Free ripening Free drainage No drainage
TTAB - C1, W/C f from 0.39 to 0.5
≈ 300 Unstable Unstable STABLE STABLE
≈ 400 Unstable Unstable STABLE STABLE
Steol - C2, τy = 18 Pa
≈ 200 Unstable Unstable STABLE STABLE
≈ 300 Unstable Unstable STABLE STABLE
≈ 400 Unstable Unstable STABLE STABLE
Steol - C2, τy = 3 Pa
≈ 200 Unstable Unstable STABLE STABLE
Table 5.2: Effect of slowing down ripening and drainage on sample stability.
When W/C f is further increased above 0.5 for TTAB samples containing perfluoro-
hexane, we sometimes notice a segregation of cement grains at the bottom of the samples
as illustrated in Fig. 5.6 for a TTAB sample at W/C f =0.69 (i.e. a yield stress deduced for
equation 5.2 below 1 Pa) where R = 300 µm. Bubble size after cement hardening in these
samples is kept unchanged, except at the bottom of the sample.
Figure 5.6: Bottom of cement foam sample 15 minutes after production containing TTAB, R =
300 µm, W/C f =0.69 with perfluorohexane (τy < 1 Pa). Sample diameter is 2.6 cm.
Some pictures of the samples after cement hardening are shown as examples in Fig. 5.7.
Each bubble is connected with its neighbors; the size of the opening between two bubbles
depends on the bubble size. Just after sample production and during several hours, the
bubbles are separated by a liquid film containing no cement particle. When the samples
are demolded after 7 days, the liquid film has already disappeared.
Note that for the smaller bubbles, mixing of cement paste and foam is sometimes
not fully homogeneous at the bubble scale: small volumes of cement paste only are sur-
rounded by foam of higher air content than the average value (see Fig. 5.8, top). For in-
stance structure of foams in pictures (c) and (d) in Fig. 5.7 should be the same, but mix-
ing was more inhomogeneous in sample (c). However, the quality of the mixing does not
change the fact that samples are stable only if ripening is prevented: the bubble size distri-
bution measured from the tomography images after cement hardening is narrow around
111

CHAPTER 5. STABILITY CRITERION FOR FRESH CEMENT FOAMS
(a) (b) (c) (d)
Figure 5.7: Pictures of hardened cement foams. From left to right: (a) sample containing TTAB,
initial bubble size 400 µm, with no control of destabilisation mechanisms; (b) sample containing
Steol (18 Pa), initial bubble size 300µm, with perfluorohexane; (c) sample containing Steol (18 Pa),
initial bubble size 200 µm, with perfluorohexane; (d) sample containing Steol (3 Pa), initial bubble
size 200 µm, with perfluorohexane. Height for all pictures is 5 mm.
the average value (see Fig. 5.8, bottom).
Figure 5.8: Top : 3D reconstruction from tomography experiment on a TTAB cement foam,
R=370 µm and W/C f =0.42, stabilized by perfluorohexane. Red arrow indicates an area without
bubbles. Cube size is 3 mm. Bottom: Bubble size distribution by volume (arbitrary unit on vertical
axis), statistics on a 1.5 cm cube in the middle of the sample (about 10 000 bubbles).
An example of the evolution of the morphology of a TTAB cement foam with R =
112

CHAPTER 5. STABILITY CRITERION FOR FRESH CEMENT FOAMS
365 µm is shown in Fig. 5.9. The average radius of the bubbles and the radius of the bigger
bubbles (i.e. average of the bigger three radius) are given in Fig. 5.10 for two TTAB sam-
ples with different initial bubble sizes. Note that fast variations for the default size curves
are due to the image analysis process: some of the bubbles cannot be identified on all the
pictures because of unclean sample walls.
Figure 5.9: Evolution of morphology of fresh cement foam. Example of sample with initial bubble
radius 365µm, W/C=0.41 and 83% air content containing TTAB surfactant. Picture width is 1.5 cm.
Figure 5.10: Evolution of bubble radius with time for the TTAB samples with initial bubble radius
365 µm, W/C f =0.41 (grey curves) and 270 µm, W/C f =0.42. Lines correspond to average value of
all the bubbles and dots show the size of the defaults (average of the bigger three radius).
For both samples, the maximal radius and the average radius of the apparent bubbles
start to increase just after sample preparation. We can notice that the apparent radius are
below the radius of the bubbles of the precursor foam due to the width of the Plateau bor-
ders on the pictures. Bubble size increases faster when the initial bubble size is smaller.
Time for the bigger bubbles to reach twice their initial size is about 20 minutes after foam
113

CHAPTER 5. STABILITY CRITERION FOR FRESH CEMENT FOAMS
preparation when R = 270 µm and W/C f = 0.42, and 40 minutes after foam preparation
when R = 365 µm, W/C f = 0.41
5.3.2.2 Bigger bubbles (R & 500 µm)
In samples containing bigger bubbles, air fraction often increases from the bottom to the
top of the sample when drainage is not prevented through rotation. Examples of slices ob-
tained by X-ray tomography of a 11 cm high sample are shown in Fig. 5.11. Air fraction has
been calculated by image analysis of the tomography slices, and is plotted at the bottom
of Fig. 5.11 as a function of the height. It increases from 80% at the bottom of the sample
to 85% at the top of the 11 cm high sample. This curve additionally shows oscillations of
the air fraction over a length scale close to 1300 µm, i.e. the diameter of the bubbles (see
inset). This is a signature of the organization of the monodisperse bubbles into a crys-
talline structure. When the curve is averaged over a height bigger than the bubble size
(black curve), some local minima and maxima are still present. The local variations may
be created during the mixing of cement paste and precursor foam or appear later during
the drainage of the sample. In Fig. 5.12, a 3D reconstruction drawn from the tomography
images is shown. In addition, the volume size distribution of the bubbles is plotted and
confirms the narrow distribution around the average bubble radius
h=3 cm h= 10 cm
Figure 5.11: Steol sample (τy =3 Pa, R=685 µm). Top: Slices of cement foam sample obtained by
X-ray tomography at different height, bubbles appear in black and cement paste is grey. Bottom :
evolution or air fraction with sample height. Grey curve is raw data, black curve is the data average
over 2000 µm
114

CHAPTER 5. STABILITY CRITERION FOR FRESH CEMENT FOAMS
Figure 5.12: Top: 3D reconstruction from tomography experiment on a Steol sample (τy = 3 Pa,R =
685µm). Cube size is 3 mm. Bottom: Bubble size distribution by volume (arbitrary unit on vertical
axis), statistics on a 1.5 cm cube in the middle of the sample (about 2000 bubbles).
In addition, drainage sometimes leads to a strong destabilization of bubbles at the
bottom of the sample (see Fig. 5.13, left). Preventing drainage by sample rotation makes
the sample more homogeneous (see Fig. 5.13, center) but often leads to weak samples,
that break when they are demolded (see Fig. 5.13, center). This occurs when cement paste
in the foam sample moves when sample rotates, which is often the case when τy is too low.
Figure 5.13: Comparison of samples with big bubble size (TTAB, Φ=0.87%, R=1000 µm) after free
drainage (W/C f =0.44, left) and when drainage has been prevented by rotation (center and right).
Rotation sometimes leads to weak samples that break when they are demolded (W/C f =0.49, right).
Sample height is 6 cm.
115
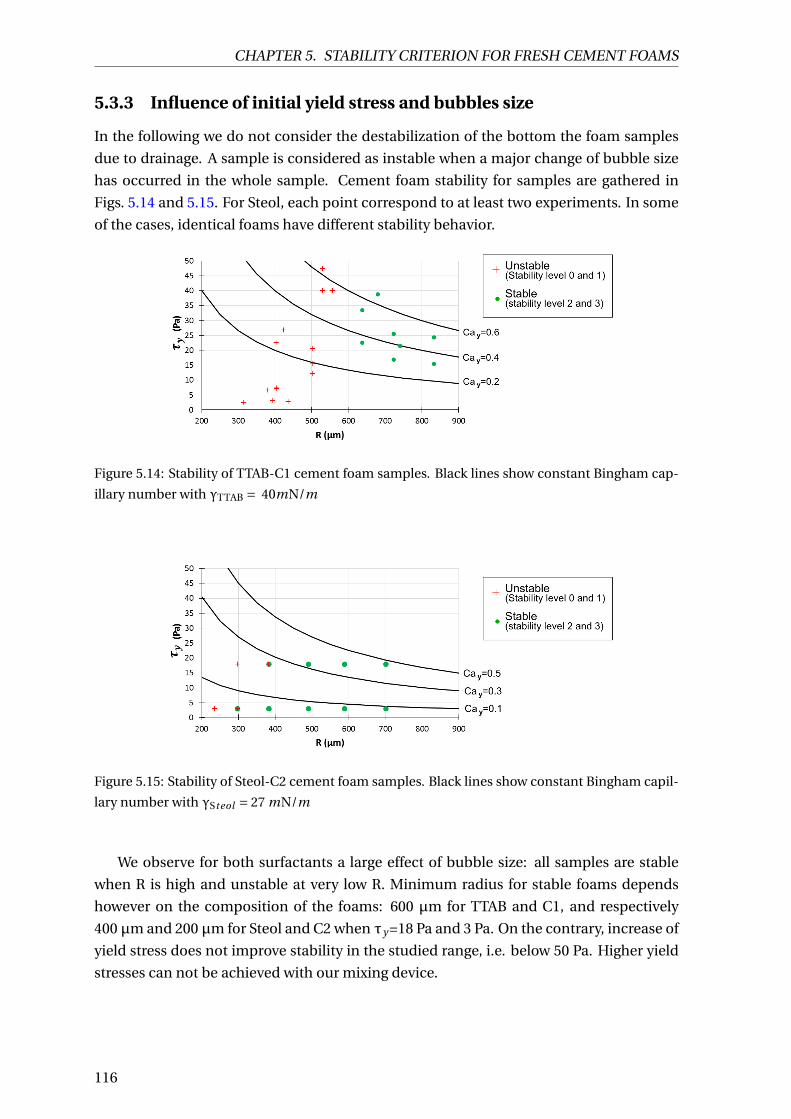
CHAPTER 5. STABILITY CRITERION FOR FRESH CEMENT FOAMS
5.3.3 Influence of initial yield stress and bubbles size
In the following we do not consider the destabilization of the bottom the foam samples
due to drainage. A sample is considered as instable when a major change of bubble size
has occurred in the whole sample. Cement foam stability for samples are gathered in
Figs. 5.14 and 5.15. For Steol, each point correspond to at least two experiments. In some
of the cases, identical foams have different stability behavior.
Figure 5.14: Stability of TTAB-C1 cement foam samples. Black lines show constant Bingham cap-
illary number with γTTAB = 40mN/m
Figure 5.15: Stability of Steol-C2 cement foam samples. Black lines show constant Bingham capil-
lary number with γSteol = 27 mN/m
We observe for both surfactants a large effect of bubble size: all samples are stable
when R is high and unstable at very low R. Minimum radius for stable foams depends
however on the composition of the foams: 600 µm for TTAB and C1, and respectively
400 µm and 200 µm for Steol and C2 when τy =18 Pa and 3 Pa. On the contrary, increase of
yield stress does not improve stability in the studied range, i.e. below 50 Pa. Higher yield
stresses can not be achieved with our mixing device.
116

CHAPTER 5. STABILITY CRITERION FOR FRESH CEMENT FOAMS
5.4 Discussion
5.4.1 Destabilization mechanisms
First, volume of aqueous foams for both surfactants was constant for more than 10 hours
with C6F14 and without. Stability of a liquid film depends on the ability of the surfactant
layers on both interfaces to repel each other. Film breakage occurs when the disjoining
pressure Πd , i.e. the pressure in the liquid film due the the repulsion on the air-liquid
interfaces, reaches a critical value Πd ,cr i t . In an aqueous foam in equilibrium, disjoining
pressure is maximal at the top of the foam and Πd = ρl g h where ρl is the liquid density.
Our results show that TTAB and Steol are able to prevent coalescence, even in the highly
alkaline conditions in cement paste, at Πd = 1000 Pa. In foams, coalescence can take
place even if Πd < ρg hcr i t , because bubble rearrangement can lead to film breakage due
to dynamics, if liquid volume content is very low [9]. Rearrangements can for instance
be a consequence of the evolution of bubble shape due to ripening. This explains why
coalescence occurs after a few hours in Steol aqueous foams containing perfluoroexane
whereas the sample foams with perfluorohexane were stable for 30 hours.
These observations on aqueous foams show that coalescence is not expected to be the
leading destabilisation mechanism in cement foam samples when their height is below
11 cm. Let us now investigate the other two mechanisms. Drainage should stop if yield
stress exceeds a critical value τc,d whose order of magnitude is given by [3]:
τc,d ∼ ρg r (5.3)
where r refers to the external radius of curvature of Plateau borders. At high air con-
tent Φ > 99%, r ≈ R/p
(1−Φ)/0.33 [1] whereas at low air content Φ→ 64%, r → R. In our
case Φ= 83 %; we take r ∼ R, so τc,d ∼ ρg R.
Ripening is expected to be slowed down or stopped when the yield stress of the in-
terstitial material reaches the order of magnitude of the bubble capillary pressure PC [4].
Therefore, we define the critical stress for ripening as:
τc,r ∼ γ/R (5.4)
Both critical stresses for drainage and ripening depend on the bubble radius R. We can
estimate their value for cement foam samples, where ρ ' 2000 kg/m3 and γ ' 30 mN/m.
The obtained curves are shown in Fig 5.16. We notice that for the bubble sizes we have
studied, i.e. 100 µm < R < 1000 µm, τc,d < τc,r . τc,r is two orders of magnitude above
τc,d when R is a few 100 µm, which explains that ripening this the dominant destabiliza-
tion mechanism at small bubble size. When R → 1 mm, critical stresses for drainage and
ripening are the same order of magnitude, and drainage can take place even if no major
evolution of bubble size occurs.
To summarize, the orders of magnitude of the stresses in Fig. 5.16 are in adequation
with experimental observations: ripening is the major destabilization mechanism for the
smaller bubble size, and drainage starts to pays a role when R→ 1 mm.
117

CHAPTER 5. STABILITY CRITERION FOR FRESH CEMENT FOAMS
Figure 5.16: Comparison of driving stresses for drainage and ripening. The curves define three
possible behavior of cement foams when no experimental artifice is used to slow down ripening
or drainage: stable foam if τy > τc,r , both drainage and ripening if τy < τc,d and only ripening at
intermediate yield stress values.
5.4.2 Characteristic destabilization times
To get deeper understanding of drainage and ripening, we can calculate their respective
time scales.
Let us first calculate a rough estimation of drainage characteristic time td . It depends
on the cement foam sample height H and the drainage velocity v : td = H/v . The velocity
is given by Darcy’s law for pressure gradient induced by gravity ρg:
v = k
µappρg (5.5)
Where k is the permeability and µapp the apparent viscosity of the cement paste. Per-
meability of a foam depends of the air fraction and the bubble size [10]:
k = 4(1−Φ)3/2
1700(1−2.7(1−Φ)+2.2(1−Φ)2)2R2 (5.6)
For Φ= 0.83, this gives k = 5.10−4R2.
To assess the apparent viscosity of the continuous phase, a rheological model must be
chosen. Bingham model describes well the rheological behavior of cement paste [11], the
stress τ and the shear rate γ in the paste are related by:
τ= τy +µp γ (5.7)
where the yield stress τy and the plastic viscosity µp depends on the paste formulation.
We have measured the flow curves of three cement pastes with no surfactant, at water-
to-cement ratio from 0.37 to 0.5 (results not shown here). For all three of them, stress at
γ100 = 100 s−1 is close to 2τy , i.e. µp ∼ τy /γ100.
At the scale of the Plateau borders and nodes, the stress is τ ∼ ρg r where r is the
charateristic size of the channels and is close to the bubble radius R for the studied air
fraction. The apparent viscosity is therefore
118

CHAPTER 5. STABILITY CRITERION FOR FRESH CEMENT FOAMS
µapp = τ/γ∼ ρg Rτy
(ρg R−τy )γ100(5.8)
From equations 5.5, 5.6 and 5.8, we find that the characteristic drainage time is
td ∼ Hτy
5.10−4R(ρg R−τy )γ100(5.9)
This gives, for τy = 1 Pa, td ∼ 30 min when R = 200 µm and td ∼ 1 min when R =
700 µm.
Regarding ripening, characteristic time is given by [12]:
tr =2R2
0
K2(5.10)
where K2 is the diffusion coefficient. For nitrogen and low molecular weight surfactants
K2 ∼ 50 µm2/s. For polydisperse foams, characteristic time given by equation 5.10 is the
time during which the average bubble size grows from its initial value R0 to 2 R0. In the
case of monodisperse foams, ripening is delayed. First, there is an induction period dur-
ing which defaults appear and grow in the foam. The length of this induction period is not
known. However, we chose to use equation 5.10 with R0 = R to assess the time evolution
of the defaults due to ripening.
We obtain tr ∼ 50 min when R = 270 µm and tr ∼ 90 min when R = 365 µm. These
calculated times are the same order of magnitude than the ripening times observed in
Fig. 5.10.
Comparison of drainage and ripening characteristic times shows that when cement
paste yield stress is below driving pressures for both drainage and ripening, drainage oc-
curs faster than ripening as soon as R & 200 µm.
R = 200 µm 700 µm 1 mm
τy = 1 Pa Drainage + ripening ∼ 30 min Drainage ∼ 1 min Drainage ∼ 1 min
10 Pa Ripening ∼ 30 min Drainage ∼ 1 h STABLE
100 Pa Ripening ∼ 30 min STABLE STABLE
Table 5.3: Characteristic destabilization times for cement foams with different bubble size and
interstitial yield stress
5.4.3 Effect of Bingham capillary number
We have identified ripening as the major destabilisation mechanism. To go further, we
can use the Bingham capillary number which compares the yield stress (stabilizing effect)
with the capillary pressure inside the bubbles, which leads to ripening:
Cay =τy
τc,r= τy
γ/R(5.11)
119

CHAPTER 5. STABILITY CRITERION FOR FRESH CEMENT FOAMS
We expect that a suitable criterion for foam stability would be under the form of a criti-
cal capillary number Ca∗y . Most intuitive calculation of Bingham capillary number would
use the yield stress of the free cement paste τy obtained from Fig. 5.4. The calculated
values are plotted in Fig. 5.14 and 5.15 and compared to the stability of TTAB and Steol
samples. Cay for all the samples are summarized in Fig. 5.17. We see that Cay cannot be
used to predict cement foam stability: even if stability improves with increasing bubble
size as expected, no improvement can be seen when τy increases up to 50 Pa.
Figure 5.17: Cement foam stability as a function of Bingham capillary number calculated from free
cement paste yield stress. Black dots correspond to Steol samples with τy = 3 Pa, grey dots to Steol
samples with τy = 18 Pa and empty triangles to TTAB samples.
τy is therefore not the adequate yield stress that we can take into account to define a
stability criterion. Chapter 4 provides two hints to define a better criterion :
• The yield stress of the cement paste when it is confined in the foam structure can be
higher than the free yield stress. It is the effective stress that the bubbles must over-
come to deform, consequently, it is more likely to be related to foam stability than
free yield stress. Interstitial yield stress τy,i nt can be obtained from macroscopic
foam yield stress τy, f oam(Φ) by [13]:
τy,i nt =(1− τy, f oam(Φ)
τy,aq (Φ)
)3/2γ
Rc3/2(1−Φ)2(5.12)
where τy,aq (Φ) = 0.6γ
R(Φ−Φc )2 is the yield stress of aqueous foam with the same air
content and c=110 is a constant.
• Yield stress of cementitious materials at rest increases with time due to flocculation
and creation of hydrate bonds between the particles [11]. Therefore, we can wonder
what age t∗ should be taken into account to define a stability criterion. We have
seen in Fig. 5.10 that for unstable samples, the size of the bigger bubbles doubles in
several tens of minutes, so we choose to try t∗ = 15 min.
120

CHAPTER 5. STABILITY CRITERION FOR FRESH CEMENT FOAMS
5.4.4 15 min interstitial Bingham capillary number
We have measured cement foam yield stress at 15 min with rheometry protocol described
in chapter 4. Interstitial capillary number have been deduced using Equation 5.12. Note
that bubble size have an effect on interstitial yield stress: interstitial yield stress decreases
when bubbles size increases.
Figure 5.18: Interstitial yield stress calculated from foam yield stress measured at 15 min for sam-
ples containing TTAB, W/C f =0.42
Two hypothesis can account for this observation. First, equation 5.12 has been empir-
ically obtained on model yield stress fluids (oil-in-water emulsion and beads suspension)
when Cay,i nt = Rτy,i nt /γ < 0.5. The interstitial yield stress value obtained for the bigger
bubbles in Fig. 5.18 gives Cay,i nt ' 1, so that a deviation of the yield stress from the value
given by equation 5.12 is possible.
Besides, a possible effect of bubble size is illustrated by the high resolution tomogra-
phy pictures in Fig. 5.19. When the bubbles are small, the bigger cement grains, whose
diameter before the start of hydration is about 100 µm, have similar size as the Plateau
borders. Note that the synchrotron pictures have been taken two months after the sam-
ple preparation, when most of the cement has reacted with water and formed hydrates,
and that therefore apparent cement grain size on the pictures is smaller than their initial
size. The diameter of the bigger particles that can enter the Plateau borders is given by
equation [14]:
dPB = 2R0.27
p1−Φ+3.17(1−Φ)2.75
1+0.57(1−Φ)0.27(5.13)
With Φ= 83%, we obtain dPB = 60 µm if R = 300 µm and dPB = 160 µm if R = 800 µm.
As a consequence, when the bubbles are small, bigger cement grains cannot enter the
Plateau borders and are stuck in the foam nodes. This leads to a segregation of cement
grains following their size, this segregation can change the yield stress of the cement paste.
Stability of samples is plotted as a function the interstitial capillary number at t∗ =15 min in Fig. 5.20. We can see for all the curves that a transition from unstable samples
at Cay,i nt (t∗) . 1 to stable samples when Cay,i nt (t∗) is higher. We can therefore define a
critical value of the capillary number Ca∗y,i nt (t∗) = 1. It is important to note that the value
of t∗ is expected to highly depends on the preparation method of cement foam sample
121

CHAPTER 5. STABILITY CRITERION FOR FRESH CEMENT FOAMS
Figure 5.19: Synchrotron slices of TTAB cement foams stabilized by C6F14, for R=265 µm (left) and
R=550 µm (right), two months after preparation. Image width is 1300 µm. Red arrows indicate
some of the bigger cement grains.
and can be affected, for instance, by the polydispersity of the foam and the setting time of
the cement.
Figure 5.20: Cement foam stability as a function of Bingham capillary number calculated from
interstitial yield stress at 15 min. Black dots correspond to Steol samples with τy = 3 Pa, grey dots
to Steol samples with τy = 18 Pa and empty triangles to TTAB samples.
5.5 Conclusion
We have investigated the mechanisms at stake in the destabilization of cement foam sam-
ples. We first note that a proper choice of surfactant can prevent coalescence of the films
up to cement hardening.
For most cement foam samples, prepared either with anionic or cationic surfactant,
ripening is the leading destabilization mechanism. Drainage is also sometimes observed
when yield stress of cement paste is very low or bubble size is big. In these cases, drainage
takes place faster than ripening.
122

CHAPTER 5. STABILITY CRITERION FOR FRESH CEMENT FOAMS
Ripening is avoided if Cay,i nt (t∗) > Ca∗y,i nt (t∗) ' 1 where t∗ depends on the prepara-
tion method of the foam. This criterion is independent of bubble size, cement paste yield
stress and surfactant. Yield stress used for the calculation of this criterion is the interstitial
yield stress.
In this work, the air fraction of the samples has been kept constant and both cement
used have similar setting times. In addition, we have studied foams with initially very
narrow bubble size distribution. We can wonder how these factors change the stability
criterion and whether they affect its value or the time t∗.
Bibliography
[1] I. Cantat, S. Cohen-Addad, F. Elias, F. Graner, R. Höhler, O. Pitois, F. Rouyer, and
A. Saint-Jalmes, Foams - Structure and dynamics. Oxford University Press, 2013. 104,
105, 107, 117
[2] B. Feneuil, O. Pitois, and N. Roussel, “Effect of surfactants on the yield stress of ce-
ment paste,” Cement and Concrete Research, vol. 100, pp. 32–39, 2017. 104, 106, 108,
109, 110, 125
[3] S. Guignot, S. Faure, M. Vignes-Adler, and O. Pitois, “Liquid and particles retention
in foamed suspensions,” Chemical Engineering Science, vol. 65, pp. 2579–2585, 2010.
104, 117
[4] I. Lesov, S. Tcholakova, and N. Denkov, “Factors controlling the formation and stabil-
ity of foams used as precursors of porous materials,” Journal of Colloid and Interface
Science, vol. 426, pp. 9–21, 2014. 104, 117
[5] H. Bey, F. Wintzenrieth, O. Ronsin, R. Höhler, and S. Cohen-Addad, “Stabilization of
foams by the combined effects of an insoluble gas species and gelation,” Soft Matter,
vol. 13, pp. 6816–6830, 2017. 107
[6] H. Bessaies-Bey, Polymères et propriétés rhéologiques d’une pâte de ciment : une ap-
proche physique générique. PhD thesis, Université Paris-Est - SIE, 2015. 108
[7] N. Roussel and P. Coussot, “Fifty-cent rheometer for yield stress measurements:
From slump to spreading flow,” Journal of Rheology, vol. 49, no. 3, pp. 705–718, 2005.
108
[8] R. J. Flatt and P. Bowen, “Yodel: a yield stress model for suspensions,” Journal of the
American Ceramic Society, vol. 89, no. 4, pp. 1244–1256, 2006. 108
[9] A.-L. Biance, A. Delbos, and O. Pitois, “How topological rearrangements and liquid
fraction control liquid foam stability,” Physical Review Letters, vol. 106, p. 068301,
2011. 117
[10] F. Rouyer, O. Pitois, E. Lorenceau, and N. Louvet, “Permeability of a bubble assembly:
from the very dry to the wet limit,” Physics of Fluids, vol. 22, p. 043302, 2010. 118
123

CHAPTER 5. STABILITY CRITERION FOR FRESH CEMENT FOAMS
[11] N. Roussel, A. Lemaître, R. J. Flatt., and P. Coussot, “Steady state flow of cement
suspensions: A micromechanical state of the art.,” Cement and Concrete Research,
vol. 40, pp. 77–84, 2010. 118, 120
[12] O. Pitois, “Foam ripening,” in Foam Engineering: Fundamentals and Applications
(P. Stevenson, ed.), pp. 59–73, John Wiley & Sons, 2012. 119
[13] F. Gorlier, Y. Khidas, and O. Pitois, “Yielding of complex liquid foams,” Journal of
Rheology, vol. 61, pp. 919–930, 2017. 120
[14] N. Louvet, R. Höhler, and O. Pitois, “Capture of particles in soft porous media,” Phys-
ical Review E, vol. 82, p. 041405, 2010. 121
124

CHAPTER 5. STABILITY CRITERION FOR FRESH CEMENT FOAMS
Appendices
Appendix A: aqueous foam stability
Stability of aqueous foam is shown in Fig. 5.21 for several surfactants studied in [2] and
appendix of chapter 2. All foams contain perfluorohexane.
Figure 5.21: Stability of aqueous foams containing perfluorohexane with surfactants studied in
chapter 2.
Synthetic cement pore solution makes Bio-Terge foam less stable. Whereas Bio-Terge
at 1 g/L can stabilize aqueous foam. Glucopon at 10 g/L was not enough to get stable
foams for 10 hours, whereas 20 g/l provided stable foams in water and synthetic cement
pore solution. Alpha Foamer and Triton are stable at the studied concentration in water
and synthetic cement pore solution for at least 10 h.
125

CHAPTER 5. STABILITY CRITERION FOR FRESH CEMENT FOAMS
126

Chapter 6
Water imbibition of open-cell cement
foams
Sommaire6.1 Introduction . . . . . . . . . . . . . . . . . . . . . . . . . . . . . . . . . . . . 127
6.2 Materials and methods . . . . . . . . . . . . . . . . . . . . . . . . . . . . . . 128
6.2.1 Materials . . . . . . . . . . . . . . . . . . . . . . . . . . . . . . . . . . . 128
6.2.2 Cement foam production . . . . . . . . . . . . . . . . . . . . . . . . . 128
6.2.3 Characterization of the foam morphology . . . . . . . . . . . . . . . 129
6.2.4 Permeability measurement . . . . . . . . . . . . . . . . . . . . . . . . 130
6.2.5 Imbibition experiment . . . . . . . . . . . . . . . . . . . . . . . . . . . 131
6.3 Results and discussion . . . . . . . . . . . . . . . . . . . . . . . . . . . . . . 131
6.4 Conclusion . . . . . . . . . . . . . . . . . . . . . . . . . . . . . . . . . . . . . 136
Bibliography . . . . . . . . . . . . . . . . . . . . . . . . . . . . . . . . . . . . . . . 137
6.1 Introduction
Durability of construction materials can be jeopardized by successive imbibition/drying
cycles. Therefore, controlling sorption properties of those materials is a crucial issue and
water repellents can be used for preventing or decreasing water absorption [1]. Theory
of capillary imbibition has been intensively studied from the pioneering works of Bell &
Cameron [2], Lucas [3] and Washburn [4]. They assumed, in agreement with experimental
observations, that under the action of capillary effects, a wet front progresses through the
sample while saturating the material behind. The above basic theory turns out to be in-
appropriate when applied to complex materials with several levels of porous phases. This
is the case for foamed concretes [5], autoclaved aerated concretes [6] and aerated gyp-
sum [7] for example, in which effects of multimodal distributions of pores remain difficult
to understand in terms of material sorption characteristics. However, designing materi-
als with appropriate imbibition properties requires understanding how sorption behav-
127

CHAPTER 6. WATER IMBIBITION OF OPEN-CELL CEMENT FOAMS
ior depends on the material morphology. Here we investigate the imbibition behavior of
well-controlled cement foams. In contrast to autoclaved aerated concrete, the studied
cement foams are open-cell foams with cell window size that depends on both pore size
and foam density. We show that those pore windows control the imbibition properties of
such material. Moreover, choice made for the surfactant when preparing cement foam is
proven to be crucial.
6.2 Materials and methods
6.2.1 Materials
Two surfactants are used: tetradecyltrymethyl ammonium bromide (TTAB) provided by
Sigma-Aldrich and Steol® 270 CIT provided by Stepan. The main difference between the
surfactants lies in the charge of the hydrophilic head: TTAB is positively charged and Steol
negatively charged. This leads to different adsorption behavior on cement grains sur-
face. More information about these surfactants and their behavior in cement paste can
be found in reference [8].
We use two different cements; their compositions and physical properties are speci-
fied in Table 6.1. The first is used in TTAB samples and will be referred to in the following
as C1; it is manufactured by Lafarge, in Saint-Vigor factory. C2 is used in Steol samples
and is a CEM I cement from Lafarge, Lagerdorf.
C1 C2
CaO/SiO2 3 3
MgO 1.1% 0.8%
Na2O + 0.658 K2O 0.34% 0.5%
SO3 2.58% 2.5 %
Cl− 0.03% 0.04 %
Gypsum 2.4% 4%
Density (g/cm3) 3.21 3.15
SSB (cm2/g) 3586 4330
Table 6.1: Chemical and physical properties of cements. C1 refers to CEM I cement from Lafarge,
Saint-Vigor and C2 to CEM I cement from Lafarge, Lagerdorf.
6.2.2 Cement foam production
To prepare cement foam samples, we mix a precursor aqueous foam with a cement paste.
Precursor foam is made from a surfactant solution in distilled water and from nitrogen
gas. For each sample, all the bubbles have the same size. They are generated through
a 100 µm size T-junction with two entrances, one for gas and one for foaming solution.
Then they are collected in a column, where the foam is kept at constant liquid fraction
128
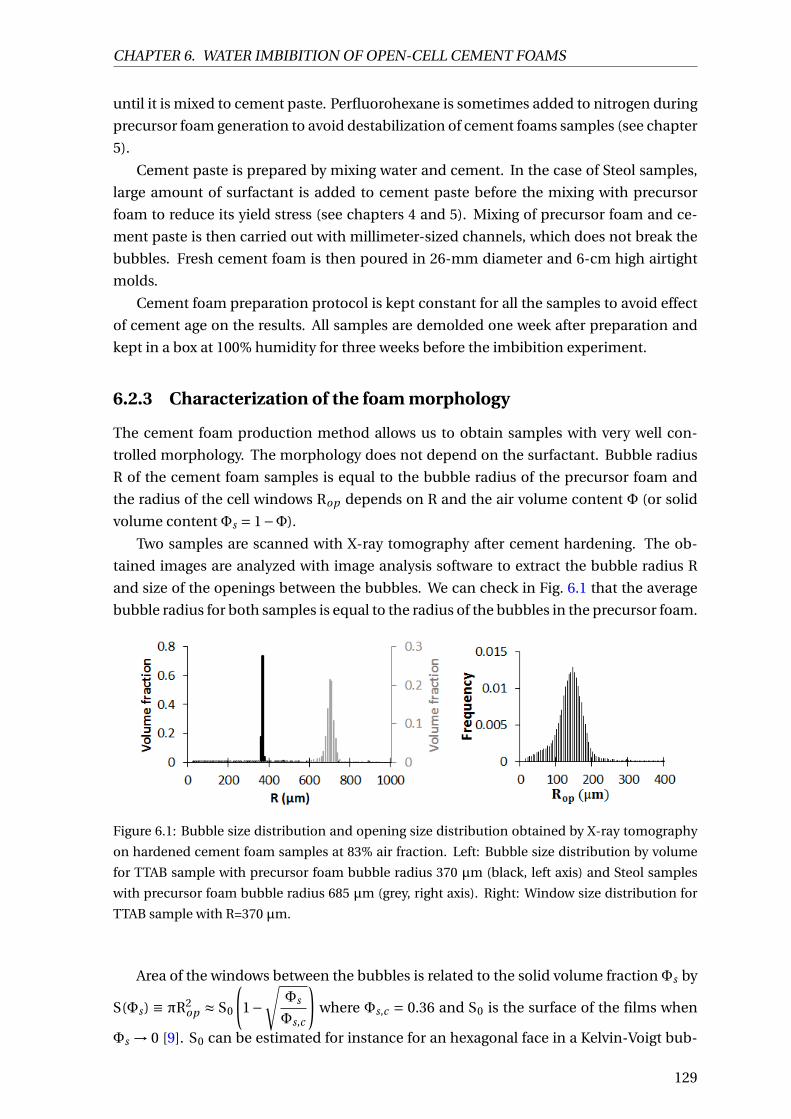
CHAPTER 6. WATER IMBIBITION OF OPEN-CELL CEMENT FOAMS
until it is mixed to cement paste. Perfluorohexane is sometimes added to nitrogen during
precursor foam generation to avoid destabilization of cement foams samples (see chapter
5).
Cement paste is prepared by mixing water and cement. In the case of Steol samples,
large amount of surfactant is added to cement paste before the mixing with precursor
foam to reduce its yield stress (see chapters 4 and 5). Mixing of precursor foam and ce-
ment paste is then carried out with millimeter-sized channels, which does not break the
bubbles. Fresh cement foam is then poured in 26-mm diameter and 6-cm high airtight
molds.
Cement foam preparation protocol is kept constant for all the samples to avoid effect
of cement age on the results. All samples are demolded one week after preparation and
kept in a box at 100% humidity for three weeks before the imbibition experiment.
6.2.3 Characterization of the foam morphology
The cement foam production method allows us to obtain samples with very well con-
trolled morphology. The morphology does not depend on the surfactant. Bubble radius
R of the cement foam samples is equal to the bubble radius of the precursor foam and
the radius of the cell windows Rop depends on R and the air volume content Φ (or solid
volume content Φs = 1−Φ).
Two samples are scanned with X-ray tomography after cement hardening. The ob-
tained images are analyzed with image analysis software to extract the bubble radius R
and size of the openings between the bubbles. We can check in Fig. 6.1 that the average
bubble radius for both samples is equal to the radius of the bubbles in the precursor foam.
Figure 6.1: Bubble size distribution and opening size distribution obtained by X-ray tomography
on hardened cement foam samples at 83% air fraction. Left: Bubble size distribution by volume
for TTAB sample with precursor foam bubble radius 370 µm (black, left axis) and Steol samples
with precursor foam bubble radius 685 µm (grey, right axis). Right: Window size distribution for
TTAB sample with R=370 µm.
Area of the windows between the bubbles is related to the solid volume fraction Φs by
S(Φs) ≡ πR2op ≈ S0
(1−
√Φs
Φs,c
)where Φs,c = 0.36 and S0 is the surface of the films when
Φs → 0 [9]. S0 can be estimated for instance for an hexagonal face in a Kelvin-Voigt bub-
129

CHAPTER 6. WATER IMBIBITION OF OPEN-CELL CEMENT FOAMS
bles: S0,Kel vi n = 3p
3
2
(π
6p
2
)2/3
R2 [9]. Therefore, the opening radius can be estimated by
the following equation:
Rop ≈ R
√√√√3p
3
2π
(π
6p
2
)2/3(
1−√
Φs
Φs,c
)(6.1)
ForΦs = 0.17 and R = 370µm, the calculated value of the window size is Rop ≈ 140µm;
it fits well with the average value obtained from the tomography pictures (see size distri-
bution in Fig. 6.1, right).
6.2.4 Permeability measurement
Gas-flow permeability was measured with a home-made setup (see Fig. 6.2). A gas flow
controller was used to push dry nitrogen through the foam sample (length L and circular
cross-section S = 5.3 cm2) embedded with PTFE ribbon and fitting a cylindrical tube. The
pressure difference ∆P across the sample was measured thanks to a manometer. Several
measurements were performed as a function of the gas flow rate Q (see a typical measure-
ment in Fig. 6.2). The foam permeability was deduced from the Darcy law:
k = ηL/S
d(∆P)/dQ(6.2)
where η= 1.8 10−5 Pa.s is the dynamic viscosity of the gas.
Figure 6.2: Setup used for measuring air-flow permeability of cement foams. A gas flow controller
is used to push nitrogen at volume flow rate Q through the foam sample. The pressure difference
∆P across the sample is measured thanks to a manometer. A typical example for the resulting
∆P(Q) curve is presented.
130

CHAPTER 6. WATER IMBIBITION OF OPEN-CELL CEMENT FOAMS
6.2.5 Imbibition experiment
Water imbibition was studied by measuring the capillary rise through foam samples. Sam-
ples were put in contact with a thin layer (5 mm) of water in a 30-cm diameter container.
The diameter of the container is large compared to the sample dimension so that we can
assume that the height of the liquid layer does not vary during an experiment. The rising
front was followed using a camera (see the picture in Fig. 6.4).
6.3 Results and discussion
Results for foam permeability are presented in Fig. 6.3 as a function of solid volume frac-
tion Φs , for several samples with different pore radius R, and for both TTAB and Steol
surfactants. Note that it is more convenient to plot the dimensionless permeability, i.e.
k/V2/3b , with Vb = 4/3πR3, because k/V2/3
b is expected to depend only onΦs . Fig. 6.3 shows
such a behavior, where k/V2/3b decreases from 0.018 to 0.010 as Φs increases from 0.1 to
0.17. Note that permeability values are close for the two studied surfactants. We have
reported theoretical values provided by Lusso & Chateau for the foam permeability of dis-
ordered monodisperse foams [10]. It can be seen that this theoretical curve is in very good
agreement with our data. In the following, we will refer to that curve for estimating foam
permeability of our foam samples.
Figure 6.3: Results for cement foam permeability as measured by gas flow experiment (circles:
yellow for TTAB samples and green for Steol samples) and deduced from imbibition experiment
using equation 6.4 (squares). The black line corresponds to the theoretical values provided by
Lusso & Chateau [10].
Typical results for water imbibition are presented in Fig. 6.4. All TTAB foam samples
reach the height h = 1 cm within 1 s. After the rapid rising regime, data show a stair-
shape curve in the linear-log scale. This behavior is related to the saturation height (the
so-called Jurin height) for imbibition of the foam pores. The further increase of the front
height can be explained by the imbibition of the foam porous skeleton (i.e. cement ma-
trix), which is characterized by a much lower imbibition velocity. Note that the second
131
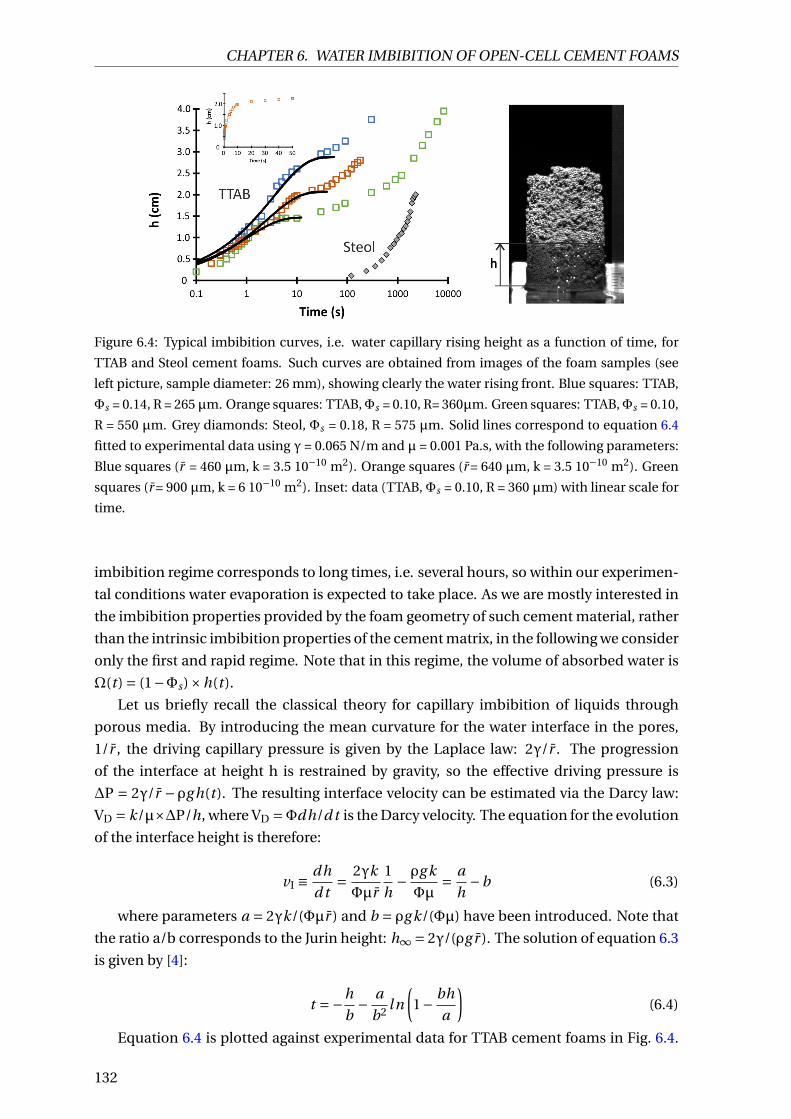
CHAPTER 6. WATER IMBIBITION OF OPEN-CELL CEMENT FOAMS
Figure 6.4: Typical imbibition curves, i.e. water capillary rising height as a function of time, for
TTAB and Steol cement foams. Such curves are obtained from images of the foam samples (see
left picture, sample diameter: 26 mm), showing clearly the water rising front. Blue squares: TTAB,
Φs = 0.14, R = 265µm. Orange squares: TTAB,Φs = 0.10, R= 360µm. Green squares: TTAB,Φs = 0.10,
R = 550 µm. Grey diamonds: Steol, Φs = 0.18, R = 575 µm. Solid lines correspond to equation 6.4
fitted to experimental data using γ = 0.065 N/m and µ = 0.001 Pa.s, with the following parameters:
Blue squares (r = 460 µm, k = 3.5 10−10 m2). Orange squares (r = 640 µm, k = 3.5 10−10 m2). Green
squares (r = 900 µm, k = 6 10−10 m2). Inset: data (TTAB, Φs = 0.10, R = 360 µm) with linear scale for
time.
imbibition regime corresponds to long times, i.e. several hours, so within our experimen-
tal conditions water evaporation is expected to take place. As we are mostly interested in
the imbibition properties provided by the foam geometry of such cement material, rather
than the intrinsic imbibition properties of the cement matrix, in the following we consider
only the first and rapid regime. Note that in this regime, the volume of absorbed water is
Ω(t ) = (1−Φs)×h(t ).
Let us briefly recall the classical theory for capillary imbibition of liquids through
porous media. By introducing the mean curvature for the water interface in the pores,
1/r , the driving capillary pressure is given by the Laplace law: 2γ/r . The progression
of the interface at height h is restrained by gravity, so the effective driving pressure is
∆P = 2γ/r −ρg h(t ). The resulting interface velocity can be estimated via the Darcy law:
VD = k/µ×∆P/h, where VD =Φdh/d t is the Darcy velocity. The equation for the evolution
of the interface height is therefore:
vI ≡ dh
d t= 2γk
Φµr
1
h− ρg k
Φµ= a
h−b (6.3)
where parameters a = 2γk/(Φµr ) and b = ρg k/(Φµ) have been introduced. Note that
the ratio a/b corresponds to the Jurin height: h∞ = 2γ/(ρg r ). The solution of equation 6.3
is given by [4]:
t =−h
b− a
b2l n
(1− bh
a
)(6.4)
Equation 6.4 is plotted against experimental data for TTAB cement foams in Fig. 6.4.
132

CHAPTER 6. WATER IMBIBITION OF OPEN-CELL CEMENT FOAMS
Note that the value for the saturation height sets the value for r , so fitting equation 6.4
to our data provides the expected value for the foam permeability k. Following such a
procedure, we obtain values for r and k presented in Figs. 6.5 and 6.3 respectively. Let us
first discuss values obtained for r : the radius of curvature of the interface is set mainly by
the pore size, and secondarily by solid volume fractionΦs (see Fig. 6.5). This result is con-
sistent with the theory of capillarity in thin tubes, as expressed by the Jurin law: smaller
pores induce smaller radii of curvature, and consequently larger capillary pressures. The
observed relation between r and bubble size can be approximated by: r ≈ 1.5R. Note that
for a perfectly wetting cylindrical tube of radius R, one would have r ≈ R. This deviation
reflects the complex pore shape in foam and the numerous gaps (windows between pores)
located around each pore. Note that the foam pore shape geometry with solid struts and
gaps has some similarity with bundles of cylindrical fibers as studied by Princen [11]. Of
course, the size of those gaps decreases as Φs increases, i.e. the surface area covered by
solid walls increases, and this could explain the weak effect observed for Φs .
Figure 6.5: Radius of curvature for the water/air interface in cement foam samples, as deduced
from equation 6.4, as a function of the pore size. Different symbols are used for indicating the
solid volume fraction of the foam samples: blue diamonds (Φs ≈ 0.10), green squares (Φs ≈ 0.15)
and orange circles (Φs ≈ 0.20). The dotted lines correspond to equations r = 1.32R and r = 1.72R.
Permeability values deduced from imbibition results (see Fig. 6.3) are found to be one
order of magnitude smaller than measured foam permeability, i.e. within the range 0.2-
0.6 10−10 m2. In other words, using the measured foam permeability values in equation
6.4 would give imbibition velocity 10 times larger than observed velocity. In order to un-
derstand the physical origin of this deviation, we have taken images of the imbibition
process with a larger image frequency (100 i/s) and a higher magnification. Such image
sequence is presented in Fig. 6.6 as a single spatio-temporal image (image width corre-
sponds to time). This reveals how the water front proceeds during rising through the
porous structure: from pore to pore, the capillary ascending motion pauses regularly, and
the durations of those pauses appear to be distributed within the range 0.05 s – 0.2 s.
It is recognized that interface motions can be slowed down or even stopped by passing
through pore junctions or through capillaries with significant expansion of the cross-
section [12, 13, 14]. We therefore attribute the observed pauses to the windows between
the pores, where the interface is expected to flatten, i.e. r → ∞, for satisfying contact
133

CHAPTER 6. WATER IMBIBITION OF OPEN-CELL CEMENT FOAMS
angle conditions at sharp edges constriction geometry [13]. This means that the driving
capillary pressure drops at pore windows and then spreading of thin precursor film em-
anating from the rising liquid promotes the sudden pull-up of the interface in the new
pore, where equilibrium contact angle conditions can be recovered. Note that the porous
nature of the cement skeleton may contribute to such breakthrough. This process takes
the time identified as the pauses during imbibition (see Fig. 6.6 (c)).
Figure 6.6: Capillary water imbibition observed at the pore scale. (a) Image of the foam sample
and (b) spatio-temporal image (width corresponds to time: 1 pixel = 0.01 s) of the water rising
front (yellow curve) observed at frame rate of 100 images per second. A stair-shape curve is ob-
tained, which means that the capillary ascending motion pauses regularly. The dotted line cor-
responds to the average front velocity with slope (dh/dt), whereas the continuous line shows the
slope 10×(dh/dt). (c) Schematic plot of the interface ascending motion at pore scale, where the
rising velocity is vI for the main part of the pore – i.e. areas (i) and (iii), whereas it drops down to
a low value at pore window, i.e. area (ii). Configurations of the interface are shown by sketches (i),
(ii) and (iii). The evolution of the driving capillary, i.e. γ/r , is also presented: first it drops down at
pore window, and it rebuilds after a characteristic time tc .
We propose to account for the effect of the pauses by introducing the average dura-
tion tc spent by the interface between two neighbor pores during the vertical motion (see
Fig. 6.6). The dynamics of the vertical motion between two successive stops can still be
considered as mainly governed by the balance between capillary effects and Darcy’s law
(leading to equation 6.4). Therefore, the average time for the interface to travel a length
2R is equal to 2R/vI + tc , and the modified imbibition velocity is given by:
vI,tc =2R
2RvI
+ tc= vI
1+ vI
2R/tc
(6.5)
In the following we choose to use k values provided by Lusso & Chateau [10] (see
Fig. 6.3) and to consider tc as a fitting parameter such as tc = t0(1+ p ht0
), where t0 is a
minimal time and coefficient p accounts for the slowdown effect of gravity (time tc is
expected to increase as a function of height). Parameters t0 and p can be determined by
fitting equation 6.5 to our data. In practice, we chose hi values within the range of interest
and we calculate the corresponding times ti = ti−1 + (hi −hi−1)/(vI,tc )i , where (hi −hi−1)
correspond to small steps. Results obtained by fitting equation 6.5 to data from Fig. 6.4
134

CHAPTER 6. WATER IMBIBITION OF OPEN-CELL CEMENT FOAMS
are presented in Fig. 6.7, showing reasonable agreement. Note that both r and k values
are now consistent. This procedure is performed for all samples, providing values for the
fitting parameters: t0 ≈ 0.005 s, and p is shown in figure E (inset), where the average value
is given by p ×R ≈ 0.005 s. This corresponds to p ≈ 0.1 s/cm, or equivalently, the average
time tc is approximately equal to 0.1 s for h ≈ 1 cm, which is consistent with observed
pause durations in Fig. 6.6. The additional parameter tc is therefore useful for reconcil-
ing k values and r values in the water capillary imbibition process of cement foams, and it
shows that pore windows have a significant influence on water imbibition properties. The
analysis of p values reveals that p increases with both pore size and gas volume fraction,
so does foam permeability. Indeed, recent work showed that k/R2 ∼ (Rop /R)3 [15]. We
identify a simple relationship between p and k: (pR)/k ≈ 106 s/m2, which indicates that
the pore halting mechanism depends on geometry of the pore windows. Further study
would be useful for clarifying this issue.
Figure 6.7: Water capillary rising height as a function of time for TTAB cement foams (data from
Fig. 6.4). Solid lines correspond to equation 6.5 fitted to experimental data using γ = 0.065 N/m
and µ = 0.001 Pa.s, with the following parameters: Blue squares (r = 460 µm, k = 8.5 10−9 m2, t0
= 0.005 s, p = 0.06 s/cm). Orange squares (r = 660 µm, k = 5 10−9 m2, t0 = 0.005 s, p = 0.18 s/cm).
Green squares (r = 950 µm, k = 12 10−9 m2, t0 = 0.005 s, p = 0.23 s/cm). Inset: Results for p ×R
as a function of foam permeability for all studied TTAB samples. The dotted line corresponds to
equation pR = 106k.
Finally we discuss the effect of surfactant. Whereas imbibition velocities for TTAB ce-
ment foams were found to be of the order of 1 cm/s, Steol cement foam requires almost
1000 s for the water front to reach h = 1 cm (i.e. 0.001 cm/s). Moreover, an “induction
period" of almost 100 s is observed before measurable imbibition. In fact, such behav-
ior cannot be described with equation 6.4 whatever the value for k. On the other hand,
such slow kinetics can be reconciled with theory using equation 6.5 with tc ∼ 100 s. This
extremely long time suggests that additional chemical effects are involved, such as the
dissolution of dried surfactant remaining onto the cement surface. Note that Steol sur-
factant has been shown to induce high water contact angles on cement surface, provided
that Steol concentration is low enough [8]. Initial Steol concentration is rather high in
135

CHAPTER 6. WATER IMBIBITION OF OPEN-CELL CEMENT FOAMS
this study, but one can expect that Steol molecules, that are known to adsorb significantly
on cement/hydrate grains, are consumed by new hydrate surface area, making the Steol
concentration drop below a critical value. Therefore, a plausible mechanism for Steol ac-
tion is (1) the in-situ hydrophobization of the cement skeleton, (2) the surfactant layer re-
mains on the surface of the foam skeleton as the sample is left for drying, and (3) the slow
dissolution of the dried hydrophobic surfactant layer by the imbibing water. As TTAB sur-
factant has not been shown to induce such hydrophobization effect on cement [8], TTAB
cement imbibition does not exhibit such specific behavior.
6.4 Conclusion
Water imbibition has been studied in cement foams prepared from two distinct foam-
ing solutions, namely TTAB and Steol surfactant solutions. Thanks to a dedicated foam-
ing method, we were able to produce samples with controlled pore size and gas volume
fraction. Results obtained for TTAB show imbibition behavior consistent with Washburn
theory if the permeability parameter is used as a fitting parameter. However, fitted val-
ues were found to one order of magnitude smaller than theoretical and measured values.
Observation of the imbibition process at the pore scale revealed that the capillary ascend-
ing motion pauses regularly, which makes the imbibition velocity decrease and explains
the low fitted values for the foam permeability. This was attributed to the effect of pore
windows, i.e. passages between pores. We have introduced a characteristic time corre-
sponding to the excess time spent by the interface at those pore windows. Using that time
as a fitting parameter, we succeed to reconcile measured permeability values with mea-
sured imbibition velocities. The fitted values for the characteristic time are of the order
0.1 s, which was found to be consistent with direct observations of the imbibition pro-
cess at the pore scale. Further work could be useful for evaluating the relevance of our
approach for porous materials exhibiting the similar morphological features. Results ob-
tained for Steol show extremely slow imbibition velocities, i.e. 1000 times smaller than
for TTAB samples, which cannot be described using the classical Washburn theory. This
effect has been attributed to the in-situ hydrophobization of the cement foam skeleton
during the production process. As water is put in contact with the foam sample, imbibi-
tion is prevented by the water-repellent action of the dried surfactant layer. Imbibition
proceeds on condition that the dried surfactant layer is dissolved by the imbibing water
as the front goes along. This clearly shows that surfactant used for preparing cement foam
has crucial effect on imbibition properties of such porous material.
Bibliography
[1] C. Ma and B. Chen, “Properties of foamed concrete containing water repellents,”
Construction and Building Materials, vol. 123, pp. 106–114, 2016. 127
[2] J. M. Bell and F. K. Cameron, “The flow of liquids through capillary spaces,” Journal
of Physical Chemistry, vol. 10, pp. 658–674, 1906. 127
136

CHAPTER 6. WATER IMBIBITION OF OPEN-CELL CEMENT FOAMS
[3] R. Lucas, “Ueber das zeitgesetz des kapillaren aufstiegs von flüssigkeiten,” Kolloid-
Zeitschrift, vol. 23, pp. 15–22, 1918. 127
[4] E. W. Washburn, “The dynamics of capillary flow,” Physical Review, vol. 17, pp. 273–
283, 1921. 127, 132
[5] E. Kunhanandan Nambiar and K. Ramamurthy, “Air-void characterisation of foam
concrete,” Cement and Concrete Research, vol. 37, pp. 221–230, 2007. 127
[6] I. Ioannou, A. Hamilton, and C. Hall, “Capillary absorption of water and n-decane by
autoclaved aerated concrete,” Cement and Concrete Research, vol. 38, pp. 766–771,
2008. 127
[7] K. Song, J. Mitchell, H. Jaffel, and L. Gladden, “Magnetic resonance imaging studies
of spontaneous capillary water imbibition in aerated gypsum,” Journal of Physics D:
Applied Physics, vol. 44, 2011. 127
[8] B. Feneuil, O. Pitois, and N. Roussel, “Effect of surfactants on the yield stress of ce-
ment paste,” Cement and Concrete Research, vol. 100, pp. 32–39, 2017. 128, 135, 136
[9] I. Cantat, S. Cohen-Addad, F. Elias, F. Graner, R. Höhler, O. Pitois, F. Rouyer, and
A. Saint-Jalmes, Foams - Structure and dynamics. Oxford University Press, 2013. 129,
130
[10] C. Lusso and X. Chateau, “Numerical modeling of disordered foam in 3d: Effective
properties by homogenization,” in Poromechanics VI (M. Vandamme, P. Dangla, J.-
M. Pereira, and S. Ghabezloo, eds.), pp. 1347–1354, 2017. 131, 134
[11] H. M. Princen, “Capillary phenomena in assemblies of parallel cylinders. ii. capil-
lary rise in systems with more than two cylinders,” Journal of Colloid and Interface
Science, vol. 30, pp. 359–371, 1969. 133
[12] H. Wiklund and T. Uesaka, “Microfluidics of imbibition in random porous media,”
Physical Review E - Statistical, Nonlinear, and Soft Matter Physics., vol. 87, 2013. 133
[13] H. Mehrabian, P. Gao, and J. Feng, “Wicking flow through microchannels,” Physics of
fluids, vol. 23, pp. 1–14, 2011. 133, 134
[14] Z. Sadjadi, M. Jung, R. Seemann, and H. Rieger, “Meniscus arrest during capillary rise
in asymmetric microfluidic pore junctions,” Langmuir, vol. 31, pp. 2600–2608, 2015.
133
[15] V. Langlois, V. H. Trinh, C. Lusso, C. Perrot, X. Chateau, Y. Khidas, and O. Pitois,
“Permeability of solid foam: Effect of pore connections,” Physical Review E, vol. 97,
p. 053111, 2018. 135
137
CHAPTER 6. WATER IMBIBITION OF OPEN-CELL CEMENT FOAMS
138

Conclusion
When cement foams are prepared by mixing an aqueous foam and a cement paste, sur-
factants must be used. We have first selected various surfactants that are compatible with
cement solution and investigated their effects on cement paste, without air bubbles. De-
pending on the type of surfactant and its concentration, addition of surfactant can have
three different consequences on cement paste yield stress. (1) Some surfactants have low
affinity to cement grains and hardly change the properties of the cement paste. (2) At
low concentration, surfactants with high affinity to cement grains (mainly anionic sur-
factants) form a single layer that makes the cement grains hydrophobic. Hydrophobic
interaction increases attraction between cement grains and enhances the yield stress of
the cement paste. (3) At high concentration, the same surfactants form micelles on the
cement grains surface, which creates a steric repulsion between the grains and makes
cement paste yield stress drop.
Then, we have studied aerated cement pastes and cement foams. The identification
of the three surfactant regimes has allowed us to control the properties of the produced
cement foams, and to analyze the rheological measurements and the stability of the fresh
materials, and the water imbibition of the solid foams.
When bubbles are added to cement paste at air fractions below 40%, their effect on
the paste yield stress is strongly affected by the surface properties of cement grains. Hy-
drophobic cement grains irreversibly adsorb on bubble surface; this changes the surface
characteristics of the bubbles, so that bubbles enhance the yield stress similarly to solid
inclusions. On the other hand, when cement grains are hydrophilic and do not adsorb at
air-liquid interfaces, behavior of bubbles in cement paste corresponds to observations in
model yield stress fluids: dimensionless yield stress depends on the air volume content
and on the deformability of the bubbles.
When air volume content is higher, around 83%, most foams tend to destabilize be-
fore cement hardening due to ripening. Unexpectedly, when yield stress of the cement
paste τy is changed by the addition of superplasticizer or high amount of anionic surfac-
tant, ripening can be stopped if the yield stress is relatively low, in the range τ∗∗y < τy < τ∗y .
Rheological measurements on the foam when τy < τ∗y show that the yield stress of the
interstitial cement paste is greatly increased due to the confinement between the bub-
bles. In addition, water can be more easily extracted from the interstitial cement paste
under gravity when τy < τ∗y than when τy > τ∗y . Our hypothesis is that the yield stress en-
hancement and remarkable stability in the low yield stress regime is a consequence of the
139

CONCLUSION
reorganization of cement grains into a denser granular structure. Destabilization when
τy < τ∗∗y is attributed to the deflocculated state of the smaller cement particles, which
exit the foam skeleton.
Then, we have compared cement foams prepared with two different surfactants, with
low and high affinities to cement grains. A stability criterion, independent on the surfac-
tant, can be defined from the bubble radius R, the yield stress of the paste confined by the
bubbles τy,i nt and the air-fluid surface tension γ. Foams are stable when the Bingham
capillary number, evaluated for the interstitial cement paste at time t∗, is above a critical
value. Time t∗ is expected to depend on the preparation method of the cement foam.
Further studies on cement foam stability would be needed to understand the role of
air volume fraction. In addition, the regime when cement grains are hydrophobic has
not been investigated here. We expect that the adsorption of cement grains at air-fluid
interfaces leads to the formation of closed porosity. Effect of cement membranes between
the bubbles on foam stability and rheology remains to be investigated.
Finally, we have studied the water imbibition of cement foams with open porosity.
We have observed that the imbibition is slower than the velocity predicted from the per-
meability measurement. We have introduced a characteristic time, corresponding to the
excess time spent by the water interface at windows between the bubbles, to reconcile
measured permeability values with measured imbibition velocities. For surfactant with
low affinity to cement grain surface, the fitted values for the characteristic time are of the
order 0.1 s, which was found to be consistent with direct observations of the imbibition
process at the pore scale. Results obtained for surfactant with high affinity to cement sur-
face shows extremely slow imbibition velocities, i.e. 1000 times smaller. The main reason
must be the hydrophobization of the pore walls. This observation illustrates the strong
relation between material formulation and its final properties.
140

Appendix A
Compressive resistance
In this appendix, we report some measurements of compressive strength of cement foams.
We compare two surfactants (anionic and cationic). We study mostly samples at air frac-
tion above 75% and a few samples at air fraction below 40%.
A.1 Materials and methods
A.1.1 Materials
Two surfactants and two cements are used. Samples containing TTAB cationic surfactant
are made with CEM I cement from Lafarge, Saint-Vigor factory (C1). For samples contain-
ing Steol anionic surfactant, CEM I cement from Lafarge, Lagerdorf factory (C2) is used.
Manufacturers and chemical formulas of surfactants, and cement chemical compositions
can be found in chapter 5.
A.1.2 Sample preparation protocol
Precursor foam is generated as explained in chapters 3, 4 and 5. For each sample, it is
mixed with a cement paste. Then samples are cast into 26-mm diameter and 6 cm high
sealed molds. Samples are demolded 7 days after preparation and kept in a 100% humid-
ity box for three additional weeks.
Three types of samples are prepared :
• Steol samples with high air content Φ' 83%. Preparation procedure is described in
chapters 4 and 5.
• TTAB samples with high air contentΦ' 83%. Preparation procedure is described in
chapter 5; for the smaller bubble sizes, we use C6F14 during precursor foam prepara-
tion to avoid ripening. Often, the density at the top of the sample and at the bottom
of the sample are different. These samples are cut in two parts and both parts were
weighted to measure their true density. Densities are between 200 and 500 kg/m3,
that is to say that the corrected air fractions range from 76% to 92%.
I

APPENDIX A. COMPRESSIVE RESISTANCE
• TTAB sample with low air content Φ < 40%. Preparation procedure is described in
chapter 3. In particular, precursor foam is incorporated by hand into the cement
paste.
A.1.3 Compression tests
All samples are tested in average 28 days after production (between 25 and 35 days). Sam-
ples are cut so that final height is between 25 and 35 mm.
Different presses are used for the different types of samples according to the needed
crushing force required :
• Steol samples are tested with a press with maximal force 500 N at speed 0.1 mm/s.
Before the test, sample ends are plastered to create flat parallel surfaces as shown in
Fig. A.1.
• TTAB samples at high air content are tested with a press with maximal force 20 kN
at speed 0.1 mm/s. Before the test, sample ends are plastered to create flat parallel
surfaces as shown in Fig. A.1.
• TTAB samples at low air content are tested with a press with maximal force 100 kN at
speed 1 mm/min = 0.016 mm/s. Sample top and bottom faces are filed so that their
are flat and parallel. The surfaces are not plastered, but rubber layers are placed at
the top and bottom of the sample during the compression test.
Figure A.1: Steol cement foam sample (Φ = 83%, R = 380 µm) ready for compression test. All the
Steol and TTAB samples at air fraction above 75% have been plastered in order to make flat parallel
ends.
II

APPENDIX A. COMPRESSIVE RESISTANCE
A.2 Results and discussion
A.2.1 Curve shape
A.2.1.1 Air contentΦ> 75%, Steol and TTAB samples
Examples of stress-strain curves for some samples with high air content are shown in Fig.
A.2. Usually, a first peak occurs, then stress increases again.
Figure A.2: Examples of stress-strain curve obtained during compression tests of TTAB samples
with air content above 74%. Left: σpeak =σmax = 0.40 MPa. Right: σpeak = 0.14 MPa and σmax =0.30 MPa
Two values can be extracted from these curves: the stress at the peak σpeak and the
maximal reached stress σmax . For most of the samples, both values are the same order of
magnitude, and sometimes, the maximal value is reached at the first peak.
With Steol samples, the press force is sometimes not enough to break the samples ;
therefore, the peak value and the maximal value cannot be always measured.
We can compare this shape with a typical curve of brittle foam material [1] shown
in Fig. A.3. In this typical curve, three phases can be seen. First, in the elastic regime,
stress increases linearly up to a σpeak . When σpeak is reached, foam locally breaks. After
this first rupture, during the the "plateau" regime, broken area expands: the more strain
increases, the more Plateau borders are broken. When deformation approaches the air
volume fraction Φ, amount of air voids in the crushed sample is very small and further
increase leads to the compaction of the broken Plateau borders and nodes (densification)
and then to compression of the plain material itself. In this typical curve, the peak value
is the maximal stress before the beginning of densification.
In our case, densification phase is never achieved. Compression of plain cement paste
should occur when deformation is nearly the initial air volume fraction Φ, but maximal
deformation of our samples is 30% whereas air volume fraction of the denser samples is
75%. Therefore, the presence of distinct values for σpeak and σmax would not occur if the
samples were homogeneous. A possible explanation is that σpeak is the resistance of the
weakest areas of the sample and σmax , the resistance of the strongest areas.
III

APPENDIX A. COMPRESSIVE RESISTANCE
Figure A.3: Stress-strain curve during compression test of a brittle foam, deformation rate is 10−3
and air fraction, Φ= 92% [1].
A.2.1.2 Air contentΦ< 40%
Initial stress peak can also been observed when air content is below 40%, but the stress
decrease after the first peak is small. In addition, the peak value is much lower than the
maximum value, often one order of magnitude below.
Figure A.4: Example of stress-strain curve obtained during a compression test, for a TTAB sample
containing 8% of air.
When the maximum value is reached, several cracks have formed in the sample.
A.2.2 Compression resistance
A.2.2.1 Comparison with literature
Comparison of the resistance with data from literature (seen chapter 1) is presented in
Fig. A.5. Note that air fraction is related to the density by the following equation:
ρ= ρpaste (1−φ) (A.1)
Where ρpaste is the density of the paste without the bubbles and is related to the water-
to-cement ratio by the formula:
IV

APPENDIX A. COMPRESSIVE RESISTANCE
ρpaste = W/C+1W/C
ρE+ 1
ρC
(A.2)
Paste density decreases from 1950 kg/m3 when W/C=0.40 to 1835 kg/m3 when W/C=0.50.
Figure A.5: Comparison of the measured strength with the results from the literature. Top: peak
value σpeak . Bottom: maximal value σmax .
We can first note that the measured values are the same order of magnitude as litera-
ture values for low densities (i.e. Φ> 75%). For high density samples, maximal stress fits
with literature values whereas peak stress is lower.
A.2.2.2 Effect of surfactant
As seen in Fig. A.5, compressive strengths for Steol foam samples are bigger than for sam-
ples containing TTAB, the difference is certainly larger than what appears in the graph
because some of the Steol samples have not been broken. This can be explained by a
stronger matrix in the case of Steol samples. Water-to-cement ratios are similar for both
types of samples: between 0.39 and 0.5 with average value 0.43. However, cement C2 used
to prepare Steol foams has smaller grains than C1, used in TTAB sample: Blaine specific
surface area is 3586 cm2/g for C1 and 4330 cm2/g for C2. Therefore, C2 is expected to hy-
drate faster than C1 and to reach a higher degree of hydration of cement at 28 days, which
increases the cement paste strength.
A.2.2.3 Effect of W/C
Decreasing water-to-cement ratio is expected to increase the strength of the interstitial
cement paste, and therefore, increase the strength of the cement foams. The results for
V

APPENDIX A. COMPRESSIVE RESISTANCE
cement W/C are plotted in Fig. A.6 for bubble size from 990 to 1100 µm. No effect of
water-to-cement ratio can be seen on these graphs. No conclusion can however be drawn
because of the large dispersion of the results.
Figure A.6: Peak compressive strength for TTAB foams samples with bubble size 990-1100 µm, for
several water-to-cement ratios.
A.2.2.4 Effect of bubble size
Peak stress results on TTAB foams and bubble suspensions are detailled in Fig. A.7 for
several bubble sizes.
Figure A.7: Dependence of the measured strengthσpeak on the bubble radius for TTAB foams (left)
and bubble suspensions (right).
In the low air fraction regime, no major effect of bubble size can be seen.
On the contrary, for Φ> 75%, strength decreases when bubble radius decreases. This
effect may be due to a poor mixing in the samples containing the smaller bubbles. In-
deed, areas of cement paste without bubbles can be seen. From the tomography images
of a TTAB sample of bubble radius 370 µm and air fraction 83%, we measure the size of
bubble-free areas and their total volume. A few of these areas have volume between 1 and
30 bubble size, and there is a large area of nearly 400 bubble volume. All together, they
compose 12% of the total sample volume. Therefore, effective air content of the foam
around these areas between bubbles is:
Φe f f = 1− (1−Φ)−Φde f aul t s
1−Φde f aul t≈ 94% (A.3)
VI

APPENDIX A. COMPRESSIVE RESISTANCE
This value corresponds to a density ρ ≈ 110 kg/m3. Very few values of mechanical
resistance can be found in the literature at this very low density. We can for instance
mention the work of Tonyan and Gibson [2], who created foams at density 170 kg/m3 and
mechanical resistance 50 Pa. They used polyester fibers to reinforce the cement paste
matrix. In our case, we obtain similar compressive strength for a simple cement paste
matrix, without fiber reinforcement.
The difficulty to obtain a good mixing may be related to the small size of the Plateau
borders when bubble radius is small. The diameter of the bigger spheres that can fit in the
Plateau borders is given by equation 5.13. The values calculated for several bubble radius
and air fractions are summarized in Table A.1. For C1 cement, grains of size above 60µm
compose 5% of the total volume of cement grains (for C2, 5% volume is filled by grains
size above 40µm). That is to say that if Plateau border diameter is below 60µm, 5% of the
grains must remain in the nodes.
Φ=75% Φ=80% Φ=85% Φ=90% Φ=95%
R=200 µm 59 µm 46 µm 36 µm 28 µm 20 µm
R=300 µm 88 µm 70 µm 54 µm 42 µm 29 µm
R=400 µm 118 µm 93 µm 73 µm 56 µm 39 µm
R=500 µm 147 µm 116 µm 91 µm 70 µm 49 µm
R=600 µm 177 µm 139 µm 109 µm 84 µm 59 µm
Table A.1: Plateau border diameter at given bubble size and air volume fraction. Values in red
indicate that at least 5% of the volume of C1 cement grains cannot fit in the Plateau borders.
A.3 Conclusion
Measured strength are the same order of magnitude as the values measured in the litera-
ture.
However, we have measured an unexpected effect of bubble size on TTAB samples at
air fraction above 75%. The poor mixing, that has been observed on some samples with
small bubbles, can account for this effect.
Bibliography
[1] L. Gibson and M. Ashby, eds., Cellular Solids: Structure and Properties. Cambridge:
Cambridge University Press, 1997. III, IV
[2] T. D. Tonyan and L. J. Gibson, “Structure and mechanics of cement foams,” Journal of
Material Science, vol. 27, pp. 6371–6378, 1992. VII
VII