porosity and specific surface of portland cement paste
TRANSCRIPT
LUND UNIVERSITY
PO Box 117221 00 Lund+46 46-222 00 00
Porosity and specific surface of Portland cement paste : an analysis of experimentalwork performed by Åke Grudemo during the years 1973-1979
Fagerlund, Göran
2006
Link to publication
Citation for published version (APA):Fagerlund, G. (2006). Porosity and specific surface of Portland cement paste : an analysis of experimental workperformed by Åke Grudemo during the years 1973-1979. (Report TVBM; Vol. 3133). Division of BuildingMaterials, LTH, Lund University.
Total number of authors:1
General rightsUnless other specific re-use rights are stated the following general rights apply:Copyright and moral rights for the publications made accessible in the public portal are retained by the authorsand/or other copyright owners and it is a condition of accessing publications that users recognise and abide by thelegal requirements associated with these rights. • Users may download and print one copy of any publication from the public portal for the purpose of private studyor research. • You may not further distribute the material or use it for any profit-making activity or commercial gain • You may freely distribute the URL identifying the publication in the public portal
Read more about Creative commons licenses: https://creativecommons.org/licenses/Take down policyIf you believe that this document breaches copyright please contact us providing details, and we will removeaccess to the work immediately and investigate your claim.

i
PREFACE Mr. Åke Grudemo (1919-1994) is a part of the history of the Swedish Cement and Concrete Research Institute in Stockholm, Sweden. The Institute was established in 1942, and Mr. Grudemo was employed at the Institute already in 1944 when he still was a student at the Royal Institute of Technology in Stockholm. In the mid 1940s, the Institute was organized in five departments, and Mr. Grudemo with a M.Sc. in physics belonged to the Physical Department. He was an active researcher during four decades and under four Institute Presidents. He has published more than a dozen research bulletins and reports between the early 1950s and 1986. Mr. Åke Grudemo’s research was devoted to the microstructure of cementitious materials and he was a pioneer in using new technologies like electron microscopy. An example is his Chapter entitled “Electron Microscopy of Portland Cement Pastes” in the textbook “The Chemistry of Cement” (Academic Press, London, 1962, edited by Dr. H. F. W. Taylor). Despite a lot of publications, much research data remain unpublished. The research money might have expired, other research projects may have needed more attention, or the research might have resulted in secondary data that were outside the scope of a certain investigation. However, experimental research is never too old. As a current representative of the Swedish Cement and Concrete Research Institute, I am grateful to Prof. Göran Fagerlund that he has taken his time to re-analyse Mr. Grudemo’s research and made them public by authoring this report. Stockholm, October 16, 2006 Johan Silfwerbrand Professor, President of the Swedish Cement and Concrete Research Institute
ii
FOREWORD AND ACKNOWLEDGEMENT During his whole professional career, from the mid 1940-ies to the mid 1980-ies, Åke Grudemo was researcher at the Swedish Cement and Concrete Research Institute (CBI) in Stockholm. Åke Grudemo had his background in physics. Therefore, he quite early devoted his interest to studies of the micro-structure of cement paste, using sophisticated technique, that had practically not been used previously in cement and concrete research. Grudemo was one of the first the first to apply Transmission Electron Microscopy (TEM) for basic studies of the structure of hardening cement paste. His TEM-studies gave a new picture of the structure of cement gel. In the famous work by T.C. Powers and T.L. Brownyard from 1948 the gel was supposed to be made up of tiny spherical particles. When Åke Grudemo presented his TEM-pictures showing that the gel particles were rather thin, flat fibres or plates, Powers changed his description of the cement gel, and in writing attributed this change in view to Grudemo´s work; Powers (1960). The TEM results were presented in a comprehensive report; Grudemo (1955). Åke Grudemo also developed techniques for quantitative X-ray analysis of hydrated cement paste. Results of his studies are presented in a number of reports like Grudemo (1965, 1975B, 1977, 1986 A). In the 1970-ies Åke Grudemo investigated structure-strength relations in cement paste and cement mortar. From 1975 to 1979 I had the privilege to collaborate with him in some of these studies and therefore obtained good insight in his work. Grudemo designed all experimental techniques and performed all experimental work. This is of high quality, and therefore the experimental results have high credibility. Some of the work -mainly the mechanical tests- was published; Grudemo (1975C, 1975D, 1977, 1979, 1982). Many results dealing with porosity and pore structure remained, however, unpublished. When Åke Grudemo retired from CBI he gave these unpublished data to me, maybe hoping that I might find them useful for some purpose. It is not until now that I have had the opportunity to make an analysis of the data. I am grateful for the confidence Åke Grudemo had in me when he gave me the data. I hope that my analysis of them should have been appreciated by him. In the report, the Grudemo data are reported and used for tests of formulae for total and “coarse” porosity, and for determination of the specific surface of cement paste, and for determination of the structure of the cement gel. Hopefully the analysis gives some information that can be of use in future cement and concrete research. Lund in September 2006 Göran Fagerlund
iii
OUTLINE OF THE REPORT The report is divided in two parts. Each part is based on its own set of experimental data obtained from the Grudemo work.
Part I deals with the porosity of cement paste and with how porosity is influenced by the composition and degree of hydration of the cement paste. Part II deals with the specific surface and internal structure of cement paste and cement gel.
All background data are listed in two Appendices, one for each Part.

iv

v
CONTENTS Page PREFACE i FOREWORD AND ACKNOWLEDGEMENT ii LAYOUT OF THE REPORT iii CONTENTS v LIST OF SYMBOLS vii
PART I: POROSITY 1
SUMMARY OF PART I 3 I:1 MATERIALS AND SPECIMENS 5 I:1.1 Mixing, casting and curing 5 I:1.2 Cement 5 I:1.3 Specimens 6 I:2 MEASUREMENTS 7 I:3 DEGREE OF HYDRATION 8 I:4 WATER-CEMENT RATIO 10 I:5 DEFINITION OF POROSITY 12 I:6 TOTAL POROSITY 13 I:6.1 Total porosity – experimentally 13 I:6.2 Total porosity – theoretically 14 I:6.3 Total porosity – results of measurements 16 I:6.4 Comparison between measured and calculated total porosity 17 I:7 COARSE POROSITY 20 1:7.1 Definition of coarse porosity 20 I:7.2 Coarse porosity – experimentally 20 I:7.3 Coarse porosity – theoretically 21 I:7.3.1 Calculated from the adsorption isotherm 21 I:7.3.2 Calculated from the desorption isotherm 22 I:7.3.3 Capillary porosity 24 I:7.3.3 RH-value corresponding to the capillary porosity 25 I:7.4 Comparison between measured and calculated coarse porosity 27 I:8 SPECIFIC SURFACE 31
PART II: SPECIFIC SURFACE AND GEL STRUCTURE 33
SUMMARY OF PART II 35 II.1 MATERIALS AND SPECIMENS 37 II:1.1 Mixing, casting and curing 37 II:1.2 Cement 37 II:1.3 Specimens 37 II:1.4 Mixes 38 II:2 MEASUREMENTS 39 II:3 DEGREE OF HYDRATION. EVOLUTION OF CALCIUM HYDROXIDE 40 II:3.1 Degree of hydration 40 II:3.2 Calcium hydroxide 43

vi
II.4 SPECIFIC SURFACE – THE BET-THEORY 46 II:5 SPECIFIC SURFACE OF CEMENT PASTE BASED ON ADSORPTION 48 II:6 SPECIFIC SURFACE BASED ON DESORPTION 50 II:6.1 Introduction 50 II:6.2 Specific surface based on the Powers & Brownyard (1948) work 50 II:6.3 Specific surface directly from measurements 52 II:7 SPECIFIC SURFACE OF THE CEMENT GEL 57 II:7.1 Definition of cement gel 57 II:7.2 Specific surface of cement gel based on adsorption 58 II:7.3 Specific surface of cement gel based on desorption 59 II:7.3.1 Specific surface based on the Powers & Brownyard work 59 II:7.3.2 Specific surface of cement gel directly from measurements 59 II:8 STRUCTURE OF THE CEMENT GEL 60 II:8.1 Size of gel particles including calcium hydroxide 60 II:8.2 Size of gel particles not including calcium hydroxide 62 II:8.3 Size of gel pores including calcium hydroxide 63 II:8.4 Size of gel pores not including calcium hydroxide 64
REFERENCES 67
APPENDIX TO PART I 69 AI.1 Tables. Porosity data 71 AI.2 Specific surface of cement paste based on porosity data in Part I 75 AI.3 Specific surface of cement gel based on porosity data in Part I 81
APPENDIX TO PART II 85
Tables. Specific surface data 87

vii
LIST OF SYMBOLS A The adsorption coefficient (-) Am Surface area covered by one adsorbed water molecule (m2) CHC Amount of calcium hydroxide as weight fraction of cement (g/g) CHS Amount of calcium hydroxide as weight fraction of solid (g/g) CHtot Total amount of calcium hydroxide (g) K Coefficient in equation (I:7.21) (-) K Coefficient in equation (II:6.8) (m2/kg) M Molecular weight of water (18 kg/kmole) N Avogadro´s number (6.02·1026 molecules per kmole) Pcap Capillary porosity (-) Pcoarse Coarse porosity (pores empty at 33% RH) (-) Pcoarse,meas Measured coarse porosity (-) Pgel Gel porosity (-) Ptot Total porosity (-) Ptot,calc Calculated total porosity (-) Ptot,meas Measured total porosity (-) P33,ads Coarse porosity at adsorption to 33% RH (-) P33,des Coarse porosity at desorption to 33% RH (-) Qdry,gel Dry weight of the cement gel (g) Qdry,paste Dry weight of the specimen (g) Qsat Weight of water saturated specimen (g) Qsolid Weight of solid part of cement paste (g) Q105 Weight of specimens after drying to +105°C (g) Q1000 Weight of specimen after heating to 1000°C (g) Q33 Weight of specimen in equilibrium with 33% RH (g) R Amount of mineral additive as weight fraction of cement (g/g) S Amount of silica gel as weight fraction of cement (g/g) S Specific surface (m2/kg) Sads Specific surface of the paste calculated from adsorption (m2/kg) or (m2/g) Sads,gel, Specific surface of the gel calculated from adsorption (m2/kg) or (m2/g) Sdes Specific surface of the paste calculated from desorption (m2/kg) or (m2/g) Sdes,gel Specific surface of the gel calculated from desorption (m2/kg) or (m2/g) Sgel Specific surface of the cement gel including Ca(OH)2 (m2/kg) or (m2/g) Sgel,net Specific surface of cement gel excluding Ca(OH)2 (m2/kg) or (m2/g) V Specimen volume (cm3) Vgel Volume of cement gel (cm3) Vpaste Volume of cement paste (cm3) Vp,gel Volume of pores in the cement gel (cm3) Vp,coarse Volume of “coarse” pores (cm3) Vp,tot Total pore volume (cm3) Vp,33,ads Volume of empty pores at adsorption to 33% RH (cm3) Vp,33,des Volume of empty pores at desorption to 33% RH (cm3) Wm Amount of water in one monolayer (kg/kg) WΦ Amount of adsorbed water at equilibrium with Φ (kg/kg) W33 Amount of adsorbed water at 33% RH (kg/kg) W33,ads Amount of water at equilibrium with 33% RH at adsorption (kg/kg) W33,des Amount of water at equilibrium with 33% RH at desorption (kg/kg)
viii
W33,des,gel Amount of water in gel at equilibrium with 33% RH (kg/kg) c Cement weight (g) d Width of gel pore (m) k Coefficient in equation (I:6.12) (-) t Thickness of a gel particle (m) vc Specific volume of cement (0.32 cm3/g) vw Specific volume of water (1 cm3/g) vwn Specific volume of chemically bound water (cm3/g) wcuring Amount of water sucked in during water curing (g) wm Amount of adsorbed water in one monolayer (g) wn Chemically bound water (g) wn,max Amount of chemically bound water at complete hydration (g) wsat Evaporable water content at saturation (g) wo Amount of mixing water (g) (w/c)o True water cement ratio (-) (w/c)sat,o Measured water–cement ratio including curing water (-) w33,ads Weight of pore water at adsorption to 33% RH (g) w33,des Weight of pore water at desorption to 33% RH (g) α Degree of hydration (-) Φ Relative humidity (-) Φm Relative humidity corresponding to one monolayer (-) ρCSH Density of cement gel particles excluding Ca(OH)2 (kg/m3) ρgel Density of cement gel particles including Ca(OH)2 (kg/m3) ρgel´ Density of cement gel particles including Ca(OH)2 (g/cm3) ρpaste´ Density of cement paste including gel pores (g/cm3) ρw Density of water (1 g/cm3)
1
PART I
POROSITY

2

3
SUMMARY OF PART I The primary aim of Part I is to use data from the Grudemo investigations to find a general equation for the total porosity of Portland cement paste that can be used for any water-cement ratio and any degree of hydration. The analysis is based on 19 different air-free cement pastes. All mixes were made with one single low alkali and sulphate resistant Portland cement. The water-cement ratio was varied between 0.18 and 1.00. Measurements of porosity were made after hydration times varying from18 hours to 30 days. The degree of hydration was based on the weight after drying at +105 ºC and the weight after ignition at 1000 ºC. Equation (I:3.5) was used for the calculation. The true water cement ratio compensated for bleeding and separation was calculated from the water-saturated weight corrected for water sucked in during hydration. Equation (I:4.6) was used for the calculation. Total porosity The total porosity was calculated from the water-stored weight, the weight after drying at +105 ºC and the weight after ignition at 1000 ºC. Equation (I:6.5) was used for the calculation. The measured total porosity was compared with the theoretical total porosity based on an assumed “volume contraction” of hydrate water, and an assumed amount of water that is bound at complete hydration.
( )( ) 0.32w/c
αkw/cP0
0tot
+⋅−= (I:6.12)
where (w/c)0 is the water cement ratio, α is the degree of hydration and k is a coefficient mainly determined by the “chemical contraction”, i.e. the reduction in specific volume when free water is bound chemically in the cement gel.
For k=0.18 à 0.19 the agreement between measured and theoretical total porosity is almost perfect over the entire water-cement ratio range 0.18-1.00, and degree of hydration range 12%-80%; see Equations (I:6.13) and (I:6.14), and Figures I:6.1 to I:6.3. This indicates that the chemical contraction is of the order 25% for all w/c-ratios and all degrees of hydration. “Coarse porosity” “Coarse porosity” is defined as the volume of pores filled by water at desorption to 33% relative humidity (RH); the “33%-porosity”. It was determined from the weight of specimens stored to equilibrium with air in vessels containing a saturated MgCl2-solution. Equation (I:7.3) was used for the calculation. The measured coarse porosity was compared with “33%-porosities” calculated from “classic” desorption and adsorption isotherms determined by Powers and Brownyard (1948).
4
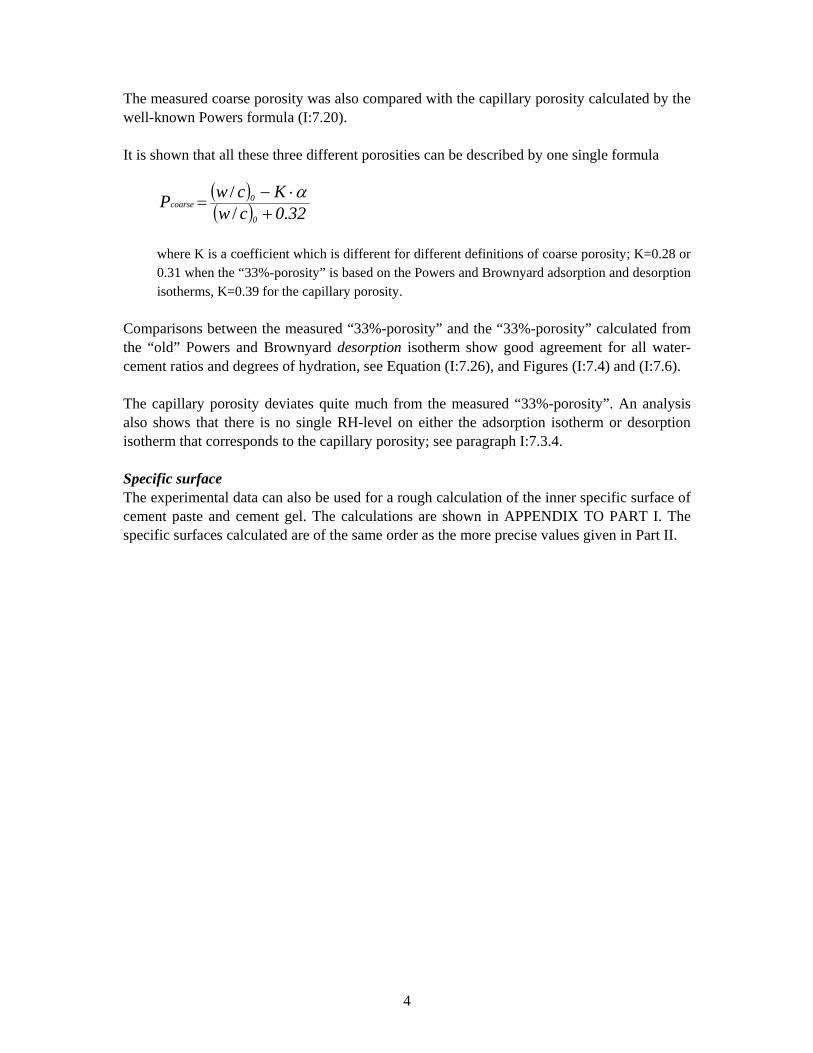
The measured coarse porosity was also compared with the capillary porosity calculated by the well-known Powers formula (I:7.20). It is shown that all these three different porosities can be described by one single formula
( )( ) 0.32cw
KcwP0
0coarse
+⋅−=
// α
where K is a coefficient which is different for different definitions of coarse porosity; K=0.28 or 0.31 when the “33%-porosity” is based on the Powers and Brownyard adsorption and desorption isotherms, K=0.39 for the capillary porosity.
Comparisons between the measured “33%-porosity” and the “33%-porosity” calculated from the “old” Powers and Brownyard desorption isotherm show good agreement for all water-cement ratios and degrees of hydration, see Equation (I:7.26), and Figures (I:7.4) and (I:7.6). The capillary porosity deviates quite much from the measured “33%-porosity”. An analysis also shows that there is no single RH-level on either the adsorption isotherm or desorption isotherm that corresponds to the capillary porosity; see paragraph I:7.3.4. Specific surface The experimental data can also be used for a rough calculation of the inner specific surface of cement paste and cement gel. The calculations are shown in APPENDIX TO PART I. The specific surfaces calculated are of the same order as the more precise values given in Part II.
5
I:1 MATERIALS AND SPECIMENS I:1.1 Mixing, casting and curing A: Cast cement paste Cement pastes were mixed for long time (2 hours) in a food mixer. Cement paste cylinders were cast in 75 mm long, 14 mm wide teflon moulds. Each mould was vibrated internally by a thin vibrating “needle”. After de-moulding, the specimens were stored in saturated lime water at room-temperature until the time of testing. The storage containers were sealed so as to avoid carbonation. Mixing and casting was made in such way that practically no air-voids were entrapped. This was confirmed microscopically and by measurement of density. Thus, since the specimens were stored in water until testing, they only contained 2 phases:
1. Cement (unreacted+reacted) 2. Water (free+chemically bound)
In total 18 different mixes were produced with water-cement ratio varying from 0.25 to 1.00. Thus, a very large span in porosity was obtained B: Compact One single series was made as a “compact” where dry cement powder was dry-pressed in a mould to cylinders with diameter 12 mm and length 8 mm. After pressing the samples were placed on a moist filter-paper from which they absorbed water until they became saturated. The water absorbed corresponds to a water-cement ratio of 0.18. I:1.2 Cement The cement was of type low alkali, sulphate resistant Portland with the following composition in weight-percent. C3S 60 C2S 18 C3A 5 C4AF 9 Na2O 0.2 K2O 0.1 SO3 2.4 Lime-stone filler 0 In some pastes with very high water-cement ratio, a small amount of amorphous colloidal silica gel (“aerosil”) was used for avoidance of water separation. In order to investigate the effect of the cement fineness a certain portion of the cement was divided by sieving into a fine fraction (grains <37µm) and a coarse fraction (grains >37µm). According to Grudemo (1975D) the mineral composition determined by X-ray diffraction is about the same in both fractions.
6
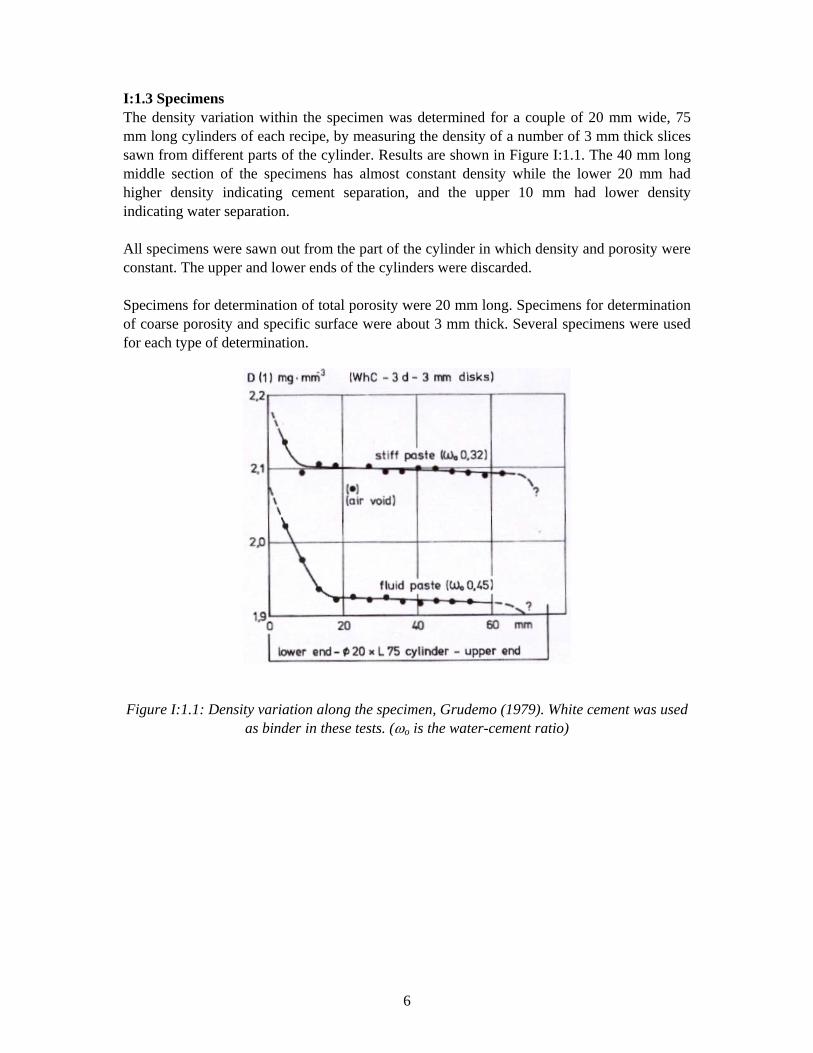
I:1.3 Specimens The density variation within the specimen was determined for a couple of 20 mm wide, 75 mm long cylinders of each recipe, by measuring the density of a number of 3 mm thick slices sawn from different parts of the cylinder. Results are shown in Figure I:1.1. The 40 mm long middle section of the specimens has almost constant density while the lower 20 mm had higher density indicating cement separation, and the upper 10 mm had lower density indicating water separation. All specimens were sawn out from the part of the cylinder in which density and porosity were constant. The upper and lower ends of the cylinders were discarded. Specimens for determination of total porosity were 20 mm long. Specimens for determination of coarse porosity and specific surface were about 3 mm thick. Several specimens were used for each type of determination.
Figure I:1.1: Density variation along the specimen, Grudemo (1979). White cement was used as binder in these tests. (ωo is the water-cement ratio)
7
I:2 MEASUREMENTS After water storage for pre-determined time, varying from less than 1 day to about 30 days, the following measurements were made: Determination of total porosity
1. The saturated specimen was weighed (Qsat). 2. The specimen was crushed and ground in ethyl-alcohol in order to stop further
hydration. 3. The cement paste powder was dried at +105ºC at very precise relative humidity (x%)
by a method developed by Danielsson (197x). The dry weight was determined (Q105). 4. The dry powder was ignited at +1000ºC and weighed (Q1000).
Determination of coarse porosity and specific surface
1. The saturated specimen was weighed (Qsat). 2. The thin specimen was placed in an evacuated vessel connected to another vessel
containing a saturated solution of MgCl2. Drying was performed until equilibrium with the salt solution (33% RH). The weight was determined (Q33). By evacuation carbonation was avoided.
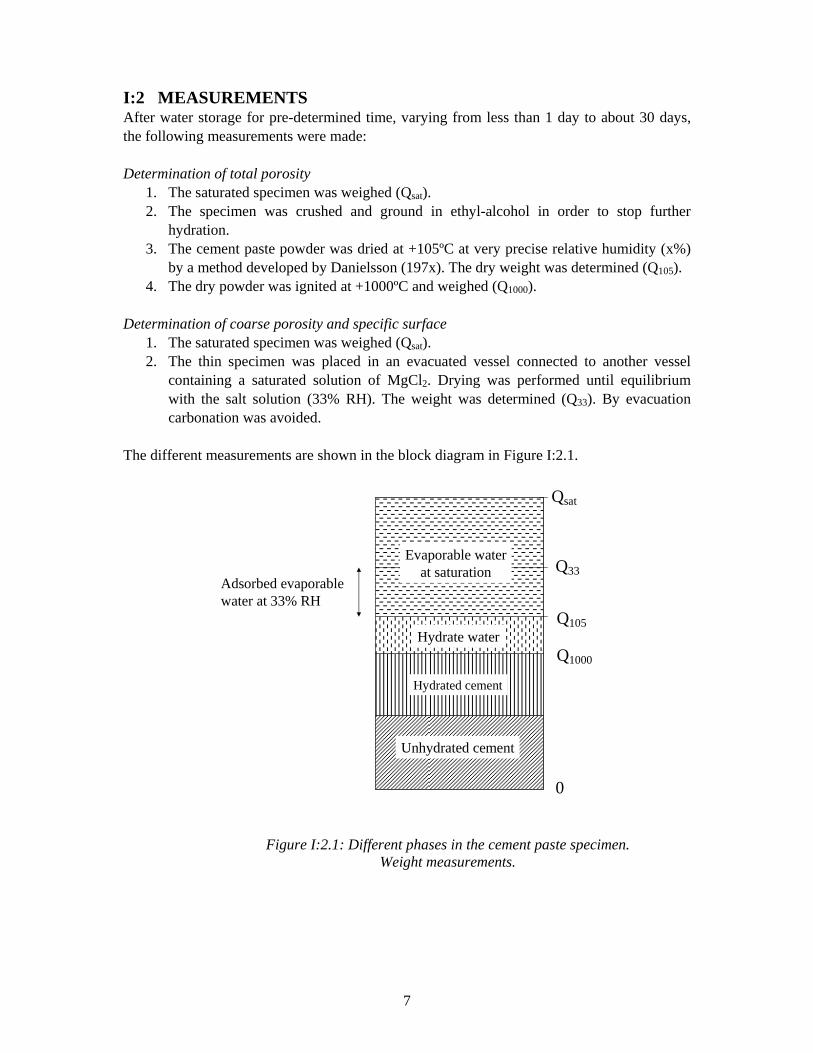
The different measurements are shown in the block diagram in Figure I:2.1.
Qsat
Q105
Q1000
0
Q33
Hydrate water
Evaporable waterat saturation
Hydrated cement
Unhydrated cement
Adsorbed evaporablewater at 33% RH
Figure I:2.1: Different phases in the cement paste specimen.
Weight measurements.

8
I:3 DEGREE OF HYDRATION The weight of chemically bound water in the specimen (wn) is calculated by wn= Q105-Q1000 (g) (I:3.1) The cement content is (assuming no carbonation) c=Q1000 (g) (I:3.2) The amount of chemically bound water at complete hydration is supposed to be wn,max/c ≈ 0.25 (I:3.3) The value is somewhat different for different chemical compositions of the portland cement, Powers & Brownyard (1948).
At reaction of the pure clinker components the following amount of water in kg per kg component is bound: C3S: 0.24 kg/kg, C2S: 0.21 kg/kg, C3A: 0.40 kg/kg, C4AF: 0.37 kg/kg. For the actual cement composition these values give the water binding 0.235 kg/kg cement. In real cements other reactions also takes place, like reactions of gypsum with C3A and C4AF. The value 0.25, which is selected in equation (I:3.3), might therefore be afflicted with a certain error.
The degree of hydration is defined
)/(25.0
)/( cw4cwn
n ⋅==α 0≤α≤1 (I:3.4)
Thus, the degree of hydration of the specimen is calculated by
1000
1000105
QQQ4 −⋅=α (I:3.5)
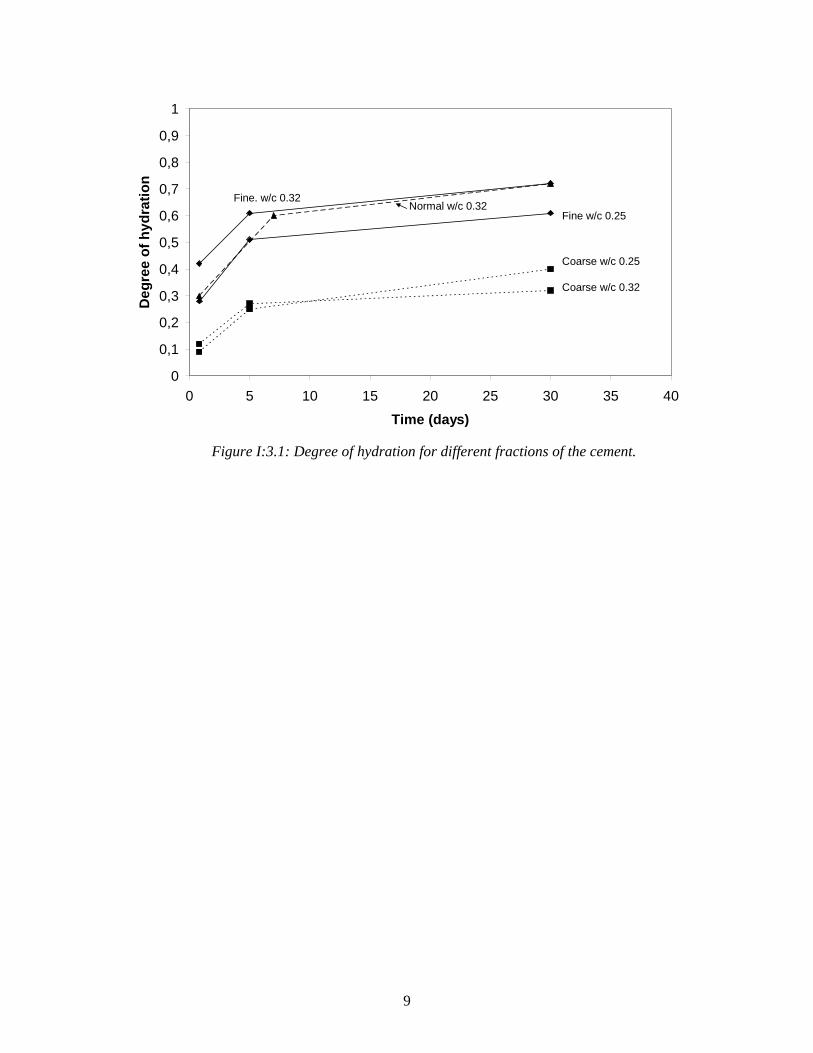
All results are given in Tables IA.1-IA.5 in the APPENDIX TO PART I. The development of degree of hydration is much slower for the coarse fraction than for the ordinary cement and for the fine fraction, as shown in Figure I:3.1.
9
0
0,1
0,2
0,3
0,4
0,5
0,6
0,7
0,8
0,9
1
0 5 10 15 20 25 30 35 40
Time (days)
Deg
ree
of h
ydra
tion
Fine. w/c 0.32Fine w/c 0.25
Coarse w/c 0.32
Coarse w/c 0.25
Normal w/c 0.32
Figure I:3.1: Degree of hydration for different fractions of the cement.

10
I:4 WATER-CEMENT RATIO In most cases the water-cement ratio can be obtained from the recipe. There might be some separation, however, making the real water-cement ratio a bit different, normally it is lower. The true water-cement ratio can be calculated from the measured total water content of the saturated specimen (free+chemically bound) reduced by the curing water sucked in during water storage, the suction being caused by the “volume contraction” when water is chemically bound. Thus, the amount of mixing water (wo) can be calculated by wo=(Qsat-Q1000)-wcuring (g) (I:4.1) The volume of the curing water corresponds to about 25% of the amount of chemically bound water wn, Powers (1960). Using the specific volume of water 1 cm3/g gives wcuring=0.25·wn =0.25·(Q105-Q1000) (g) (I:4.2) Then, the amount of mixing water becomes wo=(Qsat-Q1000)-0.25·(Q105-Q1000) (g) (I:4.3) The water-cement ratio becomes (w/c)o=[(Qsat-Q1000)- 0.25·(Q105-Q1000)]/Q1000 (I:4.4) The measured “water-cement ratio” of the saturated specimen before the correction for curing water is (w/c)sat,o=(Qsat-Q1000)/Q1000 (I:4.5) The relation between the true water-cement ratio (w/c)o and the measured (w/c)sat,o is obtained by combining equations (I:4.4) and (I:4.5) and introducing equations (I:3.4) and (I:4.2) α⋅⋅−=−= 0.250.25cwcw0.25cwcw osatnosato ,, )/()/()/()/( (I:4.6) α⋅−= 0.0625cwcw osato ,)/()/( (I:4.6´)
Example I:4.1 The following weights were obtained for a certain cement paste: Qsat=203 g Q105=139 g Q1000=121 g The water-cement ratio becomes; equation (I:4.4) (w/c)o=[(203-121)- 0.25·(139-121)]/121=0.641
11
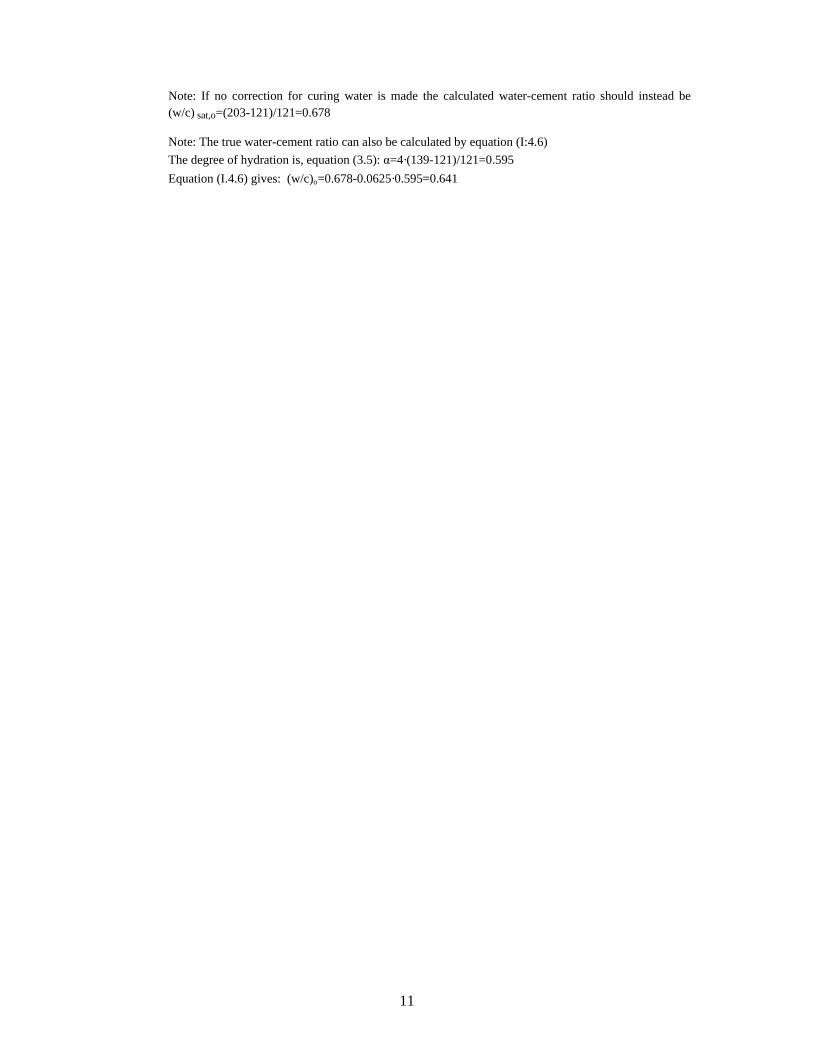
Note: If no correction for curing water is made the calculated water-cement ratio should instead be (w/c) sat,o=(203-121)/121=0.678 Note: The true water-cement ratio can also be calculated by equation (I:4.6) The degree of hydration is, equation (3.5): α=4·(139-121)/121=0.595 Equation (I.4.6) gives: (w/c)o=0.678-0.0625·0.595=0.641

12
I:5 DEFINITION OF POROSITY Total porosity is based on the dry weight after drying to equilibrium at +105ºC in an oven with fixed vapour pressure corresponding to x% relative humidity. The method was developed by Danielsson (1974). The dry weight obtained in this way is about the same as after so-called D-drying; defined in Powers (1960). Total porosity, Ptot, is the difference in water volume between full saturation and the dry state. 33% porosity (“capillary porosity”) is based on the weight after drying to equilibrium in 33% relative humidity. Drying is made in a vessel containing a saturated CaCl2-solution and CO2-free air. 33% porosity is the difference in water volume between full saturation and the water volume at equilibrium with 33% RH. The 33% porosity is not exactly the same as capillary porosity, see below. In calculating these water volumes the weight of water is used, whereby the density of all pore water is assumed to be 1g/cm3.

13
I:6 TOTAL POROSITY I:6.1 Total porosity-experimentally The water content (wsat) at full saturation is wsat=Qsat-Q105 (g) (I:6.1) The volume of water at saturation is equal to the total pore volume (Vp,tot), i.e. Vp,tot=vw·wsat = 1·wsat (cm3) (I:6.2) Where vw is the specific volume of water (1 cm3/g). The specimen volume (V) is (assuming no air-pores) V=vw·wo+vc·c = 1·wo+0.32·c (cm3) (I:6.3) Where wo is the amount of mixing water (g), vc is the specific volume of cement (≈0.32 cm3/g), and c is the cement weight (g). The total porosity (Ptot) is Ptot=Vp,tot/V=(Qsat-Q105 )/(wo+0.32·c) = (Qsat-Q105 )/{c·[(w/c)o+0.32)]} (I:6.4) (w/c)o, the water-cement ratio, is given by equation (I:4.4). c is given by equation (I:3.2). Inserting these equations gives
100010001051000
105
)()( Q0.32QQ0.25QQQQP
sat
sattot
⋅+−−−−= (I:6.5)
Example I:6.1 The same cement paste as Example I:4.1. Ptot=(203-139)/[(203-121)- 0.25·(139-121)+0.32·121)]=0.551 (55.1%) Note: if no correction for curing water was made the calculated porosity would be Ptot=(203-139)/[(203-121)+0.32·121)]=0.530 (53%) The reason why the last porosity is erroneously low is that the specimen volume is assumed to be too high since all water in the specimen is supposed to come from the mixing water. In reality some of the water (curing water) is sucked into the specimen and does not contribute to the specimen volume.
14
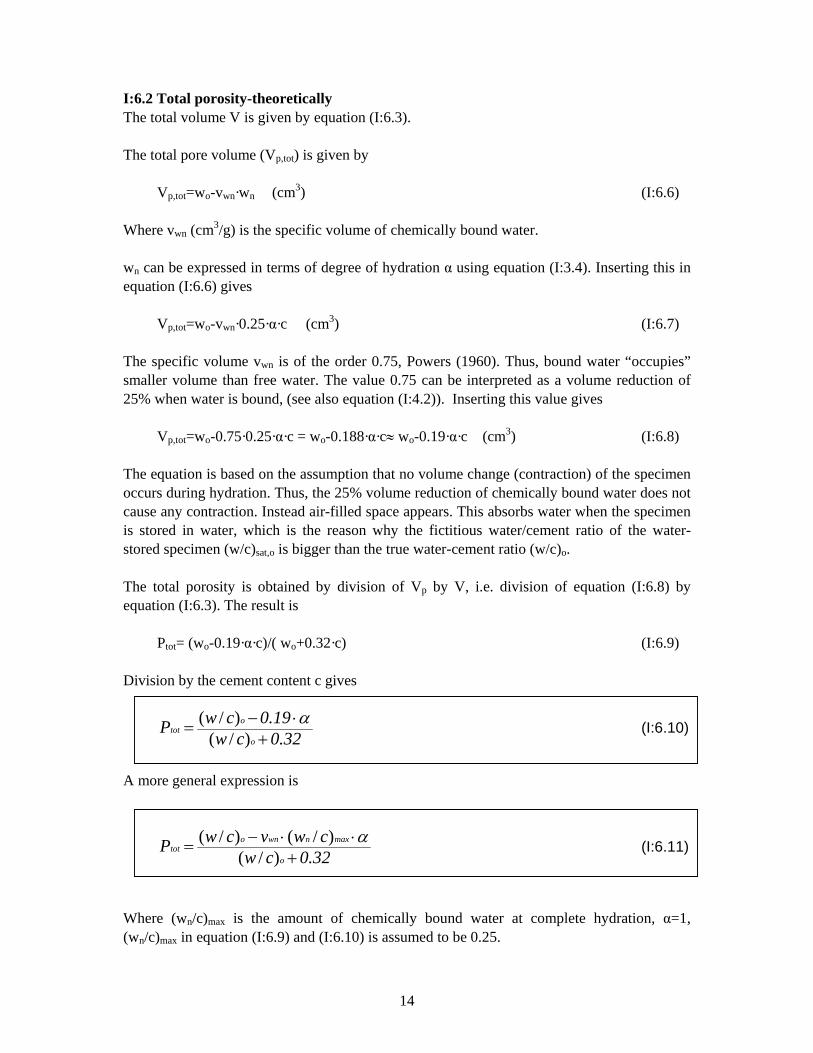
I:6.2 Total porosity-theoretically The total volume V is given by equation (I:6.3). The total pore volume (Vp,tot) is given by
Vp,tot=wo-vwn·wn (cm3) (I:6.6) Where vwn (cm3/g) is the specific volume of chemically bound water. wn can be expressed in terms of degree of hydration α using equation (I:3.4). Inserting this in equation (I:6.6) gives Vp,tot=wo-vwn·0.25·α·c (cm3) (I:6.7) The specific volume vwn is of the order 0.75, Powers (1960). Thus, bound water “occupies” smaller volume than free water. The value 0.75 can be interpreted as a volume reduction of 25% when water is bound, (see also equation (I:4.2)). Inserting this value gives Vp,tot=wo-0.75·0.25·α·c = wo-0.188·α·c≈ wo-0.19·α·c (cm3) (I:6.8) The equation is based on the assumption that no volume change (contraction) of the specimen occurs during hydration. Thus, the 25% volume reduction of chemically bound water does not cause any contraction. Instead air-filled space appears. This absorbs water when the specimen is stored in water, which is the reason why the fictitious water/cement ratio of the water-stored specimen (w/c)sat,o is bigger than the true water-cement ratio (w/c)o. The total porosity is obtained by division of Vp by V, i.e. division of equation (I:6.8) by equation (I:6.3). The result is Ptot= (wo-0.19·α·c)/( wo+0.32·c) (I:6.9) Division by the cement content c gives
0.32cw
0.19cwPo
otot
+⋅−=
)/()/( α (I:6.10)
A more general expression is
0.32cw
cwvcwPo
maxnwnotot
+⋅⋅−=
)/()/()/( α (I:6.11)
Where (wn/c)max is the amount of chemically bound water at complete hydration, α=1, (wn/c)max in equation (I:6.9) and (I:6.10) is assumed to be 0.25.

15
Equation (I:6.11) can also be written
0.32cwkcwP
o
otot
+⋅−=
)/()/( α (I:6.12)
Where k is a coefficient including both “chemical contraction” of water (vwn) and chemically bound water at complete saturation ((wn/c)max).
Example I:6.1 A cement paste with water-cement ratio 0.82 and 86% degree of hydration. Equation (I:6.10) gives Ptot=(0.82-0.19·0.86)/(0.82+0.32)=0.576 (57.6%)
Example I:6.2
The same cement paste as example I:6.1, but the parameter (wn/c)max= 0.20 and the parameter vwn=0.70.
Equation (I:6.11) gives
Ptot=(0.82-0.70·0.20·0.86)/(0.82+0.32)=0.614 (61,4%)
16
I:6.3 Total porosity - results of measurements The results of all measurements of the degree of hydration and the saturated water content (w/c)sat,o are shown in Tables IA.1-IA.5 in the APPENDIX TO PART I. Also the true water-cement ratio (w/c)o calculated by equation (I:4.6) is shown in the tables. The following comments can be made: 1. For cement pastes without aerosil and with high water-cement ratio the difference
between the real water-cement ratio (w/c)o of the hardened paste and the water-cement ratio at mixing wo/c is considerable which depends on separation.
2. With a small amount of aerosil almost no separation occurred even at water-cement
ratio 1.
3. The spread in calculated true water-cement ratio (w/c)o between specimens of different age is very small for all initial water-cement ratios, indicating low variation within specimens from the same mix. The almost constant values of (w/c)o for different concrete age also strengthens the validity of equation (I:4.6).
Note, the value of the fictitious water-cement ratio (w/c)sat,o increases with increased degree of hydration, which is a consequence of time dependent water absorption in “contraction pores” formed by chemical shrinkage.
17
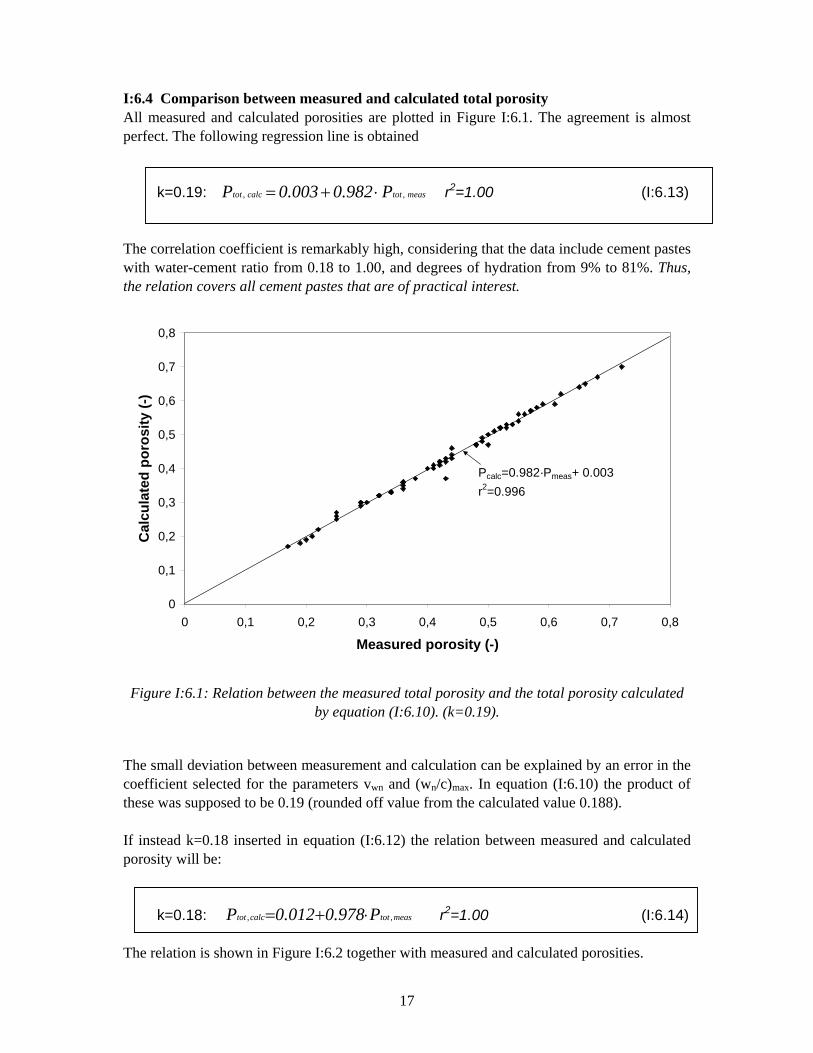
I:6.4 Comparison between measured and calculated total porosity All measured and calculated porosities are plotted in Figure I:6.1. The agreement is almost perfect. The following regression line is obtained k=0.19: meastotcalctot P0.9820.003P ,, ⋅+= r2=1.00 (I:6.13) The correlation coefficient is remarkably high, considering that the data include cement pastes with water-cement ratio from 0.18 to 1.00, and degrees of hydration from 9% to 81%. Thus, the relation covers all cement pastes that are of practical interest.
0
0,1
0,2
0,3
0,4
0,5
0,6
0,7
0,8
0 0,1 0,2 0,3 0,4 0,5 0,6 0,7 0,8
Measured porosity (-)
Cal
cula
ted
poro
sity
(-)
Pcalc=0.982·Pmeas+ 0.003r2=0.996
Figure I:6.1: Relation between the measured total porosity and the total porosity calculated
by equation (I:6.10). (k=0.19). The small deviation between measurement and calculation can be explained by an error in the coefficient selected for the parameters vwn and (wn/c)max. In equation (I:6.10) the product of these was supposed to be 0.19 (rounded off value from the calculated value 0.188). If instead k=0.18 inserted in equation (I:6.12) the relation between measured and calculated porosity will be: k=0.18: meastotcalctot P0.9780.012P ,, ⋅+= r2=1.00 (I:6.14) The relation is shown in Figure I:6.2 together with measured and calculated porosities.

18
The two relations (I:6.13) and (I:6.14) are very similar. The correlation coefficient is the same for both relations and very high. Therefore, the analysis shows that anyone of the following relations can be used for calculation of total porosity
0.32cw
0.19cwPo
otot
+⋅−=
)/()/( α (I:6.10)
0.32cw
0.1cwPo
otot
+⋅−=
)/(8)/( α (I:6.15)
0
0,1
0,2
0,3
0,4
0,5
0,6
0,7
0,8
0 0,1 0,2 0,3 0,4 0,5 0,6 0,7 0,8
Measured porosity (-)
Cal
cula
ted
poro
sity
(-)
Pcalc=0.978·Pmeas+0.012r2=0.996
Pcalc=Pmeas
Figure I:6.2: Relation between the measured total porosity and the total porosity calculated
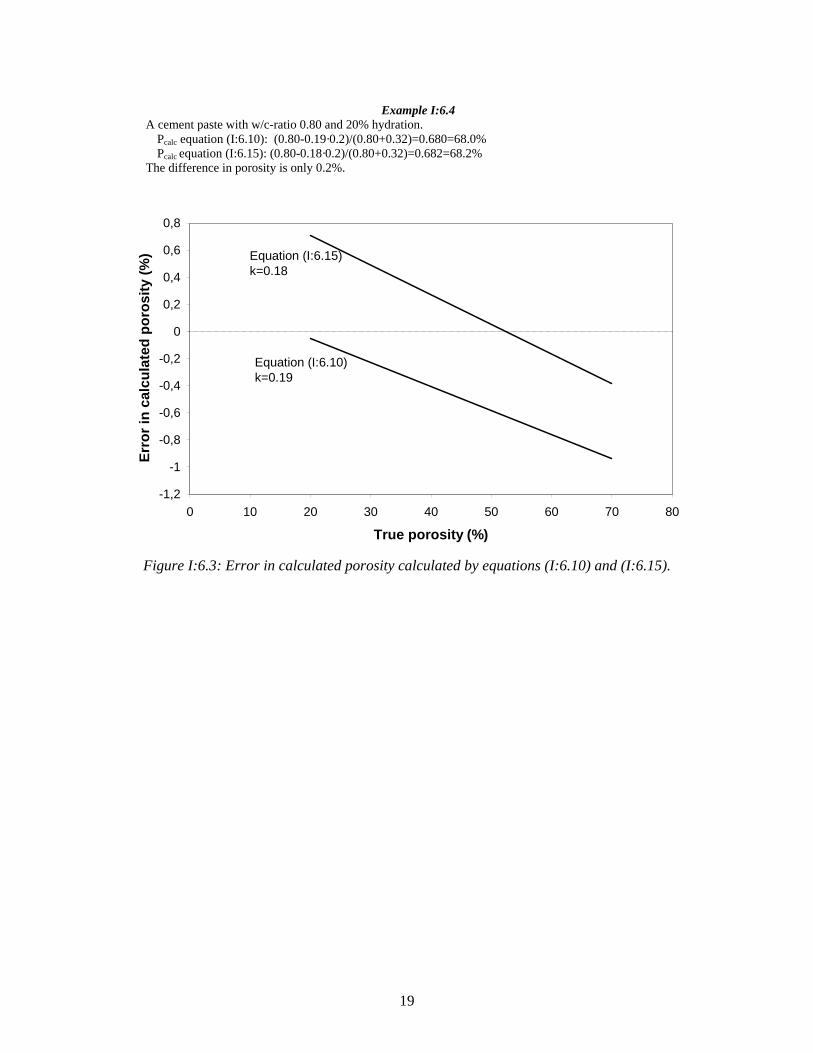
by equation (I:6.15). (k=0.18). The error in calculated porosity is quite low for both expressions as shown in Figure I:6.3. Equation (I:6.10) gives almost perfect agreement at low porosities, but it will always somewhat underestimate the porosity. For high porosities, frequently occurring in practice (60%), it underestimates the porosity by about 0.6%. Equation (I:6.15) on the other hand gives perfect agreement at about 50% porosity. For lower porosities it overestimates the porosity by maximum 0.7%, and for higher porosities it underestimates the porosity by maximum 0.3%.
Example I:6.3 A cement paste with w/c-ratio 0.35 and 50% hydration. Pcalc equation (I:6.10): (0.35-0.19·0.5)/(0.35+0.32)=0.381=38.1% Pcalc equation (I:6.15): (0.35-0.18·0.5)/(0.35+0.32)=0.388=38.8% The difference in porosity is 0.7%
19
Example I:6.4
A cement paste with w/c-ratio 0.80 and 20% hydration. Pcalc equation (I:6.10): (0.80-0.19·0.2)/(0.80+0.32)=0.680=68.0% Pcalc equation (I:6.15): (0.80-0.18·0.2)/(0.80+0.32)=0.682=68.2% The difference in porosity is only 0.2%.
-1,2
-1
-0,8
-0,6
-0,4
-0,2
0
0,2
0,4
0,6
0,8
0 10 20 30 40 50 60 70 80
True porosity (%)
Erro
r in
calc
ulat
ed p
oros
ity (%
) Equation (I:6.15)k=0.18
Equation (I:6.10)k=0.19
Figure I:6.3: Error in calculated porosity calculated by equations (I:6.10) and (I:6.15).
20
I:7 COARSE POROSITY I:7.1 Definition of coarse porosity By “coarse porosity” is, in this report, meant pore volume that is not water-filled when the material is at equilibrium with 33% relative humidity (RH). According to the Kelvin law for capillary condensation (probably not valid for a relative humidity as low as 33%, however) water-filled pores at 33% RH are pores containing a water meniscus with radius of about 10Å (corresponding to the thickness of about 3 water molecules stacked on top of each other). The pore size is somewhat bigger since also an adsorbed layer is present. The thickness of this corresponds to about 1 to 1.5 molecules adsorbed water, i.e. about 2.9 to 4.4 Å. Thus, pores that are water-filled above 33% RH have radii above about 13 Å to 14Å (1.3 to 1.4 nm). The coarse porosity defined in this way is not the same as, but similar to, the “capillary porosity” as defined by Powers (1960). Therefore, it is interesting to compare the experimentally observed coarse porosity with the calculated capillary porosity. The method is described below in paragraph I:7.3.3. The coarse porosity can also be calculated from the sorption isotherm at 33% RH. The method is described below in paragraph I:7.3.1 and I:7.3.2. I:7.2 Coarse porosity – experimentally The coarse pore volume is calculated by Vp,coarse=vw(wsat-w33) (cm3) (I:7.1) where wsat (g) is the water weight at complete saturation and w33 (g) is the water weight at equilibrium with 33% RH. vw is the specific volume of water (1 cm3/g). Using the observed weights give Vp,coarse =Qsat-Q33 (cm3) (I:7.2) The total volume is given by equation (I:6.3). Hence, the coarse porosity becomes
0.32cw
QQPo
satcoarse
+−=
)/(33 (I:7.3)
Inserting equation (I.4.3) for wo and equation (I.3.2) for c gives:
100010001051000sat
33satcoarse
Q0.32)Q0.25(Q)Q(QQQP
⋅+−−−−= (I:7.3´)
21
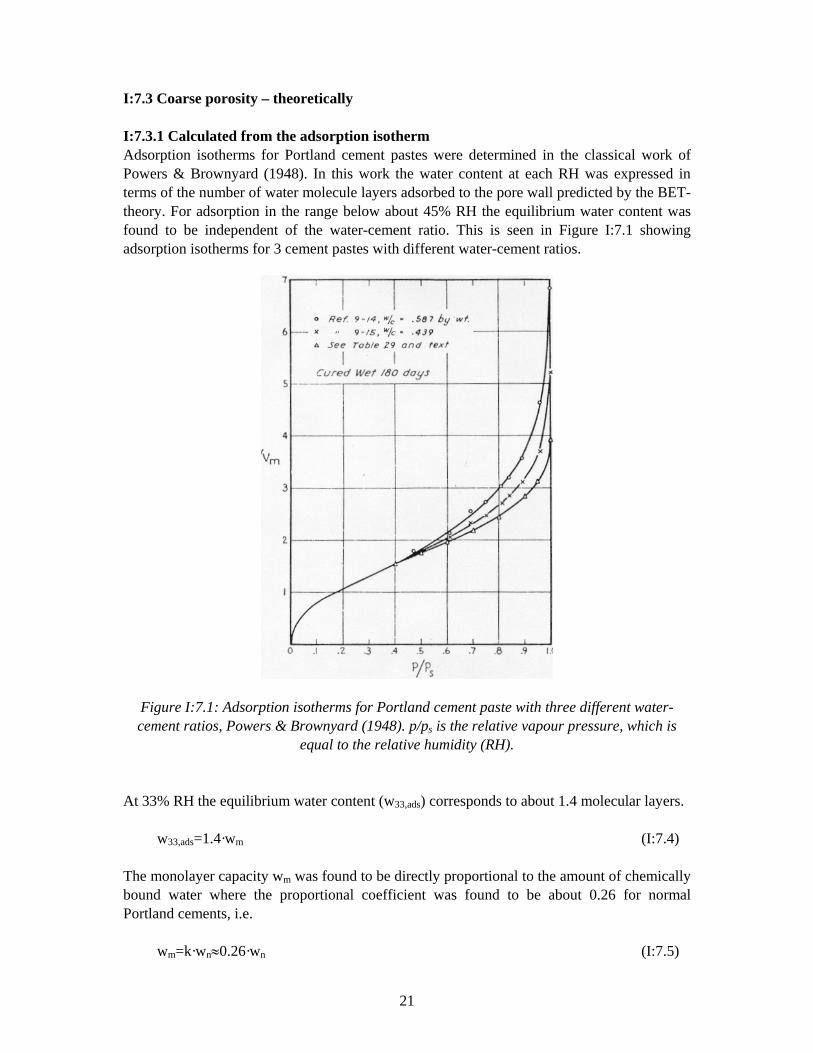
I:7.3 Coarse porosity – theoretically I:7.3.1 Calculated from the adsorption isotherm Adsorption isotherms for Portland cement pastes were determined in the classical work of Powers & Brownyard (1948). In this work the water content at each RH was expressed in terms of the number of water molecule layers adsorbed to the pore wall predicted by the BET-theory. For adsorption in the range below about 45% RH the equilibrium water content was found to be independent of the water-cement ratio. This is seen in Figure I:7.1 showing adsorption isotherms for 3 cement pastes with different water-cement ratios.
Figure I:7.1: Adsorption isotherms for Portland cement paste with three different water-cement ratios, Powers & Brownyard (1948). p/ps is the relative vapour pressure, which is
equal to the relative humidity (RH).
At 33% RH the equilibrium water content (w33,ads) corresponds to about 1.4 molecular layers. w33,ads=1.4·wm (I:7.4) The monolayer capacity wm was found to be directly proportional to the amount of chemically bound water where the proportional coefficient was found to be about 0.26 for normal Portland cements, i.e. wm=k·wn≈0.26·wn (I:7.5)

22
Inserting equation (I:7.4) gives wm=0.26·0.25·α·c=0.065·α·c (g) (I:7.6) The adsorbed water at 33% RH becomes c0.091c0.0651.4w1.4w mads ⋅⋅=⋅⋅⋅=⋅= αα,33 (g) (I:7.7) The volume of the empty coarse porosity at 33% RH is Vp,33,ads=Vp,tot-vw·w33 (cm3) (I:7.8) Where vw is the specific volume of water in the fine water-filled pores. This is assumed to be the same as for bulk water, i.e vw=1 cm3/g. (In reality, the specific volume might be somewhat lower. The value 0.9 cm3/g was suggested by Powers (1960)) Inserting equation (I:6.8) for Vp,tot gives Vp,33,ads=wo-0.19·α·c - 0.091·α·c = wo-0.28·α·c (cm3) (I:7.9) Division with the total volume according to equation (I:6.3) gives the coarse porosity P33
0.32cw
0.28cwV
VPo
oadspads
+⋅−==
)/()/(,33,
,33α (I:7.10)
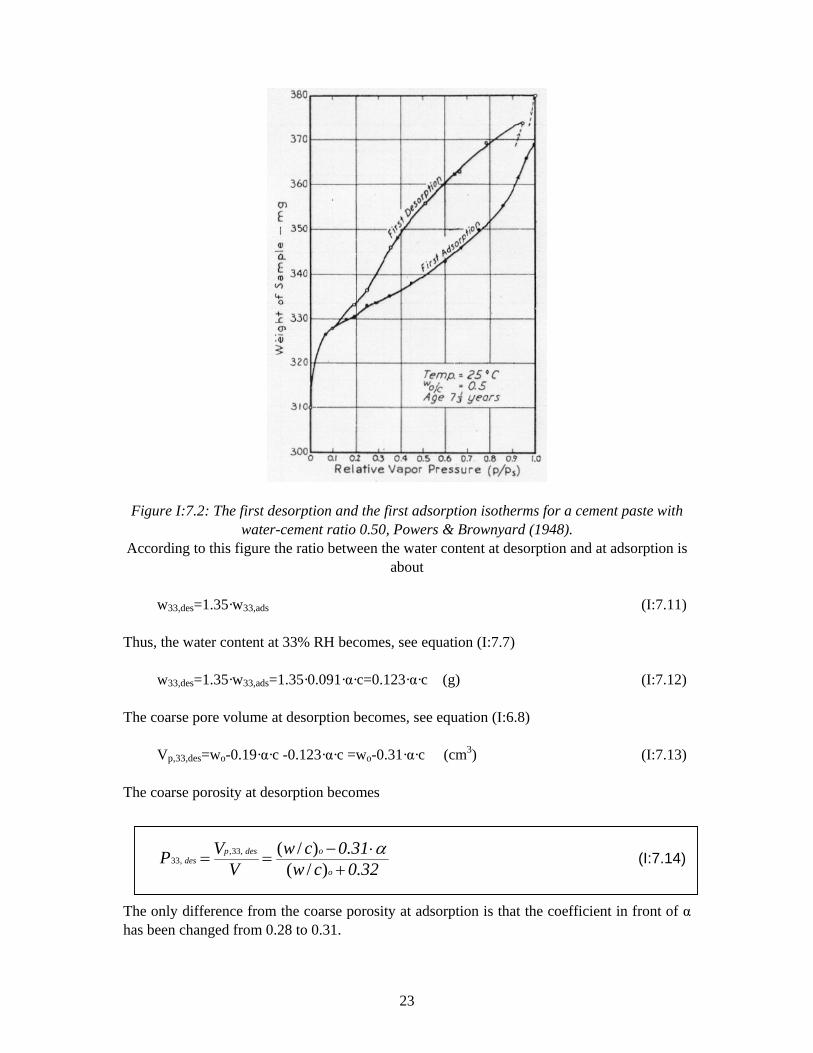
I:7.3.2 Calculated from the desorption isotherm The equilibrium water content at desorption is somewhat higher than at adsorption. One example is shown in Figure I:7.2.
23
Figure I:7.2: The first desorption and the first adsorption isotherms for a cement paste with water-cement ratio 0.50, Powers & Brownyard (1948).
According to this figure the ratio between the water content at desorption and at adsorption is about
w33,des=1.35·w33,ads (I:7.11) Thus, the water content at 33% RH becomes, see equation (I:7.7) w33,des=1.35·w33,ads=1.35·0.091·α·c=0.123·α·c (g) (I:7.12) The coarse pore volume at desorption becomes, see equation (I:6.8) Vp,33,des=wo-0.19·α·c -0.123·α·c =wo-0.31·α·c (cm3) (I:7.13) The coarse porosity at desorption becomes
0.32cw
0.31cwV
VPo
odespdes
+⋅−==
)/()/(,33,
,33α (I:7.14)
The only difference from the coarse porosity at adsorption is that the coefficient in front of α has been changed from 0.28 to 0.31.

24
I:7.3.3 Capillary porosity The reaction products between cement and water -the cement gel- has a porosity of 28%, Powers (1960). Thus, the total gel volume is the sum of volumes of hydrated cement, chemically bound water and “gel pores”, which gives Vgel= vc·α·c + vwn·wn +0.28·Vgel (cm3) (I:7.15) Where vc is the specific volume of cement (≈0.32 cm3/g) and vwn is the specific volume of chemically bound water (≈0.75 cm3/g). Inserting equation (I:3.4) for wn gives Vgel=(0.32·α·c +0.75·0.25·α·c)/0.72 = 0.705·α·c (cm3) (I:7.16) The gel pore volume is 28% of this Vp,gel=0.28·0.705·α·c =0.197·α·c (cm3) (I:7.17) The “gel porosity” is obtained by division with the total volume described by equation (I:6.3) Pgel=0.197·α·c/(wo+0.32) = 0.197·α/[(w/c)o+0.32] (I:7.18) The capillary porosity is the difference between the total porosity given by equation (I:6.10) and the gel porosity given by equation (I:7.18) Pcap=[(w/c)o-0.19·α]/[(w/c)o+0.32] - 0.197·α/[(w/c)o+0.32] (I:7.19)
0.32cw
0.39cwPo
ocap
+⋅−=
)/()/( α (I:7.20)
The coefficient 0.39 is afflicted by some uncertainties. It is a function of three material parameters, vwn, (wn/c)max and porosity of the cement gel. Values used in equation (I:6.10) for these parameters are vwn=0.75, (wn/c)max=0.25 and Pgel=28%. A more general expression for the capillary porosity is
0.32cwKcwP
o
ocap
+⋅−=
)/()/( α (I:7.21)
Where K is a coefficient of the order 0.36-0.42.
25
I:7.3.4 RH-value corresponding to the capillary porosity The relation between the coarse porosity calculated from the sorption isotherms and the capillary porosity is found by comparing the theoretical equations (I:7.10) or (I:7.14) with equation (I:7.20). It is directly seen by the equations that the capillary porosity is lower than the other two porosities. The only difference between the three equations is the coefficient in front of the degree of hydration. It is 0.39 for capillary porosity but only 0.28 and 0.31 for the other two porosities.
Example I:7.1 1: Low “coarse” porosity: (w/c)o=0.40. α=0.7: Equation (I:7.10) gives: P33,ads=0.283 Equation (I:7.14) gives: P33,des=0.254 Equation (I:7.20) gives: Pcap=0.176 Thus Pcap/P33,ads=0.176/0.283=0.62 Pcap/P33,des=0.176/0.254=0.69
2: High ”coarse” porosity: (w/c)o=0.80. α=0.4: Equation (I:7.10) gives: P33,ads=0.614 Equation (I:7.14) gives: P33,des=0.604 Equation (I:7.20) gives: Pcap=0.575 Thus Pcap/P33,ads=0.575/0.614=0.94 Pcap/P33,des=0.575/0.604=0.95
RH-value on the adsorption isotherm corresponding to the capillary porosity According to the Powers & Brownyard adsorption isotherm -Figure I:7.1- the capillary porosity should correspond to about 3.1 molecular layers of adsorbed water, which is proven by the following analysis. At 3.1 molecular layers, the amount of adsorbed water is (c.f. equation (I:7.7) w33,ads=3.1·0.065·α·c=0.20·α·c (I:7.22) Then, equation (I:7.8) gives the following equation for the empty pore volume Vp,33,ads=wo-0.19·α·c-0.20·α·c=wo-0.39·α·c (I:7.23) Dividing with the total volume gives the empty porosity P33,ads= [(w/c)o-0.39·α·c]/[(w/c)o +0.32] (I:7.24) But, this is the same as the capillary porosity, see equation (I:7.20).
26
3.1 molecular layers correspond to more than 80% RH if only pure adsorption is considered; see Figure I:7.1. At such high RH there is also capillary condensation, which is seen in Figure I:7.1 by the fact that the different adsorption isotherms for different water-cement ratio when RH>45%; the higher the w/c-ratio, the higher the isotherm. Therefore, the true RH-value corresponding to capillary porosity is also dependent on the water-cement ratio. The RH-value can therefore vary between about 60% and 90% RH depending on the w/c-ratio. RH-value on the desorption isotherm corresponding to the capillary porosity 3.1 adsorbed water layers corresponds to 90% RH on the lowest adsorption isotherm in Figure I:7.1 (the “gel isotherm” valid for a cement paste with no capillary pores; i.e a paste with no or very low capillary condensation). According to Figure I:7.2 this RH on the adsorption isotherm corresponds to about 60% RH on the desorption isotherm. This RH-value is also within the capillary condensation range which makes it impossible to find one single RH-value that corresponds to the capillary porosity. The analysis shows that it is not possible to find one single RH-value on the adsorption or the desorption isotherm that corresponds to the capillary porosity. The value will depend on the water-cement ratio.
27
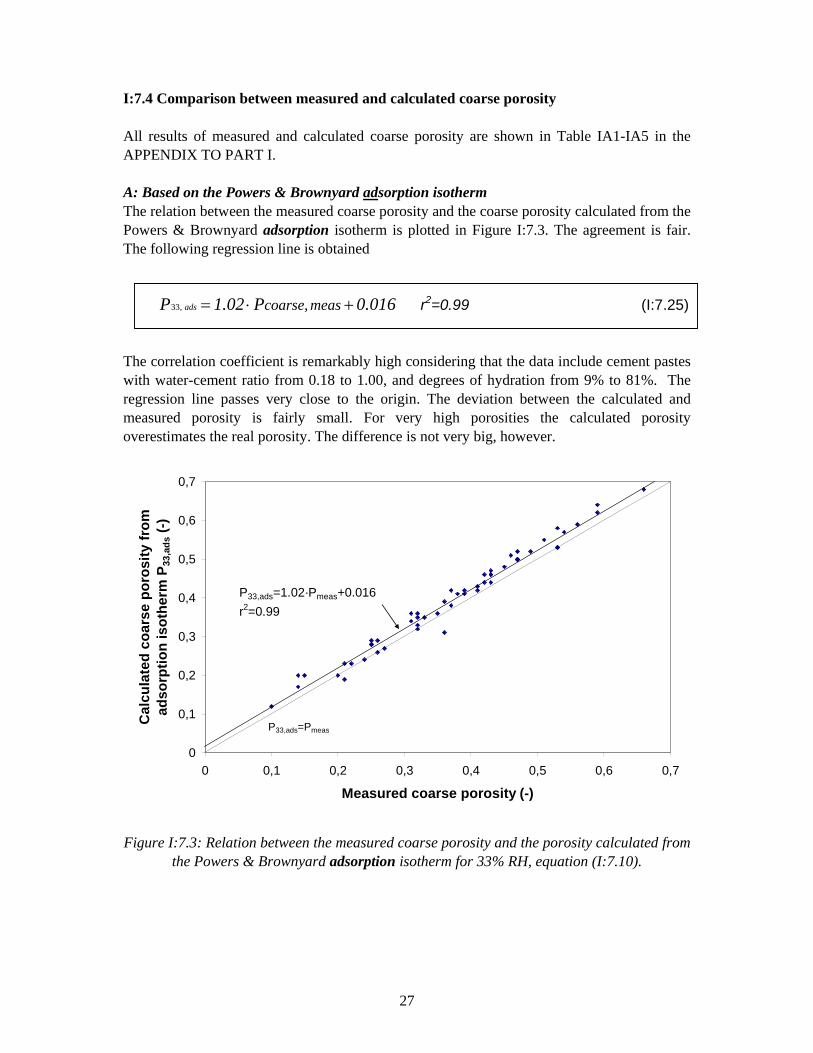
I:7.4 Comparison between measured and calculated coarse porosity All results of measured and calculated coarse porosity are shown in Table IA1-IA5 in the APPENDIX TO PART I. A: Based on the Powers & Brownyard adsorption isotherm The relation between the measured coarse porosity and the coarse porosity calculated from the Powers & Brownyard adsorption isotherm is plotted in Figure I:7.3. The agreement is fair. The following regression line is obtained 0.016P1.02P meascoarseads +⋅= ,,33 r2=0.99 (I:7.25) The correlation coefficient is remarkably high considering that the data include cement pastes with water-cement ratio from 0.18 to 1.00, and degrees of hydration from 9% to 81%. The regression line passes very close to the origin. The deviation between the calculated and measured porosity is fairly small. For very high porosities the calculated porosity overestimates the real porosity. The difference is not very big, however.
0
0,1
0,2
0,3
0,4
0,5
0,6
0,7
0 0,1 0,2 0,3 0,4 0,5 0,6 0,7
Measured coarse porosity (-)
Cal
cula
ted
coar
se p
oros
ity fr
om
adso
rptio
n is
othe
rm P
33,a
ds (-
)
P33,ads=1.02·Pmeas+0.016r2=0.99
P33,ads=Pmeas
Figure I:7.3: Relation between the measured coarse porosity and the porosity calculated from
the Powers & Brownyard adsorption isotherm for 33% RH, equation (I:7.10).
28
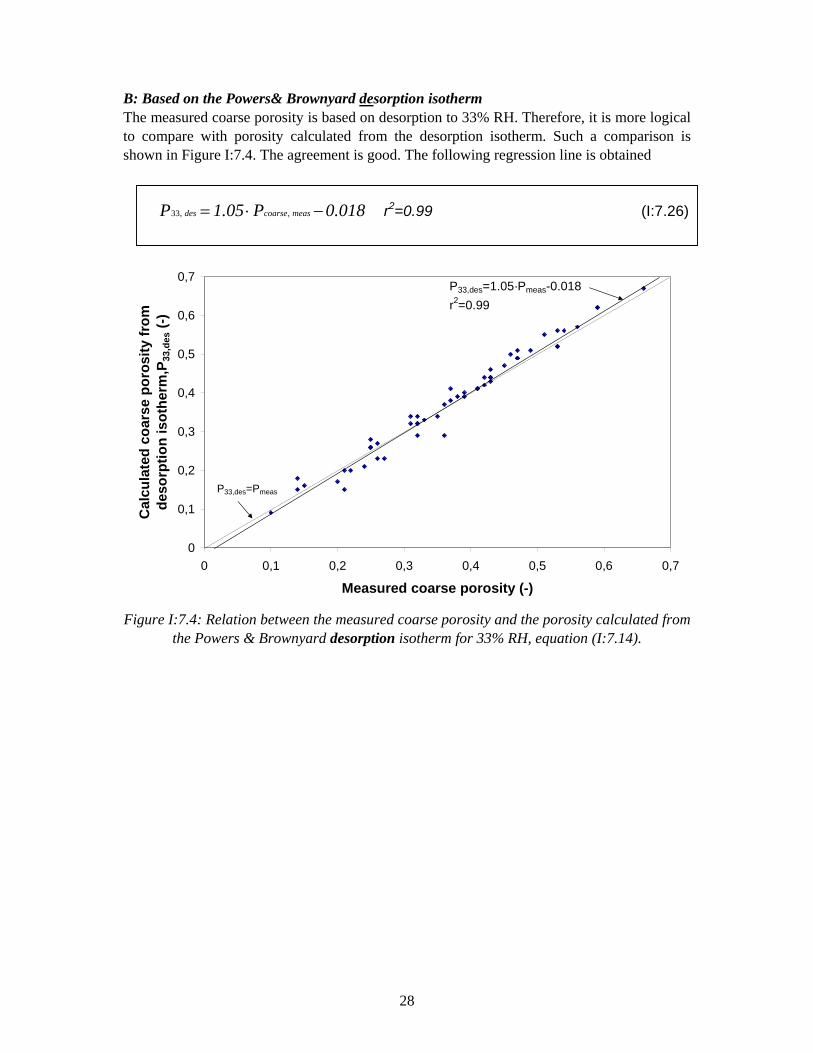
B: Based on the Powers& Brownyard desorption isotherm The measured coarse porosity is based on desorption to 33% RH. Therefore, it is more logical to compare with porosity calculated from the desorption isotherm. Such a comparison is shown in Figure I:7.4. The agreement is good. The following regression line is obtained 0.018P1.05P meascoarsedes −⋅= ,,33 r2=0.99 (I:7.26)
0
0,1
0,2
0,3
0,4
0,5
0,6
0,7
0 0,1 0,2 0,3 0,4 0,5 0,6 0,7
Measured coarse porosity (-)
Cal
cula
ted
coar
se p
oros
ity fr
om
deso
rptio
n is
othe
rm,P
33,d
es (-
)
P33,des=1.05·Pmeas-0.018r2=0.99
P33,des=Pmeas
Figure I:7.4: Relation between the measured coarse porosity and the porosity calculated from
the Powers & Brownyard desorption isotherm for 33% RH, equation (I:7.14).
29
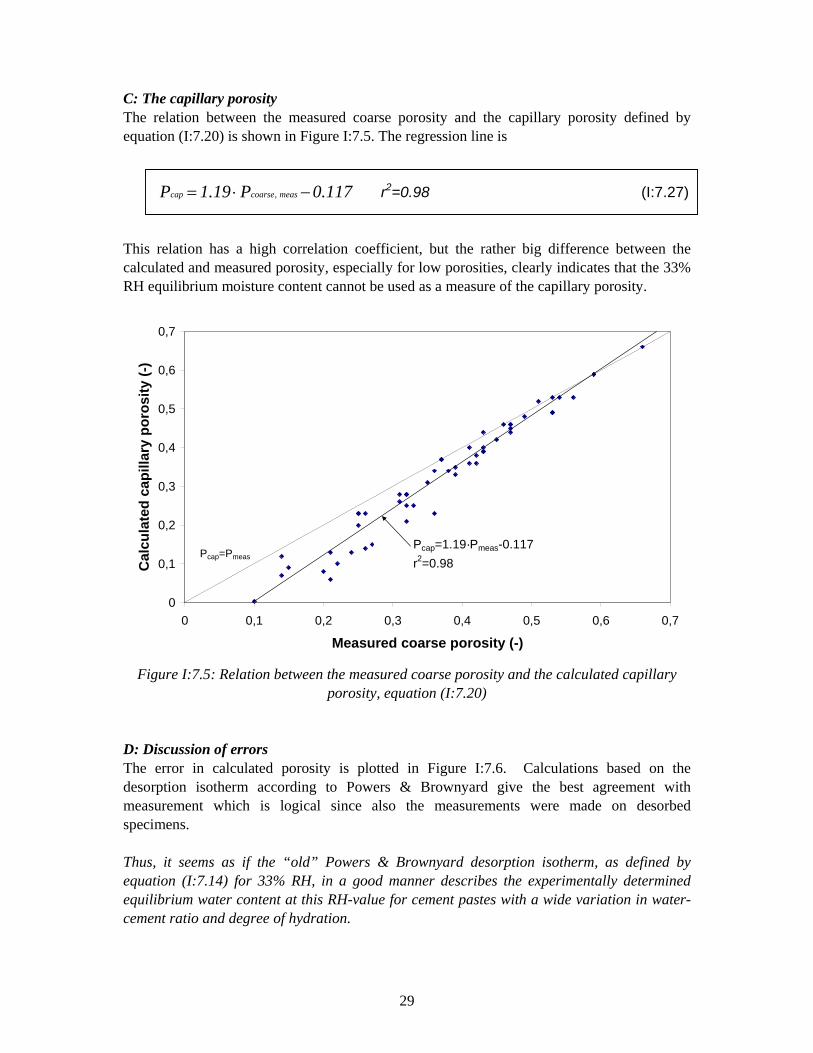
C: The capillary porosity The relation between the measured coarse porosity and the capillary porosity defined by equation (I:7.20) is shown in Figure I:7.5. The regression line is 0.117P1.19P meascoarsecap −⋅= , r2=0.98 (I:7.27) This relation has a high correlation coefficient, but the rather big difference between the calculated and measured porosity, especially for low porosities, clearly indicates that the 33% RH equilibrium moisture content cannot be used as a measure of the capillary porosity.
0
0,1
0,2
0,3
0,4
0,5
0,6
0,7
0 0,1 0,2 0,3 0,4 0,5 0,6 0,7
Measured coarse porosity (-)
Cal
cula
ted
capi
llary
por
osity
(-)
Pcap=1.19·Pmeas-0.117r2=0.98
Pcap=Pmeas
Figure I:7.5: Relation between the measured coarse porosity and the calculated capillary
porosity, equation (I:7.20)
D: Discussion of errors The error in calculated porosity is plotted in Figure I:7.6. Calculations based on the desorption isotherm according to Powers & Brownyard give the best agreement with measurement which is logical since also the measurements were made on desorbed specimens. Thus, it seems as if the “old” Powers & Brownyard desorption isotherm, as defined by equation (I:7.14) for 33% RH, in a good manner describes the experimentally determined equilibrium water content at this RH-value for cement pastes with a wide variation in water-cement ratio and degree of hydration.
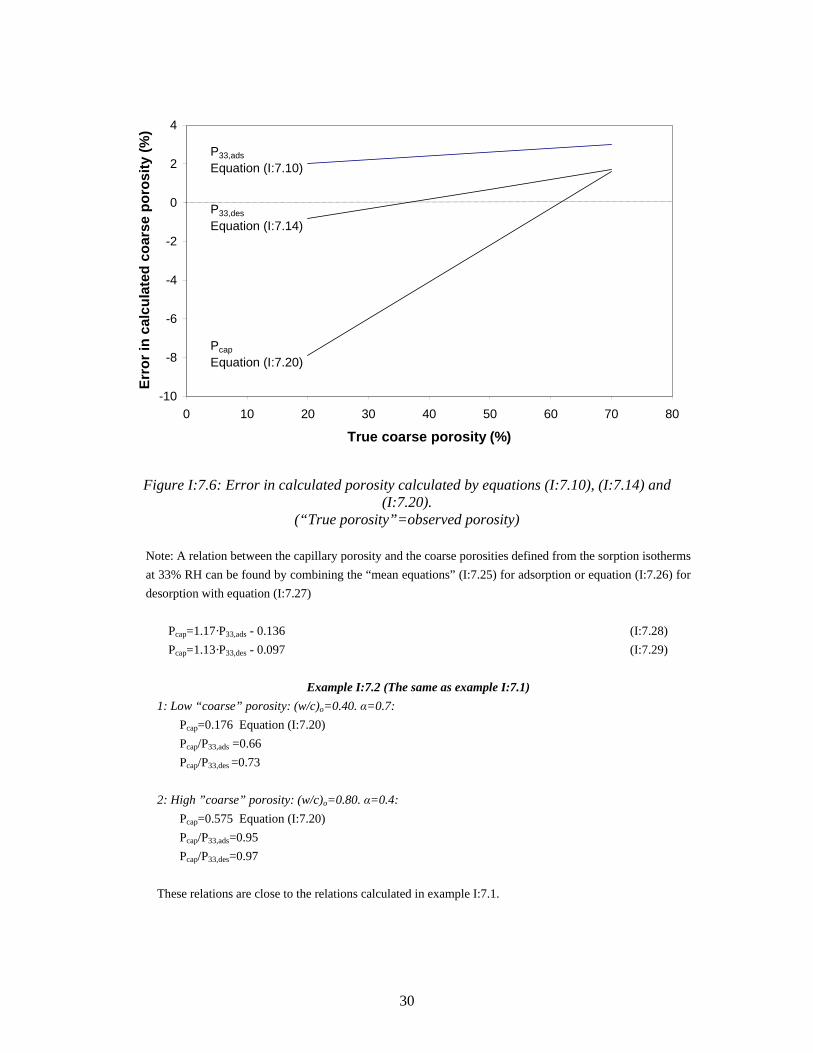
30
-10
-8
-6
-4
-2
0
2
4
0 10 20 30 40 50 60 70 80
True coarse porosity (%)
Erro
r in
calc
ulat
ed c
oars
e po
rosi
ty (%
)P33,adsEquation (I:7.10)
P33,desEquation (I:7.14)
PcapEquation (I:7.20)
Figure I:7.6: Error in calculated porosity calculated by equations (I:7.10), (I:7.14) and (I:7.20).
(“True porosity”=observed porosity)
Note: A relation between the capillary porosity and the coarse porosities defined from the sorption isotherms at 33% RH can be found by combining the “mean equations” (I:7.25) for adsorption or equation (I:7.26) for desorption with equation (I:7.27) Pcap=1.17·P33,ads - 0.136 (I:7.28) Pcap=1.13·P33,des - 0.097 (I:7.29)
Example I:7.2 (The same as example I:7.1) 1: Low “coarse” porosity: (w/c)o=0.40. α=0.7: Pcap=0.176 Equation (I:7.20) Pcap/P33,ads =0.66 Pcap/P33,des =0.73
2: High ”coarse” porosity: (w/c)o=0.80. α=0.4: Pcap=0.575 Equation (I:7.20) Pcap/P33,ads=0.95 Pcap/P33,des=0.97
These relations are close to the relations calculated in example I:7.1.
31
I:8 SPECIFIC SURFACE The inner specific surface of the cement paste describes the internal structure of the paste and the cement gel. The principles are described in Part II. Some estimations of the specific surface can be made on basis of measurements in the present Part I. Data over total porosity and coarse porosity listed in Tables AI.1-AI.5 are used as input in the calculations. The precision in the data are however not big enough to give an accurate calculation. Despite this, the calculations are made and presented in APPENDIX TO PART I. In Part II more precise calculations of specific surface and gel structure are made for a number of cement pastes based on measurements of the equilibrium weight at 33% RH and the dry weight.

32
33
PART II
SPECIFIC SURFACE AND GEL STRUCTURE

34
35
SUMMARY OF PART II The aim of Part II is to use the Grudemo data to calculate the inner specific surface of cement paste as function of its water-cement ratio and degree of hydration. Another aim is to use the same data for calculation of the specific surface of the cement gel, and to calculate the size of gel pores and gel particles. 25 different cement pastes were included in the study. 6 of them were made with low alkali-sulfate resistant Portland cement, 18 were made with Danish white cement, 1 was a pure C3S-paste. 3 of the white cement pastes contained 5 to 20% addition of semi-hydrate gypsum, 3 contained 5 to20% silica gel, and 3 contained 2 to 4% ethylene glycol. The water-cement ratio was varied between 0.25 and 0.50. The age at testing in most cases varied between 1 and 28 days. Degree of hydration The degree of hydration was determined from the non-evaporable water content determined after drying to +105 ºC and after ignition at 1000 ºC. As expected the hydration rate is higher for cement with higher specific surface and for cement containing higher amount of C3S; Figures II:3.1-II:3.2. It was also found that addition of silica gel and hemi-hydrate strongly reduced the amount of non-evaporable water for constant hydration time; Figures II:3.3-II:3.4. Amount of calcium hydroxide (CH) The amount of calcium hydroxide was determined by X-ray diffraction. As expected the CH content increased with increased degree of hydration; Figures II:3.5-II:3.6. Addition of silica gel reduced the amount of CH; the bigger the amount of silica gel the lower the CH-content; Figure II:3.7. Specific surface of cement paste The specific surface was calculated by the BET-theory using the measured equilibrium water content at the first desorption to 33% RH. In order to find the monomolecular capacity, which is supposed to correspond to the equilibrium water content at 17% RH, the water content at 33% RH is divided by the factor 1.38. It was found that the specific surface of the cement paste is independent of the water-cement ratio and only dependent on the degree of hydration. This is in accordance with the Powers & Brownyard (1948) and the Powers (1960) observations. The following equation is valid:
α0.251αKS⋅+
⋅= m2/kg (II:6.8)
where K is a coefficient that is almost independent of the water-cement ratio and degree of hydration. K≈3.7·105 for the LA/SR-cement; K≈4.1·105 for the white cement. The Powers and Brownyard (1948) desorption isotherms gives K≈3.2·105
This means that the specific surface of a cement paste with 80% hydration is about 250 m2/g. This can be compared with 210 m2/g which is calculated from the Powers and Brownyard (1948) desorption isotherm shown in Figure II:7.2.
36
Specific surface of cement gel The specific surface of the entire cement gel including the non-colloidal calcium hydroxide is found by introducing α=1 in the equation above:
LA/SR-cement: Sgel≈300 m2/g White cement: Sgel≈330 m2/g
The specific surface of white cement gel containing silica gel is higher than for the plain cement pastes. The most plausible reason is that the amount of calcium hydroxide is lower.
10% silica gel: Sgel≈375 m2/g
Specific surface of “gel particles” The specific surface of the gel particles excluding the non-colloidal calcium hydroxide is higher than for the total gel. If calcium hydroxide is supposed to have negligible surface area the net specific surface of the gel particles becomes:
LA/SR-cement: Sgel,net≈430 m2/g White cement: Sgel,net≈550 m2/g
Size of gel particles The gel particles are assumed to be thin plates. The Grudemo desorption data give an average thickness of the plates including the calcium hydroxide of about 25 Å for both cement types. The thickness of gel particles excluding the calcium hydroxide, assuming this to have negligible surface area, is reduced to about 14 to 18 Å.
Size of gel pores The volume of gel pores is assumed to be 28% as shown by Powers (1960). Then, the Grudemo desorption data show that the width of slit like gel pores becomes about 10Å if calcium hydroxide is included in the gel. If calcium hydroxide is excluded the width of the gel pores is increased to about 12Å. Effect of drying at +105C on the specific surface The effect of drying is found by comparing the specific surface calculated from the first desorption isotherm on the never-dried specimen, and the first adsorption isotherm on the dried specimen. The Powers & Brownyard data are used. It is found that drying decreases the specific surface by about 25% and increases the average width of the gel pore from about 10Å to about 17Å. Comparison with the Powers & Brownyard (1948) work The Grudemo desorption data for a very wide spectrum of degree of hydration and water-cement ratio indicate that the specific surface of the cement paste is virtually independent of the water cement ratio. It is only a function of the degree of hydration. This is in accordance with earlier observations by Powers & Brownyard (1948) and Powers (1960). The calculated specific surface for the cement gel itself (i.e. at 100% hydration) is about 300 m2/g which can be compared with about 255 m2/g calculated from a typical Powers & Brownyard (1948) first desorption isotherm, and about 210 m2/g calculated from an adsorption isotherm.
37
II:1 MATERIALS AND SPECIMENS II:1.1 Mixing, casting and curing The same procedures were used as for the specimens in Part I, see paragraph I.1.1. Tests of the specimens were made after curing in saturated lime water for periods lasting from 1 day to 30 days (157 days for one series). An overview over curing times before testing is given in Table II.1 II:1.2 Cement Main cement types Three types of cements were used
• White cement (WhC) • Low alkali, sulphate resistant Portland cement (LA/SR) • Pure C3S
The LA/SR-cement was the same as in Part I. Its composition is given in paragraph I.1.2. The white cement had the following composition in weight-percent C3S 81 C2S 6 C3A 5 C4AF 1 Limestone filler 0 Variations in cement LA/SR-cement A fine fraction (<37 µm) of the LA/SR-cement was also investigated. The same fine fraction was also studied in Part I. White cement Certain amounts of different additives were used in some mixes
1. Hemi-hydrate gypsum, CaSO4·½H2O (5 to 10 % added) 2. Amorphous silica gel (Aerosil) (5 to 20% added) 3. Ethylene glycol (2 to 6% added)
The aerosil and the ethylene glycol were primarily used for stabilizing the mixes against separation. II:1.3 Specimens The same type of cement paste specimens as described in paragraph I.1.3 were used for testing.

38
II:1.4 Mixes In total 25 different mixes were studied. Characteristics of different mixes are shown in Table II:1.1. Table II:1.1: Overview over mixes
Additive Cement type Type % 1)
(w/c)o Age at testing days
0.25 0.32
LA/SR
No
0.40
1, 2, 3, 4, 6, 8, 12, 20, 28
0.32 0.40
LA/SR Fine
No
0.50
2,4,8,16
0.32 1, 2, 3, 4, 6, 8, 12, 19, 28 0.32 0.35 0.38 0.42 0.46 0.50
3, 9, 27
0.40
No
0.50 1, 2, 3, 4, 6, 8, 12, 18
5 10
Semi-hydrate
20
0.50
4, 8
5 10
Silica gel
20
0.50
1, 4, 8, 16
2 5,30 4 5
White cement
Ethylene glycol
6
0.40 2)
5, 30 C3S No 0.40 2, 4, 8, 18, 157
1) % of the cement weight 2) Including the ethylene glycol. The net w/c-ratio is 0.38, 0.36 and 0.34 respectively.
39
II:2 MEASUREMENTS At terminated water curing the following procedures were undertaken (c.f. Figure I:2.1). Determination of the degree of hydration (made on about 30 mm long specimens):
1. A cement paste specimen was crushed and ground in ethyl-alcohol in order to stop further hydration.
2. The powder was dried at +105°C by the method developed by Danielsson (1974).The dry weight was determined (Q105).
3. The dry powder was ignited at +1000°C and weighed (Q1000). 4. The degree of hydration was calculated by equation (I.3.5)
Determination of specific surface (made on about 3 mm thick slices):
1. The specimens were placed in a glass container connected to another glass vessel containing a saturated water solution of MgCl2. The vessels were subjected to vacuum in order to avoid carbonation, and in order to decrease the time needed for the specimen to reach moisture equilibrium with air in the vessel (33% RH).
2. After moisture equilibrium had been reached the specimens were weighed (Q33). 3. The specimens were dried at 105°C and the dry weight determined (Q105). 4. Calculation of the specific surface was made, see equation (II:4.8) below.
In total 116 different tests were made. Furthermore, quantitative X-ray diffraction for determination of crystalline calcium hydroxide was performed on all samples except those containing ethylene glycol. All data are listed in Tables AII.1-AII.5 in the APPENDIX TO PART II.

40
II:3 DEGREE OF HYDRATION. EVOLUTION OF CALCIUM HYDROXIDE
II:3.1 Degree of hydration The degree of hydration is calculated by equation (I:3.5). The result is shown in APPENDIX TO PART II, Tables AII.1-AII.5. The development of degree of hydration with time is plotted in Figures II:3.1 –II:3.4. The following observations are made:
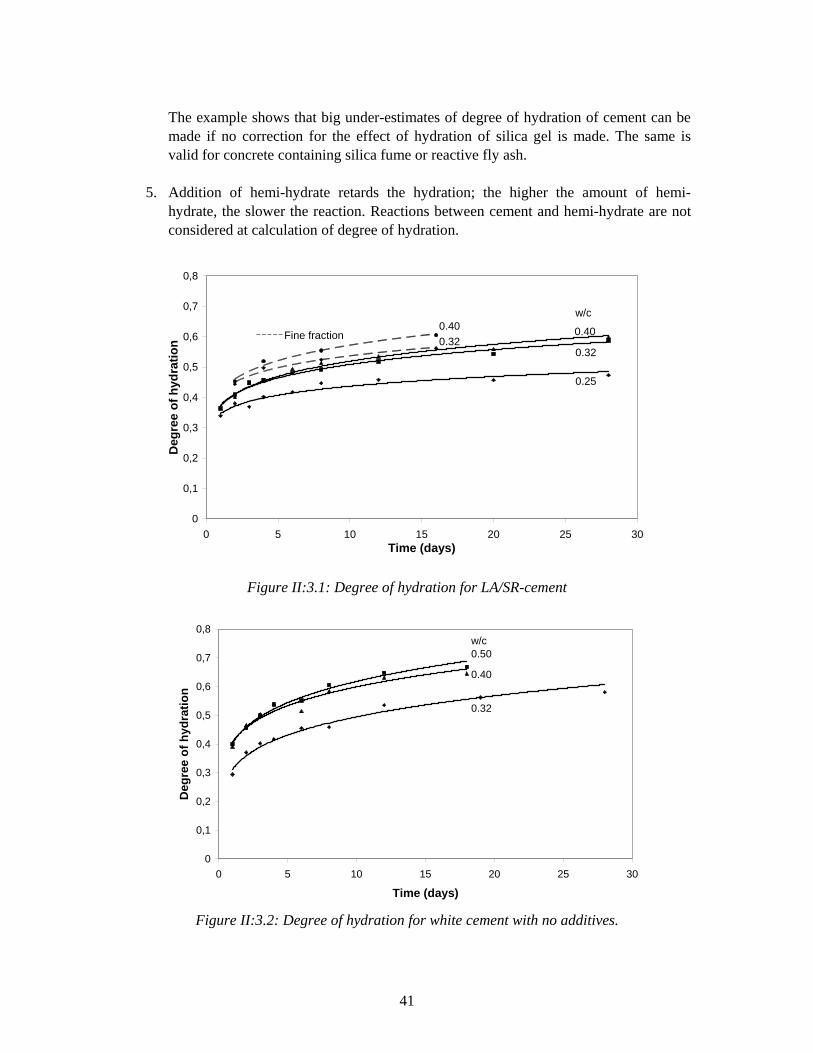
1. The hydration rate increases with increased water-cement ratio. This was also observed in Part I, see Figure I:3.1.
2. The hydration rate is higher for white cement than for the LA/SR-cement.
Example w/c=0.40: The degree of hydration after 3 days is 0.50 for white cement and only 0.45 for LA/SR-cement. After 20 days the values are 0.65 and 0.56. The main reason is the higher amount of C3S (and C3A) in the white cement.
3. The hydration rate increases with increased fineness of the cement. This was also
found in Part I, Figure I:3.1.
4. Addition of silica gel seems to accelerate the early hydration, but retard the long-term hydration; the higher the amount of silica gel, the bigger the long-term retardation. These conclusions might however not be correct, viz. the use of equation (I:3.5) for calculation of degree of hydration is not altogether correct for mixes containing silica gel. It was shown by Helsing Atlassi (1993) that there is no direct proportionality between the amount of chemically bound water and degree of hydration for mixes containing silica fume. The following relation for chemically bound water was given
wn≈0.25·αC·c-0.34·αS·S·c (II:3.1)
Where αC is the degree of hydration of the cement, and αS is the degree of hydration of the silica gel. S is the amount of silica gel as weight fraction of the cement. The minus-sign in front of silica indicates that hydration of silica is a polymerization process that liberates previously bound water. This process was not known when Grudemo made his research.
Example
LA/SR-cement. w/c-ratio 0.40.10% silica gel, S=0.10. 28 days of hydration. Full hydration of silica gel (αS=1). - “Believed” degree of hydration of the cement as judged by equation (I:3.5) after 28
days: αC=0.60 (Figure II:3.1) -Observed amount of chemically bound water: wn= 0.25·0.60·c=0.15·c -Amount of water set free by hydration of silica gel: 0.34·1·0.10·c=0.034·c -True degree of hydration of the cement calculated by equation (II:3.1): αC=(0.15+0.034)/0.25=0.74
41
The example shows that big under-estimates of degree of hydration of cement can be made if no correction for the effect of hydration of silica gel is made. The same is valid for concrete containing silica fume or reactive fly ash.
5. Addition of hemi-hydrate retards the hydration; the higher the amount of hemi-hydrate, the slower the reaction. Reactions between cement and hemi-hydrate are not considered at calculation of degree of hydration.
0
0,1
0,2
0,3
0,4
0,5
0,6
0,7
0,8
0 5 10 15 20 25 30Time (days)
Deg
ree
of h
ydra
tion
w/c
0.25
0.32
0.400.320.40
Fine fraction
Figure II:3.1: Degree of hydration for LA/SR-cement
0
0,1
0,2
0,3
0,4
0,5
0,6
0,7
0,8
0 5 10 15 20 25 30
Time (days)
Deg
ree
of h
ydra
tion
w/c
0.32
0.40
0.50
Figure II:3.2: Degree of hydration for white cement with no additives.
42
0
0,1
0,2
0,3
0,4
0,5
0,6
0,7
0,8
0 2 4 6 8 10 12 14 16 18 20
Time (days)
Deg
ree
of h
ydra
tion
Silica gel0%
5%10%20%
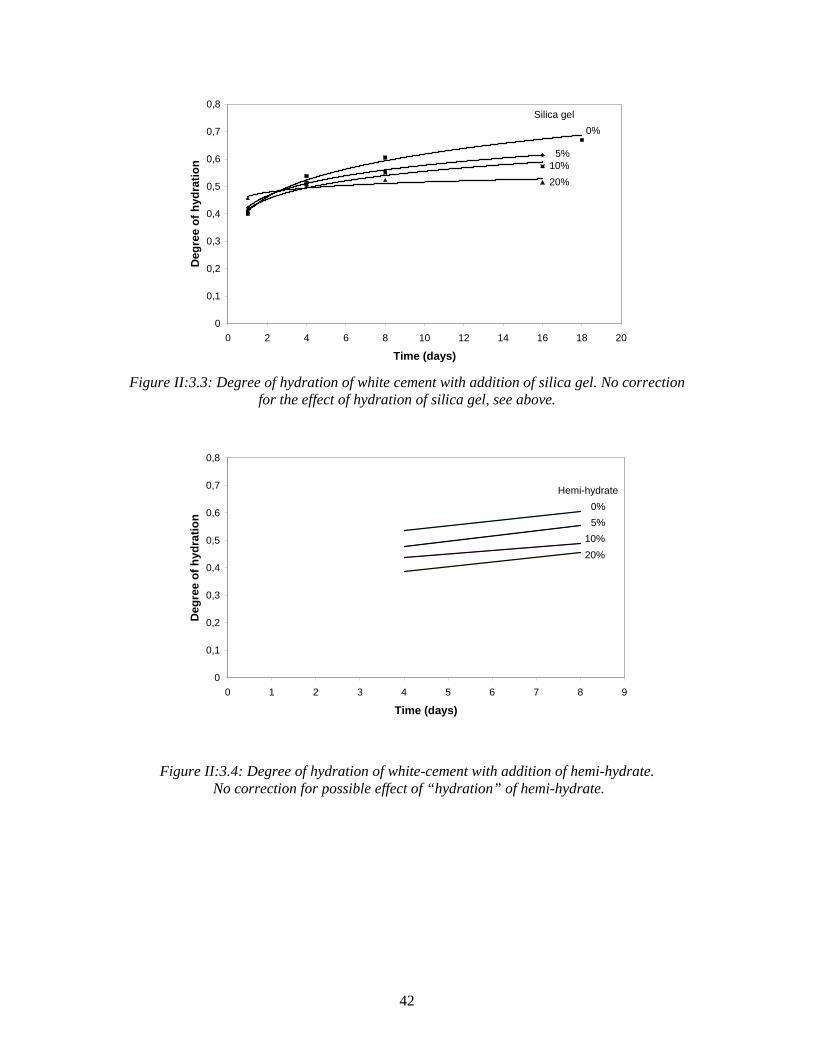
Figure II:3.3: Degree of hydration of white cement with addition of silica gel. No correction
for the effect of hydration of silica gel, see above.
0
0,1
0,2
0,3
0,4
0,5
0,6
0,7
0,8
0 1 2 3 4 5 6 7 8 9
Time (days)
Deg
ree
of h
ydra
tion
0%5%
10%20%
Hemi-hydrate
Figure II:3.4: Degree of hydration of white-cement with addition of hemi-hydrate. No correction for possible effect of “hydration” of hemi-hydrate.
43
II:3.2 Calcium hydroxide The amount of crystalline calcium hydroxide (CH) was determined by quantitative X-ray diffraction on powdered samples dried at +105°C. Principles of the technique are described in Grudemo (1977). The measurement gives the weight fraction of calcium hydroxide in the sample (weight-fraction of solid material). The total weight of dried solid material (with no additives) is
Qsolid=c+wn=c(1+0.25·α) (g) (II:3.2)
The total amount of crystalline calcium hydroxide (CH) becomes CHtot=CHS·c(1+0.25·α) (g) (II:3.3) Where the parameter CHS is the measured amount of crystalline calcium hydroxide expressed as weight-fraction of all solid material. The amount of calcium hydroxide as weight fraction of the cement becomes CHC=CHtot/c= CHS(1+0.25·α) (II:3.4) For cement pastes with mineral additives equation (II:3.4) is modified to CHC= CHS (1+R+0.25·α) (II:3.5) Where the coefficient R is the amount of mineral additive as weight-fraction of cement. It is assumed that the density is the same for the additive as for the cement. The measured amount of CH in weight-% of solid, and the calculated amount of CH as weight-% of cement, is shown in APPENDIX TO PART II, Tables AII.1-AII.5. The amount of calcium hydroxide as function of the degree of hydration is shown in Figures II:3.5-II:3.7. The following observations are made:
1. The amount of calcium hydroxide increases with increased degree of hydration. However, the results do no indicate a direct proportionality between CH and degree of hydration, which might depend on the rather big spread in results. One must expect that the amount of calcium hydroxide is zero at zero hydration. The trend lines do, however, erroneously predict considerable amounts of calcium hydroxide even before any hydration.
2. At equal degree of hydration the amount of calcium hydroxide is somewhat higher for
the white cement than for the LA/SR-cement. The most plausible reason is the higher amount of C3S in the white cement; more calcium hydroxide is developed at hydration of C3S than at hydration of the same amount of C2S.
44
Examples of results: 50% degree of hydration, w/c-ratio 0.40: White cement: CHC≈0.28. LA/SR-cement: CHC ≈0.24.
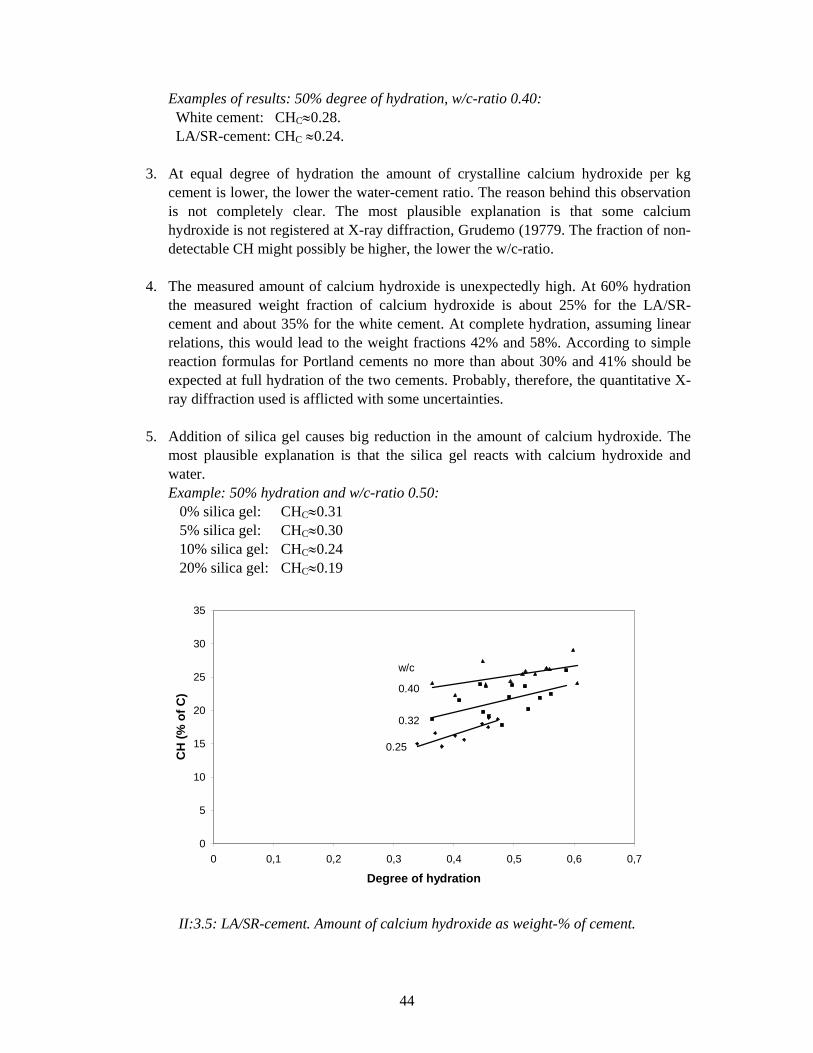
3. At equal degree of hydration the amount of crystalline calcium hydroxide per kg cement is lower, the lower the water-cement ratio. The reason behind this observation is not completely clear. The most plausible explanation is that some calcium hydroxide is not registered at X-ray diffraction, Grudemo (19779. The fraction of non-detectable CH might possibly be higher, the lower the w/c-ratio.
4. The measured amount of calcium hydroxide is unexpectedly high. At 60% hydration
the measured weight fraction of calcium hydroxide is about 25% for the LA/SR-cement and about 35% for the white cement. At complete hydration, assuming linear relations, this would lead to the weight fractions 42% and 58%. According to simple reaction formulas for Portland cements no more than about 30% and 41% should be expected at full hydration of the two cements. Probably, therefore, the quantitative X-ray diffraction used is afflicted with some uncertainties.
5. Addition of silica gel causes big reduction in the amount of calcium hydroxide. The
most plausible explanation is that the silica gel reacts with calcium hydroxide and water. Example: 50% hydration and w/c-ratio 0.50: 0% silica gel: CHC≈0.31 5% silica gel: CHC≈0.30 10% silica gel: CHC≈0.24 20% silica gel: CHC≈0.19
0
5
10
15
20
25
30
35
0 0,1 0,2 0,3 0,4 0,5 0,6 0,7
Degree of hydration
CH
(% o
f C)
w/c
0.25
0.32
0.40
II:3.5: LA/SR-cement. Amount of calcium hydroxide as weight-% of cement.

45
0
5
10
15
20
25
30
35
40
45
0 0,1 0,2 0,3 0,4 0,5 0,6 0,7 0,8
Degree of hydration
CH
(% o
f C)
w/c
0.32
0.40
0.50
II:3.6: White cement. Amount of calcium hydroxide as weight-% of cement.
0
5
10
15
20
25
30
35
40
45
0 0,1 0,2 0,3 0,4 0,5 0,6 0,7
Degree of hydration
CH
(% o
f C)
Amount of silica gel (%)
0
5
1020
II:3.7: White cement with addition of silica gel. Amount of calcium hydroxide as weight-% of
cement
46
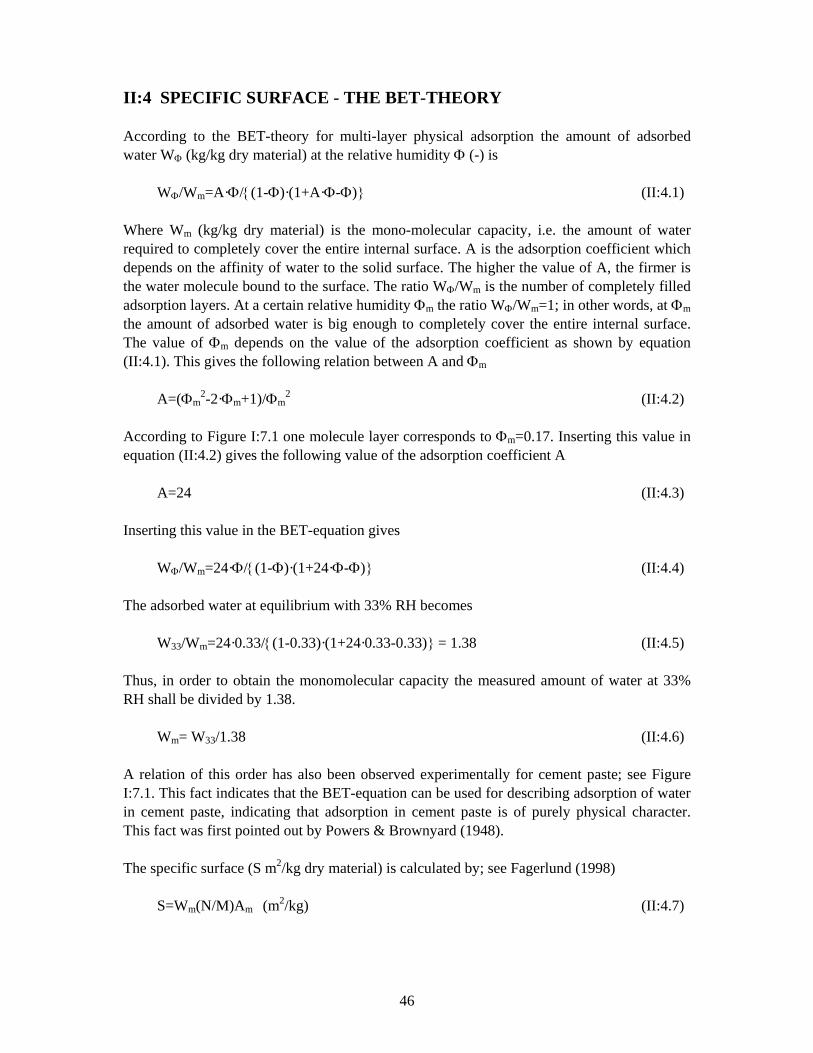
II:4 SPECIFIC SURFACE - THE BET-THEORY According to the BET-theory for multi-layer physical adsorption the amount of adsorbed water WΦ (kg/kg dry material) at the relative humidity Φ (-) is WΦ/Wm=A·Φ/{(1-Φ)·(1+A·Φ-Φ)} (II:4.1) Where Wm (kg/kg dry material) is the mono-molecular capacity, i.e. the amount of water required to completely cover the entire internal surface. A is the adsorption coefficient which depends on the affinity of water to the solid surface. The higher the value of A, the firmer is the water molecule bound to the surface. The ratio WΦ/Wm is the number of completely filled adsorption layers. At a certain relative humidity Φm the ratio WΦ/Wm=1; in other words, at Φm the amount of adsorbed water is big enough to completely cover the entire internal surface. The value of Φm depends on the value of the adsorption coefficient as shown by equation (II:4.1). This gives the following relation between A and Φm A=(Φm
2-2·Φm+1)/Φm2 (II:4.2)
According to Figure I:7.1 one molecule layer corresponds to Φm=0.17. Inserting this value in equation (II:4.2) gives the following value of the adsorption coefficient A A=24 (II:4.3) Inserting this value in the BET-equation gives WΦ/Wm=24·Φ/{(1-Φ)·(1+24·Φ-Φ)} (II:4.4) The adsorbed water at equilibrium with 33% RH becomes W33/Wm=24·0.33/{(1-0.33)·(1+24·0.33-0.33)} = 1.38 (II:4.5) Thus, in order to obtain the monomolecular capacity the measured amount of water at 33% RH shall be divided by 1.38. Wm= W33/1.38 (II:4.6) A relation of this order has also been observed experimentally for cement paste; see Figure I:7.1. This fact indicates that the BET-equation can be used for describing adsorption of water in cement paste, indicating that adsorption in cement paste is of purely physical character. This fact was first pointed out by Powers & Brownyard (1948). The specific surface (S m2/kg dry material) is calculated by; see Fagerlund (1998) S=Wm(N/M)Am (m2/kg) (II:4.7)

47
Where N is Avogadro´s number (6.02·1026 molecules/kmole) and M is the molecular weight of water (18 kg/kmole). Am is the area covered by 1 water molecule. Assuming close-packed molecules Am=10.6 Å2. The derivation of this value is made in Fagerlund (1998). Inserting equation (II:4.6) and the figures for all constants gives the following equation for calculation of the specific surface from the equilibrium adsorption at 33% RH.
2026
1010.618
106.021.38WS 33 −⋅⋅⋅⋅= (m2/kg) (II:4.8)
or 33
610 W2.57S ⋅⋅= (m2/kg) (II:4.8´) Note: W33 shall be expressed in kg per kg dry material.

48
II:5 SPECIFIC SURFACE OF CEMENT PASTE BASED ON ADSORPTION According to the original BET-theory, water contents at adsorption shall be used. As shown in the previous paragraph -equation (II:4.8)- the following equation gives the specific surface based on the equilibrium water content at 33% RH reached by adsorption
adsads W102.57S 6,33⋅⋅= (m2/kg) (II:5.1)
W33,ads was however not determined in Grudemo´s work. Therefore, experimental values of specific surface based on adsorption cannot be calculated from his data. Values of Sads can be obtained from the Powers & Brownyard (1948) adsorption isotherms, see Figure I:7.1. The adsorbed water expressed in grams is given by equation (I:7.7) w33,ads=0.091·α·c (g) (I:7.7) The dry weight of the cement paste is composed of the weight of cement and chemically bound water, i.e. Qdry=c+0.25·α·c=c(1+0.25·α) (II:5.2) The water content at equilibrium with 33% RH at adsorption becomes W33,ads=w33,ads/Qdry (g/g or kg/kg) (II:5.3) Inserting equations (I:7.7) and (II:5.2) gives W33,ads=0.091·α/(1+0.25·α) (II:5.4) Inserting this in equation (II:5.1) gives the following expression for the specific surface of the entire cement paste Sads=2.57·106·0.091·α/(1+0.25·α) (m2/kg) (II:5.5) or
α0.251α102.34S
5ads
⋅+⋅⋅= (m2/kg) (II:5.6)
Thus, according to the Powers & Brownyard (1948) work, the specific surface based on adsorption is independent of the water-cement ratio, and only dependent of the degree of hydration. This is logical since it is primarily the amount of cement gel that determines the

49
internal surface and not the amount of coarse pores. The volume of cement gel is independent of the water-cement ratio as shown by equation (I:7.16) Equation (II:5.6) is shown in Figure II:6.1. When α=1 all solid material is cement gel. Therefore, theoretically, according to equation (II:5.6) the specific surface of the cement gel is 187 m2/g. This value is of the same order as the values below values given in Powers (1960) for 4 different cement pastes. This is not unexpected since the value is calculated from an adsorption isotherm experimentally determined by Powers.
Cement paste No
Specific surface of the cement gel based on the adsorption isotherm (m2/g)
1 219 2 200 3 227 4 193
Mean value 210
Note1: All these values are the specific surface of the entire cement gel including non-colloidal calcium hydroxide. Note 2: The values are valid for cement gel that has been exposed to hard drying before adsorption. It is not necessarily the same as the specific surface of the “virgin” (never-dried) cement paste, see the next paragraph.
50
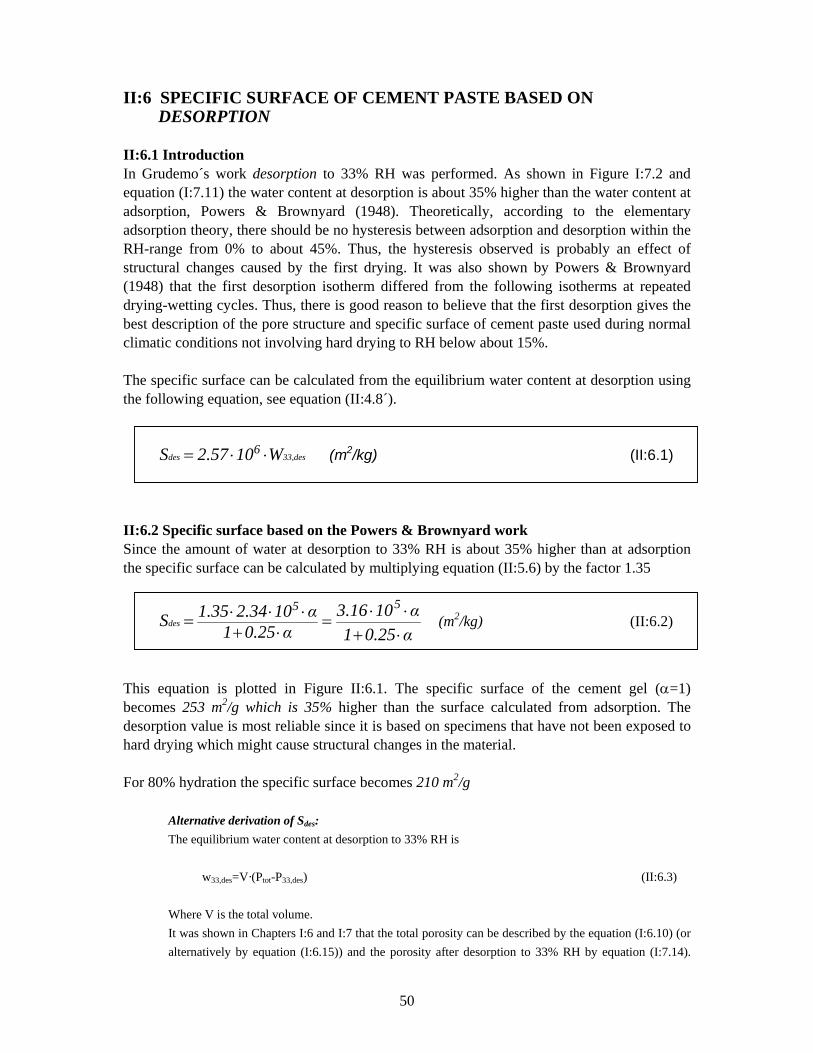
II:6 SPECIFIC SURFACE OF CEMENT PASTE BASED ON DESORPTION II:6.1 Introduction In Grudemo´s work desorption to 33% RH was performed. As shown in Figure I:7.2 and equation (I:7.11) the water content at desorption is about 35% higher than the water content at adsorption, Powers & Brownyard (1948). Theoretically, according to the elementary adsorption theory, there should be no hysteresis between adsorption and desorption within the RH-range from 0% to about 45%. Thus, the hysteresis observed is probably an effect of structural changes caused by the first drying. It was also shown by Powers & Brownyard (1948) that the first desorption isotherm differed from the following isotherms at repeated drying-wetting cycles. Thus, there is good reason to believe that the first desorption gives the best description of the pore structure and specific surface of cement paste used during normal climatic conditions not involving hard drying to RH below about 15%. The specific surface can be calculated from the equilibrium water content at desorption using the following equation, see equation (II:4.8´). 33,desdes W102.57S 6 ⋅⋅= (m2/kg) (II:6.1) II:6.2 Specific surface based on the Powers & Brownyard work Since the amount of water at desorption to 33% RH is about 35% higher than at adsorption the specific surface can be calculated by multiplying equation (II:5.6) by the factor 1.35
α0.251α103.16
α0.251α102.341.35S
55des
⋅+⋅⋅=
⋅+⋅⋅⋅= (m2/kg) (II:6.2)
This equation is plotted in Figure II:6.1. The specific surface of the cement gel (α=1) becomes 253 m2/g which is 35% higher than the surface calculated from adsorption. The desorption value is most reliable since it is based on specimens that have not been exposed to hard drying which might cause structural changes in the material. For 80% hydration the specific surface becomes 210 m2/g
Alternative derivation of Sdes: The equilibrium water content at desorption to 33% RH is w33,des=V·(Ptot-P33,des) (II:6.3) Where V is the total volume. It was shown in Chapters I:6 and I:7 that the total porosity can be described by the equation (I:6.10) (or alternatively by equation (I:6.15)) and the porosity after desorption to 33% RH by equation (I:7.14).
51
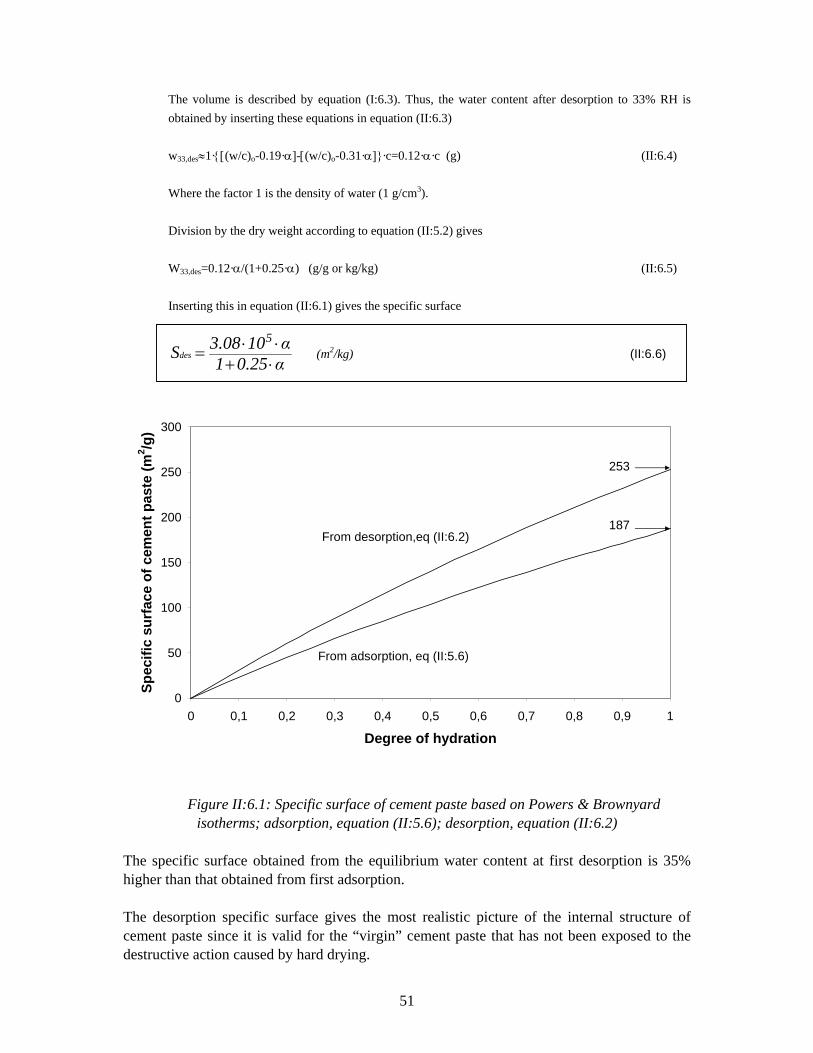
The volume is described by equation (I:6.3). Thus, the water content after desorption to 33% RH is obtained by inserting these equations in equation (II:6.3) w33,des≈1·{[(w/c)o-0.19·α]-[(w/c)o-0.31·α]}·c=0.12·α·c (g) (II:6.4) Where the factor 1 is the density of water (1 g/cm3). Division by the dry weight according to equation (II:5.2) gives W33,des=0.12·α/(1+0.25·α) (g/g or kg/kg) (II:6.5) Inserting this in equation (II:6.1) gives the specific surface
α0.251α103.08S
5des
⋅+⋅⋅= (m2/kg) (II:6.6)
0
50
100
150
200
250
300
0 0,1 0,2 0,3 0,4 0,5 0,6 0,7 0,8 0,9 1
Degree of hydration
Spec
ific
surf
ace
of c
emen
t pas
te (m
2 /g)
187
253
From adsorption, eq (II:5.6)
From desorption,eq (II:6.2)
Figure II:6.1: Specific surface of cement paste based on Powers & Brownyard isotherms; adsorption, equation (II:5.6); desorption, equation (II:6.2)
The specific surface obtained from the equilibrium water content at first desorption is 35% higher than that obtained from first adsorption. The desorption specific surface gives the most realistic picture of the internal structure of cement paste since it is valid for the “virgin” cement paste that has not been exposed to the destructive action caused by hard drying.
52
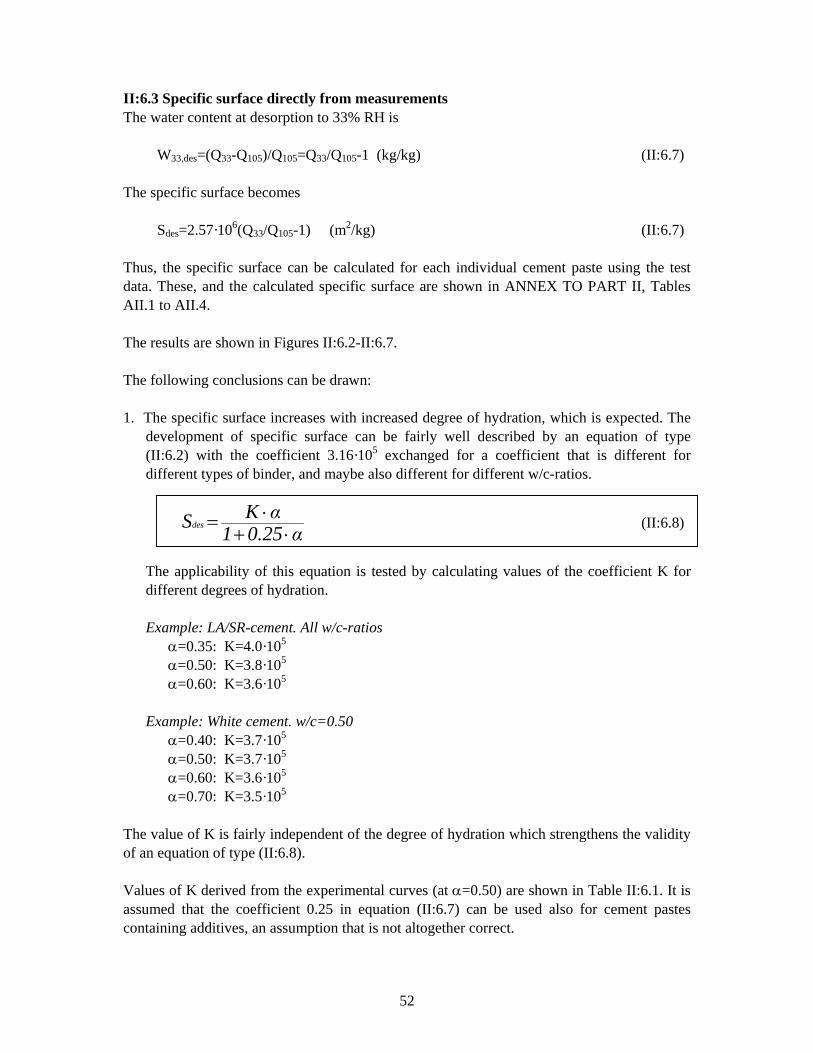
II:6.3 Specific surface directly from measurements The water content at desorption to 33% RH is W33,des=(Q33-Q105)/Q105=Q33/Q105-1 (kg/kg) (II:6.7) The specific surface becomes Sdes=2.57·106(Q33/Q105-1) (m2/kg) (II:6.7) Thus, the specific surface can be calculated for each individual cement paste using the test data. These, and the calculated specific surface are shown in ANNEX TO PART II, Tables AII.1 to AII.4. The results are shown in Figures II:6.2-II:6.7. The following conclusions can be drawn: 1. The specific surface increases with increased degree of hydration, which is expected. The
development of specific surface can be fairly well described by an equation of type (II:6.2) with the coefficient 3.16·105 exchanged for a coefficient that is different for different types of binder, and maybe also different for different w/c-ratios.
α0.251αKSdes⋅+
⋅= (II:6.8)
The applicability of this equation is tested by calculating values of the coefficient K for
different degrees of hydration.
Example: LA/SR-cement. All w/c-ratios α=0.35: K=4.0·105 α=0.50: K=3.8·105 α=0.60: K=3.6·105 Example: White cement. w/c=0.50 α=0.40: K=3.7·105 α=0.50: K=3.7·105 α=0.60: K=3.6·105 α=0.70: K=3.5·105
The value of K is fairly independent of the degree of hydration which strengthens the validity of an equation of type (II:6.8).
Values of K derived from the experimental curves (at α=0.50) are shown in Table II:6.1. It is assumed that the coefficient 0.25 in equation (II:6.7) can be used also for cement pastes containing additives, an assumption that is not altogether correct.

53
Table II:6.1: The coefficient K derived from the curves in Figures II:6.2-II:6.7, and the corresponding specific surface at 80% hydration; equation (II:6.8)
Additive K Type of cement
w/c Type amount
% of C
Specific surface (α=0.80)
m2/g LA/SR. Normal
0.25-0.40
3.8·105 253
LA/SR. Fine 0.32-0.50
3.6·105 233
0.32-0.50
4.1·105 273
0.32 4.4·105 293 0.40 3.9·105 260
White cement
0.50
3.7·105 245 5 3.9·105 260 10 4.7·105 313
White cement
0.50
Silica gel
20 5.9·105 346 5 4.1·105 273 10 4.7·105 313
White cement
0.50
Hemi-hydrate 20 7.5·105 500
2. The specific surface is almost independent of the water-cement ratio, which clearly
indicates that the gel structure formed has the same shape irrespectively of the water-cement ratio. The very slight tendency that the specific surface is increased with decreased water-cement ratio might be a consequence of the bigger difficulty to reach moisture equilibrium during drying for cement pastes with very low water-cement ratio.
3. There is no clear difference in specific surface between the normal LA/SR-cement and the
fine fraction of this cement. This is of course expected since the chemical composition is the same in the two cements.
4. Addition of silica gel causes a big increase in the specific surface. This can be explained by
the fact that the silica gel produces more calcium-silicate hydrate gel by its reaction with calcium hydroxide.
5. For all cement pastes, the specific surface is higher than the values calculated from the
Powers & Brownyard (1948) desorption isotherm in Figure I:7.2, equation (II:6.2). For the LA/SR-cement it is in average 17% higher. For the white cement it is in average 25% higher. It must be considered, however, that the chemical composition of the cement used by Powers & Brownyard in their Figure I:7.2 is not the same as for the cement used in the Grudemo study.
6. Addition of hemi-hydrate gypsum causes considerable increase in the specific surface. The
reason is unclear.

54
0
20
40
60
80
100
120
140
160
180
200
0 0,1 0,2 0,3 0,4 0,5 0,6 0,7 0,8 0,9 1
Degree of hydration
Spec
ific
surf
ace
(m2 /g
)
w/c
0.25
0.32
0.40
0.25
0.32, 0.40
Figure II:6.2: Normal LA/SR-cement. Specific surface calculated from first desorption versus
the degree of hydration.
0
20
40
60
80
100
120
140
160
180
200
0 0,1 0,2 0,3 0,4 0,5 0,6 0,7 0,8 0,9 1
Degree of hydration
Spec
ific
surf
ace
(m2 /g
)
Figure II:6.3: Fine fraction of LA/SR-cement. Specific surface calculated from first
desorption versus the degree of hydration.
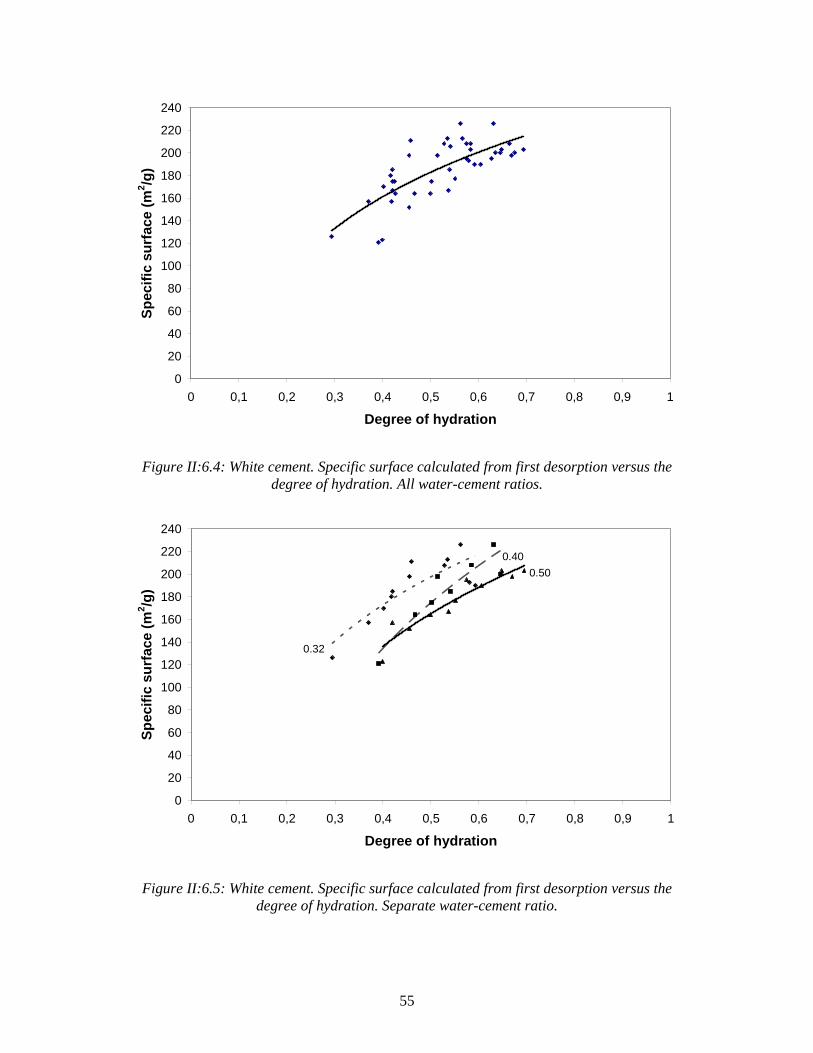
55
0
20
40
60
80
100
120
140
160
180
200
220
240
0 0,1 0,2 0,3 0,4 0,5 0,6 0,7 0,8 0,9 1
Degree of hydration
Spec
ific
surf
ace
(m2 /g
)
Figure II:6.4: White cement. Specific surface calculated from first desorption versus the degree of hydration. All water-cement ratios.
0
20
40
60
80
100
120
140
160
180
200
220
240
0 0,1 0,2 0,3 0,4 0,5 0,6 0,7 0,8 0,9 1
Degree of hydration
Spec
ific
surf
ace
(m2 /g
)
0.32
0.400.50
Figure II:6.5: White cement. Specific surface calculated from first desorption versus the degree of hydration. Separate water-cement ratio.
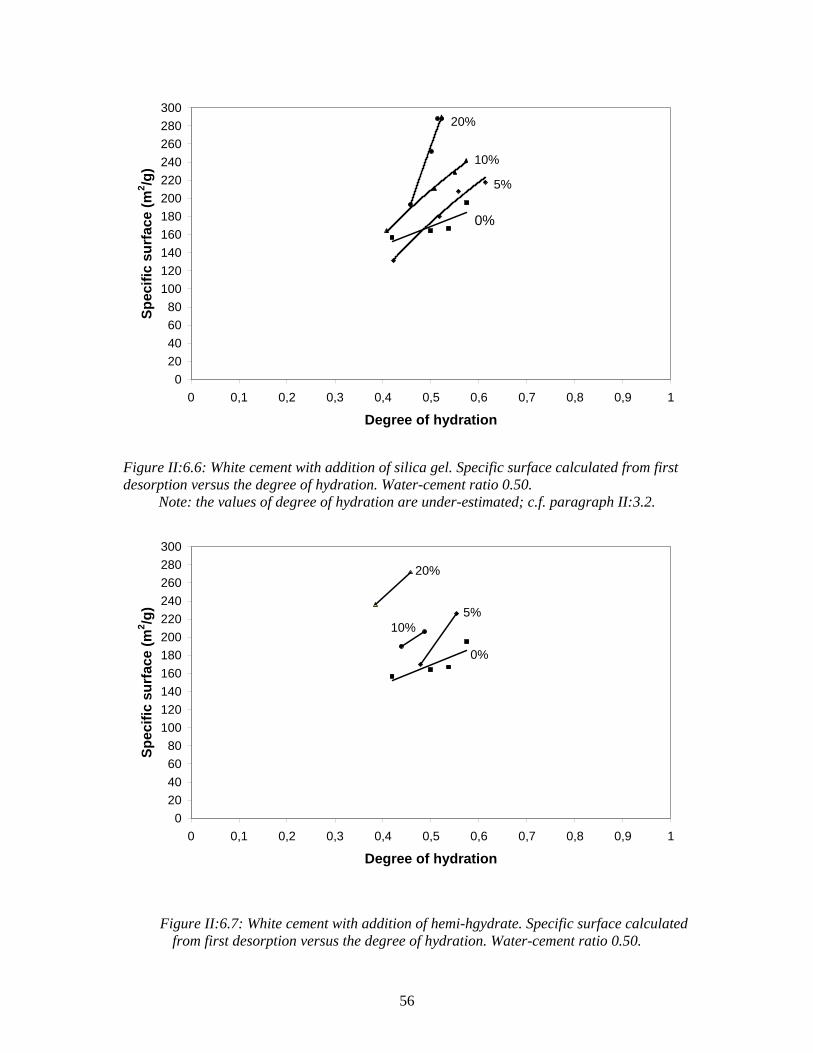
56
020406080
100120140160180200220240260280300
0 0,1 0,2 0,3 0,4 0,5 0,6 0,7 0,8 0,9 1
Degree of hydration
Spec
ific
surf
ace
(m2 /g
)
0%
5%
10%
20%
Figure II:6.6: White cement with addition of silica gel. Specific surface calculated from first desorption versus the degree of hydration. Water-cement ratio 0.50.
Note: the values of degree of hydration are under-estimated; c.f. paragraph II:3.2.
020406080
100120140160180200220240260280300
0 0,1 0,2 0,3 0,4 0,5 0,6 0,7 0,8 0,9 1
Degree of hydration
Spec
ific
surf
ace
(m2 /g
) 5%10%
20%
0%
Figure II:6.7: White cement with addition of hemi-hgydrate. Specific surface calculated
from first desorption versus the degree of hydration. Water-cement ratio 0.50.
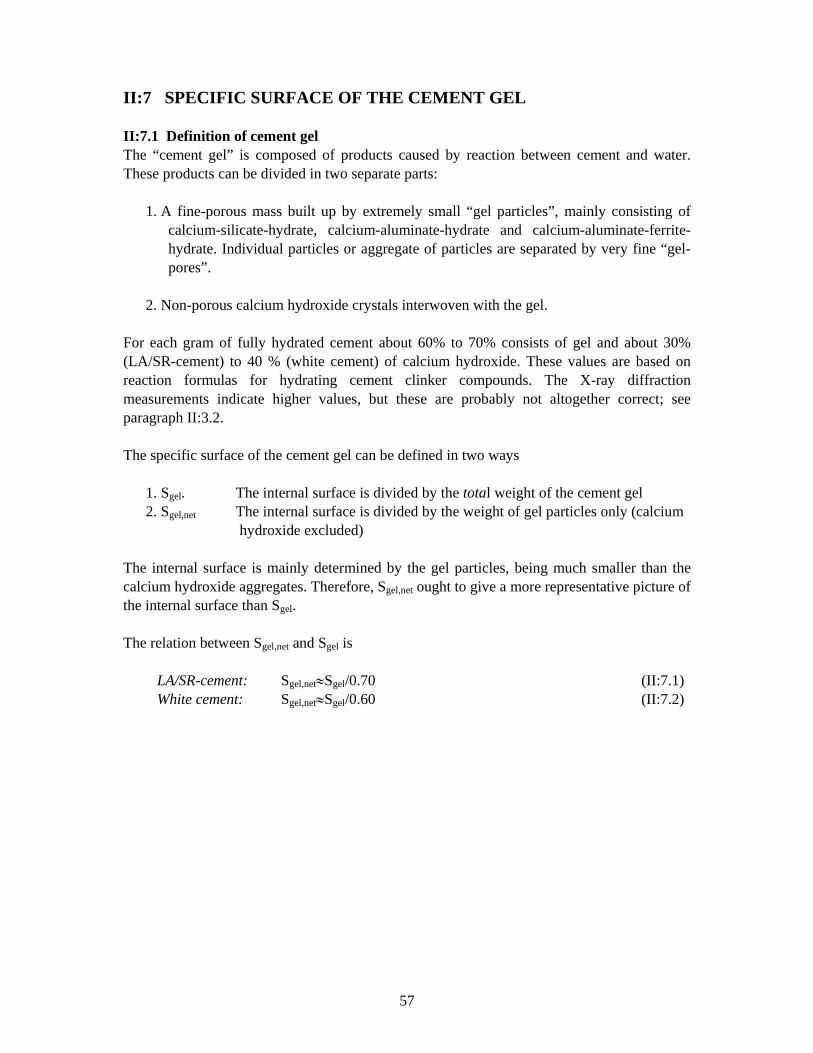
57
II:7 SPECIFIC SURFACE OF THE CEMENT GEL II:7.1 Definition of cement gel The “cement gel” is composed of products caused by reaction between cement and water. These products can be divided in two separate parts:
1. A fine-porous mass built up by extremely small “gel particles”, mainly consisting of calcium-silicate-hydrate, calcium-aluminate-hydrate and calcium-aluminate-ferrite-hydrate. Individual particles or aggregate of particles are separated by very fine “gel-pores”.
2. Non-porous calcium hydroxide crystals interwoven with the gel.
For each gram of fully hydrated cement about 60% to 70% consists of gel and about 30% (LA/SR-cement) to 40 % (white cement) of calcium hydroxide. These values are based on reaction formulas for hydrating cement clinker compounds. The X-ray diffraction measurements indicate higher values, but these are probably not altogether correct; see paragraph II:3.2. The specific surface of the cement gel can be defined in two ways
1. Sgel. The internal surface is divided by the total weight of the cement gel 2. Sgel,net The internal surface is divided by the weight of gel particles only (calcium hydroxide excluded)
The internal surface is mainly determined by the gel particles, being much smaller than the calcium hydroxide aggregates. Therefore, Sgel,net ought to give a more representative picture of the internal surface than Sgel. The relation between Sgel,net and Sgel is LA/SR-cement: Sgel,net≈Sgel/0.70 (II:7.1) White cement: Sgel,net≈Sgel/0.60 (II:7.2)
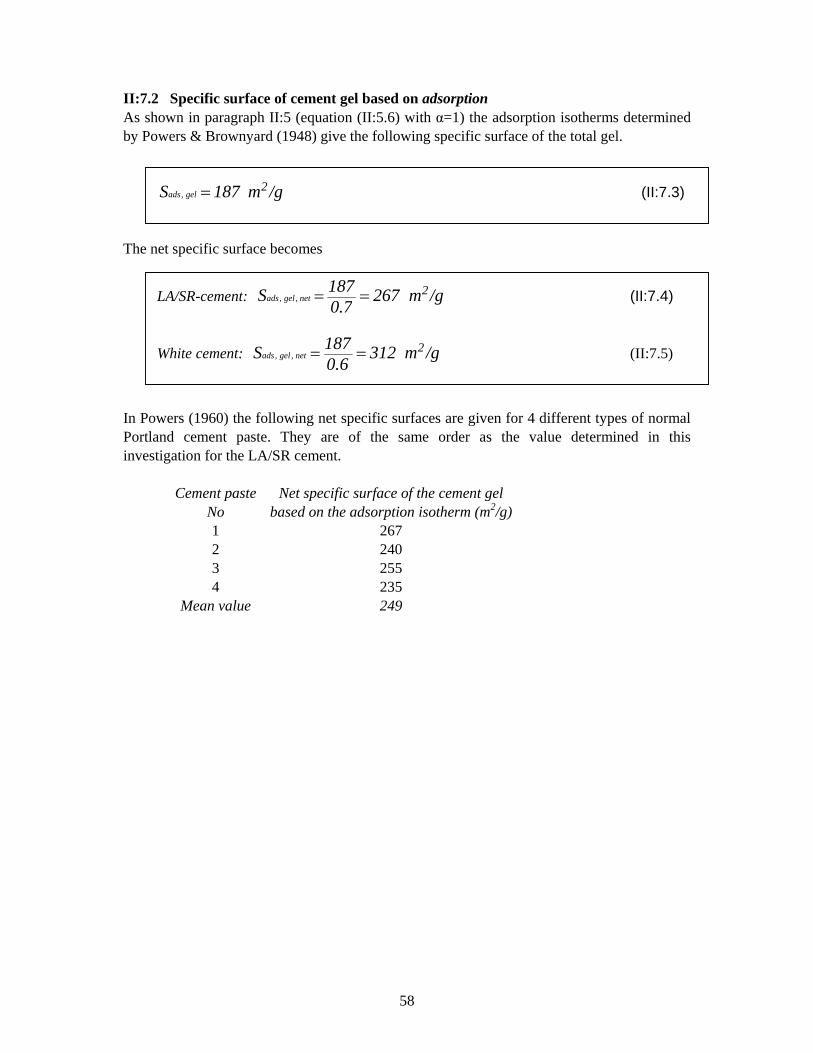
58
II:7.2 Specific surface of cement gel based on adsorption As shown in paragraph II:5 (equation (II:5.6) with α=1) the adsorption isotherms determined by Powers & Brownyard (1948) give the following specific surface of the total gel. /gm187S 2
gelads =, (II:7.3) The net specific surface becomes
LA/SR-cement: /gm2670.7187S 2
netgelads ==,, (II:7.4)
White cement: /gm3120.6187S 2
netgelads ==,, (II:7.5)
In Powers (1960) the following net specific surfaces are given for 4 different types of normal Portland cement paste. They are of the same order as the value determined in this investigation for the LA/SR cement.
Cement paste No
Net specific surface of the cement gel based on the adsorption isotherm (m2/g)
1 267 2 240 3 255 4 235
Mean value 249
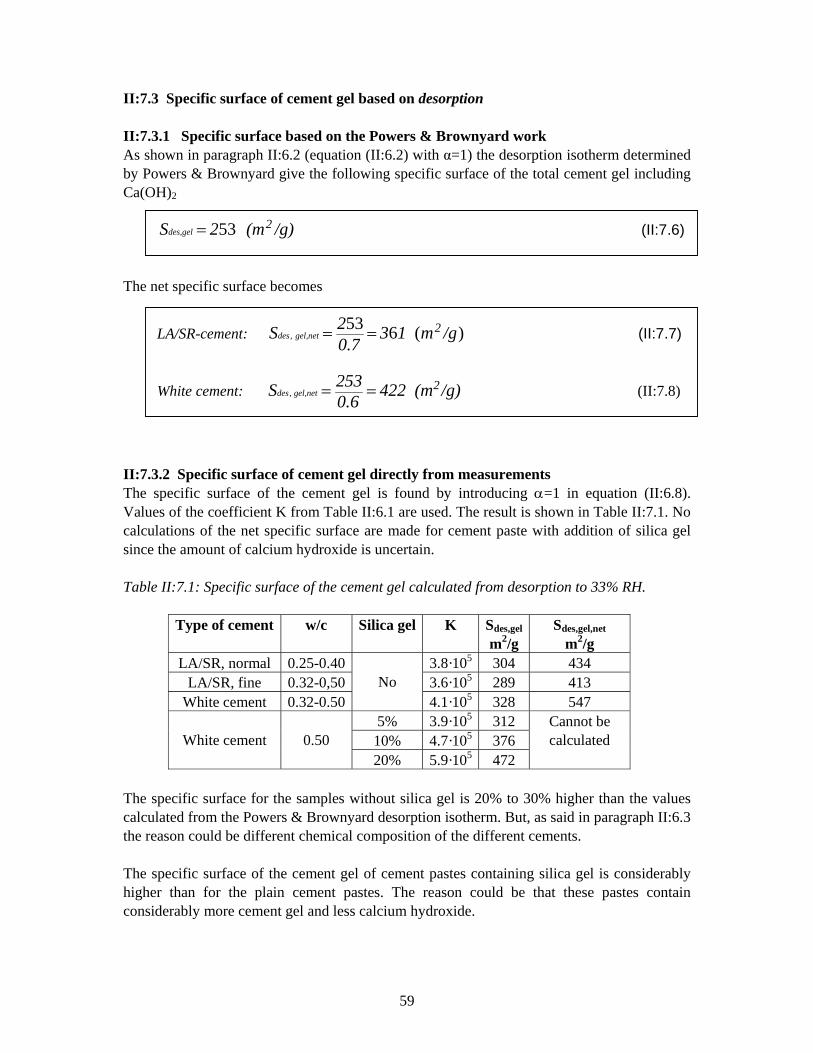
59
II:7.3 Specific surface of cement gel based on desorption II:7.3.1 Specific surface based on the Powers & Brownyard work As shown in paragraph II:6.2 (equation (II:6.2) with α=1) the desorption isotherm determined by Powers & Brownyard give the following specific surface of the total cement gel including Ca(OH)2 /g)(m2S 2
des,gel 53= (II:7.6) The net specific surface becomes
LA/SR-cement: )(653, /gm13
0.72S 2
gel,netdes == (II:7.7)
White cement: /g)(m4220.6253S 2
gel,netdes ==, (II:7.8)
II:7.3.2 Specific surface of cement gel directly from measurements The specific surface of the cement gel is found by introducing α=1 in equation (II:6.8). Values of the coefficient K from Table II:6.1 are used. The result is shown in Table II:7.1. No calculations of the net specific surface are made for cement paste with addition of silica gel since the amount of calcium hydroxide is uncertain. Table II:7.1: Specific surface of the cement gel calculated from desorption to 33% RH.
Type of cement w/c Silica gel K Sdes,gel
m2/g Sdes,gel,net
m2/g LA/SR, normal 0.25-0.40 3.8·105 304 434
LA/SR, fine 0.32-0,50 3.6·105 289 413 White cement 0.32-0.50
No
4.1·105 328 547 5% 3.9·105 312 10% 4.7·105 376
White cement
0.50
20% 5.9·105 472
Cannot be calculated
The specific surface for the samples without silica gel is 20% to 30% higher than the values calculated from the Powers & Brownyard desorption isotherm. But, as said in paragraph II:6.3 the reason could be different chemical composition of the different cements. The specific surface of the cement gel of cement pastes containing silica gel is considerably higher than for the plain cement pastes. The reason could be that these pastes contain considerably more cement gel and less calcium hydroxide.

60
II:8 STRUCTURE OF THE CEMENT GEL II:8.1 Size of gel particles including calcium hydroxide According to Powers (1960) the cement gel is composed of plate-like crystals separated by pores. The specific surface of such crystals is Sgel=2/(t·ρgel) (m2/kg) (II:8.1) or
gelgel ρS
2t⋅
= (m) (II:8.1´)
Where t (m) is the thickness of the particles, and ρgel (kg/m3) the density of the particles. Note: Sgel must be expressed in m2/kg and not in m2/g as given by the equations above. The weight of the cement paste is given by equation (II:5.2) expressed as Qdry,paste=c(1+0.25·α) (g) (II:5.2) The volume of the cement paste is composed of the total volume of hydrated cement and chemically bound water Vpaste=vc·α·c + vwn·0.25·α·c (cm3) (II:8.2) Where vc and vwn are the specific volumes of cement and chemically bound water. vc≈0.32 cm3/g and vwn≈0.75 cm3/g. Inserting these values gives Vpaste=c(0.32+0.19·α) (cm3) (II:8.3) The density of the cement paste becomes ρpaste´=(1+0.25·α)/(0.32+0.19·α) (g/cm3) (II:8.4) Inserting α=1 gives the density of the gel ρgel´=1.25/(0.32+0.19)=2.45 g/cm3 (ρgel=2450 kg/m3) (II:8.5)
0245S
2tgel ⋅
= (m) (II:8.1´)
The thickness of the gel particles are obtained by inserting the calculated specific surface from equations (II:7.3), (II:7.6), and Table II:7.1 into equation (II:8.1´).
61
1. From Powers & Brownyard adsorption, equation (II:7.3), Sgel=187·103 m2/kg t=2/(187·103·2450)=4.4·10-9 m (44Å) 2. From Powers & Brownyard desorption, equation (II:7.6), Sgel=253·103 m2/kg t=2/(253·103·2450)=3.2·10-9 m (32Å) 3. From Grudemo desorption, Table II:7.1 The calculated value depends on the type of cement (as shown by Table II:6.1, it is also to a certain extent dependent on the water-cement ratio). LA/SR-cement: Sgel=304·103 m2/kg t=2/(304·103·2450)=2.7·10-9 m (27 Å) White cement: Sgel=328·103 m2/kg t=2/(328·103·2450)=2.5·10-9 m (25 Å) All calculations based on desorption indicate that the mean size of gel particles are of the order 25 to 30 Å. It seems as if drying at +105ºC causes a coarsening of the gel structure. The average particle size is increased from about 25-30Å to about 45 Å. This indicates that hard drying causes a certain “collapse” of the gel structure. The calculated increase in particle size might however be apparent, and merely depend on difficulties to re-absorb water in the very narrow gel-pores.
Note: If the gel particles are supposed to be spherical the particle diameter (d) will be 3 times the plate thickness calculated above:
gelgel ρS
6d⋅
= (II.8.1´´)
Powers & Brownyard adsorption: d=132 Å Powers & Brownyard desorption: d=96 Å Grudemo desorption, LA/SR: d=81 Å Grudemo desorption, WhC: d=75 Å
62
II:8.2 Size of gel particles not including calcium hydroxide The density of calcium hydroxide is 2.24 g/cm3. The density of the entire gel including calcium hydroxide is 2.45 g/cm3. Then, the following density is valid for the CSH-particles: LA/SR-cement (30% CH): ρCSH=2.55 g/cm3 White cement (40% CH): ρCSH=2.61 g/cm3 Calcium hydroxide is assumed to have negligible inner surface compared to the CSH-gel. Then, the thickness of the CSH-particles becomes
CSHnetgel ρS
2t⋅
=,
(m) (II:8.6)
The thickness of the gel particles are obtained by inserting the calculated net specific surface from equations (II:7.4), (II:7.5), (II:7.7), (II:7.8) and Table II:7.1 into equation (II:8.6). The result will depend on the type of cement. LA/SR-cement 1. From Powers & Brownyard adsorption, equation (II:7.4), Sgel,net=267·103 m2/kg t=2/(267·103·2550)=2.9·10-9 m (29Å) 2. From Powers & Brownyard desorption, equation (II:7.7), Sgel,net=361·103 m2/kg t=2/(361·103·2550)=2.2·10-9 m (22Å) 3. From Grudemo desorption, Table II:7.1. Sgel,net=434·103 m2/kg t=2/(434·103·2550)=1.8·10-9 m (18 Å) White cement 1. From Powers & Brownyard adsorption, equation (II:7.5), Sgel,net=312·103 m2/kg t=2/(312·103·2610)=2.5·10-9 m (25Å) 2. From Powers & Brownyard desorption, equation (II:7.8), Sgel,net=434·103 m2/kg t=2/(434·103·2610)=1.8·10-9 m (18Å) 3. From Grudemo desorption, Table II:7.1. Sgel,net=547·103 m2/kg t=2/(547·103·2610)=1.4·10-9 m (14 Å) The particle sizes calculated above are considerably smaller than if the entire gel is looked upon as one single homogeneous phase. It must be considered, however, that the calculation might not be altogether correct. Possibly it is wrong to separate all calcium hydroxide from the gel and consider it to have negligible area.
Note: If the gel particles are supposed to be spherical the particle diameter (d) will be 3 times the plate thickness calculated above, see equation (II:8.1´´)
63
II:8.3 Size of gel pores including calcium hydroxide The porosity of the cement gel (Pgel) is of the order 28%, Powers (1960). The gel pores being located between individual gel particles are slit like. The specific surface of slit like pores is Sgel=2·Pgel/[ρgel(1-Pgel)d] (m2/kg) (II:8.6) or
)P(1ρS
P2dgelgelgel
gel
−⋅⋅⋅= (m) (II:8.7)
Where Pgel is the gel porosity (-) and d (m) is the width of the pores. Inserting Pgel=0.28 and ρgel=2450 kg/m3 gives
gelS
4103.17d−⋅= (m) (II:8.7´)
The width of the gel pores is obtained by inserting calculated specific surface from equations (II:7.3), (II:7.6), and Table II:7.1 into equation (II:8.7´). 1. From Powers & Brownyard adsorption, equation (II:7.3), Sgel=187·103 m2/kg d=3.17·10-4/187·103=1.7·10-9 m (17 Å) 2. From Powers & Brownyard desorption, equation (II:7.6), Sgel=253·103 m2/kg d=3.17·10-4/253·103=1.3·10-9 m (13 Å) 3. From Grudemo desorption, Table II:7.1 The calculated value depends on the type of cement (as shown by Table II:6.1, it is also to a certain extent dependent on the water-cement ratio). LA/SR-cement: Sgel=304·103 m2/kg d=3.17·10-4/304·103=1.0·10-9 m (10 Å) White cement: Sgel=328·103 m2/kg d=3.17·10-4/328·103=1.0·10-9 m (10 Å) All calculations based on desorption indicate that the mean width of gel pores is of the order 10 Å. Thus, about 3-4 water molecule layers can be contained in gel pores. Drying to +105ºC before the adsorption isotherm is determined causes a coarsening of the pores from about 10 Å to about 17 Å. The reason might be a more or less permanent decrease in the gel porosity. Theoretically, the size of the remaining gel pores is unchanged (10Å), provided the gel porosity is reduced from 28% to 18% due to drying.
64
II:8.4 Size of gel pores not including calcium hydroxide In the calculation above the total cement gel including calcium hydroxide was considered. The calculated gel pore size might become smaller if calcium hydroxide is excluded. An approximate calculation will be made. It is assumed that all gel pores are located in the CSH-gel. Thus the porosity 28% valid for the total gel will be increased to PCSH=0.28/VCSH (II:8.8) Where PCSH is the porosity of the CSH-gel and VCSH is the volume fraction of CSH-gel. The porosity will be somewhat different for different types of cement LA/SR-cement: PCSH=0.40 White cement: PCSH=0.46 The gel pore size becomes
)P(1ρS
P2dCSHCSHnetgel
CSH
−⋅⋅⋅=
, (m) (II:8.9)
The pore width is obtained by inserting the calculated net specific surface from equations (II:7.4), (II:7.5), (II:7.7), (II:7.8) and Table II:7.1 into equation (II:8.6). The result will depend on the type of cement. LA/SR-cement 1. From Powers & Brownyard adsorption, equation (II:7.3), Sgel,net=267·103 m2/kg d=2·0.40/[(267·103·2550·(1-0.40)]=2.0·10-9 m (20 Å) 2. From Powers & Brownyard desorption, equation (II:7.6), Sgel,net=361·103 m2/kg d=2·0.40/[(361·103·2550·(1-0.40)]=1.4·10-9 m (14 Å) 3. From Grudemo desorption, Table II:7.1, Sgel,net=434·103 m2/kg d=2·0.40/[(434·103·2550·(1-0.40)]=1.2·10-9 m (12 Å) White cement 1. From Powers & Brownyard adsorption, equation (II:7.5), Sgel,net=312·103 m2/kg d=2·0.46/[(312·103·2610·(1-0.46)]=2.1·10-9 m (21Å) 2. From Powers & Brownyard desorption, equation (II:7.8), Sgel,net=434·103 m2/kg d=2·0.46/[(434·103·2610·(1-0.46)]=1.5·10-9 m (15Å) 3. From Grudemo desorption, Table II:7.1. Sgel,net=547·103 m2/kg d=2·0.46/[(547·103·2610·(1-0.46)]=1.2·10-9 m (12 Å)
65
Calculations based on desorption indicate that the mean width of gel pores is of the order 12-15 Å. This corresponds to about 4-5 water molecule layers.

66

67
REFERENCES Publications by Åke Grudemo.
Grudemo, Å. (1954): An x-ray examination of the structure of vermiculites. Swedish Cement and Concrete Research Institute. Proceedings No22. (In Swedish)
Grudemo, Å. (1955): An electronographic study of the morphology and crystallization
properties of calcium silicate hydrates. Swedish Cement and Concrete Research Institute. Proceedings No 26.
Grudemo, Å. (1956): The silicate-water system: analogies between the
montmorillonoids and the calcium silicate hydrates of the tobermorite group: some experimental data for the sorption of water in montmorillonite. Swedish Cement and Concrete Research Institute. Note on research in progress, No5.
Grudemo, Å., Copeland, L.E. (1960): Portland cement + water. Kemisk Tidskrift
(Chemical Journal) 1969:10. (In Swedish) Grudemo, Å. (1965): The microstructure of cement gel phases. Royal Institute of
Technology, Stockholm. Proceedings No 242. Grudemo, Å. (1975A): On the use of dielectric methods for rapid measurements of
capillary porosity in saturated cement pastes. Paper presented at RILEM/IUPAC Symposium Pore Structure and Properties of Materials. Prague, Sept 18 to 21,1973. Swedish Cement and Concrete Research Institute. Report 11:75, Stockholm 1975.
Grudemo, Å. (1975B): On the development of hydrate crystal morphology in silicate
cement binders. Paper presented at RILEM-d´INSA Symposium, Toulose. Swedish Cement and Concrete Research Institute. Report 09:75, Stockholm 1975.
Grudemo, Å. (1975C): On the role of pore size and shape in strength-structure
relationships of cement pastes. Paper presented at RILEM/IUPAC Symposium Pore Structure and Properties of Materials. Prague, Sept 18 to 21,1973. Swedish Cement and Concrete Research Institute. Report 11:75, Stockholm 1975.
Grudemo, Å. (1975D): Strength versus structure in cement pastes. Paper presented at
the 6th International Symposium on the Chemistry of Cement. Moscow, Sept 23 to27, 1974. Swedish Cement and Concrete Research Institute. Report 13:75, Stockholm 1975.
68
Grudemo, Å. (1977): Strength-structure relationships of cement paste materials. Part 1. Methods and basic data for studying phase composition and microstructure. Swedish Cement and Concrete Research Institute. Research 6:77, Stockholm 1977.
Grudemo, Å. (1979): Strength-structure relationships of cement paste materials. Part 2.
Methods and basic data for studying strength and failure properties. Swedish Cement and Concrete Research Institute. Research 8:79, Stockholm 1979.
Grudemo, Å., Fagerlund, G. (1982): Mechanical properties of model cement mortars in
relation to phase composition. Swedish Cement and Concrete Research Institute. Research No 06:1982.
Grudemo. Å. (1986A): The crystal structure of cement hydration – a review and a new
gel structure model. Nordic Concrete Research, 1984. Grudemo, Å. (1986B): The dielectric properties of partially-dried pastes at audio to
radio frequencies. Swedish Cement and Concrete Research Institute. Research No 02:1986.
Grudemo, Å. (1986C): Fresh cement pastes-influence of admixtures and additives.
Swedish Cement and Concrete Research Institute. Research No 01:1986. Other references
Powers, T.C., Brownyard, T.L. (1948): Studies of the physical properties of hardened Portland cement paste. Research Laboratories of the Portland Cement Association. Bulletin 22, Chicago.
Powers, T.C. (1960): Physical properties of cement paste. Proceedings of the 4th
International Symposium on the Chemistry of Cement, Washington D.C. (Published as National Bureau of Standards, Monograph 43, Vol II, Washington D.C.,1962)
Danielsson, U. (1974): An apparatus for easy determination of the amount of bound
water in cement pastes yielding highly reproducible results. Matériaux et Constructions, 7:40.
Helsing-Atlassi,E.(1993): A quantitative thermogravimetric study on the nonevaporable
water in mature silica fume concrete. Chalmers University of Technology, Div. of Building Materials, Dissertation P-93:6.
Fagerlund, G. (1998): Moisture and pores, Part I: Specific area. Adsorption. Text Book
on Advanced Course in Building Materials. Div. of Building Materials, Lund Institute of Technology, Lund.

69
APPENDIX TO PART I

70

71
AI.1 Tables. Porosity data

72
Table AI.1. Porosity. Cement pastes made with the ordinary cement Total porosity Coarse porosity
(w/c)o from
recipe
Age α (w/c) sat,o (w/c)o true
value Eq (4.6)
Measured
Calculated Eq (6.10)
Meas. Adsorpt. isotherm Eq(7.10)
Desorpt. isotherm Eq(7.14)
Cap.
Eq(7.20) 18-22h 0.37 0.61 0.59 0.57 0.57 0.53 0.53 0.52 0.49
5d 0.42 0.61 0.58 0.55 0.56 0.46 0.51 0.50 0.46 0.80 Hand mixed 27d 0.60 0.62 0.58 0.52 0.52 0.42 0.46 0.44 0.38
18-22h 0.33 0.58 0.56 0.57 0.57 0.53 0.53 0.52 0.49
5d 0.50 0.60 0.57 0.54 0.53 0.45 0.48 0.47 0.42 0.80
27d 0.57 0.61 0.57 0.53 0.52 0.43 0.46 0.44 0.39
18-20h 0.23 0.55 0.54 0.58 0.58 0.51 0.55 0.55 0.52
5d 0.51 0.56 0.53 0.51 0.51 0.43 0.46 0.44 0.39
0.63 30d 0.64 0.57 0.53 0.49 0.48 0.39 0.41 0.39 0.33
18-20h 0.28 0.49 0.47 0.53 0.53 0.47 0.50 0.49 0.46
5d 0.50 0.50 0.47 0.48 0.47 0.39 0.42 0.40 0.35
0.50 30d 0.69 0.51 0.47 0.43 0.43 0.32 0.35 0.32 0.25
18-22h 0.33 0.41 0.39 0.44 0.46 0.37 0.42 0.41 0.37
7d 0.53 0.42 0.39 0.41 0.41 0.31 0.34 0.32 0.26
0.40 30d 0.72 0.43 0.39 0.36 0.36 0.27 0.27 0.23 0.15
20h 0.26 0.40 0.38 0.50 0.47 0.43 0.44 0.43 0.40 5d 0.51 0.43 0.40 0.42 0.42 0.32 0.36 0.34 0.28
0.40
30d 0.74 0.44 0.39 0.36 0.35 0.26 0.26 0.23 0.14
18-20h 0.30 0.33 0.31 0.41 0.40 0.35 0.36 0.34 0.31 7d 0.60 0.36 0.32 0.32 0.32 0.24 0.24 0.21 0.13
0.32
30d 0.72 0.36 0.32 0.29 0.29 0.21 0.19 0.15 0.06
20h 0.26 0.34 0.32 0.43 0.42 0.36 0.39 0.37 0.34 5d 0.52 0.36 0.33 0.36 0.36 0.25 0.28 0.26 0.20
0.32
30d 0.71 0.37 0.33 0.29 0.30 0.20 0.20 0.17 0.08 Table AI.2. Porosity. Cement pastes made with the fine cement fraction (<37µm)
Total porosity Coarse porosity
(w/c)o from
recipe
Age α (w/c) sat,o (w/c)o true
value Eq (4.6)
Measur.
Calculated Eq (6.10)
Meas. Adsorpt. isotherm Eq(7.10)
Desorpt isotherm Eq(7.14)
Cap.
Eq(7.20) 18-20h 0.22 0.41 0.40 0.50 0.50 0.43 0.47 0.46 0.44
5d 0.53 0.44 0.41 0.42 0.42 0.31 0.36 0.34 0.28
0.40 30d 0.81 0.44 0.39 0.34 0.33 0.22 0.23 0.20 0.10
18-20h 0.24 0.49 0.48 0.55 0.54 0.49 0.52 0.51 0.48
5d 0.53 0.51 0.48 0.48 0.47 0.38 0.41 0.39 0.34
0.50 30d 0.81 0.54 0.49 0.42 0.41 0.32 0.32 0.29 0.21
18-20h 0.42 0.34 0.31 0.43 0.37 0.36 0.31 0.29 0.23
5d 0.61 0.36 0.32 0.32 0.32 0.21 0.23 0.20 0.13
0.32 30d 0.72 0.37 0.33 0.29 0.30 0.15 0.20 0.16 0.09
20h 0.28 0.26 0.24 0.34 0.33 0.26 0.29 0.27 0.23 5d 0.51 0.27 0.24 0.25 0.26 0.14 0.17 0.15 0.07
0.25
30d 0.61 0.28 0.24 0.22 0.22 0.10 0.12 0.09 0.004

73
Table AI.3. Porosity. Cement pastes made with the coarse cement fraction (>37µm) Total porosity Coarse porosity (w/c)o
from recipe Age α (w/c) sat,o (w/c)o
true value Eq (4.6)
Measured
Calculated Eq (6.10)
Meas. Adsorpt. isotherm Eq(7.10)
Desorpt. isotherm Eq(7.14)
Cap.
Eq(7.20) 18-20h 0.12 0.30 0.29 0.44 0.44 0.41 0.42 0.41 0.40
5d 0.27 0.29 0.27 0.38 0.37 0.32 0.33 0.32 0.28
0.32 30d 0.32 0.28 0.26 0.36 0.34 0.25 0.29 0.28 0.23
20h 0.09 0.25 0.24 0.40 0.40 0.37 0.38 0.38 0.37 5d 0.25 0.24 0.22 0.32 0.32 0.25 0.28 0.26 0.23
0.25
30d 0.40 0.24 0.22 0.25 0.27 0.14 0.20 0.18 0.12 Table AI.4. Porosity. Cement pastes made with the ordinary cement with aerosil added for stabilization.
Total porosity Coarse porosity (w/c)o from recipe
Age α (w/c) sat,o (w/c)o true value Eq (4.6)
Measured
Calculated Eq (6.10)
Meas. Adsorpt. isotherm Eq(7.10)
Desorpt. isotherm Eq(7.14)
Cap.
Eq(7.20) 18-22h 0.31 0.98 0.96 0.72 0.70 0.66 0.68 0.67 0.66
5d 0.55 1.01 0.98 0.68 0.67 0.59 0.64 0.62 0.59
1.00 30d 0.75 1.02 0.97 0.65 0.64 0.56 0.59 0.57 0.53
18-22h 0.32 0.79 0.77 0.66 0.65 0.59 0.62 0.62 0.59
5d 0.53 0.82 0.79 0.62 0.62 0.53 0.58 0.56 0.53
0.80 30d 0.74 0.84 0.79 0.59 0.59 0.47 0.52 0.51 0.45
20h 0.30 0.63 0.61 0.61 0.59 0.54 0.57 0.56 0.53 5d 0.54 0.66 0.63 0.56 0.56 0.47 0.50 0.49 0.44
0.63
30d 0.74 0.68 0.63 0.52 0.52 0.42 0.44 0.42 0.36
20h 0.28 0.50 0.48 0.54 0.53 0.47 0.50 0.49 0.46 5d 0.53 0.53 0.50 0.49 0.49 0.41 0.43 0.41 0.36
0.50
30d 0.73 0.54 0.49 0.44 0.43 0.33 0.35 0.33 0.25
Table AI.5. Porosity. Compact made with the ordinary cement. Total porosity Coarse porosity (w/c)o
from recipe Age α (w/c) sat,o (w/c)o
true value Eq (4.6)
Measured
Calculated Eq (6.10)
Measured Adsorpt. isotherm Eq(7.10)
Desorpt. isotherm Eq(7.14)
Cap.
Eq(7.20) 6h 0.18 0.20 0.19 0.30 0.30 0.27 0.27 0.26 0.23 12h 0.32 0.21 0.19 0.25 0.25 0.20 0.20 0.18 0.13 1d 0.42 0.21 0.18 0.21 0.20 0.15 0.12 0.10 0.03 2d 0.48 0.21 0.18 0.19 0.18 0.13 0.09 0.06 0 4d 0.49 0.22 0.19 0.20 0.19 0.13 0.10 0.07 0
≈ 0.18
10d 0.53 0.22 0.19 0.17 0.17 0.12 0.08 0.05 0

74

75
AI.2 Specific surface of cement paste based on porosity data in Part I
Based on first desorption to 33% RH

76
Analysis of data The water content at desorption to 33% RH is W33,des=(Q33-Q105)/Q105=Q33/Q105-1 (kg/kg) (AI.1) The specific surface becomes -see equation (II:6.1) in Part II. Sdes=2.57·106·W33,des =2.57·106 (Q33/Q105-1) (m2/kg) (AI.3) Thus, the specific surface can be calculated for each individual specimen. Unfortunately, however, individual data for Q33 and Q105 were not furnished to the present author. An alternative calculation of the water content at 33% RH can be made by directly using the measured total porosity (Ptot) and coarse porosity from desorption (P33,des). Data for these are known and listed in Tables AI.1-A1.5. The water content at equilibrium with 33% RH at desorption is w33,des=ρw(Ptot-P33,des)V (g) (AI.4) Where ρw is the density of water (1 g/cm3). The specimen volume is V=wo+0.32·c =c[(w/c)o+0.32] (cm3) (AI.5) The dry weight is Qdry=c(1+0.25·α) (g) (AI.6) The water content at equilibrium with 33% RH at desorption becomes W33,des=w33,des/Qdry (g/g or kg/kg) (AI.8) Inserting equations (AI.4) and (AI.6) gives W33,des=(Ptot-P33,des)[(w/c)o+0.32]/(1+0.25·α) (AI.9) The specific surface becomes
[ ]α⋅+
+−⋅=0.251
0.32cwPP102.57S odestotdes
6 )/()( ,33 (m2/kg) (AI.10)
The calculation involves a subtraction of two numbers that are of similar size. The value of these numbers (Ptot and P33,des) given in Tables I:A1.1-I:A1.5 are not precise enough for a reliable calculation of the specific surface of each individual cement paste, since they are only stated by two decimals. Instead the mean relation between the total number of observations
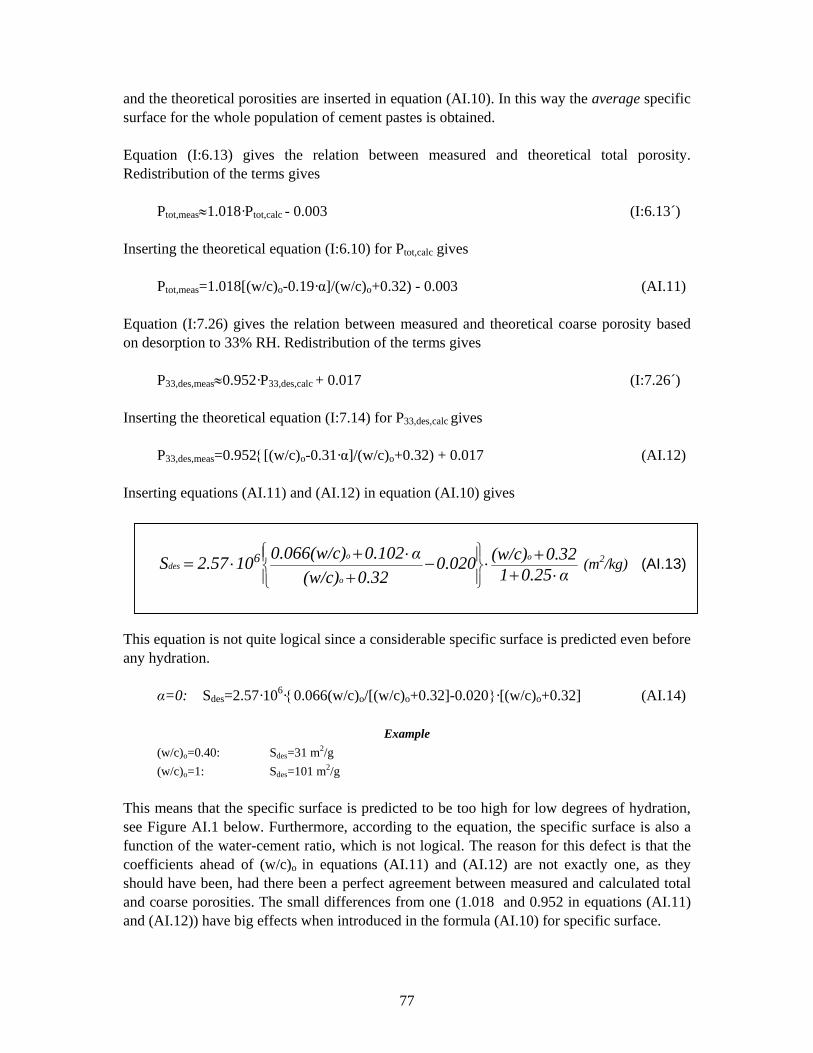
77
and the theoretical porosities are inserted in equation (AI.10). In this way the average specific surface for the whole population of cement pastes is obtained. Equation (I:6.13) gives the relation between measured and theoretical total porosity. Redistribution of the terms gives Ptot,meas≈1.018·Ptot,calc - 0.003 (I:6.13´) Inserting the theoretical equation (I:6.10) for Ptot,calc gives Ptot,meas=1.018[(w/c)o-0.19·α]/(w/c)o+0.32) - 0.003 (AI.11) Equation (I:7.26) gives the relation between measured and theoretical coarse porosity based on desorption to 33% RH. Redistribution of the terms gives P33,des,meas≈0.952·P33,des,calc + 0.017 (I:7.26´) Inserting the theoretical equation (I:7.14) for P33,des,calc gives P33,des,meas=0.952{[(w/c)o-0.31·α]/(w/c)o+0.32) + 0.017 (AI.12) Inserting equations (AI.11) and (AI.12) in equation (AI.10) gives
α0.251
0.32(w/c)0.0200.32(w/c)
α0.1020.066(w/c)102.57S o
o
odes
6⋅+
+⋅−+
⋅+⋅=⎪⎭
⎪⎬⎫
⎪⎩
⎪⎨⎧
(m2/kg) (AI.13)
This equation is not quite logical since a considerable specific surface is predicted even before any hydration. α=0: Sdes=2.57·106·{0.066(w/c)o/[(w/c)o+0.32]-0.020}·[(w/c)o+0.32] (AI.14)
Example (w/c)o=0.40: Sdes=31 m2/g (w/c)o=1: Sdes=101 m2/g This means that the specific surface is predicted to be too high for low degrees of hydration, see Figure AI.1 below. Furthermore, according to the equation, the specific surface is also a function of the water-cement ratio, which is not logical. The reason for this defect is that the coefficients ahead of (w/c)o in equations (AI.11) and (AI.12) are not exactly one, as they should have been, had there been a perfect agreement between measured and calculated total and coarse porosities. The small differences from one (1.018 and 0.952 in equations (AI.11) and (AI.12)) have big effects when introduced in the formula (AI.10) for specific surface.
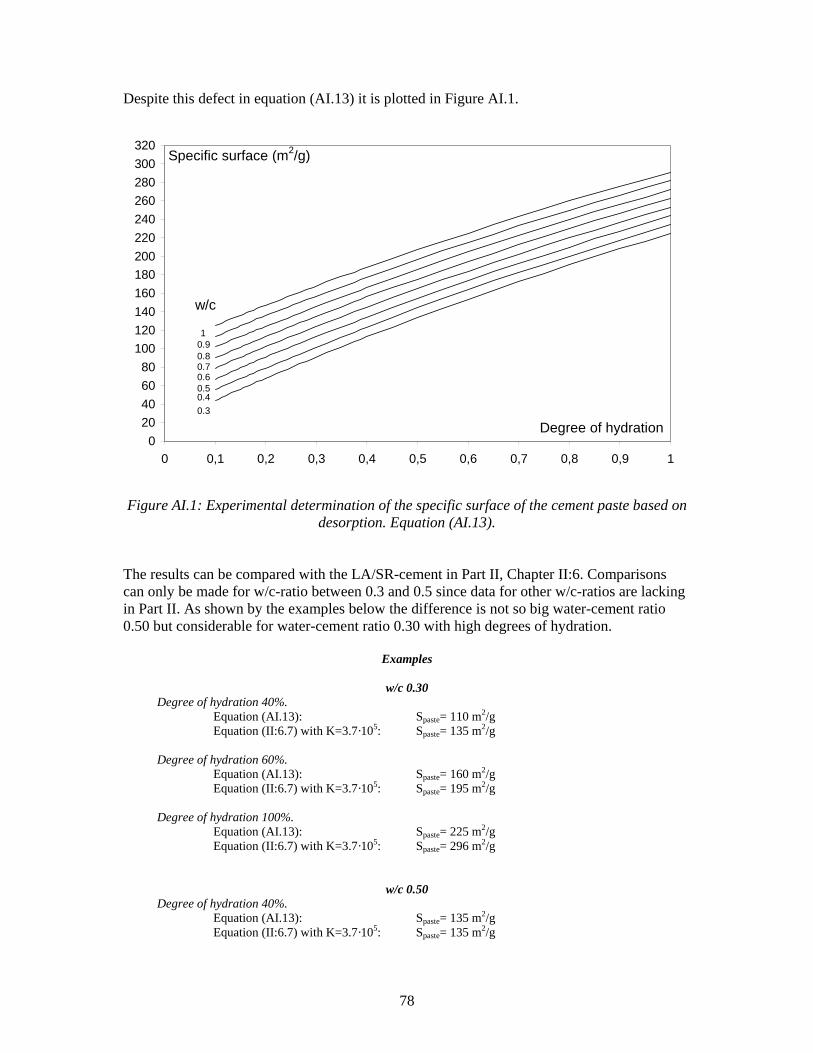
78
Despite this defect in equation (AI.13) it is plotted in Figure AI.1.
020406080
100120140160180200220240260280300320
0 0,1 0,2 0,3 0,4 0,5 0,6 0,7 0,8 0,9 1
Degree of hydration
Specific surface (m2/g)
10.90.80.70.6
0.40.3
0.5
w/c
Figure AI.1: Experimental determination of the specific surface of the cement paste based on
desorption. Equation (AI.13). The results can be compared with the LA/SR-cement in Part II, Chapter II:6. Comparisons can only be made for w/c-ratio between 0.3 and 0.5 since data for other w/c-ratios are lacking in Part II. As shown by the examples below the difference is not so big water-cement ratio 0.50 but considerable for water-cement ratio 0.30 with high degrees of hydration.
Examples
w/c 0.30 Degree of hydration 40%. Equation (AI.13): Spaste= 110 m2/g Equation (II:6.7) with K=3.7·105: Spaste= 135 m2/g Degree of hydration 60%. Equation (AI.13): Spaste= 160 m2/g Equation (II:6.7) with K=3.7·105: Spaste= 195 m2/g Degree of hydration 100%. Equation (AI.13): Spaste= 225 m2/g Equation (II:6.7) with K=3.7·105: Spaste= 296 m2/g
w/c 0.50 Degree of hydration 40%. Equation (AI.13): Spaste= 135 m2/g Equation (II:6.7) with K=3.7·105: Spaste= 135 m2/g
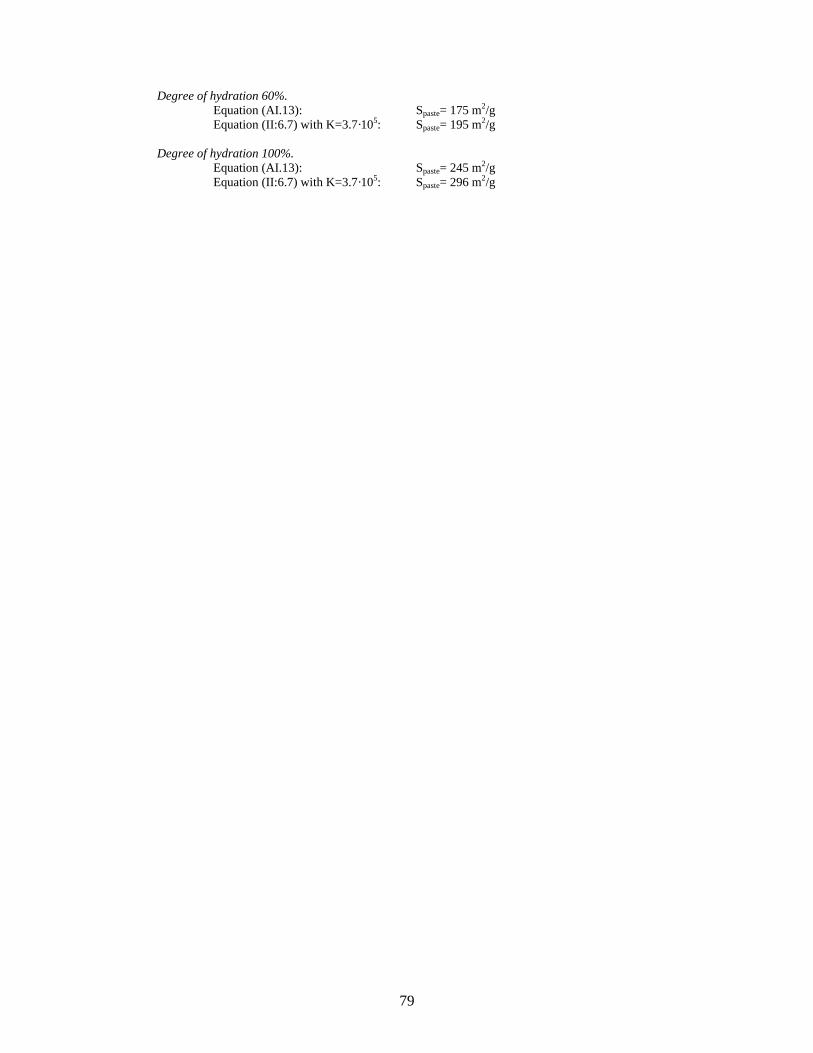
79
Degree of hydration 60%. Equation (AI.13): Spaste= 175 m2/g Equation (II:6.7) with K=3.7·105: Spaste= 195 m2/g Degree of hydration 100%. Equation (AI.13): Spaste= 245 m2/g Equation (II:6.7) with K=3.7·105: Spaste= 296 m2/g

80

81
AI.3 Specific surface of cement gel based on porosity data in
Part I
Based on first desorption to 33% RH
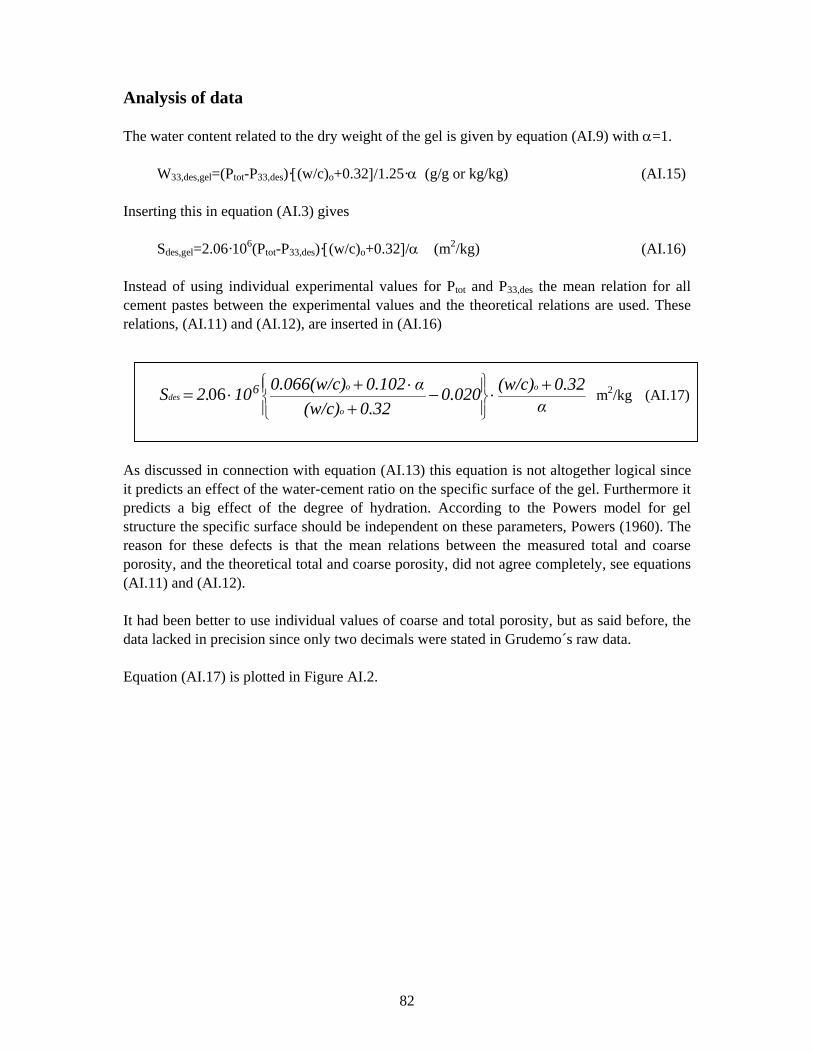
82
Analysis of data The water content related to the dry weight of the gel is given by equation (AI.9) with α=1. W33,des,gel=(Ptot-P33,des)·[(w/c)o+0.32]/1.25·α (g/g or kg/kg) (AI.15) Inserting this in equation (AI.3) gives Sdes,gel=2.06·106(Ptot-P33,des)·[(w/c)o+0.32]/α (m2/kg) (AI.16) Instead of using individual experimental values for Ptot and P33,des the mean relation for all cement pastes between the experimental values and the theoretical relations are used. These relations, (AI.11) and (AI.12), are inserted in (AI.16)
α
0.32(w/c)0.0200.32(w/c)
α0.1020.066(w/c)102.S o
o
odes
6 +⋅−+
⋅+⋅=⎪⎭
⎪⎬⎫
⎪⎩
⎪⎨⎧
06 m2/kg (AI.17)
As discussed in connection with equation (AI.13) this equation is not altogether logical since it predicts an effect of the water-cement ratio on the specific surface of the gel. Furthermore it predicts a big effect of the degree of hydration. According to the Powers model for gel structure the specific surface should be independent on these parameters, Powers (1960). The reason for these defects is that the mean relations between the measured total and coarse porosity, and the theoretical total and coarse porosity, did not agree completely, see equations (AI.11) and (AI.12). It had been better to use individual values of coarse and total porosity, but as said before, the data lacked in precision since only two decimals were stated in Grudemo´s raw data. Equation (AI.17) is plotted in Figure AI.2.
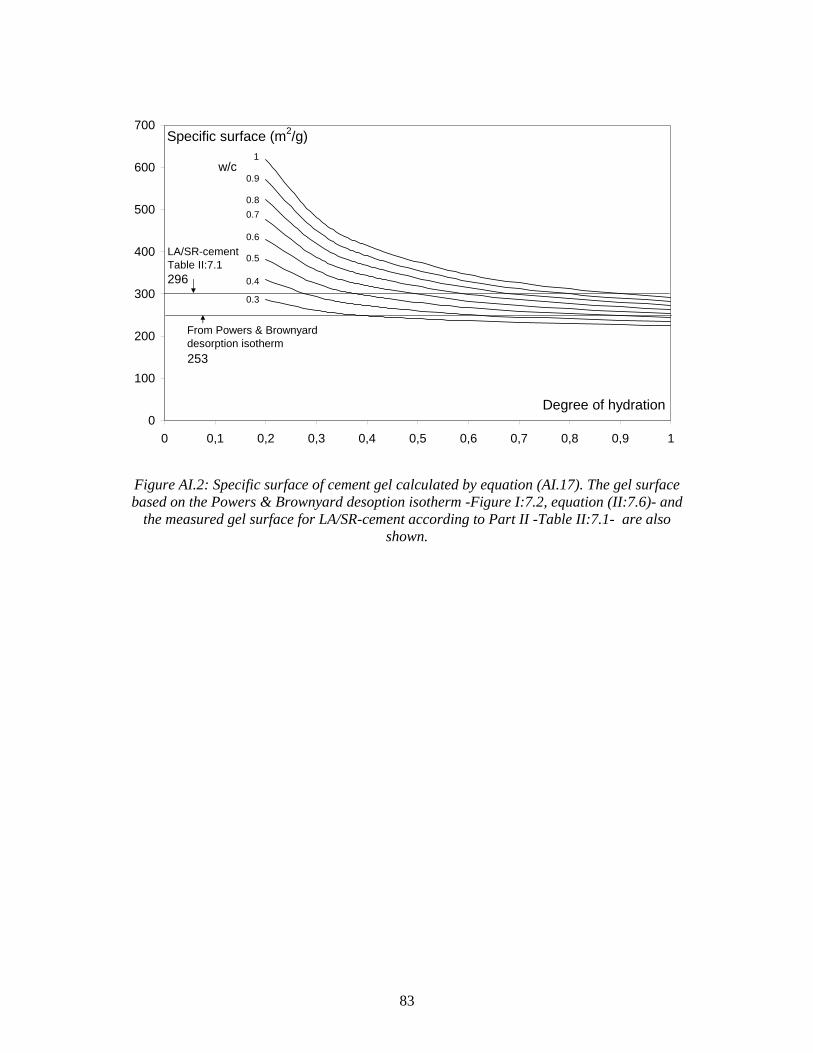
83
0
100
200
300
400
500
600
700
0 0,1 0,2 0,3 0,4 0,5 0,6 0,7 0,8 0,9 1
Degree of hydration
Specific surface (m2/g)1
0.9
0.80.7
0.6
0.5
0.4
0.3
w/c
From Powers & Brownyarddesorption isotherm253
LA/SR-cementTable II:7.1296
Figure AI.2: Specific surface of cement gel calculated by equation (AI.17). The gel surface based on the Powers & Brownyard desoption isotherm -Figure I:7.2, equation (II:7.6)- and
the measured gel surface for LA/SR-cement according to Part II -Table II:7.1- are also shown.

84

85
APPENDIX TO PART II

86

87
Tables. Specific surface data

88
Table AII.1: LA/SR Cement. Ordinary size distribution. No additives.
Ca(OH)2 (w/c)o Age days
α weight-%
of solid weight-%
of C
W33,des kg/kg
Spaste m2/g
1 0.339 13.8 15.0 0.051 131 2 0.380 13.3 14.6 0.058 149 3 0.369 15.2 16.6 0.060 154 4 0.402 14.7 16.2 0.063 162 6 0.417 14.1 15.6 0.065 167 8 0.447 16.2 18.0 0.069 177 12 0.458 17.0 18.9 0.061 157 20 0.457 15.7 17.5 0.061 157
0.25
28 0.473 16.7 18.7 0.060 154 1 0.364 17.1 18.7 0.049 126 2 0.409 19.5 21.5 0.057 146 3 0.449 17.8 19.8 0.063 162 4 0.458 17.1 19.1 0.065 167 6 0.480 15.9 17.8 0.069 177 8 0.492 19.6 22.0 0.071 182 12 0.518 20.9 23.6 0.063 162 20 0.543 19.3 21.9 0.068 175
0.32
28 0.587 22.7 26.0 0.068 175 1 0.364 22.1 24.1 0.050 129 2 0.402 20.3 22.3 0.055 141 3 0.448 24.6 27.4 0.061 157 4 0.453 21.3 23.7 0.064 164 6 0.494 21.7 24.4 0.070 180 8 0.514 22.6 25.5 0.070 180 12 0.535 22.5 25.5 0.065 167 20 0.559 23.0 26.2 0.069 177
0.40
28 0.598 25.3 29.1 0.070 180
Table AII.2: LA/SR Cement. Fine fraction (>37 µm).No additives.
Ca(OH)2 (w/c)o Age days
α weight-%
of solid weight-%
of C
W33,des
kg/kg
Spaste m2/g
2 0.444 21.5 23.9 0.057 146 4 0.497 21.2 23.8 0.062 159 8 0.524 17.9 20.2 0.065 167
0.32
16 0.561 19.7 22.5 0.069 177 2 0.453 21.5 23.9 0.057 146 4 0.519 22.9 25.9 0.062 159 8 0.554 23.2 26.4 0.068 175
0.40
16 0.605 20.9 24.1 0.071 182 2 0.443 26.2 29.1 0.055 141 4 0.520 28.6 32.3 0.064 164 8 0.569 23.9 27.3 0.068 175
0.50
16 0.618 26.5 30.5 0.070 180
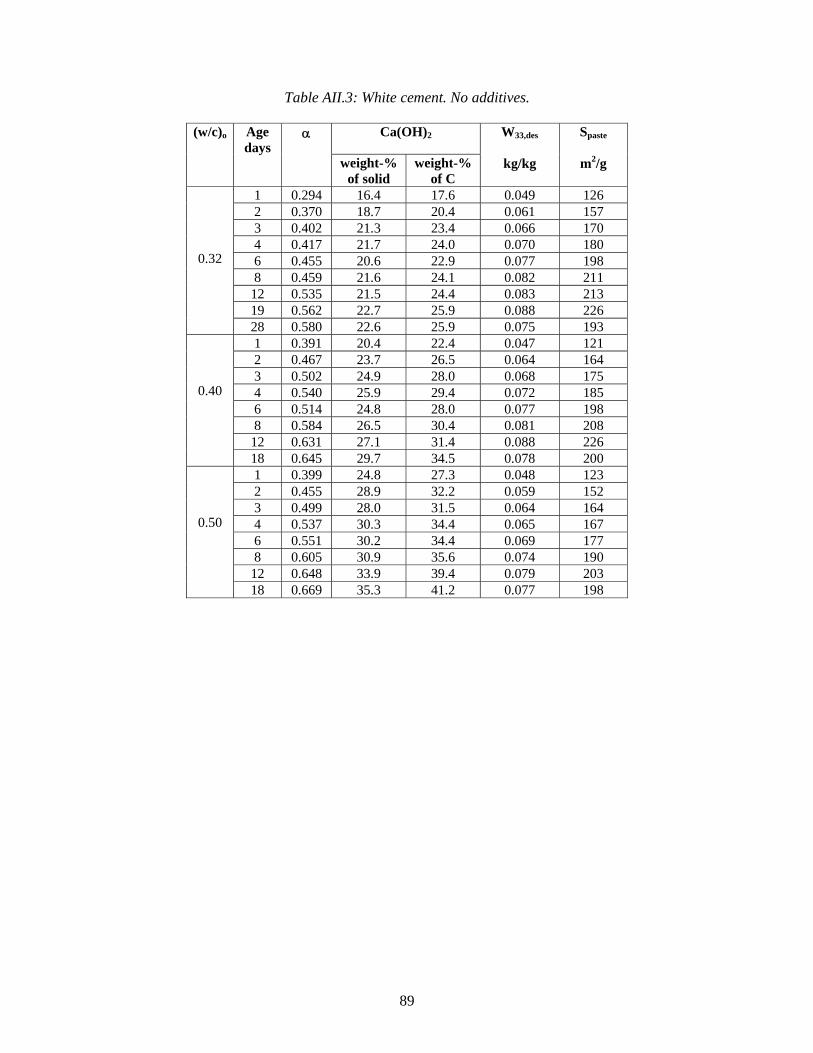
89
Table AII.3: White cement. No additives.
Ca(OH)2 (w/c)o Age days
α
weight-% of solid
weight-% of C
W33,des
kg/kg
Spaste
m2/g
1 0.294 16.4 17.6 0.049 126 2 0.370 18.7 20.4 0.061 157 3 0.402 21.3 23.4 0.066 170 4 0.417 21.7 24.0 0.070 180 6 0.455 20.6 22.9 0.077 198 8 0.459 21.6 24.1 0.082 211 12 0.535 21.5 24.4 0.083 213 19 0.562 22.7 25.9 0.088 226
0.32
28 0.580 22.6 25.9 0.075 193 1 0.391 20.4 22.4 0.047 121 2 0.467 23.7 26.5 0.064 164 3 0.502 24.9 28.0 0.068 175 4 0.540 25.9 29.4 0.072 185 6 0.514 24.8 28.0 0.077 198 8 0.584 26.5 30.4 0.081 208 12 0.631 27.1 31.4 0.088 226
0.40
18 0.645 29.7 34.5 0.078 200 1 0.399 24.8 27.3 0.048 123 2 0.455 28.9 32.2 0.059 152 3 0.499 28.0 31.5 0.064 164 4 0.537 30.3 34.4 0.065 167 6 0.551 30.2 34.4 0.069 177 8 0.605 30.9 35.6 0.074 190 12 0.648 33.9 39.4 0.079 203
0.50
18 0.669 35.3 41.2 0.077 198
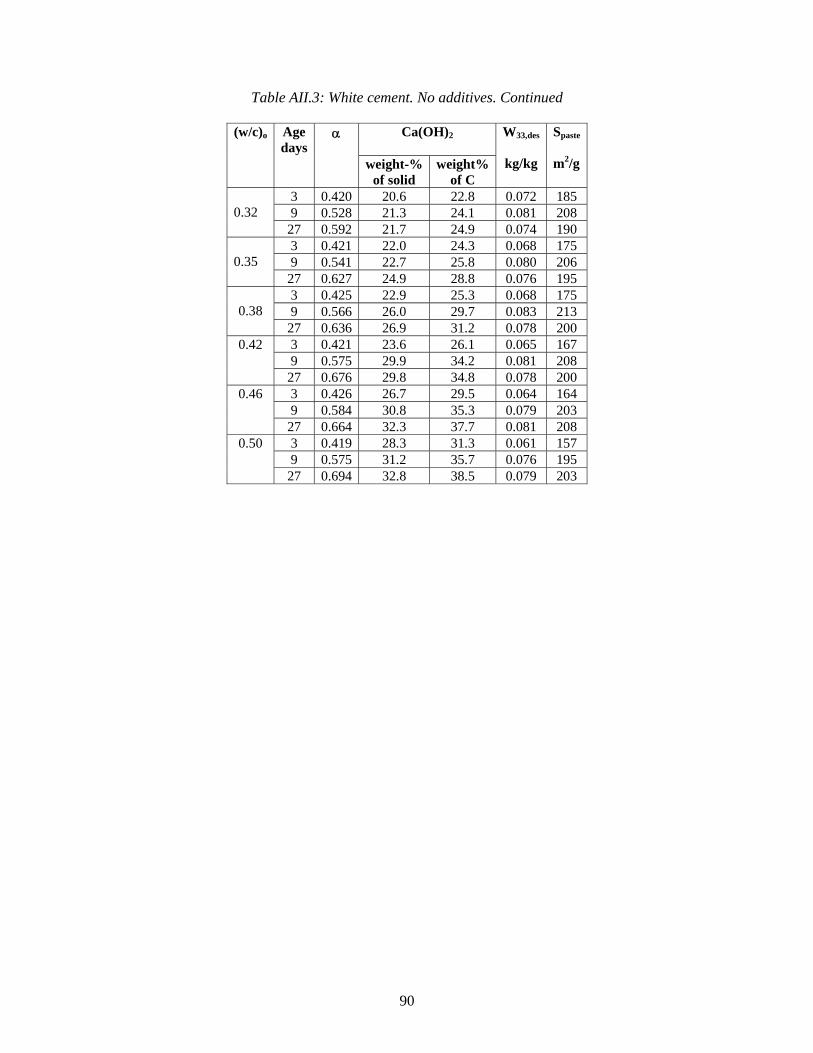
90
Table AII.3: White cement. No additives. Continued
Ca(OH)2
(w/c)o Age days
α
weight-%of solid
weight% of C
W33,des
kg/kg
Spaste m2/g
3 0.420 20.6 22.8 0.072 185 9 0.528 21.3 24.1 0.081 208
0.32
27 0.592 21.7 24.9 0.074 190 3 0.421 22.0 24.3 0.068 175 9 0.541 22.7 25.8 0.080 206
0.35
27 0.627 24.9 28.8 0.076 195 3 0.425 22.9 25.3 0.068 175 9 0.566 26.0 29.7 0.083 213
0.38
27 0.636 26.9 31.2 0.078 200 3 0.421 23.6 26.1 0.065 167 9 0.575 29.9 34.2 0.081 208
0.42
27 0.676 29.8 34.8 0.078 200 3 0.426 26.7 29.5 0.064 164 9 0.584 30.8 35.3 0.079 203
0.46
27 0.664 32.3 37.7 0.081 208 3 0.419 28.3 31.3 0.061 157 9 0.575 31.2 35.7 0.076 195
0.50
27 0.694 32.8 38.5 0.079 203

91
Table AII.4: White cement with additives.
Additive
Ca(OH)2
W33,des kg/kg
Spastem2/g
Type Amount % of C
(w/c)o (w/c)eff
1)
Age days
α
weight-%of solid
weight-% of C
4 0.478 23.3 27.2 0.066 170 5 0.50 0.476 8 0.554 33.7 40.0 0.088 226 4 0.438 29.9 36.2 0.074 190 10 0.50 0.455 8 0.487 29.1 35.6 0.080 206 4 0.385 25.5 33.1 0.092 236
Semi-hydrate gypsum
20 0.50 0.417 8 0.457 26.9 35.4 0.106 272 1 0.422 22.1 25.5 0.051 131 4 0.517 26.2 30.9 0.070 180 8 0.557 28.1 33.4 0.081 208
5
0.50
0.476
16 0.613 27.0 32.5 0.085 218 1 0.408 15.4 18.5 0.064 164 4 0.507 21.2 26.0 0.082 211 8 0.550 21.3 26.4 0.089 229
10
0.50
0.455
16 0.573 21.4 26.6 0.094 242 1 0.457 13.2 17.3 0.075 193 4 0.501 15.5 20.5 0.098 252 8 0.523 17.5 23.3 0.112 288
Silica gel
20
0.50
0.417
16 0.514 13.0 17.3 0.112 288 5 - - 0.081 208 2 0.40 0.42 30 - - 0.097 249
4 0.40 0.44 30 - - 0.100 257 5 - - 0.074 190
Ethylene glycol 6 0.40 0.46
30 - - 0.100 257 1) (w/c)eff is defined: - For mineral additives: (w/c)eff=(w/c)o/(1+a) - For ethylene glycol: (w/c)eff= (w/c)o+a Where a is the additive as fraction of the cement.
Thus the mineral additive is treated as full-worthy cement (binder) while the ethylene glycol is treated as ordinary mixing water. These assumptions are of course not correct and are only used for more alternative comparisons with the pure cement pastes.