cement paste reference material (srm2492) shelf-life extension
TRANSCRIPT

NIST Technical Note 1934
Cement Paste Reference Material (SRM 2492) Shelf-Life Extension
Alex Olivas Chiara F. Ferraris
Brian Lang Jennifer Richter Raissa P. Ferron
This publication is available free of charge from:
http:// dx.doi.org/10.6028/NIST.TN.1934

This page is intentionally blank

NIST Technical Note 1934
Cement Paste Reference Material (SRM 2492) Shelf-Life Extension
Alex Olivas Chiara F. Ferraris
Jennifer Richter Materials and Construction Research Division
Engineering Laboratory
Brian Lang Chemical Sciences Division
Material Measurement Laboratory
Raissa P. Ferron The University of Texas at Austin
This publication is available free of charge from: http:// dx.doi.org/10.6028/NIST.TN.1934
September 2016
U.S. Department of Commerce Penny Pritzker, Secretary
National Institute of Standards and Technology Willie May, Under Secretary of Commerce for Standards and Technology and Director

Certain commercial entities, equipment, or materials may be identified in this document in order to describe an experimental procedure or concept adequately.
Such identification is not intended to imply recommendation or endorsement by the National Institute of Standards and Technology, nor is it intended to imply that the entities, materials, or equipment are necessarily the best available for the purpose.
National Institute of Standards and Technology Technical Note 1934 Natl. Inst. Stand. Technol. Tech. Note 1934, 44 pages (September 2016)
CODEN: NTNOEF
This publication is available free of charge from: http://dx.doi.org/10.6028/NIST.TN.1934

Abstract
Cement-based materials (e.g. cement paste, mortar and concrete) are complex rheological fluids
that display time-dependent and shear-dependent rheological behavior. Over the years, various
concrete rheometers have been proposed and made available commercially; however, there is no
method to calibrate them. Furthermore, typical calibration fluids used in commercial rheometers
are not well suited for the concrete rheometer calibration due to their high cost and they are
Newtonian (i.e., not a complex fluid). Therefore, there was a clear need for a reference material
specifically designed for concentrated, granular suspensions, such as cement paste, mortar and
concrete; this need led to the development of a new series of reference materials for calibration of
devices used in cement-based suspension rheological testing. The reference material to simulate
cement paste, SRM 2492, was composed of a fine limestone powder in a corn syrup matrix. While
the ranking of mixtures tested using these rheometers tend to match, the absolute values for the
rheological properties of the mixtures evaluated with different rheometers are not well correlated
[1, 2]. Additionally, due to microbial growth in the paste matrix, the shelf life of standard reference
material 2492 was limited to 7 d. This paper presents the results of a study to analyze how to
minimize microbial growth within the paste matrix. Various biocides that extend the shelf-life of
the reference material were examined, with the most promising method being sodium propionate,
a non-toxic chemical. Furthermore, recommendations to improve the storage of SRM are provided
to extend the usable shelf life.
Keywords: Rheology, Reference Materials, Biocide, Microorganisms, Microbes
_______________________________________________________________________________________ This publication is available free of charge from
: http://dx.doi.org/10.6028/NIS
T.TN.1934

Table of Contents
1 Introduction .......................................................................................................................... 1
2 Background .......................................................................................................................... 2
3 Experimental Procedure ....................................................................................................... 6
3.1 Materials ....................................................................................................................................... 6
3.1.1 SRM 2492 .............................................................................................................................. 6
3.1.2 Biocides used ........................................................................................................................ 6
3.2 Sterilization Approaches ............................................................................................................. 10
3.2.1 Heat sterilization ................................................................................................................. 10
3.2.2 Chemical sterilization .......................................................................................................... 11
3.3 Measurement Devices ................................................................................................................ 12
3.3.1 Rheometer .......................................................................................................................... 12
3.3.2 Vibrational viscometer ........................................................................................................ 12
3.4 Moisture Content Analysis .......................................................................................................... 13
4 Results and Discussion ...................................................................................................... 14
4.1 Heat Treatment Sterilization ....................................................................................................... 14
4.2 Analysis of Biocides ..................................................................................................................... 15
4.3 Biocide Rheological Effects ......................................................................................................... 16
4.3.1 Initial preliminary studies of the effect of biocides ............................................................ 17
4.3.2 Impact of immediate introduction of biocide with the mixing water ................................ 21
4.3.3 Impact of delayed addition of biocides ............................................................................... 23
4.4 Biocide Optimization ................................................................................................................... 25
4.5 Effect of Moisture Content on SRM 2492 Shelf-life .................................................................... 29
4.5.1 Moisture content of SRM 2492 ........................................................................................... 29
4.5.2 Storage container analysis .................................................................................................. 32
5 Recommended Standard Practice for Storage of SRM 2492 ............................................. 41
6 Conclusion ......................................................................................................................... 42
7 References .......................................................................................................................... 43
_______________________________________________________________________________________ This publication is available free of charge from
: http://dx.doi.org/10.6028/NIS
T.TN.1934

List of Figures
Figure 1: SRM 2492 rheological properties show stability until they exceed age = 7 days, the samples shown were stored at [A] 6 °C and [B] 23 °C. [5]. The standard deviation is shown in the figures. ............. 3 Figure 2: Two-year old SRM stored in a closed container in the laboratory ................................................ 4 Figure 3: Corn syrup + water solution showed signs of microbial growth after 12 d. .................................. 4 Figure 4: Microbial growth appears in top layer of SRM paste. Image taken at 9 weeks. ........................... 4 Figure 5: Accelerated microbial growth environments analyzing a (left) normal SRM sample and (right) a sterilized SRM sample. .................................................................................................................................. 5 Figure 6: Comparison at 9 weeks of sterilized sample (S-S) on the right vs. normal sample (N-S) on left. N-S sample shows evidence of microbial activity on its surface. ................................................................... 14 Figure 7: Viscosity behavior over time after mixing the biocide emulsions portray threshold value of 15 min prior to viscous stability. The uncertainty bar is one standard deviation calculated from 3 measurements on the same mixture. ......................................................................................................... 16 Figure 8: Addition of SNS to SRM 2492 slightly increases viscosity but Bingham behavior remains similar to control sample. [5] The uncertainty of the shear stress values is 1.69 Pa (obtained from the SRM 2492 certificate of analysis). ................................................................................................................................ 18 Figure 9: (Left) SRM 2492 paste with SNS at 5 weeks. ............................................................................... 18 Figure 10: (Left) SRM 2492 paste with SA at 9 weeks. ............................................................................... 19 Figure 11: Use of Sodium Azide (SA) on SRM 2492 does not alter the rheological properties significantly. The 4th day values are extremely low due to higher temperatures during weekend. [5] The uncertainties are 1.69 Pa and 0.74 Pa·s for yield stress and viscosity, respectively (obtained from the SRM 2492 certificate of analysis). ................................................................................................................................ 19 Figure 12: Cinnamaldehyde (CN) maintains SRM viscosity stable over few days, but has slight increase in yield stress. [5] The uncertainties are 1.69 Pa and 0.74 Pa·s for yield stress and viscosity, respectively (obtained from the SRM 2492 certificate of analysis). ............................................................................... 20 Figure 13: (Left) SRM 2492 paste with CN at 5 weeks. ............................................................................... 21 Figure 14: Effect of biocides on temporal evolution of viscosity when biocide is added at 0.2% dosage into freshly mixed SRM 2492. SRM 2492 is denoted as the “control” mixture in the figure. The uncertainty bar is one standard deviation calculated from 3 measurements on the same mixture. ........ 22 Figure 15: Effect of biocide on temporal evolution of yield stress when biocide is added at 0.2% dosage into freshly mixed SRM 2492 (denoted as “control”). The uncertainty bar is one standard deviation calculated from 3 measurements on the same mixture............................................................................. 22 Figure 16: Effect of sodium propionate (SP) addition at 0.5% dosage on viscosity (Visc) and yield stress (YS) of SRM 2492. Orange vertical line represents time of biocide addition at age = 21 days. The uncertainty bar is one standard deviation calculated from 3 measurements on the same mixture. ........ 24 Figure 17: Effect of grapefruit seed extract (GSE) addition at 0.5% dosage on viscosity (Visc.) and yield stress (YS) of SRM 2492. Orange vertical line represents time of biocide addition at age = 35 days. The uncertainty bar is one standard deviation calculated from 3 measurements on the same mixture. ........ 24 Figure 18: Effect of Honey-B-Healthy (HBH) addition at 0.5% dosage on viscosity (Visc) and yield stress (YS) of SRM 2492. Orange vertical line represents time of biocide addition at age = 42 days. The uncertainty bar is one standard deviation calculated from 3 measurements on the same mixture. ........ 25
_______________________________________________________________________________________ This publication is available free of charge from
: http://dx.doi.org/10.6028/NIS
T.TN.1934

Figure 19: Effect of CN on viscosity of SRM 2492 decreases after 2 months. The uncertainty is 1.69 Pa for shear stress measurements up to 7 days (obtained from the SRM 2492 certificate of analysis). ........ 26 Figure 20: Effects of different dosages of Honey-B-Healthy (HBH) on viscosity of SRM 2492. Uncertainties shown for SRM 2492 are based on the certificate of analysis. ................................................................... 28 Figure 21: Effects on viscosity of SRM 2492 by different dosages of sodium propionate (SP). Uncertainties shown for SRM 2492 are based on the certificate of analysis. ............................................ 28 Figure 22: Composition of SRM 2492 shown in (left) its entirety and (right) with only the liquid components. ............................................................................................................................................... 30 Figure 23: Moisture content available in SRM 2492 samples of different ages, observed via continuous oven-drying at 40 °C. Moisture contents have an uncertainty of 1 % calculated from 3 samples measured at each point. .............................................................................................................................................. 31 Figure 24: Moisture content available in SRM 2492 samples of different ages, observed via continuous oven-drying at 100 °C. Moisture contents have an uncertainty of 1 % calculated from 3 samples measured at each point. ............................................................................................................................. 31 Figure 25: Moisture content observed for liquid composition (diluted corn syrup only) of SRM 2492 at oven-drying conditions of 40 °C and 100 °C. These moisture contents have an uncertainty of 0.5 % calculated from 3 samples measured at each point. .................................................................................. 32 Figure 26: Mass losses of SRM 2492 samples recorded over time to show water content evaporated when stored increases with time. These are single measurements, the uncertainty is estimate from the balance precision at 0.01%. ........................................................................................................................ 36 Figure 27: Moisture loss when storing SRM 2492 reduced significantly by application of lined lid. These are single measurements, the uncertainty is estimate from the balance precision at 0.01 %. ................. 37 Figure 28: Various methods of sealing the containers were analyzed using plastic film, plastic zip bag or a combination. None of which retained moisture more effectively than the normal or lined lid. These are single measurements, the uncertainty is estimate from the balance precision at 0.01 %......................... 38 Figure 29: Evolution of moisture loss (by % mass) show high losses in the PS containers. These are single measurements, the uncertainty is estimate from the balance precision at 0.01 %. .................................. 39
List of Tables
Table 1: Biocides used in this report ............................................................................................................. 7 Table 2: Stable viscosity values determined using a vibrational viscometer for the biocide emulsions analyzed in this study obtained after 15 min post-mixing.......................................................................... 15 Table 3: Listing of all components analyzed for most effective container sealing system. ........................ 33 Table 4: Moisture Vapor Transmission Ratings (MVTR) and basic matter properties of common polymers. MVTR values are in g-mil/100in2/24h. [20, 21].......................................................................................... 34
_______________________________________________________________________________________ This publication is available free of charge from
: http://dx.doi.org/10.6028/NIS
T.TN.1934

Acknowledgements
The authors would like to thank Max Peltz (NIST) for all of his technical assistance during the
experimental execution of this project. His support is much appreciated and the work completed
in this study would not be possible without him. We would also like to thank Paul Stutzman (NIST)
for his suggestion of using paraffin wax film as a sealing material.
_______________________________________________________________________________________ This publication is available free of charge from
: http://dx.doi.org/10.6028/NIS
T.TN.1934

1 | P a g e
1 Introduction
Rheology is a branch of science that deals with the study of the flow and deformation behavior
of fluids. With the advances in the development of cement-based suspensions, such as self-
consolidating concrete, underwater concrete, and 3-D printing slurries, there is an increasing desire
to accurately determine the rheological properties. While great progress has been made in the field
of concrete rheology, one aspect that has limited the broader adoption of rheological
characterization in the concrete community is due to the fact the rheological properties extracted
from the concrete rheometers lack good correlation amongst their absolute values. The American
Concrete Institute (ACI) Committee 238 used two international testing campaigns to determine
correlation between existing concrete rheometers and found that there was a need for a reference
material to calibrate the rheometers [1, 2]. Discussions from ACI Committee 238 found that the
reference material cannot be the traditional standard oils as they are likely to be too cost-prohibitive
to fill a whole concrete rheometer (20 L); additionally, standard oils display Newtonian behavior,
which is not representative of the rheological behavior of concrete. Therefore, there was a clear
need for a reference material that could simulate paste, mortar and concrete with a large size
distribution of particles. Additionally, the reference material needed to be a Bingham fluid since
many cement-based materials exhibit Bingham behavior. This led to the development by National
Institute of Standards and Technology (NIST) of a series of standard reference materials (SRM),
composed of a corn syrup solution and fine limestone powder with glass bead inclusions.
SRM 2492 is a paste for calibration of rheometers used for cement paste measurements; a key
attribute of this paste was that it was engineered to display Bingham behavior. It was found from
preliminary studies that microorganism growth seems to be a cause of the deterioration of the SRM
2492, which limits the shelf life to 7 d. Therefore, efforts were focused in this study on finding an
appropriate biocide that ensures the SRM 2492 is viable for a length of time that exceeds the
certified 7 d shelf life [3, 4].
It was observed that after 7 d of storage microbial growth becomes noticeable, along with
changes in the rheological properties of the SRM paste [5]. One method to destroy microbial
growth would be heat treatment sterilization, but it is labor intensive since all instruments and
_______________________________________________________________________________________ This publication is available free of charge from
: http://dx.doi.org/10.6028/NIS
T.TN.1934

2 | P a g e
containers need to be heat treated, as well as all materials such as the limestone and water. This is
not an easy task in a commercial laboratory and especially in the field. The other solution would
be to use chemical sterilization, such as a biocide. It is preferable that the biocides selected are not
toxic to humans, so that no special precautions need to be implemented to use and for disposal.
Therefore, this study was limited to the analysis of three biocides: grapefruit seed extract (GSE),
Honey-B-Healthy (HBH) and sodium propionate (SP). The optimal biocide addition time was
also examined: initially with the mixing water or later after the mixture is older than 7 d. A
discussion is presented on the selection criteria of the biocides, as well as other factors that could
contribute to the deterioration of the SRM and provides solutions to prolong the shelf life of the
SRM. Furthermore, the rheological properties were monitored to ensure the selected biocide did
not cause significant changes to the viscosity of the SRM.
2 Background
SRM 2492 [3] is a non-Newtonian reference material, with Bingham behavior composed of
non-setting materials. The constituents are fine limestone, corn syrup and water, with the first
constituents provided in the SRM box and the water provided by the user. The re-certification [4]
of this SRM served as the matrix to create SRM 2493 [6], which is the mortar rheology SRM with
the addition of 1 mm glass beads. SRM 2493 will then contribute as the stepping stone to develop
a concrete SRM 2497 by the addition of 10 mm beads, thus completing the multi-phase series
(expected in 2016).
It was observed during the development of SRM 2492 that the rheological properties are stable
up until 7 d after mixing. Figure 1 presents the plots showing the temporal evolution of yield stress
and viscosity of the SRM paste [5]. Initially, the yield stress and plastic viscosity of the SRM were
around 55 Pa and 6 Pa·s, respectively, when stored at 6 °C. Similarly, the yield stress and plastic
viscosity of the SRM when stored at 23 °C, were around 62 Pa and 7 Pa·s, respectively. These
values are higher than typical values measured for paste, and are likely due to the additional
viscosity of the corn syrup which can be found in the original certification report [3]. Storing the
SRM at a lower temperature, 6 °C, in between measurement was thought to inhibit the growth of
microorganisms, but this had no significant effect on the results as shown in Figure 1. The increase
in rheological properties after 10 d are apparent on both storage conditions.
_______________________________________________________________________________________ This publication is available free of charge from
: http://dx.doi.org/10.6028/NIS
T.TN.1934

3 | P a g e
The first leading factor causing the data divergence was discovered from observations of
microbial growth on the SRM, left in the lab for two years, as shown in Figure 2. To verify this
hypothesis, two mixtures were prepared: an aqueous solution of corn syrup and an SRM. The
aqueous solution of corn syrup was placed in a closed, plastic container and after just 12 d of
storage the microbial growth was already clearly visible on the side of the containers (Figure 3).
On the other hand, the SRM placed in a similar container, showed (Figure 4) bacteria growth was
visible after 9 weeks. The slow appearance of the bacteria might be due in part on the difficulty to
detect the bacteria in the SRM, compared to the flask. It is speculated that the limestone had
additional traces of minerals which could provide additional nutrients, the microorganisms feed
on the sugars in the corn syrup, or that the limestone serves as substrate promoting the formation
of microbial networks (e.g., biofilms), ultimately leading to further microbial growth.
To test the hypothesis that the microorganisms seen would be generated in a typical SRM
mixture, small amounts of SRM mixture were placed in one form of accelerated growth medium
(i.e., nutrient broth) in a culture flask. Figure 5 shows two cases: a normally prepared SRM and a
Figure 1: SRM 2492 rheological properties show stability until they exceed age = 7 days, the samples shown were stored at [A] 6 °C and [B] 23 °C. [5]. The standard deviation is shown in the figures.
_______________________________________________________________________________________ This publication is available free of charge from
: http://dx.doi.org/10.6028/NIS
T.TN.1934

4 | P a g e
SRM with all the ingredients sterilized by heat-treatment first (See section 3.2.1). Within 4 d, a
green-yellow pubescence is visible in the normal sample but not on the sterilized sample. It was
speculated that the presence of the microorganisms could be causing the increase in viscosity and
yield stress observed in Figure 1.
Figure 3: Corn syrup + water solution showed signs of microbial growth after 12 d.
Figure 4: Microbial growth appears in top layer of SRM paste. Image taken at 9 weeks.
Figure 2: Two-year old SRM stored in a closed container in the laboratory
_______________________________________________________________________________________ This publication is available free of charge from
: http://dx.doi.org/10.6028/NIS
T.TN.1934

5 | P a g e
These observations led to the evaluation of two possible approaches that limit microbial
growth and control the degradation of the SRM after mixing: (1) heat treatment sterilization and
(2) chemical sterilization. Heat treatments are very effective at deactivating/killing
microorganisms, however the need for strict laboratory controlled conditions may hinder SRM
users from being able to successfully implement this method. The efficacy of a particular biocide
will vary depending on its concentration and the type of microorganism present, however chemical
sterilization treatments using biocides are advantageous when there are concerns that the high
temperatures from heat treatments may damage the material. Additionally, the simplicity of the
chemical sterilization means that the SRM owner can introduce the biocide during initial mixing
or at a later time period after the SRM is prepared.
Another interesting phenomena was also investigated. The rheological data shown in the SRM
2492 certificate show an increasing trend with time from 1 d to 7 d. All the values are still within
the uncertainty posted, and can still be considered consistent with the certified values. One
hypothesis, is that the plastic containers used to store the material were not adequate to avoid some
water losses. Alternative containers were also examined and are discussed later in this study.
Figure 5: Accelerated microbial growth environments analyzing a (left) normal SRM sample and (right) a sterilized SRM sample.
_______________________________________________________________________________________ This publication is available free of charge from
: http://dx.doi.org/10.6028/NIS
T.TN.1934

6 | P a g e
3 Experimental Procedure
3.1 Materials
3.1.1 SRM 2492 The main component in this study, SRM 2492 cement paste reference material, forms the
matrix of all samples examined with the following composition, as per the certificate [7].
Corn Syrup: 200.0 g
Distilled water: 63.16 g
Limestone: 458.1 g
The constituents need to be prepared by the user according to the specification described in the
certificate [7]. Further detail about the composition or properties of SRM 2492 can be found in the
published certification report [4].
3.1.2 Biocides used
The selection of the biocides was restricted to those that were commercially available and
inexpensive products and are listed in Table 1. On the other hand, a few non-commercial biocides
were also analyzed for comparison and to offer a variety of solutions. These non-commercial
biocides were prepared in-house at NIST. The biocides (with abbreviations1 for future references)
considered are listed below and followed by a more detailed description provided in the following
sections.
1 Abbreviations specified are solely for use during this report. They were created to ease references to the biocide name in and in no way represents any other brand or scientific name.
_______________________________________________________________________________________ This publication is available free of charge from
: http://dx.doi.org/10.6028/NIS
T.TN.1934

7 | P a g e
Table 1: Biocides used in this report
Biocide1 Preparation for
usage
NFPA
Grapefruit seed extract (GSE) Use as purchased
Honey-B-Healthy (HBH) Use as purchased Lemongrass
Oil
Spearmint
Oil
Sucrose
Sodium propionate (SP) Preparation needed
Sodium azide (SA) Preparation needed
Cinnamaldehyde (CN) Preparation needed
Silver nanoparticle suspension (SNS) Preparation needed
3.1.2.1 Grapefruit Seed Extract (GSE)
The grapefruit seed extract (GSE) is a liquid extracted from a grapefruit’s seeds and pulp.
GSE is a great source of plant antioxidants which makes it rich in nutrients and phytochemicals
[8]. There have been a number of reported uses of GSE in cosmetics and dietary supplements
which claimed antioxidant and antibacterial effects [9].
The effectiveness of a processed GSE was investigated in the literature, as the
commercially available biocide would also be processed into chemical (liquid) form by the biocide
_______________________________________________________________________________________ This publication is available free of charge from
: http://dx.doi.org/10.6028/NIS
T.TN.1934

8 | P a g e
supplier. Results suggest GSE consistently contained antibacterial characteristics that are
comparable to that of proven topical antibacterial. Although the GSE appeared to have greater
inhibitory effect on gram-positive organisms than on gram-negative organisms, its comparative
effectiveness against a wide range of bacterial biotypes is significant [10]. Gram-negative bacteria
tend to have more longevity than gram-positive and are tougher to kill due to their structural
differences, specifically in the thickness of the peptidoclycan layer(s). To account for the
toughness of the gram-negative structure, the biocide of interest would preferably be a broad
spectrum biocide.
The levels of toxicity for GSE concentrations [13] would signify both microbial and
nontoxic threshold values. The usage of scanning transmission electron microscopy (STEM)
revealed the mechanism of GSE’s antibacterial activity. The results showed that GSE disrupts the
bacterial cell membrane and liberates the cytoplasmic contents within 15 min after contact.
However, tests indicate that GSE remains bactericidal but toxic at GSE solution concentrations of
1:1 through 1:128, while at a 1:512 dilution GSE is bactericidal but completely nontoxic.
3.1.2.2 Honey-B-Healthy
The Honey-B-Healthy (HBH) is a commercially available product and it was expected to
serve as a preservation agent for the corn syrup solution. HBH uses lemongrass and spearmint oil
concentrates for its naturally occurring pheromones. As shown in these studies, HBH concentrate
[14] can be kept in syrup solutions with tightly sealed containers and fed to bees when needed
during nectar shortages to help maintain healthy productive colonies for pollination and honey
production.
The safety information of the main components for HBH (lemongrass oil, spearmint oil,
and sucrose) were examined for possible hazards using available literature. The NFPA (National
Fire Protection Association) ratings from the SDS (Safety Data Sheet) for all three components
are summarized in Table 1, which show that the HBH is not a hazardous material for users due to
its low NFPA ratings. The blue, red and yellow diamonds represent the health, flammability and
instability hazard, respectively. Where the Health (blue) Rating is 2 indicates continued exposure
can lead to temporary incapacitation unless given prompt medical attention. Also, Flammability
_______________________________________________________________________________________ This publication is available free of charge from
: http://dx.doi.org/10.6028/NIS
T.TN.1934

9 | P a g e
(red) 2 indicates the material needs to be exposed to relatively high temperature before ignition
can occur. A rating of 2 on the Instability (yellow) signifies risk of violent chemical change at high
temperatures or pressures. Where Health 1 rating is indicated, only minor injury can occur if no
treatment is given, and Flammability 1 indicates materials need preheating before ignition can
occur. Yellow 1 indicates normally stable conditions, but high temperatures can make instability
exist. Any ratings of 0 are considered normal or stable conditions.
3.1.2.3 Sodium Propionate
Sodium propionate (SP) is used as a food preservative in the United States, the European
Union, and several other countries. Although SP is slightly toxic, it is generally safe in small
amounts (less than 5000 mg per kg of total SRM mass). SP (also known as Mycoban) is
commercially available but can also be easily prepared by the reaction of propionic acid with
sodium carbonate or sodium hydroxide.
For this study the SP was prepared at NIST by the stoichiometric addition of 2 mol/L of
sodium hydroxide into neat liquid propionic acid. A 10 % stock solution (by mass) of SP in
deionized water was used as the working solution and diluted as needed.
3.1.2.4 Sodium Azide (NaN3)
Sodium azide (SA) is a sodium salt of hydrazoic acid that is colorless, odorless, crystalline
solid (salt-like) and is soluble in water or liquid ammonia. SA has a broad spectrum of applications
as a biocide. The main applications of SA are as an additive to perishable food where it is used to
prevent the growth of microorganisms. For this study, a 4 % solution (wt. /wt.) of Sodium Azide
in deionized water was made as the primary working solution and diluted as needed.
However, SA can be highly toxic and the solid material can present an explosion risk when
shocked or heated [15]. Nonetheless, SA is not harmful to humans if the dosage is between 0.3
mg to 150 mg dosage [16]. Since levels of toxicity typically depend on the concentration, previous
studies have examined use of low concentrations of SA to minimize the effect of toxicity [17]. The
analysis of this biocide found that a concrentration of 0.01 % of biocide per total SRM sample
_______________________________________________________________________________________ This publication is available free of charge from
: http://dx.doi.org/10.6028/NIS
T.TN.1934

10 | P a g e
mass not only helps prevent the characteristic growth of microorganisms but it also inhibits
common bacteria and other microorganisms and was a total dosage of 72 mg of biocide.
3.1.2.5 Cinnamaldehyde (C9H8O)
Cinnamaldehyde (CN) is a liquid, organic compound which aids in avoiding bacterial
growth and mold formation. CN is typically used in the food industry, where it is often used as a
fungicide and insecticide due to its low toxicity for human. Although this study used this product
as produced synthetically, it should be noted that CN can be obtained naturally from the bark of
cinnamon trees. It is used as flavor in the food industry in products such as chewing gum, candy
and beverages.
3.1.2.6 Silver Nanoparticle Suspension
The silver nanoparticle suspension (SNS) is a biocidic suspension composed of silver (Ag)
nanoparticles capped with citrate. The citrate is essentially the salt or ester of citric acid. The Ag
nanoparticles have been applied in various fields such as electronics, optics, water treatment and
biotechnology. SNS serves this wide range of industries due to Ag antimicrobial behavior. Recent
[18] reports showed that Ag nanoparticles have potential risks to human health due to their “Trojan
horse” mechanism where the silver ions are released via dissolution. The studies on the toxicity of
SNS portray that the measurement of the Ag ion fraction is crucial for toxicity studies. The
suspension examined here was composed of 60 mg Ag nanoparticles per liter of water which is a
non-toxic level for humans. The Ag nanoparticles had a particle size of 20 nm in diameter.
3.2 Sterilization Approaches
3.2.1 Heat sterilization
Sterilization could be performed using a variety of methods, such as dry heat, autoclave or
UV sterilization. To determine the effect of sterilization on the microbial growth, the easily
available dry heat was deemed to be a good approach. This was based on the principle that
microbial growth is improbable if there are no viable microbial cells in the system. This approach
_______________________________________________________________________________________ This publication is available free of charge from
: http://dx.doi.org/10.6028/NIS
T.TN.1934

11 | P a g e
attempts to kill the microbial sources via heat treatment of the SRM constituents, instruments, and
other laboratory equipment that comes in contact with the SRM.
The sterilization of the constituents began by heating the limestone at 150 °C for 48 h in
order to ensure that devitalization of any bacteria or microorganisms in the limestone is reached.
Then, a glass container is sterilized by cleaning it with an alcohol such as ethanol, and is used for
storage after heating. The water was deionized and boiled at 100 °C, then stored in a sterile
container at room temperature. There is no need to sterilize the corn syrup, as without dilution it
does not allow microbial growth.
Then, all the instruments and any tool that came into contact with the SRM was sterilized.
This was achieved by rinsing all parts repeatedly with ethanol. By sterilizing all instruments,
external microbial contamination was avoided through pre-mixing and sampling of material which
were to be done during all measurements. Alternatively, to use less ethanol, heat sanitation may
be used for the metallic tools or instrument parts by placing the items in the oven with the
limestone. Also, gloves and dust masks were used to help reduce opportunistic microbial
contamination from the human body. Once the materials were cooled, they were mixed according
to the mixing procedure in the certificate of analysis [7] using a high shear blender with
temperature control. The storage containers were also sanitized with ethanol before storing the
SRM paste. The storage conditions, such as room temperature and location, were the same as for
the normal samples.
3.2.2 Chemical sterilization
Two approaches were used to introduce the biocides (as chemical sterilization agents): (1)
immediate addition and (2) delayed addition. The immediate addition approach consisted of
following the standard mixing procedure for SRM 2492 as per the certificate of analysis [7]. The
only modification to the process is the inclusion of the biocide dosage with the mixing water. By
adding the biocide into the water component during preparation, the water acts as the medium that
the biocide particles can use to travel into the SRM paste.
_______________________________________________________________________________________ This publication is available free of charge from
: http://dx.doi.org/10.6028/NIS
T.TN.1934

12 | P a g e
The second approach adds the biocide chemical at a later age, after the SRM paste has
already been used and stored. Each SRM 2492 batch contains enough material such that it was
split in half and stored in two separate containers prior to testing. One half served as a control
mixture while the other half received a dosage of a biocide. In this approach, the biocide is added
into the SRM paste then re-mixed with a high shear blender for 2.5 min at 300 rpm (31.4 rad/s).
This re-mixing step is highly recommended, as stated in the certificate of analysis, when re-using
the SRM at a later age regardless if the biocide is added or not.
3.3 Measurement Devices
3.3.1 Rheometer
Since this study focuses on extending the life of SRM 2492, the rheometer protocol followed the
exact procedure that was certified for SRM 2492 [4]. Therefore, serrated parallel plates of 35 mm
in diameter were used to gather the rheological data. The gap between the two parallel plates was
0.600 mm ± 0.001 mm [4] and the temperature of the rheometer was maintained at 23 °C ± 0.5 °C
[4] during all tests via controlled water bath.
The testing protocol consisted of shearing the material at 0.01 s-1 for 150 s before starting
the Bingham test. The Bingham test consisted of increasing the nominal shear rate from 0.1 s-1 to
50 s-1 (15 points in total) and then decreasing shear rate from 50 s-1 to 0.1 s-1 (20 points in total).
At each step, a time of 30 s was allowed for the torque readings to reach steady state behavior
before the torque value was recorded. More details of the procedure could be found in [4].
3.3.2 Vibrational viscometer
This type of viscometer can only be used with a Newtonian fluid whose viscosity does not
change with shear rate. The viscometer consists of a rod that is immersed in the fluid to be
measured. The rod vibrates at a high frequency, and it measures the damping due to the fluid. The
amplitude is small and the power consumed is then converted to viscosity [19]. The viscosity
_______________________________________________________________________________________ This publication is available free of charge from
: http://dx.doi.org/10.6028/NIS
T.TN.1934

13 | P a g e
measured is the dynamic viscosity (μ) of the fluid, which is output by the viscometer in units of
centipoise2 [cP]. The instrument used also provides the temperature if needed.
3.4 Moisture Content Analysis
To determine the amount of water content in a prepared SRM batch, small samples at various
time of storage (i.e. various sample ages) were placed in an oven in order to evaporate all the water,
and the mass was measured before and after heating. Furthermore, in order to truly determine
whether the containers were poorly sealed, just water was placed in various containers and the
mass loss of the container was monitored over time.
2 Unit Note: 1 cP = 1 mPa·s = 10-3 Pa·s
_______________________________________________________________________________________ This publication is available free of charge from
: http://dx.doi.org/10.6028/NIS
T.TN.1934

14 | P a g e
4 Results and Discussion
4.1 Heat Treatment Sterilization
The sterilization process yielded evidence of microbial depletion. As shown in Figure 6,
there was a clear display of microbes in the normal SRM paste sample (N-S), while the heat treated
sterilized sample (S-S) showed considerably less microbial growth [3] after 9 weeks. The only
visible formation on the S-S was a layer of water due to bleeding and sedimentation, which were
found to occur on SRM 2492 samples during storage. This phenomenon is further discussed in
Section 4.3.
Although the heat treatment sterilization method reduced the presence of microorganisms in
the SRM paste, it is was deemed cumbersome as sanitation of parts for every rheological
measurement will greatly increase the required time for testing. Nevertheless, this method is a non-
toxic approach to extending the SRM paste shelf-life.
Figure 6: Comparison at 9 weeks of sterilized sample (S-S) on the right vs. normal sample (N-S) on left. N-S sample shows evidence of microbial activity
on its surface.
_______________________________________________________________________________________ This publication is available free of charge from
: http://dx.doi.org/10.6028/NIS
T.TN.1934

15 | P a g e
4.2 Analysis of Biocides
To pre-screen the biocides effectiveness, they were tested using only the aqueous solution
of corn syrup at first. To determine the effect of the addition of a biocide on rheological properties,
the viscosity of the solution was monitored before and after addition of the biocide. The
measurement was done by a vibrational viscometer.
To ensure that the viscosity measured was stable, the data were collected up to 20 min after
mixing. Each mixture was measured three times to determine the uncertainty. Figure 7 shows the
data obtained. All three biocides and the control displayed decreasing viscosities until reaching a
15 min threshold, after which the viscosities stabilized from 15 min to 20 min. Therefore, it is
recommended to wait 20 min between mixing end time and making rheological measurements in
order to allow the viscosity of the liquid components to stabilize.
Table 2 only reflects the viscosity values of the biocide emulsions after 15 min of mixing as
it is considered the stable value. The biocides did cause an increase in viscosity compared to the
control, but none of them altered the changes in viscosity over time. The biocide dosages for
measurements shown in Figure 7 were specified at 0.2 % mass of biocide per mass of water-syrup
solution. Significant alterations to the biocide dosage can lead to changes in SRM viscosity,
therefore this study analyzes the optimal dosages for SRM 2492, as discussed in the following
sections.
Table 2: Stable viscosity values determined using a vibrational viscometer for the biocide emulsions analyzed in this study obtained after 15 min post-mixing.
15 min 20 minSP 128.5 129.1 128.8 0.3
GSE 125.4 125.5 125.4 0.1HBH 126.7 126.7 126.7 0.0
Control 124.9 124.9 124.9 0.0
Time after mixing Average Viscosity
Standard Deviation
Biocide
Biocide Emulsion Viscosities [mPa∙s]
_______________________________________________________________________________________ This publication is available free of charge from
: http://dx.doi.org/10.6028/NIS
T.TN.1934

16 | P a g e
4.3 Biocide Rheological Effects
The solution to use biocide to increase the shelf-life led to several application questions:
• Optimization of addition time: with the mixing water or later? How late to ensure
that biocide addition is still effective?
• How to determine the correct dosage for each of the biocides selected?
• How the addition of the biocides would affect the rheological properties of the
SRM 2492 as shown in the certificate?
In this section, the answer to these questions will be analyzed.
It should be noted that the biocides’ effectiveness was tested using various methods, such
as in the SRM or in a corn syrup solution kept in a closed container and examined periodically, or
in a cell culture flask where nutrients were added to accelerate the bacteria or fungi growth. This
latter method will be referred to as accelerated method in this report, and used a 0.5 percent agar
growth medium enriched with: yeast extract (1 %), peptone (2 %), D-glucose (4 %), NaCl (0.5 %),
and CaNO3 (0.2 %).
Figure 7: Viscosity behavior over time after mixing the biocide emulsions portray threshold value of 15 min prior to viscous stability. The uncertainty bar is one standard deviation calculated from 3 measurements on the same mixture.
_______________________________________________________________________________________ This publication is available free of charge from
: http://dx.doi.org/10.6028/NIS
T.TN.1934
17 | P a g e
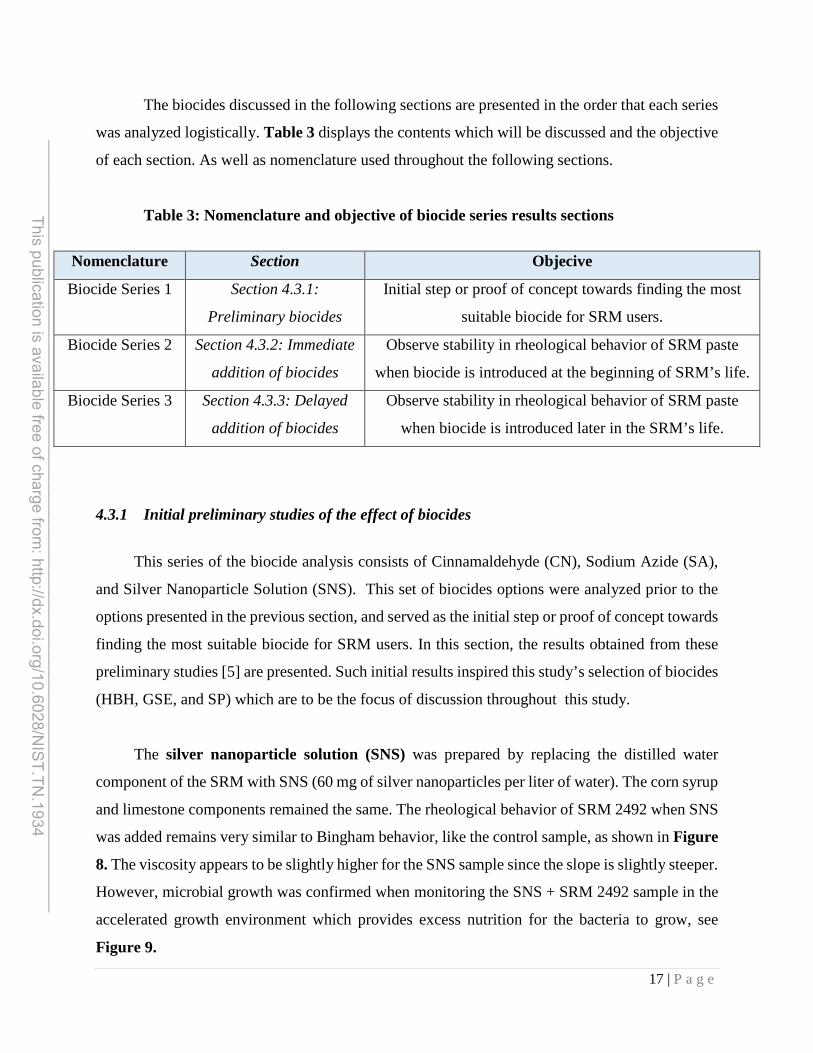
The biocides discussed in the following sections are presented in the order that each series
was analyzed logistically. Table 3 displays the contents which will be discussed and the objective
of each section. As well as nomenclature used throughout the following sections.
Table 3: Nomenclature and objective of biocide series results sections
4.3.1 Initial preliminary studies of the effect of biocides
This series of the biocide analysis consists of Cinnamaldehyde (CN), Sodium Azide (SA),
and Silver Nanoparticle Solution (SNS). This set of biocides options were analyzed prior to the
options presented in the previous section, and served as the initial step or proof of concept towards
finding the most suitable biocide for SRM users. In this section, the results obtained from these
preliminary studies [5] are presented. Such initial results inspired this study’s selection of biocides
(HBH, GSE, and SP) which are to be the focus of discussion throughout this study.
The silver nanoparticle solution (SNS) was prepared by replacing the distilled water
component of the SRM with SNS (60 mg of silver nanoparticles per liter of water). The corn syrup
and limestone components remained the same. The rheological behavior of SRM 2492 when SNS
was added remains very similar to Bingham behavior, like the control sample, as shown in Figure
8. The viscosity appears to be slightly higher for the SNS sample since the slope is slightly steeper.
However, microbial growth was confirmed when monitoring the SNS + SRM 2492 sample in the
accelerated growth environment which provides excess nutrition for the bacteria to grow, see
Figure 9.
Nomenclature Section Objecive
Biocide Series 1 Section 4.3.1:
Preliminary biocides
Initial step or proof of concept towards finding the most
suitable biocide for SRM users.
Biocide Series 2 Section 4.3.2: Immediate
addition of biocides
Observe stability in rheological behavior of SRM paste
when biocide is introduced at the beginning of SRM’s life.
Biocide Series 3 Section 4.3.3: Delayed
addition of biocides
Observe stability in rheological behavior of SRM paste
when biocide is introduced later in the SRM’s life.
_______________________________________________________________________________________ This publication is available free of charge from
: http://dx.doi.org/10.6028/NIS
T.TN.1934

18 | P a g e
In this preliminary study, the addition of Sodium Azide (SA) was analyzed at a
concentration of 0.08 %, where the dosage was calculated as mass of biocide per total SRM paste
mass which was added and introduced with the water component of SRM 2492 during the standard
mixing process. The viscosity and yield stress were monitored for 12 d and appeared to not change
drastically with the exception of an outlier. The outlier occurs on the 4th day and is believed to be
due to changes in lab room temperature during that period. Specifically, the room temperature
Figure 9: (Left) SRM 2492 paste with SNS at 5 weeks.
(Right) Accelerated method showed signs of microorganisms at 2 weeks. [5]
Figure 8: Addition of SNS to SRM 2492 slightly increases viscosity but Bingham behavior remains similar to control sample. [5] The uncertainty of the shear stress values is 1.69 Pa (obtained from the SRM 2492 certificate of analysis).
_______________________________________________________________________________________ This publication is available free of charge from
: http://dx.doi.org/10.6028/NIS
T.TN.1934

19 | P a g e
would increase due to energy-saving procedures by NIST of shutting down the air conditioning
during the weekend. However, the rheological properties returned to being close to the original
value once normal conditions were reestablished, shown in Figure 10. Yield stress is represented
by YS, and viscosity by µ in the following figures. The SA was analyzed in both the accelerated
method and normal storage conditions, and both conditions lacked signs of microbes after several
weeks (see Figure 11.).
Figure 11: Use of Sodium Azide (SA) on SRM 2492 does not alter the rheological properties significantly. The 4th day values are extremely low due to higher temperatures during weekend. [5] The uncertainties are 1.69 Pa and 0.74 Pa·s for yield stress and viscosity, respectively (obtained from the SRM 2492 certificate of analysis).
Figure 10: (Left) SRM 2492 paste with SA at 9 weeks. (Right) Accelerated method showed no signs of microbes at 11 weeks. [5]
_______________________________________________________________________________________ This publication is available free of charge from
: http://dx.doi.org/10.6028/NIS
T.TN.1934

20 | P a g e
The addition of Cinnamaldehyde (CN) was monitored at a dosage of 0.88 % (0.55 mL
CN per 62.58 mL of water) [5]. The limestone and corn syrup components were not modified, and
the standard mixing process was followed. The addition of CN to the SRM appeared to keep the
viscosity slightly constant over time as shown in Figure 12; while the yield stress showed a slight
increase. The use of CN in the accelerated and normal conditions yielded results of no microbial
growth after several weeks, as portrayed in Figure 13. The measurements were collected at
different time intervals for all biocides in this section.
Figure 12: Cinnamaldehyde (CN) maintains SRM viscosity stable over few days, but has slight increase in yield stress. [5] The uncertainties are 1.69 Pa and 0.74 Pa·s for yield stress and viscosity, respectively (obtained from the SRM 2492 certificate of analysis).
_______________________________________________________________________________________ This publication is available free of charge from
: http://dx.doi.org/10.6028/NIS
T.TN.1934

21 | P a g e
4.3.2 Impact of immediate introduction of biocide with the mixing water
The main purpose of this second series of biocide analysis was to observe the stability in
rheological behavior of the SRM paste when the biocide was introduced at the beginning of the
SRM’s life. During this phase of the work, only the following biocides were evaluated: GSE, HBH,
and SP. The GSE and HBH biocides were of main interest to analyze since they were selected
based on the most recent investigations into good biocide candidates. SP was chosen based on
previous work discussed in the previous section (4.3.1) where SA showed it was a promising
candidate. Despite the good results from SA, another compound with similar effectiveness and
less toxicity was needed; thus leading this study to evaluate SP.
The expectations set for biocides in this phase of the work were that they should extend the
stability past 7 d (where stability is determined by no significant changes in rheological properties).
The biocide selections were tested and compared to a control mixture (no biocide) in the viscosity
curves shown in Figure 14 and Figure 15. The biocide dosages were specified at 0.2 % for all
three biocides in this first series, where the dosage was calculated as mass of biocide per total SRM
paste mass. It was determined that adding the biocides was causing a reduction in viscosity of the
SRM paste; however, the viscosity in mixtures that contained a biocide had better stability over
time compared to the control which had no biocide. On the other hand, the yield stress of the SRM
paste increased when HBH was added to the SRM, while addition of the other two biocides slightly
reduced the yield stress of the control sample.
Figure 13: (Left) SRM 2492 paste with CN at 5 weeks. (Right) Accelerated method lacked signs of microbes at 8 weeks. [5]
_______________________________________________________________________________________ This publication is available free of charge from
: http://dx.doi.org/10.6028/NIS
T.TN.1934

22 | P a g e
Figure 14: Effect of biocides on temporal evolution of viscosity when biocide is added at 0.2% dosage into freshly mixed SRM 2492. SRM 2492 is denoted as the “control” mixture in the figure. The uncertainty bar is one standard deviation calculated from 3 measurements on the same mixture.
Figure 15: Effect of biocide on temporal evolution of yield stress when biocide is added at 0.2% dosage into freshly mixed SRM 2492 (denoted as “control”). The uncertainty bar is one standard deviation calculated from 3 measurements on the same mixture.
_______________________________________________________________________________________ This publication is available free of charge from
: http://dx.doi.org/10.6028/NIS
T.TN.1934

23 | P a g e
4.3.3 Impact of delayed addition of biocides
A third series of analysis was conducted on three mixtures of various ages from the SRM
2492; each mixture was split in half and stored in two separate containers prior to testing. One half
served as a control mixture while the other half received a dosage of a biocide. Thus, a total of six
samples were created which tested a total of three biocides. This second series of biocides were
specified at 0.5 % for all three biocides in order to also gain insight on the impact of increasing the
dosage from the previously observed 0.2 %, where the dosage was calculated as mass of biocide
per total SRM paste mass. Figures 16-18 show the viscosity and yield stress behavior of the mixes
with and without delayed biocide additions. Viscosity is represented in the figures by red lines
while yield stress is shown as blue lines. The lines with white-filled data points represent the SRM
without any biocide (control or host mixture) which are shown having unstable behavior after 7 d
for all three samples. The lines with color-filled data points represent the behavior of the host
sample after receiving the biocide. The orange dashed line represents the time of biocide
introduction to the host SRM sample.
The metric for biocides to be rated with a good performance was that the addition would
stabilize the viscosity (and yield stress) readings beyond 7 d (i.e. the point where the original SRM
rheological behavior begins to diverge), and ideally this stability would continue for an extended
time. The addition of SP and HBH stabilized the viscosity of the mixture and nearly returned it to
its original value (see Figure 16 and 18, respectively). The addition of SP decreased the yield
stress while the addition of HBH did not result in any considerable changes to the yield stress. The
GSE did not show promising results since it did not appear to stabilize the SRM viscosity nor yield
stress when added to the host sample, see Figure 17.
_______________________________________________________________________________________ This publication is available free of charge from
: http://dx.doi.org/10.6028/NIS
T.TN.1934

24 | P a g e
Figure 16: Effect of sodium propionate (SP) addition at 0.5% dosage on viscosity (Visc) and yield stress (YS) of SRM 2492. Orange vertical line represents time of biocide addition at age = 21 days. The uncertainty bar is one standard deviation calculated from 3 measurements on the same mixture.
Figure 17: Effect of grapefruit seed extract (GSE) addition at 0.5% dosage on viscosity (Visc.) and yield stress (YS) of SRM 2492. Orange vertical line represents time of biocide addition at age = 35 days. The uncertainty bar is one standard deviation calculated from 3 measurements on the same mixture.
_______________________________________________________________________________________ This publication is available free of charge from
: http://dx.doi.org/10.6028/NIS
T.TN.1934

25 | P a g e
4.4 Biocide Optimization
The following discussions on biocide optimization will use the nomenclature to the biocide
series discussed in Table 3. Results from the preliminary biocide series (section 4.3.1) indicated
that SNS was not a good candidate for further analysis since it was the only biocide of its series
that showed microbial growth with the accelerated method. The SNS is also an expensive solution,
thus not the best for practical use either. On the other hand, the SA and CN both yielded positive
results in the accelerated and normal condition monitoring since no microbial growth was
observed. However, CN showed that the rheological properties were not maintained over 2
months. The plastic viscosity of a sample with CN tends to drop significantly after 2 months as
can be seen from the slopes of the lines in Figure 19. The large viscosity change deemed the CN
solution not desirable since the predictability of the data is affected. The SA resulted being the
Figure 18: Effect of Honey-B-Healthy (HBH) addition at 0.5% dosage on viscosity (Visc) and yield stress (YS) of SRM 2492. Orange vertical line represents time of biocide addition at age = 42 days. The uncertainty bar is one standard deviation calculated from 3 measurements on the same mixture.
_______________________________________________________________________________________ This publication is available free of charge from
: http://dx.doi.org/10.6028/NIS
T.TN.1934

26 | P a g e
most promising option from this series of biocides, but another compound with similar
effectiveness and less toxicity than SA was needed; thus leading this study to observe Sodium
Propionate (SP).
Based on the second series (Biocide Series 2, section 4.3.2), the SP and GSE biocides were
deemed to be more promising than the HBH biocide in applications where the biocide will be
mixed into freshly prepared SRM mixtures. Addition of SP and GSE biocides do not show
considerable change on the yield stress, and provide a lower but more stable viscosity if added to
SRM 2492.
The results from the third analysis series (Biocide Series 3, section 4.3.3) showed that GSE
was to be discontinued from future research in this study since it failed to comply with the
acceptable requirements of both Biocide Series 2 and 3. The HBH showed better results in Series
3 than it did prior in Series 2, since it helped stabilize the viscosity and didn’t affect the yield stress
of SRM 2492 when added into the mix at a later age. Also the SP helped in stabilizing the viscosity
even if added at a later age.
Figure 19: Effect of CN on viscosity of SRM 2492 decreases after 2 months. The uncertainty is 1.69 Pa for shear stress measurements up to 7 days (obtained from the SRM 2492 certificate of analysis).
_______________________________________________________________________________________ This publication is available free of charge from
: http://dx.doi.org/10.6028/NIS
T.TN.1934
27 | P a g e
Based on the results discussed above, further analysis was conducted in order to optimize
the standard practice of using the better biocide selections: SP and HBH. This analysis only
focused on optimizing results based on viscosity stabilization; yield stress was not observed since
the HBH doesn’t affect it, and the SP lowers the yield stress initially but keeps it constant at the
lower value. This would be acceptable as it could be conceived that the SRM certificate be
modified to include a different lower yield stress, if that would increase significantly the shelf-life.
Different dosages of SP and HBH were analyzed with the goal of stabilizing viscosity at a value
close to the original certified SRM 2492 values. As shown in Figure 20 and Figure 21, some
dosages were added at the initial sample mix (shown by filled circles to represent biocide dosage
is present in sample) or introduced at a later age (shown by white circles to represent empty biocide
dosage). The dosages are also labeled along the lines.
Thus, optimization of the biocide requires a dosage that is not too small such that it doesn’t
take effect, like the 0.18 % SP dosage. Also, the dosage shouldn’t be so high that there is too much
liquid content added since that would cause a decreased viscosity as shown by the 0.35 % SP
dosage. All dosages mentioned in this section onward are shown as percentages (%) which were
calculated as mass of biocide per mass of total SRM paste. Therefore, the target dosage of SP could
balance the loss of moisture which resulted being around 0.26 % as shown by the blue line. This
dosage appears to stabilize viscosity effectively enough to bring the viscosity value close to the
desired baseline value. Furthermore, the stability is maintained even if added at later age. However,
for HBH all dosages appeared to behave very similar to the control by gradually increased
viscosity; therefore, is not as reliable a biocide as the SP. Once this instability was noticed, the
observation of that biocide dosage was discontinued.
For best practice when using SRM 2492, SP should be used as the biocide to account for
microbial growth activity that has been noticed to form on the paste after 7 d of storage. As shown
in this study, the SP can be added at a later age (up to 70 d shown in this study) and still stabilize
the viscosity to the paste viscosity value certified for SRM 2492.
_______________________________________________________________________________________ This publication is available free of charge from
: http://dx.doi.org/10.6028/NIS
T.TN.1934

28 | P a g e
Figure 20: Effects of different dosages of Honey-B-Healthy (HBH) on viscosity of SRM 2492. Uncertainties shown for SRM 2492 are based on the certificate of analysis.
Figure 21: Effects on viscosity of SRM 2492 by different dosages of sodium propionate (SP). Uncertainties shown for SRM 2492 are based on the certificate of analysis.
_______________________________________________________________________________________ This publication is available free of charge from
: http://dx.doi.org/10.6028/NIS
T.TN.1934

29 | P a g e
4.5 Effect of Moisture Content on SRM 2492 Shelf-life
During this study an observation was made of water bleeding to the top of the SRM paste
when stored for an extended period of time. Many samples showed a thin layer of water atop the
paste surface after at least a day of resting; the longer the samples were left untouched yielded
thicker layers of bleeding water. This layer does not directly affect the rheological properties of
the SRM 2492 as it is protocol to mix it for 30 s at 300 rpm (31.4 rad/s) prior to any rheological
tests. However, bleed water is problematic from two aspects: (1) bleed water on the surface of the
SRM mixture may promote an environment for microbial growth (2) the plastic storage containers
are not 100 % resistant to moisture evaporation. Thus, the bleed water may slowly evaporate which
ultimately is reducing the water content in the mixture composition and could result in increased
viscosity. Nevertheless, a trend of increased viscosity in the certified values was observed despite
the fact that the values are still within the statistically certified uncertainty. Thus, an investigation
into the storage containers (aspect 2) was conducted to determine if the reason for the increasing
viscosity trend was due to water loss during storage.
4.5.1 Moisture content of SRM 2492
The analysis for moisture loss began by observing the moisture content conducted with
traditional tests of oven drying over time. Figure 22 shows the original composition of SRM 2492
compared to its solely liquid composition (excluding the limestone). Samples of SRM 2492 and
its liquid portion were both monitored over time for changes in moisture content. By independently
analyzing the liquid portion only we are able to observe the contribution that the corn syrup
solution has on the SRM’s moisture losses.
_______________________________________________________________________________________ This publication is available free of charge from
: http://dx.doi.org/10.6028/NIS
T.TN.1934

30 | P a g e
The moisture content tests were conducted on SRM 2492 samples of three different ages: 5
weeks, 17 weeks and 35 weeks old. Each age was represented by 3 test samples which yielded a
mass loss uncertainty of 1 %. Furthermore, the samples were tested by drying them at two
temperature conditions: 40 °C and 100 °C as shown in Figure 23 and 24, respectively. Thus, each
temperature condition contained nine total SRM 2492 samples of various ages which were placed
in the oven and weighed periodically for 14 d. The data points shown in the figures are the periods
when the samples were weighed. Due to operator schedule constraints the 100 °C test presents
more data points than the 40 °C test. It was found that after 14 d the moisture loss reaches a plateau
value, as shown by the slope of the curves. Figures 23 and 24 both highlighted the moisture
content of the 5 weeks old SRM 2492 sample is higher than the water content at 17 weeks and 35
weeks old, regardless of temperature condition tested. This is assumed to be caused by the moisture
losses due to evaporation which is primarily occurring in the first weeks.
Figure 22: Composition of SRM 2492 shown in (left) its entirety and (right) with only the liquid components.
_______________________________________________________________________________________ This publication is available free of charge from
: http://dx.doi.org/10.6028/NIS
T.TN.1934

31 | P a g e
Figure 24: Moisture content available in SRM 2492 samples of different ages, observed via continuous oven-drying at 100 °C. Moisture contents have an uncertainty of 1 % calculated from 3 samples measured at each point.
Figure 23: Moisture content available in SRM 2492 samples of different ages, observed via continuous oven-drying at 40 °C. Moisture contents have an uncertainty of 1 % calculated from 3 samples measured at each point.
_______________________________________________________________________________________ This publication is available free of charge from
: http://dx.doi.org/10.6028/NIS
T.TN.1934

32 | P a g e
The results yielded larger moisture contents when oven-dried at 100 °C compared to
conducting the test at 40 °C. SRM 2492 samples dried at 100 °C yielded moisture contents of about
14 % ± 1 % while the 40 °C samples had moisture contents of about 9 % ± 1 % This occurrence
is also portrayed in the testing of the liquid composition (corn syrup + water only). As shown in
Figure 25 the moisture contents for the liquid portion when oven-dried at 100 °C and 40 °C differ
from 37 % ± 0.5 % to 30 % ± 0.5 %, respectively. These differences of moisture content
calculations can either be due to the higher heat loads at 100 °C being able to drive out amounts
of water from the samples, possibly some decomposition of corn syrup, or a combination of the
two.
4.5.2 Storage container analysis
A series of tests were conducted to determine the effectiveness of the containers in which
the SRM 2492 samples were stored. The analyses measured the loss of mass over time when
storing SRM 2492 paste and compared those results to only storing water in similar containers.
This study analyzed different methods of sealing the storage containers with the intention of
Figure 25: Moisture content observed for liquid composition (diluted corn syrup only) of SRM 2492 at oven-drying conditions of 40 °C and 100 °C. These moisture contents have an uncertainty of 0.5 % calculated from 3 samples measured at each point. _______________________________________________________________________________________
This publication is available free of charge from: http://dx.doi.org/10.6028/N
IST.TN
.1934

33 | P a g e
finding the most effective method to retain the moisture content when stored long periods of time.
These analyses were also studied because if moisture can escape out of the container then air can
enter, which increases the likelihood of microbial growth.
4.5.2.1 Container and sealant types
A variety of containers, lids and sealing methods were analyzed in order to find the sealing
system with the least moisture loss during storage. This analysis looked into altering not only the
material type for the containers and lids, but also observed different methods of sealing the
containers. All the types of components that were analyzed are listed in Table 4 in no particular
order, from which various combinations were observed during this study.
Table 3: Listing of all components analyzed for most effective container sealing system.
Container Types Lid Types Sealant Types
Polypropylene (PP) Normal Plastic film (e.g. Saran Wrap)
Polystyrene (PS) Lined Paraffin wax film
- Alt. Lined Plastic zip bag (e.g. Ziploc bag)
The original container from SRM 2492 certification testing is composed of polypropylene
(PP) with a normal lid, where normal signifies the lid has no special performance of moisture
retention. The alternate container type analyzed in this study differs from the normal container by
the polymer type which is polystyrene (PS). The main difference between PP and PS that will
impact this study is the Moisture Vapor Transmission Rate (MVTR) of each polymer. MVTR is a
measure of the passage of gaseous H2O through a barrier. Thus, a lower MVTR rating represents
a better retention of moisture content. As shown in Table 5, the PS has a high MVTR of 10 while
the PP only has a 0.5 rating. The only advantage a PS container has in this comparison over a PP
container is that PS has better clarity, but impact strength wouldn’t be significantly different
between the two polymers. The increased clarity could allow a better observation of sedimentation
and microbial growth. But the increase in impact strength is more important that the increase in
clarity, thus PP container is preferred to the PS container. The table also compares the MVTR of
those polymers used as sealant systems such as the paraffin wax film. Also shown is the plastic
_______________________________________________________________________________________ This publication is available free of charge from
: http://dx.doi.org/10.6028/NIS
T.TN.1934

34 | P a g e
film (Saran wrap) which is composed of PVDC, and the plastic zip bag (Ziploc bag) which is
composed of polyethylene film.
Table 4: Moisture Vapor Transmission Ratings (MVTR) and basic matter properties of common polymers. MVTR values are in g-mil/100in2/24h. [20, 21] (Typical SI units: g-mil/m2/day = 15 g-mil/100in2/24h.)
Other than changing the container’s polymer type, this study also observed the use of an
alternative lid labelled in this study as “lined lid”. Both the normal and lined lid were obtained
from the same manufacturer and are composed of Polypropylene. However, the lined lid represents
a lid that is more air-tight since it comes with the addition of a PTFE-Faced Foamed Polyethylene
liner adhered on the underside of the lid surface (PTFE: Polytetrafluoroethylene). The polymer
pad fits snugly between the lined lid and the container once closed, thus making the container more
air-tight.
Furthermore, various methods of sealing the containers with materials that are commonly
available were also analyzed, such as plastic film and plastic zip bags. This study also investigated
the use of paraffin wax film wrap since it is a more adhesive type of material. The application of
the paraffin film wrap was executed in two ways, either (1) placed under the cap when closed or
(2) placed on the entire circumference of the container lid (as if taping the lid shut around its edge).
The moisture retention performance for various combinations of the components listed in this
section are discussed in the following sections.
Polymer Type MVTR Clarity Impact Strength
Polypropylene (PP) 0.5 Poor Fair
Polystyrene (PS) 10.0 Excellent Poor
Paraffin Wax Polybutene-1 2.7 Poor N/A
Polyvinylidene Chloride (PVDC) 0.2 Poor N/A
Polyethylene film (LDPE) 0.6 Fair N/A
_______________________________________________________________________________________ This publication is available free of charge from
: http://dx.doi.org/10.6028/NIS
T.TN.1934

35 | P a g e
4.5.2.2 Performance of sealing systems
The effectiveness of the lids was analyzed by observing the evolution of SRM 2492 mass
loss when stored, and assuming some mass loss is due to moisture evaporation. This section
purpose was to explore the limits of the various type of sealing system. Thus, just few tests were
performed and they should be considered more so as a trend rather than definitive values with a
clear uncertainty. First, an analysis was conducted to measure the difference in moisture loss
prevention between the normal and lined lid on a normal container. During this first analysis,
parallel samples were analyzed to observe the effect of mixing protocol on the SRM 2492 sample
when making measurements of mass loss. The parallel analysis allowed us to highlight mass loss
behavior in a more practical scenario since an SRM user would in fact be required to re-mix their
sample prior to making rheological measurements. As shown in Figure 26, all samples
experienced mass loss due to evaporation, as expected. When interpreting the figure, the lines with
circle data points signify a normal lid was used during storage while square data points represent
a lined lid was applied. In regards to mixing protocol, the solid data points mean the samples were
re-mixed prior to measuring such data point, while open data points represent a sample that was
never re-mixed prior to mass measurements. These preliminary single data point results highlight
a reduction in moisture loss when using the lined lid given that both of the samples with lined lids
(samples C and D) showed the lowest mass losses regardless of mixing protocol. The effect of re-
mixing a sample stored in a normal, unlined container (sample A) showed reduction in moisture
loss compared to not re-mixing the sample (sample B). This supports the idea that water evaporates
more easily (moisture is lost) from the bleed layer formed during storage then from a well-mixed
specimen, because re-mixing prevents the amount of water in the bleed layer to grow. On the other
hand, when re-mixing an SRM sample stored in a lined container (sample C) the opposite effect
occurs, and an increase in moisture loss compared to not re-mixing (sample D) occurs. This is
likely due to the paste’s exposure to air when opening the container to conduct the re-mixing and
rheological testing. Furthermore, the lined container is able to maintain its original composition
fairly well, so any exposure to air will result in more moisture loss compared to keeping the lined
lid closed by not re-mixing. When measuring the specimen for mass loss and the container was
remixed, the mass was measured before and after to ensure that any material lost on the mixing
blade was considered.
_______________________________________________________________________________________ This publication is available free of charge from
: http://dx.doi.org/10.6028/NIS
T.TN.1934

36 | P a g e
It is evident from the Figure 26 that the use of a lined lid is recommended for standard
practice when using SRM 2492 and intending on storing for future use even for less than 7 d.
Nonetheless, a second analysis was conducted on two unmixed samples to verify the effectiveness
of using a lined lid versus a normal lid. As shown in Figure 27, the use of a lined lid can reduce
the loss of moisture from being nearly 3 % in 20 d down to under 0.5 %.
Figure 26: Mass losses of SRM 2492 samples recorded over time to show water content evaporated when stored increases with time. These are single measurements, the uncertainty is estimate from the balance precision at 0.01%. Circles represent normal lid was used during storage; squares represent lined lid.
Solid data were re-mixed pre-measurement; open data were unmixed samples.
A Normal Test DayB Normal NoneC Lined Test DayD Lined None
Code Lid typeMixing
Protocol
_______________________________________________________________________________________ This publication is available free of charge from
: http://dx.doi.org/10.6028/NIS
T.TN.1934

37 | P a g e
Next, an analysis on containers with only water was conducted in order to focus the results
on the effectiveness of moisture loss prevention, since it is safe to assume from previous results
that much of the mass loss during SRM 2492 storage is due to moisture evaporation. This set of
analysis compares the use of the normal lid, lined lid, plastic zip bag and plastic film to seal the
water-filled containers. The lined lid yielded the lowest moisture losses, keeping the loss under
0.05 % mass loss at 21 d (see Figure 28). The application of a plastic zip bag and/or plastic film
caused a higher loss in water compared to the normal container.
Figure 27: Moisture loss when storing SRM 2492 reduced significantly by application of lined lid. These are single measurements, the uncertainty is estimate from the balance precision at 0.01 %.
_______________________________________________________________________________________ This publication is available free of charge from
: http://dx.doi.org/10.6028/NIS
T.TN.1934

38 | P a g e
A final series of moisture loss analysis was conducted in which the two container types (PP
and PS) were also included in the combination of sealing systems analyzed, shown in Figure 29.
Furthermore, an additional lid type was included during this final series which was labelled
“Alternative Lined Lid” since it is also a PVC lid, however from a new source whose identity is
irrelevant to the results. The original Lined Lid is still included in the following analysis, but the
Alternative Lined Lids were ordered due to the effectiveness shown from the original’s results.
Furthermore, this final set of sealing system analysis replaced the use of Saran wrap for a more
adhesive paraffin film wrap.
Refer to the legend below Figure 29 for important notes on interpreting the results. The PS
container resulted having higher losses of moisture compared to the original PP container, as
expected due to PS having a higher MVTR. On the other hand, the use of paraffin film wrap
resulted in good retention of moisture. In fact, the samples with paraffin film wrap around the lid’s
circumference yielded the lowest moisture losses (gold-bordered circles) similar to the PP
Figure 28: Various methods of sealing the containers were analyzed using plastic film, plastic zip bag or a combination. None of which retained moisture more effectively than the normal or lined lid. These are single measurements, the uncertainty is estimate from the balance precision at 0.01 %.
_______________________________________________________________________________________ This publication is available free of charge from
: http://dx.doi.org/10.6028/NIS
T.TN.1934

39 | P a g e
container with a lined lid (purple line). These results were promising for the paraffin film wrap
since it performed as well as the lined lid, of which the latter was expected to be the best sealing
system based on the previous results discussed. In conclusion, the use of a lined lid or paraffin wax
film are able to keep moisture losses under 0.05 % by mass.
Figure 29: Evolution of moisture loss (by % mass) show high losses in the PS containers. These are single measurements, the uncertainty is estimate from the balance precision at 0.01 %.
Legend (Fig 29): Codes shown on table represent the colors for lines portrayed in figure above. PP types are represented by the circles, while
PS are shown as squares. Containers with lined lids have black borders
around the circle/square, while unlined lids shown by white borders.
Containers with paraffin wax film wrap shown with gold borders around circles.
A PP Unlined NoneB PS Unlined NoneC PP Lined NoneD PS Alt Lined NoneE PP Alt Lined NoneF PP Alt Lined CircumferenceG PP Alt Lined Under capH PP Unlined Circumference
Code Container type
Lid type Film wrap
_______________________________________________________________________________________ This publication is available free of charge from
: http://dx.doi.org/10.6028/NIS
T.TN.1934

40 | P a g e
4.5.2.3 Summary of storage container analysis
The high MVTR of the PS container caused higher losses of moisture compared to the
original PP container, therefore the former is not recommended for use with SRM 2492. The
original PP containers resulted being the best choice in terms of having one of the lowest MVTRs,
and are recommended for storage of SRM 2492. The results from the moisture analysis enabled
this study to recommend that SRM 2492 should be stored in polypropylene (PP) containers, and
preferably in combination with a lined lid and possibly with the addition of paraffin film wrap to
seal the lid. More importantly, the finding of this recommended practice helped explain the cause
of increased viscosities found at later ages of the SRM 2492 life (during storage), in addition to
the microbial activity visible after 7 d. The use of lined lid can serve as the solution to restraining
evaporation from the bleeding layer which forms due to the natural occurrence of particle
sedimentation caused by gravity. In conclusion, the use of a lined lid helps minimize moisture loss,
minimizes changes of SRM2492 moisture content during storage and could prevent undesired
viscosity increases.
_______________________________________________________________________________________ This publication is available free of charge from
: http://dx.doi.org/10.6028/NIS
T.TN.1934

41 | P a g e
5 Recommended Standard Practice for Storage of SRM 2492
Before the microbial activity visible at 7 d, another issue dominates the paste behavior which
is the bleeding of water due to particle sedimentation; this phenomenon creates a layer of water at
the top surface of the SRM 2492 sample. The formation of such bleeding layer could be providing
an environment for microbial activity to grow; whose presence then increases the viscosity of the
sample as well as makes the rheological data less predictable. Furthermore, the container in which
the samples are stored appear to lose moisture over time, which depletes the water in the bleeding
layer. The moisture loss of the aqueous layer results in increased viscosity of the entire SRM
mixture. These issues encouraged this study to develop methods that minimize moisture loss.
The most effective method evaluated of minimizing moisture loss during storage resulted
being the use of a low MVTR plastic, like polypropylene (PP), combined with a lined lid. Applying
this as standard practice for storage of SRM 2492 increases the likelihood that the water content
won’t change significantly when the paste is re-used past the sample’s certified age of 7 d. The
bleeding of the water alone does not affect the rheological properties as the SRM needs to be
remixed for 30 s at 300 rpm (31.4 rad/s) prior to every usage.
This study provided mitigation issues for the moisture factor which occurs in the first 7 d,
and solutions to microbial activity which occurs after 7 d. While this study showed that sterilization
of all equipment and materials worked well in keeping viscosity stable, it was deemed a complex
process for user-friendliness. Therefore, based on the results from the Biocide Series, sodium
propionate (SP) is recommended for use during future work on this SRM since it showed the most
promising results.
This study will allow some changes in the certificate of the SRM 2492 to include how to
better store the material after mixing by using the proper container and lid. Nevertheless, more
tests would be needed before recommending the use of a biocide, as full statistical analysis would
need to be conducted.
_______________________________________________________________________________________ This publication is available free of charge from
: http://dx.doi.org/10.6028/NIS
T.TN.1934

42 | P a g e
6 Conclusion
An analysis on various methods to extend the shelf life and reduce variability of paste
reference material, SRM 2492 was conducted. It was observed throughout this study that microbial
activity is visible at about 7 d after mixing a SRM 2492 sample. Therefore, an analysis on various
methods to extend the shelf life of the paste reference material were conducted. Heat treatment
sterilization was found to be adequate in reducing microbial growth, but was deemed too complex
for user-friendliness. Chemical stabilization through use of biocides, particularly sodium
propionate (SP), was found to be effective in extending the shelf life of SRM 2492 by preventing
microbial growth. This study focused not only on considering the effectiveness of the biocides to
stabilize rheological results (for better predictability), but also considered the simplicity of
practicing these methods at any sample age. Therefore, the use of SP proved to be the most
effective method to account for microbial growth and extend the shelf life of SRM 2492. As for
the moisture loss prevention, it is recommended to store the SRM 2492 in polypropylene
containers with lined lids. Alternatively, the application of paraffin film wrap around the
circumference of the closed lid provides an effective method to minimize moisture loss.
_______________________________________________________________________________________ This publication is available free of charge from
: http://dx.doi.org/10.6028/NIS
T.TN.1934

43 | P a g e
7 References
[1] C. F. Ferraris and L. E. Brower, "Comparison of concrete rheometers: International tests at LCPC (Nantes, France) in October 2000 (NISTIR 6819)," National Institute of Standards and Technology, Gaithersburg, MD.
[2] C. F. Ferraris and L. E. Brower, "Comparison of concrete rheometers: International tests at MB (Cleveland OH, USA) in May 2003 (NISTIR 7154)," National Institute of Standards and Technology , Gaithersburg, MD.
[3] C. F. Ferraris , P. Stutzman, J. Winpigler and W. Guthrie, "Certification of SRM 2492: Bingham Paste Mixture for Rheological Measurements," SP-260-174 Rev. 2012, June 2012.
[4] A. Olivas, C. F. Ferraris, W. F. Guthrie and B. Toman , "Re-certification of SRM 2492: Bingham Paste Mixture for Rheological Measurements," National Institute of Standards and Technology. (NIST Special Publication 260-182). U.S. Department of Commerce, Gaithersburg, MD, August 2015.
[5] J. Richter, "Development of a Reference Material for Calibration of Cement Paste and Mortar Rheometers," Technische Bergakademie Freiberg, Institut fur Kermaik, Glas- und, Baustofftechnik, Saxony, Germany, 2012.
[6] A. Olivas , C. F. Ferraris, N. S. Martys, E. J. Garboczi and B. Toman, "Certification of SRM 2493: Standard Reference Mortar for Rheological Measurements," NIST SP 260-xxx, 2015.
[7] "Certificate of Analysis - Standard Reference Material 2492 - Bingham Paste Mixture for Rheological Measurements," https://www-s.nist.gov/srmors/certificates/2492.pdf?CFID=43361335&CFTOKEN=c97579bb82935c97-040078EA-DA85-4BEF-25F4DEBA53DB58AA, 2015.
[8] A. C, M. S and B. NP, "Antioxidant activity of grapfruit seed extract on vegetable oils," Science of Food and Agriculture , vol. 77, no. 4, pp. 463-467, 1998.
[9] M. Ganzera, A. Aberham and H. Stuppner, "Development and Validation of an HPLC/UV/MS Method for Simultaneous Determination of 18 preservatives in Grapefruit Seed Extract," Agricultural and Food Chemistry, vol. 54, pp. 3768-3772, 2006.
[10] L. Reagor, J. Gusman, L. McCoy, E. Carino and J. P. Heggers, "The Effectiveness of Processed Grapefruit-Seed Extract as an Antibacterial Agent: I.," Alternative and Complementary Medicine, vol. 8, no. 3, pp. 325-332, 2002.
[11] J. Behnsen, E. Deriu, M. Sassone-Corsi and H. Ralfetellu, "Probiotics: Properties, examples, and specific applications.," Perspectives in Medicine, no. http://perspectivesinmedicine.cshlp.org/content/3/3/a010074.full, 2013.
[12] N. I. o. A. a. I. Diseases, 30 April 2012. [Online]. Available: http://www.niaid.nih.gov/topics/antimicrobialresistance/examples/gramnegative/Pages/default.aspx.
_______________________________________________________________________________________ This publication is available free of charge from
: http://dx.doi.org/10.6028/NIS
T.TN.1934

44 | P a g e
[13] J. P. Heggers, J. Cottingham, J. Gusman, L. Reagor, L. McCoy, E. Carino, R. Cox and J.-G. Zhao, "The Effectiveness of Processed Grapefruit-Seed Extract as An Antibacterial Agent: II. Mechanism of Action and In Vitro Toxicity," Alternative and Complementary Medicine, vol. 8, no. 3, pp. 333-340, 2002.
[14] B. Noel and J. Amrine, "HONEY B HEALTHY Feeding Stimulant with Essential Oils," bee-commerce.com.
[15] Chemwatch, Material Safety Data Sheet: Sodium Azide 0.05% Solution, Version 2.0, 2007.
[16] L. S. Chang S., "Human health effects of sodium azide exposure: a literature review and analysis," Int J Toxicol. , vol. 22, no. 3, pp. 175-186, 2003.
[17] M. L. Snyder and H. C. Lichstein, "Sodium Azide as an Inhibiting Substance for Gram-Negative Bacteria," The Journal of Infectious Diseases, Vol. 67, No. 2, 1940.
[18] M. Ahamed , M. AlSalhi and M. K. Siddiqui, "Silver nanoparticle applications and human health," Clinica Chimica Acta, no. 411, pp. 1841-1848, 2010.
[19] M. A. Rao, S. S. Rizvi and A. K. Datta, "Engineering Properites for Foods," CRC Press, p. 81, 2005.
[20] Aplha Packaging , "www.alphap.com/plastics-comparison," 2015. [Online]. [Accessed 02 2016].
[21] Sorbentsystems, "www.sorbentsystems.com/barrier_film_properties.htm," 2014. [Online]. [Accessed 2016].
_______________________________________________________________________________________ This publication is available free of charge from
: http://dx.doi.org/10.6028/NIS
T.TN.1934