cellular mobile in india: competition and policy
TRANSCRIPT

1
WORKING PAPER NO: 353
Cellular Mobile in India: Competition and Policy
Subhashish Gupta Associate Professor
Economics & Social Science
Indian Institute of Management Bangalore
Bannerghatta Road, Bangalore – 5600 76
Ph: 080-26993030
Year of Publication 2011

2
Introduction
Telecommunications in India has been one of the success stories of economic reforms that
increased GDP growth to 9% from the earlier “Hindu rate of growth” of 3%. The number of
telephone connections per one hundred people, or teledensity, has increased from a low of
0.81 in 1994 to 64.34 at the end of 20102. By most standards this is a creditable achievement.
The growth in telecommunication services has also been spectacular clocking some of the
fastest growth rates in the world. A closer look at the sector though reveals a less rosy
picture.
It has become fashionable to compare China and India across most parameters of economic
growth and well being. Here, as with other parameters, India does not compare favourably. In
2009 India’s mobile teledensity was 43.48 while that of China’s was 55.973. India also
compares unfavourably with other Asian neighbours.4 It could of course be argued that given
her late start and current robust growth rates she will catch up, sooner rather than later. Yet,
there are other misgivings. One is the sorry state of rural teledensity5 and another is the lack
of broadband penetration6. Further, the telecommunications sector seems to get embroiled in
political problems from time to time. Currently, the Controller and Auditor General of India
(CAG) has suggested that in the last round of allocation of 2G spectrum using administrative
procedures rather than an auction has led to substantial loss of revenue to the government.
One estimate7 has pegged it at 176645 crores8 (1.76 trillion Rupees). Regardless of the truth
of the charge this event has caused some turmoil in the telecommunications sector leading to
the resignation of the telecommunications minister and calls for cancellation of licenses.
Clearly events of this kind should affect the health of this sector. However, nothing much
seems to have happened. It is as if the key drivers of this sector are so strong that minor
hiccups don’t make a dent. The other possibility is that if such events had been avoided then
telecommunications growth would have been even higher and conditions healthier.
In this paper I aim to take a closer look at the cellular mobile segment from the standpoint of
competition and policy. The usual assumption is that the cellular mobile segment enjoys
strong competition. It would be useful to try and take a closer look at that assumption. It is
also intriguing that the Telecommunications Regulatory Authority of India (TRAI) while not
interfering on a regular basis does, at times regulate tariffs on the basis of insufficient
competition. The rationale behind the TRAI’s decision seems to be based on casual
observation of behaviour and not on robust analysis. The fact that now India has a
3
Competition Commission that is up and running makes the situation even more interesting.
Anti-competitive behaviour is also the preserve of the Competition Commission of India
(CCI). How the two agencies will coordinate their decisions in the future will be interesting
to observe. Other actors like the Department of Telecommunications (DOT), the parent
ministry, the incumbent state operators, BSNL and MTNL, also keep the plot ticking over.
Competition
The trend towards increasing competition in all segments of the telecommunications industry
worldwide is unmistakable, even though the degree of competition varies. The International
Telecommunications Union (ITU) estimates that 90% of countries have competition in the
markets for mobile and internet services9. It should be noted though allowing competition
does not necessarily translate into the presence of meaningful competition. Often countries
are not sufficiently proactive in their efforts to establish competition since they see little
virtue in competition as such, being more interested in matters such as teledensity and
universal coverage. It is also the case that incumbent telecom operators, whether state owned
or private, have no interest in the development of competition and in fact try their best to
thwart it. The result is that even after the introduction of competition, incumbent operators
tend to dominate.
In terms of the institutional arrangements that have an impact on the sector, 157 countries
possess a telecommunications regulator by the end of 2010, up from 106 in 200010. A large
number of countries also have separate competition authorities and competition laws. The
competition laws have standard proscriptions against anti-competitive agreements, abuse by
dominant firms and mergers and acquisitions. Network externalities, a fundamental feature of
telecommunications, make it vulnerable to monopolization. An individual subscriber to a
telephone network derives benefits from being connected to a larger network since he is able
to connect to a larger number of persons. The incumbent state operators typically have the
largest networks due to historical reasons.11Effective interconnection rules are required to
ensure non-discriminatory access to rival networks.
Most countries around the world, particularly developing ones, are concerned with providing
access to the telecommunications network to all its citizens, termed Universal Service
Obligations (USO). Access to telecommunications services is seen to be a driver for greater
prosperity.12 It is felt that reliance on the market alone would not deliver access to
4
telecommunications services to the poor. The state would have to step in to provide access for
preserving equity. Equally, the presence of externalities could lead to market failure whereby
the size of the network is less than what it should be. Government policies designed to correct
the market failure is a possibility. A potential problem with government intervention,
particularly cross-subsidization, is that it could distort competition. Recently efforts are being
made to design subsidies in a way that is neutral in its effect on competition.
Some parts of the telecommunications sector are characterized by large sunk costs,
particularly the fixed-line part. This acts as a barrier to entry by private operators. Often, the
incumbent operator is the sole repository of expertise in engineering and network
management. Also, as a government operator it is sometime more trusted than private
operators. Further, presence of scale and scope economies, established sales and distribution
networks and the benefits of vertical integration all serve to strengthen the dominant position
of the incumbent.
Regulators have often sought to discipline dominant incumbent operators, in order to foster
competition by a number of methods. Perhaps, the most benign of these is to mandate
separate accounts for the different businesses that the operator runs. It has been the practice in
the past, and India is no exception, for dominant operators to cross-subsidize their local basic
services from long distance operations. Accounting separation provides some hope of
discovering the extent of such cross-subsidization. More stringent remedies would include
vertical or horizontal structural separation, line of business restriction and the most extreme
of all, divestiture. Typically, governments baulk at such drastic interventions, because of the
irreversible nature of such decisions and the risk of getting it wrong. Further, size is seen as
being important to compete effectively in a globalised world. Finally, it is sometimes argued
that incumbent operators have been the first to introduce innovations13. Restricting incumbent
operators could have a detrimental effect on the dynamism of the industry14.
The dynamism inherent in the industry has made governments less inclined to rely on
competition authorities for market development.15 Since competition authorities typically act
ex-post their actions may be too delayed to be effective. Sector specific regulators have often
introduced competition law principles into their regulations. These include mandated
interconnection and access obligations. Regulators have also moved away from specific taxes
to a broader based funding of universal service obligations. Further, they have often
introduced more onerous burdens on the incumbent operators. For instance incumbent

5
operators have been mandated to provide access to the local loop on a non-discriminatory
basis but cable TV providers, who provide a substitute to the local loop, are usually not
required to do the same. The issue of local access has been a vexing problem from the point,
among others, of internet access. The same is true of the pricing practices of internet
backbone providers.
Measuring the extent of competition in telecommunications markets is a difficult task. The
problem lies in both in the metrics to be used and the market segments to be looked at.
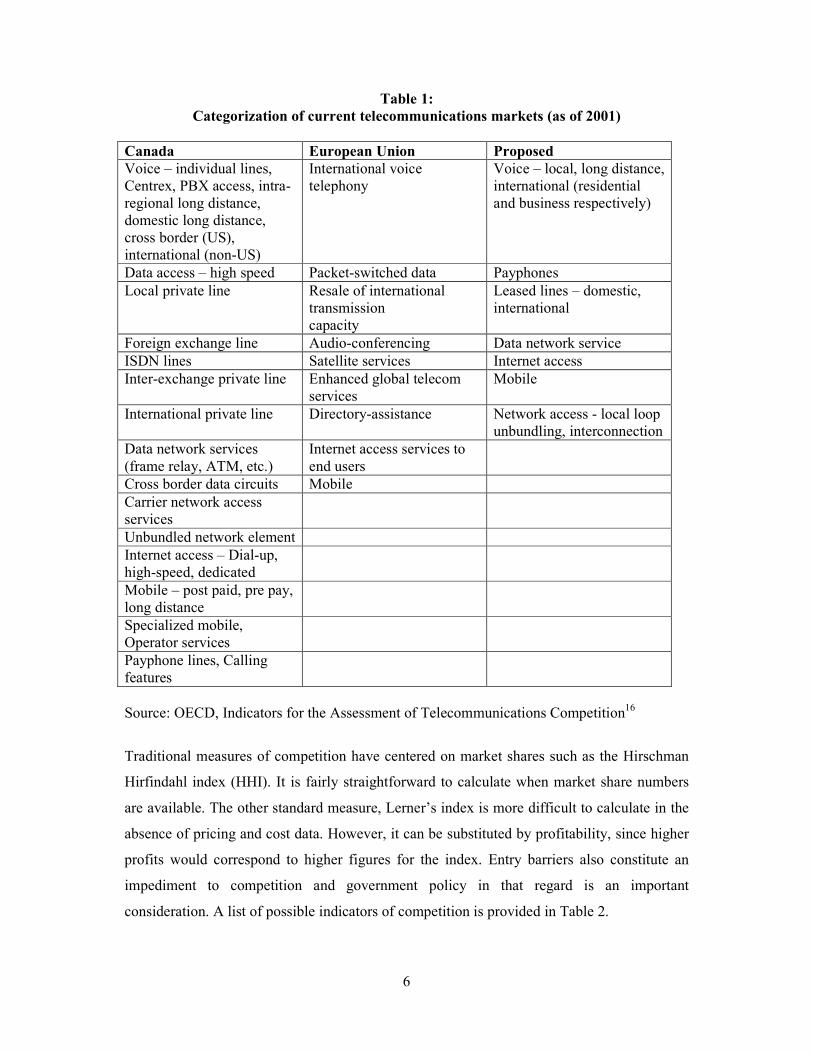
Market segmentation can be done on the basis of products or geographically or both.
Segmentation on the basis of products is difficult without knowing the substitution
possibilities between products. If two products are very good substitutes for each other then
there is no point in treating them as different. Increasing convergence in telecommunications
technologies are making some product divisions redundant. Table 1 shows suggested product
definitions for Canada, EU and one that the OECD favours. A broader definition of the
market will automatically lead to a larger number of firms being included and that could
throw up measures that overstate the amount of competition.
6
Table 1:
Categorization of current telecommunications markets (as of 2001)
Canada European Union Proposed
Voice – individual lines, Centrex, PBX access, intra-regional long distance, domestic long distance, cross border (US), international (non-US)
International voice telephony
Voice – local, long distance, international (residential and business respectively)
Data access – high speed Packet-switched data Payphones
Local private line Resale of international transmission capacity
Leased lines – domestic, international
Foreign exchange line Audio-conferencing Data network service
ISDN lines Satellite services Internet access
Inter-exchange private line Enhanced global telecom services
Mobile
International private line Directory-assistance Network access - local loop unbundling, interconnection
Data network services (frame relay, ATM, etc.)
Internet access services to end users
Cross border data circuits Mobile
Carrier network access services
Unbundled network element
Internet access – Dial-up, high-speed, dedicated
Mobile – post paid, pre pay, long distance
Specialized mobile, Operator services
Payphone lines, Calling features
Source: OECD, Indicators for the Assessment of Telecommunications Competition16
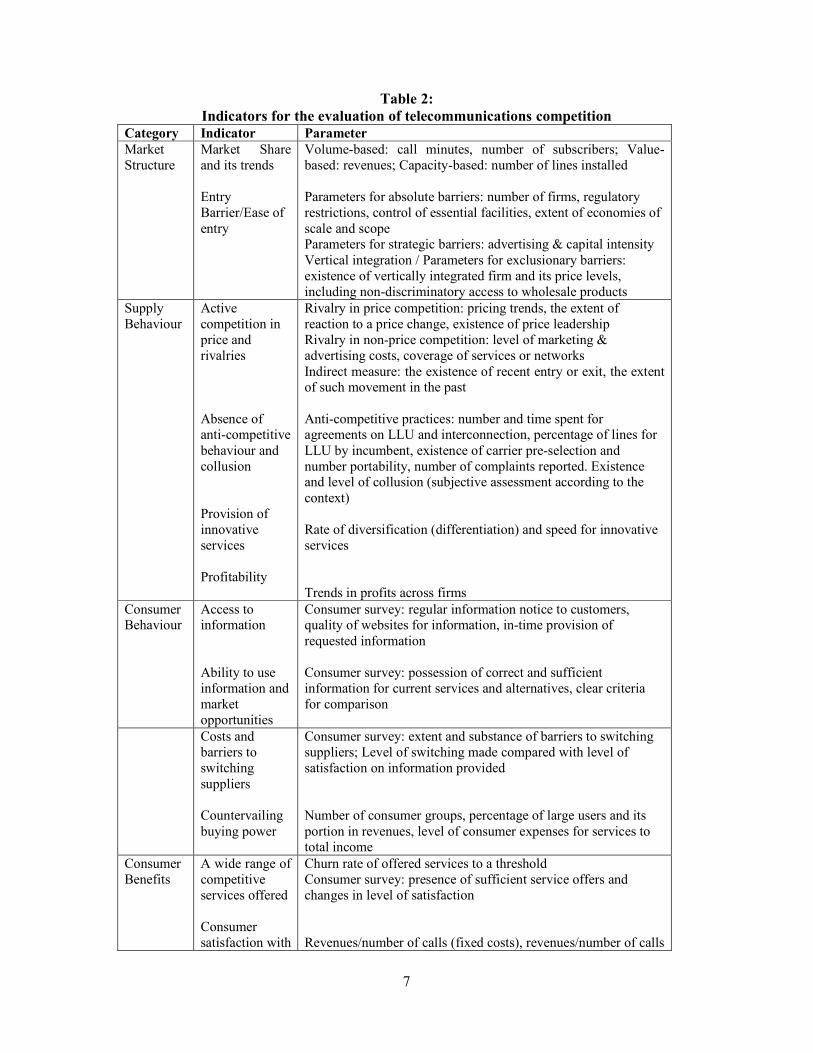
Traditional measures of competition have centered on market shares such as the Hirschman
Hirfindahl index (HHI). It is fairly straightforward to calculate when market share numbers
are available. The other standard measure, Lerner’s index is more difficult to calculate in the
absence of pricing and cost data. However, it can be substituted by profitability, since higher
profits would correspond to higher figures for the index. Entry barriers also constitute an
impediment to competition and government policy in that regard is an important
consideration. A list of possible indicators of competition is provided in Table 2.
7
Table 2:
Indicators for the evaluation of telecommunications competition
Category Indicator Parameter
Market Structure
Market Share and its trends Entry Barrier/Ease of entry
Volume-based: call minutes, number of subscribers; Value-based: revenues; Capacity-based: number of lines installed Parameters for absolute barriers: number of firms, regulatory restrictions, control of essential facilities, extent of economies of scale and scope Parameters for strategic barriers: advertising & capital intensity Vertical integration / Parameters for exclusionary barriers: existence of vertically integrated firm and its price levels, including non-discriminatory access to wholesale products
Supply Behaviour
Active competition in price and rivalries Absence of anti-competitive behaviour and collusion Provision of innovative services Profitability
Rivalry in price competition: pricing trends, the extent of reaction to a price change, existence of price leadership Rivalry in non-price competition: level of marketing & advertising costs, coverage of services or networks Indirect measure: the existence of recent entry or exit, the extent of such movement in the past Anti-competitive practices: number and time spent for agreements on LLU and interconnection, percentage of lines for LLU by incumbent, existence of carrier pre-selection and number portability, number of complaints reported. Existence and level of collusion (subjective assessment according to the context) Rate of diversification (differentiation) and speed for innovative services Trends in profits across firms
Consumer Behaviour
Access to information Ability to use information and market opportunities
Consumer survey: regular information notice to customers, quality of websites for information, in-time provision of requested information Consumer survey: possession of correct and sufficient information for current services and alternatives, clear criteria for comparison
Costs and barriers to switching suppliers Countervailing buying power
Consumer survey: extent and substance of barriers to switching suppliers; Level of switching made compared with level of satisfaction on information provided
Number of consumer groups, percentage of large users and its portion in revenues, level of consumer expenses for services to total income
Consumer Benefits
A wide range of competitive services offered Consumer satisfaction with
Churn rate of offered services to a threshold Consumer survey: presence of sufficient service offers and changes in level of satisfaction Revenues/number of calls (fixed costs), revenues/number of calls

8
price and affordability Consumer satisfaction with the quality of services
minutes Consumer survey: price adequacy, affordability, simplicity and ease in rate structure Call completion/congestion/disruption rate, time for installation and repair, number of faults, number of reported complaints Consumer survey: level of quality, areas of concerns, the reason for low quality service
Source: OECD, Indicators for the Assessment of Telecommunications Competition
17
Developments in India
Introduction of private operators in provision of telecommunication services began in 1995.
The government, concerned with the dismal teledensity figures allowed private operators to
offer local calling on fixed lines. Not surprisingly there was not that much enthusiasm from
private operators. They were much more enthusiastic when the government opened up the
cellular mobiles service to private parties. In their enthusiasm these operators bid fairly large
sums for their licenses and soon found that their expectations of revenues had been too
optimistic. The government was faced with a situation where the mobile operators would
have to default on their payments and their licenses would have to be cancelled. Faced with
the crisis the government in 1999 responded with a new telecom policy that mandated
moving to a revenue share regime where the operators were to pay their license fees through
a share of their revenues over a 20 year period18. This policy document also made important
changes in the role of the regulator. Since then the telecommunications sector has witnessed
strong growth in most parts. The growth in mobile services has been exceptional with
subscriber numbers crossing the 500 million mark.
The government slowly opened up different parts of the telecommunications sector, increased
the number of operators and introduced policies that increased competition. In 2000 the
domestic long distance, usually referred to as national long distance (NLD), market was
opened up to private operators19. It also separated out the operations part of the Department
of Telecommunications (DOT), named it Bharat Sanchar Nigam Limited (BSNL) and
changed its status to a corporate body owned by the government. BSNL and MTNL20 were
allowed to enter the cellular mobile market. It also created the Wireless Planning and
Coordination wing in DOT for overseeing spectrum allocation. The Telecom Regulatory
Authority of India (TRAI) Act was amended to allow it complete authority to regulate tariffs
and interconnection. It made it mandatory to seek the TRAI’s view on issues pertaining to
entry. The dispute settlement role of the TRAI was hived off to a newly created Telecom
9
Dispute Settlement Appellate Tribunal (TDSAT). Next year a fourth operator was allowed
entry and the year after, the International Long Distance (ILD) market was opened up. The
incumbent state operator for ILD, Videsh Sanchar Nigam Limited (VSNL) was privatized.
An USO fund was set up under the DOT, funded through a 5% tax on revenues. The steps
taken by the government in this period served to provide the structure that would allow
competition and growth in telecommunications.
The next few years saw an active TRAI using its powers to regulate tariffs and foster
competition. First it classified interconnection charges into origination, termination and
carriage. It then imposed price ceilings for all of these for basic, cellular and limited mobility.
It also introduced an Access Deficit Charge (ADC) on all types of calls to compensate BSNL
for operating in rural areas. However, by 2005 the TRAI began phasing out the ADC and by
2007 had reduced it to fairly low amounts. The TRAI introduced the Calling Party Pays
(CPP), a move that was credited with a sharp increase in the number of mobile subscribers.
The government also played its part. The customs duties on capital goods for
telecommunications were reduced to 15% and that on cell phones reduced to 5%. It also
allowed foreign direct investment up to 74%. The Unified Access License regime was
implemented allowing any operator to offer services using any technology and the Broadband
Policy was unveiled. The industry also responded to these moves. Reliance Communications
offered connections bundled along with phones and offered prices as low as Rs. 0.40 per
minute. Motorola launched its first made in India phone for Rs. 1700.
From 2006 onwards the narrative has been one of relentless increase in the number of
subscribers, strong competition and growth. In 2006 India became the fifth country to cross
the 100 million mark and it overtook China as fastest growing telecom market in the world.
In 2008 India overtook USA in terms of number of subscribers and the number is now more
than 500 million. Vodafone acquired Hutchison Telecom India’s 67% stake for USD 19.3
billion and Bharati became the third largest mobile operator in the world. Tata Teleservices in
a strategic move introduced per second billing and others followed. Previously customers
would be billed per minute, so that even if a customer talked for a few seconds the whole
minute would be charged. Obviously, increased competition was directly beneficial to
consumers.
10
As the number of subscribers rose operators began suffering from a lack of spectrum. A
possible method of alleviating this problem was to allow them to share towers. Even though it
raised the possibility of collusion, the government allowed it. The use of both GSM and
CDMA by the same license was also allowed and the government gave the go ahead for
mobile number portability. The TRAI reduced the roaming rental to zero and sharply reduced
roaming tariffs. 2010 saw successful auctions of 3G licenses with the government earning Rs.
67718.95 crores (USD 14.78 billion) for the government. The latest development involves the
allegation by the CAG that the previous communications minister, Mr. A. Raja, might have
bent the rules to provide licenses to some favoured investors. It is alleged that some of these
investors had no interest in telecommunications and only applied to get scarce spectrum that
was then resold at a profit. Mr. Raja has had to step down and the government and the TRAI
are trying to cancel the licenses of some of the operators who have defaulted on roll-out
commitments. The result has been that the industry and the entire political system have been
thrown into turmoil. Several members of Parliament, including the erstwhile minister, have
been incarcerated while the matter is being heard in the courts.
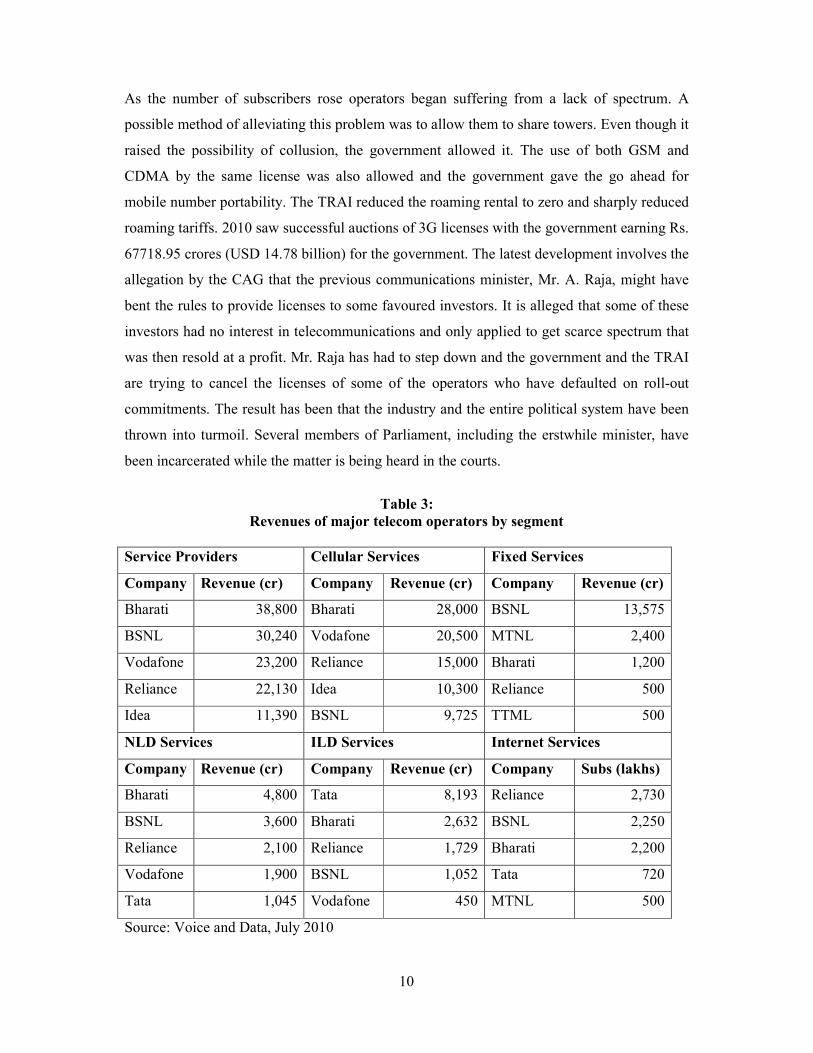
Table 3:
Revenues of major telecom operators by segment
Service Providers Cellular Services Fixed Services
Company Revenue (cr) Company Revenue (cr) Company Revenue (cr)
Bharati 38,800 Bharati 28,000 BSNL 13,575
BSNL 30,240 Vodafone 20,500 MTNL 2,400
Vodafone 23,200 Reliance 15,000 Bharati 1,200
Reliance 22,130 Idea 10,300 Reliance 500
Idea 11,390 BSNL 9,725 TTML 500
NLD Services ILD Services Internet Services
Company Revenue (cr) Company Revenue (cr) Company Subs (lakhs)
Bharati 4,800 Tata 8,193 Reliance 2,730
BSNL 3,600 Bharati 2,632 BSNL 2,250
Reliance 2,100 Reliance 1,729 Bharati 2,200
Vodafone 1,900 BSNL 1,052 Tata 720
Tata 1,045 Vodafone 450 MTNL 500
Source: Voice and Data, July 2010
11
A glance at Table 3 shows the predominance of Bharati which operates under the Airtel
brand. It has the highest revenue and is among the top 3 in every segment. The incumbent
state operator is now in second place in terms of revenues. It still retains its leadership in the
fixed wire-line segment and that remains its main source of revenues. This is in contrast to
other providers who rely on mobile for most of their revenues. Fixed services, a primary
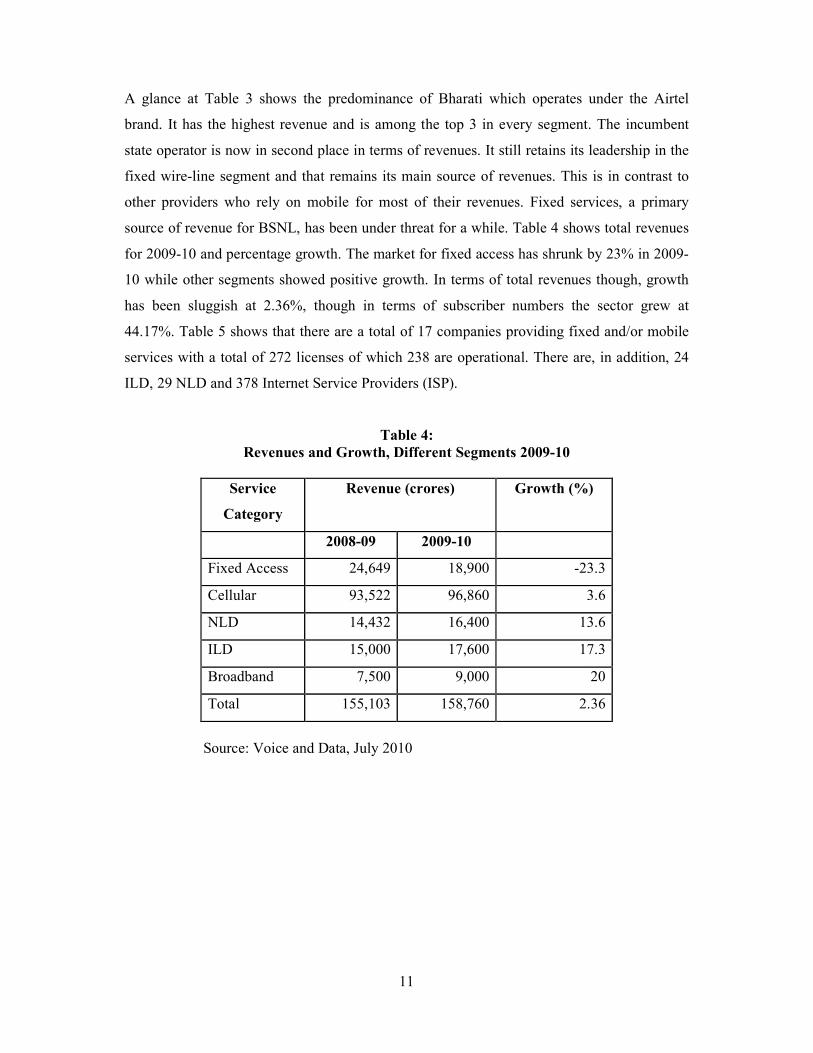
source of revenue for BSNL, has been under threat for a while. Table 4 shows total revenues
for 2009-10 and percentage growth. The market for fixed access has shrunk by 23% in 2009-
10 while other segments showed positive growth. In terms of total revenues though, growth
has been sluggish at 2.36%, though in terms of subscriber numbers the sector grew at
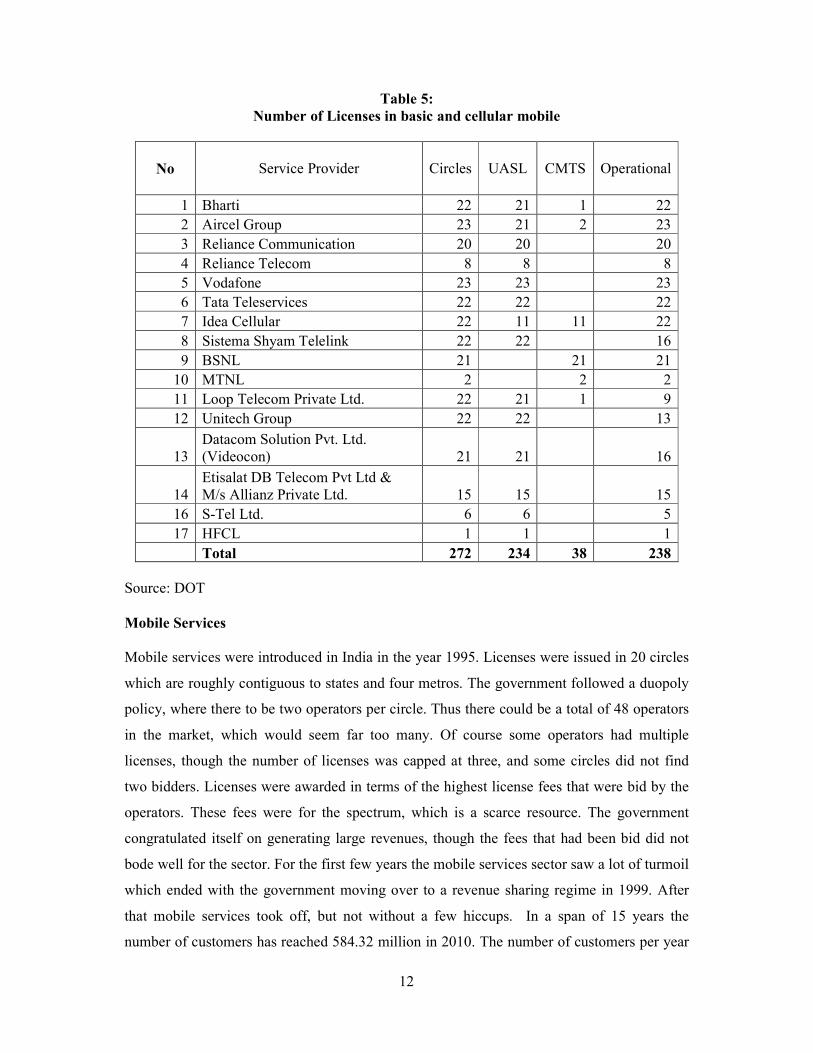
44.17%. Table 5 shows that there are a total of 17 companies providing fixed and/or mobile
services with a total of 272 licenses of which 238 are operational. There are, in addition, 24
ILD, 29 NLD and 378 Internet Service Providers (ISP).
Table 4:
Revenues and Growth, Different Segments 2009-10
Service
Category
Revenue (crores) Growth (%)
2008-09 2009-10
Fixed Access 24,649 18,900 -23.3
Cellular 93,522 96,860 3.6
NLD 14,432 16,400 13.6
ILD 15,000 17,600 17.3
Broadband 7,500 9,000 20
Total 155,103 158,760 2.36
Source: Voice and Data, July 2010
12
Table 5:
Number of Licenses in basic and cellular mobile
No Service Provider Circles UASL CMTS Operational
1 Bharti 22 21 1 22
2 Aircel Group 23 21 2 23
3 Reliance Communication 20 20 20
4 Reliance Telecom 8 8 8
5 Vodafone 23 23 23
6 Tata Teleservices 22 22 22
7 Idea Cellular 22 11 11 22
8 Sistema Shyam Telelink 22 22 16
9 BSNL 21 21 21
10 MTNL 2 2 2
11 Loop Telecom Private Ltd. 22 21 1 9
12 Unitech Group 22 22 13
13 Datacom Solution Pvt. Ltd. (Videocon) 21 21 16
14 Etisalat DB Telecom Pvt Ltd & M/s Allianz Private Ltd. 15 15 15
16 S-Tel Ltd. 6 6 5
17 HFCL 1 1 1
Total 272 234 38 238
Source: DOT
Mobile Services
Mobile services were introduced in India in the year 1995. Licenses were issued in 20 circles
which are roughly contiguous to states and four metros. The government followed a duopoly
policy, where there to be two operators per circle. Thus there could be a total of 48 operators
in the market, which would seem far too many. Of course some operators had multiple
licenses, though the number of licenses was capped at three, and some circles did not find
two bidders. Licenses were awarded in terms of the highest license fees that were bid by the
operators. These fees were for the spectrum, which is a scarce resource. The government
congratulated itself on generating large revenues, though the fees that had been bid did not
bode well for the sector. For the first few years the mobile services sector saw a lot of turmoil
which ended with the government moving over to a revenue sharing regime in 1999. After
that mobile services took off, but not without a few hiccups. In a span of 15 years the
number of customers has reached 584.32 million in 2010. The number of customers per year

13
is shown in table 6 and Figure 1 shows the current state of the market. There have been wide
variations in the growth rates across the years and the peaks and troughs can be associated
with specific events. For example the peak growth of 159.84% in 2004 can be associated with
Reliance’s entry into the market with very aggressive marketing schemes.
Table 6:
Subscribers per year
Year Number Growth (%) Year Number Growth (%)
1996 0.06 2004 33 159.84
1997 0.38 533.33 2005 52.4 58.79
1998 0.88 131.58 2006 90.8 73.28
1999 1.20 36.36 2007 156.57 72.87
2000 2.46 105 2008 205.5 30.92
2001 3.57 45.12 2009 391.76 90.64
2002 7.00 96.08 2010 584.32 49.15
2003 12.7 81.43
Source: Voice and Data
Figure 1:
Total subscribers per operator21
From Figure 1 we can get a snapshot of the mobile market in 2010. There are 7 fairly large
operators and 8 very small ones. Among the large ones Bharati predominates while Reliance
and Vodafone are neck and neck at second place. BSNL, Tata and Idea are some distance
behind with Aircel bringing up the rear. The 8 small operators are mostly ones who have just
0
20,000,000
40,000,000
60,000,000
80,000,000
100,000,000
120,000,000
140,000,000
160,000,000
Total subscribers

14
begun their operations. MTNL is a government operator, initially formed to provide fixed
access services only in Delhi and Mumbai. The government is interested in merging MTNL
within BSNL. The all India picture can hide regional differences. For example Figure 2
shows Aircel as the largest operator in Tamil Nadu while Figure 3 shows that Idea
predominates in Kerala. The circles also differ in their growth rates as seen in Figure 4. In
October 2010 Bihar witnessed the highest growth rate. It could be surmised that Bihar being
one of the poorer states, is exhibiting high growth because coverage is lower than in other
states and consequently there is more room for growth. The same may be true of Madhya
Pradesh. This thesis does not explain why the next highest growth rate is in Karnataka,
Gujarat and Delhi. There is obviously a complex interplay between demographic factors,
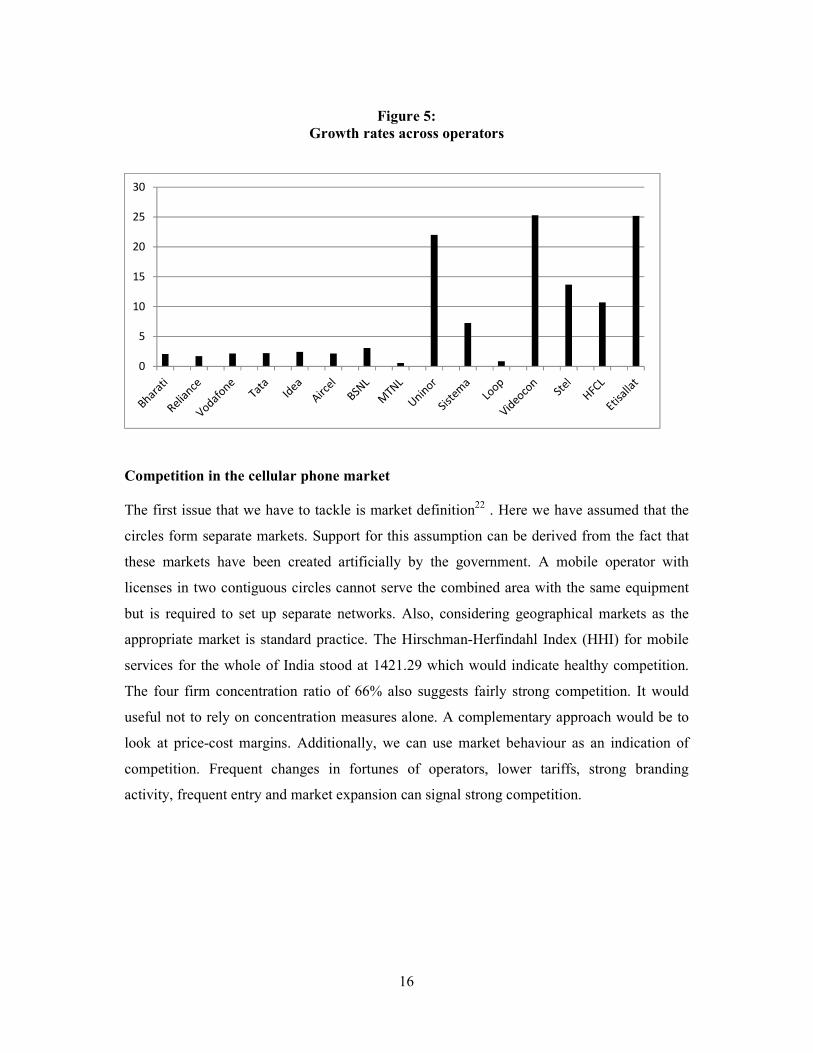
economic factors and growth rates. When we compare growth across operators, in Figure 5, it
is the new entrants that have grown the fastest.
Figure 2:
Subscribers in Tamil Nadu
0
2000000
4000000
6000000
8000000
10000000
12000000
14000000
16000000
18000000
20000000

15
Figure 3:
Subscribers in Kerala
Figure 4:
Growth rates across circles (October 2010)
0
1000000
2000000
3000000
4000000
5000000
6000000
7000000
0
5
10
15
20
25
30
35
40
16
Figure 5:
Growth rates across operators
Competition in the cellular phone market
The first issue that we have to tackle is market definition22 . Here we have assumed that the
circles form separate markets. Support for this assumption can be derived from the fact that
these markets have been created artificially by the government. A mobile operator with
licenses in two contiguous circles cannot serve the combined area with the same equipment
but is required to set up separate networks. Also, considering geographical markets as the
appropriate market is standard practice. The Hirschman-Herfindahl Index (HHI) for mobile
services for the whole of India stood at 1421.29 which would indicate healthy competition.
The four firm concentration ratio of 66% also suggests fairly strong competition. It would
useful not to rely on concentration measures alone. A complementary approach would be to
look at price-cost margins. Additionally, we can use market behaviour as an indication of
competition. Frequent changes in fortunes of operators, lower tariffs, strong branding
activity, frequent entry and market expansion can signal strong competition.
0
5
10
15
20
25
30
17
Figure 6:
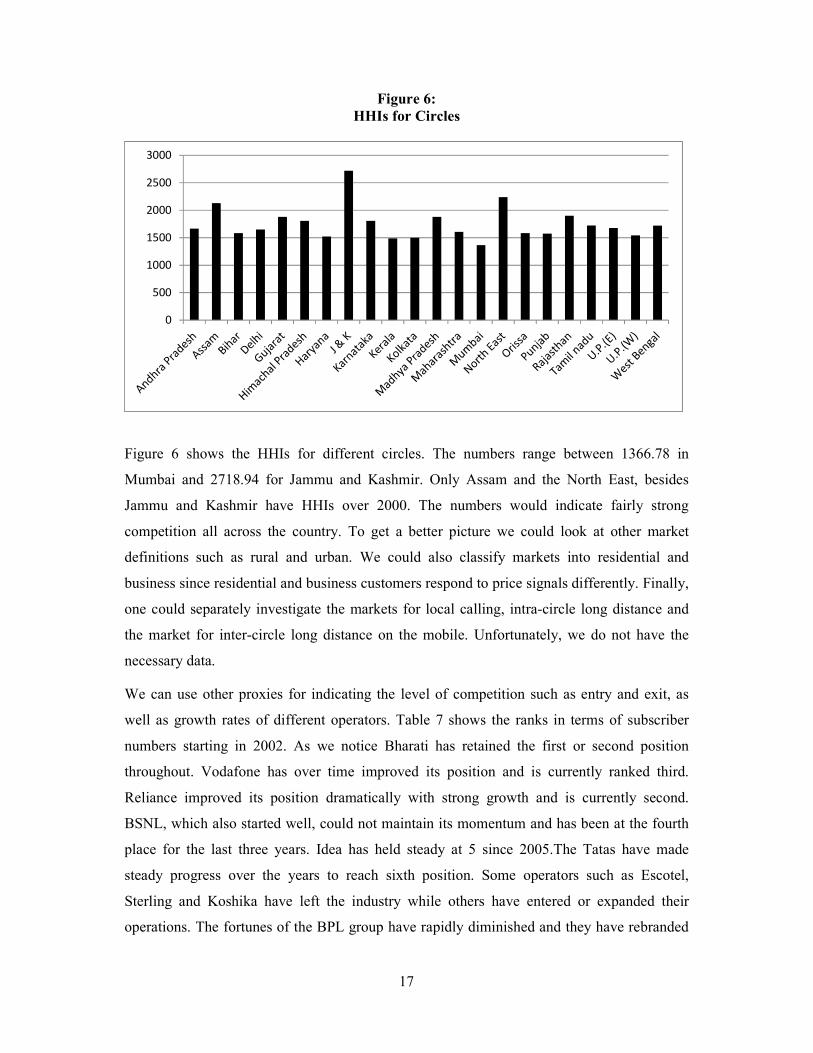
HHIs for Circles
Figure 6 shows the HHIs for different circles. The numbers range between 1366.78 in
Mumbai and 2718.94 for Jammu and Kashmir. Only Assam and the North East, besides
Jammu and Kashmir have HHIs over 2000. The numbers would indicate fairly strong
competition all across the country. To get a better picture we could look at other market
definitions such as rural and urban. We could also classify markets into residential and
business since residential and business customers respond to price signals differently. Finally,
one could separately investigate the markets for local calling, intra-circle long distance and
the market for inter-circle long distance on the mobile. Unfortunately, we do not have the
necessary data.
We can use other proxies for indicating the level of competition such as entry and exit, as
well as growth rates of different operators. Table 7 shows the ranks in terms of subscriber
numbers starting in 2002. As we notice Bharati has retained the first or second position
throughout. Vodafone has over time improved its position and is currently ranked third.
Reliance improved its position dramatically with strong growth and is currently second.
BSNL, which also started well, could not maintain its momentum and has been at the fourth
place for the last three years. Idea has held steady at 5 since 2005.The Tatas have made
steady progress over the years to reach sixth position. Some operators such as Escotel,
Sterling and Koshika have left the industry while others have entered or expanded their
operations. The fortunes of the BPL group have rapidly diminished and they have rebranded
0
500
1000
1500
2000
2500
3000

18
themselves as Loop Mobile. Five new operators started operations in the last two years and it
is too early to study their impact on the market.
Table 7:
Ranks of operators by subscriber numbers
RANK
Operators 2002 2003 2004 2005 2006 2007 2008 2009 2010
Bharati 1 1 2 1 2 1 1 1 1
Vodafone 2 4 5 4 4 4 2 3 3
BPL 3 6 6 7 8 12 11 - -
Idea 4 5 4 5 5 5 5 5 5
Escotel 5 8 - - - - - - -
Spice 6 7 8 8 11 11 9 - -
Sterling 7 - - - - - - - -
Reliance 8 3 1 2 1 2 3 2 2
Fascel 9 9 9 10 9 9 - - -
MTNL 10 11 11 11 10 10 10 9 9
Usha Martin 11 - - - - - - - -
RPG 12 12 - - - - - -
Aircel 13 10 7 6 7 7 - 7 7
Hexacom 14 14 12 12 12 - - - -
Koshika 15 - - - - - - -
BSNL 16 2 3 3 3 3 4 4 4
Dishnet - - - - 13 8 - - -
Escorts - - - - 16 - - - -
HFCL - 16 13 13 14 13 12 12 14
TTML - 13 10 9 6 6 6 8 8
Shyam - 15 14 14 15 14 13
TTSL 6 6
Loop 10 12
Sistema 11 11
Uninor 10
Stel 13
Etisallat 15
Source: Voice and Data
Table 8 shows the growth rates of different operators across the years. Bharati, Reliance,
Vodafone, Idea, TTSL and Aircel have retained fairly healthy growths over the years. Among
the top 5 BSNL’s growth rate has been declining over the years. Idea, which has been steady
at the 5th position, has grown through acquisitions. Loop is the new avatar of BPL and
Sistema has merged with Shyam. There are a number of new entrants, as noted earlier, and
naturally they have grown the fastest. What is remarkable is that the top 2, Bharati and

19
Reliance have posted growth rates over 100 in 2009. This may be an indication that these two
are pulling ahead, a hunch that is reinforced by the financial data in table 9.
Table 8:
Growth rates of operators (%)
Operators 2003 2004 2005 2006 2007 2008 2009
Bharati 118.87 62.4 78.3 89.7 66.9 51.5 127.52
Reliance 384.33 43.9 65.6 60.9 64.4 72.67 102.42
BSNL 123.79 65.2 81.6 51.4 46 27.9 33.2
Vodafone/Hutch 138.34 51.5 68.1 72.1 66.9 55.9 46.7
Idea 113.49 36.3 45.4 90.1 71.3 52.5 48.4
BPL 66.62 36.7 8.9 -20.1 20.6 Loop
Spice 88.89 314.69 34 41.5 54.2 Idea
Aircel 128.08 70.9 48.3 111.1 92.6 74.1 99.6
Escotel 70.53 Idea
TTSL 324.27 73 345 135.7 117.4 43.3 90.3
MTNL 29.09 93.9 105.2 38.2 28.4 26.9 13.6
Hexacom 53.73 Bharati
HFCL 2.82 -16.7 20 16.7 900 30
Shyam/Sistema - -62.5 0 0 57.1 445.5 526
TTML 95.8 48.7 76.5
Loop 67.4 31.5
Source: Voice and Data
Table 9:
Revenues and profits (Rs. millions)
Financial Year Financial Year Financial Year
Company 2006-07 2007-08 2008-09
Revenue Profit Revenue Profit Revenue Profit
BSNL 397.15 78.06 380.47 30.09 358.12 5.75
Bharati 185.20 42.57 270.25 76.01 373.52 80.44
MTNL 55.82 4.66 54.07 5.07 45.77 2.15
Tata Communications 86.11 0.02 82.63 -0.28 99.63 1.92
Tata Teleservices (Maharashtra) Limited
14.07 -3.11 17.07 -1.26 20.46 -1.70
RCOM 144.68 31.63 190.68 54.01 222.51 62.49
Idea Cellular 43.87 5.02 67.37 10.42 101.54 8.82
Shyam/Sistema 2.40 -0.41 1.17 -1.81 1.28 -5.91
Source: Voice and Data
It should be noted that Vodafone does not disclose earnings data so we can’t know for sure.
We see BSNL’s profits have steadily declined and a loss in terms of subscriber base and the
20
declining fortunes of their fixed access business indicates problems down the horizon. The
mystery is why none of the other operators have been able to replicate the success of Bharati
and Reliance. It is reported that Bharati has an EBIDTA (Earnings before Interest, Taxes,
Depreciation and Amortization) of 40% and it manages to achieve this figure pricing calls at
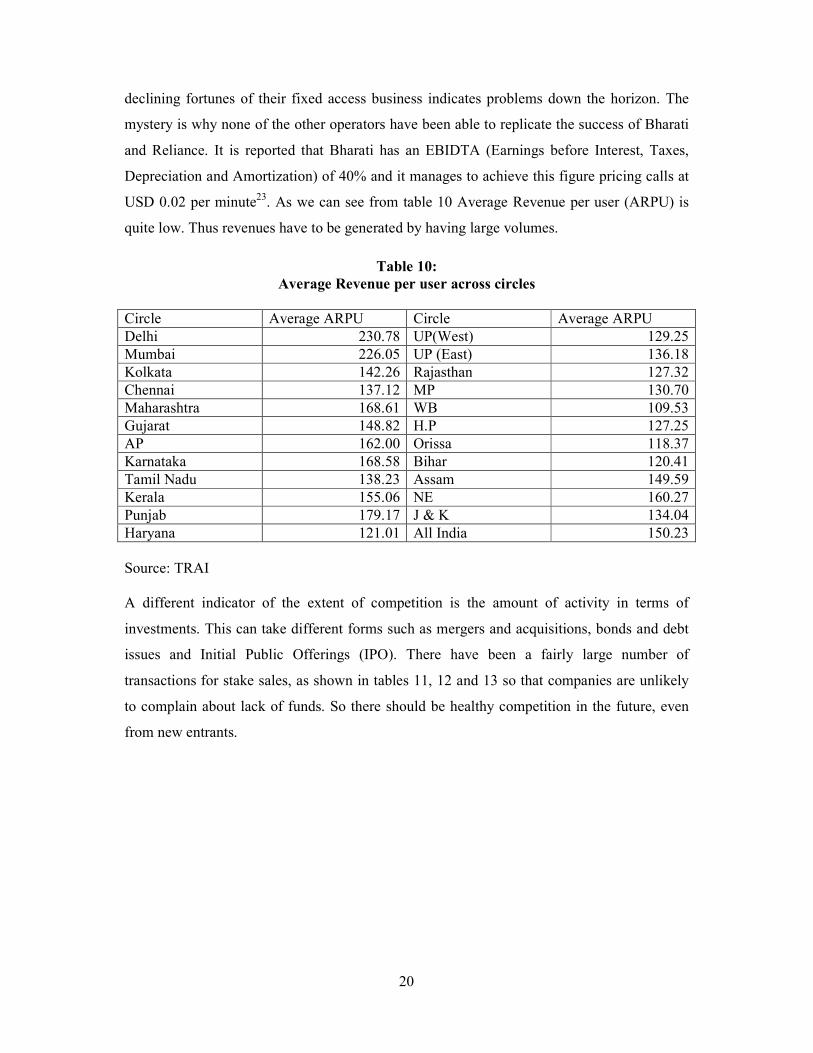
USD 0.02 per minute23. As we can see from table 10 Average Revenue per user (ARPU) is
quite low. Thus revenues have to be generated by having large volumes.
Table 10:
Average Revenue per user across circles
Circle Average ARPU Circle Average ARPU
Delhi 230.78 UP(West) 129.25
Mumbai 226.05 UP (East) 136.18
Kolkata 142.26 Rajasthan 127.32
Chennai 137.12 MP 130.70
Maharashtra 168.61 WB 109.53
Gujarat 148.82 H.P 127.25
AP 162.00 Orissa 118.37
Karnataka 168.58 Bihar 120.41
Tamil Nadu 138.23 Assam 149.59
Kerala 155.06 NE 160.27
Punjab 179.17 J & K 134.04
Haryana 121.01 All India 150.23
Source: TRAI A different indicator of the extent of competition is the amount of activity in terms of
investments. This can take different forms such as mergers and acquisitions, bonds and debt
issues and Initial Public Offerings (IPO). There have been a fairly large number of
transactions for stake sales, as shown in tables 11, 12 and 13 so that companies are unlikely
to complain about lack of funds. So there should be healthy competition in the future, even
from new entrants.

21
Table 11:
Stake sales in Telecom companies
Stake Sales (2008-2009)
Year Acquiring Company Target Company Equity Stake (%) Deal Value
2009 Telenor Unitech Wireless 67.25 Rs. 61.2 billion
Sahara Group S Tel 11.70 Rs. 2.5 billion
Bahrain Telecommunications S Tel 6.30 Rs. 1.25 billion
Emirates Telecommunications Etisalat DB 5.27 Rs. 3.8 billion
2008 Idea Cellular
Spice Communications 49.00 Rs. 281.4 billion
Tata Communications Neotel 30.00 NA
NTT DOCOMO Tata Teleservices 26.00 Rs. 130.7 billion
Telenor Unitech Wireless 60.00 Rs. 61.2 billion
Etisalat Swan Telecom 45.00 $ 900 million
Sistema JFSC ShyamTelelink 63.71 NA
Source: Voice and Data
Table 12:
Financing
Key bond and debt issues (2008-2009)
Year Company Type of debt/bond Deal Size
2009 Vodafone Essar Loan Rs. 100 billion
Aircel Loan Rs. 143 billion
Unitech Wireless Loan Rs. 50 billion
ETHL Communications Bonds Rs. 42.8 billion
Indus Towers Loan Rs. 100 billion
2008 Reliance Communications Loan and lines of credit $ 150 million
Quippo Telecom Infrastructure Limited Loan $ 185 million
Idea Cellular Loan $ 100 million
GTL Infrastructure Loan $ 150 million
Reliance Communications Loan $ 750 million
Source: Voice and Data

22
Table 13:
Initial Public Offerings
Key telecom IPO's
Company Month Issue price Issue size
Amount
raised Oversubscription
(Rs per share)
(million shares)
(Rs million) (times)
Idea Cellular Feb 2007 75 325.83 24437.50 50.00
Spice Communications Jun 2007 46 113.10 5202.60 37.00
Onmobile Global Jan 2008 440 10.90 4796.24 10.90
Source: Voice and Data It is difficult to reach a definite conclusion on the level of competition. On the positive side
there are a large number of players and some circles have up to 12 operators. HHIs and four
firm concentration ratios indicate healthy competition in all circles. There is not too much
discrepancy in terms of market shares among the top 6 firms. There has also been a fair
amount of entry and all the operators are flush with funds. On the negative side the steady
decline of BSNL, one of the top 6, is a cause for worry. A second cause for worry is the
difference in profits between the top 2 and the rest. It is true that prices in India are among the
lowest in the world but even then Bharati and Reliance managed to post very high EBIDTA.
Policy
The extent of competition that can be achieved is dependent on institutional factors,
particularly in a country like India, where the government’s reach can be substantial. The
policies adopted by the government and its attitude towards competitive forces shape the
actual level of competition. Other institutions such as the legal system and regulatory bodies
affect the nature of competition as well24.
The starting point should be to articulate the government’s view on competition.
Unfortunately, in India, with its tradition of a mixed economy, the attitude to competition and
a market economy has been ambivalent. The emphasis is often geared towards policy goals
and competition is often a by-product, sometimes unwelcome, of the process. The policy
developments in the telecommunications sector illustrate this notion quite well. When in
1994, the government took the first tentative steps to liberalize the sector competition did not
figure as either an outcome to be desired or a means to achieve an outcome.
23
The government set out its policy in 3 pages stating such objectives as the need to connect all
villages and to provide affordable services. It then decided on concrete goals such as
“telephones to be available on demand by 1997”25 and that in urban areas a public call office
(PCO) would be provided for every 500 persons. The government’s estimate of the funds
needed amounted to Rs. 23,000 crores which it clearly did not have and could not raise. So
“private initiative would be used to complement the Departmental efforts.” Thus the entry of
private players was not designed to provide competition. In fact the DOT viewed itself as the
primary provider of telecommunications services and private players would only operate on
the fringes and most importantly provide it with resources garnered through license fees for
its own expansion plans.
The government was quite willing to let the DOT orchestrate developments in the
telecommunications sector for the next four years. In the meanwhile private participation in
basic services did not take off and the cellular mobile sector was in a mess. Another major
development was the setting up of the regulator, TRAI. Initially, the DOT wanted the
regulator to be a part of the DOT and subservient to it. Fortunately, the government deemed
fit to make it independent, but not too independent. In the initial years DOT contested
TRAI’s jurisdiction over it and fought a number of battles over tariff regulation. The TRAI
was not provided with licensing powers and could not arbitrate disputes between the DOT
and other private operators. The government also saw no reason to overhaul the antiquated
1885 Indian Telegraph Act.
The problems besieging the telecommunications sector prompted the government to take a
fresh look at the sector. The result was the New Telecom Policy of 1999. This document
observed, “Result of privatization has so far not been entirely satisfactory.” For the first time
it mentioned as one of the objectives the need to “transform in a time bound manner, the
telecommunications sector to a greater competitive environment in both urban and rural areas
providing equal opportunities and level playing field for all players.” The most important step
was the movement to revenue sharing, which provided much needed relief to the cellular
mobile sector. It also removed a number of constraints in operations of private operators. The
national long distance market was opened to private participation and cable operators were
allowed to provide telecommunications services. The TRAI’s powers were strengthened and
a separate dispute settlement body, the TDSAT, was set up. Finally, DOT was divided into
DTS, the operator from the DOT, which was to be the policy making body. It suggested that
24
DTS should eventually stop functioning as a government department and operate as a
commercial entity. This was eventually done.
NTP 99 had a strong pro-competitive message as it substantially eased entry restrictions and
strengthened the regulator by clearly setting out its powers. Soon after VSNL, the state
owned international long distance monopoly operator was privatized and its monopoly ended.
The government also came out with a bill, the Communications Convergence Act 2000, to set
up a unified regulator for all communications services, with even more powers for the
regulator. This bill, however, has not been passed by the parliament and its current status is
unknown. In the meanwhile broadcasting services have been brought under the purview of
the TRAI.
The actions of the government may suggest that it suffers from schizophrenia. It is important
to note that the government is not a monolith. Various constituents of the government often,
hopefully inadvertently, work at cross purposes to each other. Quite often the actions of other
ministries affect the telecommunications sector. For instance private operators are supposed
to have rights of way to lay cables at par with the BSNL. Yet they often faced harassment
from the Ministry of Environment. The finance ministry reduced the duty on handsets which
boosted the fortunes of mobile operators. At other times the same ministry determined that all
those who own mobile phones would have to file income tax returns, a move that reduced the
number of connections. Such, policy decisions often provide a competitive edge to some
operators to the detriment of others. The effect on competition does not seem to be
considered in making these decisions.
The other players in the policy environment have been the DOT, the Communications
ministry and the prime minister’s office (PMO). The views of the communications ministry
seem to depend on the minister in charge. Even though the DOT has a strong influence on the
ministry an independent minister can ignore the DOT’s advice. The problem though is with
the role the minister chooses to play and to what extent he can affect the market.
A previous minister, Mr. Dayanidhi Maran, is credited with persuading the government to
increase the FDI cap to 74%, which was a pro-competitive move. He also managed to get
BSNL to reduce its tariffs and badgered private mobile operators to reduce roaming rates.
This form of intervention in the market, even if it is well intentioned and beneficial to the
consumer, can increase the risk profile of investors and eventually prove harmful. Finally, the

25
prime minister’s office (PMO) was credited with the creation of the NTP 99. Again, one
wonders whether it is the PMO’s business to micro manage other ministries. It is certainly
possible that he might have to intervene at times but surely a broad pro-competitive policy
stance should have provided a clear direction to the ministry.
The issue of spectrum allocation caused a fair amount of stir. For a while spectrum was
allocated on the basis of subscriber numbers and the technology used. The entrenched
operators, who typically operated on the GSM standard, would have liked this practice to
continue as it would inhibit entry and cement their current positions. The newer entrants,
prominent among them the Tata group, wanted spectrum to be made available based on
auctions.26 This had been interpreted as a fight between GSM and CDMA operators, though it
is better interpreted as a fight between older and newer operators. The existing operators also
opposed allowing firms to offer both GSM and CDMA services and were in favour of
capping the number of operators. Their argument was that larger numbers of operators reduce
the efficient use of spectrum. Taking this argument to its logical conclusion one could argue
that mobile telephony is a natural monopoly and so there should be only one mobile operator.
Spectrum allocation is probably best done through properly designed auctions. It has been
argued that high spectrum bids eventually find their way into high prices. The problem is that
it is difficult to find an alternative to auctions.
The two other approaches are to depend on executive decision, which is difficult, time-
consuming and prone to manipulation or lotteries. It was the use of executive power to
implement a first come first serve (FCFS) process in the last allocation of 2G spectrum that
caused the previous telecom minister’s downfall. Charges were made that particular firms
were given spectrum out of turn and that the prices were too low. Also, some of the
beneficiaries had no interest in telecommunications, being real estate firms, and they merely
got spectrum at a low price and promptly resold it a handsome profit. Lotteries are also
problematic since typically there are a large number of applicants and the market in second-
hand spectrum may not work efficiently.
The telecom regulator, TRAI has usually not interfered with pricing, usually practicing
“forbearance”. Its approach has usually been pro competitive, as when it grappled with the
issue of telecom operators charging their own customers at a different rate than other
operator’s customers. Sometimes though, it has been a bit too intrusive. Some time back it
concluded that there was not sufficient competition in the market for roaming and that the

26
operators were colluding to keep charges high. The TRAI came to this conclusion after a very
cursory analysis of the data. This is an issue where the TRAI could have approached the
Competition Commission for advice.
The last issue pertaining to policy matters is the behaviour of BSNL. Like most incumbents it
tried to make life difficult for the new entrants. To some extent it was thwarted by the TRAI
and successive ministers. It was also not helped by its large workforce and its inherent
inefficiency. Dealing with BSNL and MTNL will be an issue in the future, particularly since
they have most of the fixed access network that is important for higher broadband
penetration.
Conclusion
This paper set out to examine the cellular mobile success story in India. In comparison with
other regional countries there might be reason to be less ecstatic. On the other hand the
growth in the number of subscribers remains unabated, adding some 17 million every month.
There are a large number of operators and investments are pouring in. For the near future, at
least, competition in cellular mobile is likely to be healthy and the numbers of subscribers
continue to grow. At the same time issues of governance have from the beginning troubled
this sector and that has continued till the present time.

27
1 National Telecom Policy 1994, Government of India, Ministry of Communications and Information Technology, Department of Telecommunications, http://www.dot.gov.in/ntp/ntp1994.htm 2 Government of India, Ministry of Communications and Information Technology, Department of Telecommunications, Network Status, http://www.dot.gov.in/networkstatus.htm 3 International Telecommunications Union, Free Statistics, Mobile Phone Subscriptions, http://www.itu.int/ITU-D/ict/statistics/index.html 4 In 2009 Pakistan’s mobile teledensity was 55.53 and that of Sri Lanka was 78.89. International Telecommunications Union, Free Statistics, Mobile Phone Subscriptions, http://www.itu.int/ITU-D/ict/statistics/index.html 5 Rural teledensity stood at 30.18, while urban teledensity was 143.95 by the end of 2010. Government of India, Ministry of Communications and Information Technology, Department of Telecommunications, Network Status, http://www.dot.gov.in/networkstatus.htm 6 The broadband density is 0.9, while the internet users’ density is 7.5. International Telecommunications Union, Free Statistics, Mobile Phone Subscriptions, http://www.itu.int/ITU-D/ict/statistics/index.html 7 Controller and Auditor General of India, Performance Audit Report on the Issue of Licenses and Allocation of 2G Spectrum by the Department of Telecommunications, Ministry of Communications and Information Technology, http://cag.gov.in/html/reports/civil/2010-11_19PA/Telecommunication%20Report.pdf 8 1 crore is equivalent to 10 million, 1 lakh is equivalent to 1, 00,000. This paper uses all these terms. 9 ITU Statshot, Issue 5, January 2011, http://www.itu.int/net/pressoffice/stats/2011/01/index.aspx 10 ITU Statshot, Issue 5, January 2011, http://www.itu.int/net/pressoffice/stats/2011/01/index.aspx 11 Competition Policy in Telecommunications, Background Paper, 2002, Telecommunications Regulation Handbook, Module 5, Competition Policy, World Bank. 12 An econometric analysis of the impact of mobile, Professor Rajat Kathuria, Dr. Mahesh Uppal and Mamta in India: The Impact of Mobile Phones, Moving the debate forward • The Policy Paper Series • Number 9 • January 2009 13 Competition Policy in the New High-Tech, Global Marketplace, FTC, 1996, http://www.ftc.gov/opp/global/report/gc_v1.pdf 14 Vickers, J. Competition Policy and Innovation, A speech to the International Competition Policy Conference, Oxford, By John Vickers, Director General of Fair Trading, U.K., 27 June 2001 15 Audretsch, David B, Baumol, William J and Burke, Andrew E., Competition Policy in Dynamic Markets, International Journal of Industrial Organization, 19 (2001), 613-634. 16 Indicators for the Assessment of Telecommunications Competition, Working Party on Telecommunication and Information Services Policies, Committee for Information, Computer and Communications Policy, Directorate for Science, Technology and Industry, Organisation for Economic Co-operation and Development, DSTI/ICCP/TISP(2001)6/FINAL, 17-Jan-2003, http://www.oecd.org/dataoecd/4/22/2496809.pdf 17 Indicators for the Assessment of Telecommunications Competition
28
18 New Telecom Policy 1999, Government of India, Ministry of Communications and Information Technology, Department of Telecommunications, 19 The information on telecommunications in India has been collected from various editions of Voice and Data, Tele.net, the Hindu Business Line and other publications. 20 Mahanagar Telecom Nigam Limited (MTNL) had earlier been created to serve the cities of Delhi and Mumbai. 21 TRAI, (Press Release No. 66 /2010, New Delhi, 24th December 2010, Telecom Subscription Data as on 31st October 2010, http://www.trai.gov.in/WriteReadData/trai/upload/PressReleases/780/PRecodiv24dec10.pdf 22 Gual, Jordi, Market Definition in the Telecoms industry, Centre for Economic Policy Research, Discussion paper No. 3988, July 2003, www.cepr.org/pubs/dps/DP3988.asp. 23
How can carriers make 40% EBIDTA margin at 2 cents/min tariff? January 31, 2011, http://www.telecomcircle.com/2009/02/carriers-ebidta/ 24 Gupta, Rajani, Telecommunications Liberalization, Critical Role of Legal and Regulatory Regime, Economic and Political Weekly, April 27, 2002. 25 NTP(1994) 26 Industry divided over road to telecom reforms, The Economic Times, 10th July, 2007.