case 17-e- & case 17-g- . forecasting and … · forecasting and rates panel schedule of...
TRANSCRIPT

CENTRAL HUDSON GAS & ELECTRIC CORPORATION
CASE 17-E- & CASE 17-G- .
FORECASTING AND RATES PANEL
SCHEDULE OF EXHIBITS
Statement of Operating Revenues (FRP-1)
Electric Sales, Base Delivery Revenues and Customers (FRP-2)
Gas Sales, Base Delivery Revenues and Customers (FRP-3)
Electric Model Specifications and Statistics (FRP-4)
Gas Model Specifications and Statistics (FRP-5)
Electric Forecast Results (FRP-6)
Gas Forecast Results (FRP-7)
Heating and Cooling Degree Days (FRP-8)
Design Day and Winter Season Demand Requirements (FRP-9)
Cumulative PV Net Metered kW Installed (FRP-10)
Estimated Effect of Proposed Electric Revenue Increase (FRP-11)
Estimated Effect of Proposed Gas Revenue Increase (FRP-12)
Comparison of Gas Bills Under Declining Block Rates / Flat Rates (FRP-13)
Summary of Present and Proposed Electric Rates (FRP-14)
Summary of Present and Proposed Gas Rates (FRP-15)
Comparison of Bills Under Present/Proposed Electric Rates (FRP-16)
Comparison of Gas Bills Under Present/Proposed Gas Rates (FRP-17)

Exhibit ___(FRP-1)
Central Hudson Gas & Electric Corporation
Statement of Operating Revenues
for
2014, 2015, 2016 andthe Twelve Months Ended March 31, 2017
Schedule A Electric Operating Revenues
Schedule B Gas Operating Revenues

Central Hudson Gas & Electric CorporationStatement of Electric Operating Revenues
Year Ended December 31, 2014 Year Ended December 31, 2015Total Base Base Rev. Total Base Base Rev.
Acct. No. kWh Revenue Revenue $/kWh kWh Revenue Revenue $/kWh
440 Residential * 1,684,951,678 316,478,059$ 147,811,142$ 0.088$ 1,712,057,070 302,576,630$ 154,785,876$ 0.090$
442 Commercial and Industrial * 690,770,265 104,703,116$ 38,067,875$ 0.055$ 662,037,090 90,146,212$ 37,579,129$ 0.057$
444 Public Street and Highway Lighting 21,648,579 6,678,641$ 4,784,709$ 0.221$ 22,050,240 6,474,126$ 4,976,742$ 0.226$
445 Other Sales to Public Authorities 171,101,706 23,906,369$ 7,089,974$ 0.041$ 156,728,011 18,624,623$ 6,527,547$ 0.042$
448 Interdepartmental Sales 977,110 12,051$ 12,051$ 0.012$ 1,036,433 13,832$ 13,832$ 0.013$
456.21/25 Residential Retail Access * 361,589,941 33,069,063$ 29,717,090$ 0.082$ 369,008,818 34,554,348$ 31,299,965$ 0.085$ 456.22/26 Commercial Retail Access * 949,487,547 39,182,407$ 33,170,571$ 0.035$ 990,813,029 41,206,414$ 34,561,259$ 0.035$ 456.23 Industrial Retail Access 940,274,497 13,156,345$ 9,487,073$ 0.010$ 945,589,484 14,574,509$ 9,771,379$ 0.010$ 456.24 OPA Retail Access 199,953,434 7,966,667$ 6,724,352$ 0.034$ 217,995,847 8,915,767$ 7,437,803$ 0.034$
Total Own Territory 5,020,754,757 545,152,718$ 276,864,836$ 0.055$ 5,077,316,022 517,086,461$ 286,953,532$ 0.057$
450 Finance Charges on Utility Services 3,716,362$ 3,716,367$ 3,519,867$ 3,519,867$
451 Miscellaneous Service Revenues 357,768$ 365,172$ 341,544$ 348,868$
454 Rental from Property 4,852,657$ 4,851,345$ 4,666,763$ 4,665,468$
456 Other Electric Revenues 24,238,811$ 22,305,573$ 14,241,219$ 14,209,232$
Total Other Operating Revenues 33,165,598$ 31,238,457$ 22,769,393$ 22,743,435$
447 Sales for Resale 53,859,974 3,080,068$ 3,080,068$ 0.057$ 54,296,882 2,009,645$ 2,009,645$ 0.037$
Total Electric Operating Revenues 5,074,614,731 581,398,384$ 311,183,361$ 5,131,612,904 541,865,499$ 311,706,612$
* Includes Unbilled Sales/Deliveries & Revenue
Exh
ibit _
__
(FR
P-1
)
Sheet 1 of 2
Schedule A

Central Hudson Gas & Electric CorporationStatement of Electric Operating Revenues
Year Ended December 31, 2016 Twelve Months Ended March 31, 2017Total Base Cents per Total Base Cents per
Acct. No. kWh Revenue Revenue kWh kWh Revenue Revenue kWh
440 Residential * 1,783,746,958 293,925,730$ 166,134,670$ 0.093$ 1,803,473,012 297,010,058$ 168,124,302$ 0.093$
442 Commercial and Industrial * 691,809,084 84,948,669$ 38,303,657$ 0.055$ 698,491,769 85,450,828$ 38,945,554$ 0.056$
444 Public Street and Highway Lighting 19,770,090 6,040,886$ 4,931,978$ 0.249$ 18,813,678 5,878,039$ 4,868,174$ 0.259$
445 Other Sales to Public Authorities 141,655,816 14,831,293$ 5,651,212$ 0.040$ 140,290,050 14,697,886$ 5,681,413$ 0.040$
448 Interdepartmental Sales 1,037,036 19,136$ 19,136$ 0.018$ 1,077,743 22,087$ 22,087$ 0.020$
456.21/25 Residential Retail Access * 334,147,015 32,981,635$ 29,343,952$ 0.088$ 326,082,693 32,335,196$ 28,706,951$ 0.088$ 456.22/26 Commercial Retail Access * 947,487,932 38,723,823$ 30,833,295$ 0.033$ 933,096,861 37,814,978$ 30,119,791$ 0.032$ 456.23 Industrial Retail Access 915,692,978 12,015,462$ 8,575,955$ 0.009$ 901,961,779 11,332,213$ 7,741,574$ 0.009$ 456.24 OPA Retail Access 229,883,684 9,378,371$ 7,431,836$ 0.032$ 233,734,464 9,402,801$ 7,463,050$ 0.032$
Total Own Territory 5,065,230,593 492,865,005$ 291,225,692$ 0.057$ 5,057,022,049 493,944,086$ 291,672,897$ 0.058$
450 Finance Charges on Utility Services 2,922,791$ 2,922,791$ 2,926,269$ 2,926,271$
451 Miscellaneous Service Revenues 362,202$ 372,338$ 1,658,927$ 1,670,425$
454 Rental from Property 5,888,674$ 6,138,900$ 6,273,719$ 6,272,030$
456 Other Electric Revenues 8,210,587$ 8,210,350$ 10,577,232$ 10,576,982$
Total Other Operating Revenues 17,384,254$ 17,644,379$ 21,436,147$ 21,445,708$
447 Sales for Resale 46,338,149 1,346,105$ 1,346,105$ 0.029$ 43,402,330 1,375,789$ 1,375,789$ 0.032$
Total Electric Operating Revenues 5,111,568,742 511,595,364$ 310,216,176$ 5,100,424,379 516,756,022$ 314,494,394$
* Includes Unbilled Sales/Deliveries & Revenue
Sheet 2 of 2
Exh
ibit _
__
(FR
P-1
)
Schedule A

Central Hudson Gas & Electric CorporationStatement of Gas Operating Revenues
Year Ended December 31, 2014 Year Ended December 31, 2015Total Base Base Rev. Total Base Base Rev.
Acct No. Mcf Revenue Revenue $/Mcf Mcf Revenue Revenue $/Mcf
480 Residential * 4,569,218 77,651,535$ 39,203,300$ 8.58$ 4,513,236 66,628,487$ 39,003,773$ 8.64$
481 Commercial & Industrial * 2,929,785 34,931,967$ 12,777,719$ 4.36$ 2,824,941 26,817,055$ 11,977,319$ 4.24$
482 Other Sales-Public Authorities 740,309 7,377,090$ 2,985,134$ 4.03$ 564,170 4,492,947$ 1,967,802$ 3.49$
484 Interdepartmental Sales 31,686 344,517$ 344,517$ 10.87$ 27,363 223,694$ 223,694$ 8.18$
489.10 Gas Transport. - Cust. Owned Gas 1,323,757 1,720,680$ 1,654,823$ 1.25$ 1,398,979 1,764,413$ 1,673,083$ 1.20$
489.11 SC 14 Transportation 1,558,888 865,584$ 865,588$ 0.56$ 1,902,839 856,755$ 856,752$ 0.45$ 489.09/12 SC 11 Transportation 2,278,955 3,868,324$ 3,857,103$ 1.69$ 2,607,924 9,271,194$ 9,047,282$ 3.47$ 489.13/14/30 Residential Transportation * 1,143,571 10,118,478$ 9,446,494$ 8.26$ 1,128,237 9,442,811$ 9,131,264$ 8.09$ 489.19/20/40 Commercial Transportation * 3,029,036 9,485,300$ 9,273,996$ 3.06$ 3,193,667 8,981,353$ 9,362,644$ 2.93$ 489.21 Industrial Transportation 191,288 432,592$ 421,757$ 2.20$ 302,425 570,923$ 622,416$ 2.06$ 489.22 OPA Transportation 396,831 1,042,203$ 1,001,115$ 2.52$ 395,816 973,134$ 1,003,898$ 2.54$
Total 18,193,323 147,838,270$ 81,831,546$ 4.50$ 18,859,596 130,022,766$ 84,869,927$ 4.50$
487 Finance Charges on Utility Services - 1,152,094$ 1,152,094$ - 984,439$ 984,439$
488 Miscellaneous Service Revenues - 31,898$ 31,898$ - 36,586$ 36,586$
493 Rent from Gas Property - -$ -$ - 1,303$ 1,303$
494 Interdepartmental Rents - -$ -$ - -$ -$
495 Other Gas Revenues - (4,281,468)$ (4,281,468)$ - 1,683,160$ 1,683,160$
Total Other Operating Revenues - (3,097,476)$ (3,097,476)$ - 2,705,488$ 2,705,488$
483 Sales For Resale 2,959,543 18,830,666$ 18,830,666$ 6.36$ 2,799,895 13,558,473$ 13,558,473$ 4.84$
Total Gas Operating Revenues 21,152,866 163,571,460$ 97,564,736$ 4.61$ 21,659,491 146,286,727$ 101,133,888$ 4.67$
* Includes Unbilled Sales/Transport & Revenue
Sheet 1 of 2
Schedule B
Exhibit ___(F
RP
-1)

Central Hudson Gas & Electric CorporationStatement of Gas Operating Revenues
Year Ended December 31, 2016 Twelve Months Ended Mar 31, 2017Total Base Base Rev. Total Base Base Rev.
Acct No. Mcf Revenue Revenue $/Mcf Mcf Revenue Revenue $/Mcf
480 Residential * 4,443,936 62,545,958$ 46,120,023$ 10.38$ 4,568,613 67,327,411$ 47,191,572$ 10.33$
481 Commercial & Industrial * 2,759,664 21,180,923$ 12,512,560$ 4.53$ 2,877,544 24,486,808$ 13,649,084$ 4.74$
482 Other Sales-Public Authorities 563,348 3,515,222$ 1,954,671$ 3.47$ 551,222 3,958,801$ 2,036,682$ 3.69$
484 Interdepartmental Sales 29,223 184,178$ 184,178$ 6.30$ 30,284 216,333$ 216,333$ 7.14$
489.10 Gas Transport. - Cust. Owned Gas 1,293,094 1,359,615$ 1,291,943$ 1.00$ 1,343,716 1,397,165$ 1,312,765$ 0.98$
489.11 SC 14 Transportation 2,504,545 849,632$ 849,629$ 0.34$ 2,564,943 856,411$ 856,411$ 0.33$ 489.09/12 SC 11 Transportation 2,320,103 5,709,358$ 5,495,237$ 2.37$ 2,303,654 5,356,601$ 5,101,416$ 2.21$ 489.13/14/30 Residential Transportation * 904,264 9,018,773$ 8,925,775$ 9.87$ 864,127 8,735,188$ 8,575,534$ 9.92$ 489.19/20/40 Commercial Transportation * 3,183,973 9,681,819$ 9,870,998$ 3.10$ 3,206,309 10,397,399$ 10,281,660$ 3.21$ 489.21 Industrial Transportation 333,943 708,819$ 732,406$ 2.19$ 347,086 818,930$ 812,009$ 2.34$ 489.22 OPA Transportation 560,536 1,359,935$ 1,396,052$ 2.49$ 461,172 1,330,490$ 1,305,682$ 2.83$
Total Deliveries 18,896,629 116,114,232$ 89,333,472$ 4.73$ 19,118,668 124,881,537$ 91,339,147$ 4.78$
487 Finance Charges on Utility Services - 698,597$ 698,597$ - 714,953$ 714,953$
488 Misc. Service Revenues - 32,473$ 32,473$ - 31,424$ 31,424$
493 Rent from Gas Property - 1,348$ 1,348$ - 1,346$ 1,346$
494 Interdepartmental Rents - -$ -$ - -$ -$
495 Other Gas Revenues - 2,631,603$ 2,631,603$ - 1,769,830$ 1,769,830$
Total Other Operating Revenues - 3,364,021$ 3,364,021$ - 2,517,553$ 2,517,553$
483 Sales For Resale 2,887,812 9,868,457$ 9,868,457$ 3.42$ 2,592,054 9,295,594$ 9,295,594$ 3.59$
Total Gas Operating Revenues 21,784,441 129,346,710$ 102,565,950$ 4.71$ 21,710,722 136,694,684$ 103,152,294$ 4.75$
* Includes Unbilled Sales/Transport & Revenue Exh
ibit _
__
(FR
P-1
)
Sh
ee
t 2 o
f 2
Sch
ed
ule
B

Exhibit ___(FRP-2)
Central Hudson Gas & Electric Corporation
Electric Sales, Base Delivery Revenues and Customers
Schedule A Summary of Electric Sales, Base Revenues and Customersby Service Classification for the Twelve Months Ended March 31, 2017, December 31, 2017, December 31, 2018,and June 30, 2019
Schedule B Electric Sales, Base Revenues and Customers by Revenue Account - Twelve Months Ended March 31, 2017
Schedule C Electric Sales, Base Revenues and Customers by Service Classification - Twelve Months Ended March 31, 2017
Schedule D Electric Sales, Base Revenues and Customers by Service Classification - Twelve Months Ended December 31, 2017
Schedule E Electric Sales, Base Revenues and Customers by Service Classification - Twelve Months Ended December 31, 2018
Schedule F Electric Sales, Base Revenues and Customers by Service Classification - Twelve Months Ended June 30, 2019

Exhibit ___(FRP-2)Schedule A
Sheet 1 of 3
Twelve Months Twelve MonthsEnded Ended
March 31, 2017 2017 2018 June 30, 2019
Service Classification No. 1Heating 317,671 318,979 332,126 328,987 EEPS Lost MWh - (20,551) (37,310) (39,271)
Nonheating 1,808,156 1,793,997 1,845,882 1,838,754
EEPS Lost MWh - (133,743) (203,875) (213,414) PV Lost MWh - (50,406) (77,101) (85,800)
2,125,827 1,908,276 1,859,722 1,829,256
Service Classification No. 2Nondemand 170,693 175,396 175,470 174,848
EEPS Lost MWh - (14,379) (21,818) (22,768) Primary 210,362 222,972 226,852 226,388 EEPS Lost MWh - (19,365) (28,205) (29,450) Secondary 1,404,313 1,451,409 1,455,027 1,452,457 EEPS Lost MWh - (124,259) (180,915) (188,785) PV Lost MWh - (17,941) (24,682) (25,915)
1,785,368 1,673,833 1,601,729 1,586,775
Service Classification No. 3 280,389 285,688 285,133 284,486 EEPS Lost MWh - (24,573) (35,453) (36,965)
280,389 261,115 249,680 247,521
Service Classification No. 5 12,437 12,336 12,350 12,330
Service Classification No. 6 17,580 18,711 19,030 19,030
Service Classification No. 8 18,814 19,003 17,900 17,260
Service Classification No. 9 2,282 764 600 600
Service Classification No. 13
Transmission 696,489 697,982 711,174 711,174 Substation 123,421 145,873 152,958 153,752
819,910 843,855 864,132 864,926
Interdepartmental 1,078 1,064 1,040 1,040
Total Own Territory 5,063,686 4,738,957 4,626,183 4,578,738
Central Hudson Gas & Electric CorporationSummary of Electric Sales (MWh) by Service Classification

Exhibit ___(FRP-2)Schedule A
Sheet 2 of 3
Twelve Months Twelve MonthsEnded Ended
March 31, 2017 2017 2018 June 30, 2019
Service Classification No. 1Heating 25,350,616$ 27,307,807$ 30,908,950$ 30,699,430$ EEPS Lost Revenue -$ (1,393,070)$ (2,603,040)$ (2,740,300)$
Nonheating 166,230,047$ 176,955,160$ 195,028,660$ 194,553,910$
EEPS Lost Revenue -$ (9,091,560)$ (14,241,070)$ (14,908,100)$ PV Lost Revenue -$ (3,319,860)$ (5,358,390)$ (5,993,050)$
191,580,663$ 190,458,478$ 203,735,110$ 201,611,890$
Service Classification No. 2Nondemand 15,779,368$ 16,943,829$ 18,075,150$ 18,068,490$
EEPS Lost Revenue -$ (433,570)$ (710,880)$ (743,190)$ Primary 5,003,305$ 5,339,111$ 5,636,270$ 5,625,840$ EEPS Lost Revenue -$ (429,000)$ (620,580)$ (646,990)$ Secondary 54,561,133$ 60,078,966$ 62,192,660$ 62,064,420$ EEPS Lost Revenue -$ (4,372,490)$ (6,300,990)$ (6,570,630)$ PV Lost Revenue -$ (1,376,570)$ (1,913,210)$ (1,987,830)$
75,343,806$ 75,750,276$ 76,358,420$ 75,810,110$
Service Classification No. 3 6,380,372$ 6,748,820$ 6,872,410$ 6,855,670$ EEPS Lost Revenue -$ (546,980)$ (785,260)$ (817,560)$
6,380,372$ 6,201,840$ 6,087,150$ 6,038,110$
Service Classification No. 5 1,625,223$ 1,601,934$ 1,719,330$ 1,776,770$
Service Classification No. 6 1,173,385$ 1,233,636$ 1,323,760$ 1,323,760$
Service Classification No. 8 4,847,539$ 4,859,436$ 4,901,970$ 4,799,010$
Service Classification No. 9 184,216$ 198,299$ 228,960$ 226,320$
Service Classification No. 13
Transmission 2,869,291$ 4,714,992$ 5,599,090$ 5,599,090$ Substation 1,929,247$ 1,874,264$ 1,886,720$ 1,917,660$
4,798,538$ 6,589,256$ 7,485,810$ 7,516,750$
Interdepartmental 22,087$ 14,732$ 11,130$ 11,130$
Total Own Territory 285,955,829$ 286,907,887$ 301,851,640$ 299,113,850$
Central Hudson Gas & Electric CorporationSummary of Electric Base Delivery Revenues by Service Classification

Exhibit ___(FRP-2)Schedule A
Sheet 3 of 3
Twelve Months Twelve MonthsEnded Ended
March 31, 2017 2017 2018 June 30, 2019
Service Classification No. 1Heating 27,723 26,710 26,772 26,804 Nonheating 238,516 229,481 229,491 229,572
266,239 256,190 256,263 256,376
Service Classification No. 2Nondemand 30,425 29,409 29,401 29,432 Primary 151 153 153 153 Secondary 11,702 11,558 11,409 11,365
42,277 41,120 40,963 40,950
Service Classification No. 3 34 32 31 31
Service Classification No. 5 4,219 4,089 4,031 4,008
Service Classification No. 6 1,032 997 1,000 1,000
Service Classification No. 8 210 210 210 210
Service Classification No. 9 212 207 201 198
Service Classification No. 13
Transmission 6 5 5 5
Substation 8 8 8 8
14 13 13 13
Interdepartmental 1 1 1 1
Total Own Territory 314,239 302,859 302,712 302,787
Central Hudson Gas & Electric CorporationSummary of Electric Customers by Service Classification

Central Hudson Gas & Electric CorporationStatement of Electric Sales, Revenues and Customers by Revenue Account
Twelve Months Ended March 31, 2017
April May June July August September October November December January February MarchAcct. No. 2016 2016 2016 2016 2016 2016 2016 2016 2016 2017 2017 2017 Total
Sales (MWh)440 Residential * 131,049 107,849 117,190 223,196 183,608 162,948 130,914 135,077 153,599 165,906 144,297 147,840 1,803,473 442 Commercial and Industrial * 53,500 48,479 54,087 65,401 70,937 63,793 58,568 53,371 54,418 65,893 52,953 57,091 698,491 444 Public Street and Highway Lighting 1,515 886 1,206 1,103 1,425 1,630 1,857 1,920 2,150 2,025 1,539 1,558 18,814 445 Other Sales to Public Authorities 11,615 10,805 10,616 11,520 11,833 11,887 10,845 11,478 12,502 12,538 12,386 12,265 140,290 447 Sales for Resale 5,588 4,857 4,474 3,929 3,828 3,799 3,629 107 2,597 5,093 3,431 2,070 43,402 448 Interdepartmental Sales 75 76 88 88 112 100 88 79 87 101 93 90 1,077 456.21/25 Residential Retail Access * 25,270 20,609 22,477 42,834 34,298 30,080 23,671 23,249 26,011 28,444 24,545 24,596 326,084 456.22/26 Commercial Retail Access * 72,924 72,798 82,569 92,818 97,541 85,764 71,499 69,510 71,472 77,768 64,948 73,487 933,098 456.23 Industrial Retail Access 75,144 77,710 80,670 83,967 84,923 79,394 76,336 72,176 70,428 69,586 62,482 69,145 901,961 456.24 OPA Retail Access 17,602 17,527 19,610 20,011 20,145 20,189 18,310 18,578 20,219 21,165 20,193 20,185 233,734
Total Sales 394,282 361,596 392,987 544,867 508,650 459,584 395,717 385,545 413,483 448,519 386,867 408,327 5,100,424
Base Revenues ($)440 Residential * 11,729,072$ 10,546,815$ 11,038,787$ 19,328,119$ 17,171,290$ 15,480,155$ 13,844,341$ 13,903,002$ 15,201,315$ 15,603,219$ 11,425,614$ 12,852,572$ 168,124,302$ 442 Commercial and Industrial * 2,957,871$ 2,969,879$ 3,125,555$ 3,695,565$ 3,698,051$ 3,357,179$ 3,456,573$ 3,221,420$ 2,971,014$ 3,346,366$ 2,758,917$ 3,387,164$ 38,945,554$ 444 Public Street and Highway Lighting 404,057$ 382,507$ 410,660$ 417,767$ 428,014$ 437,584$ 405,983$ 392,711$ 385,151$ 404,119$ 398,163$ 401,459$ 4,868,174$ 445 Other Sales to Public Authorities 442,738$ 458,357$ 457,305$ 518,913$ 492,883$ 508,318$ 469,566$ 469,394$ 489,929$ 472,810$ 447,425$ 453,774$ 5,681,413$ 447 Sales for Resale 165,341$ 104,144$ 115,306$ 132,355$ 163,619$ 96,503$ 81,986$ 9,910$ 115,767$ 198,212$ 117,340$ 75,306$ 1,375,789$ 448 Interdepartmental Sales 1,062$ 1,083$ 1,244$ 1,866$ 2,514$ 2,246$ 1,964$ 1,765$ 1,961$ 2,278$ 2,104$ 2,000$ 22,087$ 456.21/25 Residential Retail Access * 2,130,397$ 1,896,001$ 1,979,014$ 3,463,050$ 3,028,654$ 2,697,986$ 2,359,851$ 2,295,730$ 2,411,840$ 2,551,927$ 1,841,490$ 2,051,009$ 28,706,951$ 456.22/26 Commercial Retail Access * 2,416,903$ 2,452,496$ 2,638,381$ 2,890,385$ 2,957,486$ 2,683,368$ 2,473,653$ 2,495,778$ 2,291,319$ 2,369,766$ 1,996,540$ 2,453,716$ 30,119,791$ 456.23 Industrial Retail Access 687,255$ 703,306$ 574,188$ 663,819$ 796,317$ 774,830$ 726,183$ 703,128$ 611,203$ 429,033$ 467,878$ 604,435$ 7,741,574$ 456.24 OPA Retail Access 579,453$ 592,585$ 653,975$ 654,641$ 624,966$ 677,332$ 648,414$ 614,142$ 615,010$ 619,527$ 584,755$ 598,250$ 7,463,050$
Total Base Revenues 21,514,150$ 20,107,175$ 20,994,415$ 31,766,480$ 29,363,794$ 26,715,502$ 24,468,514$ 24,106,980$ 25,094,509$ 25,997,258$ 20,040,225$ 22,879,686$ 293,048,686$
Customers440 Residential 216,988 215,948 217,702 323,329 218,269 218,740 219,207 219,352 220,662 220,985 215,408 227,117 227,809 442 Commercial and Industrial 32,654 30,730 33,113 41,388 32,013 32,229 31,847 32,139 32,357 32,513 31,720 33,536 33,020 444 Public Street and Highway Lighting 210 210 210 210 210 210 210 210 211 211 211 211 210 445 Other Sales to Public Authorities 2,058 1,928 2,306 2,531 2,150 2,153 2,152 2,161 2,182 2,195 2,204 2,281 2,192 447 Sales for Resale 4 4 3 4 4 4 5 5 4 4 4 4 4 448 Interdepartmental Sales 1 1 1 1 1 1 1 1 1 1 1 1 1 456.21/25 Residential Retail Access 39,213 38,755 38,541 56,370 37,533 37,097 36,638 36,283 36,055 35,979 35,010 36,730 38,684 456.22/26 Commercial Retail Access 10,719 10,632 10,522 12,934 10,460 10,390 10,313 10,262 10,236 10,167 9,824 10,299 10,563 456.23 Industrial Retail Access 321 298 307 311 304 303 298 296 295 297 288 306 302 456.24 OPA Retail Access 1,492 1,459 1,494 1,714 1,428 1,419 1,438 1,403 1,427 1,420 1,326 1,474 1,458
Average Customers 303,660 299,965 304,199 438,792 302,372 302,546 302,109 302,112 303,430 303,772 295,996 311,959 314,243
* Includes Unbilled
Exhibit ___(F
RP
-2)
Schedule B

Central Hudson Gas & Electric CorporationSummary of Electric Sales (MWh) by Service Classification
Twelve Months Ended March 31, 2017
April May June July August September October November December January February March2016 2016 2016 2016 2016 2016 2016 2016 2016 2017 2017 2017 Total
Service Classification No. 1Heating 28,489 21,831 17,489 26,141 18,897 19,165 16,214 20,426 34,430 42,876 37,569 34,145 317,671 Nonheating 125,482 113,141 125,359 239,893 186,930 178,166 133,640 123,572 144,399 161,487 145,653 130,435 1,808,156
153,971 134,972 142,848 266,034 205,827 197,331 149,854 143,998 178,829 204,363 183,222 164,580 2,125,827
Service Classification No. 2Nondemand 14,088 11,172 12,660 17,744 14,614 14,470 11,975 12,045 14,428 17,029 16,012 14,455 170,693 Primary 16,816 17,029 18,154 19,331 20,063 18,273 16,440 16,524 17,040 17,354 17,012 16,327 210,362 Secondary 106,583 102,566 119,365 131,636 138,023 135,611 109,579 102,927 112,065 121,127 115,717 109,113 1,404,313
137,487 130,767 150,179 168,711 172,700 168,354 137,994 131,497 143,532 155,510 148,741 139,895 1,785,368
Service Classification No. 3 21,025 22,202 22,829 25,812 26,855 25,099 22,904 22,329 24,246 23,234 20,630 23,223 280,389
Service Classification No. 5 945 844 762 852 895 985 1,152 1,234 1,373 1,283 1,080 1,033 12,437
Service Classification No. 6 1,486 1,045 1,213 2,000 1,531 1,480 1,144 1,146 1,624 1,922 1,610 1,380 17,580
Service Classification No. 8 1,515 886 1,206 1,103 1,425 1,630 1,857 1,920 2,150 2,025 1,539 1,558 18,814
Service Classification No. 9 147 228 217 227 227 227 226 226 241 210 36 68 2,282
Service Classification No. 13Transmission 59,606 60,242 62,003 64,316 64,731 60,174 62,038 55,997 54,010 53,902 47,732 51,738 696,489 Substation 10,072 11,279 11,002 11,795 11,873 9,438 8,949 9,922 9,739 9,640 9,185 10,528 123,421
69,678 71,521 73,004 76,111 76,604 69,612 70,986 65,919 63,749 63,541 56,917 62,266 819,910
Interdepartmental 75 76 88 88 112 100 88 79 88 101 94 89 1,078
Total 386,331 362,542 392,346 540,938 486,176 464,819 386,205 368,347 415,831 452,190 413,869 394,092 5,063,686
Exh
ibit _
__
(FR
P-2
)
Sh
ee
t 1 o
f 3
Sch
ed
ule
C

Central Hudson Gas & Electric CorporationSummary of Electric Base Delivery Revenues by Service Classification
Twelve Months Ended March 31, 2017
April May June July August September October November December January February March2016 2016 2016 2016 2016 2016 2016 2016 2016 2017 2017 2017 Total
Service Classification No. 1Heating 2,038,539$ 1,732,137$ 1,491,064$ 2,298,443$ 1,840,859$ 1,854,856$ 1,666,195$ 1,935,095$ 2,827,120$ 3,244,326$ 2,264,671$ 2,157,310$ 25,350,616$ Nonheating 11,711,865$ 11,032,805$ 11,712,427$ 20,487,537$ 17,349,614$ 16,772,911$ 13,953,717$ 13,310,608$ 14,665,702$ 13,846,330$ 10,806,859$ 10,579,671$ 166,230,047$
13,750,403$ 12,764,942$ 13,203,491$ 22,785,980$ 19,190,473$ 18,627,768$ 15,619,912$ 15,245,703$ 17,492,823$ 17,090,656$ 13,071,531$ 12,736,981$ 191,580,663$
Service Classification No. 2Nondemand 1,242,260$ 1,128,368$ 1,230,545$ 1,701,217$ 1,352,704$ 1,352,822$ 1,282,552$ 1,293,361$ 1,352,820$ 1,387,755$ 1,205,513$ 1,249,451$ 15,779,368$ Primary 420,051$ 436,489$ 447,527$ 487,133$ 454,973$ 450,281$ 418,620$ 415,450$ 403,049$ 368,697$ 353,920$ 347,113$ 5,003,305$ Secondary 4,344,916$ 4,362,391$ 4,796,244$ 4,989,028$ 5,091,187$ 5,086,524$ 4,682,675$ 4,470,590$ 4,311,773$ 4,221,164$ 3,998,628$ 4,206,014$ 54,561,133$
6,007,227$ 5,927,248$ 6,474,316$ 7,177,378$ 6,898,864$ 6,889,627$ 6,383,847$ 6,179,401$ 6,067,641$ 5,977,617$ 5,558,061$ 5,802,578$ 75,343,806$
Service Classification No. 3 473,330$ 509,822$ 509,004$ 568,797$ 608,228$ 599,129$ 530,497$ 546,697$ 567,756$ 500,040$ 470,562$ 496,509$ 6,380,372$
Service Classification No. 5 124,433$ 127,547$ 124,007$ 156,403$ 137,454$ 138,873$ 141,637$ 141,452$ 143,933$ 141,452$ 122,158$ 125,875$ 1,625,223$
Service Classification No. 6 91,855$ 73,060$ 81,629$ 131,600$ 114,632$ 112,808$ 90,174$ 87,754$ 115,476$ 124,847$ 78,424$ 71,126$ 1,173,385$
Service Classification No. 8 404,057$ 382,507$ 410,660$ 417,767$ 428,014$ 437,584$ 405,983$ 392,711$ 385,151$ 391,996$ 396,013$ 395,096$ 4,847,539$
Service Classification No. 9 10,954$ 16,591$ 15,848$ 17,329$ 17,610$ 17,427$ 17,439$ 17,489$ 18,419$ 10,663$ 9,433$ 15,012$ 184,216$
Service Classification No. 13Transmission 284,446$ 281,617$ 125,455$ 196,737$ 323,531$ 310,643$ 360,287$ 297,248$ 207,796$ 99,894$ 146,955$ 234,683$ 2,869,291$ Substation 131,786$ 191,362$ 163,542$ 180,266$ 180,659$ 160,893$ 150,642$ 147,950$ 151,232$ 148,038$ 161,931$ 160,945$ 1,929,247$
416,232$ 472,980$ 288,997$ 377,003$ 504,190$ 471,536$ 510,929$ 445,199$ 359,028$ 247,932$ 308,886$ 395,628$ 4,798,538$
Interdepartmental 1,062$ 1,083$ 1,244$ 1,866$ 2,514$ 2,246$ 1,964$ 1,765$ 1,961$ 2,278$ 2,104$ 2,000$ 22,087$
Total Base Revenue 21,279,553$ 20,275,780$ 21,109,196$ 31,634,124$ 27,901,980$ 27,296,998$ 23,702,383$ 23,058,171$ 25,152,187$ 24,487,481$ 20,017,171$ 20,040,805$ 285,955,829$
Sh
ee
t 2 o
f 3
Sch
ed
ule
C
Exh
ibit _
__
(FR
P-2
)

Central Hudson Gas & Electric Corporation
Summary of Electric Customers by Service Classification
Twelve Months Ended March 31, 2017
April May June July August September October November December January February March
2016 2016 2016 2016 2016 2016 2016 2016 2016 2017 2017 2017 Average
Service Classification No. 1Heating 26,168 27,194 26,081 39,845 26,627 26,649 26,605 26,677 26,699 26,700 26,002 27,432 27,723 Nonheating 229,699 227,146 230,047 339,394 228,936 228,951 229,015 228,754 229,786 230,052 224,219 236,191 238,516
255,867 254,340 256,128 379,239 255,563 255,600 255,620 255,431 256,485 256,752 250,221 263,623 266,239
Service Classification No. 2Nondemand 30,267 28,184 30,453 40,576 29,351 29,497 29,055 29,340 29,521 29,660 28,759 30,432 30,425 Primary 151 154 154 150 153 150 149 154 148 147 152 147 151 Secondary 11,732 11,763 11,795 11,635 11,724 11,698 11,671 11,631 11,667 11,661 11,388 12,059 11,702
42,150 40,101 42,402 52,361 41,228 41,345 40,875 41,125 41,336 41,468 40,299 42,638 42,277
Service Classification No. 3 32 32 32 32 36 34 34 34 34 34 34 34 34
Service Classification No. 5 4,145 4,062 4,174 5,260 4,099 4,136 4,137 4,110 4,142 4,103 4,043 4,217 4,219
Service Classification No. 6 1,020 981 1,021 1,458 1,004 989 1,000 968 992 976 960 1,013 1,032
Service Classification No. 8 210 210 210 210 210 210 210 210 211 211 211 211 210
Service Classification No. 9 218 216 215 214 214 214 212 212 211 209 209 205 212
Service Classification No. 13Transmission 7 6 5 5 5 5 7 6 6 6 6 5 6 Substation 6 12 8 8 8 8 8 10 8 8 8 8 8
13 18 13 13 13 13 15 16 14 14 14 13 14
Interdepartmental 1 1 1 1 1 1 1 1 1 1 1 1 1
Total Customers 303,656 299,961 304,196 438,788 302,368 302,542 302,104 302,107 303,426 303,768 295,992 311,955 314,239
Sch
ed
ule
C
Sh
ee
t 3 o
f 3
Exh
ibit _
__
(FR
P-2
)
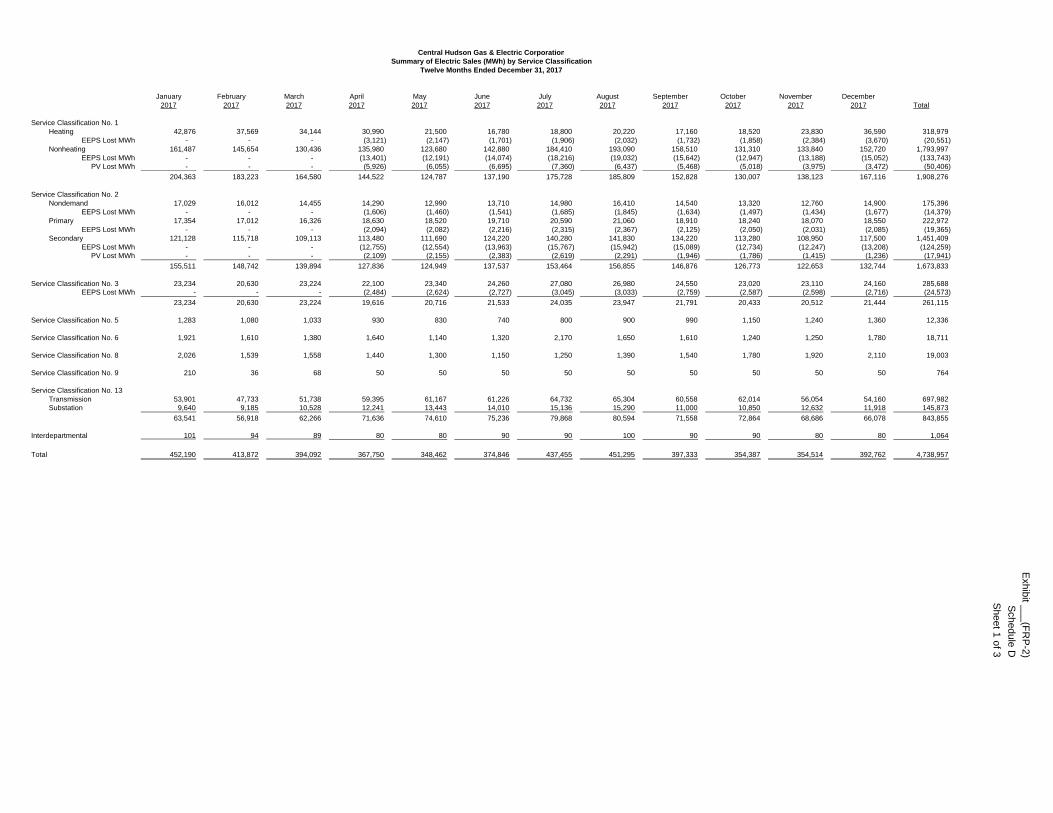
Central Hudson Gas & Electric CorporationSummary of Electric Sales (MWh) by Service Classification
Twelve Months Ended December 31, 2017
January February March April May June July August September October November December2017 2017 2017 2017 2017 2017 2017 2017 2017 2017 2017 2017 Total
Service Classification No. 1Heating 42,876 37,569 34,144 30,990 21,500 16,780 18,800 20,220 17,160 18,520 23,830 36,590 318,979
EEPS Lost MWh - - - (3,121) (2,147) (1,701) (1,906) (2,032) (1,732) (1,858) (2,384) (3,670) (20,551) Nonheating 161,487 145,654 130,436 135,980 123,680 142,880 184,410 193,090 158,510 131,310 133,840 152,720 1,793,997
EEPS Lost MWh - - - (13,401) (12,191) (14,074) (18,216) (19,032) (15,642) (12,947) (13,188) (15,052) (133,743) PV Lost MWh - - - (5,926) (6,055) (6,695) (7,360) (6,437) (5,468) (5,018) (3,975) (3,472) (50,406)
204,363 183,223 164,580 144,522 124,787 137,190 175,728 185,809 152,828 130,007 138,123 167,116 1,908,276
Service Classification No. 2Nondemand 17,029 16,012 14,455 14,290 12,990 13,710 14,980 16,410 14,540 13,320 12,760 14,900 175,396
EEPS Lost MWh - - - (1,606) (1,460) (1,541) (1,685) (1,845) (1,634) (1,497) (1,434) (1,677) (14,379) Primary 17,354 17,012 16,326 18,630 18,520 19,710 20,590 21,060 18,910 18,240 18,070 18,550 222,972
EEPS Lost MWh - - - (2,094) (2,082) (2,216) (2,315) (2,367) (2,125) (2,050) (2,031) (2,085) (19,365) Secondary 121,128 115,718 109,113 113,480 111,690 124,220 140,280 141,830 134,220 113,280 108,950 117,500 1,451,409
EEPS Lost MWh - - - (12,755) (12,554) (13,963) (15,767) (15,942) (15,089) (12,734) (12,247) (13,208) (124,259) PV Lost MWh - - - (2,109) (2,155) (2,383) (2,619) (2,291) (1,946) (1,786) (1,415) (1,236) (17,941)
155,511 148,742 139,894 127,836 124,949 137,537 153,464 156,855 146,876 126,773 122,653 132,744 1,673,833
Service Classification No. 3 23,234 20,630 23,224 22,100 23,340 24,260 27,080 26,980 24,550 23,020 23,110 24,160 285,688 EEPS Lost MWh - - - (2,484) (2,624) (2,727) (3,045) (3,033) (2,759) (2,587) (2,598) (2,716) (24,573)
23,234 20,630 23,224 19,616 20,716 21,533 24,035 23,947 21,791 20,433 20,512 21,444 261,115
Service Classification No. 5 1,283 1,080 1,033 930 830 740 800 900 990 1,150 1,240 1,360 12,336
Service Classification No. 6 1,921 1,610 1,380 1,640 1,140 1,320 2,170 1,650 1,610 1,240 1,250 1,780 18,711
Service Classification No. 8 2,026 1,539 1,558 1,440 1,300 1,150 1,250 1,390 1,540 1,780 1,920 2,110 19,003
Service Classification No. 9 210 36 68 50 50 50 50 50 50 50 50 50 764
Service Classification No. 13Transmission 53,901 47,733 51,738 59,395 61,167 61,226 64,732 65,304 60,558 62,014 56,054 54,160 697,982 Substation 9,640 9,185 10,528 12,241 13,443 14,010 15,136 15,290 11,000 10,850 12,632 11,918 145,873
63,541 56,918 62,266 71,636 74,610 75,236 79,868 80,594 71,558 72,864 68,686 66,078 843,855
Interdepartmental 101 94 89 80 80 90 90 100 90 90 80 80 1,064
Total 452,190 413,872 394,092 367,750 348,462 374,846 437,455 451,295 397,333 354,387 354,514 392,762 4,738,957
Sheet 1 of 3
Schedule D
Exhibit ___(F
RP
-2)

Central Hudson Gas & Electric CorporationSummary of Electric Base Delivery Revenues by Service Classification
Twelve Months Ended December 31, 2017
January February March April May June July August September October November December2017 2017 2017 2017 2017 2017 2017 2017 2017 2017 2017 2017 Total
Service Classification No. 1Heating 3,244,326$ 2,264,671$ 2,157,310$ 2,645,150$ 2,033,040$ 1,725,870$ 1,906,520$ 2,052,710$ 1,840,560$ 1,934,280$ 2,306,710$ 3,196,660$ 27,307,807$
EEPS Lost Revenue -$ -$ -$ (201,570)$ (138,670)$ (109,750)$ (128,420)$ (141,510)$ (121,190)$ (129,430)$ (166,660)$ (255,870)$ (1,393,070)$ Nonheating 13,846,330$ 10,806,859$ 10,579,671$ 14,317,030$ 13,471,750$ 14,765,980$ 17,899,520$ 18,990,280$ 16,571,170$ 14,676,390$ 14,844,180$ 16,186,000$ 176,955,160$
EEPS Lost Revenue -$ -$ -$ (867,110)$ (789,000)$ (910,470)$ (1,225,460)$ (1,329,380)$ (1,092,810)$ (904,900)$ (921,680)$ (1,050,750)$ (9,091,560)$ PV Lost Revenue -$ -$ -$ (357,540)$ (365,310)$ (403,880)$ (508,710)$ (444,920)$ (377,960)$ (346,840)$ (274,750)$ (239,950)$ (3,319,860)$
17,090,656$ 13,071,531$ 12,736,981$ 15,535,960$ 14,211,810$ 15,067,750$ 17,943,450$ 19,127,180$ 16,819,770$ 15,229,500$ 15,787,800$ 17,836,090$ 190,458,478$
Service Classification No. 2Nondemand 1,387,755$ 1,205,513$ 1,249,451$ 1,397,820$ 1,366,610$ 1,383,120$ 1,473,310$ 1,559,650$ 1,504,120$ 1,458,790$ 1,446,060$ 1,511,630$ 16,943,829$
EEPS Lost Revenue -$ -$ -$ (41,800)$ (38,140)$ (40,240)$ (49,670)$ (60,380)$ (53,530)$ (48,630)$ (46,680)$ (54,500)$ (433,570)$ Primary 368,697$ 353,920$ 347,113$ 450,510$ 452,420$ 479,500$ 535,950$ 501,460$ 477,330$ 453,390$ 453,120$ 465,700$ 5,339,111$
EEPS Lost Revenue -$ -$ -$ (44,840)$ (45,170)$ (48,200)$ (54,720)$ (50,550)$ (48,100)$ (45,270)$ (45,220)$ (46,930)$ (429,000)$ Secondary 4,221,164$ 3,998,628$ 4,206,014$ 4,828,590$ 4,924,040$ 5,367,290$ 6,016,480$ 5,806,970$ 5,674,060$ 5,102,250$ 4,941,380$ 4,992,100$ 60,078,966$
EEPS Lost Revenue -$ -$ -$ (432,660)$ (443,570)$ (493,590)$ (566,510)$ (544,830)$ (528,860)$ (464,550)$ (446,860)$ (451,060)$ (4,372,490)$ PV Lost Revenue -$ -$ -$ (153,650)$ (157,000)$ (173,580)$ (206,970)$ (181,040)$ (153,790)$ (141,120)$ (111,790)$ (97,630)$ (1,376,570)$
5,977,617$ 5,558,061$ 5,802,578$ 6,003,970$ 6,059,190$ 6,474,300$ 7,147,870$ 7,031,280$ 6,871,230$ 6,314,860$ 6,190,010$ 6,319,310$ 75,750,276$
Service Classification No. 3 500,040$ 470,562$ 496,509$ 518,180$ 567,980$ 576,240$ 635,550$ 598,940$ 625,220$ 558,370$ 589,460$ 611,770$ 6,748,820$ EEPS Lost Revenue -$ -$ -$ (53,090)$ (58,880)$ (59,850)$ (66,140)$ (61,820)$ (64,830)$ (57,630)$ (61,110)$ (63,630)$ (546,980)$
500,040$ 470,562$ 496,509$ 465,090$ 509,100$ 516,390$ 569,410$ 537,120$ 560,390$ 500,740$ 528,350$ 548,140$ 6,201,840$
Service Classification No. 5 141,452$ 122,158$ 125,875$ 126,220$ 125,240$ 124,280$ 136,640$ 137,620$ 138,600$ 140,220$ 141,160$ 142,470$ 1,601,934$
Service Classification No. 6 124,847$ 78,424$ 71,126$ 110,570$ 84,640$ 94,320$ 138,850$ 113,950$ 111,320$ 92,410$ 92,400$ 120,780$ 1,233,636$
Service Classification No. 8 391,996$ 396,013$ 395,096$ 408,450$ 408,410$ 408,370$ 408,400$ 408,440$ 408,480$ 408,550$ 408,590$ 408,640$ 4,859,436$
Service Classification No. 9 10,663$ 9,433$ 15,012$ 18,260$ 18,240$ 18,200$ 18,170$ 18,140$ 18,100$ 18,060$ 18,030$ 17,990$ 198,299$
Service Classification No. 13Transmission 99,894$ 146,955$ 234,683$ 437,340$ 451,950$ 451,840$ 490,630$ 515,400$ 491,280$ 511,890$ 449,080$ 434,050$ 4,714,992$ Substation 148,038$ 161,931$ 160,945$ 140,060$ 163,780$ 159,720$ 179,410$ 178,590$ 142,420$ 145,520$ 144,370$ 149,480$ 1,874,264$
247,932$ 308,886$ 395,628$ 577,400$ 615,730$ 611,560$ 670,040$ 693,990$ 633,700$ 657,410$ 593,450$ 583,530$ 6,589,256$
Interdepartmental 2,278$ 2,104$ 2,000$ 860$ 860$ 960$ 960$ 1,070$ 960$ 960$ 860$ 860$ 14,732$
Total Base Revenue 24,487,481$ 20,017,171$ 20,040,805$ 23,246,780$ 22,033,220$ 23,316,130$ 27,033,790$ 28,068,790$ 25,562,550$ 23,362,710$ 23,760,650$ 25,977,810$ 286,907,887$
Sheet 2 of 3
Schedule D
Exhibit ___(F
RP
-2)

Central Hudson Gas & Electric Corporation
Summary of Electric Customers by Service Classification
Twelve Months Ended December 31, 2017
January February March April May June July August September October November December
2017 2017 2017 2017 2017 2017 2017 2017 2017 2017 2017 2017 Average
Service Classification No. 1Heating 26,700 26,002 27,432 26,658 26,739 26,668 26,736 26,681 26,747 26,692 26,758 26,702 26,710 Nonheating 230,052 224,219 236,191 229,907 227,851 230,009 228,851 229,289 229,135 229,349 228,977 229,939 229,481
256,752 250,221 263,623 256,565 254,590 256,677 255,587 255,970 255,882 256,041 255,735 256,641 256,190
Service Classification No. 2Nondemand 29,660 28,759 30,432 29,269 29,348 29,282 29,516 29,258 29,415 29,258 29,416 29,294 29,409 Primary 147 152 147 156 154 158 154 154 154 155 155 150 153 Secondary 11,661 11,388 12,059 11,575 11,559 11,543 11,531 11,389 11,482 11,465 11,449 11,600 11,558
41,468 40,299 42,638 41,000 41,061 40,983 41,201 40,801 41,051 40,878 41,020 41,044 41,120
Service Classification No. 3 34 34 34 31 31 31 31 32 31 31 31 31 32
Service Classification No. 5 4,103 4,043 4,217 4,098 4,016 4,127 4,071 4,052 4,089 4,090 4,063 4,095 4,089
Service Classification No. 6 976 960 1,013 1,010 990 1,010 990 1,010 990 1,010 990 1,010 997
Service Classification No. 8 211 211 211 210 210 210 210 210 210 210 210 210 210
Service Classification No. 9 209 209 205 205 209 208 207 207 207 205 205 204 207
Service Classification No. 13Transmission 6 6 5 5 5 5 5 5 5 5 5 5 5 Substation 8 8 8 8 8 8 8 8 8 8 8 8 8
14 14 13 13 13 13 13 13 13 13 13 13 13
Interdepartmental 1 1 1 1 1 1 1 1 1 1 1 1 1
Total Customers 303,768 295,992 311,955 303,133 301,121 303,260 302,311 302,296 302,474 302,479 302,268 303,249 302,859
- - - - - - - - -
Sheet 3 of 3
Schedule D
Exhibit ___(F
RP
-2)

Central Hudson Gas & Electric CorporationSummary of Electric Sales (MWh) by Service Classification
Twelve Months Ended December 31, 2018
January February March April May June July August September October November December2018 2018 2018 2018 2018 2018 2018 2018 2018 2018 2018 2018 Total
Service Classification No. 1Heating 44,997 45,866 40,271 30,081 20,981 16,470 18,559 20,023 17,017 18,344 23,484 36,033 332,126
EEPS Lost MWh (5,007) (5,149) (4,502) (3,396) (2,348) (1,871) (2,109) (2,256) (1,925) (2,063) (2,633) (4,051) (37,310) Nonheating 167,656 169,834 158,608 135,230 123,384 142,185 183,391 191,924 157,760 130,879 133,336 151,695 1,845,882
EEPS Lost MWh (18,502) (18,746) (17,518) (14,931) (13,626) (15,692) (20,296) (21,193) (17,442) (14,458) (14,719) (16,752) (203,875) PV Lost MWh (2,421) (3,692) (6,890) (7,644) (7,776) (8,563) (9,376) (8,168) (6,914) (6,322) (4,991) (4,344) (77,101)
186,723 188,113 169,969 139,340 120,615 132,529 170,169 180,330 148,496 126,380 134,477 162,581 1,859,722
Service Classification No. 2Nondemand 16,097 16,620 15,321 14,209 12,935 13,684 14,940 16,373 14,502 13,307 12,700 14,782 175,470
EEPS Lost MWh (2,001) (2,067) (1,905) (1,767) (1,609) (1,702) (1,858) (2,035) (1,803) (1,655) (1,580) (1,836) (21,818) Primary 18,626 18,448 18,485 18,528 18,508 19,572 20,389 20,888 18,709 18,203 18,075 18,421 226,852
EEPS Lost MWh (2,316) (2,294) (2,298) (2,304) (2,301) (2,434) (2,535) (2,597) (2,326) (2,263) (2,247) (2,290) (28,205) Secondary 119,299 120,781 116,465 112,853 111,861 123,170 138,511 140,394 132,435 113,299 109,362 116,597 1,455,027
EEPS Lost MWh (14,834) (15,017) (14,481) (14,031) (13,909) (15,314) (17,222) (17,456) (16,467) (14,088) (13,598) (14,498) (180,915) PV Lost MWh (775) (1,182) (2,206) (2,447) (2,489) (2,741) (3,001) (2,615) (2,213) (2,024) (1,598) (1,391) (24,682)
134,096 135,289 129,381 125,041 122,996 134,235 149,224 152,952 142,837 124,779 121,114 129,785 1,601,729
Service Classification No. 3 23,985 21,411 22,490 21,969 23,311 24,079 26,810 26,748 24,287 22,958 23,103 23,982 285,133 EEPS Lost MWh (2,983) (2,662) (2,796) (2,732) (2,898) (2,994) (3,333) (3,326) (3,020) (2,854) (2,873) (2,982) (35,453)
21,002 18,749 19,694 19,237 20,413 21,085 23,477 23,422 21,267 20,104 20,230 21,000 249,680
Service Classification No. 5 1,300 1,080 1,050 930 830 740 800 900 990 1,140 1,230 1,360 12,350
Service Classification No. 6 1,520 1,990 1,720 1,640 1,140 1,320 2,170 1,650 1,610 1,240 1,250 1,780 19,030
Service Classification No. 8 1,880 1,570 1,520 1,340 1,210 1,070 1,160 1,300 1,430 1,660 1,790 1,970 17,900
Service Classification No. 9 50 50 50 50 50 50 50 50 50 50 50 50 600
Service Classification No. 13Transmission 54,494 52,590 59,470 59,400 61,172 61,226 64,732 65,304 60,558 62,014 56,054 54,160 711,174 Substation 11,422 12,286 12,720 12,246 13,448 14,010 15,136 15,290 11,000 10,850 12,632 11,918 152,958
65,916 64,876 72,190 71,646 74,620 75,236 79,868 80,594 71,558 72,864 68,686 66,078 864,132
Interdepartmental 90 90 80 80 80 90 90 100 90 90 80 80 1,040
Total 412,577 411,807 395,654 359,304 341,954 366,355 427,008 441,298 388,328 348,307 348,907 384,684 4,626,183
Sheet 1 of 3
Schedule E
Exhibit ___(F
RP
-2)

Central Hudson Gas & Electric CorporationSummary of Electric Base Delivery Revenues by Service Classification
Twelve Months Ended December 31, 2018
January February March April May June July August September October November December2018 2018 2018 2018 2018 2018 2018 2018 2018 2018 2018 2018 Total
Service Classification No. 1Heating 3,785,290$ 3,845,110$ 3,455,910$ 2,742,470$ 2,108,790$ 1,792,060$ 1,939,610$ 2,040,560$ 1,832,170$ 1,923,510$ 2,284,140$ 3,159,330$ 30,908,950$
EEPS Lost Revenue (349,320)$ (359,650)$ (313,910)$ (236,800)$ (163,660)$ (130,340)$ (147,530)$ (157,090)$ (134,670)$ (143,680)$ (183,990)$ (282,400)$ (2,603,040)$ Nonheating 17,227,970$ 17,366,470$ 16,588,640$ 14,964,710$ 14,098,670$ 15,452,920$ 18,308,890$ 18,913,830$ 16,523,910$ 14,651,270$ 14,815,330$ 16,116,050$ 195,028,660$
EEPS Lost Revenue (1,292,940)$ (1,308,990)$ (1,223,780)$ (1,042,170)$ (952,070)$ (1,095,960)$ (1,417,960)$ (1,480,120)$ (1,218,880)$ (1,010,030)$ (1,028,190)$ (1,169,980)$ (14,241,070)$ PV Lost Revenue (167,350)$ (255,160)$ (476,210)$ (528,340)$ (537,480)$ (591,860)$ (654,880)$ (570,570)$ (482,930)$ (441,570)$ (348,620)$ (303,420)$ (5,358,390)$
19,203,650$ 19,287,780$ 18,030,650$ 15,899,870$ 14,554,250$ 15,426,820$ 18,028,130$ 18,746,610$ 16,519,600$ 14,979,500$ 15,538,670$ 17,519,580$ 203,735,110$
Service Classification No. 2Nondemand 1,554,640$ 1,569,760$ 1,529,900$ 1,490,480$ 1,451,420$ 1,473,590$ 1,522,880$ 1,560,650$ 1,505,060$ 1,460,570$ 1,446,240$ 1,509,960$ 18,075,150$
EEPS Lost Revenue (65,280)$ (67,230)$ (62,020)$ (57,440)$ (52,220)$ (55,490)$ (60,370)$ (66,590)$ (58,750)$ (54,180)$ (51,580)$ (59,730)$ (710,880)$ Primary 423,770$ 434,800$ 435,770$ 468,560$ 472,870$ 498,100$ 544,960$ 501,580$ 476,420$ 456,110$ 456,780$ 466,550$ 5,636,270$
EEPS Lost Revenue (45,750)$ (47,270)$ (47,790)$ (51,630)$ (52,040)$ (54,970)$ (61,140)$ (55,690)$ (52,620)$ (50,110)$ (50,130)$ (51,440)$ (620,580)$ Secondary 4,794,210$ 4,839,670$ 4,810,410$ 4,912,880$ 5,041,320$ 5,455,320$ 6,016,720$ 5,743,290$ 5,597,540$ 5,089,300$ 4,943,370$ 4,948,630$ 62,192,660$
EEPS Lost Revenue (476,390)$ (482,520)$ (476,220)$ (491,870)$ (507,570)$ (558,900)$ (628,870)$ (596,420)$ (577,240)$ (513,790)$ (496,090)$ (495,110)$ (6,300,990)$ PV Lost Revenue (59,920)$ (91,350)$ (170,490)$ (189,170)$ (192,440)$ (211,890)$ (233,240)$ (203,210)$ (172,000)$ (157,270)$ (124,160)$ (108,070)$ (1,913,210)$
6,125,280$ 6,155,860$ 6,019,560$ 6,081,810$ 6,161,340$ 6,545,760$ 7,100,940$ 6,883,610$ 6,718,410$ 6,230,630$ 6,124,430$ 6,210,790$ 76,358,420$
Service Classification No. 3 546,790$ 497,990$ 507,070$ 535,010$ 588,910$ 593,870$ 629,670$ 594,200$ 620,470$ 558,520$ 590,830$ 609,080$ 6,872,410$ EEPS Lost Revenue (62,500)$ (56,580)$ (57,490)$ (60,730)$ (67,560)$ (67,940)$ (72,550)$ (67,920)$ (71,330)$ (63,550)$ (67,390)$ (69,720)$ (785,260)$
484,290$ 441,410$ 449,580$ 474,280$ 521,350$ 525,930$ 557,120$ 526,280$ 549,140$ 494,970$ 523,440$ 539,360$ 6,087,150$
Service Classification No. 5 140,810$ 138,550$ 138,220$ 136,940$ 135,960$ 135,000$ 146,170$ 147,150$ 148,130$ 149,740$ 150,680$ 151,980$ 1,719,330$
Service Classification No. 6 106,580$ 131,820$ 117,100$ 113,420$ 86,630$ 96,620$ 140,730$ 113,950$ 111,320$ 92,410$ 92,400$ 120,780$ 1,323,760$
Service Classification No. 8 408,610$ 408,520$ 408,510$ 408,450$ 408,410$ 408,370$ 408,400$ 408,440$ 408,480$ 408,550$ 408,590$ 408,640$ 4,901,970$
Service Classification No. 9 18,910$ 19,280$ 19,250$ 19,190$ 19,170$ 19,130$ 19,100$ 19,060$ 19,030$ 18,980$ 18,950$ 18,910$ 228,960$
Service Classification No. 13Transmission 410,970$ 417,590$ 469,070$ 459,490$ 474,890$ 474,750$ 490,630$ 515,400$ 491,280$ 511,890$ 449,080$ 434,050$ 5,599,090$ Substation 139,840$ 159,620$ 160,140$ 147,300$ 172,200$ 167,830$ 179,410$ 178,590$ 142,420$ 145,520$ 144,370$ 149,480$ 1,886,720$
550,810$ 577,210$ 629,210$ 606,790$ 647,090$ 642,580$ 670,040$ 693,990$ 633,700$ 657,410$ 593,450$ 583,530$ 7,485,810$
Interdepartmental 960$ 960$ 860$ 860$ 860$ 960$ 960$ 1,070$ 960$ 960$ 860$ 860$ 11,130$
Total Base Revenue 27,039,900$ 27,161,390$ 25,812,940$ 23,741,610$ 22,535,060$ 23,801,170$ 27,071,590$ 27,540,160$ 25,108,770$ 23,033,150$ 23,451,470$ 25,554,430$ 301,851,640$
Sheet 2 of 3
Schedule E
Exhibit ___(F
RP
-2)

Central Hudson Gas & Electric Corporation
Summary of Electric Customers by Service Classification
Twelve Months Ended December 31, 2018
January February March April May June July August September October November December
2018 2018 2018 2018 2018 2018 2018 2018 2018 2018 2018 2018 Average
Service Classification No. 1Heating 26,781 26,712 26,794 26,723 26,805 26,734 26,802 26,746 26,813 26,757 26,823 26,768 26,772 Nonheating 229,901 229,297 229,572 229,953 228,358 230,040 229,123 229,500 229,347 229,557 229,239 230,006 229,491
256,682 256,009 256,366 256,676 255,163 256,774 255,925 256,246 256,160 256,314 256,062 256,774 256,263
Service Classification No. 2Nondemand 29,413 29,351 29,424 29,333 29,410 29,346 29,578 29,321 29,477 29,321 29,477 29,356 29,401 Primary 156 154 151 154 153 157 153 153 153 153 154 149 153 Secondary 11,426 11,413 11,649 11,404 11,403 11,397 11,397 11,266 11,363 11,353 11,342 11,497 11,409
40,995 40,918 41,224 40,891 40,966 40,900 41,128 40,740 40,993 40,827 40,973 41,002 40,963
Service Classification No. 3 30 30 31 31 30 31 31 32 31 31 31 31 31
Service Classification No. 5 3,979 4,064 4,041 4,051 3,970 4,080 4,025 4,006 4,043 4,044 4,017 4,048 4,031
Service Classification No. 6 990 1,010 990 1,010 990 1,010 990 1,010 990 1,010 990 1,010 1,000
Service Classification No. 8 210 210 210 210 210 210 210 210 210 210 210 210 210
Service Classification No. 9 210 204 204 198 202 201 200 200 200 198 198 197 201
Service Classification No. 13Transmission 5 5 5 5 5 5 5 5 5 5 5 5 5 Substation 8 8 8 8 8 8 8 8 8 8 8 8 8
13 13 13 13 13 13 13 13 13 13 13 13 13
Interdepartmental 1 1 1 1 1 1 1 1 1 1 1 1 1
Total Customers 303,110 302,459 303,080 303,081 301,545 303,220 302,523 302,458 302,641 302,648 302,495 303,286 302,712
Sheet 3 of 3
Schedule E
Exhibit ___(F
RP
-2)

Central Hudson Gas & Electric CorporationSummary of Electric Sales (MWh) by Service Classification
Twelve Months Ended June 30, 2019
July August September October November December January February March April May June2018 2018 2018 2018 2018 2018 2019 2019 2019 2019 2019 2019 Total
Service Classification No. 1Heating 18,559 20,023 17,017 18,344 23,484 36,033 44,184 45,006 39,547 29,631 20,779 16,380 328,987
EEPS Lost MWh (2,109) (2,256) (1,925) (2,063) (2,633) (4,051) (5,435) (5,585) (4,888) (3,699) (2,570) (2,057) (39,271) Nonheating 183,391 191,924 157,760 130,879 133,336 151,695 165,847 168,106 157,053 134,202 122,966 141,595 1,838,754
EEPS Lost MWh (20,296) (21,193) (17,442) (14,458) (14,719) (16,752) (20,226) (20,506) (19,170) (16,375) (15,008) (17,269) (213,414) PV Lost MWh (9,376) (8,168) (6,914) (6,322) (4,991) (4,344) (3,018) (4,588) (8,536) (9,444) (9,579) (10,520) (85,800)
170,169 180,330 148,496 126,380 134,477 162,581 181,352 182,433 164,006 134,315 116,588 128,129 1,829,256
Service Classification No. 2Nondemand 14,940 16,373 14,502 13,307 12,700 14,782 15,900 16,448 15,190 14,137 12,885 13,684 174,848
EEPS Lost MWh (1,858) (2,035) (1,803) (1,655) (1,580) (1,836) (2,162) (2,237) (2,066) (1,923) (1,753) (1,860) (22,768) Primary 20,389 20,888 18,709 18,203 18,075 18,421 18,461 18,305 18,441 18,483 18,520 19,493 226,388
EEPS Lost MWh (2,535) (2,597) (2,326) (2,263) (2,247) (2,290) (2,511) (2,489) (2,508) (2,514) (2,519) (2,651) (29,450) Secondary 138,511 140,394 132,435 113,299 109,362 116,597 117,972 119,661 116,378 112,774 112,318 122,756 1,452,457
EEPS Lost MWh (17,222) (17,456) (16,467) (14,088) (13,598) (14,498) (16,045) (16,275) (15,827) (15,337) (15,276) (16,696) (188,785) PV Lost MWh (3,001) (2,615) (2,213) (2,024) (1,598) (1,391) (864) (1,313) (2,443) (2,702) (2,741) (3,010) (25,915)
149,224 152,952 142,837 124,779 121,114 129,785 130,751 132,100 127,165 122,918 121,434 131,716 1,586,775
Service Classification No. 3 26,810 26,748 24,287 22,958 23,103 23,982 23,756 21,234 22,421 21,903 23,312 23,972 284,486 EEPS Lost MWh (3,333) (3,326) (3,020) (2,854) (2,873) (2,982) (3,231) (2,888) (3,049) (2,979) (3,170) (3,260) (36,965)
23,477 23,422 21,267 20,104 20,230 21,000 20,525 18,346 19,372 18,924 20,142 20,712 247,521
Service Classification No. 5 800 900 990 1,140 1,230 1,360 1,290 1,080 1,050 920 830 740 12,330
Service Classification No. 6 2,170 1,650 1,610 1,240 1,250 1,780 1,520 1,990 1,720 1,640 1,140 1,320 19,030
Service Classification No. 8 1,160 1,300 1,430 1,660 1,790 1,970 1,740 1,450 1,410 1,240 1,120 990 17,260
Service Classification No. 9 50 50 50 50 50 50 50 50 50 50 50 50 600
Service Classification No. 13Transmission 64,732 65,304 60,558 62,014 56,054 54,160 54,494 52,590 59,470 59,400 61,172 61,226 711,174 Substation 15,136 15,290 11,000 10,850 12,632 11,918 12,868 12,162 12,728 12,252 13,444 13,472 153,752
79,868 80,594 71,558 72,864 68,686 66,078 67,362 64,752 72,198 71,652 74,616 74,698 864,926
Interdepartmental 90 100 90 90 80 80 90 90 80 80 80 90 1,040
Total 427,008 441,298 388,328 348,307 348,907 384,684 404,680 402,291 387,051 351,739 336,000 358,445 4,578,738
Sheet 1 of 3
Schedule F
Exhibit ___(F
RP
-2)

Central Hudson Gas & Electric CorporationSummary of Electric Base Delivery Revenues by Service Classification
Twelve Months Ended June 30, 2019
July August September October November December January February March April May June2018 2018 2018 2018 2018 2018 2019 2019 2019 2019 2019 2019 Total
Service Classification No. 1Heating 1,939,610$ 2,040,560$ 1,832,170$ 1,923,510$ 2,284,140$ 3,159,330$ 3,730,560$ 3,786,330$ 3,406,960$ 2,712,650$ 2,096,290$ 1,787,320$ 30,699,430$
EEPS Lost Revenue (147,530)$ (157,090)$ (134,670)$ (143,680)$ (183,990)$ (282,400)$ (379,080)$ (390,110)$ (341,430)$ (257,890)$ (179,100)$ (143,330)$ (2,740,300)$ Nonheating 18,308,890$ 18,913,830$ 16,523,910$ 14,651,270$ 14,815,330$ 16,116,050$ 17,102,470$ 17,251,140$ 16,482,710$ 14,895,010$ 14,080,170$ 15,413,130$ 194,553,910$
EEPS Lost Revenue (1,417,960)$ (1,480,120)$ (1,218,880)$ (1,010,030)$ (1,028,190)$ (1,169,980)$ (1,412,580)$ (1,432,830)$ (1,338,620)$ (1,144,210)$ (1,048,450)$ (1,206,250)$ (14,908,100)$ PV Lost Revenue (654,880)$ (570,570)$ (482,930)$ (441,570)$ (348,620)$ (303,420)$ (210,780)$ (320,470)$ (596,250)$ (659,640)$ (669,110)$ (734,810)$ (5,993,050)$
18,028,130$ 18,746,610$ 16,519,600$ 14,979,500$ 15,538,670$ 17,519,580$ 18,830,590$ 18,894,060$ 17,613,370$ 15,545,920$ 14,279,800$ 15,116,060$ 201,611,890$
Service Classification No. 2Nondemand 1,522,880$ 1,560,650$ 1,505,060$ 1,460,570$ 1,446,240$ 1,509,960$ 1,550,610$ 1,566,360$ 1,527,820$ 1,490,310$ 1,452,070$ 1,475,960$ 18,068,490$
EEPS Lost Revenue (60,370)$ (66,590)$ (58,750)$ (54,180)$ (51,580)$ (59,730)$ (70,500)$ (73,110)$ (67,560)$ (62,670)$ (57,440)$ (60,710)$ (743,190)$ Primary 544,960$ 501,580$ 476,420$ 456,110$ 456,780$ 466,550$ 420,640$ 431,860$ 434,320$ 467,480$ 472,780$ 496,360$ 5,625,840$
EEPS Lost Revenue (61,140)$ (55,690)$ (52,620)$ (50,110)$ (50,130)$ (51,440)$ (49,690)$ (51,380)$ (51,720)$ (56,090)$ (57,020)$ (59,960)$ (646,990)$ Secondary 6,016,720$ 5,743,290$ 5,597,540$ 5,089,300$ 4,943,370$ 4,948,630$ 4,742,750$ 4,796,240$ 4,799,740$ 4,902,920$ 5,050,710$ 5,433,210$ 62,064,420$
EEPS Lost Revenue (628,870)$ (596,420)$ (577,240)$ (513,790)$ (496,090)$ (495,110)$ (515,620)$ (522,980)$ (520,620)$ (537,420)$ (557,200)$ (609,270)$ (6,570,630)$ PV Lost Revenue (233,240)$ (203,210)$ (172,000)$ (157,270)$ (124,160)$ (108,070)$ (65,390)$ (99,400)$ (184,970)$ (204,620)$ (207,560)$ (227,940)$ (1,987,830)$
7,100,940$ 6,883,610$ 6,718,410$ 6,230,630$ 6,124,430$ 6,210,790$ 6,012,800$ 6,047,590$ 5,937,010$ 5,999,910$ 6,096,340$ 6,447,650$ 75,810,110$
Service Classification No. 3 629,670$ 594,200$ 620,470$ 558,520$ 590,830$ 609,080$ 541,890$ 494,230$ 505,650$ 533,530$ 587,470$ 590,130$ 6,855,670$ EEPS Lost Revenue (72,550)$ (67,920)$ (71,330)$ (63,550)$ (67,390)$ (69,720)$ (67,570)$ (61,160)$ (62,680)$ (66,120)$ (73,740)$ (73,830)$ (817,560)$
557,120$ 526,280$ 549,140$ 494,970$ 523,440$ 539,360$ 474,320$ 433,070$ 442,970$ 467,410$ 513,730$ 516,300$ 6,038,110$
Service Classification No. 5 146,170$ 147,150$ 148,130$ 149,740$ 150,680$ 151,980$ 150,370$ 148,120$ 147,790$ 146,520$ 145,540$ 144,580$ 1,776,770$
Service Classification No. 6 140,730$ 113,950$ 111,320$ 92,410$ 92,400$ 120,780$ 106,580$ 131,820$ 117,100$ 113,420$ 86,630$ 96,620$ 1,323,760$
Service Classification No. 8 408,400$ 408,440$ 408,480$ 408,550$ 408,590$ 408,640$ 391,440$ 391,360$ 391,340$ 391,290$ 391,260$ 391,220$ 4,799,010$
Service Classification No. 9 19,100$ 19,060$ 19,030$ 18,980$ 18,950$ 18,910$ 18,460$ 18,840$ 18,810$ 18,750$ 18,740$ 18,690$ 226,320$
Service Classification No. 13Transmission 490,630$ 515,400$ 491,280$ 511,890$ 449,080$ 434,050$ 410,970$ 417,590$ 469,070$ 459,490$ 474,890$ 474,750$ 5,599,090$ Substation 179,410$ 178,590$ 142,420$ 145,520$ 144,370$ 149,480$ 175,850$ 158,690$ 160,210$ 147,340$ 172,170$ 163,610$ 1,917,660$
670,040$ 693,990$ 633,700$ 657,410$ 593,450$ 583,530$ 586,820$ 576,280$ 629,280$ 606,830$ 647,060$ 638,360$ 7,516,750$
Interdepartmental 960$ 1,070$ 960$ 960$ 860$ 860$ 960$ 960$ 860$ 860$ 860$ 960$ 11,130$
Total Base Revenue 27,071,590$ 27,540,160$ 25,108,770$ 23,033,150$ 23,451,470$ 25,554,430$ 26,572,340$ 26,642,100$ 25,298,530$ 23,290,910$ 22,179,960$ 23,370,440$ 299,113,850$
Sheet 2 of 3
Schedule F
Exhibit ___(F
RP
-2)

Central Hudson Gas & Electric Corporation
Summary of Electric Customers by Service Classification
Twelve Months Ended June 30, 2019
July August September October November December January February March April May June
2018 2018 2018 2018 2018 2018 2019 2019 2019 2019 2019 2019 Average
Service Classification No. 1Heating 26,802 26,746 26,813 26,757 26,823 26,768 26,846 26,778 26,859 26,789 26,870 26,799 26,804 Nonheating 229,123 229,500 229,347 229,557 229,239 230,006 229,922 229,538 229,690 230,042 228,791 230,110 229,572
255,925 256,246 256,160 256,314 256,062 256,774 256,768 256,316 256,549 256,831 255,661 256,909 256,376
Service Classification No. 2Nondemand 29,578 29,321 29,477 29,321 29,477 29,356 29,475 29,414 29,486 29,396 29,472 29,408 29,432 Primary 153 153 153 153 154 149 155 153 150 153 152 156 153 Secondary 11,397 11,266 11,363 11,353 11,342 11,497 11,326 11,317 11,560 11,318 11,319 11,318 11,365
41,128 40,740 40,993 40,827 40,973 41,002 40,956 40,884 41,196 40,867 40,943 40,882 40,950
Service Classification No. 3 31 32 31 31 31 31 30 30 30 30 30 30 31
Service Classification No. 5 4,025 4,006 4,043 4,044 4,017 4,048 3,934 4,018 3,995 4,005 3,925 4,034 4,008
Service Classification No. 6 990 1,010 990 1,010 990 1,010 990 1,010 990 1,010 990 1,010 1,000
Service Classification No. 8 210 210 210 210 210 210 210 210 210 210 210 210 210
Service Classification No. 9 200 200 200 198 198 197 203 197 197 191 195 194 198
Service Classification No. 13Transmission 5 5 5 5 5 5 5 5 5 5 5 5 5 Substation 8 8 8 8 8 8 8 8 8 8 8 8 8
13 13 13 13 13 13 13 13 13 13 13 13 13
Interdepartmental 1 1 1 1 1 1 1 1 1 1 1 1 1
Total Customers 302,523 302,458 302,641 302,648 302,495 303,286 303,105 302,679 303,181 303,158 301,968 303,283 302,787
Sheet 3 of 3
Schedule F
Exhibit ___(F
RP
-2)

Exhibit__(FRP-3)
Central Hudson Gas & Gas Corporation
Gas Sales, Base Delivery Revenues and Customers
Schedule A Summary of Gas Sales, Base Revenues and Customersby Service Classification for the Twelve Months Ended March 31, 2017, December 31, 2017, December 31, 2018,June 30, 2019
Schedule B Gas Sales, Base Revenues and Customers by Revenue Account - Twelve Months Ended March 31, 2017
Schedule C Gas Sales, Base Revenues and Customers by Service Classification - Twelve Months Ended March 31, 2017
Schedule D Gas Sales, Base Revenues and Customers by Service Classification - Twelve Months Ended December 31, 2017
Schedule E Gas Sales, Base Revenues and Customers by Service Classification - Twelve Months Ended December 31, 2018
Schedule F Gas Sales, Base Revenues and Customers by Service Classification - Twelve Months Ended June 30, 2019

Exhibit__(FRP-3)Schedule A
Central Hudson Gas & Electric CorporationSummary of Gas Sales, Base Revenues and Customers By Service Classification
12 Months Ended March 31, 2017, December 31, 2017, 2018 and June 30, 2019
Twelve Months Twelve Months Twelve Months Twelve MonthsEnded Ended Ended Ended
Sales & Transport (Mcf) Mar. 31, 2017 Dec. 31, 2017 Dec. 31, 2018 Jun. 30, 2019Service Classification Nos. 1 & 12 Heat 5,286,194 5,218,126 5,607,070 5,568,704 Nonheating 165,158 155,221 148,796 142,889 EEPS Adjustment - (130,073) (297,020) (324,739)
5,451,353 5,243,274 5,458,846 5,386,854
Service Classification Nos. 2, 6 & 13 Heat 5,929,147 5,802,962 5,987,868 6,040,846 Nonheating 915,348 884,468 883,076 882,157 EEPS Adjustment - (44,867) (95,705) (104,405)
6,844,495 6,642,563 6,775,239 6,818,598
Service Classification No. 8 252,029 135,355 115,857 115,857 Service Classification No. 9 1,343,716 1,409,070 1,421,952 1,421,952 Service Classification No. 11 2,303,654 1,804,584 1,775,389 1,775,389 Service Classification No. 14 2,564,943 69,765 - - Sales for Resale 2,592,054 1,376,436 - - Interdepartmental 30,284 22,883 24,000 24,000
Total Sales & Transport 21,382,527 16,703,929 15,571,283 15,542,650
Base Revenue ($)Service Classification Nos. 1 & 12 Heat 52,524,311$ 54,219,859$ 58,600,870$ 58,493,790$ Nonheating 3,370,194$ 3,287,235$ 3,287,040$ 3,204,080$ EEPS Adjustment -$ (979,060)$ (2,081,920)$ (2,270,930)$
55,894,505$ 56,528,034$ 59,805,990$ 59,426,940$
Service Classification Nos. 2, 6 & 13 Heat 22,994,847$ 24,710,050$ 26,073,480$ 26,300,140$ Nonheating 2,985,798$ 3,293,994$ 3,435,340$ 3,430,890$ EEPS Adjustment -$ (159,850)$ (340,360)$ (371,230)$
25,980,645$ 27,844,194$ 29,168,460$ 29,359,800$
Service Classification No. 8 1,008,311$ 448,912$ 313,520$ 300,060$ Service Classification No. 9 1,312,765$ 2,238,277$ 2,504,050$ 2,300,370$ Service Classification No. 11* 5,101,416$ 2,901,100$ 2,386,660$ 2,386,660$ Service Classification No. 14 856,411$ 7,725$ -$ -$ Sales for Resale 9,295,592$ 5,488,793$ -$ -$ Interdepartmental 216,333$ 129,645$ 67,753$ 67,753$
Total Own Territory 99,665,977$ 95,586,679$ 94,246,433$ 93,841,583$
CustomersService Classification Nos. 1 & 12 Heat 64,047 62,091 62,912 63,380 Nonheating 7,717 7,222 6,939 6,812
71,763 69,313 69,852 70,192
Service Classification Nos. 2, 6 & 13 Heat 10,436 10,274 10,339 10,422 Nonheating 1,193 1,161 1,150 1,147
11,629 11,434 11,489 11,568
Service Classification No. 8 17 13 13 13 Interdepartmental 1 1 1 1
Total Sales & Transport Customers 83,410 80,761 81,355 81,775
* Forecast periods exclude Danskammer

CENTRAL HUDSON GAS & ELECTRIC CORPORATIONSummary of Gas Sales, Base Revenues, and Customers By Revenue Account
Twelve Months Ended March 31, 2017
April May June July August September October November December January February MarchAcct. No. 2016 2016 2016 2016 2016 2016 2016 2016 2016 2017 2017 2017 Total
Sales (Mcf)480 Residential* 442,265 274,065 108,989 157,884 84,335 76,255 169,868 530,435 662,790 741,822 661,742 658,165 4,568,613 481 Commercial & Industrial* 251,384 169,896 110,960 90,371 77,104 89,301 132,492 323,938 403,808 465,724 353,753 408,814 2,877,544 482 Public Authorities 60,492 32,895 19,087 8,098 11,557 13,257 20,110 47,796 82,185 97,869 85,301 72,574 551,222 483 Sales For Resale 203,759 89,785 44,378 56,777 54,765 38,758 91,022 291,317 345,057 424,353 434,460 517,623 2,592,054 484 Interdepartmental 4,146 1,873 684 953 2,547 147 1,076 1,329 3,090 6,018 4,415 4,007 30,284 489.09 SC 11 DLM Transportation 54,738 33,400 23,846 26,236 29,192 28,273 35,650 59,739 91,226 88,226 81,014 91,755 643,295 489.10 Gas Transport. - Cust. Owned Gas 108,522 92,676 72,553 72,528 68,998 66,713 100,747 131,764 150,347 155,616 149,026 174,226 1,343,716 489.11 SC 14 Transportation - 172,448 91,140 1,043,754 811,586 283,680 3,240 66,130 23,200 - - 69,765 2,564,943 489.12 SC 11 Transportation 91,325 111,566 122,179 217,289 198,866 109,333 84,007 113,640 152,563 152,906 131,566 175,119 1,660,359 489.13/14/30 Residential Transportation* 92,391 57,516 22,961 32,571 16,319 15,447 33,729 99,208 120,692 132,962 114,619 125,712 864,127 489.19/20/40 Commercial Transportation* 299,475 204,548 146,879 130,160 106,548 116,336 186,808 377,654 387,512 457,919 349,715 442,756 3,206,309 489.21 Industrial Transportation 33,243 25,386 22,082 18,059 16,986 18,857 19,719 27,491 34,682 44,993 45,388 40,199 347,086 489.22 OPA Transportation 50,657 31,276 8,188 4,227 5,571 4,776 10,031 38,017 83,461 84,263 83,332 57,373 461,172
Total Sales 1,692,397 1,297,329 793,925 1,858,906 1,484,374 861,132 888,499 2,108,457 2,540,612 2,852,670 2,494,332 2,838,089 21,710,722
Base Revenues480 Residential* 4,346,024$ 3,379,587$ 2,243,639$ 3,247,495$ 2,213,932$ 2,031,080$ 2,931,076$ 4,828,265$ 5,132,519$ 5,511,842$ 5,527,990$ 5,798,122$ 47,191,572$ 481 Commercial & Industrial* 1,088,505$ 806,308$ 616,707$ 608,133$ 568,816$ 594,058$ 809,208$ 1,447,111$ 1,630,499$ 1,851,050$ 1,721,319$ 1,907,370$ 13,649,084$ 482 Public Authorities 199,131$ 108,159$ 71,893$ 46,530$ 55,413$ 60,959$ 89,029$ 180,397$ 282,107$ 335,711$ 323,343$ 284,010$ 2,036,682$ 483 Sales For Resale 480,861$ 167,802$ 110,769$ 169,143$ 164,860$ 94,711$ 190,616$ 1,017,234$ 1,410,803$ 1,736,516$ 1,769,578$ 1,982,699$ 9,295,592$ 484 Interdepartmental 23,939$ 10,770$ 4,006$ 6,510$ 17,287$ 842$ 7,005$ 8,330$ 21,455$ 48,941$ 34,870$ 32,378$ 216,333$ 489.09 SC 11 DLM Transportation 66,460$ 51,701$ 48,480$ 51,361$ 51,727$ 51,613$ 55,759$ 72,527$ 94,444$ 92,361$ 87,428$ 94,914$ 818,775$ 489.10 Gas Transport. - Cust. Owned Gas 96,981$ 95,185$ 79,817$ 78,493$ 73,884$ 70,488$ 101,644$ 125,920$ 135,196$ 142,034$ 144,565$ 168,557$ 1,312,765$ 489.11 SC 14 Transportation -$ 17,632$ 202,266$ 210,535$ 206,137$ 202,651$ 332$ 6,761$ 2,372$ -$ -$ 7,725$ 856,411$ 489.12 SC 11 Transportation 449,263$ 439,215$ 433,193$ 373,757$ 311,363$ 310,333$ 317,869$ 327,264$ 342,449$ 328,679$ 319,652$ 329,605$ 4,282,641$ 489.13/14/30 Residential Transportation* 865,512$ 670,399$ 442,956$ 638,015$ 412,619$ 379,977$ 533,441$ 858,277$ 892,816$ 940,384$ 925,062$ 1,016,075$ 8,575,534$ 489.19/20/40 Commercial Transportation* 908,379$ 602,104$ 472,808$ 461,430$ 421,600$ 469,539$ 621,434$ 1,153,909$ 1,113,196$ 1,324,189$ 1,262,489$ 1,470,584$ 10,281,660$ 489.21 Industrial Transportation 73,356$ 46,240$ 43,353$ 34,717$ 39,832$ 45,205$ 45,847$ 63,880$ 78,838$ 102,168$ 126,962$ 111,612$ 812,009$ 489.22 OPA Transportation 128,191$ 74,844$ 31,353$ 21,491$ 25,607$ 24,072$ 36,975$ 102,554$ 198,797$ 218,014$ 262,003$ 181,779$ 1,305,682$
Total Base Revenues 8,726,601$ 6,469,946$ 4,801,241$ 5,947,610$ 4,563,076$ 4,335,528$ 5,740,235$ 10,192,431$ 11,335,491$ 12,631,889$ 12,505,261$ 13,385,430$ 100,634,739$
Customers480 Residential 61,490 53,105 61,628 83,589 57,723 57,666 58,154 58,276 59,125 59,258 58,152 61,106 60,773 481 Commercial & Industrial 7,777 6,854 7,692 8,356 7,260 7,282 7,330 7,468 7,592 7,750 7,715 8,025 7,592 482 Public Authorities 486 440 466 476 447 458 461 459 468 464 461 484 464 484 Interdepartmental 1 1 1 1 1 1 1 1 1 1 1 1 1 489.13/14/30 Residential Transportation 11,555 10,624 11,453 15,924 10,604 10,411 10,277 10,096 10,035 9,973 9,668 9,929 10,879 489.19/20/40 Commercial Transportation 3,630 3,389 3,518 3,941 3,321 3,279 3,282 3,259 3,237 3,218 3,114 3,279 3,372 489.21 Industrial Transportation 44 42 46 44 44 41 43 47 40 42 44 43 43 489.22 OPA Transportation 291 291 300 292 285 283 285 269 285 285 278 286 286
Average Customers 85,274 74,746 85,104 112,623 79,685 79,421 79,833 79,875 80,783 80,991 79,433 83,153 83,410
* Includes Unbilled
Schedule B
Exhibit___(F
RP
-3)

Central Hudson Gas & Electric CorporationStatement of Gas Sales, Base Revenues and Customers By Service Classification
For the Twelve Months Ended March 31, 2017
April May June July August September October November December January February March2016 2016 2016 2016 2016 2016 2016 2016 2016 2017 2017 2017 Total
Sales & Transport (Mcf)Service Classification Nos. 1 & 12
Heating 638,204 371,331 239,868 181,102 90,015 92,481 110,933 371,130 665,965 909,476 841,873 773,816 5,286,194 Non-Heating 20,308 11,453 10,442 9,829 4,434 5,516 6,471 10,255 17,786 24,949 24,329 19,388 165,158
Service Classification Nos. 2, 6 & 13Heating 597,142 382,178 250,786 188,940 148,517 175,157 194,430 433,507 773,772 1,014,964 933,369 836,386 5,929,147
Non-Heating 84,439 68,665 54,284 46,782 53,251 53,607 57,689 71,790 109,623 106,729 126,642 81,846 915,348 Service Classification No. 8 26,243 25,063 19,531 14,717 18,350 18,268 25,597 30,910 30,262 25,952 7,681 9,455 252,029 Service Classification No. 9 108,522 92,676 72,553 72,528 68,998 66,713 100,747 131,764 150,347 155,616 149,026 174,226 1,343,716 Service Classification No.11 146,063 144,966 146,025 243,525 228,058 137,606 119,657 173,379 243,789 241,132 212,580 266,874 2,303,654 Service Classification No. 14 - 172,448 91,140 1,043,754 811,586 283,680 3,240 66,130 23,200 - - 69,765 2,564,943 Sales for Resale 203,759 89,785 44,378 56,777 54,765 38,758 91,022 291,317 345,057 424,353 434,460 517,623 2,592,054 Interdepartmental 4,146 1,873 684 953 2,547 147 1,076 1,329 3,090 6,018 4,415 4,007 30,284
Total Sales & Transport 1,828,827 1,360,438 929,690 1,858,906 1,480,521 871,933 710,862 1,581,511 2,362,891 2,909,188 2,734,374 2,753,387 21,382,527
Base RevenueService Classification Nos. 1 & 12
Heating 5,606,194$ 3,900,581$ 3,319,899$ 3,562,696$ 2,263,860$ 2,288,221$ 2,439,336$ 4,109,503$ 5,415,614$ 6,526,830$ 6,712,298$ 6,379,281$ 52,524,311$ Non-Heating 312,997$ 239,127$ 268,586$ 329,289$ 222,211$ 225,799$ 235,897$ 260,294$ 301,797$ 334,916$ 328,278$ 311,001$ 3,370,194$
Service Classification Nos. 2, 6 & 13Heating 2,114,038$ 1,358,086$ 1,073,421$ 949,767$ 840,511$ 922,009$ 992,403$ 1,709,239$ 2,616,372$ 3,392,462$ 3,717,272$ 3,309,266$ 22,994,847$
Non-Heating 239,530$ 192,108$ 168,408$ 158,500$ 178,914$ 187,599$ 198,968$ 244,478$ 347,260$ 344,925$ 426,858$ 298,251$ 2,985,798$ Service Classification No. 8 101,874$ 91,713$ 74,627$ 57,560$ 74,865$ 74,400$ 102,033$ 125,016$ 120,281$ 105,888$ 33,908$ 46,146$ 1,008,311$ Service Classification No. 9 96,981$ 95,185$ 79,817$ 78,493$ 73,884$ 70,488$ 101,644$ 125,920$ 135,196$ 142,034$ 144,565$ 168,557$ 1,312,765$ Service Classification No.11 515,723$ 490,916$ 481,673$ 425,118$ 363,090$ 361,946$ 373,628$ 399,791$ 436,893$ 421,040$ 407,080$ 424,519$ 5,101,416$ Service Classification No. 14 -$ 17,632$ 202,266$ 210,535$ 206,137$ 202,651$ 332$ 6,761$ 2,372$ -$ -$ 7,725$ 856,411$ Sales for Resale 480,861$ 167,802$ 110,769$ 169,143$ 164,860$ 94,711$ 190,616$ 1,017,234$ 1,410,803$ 1,736,516$ 1,769,578$ 1,982,699$ 9,295,592$ Interdepartmental 23,939$ 10,770$ 4,006$ 6,510$ 17,287$ 842$ 7,005$ 8,330$ 21,455$ 48,941$ 34,870$ 32,378$ 216,333$
Total Base Revenue 9,492,137$ 6,563,921$ 5,783,472$ 5,947,610$ 4,405,618$ 4,428,666$ 4,641,862$ 8,006,566$ 10,808,042$ 13,053,553$ 13,574,708$ 12,959,822$ 99,665,977$
CustomersService Classification Nos. 1 & 12
Heating 65,157 57,089 65,056 88,989 61,009 60,795 61,175 61,151 61,911 61,965 60,617 63,644 64,047 Non-Heating 7,999 6,737 8,135 10,667 7,421 7,389 7,360 7,334 7,358 7,378 7,312 7,509 7,717
Service Classification Nos. 2, 6 & 13Heating 10,809 9,816 10,633 11,626 10,078 10,065 10,116 10,203 10,328 10,449 10,318 10,796 10,436
Non-Heating 1,284 1,080 1,264 1,329 1,165 1,154 1,161 1,167 1,168 1,182 1,173 1,189 1,193 Service Classification No. 8 24 23 15 11 11 17 20 19 17 16 12 14 17
Interdepartmental 1 1 1 1 1 1 1 1 1 1 1 1 1
Average Customers 85,274 74,746 85,104 112,623 79,685 79,421 79,833 79,875 80,783 80,991 79,433 83,153 83,410
Sch
ed
ule
C
Exh
ibit_
__
(FR
P-3
)

January February March April May June July August September October November DecemberSales & Transport (Mcf) 2017 2017 2017 2017 2017 2017 2017 2017 2017 2017 2017 2017 TotalService Classification Nos. 1 & 12 Heat 909,476 841,873 773,816 592,334 280,253 115,420 95,553 105,502 122,439 219,676 413,249 748,535 5,218,126 Nonheating 24,949 24,329 19,388 17,378 10,232 7,005 7,488 4,391 5,619 6,779 10,542 17,122 155,221 EEPS Adjustment - - - (38,695) (20,096) (10,502) (5,659) (5,543) (4,041) (6,269) (10,650) (28,619) (130,073)
934,424 866,202 793,204 571,017 270,389 111,923 97,382 104,350 124,017 220,186 413,141 737,038 5,243,274
Service Classification Nos. 2, 6 & 13 Heat 1,014,964 933,369 836,386 526,444 312,340 145,643 149,077 139,257 185,811 258,098 517,036 784,537 5,802,962 Nonheating 106,729 126,642 81,846 78,795 65,510 48,378 53,953 42,978 54,792 56,982 79,738 88,125 884,468 EEPS Adjustment - - - (8,538) (5,233) (3,224) (2,508) (2,254) (2,521) (3,030) (5,918) (11,641) (44,867)
1,121,693 1,060,011 918,232 596,701 372,617 190,797 200,522 179,981 238,082 312,050 590,856 861,021 6,642,563
Service Classification No. 8 25,952 7,681 9,455 7,640 11,810 8,620 5,800 9,050 9,560 12,640 15,910 11,237 135,355 Service Classification No. 9 155,616 149,026 174,226 122,760 95,990 72,840 72,610 70,820 70,520 108,900 145,530 170,232 1,409,070 Service Classification No. 11 241,132 212,580 266,874 149,122 101,068 73,816 80,764 80,938 78,899 121,240 169,493 228,658 1,804,584 Service Classification No. 14 - - 69,765 - - - - - - - - - 69,765 Sales for Resale 424,353 434,460 517,623 - - - - - - - - - 1,376,436 Interdepartmental* 5,134 4,415 3,524 2,780 1,380 470 240 160 150 380 1,350 2,900 22,883
Total Sales & Transport 2,908,304 2,734,374 2,752,904 1,450,020 853,254 458,466 457,318 445,299 521,228 775,396 1,336,280 2,011,085 16,703,929
Base Revenue ($)Service Classification Nos. 1 & 12 Heat 6,526,830$ 6,712,298$ 6,379,281$ 5,600,440$ 3,859,990$ 2,506,890$ 2,372,740$ 2,532,460$ 2,713,980$ 3,529,860$ 4,840,630$ 6,644,460$ 54,219,859$ Nonheating 334,916$ 328,278$ 311,001$ 302,420$ 259,720$ 234,020$ 241,610$ 219,750$ 230,200$ 240,740$ 270,650$ 313,930$ 3,287,235$ EEPS Adjustment -$ -$ -$ (264,960)$ (165,880)$ (87,230)$ (47,020)$ (48,230)$ (36,210)$ (54,540)$ (82,980)$ (192,010)$ (979,060)$
6,861,746$ 7,040,577$ 6,690,281$ 5,637,900$ 3,953,830$ 2,653,680$ 2,567,330$ 2,703,980$ 2,907,970$ 3,716,060$ 5,028,300$ 6,766,380$ 56,528,034$
Service Classification Nos. 2, 6 & 13 Heat 3,392,462$ 3,717,272$ 3,309,266$ 2,209,460$ 1,499,330$ 921,810$ 939,880$ 918,350$ 1,074,830$ 1,336,220$ 2,245,660$ 3,145,510$ 24,710,050$ Nonheating 344,925$ 426,858$ 298,251$ 292,380$ 250,110$ 192,760$ 214,340$ 183,140$ 220,730$ 228,170$ 307,370$ 334,960$ 3,293,994$ EEPS Adjustment -$ -$ -$ (29,580)$ (18,680)$ (11,850)$ (9,230)$ (8,420)$ (9,200)$ (11,000)$ (21,140)$ (40,750)$ (159,850)$
3,737,387$ 4,144,130$ 3,607,517$ 2,472,260$ 1,730,760$ 1,102,720$ 1,144,990$ 1,093,070$ 1,286,360$ 1,553,390$ 2,531,890$ 3,439,720$ 27,844,194$
Service Classification No. 8 105,888$ 33,908$ 46,146$ 21,770$ 33,670$ 24,570$ 16,540$ 25,790$ 27,240$ 36,010$ 45,350$ 32,030$ 448,912$ Service Classification No. 9 142,034$ 144,565$ 168,557$ 221,320$ 187,230$ 150,310$ 146,950$ 142,500$ 141,580$ 211,490$ 273,130$ 308,610$ 2,238,277$ Service Classification No. 11 421,040$ 407,080$ 424,519$ 192,060$ 168,100$ 160,120$ 164,210$ 164,160$ 164,980$ 185,150$ 210,190$ 239,490$ 2,901,100$
Service Classification No. 14 -$ -$ 7,725$ -$ -$ -$ -$ -$ -$ -$ -$ -$ 7,725$ Sales for Resale 1,736,516$ 1,769,578$ 1,982,699$ -$ -$ -$ -$ -$ -$ -$ -$ -$ 5,488,793$ Interdepartmental* 39,928$ 34,870$ 27,952$ 7,368$ 3,657$ 1,246$ 678$ 452$ 423$ 1,073$ 3,811$ 8,187$ 129,645$
Total Own Territory 13,044,540$ 13,574,708$ 12,955,396$ 8,552,678$ 6,077,247$ 4,092,646$ 4,040,698$ 4,129,952$ 4,528,553$ 5,703,173$ 8,092,671$ 10,794,417$ 95,586,679$
Customers
Service Classification Nos. 1 & 12 Heat 61,965 60,617 63,644 61,781 61,870 61,931 62,029 62,090 62,178 62,245 62,338 62,403 62,091
Nonheating 7,378 7,312 7,509 7,253 7,216 7,210 7,178 7,167 7,135 7,125 7,094 7,083 7,222
69,343 67,929 71,153 69,034 69,086 69,141 69,207 69,257 69,313 69,370 69,432 69,486 69,313
Service Classification Nos. 2, 6 & 13 Heat 10,449 10,318 10,796 10,141 10,136 10,174 10,165 10,200 10,198 10,230 10,221 10,256 10,274
Nonheating 1,182 1,173 1,189 1,151 1,170 1,146 1,159 1,149 1,161 1,144 1,162 1,142 1,161
11,631 11,491 11,985 11,292 11,306 11,320 11,324 11,349 11,359 11,374 11,383 11,398 11,434
Service Classification No. 8 16 12 14 13 13 13 13 13 13 13 13 13 13
Interdepartmental 1 1 1 1 1 1 1 1 1 1 1 1 1
Total Sales & Transport Customers 80,991 79,433 83,153 80,340 80,406 80,475 80,545 80,620 80,686 80,758 80,829 80,898 80,761
*January - March 2017 Interdepartmental excludes PSC account 484.10 Interdepartmental - Interr. - Gas Turbines
Schedule D
Exhibit__(F
RP
-3)Central Hudson Gas & Electric Corporation
Summary of Gas Sales, Base Revenues and Customers By Service ClassificationFor the Twelve Months Ending December 31, 2017

January February March April May June July August September October November DecemberSales & Transport (Mcf) 2018 2018 2018 2018 2018 2018 2018 2018 2018 2018 2018 2018 TotalService Classification Nos. 1 & 12 Heat 958,832 1,076,116 905,550 589,947 278,196 115,272 96,365 107,086 122,389 216,036 404,280 737,001 5,607,070 Nonheating 21,722 23,736 20,118 16,359 9,942 6,830 6,741 4,305 5,351 6,812 10,506 16,374 148,796 EEPS Adjustment (39,812) (58,393) (51,549) (43,957) (22,810) (11,909) (6,414) (6,277) (4,573) (7,086) (12,017) (32,224) (297,020)
940,742 1,041,459 874,119 562,349 265,328 110,193 96,692 105,114 123,167 215,762 402,769 721,151 5,458,846
Service Classification Nos. 2, 6 & 13 Heat 1,070,767 1,016,310 857,340 527,162 314,520 148,547 152,780 143,574 189,546 260,127 518,661 788,534 5,987,868 Nonheating 119,661 94,297 102,445 78,099 65,376 48,683 54,529 42,836 54,677 56,570 78,765 87,138 883,076 EEPS Adjustment (14,777) (15,719) (13,691) (9,867) (6,042) (3,717) (2,887) (2,594) (2,895) (3,475) (6,772) (13,269) (95,705)
1,175,651 1,094,888 946,094 595,394 373,854 193,513 204,422 183,816 241,328 313,222 590,654 862,403 6,775,239
Service Classification No. 8 10,660 7,580 5,350 7,640 11,810 8,620 5,800 9,050 9,560 12,640 15,910 11,237 115,857 Service Classification No. 9 183,890 162,880 144,980 122,760 95,990 72,840 72,610 70,820 70,520 108,900 145,530 170,232 1,421,952 Service Classification No. 11 264,302 235,389 191,700 149,122 101,068 73,816 80,764 80,938 78,899 121,240 169,493 228,658 1,775,389 Service Classification No. 14 - - - - - - - - - - - - - Sales for Resale - - - - - - - - - - - - - Interdepartmental 4,010 5,380 4,800 2,780 1,380 470 240 160 150 380 1,350 2,900 24,000
Total Sales & Transport 2,579,255 2,547,576 2,167,043 1,440,045 849,430 459,452 460,528 449,898 523,624 772,144 1,325,706 1,996,580 15,571,283
Base Revenue ($)Service Classification Nos. 1 & 12 Heat 7,656,770$ 8,248,210$ 7,437,820$ 5,885,640$ 4,051,610$ 2,642,840$ 2,460,790$ 2,570,500$ 2,737,790$ 3,522,490$ 4,795,010$ 6,591,400$ 58,600,870$ Nonheating 341,340$ 351,690$ 325,310$ 302,080$ 262,180$ 236,050$ 234,580$ 212,520$ 221,490$ 234,390$ 263,750$ 301,660$ 3,287,040$ EEPS Adjustment (250,450)$ (359,310)$ (330,690)$ (317,060)$ (198,330)$ (104,180)$ (54,820)$ (54,610)$ (40,990)$ (61,660)$ (93,630)$ (216,190)$ (2,081,920)$
7,747,660$ 8,240,590$ 7,432,440$ 5,870,660$ 4,115,460$ 2,774,710$ 2,640,550$ 2,728,410$ 2,918,290$ 3,695,220$ 4,965,130$ 6,676,870$ 59,805,990$
Service Classification Nos. 2, 6 & 13 Heat 4,091,910$ 3,909,180$ 3,414,020$ 2,321,630$ 1,576,820$ 972,120$ 977,540$ 941,080$ 1,095,010$ 1,350,150$ 2,258,000$ 3,166,020$ 26,073,480$ Nonheating 437,710$ 361,520$ 381,310$ 304,580$ 261,820$ 202,690$ 221,130$ 182,480$ 220,070$ 226,620$ 303,930$ 331,480$ 3,435,340$ EEPS Adjustment (50,950)$ (54,260)$ (48,110)$ (35,920)$ (22,560)$ (14,230)$ (10,850)$ (9,700)$ (10,550)$ (12,620)$ (24,180)$ (46,430)$ (340,360)$
4,478,670$ 4,216,440$ 3,747,220$ 2,590,290$ 1,816,080$ 1,160,580$ 1,187,820$ 1,113,860$ 1,304,530$ 1,564,150$ 2,537,750$ 3,451,070$ 29,168,460$
Service Classification No. 8 30,380$ 21,610$ 15,260$ 21,770$ 33,670$ 24,570$ 15,020$ 23,440$ 24,760$ 32,740$ 41,200$ 29,100$ 313,520$ Service Classification No. 9 331,050$ 294,080$ 261,830$ 221,320$ 187,230$ 150,310$ 128,070$ 124,090$ 123,250$ 183,180$ 235,290$ 264,350$ 2,504,050$ Service Classification No. 11 257,700$ 243,320$ 221,320$ 197,930$ 173,180$ 165,030$ 164,210$ 164,160$ 164,980$ 185,150$ 210,190$ 239,490$ 2,386,660$ Service Classification No. 14 -$ -$ -$ -$ -$ -$ -$ -$ -$ -$ -$ -$ -$ Sales for Resale -$ -$ -$ -$ -$ -$ -$ -$ -$ -$ -$ -$ -$ Interdepartmental 11,320$ 15,188$ 13,550$ 7,848$ 3,896$ 1,327$ 678$ 452$ 423$ 1,073$ 3,811$ 8,187$ 67,753$
Total Own Territory 12,856,780$ 13,031,228$ 11,691,620$ 8,909,818$ 6,329,516$ 4,276,527$ 4,136,348$ 4,154,412$ 4,536,233$ 5,661,513$ 7,993,371$ 10,669,067$ 94,246,433$
CustomersService Classification Nos. 1 & 12 Heat 62,487 62,554 62,644 62,710 62,802 62,864 62,964 63,023 63,111 63,179 63,271 63,339 62,912 Nonheating 7,046 7,042 7,004 7,000 6,962 6,957 6,924 6,914 6,882 6,870 6,840 6,829 6,939
69,533 69,596 69,648 69,710 69,764 69,821 69,888 69,937 69,993 70,049 70,111 70,168 69,852
Service Classification Nos. 2, 6 & 13 Heat 10,254 10,290 10,283 10,312 10,307 10,344 10,336 10,369 10,367 10,398 10,389 10,423 10,339 Nonheating 1,166 1,141 1,162 1,144 1,164 1,140 1,152 1,144 1,154 1,138 1,156 1,136 1,150
11,420 11,431 11,445 11,456 11,471 11,484 11,488 11,513 11,521 11,536 11,545 11,559 11,489
Service Classification No. 8 13 13 13 13 13 13 13 13 13 13 13 13 13 Interdepartmental 1 1 1 1 1 1 1 1 1 1 1 1 1
Total Sales & Transport Customers 80,967 81,041 81,107 81,180 81,249 81,319 81,390 81,464 81,528 81,599 81,670 81,741 81,355
Exh
ibit_
_(F
RP
-3)
Central Hudson Gas & Electric CorporationSummary of Gas Sales, Base Revenues and Customers By Service Classification
For the Twelve Months Ending December 31, 2018
Sch
ed
ule
E

July August September October November December January February March April May JuneSales & Transport (Mcf) 2018 2018 2018 2018 2018 2018 2019 2019 2019 2019 2019 2019 TotalService Classification Nos. 1 & 12 Heat 96,365 107,086 122,389 216,036 404,280 737,001 945,323 1,066,833 898,157 584,791 276,002 114,441 5,568,704 Nonheating 6,741 4,305 5,351 6,812 10,506 16,374 20,533 22,211 18,919 15,238 9,448 6,451 142,889 EEPS Adjustment (6,414) (6,277) (4,573) (7,086) (12,017) (32,224) (44,760) (65,535) (57,795) (49,219) (25,524) (13,316) (324,739)
96,692 105,114 123,167 215,762 402,769 721,151 921,096 1,023,509 859,281 550,810 259,926 107,576 5,386,854
Service Classification Nos. 2, 6 & 13 Heat 152,780 143,574 189,546 260,127 518,661 788,534 1,081,315 1,028,926 868,737 536,432 320,753 151,461 6,040,846 Nonheating 54,529 42,836 54,677 56,570 78,765 87,138 118,884 93,922 102,175 78,290 65,599 48,772 882,157 EEPS Adjustment (2,887) (2,594) (2,895) (3,475) (6,772) (13,269) (16,827) (17,880) (15,549) (11,196) (6,851) (4,210) (104,405)
204,422 183,816 241,328 313,222 590,654 862,403 1,183,372 1,104,968 955,363 603,526 379,501 196,023 6,818,598
Service Classification No. 8 5,800 9,050 9,560 12,640 15,910 11,237 10,660 7,580 5,350 7,640 11,810 8,620 115,857 Service Classification No. 9 72,610 70,820 70,520 108,900 145,530 170,232 183,890 162,880 144,980 122,760 95,990 72,840 1,421,952 Service Classification No. 11 80,764 80,938 78,899 121,240 169,493 228,658 264,302 235,389 191,700 149,122 101,068 73,816 1,775,389 Service Classification No. 14 - - - - - - - - - - - - - Sales for Resale - - - - - - - - - - - - - Interdepartmental 240 160 150 380 1,350 2,900 4,010 5,380 4,800 2,780 1,380 470 24,000
Total Sales & Transport 460,528 449,898 523,624 772,144 1,325,706 1,996,580 2,567,330 2,539,706 2,161,474 1,436,638 849,675 459,345 15,542,650
Base Revenue ($)Service Classification Nos. 1 & 12 Heat 2,460,790$ 2,570,500$ 2,737,790$ 3,522,490$ 4,795,010$ 6,591,400$ 7,596,090$ 8,215,350$ 7,414,740$ 5,872,780$ 4,056,930$ 2,659,920$ 58,493,790$ Nonheating 234,580$ 212,520$ 221,490$ 234,390$ 263,750$ 301,660$ 326,070$ 334,280$ 310,180$ 287,240$ 251,520$ 226,400$ 3,204,080$ EEPS Adjustment (54,820)$ (54,610)$ (40,990)$ (61,660)$ (93,630)$ (216,190)$ (281,590)$ (403,270)$ (370,750)$ (355,020)$ (221,910)$ (116,490)$ (2,270,930)$
2,640,550$ 2,728,410$ 2,918,290$ 3,695,220$ 4,965,130$ 6,676,870$ 7,640,570$ 8,146,360$ 7,354,170$ 5,805,000$ 4,086,540$ 2,769,830$ 59,426,940$
Service Classification Nos. 2, 6 & 13 Heat 977,540$ 941,080$ 1,095,010$ 1,350,150$ 2,258,000$ 3,166,020$ 4,134,770$ 3,959,180$ 3,460,520$ 2,361,780$ 1,606,440$ 989,650$ 26,300,140$ Nonheating 221,130$ 182,480$ 220,070$ 226,620$ 303,930$ 331,480$ 434,900$ 360,040$ 380,210$ 304,980$ 262,320$ 202,730$ 3,430,890$ EEPS Adjustment (10,850)$ (9,700)$ (10,550)$ (12,620)$ (24,180)$ (46,430)$ (58,030)$ (61,720)$ (54,650)$ (40,770)$ (25,600)$ (16,130)$ (371,230)$
1,187,820$ 1,113,860$ 1,304,530$ 1,564,150$ 2,537,750$ 3,451,070$ 4,511,640$ 4,257,500$ 3,786,080$ 2,625,990$ 1,843,160$ 1,176,250$ 29,359,800$
Service Classification No. 8 15,020$ 23,440$ 24,760$ 32,740$ 41,200$ 29,100$ 27,610$ 19,610$ 13,870$ 19,790$ 30,600$ 22,320$ 300,060$ Service Classification No. 9 128,070$ 124,090$ 123,250$ 183,180$ 235,290$ 264,350$ 283,240$ 251,730$ 224,130$ 189,390$ 162,280$ 131,370$ 2,300,370$ Service Classification No. 11 164,210$ 164,160$ 164,980$ 185,150$ 210,190$ 239,490$ 257,700$ 243,320$ 221,320$ 197,930$ 173,180$ 165,030$ 2,386,660$ Service Classification No. 14 -$ -$ -$ -$ -$ -$ -$ -$ -$ -$ -$ -$ -$ Sales for Resale -$ -$ -$ -$ -$ -$ -$ -$ -$ -$ -$ -$ -$ Interdepartmental 678$ 452$ 423$ 1,073$ 3,811$ 8,187$ 11,320$ 15,188$ 13,550$ 7,848$ 3,896$ 1,327$ 67,753$
Total Own Territory 4,136,348$ 4,154,412$ 4,536,233$ 5,661,513$ 7,993,371$ 10,669,067$ 12,732,080$ 12,933,708$ 11,613,120$ 8,845,948$ 6,299,656$ 4,266,127$ 93,841,583$
CustomersService Classification Nos. 1 & 12 Heat 62,964 63,023 63,111 63,179 63,271 63,339 63,422 63,487 63,581 63,646 63,740 63,800 63,380 Nonheating 6,924 6,914 6,882 6,870 6,840 6,829 6,792 6,788 6,750 6,746 6,707 6,703 6,812
69,888 69,937 69,993 70,049 70,111 70,168 70,214 70,275 70,331 70,392 70,447 70,503 70,192
Service Classification Nos. 2, 6 & 13 Heat 10,336 10,369 10,367 10,398 10,389 10,423 10,420 10,456 10,448 10,476 10,470 10,507 10,422 Nonheating 1,152 1,144 1,154 1,138 1,156 1,136 1,160 1,135 1,156 1,138 1,158 1,134 1,147
11,488 11,513 11,521 11,536 11,545 11,559 11,580 11,591 11,604 11,614 11,628 11,641 11,568
Service Classification No. 8 13 13 13 13 13 13 13 13 13 13 13 13 13 Interdepartmental 1 1 1 1 1 1 1 1 1 1 1 1 1
Total Sales & Transport Customers 81,390 81,464 81,528 81,599 81,670 81,741 81,808 81,880 81,949 82,020 82,089 82,158 81,775
Exh
ibit_
_(F
RP
-3)
Central Hudson Gas & Electric CorporationSummary of Gas Sales, Base Revenues and Customers By Service Classification
For the Twelve Months Ending June 30, 2019
Sch
ed
ule
F

Exhibit ___(FRP-4)
Schedule A Customer ModelsSheet 1 Residential Non-HeatSheet 2 Residential HeatSheet 3 Commercial DemandSheet 4 Commercial Non-DemandSheet 5 OPA DemandSheet 6 OPA Non-Demand
Schedule B Sales ModelsSheet 1 Residential Heat Average UseSheet 2 Residential Non-Heat Average UseSheet 3 Commercial DemandSheet 4 Commercial Non-Demand Average UseSheet 5 OPA DemandSheet 6 OPA Non-DemandSheet 7 Industrial Demand Average UseSheet 8 Industrial Non-Demand Average Use
Central Hudson Gas & Electric Corporation
Electric Model Specifications and Statistics
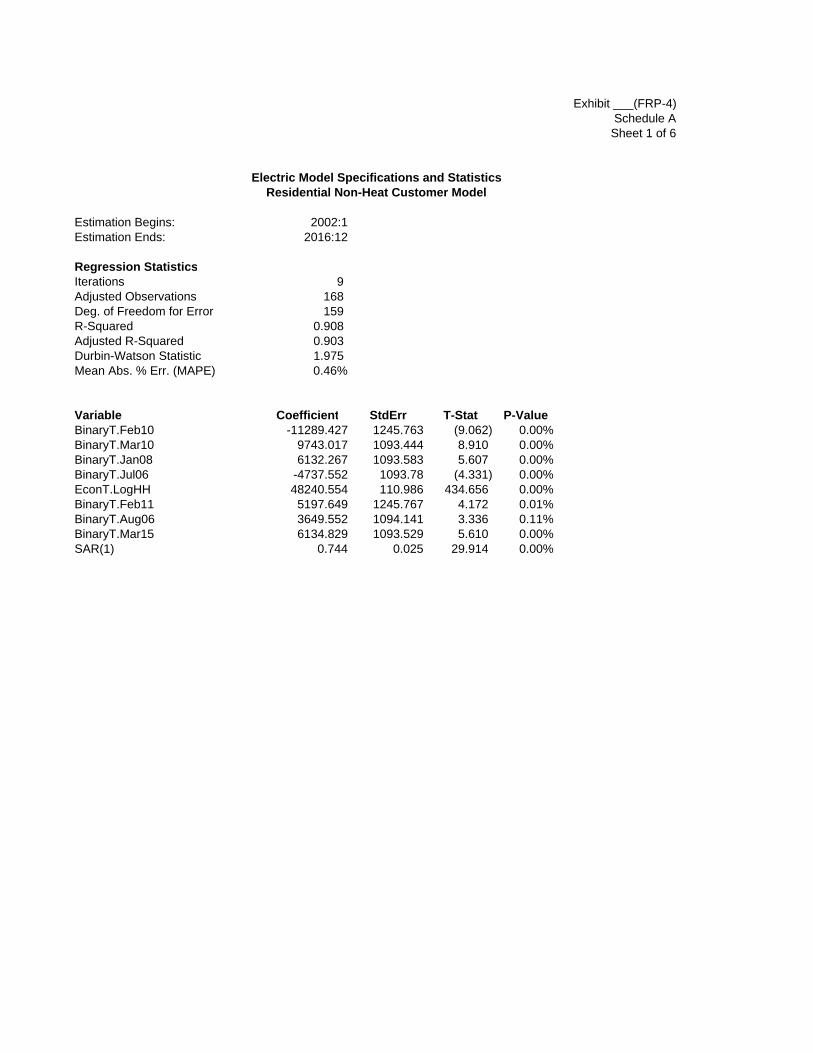
Exhibit ___(FRP-4)Schedule ASheet 1 of 6
Estimation Begins: 2002:1Estimation Ends: 2016:12
Regression StatisticsIterations 9 Adjusted Observations 168 Deg. of Freedom for Error 159 R-Squared 0.908 Adjusted R-Squared 0.903 Durbin-Watson Statistic 1.975 Mean Abs. % Err. (MAPE) 0.46%
Variable Coefficient StdErr T-Stat P-ValueBinaryT.Feb10 -11289.427 1245.763 (9.062) 0.00%BinaryT.Mar10 9743.017 1093.444 8.910 0.00%BinaryT.Jan08 6132.267 1093.583 5.607 0.00%BinaryT.Jul06 -4737.552 1093.78 (4.331) 0.00%EconT.LogHH 48240.554 110.986 434.656 0.00%BinaryT.Feb11 5197.649 1245.767 4.172 0.01%BinaryT.Aug06 3649.552 1094.141 3.336 0.11%BinaryT.Mar15 6134.829 1093.529 5.610 0.00%SAR(1) 0.744 0.025 29.914 0.00%
Electric Model Specifications and StatisticsResidential Non-Heat Customer Model

Exhibit ___(FRP-4)Schedule ASheet 2 of 6
Estimation Begins: 2010:1Estimation Ends: 2016:12
Regression StatisticsIterations 13 Adjusted Observations 83 Deg. of Freedom for Error 68 R-Squared 0.924 Adjusted R-Squared 0.908 Durbin-Watson Statistic 1.646 Mean Abs. % Err. (MAPE) 0.39%
Variable Coefficient StdErr T-Stat P-ValueCONST -33317.853 9040.863 (3.685) 0.05%BinaryT.Dec_Bef16 -565.838 117.476 (4.817) 0.00%BinaryT.Oct_Bef16 -690.013 117.974 (5.849) 0.00%BinaryT.Aug_Bef16 -626.050 118.447 (5.285) 0.00%BinaryT.Jul_Bef16 594.006 117.82 5.042 0.00%BinaryT.Jun_Bef17 -534.520 113.602 (4.705) 0.00%BinaryT.Apr_Bef17 -514.376 112.819 (4.559) 0.00%BinaryT.Feb_Bef17 -825.452 113.901 (7.247) 0.00%BinaryT.Jan_Bef17 636.016 117.207 5.426 0.00%BinaryT.Mar_Bef17 1127.652 112.502 10.023 0.00%BinaryT.May_Bef17 585.187 111.441 5.251 0.00%EconT.LogHH 12699.534 1904.512 6.668 0.00%BinaryT.Sep_Bef16 527.239 118.181 4.461 0.00%BinaryT.Nov_Bef16 499.010 117.704 4.240 0.01%AR(1) -0.370 0.112 (3.320) 0.15%
Electric Model Specifications and StatisticsResidential Heat Customer Model
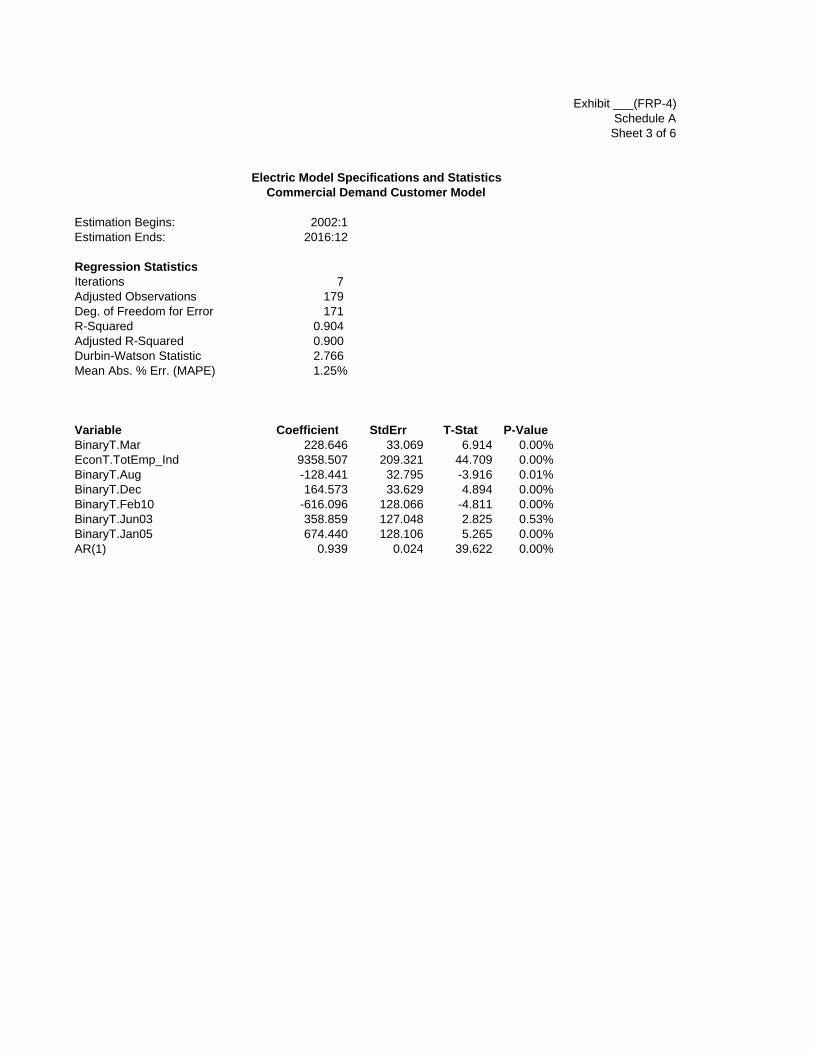
Exhibit ___(FRP-4)Schedule ASheet 3 of 6
Estimation Begins: 2002:1Estimation Ends: 2016:12
Regression StatisticsIterations 7 Adjusted Observations 179 Deg. of Freedom for Error 171 R-Squared 0.904 Adjusted R-Squared 0.900 Durbin-Watson Statistic 2.766 Mean Abs. % Err. (MAPE) 1.25%
Variable Coefficient StdErr T-Stat P-ValueBinaryT.Mar 228.646 33.069 6.914 0.00%EconT.TotEmp_Ind 9358.507 209.321 44.709 0.00%BinaryT.Aug -128.441 32.795 -3.916 0.01%BinaryT.Dec 164.573 33.629 4.894 0.00%BinaryT.Feb10 -616.096 128.066 -4.811 0.00%BinaryT.Jun03 358.859 127.048 2.825 0.53%BinaryT.Jan05 674.440 128.106 5.265 0.00%AR(1) 0.939 0.024 39.622 0.00%
Electric Model Specifications and StatisticsCommercial Demand Customer Model

Exhibit ___(FRP-4)Schedule ASheet 4 of 6
Estimation Begins: 2007:1Estimation Ends: 2016:12
Regression StatisticsIterations 13 Adjusted Observations 119 Deg. of Freedom for Error 110 R-Squared 0.909 Adjusted R-Squared 0.902 Durbin-Watson Statistic 1.984 Mean Abs. % Err. (MAPE) 0.86%
Variable Coefficient StdErr T-Stat P-ValueEconT.Pop_Ind 27065.415 48.012 563.718 0.00%BinaryT.Jan_Bef17 -1874.840 110.225 -17.009 0.00%BinaryT.Mar_Bef17 -1672.265 102.164 -16.368 0.00%BinaryT.May_Bef17 -2208.530 102.435 -21.56 0.00%BinaryT.Jul_Bef17 -1983.166 107.447 -18.457 0.00%BinaryT.Sep_Bef16 -2172.625 107.547 -20.202 0.00%BinaryT.Nov_Bef16 -2346.485 107.457 -21.837 0.00%BinaryT.Jul16 1436.547 335.544 4.281 0.00%AR(1) 0.321 0.095 3.396 0.001
Electric Model Specifications and StatisticsCommercial Non-Demand Customer Model

Exhibit ___(FRP-4)Schedule ASheet 5 of 6
Exponential Smoothing ModelEstimation Begins: 2000:6Estimation Ends: 2016:12
Regression StatisticsIterations 27Adjusted Observations 199Deg. of Freedom for Error 197R-Squared 0.833Adjusted R-Squared 0.833Durbin-Watson Statistic 2.214Mean Abs. % Err. (MAPE) 1.32%
Variable CoefficientSimple 0.224Trend 0.041
Electric Model Specifications and StatisticsOPA Demand Customer Model

Exhibit ___(FRP-4)Schedule ASheet 6 of 6
Exponential Smoothing ModelEstimation Begins: 2007:1Estimation Ends: 2016:12
Regression StatisticsIterations 21Adjusted Observations 120Deg. of Freedom for Error 119R-Squared -0.033Adjusted R-Squared -0.033Durbin-Watson Statistic 3.835Mean Abs. % Err. (MAPE) 9.43%
Variable CoefficientSimple 0.029
Electric Model Specifications and StatisticsOPA Non-Demand Customer Model

Exhibit ___(FRP-4)Schedule BSheet 1 of 8
Estimation Begins: 2009:1Estimation Ends: 2016:12
Regression StatisticsIterations 11 Adjusted Observations 95 Deg. of Freedom for Error 87 R-Squared 0.987 Adjusted R-Squared 0.986 Durbin-Watson Statistic 1.848 Mean Abs. % Err. (MAPE) 3.15%
Variable Coefficient StdErr T-Stat P-ValueCONST 340.480 24.663 13.805 0.00%ResHtVarsCR.XHeat 0.000 0.000 43.586 0.00%ResHtVarsCR.XCool 0.003 0.000 13.816 0.00%BinaryT.Dec_Bef16 -63.480 17.256 (3.679) 0.04%BinaryT.May_Bef17 -82.944 16.412 (5.054) 0.00%BinaryT.Apr_Bef17 -64.331 16.171 (3.978) 0.01%BinaryT.Nov -105.342 16.765 (6.283) 0.00%AR(1) 0.603 0.090 6.692 0.00%
Electric Model Specifications and StatisticsResidential Heat Average Use Model

Exhibit ___(FRP-4)Schedule BSheet 2 of 8
Estimation Begins: 2010:1Estimation Ends: 2016:12
Regression StatisticsIterations 20 Adjusted Observations 84 Deg. of Freedom for Error 77 R-Squared 0.963 Adjusted R-Squared 0.960 Durbin-Watson Statistic 1.622 Mean Abs. % Err. (MAPE) 2.14%
Variable Coefficient StdErr T-Stat P-ValueCONST 430.376 11.695 36.801 0.00%ResNHVarsCR.XHeat 1.068 0.055 19.406 0.00%ResNHVarsCR.XCool 2.246 0.087 25.747 0.00%BinaryT.Apr -26.268 7.657 (3.431) 0.10%BinaryT.May -28.921 8.577 (3.372) 0.12%BinaryT.Jul 25.619 5.706 4.490 0.00%MA(1) 0.807 0.073 11.087 0.00%
Electric Model Specifications and StatisticsResidential Non-Heat Average Use Model

Exhibit ___(FRP-4)Schedule BSheet 3 of 8
Estimation Begins: 2009:1Estimation Ends: 2016:12
Regression StatisticsIterations 8 Adjusted Observations 83 Deg. of Freedom for Error 79 R-Squared 0.932 Adjusted R-Squared 0.930 Durbin-Watson Statistic 2.335 Mean Abs. % Err. (MAPE) 2.19%
Variable Coefficient StdErr T-Stat P-ValueCONST 11515.503 447.662 25.724 0.00%DMD_Vars_CR.XCool_DMD 0.944 0.109 8.649 0.00%AR(1) 0.652 0.079 8.233 0.00%SAR(1) 0.776 0.064 12.220 0.00%
Electric Model Specifications and StatisticsCommercial Demand Average Use Model

Exhibit ___(FRP-4)Schedule BSheet 4 of 8
Estimation Begins: 2010:1Estimation Ends: 2016:12
Regression StatisticsIterations 11 Adjusted Observations 83 Deg. of Freedom for Error 74 R-Squared 0.917 Adjusted R-Squared 0.908 Durbin-Watson Statistic 2.263 Mean Abs. % Err. (MAPE) 2.80%
Variable Coefficient StdErr T-Stat P-ValueCONST 417.647 10.130 41.230 0.00%BinaryT.Jan -38.784 7.674 (5.054) 0.00%BinaryT.Nov -67.150 7.436 (9.030) 0.00%BinaryT.Dec -53.043 8.552 (6.203) 0.00%ND_Vars_CR.XHeat_ND 0.005 0.000 17.386 0.00%ND_Vars_CR.XCool_ND 0.843 0.063 13.403 0.00%BinaryT.Jul -28.729 6.434 (4.465) 0.00%BinaryT.May -29.921 6.250 (4.787) 0.00%AR(1) 0.666 0.087 7.624 0.00%
Electric Model Specifications and StatisticsCommercial Non-Demand Average Use Model

Exhibit ___(FRP-4)Schedule BSheet 5 of 8
Estimation Begins: 2009:1Estimation Ends: 2016:12
Regression StatisticsIterations 9 Adjusted Observations 95 Deg. of Freedom for Error 88 R-Squared 0.836 Adjusted R-Squared 0.825 Durbin-Watson Statistic 2.078 Mean Abs. % Err. (MAPE) 2.18%
Variable Coefficient StdErr T-Stat P-ValueCONST 19.713 0.249 79.212 0.00%BinaryT.Oct11 -3.361 0.594 (5.659) 0.00%BinaryT.Feb15 -3.360 0.644 (5.220) 0.00%CRWthrT.HDD 0.004 0.000 12.931 0.00%CRWthrT.CDD 0.013 0.001 10.151 0.00%BinaryT.Jan_15 4.589 0.642 7.153 0.00%AR(1) 0.371 0.104 3.557 0.06%
Electric Model Specifications and StatisticsOPA Demand Average Use Model

Exhibit ___(FRP-4)Schedule BSheet 6 of 8
Estimation Begins: 2009:1Estimation Ends: 2016:12
Regression StatisticsIterations 9 Adjusted Observations 84 Deg. of Freedom for Error 76 R-Squared 0.924 Adjusted R-Squared 0.917 Durbin-Watson Statistic 2.191 Mean Abs. % Err. (MAPE) 4.11%
Variable Coefficient StdErr T-Stat P-ValueCONST 0.462 0.026 17.744 0.00%CRWthrT.HDD 0.000 0.000 10.584 0.00%CRWthrT.CDD 0.000 0.000 4.893 0.00%BinaryT.Sep10 -0.235 0.023 (10.402) 0.00%BinaryT.Jul16 0.207 0.031 6.625 0.00%BinaryT.May14 0.064 0.023 2.824 0.60%BinaryT.Trend_Aft15 -0.003 0.000 (5.826) 0.00%SAR(1) 0.808 0.052 15.554 0.00%
Electric Model Specifications and StatisticsOPA Non-Demand Average Use Model

Exhibit ___(FRP-4)Schedule BSheet 7 of 8
Estimation Begins: 2005:1Estimation Ends: 2016:12
Regression StatisticsIterations 15 Adjusted Observations 143 Deg. of Freedom for Error 137 R-Squared 0.854 Adjusted R-Squared 0.849 Durbin-Watson Statistic 2.022 Mean Abs. % Err. (MAPE) 3.36%
Variable Coefficient StdErr T-Stat P-ValueCONST 12.033 2.190 5.493 0.00%WthrT.CDD 0.018 0.002 9.945 0.00%BinaryT.Sep11 5.384 1.204 4.473 0.00%BinaryT.Oct14 4.249 1.207 3.521 0.06%EconT.ManEmp_Ind 28.696 3.131 9.166 0.00%AR(1) 0.556 0.071 7.821 0.00%
Electric Model Specifications and StatisticsIndustrial Demand Average Use Model

Exhibit ___(FRP-4)Schedule BSheet 8 of 8
Estimation Begins: 2008:1Estimation Ends: 2016:12
Regression StatisticsIterations 10 Adjusted Observations 107 Deg. of Freedom for Error 96 R-Squared 0.836 Adjusted R-Squared 0.819 Durbin-Watson Statistic 2.221 Mean Abs. % Err. (MAPE) 6.83%
Variable Coefficient StdErr T-Stat P-ValueCONST 0.836 0.114 7.332 0.00%CRWthrT.CDD 0.000 0.000 5.360 0.00%CRWthrT.HDD 0.000 0.000 12.430 0.00%BinaryT.Jul 0.059 0.014 4.294 0.00%BinaryT.Sep 0.098 0.013 7.517 0.00%EconT.ManEmp_Ind -0.796 0.172 (4.614) 0.00%BinaryT.Mar16 0.160 0.038 4.214 0.01%BinaryT.Dec13 0.163 0.038 4.281 0.00%BinaryT.Feb14 0.120 0.038 3.139 0.23%BinaryT.Nov15 0.115 0.038 3.011 0.33%AR(1) 0.435 0.060 7.238 0.00%
Electric Model Specifications and StatisticsIndustrial Non-Demand Average Use Model

Exhibit ___(FRP-5)
Schedule A Customer ModelsSheet 1 Residential HeatSheet 2 Residential Non-HeatSheet 3 Commercial HeatSheet 4 Commercial Non-Heat
Schedule B Sales ModelsSheet 1 Residential Heat Average UseSheet 2 Residential Non-Heat Average UseSheet 3 Commercial Heat Average UseSheet 4 Commercial Non-Heat Average UseSheet 5 OPA Average UseSheet 6 Industrial Average Use
Central Hudson Gas & Electric Corporation
Gas Model Specifications and Statistics

Exhibit ___(FRP-5)Schedule A
Sheet 1 of 4
Estimation Begins: 2007:1Estimation Ends: 2016:12
Regression StatisticsIterations 14Adjusted Observations 119Deg. of Freedom for Error 103R-Squared 0.977Adjusted R-Squared 0.973Durbin-Watson Statistic 1.853Mean Abs. % Err. (MAPE) 0.78%
Variable Coefficient StdErr T-Stat P-ValueCONST 136,138.851 23,168.067 5.876 0.00%EconVars.Pop_Ind (71,819.273) 21,978.859 (3.268) 0.15%BinaryVars.Feb_Bf17 3,302.095 327.734 10.076 0.00%BinaryVars.Apr_Bf17 3,159.977 326.193 9.687 0.00%BinaryVars.Jun_Bf17 3,016.586 328.920 9.171 0.00%BinaryVars.Aug_Bf16 2,670.805 335.444 7.962 0.00%BinaryVars.Oct_Bf16 2,594.632 334.708 7.752 0.00%BinaryVars.Dec_Bf16 3,300.095 334.027 9.880 0.00%BinaryVars.Trend_Aft16 941.965 24.676 38.173 0.00%BinaryVars.Jan_Bf17 (2,910.026) 333.694 (8.721) 0.00%BinaryVars.Mar_Bf17 (2,402.317) 326.110 (7.367) 0.00%BinaryVars.May_Bf17 (3,589.144) 324.141 (11.073) 0.00%BinaryVars.Jul_Bf16 (3,533.173) 335.212 (10.540) 0.00%BinaryVars.Sep_Bf16 (4,018.293) 335.118 (11.991) 0.00%BinaryVars.Nov_Bf16 (3,914.579) 334.380 (11.707) 0.00%AR(1) (0.292) 0.094 (3.115) 0.24%
Gas Model Specifications and StatisticsResidential Heat Customer Model

Exhibit ___(FRP-5)Schedule A
Sheet 2 of 4
Estimation Begins: 2001:1Estimation Ends: 2016:12
Regression StatisticsIterations 12Adjusted Observations 191Deg. of Freedom for Error 175R-Squared 0.987Adjusted R-Squared 0.986Durbin-Watson Statistic 1.725Mean Abs. % Err. (MAPE) 1.44%
Variable Coefficient StdErr T-Stat P-ValueCONST (7,242.984) 1,678.210 (4.316) 0.00%EconVars.Households_Ind 13,683.502 1,550.956 8.823 0.00%BinaryVars.Jan_Bf17 (913.128) 76.578 (11.924) 0.00%BinaryVars.Feb_Bf17 696.153 75.659 9.201 0.00%BinaryVars.Mar_Bf17 (1,026.372) 75.541 (13.587) 0.00%BinaryVars.Apr_Bf17 601.008 75.563 7.954 0.00%BinaryVars.May_Bf17 (1,091.138) 75.259 (14.499) 0.00%BinaryVars.Jun_Bf17 619.000 76.172 8.126 0.00%BinaryVars.Jul_Bf16 (1,094.792) 76.579 (14.296) 0.00%BinaryVars.Aug_Bf16 510.808 76.739 6.656 0.00%BinaryVars.Sep_Bf16 (1,174.234) 76.683 (15.313) 0.00%BinaryVars.Oct_Bf16 541.481 76.666 7.063 0.00%BinaryVars.Nov_Bf16 (1,185.635) 76.633 (15.472) 0.00%BinaryVars.Dec_Bf16 610.401 76.606 7.968 0.00%BinaryVars.Trend_Aft16 (323.699) 8.221 (39.373) 0.00%AR(1) (0.283) 0.069 (4.104) 0.01%
Gas Model Specifications and StatisticsResidential Non-Heat Customer Model

Exhibit ___(FRP-5)Schedule A
Sheet 3 of 4
Estimation Begins: 1999:1Estimation Ends: 2016:12
Regression StatisticsIterations 19Adjusted Observations 215Deg. of Freedom for Error 205R-Squared 0.933Adjusted R-Squared 0.931Durbin-Watson Statistic 1.637Mean Abs. % Err. (MAPE) 2.22%
Variable Coefficient StdErr T-Stat P-ValueCONST 5,647.088 624.961 9.036 0.00%EconTrans.NonManEmp_Ind 3,104.656 558.768 5.556 0.00%BinaryVars.Trend_Aft16 128.891 5.072 25.413 0.00%BinaryVars.Feb_Bf17 872.852 65.765 13.272 0.00%BinaryVars.Apr_Bf17 812.178 65.534 12.393 0.00%BinaryVars.Jun_Bf17 665.690 64.196 10.370 0.00%BinaryVars.Aug_Bf16 516.755 65.597 7.878 0.00%BinaryVars.Oct_Bf16 526.504 66.309 7.940 0.00%BinaryVars.Dec_Bf16 872.901 66.527 13.121 0.00%AR(1) (0.237) 0.072 (3.272) 0.13%
Gas Model Specifications and StatisticsCommercial Heat Customer Model

Exhibit ___(FRP-5)Schedule A
Sheet 4 of 4
Estimation Begins: 2009:1Estimation Ends: 2016:12
Regression StatisticsIterations 1Adjusted Observations 96Deg. of Freedom for Error 82R-Squared 0.963Adjusted R-Squared 0.957Durbin-Watson Statistic 2.155Mean Abs. % Err. (MAPE) 1.37%
Variable Coefficient StdErr T-Stat P-ValueCONST 1,168.161 14.243 82.016 0.00%EconTrans.logNonManEmp (581.470) 74.078 (7.849) 0.00%BinaryVars.Jan_Bf17 (98.931) 13.700 (7.221) 0.00%BinaryVars.Feb_Bf17 120.087 13.681 8.778 0.00%BinaryVars.Mar_Bf17 (94.550) 13.664 (6.920) 0.00%BinaryVars.Apr_Bf17 108.578 13.646 7.957 0.00%BinaryVars.May_Bf17 (113.785) 13.627 (8.350) 0.00%BinaryVars.Jun_Bf17 100.140 13.602 7.362 0.00%BinaryVars.Jul_Bf16 (123.453) 14.179 (8.707) 0.00%BinaryVars.Aug_Bf16 98.124 14.150 6.934 0.00%BinaryVars.Sep_Bf16 (127.956) 14.113 (9.067) 0.00%BinaryVars.Oct_Bf16 91.709 14.074 6.516 0.00%BinaryVars.Nov_Bf16 (130.741) 14.034 (9.316) 0.00%BinaryVars.Dec_Bf16 130.594 13.999 9.329 0.00%
Gas Model Specifications and StatisticsCommercial Non-Heat Customer Model

Exhibit ___(FRP-5)Schedule B
Sheet 1 of 6
Estimation Begins: 2005:1Estimation Ends: 2016:12
Regression StatisticsIterations 15Adjusted Observations 144Deg. of Freedom for Error 134R-Squared 0.995Adjusted R-Squared 0.995Durbin-Watson Statistic 1.778Mean Abs. % Err. (MAPE) 6.44%
Variable Coefficient StdErr T-Stat P-ValueResSpHtVars.XHeat - - 74.502 0.00%ResSpHtVars.XOther 0.021 0.006 3.536 0.06%BinaryVars.Aug 1.300 0.150 8.649 0.00%BinaryVars.Sep 0.920 0.137 6.738 0.00%BinaryVars.Nov (1.098) 0.115 (9.519) 0.00%BinaryVars.May (0.426) 0.115 (3.718) 0.03%BinaryVars.Jul 0.977 0.134 7.279 0.00%BinaryVars.Feb 1.271 0.145 8.755 0.00%BinaryVars.Mar 0.993 0.142 6.986 0.00%MA(1) 0.301 0.087 3.450 0.08%
Gas Model Specifications and StatisticsResidential Heat Average Use Model

Exhibit ___(FRP-5)Schedule B
Sheet 2 of 6
Estimation Begins: 2001:1Estimation Ends: 2016:12
Regression StatisticsIterations 9 Adjusted Observations 180 Deg. of Freedom for Error 172 R-Squared 0.976 Adjusted R-Squared 0.975 Durbin-Watson Statistic 1.754 Mean Abs. % Err. (MAPE) 6.48%
Variable Coefficient StdErr T-Stat P-ValueResNHtVars.XOther 0.045 0.003 13.632 0.00%BinaryVars.Nov_06 (0.316) 0.096 (3.301) 0.12%ResNHtVars.HUseMul 0.002 - 22.264 0.00%BinaryVars.Winter2013 (0.206) 0.050 (4.142) 0.01%BinaryVars.Winter2012 (0.397) 0.052 (7.647) 0.00%BinaryVars.Winter2015 0.119 0.044 2.719 0.72%BinaryVars.Feb11 0.422 0.099 4.248 0.00%SAR(1) 0.784 0.039 19.978 0.00%
Residential Non-Heat Average Use ModelGas Model Specifications and Statistics

Exhibit ___(FRP-5)Schedule B
Sheet 3 of 6
Estimation Begins: 2004:1Estimation Ends: 2016:12
Regression StatisticsIterations 9Adjusted Observations 155Deg. of Freedom for Error 146R-Squared 0.988Adjusted R-Squared 0.988Durbin-Watson Statistic 1.968Mean Abs. % Err. (MAPE) 6.56%
Variable Coefficient StdErr T-Stat P-ValueStructureVars.Heat_SpHt 0.051 0.001 71.531 0.00%BinaryVars.Aug 6.405 1.005 6.375 0.00%BinaryVars.Sep 7.481 0.910 8.217 0.00%BinaryVars.Apr (5.998) 0.820 (7.315) 0.00%StructureVars.Other_SpHt 63.320 7.703 8.220 0.00%BinaryVars.Jul 7.078 0.941 7.521 0.00%BinaryVars.Jan 7.365 0.848 8.688 0.00%BinaryVars.Mar_05 10.096 2.780 3.631 0.04%AR(1) 0.301 0.088 3.433 0.08%
Commercial Heat Average Use ModelGas Model Specifications and Statistics

Exhibit ___(FRP-5)Schedule B
Sheet 4 of 6
Estimation Begins: 2005:1Estimation Ends: 2016:12
Regression StatisticsIterations 1Adjusted Observations 144Deg. of Freedom for Error 134R-Squared 0.819Adjusted R-Squared 0.807Durbin-Watson Statistic 2.043Mean Abs. % Err. (MAPE) 10.69%
Variable Coefficient StdErr T-Stat P-ValueStructureVars.Heat_GS 0.017 0.001 13.246 0.00%StructureVars.Other_GS 250.334 53.722 4.660 0.00%BinaryVars.EvenMonths_Aft05 (5.830) 1.226 (4.756) 0.00%BinaryVars.Nov11 25.503 6.819 3.740 0.03%BinaryVars.Jan 10.855 2.473 4.389 0.00%BinaryVars.Mar13 20.588 6.917 2.976 0.35%BinaryVars.Mar14 38.221 6.960 5.491 0.00%BinaryVars.Mar15 58.516 6.976 8.388 0.00%BinaryVars.Feb_Mar05 26.390 6.586 4.007 0.01%BinaryVars.ShiftMay05 17.677 4.459 3.965 0.01%
Gas Model Specifications and StatisticsCommercial Non-Heat Average Use Model

Exhibit ___(FRP-5)Schedule B
Sheet 5 of 6
Estimation Begins: 2001:1Estimation Ends: 2016:12
Regression StatisticsIterations 7Adjusted Observations 191Deg. of Freedom for Error 184R-Squared 0.961Adjusted R-Squared 0.960Durbin-Watson Statistic 2.060Mean Abs. % Err. (MAPE) 13.51%
Variable Coefficient StdErr T-Stat P-ValueStructureVars.Heat_SpHt 0.147 0.002 69.058 0.00%BinaryVars.Jan 14.576 4.210 3.462 0.07%BinaryVars.Apr (15.443) 4.144 (3.727) 0.03%BinaryVars.May (15.826) 4.045 (3.913) 0.01%BinaryVars.Summer_2 12.526 2.788 4.493 0.00%BinaryVars.Feb11 60.943 15.459 3.942 0.01%AR(1) 0.304 0.071 4.270 0.00%
Gas Model Specifications and StatisticsOPA Average Use Model

Exhibit ___(FRP-5)Schedule B
Sheet 6 of 6
Estimation Begins: 2005:1Estimation Ends: 2016:12
Regression StatisticsIterations 11Adjusted Observations 142Deg. of Freedom for Error 133R-Squared 0.947Adjusted R-Squared 0.944Durbin-Watson Statistic 1.945Mean Abs. % Err. (MAPE) 13.48%
Variable Coefficient StdErr T-Stat P-ValueStructureVars.Heat_Ind 0.166 0.006 30.200 0.00%StructureVars.Other_Ind 592.168 96.624 6.129 0.00%BinaryVars.Apr (59.655) 6.226 (9.581) 0.00%BinaryVars.May (39.534) 5.304 (7.453) 0.00%BinaryVars.Dec10 (64.659) 16.472 (3.925) 0.01%BinaryVars.Apr10 58.261 17.405 3.347 0.11%BinaryVars.TrendAft04 (2.491) 0.389 (6.410) 0.00%AR(1) 0.488 0.085 5.713 0.00%AR(2) 0.314 0.085 3.713 0.03%
Gas Model Specifications and StatisticsIndustrial Average Use Model

Exhibit ___(FRP-6)
Sheet 1 Residential HeatSheet 2 Residential Non-HeatSheet 3 Commercial DemandSheet 4 Commercial Non-DemandSheet 5 OPA DemandSheet 6 OPA Non-DemandSheet 7 Industrial DemandSheet 8 Industrial Non-DemandSheet 9 Service Class 13Sheet 10 Area LightingSheet 11 Street LightingSheet 12 Traffic SignalsSheet 13 InterdepartmentalSheet 14 Total Own Territory
*Results do not include post-forecast adjustments for EEPS in Case 07-M-0548 and PV Net Metering
Central Hudson Gas & Electric Corporation
Electric Forecast Results

Exhibit ___(FRP-6)Sheet 1 of 14
Actual Norm Actual NormCusts Change MWh Change MWh Change MWh/Cust MWh/Cust
2012 26,599 294,856 327,745 11.09 12.32
2013 26,612 13 319,392 24,536 332,729 4,984 12.00 12.50
2014 26,827 215 331,706 12,314 324,803 (7,926) 12.36 12.11
2015 26,945 118 329,493 (2,213) 317,683 (7,120) 12.23 11.79
*2016 26,974 29 303,996 (25,497) 334,269 16,586 11.27 12.39
**2017 27,018 44 326,196 22,200 330,997 (3,272) 12.07 12.25
2018 27,076 58 294,816 (36,181) - 10.89
Rate Year 27,108 289,719 10.69
*2016 data reflects adjustment for July transition to monthly billing**2017 data represents 3 months actual/normal and 9 months forecast
Electric Forecast ResultsResidential Heat

Exhibit ___(FRP-6)Sheet 2 of 14
Actual Norm Actual NormCusts Change MWh Change MWh Change MWh/Cust MWh/Cust
2012 226,754 1,749,641 1,822,302 7.72 8.04
2013 227,204 450 1,769,988 20,347 1,830,523 8,221 7.79 8.06
2014 227,522 318 1,721,316 (48,672) 1,733,436 (97,087) 7.57 7.62
2015 228,832 1,310 1,750,480 29,164 1,697,222 (36,214) 7.65 7.42
*2016 228,736 (96) 1,701,513 (48,967) 1,745,463 48,241 7.44 7.63
**2017 229,349 613 1,785,774 84,261 1,792,014 46,551 7.79 7.81
2018 229,365 16 1,522,262 (269,752) - 6.64
Rate Year 229,446 1,495,474 6.52
*2016 data reflects adjustment for July transition to monthly billing**2017 data represents 3 months actual/normal and 9 months forecast
Electric Forecast ResultsResidential Non-Heat

Exhibit ___(FRP-6)Sheet 3 of 14
Actual Norm Actual NormCusts Change MWh Change MWh Change MWh/Cust MWh/Cust
2012 9,755 1,389,715 1,405,282 142.46 144.06
2013 9,824 69 1,381,716 (7,999) 1,419,844 14,562 140.65 144.53
2014 10,035 211 1,378,035 (3,681) 1,386,805 (33,039) 137.32 138.20
2015 10,107 72 1,403,682 25,647 1,382,149 (4,656) 138.88 136.75
2016 9,979 (128) 1,375,644 (28,038) 1,339,495 (42,654) 137.85 134.23
*2017 9,868 (111) 1,414,606 38,962 1,414,606 75,111 143.35 143.35
2018 9,732 (136) 1,445,834 31,228 - 148.56
Rate Year 9,694 1,432,373 147.76
*2017 data represents 3 months actual/normal and 9 months forecast
Electric Forecast ResultsCommercial Demand

Exhibit ___(FRP-6)Sheet 4 of 14
Actual Norm Actual NormCusts Change MWh Change MWh Change MWh/Cust MWh/Cust
2012 27,197 166,904 173,430 6.14 6.38
2013 27,319 122 170,980 4,076 179,602 6,172 6.26 6.57
2014 27,168 (151) 168,326 (2,654) 167,741 (11,861) 6.20 6.17
2015 27,452 284 169,519 1,193 167,114 (627) 6.18 6.09
*2016 27,543 91 164,413 (5,106) 171,803 4,689 5.97 6.24
**2017 27,687 144 178,499 14,086 178,502 6,699 6.45 6.45
2018 27,704 17 153,652 (24,850) - 5.55
Rate Year 27,740 152,076 5.48
*2016 data reflects adjustment for July transition to monthly billing**2017 data represents 3 months actual/normal and 9 months forecast
Electric Forecast ResultsCommercial Non-Demand

Exhibit ___(FRP-6)Sheet 5 of 14
Actual Norm Actual NormCusts Change MWh Change MWh Change MWh/Cust MWh/Cust
2012 1,371 366,498 371,410 267.32 270.90
2013 1,368 (3) 361,887 (4,611) 380,205 8,795 264.54 277.93
2014 1,384 16 354,392 (7,495) 352,557 (27,648) 256.06 254.74
2015 1,384 - 357,581 3,189 353,817 1,260 258.37 255.65
2016 1,355 (29) 355,146 (2,435) 354,926 1,109 262.10 261.94
*2017 1,341 (14) 361,451 6,305 359,927 5,001 269.54 268.40
2018 1,327 (14) 360,750 823 - 271.85
Rate Year 1,321 359,000 271.76
*2017 data represents 3 months actual/normal and 9 months forecast
OPA DemandElectric Forecast Results

Exhibit ___(FRP-6)Sheet 6 of 14
Actual Norm Actual NormCusts Change MWh Change MWh Change MWh/Cust MWh/Cust
2012 2,018 13,946 14,854 6.91 7.36
2013 2,030 12 14,223 277 14,857 3 7.01 7.32
2014 2,004 (26) 13,799 (424) 13,751 (1,106) 6.89 6.86
2015 2,037 33 14,342 543 14,130 379 7.04 6.94
2016 2,017 (20) 13,734 (608) 13,943 (187) 6.81 6.91
*2017 2,052 35 13,673 (61) 13,674 (269) 6.66 6.66
2018 2,031 (21) 13,940 266 - 6.86
Rate Year 2,026 13,850 6.84
*2017 data represents 3 months actual/normal and 9 months forecast
Electric Forecast ResultsOPA Non-Demand

Exhibit ___(FRP-6)Sheet 7 of 14
Actual Norm Actual NormCusts Change MWh Change MWh Change MWh/Cust MWh/Cust
2012 495 176,816 184,784 357.20 373.30
2013 499 4 179,790 2,974 179,790 (4,994) 360.30 360.30
2014 503 4 176,624 (3,166) 175,829 (3,961) 351.14 349.56
2015 525 22 177,301 677 164,376 (11,453) 337.72 313.10
2016 554 29 193,377 16,076 209,560 45,184 349.06 378.27
*2017 535 (19) 191,914 (1,463) 191,915 (17,645) 358.72 358.72
2018 534 (1) 194,130 2,215 - 363.54
Rate Year 534 194,050 363.39
*2017 data represents 3 months actual/normal and 9 months forecast
Industrial DemandElectric Forecast Results

Exhibit ___(FRP-6)Sheet 8 of 14
Actual Norm Actual NormCusts Change MWh Change MWh Change MWh/Cust MWh/Cust
2012 557 3,212 2,347 5.77 4.21
2013 563 6 3,464 252 3,368 1,021 6.15 5.98
2014 545 (18) 3,214 (250) 3,303 (65) 5.90 6.06
2015 511 (34) 3,023 (191) 2,969 (334) 5.92 5.81
2016 487 (24) 2,921 (102) 3,042 73 6.00 6.25
*2017 492 5 3,081 160 3,107 65 6.26 6.32
2018 487 (5) 3,050 (57) - 6.26
Rate Year 487 3,050 6.26
*2017 data represents 3 months actual/normal and 9 months forecast
Industrial Non-DemandElectric Forecast Results
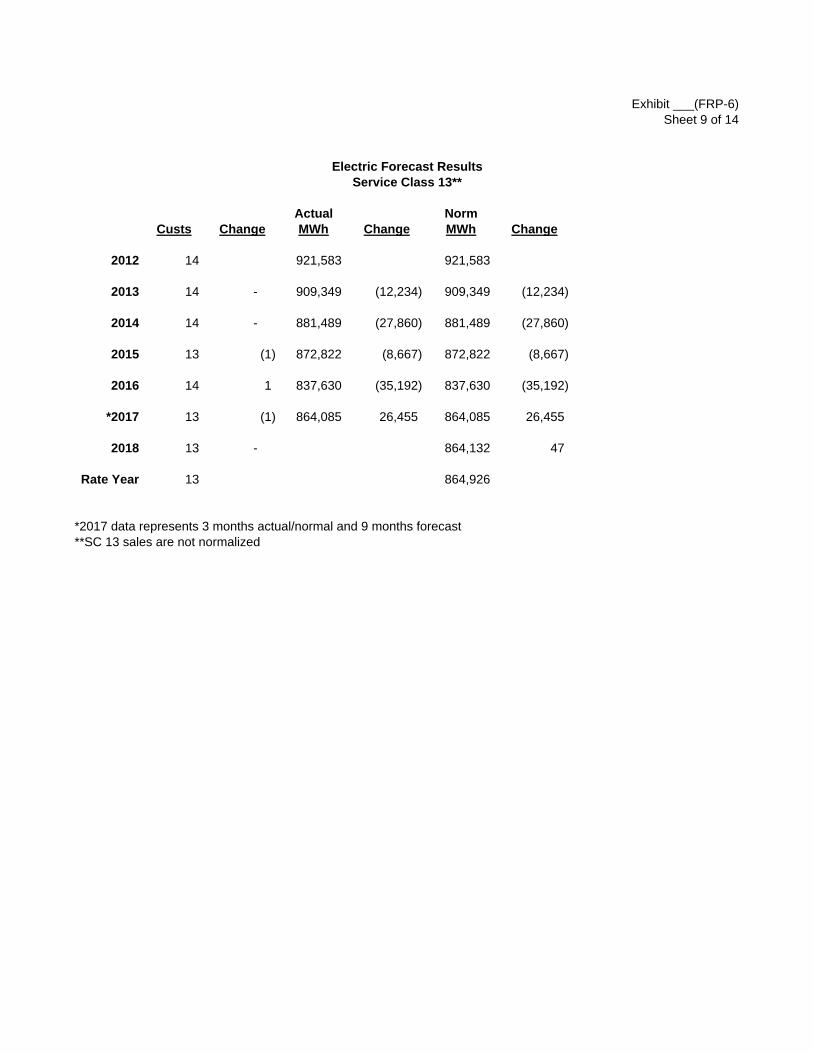
Exhibit ___(FRP-6)Sheet 9 of 14
Actual NormCusts Change MWh Change MWh Change
2012 14 921,583 921,583
2013 14 - 909,349 (12,234) 909,349 (12,234)
2014 14 - 881,489 (27,860) 881,489 (27,860)
2015 13 (1) 872,822 (8,667) 872,822 (8,667)
2016 14 1 837,630 (35,192) 837,630 (35,192)
*2017 13 (1) 864,085 26,455 864,085 26,455
2018 13 - 864,132 47
Rate Year 13 864,926
*2017 data represents 3 months actual/normal and 9 months forecast**SC 13 sales are not normalized
Service Class 13**Electric Forecast Results

Exhibit ___(FRP-6)Sheet 10 of 14
Actual Norm Actual NormCusts Change MWh Change MWh Change MWh/Cust MWh/Cust
2012 4,328 12,703 12,703 2.94 2.94
2013 4,268 (60) 12,612 (91) 12,612 (91) 2.96 2.96
2014 4,207 (61) 12,556 (56) 12,556 (56) 2.98 2.98
2015 4,197 (10) 12,449 (107) 12,449 (107) 2.97 2.97
2016 4,219 22 12,511 62 12,511 62 2.97 2.97
*2017 4,089 (130) 12,336 (175) 12,336 (175) 3.02 3.02
2018 4,031 (58) 12,350 14 3.06
Rate Year 4,008 12,330 3.08
*2017 data represents 3 months actual/normal and 9 months forecast**Lighting sales are not normalized
Electric Forecast ResultsArea Lighting**

Exhibit ___(FRP-6)Sheet 11 of 14
Actual Norm Actual NormCusts Change MWh Change MWh Change MWh/Cust MWh/Cust
2012 207 22,846 22,846 110.37 110.37
2013 208 1 22,622 (224) 22,622 (224) 108.76 108.76
2014 209 1 21,649 (973) 21,649 (973) 103.58 103.58
2015 210 1 22,050 401 22,050 401 105.00 105.00
2016 210 - 19,770 (2,280) 19,770 (2,280) 94.14 94.14
*2017 210 - 19,002 (768) 19,002 (768) 90.49 90.49
2018 210 - 17,900 (1,102) 85.24
Rate Year 210 17,260 82.19
*2017 data represents 3 months actual/normal and 9 months forecast**Lighting sales are not normalized
Street Lighting**Electric Forecast Results

Exhibit ___(FRP-6)Sheet 12 of 14
Actual Norm Actual NormCusts Change MWh Change MWh Change MWh/Cust MWh/Cust
2012 241 2,909 2,909 12.07 12.07
2013 238 (3) 2,891 (18) 2,891 (18) 12.15 12.15
2014 234 (4) 2,865 (26) 2,865 (26) 12.24 12.24
2015 226 (8) 2,801 (64) 2,801 (64) 12.39 12.39
2016 216 (10) 2,742 (59) 2,742 (59) 12.69 12.69
*2017 217 1 764 (1,978) 764 (1,978) 3.52 3.52
2018 201 (16) 600 (164) 2.99
Rate Year 198 600 3.03
*2017 data represents 3 months actual/normal and 9 months forecast**Lighting sales are not normalized
Electric Forecast ResultsTraffic Signals**

Exhibit ___(FRP-6)Sheet 13 of 14
ActualCusts MWh Change
2012 1 987
2013 1 967 (20)
2014 1 977 10
2015 1 1,036 59
2016 1 1,037 1
*2017 1 1,067 30
2018 1 1,040 (27)
Rate Year 1 1,040
*2017 data represents 3 months actual/normal and 9 months forecast**Interdepartmental sales are not normalized
Interdepartmental**Electric Forecast Results

Exhibit ___(FRP-6)Sheet 14 of 14
Actual Norm Actual NormCusts Change MWh Change MWh Change MWh/Cust MWh/Cust
2012 299,537 5,122,616 5,263,182 17.10 17.57
2013 300,148 611 5,149,881 27,265 5,281,433 18,251 17.16 17.60
2014 300,653 505 5,066,948 (82,933) 5,087,227 (194,206) 16.85 16.92
2015 302,440 1,787 5,116,579 49,631 5,023,932 (63,295) 16.92 16.61
2016 302,305 (135) 4,984,434 (132,145) 5,006,738 (17,194) 16.49 16.56
*2017 302,872 567 5,172,448 188,014 5,181,996 175,258 17.08 17.11
2018 302,712 (160) 4,884,456 (297,540) 16.14
Rate Year 302,786 4,835,748 15.97
*2017 data represents 3 months actual/normal and 9 months forecast
Electric Forecast ResultsTotal Own Territory Sales (Excludes Unbilled)

Exhibit ___(FRP-7)
Sheet 1 Residential HeatSheet 2 Residential Non-HeatSheet 3 Commercial HeatSheet 4 Commercial Non-HeatSheet 5 OPASheet 6 IndustrialSheet 7 InterdepartmentalSheet 8 Total Own Territory
*Results do not include post-forecast adjustment for EEPS
Central Hudson Gas & Electric Corporation
Gas Forecast Results*

Exhibit ___(FRP-7)Sheet 1 of 8
Actual Norm Actual NormCusts Change Mcf Change Mcf Change Mcf/Cust Mcf/Cust
2012 56,663 4,221,997 4,862,780 74.51 85.82
2013 57,674 1,011 5,028,296 806,299 4,989,618 126,838 87.18 86.51
2014 58,865 1,191 5,650,625 622,329 5,329,526 339,908 95.99 90.54
2015 60,149 1,284 5,690,474 39,849 5,451,095 121,569 94.61 90.63
*2016 61,070 921 5,146,602 (543,872) 5,789,778 338,683 84.27 94.81
**2017 61,959 889 5,196,842 50,240 5,626,636 (163,142) 83.88 90.81
2018 62,765 806 5,585,992 (40,644) 89.00
RY 63,232 5,547,436 87.73
*2016 data reflects adjustment for July transition to monthly billing**2017 data represents 3 months actual/normal and 9 months forecast
Gas Forecast ResultsResidential Heat

Exhibit ___(FRP-7)Sheet 2 of 8
Actual Norm Actual NormCusts Change Mcf Change Mcf Change Mcf/Cust Mcf/Cust
2012 8,148 136,428 149,733 16.74 18.38
2013 7,979 (169) 152,337 15,909 151,755 2,022 19.09 19.02
2014 7,728 (251) 168,881 16,544 162,934 11,179 21.85 21.08
2015 7,499 (229) 167,243 (1,638) 162,741 (193) 22.30 21.70
*2016 7,393 (106) 153,376 (13,867) 164,643 1,902 20.75 22.27
**2017 7,195 (198) 152,872 (504) 154,081 (10,562) 21.25 21.42
2018 6,913 (282) 147,256 (6,825) 21.30
RY 6,786 141,354 20.83
*2016 data reflects adjustment for July transition to monthly billing**2017 data represents 3 months actual/normal and 9 months forecast
Residential Non-HeatGas Forecast Results

Exhibit ___(FRP-7)Sheet 3 of 8
Actual Norm Actual NormCusts Change Mcf Change Mcf Change Mcf/Cust Mcf/Cust
2012 8,772 3,674,779 4,146,634 418.92 472.71
2013 8,949 177 4,251,044 576,265 4,211,115 64,481 475.03 470.57
2014 9,144 195 4,807,000 555,956 4,561,498 350,383 525.70 498.85
2015 9,327 183 4,938,690 131,690 4,795,402 233,904 529.50 514.14
*2016 9,397 70 4,544,632 (394,058) 5,004,158 208,756 483.63 532.53
**2017 9,532 135 4,696,752 152,120 4,842,563 (161,595) 492.74 508.03
2018 9,629 97 4,862,941 20,378 505.03
RY 9,712 4,914,423 506.02
*2016 data reflects adjustment for July transition to monthly billing**2017 data represents 3 months actual/normal and 9 months forecast
Commercial HeatGas Forecast Results

Exhibit ___(FRP-7)Sheet 4 of 8
Actual Norm Actual NormCusts Change Mcf Change Mcf Change Mcf/Cust Mcf/Cust
2012 1,121 590,420 610,147 526.69 544.29
2013 1,113 (8) 631,458 41,038 629,842 19,695 567.35 565.90
2014 1,098 (15) 719,843 88,385 710,335 80,493 655.59 646.94
2015 1,110 12 722,714 2,871 717,499 7,164 651.09 646.40
*2016 1,090 (20) 691,640 (31,074) 709,179 (8,320) 634.53 650.62
**2017 1,086 (4) 665,195 (26,445) 656,436 (52,743) 612.52 604.45
2018 1,074 (12) 648,055 (8,381) 603.40
RY 1,071 646,447 603.59
*2016 data reflects adjustment for July transition to monthly billing**2017 data represents 3 months actual/normal and 9 months forecast
Commercial Non-HeatGas Forecast Results

Exhibit ___(FRP-7)Sheet 5 of 8
Actual Norm Actual NormCusts Change Mcf Change Mcf Change Mcf/Cust Mcf/Cust
2012 725 788,471 900,619 1,087.55 1,242.23
2013 726 1 898,153 109,681 888,894 (11,725) 1,237.12 1,224.37
2014 730 4 940,070 41,918 884,459 (4,435) 1,287.77 1,211.59
2015 737 7 846,168 (93,902) 813,482 (70,977) 1,148.12 1,103.77
*2016 733 (4) 994,213 148,045 1,097,798 284,316 1,356.36 1,497.68
**2017 736 3 868,370 (125,843) 916,991 (180,807) 1,179.85 1,245.91
2018 733 (3) 892,715 (24,276) 1,217.89
RY 733 891,851 1,216.71
*2016 data reflects adjustment for July transition to monthly billing**2017 data represents 3 months actual/normal and 9 months forecast
Gas Forecast ResultsOPA

Exhibit ___(FRP-7)Sheet 6 of 8
Actual Norm Actual NormCusts Change Mcf Change Mcf Change Mcf/Cust Mcf/Cust
2012 247 278,615 325,023 1,127.99 1,315.88
2013 242 (5) 367,572 88,958 363,745 38,722 1,518.89 1,503.08
2014 249 7 529,729 162,157 504,618 140,873 2,127.43 2,026.58
2015 257 8 582,416 52,687 569,103 64,485 2,266.21 2,214.41
*2016 270 13 556,390 (26,026) 604,830 35,727 2,060.70 2,240.11
**2017 272 2 480,746 (75,644) 484,291 (120,539) 1,767.45 1,780.48
2018 270 (2) 489,851 5,560 1,814.26
RY 270 493,085 1,826.24
*2016 data reflects adjustment for July transition to monthly billing**2017 data represents 3 months actual/normal and 9 months forecast
Gas Forecast ResultsIndustrial

Exhibit ___(FRP-7)Sheet 7 of 8
Actual Norm Actual NormCusts Change Mcf Change Mcf Change Mcf/Cust Mcf/Cust
2012 1 19,345 19,345 19,345.00 19,345.00
2013 1 - 23,772 4,427 23,772 4,427 23,772.00 23,772.00
2014 1 - 27,041 3,269 27,041 3,269 27,041.00 27,041.00
2015 1 - 25,892 (1,149) 25,892 (1,149) 25,892.00 25,892.00
*2016 1 - 22,121 (3,771) 22,121 (3,771) 22,121.00 22,121.00
**2017 1 - 22,883 762 22,883 762 22,883.00 22,883.00
2018 1 - 24,000 1,117 24,000.00
RY 1 24,000 24,000.00
*2016 data reflects adjustment for July transition to monthly billing**2017 data represents 3 months actual/normal and 9 months forecast
InterdepartmentalGas Forecast Results

Exhibit ___(FRP-7)Sheet 8 of 8
Actual NormCusts Change Mcf Change Mcf Change
2012 75,677 9,710,055 11,014,281
2013 76,684 1,007 11,352,632 1,642,577 11,258,741 244,460
2014 77,815 1,131 12,843,189 1,490,557 12,398,321 1,139,580
2015 79,080 1,265 12,973,597 130,408 12,535,214 136,893
*2016 79,954 874 12,108,974 (864,623) 13,392,507 857,293
**2017 80,781 827 12,083,660 (25,314) 12,703,881 (688,626)
2018 81,385 604 12,650,810 (53,071)
RY 81,805 12,658,596 7,786
*2016 data reflects adjustment for July transition to monthly billing**2017 data represents 3 months actual/normal and 9 months forecast
Gas Forecast ResultsTotal Firm Sales

Exhibit__(FRP-8)
Central Hudson Gas & Gas Corporation
Heating and Cooling Degree Days
Sheet 1 Electric Heating Degree DaysSheet 2 Electric Cooling Degree DaysSheet 3 Gas Heating Degree Days

Central Hudson Gas & Electric Corporation
Exhibit__(F
RP
-8) S
heet 1 of 3
5,000
5,200
5,400
5,600
5,800
6,000
6,200
6,400
6,600
6,800
7,000
Electric Heating Degree Days
Annual
30 Yr Avg
10 Yr Avg

Central Hudson Gas & Electric CorporationE
xhibit__(FR
P-8)
Sheet 2 of 3
400
500
600
700
800
900
1,000
1,100
Electric Cooling Degree Days
Annual
30 Yr Avg
10 Yr Avg

Exhibit__(F
RP
-8) S
heet 3 of 3
Central Hudson Gas & Electric Corporation
4,900
5,400
5,900
6,400
6,900
Gas Heating Degree Days
Annual
10 Year Average
30 Year Average

Exhibit__(FRP-9)
Central Hudson Gas & Gas Corporation
Design Day and Winter Season Demand Requirements
Schedule A Estimated Design Weather RequirementsSchedule B Estimated Normal Weather Requirements

2016-17 (forecast) 2/2016-17 (actuals) 2017-18 2018-19 2019-20 2020-21 2021-22
FirmSales 8,168 7,629 8,489 8,419 8,431 8,416 8,361
Transportation 7,341 7,001 7,074 7,082 7,129 7,143 7,132
Non-FirmSales 283 252 116 116 116 116 116
Transportation 1,245 1,344 1,422 1,422 1,422 1,422 1,422
Total 17,038 16,226 17,101 17,039 17,097 17,097 17,031
FirmSales 5,405 5,206 6,058 6,000 6,017 6,001 5,959
Transportation 4,793 4,078 4,767 4,770 4,803 4,808 4,799
Non-FirmSales 150 104 51 51 51 51 51
Transportation 715 761 808 808 808 808 808
Total 11,063 10,150 11,683 11,628 11,679 11,667 11,617
Peak DayFirm
Sales 77.84 61.37 82.16 82.56 83.25 83.94 84.59
Transportation 69.02 48.07 64.65 65.63 66.45 67.26 68.12
Non-Firm
Sales 3/1.38 - - - - - -
Transportation 6.03 6.29 8.43 8.51 8.60 8.69 8.77
Total 154.27 115.72 155.25 156.70 158.29 159.89 161.48
1/ For Reliability Forecast purposes Design Weather is defined as a 10% increase from normal weather defined as a 30 year average of historic
degree days:
Annual HDD 6,609 5,695 6,576 6,576 6,576 6,576 6,576
Winter HDD 5,267 4,551 5,236 5,236 5,236 5,236 5,236
Peak Day 70 52 70 70 70 70 70
2/ Of the Firm Transporation Peak Forecast value, approximately 24% relates to SC 11.
3/ Peak day forecast allocated based on most recent actuals, which reflects interruptible sales curtailment.
Exhibit__(F
RP
-9)S
chedule ACentral Hudson Gas & Gas Corporation
Case 17-M-0280 - Winter Supply 2017-18 Forms
Table 2 - Estimated Design Weather 1/ Requirements (MDT)
Annual
Winter Season

2016-17 (forecast) 2/2016-17 (actuals) 2017-18 2018-19 2019-20 2020-21 2021-22
FirmSales 7,496 7,629 7,792 7,726 7,734 7,720 7,666
Transportation 6,871 7,001 6,627 6,635 6,677 6,689 6,678
Non-FirmSales 283 252 116 116 116 116 116
Transportation 1,245 1,344 1,422 1,422 1,422 1,422 1,422
Total 15,896 16,226 15,957 15,899 15,949 15,947 15,882
FirmSales 4,930 5,206 5,530 5,475 5,489 5,472 5,432
Transportation 4,448 4,078 4,426 4,428 4,458 4,462 4,453
Non-FirmSales 150 104 51 51 51 51 51
Transportation 715 761 808 808 808 808 808
Total 10,243 10,150 10,814 10,762 10,805 10,792 10,743
Peak DayFirm
Sales 64.68 61.37 68.25 68.53 69.06 69.60 70.08
Transportation 58.36 48.07 54.63 55.43 56.09 56.75 57.45
Non-Firm
Sales 3/1.16 - - - - - -
Transportation 5.05 6.29 7.06 7.12 7.19 7.26 7.33
Total 129.24 115.72 129.94 131.08 132.34 133.61 134.86
1/ Although the Company's sales forecasts reflect ten year average HDD for normal weather, for reliability forecast purposes herein normalweather is defined as thirty year average HDD:
Annual HDD 6,008 5,695 5,978 5,978 5,978 5,978 5,978 Winter HDD 4,788 4,551 4,760 4,760 4,760 4,760 4,760
Peak Day HDD 57 52 57 57 57 57 57
2/ From prior year submission Table 3 which also reflected thirty year average of historic degree days for normal weather. For 2016-17 Total Peak day reflects total value from prior year submission with detail allocated based on sales.
Of the Firm Transporation Peak Forecast value, approximately 25% relates to SC 11.
3/ Peak day forecast allocated based on most recent actuals, which reflects interruptible sales curtailment.
Exhibit__(F
RP
-9)S
chedule BCentral Hudson Gas & Gas Corporation
Case 17-M-0280 - Winter Supply 2017-18 Forms
Table 3 - Estimated Normal Weather 1/ Requirements (MDT)
Annual
Winter Season

Exhibit___(FRP-10)
Estimate of Cumulative Residential kW InstalledJan Feb Mar Apr May Jun Jul Aug Sep Oct Nov Dec
2017 46,305 47,274 48,348 49,386 50,459 51,496 52,570 53,640 54,680 55,753 56,790 57,864 2018 60,534 61,530 62,632 63,697 64,799 65,867 66,968 68,070 69,136 70,237 71,304 72,405 2019 75,448 76,471 77,600 78,695 79,826 80,921 82,050 83,183 84,276 85,407 86,502 87,632 2020 91,048 92,131 93,293 94,415 95,575 96,698 97,856 99,018 100,139 101,300 102,424 103,583 2021 107,370 108,444 109,631 110,783 111,971 113,124 114,311 115,502 116,653 117,841 118,993 120,180 2022 121,371 122,444 123,633 124,784 125,972 127,123 128,313 129,502 130,652 131,842 132,992 134,181
Estimate of Cumulative Non-Residential kW InstalledJan Feb Mar Apr May Jun Jul Aug Sep Oct Nov Dec
2017 16,482 16,827 17,208 17,577 17,959 18,329 18,710 19,094 19,462 19,844 20,214 20,595 2018 19,379 19,697 20,050 20,392 20,745 21,085 21,438 21,791 22,132 22,486 22,826 23,180 2019 21,592 21,882 22,208 22,520 22,844 23,157 23,482 23,804 24,118 24,442 24,755 25,079 2020 23,118 23,395 23,688 23,974 24,268 24,553 24,849 25,142 25,428 25,722 26,006 26,301 2021 23,969 24,209 24,476 24,732 24,998 25,253 25,520 25,784 26,041 26,307 26,563 26,830 2022 27,094 27,335 27,600 27,857 28,123 28,380 28,645 28,910 29,168 29,432 29,690 29,955
Estimate of Lost kWh- Residential Jan Feb Mar Apr May Jun Jul Aug Sep Oct Nov Dec Total
2017 1,852,061 2,836,214 5,318,367 5,926,441 6,055,149 6,694,589 7,359,809 6,436,963 5,468,206 5,017,983 3,975,001 3,471,551 60,412,334 2018 2,421,181 3,691,514 6,889,663 7,643,807 7,775,995 8,562,725 9,375,555 8,168,489 6,913,873 6,321,620 4,990,910 4,343,950 77,099,282 2019 3,017,659 4,587,911 8,536,201 9,443,615 9,579,283 10,519,783 11,487,062 9,982,097 8,427,942 7,687,000 6,054,625 5,257,506 94,580,684 2020 3,641,615 5,527,440 10,262,482 11,329,935 11,469,203 12,570,820 13,699,918 11,882,337 10,014,306 9,117,446 7,169,081 6,214,494 112,899,077 2021 4,294,446 6,506,090 12,059,724 13,294,145 13,436,773 14,706,239 16,003,645 13,860,468 11,665,680 10,606,222 8,328,828 7,210,243 131,972,503 2022 4,854,447 7,346,032 13,600,000 14,974,311 15,116,939 16,526,145 17,963,811 15,540,513 13,065,645 11,866,387 9,308,690 8,050,244 148,213,164
Estimate of Lost kWh- Non-Residential Jan Feb Mar Apr May Jun Jul Aug Sep Oct Nov Dec Total
2017 659,227 1,009,539 1,892,928 2,109,275 2,155,116 2,382,792 2,619,407 2,291,319 1,946,270 1,786,048 1,414,867 1,235,601 21,502,389 2018 775,098 1,181,726 2,205,557 2,447,080 2,489,442 2,741,075 3,001,329 2,614,963 2,213,279 2,023,839 1,597,692 1,390,688 24,681,768 2019 863,611 1,312,815 2,442,942 2,702,445 2,741,325 3,010,438 3,287,489 2,856,527 2,411,887 2,199,888 1,732,711 1,504,620 27,066,698 2020 924,646 1,403,588 2,605,746 2,876,928 2,912,208 3,191,920 3,478,870 3,017,090 2,542,891 2,315,093 1,820,274 1,577,934 28,667,188 2021 958,683 1,452,424 2,692,428 2,967,890 2,999,810 3,282,920 3,572,810 3,094,132 2,604,194 2,367,746 1,859,261 1,609,672 29,461,970 2022 1,083,673 1,639,968 3,036,077 3,342,895 3,374,817 3,689,434 4,010,311 3,469,257 2,916,905 2,649,010 2,078,134 1,797,156 33,087,637
Central Hudson Gas & Electric CorporationCumulative PV Net Metered kW Installed
0
20,000
40,000
60,000
80,000
100,000
120,000
140,000
160,000
180,000
kW

Exhibit___(FRP-11)
Central Hudson Gas & Electric Corporation
Estimated Effect of Proposed Electric Revenue Increase
Schedule A Electric Interclass Revenue Allocation
Schedule B Determination of Rate Case Revenue with Proposed Revenue Increase

Min .75x, Max 1.25x
Incremental Revenue Requirement Excluding Taxes (1) 63,407,000$ Percentage On Base Rates (2) 21.20%
(3) (4) (5) (6) (7) (8)=(2)x(6)x(7) (9) (10)=(8)+(9) (11) (12) (13) (14)=(12)-(13) (15)=(10)+(14) (16) (17)Unitized Rate Unitized Rate Unitized Rate Revenue RY Sales MFC Revenue Total MFC Adj Increase Delivery
of Return of Return of Return Allocation at Current Base Rev Adjustment Revenue from Current Estimated Adjustment to Adj Base as % of IncreaseHistoric Information Only Pro Forma Factor Rates Increase 254,336$ Total % Increase Base Rates MFC Revenue Rate Increase Rev Increase System Percent
SC 1 Residential 1.08 0.88 0.93 1.00 201,611,890$ 42,739,849$ 172,127$ 42,911,976$ 21.28% 7,641,090$ 9,420,668$ (1,779,578)$ 41,132,398$ 67.10% 21.21%SC 2 Non Demand 0.04 (0.13) 1.73 1.00 17,325,300$ 3,672,803$ 14,792$ 3,687,594$ 21.28% 854,670$ 1,079,768$ (225,098)$ 3,462,496$ 5.65% 21.02%SC 2 Secondary 1.08 1.43 1.15 1.00 53,505,960$ 11,342,767$ 45,681$ 11,388,448$ 21.28% 341,170$ 420,837$ (79,667)$ 11,308,780$ 18.45% 21.27%SC 2 Primary 2.70 4.77 (1.07) 1.00 4,978,850$ 1,055,470$ 4,251$ 1,059,721$ 21.28% 4,000$ 5,908$ (1,908)$ 1,057,813$ 1.73% 21.26%SC 3 Primary 2.35 3.78 (0.89) 1.00 6,038,110$ 1,280,023$ 5,155$ 1,285,178$ 21.28% -$ -$ -$ 1,285,178$ 2.10% 21.28%SC 5 Area Lighting 0.05 (0.17) 1.28 1.00 1,776,770$ 376,659$ 1,517$ 378,176$ 21.28% 128,870$ 147,220$ (18,350)$ 359,825$ 0.59% 21.84%SC 6 Residential TOU 2.18 2.43 0.17 1.00 1,323,760$ 280,625$ 1,130$ 281,755$ 21.28% 34,860$ 36,728$ (1,868)$ 279,887$ 0.46% 21.72%SC 8 Street Lighting 1.98 0.42 1.67 0.75 4,799,010$ 763,009$ 3,073$ 766,082$ 15.96% 5,190$ 7,767$ (2,577)$ 763,505$ 1.25% 15.93%SC 9 Traffic Signals 1.97 1.68 (0.12) 1.00 226,320$ 47,978$ 193$ 48,171$ 21.28% 6,720$ 7,272$ (552)$ 47,619$ 0.08% 21.68%SC 13 Substation (0.36) 0.45 1.66 1.00 1,917,660$ 406,526$ 1,637$ 408,163$ 21.28% -$ -$ -$ 408,163$ 0.67% 21.28%SC 13 Transmission (1.38) 1.70 1.18 1.00 5,599,090$ 1,186,955$ 4,780$ 1,191,735$ 21.28% -$ -$ -$ 1,191,735$ 1.94% 21.28%
Total 1.00 1.00 1.00 299,102,720$ 63,152,664$ 254,336$ 63,407,000$ 21.20% 9,016,570$ 11,126,169$ (2,109,599)$ 61,297,401$ 100% 21.13%
Central Hudson Gas & Electric CorporationElectric Revenue Allocation
Twelve Months Ending June 30, 2019
Exh
ibit _
_(F
RP
-11
) S
che
du
le A

Exhibit__(FRP-11)Schedule B
Central Hudson Gas & Electric CorporationElectric Interclass Revenue Allocation
Determination of Base Rate Revenue with Proposed Revenue IncreaseTwelve Months Ending June 30, 2019
Present Base Rate Revenue ($000)
PercentBase MFC Base MFC Base MFC Total Rates Revenue Total Rates Revenue Total Rates Revenue Total Increase
Service Classification No. 1 Residential 193,971$ 7,641$ 201,612$ 41,132$ 1,780$ 42,912$ 235,103$ 9,421$ 244,524$ 21.28%
Service Classification No. 2 Non-demand 16,471$ 855$ 17,325$ 3,462$ 225$ 3,688$ 19,933$ 1,080$ 21,013$ 21.28% Demand - Secondary 53,165$ 341$ 53,506$ 11,309$ 80$ 11,388$ 64,474$ 421$ 64,894$ 21.28% Demand - Primary 4,975$ 4$ 4,979$ 1,058$ 2$ 1,060$ 6,033$ 6$ 6,039$ 21.28%
74,610$ 1,200$ 75,810$ 15,829$ 307$ 16,136$ 90,439$ 1,507$ 91,946$ 21.28%
Service Classification No. 3 Large Primary 6,038$ -$ 6,038$ 1,285$ -$ 1,285$ 7,323$ -$ 7,323$ 21.28%
Service Classification No. 5 Area Lighting 1,648$ 129$ 1,777$ 360$ 18$ 378$ 2,008$ 147$ 2,155$ 21.28%
Service Classification No. 6 Residential Time of Use 1,289$ 35$ 1,324$ 280$ 2$ 282$ 1,569$ 37$ 1,606$ 21.28%
Service Classification No. 8 Street Lighting 4,794$ 5$ 4,799$ 764$ 3$ 766$ 5,557$ 8$ 5,565$ 15.96%
Service Classification No. 9 Traffic Signals 220$ 7$ 226$ 48$ 1$ 48$ 267$ 7$ 274$ 21.28%
Service Classification No. 13 Substation 1,918$ -$ 1,918$ 408$ -$ 408$ 2,326$ -$ 2,326$ 21.28% Transmission 5,599$ -$ 5,599$ 1,192$ -$ 1,192$ 6,791$ -$ 6,791$ 21.28%
7,517$ 0 7,517 1,600$ -$ 1,600$ 9,117$ -$ 9,117$ 21.28%
Total Filed Rates 290,086$ 9,017$ 299,103$ 61,297$ 2,110$ 63,407$ 351,384$ 11,126$ 362,510$ 21.20%
Interdepartmental 11$ 11$ -$ -$ -$ 11$ -$ 11$ Revenue Taxes 5,275$ 5,275$ 1,756 1,756$ 7,031$ -$ 7,031$ Other Revenues 10,011$ 10,011$ 652$ -$ 652$ 10,663$ -$ 10,663$
Total 305,383$ 9,017$ 314,400$ 63,705$ 2,110$ 65,815$ 369,089$ 11,126$ 380,215$ 20.93%
Proposed Revenue Increase ($000) Total Revenue After Increase ($000)

Exhibit__(FRP-12)
Central Hudson Gas & Electric Corporation
Estimated Effect of Proposed Gas Revenue Increase
Schedule A Gas Interclass Revenue Allocation
Schedule B Determination of Rate Case Revenue with Proposed Revenue Increase

Central Hudson Gas & Electric Corporation
Gas Revenue Allocation - Twelve Months Ending June 30, 2019
Incremental Revenue Requirement (1) 24,820,000$ Percentage On Base Rates (2) 27.22%
(3) (4) (5) (6) (7) (8)=(2)x(6)x(7) (9) (10)=(8)+(9) (11) (12) (13) (14)=(12)-(13) (15)=(10)+(14) (16) (17)Unitized Rate Unitized Rate Unitized Rate Revenue RY Block Revs MFC Revenue Total MFC Adj Increase Delivery
of Return of Return of Return Allocation at Current Base Rev Adjustment Revenue from Current Estimated Adjustment to Adj Base as % of IncreaseHistoric Hypothetical Pro Forma Factor Rates (Incl MFC) Increase -$ Total % Increase MFC Rates MFC Revenue Rate Increase Rev Increase System Percent
Information Only
SC 1 & 12 0.68 0.88 0.87 1.00 59,426,940$ 16,177,708$ -$ 16,177,708$ 27.22% 932,430$ 1,540,102$ (607,672)$ 15,570,036$ 66.51% 26.62%SC 2, 6 & 13 0.72 0.75 1.15 1.00 29,359,800$ 7,992,575$ -$ 7,992,575$ 27.22% 1,138,680$ 1,942,619$ (803,939)$ 7,188,636$ 30.71% 25.47%SC 11 Transmission 6.03 3.24 0.82 1.00 1,462,180$ 398,047$ -$ 398,047$ 27.22% -$ -$ -$ 398,047$ 1.70% 27.22%SC 11 Distribution 0.89 -0.16 1.43 1.00 92,210$ 25,102$ -$ 25,102$ 27.22% -$ -$ -$ 25,102$ 0.11% 27.22%SC 11 - DLM 0.61 -0.14 1.34 1.00 832,270$ 226,568$ -$ 226,568$ 27.22% -$ -$ -$ 226,568$ 0.97% 27.22%
Total 91,173,400 24,820,000$ -$ 24,820,000$ 2,071,110$ 3,482,720$ (1,411,610)$ 23,408,390$ 100.00% 26.27%
Pro FormaPro Forma 3.44% TOTAL 1.00
ECOSSC 1 & 12 3.01% SC 1 & 12 0.87 SC 2, 6 & 13 3.95% SC 2, 6 & 13 1.15 SC 11 Transmission 2.82% SC 11 Transmission 0.82 LowSC 11 Distribution 4.91% SC 11 Distribution 1.43 HighSC 11 - DLM 4.60% SC 11 - DLM 1.34 High
EmbeddedHistoric 6.20% TOTAL 1.00ECOS
SC 1 & 12 4.23% SC 1 & 12 0.68 LowSC 2, 6 & 13 4.46% SC 2, 6 & 13 0.72 LowSC 11 Transmission 37.41% SC 11 Transmission 6.03 HighSC 11 Distribution 5.54% SC 11 Distribution 0.89SC 11 - DLM 3.81% SC 11 - DLM 0.61 Low
HypotheticalHypothetical 5.47% TOTAL 1.00
ECOSSC 1 & 12 4.82% SC 1 & 12 0.88 SC 2, 6 & 13 4.08% SC 2, 6 & 13 0.75 LowSC 11 Transmission 17.74% SC 11 Transmission 3.24 HighSC 11 Distribution -0.89% SC 11 Distribution (0.16) LowSC 11 - DLM -0.77% SC 11 - DLM (0.14) Low
UNITIZED RATE OF RETURN
UNITIZED RATE OF RETURN
UNITIZED RATE OF RETURN
Sch
ed
ule
A
Exh
ibit _
_ (F
RP
-12
)

Central Hudson Gas & Electric CorporationDetermination of Base Rate Revenue with Proposed Revenue Increase
Twelve Months Ending June 30, 2019
Revenue at Present Rates ($000) Proposed Revenue Increase ($000) Total Revenue After Increase ($000)Customer Sales Revenue Tax Base Base Revenue Base Revenue % OverallMonths (Mcf.) Factor Rates MFC Total Rates MFC Tax Total Rates MFC Tax Total Increase
S.C. Nos. 1 & 12 - Billed 842,308 5,386,854 0.02627 58,494$ 932$ 59,427$ 14,425$ 608$ -$ 15,032$ 72,919$ 1,540$ -$ 74,459$ 25.30%S.C. No. 2, 6 & 13 - Billed 138,820 6,818,598 0.00563 28,221$ 1,139$ 29,360$ 5,734$ 804$ -$ 6,538$ 33,955$ 1,943$ -$ 35,898$ 22.27%S.C. No. 11 - Transmission 36 1,002,485 0.00563 1,462$ -$ 1,462$ 398$ -$ -$ 398$ 1,860$ -$ -$ 1,860$ 27.22%S.C. No. 11 - Distribution 12 50,147 0.00563 92$ -$ 92$ 25$ -$ -$ 25$ 117$ -$ -$ 117$ 27.22%S.C. No. 11 - DLM 12 722,757 0.00563 832$ -$ 832$ 227$ -$ -$ 227$ 1,059$ -$ -$ 1,059$ 27.22%Unbilled - - -$ -$ -$ -$ -$ -$ -$ -$ -$ -$ -$
Total Firm 981,188 13,980,841 89,102$ 2,071$ 91,173$ 20,808$ 1,412$ -$ 22,220$ 109,911$ 3,483$ -$ 113,393$ 24.37%
Interdepartmental 12 24,000 64$ 4$ 68$ -$ -$ -$ -$ 64$ 4$ -$ 68$ Interruptible 612 1,537,809 2,600$ -$ 2,600$ -$ -$ -$ -$ 2,600$ -$ -$ 2,600$
Total Own Territory 981,812 15,542,650 91,766$ 2,075$ 93,841$ 20,808$ 1,412$ -$ 22,220$ 112,574$ 3,487$ -$ 116,061$ 23.68%
Revenue Tax on Increase -$ Total Revenue Increase 22,220$ Revenue Tax Rate 0.00%
Sch
ed
ule
B
Exh
ibit _
__
(FR
P-1
2)

Exhibit__(FRP-13)
Central Hudson Gas & Electric Corporation
Comparison of Gas Bills Under Declining Block and Flat Rates
Schedule A Service Classification Nos. 1 & 12
Schedule B Service Classification Nos. 2, 6 & 13

Central Hudson Gas & Electric Corporation
Comparison of Gas Bills Under Declining Block and Flat Rates
MonthlyUsage
CcfCase 14-G-0319 RY3 Block Rates
Redesigned RY3 Flat Rates Amount Increase
2 27.84$ 27.84$ -$ 0.00%4 31.03 30.46 (0.58) -1.86%6 34.23 33.07 (1.15) -3.37%8 37.42 35.69 (1.73) -4.63%
10 40.61 38.30 (2.31) -5.69%15 48.59 44.84 (3.75) -7.72%20 56.57 51.37 (5.20) -9.19%25 64.55 57.91 (6.64) -10.29%30 72.53 64.44 (8.08) -11.15%35 80.51 70.98 (9.53) -11.83%40 88.49 77.52 (10.97) -12.40%50 104.45 90.59 (13.86) -13.27%60 114.90 103.66 (11.24) -9.78%80 135.81 129.80 (6.01) -4.43%
100 156.73 155.95 (0.78) -0.50%130 188.10 195.16 7.07 3.76%170 229.92 247.45 17.53 7.62%200 261.29 286.67 25.38 9.71%300 365.85 417.39 51.54 14.09%
1000 1,097.79 1,332.43 234.64 21.37%
Average Annual Heating Customer @ 850 Ccf Per Year850 1,439.92 1,413.85 (26.06) -1.81%
Weighted Revenue Tax Factor: Delivery 0.02560 Commodity 0.00560
Gas Supply Charge (per Ccf): 0.53670$
New York State Assessment Surcharge (per Ccf): 0.01166$
System Benefits Charge (per Ccf) 0.01814$
Merchant Function Charge (per Ccf): MFC Admin 0.00434$ MFC Supply 0.01297$ Transition Adj. 0.00502$
Gas Bill Credit (per Ccf): (0.01278)$
In order to only show the impact of eliminating block rate design, block bills and flat ratebills reflect GBC, MFC, NYSA, SBC and GSC at July 1, 2017 rates.
Exhibit__(FRP-13)Schedule A
P.S.C. No. 12 - GasService Classification Nos. 1 & 12
Monthly Bill Change in Monthly Bill

Central Hudson Gas & Electric Corporation
Comparison of Gas Bills Under Declining Block and Flat Rates
MonthlyUsage
CcfCase 14-G-0319 RY3 Block Rates
Redesigned RY3 Flat Rates Amount Increase
2 40.40$ 40.40$ -$ 0.00%10 49.54 47.83 (1.70) -3.43%30 72.38 66.42 (5.95) -8.22%50 95.22 85.01 (10.20) -10.72%
100 152.32 131.49 (20.83) -13.68%150 198.20 177.96 (20.24) -10.21%200 244.08 224.44 (19.64) -8.05%250 289.96 270.91 (19.05) -6.57%300 335.84 317.39 (18.46) -5.50%400 427.60 410.34 (17.27) -4.04%500 519.36 503.29 (16.08) -3.10%600 611.13 596.24 (14.89) -2.44%800 794.65 782.13 (12.51) -1.57%
1000 978.17 968.03 (10.14) -1.04%1500 1,436.97 1,432.78 (4.19) -0.29%2000 1,895.78 1,897.52 1.75 0.09%3000 2,813.39 2,827.02 13.63 0.48%5000 4,648.60 4,686.00 37.40 0.80%7500 6,790.27 7,009.73 219.46 3.23%
10000 8,931.94 9,333.47 401.53 4.50%12000 10,645.27 11,192.45 547.18 5.14%14000 12,358.61 13,051.44 692.83 5.61%16000 14,071.94 14,910.42 838.48 5.96%20000 17,498.61 18,628.39 1,129.78 6.46%
Average Annual Heating Customer @ 4940 Ccf Per Year4940 5,259.71 5,054.17 (205.54) -3.91%
Average Annual SC 6 Customer @ 99,450 Ccf Per Year99450 89,578.77 92,900.51 3,321.75 3.71%
Average Annual SC 6 High Volume Tail Block Billed Customer @ 145,910 Ccf Per Year145910 125,460.56 136,084.74 10,624.18 8.47%
Weighted Revenue Tax Factor: Delivery 0.00560 Commodity 0.00560
Gas Supply Charge (per Ccf): 0.53670$
New York State Assessment Surcharge (per Ccf): 0.00407$
System Benefits Charge (per Ccf): 0.00791$
Merchant Function Charge (per Ccf): MFC Admin 0.00419$ MFC Supply 0.01251$ Transition Adj. 0.02584$
Gas Bill Credit (Per Ccf): (0.00495)$
In order to only show the impact of eliminating block rate design, block bills and flat ratebills reflect GBC, MFC, NYSA, SBC and GSC at July 1, 2017 rates.
Exhibit__(FRP-13)Schedule B
Monthly Bill Change in Monthly Bill
P.S.C. No. 12 - GasService Classification Nos. 2, 6 & 13

Exhibit___(FRP-14)
Central Hudson Gas & Electric Corporation
Summary of Present and Proposed Electric Rates
Schedule A Merchant Function Charges
Schedule B Electric Bill Credit
Schedule C Service Classification No. 1
Schedule D Service Classification No. 2
Schedule E Service Classification No. 3
Schedule F Service Classification No. 5
Schedule G Service Classification No. 6
Schedule H Service Classification No. 8
Schedule I Service Classification No. 9
Schedule J Service Classification No. 13

Exhibit__(FRP-14)Schedule A
Central Hudson Gas & Electric Corporation
Electric Commodity Related Merchant Function Charges($/kWh)
Present Base MFC Rates
MFC MFCAdministration Supply MFC
Charge Charge Total
S.C. No. 1 0.00163$ 0.00236$ 0.00399$ S.C. No. 2 ND 0.00230$ 0.00332$ 0.00562$ S.C. No. 2 PD 0.00001$ 0.00001$ 0.00002$ S.C. No. 2 SD 0.00011$ 0.00016$ 0.00027$ S.C. No. 3 -$ -$ -$ S.C. No. 5 0.00427$ 0.00618$ 0.01045$ S.C. No. 6 0.00075$ 0.00108$ 0.00183$ S.C. No. 8 0.00012$ 0.00018$ 0.00030$ S.C. No. 9 0.00116$ 0.00167$ 0.00283$ S.C. No. 13 S -$ -$ -$ S.C. No. 13 T -$ -$ -$
Proposed Base MFC Rates
MFC MFCAdministration Supply MFC
Charge Charge Total
S.C. No. 1 0.00192$ 0.00323$ 0.00515$ S.C. No. 2 ND 0.00264$ 0.00446$ 0.00710$ S.C. No. 2 PD 0.00001$ 0.00002$ 0.00003$ S.C. No. 2 SD 0.00013$ 0.00021$ 0.00034$ S.C. No. 3 -$ -$ -$ S.C. No. 5 0.00444$ 0.00750$ 0.01194$ S.C. No. 6 0.00072$ 0.00121$ 0.00193$ S.C. No. 8 0.00017$ 0.00028$ 0.00045$ S.C. No. 9 0.00451$ 0.00761$ 0.01212$ S.C. No. 13 S -$ -$ -$ S.C. No. 13 T -$ -$ -$

Exhibit__(FRP-14)Schedule B
Bill Bill Credit Credit
Per kWh Per kW
S.C. No. 1 (0.00073)$ -$ S.C. No. 2 ND (0.00093)$ -$ S.C. No. 2 PD (0.00013)$ -$ S.C. No. 2 SD (0.00015)$ -$ S.C. No. 3 -$ (0.06000)$ S.C. No. 5 (0.00143)$ -$ S.C. No. 6 (0.00025)$ -$ S.C. No. 8 (0.00128)$ -$ S.C. No. 9 (0.00039)$ -$ S.C. No. 13 S -$ (0.06000)$ S.C. No. 13 T -$ (0.03000)$
Bill Bill Credit Credit
Per kWh Per kW
S.C. No. 1 (0.00813)$ -$ S.C. No. 2 ND (0.00840)$ -$ S.C. No. 2 PD (0.00186)$ -$ S.C. No. 2 SD (0.00319)$ -$ S.C. No. 3 -$ (0.81)$ S.C. No. 5 (0.01062)$ -$ S.C. No. 6 (0.00515)$ -$ S.C. No. 8 (0.01535)$ -$ S.C. No. 9 (0.02833)$ -$ S.C. No. 13 S -$ (0.64)$ S.C. No. 13 T -$ (0.35)$
Proposed EBC Rates
Present EBC Rates
Central Hudson Gas & Electric Corporation
Electric Bill Credit

EXHIBIT ____(FRP -14)Schedule C
Monthly Charge 24.00$ Monthly Charge 25.00$
Monthly Energy Delivery Charge per kWh 0.06586$ Monthly Energy Delivery Charge per kWh 0.08495$
Monthly Service Size Charge -$ Monthly Service Size Charge -$ Annual kWh: 9,001-10,000 1.00$ -$ Annual kWh: 10,001-12,000 2.00$ -$ Annual kWh: 12,001-15,000 3.00$
Annual kWh: Over 15,001 4.00$
Minimum Monthly Charge: Minimum Monthly Charge:
The Customer Charge The Customer Charge
Present Rate Proposed Rate
Central Hudson Gas & Electric Corporation
Summary of Present and Proposed Electric Rates
Single Phase Residential Service
Service Classification No. 1 - P.S.C. No. 15
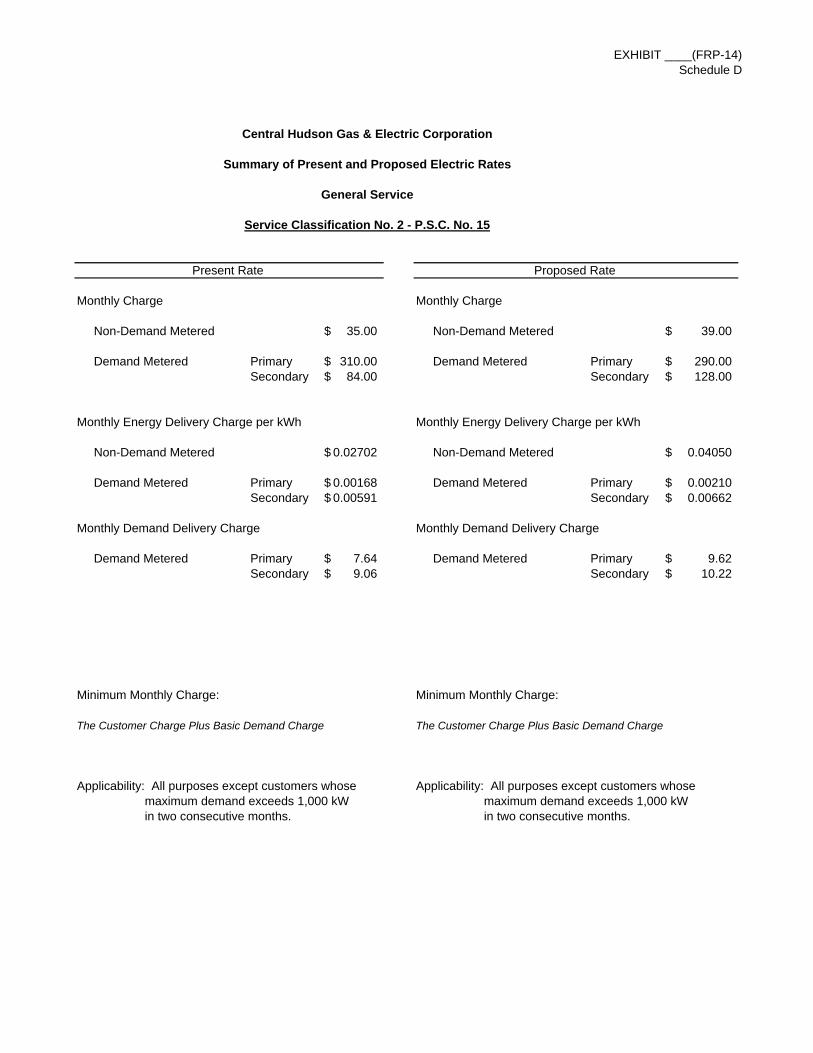
EXHIBIT ____(FRP-14)Schedule D
Monthly Charge Monthly Charge
Non-Demand Metered 35.00$ Non-Demand Metered 39.00$
Demand Metered Primary 310.00$ Demand Metered Primary 290.00$ Secondary 84.00$ Secondary 128.00$
Monthly Energy Delivery Charge per kWh Monthly Energy Delivery Charge per kWh
Non-Demand Metered 0.02702$ Non-Demand Metered 0.04050$
Demand Metered Primary 0.00168$ Demand Metered Primary 0.00210$ Secondary 0.00591$ Secondary 0.00662$
Monthly Demand Delivery Charge Monthly Demand Delivery Charge
Demand Metered Primary 7.64$ Demand Metered Primary 9.62$ Secondary 9.06$ Secondary 10.22$
Minimum Monthly Charge: Minimum Monthly Charge:
The Customer Charge Plus Basic Demand Charge The Customer Charge Plus Basic Demand Charge
Applicability: All purposes except customers whose Applicability: All purposes except customers whose maximum demand exceeds 1,000 kW maximum demand exceeds 1,000 kW in two consecutive months. in two consecutive months.
Present Rate Proposed Rate
Central Hudson Gas & Electric Corporation
Summary of Present and Proposed Electric Rates
General Service
Service Classification No. 2 - P.S.C. No. 15

EXHIBIT ___(FRP-14)Schedule E
Monthly Charge 1,500.00$ Monthly Charge 935.00$
Monthly Energy Delivery Charge per kWh -$ Monthly Energy Delivery Charge per kWh -$
Monthly Demand Delivery Charge Monthly Demand Delivery Charge
Basic Demand per kW 9.84$ Basic Demand per kW 12.56$
Reactive Demand per Rkva 0.83$ Reactive Demand per Rkva* 0.83$
Minimum Monthly Charge: Minimum Monthly Charge:
The Customer Charge Plus Basic Demand Charge The Customer Charge Plus Basic Demand Charge
Present Rate Proposed Rate
Central Hudson Gas & Electric Corporation
Summary of Present and Proposed Electric Rates
Large Power Primary Service
Service Classification No. 3 - P.S.C. No. 15

EXHIBIT ___(FRP-14)Schedule F
Sheet 1 of 2
Central Hudson Gas & Electric Corporation
Summary of Present and Proposed Electric Rates
Area Lighting
Service Classification No. 5 - P.S.C. No. 15
Lamp and Fixture Charge
Present ProposedAnnual Monthly Monthly
Lumens Type kWh Base Rate Base Rate
First Light
7,000 Mercury 832 11.22$ 13.67$ 20,000 Mercury 1,820 15.69$ 19.12$ 60,000 Mercury 4,320 25.93$ 31.59$ 5,800 Sodium 344 9.45$ 11.51$ 16,000 Sodium 721 11.53$ 14.05$ 27,000 Sodium 1,264 14.35$ 17.48$ 50,000 Sodium 1,984 17.16$ 20.91$
140,000 Sodium 4,656 30.58$ 37.26$ 50,000 Sodium - Floodlight 1,984 17.57$ 21.41$ 20,500 Metal Halide 1,200 14.48$ 17.64$ 36,000 Metal Halide 1,856 16.45$ 20.04$ 36,000 Metal Halide - Floodlight 1,856 16.98$ 20.69$
110,000 Metal Halide - Floodlight 4,400 28.72$ 34.99$ 14,001 Metal Halide (P) 820 $31.99 38.98$ 20,501 Metal Halide (P) 1,200 $37.62 45.83$ 36,001 Metal Halide 1,856 $44.90 54.70$ 5,801 Sodium Vapor (P) 344 $19.45 23.70$
2,900 LED 100 $11.45 13.95$ 6,800 LED 260 $11.99 14.61$ 9,500 LED 380 $13.73 16.73$ 16,500 LED 620 $18.24 22.22$
Lamp, Fixture and Pole Package Charge
Present ProposedAnnual Monthly Monthly
Lumens Type kWhrs Base Rate Base Rate
14,000 Metal Halide 820 31.99$ 38.98$ 20,500 Metal Halide 1,200 37.62$ 45.83$ 36,000 Metal Halide 1,856 44.90$ 54.70$ 5,800 Sodium - Colonial Post Top 344 19.45$ 23.70$

EXHIBIT ___(FRP-14)Schedule F
Sheet 2 of 2
Central Hudson Gas & Electric Corporation
Summary of Present and Proposed Electric Rates
Area Lighting
Service Classification No. 5 - P.S.C. No. 15
Present ProposedAnnual Monthly Monthly
Lumens Type kWhrs Base Rate Base Rate5,800 Sodium - Acorn 344 15.03$ 18.31$ 6,000 Induction - Acorn 340 19.77$ 24.09$ 14,000 Metal Halide - Acorn 820 15.00$ 18.28$ 16,000 Sodium - Victorian 721 15.55$ 18.95$ 27,000 Sodium - Highway Setback 1,264 14.21$ 17.31$ 50,000 Sodium - Highway Setback 1,984 13.31$ 16.22$ 20,500 Metal Halide - Highway Setback 1,200 15.76$ 19.20$ 36,000 Metal Halide - Highway Setback 1,856 17.79$ 21.67$ 27,000 Sodium - Teardrop 1,264 26.80$ 32.65$ 50,000 Sodium - Teardrop 1,984 29.94$ 36.48$ 20,500 Metal Halide - Teardrop 1,200 27.79$ 33.86$ 36,000 Metal Halide - Teardrop 1,856 30.01$ 36.56$
Present ProposedMonthly Monthly
Type Base Rate Base RateStandard Wooden Utility Pole 9.29$ 11.32$ Fluted Decorative Fiberglass Pole (area lighting) 30.32$ 36.94$ Fiberglass Pole up to 20' (decorative other than highway) 26.84$ 32.70$ Fiberglass Pole for Highway Setback (30' mounting height) 26.84$ 32.70$ Decorative Arm for Decorative Teardrop Lighting 12.90$ 15.72$
Decorative and Specialty Lighting
Decorative and Specialty Lighting - Supporting Equipment

EXHIBIT ____(FRP-14)Schedule G
Monthly Charge 27.00$ Monthly Charge 28.00$
Monthly Energy Delivery Charge per kWh
On-Peak 0.09507$ On-Peak 0.12022$ Off-Peak 0.03169$ Off-Peak 0.04007$
Minimum Monthly Charge: Minimum Monthly Charge:
The Customer Charge The Customer Charge
Rating Periods Rating Periods
On-Peak: Customer choice of: On-Peak: Customer choice of: 8am - 8pm OR 9am - 9pm OR 10am - 10pm, 8am - 8pm OR 9am - 9pm OR 10am - 10pm, excluding six designated holidays excluding six designated holidays
Off-Peak: All other hours including all hours of the Off-Peak: All other hours including all hours of the following holidays: following holidays: New Year's Day New Year's Day Memorial Day Memorial Day Fourth of July Fourth of July Labor Day Labor Day Thanksgiving Day Thanksgiving Day Christmas Day Christmas Day
Present Rate Proposed Rate
Central Hudson Gas & Electric Corporation
Summary of Present and Proposed Electric Rates
Residential Time-of-Use Service
Service Classification No. 6 - P.S.C. No. 15

EXHIBIT ___(FRP-14)Schedule HPage 1 of 3
Central Hudson Gas & Electric Corporation
Summary of Present and Proposed Electric Rates
Public Street and Highway Lighting
Service Classification No. 8 - P.S.C. No. 15
Company Owned and Maintained
Present ProposedAnnual Annual Annual
Lumens Type kWh Base Rate Base Rate
Standard Lights
5,800 Sodium Vapor 344 169.55$ 196.55$ 16,000 Sodium Vapor 720 188.44$ 218.45$ 27,000 Sodium Vapor 1,264 228.48$ 264.87$ 50,000 Sodium Vapor 1,984 257.66$ 298.70$ 140,000 Sodium Vapor 4,656 426.68$ 494.64$ 20,500 Metal Halide 1,200 259.93$ 301.33$ 36,000 Metal Halide 1,856 252.26$ 292.44$
LED Lights
3,600 LED 156 152.23$ 176.48$ 7,200 LED 328 171.61$ 198.94$
10,000 LED 372 207.43$ 240.47$ 17,600 LED 612 304.34$ 352.81$ 2,900 LED 100 137.43$ 159.32$ 6,800 LED 260 143.89$ 166.81$ 9,500 LED 380 164.81$ 191.06$
16,500 LED 620 218.83$ 253.68$
Non-Standard Lights
1,000 Incandescent 368 136.88$ 158.68$ 2,500 Incandescent 756 181.04$ 209.87$ 4,000 Incandescent 1,180 217.21$ 251.80$ 6,000 Incandescent 1,620 248.84$ 288.47$
3,600 Mercury Vapor 504 174.17$ 201.91$ 7,000 Mercury Vapor 832 188.62$ 218.66$ 11,000 Mercury Vapor 1,184 204.61$ 237.20$ 15,000 Mercury Vapor 1,820 238.72$ 276.74$ 20,000 Mercury Vapor 1,820 238.72$ 276.74$ 60,000 Mercury Vapor 4,320 350.24$ 406.02$
Lamp, Fixture and Pole Package
5,800 Sodium Vapor - Colonial Post Top 344 366.95$ 425.39$ 5,800 Sodium Vapor 344 462.58$ 536.25$ 16,000 Sodium Vapor 720 479.49$ 555.86$ 14,000 Metal Halide 820 528.51$ 612.69$ 20,500 Metal Halide 1,200 546.21$ 633.20$ 36,000 Metal Halide 1,856 578.39$ 670.51$
Standard Decorative and Special Purpose Luminaires
5,800 Sodium Vapor - Acorn 344 214.51$ 248.67$ 6,000 Induction - Acorn 340 290.96$ 337.30$ 14,000 Metal Halide - Acorn 820 271.49$ 314.73$ 16,000 Sodium Vapor - Victorian 720 276.41$ 320.43$ 27,000 Sodium Vapor - Highway Setback 1,264 262.28$ 304.05$ 50,000 Sodium Vapor - Highway Setback 1,984 294.88$ 341.85$ 20,500 Metal Halide - Highway Setback 1,200 300.51$ 348.37$ 36,000 Metal Halide - Highway Setback 1,856 292.64$ 339.25$ 50,000 Sodium Vapor - Floodlight 1,984 272.91$ 316.38$ 36,000 Metal Halide - Floodlight 1,856 261.57$ 303.23$ 110,000 Metal Halide - Floodlight 4,400 449.32$ 520.88$ 27,000 Sodium Vapor - Teardrop 1,264 315.98$ 366.31$ 50,000 Sodium Vapor - Teardrop 2,480 370.65$ 429.68$ 20,500 Metal Halide - Teardrop 1,200 342.38$ 396.91$ 36,000 Metal Halide - Teardrop 1,856 350.98$ 406.88$

EXHIBIT ___(FRP-14)Schedule HPage 2 of 3
Central Hudson Gas & Electric Corporation
Summary of Present and Proposed Electric Rates
Public Street and Highway Lighting
Service Classification No. 8 - P.S.C. No. 15
Customer Owned/Company Maintained
Present ProposedAnnual Annual Annual
Lumens Type kWh Base Rate Base Rate
Standard Lights
6,000 Induction 340 50.52$ 58.57$ 5,800 Sodium Vapor 344 57.61$ 66.79$
16,000 Sodium Vapor 720 74.10$ 85.90$ 27,000 Sodium Vapor 1,264 97.94$ 113.54$ 50,000 Sodium Vapor 1,984 129.94$ 150.64$
140,000 Sodium Vapor 4,656 254.27$ 294.77$ 14,000 Metal Halide 820 83.95$ 97.32$ 20,500 Metal Halide 1,200 101.46$ 117.62$ 36,000 Metal Halide 1,856 127.29$ 147.56$
110,000 Metal Halide 4,400 270.82$ 313.95$
Non-Standard Lights
9,500 Sodium Vapor 584 68.14$ 78.99$ 1,000 Incandescent 368 84.55$ 98.02$ 2,500 Incandescent 756 112.08$ 129.93$ 4,000 Incandescent 1,180 131.74$ 152.72$ 6,000 Incandescent 1,620 171.02$ 198.26$
10,000 Incandescent 2,480 208.74$ 241.99$ 7,000 Mercury Vapor 832 78.16$ 90.61$
11,000 Mercury Vapor 1,184 94.02$ 108.99$ 15,000 Mercury Vapor 1,820 126.13$ 146.22$ 20,000 Mercury Vapor 1,820 126.13$ 146.22$ 60,000 Mercury Vapor 4,320 237.01$ 274.76$
Present ProposedType Base Rate Base RatePre-attachment survey fee 9.29$ 10.77$ Annual pole rental (company sole owned) 7.27$ 8.43$ Annual pole rental (company joint owned) 3.62$ 4.20$
Other Charges

EXHIBIT ___(FRP-14)Schedule HPage 3 of 3
Central Hudson Gas & Electric Corporation
Summary of Present and Proposed Electric Rates
Public Street and Highway Lighting
Service Classification No. 8 - P.S.C. No. 15
Company Owned and Maintained
Present ProposedAnnual Annual Annual
Lumens Type kWh Base Rate Base Rate
Standard Lights
5,800 Sodium Vapor 344 25.59$ 29.67$ 9,500 Sodium Vapor 584 36.14$ 41.90$
16,000 Sodium Vapor 720 42.09$ 48.79$ 27,000 Sodium Vapor 1,264 65.96$ 76.47$ 50,000 Sodium Vapor 1,984 97.52$ 113.05$
140,000 Sodium Vapor 4,656 214.70$ 248.89$ 8,500 Metal Halide 520 33.33$ 38.64$
14,000 Metal Halide 820 46.50$ 53.91$ 20,500 Metal Halide 1,200 63.16$ 73.22$ 36,000 Metal Halide 1,856 91.90$ 106.54$
110,000 Metal Halide 4,400 203.49$ 235.90$
Non-Standard Lights
1,000 Incandescent 368 26.65$ 30.89$ 2,500 Incandescent 756 43.69$ 50.65$ 4,000 Incandescent 1,180 62.27$ 72.19$ 6,000 Incandescent 1,620 81.58$ 94.57$
3,600 Mercury Vapor 504 32.61$ 37.80$ 7,000 Mercury Vapor 832 47.01$ 54.50$
11,000 Mercury Vapor 1,184 62.46$ 72.41$ 20,000 Mercury Vapor 1,820 90.34$ 104.73$
60,000 Mercury Vapor 4,320 200.05$ 231.91$ 6,000 Induction 340 25.42$ 29.47$
Present ProposedType Base Rate Base RatePre-attachment survey fee 9.29$ 10.77$ Annual pole rental (company sole owned) 7.27$ 8.43$ Annual pole rental (company joint owned) 3.62$ 4.20$
Present ProposedType Base Rate Base RateStandard Company Pole (street lighting) 63.42$ 73.52$ Mastarms greater than 14' 35.82$ 41.53$ Fluted Decorative Fiberglass Pole 331.23$ 383.98$ Fiberglass Pole up to 20' (decorative lighting) 293.57$ 340.33$ Fiberglass Pole for Highway Setback 293.57$ 340.33$
(30' mounting height)Decorative Arm for Decorative Teardrop Lighting 140.98$ 163.43$
Public Street and Highway Lighting - Supporting Equipment
Other Charges

EXHIBIT ____(FRP -14)Schedule I
Monthly Charge 3.52$ Monthly Charge 4.30$
Monthly Energy Delivery Charge per kWh -$ Monthly Energy Delivery Charge per kWh -$
Minimum Monthly Charge: Minimum Monthly Charge:
The Customer Charge The Customer Charge
Present Rate Proposed Rate
Central Hudson Gas & Electric Corporation
Summary of Present and Proposed Electric Rates
Single Phase Residential Service
Service Classification No. 9 - P.S.C. No. 15

EXHIBIT ___(FRP-14)Schedule J
Monthly Charge- Substation 3,800.00$ Monthly Charge- Substation 1,970.00$ Transmission 5,020.00$ Transmission 5,725.00$
Monthly Energy Delivery Charge per kWh Monthly Energy Delivery Charge per kWh
Substation -$ Substation -$ Transmission -$ Transmission -$
Monthly Demand Delivery Charge Monthly Demand Delivery Charge
Basic Demand per kW Basic Demand per kW
Substation 7.49$ Substation 10.14$ Transmission 4.30$ Transmission 5.28$
Reactive Demand per Rkva 0.83$ Reactive Demand per Rkva* 0.83$
Minimum Monthly Charge: Minimum Monthly Charge:
The Customer Charge Plus Basic Demand Charge The Customer Charge Plus Basic Demand Charge
Present Rate Proposed Rate
Central Hudson Gas & Electric Corporation
Summary of Present and Proposed Electric Rates
Large Power Substation & Transmission Service
Service Classification No. 13 - P.S.C. No. 15

Exhibit__(FRP-15)
Central Hudson Gas & Electric Corporation
Summary of Present and Proposed Gas Rates
Schedule A Merchant Function Charges
Schedule B Residential ServiceService Classification Nos. 1 & 12
Commercial and Industrial ServiceService Classification Nos. 2, 6 & 13
Firm Transportation ServiceService Classification No. 11
TransmissionDistributionDistribution Large Mains (DLM)
Schedule C Gas Bill Credit

Exhibit__(FRP-15)Schedule A
MFC MFCMFC Applicable to Administration Supply MFC
Group S.C. No. Charge Charge Total
MFC-1 1, 12 & 16 0.00434$ 0.01297$ 0.01731$ MFC-2 2, 6, 13 & 15 0.00419$ 0.01251$ 0.01670$
Proposed Base MFC Rates
MFC Applicable to Total Deliveries MFC Admin MFC SupplyGroup S.C. No. MFC Supply MFC Admin Total MFC Mcf per Ccf per Ccf
MFC-1 1, 12 & 16 1,127,952$ 412,134$ 1,540,086$ 5,386,854 0.00765$ 0.02094$ MFC-2 2, 6, 13 & 15 1,427,745$ 521,672$ 1,949,417$ 6,842,598 0.00762$ 0.02087$
2,555,697$ 933,806$ 3,489,503$ 12,229,452 0.00764$ 0.02090$
($/Ccf)
Central Hudson Gas & Electric Corporation
Gas Commodity Related Merchant Function Charges
Present MFC Rates

Exhibit__(FRP-15)Schedule B
Central Hudson Gas & Electric Corporation
Summary of Present and Proposed Gas Rates
Residential Delivery ServiceService Classification Nos. 1 & 12 - P.S.C. No. 12
Present Rate - Monthly Charge Proposed Rate - Monthly Charge
Rate perCubic Feet 100 Cubic Feet Cubic Feet Rate per 100 Cubic Feet
200 or Less $26.00 200 or Less $30.00Next 4,800 $0.9904 Additional $0.9113Additional $0.4542
Commercial and Industrial Delivery ServiceService Classification Nos. 2, 6 & 13 - P.S.C. No. 12
Present Rate - Monthly Charge Proposed Rate - Monthly Charge
Rate perCubic Feet 100 Cubic Feet Cubic Feet Rate per 100 Cubic Feet
200 or Less $39.00 200 or Less $45.00Next 9,800 $0.5494 Additional $0.4151Next 490,000 $0.3262 Additional SC 6 High Volume $0.3759Additional $0.2656
Firm TransportationService Classification No. 11 - P.S.C. No. 12
Proposed Rate - Monthly Charge Proposed Rate - Monthly Charge
Transmission: Cubic Feet Rate per 100 Cubic Feet Transmission:(a) Annual x<300k Mcf 50,000 or Less $7,500
Additional $0.0298 Customer Charge $1,500.00(b) Annual 300k<x<800k Mcf 100,000 or Less $38,200 Mcf of MDQ $11.11
Additional $0.0447(c) Annual >800k Mcf 300,000 or Less $64,300
Additional $0.0391 Distribution:
Distribution: Customer Charge $1,500.00(a) Annual x<100k Mcf 40,000 or Less $7,500 Mcf of MDQ $23.45
Additional $0.0639(b) Annual x>=100k Mcf 70,000 or Less $17,200
Additional $0.0612 Distribution - Large Mains (DLM):
Distribution - Large Mains (DLM): 300,000 or Less $50,600 Customer Charge $1,500.00Additional $0.0599 Mcf of MDQ $17.70
Electric Generation: Customer Charge $1,200.00Mcf of MDQ $9.25

Exhibit__(FRP-15)Schedule C
Proposed Gas Bill Credit Rates
Total Rate Moderator CreditAdj Base Allocated on Adj Base
Applicable to Rate Increase Rate Increase Total Deliveries Total DeliveriesS.C. No. as % of System as % of System Mcf $/Ccf MDQ $/MDQ
1, 12 & 16 66.51% (6,696,833)$ 5,386,854 (0.12432)$ 2, 6, 13 & 15 30.71% (3,092,163)$ 6,818,598 (0.04535)$ SC 11 Transmission* 1.70% (171,171)$ 390,576 (0.44)$ SC 11 Distribution 0.11% (11,076)$ 4,236 (2.61)$ SC 11 - DLM 0.97% (97,668)$ 58,800 (1.66)$
100.00% (10,068,911)$
Total SC 11 EG CreditAllocated on
Applicable to Base Revenue Base Revenue Total Deliveries Total DeliveriesS.C. No. as % of System as % of System Mcf $/Ccf MDQ $/MDQ
1, 12 & 16 66.31% (703,968)$ 5,386,854 (0.01307)$ 2, 6, 13 & 15 30.93% (328,419)$ 6,818,598 (0.00482)$ SC 11 Transmission* 1.69% (17,958)$ 390,576 (0.05)$ SC 11 Distribution 0.11% (1,133)$ 4,236 (0.27)$ SC 11 - DLM 0.96% (10,221)$ 58,800 (0.17)$
100.00% (1,061,700)$
Total Gas Bill Credit Applicable to Total Deliveries Total Deliveries
S.C. No. Mcf $/Ccf MDQ $/MDQ1, 12 & 16 (7,400,801)$ 5,386,854 (0.13739)$ 2, 6, 13 & 15 (3,420,582)$ 6,818,598 (0.05017)$ SC 11 Transmission* (189,130)$ 390,576 (0.49)$ SC 11 Distribution (12,209)$ 4,236 (2.88)$ SC 11 - DLM (107,890)$ 58,800 (1.83)$
(11,130,611)$
*Includes both SC 11 EG customers for correct rate design.
Central Hudson Gas & Electric Corporation
Gas Bill Credit($/Ccf and $/MDQ)

Exhibit___(FRP-16)
Central Hudson Gas & Electric Corporation
Comparison of Present and Proposed Electric Bills
Schedule A Service Classification No. 1
Schedule B Service Classification No. 2Sheet 1 Non- DemandSheet 2 Secondary DemandSheet 3 Primary Demand
Schedule C Rates Utilized in Development of Typical Bills

S.C. No. 1 - Non Heating
20% Below 15% Below 10% Below 5% Below 5% Above 10% Above 15% Above 20% AboveAverage Average Average Average Average Average Average Average Average
kWh 450 480 500 530 560 590 620 640 670 Present Bill 94.89$ 99.57$ 102.70$ 107.39$ 112.07$ 116.76$ 121.45$ 124.58$ 129.26$
Proposed Bill w/out rate moderation 105.57$ 110.91$ 114.46$ 119.79$ 125.13$ 130.46$ 135.79$ 139.34$ 144.68$ $ Increase 10.69$ 11.33$ 11.76$ 12.41$ 13.05$ 13.70$ 14.34$ 14.77$ 15.41$
% Increase 11.26% 11.38% 11.45% 11.55% 11.64% 11.73% 11.81% 11.86% 11.92%
Proposed Bill w/rate moderation 101.83$ 106.91$ 110.30$ 115.38$ 120.47$ 125.55$ 130.63$ 134.02$ 139.10$ $ Increase 6.94$ 7.34$ 7.60$ 8.00$ 8.39$ 8.78$ 9.18$ 9.44$ 9.84$
% Increase 7.32% 7.37% 7.40% 7.45% 7.49% 7.52% 7.56% 7.58% 7.61%
S.C. No. 1 - Heating
20% Below 15% Below 10% Below 5% Below 5% Above 10% Above 15% Above 20% AboveAverage Average Average Average Average Average Average Average Average
kWh 720 770 810 860 900 950 990 1,040 1,080 Present Bill 137.08$ 144.89$ 151.14$ 158.95$ 165.20$ 173.02$ 179.27$ 187.08$ 193.33$
Proposed Bill w/out rate moderation 153.56$ 163.47$ 170.58$ 180.49$ 187.60$ 196.49$ 203.60$ 213.51$ 220.62$ $ Increase 16.49$ 18.58$ 19.44$ 21.54$ 22.40$ 23.47$ 24.33$ 26.43$ 27.29$
% Increase 12.03% 12.83% 12.86% 13.55% 13.56% 13.57% 13.57% 14.13% 14.12%
Proposed Bill w/rate moderation 147.57$ 157.07$ 163.84$ 173.34$ 180.11$ 188.58$ 195.36$ 204.86$ 211.63$ $ Increase 10.49$ 12.18$ 12.70$ 14.38$ 14.91$ 15.57$ 16.09$ 17.78$ 18.30$
% Increase 7.66% 8.40% 8.40% 9.05% 9.03% 9.00% 8.98% 9.50% 9.47%
See Exhibit__(FRP-16, Schedule C) for rates used in the development of these bills
Central Hudson Gas & Electric Corporation
Comparison of Present and Proposed Electric BillsE
XH
IBIT
__(FR
P-16)
Schedule A

S.C. No. 2 - Non Demand
20% Below 15% Below 10% Below 5% Below 5% Above 10% Above 15% Above 20% AboveAverage Average Average Average Average Average Average Average Average
kWh 340 370 390 410 430 450 470 490 520 Present Bill 76.35$ 79.92$ 82.31$ 84.69$ 87.07$ 89.46$ 91.84$ 94.22$ 97.80$
Proposed Bill w/out rate moderation 85.97$ 90.04$ 92.75$ 95.45$ 98.16$ 100.87$ 103.58$ 106.29$ 110.35$ $ Increase 9.63$ 10.11$ 10.44$ 10.76$ 11.09$ 11.41$ 11.74$ 12.07$ 12.55$
% Increase 12.61% 12.65% 12.68% 12.71% 12.74% 12.76% 12.78% 12.80% 12.84%
Proposed Bill w/rate moderation 83.05$ 86.86$ 89.39$ 91.93$ 94.47$ 97.00$ 99.54$ 102.08$ 105.88$ $ Increase 6.70$ 6.93$ 7.09$ 7.24$ 7.39$ 7.55$ 7.70$ 7.85$ 8.08$
% Increase 8.78% 8.67% 8.61% 8.55% 8.49% 8.43% 8.38% 8.33% 8.26%
See Exhibit__(FRP-16, Schedule C) for rates used in the development of these bills
Central Hudson Gas & Electric Corporation
Comparison of Present and Proposed Electric BillsE
XH
IBIT
__(FR
P-16)
Schedule B
Sheet 1 of 3

EXHIBIT___(FRP16)Schedule BSheet 2 of 3
S.C. No. 2 - Secondary Demand
kW 500 750 1,000 2,000 2,500 5,000 7,500 10,000 15,000 20,000 5Present Bill 177.90$ 200.67$ 223.44$ 314.52$ 360.06$
Proposed Bill 227.72$ 249.92$ 272.11$ 360.87$ 405.25$
EBC Reduction (1.52)$ (2.28)$ (3.04)$ (6.08)$ (7.60)$ Delivery Rate Increase 51.34$ 51.52$ 51.71$ 52.43$ 52.80$
Total $ Increase 49.82$ 49.24$ 48.67$ 46.35$ 45.20$ Total % Increase 28.01% 24.54% 21.78% 14.74% 12.55%
10Present Bill 224.28$ 247.04$ 269.81$ 360.89$ 406.43$
Proposed Bill 280.04$ 302.23$ 324.42$ 413.18$ 457.56$
EBC Reduction (1.52)$ (2.28)$ (3.04)$ (6.08)$ (7.60)$ Delivery Rate Increase 57.28$ 57.46$ 57.64$ 58.37$ 58.73$
$ Increase 55.76$ 55.18$ 54.60$ 52.29$ 51.13$ % Increase 24.86% 22.34% 20.24% 14.49% 12.58%
15Present Bill 316.19$ 407.27$ 452.80$ 680.50$ 908.20$
Proposed Bill 376.73$ 465.49$ 509.88$ 731.79$ 953.70$
EBC Reduction (3.04)$ (6.08)$ (7.60)$ (15.20)$ (22.80)$ Delivery Rate Increase 63.58$ 64.31$ 64.67$ 66.49$ 68.30$
$ Increase 60.54$ 58.23$ 57.07$ 51.29$ 45.50$ % Increase 19.15% 14.30% 12.60% 7.54% 5.01%
20Present Bill 453.64$ 499.18$ 726.87$ 954.57$ 1,182.26$
Proposed Bill 517.80$ 562.19$ 784.10$ 1,006.01$ 1,227.92$
EBC Reduction (6.08)$ (7.60)$ (15.20)$ (22.80)$ (30.40)$ Delivery Rate Increase 70.24$ 70.61$ 72.42$ 74.24$ 76.06$
$ Increase 64.16$ 63.01$ 57.22$ 51.44$ 45.66$ % Increase 14.14% 12.62% 7.87% 5.39% 3.86%
30Present Bill 591.92$ 819.62$ 1,047.32$ 1,275.01$ 1,730.40$
Proposed Bill 666.81$ 888.72$ 1,110.63$ 1,332.54$ 1,776.37$
EBC Reduction (7.60)$ (15.20)$ (22.80)$ (30.40)$ (45.60)$ Delivery Rate Increase 82.48$ 84.30$ 86.12$ 87.93$ 91.56$
$ Increase 74.88$ 69.10$ 63.32$ 57.53$ 45.96$ % Increase 12.65% 8.43% 6.05% 4.51% 2.66%
40Present Bill 912.37$ 1,140.06$ 1,367.76$ 1,823.15$ 2,278.54$
Proposed Bill 993.34$ 1,215.25$ 1,437.16$ 1,880.99$ 2,324.81$
EBC Reduction (15.20)$ (22.80)$ (30.40)$ (45.60)$ (60.80)$ Delivery Rate Increase 96.17$ 97.99$ 99.81$ 103.44$ 107.07$
$ Increase 80.97$ 75.19$ 69.41$ 57.84$ 46.27$ % Increase 8.88% 6.60% 5.07% 3.17% 2.03%
50Present Bill 1,005.11$ 1,232.81$ 1,460.50$ 1,915.89$ 2,371.29$
Proposed Bill 1,097.96$ 1,319.87$ 1,541.78$ 1,985.61$ 2,429.43$
EBC Reduction (15.20)$ (22.80)$ (30.40)$ (45.60)$ (60.80)$ Delivery Rate Increase 108.05$ 109.86$ 111.68$ 115.31$ 118.95$
$ Increase 92.85$ 87.06$ 81.28$ 69.71$ 58.15$ % Increase 9.24% 7.06% 5.57% 3.64% 2.45%
100Present Bill 1,468.84$ 1,696.54$ 1,924.23$ 2,379.62$ 2,835.02$
Proposed Bill 1,621.06$ 1,842.98$ 2,064.89$ 2,508.71$ 2,952.54$
EBC Reduction (15.20)$ (22.80)$ (30.40)$ (45.60)$ (60.80)$ Delivery Rate Increase 167.42$ 169.24$ 171.05$ 174.69$ 178.32$
$ Increase 152.22$ 146.44$ 140.65$ 129.09$ 117.52$ % Increase 10.36% 8.63% 7.31% 5.42% 4.15%
See Exhibit__(FRP-16, Schedule C) for rates used in the development of these bills
kWh
Central Hudson Gas & Electric CorporationComparison of Present and Proposed Electric Bills

EXHIBIT___(FRP16)Schedule BSheet 3 of 3
S.C. No. 2 - Primary Demand
kW 500 750 1,000 2,000 2,500 5,000 7,500 10,000 15,000 20,000 5Present Bill 397.13$ 417.46$ 437.80$ 519.16$ 559.83$
Proposed Bill 386.12$ 406.12$ 426.12$ 506.14$ 546.14$
EBC Reduction (0.87)$ (1.30)$ (1.73)$ (3.46)$ (4.33)$ Delivery Rate Increase (10.14)$ (10.05)$ (9.95)$ (9.56)$ (9.36)$
Total $ Increase (11.01)$ (11.35)$ (11.68)$ (13.02)$ (13.69)$ Total % Increase -2.77% -2.72% -2.67% -2.51% -2.45%
10Present Bill 436.23$ 456.57$ 476.91$ 558.26$ 598.94$
Proposed Bill 435.36$ 455.36$ 475.36$ 555.37$ 595.38$
EBC Reduction (0.87)$ (1.30)$ (1.73)$ (3.46)$ (4.33)$ Delivery Rate Increase (0.01)$ 0.09$ 0.18$ 0.57$ 0.77$
Total $ Increase (0.88)$ (1.21)$ (1.55)$ (2.89)$ (3.56)$ Total % Increase -0.20% -0.27% -0.32% -0.52% -0.59%
15Present Bill 516.01$ 597.37$ 638.04$ 841.43$ 1,044.82$
Proposed Bill 524.60$ 604.61$ 644.62$ 844.65$ 1,044.69$
EBC Reduction (1.73)$ (3.46)$ (4.33)$ (8.65)$ (12.98)$ Delivery Rate Increase 10.32$ 10.71$ 10.91$ 11.87$ 12.85$
Total $ Increase 8.59$ 7.25$ 6.58$ 3.22$ (0.13)$ Total % Increase 1.66% 1.21% 1.03% 0.38% -0.01%
20Present Bill 636.47$ 677.15$ 880.53$ 1,083.92$ 1,287.31$
Proposed Bill 653.85$ 693.86$ 893.89$ 1,093.93$ 1,293.96$
EBC Reduction (3.46)$ (4.33)$ (8.65)$ (12.98)$ (17.30)$ Delivery Rate Increase 20.84$ 21.04$ 22.01$ 22.99$ 23.95$
Total $ Increase 17.38$ 16.71$ 13.36$ 10.01$ 6.65$ Total % Increase 2.73% 2.47% 1.52% 0.92% 0.52%
30Present Bill 755.36$ 958.74$ 1,162.13$ 1,365.52$ 1,772.29$
Proposed Bill 792.34$ 992.37$ 1,192.41$ 1,392.44$ 1,792.51$
EBC Reduction (4.33)$ (8.65)$ (12.98)$ (17.30)$ (25.95)$ Delivery Rate Increase 41.31$ 42.28$ 43.26$ 44.22$ 46.17$
Total $ Increase 36.98$ 33.63$ 30.28$ 26.92$ 20.22$ Total % Increase 4.90% 3.51% 2.61% 1.97% 1.14%
40Present Bill 1,036.95$ 1,240.34$ 1,443.73$ 1,850.50$ 2,257.27$
Proposed Bill 1,090.85$ 1,290.88$ 1,490.92$ 1,890.98$ 2,291.05$
EBC Reduction (8.65)$ (12.98)$ (17.30)$ (25.95)$ (34.60)$ Delivery Rate Increase 62.55$ 63.52$ 64.49$ 66.44$ 68.38$
Total $ Increase 53.90$ 50.54$ 47.19$ 40.49$ 33.78$ Total % Increase 5.20% 4.08% 3.27% 2.19% 1.50%
50Present Bill 1,115.16$ 1,318.55$ 1,521.94$ 1,928.71$ 2,335.48$
Proposed Bill 1,189.33$ 1,389.36$ 1,589.40$ 1,989.46$ 2,389.53$
EBC Reduction (8.65)$ (12.98)$ (17.30)$ (25.95)$ (34.60)$ Delivery Rate Increase 82.82$ 83.79$ 84.76$ 86.71$ 88.65$
Total $ Increase 74.17$ 70.81$ 67.46$ 60.76$ 54.05$ Total % Increase 6.65% 5.37% 4.43% 3.15% 2.31%
100Present Bill 1,506.21$ 1,709.60$ 1,912.98$ 2,319.76$ 2,726.53$
Proposed Bill 1,681.72$ 1,881.76$ 2,081.79$ 2,481.86$ 2,881.92$
EBC Reduction (8.65)$ (12.98)$ (17.30)$ (25.95)$ (34.60)$ Delivery Rate Increase 184.16$ 185.14$ 186.11$ 188.05$ 190.00$
Total $ Increase 175.51$ 172.16$ 168.81$ 162.10$ 155.40$ Total % Increase 11.65% 10.07% 8.82% 6.99% 5.70%
See Exhibit__(FRP-16, Schedule C) for rates used in the development of these bills
kWh
Central Hudson Gas & Electric CorporationComparison of Present and Proposed Electric Bills

EXHIBIT__(FRP-16)Schedule C
Rates as of July 12, 2017
SC 1 SC 2 ND SC 2 SD SC 2 PDMarket Price Charge 0.06633$ 0.06633$ 0.06633$ $0.06567Market Price Adjustment 0.01090$ 0.01090$ 0.01090$ $0.00652Purchased Power Adjustment -$ -$ -$ -$ Miscellaneous Charges (0.00225)$ (0.00230)$ (0.00250)$ (0.00250)$ System Benefits Charge* 0.00900$ 0.00900$ 0.00900$ 0.00900$ MFC Admin Charge 0.00163$ 0.00230$ 0.00011$ 0.00001$ MFC Supply Charge 0.00257$ 0.00440$ 0.00036$ 0.00003$ MFC Transition Adjustment 0.00017$ 0.00077$ 0.00008$ 0.00001$ New York State Assessment* 0.00067$ 0.00043$ 0.00043$ 0.00058$ Electric Bill Credit (0.00073)$ (0.00093)$ (0.00015)$ (0.00013)$
Weighted Revenue Tax - Commodity 0.314% 0.314% 0.314% 0.314%Weighted Revenue Tax - Delivery 2.314% 2.314% 2.314% 2.314%
MFC Admin Charge - Proposed 0.00192$ 0.00264$ 0.00013$ 0.00001$ MFC Supply Charge - Proposed** 0.00344$ 0.00554$ 0.00041$ 0.00004$ Electric Bill Credit - Proposed (0.00813)$ (0.00840)$ (0.00319)$ (0.00186)$
*In order to only show the impact of base rate increases, bills under proposed rates do not reflect changes to the SBC, EEPS, RPS or NYSA. These items have been included at current rates but are subject to change.
**The MFC Supply Charge includes 50 percent of forecast net lost revenues associated with customer migrationand therefore is subject to change each year based on the calculation of actual net lost revenues. Currentallocation of MFC Lost Revenue Charge included in Proposed MFC Supply.
Central Hudson Gas & Electric Corporation
Comparison of Present and Proposed Electric Rates
Rates Utilized in Development of Typical Bills
Exhibit__(FRP-17)
Central Hudson Gas & Electric Corporation
Comparison of Gas Bills Under Present and Proposed Rates
Schedule A Service Classification Nos. 1 & 12
Schedule B Service Classification Nos. 2, 6 & 13

Exhibit__(FRP-17)Schedule A
MonthlyUsage Present Proposed RY 1 Delivery % Additional Gas Proposed RY 1 Delivery
Ccf Monthly Bill Monthly Bill $ Increase Increase Bill Credit Monthly Bill $ Increase % Increase2 27.84$ 31.97$ 4.13$ 14.82% (0.26)$ 31.72$ 3.87$ 13.91%4 31.04 35.02$ 3.99 12.85% (0.51) 34.51 3.48 11.20%6 34.23 38.08$ 3.85 11.24% (0.77) 37.31 3.08 9.01%8 37.42 41.13$ 3.71 9.91% (1.02) 40.11 2.69 7.18%
10 40.62 44.18$ 3.57 8.79% (1.28) 42.91 2.29 5.64%15 48.60 51.82$ 3.22 6.62% (1.91) 49.90 1.31 2.69%20 56.58 59.45$ 2.87 5.07% (2.55) 56.90 0.32 0.56%25 64.56 67.08$ 2.52 3.90% (3.19) 63.89 (0.67) -1.04%30 72.55 74.72$ 2.17 2.99% (3.83) 70.89 (1.66) -2.28%35 80.53 82.35$ 1.82 2.26% (4.47) 77.88 (2.64) -3.28%40 88.51 89.98$ 1.47 1.66% (5.10) 84.88 (3.63) -4.10%50 104.48 105.25$ 0.77 0.74% (6.38) 98.87 (5.61) -5.37%60 114.94 120.52$ 5.58 4.85% (7.66) 112.86 (2.08) -1.81%80 135.86 151.05$ 15.18 11.18% (10.21) 140.84 4.98 3.66%
100 156.79 181.58$ 24.79 15.81% (12.76) 168.82 12.03 7.67%130 188.18 227.38$ 39.20 20.83% (16.59) 210.79 22.62 12.02%170 230.03 288.44$ 58.42 25.40% (21.69) 266.75 36.73 15.97%200 261.41 334.24$ 72.83 27.86% (25.52) 308.73 47.31 18.10%300 366.04 486.91$ 120.87 33.02% (38.28) 448.63 82.59 22.56%
1000 1,098.40 1,555.54$ 457.14 41.62% (127.59) 1,427.96 329.55 30.00%
Average Annual Heating Customer @ 830 Ccf Per Year830 1,404.66 1,614.11 209.46 14.91% (105.90) 1,508.22 103.56 7.37%
Weighted Revenue Tax Factor: Delivery 0.02560 Commodity 0.00560
Gas Supply Charge (per Ccf): 0.53670$
New York State Assessment Surcharge (per Ccf): 0.01166$
System Benefits Charge (per Ccf): 0.01814$
Present Proposed RY 1S.C. No. 1 & 12 Base Delivery Rates
Block 1 First 2 Ccf 26.00$ 30.00$ Block 2 per Ccf Next 48 Ccf 0.9904$ 0.9113$ Block 3 per Ccf Additional 0.4542$ 0.9113$
Merchant Function Charge (per Ccf): MFC Admin 0.00434$ 0.00765$ MFC Supply 0.01297$ 0.02094$ Transition Adj. 0.00502$ 0.00502$
SC 11 EG Gas Bill Credit (per Ccf): (0.01278)$ (0.01307)$ Rate Moderation Gas Bill Credit (per Ccf): -$ (0.12432)$
Gas Bill Credit (per Ccf): (0.01278)$ (0.13739)$
In order to only show the impact of base rate increases, annual bills under proposed rates do not reflect annual changes to the SBC, NYSA, and GSC. NYSA, GSC and SBC have been included at July 1, 2017 rates.Proposed Transition Adj. Rate reflects current Transition Adj. Rate.
P.S.C. No. 12 - GasService Classification Nos. 1 & 12
Comparison of Gas Bills Under Present and Proposed RatesCentral Hudson Gas & Electric Corporation
Rate Year 1 (Twelve Months Ended June 30, 2019)
With Additional Rate ModerationSC 11 EG Gas Bill Credit Only

Exhibit__(FRP-17)Schedule B
Central Hudson Gas & Electric CorporationComparison of Gas Bills Under Present and Proposed Rates
MonthlyUsage Present Proposed RY 1 Delivery % Additional Gas Proposed RY 1 Delivery
Ccf Monthly Bill Monthly Bill $ Increase Increase Bill Credit Monthly Bill $ Increase % Increase2 40.40$ 46.46$ 6.06$ 14.99% (0.09)$ 46.37$ 5.97$ 14.77%
10 49.54 54.61 5.07 10.24% (0.46) 54.15 4.62 9.32%30 72.38 74.99 2.61 3.61% (1.37) 73.62 1.24 1.72%50 95.22 95.37 0.15 0.16% (2.28) 93.09 (2.13) -2.24%
100 152.32 146.32 (6.00) -3.94% (4.56) 141.76 (10.56) -6.94%150 198.20 197.27 (0.93) -0.47% (6.84) 190.43 (7.77) -3.92%200 244.08 248.22 4.14 1.69% (9.12) 239.10 (4.99) -2.04%250 289.96 299.17 9.21 3.17% (11.40) 287.77 (2.20) -0.76%300 335.84 350.12 14.27 4.25% (13.68) 336.44 0.59 0.18%400 427.60 452.02 24.41 5.71% (18.24) 433.77 6.17 1.44%500 519.36 553.92 34.55 6.65% (22.80) 531.11 11.75 2.26%600 611.13 655.82 44.69 7.31% (27.36) 628.45 17.33 2.84%800 794.65 859.62 64.97 8.18% (36.48) 823.13 28.48 3.58%
1000 978.17 1,063.41 85.25 8.71% (45.61) 1,017.81 39.64 4.05%1500 1,436.97 1,572.91 135.94 9.46% (68.41) 1,504.51 67.53 4.70%2000 1,895.78 2,082.41 186.63 9.84% (91.21) 1,991.20 95.42 5.03%3000 2,813.39 3,101.41 288.02 10.24% (136.82) 2,964.59 151.21 5.37%5000 4,648.60 5,139.40 490.80 10.56% (228.03) 4,911.37 262.77 5.65%7500 6,790.27 7,686.89 896.62 13.20% (342.04) 7,344.85 554.58 8.17%
10000 8,931.94 10,234.38 1,302.44 14.58% (456.05) 9,778.33 846.39 9.48%12000 10,645.27 12,272.38 1,627.10 15.28% (547.26) 11,725.11 1,079.84 10.14%14000 12,358.61 14,310.37 1,951.76 15.79% (638.48) 13,671.89 1,313.28 10.63%16000 14,071.94 16,348.36 2,276.42 16.18% (729.69) 15,618.67 1,546.73 10.99%20000 17,498.61 20,424.35 2,925.73 16.72% (912.11) 19,512.24 2,013.62 11.51%
Average Annual Heating Customer @ 5700 Ccf Per Year5700 5,957.09 6,341.30 384.21 6.45% (259.95) 6,081.35 124.26 2.09%
Weighted Revenue Tax Factor: Delivery 0.00560 Commodity 0.00560
Gas Supply Charge (per Ccf): 0.53670$
New York State Assessment Surcharge (per Ccf): 0.00407$
System Benefits Charge (per Ccf): 0.00791$
Present Proposed RY 1S.C. No. 2, 6 & 13 Base Delivery Rates
Block 1 First 2 Ccf 39.00$ 45.00$ Block 2 per Ccf Next 98 Ccf 0.5494$ 0.4151$ Block 3 per Ccf Next 4900 Ccf 0.3262$ 0.4151$ Block 4 per Ccf Additional 0.2656$ 0.4151$
Merchant Function Charge (per Ccf): MFC Admin 0.00419$ 0.00762$ MFC Supply 0.01251$ 0.02087$ Transition Adj. 0.02584$ 0.02584$
SC 11 EG Gas Bill Credit (per Ccf): (0.00495)$ (0.00482)$ Rate Moderation Gas Bill Credit (per Ccf): -$ (0.04535)$
Gas Bill Credit (per Ccf): (0.00495)$ (0.05017)$
In order to only show the impact of base rate increases, annual bills under proposed rates do not reflect annual changes to the SBC, NYSA, and GSC. NYSA, GSC and SBC have been included at July 1, 2017 rates.Proposed Transition Adj. Rate reflects current Transition Adj. Rate.
Rate Year 1 (Twelve Months Ended June 30, 2019)
P.S.C. No. 12 - Gas
SC 11 EG Gas Bill Credit Only With Additional Rate Moderation
Service Classification Nos. 2, 6 & 13