cardiopatia iskemica
TRANSCRIPT

8/8/2019 cardiopatia iskemica
http://slidepdf.com/reader/full/cardiopatia-iskemica 1/10
Circulation Journal Vol.74, June 2010
Circulation Journal
Ofcial Journal o the Japanese Circulation Society
http://www.j-circ.or.jp
t is now widely accepted that the incidence o secondarycardiovascular events can be signicantly reduced bytherapy with statins in patients with acute coronary
syndrome (ACS).1–3 Although the exact pathophysiologicalmechanism has not yet been claried, several attempts have
been made, including using intravascular imaging modalities,to directly or indirectly evaluate the improvement in theplaque vulnerability with statin therapy.4–7
Received October 8, 2009; revised manuscript received February 15, 2010; accepted February 16, 2010; released online May 12, 2010Time or primary review: 46 days
Division o Cardiology, Department o Medicine, Nihon University School o Medicine, †Department o Cardiology, Juntendo UniversitySchool o Medicine, §§Division o Cardiovascular Medicine, Keiai Hospital, ¶Toranomon Hospital, Tokyo, *Department o CardiovascularMedicine, **Center or Medical Education, Kyoto University Graduate School o Medicine, Kyoto, ††Department o Cardiology, TenriHospital, Tenri, ‡Division o Cardiovascular Medicine, Kanazawa University Graduate School o Medicine, Kanazawa, ‡‡Department o Cardiology, Fujita Health University, Toyoake, §Division o Cardiology, Yokohama City University Medical Center, Yokohama and ¶¶Division o Cardiology, Department o Medicine and Clinical Science, Yamaguchi University Graduate School o Medicine, Ube, Japan
The Japan Heart Foundation unded this study with an unrestricted grant rom Kowa Pharmaceutical. Kowa Pharmaceutical participatedin the preparation o the study design, but the investigators or an independent Clinical Research Coordinator (see Acknowledgment)made the nal decision on the study design, database maintenance, made manuscript, and submission o the article; an independentstatistician (see Appendix 1) analyzed the data.
Trial Registration: ClinicalTrials.gov Identier: NCT002429; http://clinicaltrials.gov/ct2/show/NCT00242944
Mailing address: Masunori Matsuzaki, MD, Division o Cardiology, Department o Medicine and Clinical Science, Yamaguchi UniversityGraduate School o Medicine, Ube 755-8505, Japan. E-mail: [email protected]
ISSN-1346-9843 doi: 10.1253/circj.CJ-09-0766
All rights are reserved to the Japanese Circulation Society. For permissions, please e-mail: [email protected]
Diabetes Mellitus Is a Major Negative Determinantof Coronary Plaque Regression During Statin Therapy
in Patients With Acute Coronary Syndrome
– Serial Intravascular Ultrasound Observations From the JapanAssessment o Pitavastatin and Atorvastatin
in Acute Coronary Syndrome Trial (the JAPAN-ACS Trial) –
Takaumi Hiro, MD; Takeshi Kimura, MD*; Takeshi Morimoto, MD**; Katsumi Miyauchi, MD†;
Yoshihisa Nakagawa, MD††; Masakazu Yamagishi, MD‡; Yukio Ozaki, MD‡‡; Kazuo Kimura, MD§;
Satoshi Saito, MD§§; Tetsu Yamaguchi, MD ¶; Hiroyuki Daida, MD†; Masunori Matsuzaki, MD ¶¶
or the JAPAN-ACS Investigators
Background: The Japan Assessment o Pitavastatin and Atorvastatin in Acute Coronary Syndrome (JAPAN-
ACS) trial has ound that early aggressive statin therapy in patients with acute coronary syndrome (ACS) signi-cantly reduces the plaque volume (PV) o non-culprit coronary lesions. The purpose o the present study was to
evaluate clinical actors that have an impact on plaque regression using statin therapy.
Methods and Results: Serial intravascular ultrasound observations over 8–12 months were perormed in 252
ACS patients receiving pitavastatin or atorvastatin. Linear regression analysis identied the presence o diabetes
mellitus (DM) and PV at baseline as inhibiting actors, and serum remnant-like particle-cholesterol level at baseline
as a signicant actor signicantly aecting the degree o plaque regression. Signicant correlation between %
change o PV and low-density lipoprotein cholesterol (LDL-C) level was ound in patients with DM (n=73, P<0.05,
r=0.4), whereas there was no signicant correlation between the 2 parameters in patients without DM (n=178).
Conclusions: The regression o coronary plaque induced by statin therapy ater ACS was weaker in diabetic
patients than their counterparts. Moreover, vigorous reduction o the LDL-C levels might induce a greater degree
o plaque regression in ACS patients with DM. (Circ J 2010; 74: 1165 – 1174)
Key Words: Acute coronary syndrome; Diabetes mellitus; Intravascular ultrasound; Plaque; Statins
I
ORIGINAL ARTICLE
Ischemic Heart Disease
8/8/2019 cardiopatia iskemica
http://slidepdf.com/reader/full/cardiopatia-iskemica 2/10
1166
Circulation Journal Vol.74, June 2010
HIRO T et al.
Editorial p 1073
The Japan Assessment o Pitavastatin and Atorvastatinin Acute Coronary Syndrome (JAPAN-ACS) study was per-ormed as a prospective, randomized open-label parallel-group study with a blind endpoint evaluation at 33 centers, tocomparatively examine the eect o 8–12-months’ treatmentwith pitavastatin and atorvastatin on the degree o coronaryplaque regression in non-culprit lesions o the culprit vesseltreated by PCI in patients with ACS.8 The results o thisanalysis demonstrated the non-ineriority o pitavastatin4 mg/day to atorvastatin 20 mg/day, with an approximately17% regression o the plaque volume (PV), suggesting thatthe eect o inducing plaque regression can be generalized toother statins. The degree o this eect varied widely amongpatients, regardless o the baseline low-density lipoproteincholesterol (LDL-C) level, and it would be important toclariy its critical determinants. Previous studies have docu-mented several determinants o the degree o plaque progres-sion/regression in patients with stable coronary artery disease,such as gender,9 blood pressure,10 obesity,11 and use/non-useo β-blockers.12 The major baseline determinants o the degreeo plaque regression have not, however, yet been determinedin patients with ACS.
The purpose o the present sub-analysis o the JAPAN-ACS study was thereore to identiy the major baseline deter-minants o the degree o plaque regression in ACS patientsunder treatment with statins, on multivariate analysis. Thebaseline parameters examined included the clinical patientcharacteristics, serum lipid prole, concomitantly adminis-tered drugs, intravascular ultrasound (IVUS) parameters, andpresence/absence o underlying diseases, such as diabetesmellitus (DM). This study was perormed in the entire patientpopulation, using the ull analysis set, o the JAPAN-ACSstudy, because the regressive eect o the 2 statins was shownto be equivalent in that study.8
Methods
Study Subjects and Ethics ConsiderationsThe present study was a sub-analysis o the JAPAN-ACSstudy.8 Description o the present study design is publishedelsewhere.13 In brie, ACS patients selected were >20 years
o age with hypercholesterolemia and had undergone suc-cessul PCI under IVUS guidance. They were ound to havecoronary plaques (>500μm in thickness, or percent plaquearea ≥20%) in the culprit vessel at least 5 mm away rom thePCI-treated lesions. ACS was dened as unstable angina pec-toris, non-ST-elevation myocardial inarction (MI) or ST-elevation MI. The diagnosis o ACS was made based on theulllment o at least 2 o the ollowing three criteria: (1)evidence o coronary ischemia on ECG; (2) increase (≥2-old)
in the serum creatinine kinase (CK) or CK-MB levels and/ortroponin-T positivity; and (3) presence o symptoms sugges-tive o ACS. DM and other complications were diagnosedby the attending physicians.
The study was conducted in conormity with the princi-ples o the Declaration o Helsinki, and with the approval o the institutional review boards o all o the 33 participatinginstitutions. Written inormed consent or participation wasobtained rom all o the patients enrolled.
IVUS Procedure and ExaminationDetails o the IVUS procedure and examination are docu-mented elsewhere.8 In brie, ollowing IVUS-guided PCIor the culprit lesion in the patients with ACS, a nal IVUSexamination or analysis was perormed in the culprit ves-sel. The IVUS catheter Atlantis SR Pro2 (Boston Scientic,Natick, MA, USA) was used, and a motorized pullback device withdrew the transducer at the speed o 0.5 mm/s.The consoles used were the ClearView or Galaxy 2 system(Boston Scientic). The same imaging system with the sametype o IVUS catheter was used or both the baseline and theollow-up examinations.
Two independent experienced investigators perormed thequantitative IVUS analysis at the central core-laboratory. Thetarget segment or analysis was identied at a non-PCI site o the culprit vessel (>5 mm proximal or distal to the PCI site)based on some reproducible indices. Manual tracing was per-ormed in every 0.1-mm cross-section and the sotware(echoPlaque2, INDEC systems, Santa Clara, USA) auto-matically interpolated the tracings o 5 cross-sections between2 manually traced images. Thereore, the volume was calcu-lated rom each o the 0.017-mm-apart segments.
IVUS ParametersThe primary endpoint o the JAPAN-ACS study was the per-cent change in coronary PV, which was calculated as ollows:
PV (ollow up) – PV (baseline)—————————————×100
PV (baseline)
Coronary PV was calculated using the sum o the dierencesbetween the external elastic membrane (EEM) cross-sectionalarea (CSA) and the lumen CSA across all evaluated ramesas: PV=∑(EEMCSA–LUMENCSA)× (slice thickness).
The major secondary endpoints were the nominal change o the percent PV (%PV) and nominal change o the normalizedPV (NPV; ollow-up PV minus baseline PV, respectively).The %PV was calculated using the ollowing ormula:
∑ (EEMCSA – LUMENCSA)%PV = ——————————— ×100
∑ (EEMCSA)
NPV was calculated as:
LMEDNPV = PV× ————
LMEASURED
where LMED=the median value o observed length in all sub- jects and LMEAURED= observed length or each plaque.
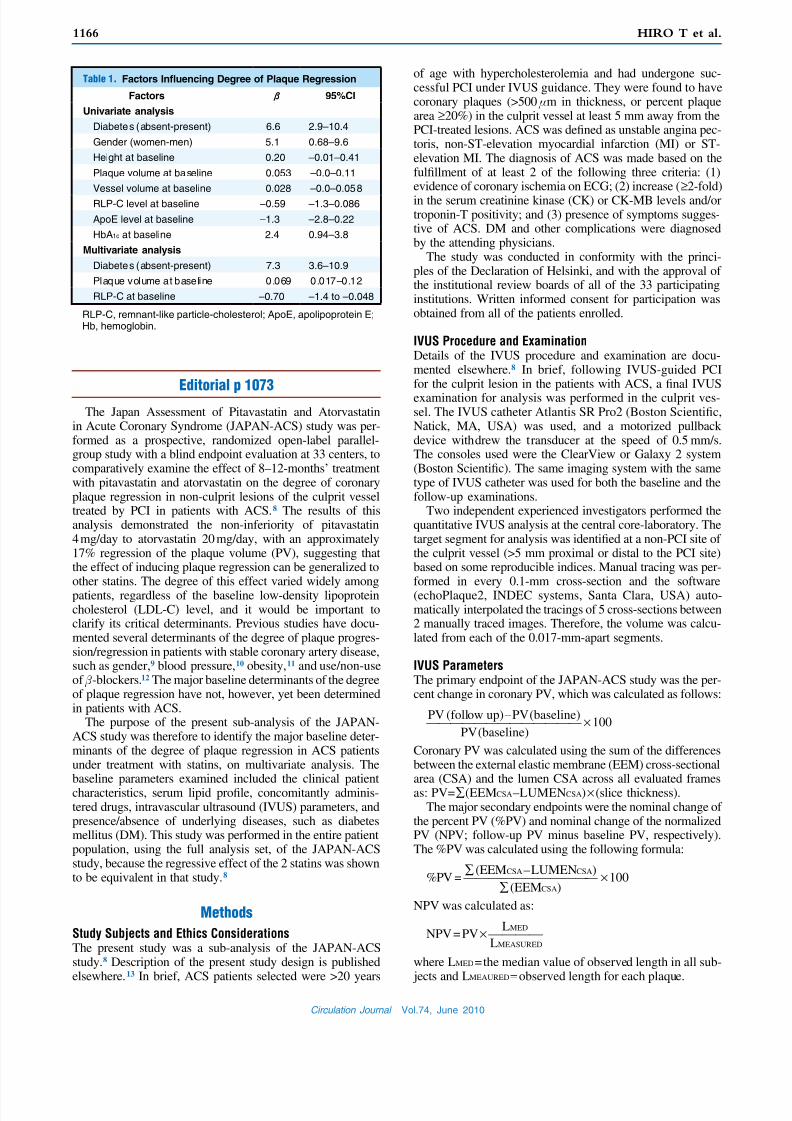
Table 1. Factors Infuencing Degree o Plaque Regression
Factors β 95%CI
Univariate analysis
Diabetes (absent-present) 6.6 2.9–10.4
Gender (women-men) 5.1 0.68–9.6
Height at baseline 0.20 –0.01–0.41
Plaque volume at baseline 0.053 –0.0–0.11
Vessel volume at baseline 0.028 –0.0–0.058
RLP-C level at baseline –0.59 –1.3–0.086
ApoE level at baseline –1.3 –2.8–0.22
HbA1c at baseline 2.4 0.94–3.8
Multivariate analysis
Diabetes (absent-present) 7.3 3.6–10.9
Plaque volume at baseline 0.069 0.017–0.12
RLP-C at baseline –0.70 –1.4 to –0.048
RLP-C, remnant-like particle-cholesterol; ApoE, apolipoprotein E;Hb, hemoglobin.
8/8/2019 cardiopatia iskemica
http://slidepdf.com/reader/full/cardiopatia-iskemica 3/10
1167
Circulation Journal Vol.74, June 2010
Diabetes and Plaque Regression in Japan-ACS Trial
Statistical AnalysisWe used the ull analysis set (FAS) o the JAPAN-ACS studyor this sub-analysis. Patients were included in the FAS i they had ACS and measurable IVUS lesions both at enroll-
ment and at ollow up. To identiy the actors that mightinfuence the % change o the coronary PV, we rst dened83 variables at baseline as potential actors (Appendix 2). Wedeveloped a univariate and multivariate general linear model
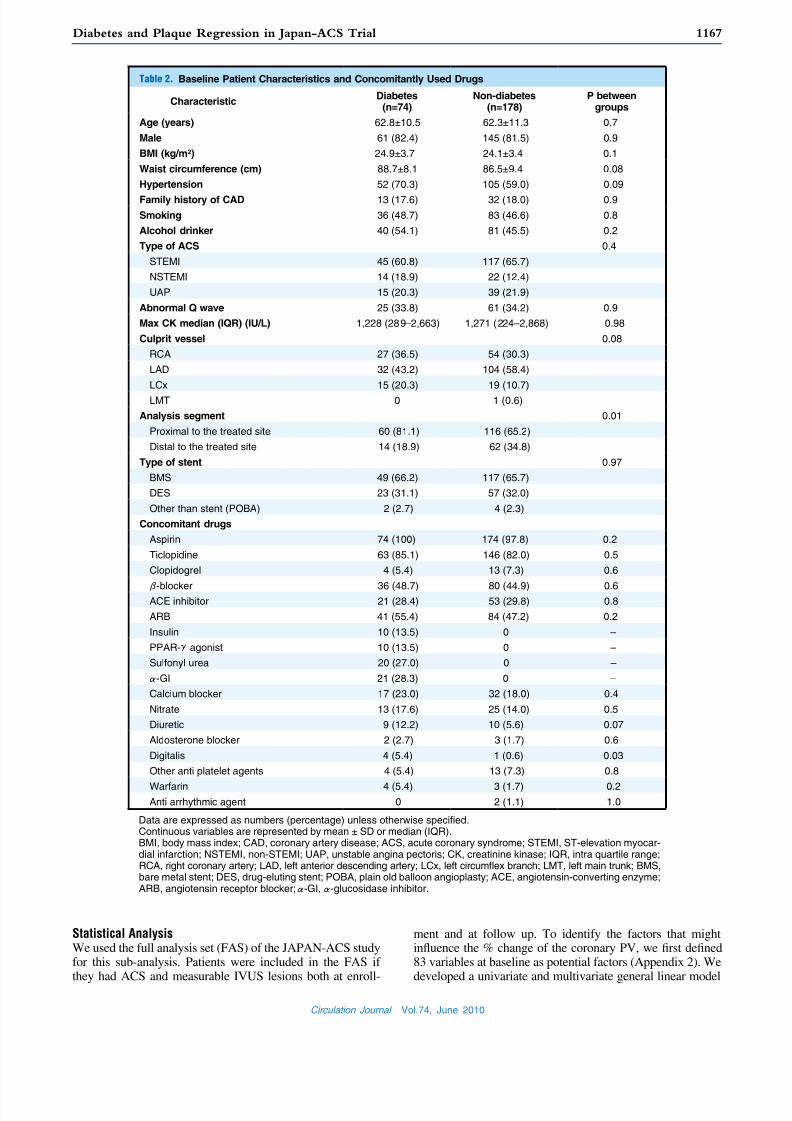
Table 2. Baseline Patient Characteristics and Concomitantly Used Drugs
CharacteristicDiabetes
(n=74)Non-diabetes
(n=178)P between
groups
Age (years) 62.8±10.5 62.3±11.3 0.7
Male 61 (82.4) 145 (81.5) 0.9
BMI (kg/m2) 24.9±3.7 24.1±3.4 0.1
Waist circumerence (cm) 88.7±8.1 86.5±9.4 0.08
Hypertension 52 (70.3) 105 (59.0) 0.09
Family history o CAD 13 (17.6) 32 (18.0) 0.9
Smoking 36 (48.7) 83 (46.6) 0.8
Alcohol drinker 40 (54.1) 81 (45.5) 0.2
Type o ACS 0.4
STEMI 45 (60.8) 117 (65.7)
NSTEMI 14 (18.9) 22 (12.4)
UAP 15 (20.3) 39 (21.9)
Abnormal Q wave 25 (33.8) 61 (34.2) 0.9
Max CK median (IQR) (IU/L) 1,228 (289–2,663) 1,271 (224–2,868) 0.98
Culprit vessel 0.08
RCA 27 (36.5) 54 (30.3)
LAD 32 (43.2) 104 (58.4)
LCx 15 (20.3) 19 (10.7)
LMT 0 1 (0.6)
Analysis segment 0.01
Proximal to the treated site 60 (81.1) 116 (65.2)
Distal to the treated site 14 (18.9) 62 (34.8)
Type o stent 0.97
BMS 49 (66.2) 117 (65.7)
DES 23 (31.1) 57 (32.0)
Other than stent (POBA) 2 (2.7) 4 (2.3)
Concomitant drugs
Aspirin 74 (100) 174 (97.8) 0.2
Ticlopidine 63 (85.1) 146 (82.0) 0.5
Clopidogrel 4 (5.4) 13 (7.3) 0.6
β-blocker 36 (48.7) 80 (44.9) 0.6ACE inhibitor 21 (28.4) 53 (29.8) 0.8
ARB 41 (55.4) 84 (47.2) 0.2
Insulin 10 (13.5) 0 –
PPAR-γagonist 10 (13.5) 0 –
Sulonyl urea 20 (27.0) 0 –
α-GI 21 (28.3) 0 –
Calcium blocker 17 (23.0) 32 (18.0) 0.4
Nitrate 13 (17.6) 25 (14.0) 0.5
Diuretic 9 (12.2) 10 (5.6) 0.07
Aldosterone blocker 2 (2.7) 3 (1.7) 0.6
Digitalis 4 (5.4) 1 (0.6) 0.03
Other anti platelet agents 4 (5.4) 13 (7.3) 0.8
Wararin 4 (5.4) 3 (1.7) 0.2Anti arrhythmic agent 0 2 (1.1) 1.0
Data are expressed as numbers (percentage) unless otherwise specied.Continuous variables are represented by mean ± SD or median (IQR).BMI, body mass index; CAD, coronary artery disease; ACS, acute coronary syndrome; STEMI, ST-elevation myocar-dial inarction; NSTEMI, non-STEMI; UAP, unstable angina pectoris; CK, creatinine kinase; IQR, intra quartile range;RCA, right coronary artery; LAD, let anterior descending artery; LCx, let circumfex branch; LMT, let main trunk; BMS,bare metal stent; DES, drug-eluting stent; POBA, plain old balloon angioplasty; ACE, angiotensin-converting enzyme;ARB, angiotensin receptor blocker;α-GI,α-glucosidase inhibitor.

8/8/2019 cardiopatia iskemica
http://slidepdf.com/reader/full/cardiopatia-iskemica 4/10
1168
Circulation Journal Vol.74, June 2010
HIRO T et al.
to assess the relationship between the % change o the coro-nary PV and each potentially signicant variable. Variablesthat met the ollowing criteria were included or the univari-ate analysis conducted to determine the association with theprimary endpoint: (1) measurements obtained in ≥50% o thetotal population; and (2) requency ≥10% o the total popula-tion or each nominal or ordinal variable. The variables show-ing correlation with the % change in PV with P<0.1 wereincluded in the multivariate analyses. We nally developed
a multivariable model using the variables selected on uni-variate analysis, ollowed by backward model selection withP<0.05.
Based on the results o the multivariable model, we iden-tied DM as a strong determinant o the coronary plaqueregression. We thus divided the total subjects into 2 groupsaccording to the diabetes status. Following the descriptive sta-tistics, comparisons o continuous variables between 2 groupswere perormed using a two-sample t-test or Wilcoxon’srank– sum test, and those between the parameters at baselineand ollow up were perormed using one-sample t-tests orWilcoxon’s signed rank test according to their distributions.Comparisons o categorical variables between 2 groups wereperormed using the chi-square and Fisher’s exact tests. Weused general linear models to assess the relationships betweenthe % change o the coronary PV and several o the variablesexamined, including the serum lipid prole at the 8–12-monthollow up. The signicance level was set at 5% or the two-sided test (and 2.5% or one-sided test).
All the statistical analyses were perormed using the SASSystem Release 9.1 (SAS institute, Cary, NC, USA).
Results
Multivariate AnalysisAccording to the selection criteria, the presence o DM, genderand six baseline parameters, including the height, PV, vesselvolume, remnant-like particle-cholesterol (RLP-C) level, apo-lipoprotein (Apo) E level and hemoglobin A1c (HbA1c), wereselected on univariate analysis as actors determining thedegree o plaque regression (Table 1). The multivariateanalysis identied the presence o DM, PV at baseline andRLP-C level at baseline as the actors that were signicantlyassociated with the degree o plaque regression. In this analy-sis, a positive estimate corresponded to a lower likelihood o regression. The estimate or the presence o DM was 7.3 (95%condence interval (CI): 3.6–10.9), or the PV at baseline itwas 0.069 (95%CI: 0.017–0.12), and or the RLP-C level atbaseline it was –0.70 (95%CI: –1.4 to –0.048). Based on themultivariate model, we identied the presence/absence o DMas being strongly correlated with the primary endpoint. Wethereore conducted urther analyses ater subdividing theparticipants into a diabetic and non-diabetic group.
Patient CharacteristicsThe 252 patients (125 rom the pitavastatin group and 127rom the atorvastatin group) were divided into those with DM(diabetic group; n=74) and those without DM (non-diabeticgroup; n=178). All the baseline demographic characteristicswere similar between the 2 groups, except or the location o the plaque segment o interest (Table 2). Segments proximalto the PCI site or IVUS evaluation were included more re-quently in the diabetic group than in the non-diabetic group(81.1% vs 65.2%, P=0.012). In the diabetic group, 13.5% o the patients were receiving insulin, 13.5% were under treat-ment with a PPAR-γagonist, 27% were under treatment with
T a b l e
3 .
I V U S
R e s u l t s
B a s e l i n e
F o l l o w u p
N o m i n a l c h a n g e
P e r c e n t c h a n g e ( % )
D i a b e t e s
( n = 7 4 )
N o n -
d i a b e t e s
( n = 1 7 8 )
P
b
e t w e e n
g
r o u p s
D i a b e t e s
( n = 7 4 )
N o n -
d i a b e t e s
( n = 1 7 8 )
P
b e t w e e n
g r o u p s
D i a b e t e s
( n = 7 4 )
P c o m -
p a r e d
w i t h
b a s e l i n e
N o n -
d i a b e t e s
( n = 1 7 8 )
P c o m
-
p a r e d
w i t h
b a s e l i n
e
P
b e t w e e n
g r o u p s
D i a b e t e s
( n = 7 4 )
P c o m -
p a r e d
w i t h
b a s e l i n e
N o
n -
d i a b e t e s
( n = 1
7 8 )
P c o m -
p a r e d
w i t h
b a s e l i n e
P
b e t w e e n
g r o u p s
P l a q u e v o l u m e
( m m 3 )
5 7 . 3 ± 2 6 . 7
5 6 . 8 ± 3 4 . 3
0 . 9
5 0 . 1 ± 2 5 . 1
4 6 . 4 ± 3 0 . 6
0 . 4
– 7 . 2 ± 8 . 3
< 0 . 0
0 1
– 1 0 . 3 ± 1 0 . 3
< 0 . 0 0
1
0 . 0
2
– 1 2 . 8 ± 1 4 . 4
< 0 . 0
0 1
– 1 9 . 4 ± 1 3 . 4
< 0 . 0
0 1
< 0 . 0
0 1
P e r c e n t p l a q u e
v o l u m e ( % )
4 9 . 6 ± 8 . 9
5 0 . 1 ± 1 0 . 8
0 . 7
4 5 . 2 ± 9 . 9
4 3 . 5 ± 1 1 . 2
0 . 3
– 4 . 4 ± 5 . 7
< 0 . 0
0 1
– 6 . 6 ± 6 . 3
< 0 . 0 0
1
0 . 0
1
N A
–
N A
–
–
N o r m a l i z e d
p l a q u e v o l u m e
( m m 3 )
5 6 . 9 ± 1 7 . 5
5 3 . 6 ± 1 9 . 4
0 . 2
4 9 . 5 ± 1 6 . 6
4 3 . 5 ± 1 8 . 3
0 . 0
2
– 7 . 4 ± 9 . 0
< 0 . 0
0 1
– 1 0 . 1 ± 8 . 0
< 0 . 0 0
1
0 . 0
2
N A
–
N A
–
–
E E M
v o l u m e
( m m 3 )
1 1 6 . 5 ± 5 3 . 8
1 1 1 . 6 ± 6 1 . 5
0 . 5
1 1 1 . 1 ± 5 2 . 0
1 0 3 . 0 ± 5 6 . 1
0 . 3
– 5 . 4 ± 1 3 . 5
0 . 0
0 1
– 8 . 6 ± 1 5 . 4
< 0 . 0 0
1
0 . 1
– 4 . 1 ± 1 1 . 6
0 . 0
0 4
– 6 . 9 ±
1 1 . 3
< 0 . 0
0 1
0 . 0
8
L u m e n v o l u m e
( m m 3 )
5 9 . 2 ± 3 1 . 3
5 4 . 8 ± 3 1 . 6
0 . 3
6 1 . 0 ± 3 1 . 1
5 6 . 5 ± 3 0 . 2
0 . 3
– 1 . 8 ± 9 . 8
0 . 1
– 1 . 7 ± 1 1 . 0
0 . 0 3
5
0 . 9
8
5 . 2 ± 1 8 . 2
0 . 0
2
7 . 1 ±
2 1 . 3
< 0 . 0
0 1
0 . 5
I V U S l e s i o n
l e n g t h ( m m )
6 . 6 ± 2 . 8
6 . 7 ± 3 . 1
0 . 7
S / B
S / B
–
–
–
–
–
–
–
–
–
–
–
T h e l a s t c o l u m n i n d i c a t e s t h e c o m p a r i s o n
o f t h e p e r c e n t c h a n g e i n t h e v a l u e s o f t h e v a
r i a b l e s b e t w e e n t h e d i a b e t i c a n d n o n - d i a b e t i c g r o u p .
C o n t i n u o u s v a r i a b l e s a r e r e p r e s e n t e d b y m
e a n ± S D .
I V U S ,
i n t r a v a s c u l a r u l t r a s o u n d ; N A , n o t a p
p l i c a b l e ; E E M , e x t e r n a l e l a s t i c m e m b r a n e ; S
/ B , s a m e a s a t b a s e l i n e .

8/8/2019 cardiopatia iskemica
http://slidepdf.com/reader/full/cardiopatia-iskemica 5/10
1169
Circulation Journal Vol.74, June 2010
Diabetes and Plaque Regression in Japan-ACS Trial
a sulonyl urea, and 28.3% were under treatment with anα-glucosidase inhibitor.
IVUS ParametersThere were no signicant dierences in the baseline IVUSparameters between the diabetic and non-diabetic patients(Table 3). The percent change in PV at the 8–12-month ol-low up, however, was signicantly lower in the diabetic groupas compared with that in the non-diabetic group (–12.8±14.4% vs –19.4±13.4%, P<0.001) (Figure 1). The nominalchange in the %PV or NPV were also signicantly decreasedin the diabetic group as compared with that in the non-dia-
betic group (P=0.01 and P=0.02, respectively). In contrast,no signicant dierence in the percent change o the EEMor lumen volume was observed between the 2 groups (P=0.08and P=0.5, respectively; Table 3). Although segments proxi-mal to the PCI site were measured more requently in thediabetic group than in the non-diabetic group, the percentchange o the PV was similar between the proximal site anddistal site. Furthermore, there was no dierence in baseline%PV between distal and proximal segments in each group.
Laboratory ResultsSignicant decrease o the LDL-C level rom 131.5±
Figure 1. Plaque volume and low-density lipoprotein cholesterol (LDL-C) change in patients with or without diabetes mellitus.
The percent change in plaque volume at the 8–12-month ollow up was signifcantly lower in the diabetic group as comparedwith that in the non-diabetic group, although the percent change in LDL-C level during the observation period was not signif-cantly dierent between the 2 groups. Values are mean ± SD.
Table 4. Laboratory Results
Baseline Follow up Percent change (%)
Diabetes(n=74)
Non-diabetes(n=178)
Diabetes(n=74)
Non-diabetes(n=178)
Diabetes(n=74)
Non-diabetes(n=178)
P betweengroups
TC (mg/dl) 197.6±35.7 197.0±36.1 153.0±34.0 151.7±29.2 –21.8±16.0 –21.7±17.2 0.97
LDL-C (mg/dl) 131.5±31.9 132.7±32.5 81.5±28.1 83.0±24.4 –36.7±21.8 –35.7±21.1 0.7 TG (mg/dl) 126.1±55.8 114.6±55.3 124.1±61.6 123.6±73.8 13.5±71.6 20.9±66.6 0.4 HDL-C (mg/dl) 45.0±10.8 43.9±9.4 49.0±13.4 47.4±11.7 11.6±22.9 7.8±22.2 0.2 RLP-C (mg/dl) 4.4±2.4 4.3±2.6 3.9±2.5 3.9±3.3 1.6±70.9 7.0±89.4 0.7 Small dense LDL (RM) 0.35±0.04 0.36±0.05 0.34±0.04 0.34±0.03 –1.8±11.9 –3.4±11.3 0.3 Non-HDL-C (mg/dl) 152.1±32.4 152.4±33.8 104.0±34.0 104.2±26.7 –30.8±21.2 –30.1±19.3 0.8 LDL-C/HDL-C 3.1±0.9 3.1±0.9 1.8±0.8 1.8±0.6 –40.4±26.5 –39.2±18.9 0.7
hs-CRP median:IQR (mg/L)16.9
(5.3–42.0)20.1
(5.4–68.0)0.54
(0.26–1.5)0.54
(0.32–1.0)–95.7
(–99.1 to –83.5)–96.9
(–99.1 to –89.4) 0.3*
WBC:IQR (cells/ μl)9,450
(7,675–11,250)8,900
(7,175–11,225)6,400
(5,050–7,600)5,905
(5,145–7,000)–33.3
(–48.8 to –12.0)–32.7
(–44.0 to –19.1) 0.8*
HbA1c (%) 7.3±1.4 5.4±0.4 6.8±1.4 5.6±0.4 –0.44±1.42† 0.14±0.30† <0.001
Continuous variables are represented by mean ± SD or median (IQR).*Wilcoxon sign rank test. †Nominal change.HDL-C, high density lipoprotein-cholesterol; LDL-C, low density lipoprotein-cholesterol; hs-CRP, high-sensitivity C-reactive protein; WBC,white blood cells. Other abbreviations see in Tables 1,2.SI conversions: to convert total cholesterol, LDL-C, HDL-C, RLP-C, non-HDL-C to mmol/L, multiply by 0.0259; PTX3 toμg/L, multiply values by 1.

8/8/2019 cardiopatia iskemica
http://slidepdf.com/reader/full/cardiopatia-iskemica 6/10
1170
Circulation Journal Vol.74, June 2010
HIRO T et al.
31.9 mg/dl (3.40±0.83 mmol/L) at baseline to 81.5±28.1 mg/dl(2.11±0.73 mmol/L) at the 8–12-month ollow up (P<0.001vs baseline) was observed in the diabetic group, and rom132.7±32.5 mg/dl (3.44±0.84 mmol/L) at baseline to 83.0±24.4 mg/dl (2.14±0.63 mmol/L; P<0.001 vs baseline) at the8–12-month ollow up in the non-diabetic group (Table 4).The LDL-C levels at the baseline and at the 8–12-monthollow up and its percent change during the observationperiod were similar between the 2 groups (Figure 1). Thehigh-density lipoprotein cholesterol (HDL-C) level also hada comparable increase in the 2 groups. The serum levels o infammatory markers, namely, hs-CRP and PTX3, and thewhite blood cell count, were elevated to equivalent degrees atbaseline, and no signicant dierences in the percent changeso the parameters were observed between the 2 groups. TheHbA1c level at baseline was signicantly higher in the dia-betic group as compared with that in the non-diabetic group(7.3±1.4% vs 5.4±0.4%, P<0.001). During the ollow-upperiod, the HbA1c level decreased signicantly in the diabeticgroup (rom 7.3±1.4% to 6.8±1.4%, P=0.012), but increasedsignicantly, although only slightly, in the non-diabetic group(rom 5.4±0.4% to 5.6±0.4%, P<0.001).
Degree o Plaque Regression and BiomarkersSignicant correlation was observed between the LDL-Clevel at the 8–12-month ollow up and the percent change o the PV in the diabetic group (r=0.28, P=0.017), whereas nosuch signicant correlation was observed in the non-diabeticgroup (r=–0.03, P=0.7; Figure 2). In addition, the percentchange o the LDL-C level during the study period was alsosignicantly correlated with the percent change o the PV(r=0.37, P=0.011) in the diabetic group, but not in the non-diabetic patients (r=0.01, P=0.9). Furthermore, signicantand close correlations between the LDL-C level at the 8–12-month ollow up as well as the percent change o thisparameter during the study period with the percent change o the PV were observed in diabetic patients with baseline HbA1c levels higher than or equal to the median, that is, 7.0% (r=0.49,P=0.0027, and r=0.45, P=0.0056, respectively), whereas nosignicant correlation among these parameters were observedin the diabetic patients with baseline HbA1c levels <7.0%(r=0.06, P=0.7, and r=0.24, P=0.2, respectively; Figure 3).
There were also statistically signicant correlations be-tween the percent changes o other lipid parameters such asthe total cholesterol (TC; r=0.37, P=0.0012), RLP-C (r=0.25,P=0.032), non-HDL-C (r=0.37, P=0.017) and ApoB (r=0.33,
Follow up LDL-C level (mg/dL) Follow up LDL-C level (mg/dL)
Percent change in LDL-C level (%) Percent change in LDL-C level (%)
P e r c e n t c h a n g e i n p l a q u e v o l u m e ( % )
P e r c e n t c h a n g e i n p l a q u e v
o l u m e ( % )
P e r c e n t c h a n g e i n p l a q u e v o l u m e ( % )
P e r c e n t c h a n g e i n p l a q u e v
o l u m e ( % )
-80
-70
-60
-50
-40-30
-20
-10
0
10
20
20 40 60 80 100 120 140 160 180
-80
-70
-60
-50
-40
-30
-20
-10
0
10
20
-80 -60 -40 -20 0 20 40 60
r = 0.01
p = 0.9
r = 0.37
p = 0.01
r = -0.03
p = 0.7r = 0.28
p = 0.02
n=176n=73
n=178n=73
y=0.143x-24.4
y=0.249x-3.54
A B
C D
Diabetic patients Non-diabetic patients
-80
-70
-60
-50
-40-30
-20
-10
0
10
20
20 40 60 80 100 120 140 160 180
-80
-70
-60
-50
-40
-30
-20
-10
0
10
20
-80 -60 -40 -20 0 20 40 60
Figure 2. Relationship between the low-density lipoprotein cholesterol (LDL-C) level and percent change in plaque volume in
patients with and without diabetes. (A,C) There were signifcant correlations between the ollow-up LDL-C level, as well as thepercent change o the LDL-C level, and the percent change in plaque volume during the 8–12-month ollow up in patients withdiabetes. (B,D) In contrast, no such relationships were detected in the non-diabetic patients.

8/8/2019 cardiopatia iskemica
http://slidepdf.com/reader/full/cardiopatia-iskemica 7/10
1171
Circulation Journal Vol.74, June 2010
Diabetes and Plaque Regression in Japan-ACS Trial
P=0.0055) and the percent change o the PV in the diabeticgroup, while no such correlations were observed in the non-diabetic group.
Major Adverse Cardiovascular Events (MACE) and SaetyProfleThere was a signicant dierence in the prevalence o MACEbetween the diabetic and non-diabetic groups (29.9% vs18.2%, P=0.026). Among the MACE components, targetlesion revascularization (TLR) tended to be observed at ahigher requency in the diabetic group than in the non-dia-betic group (17.2% vs 9.6%, P=0.06). In regard to the othercomponents, the incidences o MI (1.2% vs 1.0%, P>0.99),target vessel revascularization (non-TLR; 6.9% vs 5.3%,P=0.6) and revascularization o the non-culprit vessels (6.9%vs 5.3%, P=0.6) were similar between the diabetic and non-diabetic groups.
There were no signicant dierences in the prevalenceo adverse events between the diabetic group and the non-diabetic group.
Discussion
This sub-analysis o the multi-center JAPAN-ACS studyusing multivariate analysis showed that the presence/absenceo DM, the PV and the RLP-C level at baseline were inde-pendently associated with the degree o plaque regressioninduced by statin therapy in patients with ACS. In particular,the percent change in PV during the 8–12-month ollow-upperiod was signicantly attenuated in the diabetic group ascompared with that in the non-diabetic group. This resultwas consistent with that reported rom a previous clinicaloutcome study, in which DM patients had a worse prognosisdespite advanced treatment or ACS as compared to non-DM patients.14 There were signicant correlations, however,between the percent change in PV and percent change o theLDL-C level or ollow-up LDL-C level in patients with DM,while no such signicant correlations were observed in thepatients without DM. These data indicated that the presenceo DM was one o the major deterrents o plaque regressioninduced by statin therapy in patients with ACS. In addition,the results also suggested that more vigorous reduction o the LDL-C levels might induce a greater degree o regres-sion o the PV in ACS patients with DM.
Follow up LDL-C level (mg/dL)
P e r c e n t c h a n g e i n p l a q u e v o l u m e ( % )
P e r c e n t c h a n g e i n p l a q u e v o l u m e ( % )
P e r c e n t c h a n g e i n p l a q u e
v o l u m e ( % )
P e r c e n t c h a n g e i n p l a q u e
v o l u m e ( % )
Percent change in LDL-C level (%)
Follow up LDL-C level (mg/dL)
-60
-50
-40
-30
-20
-10
0
10
20
-70 -60 -50 -40 -30 -20 -10 0 10 20 30
Percent change in LDL-C level (%)
A B
C D
r = 0.49p = 0.003
r = 0.45p = 0.006
r = 0.06p = 0.7
r = 0.24p = 0.2
n=35
n=36 n=35
y=0.246x-32.2
y=0.277x-1.47
HbA1c≥7.0% HbA1c<7.0%
-60
-50
-40
-30
-20
-10
0
10
20
- 70 -6 0 - 50 -4 0 - 30 -2 0 - 10 0 10 2 0 3 0
-60
-50
-40
-30
-20
-10
0
10
20
20 40 60 80 100 120 140 160 180
-60
-50
-40
-30
-20
-10
0
10
20
20 40 60 80 100 120 140 160 180
n=36
Figure 3. Relationships between the low-density lipoprotein cholesterol (LDL-C) levels and the percent change in plaque vol-ume in patients with diabetes (classifed into subgroups by the baseline hemoglobin (Hb)A1c level). (A,C) There were signifcant
correlations between the ollow-up LDL-C level, as well as the percent change o the LDL-C level, and the percent change inplaque volume during the 8–12-month ollow up, especially in the diabetic patients with baseline HbA 1c levels ≥7.0%. (B,D) Nosuch signifcant relationships, however, were detected in the diabetic patients with baseline HbA 1c levels <7.0%.

8/8/2019 cardiopatia iskemica
http://slidepdf.com/reader/full/cardiopatia-iskemica 8/10
1172
Circulation Journal Vol.74, June 2010
HIRO T et al.
Because the baseline patient proles were similar betweenthe diabetic and non-diabetic patients with ACS, the dier-ences between the 2 groups in terms o the degree o plaqueregression or the relation o this parameter with the changesin the LDL-C levels during statin therapy might be attribut-able to dierences in the baseline characteristics o plaque.This may be supported by the present results, in which a sig-nicant dierence in the prevalence o MACE was oundbetween the diabetic and non-diabetic groups. Nicholls et al
documented, based on a pooled analysis o 5 IVUS trialsconducted on a total o 2,237 patients, that diabetic patientshad a greater percent or total atheroma volume, with morerapid progression o the PV and inadequate compensatoryremodeling.15 This suggested the existence o a unique patho-genetic mechanism or plaque ormation in diabetic patients,although there were no signicant dierences at baseline inthese volumetric indices in the present study between thediabetic group and the non-diabetic group. In the present studythe percent change in EEM volume during the ollow-upperiod indicated a signicant negative remodeling in eachgroup. During the remodeling, EEM volume at ollow uptended to be larger, and the change in EEM volume tendedto be smaller in the diabetic group, although P value did notreach signicance. As already shown in the main JAPAN-ACS study, the change in EEM volume was signicantlycorrelated with that o PV.8 Thereore, this tendency mightbe considered to be an adaptation process. Non-signicantdierence in EEM volume at ollow up and its change, how-ever, might suggest the existence o a dierent remodelingmechanism in the 2 groups, because the degree o PV regres-sion was signicantly smaller in the diabetic group.
Another important result in the present study was that sig-nicant correlations between the percent change in PV andpercent change o the LDL-C level or the ollow-up LDL-Clevel could be seen only in the diabetic group, and wereabsent in the non-diabetic group. Although this correlationcoecient was signicant but not so high, this dierencebetween the 2 groups might suggest the existence o bothLDL-C-dependent and LDL-C-independent mechanisms o plaque regression induced by statins. Thereore, it can beassumed that some specic or more complex tissue charac-teristics o plaques in ACS patients with DM, as discussedbelow, might signicantly inhibit the LDL-C-independentmechanism, while plaque regression in ACS patients withoutDM might be mediated mainly by the LDL-C-independentmechanism. Such switching o the regression mechanismmight be determined by the HbA1c level, as suggested by thepresent nding. This suggests that intensive glycemic con-trol might be essential in ACS patients with DM to achievesignicant plaque regression. Although the details o the puta-tive LCL-C-independent mechanism are unknown, it mightbe related to the pleiotropic eects o statin.16–19 Whateverthe exact mechanism, these data provide the important mes-sage that intensive reduction o the LDL-C level shouldbe ensured to obtain a greater degree o regression o the PVin ACS patients with DM.
Williams et al carried out a systematic review o numerousprevious in vitro studies, concluding that possible mecha-nisms responsible or lesion shrinkage include decreasedretention o ApoB-lipoproteins within the arterial wall, efuxo cholesterol and other toxic lipids rom plaques, emigrationo oam cells out o the arterial wall, and infux o healthyphagocytes that remove necrotic debris and other componentso the plaque.20 It can be assumed that some o these mecha-nisms are dependent on LDL-C level, and the other ones are
independent, which might be attenuated by the presence o DM. But there have been no documented reports so ar regard-ing the relationship between activity o each mechanism andpresence o DM, which should be claried in urther studies.Another possible reason or the dierence in plaque regres-sion due to statin between DM patients and non-DM patientsmight be attributed to the dierence in the activity o athero-sclerotic process to promote plaque ormation.
Recently, some studies using new intravascular imaging
modalities suggested that the plaque in diabetic patients hada signicantly bigger lipid core,21 a lesser degree o intimalhyperplasia,21 and more abundant dense-calcium or brocal-cic tissue.22 Kawasaki et al demonstrated that the eect o statins on plaque regression was mainly mediated by absorp-tion o the lipid core.6 Although no consistent specic tissuecharacteristics o plaques in diabetic patients have been con-rmed, such complex properties o the tissue components o a plaque might prevent the eect o statins o producingregression o the lipid core. Recently, Hirayama et al reporteda signicant change in plaque color by statin using coronaryangioscopy.23 Furthermore, a multicenter study has beenongoing to clariy the change in tissue characteristics bystatin, using VH-IVUS.24 Thereore, urther studies particu-larly ocused on the tissue characteristics o plaques may pro-vide urther validation o this hypothesis in the near uture.
The uniqueness o the regressive mechanism o plaquessuggested in diabetic patients could also be observed in rela-tion to other clinical parameters in this group, such as the TC,RLP-C, non-HDL-C and ApoB levels; none o these parame-ters was correlated with the percent change in PV in the non-diabetic patients. Thereore, concomitant intensive improve-ment o these parameters by several interventions includingtherapeutic liestyle changes or aggressive diet modicationwould exert avorable eects in ACS patients with DM interms o the degree o plaque regression. Consequently, thepresent results have the important clinical implication thatACS patients with DM should be treated with an understand-ing o the reractory characteristics o plaque regression aswell as o the necessity o specic therapeutic interventions.
In addition to the study limitations documented in the mainreport o the JAPAN-ACS study,8 the current substudy hadspecic limitations. In the present substudy the baseline pro-le between the 2 groups was not completely matched espe-cially or the proximity o the observed site compared to thePCI site. Although the percent change o the PV was similarbetween the proximal site and distal site, original dierencein the tissue characteristics between the proximal and the dis-tal coronary branch should be considered in the interpretationo the data.25,26 The diagnosis o diabetes was made by theattending physician in the participants. Glucose tolerancewas not thoroughly examined in some patients. Patients withonly impaired glucose tolerance or borderline diabetes werenot diagnosed as having DM. Furthermore, no specic inter-ventions to treat DM were attempted, so that the eects o intensive glucose control on our data could not be elucidated.Thereore, a randomized controlled multicenter study withprimary prospective intervention or DM would be neededto conrm our data.
Conclusions
The presence o DM was one o the major negative deter-minants o plaque regression induced by statin therapy inpatients with ACS. There were signicant correlations, how-ever, between the percent change in PV and percent change

8/8/2019 cardiopatia iskemica
http://slidepdf.com/reader/full/cardiopatia-iskemica 9/10
1173
Circulation Journal Vol.74, June 2010
Diabetes and Plaque Regression in Japan-ACS Trial
o the LDL-C level or ollow-up LDL-C level only in patientswith DM, while no such signicant correlations were oundin the patients without DM. Thereore, these data suggest theimportance o more intensive reduction o the LDL-C levelsto achieve a greater degree o regression o the PV in ACSpatients with DM.
Acknowledgments
We sincerely acknowledge the contributions o Izumi Miki, SaekoMinematsu, Yumika Fujino and Miya Hanazawa to the data management,and those o Hiroko Kanou, Natsuko Yamamoto, Tatsuhiro Fujimuraand Genta Hashimoto to the IVUS core–laboratory management andIVUS planimetry. JAPAN-ACS Investigators: Aichi Medical University(Takayuki Ito, MD; Hiroaki Takashima, MD); Akita Medical Center(Tadaya Sato, MD); Anjo Kosei Hospital (Masato Watarai, MD); EhimePreectural Central Hospital (Yukio Kazatani, MD; Shinichi Hiramatsu,MD); Fujita Health University (Hitoshi Hishida, MD; Yukio Ozaki,MD; Hiroyuki Naruse, MD); Fukuoka University (Keijiro Saku, MD;Shin-ichiro Miura, MD; Atsushi Iwata, MD); Giu Preectural GeneralMedical Center (Sachiro Watanabe, MD; Toshiyuki Noda, MD, RyuheiTanaka, MD; Koji Ono, MD); Hiroshima City Asa Hospital (KeigoDote, MD; Masaya Kato, MD; Shota Sasaki, MD; Kentaro Ueda, MD);Hiroshima City Hospital (Ichiro Inoue, MD; Takuji Kawagoe, MD);Japanese Redcross Nagoya First Hospital (Haruo Kamiya, MD);Juntendo University (Hiroyuki Daida, MD; Katsumi Miyauchi, MD);Juntendo University Shizuoka Hospital (Satoru Suwa, MD); Juntendo
University Urayasu Hospital (Yuji Nakazato, MD; Kosei Tanimoto, MD);Kansai Rosai Hospital (Shinsuke Nanto, MD; Fusako Sera, MD); KokuraMemorial Hospital (Masakiyo Nobuyoshi, MD; Hitoshi Yasumoto, MD);Kurashiki Central Hospital (Kazuaki Mitsudo, MD; Yasushi Fuku, MD);Kyoto University (Takeshi Kimura, MD; Yoshihisa Nakagawa, MD);National Cardiovascular Center (Hiroshi Nonogi, MD; Yoritaka Otsuka,MD; Nobuaki Kokubu, MD); National Hospital Organization HamadaMedical Center (Hiroshi Iida, MD; Mutsuo Nakayama, MD); NationalHospital Organization Kagoshima Medical Center (Shinichi Minagoe,MD; Hitoshi Nakajima, MD; Masahiro Sonoda, MD); NTT East Cor-poration Sapporo Hospital (Tetsuro Kouya, MD; Noriyuki Miyamoto,MD; Yoshiyuki Suzuki, MD; Sachie Taguchi, MD); Okayama RedcrossGeneral Hospital (Toru Ujihira, MD; Hironori Saitou, MD; Tetsuya Sato,MD); Osaka City General Hospital (Akira Itoh, MD; Kei Yunoki, MD);Saiseikai Kumamoto Hospital (Takashi Honda, MD; Koichi Nakao, MD;Norihiro Yamada, MD); Sendai Kosei Hospital (Taiichiro Meguro, MD;Kaname Takizawa, MD); Tokuyama Central Hospital (Hiroshi Ogawa,
MD; Takahiro Iwami, MD); Toranomon Hospital (Sugao Ishiwata, MD;Yo Fujimoto, MD); Tsuchiya General Hospital (Yasuhiko Hayashi, MD;Mamoru Toyouku, MD; Masaya Otsuka, MD); University o Tokyo(Yasunobu Hirata, MD; Jiro Ando, MD); Wakayama Medical University(Takashi Akasaka, MD; Takashi Kubo, MD; Hironori Kitabata, MD);Yamaguchi University (Masunori Matsuzaki, MD; Takaumi Hiro, MD;Takashi Fujii, MD; Takayuki Okamura, MD; Jutaro Yamada, MD; GentaHashimoto, MD; Tatsuhiro Fujimura, MD); Yokkaichi Municipal Hos-pital (Satoshi Ichimiya, MD; Masaaki Kanashiro, MD; Junji Watanabe,MD; Seiji Fukui, MD; Taiki Ohashi, MD; Nobutake Kurebayashi, MD);Yokohama City University Medical Center (Kiyoshi Hibi, MD).
References
1. Schwartz GG, Olsson AG, Ezekowitz MD, Ganz P, Oliver MF,Waters D, et al. Eects o atorvastatin on early recurrent ischemicevents in acute coronary syndromes: The MIRACL study: A ran-
domized controlled trial. JAMA 2001; 285: 1711 – 1718.2. Cannon CP, Braunwald E, McCabe CH, Rader DJ, Rouleau JL, BelderR, et al. Intensive versus moderate lipid lowering with statins ateracute coronary syndromes. N Engl J Med 2004; 350: 1495 – 1504.
3. Thompson PL. Clinical relevance o statins: Instituting treatmentearly in acute coronary syndrome patients. Atheroscler Suppl 2001;2: 15 – 19.
4. Nissen SE, Tuzcu EM, Schoenhagen P, Brown BG, Ganz P, VogelRA, et al. Eect o intensive compared with moderate lipid-lower-ing therapy on progression o coronary atherosclerosis: A random-ized controlled trial. JAMA 2004; 291: 1071 – 1080.
5. Nissen SE, Nicholls SJ, Sipahi I, Libby P, Raichlen JS, BallantyneCM, et al. Eect o very high-intensity statin therapy on regressiono coronary atherosclerosis: The ASTEROID trial. JAMA 2006;295: 1556 – 1565.
6. Kawasaki M, Sano K, Okubo M, Yokoyama H, Ito Y, Murata I, etal. Volumetric quantitative analysis o tissue characteristics o coro-nary plaques ater statin therapy using three-dimensional integrated
backscatter intravascular ultrasound. J Am Coll Cardiol 2005; 45: 1946 – 1953.
7. Okazaki S, Yokoyama T, Miyauchi K, Shimada K, Kurata T, SatoH, et al. Early statin treatment in patients with acute coronary syn-drome: Demonstration o the benecial eect on atheroscleroticlesions by serial volumetric intravascular ultrasound analysis duringhal a year ater coronary event: The ESTABLISH Study. Circula-tion 2004; 110: 1061 – 1068.
8. Hiro T, Kimura T, Morimoto T, Miyauchi K, Nakagawa Y,Yamagishi M, et al. Eect o intensive statin therapy on regressiono coronary atherosclerosis in patients with acute coronary syndrome:
A multi-center randomized trial evaluated by volumetric intravascu-lar ultrasound using pitavastatin versus atorvastatin (JAPAN-ACSstudy). J Am Coll Cardiol 2009; 293: 293 – 302.
9. Nicholls SJ, Tuzcu EM, Crowe T, Sipahi I, Schoenhagen P, KapadiaS, et al. Relationship between cardiovascular risk actors and ath-erosclerotic disease burden measured by intravascular ultrasound. J Am Coll Cardiol 2006; 47: 1967 – 1975.
10. Sipahi I, Tuzcu EM, Schoenhagen P, Wolski KE, Nicholls SJ, BalogC, et al. Eects o normal, pre-hypertensive, and hypertensive bloodpressure levels on progression o coronary atherosclerosis. J AmColl Cardiol 2006; 48: 833 – 838.
11. Nicholls SJ, Tuzcu EM, Sipahi I, Schoenhagen P, Hazen SL, NtaniosF, et al. Eects o obesity on lipid-lowering, anti-infammatory, andantiatherosclerotic benets o atorvastatin or pravastatin in patientswith coronary artery disease (rom the REVERSAL Study). Am J Cardiol 2006; 97: 1553 – 1557.
12. Sipahi I, Tuzcu EM, Wolski KE, Nicholls SJ, Schoenhagen P, Hu
B, et al. Beta-blockers and progression o coronary atherosclerosis:Pooled analysis o 4 intravascular ultrasonography trials. Ann Intern Med 2007; 147: 10 – 18.
13. Miyauchi K, Kimura T, Morimoto T, Nakagawa Y, Yamagishi M,Ozaki Y, et al. Japan assessment o pitavastatin and atorvastatin inacute coronary syndrome (JAPAN-ACS): Rationale and design.Circ J 2006; 70: 1624 – 1628.
14. Donahoe SM, Stewart GC, McCabe CH, Mohanavelu S, MurphySA, Cannon CP, et al. Diabetes and mortality ollowing acute coro-nary syndromes. JAMA 2007; 298: 765 – 775.
15. Nicholls SJ, Tuzcu EM, Kalidindi S, Wolski K, Moon KW, SipahiI, et al. Eect o diabetes on progression o coronary atherosclerosisand arterial remodeling: A pooled analysis o 5 intravascular ultra-sound trials. J Am Coll Cardiol 2008; 52: 255 – 262.
16. Masamura K, Oida K, Kanehara H, Suzuki J, Horie S, Ishii H, etal. Pitavastatin-induced thrombomodulin expression by endothelialcells acts via inhibition o small G proteins o the Rho amily.
Arterioscler Thromb Vasc Biol 2003; 23: 512 – 517.17. Bonnet J, McPherson R, Tedgui A, Simoneau D, Nozza A, Martineau
P, et al. Comparative eects o 10-mg versus 80-mg atorvastatinon high-sensitivity C-reactive protein in patients with stable coro-nary artery disease: Results o the CAP (Comparative AtorvastatinPleiotropic eects) study. Clin Ther 2008; 30: 2298 – 2313.
18. Nakamura K, Sasaki T, Cheng XW, Iguchi A, Sato K, Kuzuya M.Statin prevents plaque disruption in apoE-knockout mouse modelthrough pleiotropic eect on acute infammation. Atherosclerosis 2009; 206: 355 – 361.
19. Liu PY, Liu YW, Lin LJ, Chen JH, Liao JK. Evidence or statinpleiotropy in humans: Dierential eects o statins and ezetimibeon rho-associated coiled-coil containing protein kinase activity,endothelial unction, and infammation. Circulation 2009; 119: 131 – 138.
20. Williams KJ, Feig JE, Fisher EA. Rapid regression o atherosclero-sis: Insights rom the clinical and experimental literature. Nat Clin
Pract Cardiovasc Med 2008; 5: 91 – 102.21. Sano K, Kawasaki M, Okubo M, Yokoyama H, Ito Y, Murata I, etal. In vivo quantitative tissue characterization o angiographicallynormal coronary lesions and the relation with risk actors: A studyusing integrated backscatter intravascular ultrasound. Circ J 2005;69: 543 – 549.
22. Nasu K, Tsuchikane E, Katoh O, Fujita H, Surmely JF, Ehara M, etal. Plaque characterisation by virtual histology intravascular ultra-sound analysis in patients with type 2 diabetes. Heart 2008; 94: 429 – 433.
23. Hirayama A, Saito S, Ueda Y, Takayama T, Honye J, Komatsu S,et al. Qualitative and quantitative changes in coronary plaque asso-ciated with atorvastatin therapy. Circ J 2009; 73: 718 – 725.
24. Nozue T, Yamamoto S, Tohyama S, Umezawa S, Kunishima T,Sato A, et al. Treatment with statin on atheroma regression evaluatedby intravascular ultrasound with virtual histology (TRUTH Study):Rationale and design. Circ J 2009; 73: 352 – 355.
25. Tanaka A, Imanishi T, Kitabata H, Kubo T, Takarada S, Kataiwa

8/8/2019 cardiopatia iskemica
http://slidepdf.com/reader/full/cardiopatia-iskemica 10/10
1174
Circulation Journal Vol.74, June 2010
HIRO T et al.
H, et al. Distribution and requency o thin-capped broatheromasand ruptured plaques in the entire culprit coronary artery in patientswith acute coronary syndrome as determined by optical coherencetomography. Am J Cardiol 2008; 102: 975 – 979.
26. Komura N, Hibi K, Kusama I, Otsuka F, Mitsuhashi T, Endo M, etal. Plaque location in the let anterior descending coronary arteryand tissue characteristics in angina pectoris: An integrated back-scatter intravascular ultrasound study. Circ J 2010; 74: 142 – 147.
Appendix 1
Steering committee: Takaumi Hiro, MD; Katsumi Miyauchi, MD;Yoshihisa Nakagawa, MD; Masakazu Yamagishi, MD; Yukio Ozaki, MD(working members, respectively); Takeshi Kimura, MD; Hiroyuki Daida,MD (co-principal investigators, respectively); Masunori Matsuzaki, MD(principal investigator). Independent event assessment committee: KazuoKimura, MD; Satoshi Saito, MD; Tetsu Yamaguchi, MD. Independentstatistician: Takeshi Morimoto, MD.
Appendix 2Baseline ParametersThe ollowing 83 variables at baseline were considered as actors poten-
tially associated with the % change o the coronary PV and entered intothe multivariate analysis model: baseline characteristics (age, gender,diabetes, medication or diabetes, insulin treatment or diabetes, historyo MI, history o angina, history o PCI, history o CABG, history o blood vessel diseases, history o DAA, history o aortic aneurysm, historyo ASO, history o CI, hypertension, amily history o CAD, smoking,alcohol drinker, drug allergy, height, body weight, BMI, waist circum-erence, SBP, DBP, heart rate, type o ACS, stent usage, type o stent,culprit vessel, proximal/distal to the treated site, abnormal Q wave posi-tive, max CPK, troponin T positive, troponin I positive); concomitantdrugs (Ca blocker, nitrate, ACE inhibitor, ARB,
β-blocker, diuretic, aldo-
sterone blocker, digitalis, PPAR-γagonist, sulonyl urea,α-GI, ticlopidine,clopidogrel, aspirin, other antiplatelet agents, wararin, anti arrhythmicagent); baseline blood parameters (TC, LDL-C, TG, HDL-C, HDL2-C,HDL3-C, RLP-C, small dense LDL, non-HDL-C, LDL-C/HDL-C ratio,ApoA-I, ApoB, ApoE, ApoB/ApoA-I ratio, MDA-LDL, phospholipid,Lp(a), hs-CRP, PTX3, HbA1c); baseline IVUS parameters (lesion lengtho evaluation site, PV, %PV, normalized PV, vessel volume, minimumlumen area in evaluation site, lumen volume, minimum lumen area intreated site, plaque area in treated site, vessel area in treated site, stentarea in treated site).