capital structure, overall rate of return and investor
TRANSCRIPT

Direct Testimony and Schedules
Paul A. Johnson
Before the Minnesota Public Utilities Commission
State of Minnesota
In the Matter of the Application of Northern States Power Company
for Authority to Increase Rates for Electric Service in Minnesota
Docket No. E002/GR-21-630
Exhibit___(PAJ-1)
Capital Structure, Overall Rate of Return
And Investor Relations
October 25, 2021

i Docket No. E002/GR-21-630 Johnson Direct
Table of Contents
I. Introduction and Qualifications 1
II. Summary and Overview 3
III. Standards and Fundamental Considerations for the
NSPM Capital Structure
6
IV. NSPM’s Capital Expenditure Plan, Credit Ratings and the
Regulatory Environment
12
A. NSPM Capital Expenditures and Financial Implications 12
B. Importance of Credit Ratings and a Healthy Regulatory
Environment
17
V. Proposed Capital Structure, Cost of Debt, and Rate of Return 30
1. Long-Term Debt 32
2. Short-Term Debt 34
3. Common Equity 39
VI. Investor Relations Expenses 40
VII. Summary and Recommendations 42

ii Docket No. E002/GR-21-630 Johnson Direct
Schedules
Statement of Qualifications Schedule 1
2022 Cost of Capital Summary Schedule 2, p. 1 of 3
2023 Cost of Capital Summary Schedule 2, p. 2 of 3
2024 Cost of Capital Summary Schedule 2, p. 3 of 3
Chart of 2011 through 2024 Capital Expenditures Schedule 3
2022 Forecasted Long Term Debt Schedule 4
2023 Forecasted Long Term Debt Schedule 5
2024 Forecasted Long Term Debt Schedule 6
Moody's Credit Opinion Dated 12-31-20 Schedule 7
S&P Ratings Direct Dated 12-18-20 Schedule 8
Moody’s Regulated Utilities Dated 6-23-2017 Schedule 9
S&P Key Credit Factors Dated 11-19-2013 Schedule 10
S&P Ratios and Adjustments Dated 11-19-2013 Schedule 11
S&P Credit Metrics – 2021 through 2024 Schedule 12, pg 1
Moody’s Credit Metrics – 2021 through 2024 Schedule 12, pg 2
2022 through 2024 Interest Rate Forecast Schedule 13
2022 Forecasted Short Term Debt Schedule 14
2023 Forecasted Short Term Debt Schedule 15
2024 Forecasted Short Term Debt Schedule 16
Money Pool Activity 2019 through June 2021 Schedule 17
2022 Forecasted Equity Balances
2023 Forecasted Equity Balances
2024 Forecasted Equity Balances
Flotation Costs 1949 through November 2020
Schedule 18
Schedule 19
Schedule 20
Schedule 21
1

1 Docket No. E002/GR-21-630 Johnson Direct
I. INTRODUCTION AND QUALIFICATIONS 1
2
Q. PLEASE STATE YOUR NAME AND OCCUPATION. 3
A. My name is Paul A. Johnson. I am Vice President, Treasurer and Investor 4
Relations of Xcel Energy Services, Inc., the service company subsidiary of Xcel 5
Energy Inc. (Xcel Energy or XEI). 6
7
Q. ON WHOSE BEHALF ARE YOU TESTIFYING IN THIS PROCEEDING? 8
A. I am testifying on behalf of Northern States Power Company (NSPM or the 9
Company), d/b/a Xcel Energy. 10
11
Q. PLEASE BRIEFLY OUTLINE YOUR RESPONSIBILITIES AS VICE PRESIDENT, 12
TREASURER AND INVESTOR RELATIONS. 13
A. As Vice President, Treasurer and Investor Relations, I am responsible for 14
recommending and implementing the financing required to achieve target 15
capital structure objectives at each of the regulated utility operating companies 16
and at Xcel Energy. I am also responsible for corporate cash forecasting and 17
management, pension plan management, hazard risk insurance, treasury 18
services, and financial policies. In addition, I am responsible for developing 19
and maintaining relationships with investors, investor analysts, and internal and 20
external stakeholders to ensure that they are well positioned to make financial 21
or investment decisions. I am also responsible for working with the credit rating 22
agencies and providing timely updates as required. A description of my 23
qualifications, duties, and responsibilities is included in this testimony as Exhibit 24
__(PAJ-1), Schedule 1. 25

2 Docket No. E002/GR-21-630 Johnson Direct
Q. PLEASE STATE THE PURPOSE OF YOUR TESTIMONY. 1
A. In my testimony, I discuss a number of topics related to the Company’s cost 2
of capital. In particular, I: 3
• Discuss financial integrity, its importance to NSPM and its stakeholders, 4
and the need for NSPM to demonstrate stable overall financial health in 5
order to access capital at attractive terms in varied economic conditions 6
and raise debt capital for utility investments at low costs; 7
• Discuss the criteria the ratings agencies use to measure financial integrity; 8
• Provide a current assessment of NSPM’s financial integrity and describe 9
the impact that regulatory decisions, changes in cash flow and the timely 10
recovery of prudent utility costs have on NSPM’s financial integrity; 11
• Present and support the capital structure and overall cost of capital 12
proposed by NSPM for the term of the Multi-Year Rate Plan (MYRP), 13
2022-2024; and 14
• Discuss the importance of the Company’s Investor Relations efforts. 15
16
Q. HOW IS YOUR TESTIMONY ORGANIZED? 17
A. I present my testimony in the following sections: 18
• Section II provides a Summary and Overview of NSPM’s proposed 19
Capital Structure, Cost of Debt, and Rate of Return (ROR) for the time 20
period covered by this rate case. 21
• Section III identifies the Commission’s standards for review of capital 22
structure and explains the purpose of, and how the Company determines, 23
the capital structure. 24
• Section IV describes the Company’s historical and planned financing and 25
investment activities, explains the importance of the regulatory 26
environment to the credit rating agencies’ and investors’ perceptions of 27

3 Docket No. E002/GR-21-630 Johnson Direct
the regulatory risk and to the Company’s ability to carry out its capital 1
expenditure plans. This section also includes a discussion of the credit 2
rating agencies’ criteria and NSPM’s current credit ratings and financial 3
metrics. 4
• Section V provides a detailed description of the components of NSPM’s 5
capital structure and costs of long-term debt (LTD) and short-term debt 6
(STD) for 2022 through 2024. 7
• Section VI discusses the need for and importance of the Company’s 8
Investor Relations expenses. 9
• Section VII includes a Conclusion and Recommendations. 10
11
II. SUMMARY AND OVERVIEW 12
13
Q. WHAT DO YOU DISCUSS IN THIS SECTION OF YOUR DIRECT TESTIMONY? 14
A. In this section, I provide an overview of NSPM’s recommended capital 15
structure for 2022 through 2024. 16
17
Q. PLEASE SUMMARIZE NSPM’S PROPOSED CAPITAL STRUCTURE, COSTS OF DEBT 18
AND EQUITY, AND ROR FOR 2022, 2023 AND 2024. 19
A. NSPM’s recommended capital structure for the 2022 test year, including costs 20
of STD, LTD, and Common Equity, is included on Exhibit___(PAJ-1), 21
Schedule 2, Page 1 of 3, and is summarized below. This recommended capital 22
structure, and the capital structures recommended for plan years 2023 and 2024, 23
will allow NSPM to continue to raise capital at competitive pricing in order to 24
keep costs low for customers, will support the credit ratings guidance provided 25
by the three recognized credit rating agencies and will help maintain NSPM’s 26
financial integrity, which I discuss further in Section IV. 27

4 Docket No. E002/GR-21-630 Johnson Direct
1
2
3
4
5
6
7
8
9
10
NSPM’s proposed capital structure for the 2023 plan year is included on 11
Exhibit___(PAJ-1), Schedule 2, Page 2 of 3, and can be summarized as 12
follows: 13
14
15
16
17
18
19
20
21
22
23
24
The Company’s proposed capital structure for the 2024 plan year is included on 25
Exhibit___(PAJ-1), Schedule 2, Page 3 of 3, and can be summarized as follows: 26
Table 1
2022 Test Year
Recommended Capital Structure Ratios and Costs
Percent of Total Capital Cost Weighted
Cost
STD 0.61% 0.94% 0.01% LTD 46.89% 4.13% 1.94% Common Equity 52.50% 10.20% 5.36%
Total Capital 100.00% 7.31%
Table 2
2023
Recommended Capital Structure Ratios and Costs
Percent of Total Capital Cost Weighted
Cost
STD 1.00% 0.80% 0.01% LTD 46.50% 4.12% 1.91% Common Equity 52.50% 10.20% 5.36% Total Capital 100.00% 7.28%

5 Docket No. E002/GR-21-630 Johnson Direct
1
2
3
4
5
6
7
8
9
Q. HOW DOES THE USE OF A 52.50 PERCENT EQUITY RATIO IN EACH OF THE YEARS 10
OF NSPM’S MYRP COMPARE TO RECENTLY AUTHORIZED CAPITAL STRUCTURES 11
FOR NSPM? 12
A. NSPM’s recommended capital structure of 52.50 percent equity for the 2022 13
test year and for the 2023 and 2024 plan years remains unchanged from the 14
52.50 percent equity ratio authorized by the Commission in rate cases dating 15
back to 2013, and is consistent with authorized capital structures going even 16
farther back in time. NSPM’s authorized equity ratio has ranged between 52.47 17
percent and 52.56 percent over the last several electric general rate case 18
proceedings dating back to 2009. In each of those cases, the Commission 19
agreed with the reasonableness of NSPM’s proposed capital structure. 20
Throughout this time, NSPM has been consistent and transparent in managing 21
its capital structure consistent with the Commission’s authorized capital 22
structure and to ensure NSPM’s financial integrity. NSPM is following those 23
same principles in this proceeding. 24
25
Q. DO YOU BELIEVE THE RECOMMENDED RORS RESULTING FROM YOUR 26
PROPOSED CAPITAL STRUCTURES ARE REASONABLE AND APPROPRIATE? 27
Table 3
2024
Recommended Capital Structure Ratios and Costs
Percent of Total Capital Cost Weighted
Cost
STD 0.42% 1.47% 0.01% LTD 47.08% 4.09% 1.93% Common Equity 52.50% 10.20% 5.36%
Total Capital 100.00% 7.30%

6 Docket No. E002/GR-21-630 Johnson Direct
A. Yes. NSPM’s recommended RORs for 2022 through 2024 are reasonable, as 1
discussed in Mr. D’Ascendis direct testimony, and reflect a decrease from the 2
cost of LTD and STD used in the Commission-approved Settlement of the 3
Company’s 2015 rate case. 4
5
The projected cost of LTD for 2022 through 2024 ranges from 4.09 to 4.13 6
percent, as compared to 4.75 to 4.81 percent authorized in our last rate case. 7
The projected cost of STD for 2022 through 2024 ranges from 0.80 to 1.47 8
percent, as compared to 1.84 to 4.81 percent authorized in the last rate case. It 9
should be noted that, while the cost of debt has decreased, it is due to the 10
current low interest rate environment and NSPM’s credit profile. The 11
recommended Return on Equity (ROE) of 10.20 percent is supported in the 12
Direct Testimony of Company Witness Mr. Dylan D’Ascendis. 13
14
III. STANDARDS AND FUNDAMENTAL CONSIDERATIONS FOR 15
THE NSPM CAPITAL STRUCTURE 16
17
Q. PLEASE SUMMARIZE THE MOST SIGNIFICANT POINTS YOU DISCUSS IN THIS 18
SECTION OF YOUR DIRECT TESTIMONY. 19
A. I discuss the following points: 20
• The basic regulatory standard for reviewing a utility’s capital structure is 21
one of reasonableness. 22
• NSPM’s capital structure satisfies the Commission’s reasonableness 23
criteria, and provides long-term customer benefits, including access to 24
capital markets at favorable terms to finance capital expenditures. That, 25
in turn, allows NSPM to serve its customers safely and reliably and to 26
invest in carbon-free renewable generation to meet Minnesota energy 27

7 Docket No. E002/GR-21-630 Johnson Direct
policy and societal goals and customer expectations and to do so at a 1
competitive cost. 2
• NSPM’s management of its capital structure is based on long-term 3
considerations, including the Commission’s authorized capital structure, 4
credit ratings, future financing plans, the relative capital structures of 5
other utilities, and overall financial market conditions. 6
7
Q. WHAT STANDARD HAS THE COMMISSION USED TO EVALUATE CAPITAL 8
STRUCTURES FOR SETTING UTILITY RATES? 9
A. The Commission has used a reasonableness standard in making capital structure 10
decisions. To determine whether a company’s actual capital structure is 11
reasonable, the Commission has considered: 12
• How the debt and equity ratios for the utility compare to similar utility 13
companies; 14
• Whether the utility’s capital structure is an actual capital structure based 15
on market forces, or is an internal accounting capital structure; 16
• Whether the capital structure supports long-term credit quality given the 17
utility’s capital investment forecast, future financing requirements, and 18
the need to access public capital markets; and 19
• Whether the capital structure provides long-term cost benefits to 20
customers. 21
22
Q. DOES NSPM’S PROPOSED CAPITAL STRUCTURE MEET THE COMMISSION’S 23
STANDARDS AND CRITERIA FOR REASONABLENESS? 24
A. Yes. NSPM’s proposed capital structure meets the Commission’s standards and 25
criteria. NSPM’s capital structure is within a reasonable range of equity ratios 26
for the Utility Proxy Group, as Mr. D’Ascendis’s analysis shows. Further, 27

8 Docket No. E002/GR-21-630 Johnson Direct
NSPM’s proposed capital structure is an actual, market-based capital structure 1
and is comparable to its historical capital structure and consistent with the 2
Commission’s last authorized capital structure. NSPM’s historical capital 3
structure has provided long-term benefits to customers by providing reasonable 4
costs of capital and sufficient access to capital markets in a wide range of market 5
conditions to finance capital investments. Finally, the Commission has 6
consistently found NSPM’s recommended capital structures to be reasonable 7
and the requested equity ratio in this case is identical to the equity ratio approved 8
in Docket No. E002/GR-13-868 and utilized in the Settlement of the 2015 rate 9
case, and is in line with the approved equity ratio in the three cases prior to 10
those proceedings (Docket Nos. E002/GR-12-961, E002/GR-10-971, and 11
E002/GR-08-1065). 12
13
Q. HOW DOES NSPM’S 52.50 PERCENT EQUITY RATIO COMPARE WITH THE EQUITY 14
RATIOS OF MR. D’ASCENDIS’S UTILITY PROXY GROUP? 15
A. NSPM’s 52.50 equity ratio is well within the range of equity ratios maintained 16
by Mr. D’Ascendis’s Utility Proxy Group. As shown on page 2 of 17
Exhibit___(DWD-1), Schedule 3, common equity ratios of the utilities range 18
from 31.06 percent to 56.14 percent for fiscal year 2020. Taking this a step 19
further, the equity ratios maintained by the operating subsidiaries of Mr. 20
D’Ascendis’s Utility Proxy Group ranged from 41.41% to 54.98% for fiscal year 21
2020.1 22
23
No matter what range is analyzed, NSPM’s requested equity ratio of 52.50% 24
falls within the range and therefore, should be considered reasonable for rate 25
making purposes. 26
1 Exhibit DWD-1, Schedule 3, Page 3.

9 Docket No. E002/GR-21-630 Johnson Direct
Q. WHEN YOU DESCRIBE NSPM’S CAPITAL STRUCTURE AS AN ACTUAL AND 1
MARKET-BASED CAPITAL STRUCTURE, WHAT DOES THAT MEAN? 2
A. NSPM is a separate, stand-alone legal Minnesota corporation that manages its 3
own separate capital structure consistent with the regulatory and financial risk 4
prevailing at the operating company level and within its respective jurisdictions. 5
Moody’s, Fitch and Standard and Poor’s (S&P) all assign credit ratings to NSPM 6
as a corporate entity and to each one of its individual bond issuances. NSPM 7
files its own quarterly and annual financial statements with the Securities and 8
Exchange Commission (SEC), which credit rating agencies and investors use to 9
analyze the company. In addition, debt to support capital expenditures and 10
operations of NSPM is issued specifically by the NSPM legal entity. 11
12
It is important to note that although the Commission may view the Electric and 13
Gas Departments as different entities, from a financial statement perspective, 14
these are both under the umbrella of one company. 15
16
Q. WHAT FACTORS ARE CONSIDERED IN PLANNING AND MANAGING THE CAPITAL 17
STRUCTURE FOR NSPM? 18
A. NSPM considers a number of factors, including: 19
• Credit rating evaluations that reflect rating agency assessments of 20
NSPM’s business and financial risk; 21
• NSPM’s long-term construction cycle and the scale of its capital 22
investments; 23
• Capital structures of other vertically-integrated, regulated utilities; 24
• The long-term stability of the capital structure being appropriately 25
matched with the long lives of the NSPM’s asset investments; 26
• The current macroeconomic outlook and associated risk factors affecting 27

10 Docket No. E002/GR-21-630 Johnson Direct
the utility sector and capital markets generally; 1
• The need to manage the maturities of LTD to avoid excessive refinancing 2
risk in any given year; and 3
• The Commission’s authorized capital structure. 4
5
Q. DO YOU HAVE A TARGET FOR MANAGING NSPM’S EQUITY RATIO? 6
A. Yes. NSPM continues to target a regulated capital structure having an equity 7
ratio of 52.50 percent, which supports NSPM’s current credit ratings and 8
projected cost of long-term and short-term debt, as well as providing continued 9
access to capital markets in varying market conditions and at an attractive cost 10
of capital. 11
12
Q. WHY IS THAT TARGET EQUITY RATIO APPROPRIATE? 13
A. The 52.50 percent target equity ratio has long-supported NSPM’s current S&P 14
A- and Moody’s A2 corporate credit ratings, and NSPM aims to continue to 15
maintain these ratings. NSPM believes that its current corporate credit ratings 16
provide access to financing at a low cost, especially while making significant 17
capital investments to provide safe and reliable service to customers and 18
support the clean energy transition that enable shared carbon reduction goals. 19
As discussed earlier, the target regulated equity ratio of 52.50 percent is also 20
consistent with other utility capital structures, as shown by the equity ratios of 21
Mr. D’Ascendis’s Utility Proxy Group. 22
23
Q. HOW DO CUSTOMERS BENEFIT FROM NSPM’S CAPITAL STRUCTURE AND 24
EQUITY RATIO? 25
A. NSPM’s capital structure and equity ratio have a significant effect on its financial 26
integrity. NSPM’s financial integrity is essential to: (i) its ability to finance its 27

11 Docket No. E002/GR-21-630 Johnson Direct
investments and operations at a competitive cost in all market conditions; and 1
(ii) maintain its credit ratings. NSPM’s capital structure has allowed it to 2
simultaneously finance its ongoing investments and maintain access to capital 3
at competitive rates while also maintaining its credit ratings. NSPM’s S&P, 4
Moody’s and Fitch’s corporate credit ratings and credit outlook have remained 5
stable for over a decade. In addition, NSPM has maintained its financial 6
strength to ensure consistent access to capital markets under a range of 7
economic conditions and raise the capital required to efficiently fund its future 8
investments, such as its investments in renewable energy. Finally, the lower 9
proposed cost of debt in this proceeding, made possible in part by the 10
Company’s credit ratings, compared to that authorized in the Company’s last 11
rate case, provides a tangible benefit to our customers. 12
13
Q. WHAT DOES THE TERM “FINANCIAL INTEGRITY” MEAN? 14
A. Financial integrity refers to a company’s financial strength and its ability to 15
attract capital in varying economic conditions. The ability to attract capital at a 16
competitive cost in various economic conditions is integral to a utility’s 17
obligation to provide safe, reliable and affordable utility service to customers. 18
Financial integrity ensures that the utility will have the flexibility to withstand 19
unanticipated macroeconomic events outside of its control, such as the 2008-20
2009 financial crisis or more recently, the COVID-19 pandemic. 21
22
Q. WHAT FACTORS CONTRIBUTE TO A UTILITY’S FINANCIAL INTEGRITY? 23
A. The financial integrity of a regulated utility is largely a function of its capital 24
structure, ROE, and cash flow, but can be impacted by other factors as well. 25
To maintain a strong financial profile, a utility needs to have the opportunity to 26
recover all prudently-incurred utility costs in a timely manner, which includes 27

12 Docket No. E002/GR-21-630 Johnson Direct
not only the costs for capital investments and operations and maintenance 1
expense, but also the costs of servicing debt and providing a fair return for 2
equity investors. This is why constructive and consistent regulatory decisions 3
on capital structure, ROE and the recovery of prudent utility costs are vitally 4
important to NSPM. 5
6
IV. NSPM’S CAPITAL EXPENDITURE PLAN, CREDIT RATINGS 7
AND THE REGULATORY ENVIRONMENT 8
9
Q. PLEASE SUMMARIZE THE KEY POINTS YOU DISCUSS IN THIS SECTION OF YOUR 10
DIRECT TESTIMONY. 11
A. The key points are as follows: 12
• NSPM’s capital expenditure program has resulted in corresponding 13
issuances of debt by NSPM as well as equity infusions from Xcel Energy. 14
• NSPM expects to continue to make significant capital investments in 15
Minnesota, which requires future access to capital at favorable rates. 16
• Constructive and balanced regulatory decisions are very important to 17
both debt and equity investors, rating agencies, and financial analysts. 18
• NSPM’s credit ratings remain strong, but are dependent on NSPM’s 19
business and financial risk, which can be impacted by both favorable and 20
unfavorable regulatory decisions. 21
22
A. NSPM Capital Expenditures and Financial Implications 23
Q. PLEASE SUMMARIZE THE HISTORICAL CONTEXT FOR NSPM’S CAPITAL 24
EXPENDITURES PROGRAM. 25
A. NSPM has engaged in a large-scale capital expenditure program for necessary 26
investments in its system as well as investment in carbon-free renewable 27
13 Docket No. E002/GR-21-630 Johnson Direct
generation to meet Minnesota energy policy and societal goals and customer 1
expectations. As shown on Exhibit___(PAJ-1), Schedule 3, during the period 2
2011 through 2020, NSPM made capital expenditures of approximately $13.2 3
billion in its combined gas and electric utility business. As examples, NSPM’s 4
investments in wind generation and new transmission projects required 5
significant capital investment during this period. In addition, NSPM has been 6
making ongoing investments to modernize and support its distribution and 7
transmission infrastructure, as discussed by Company witnesses Ms. Kelly 8
Bloch and Mr. Ian Benson. 9
10
These and other ongoing investments make it critical that NSPM maintain a 11
strong financial position, so that it can access the capital markets at competitive 12
rates. Investors and credit rating agencies are very focused on Commission 13
decisions on equity ratio, ROE and cost recovery. These decisions can have a 14
significant impact on investor and credit rate agency perceptions, which will 15
impact future cost of capital. 16
17
Q. HOW DO FORECAST CAPITAL EXPENDITURE LEVELS COMPARE TO PRIOR YEARS? 18
A. Exhibit___(PAJ-1), Schedule 3 shows that NSPM’s forecasted capital 19
expenditures for 2021 through 2024 are approximately $8.3 billion (91 percent 20
of which is for the electric operations) or an average of approximately $2.1 21
billion ($1.9 billion for electric) per year. This level of forecasted capital 22
expenditures is higher than the historical average during 2016 through 2020 due 23
to the projects noted earlier. As discussed by Company witnesses Mr. Gregory 24
Chamberlain and Mr. Randy Capra, the Company plans to make significant 25
investments in wind and solar resources over the term of the MYRP as it 26
continues to transition its generation fleet to carbon-free resources. 27

14 Docket No. E002/GR-21-630 Johnson Direct
Q. HOW DOES NSPM’S CAPITAL EXPENDITURE FORECAST AFFECT FINANCING 1
PLANS AND INVESTOR EXPECTATIONS? 2
A. To fund its forecasted capital expenditures, NSPM will need to access the capital 3
markets in each year 2022 through 2024. It is therefore important for NSPM 4
to meet investor expectations and maintain its current credit ratings to continue 5
to be able to obtain financing at competitive rates. To do so, it is important 6
that NSPM receives timely recovery of the costs of its investments and 7
operations and a reasonable overall cost of capital. 8
9
Q. HAS NSPM RECENTLY ISSUED LTD, AND WILL NSPM NEED TO ISSUE LTD IN 10
THE 2022 TO 2024 TIME PERIOD? 11
A. Yes. NSPM issued a $850 million “Green” First Mortgage Bond on March 30, 12
2021. NSPM is projected to issue debt in each of the years 2022 through 2024. 13
The precise size, timing and tenor of debt issuances will depend on prevailing 14
financial market conditions and trends at the time of issuance. The forecast 15
included in Schedules 4, 5 and 6 reflect the most recent forecast information 16
available. 17
18
Q. WHAT IS A “GREEN” FIRST MORTGAGE BOND? 19
A. Green bonds are a type of fixed-income instrument that is earmarked to raise 20
funds for climate and environmental related projects. In NSPM’s case, the 21
green bonds issued to date (one each in 2019, 2020 and 2021) have been tied to 22
financing investments in wind projects. 23
24
Q. DO NSPM’S CUSTOMERS BENEFIT FROM GREEN BONDS? 25
A. Yes. The main benefit of issuing green bonds is to diversify NSPM’s investor 26
base by attracting environmentally focused investors, which are becoming 27

15 Docket No. E002/GR-21-630 Johnson Direct
increasingly more common. A larger pool of investors leads to increased 1
investor demand during a bond issuance, which in turn adds pressure on 2
investors to accept a lower return on the debt, lowering our overall cost of LTD 3
paid by Minnesota customers. Simply, by expanding our customer pool for our 4
debt, green bonds can lower our financing costs, thereby lowering our cost of 5
service. 6
7
Additionally, Minnesota customers have called for increased renewable energy, 8
and Xcel Energy continues to strive to deliver carbon-free options reliably and 9
at a reasonable cost to our customers, as discussed further by Company witness 10
Mr. Gregory Chamberlain. These green bonds bring global attention to the 11
advances Minnesota has made in implementing wind energy into our grid. 12
13
Q. IS THERE EMPIRICAL DATA TO SUPPORT YOUR CLAIM THAT NSPM’S CUSTOMERS 14
BENEFIT FROM ISSUING GREEN BONDS? 15
A. Yes. In 2019, NSPM issued $600 million in green bonds with an interest rate, 16
or “coupon,” of 2.90 percent, setting the record for the lowest coupon on 30-17
year bonds in utility industry history at the time of the issuance. In 2020, NSPM 18
broke its own record with its issuance of $700 million in green bonds with a 19
coupon of 2.60 percent. Again, NSPM set a new record with the lowest coupon 20
on 30-year bonds in utility industry history at the time of issuance. 21
22
Additionally, in the secondary trading markets (i.e., after the bond is originally 23
placed), green bonds have been shown to trade at tighter levels than standard 24
or non-green first mortgage bonds. For example, as of September 2021, green 25
bonds issued by NSPM were trading at tighter credit spreads (or the amount 26
added to prevailing U.S. Treasury rates to determine the overall coupon) than 27

16 Docket No. E002/GR-21-630 Johnson Direct
its standard first mortgage bonds. 1
2
Trading at tighter levels in the secondary market demonstrates the ever-3
increasing appetite that fixed-income investors have for green bonds in today’s 4
market – a trend that is expected to continue to grow. 5
6
Q. WHAT ARE NSPM’S OBJECTIVES WHEN ISSUING LTD? 7
A. The primary objectives of NSPM’s debt financing strategy are to minimize debt 8
costs and exposure to potential adverse market conditions in the future, 9
maximize financing flexibility, maintain a strong liquidity profile and maintain a 10
strong investment grade credit rating. 11
12
Q. WHY DOES MAINTAINING FINANCIAL INTEGRITY BENEFIT NSPM’S 13
CUSTOMERS? 14
A. Financial integrity directly affects both NSPM’s ability to access capital to invest 15
in infrastructure necessary to continue to provide safe and reliable utility service 16
as well as its cost of that capital, which is ultimately included in NSPM’s 17
customer rates. Attracting competitively priced capital in varying market 18
conditions, including unexpected macroeconomic events outside the 19
Company’s control, such as the COVID-19 pandemic, is also critical to 20
maintaining the ability to invest in the infrastructure necessary for NSPM to 21
provide safe and reliable utility service to its customers. 22 23 It is important to note, however, that the question of a utility’s financial integrity 24
is not necessarily binary (i.e., does a utility have financial integrity or not); rather, 25
the degree of financial integrity and therefore, the cost of capital available to a 26
utility, lies on a spectrum. Weaker financial integrity at a utility increases the 27

17 Docket No. E002/GR-21-630 Johnson Direct
issued cost of debt and the implied cost of equity, which increases the overall 1
weighted average cost of capital (WACC) and the ultimate financing costs paid 2
by customers. Strong financial integrity has the opposite effect, which in turn 3
provides a direct benefit to customers. Financial integrity and strong credit 4
ratings become even more important when the capital markets are in distress 5
and access to capital and liquidity can be critical. 6
7
B. Importance of Credit Ratings and a Healthy Regulatory 8
Environment 9
Q. CAN YOU EXPLAIN CREDIT RATINGS IN MORE DETAIL? 10
A. Yes. A credit rating measures credit risk, which is the ability and willingness of 11
an issuer to fulfill its financial obligations in full and on time. Credit ratings 12
help debt investors differentiate between companies – who are competing for 13
the same investment dollars. The credit ratings assigned by rating agencies 14
indicate their opinions of a company’s ability to meet its financial obligations. 15
Rating agency opinions are considered valuable by potential investors because 16
they represent independent, third-party opinions that are based upon a 17
consistent approach to the evaluation of company risk over time. Ratings affect 18
the number of potential investors and the cost of a company’s debt, and they 19
offer important insight into a company’s investment risk in the past and future. 20
21
During the period 2016 to 2021 year to date (YTD)2, debt investors have 22
provided approximately $676 billion of capital investment to the U.S. utility 23
sector. Capital provided from these investors allows utilities to fund a portion 24
of their capital investment programs. See Chart 1 below. 25
26
2 As of September 28, 2021.

18 Docket No. E002/GR-21-630 Johnson Direct
Chart 1: 2014-August 2020 Debt Amount 1
Issued to the U.S. Utility Sector3 2
3
4
5
6
7
8
9
10
11
12
In order to attract capital at favorable rates in a competitive environment, 13
protecting and maintaining NSPM’s credit ratings is critical. This point 14
becomes even more critical in a volatile market environment, as recently 15
evidenced during the COVID-19 pandemic. Utilities with higher credit ratings 16
are associated with reduced risk, which attract investors at a lower cost of debt 17
(i.e., lower average credit spreads) and favorably positions such utilities relative 18
to lower-rated comparable companies. Generally, the stronger the Company’s 19
credit ratings, the larger the pool of investors willing to consider investing in the 20
Company’s debt and the less the Company will need to pay in fees and interest 21
in order to issue debt. Investment-grade credit ratings are crucial because the 22
cost of debt increases very rapidly – and the number of potential investors 23
decreases substantially – for those companies rated near the bottom of or below 24
investment grade. 25
26
3 Source: Bloomberg

19 Docket No. E002/GR-21-630 Johnson Direct
Further, credit ratings take on greater importance when economic conditions 1
worsen and access to capital markets becomes more difficult. As credit 2
availability tightens, investors become increasingly more selective regarding 3
which companies qualify for their investment dollars. Therefore, lower credit 4
ratings reduce or eliminate access to capital markets and significantly increase 5
the cost of capital during times of market distress. 6
7
Q. HOW DO CREDIT RATINGS AFFECT NSPM’S COST OF CAPITAL? 8
A. LTD is priced based on the underlying Treasury rate plus a credit spread, which 9
is primarily based on NSPM’s credit rating and investors perception of the 10
Company. In general, the lower the credit rating, the higher the credit spread. 11
Issuing debt at a higher rate will increase the cost of LTD for NSPM, which is 12
ultimately paid by NSPM’s customers. 13
14
Equity investors also look at credit ratings. Because the income available to 15
common equity holders is subordinate to debt obligations, the weakening of a 16
company’s creditworthiness also increases the cost of equity. 17
18
Ultimately, customers of the higher-rated utility benefit from the lower capital 19
costs as these costs are ultimately borne by customers. 20 21
Q. DO CREDIT SPREADS DIFFER BASED ON CREDIT RATINGS? 22
A. Yes. Lower credit ratings are seen as riskier and therefore investors demand 23
a higher spread. Chart 2 below shows that, in general, the credit spreads of 24
BBB rated utility companies are historically wider than those of A rated utility 25
companies, especially in times of market volatility.4 For example, the average 26
4 Source: Bloomberg

20 Docket No. E002/GR-21-630 Johnson Direct
difference in credit spreads between A and BBB rated utilities over the course 1
of June 2009 to June 2021 (i.e., the timeframe displayed in the chart below) is 2
approximately 40 basis points. Howevere, in periods of market volatility, the 3
credit spread difference between A and BBB rated utilities can increase 4
dramatically. In June 2009, the average difference in credit spreads between 5
A and BBB rated utilities was approximately 100 basis points. More recently, 6
towards the second half of March 2020, due to the market volatility related to 7
the COVID-19 pandemic, the difference in credit spreads was approximately 8
75 basis points. 9
10
Chart 2: A vs. BBB Rated Utility Spreads 11
June 2009 – June 2021 12
13
14
15
16
17
18
19
20
21
Q. HAVE NSPM’S FINANCIAL STRENGTH AND CREDIT RATINGS HAD A POSITIVE 22
EFFECT ON ITS COST OF LTD AND ITS RECENT LTD ISSUANCES? 23
A. Yes. NSPM’s historical financial strength and credit ratings have had a 24
positive effect on both NSPM’s weighted cost of LTD and the rates for its 25
recent LTD issuances. These effects confirm that customers and investors 26
have a common interest in maintaining NSPM’s financial strength. 27

21 Docket No. E002/GR-21-630 Johnson Direct
Maintaining a strong balance sheet and credit metrics, and otherwise meeting 1
expectations of the investor community, has enabled NSPM to secure more 2
favorable borrowing costs, which lowers overall costs and provides substantial 3
long run benefits to customers. 4
5
Q. HOW IS A CREDIT RATING ESTABLISHED? 6
A. Credit rating agencies assign credit ratings based on in-depth analysis and 7
review. The analysis centers on two main areas: qualitative analysis and 8
quantitative analysis. The qualitative side is the assessment of business risk, 9
which is comprised first of the broad risks prevailing at the country, industry 10
and state level. The issuer’s more specific risk within its business and 11
economic environment is then considered. For a utility, regulatory risk is the 12
most significant business risk. The quantitative side of the analysis examines 13
financial ratios to analyze the financial risk of the issuer. 14
15
Business risk and financial risk can be viewed as complementary sides of the 16
total risk or investment risk of an entity, so that more of one risk must be 17
offset by less of the other risk to arrive at a specific rating. Because regulation 18
has a significant impact on the financial results of utilities, regulatory risk is a 19
key consideration in ratings outcomes and receives significant attention from 20
credit rating agencies.5 21
22
Q. HOW MUCH WEIGHT IS PLACED ON REGULATORY RISK BY CREDIT RATING 23
AGENCIES? 24
A. For Moody’s, regulatory risk constitutes up to 60 percent of the credit profile, 25
5 Schedule 7 at 2 and 4-5 and Schedule 8 at 4.

22 Docket No. E002/GR-21-630 Johnson Direct
and for S&P, it is up to 80 percent.6 Both focus on the basic regulatory 1
framework, including (1) the legal foundation for utility regulation, (2) the 2
ratemaking policies and procedures that determine how well the utility is 3
afforded the opportunity to earn a reasonable return with reasonable cash 4
flow, and (3) the history of regulatory behavior by commissions applying those 5
laws, policies and procedures. Then, they examine the mechanics of 6
regulation, particularly the rate-setting process. 7
8
Q. WHAT OTHER CONSIDERATIONS GO INTO DETERMINING REGULATORY RISK? 9
A. Credit rating agencies also place high value on transparency, predictability, and 10
consistency in regulatory outcomes.7 Utilities fund capital expenditures 11
primarily with long-dated maturities to match the long-lived assets. Credit 12
rating agencies regard fixed income investors (who extend credit over long 13
periods) as their primary audience and strive to rate LTD as accurately as 14
possible. Utility investors value ratings that are stable and accurate. 15
Regulatory frameworks and practices that are viewed as constructive, 16
transparent, consistent and predictable allow rating agencies to more 17
accurately project future cash flows and debt leverage and will result in a better 18
business risk profile. This predictability offers creditors the ability to 19
accurately assess risk over most of the debt’s term and improves the ability of 20
the company to manage its business activities and capital program for the 21
long-term benefit of ratepayers. 22
6 Schedule 9 at 4 (Regulatory Framework (25%) + Ability to Recover Costs and Earn Returns (25%) +
Diversification (10%)) and Schedule 10 at 6,9 (Competitive Advantage (60%) + Scale, Scope and Diversity (20%)).
7 Schedule 9 at 10 and Schedule 10 at 6-8.

23 Docket No. E002/GR-21-630 Johnson Direct
Q. HAVE CREDIT RATING AGENCIES COMMENTED ON THE IMPORTANCE OF THE 1
REGULATORY FRAMEWORK IN EVALUATING A UTILITY’S FINANCIAL 2
INTEGRITY? 3
A. Yes. S&P has noted that the regulatory framework “is of critical importance 4
when assessing regulated utilities’ credit risk because it defines the 5
environment in which a utility operates and has a significant bearing on a 6
utility’s financial performance.”8 S&P observes further that “[w]e base our 7
assessment of the regulatory framework’s relative credit supportiveness on our 8
view of how regulatory stability, efficiency of tariff setting procedures, 9
financial stability, and regulatory independence protect a utility’s credit quality 10
and its ability to recover its costs and earn a timely return.”9 11
12
Q. SHOULD THE COMMISSION CONSIDER REGULATORY RISK WHEN DECIDING 13
THE OUTCOME OF THIS PROCEEDING? 14
A. Yes. Credit rating agencies have emphasized the importance of balanced, 15
consistent, and constructive outcomes in utility rate proceedings. Such 16
regulatory outcomes convey to the rating agencies the credit-positive 17
relationships between companies and commissions, which in turn may lower 18
the perceived risk for external investors and result in lower debt costs. 19
20
Q. WHAT FINANCIAL CONSIDERATIONS CONSTITUTE THE QUANTITATIVE SIDE 21
OF CREDIT ANALYSIS? 22
A. Credit analysis focuses on cash flow. Credit analysts strive to understand the 23
cash-flow dynamics of a company’s financial results, because servicing debt 24
requires cash not just earnings. A recent example of this is the effect of tax 25
8 Schedule 10 at 6. 9 Schedule 10 at 6.

24 Docket No. E002/GR-21-630 Johnson Direct
reform on utilities, which placed downward pressure on utility ratings because 1
of its negative cash-flow impact despite relatively neutral earnings 2
implications. The primary measure that rating agencies use for most cash-3
flow metrics is cash from operations (CFO) or some derivation of it.10 The 4
other major element of financial risk to a credit analyst is the total amount of 5
debt or debt-like obligations (also referred to as imputed or off-balance sheet 6
debt) on the issuer’s balance sheet. Items that the rating agencies regard as 7
debt-like adjustments include lease liabilities, long-term power purchase 8
obligations, pension obligations, and asset-retirement obligations. 9
10
Q. WHAT ARE THE PRIMARY FINANCIAL METRICS THAT CREDIT RATING 11
AGENCIES ANALYZE? 12
A. The primary financial metrics evaluated by the major credit rating agencies 13
include some version of the following coverage ratios: (i) the ratio of funds 14
from operations or cash from operations to total debt (FFO/Total Debt or 15
CFO/Debt); (ii) the ratio of funds from operations or cash from operations 16
to interest (FFO/Interest or CFO/Interest) and; (iii) the ratio of debt to 17
earnings before interest, taxes, depreciation, and amortization 18
(Debt/EBITDA). These financial metrics are a composite measure of the 19
utility’s ability to manage its debt burden over time and to meet its financial 20
obligations as they come due. The greater the business risk, the stronger these 21
financial metrics must be to maintain the same credit ratings to provide 22
sufficient evidence to the credit rating agencies and investors that the company 23
can withstand the financial effect of both macroeconomic and company-24
10 For Moody’s, their derivation of the CFO measurement is “CFO pre-working capital.” S&P refers to this measure as funds from operations (FFO). Both Moody’s and S&P compare there derivation of CFO to the overall debt burden.

25 Docket No. E002/GR-21-630 Johnson Direct
specific risks. 1
2
Q. WHAT TYPES OF DEBT OBLIGATIONS DO RATING AGENCIES INCLUDE IN 3
THEIR CREDIT METRICS CALCULATIONS? 4
A. The total debt calculated by rating agencies includes debt and debt-like 5
obligations, including on-balance sheet obligations such as finance and 6
operating leases, as well as off-balance sheet obligations. Off-balance sheet 7
obligations are payment obligations (such as long term purchase power 8
obligations, pension obligations, and asset retirement obligations) that do not 9
appear on the balance sheet as debt; however, rating agencies may treat them as 10
debt because the utility has little or no discretion whether to pay for these 11
obligations.11 12
13
Q. WHAT IS THE SIGNIFICANCE TO THIS RATE CASE OF THE RATIOS THE CREDIT 14
RATING AGENCIES EVALUATE? 15
A. This rate case outcome will affect both the business risk and the credit metrics. 16
Investors and credit rating agencies will assess the rate case outcome to 17
determine if the regulatory risk has changed. The rate case outcome will also 18
allow investors and credit rating agencies to update their projections and credit 19
metrics to determine whether a company will be able to service its existing 20
debt obligations at the required level and will have the flexibility to take on 21
incremental debt. Including existing off-balance sheet obligations in 22
calculating a company’s total debt affects many of the financial metrics the 23
rating agencies rely upon. In general, the higher the proportion of debt in a 24
capital structure, the more downward pressure on cash flow metrics and credit 25
ratings, and upward pressure cost of capital to the utility and its customers. 26
11 See Schedules 9, 10, and 11 for a discussion of adjustments for off-balance sheet obligations.

26 Docket No. E002/GR-21-630 Johnson Direct
Q. PLEASE EXPLAIN THE RATING AGENCY SCALES. 1
A. Credit rating agencies provide ratings for both the business entity as a whole 2
and for the various debt issuances of the entity. The investment-grade rating 3
categories include the High Grade (Triple-A and Double-A) and the Medium 4
Grade category (Single-A and Triple-B ratings). The ratings are generally 5
further delineated by S&P through the use of pluses or minuses to show a 6
company’s relative standing within the categories, while Moody’s uses numbers 7
to show a company’s standing within a category. The highest investment-grade 8
rating is AAA; the lowest investment-grade rating is BBB-. Debt rated BB+ or 9
below is considered speculative grade or junk bonds. 10
11
Q. WHAT ARE THE COMPANY’S CURRENT CREDIT RATINGS? 12
A. The Company’s current credit ratings are: 13
14
15
16
17
18
19
20
21
There have been no changes in the credit ratings since the last MYRP filing. 22
23
Q. HOW DO THE COMPANY’S CREDIT METRICS COMPARE TO THE S&P AND 24
MOODY’S CRITERIA? 25
A. Exhibit___(PAJ-1), Schedule 12, Page 1, shows NSPM’s forecasted credit 26
metrics as compared to S&P guidelines. The metrics are within the target ranges 27
Table 4
NSPM Current Credit Ratings
Fitch Moody’s Moody’s
S&P Equivalent
S&P
Corporate Rating
A- A2 A- A-
Senior Secured A+ Aa3 A A

27 Docket No. E002/GR-21-630 Johnson Direct
for NSPM’s current credit ratings. Exhibit___(PAJ-1), Schedule 12, Page 2, 1
shows NSPM’s forecasted credit metrics as compared to Moody’s guidelines. 2
The main metrics are generally within these target ranges. Overall, the 3
Company expects that its recommended capital structure and the forecasted 4
financial metrics will continue to support and maintain its current credit ratings 5
over the 2022 to 2024 time period. 6
7
Q. WHY IS IT IMPORTANT FOR NSPM TO MAINTAIN ITS A- CORPORATE RATING? 8
A. Earlier in my Direct Testimony, I demonstrated that the credit spreads between 9
an A and BBB rated company can be significant, especially during times of 10
market volatility or distress. This is a real cost that affects what rates the 11
customers pay. To further support this position, Dr. Roger Morin, a noted 12
expert on regulatory finance, analyzes the optimal capital structure for utilities 13
in his book New Regulatory Finance. Based on that analysis, Dr. Morin concludes 14
that an A rated utility is in the best interest of the customers and utilities: 15
16
“The message from the model is clear: over the long run, a strong 17
A bond rating will minimize the pre-tax cost of capital to 18
ratepayers. Long term achievement of at least an A rating is in 19
the electric utility company’s and ratepayers’ best interests. 20
The model results show that on an incremental cost basis, a strong A 21
bond rating generally results in the lowest pre-tax cost of capital for 22
electric utilities, especially under adverse economic conditions, which 23
are far more relevant to the question of capital structure.”12 24
12 Roger A. Morin, New Regulatory Finance 515 (2006).

28 Docket No. E002/GR-21-630 Johnson Direct
Q. WHAT IS THE SIGNIFICANCE OF RATEMAKING-RELATED FINANCIAL METRICS 1
SUCH AS ROE, EQUITY RATIO/CAPITAL STRUCTURE, AND TIMELINESS AND 2
RELIABILITY OF COST RECOVERY? 3
A. I will address each component in turn: 4
• First, the authorized ROE and equity ratio affect NSPM’s earnings and 5
cash flows, which directly affect its ability to fund capital investment. In 6
addition to credit ratings, investors also assess the capital structure and 7
ROE when making judgements about the credit quality of a regulatory 8
jurisdiction. As such, the ROE/equity ratio combination is a powerful and 9
effective communication tool to underscore the interest of regulators in 10
attracting capital to provide safe, reliable and environmentally-sound 11
electric service to customers. 12
• Second, the capital structure and authorized costs directly affect all 13
NSPM’s key credit metrics because either total debt or interest expense is 14
a component of each of the primary credit metrics that rating agencies 15
analyze. The credit rating agencies also evaluate the relative amounts of 16
debt and equity in the capital structure to determine whether a company is 17
appropriately capitalized given its business risk profile and to determine 18
whether the company has the ability to make interest payments, repay 19
existing debt and issue additional new debt to fund its utility capital 20
expenditures. The credit rating agencies are very concerned with a 21
company’s liquidity to meet its short-term capital needs under conditions 22
of financial stress, and they factor in the debt portfolio maturity schedule 23
and other future obligations as part of this assessment. 24
• Third, debt and equity investors expect NSPM to be able to recover its 25
costs in a timely manner and to have a reasonable opportunity to earn its 26
authorized ROE. Investors and rating agencies track the decisions of 27

29 Docket No. E002/GR-21-630 Johnson Direct
regulatory agencies relating to capital structure, cost of debt, ROE, cost 1
recovery and forward-looking cost recovery mechanisms. They categorize 2
the state regulatory environments in their assessment of the relative risks 3
of different utility investment opportunities. 4
• Finally, investors prefer certainty and will demand a higher return for what 5
they perceive as greater risk. For regulated utilities, investors prefer 6
constructive, consistent, transparent and predictable regulatory 7
environments because this reduces risk and enables investors to generate 8
predictable returns. 9
10
Q. CAN YOU FURTHER EXPLAIN WHY THE COMMISSION’S DECISIONS FOR NSPM 11
ARE PARTICULARLY IMPORTANT TO THE INVESTOR COMMUNITY? 12
A. Investors – both debt and equity – and credit rating agencies understand the 13
importance of the regulatory environment on the business risks of utilities. 14
Credit rating agencies and investors also know that NSPM has investments 15
weighted heavily toward its electric business and that NSPM’s customers are 16
concentrated in Minnesota, making the Minnesota retail electric jurisdiction 17
NSPM’s primary jurisdiction. Finally, rating agencies and bond and equity 18
investors know that the Commission is fully informed about NSPM’s 19
investment plans through the various dockets before the Commission. As a 20
result, these agencies and investors will likely consider the Commission’s 21
decisions regarding the financial components of the overall ROR and electric 22
rates as a reflection of the level of support for NSPM’s investment plans, 23
including the investments necessary to carbon reduction goals. Therefore, the 24
Commission’s decisions not only have an important impact on NSPM’s ability 25
to maintain its financial integrity and allow us to access low cost capital, they will 26
impact NSPM’s ability to achieve its broader business and environmental goals. 27

30 Docket No. E002/GR-21-630 Johnson Direct
V. PROPOSED CAPITAL STRUCTURE, COST OF DEBT, AND 1
RATE OF RETURN 2
3
Q. PLEASE SUMMARIZE THE MOST SIGNIFICANT POINTS YOU DISCUSS IN THIS 4
SECTION OF YOUR DIRECT TESTIMONY. 5
A. The most significant points I discuss include the following: 6
• The components of LTD, STD, and common equity for 2022, 2023 and 7
2024 have been determined using the same methodology that have been 8
used in prior rate cases. 9
• NSPM’s proposed capital structures for 2022, 2023 and 2024 are very 10
consistent to the capital structure adopted in the last rate case. 11
• The costs of LTD and STD have also been determined using the same 12
methodology that have been used in prior cases. 13
• The size of NSPM’s short term credit facility is reasonable and has not 14
changed since the last MYRP. 15
• The Utility Money Pool provides public interest benefits to NSPM’s 16
customers. 17
18
Q. PLEASE SUMMARIZE THE COMPONENTS OF NSPM’S RECOMMENDED CAPITAL 19
STRUCTURE AND ROR. 20
A. NSPM’s proposed 2022, 2023 and 2024 capital structures include LTD, STD, 21
and common equity. NSPM’s proposed revenue requirement for 2022 reflects 22
an overall cost of capital or ROR of 7.31 percent, which includes NSPM’s 23
average common equity ratio of 52.50 percent and a 10.20 percent ROE as 24
recommended in Mr. D’Ascendis’s Direct Testimony. NSPM’s proposed ROR 25
for 2023 is 7.28 percent and for 2024 is 7.30 percent, again including NSPM’s 26
average common equity ratio of 52.50 percent and the 10.20 percent ROE 27

31 Docket No. E002/GR-21-630 Johnson Direct
recommended by Mr. D’Ascendis. 1
2
Q. HOW DO NSPM’S 2022, 2023 AND 2024 CAPITAL STRUCTURES COMPARE WITH 3
THE CAPITAL STRUCTURES REFLECTED IN PAST RATE CASES? 4
A. The capital structures for all three years are comparable to the capital structure 5
approved by the Commission in NSPM’s 2013 rate case (Docket No. 6
E002/GR-13-868) and those reflected in the Settlement approved by the 7
Commission in the 2015 rate case. The proposed 52.50 percent equity ratio for 8
all three years match the equity ratios approved in those cases. The LTD ratios 9
for years 2022 through 2024 range from 46.50 to 47.08 percent, compared to 10
2013 and 2015 rate case LTD ratios ranging from 45.60 to 46.41 percent. 11
Finally, the STD ratios of 0.42 to 1.00 percent are comparable to the 2013 and 12
2015 ratios, which ranged from 1.09 to 1.90 percent. 13
14
Q. WHAT METHODOLOGY DID NSPM USE TO DEVELOP BALANCES AND COSTS FOR 15
THE VARIOUS COMPONENTS OF CAPITAL STRUCTURE? 16
A. NSPM’s methodology in this case is consistent with the calculations used and 17
approved by the Commission in prior rate cases. Key points are identified 18
below: 19
• 2022 and 2023 future long and short-term debt interest rates are based 20
on the average between July 2021 Global Insight forecast and July 2021 21
Bloomberg forward curve with an added credit spread (which is based 22
on the current credit rating and reflects current market information). 23
2024 future long and short-term debt interest rates are based on July 2021 24
Global Insight forecast with an added credit spread. The July 2021 25
Global Insight forecast and July 2021 Bloomberg forward curve is 26
attached as Exhibit___(PAJ-1), Schedule 13. 27

32 Docket No. E002/GR-21-630 Johnson Direct
• For forecast purposes, STD is in the form of commercial paper. 1
• STD balances are based on the average of month-end balances for the 2
12 months in the respective year. 3
• LTD balances are based on the average of month-end balances for the 4
12 months in the respective year and include forecasted LTD issuances 5
and retirements during that period. 6
• LTD costs include the coupon rate on all bonds expected to be 7
outstanding for each month of the respective year. In addition to the 8
interest expense, the cost of LTD also includes amortization expense for 9
debt issuance costs, discounts or premiums, losses on reacquired debt, 10
gains and losses from hedging transactions, and the annual amortization 11
of the upfront fees associated with NSPM’s multi-year credit agreement. 12
• Common equity balances represent the average of 13 month-end equity 13
balances from December of the prior year through December of the year 14
analyzed. The common equity balance averages the accounting month-15
end balances consistent with Generally Accepted Accounting Principles 16
(GAAP) and eliminates the non-regulated investments. 17
18
1. LTD 19
Q. WHAT ARE NSPM’S RECOMMENDED 2022-2024 LTD BALANCES AND COSTS? 20
A. See NSPM’s recommended LTD balances and costs for 2022 through 2024 21
included in Table 5, as shown on Exhibit__(PAJ-1), Schedules 4, 5 and 6, 22
respectively, Page 1 of 1. 23

33 Docket No. E002/GR-21-630 Johnson Direct
1
2
3
4
5
6
7
8
Q. ARE THERE ISSUANCES OR RETIREMENTS OF LTD PLANNED FOR 2022 9
THROUGH 2024? 10
A. Yes, NSPM plans to issue $550 million of new LTD in 2022, $850 million in 11
2023 and $450 million in 2024. NSPM has a $300 million debt retirement 12
scheduled in 2022 and a $400 million debt retirement scheduled in 2023. 13
14
Q. HOW DOES THE COMPANY DETERMINE ITS LTD ISSUANCES? 15
A. NSPM forecasts its financing needs over a multi-year period. NSPM generally 16
issues LTD in years when an existing long-term bond is maturing or if existing 17
higher coupon debt can be refinanced at a lower interest rate. In addition, 18
NSPM will issue LTD to replace STD when the STD levels approach or remain 19
above an “index-eligible” bond size of $300 million. All of these factors can 20
affect the amount and timing of a specific bond offering. 21
22
When determining the maturity of a new bond, NSPM considers the existing 23
debt portfolio maturity profile, market conditions, investor demand, the life of 24
the underlying asset portfolio, and the effects on the cost of LTD on the 25
customer. NSPM reviews the existing debt portfolio maturity profile and 26
identifies potential years where maturities are not already scheduled to occur. 27
Table 5
Recommended 2022 through 2024 LTD Balances and Costs
LTD Balance LTD Cost
2022 Test Year $6.9 billion 4.13%
2023 Plan Year $7.3 billion 4.12%
2024 Plan Year $7.7 billion 4.09%

34 Docket No. E002/GR-21-630 Johnson Direct
NSPM staggers new LTD maturities to mitigate refinancing risk or the risk of 1
having large future maturities in any one year that could be exposed to capital 2
market volatility and the associated interest rate risk. 3
4
Q. PLEASE EXPLAIN THE TERM “INDEX ELIGIBLE” AND WHY IT IS IMPORTANT. 5
A. To be included in the Barclays Capital Aggregate Bond Index, a bond must be 6
a minimum size of $300 million. Bonds that trade as a component of the index 7
are more liquid and will generally be priced at a lower credit spread over 8
prevailing U.S. Treasury rates than less liquid bonds, resulting in lower cost to 9
customers. 10
11
Q. DOES NSPM CONSIDER THE POSSIBILITY OF EARLY RETIREMENT OF 12
COMPONENTS OF ITS LTD PORTFOLIO? 13
A. Yes. For example, in 2020, NSPM retired a bond that had provisions that 14
allowed the Company to “call” the bonds without incurring significant added 15
financial obligations known as “make whole” redemption obligations. The 16
bonds currently in the NSPM debt portfolio either: (i) have no call options; (ii) 17
are only callable at par value 3 to 6 months prior to maturity; or (iii) have make 18
whole redemption provisions that are too expensive to exercise because they 19
result in very large premium payments to existing debt holders. NSPM 20
continues to monitor its LTD portfolio to take advantage of refinancing 21
opportunities that could result in lower customer costs. 22
23
2. STD 24
Q. WHAT IS NSPM’S RECOMMENDED 2022 THROUGH 2024 STD BALANCES AND 25
ASSOCIATED COSTS? 26
A. See NSPM’s recommended STD balances and costs for 2022 through 2024 27

35 Docket No. E002/GR-21-630 Johnson Direct
included in Table 6, as also shown on Exhibit__(PAJ-1), Schedule 14, 15 and 1
16, respectively, Page 1 of 1. 2
3
4
5
6
7
8
9
10
11
Q. HOW WAS THE 2022 THROUGH 2024 COST OF STD DETERMINED? 12
A. The cost of STD includes interest expense for commercial paper and the 13
monthly financing fee associated with NSPM’s June 2019 “Amended and 14
Restated Credit Agreement” for its participation in the credit facility, which 15
provides the back-up liquidity required for its commercial paper program. See 16
the Company’s Exhibit__(PAJ-1), Schedule 14, 15 and 16, respectively, Page 1 17
of 1 for a break-out of the STD cost between monthly interest expense relating 18
to commercial paper and the monthly fee expense relating to the credit facility 19
fees. 20
21
Q. HAS THE SIZE OF THE CREDIT FACILITY CHANGED SINCE THE PRIOR CASE? 22
A. No. NSPM’s credit facility remains at the $500 million level. To determine the 23
size of NSPM’s credit facility, NSPM considers liquidity requirements to 24
evaluate the amount of short term credit capacity required, such as: (i) the total 25
capital commitments over the life of the revolving credit agreement, including 26
projected capital investment and scheduled LTD maturities; (ii) the projected 27
Table 6
Recommended 2022 through 2024 STD Balances and Costs
STD Balance STD Cost
2022 Test Year $88.9 million 0.94%
2023 Plan Year $156.6 million 0.80%
2024 Plan Year $68.3 million 1.47%

36 Docket No. E002/GR-21-630 Johnson Direct
level and volatility of fuel purchase requirements; and (iii) the liquidity required 1
to manage variability in operating cash flow due to changes in sales and 2
operating expenses. Currently, these factors support the sizing of the credit 3
facility at $500 million; however, the size of the credit facility may need to be 4
reassessed if these factors change. 5
6
Q. DOES NSPM’S USE OF COMMERCIAL PAPER REDUCE THE REQUIRED LEVEL OF 7
NSPM’S CREDIT FACILITY? 8
A. No. NSPM expects to have continued access to the capital and commercial 9
paper markets, but it is necessary to have adequate back up liquidity in the event 10
of a capital market disruption. For example, the 2008 capital market crisis 11
caused commercial paper to become unavailable for a period of time. In a more 12
recent example, during March 2020, as a result of the COVID-19 pandemic, 13
commercial paper markets became very volatile and the cost of commercial 14
paper increased dramatically as shown in Chart 3 below. If comparable events 15
occurred again, or commercial paper required unreasonable terms or costs, 16
NSPM would be reliant on its credit facility for its liquidity needs. 17

37 Docket No. E002/GR-21-630 Johnson Direct
Chart 3: A2/P2 Overnight Commercial Paper Rates 1
March-April 202013 2
3
4
5
6
7
8
9
10
11
A credit facility is required in order to backstop commercial paper facilities. In 12
other words, if NSPM was not able to repay its maturing commercial paper, it 13
would be required to draw down its credit facility in order to meet that 14
obligation. Commercial paper is almost always used instead of direct drawing 15
on the credit facility because of its lower cost. Since the credit facility is a 16
backstop to commercial paper, the amount of commercial paper issued cannot 17
exceed the limit of the credit facility. Any outstanding commercial paper 18
reduces the amount available to draw under the credit facility. 19
20
Q. DOES NSPM PARTICIPATE IN A UTILITY MONEY POOL WITH OTHER 21
OPERATING UTILITY SUBSIDIARIES OF XEI? 22
A. Yes. The Utility Money Pool is a short-term intercompany revolving credit 23
facility that allows for coordination and provision of some short-term cash and 24
working capital for NSPM, Northern States Power Company, a Wisconsin 25
corporation (NSPW), Public Service Company of Colorado (PSCo) and 26
13 Source: www.federalreserve.gov

38 Docket No. E002/GR-21-630 Johnson Direct
Southwestern Public Service Company (SPS). 1
2
Q. HAS THE COMMISSION REVIEWED AND APPROVED NSPM’S PARTICIPATION IN 3
THE UTILITY MONEY POOL? 4
A. Yes. The Commission’s July 9, 2004 Order in Docket No. E002/AI-04-100 5
approved participation in the Utility Money Pool, and required NSPM to 6
demonstrate in future rate cases that NSPM’s participation in the Utility Money 7
Pool continues to be consistent with the public interest. NSPM has submitted 8
the required information in this case and in all prior rate cases since 2004. 9
NSPM also submits information regarding its participation in the Utility Money 10
Pool for Commission review and approval in its annual capital structure petition 11
filings. 12
13
Q. IS THE UTILITY MONEY POOL CONSISTENT WITH THE PUBLIC INTEREST? 14
A. Yes. The Utility Money Pool provides additional flexibility and allows for 15
potential cost savings and efficiencies without limiting access to existing 16
financing. Participants are not obligated to lend to or borrow from the Utility 17
Money Pool. However, it is available for use when it is most efficient, in 18
situations when it provides benefits such as a lower cost of borrowing, or more 19
flexibility regarding the terms of borrowing. NSPM’s lending limits are also 20
subject to approval by both the Commission and the Federal Energy Regulatory 21
Commission. 22
23
Q. DOES THE UTILITY MONEY POOL PROVIDE A SUBSTITUTE FOR THE NSPM 24
CREDIT FACILITY IN RELATION TO NEEDED LIQUIDITY? 25
A. No. Since there is no obligation for any participant to provide funds to the 26
Utility Money Pool, it does not provide the assurance of available cash that is 27

39 Docket No. E002/GR-21-630 Johnson Direct
needed by NSPM, and thus does not provide a substitute source of liquidity for 1
NSPM’s credit facility and commercial paper program. 2
3
Q. DOES NSPM’S PARTICIPATION IN THE UTILITY MONEY POOL IMPOSE RISKS ON 4
NSPM? 5
A. No. The borrowings under the Utility Money Pool are payable on demand. If 6
anything, NSPM’s participation in the Utility Money Pool provides additional 7
access to liquidity (and usually at more favorable rates) and thus, reduces risk 8
that may be caused by various macroeconomic events. 9
10
Q. HAVE YOU PREPARED A SCHEDULE SHOWING BORROWING AND LENDING 11
BETWEEN NSPM AND THE UTILITY MONEY POOL? 12
A. Yes. Exhibit___(PAJ-1), Schedule 17, provides a record of Utility Money Pool 13
activity, including lending to and borrowing from the Utility Money Pool from 14
January 2019 through June 2021. 15
16
3. Common Equity 17
Q. HOW DID YOU DETERMINE NSPM’S 2022 THROUGH 2024 COMMON EQUITY 18
BALANCES? 19
A. Consistent with prior rate case methodology, the proposed 2022 test year and 20
2023 and 2024 plan years’ common equity balances reflect the average of 13 21
month-end equity balances from December of the previous year through 22
December of the respective year and eliminates the non-regulated 23
investments. See NSPM’s recommended common equity balances by month 24
for 2022 through 2024 by referencing Exhibit___(PAJ-1), Schedules 18, 19 25
and 20, respectively. 26
27

40 Docket No. E002/GR-21-630 Johnson Direct
Q. HAS XEI ISSUED COMMON STOCK IN THE LAST FEW YEARS? 1
A. Yes. In September 2018, XEI issued approximately $225 million of common 2
stock through a $300 million SEC-registered “At the Market” program under 3
which XEI issued common stock to the public from time to time at then-4
prevailing market prices. XEI entered into a forward equity agreement for 5
approximately $460 million in November 2018, which was settled in August 6
2019. Additionally, in November 2019, XEI entered into forward sales 7
agreements in connection with a completed $743 million public offering of 11.8 8
million shares of Xcel Energy common stock. In November 2020, XEI settled 9
the forward sales agreement. 10
11
Q. HAVE YOU PROVIDED INFORMATION REGARDING FLOTATION COSTS FOR 12
PUBLIC AND NON-PUBLIC EQUITY ISSUANCES BY XEI? 13
A. Yes. Information regarding flotation costs for public and non-public offerings 14
by XEI is included in Exhibit___(PAJ-1), Schedule 21. This information was 15
used by Mr. D’Ascendis in his testimony regarding his flotation cost adjustment. 16
17
VI. INVESTOR RELATIONS EXPENSES 18
19
Q. CAN YOU PLEASE ALSO DISCUSS THE COMPANY’S INVESTOR RELATIONS 20
EFFORTS AND THE EXPENSES YOU EXPECT TO INCUR IN THE 2022 TEST YEAR 21
AND IN THE 2023 AND 2024 PLAN YEARS? 22
A. Yes. NSPM will incur investor relations expenses in 2022 through 2024 due to 23
the need to keep the credit rating agencies fully informed regarding NSPM’s 24
business and financing plans and to maintain strong investor demand for 25
NSPM’s LTD securities. The Investor Relations team also incurs costs for 26
shareholder services and interactions with fixed income investors. These efforts 27

41 Docket No. E002/GR-21-630 Johnson Direct
will enable NSPM to issue LTD securities at favorable costs, as evidenced by 1
NSPM’s very low cost of LTD. Additionally, the Investor Relations group will 2
continue to support the Company’s equity program, and customers receive the 3
benefit of improved proceeds as a result of obtaining favorable prices from the 4
issuance of stock. 5
6
Q. ARE THESE DISCRETIONARY EXPENSES? 7
A. No. A company with publicly-traded equity must engage in investor relations 8
activities, including but not limited to: (i) the listing of shares of XEI on the 9
National Association of Securities Dealers Automated Quotations (NASDAQ); 10
(ii) stock transfer agent services associated with the issuance of new common 11
shares to investors, providing shareholders online access to accounts, and 12
maintaining the list of registered shareholders; and (iii) an annual shareholders 13
meeting. 14
15
Q. IS IT APPROPRIATE TO INCLUDE THESE EXPENSES AS PART OF THE COMPANY’S 16
COST OF PROVIDING ELECTRIC SERVICE TO MINNESOTA RATEPAYERS? 17
A. Yes. These are unavoidable, just and reasonable expenses that should be 18
included in NSPM’s cost of service for ratemaking purposes. The Company 19
incurs these expenses as a necessary part of providing cost-effective service to 20
its customers; they are not expenses incurred to benefit shareholders. 21
22
Q. BUT ISN’T NSPM REQUESTING RECOVERY OF ONLY HALF OF THESE EXPENSES? 23
A. Yes. Company witness Mr. Benjamin C. Halama’s testimony, and the 24
Company’s rate request, reflects recovery of only 50 percent of these expenses 25
in this case. NSPM has removed 50 percent of these expenses, consistent with 26
past Commission decisions on this topic and due to the desire to minimize 27

42 Docket No. E002/GR-21-630 Johnson Direct
controversy in this proceeding. However, NSPM continues to view these as 1
just, reasonable and necessary expenses. 2
3
VII. CONCLUSION AND RECOMMENDATIONS 4
5
Q. PLEASE SUMMARIZE YOUR RECOMMENDATIONS. 6
A. I recommend that the Commission approve NSPM’s recommended 2022 test 7
year capital structure with 52.50 percent common equity and an overall rate of 8
return of 7.31 percent, as follows: 9
10
11
12
13
14
15
16
17
18
19
20
I also recommend that the Commission approve a proposed 2023 capital 21
structure with 52.50 percent common equity and an overall rate of return of 22
7.28 percent, as follows: 23
2022 Test Year
Recommended Capital Structure Ratios and Costs (as presented in Table 1 on Page 4)
Percent of Total Capital Cost Weighted
Cost
STD 0.61% 0.94% 0.01% LTD 46.89% 4.13% 1.94% Common Equity 52.50% 10.20% 5.36% Total Capital 100.00% 7.31%

43 Docket No. E002/GR-21-630 Johnson Direct
1
2
3
4
5
6
7
8
9
10
And lastly, I recommend that the Commission approve a proposed 2024 capital 11
structure with 52.50 percent common equity and an overall rate of return of 12
7.30 percent, as follows: 13
14
15
16
17
18
19
20
21
22
23
24
NSPM’s proposed capital structures and overall costs of capital are reasonable 25
and meet the Commission general standards of reasonableness used in decision 26
making. The capital structures are largely similar to the capital structure that 27
2023
Recommended Capital Structure Ratios and Costs (as presented in Table 2 on Page 4)
Percent of Total Capital Cost Weighted
Cost
STD 1.00% 0.80% 0.01% LTD 46.50% 4.12% 1.91% Common Equity 52.50% 10.20% 5.36% Total Capital 100.00% 7.28%
2024
Recommended Capital Structure Ratios and Costs (as presented in Table 3 on Page 5)
Percent of Total Capital
Cost Weighted Cost
STD 0.42% 1.47% 0.01% LTD 47.08% 4.09% 1.93% Common Equity 52.50% 10.20% 5.36% Total Capital 100.00% 7.30%

44 Docket No. E002/GR-21-630 Johnson Direct
NSPM has managed to for nearly a decade. These capital structures are market 1
based and consistent with prior Commission decisions for NSPM and with 2
capital structures of other comparable companies. The recommended capital 3
structures will continue to support NSPM’s financial integrity as demonstrated 4
through strong bond ratings and lower costs of debt, while simultaneously 5
enabling NSPM to make substantial capital investments in the utility 6
infrastructure, including renewable energy. Finally, NSPM has not materially 7
changed its capital structure since 2009 and the Commission has reviewed and 8
approved its equity ratio in the past four electric rate case proceedings. 9
10
I also recommend that the Commission allow partial recovery of investor 11
relations costs in rates as NSPM has proposed. 12
13
Q. DOES THIS CONCLUDE YOUR TESTIMONY? 14
A. Yes, it does. 15

Statement of Qualifications
Schedule 1
Paul A. Johnson
I received my Bachelor of Science in Business from Winona State University
and my MBA from the University of St. Thomas. I am a CFA charter holder and
passed the CPA and CMA exams.
I am the Vice President of Investor Relations and Treasurer and have held this
position since July 2021. Prior to this role, I served in the following roles during my
tenure at Xcel Energy: Vice President, Investor Relations (2013-2021); Vice President,
Investor Relations and Business Development (2012-2013); Vice President, Investor
Relations and Financial Management (2011-2012); Managing Director of Investor
Relations and Assistant Treasurer (2008-2011); Managing Director of Investor
Relations (2007-2008); Director of Investor Relations (2001-2006); Director of
External Reporting (1998-2001); Controller and Assistant Treasurer for Energy
Masters (1995-1998); and Administrator in Internal Reporting (1992-1995).
Docket No. E002/GR-21-630 Exhibit___(PAJ-1), Schedule 1
Page 1 of 1

Northern States Power Company, a Minnesota Corporation Docket No. E002/GR-21-630Electric Utility - State of Minnesota Exhibit___(PAJ-1), Schedule 2RATE OF RETURN COST OF CAPITAL SCHEDULES Page 1 of 3Cost of Capital
PROPOSED TEST YEAR 2022 COST OF CAPITAL
Percent Weighted ($000's) of Total Cost of Cost
Capitalization: Amount Capitalization Capital of Capital*
Long-Term Debt $6,873,445 46.89% 4.13% 1.94%Short-Term Debt $88,882 0.61% 0.94% 0.01%
Total Debt $6,962,327 47.50% 1.95%
Net Common Equity $7,695,202 52.50% 10.20% 5.36%
Total Capitalization $14,657,529 100.00% 7.31%
Short Term Debt and Long Term Debt Amounts are 12 Month Average Balances.Equity Amounts are 13 Month Average Balances.

Northern States Power Company, a Minnesota Corporation Docket No. E002/GR-21-630Electric Utility - State of Minnesota Exhibit___(PAJ-1), Schedule 2RATE OF RETURN COST OF CAPITAL SCHEDULES Page 2 of 3Cost of Capital
PROPOSED ADDITIONAL TEST YEAR 2023 COST OF CAPITAL
Percent Weighted ($000's) of Total Cost of Cost
Capitalization: Amount Capitalization Capital of Capital*
Long-Term Debt $7,253,518 46.50% 4.12% 1.91%Short-Term Debt $156,591 1.00% 0.80% 0.01%
Total Debt $7,410,109 47.50% 1.92%
Net Common Equity $8,190,137 52.50% 10.20% 5.36%
Total Capitalization $15,600,246 100.00% 7.28%
Short Term Debt and Long Term Debt Amounts are 12 Month Average Balances.Equity Amounts are 13 Month Average Balances.

Northern States Power Company, a Minnesota Corporation Docket No. E002/GR-21-630Electric Utility - State of Minnesota Exhibit___(PAJ-1), Schedule 2RATE OF RETURN COST OF CAPITAL SCHEDULES Page 3 of 3Cost of Capital
PROPOSED ADDITIONAL TEST YEAR 2024 COST OF CAPITAL
Percent Weighted ($000's) of Total Cost of Cost
Capitalization: Amount Capitalization Capital of Capital*
Long-Term Debt $7,702,921 47.08% 4.09% 1.93%Short-Term Debt $68,262 0.42% 1.47% 0.01%
Total Debt $7,771,183 47.50% 1.94%
Net Common Equity $8,589,208 52.50% 10.20% 5.36%
Total Capitalization $16,360,391 100.00% 7.30%
Short Term Debt and Long Term Debt Amounts are 12 Month Average Balances.Equity Amounts are 13 Month Average Balances.

Northern States Power Company, a Minnesota Corporation Docket No. E002/GR-21-630Electric Utility - State of Minnesota Exhibit ____(PAJ-1), Schedule 3RATE OF RETURN COST OF CAPITAL SCHEDULES Page 1 of 1
(a) 2011 - 2020 actual 10 year expenditures = $13.2B, average spend per year = $1.319B
(b) 2016 - 2020 actual 5 year expenditures = $6.8B, average spend per year = $1.356B
(c) 2021 - 2024 forecast 4 year expenditures = $8.3B, average spend per year = $2.071B
971 1018
1505
1159
1753
1183
947
1235
1469
1946 1971
22522079
1983
2011 2012 2013 2014 2015 2016 2017 2018 2019 2020 2021F 2022F 2023F 2024F
$ in
Mill
ions
Consolidated NSPM Capital Expenditures

Northern States Power Company, a Minnesota Corporation Docket No. E002/GR-21-630Electric Utility - State of Minnesota Exhibit ____(PAJ-1), Schedule 4RATE OF RETURN COST OF CAPITAL SCHEDULES Page 1 of 1Composite Cost of Long-Term Debt($000's)
2022 FORECASTED LONG TERM DEBT AND COSTas of 7/30/21
Premium or Premium/Coupon Issue Maturity Hedge Bond Bond LRD (4) Capital (5) Interest Hedge Discount Expense LRD Cost of Capital
Description Rate Date Date Amount Gain/(Loss) Discount Expense Expense Employed Charge Amortization Amortization Amortization Amortization Capital Cost %First Mortgage Bonds
Series due July 1, 2025 (FMB) 7.1250 Jul-95 Jul-25 250,000 - 230 187 249,583 17,813 - 78 63 17,953 7.19%Series due March 1, 2028 (FMB) 6.5000 Mar-98 Mar-28 150,000 - 330 277 149,393 9,750 - 59 49 9,858 6.60%Series Due July 15, 2035 (FMB) 5.2500 Jul-05 Jul-35 250,000 - 210 1,314 248,475 13,125 - 16 101 13,242 5.33%Series Due June 1, 2036 (FMB) 6.2500 May-06 Jun-36 400,000 7,561 649 2,255 404,657 25,000 545 47 162 24,665 6.10%Series Due July 1, 2037 (FMB) 6.2000 Jun-07 Jul-37 350,000 - 991 2,162 346,848 21,700 - 66 144 21,911 6.32%Series Due November 1, 2039 (FMB) 5.3500 Nov-09 Nov-39 300,000 (1,851) 329 2,398 295,421 16,050 (107) 19 139 16,315 5.52%Series Due August 15, 2040 (FMB) 4.8500 Aug-10 Aug-40 250,000 - 426 1,819 247,754 12,125 - 24 101 12,249 4.94%Series Due August 15, 2022 (FMB) (2) 2.1500 Aug-12 Aug-22 100,000 - 8 52 99,940 2,150 - 28 191 2,370 2.37%Series Due August 15, 2042 (FMB) 3.4000 Aug-12 Aug-42 500,000 (30,069) 2,556 4,200 463,174 17,000 (1,496) 127 209 18,833 4.07%Series Due May 15, 2023 (FMB) 2.6000 May-13 May-23 400,000 - 61 375 399,564 10,400 - 73 453 10,927 2.73%Series Due May 15, 2044 (FMB) 4.1250 May-14 May-44 300,000 - 635 2,782 296,583 12,375 - 29 127 12,531 4.23%Series Due Aug 15, 2045 (FMB) 4.0000 Aug-15 Aug-45 300,000 - 3,767 2,999 293,233 12,000 - 163 130 12,293 4.19%Series Due May 15, 2046 (FMB) 3.6000 May-16 May-46 350,000 - 1,665 4,302 344,033 12,600 - 70 180 12,850 3.74%Series Due Sep 15, 2047 (FMB) 3.7000 Sep-17 Sep-47 600,000 - 5,017 7,381 7,023 580,579 22,200 - 199 293 279 22,971 3.96%Series Due Mar 1, 2050 (FMB) 2.9000 Sep-19 Mar-50 600,000 - 10,492 7,916 581,592 17,400 - 380 286 18,066 3.11%Series Due Jun 1, 2051 (FMB) 2.6000 Jun-20 Jun-51 700,000 - 12,286 9,132 678,582 18,200 - 425 316 18,941 2.79%Series Due Apr 1, 2031 (FMB) 2.2500 Mar-21 Apr-31 425,000 - 1,546 4,339 419,115 9,563 - 177 498 10,238 2.44%Series Due Apr 1, 2052 (FMB) 3.2000 Mar-21 Apr-52 425,000 - 1,511 5,692 417,797 13,600 - 51 191 13,842 3.31%Series Due May 1, 2052 (FMB) (1) 3.3000 May-22 May-52 366,667 - - 5,431 361,236 12,100 - - 184 12,284 3.40%
Other Debt Right of Way Notes var var var 413 - - - 413 - - - - - 0.00%
TOTAL DEBT 7,017,080 (24,360) 42,709 65,014 7,023 6,877,974 275,150 (1,059) 2,031 3,820 279 282,339 4.10%
Unamortized Loss on Reacquired Debt (4,529) 1,020 Fees on 5-year Credit Facility (3) - 379 GRAND TOTAL and COST OF DEBT 6,873,445 283,738 4.13%
(1) NSPM 2022 issuance of $550M 30 year bond, balance is 8 of 12 months.(2) NSPM 2012 issuance of $300M 10 year bond, balance is 4 of 12 months.(3) Fees associated with the 5 Year Credit Facility are amortized over the life of the facility and are incorporated into the long-term debt rate. (4) Capital Employed is based on the Premium / Discount / Expense Balances representing average declining balances. New and Maturing Debt averaged on number of months in the year.(5) Interest Expense is a Straight Interest Expense calculation.
Total Bond Cost

Northern States Power Company, a Minnesota Corporation Docket No. E002/GR-21-630Electric Utility - State of Minnesota Exhibit ____(PAJ-1), Schedule 5RATE OF RETURN COST OF CAPITAL SCHEDULES Page 1 of 1Composite Cost of Long-Term Debt($000's)
2023 FORECASTED LONG TERM DEBT AND COSTas of 7/30/21
Premium or Premium/Coupon Issue Maturity Hedge Bond Bond LRD (4) Capital (5) Interest Hedge Discount Expense LRD Cost of Capital
Description Rate Date Date Amount Gain/(Loss) Discount Expense Expense Employed Charge Amortization Amortization Amortization Amortization Capital Cost %First Mortgage Bonds
Series due July 1, 2025 (FMB) 7.1250 Jul-95 Jul-25 250,000 - 152 124 249,724 17,813 - 78 63 17,953 7.19%Series due March 1, 2028 (FMB) 6.5000 Mar-98 Mar-28 150,000 - 272 227 149,501 9,750 - 59 49 9,858 6.59%Series Due July 15, 2035 (FMB) 5.2500 Jul-05 Jul-35 250,000 - 194 1,213 248,593 13,125 - 16 101 13,242 5.33%Series Due June 1, 2036 (FMB) 6.2500 May-06 Jun-36 400,000 7,016 602 2,092 404,322 25,000 545 47 162 24,665 6.10%Series Due July 1, 2037 (FMB) 6.2000 Jun-07 Jul-37 350,000 - 924 2,017 347,058 21,700 - 66 144 21,911 6.31%Series Due November 1, 2039 (FMB) 5.3500 Nov-09 Nov-39 300,000 (1,744) 310 2,260 295,686 16,050 (107) 19 139 16,315 5.52%Series Due August 15, 2040 (FMB) 4.8500 Aug-10 Aug-40 250,000 - 403 1,719 247,879 12,125 - 24 101 12,249 4.94%Series Due August 15, 2042 (FMB) 3.4000 Aug-12 Aug-42 500,000 (28,573) 2,429 3,991 465,007 17,000 (1,496) 127 209 18,833 4.05%Series Due May 15, 2023 (FMB) (2) 2.6000 May-13 May-23 133,333 - 4 24 133,305 3,467 - 27 166 3,660 2.75%Series Due May 15, 2044 (FMB) 4.1250 May-14 May-44 300,000 - 606 2,655 296,739 12,375 - 29 127 12,531 4.22%Series Due Aug 15, 2045 (FMB) 4.0000 Aug-15 Aug-45 300,000 - 3,604 2,870 293,526 12,000 - 163 130 12,293 4.19%Series Due May 15, 2046 (FMB) 3.6000 May-16 May-46 350,000 - 1,595 4,122 344,283 12,600 - 70 180 12,850 3.73%Series Due Sep 15, 2047 (FMB) 3.7000 Sep-17 Sep-47 600,000 - 4,818 7,088 6,744 581,350 22,200 - 199 293 279 22,971 3.95%Series Due Mar 1, 2050 (FMB) 2.9000 Sep-19 Mar-50 600,000 - 10,112 7,630 582,258 17,400 - 380 286 18,066 3.10%Series Due Jun 1, 2051 (FMB) 2.6000 Jun-20 Jun-51 700,000 - 11,861 8,816 679,323 18,200 - 425 316 18,941 2.79%Series Due Apr 1, 2031 (FMB) 2.2500 Mar-21 Apr-31 425,000 - 1,369 3,841 419,791 9,563 - 177 498 10,238 2.44%Series Due Apr 1, 2052 (FMB) 3.2000 Mar-21 Apr-52 425,000 - 1,460 5,500 418,040 13,600 - 51 191 13,842 3.31%Series Due May 1, 2052 (FMB) 3.3000 May-22 May-52 550,000 - - 7,917 542,083 18,150 - - 275 18,425 3.40%Series Due May 1, 2033 (FMB) (1) 2.8000 May-23 May-33 283,333 - - 4,090 279,244 7,933 - - 428 8,361 2.99%Series Due May 1, 2053 (FMB) (1) 3.6000 May-23 May-53 283,333 - - 4,197 279,137 10,200 - - 143 10,343 3.71%
Other Debt Right of Way Notes var var var 413 - - - 413 - - - - - 0.00%
TOTAL DEBT 7,400,413 (23,301) 40,715 72,392 6,744 7,257,261 290,250 (1,059) 1,956 4,002 279 297,547 4.10%
Unamortized Loss on Reacquired Debt 10,487 (3,742) 700 Fees on 5-year Credit Facility (3) - 379 GRAND TOTAL and COST OF DEBT 7,253,518 298,625 4.12%
(1) NSPM 2023 issuance of $425M 10 year bond, balance is 8 of 12 months. NSPM 2023 issuance of $425M 30 year bond, balance is 8 of 12 months.(2) NSPM 2013 issuance of $400M 10 year bond, balance is 4 of 12 months.(3) Fees associated with the 5 Year Credit Facility are amortized over the life of the facility and are incorporated into the long-term debt rate. (4) Capital Employed is based on the Premium / Discount / Expense Balances representing average declining balances. New and Maturing Debt averaged on number of months in the year.(5) Interest Expense is a Straight Interest Expense calculation.
Total Bond Cost

Northern States Power Company, a Minnesota Corporation Docket No. E002/GR-21-630Electric Utility - State of Minnesota Exhibit ____(PAJ-1), Schedule 6RATE OF RETURN COST OF CAPITAL SCHEDULES Page 1 of 1Composite Cost of Long-Term Debt($000's)
2024 FORECASTED LONG TERM DEBT AND COSTas of 7/30/21
Premium or Premium/Coupon Issue Maturity Hedge Bond Bond LRD (3) Capital (4) Interest Hedge Discount Expense LRD Cost of Capital
Description Rate Date Date Amount Gain/(Loss) Discount Expense Expense Employed Charge Amortization Amortization Amortization Amortization Capital Cost %First Mortgage Bonds
Series due July 1, 2025 (FMB) 7.1250 Jul-95 Jul-25 250,000 - 74 61 249,865 17,813 - 78 63 17,954 7.19%Series due March 1, 2028 (FMB) 6.5000 Mar-98 Mar-28 150,000 - 213 178 149,609 9,750 - 59 49 9,858 6.59%Series Due July 15, 2035 (FMB) 5.2500 Jul-05 Jul-35 250,000 - 178 1,112 248,710 13,125 - 16 101 13,243 5.32%Series Due June 1, 2036 (FMB) 6.2500 May-06 Jun-36 400,000 6,471 555 1,930 403,986 25,000 546 47 163 24,664 6.11%Series Due July 1, 2037 (FMB) 6.2000 Jun-07 Jul-37 350,000 - 858 1,873 347,269 21,700 - 66 145 21,911 6.31%Series Due November 1, 2039 (FMB) 5.3500 Nov-09 Nov-39 300,000 (1,637) 291 2,121 295,951 16,050 (107) 19 139 16,315 5.51%Series Due August 15, 2040 (FMB) 4.8500 Aug-10 Aug-40 250,000 - 379 1,618 248,003 12,125 - 24 101 12,249 4.94%Series Due August 15, 2042 (FMB) 3.4000 Aug-12 Aug-42 500,000 (27,073) 2,302 3,781 466,844 17,000 (1,501) 128 210 18,838 4.04%Series Due May 15, 2044 (FMB) 4.1250 May-14 May-44 300,000 - 577 2,527 296,896 12,375 - 29 128 12,532 4.22%Series Due Aug 15, 2045 (FMB) 4.0000 Aug-15 Aug-45 300,000 - 3,441 2,739 293,820 12,000 - 164 130 12,294 4.18%Series Due May 15, 2046 (FMB) 3.6000 May-16 May-46 350,000 - 1,525 3,941 344,534 12,600 - 70 181 12,851 3.73%Series Due Sep 15, 2047 (FMB) 3.7000 Sep-17 Sep-47 600,000 - 4,618 6,794 6,465 582,124 22,200 - 200 294 280 22,973 3.95%Series Due Mar 1, 2050 (FMB) 2.9000 Sep-19 Mar-50 600,000 - 9,731 7,343 582,926 17,400 - 381 287 18,068 3.10%Series Due Jun 1, 2051 (FMB) 2.6000 Jun-20 Jun-51 700,000 - 11,435 8,499 680,066 18,200 - 426 317 18,943 2.79%Series Due Apr 1, 2031 (FMB) 2.2500 Mar-21 Apr-31 425,000 - 1,191 3,342 420,468 9,563 - 178 499 10,240 2.44%Series Due Apr 1, 2052 (FMB) 3.2000 Mar-21 Apr-52 425,000 - 1,409 5,308 418,283 13,600 - 51 192 13,843 3.31%Series Due May 1, 2052 (FMB) 3.3000 May-22 May-52 550,000 - - 7,642 542,358 18,150 - - 276 18,426 3.40%Series Due May 1, 2033 (FMB) 2.8000 May-23 May-33 425,000 - - 5,602 419,398 11,900 - - 639 12,539 2.99%Series Due May 1, 2053 (FMB) 3.6000 May-23 May-53 425,000 - - 6,117 418,883 15,300 - - 213 15,513 3.70%Series Due May 1, 2054 (FMB) (1) 3.6000 May-24 May-54 300,000 - - 4,443 295,557 10,800 - - 151 10,951 3.71%
Other Debt Right of Way Notes var var var 413 - - - 413 - - - - - 0.00%
TOTAL DEBT 7,850,413 (22,239) 38,777 76,970 6,465 7,705,962 306,650 (1,062) 1,935 4,277 280 314,204 4.08%
Unamortized Loss on Reacquired Debt (3,041) 702 Fees on 5-year Credit Facility (2) - 379 GRAND TOTAL and COST OF DEBT 7,702,921 315,284 4.09%
(1) NSPM 2024 issuance of $450M 30 year bond, balance is 8 of 12 months.(2) Fees associated with the 5 Year Credit Facility are amortized over the life of the facility and are incorporated into the long-term debt rate. (3) Capital Employed is based on the Premium / Discount / Expense Balances representing average declining balances. New and Maturing Debt averaged on number of months in the year.(4) Interest Expense is a Straight Interest Expense calculation.
Total Bond Cost

INFRASTRUCTURE AND PROJECT FINANCE
CREDIT OPINION31 December 2020
Update
RATINGS
Northern States Power Company(Minnesota)Domicile Minneapolis,
Minnesota, UnitedStates
Long Term Rating A2
Type LT Issuer Rating
Outlook Stable
Please see the ratings section at the end of this reportfor more information. The ratings and outlook shownreflect information as of the publication date.
Contacts
Natividad Martel,CFA
+1.212.553.4561
VP-Senior [email protected]
Domenic Giovannone +1.212.553.1647Associate [email protected]
Michael G. Haggarty +1.212.553.7172Associate Managing [email protected]
Jim Hempstead +1.212.553.4318MD - Global Infrastructure & Cyber [email protected]
Northern States Power Company(Minnesota)Update to credit analysis
SummaryThe credit profile of Northern States Power Company (Minnesota) (NSP-Minnesota) reflectsthe fully regulated nature of its vertically integrated electric and natural gas distributionoperations in Minnesota (nearly 90% of its rate base), North and South Dakota (eachaccounts for less than 10% of its rate base). The profile reflects our view that these regulatoryenvironments are generally credit supportive, particularly in Minnesota where it benefits fromseveral riders as well as annual sales true-ups.
The credit assumes that the utility will continue to produce a ratio of cash flow fromoperations excluding changes in working capital (CFO pre-W/C) to debt at or above 22%following the Minnesota Public Utility’s Commission (MPUC) recent approval of the utility’sextension to its stay-out period, through 2021.
NSP-Minnesota ranks as one of the larger subsidiaries in the Xcel Energy Inc. (Xcel, Baa1stable) family in terms of rate base (2019 estimated: 37%) as well as earnings before interest,taxes, depreciation and amortization (EBITDA) and cash flow contribution (40%-45%).The credit profile also recognizes that NSP-Minnesota’s state regulators indirectly restrictdividends that the utility is allowed to upstream to parent Xcel by requiring NSP-Minnesotato maintain an equity-to-total capitalization ratio ranging between 47.1% to 57.5%.
Recent DevelopmentsCoronavirus - The rapid spread of the coronavirus outbreak, severe global economic shock,low oil prices, and asset price volatility are creating a severe and extensive credit shock acrossmany sectors, regions and markets. The combined credit effects of these developmentsare unprecedented. We regard the coronavirus outbreak as a social risk under our ESGframework, given the substantial implications for public health and safety. However, weexpect the NSP-Minnesota to be relatively resilient to recessionary pressures because of itsrate regulated business model and regulatory mechanisms.
Docket No. E002/GR-21-630 Exhibit___(PAJ-1), Schedule 7
Page 1 of 11

MOODY'S INVESTORS SERVICE INFRASTRUCTURE AND PROJECT FINANCE
Exhibit 1
Historical CFO Pre-W/C, Total Debt and CFO Pre-W/C to Debt ($ MM)
1,369 1,461 1,355 1,366 1,442
5,410 5,467 5,4145,827
6,175
25.3%
26.7%
25.0%
23.4% 23.4%
21.0%
22.0%
23.0%
24.0%
25.0%
26.0%
27.0%
0
1,000
2,000
3,000
4,000
5,000
6,000
7,000
2016 2017 2018 2019 LTM Sept-20
CFO Pre-W/C Total Debt CFO Pre-W/C / Debt
Source: Moody's Financial Metrics
Credit strengths
» Vertically integrated regulated utility operations in overall credit supportive regulatory environments
» Numerous riders and trackers that reduce regulatory lag
» Dividend distributions are subject to the commissions’ indirectly imposed restrictions regarding capital structure
Credit challenges
» Some uncertainty around the utility’s capex pending the approval of the Minnesota Relief and Recovery
» Credit metrics are lower than historical highs, but remain supportive of credit quality.
Rating outlookNSP-Minnesota's stable outlook is supported by the predictable nature of the utility’s operations and the expectation that theregulatory environments will remain credit supportive. The stable outlook assumes that although lower than previous highs, its keycredit metrics will remain adequate for its credit, including CFO pre-W/C to debt of at least 22%. The outlook considers Xcel’s group-wide O&M-cost control initiatives, overall timely recovery of costs, as well as some moderation in the utility’s base case capex.
Factors that could lead to an upgrade
» While not expected in the near term, the utility’s ratings could experience positive momentum if greater than anticipated regulatoryrelief or cost savings, or a reduction in leverage, allow it to record CFO pre-W/C to debt in the high 20% range.
Factors that could lead to a downgrade
» The ratings could be downgraded if we perceive a deterioration in the credit supportiveness of its regulatory environments, or if itscredit metrics deteriorate further; specifically, downward pressure on the ratings could result if its CFO pre-W/C to debt ratio fallsbelow 22%, for an extended period.
This publication does not announce a credit rating action. For any credit ratings referenced in this publication, please see the ratings tab on the issuer/entity page onwww.moodys.com for the most updated credit rating action information and rating history.
2 31 December 2020 Northern States Power Company (Minnesota): Update to credit analysis
Docket No. E002/GR-21-630 Exhibit___(PAJ-1), Schedule 7
Page 2 of 11

MOODY'S INVESTORS SERVICE INFRASTRUCTURE AND PROJECT FINANCE
Key indicators
Exhibit 2
Northern States Power Company - MinnesotaDec-16 Dec-17 Dec-18 Dec-19 LTM Sept-20
CFO Pre-W/C + Interest / Interest 6.7x 7.0x 6.6x 6.7x 6.7x
CFO Pre-W/C / Debt 25.3% 26.7% 25.0% 23.4% 23.4%
CFO Pre-W/C Dividends / Debt 18.0% 17.5% 16.6% 15.4% 15.4%
Debt / Capitalization 40.3% 44.0% 43.0% 42.9% 43.0%
[1] All ratios are based on 'Adjusted' financial data and incorporate Moody's Global Standard Adjustments for Non-Financial Corporations.Source: Moody's Financial Metrics
ProfileNSP-Minnesota is a vertically integrated utility that provides electric services to 1.5 million customers in Minnesota, North Dakotaand South Dakota as well as natural gas services to 0.5 million customers in Minnesota and North Dakota. Minnesota, mostly aroundMinneapolis-St. Paul, accounts for the bulk of its operations (almost 90% of revenues).
As depicted in Exhibit 3, NSP-Minnesota is the legacy subsidiary of parent Xcel Energy Inc. (Xcel, Baa1 stable), a holding companywith utility operations in eight states servicing around 3.7 million electric customers and about 2.1 million natural gas customers.NSP-Minnesota is the second largest subsidiary in terms of regulated rate base (2019 year-end estimate: $11.3 billion) after PublicService Company of Colorado (PSCO, A3 stable; 2019 year-end estimate: 12.4 billion) with each contributing between 35-45% toXcel’s consolidated net income. NSP-Minnesota and its smaller neighboring sister company Northern States Power (Wisconsin) (NSP-Wisconsin, A2 stable) operate their electric production and transmission systems as an integrated system known as the NSP-System.They share the costs of operating their integrated production and transmission systems (NSP-System) according to a Federal EnergyRegulatory Commission (FERC) approved Interchange Agreement (IA).
Exhibit 3
Xcel Energy Inc. Organizational Chart (LTM 3Q2020)($ in millions)
Xcel Energy Inc.
Baa1 Stable
CFO:$ 2,962
Total Debt: $ 21,773
Northern States Power (Minnesota) Northern States Power (Wisconsin) Public Service Company of Colorado Southwestern Public Service Company
(NSP-Minnesota) (NSP-Wisconsin) (PSCo) (SPS)
A2 Stable A2 Stable A3 Stable Baa2 Stable
CFO: $ 1,249 CFO: $ 234 CFO: $ 1,284 CFO: $ 433
Total Debt: $ 6,175 Total Debt: $ 936 Total Debt: $ 6,254 Total Debt: $ 2,905
Source: Xcel Energy Inc., Moody's Financial Metrics
Detailed credit considerationsLimited diversification benefits; bulk of operations are in MinnesotaNSP-Minnesota’s credit quality reflects limited geographic diversification benefits because Minnesota accounts for the majority of itsoperations while North and South Dakota (electric only) each represent around 6% of the total. At the same time, the Federal EnergyRegulatory Commission’s (FERC) oversight of NSP-Minnesota’s wholesale production (nearly 5% of the utility’s 2019 total electricrevenues) and transmission services modestly enhances its regulatory diversity.
Overall credit supportive regulatory environmentsRiders and surcharges reduce regulatory lag
Our view of the credit supportiveness of the regulatory frameworks in the states in which NSP-Minnesota operates considers thatthe utility’s cash flows benefit from a broad group of rider mechanisms that allow for the timely recovery of costs and investmentsbetween rate cases and the ability to implement multi-year rate plans in all three states. The utility also benefits from the ability to
3 31 December 2020 Northern States Power Company (Minnesota): Update to credit analysis
Docket No. E002/GR-21-630 Exhibit___(PAJ-1), Schedule 7
Page 3 of 11

MOODY'S INVESTORS SERVICE INFRASTRUCTURE AND PROJECT FINANCE
implement interim rates until final tariff decisions are made, automatic fuel and purchase power cost recovery mechanisms (subjectto monthly adjustments) and transmission riders. These mechanisms reduce the exposure of the utility’s cash flows to the impact ofregulatory lag as the utility stayed out of rate cases in recent years.
Exhibit 4
Summary of key regulatory mechanisms available in NSP-Minnesota's jurisdictions
Multi-year Rate Plans
Forward Test Year Interim Rates Fuel Recovery
MechanismRenewable
RiderTransmission
Rider
Distribution Recovery
Mechanism
Infrastructure Rider
Pension Deferral
Mechanism
Property Tax Deferral/True-
upDecoupling
NSP-M √ √ MN & ND √ √ √ MN & ND √ MN & ND √ MN √ SD √ MN √ MN √ MN
Source: Xcel Energy Inc., regulatory filings
However, the number of automatic recovery mechanisms is more extensive in Minnesota (including distribution and decoupling)followed by North Dakota. This drives our view that these regulatory frameworks are above-average in terms of credit supportivenesscompared to most other states, including South Dakota. In South Dakota, rates are based on historical test periods which, along with alimited number of riders, have contributed to the utility’s volatile actual return on equities (RoEs) (see Exhibit 5).
Exhibit 5
Summary of key financial parameters including authorized and actual RoEs and applicable regulatory plans
2017 2018 2019
Electric-Mn 9.20% 9.66% 8.88% 9.31% Stay-out through 2021 verbally approved by the MPCU
NG-Mn 10.09% 9.16% 9.81% 8.54%
Electric - ND 9.85% 10.91% 9.93% 9.86% Filed Rate Case in 2020
NG-ND 9.75% 8.75% 10.32% 3.74% TCJA Settlement 2019-20
Electric - SD Blackbox 6.91% 6.79% 8.77% TCJA Settlement 2019-20
Authorized RoEW/A Earned RoE (actual)
Regulatory Plan
NSP-Minnesota
Source: Xcel Energy Inc., Regulatory filings
Overall credit constructive regulatory proceedings
In Minnesota, NSP-Minnesota benefits from a decoupling mechanisms (implemented in January 2016) for electric residential end-users, as well as small commercial and industrial (C&I) customers, although their annual increases are capped at 3%. In addition,revenues from all non-decoupled electric customers are also subject to sales true-ups. These mechanism is credit supportive becauseit enhances the visibility of the utility’s cash flows, particularly in the aftermath of the economic disruption caused by the coronaviruspandemic. Next year, the utility’s rates will be adjusted to reflect both, this year’s material increase in the residential customers powerdemand as well as the significant reduction in the C&I customers’ demand. During the nine month period ended September 2020,NSP-Minnesota reported a reduction in total retail sales of nearly 3.4% (weather-adjusted: -4.2%). The increase in residential powerdemand (actual: +5.6%) could not fully offset the 3.4% contraction in sales to its C&I customer-class (on a weather adjusted basis:-7.5%).
This sales true-up, along with capital and property tax true-up mechanisms, were implemented as part of the utility’s 2016-2019 rateplan that expired last year. These mechanisms will remain in place for at least another year following the MPUC’s authorization (verbalapproval in December 2020) of NSP-Minnesota’s proposed stay out provision in December 2020. The extension of the mechanismsis credit positive because it reduces the utility’s exposure to regulatory lag. Similar to last year, the utility also withdrew the rate case(filed in November 2020) requesting a rate increase that totaled $597 million for the 2021-2023 period. In its 2020 stay-out petition,the utility also requested authority to delay any increase to the nuclear decommissioning trust annual accrual until January 1, 2022. Ona less positive note, the utility also agreed to implement an earnings sharing mechanism. According to the agreement, NSP-Minnesotawill refund to customers all earnings above a RoE of 9.06% in 2021, which is consistent with the last RoE approved in a rider request,but below the 9.2% RoE authorized in its last rate case (Order in June 2017).
4 31 December 2020 Northern States Power Company (Minnesota): Update to credit analysis
Docket No. E002/GR-21-630 Exhibit___(PAJ-1), Schedule 7
Page 4 of 11

MOODY'S INVESTORS SERVICE INFRASTRUCTURE AND PROJECT FINANCE
However, we acknowledge that this earnings test, along with the utility’s agreement not to seek rate relief for incremental bad debtexpenses in the aftermath of the coronavirus pandemic, and its agreement to fund $17.5 million in customer relief programs shouldhelp the utility manage its relationship with its stakeholders, a credit positive. Utilities in Minnesota are currently subject to the annualwinter moratorium of shutting off residential customer service for non-payment (until April 15) which overlapped with this year’sdisconnection bans put in place at the onset of the pandemic. However, we believe that the impact on the utility’s cash flows offoregoing this rate relief (bad debt expenses) and payment assistance will not be significant. Xcel’s management recently disclosedthat it estimates that the group’s consolidated bad debt expenses (2019: around $55 million) will rise by around $25 million during2020 which equals to an increase by around 50%. For NSP-Minnesota, a similar increase would result in a step-up of its reportedallowance for doubtful accounts (AFDA) to around $34.5 million (year-end 2019: $23 million). However, similar to other US utilities,NSP-Minnesota’s base rates include recovery of its historical write-offs, that is the annual amounts which were deemed ultimatelyuncollectible. This amount reduces the cash impact of its bad debt expense. As a point of reference, the utility’s write-offs averaged$12.6 million or less than 1% of its reported funds from operations during the 2015-2019 period.
In North and South Dakota, in November 2020, NSP-Minnesota requested the North Dakota Public Service Commission’s (NDPSC)authorization to increase its retail electric revenues by $22 million (+10.8%). It is premised on a rate base of $677 million for the 2021test year as well as increase in its authorized RoE to 10.2% (+34 basis points) and an equity layer of 52 .5%. The utility also requestedauthorization to implement an interim rate increase of about $16 million in January 2021. This is the first rate case filed by the utilityin ND following the expiration of the two-year rate freeze that the utility agreed to (also in South Dakota) in exchange for authority toretain the amounts due to the electric customers in 2018 and 2019 in connection to the implementation of the 2017 Tax Cuts and JobsAct (TCJA). NSP-Minnesota was authorized to use the refundable amounts due to natural gas customers to amortize the regulatoryassets related to unrecovered manufactured gas plant site expenses in Fargo. The outcome of NSP-Minnesota’s ongoing rate casewill be an important indication of both the utility's relationship with the NDPUC and the credit supportiveness of the ND regulatoryenvironment. North Dakota remains one of the few jurisdictions where the regulator has not made a decision yet as to whetherauthorize the utilities’ request to apply deferral accounting treatment to incremental costs related to the coronavirus pandemic, andrecord them under regulatory assets and liabilities.
FERC - NSP-Minnesota’s credit also benefits from the predictable cash flow associated with its FERC regulated transmissionoperations. Our view of the credit supportiveness of the FERC regulatory environment recognizes that tariffs are set on a forward-looking basis utilizing formulaic rate recovery mechanisms and true-ups (including for sales), as well as robust (60%) equity layers.NSP-Minnesota, similar to other Midcontinent Independent System Operator (MISO) transmission owners, has been involved in twoFederal Power Act (FPA) Section 206 complaints filed at the FERC by customers and public groups. The complaints questioned thejustness and reasonableness of the base ROE for MISO transmission owners. In May 2020, following a request to rehear its November2019 order, the FERC issued a final resolution of a pending 206 complaint (first complaint) disputing the justness and reasonablenessof the base RoE for MISO transmission owners, including NSP-Minnesota. Following additional revisions to the base RoE methodology,the May Order increased the base RoE to 10.02% (November 2019 order: 9.88%), effective as of the end of September 2016, whichincludes the continuation of a 0.5% RoE incentive adder. The transmission utilities are required to provide refunds, with interest, for the15-month refund period from November 12, 2013 through February 11, 2015 and for the period from September 28, 2016 through May21, 2020. We understand the impact of the refunds on NSP-Minnesota’ cash flows is not significant. According to the May Order, thesecond 206 complaint (filed in February 2015) covering a statutory refund period from February 2015 to May 2016 remains dismissed.
Some uncertainty around apex program, but likely to remain moderateXcel has disclosed that NSP-Minnesota’s capital expenditures (capex) program for the 2021-2025 period will aggregate $8.4 billionwith annual investments averaging around $1.7 billion. The utility has earmarked the bulk of the investments (nearly 75%) to expandits electric transmission, distribution and generation footprint. According to this plan, the completion next year of the 300 MWDakota Range wind project (COD: 2021) will complete its currently planned investments in renewables (capex in 2021:$295 million;afterwards: $0). Between 2019 and 2021, NSP-Minnesota will have completed five wind projects and acquired two wind farms,increasing its wind-farm capacity to nearly 2.2 GW from 840 MW at year-end 2018 (see ESG Section). These investments exceed thecompany’s historical annual capital outlays (around $6.8 billion for the 2016-2020 period, or about $1.3 billion annually).
5 31 December 2020 Northern States Power Company (Minnesota): Update to credit analysis
Docket No. E002/GR-21-630 Exhibit___(PAJ-1), Schedule 7
Page 5 of 11

MOODY'S INVESTORS SERVICE INFRASTRUCTURE AND PROJECT FINANCE
Exhibit 6
NSP-Minnesota’s rate base and 2012-2025 historical and projected capital expenditure plan($ in billions)
$1.1$1.5 $1.2
$1.8$1.2 $1.0 $1.1 $1.4
$2.0$1.6 $1.6 $1.6 $1.6 $1.9
$7.3$8.0
$8.5$9.3
$9.9$10.3
$10.7$11.3
$0.0
$2.0
$4.0
$6.0
$8.0
$10.0
$12.0
2012 2013 2014 2015 2016 2017 2018 2019 2020E 2021E 2022E 2023E 2024E 2025E
Capital Expenditures Authorized Rate Base
These planned expenditures exclude investments related to the Minnesota Relief and Recovery proposal.Source: Xcel Energy Inc.
However, pending the MPCU’s approval of its Minnesota Relief and Recovery (R&R) proposal, NSP-Minnesota’s investments inrenewables could increase by around $1.3 billion (+16%) while it would also accelerate its planned investments in the grid ($865million). This proposal followed the MPUC’s 2020 invitation to submit projects to create jobs and aid the economy in the aftermathof the pandemic outbreak. NSP-Minnesota’s proposal includes the repowering of 651 MW of owned wind-projects (total capex: $750million) as well as the construction of 460MW in solar projects (incremental capex: $650 million). In December 2020, the MPUCapproved the utility's wind repowering proposal. NSP-Minnestoa requested a decision regarding the solar assets before the end ofJune 2021. We estimate that, including these incremental annual investments, the utility’s ratio of capex to depreciation during the2021-2025 period would still remain below 2.0x (average ratio during the 2016-last twelve month period ended September 2020:1.7x),
We understand that, if these new renewable projects are approved and developed, NSP-Minnesota would undertake the investmentsbut share the costs with NSP-Wisconsin through the aforementioned Interchange Agreement (IA). NSP-Minnesota operates theNSP-System while NSP-Wisconsin is responsible for around 15% of the demand related costs. Generally, the associated interchangerevenues received from NSP-Wisconsin represent around 10% of NSP-Minnesota’s total revenues.
Credit metrics have declined from historic highs but expected to remain supportive of credit qualityAs depicted under Exhibits 1 and 2, NSP-Minnesota's credit metrics were historically very well positioned for the credit profile, includingCFO pre-W/C to debt that consistently exceeded 25% during the 2015-2018 period. However, the ratio dropped to 23.4% last yearlargely due to the cash leakage that resulted from the implementation of the TCJA, particularly the combination of the expiration ofbonus depreciation and the MPUC’s order to refund $141 million to its electric and natural gas customers following the reevaluation ofthe accumulated deferred income tax (ADIT) at the lower corporate tax rate of 21%.
That said, we note that the ratio remained stable at 23.4% for the last twelve month period ended September 2020 while it alsoreported a RoE of 9.53% (GAAP) during the same period despite the economic disruption caused by the pandemic. The utility’sfinancial ratios were aided by the aforementioned automatic recovery mechanisms and additional cost savings. During the nine monthperiod ended September 2020, the utility reported a reduction in its operational and maintenance expenses by $20.2million (-4.5%)compared to the same period in 2019 (during financial year 2019 compared to 2018:- 1.7%). During 2020, these initiatives are largelyrelated to lower plant generation expenses (including timing of planned maintenance and overhauls).
Going forward, we assume that automatic recovery mechanisms and additional cost savings will allow the utility to record financialmetrics that will remain adequate for the credit profile. This expectation includes a ratio of CFO pre-W/C to debt of at or above 22%over the foreseeable future even if the aforementioned incremental investments associated with the Minnesota R&R program (+$1.3billion) are approved. NSP-Minnesota’s dividend distributions is subject to the utility recording an equity-to-total capitalization ratiothat ranges between 47.1% and 57.1% (2010: 52.3%).
6 31 December 2020 Northern States Power Company (Minnesota): Update to credit analysis
Docket No. E002/GR-21-630 Exhibit___(PAJ-1), Schedule 7
Page 6 of 11

MOODY'S INVESTORS SERVICE INFRASTRUCTURE AND PROJECT FINANCE
ESG considerationsEnvironmental considerations incorporated into our analysis of NSP-Minnesota are primarily related to carbon dioxide regulationsas well as the natural gas distribution operations’ clean-up expenses related to manufactured gas plants (MGP) and also methaneemissions. NSP-Minnestoa's parent, Xcel, is strongly positioned for carbon transition in the regulated utility sector with strategies andplans in place that substantially mitigate its carbon transition exposure.
Environmental considerations incorporated into our credit analysis of NSP-Minnesota factors in Xcel’s goal of producing 100% carbonfree energy by 2050. It also considers that NSP-Minnesota aims to reduce, by 2030, carbon dioxide emissions to 80% below 2005levels. However, this goal is pending the approval of its Resource Plan that was initially filed in July 2019 with a supplement filed in June2020. Xcel expects during 2021.
The NSP System generates the bulk of the power requirements of NSP-Minnesota with a portion procured under Power PurchaseAgreements. NSP-Minnesota's goals incorporate the output from its nuclear fleet (1,657 MW) as the utility’s Resource Plan seeksto extend the life of the Monticello nuclear plant to 2040 from 2030 and to maintain operations at the Prairie Island nuclear unitsuntil 2033 and 2034 (the end of their lives). Exhibit 5 illustrates the growing contribution of renewables following the addition of theaforementioned wind-farms to the energy-mix (installed capacity: 2.2 GW; 2018: 840 MW). It also depicts Xcel’s expectation that theapproved retirement of NSP-Minnesota’s 1,362 MW Sherco Unit 2 (2023) and Unit 1 (2026) will reduce the contribution of coal-firedfacility output to the energy mix of NSP-Wisconsin and NSP-Minnesota to around 10% in 2027 (2019: 23%).
Exhibit 7
2005-2027 planned development of NSP-Minnesota’s energy mix
Coal50%
Natural Gas7%
Hydro11%
Nuclear27%
Wind 3%
Other2%
2005
Coal23%
Natural Gas23%
Hydro6%
Nuclear28%
Solar3%
Wind 15%
Other2%
2019 Coal10%
Natural Gas21%
Hydro5%
Nuclear26%
Solar4%
Wind 33%
Other1%
2027E
Source: Xcel Energy Inc.
However, the contribution from coal could drop to 0% if the MPUC approves NSP Minnesota’s Resource Plan for the period ending2034. The utility also proposed the retirement of the 511 MW King facility and the 517 MW Sherco Unit 3 by 2030. We assume that,upon their retirement, the utility will be able to recover the remaining rate base of its coal-fired facilities (all more than 35 years old).We assume that this rate base is relatively small, and largely reflects environmental compliance investments.
The Resource Plan also includes the construction of the Sherco combined cycle natural gas plant (CCGT; peak investment in 2026; CoD:2028). The plan also includes demand side Management (DSM) initiatives such as energy efficiency programs (annual savings through2034 around 780 GWh), and 400 MW of incremental demand response by 2023 (total by 2034: over 1,500 MW). The utility has alsoproposed the addition of around 2,600 MW of firm peaking resources (including combustion turbine battery storage and pumpedhydro) between 2031 and 2034, as well solar (3,500 MW) and wind (2,200 MW) assets. These additions will also replace wind assetsthat are expected to retire during that period.
The completion of the majority of NSP-Minnesota’s aforementioned wind projects before year-end 2020 allow them to quality for100% of Production Tax Credits (PTCs) while the 300 MW Dakota Range (COD: 2021) is expected to quality for 80% of PTCs. The
7 31 December 2020 Northern States Power Company (Minnesota): Update to credit analysis
Docket No. E002/GR-21-630 Exhibit___(PAJ-1), Schedule 7
Page 7 of 11

MOODY'S INVESTORS SERVICE INFRASTRUCTURE AND PROJECT FINANCE
flow back to customers of the tax benefits, along with the saved fuel costs, and the termination of PPAs (that are subject to elevatedcontracted prices), along with the group-wide focus on reducing O&M-expenses and credit back to customers of the tax credits (PTCsand ITCs) are key elements of the group-wide’s strategy to limit the impact of the utilities’ material investment on the customers’ bills.As per the Resource Plan, NSP-Minnesota’s goal is to keep the annual cost increases below the rate of inflation.
Social risks are primarily related to demographic and societal trends as well as customer and regulatory relations. Corporate governanceconsiderations include financial policy and we note that a strong financial position is an important characteristic for managingenvironmental and social risks amid the group's significant capital expenditure program.
Liquidity analysisSimilar to its sister companies, NSP-Minnesota has its own separate committed credit facility. Following the group’s amendment of thefacilities, in June 2019, they are now scheduled to mature in June 2024. This facility back-stops the utility’s same-sized $500 millionCP-program (Prime-1). At the end of September 2020, the utility had $490 million available under this credit facility (letter of creditsoutstanding: $10 million) as well as $422.8 million of cash on hand. The facility provides for same day funding and borrowings are notsubject to conditionality, including any MAC clause. We anticipate the utility will be able to continue to comfortably comply with theonly financial covenant embedded in the facility, namely a total Debt/Capitalization ratio below 65%. As of September 2020, the ratiowas 47.5% (2019: 48%). Furthermore, in March 2020, NSP-Minnesota renewed the $75 million one-year uncommitted bilateral creditagreement for an additional one-year term, which is used to support letters of credit (available at the end of September 2020: $29million).
NSP-Minnesota also participates in a regulated money pool with its sister companies (since October 2020, including NSP-Wisconsin).As of 30 September 2020, NSP-Minnesota’s $250 million borrowing limit was fully available. This money pool allows for short-termloans among those utility subsidiaries and allows for short-term loans from Xcel to the utilities. However, it does not permit loans fromthe utilities to Xcel. NPS-Minnesota's next debt maturity consists of $300 million first mortgage bonds (FMB) due in August 2022.
Xcel has publicly disclosed that NSP-Minnesota will issue $400 million first mortgage bonds in 2021 following the 2.60% $700 millionFMB issuance completed in September 2020 (maturity: June 2051). We anticipate that the utility will fund its capital requirements in2021, including investments (in 2021:$1.6 billion), largely with internally generated cash flows (as a point of reference, LTM September2020: nearly $1.2 billion) and short and long-term debt financing. We also anticipate that Xcel will continue to manage NSP-Minnesota’s dividend policy (LTM September 2020: $493 million) and equity contributions to the utility (LTM September 202: $423million) so as to meet its regulatory capital structure (that is a aforementioned range of equity-to-total capitalization ratio). In January2020, Xcel contributed $150 million across the four pension plans (NSP-Minnesota's contribution: $44 million; 2019: $47 million).
8 31 December 2020 Northern States Power Company (Minnesota): Update to credit analysis
Docket No. E002/GR-21-630 Exhibit___(PAJ-1), Schedule 7
Page 8 of 11

MOODY'S INVESTORS SERVICE INFRASTRUCTURE AND PROJECT FINANCE
Rating methodology and scorecard factorsMoody's evaluates NSP-Minnesota’s financial performance relative to the Regulated Electric and Gas Utilities rating methodologypublished in June 2017. As depicted in the grid below, the company's scorecard-indicated outcome based on historical as well asprojected average key credit metrics is A2, the same as its assigned senior unsecured rating.
Exhibit 8
Northern States Power Company (Minnesota)
Regulated Electric and Gas Utilities Industry [1][2] Factor 1 : Regulatory Framework (25%) Measure Score Measure Score
a) Legislative and Judicial Underpinnings of the Regulatory Framework A A A Ab) Consistency and Predictability of Regulation A A A A
Factor 2 : Ability to Recover Costs and Earn Returns (25%)a) Timeliness of Recovery of Operating and Capital Costs Aa Aa Aa Aab) Sufficiency of Rates and Returns Baa Baa Baa Baa
Factor 3 : Diversification (10%)a) Market Position A A A Ab) Generation and Fuel Diversity Baa Baa Baa Baa
Factor 4 : Financial Strength (40%)a) CFO pre-WC + Interest / Interest (3 Year Avg) 6.9x Aa 6x - 7x Aab) CFO pre-WC / Debt (3 Year Avg) 24.6% A 22% - 24% Ac) CFO pre-WC – Dividends / Debt (3 Year Avg) 17.1% A 16% - 18% Ad) Debt / Capitalization (3 Year Avg) 43.1% A 40% - 42% A
Rating:Scorecard-Indicated Outcome Before Notching Adjustment A2 A2HoldCo Structural Subordination Notching 0 0 0 0a) Scorecard-Indicated Outcome A2 A2b) Actual Rating Assigned A2 A2
Current LTM 9/30/2020
Moody's 12-18 Month Forward View
As of Date Published [3]
[1] All ratios are based on 'Adjusted' financial data and incorporate Moody's Global Standard Adjustments for Non-Financial Corporations.[2] As of 9/30/2020(L)[3] This represents Moody's forward view; not the view of the issuer; and unless noted in the text, does not incorporate significant acquisitions and divestitures.[4] Standard risk grid for financial strength.Source: Moody's Financial Metrics
Appendix
Exhibit 9
Peer Comparison [1]
FYE FYE LTM FYE FYE LTM FYE FYE LTM FYE FYE LTM
(In US millions) Dec-18 Dec-19 Sept-20 Dec-18 Dec-19 Sept-20 Dec-18 Dec-19 Sept-20 Dec-19 Dec-19 Sept-20
Revenue 5,122 5,112 5,050 1,022 981 958 1,499 1,241 1,153 450 459 448
CFO Pre-W/C 1,355 1,366 1,442 213 230 228 387 335 328 111 142 156
Total Debt 5,414 5,827 6,175 908 903 936 1,703 1,806 2,201 600 686 760
CFO Pre-W/C + Interest / Interest 6.6x 6.7x 6.7x 6.2x 6.9x 6.9x 6.0x 5.7x 5.7x 4.7x 5.6x 5.7x
CFO Pre-W/C / Debt 25.0% 23.4% 23.4% 23.5% 25.4% 24.3% 22.7% 18.6% 14.9% 18.6% 20.7% 20.5%
CFO Pre-W/C Dividends / Debt 16.6% 15.4% 15.4% 13.4% 16.1% 17.5% 16.0% 11.9% 9.2% 11.5% 14.3% 14.6%
Debt / Capitalization 43.0% 42.9% 43.0% 42.9% 41.9% 41.3% 41.8% 41.6% 45.5% 46.0% 47.3% 45.6%
Northern States Power Company
(P)A2 (Stable)
Northern States Power Company ALLETE, Inc. Otter Tail Power Company
(P)A2 (Stable) Baa1 (Stable) A3 (Stable)
Source: Moody's Financial Metrics
9 31 December 2020 Northern States Power Company (Minnesota): Update to credit analysis
Docket No. E002/GR-21-630 Exhibit___(PAJ-1), Schedule 7
Page 9 of 11

MOODY'S INVESTORS SERVICE INFRASTRUCTURE AND PROJECT FINANCE
Exhibit 10
Cash flow and credit metrics [1]CF Metrics Dec-16 Dec-17 Dec-18 Dec-19 LTM Sept-20
As Adjusted
FFO 1,395 1,485 1,419 1,420 1,487
+/- Other -26 -24 -65 -55 -45
CFO Pre-WC 1,369 1,461 1,355 1,366 1,442
+/- WC -42 -158 159 -183 -193
WC 1,327 1,302 1,514 1,183 1,249
WC 1,369 1,461 1,355 1,366 1,442
CFO 1,327 1,302 1,514 1,183 1,249
- Div 396 507 456 467 493
- Capex 1,178 984 1,146 1,410 1,353
FCF -247 -188 -89 -693 -597
(CFO Pre-W/C) / Debt 25.3% 26.7% 25.0% 23.4% 23.4%
(CFO Pre-W/C - Dividends) / Debt 18.0% 17.5% 16.6% 15.4% 15.4%
FFO / Debt 25.8% 27.2% 26.2% 24.4% 24.1%
RCF / Debt 18.5% 17.9% 17.8% 16.4% 16.1%
Revenue 4,900 5,102 5,122 5,112 5,050
Interest Expense 240 242 240 242 253
Net Income 490 523 476 539 591
Total Assets 17,917 18,005 18,525 19,904 21,144
Total Liabilities 12,691 12,664 13,024 13,911 14,726
Total Equity 5,226 5,341 5,500 5,993 6,418
[1] All figures & ratios calculated using Moody’s estimates & standard adjustments. FYE = Financial Year-End. LTM = Last Twelve Months.Source: Moody's Financial Metrics
Ratings
Exhibit 11
Category Moody's RatingNORTHERN STATES POWER COMPANY(MINNESOTA)
Outlook StableIssuer Rating A2First Mortgage Bonds Aa3Senior Secured Shelf (P)Aa3Sr Unsec Bank Credit Facility A2Senior Unsecured Shelf (P)A2Commercial Paper P-1
PARENT: XCEL ENERGY INC.
Outlook StableIssuer Rating Baa1Sr Unsec Bank Credit Facility Baa1Senior Unsecured Baa1Subordinate Shelf (P)Baa2Pref. Shelf (P)Baa3Commercial Paper P-2
Source: Moody's Investors Service
10 31 December 2020 Northern States Power Company (Minnesota): Update to credit analysis
Docket No. E002/GR-21-630 Exhibit___(PAJ-1), Schedule 7
Page 10 of 11

MOODY'S INVESTORS SERVICE INFRASTRUCTURE AND PROJECT FINANCE
© 2020 Moody’s Corporation, Moody’s Investors Service, Inc., Moody’s Analytics, Inc. and/or their licensors and affiliates (collectively, “MOODY’S”). All rights reserved.
CREDIT RATINGS ISSUED BY MOODY'S INVESTORS SERVICE, INC. AND/OR ITS CREDIT RATINGS AFFILIATES ARE MOODY’S CURRENT OPINIONS OF THE RELATIVE FUTURECREDIT RISK OF ENTITIES, CREDIT COMMITMENTS, OR DEBT OR DEBT-LIKE SECURITIES, AND MATERIALS, PRODUCTS, SERVICES AND INFORMATION PUBLISHED BY MOODY’S(COLLECTIVELY, “PUBLICATIONS”) MAY INCLUDE SUCH CURRENT OPINIONS. MOODY’S INVESTORS SERVICE DEFINES CREDIT RISK AS THE RISK THAT AN ENTITY MAYNOT MEET ITS CONTRACTUAL FINANCIAL OBLIGATIONS AS THEY COME DUE AND ANY ESTIMATED FINANCIAL LOSS IN THE EVENT OF DEFAULT OR IMPAIRMENT. SEEMOODY’S RATING SYMBOLS AND DEFINITIONS PUBLICATION FOR INFORMATION ON THE TYPES OF CONTRACTUAL FINANCIAL OBLIGATIONS ADDRESSED BY MOODY’SINVESTORS SERVICE CREDIT RATINGS. CREDIT RATINGS DO NOT ADDRESS ANY OTHER RISK, INCLUDING BUT NOT LIMITED TO: LIQUIDITY RISK, MARKET VALUE RISK, ORPRICE VOLATILITY. CREDIT RATINGS, NON-CREDIT ASSESSMENTS (“ASSESSMENTS”), AND OTHER OPINIONS INCLUDED IN MOODY’S PUBLICATIONS ARE NOT STATEMENTSOF CURRENT OR HISTORICAL FACT. MOODY’S PUBLICATIONS MAY ALSO INCLUDE QUANTITATIVE MODEL-BASED ESTIMATES OF CREDIT RISK AND RELATED OPINIONS ORCOMMENTARY PUBLISHED BY MOODY’S ANALYTICS, INC. AND/OR ITS AFFILIATES. MOODY’S CREDIT RATINGS, ASSESSMENTS, OTHER OPINIONS AND PUBLICATIONS DONOT CONSTITUTE OR PROVIDE INVESTMENT OR FINANCIAL ADVICE, AND MOODY’S CREDIT RATINGS, ASSESSMENTS, OTHER OPINIONS AND PUBLICATIONS ARE NOTAND DO NOT PROVIDE RECOMMENDATIONS TO PURCHASE, SELL, OR HOLD PARTICULAR SECURITIES. MOODY’S CREDIT RATINGS, ASSESSMENTS, OTHER OPINIONS ANDPUBLICATIONS DO NOT COMMENT ON THE SUITABILITY OF AN INVESTMENT FOR ANY PARTICULAR INVESTOR. MOODY’S ISSUES ITS CREDIT RATINGS, ASSESSMENTS ANDOTHER OPINIONS AND PUBLISHES ITS PUBLICATIONS WITH THE EXPECTATION AND UNDERSTANDING THAT EACH INVESTOR WILL, WITH DUE CARE, MAKE ITS OWN STUDYAND EVALUATION OF EACH SECURITY THAT IS UNDER CONSIDERATION FOR PURCHASE, HOLDING, OR SALE.
MOODY’S CREDIT RATINGS, ASSESSMENTS, OTHER OPINIONS, AND PUBLICATIONS ARE NOT INTENDED FOR USE BY RETAIL INVESTORS AND IT WOULD BE RECKLESSAND INAPPROPRIATE FOR RETAIL INVESTORS TO USE MOODY’S CREDIT RATINGS, ASSESSMENTS, OTHER OPINIONS OR PUBLICATIONS WHEN MAKING AN INVESTMENTDECISION. IF IN DOUBT YOU SHOULD CONTACT YOUR FINANCIAL OR OTHER PROFESSIONAL ADVISER. ALL INFORMATION CONTAINED HEREIN IS PROTECTED BYLAW, INCLUDING BUT NOT LIMITED TO, COPYRIGHT LAW, AND NONE OF SUCH INFORMATION MAY BE COPIED OR OTHERWISE REPRODUCED, REPACKAGED, FURTHERTRANSMITTED, TRANSFERRED, DISSEMINATED, REDISTRIBUTED OR RESOLD, OR STORED FOR SUBSEQUENT USE FOR ANY SUCH PURPOSE, IN WHOLE OR IN PART, IN ANYFORM OR MANNER OR BY ANY MEANS WHATSOEVER, BY ANY PERSON WITHOUT MOODY’S PRIOR WRITTEN CONSENT.
MOODY’S CREDIT RATINGS, ASSESSMENTS, OTHER OPINIONS AND PUBLICATIONS ARE NOT INTENDED FOR USE BY ANY PERSON AS A BENCHMARK AS THAT TERM ISDEFINED FOR REGULATORY PURPOSES AND MUST NOT BE USED IN ANY WAY THAT COULD RESULT IN THEM BEING CONSIDERED A BENCHMARK.
All information contained herein is obtained by MOODY’S from sources believed by it to be accurate and reliable. Because of the possibility of human or mechanical error as wellas other factors, however, all information contained herein is provided “AS IS” without warranty of any kind. MOODY'S adopts all necessary measures so that the information ituses in assigning a credit rating is of sufficient quality and from sources MOODY'S considers to be reliable including, when appropriate, independent third-party sources. However,MOODY’S is not an auditor and cannot in every instance independently verify or validate information received in the rating process or in preparing its Publications.
To the extent permitted by law, MOODY’S and its directors, officers, employees, agents, representatives, licensors and suppliers disclaim liability to any person or entity for anyindirect, special, consequential, or incidental losses or damages whatsoever arising from or in connection with the information contained herein or the use of or inability to use anysuch information, even if MOODY’S or any of its directors, officers, employees, agents, representatives, licensors or suppliers is advised in advance of the possibility of such losses ordamages, including but not limited to: (a) any loss of present or prospective profits or (b) any loss or damage arising where the relevant financial instrument is not the subject of aparticular credit rating assigned by MOODY’S.
To the extent permitted by law, MOODY’S and its directors, officers, employees, agents, representatives, licensors and suppliers disclaim liability for any direct or compensatorylosses or damages caused to any person or entity, including but not limited to by any negligence (but excluding fraud, willful misconduct or any other type of liability that, for theavoidance of doubt, by law cannot be excluded) on the part of, or any contingency within or beyond the control of, MOODY’S or any of its directors, officers, employees, agents,representatives, licensors or suppliers, arising from or in connection with the information contained herein or the use of or inability to use any such information.
NO WARRANTY, EXPRESS OR IMPLIED, AS TO THE ACCURACY, TIMELINESS, COMPLETENESS, MERCHANTABILITY OR FITNESS FOR ANY PARTICULAR PURPOSE OF ANY CREDITRATING, ASSESSMENT, OTHER OPINION OR INFORMATION IS GIVEN OR MADE BY MOODY’S IN ANY FORM OR MANNER WHATSOEVER.
Moody’s Investors Service, Inc., a wholly-owned credit rating agency subsidiary of Moody’s Corporation (“MCO”), hereby discloses that most issuers of debt securities (includingcorporate and municipal bonds, debentures, notes and commercial paper) and preferred stock rated by Moody’s Investors Service, Inc. have, prior to assignment of any credit rating,agreed to pay to Moody’s Investors Service, Inc. for credit ratings opinions and services rendered by it fees ranging from $1,000 to approximately $2,700,000. MCO and Moody’sInvestors Service also maintain policies and procedures to address the independence of Moody’s Investors Service credit ratings and credit rating processes. Information regardingcertain affiliations that may exist between directors of MCO and rated entities, and between entities who hold credit ratings from Moody’s Investors Service and have also publiclyreported to the SEC an ownership interest in MCO of more than 5%, is posted annually at www.moodys.com under the heading “Investor Relations — Corporate Governance —Director and Shareholder Affiliation Policy.”
Additional terms for Australia only: Any publication into Australia of this document is pursuant to the Australian Financial Services License of MOODY’S affiliate, Moody’s InvestorsService Pty Limited ABN 61 003 399 657AFSL 336969 and/or Moody’s Analytics Australia Pty Ltd ABN 94 105 136 972 AFSL 383569 (as applicable). This document is intendedto be provided only to “wholesale clients” within the meaning of section 761G of the Corporations Act 2001. By continuing to access this document from within Australia, yourepresent to MOODY’S that you are, or are accessing the document as a representative of, a “wholesale client” and that neither you nor the entity you represent will directly orindirectly disseminate this document or its contents to “retail clients” within the meaning of section 761G of the Corporations Act 2001. MOODY’S credit rating is an opinion as tothe creditworthiness of a debt obligation of the issuer, not on the equity securities of the issuer or any form of security that is available to retail investors.
Additional terms for Japan only: Moody's Japan K.K. (“MJKK”) is a wholly-owned credit rating agency subsidiary of Moody's Group Japan G.K., which is wholly-owned by Moody’sOverseas Holdings Inc., a wholly-owned subsidiary of MCO. Moody’s SF Japan K.K. (“MSFJ”) is a wholly-owned credit rating agency subsidiary of MJKK. MSFJ is not a NationallyRecognized Statistical Rating Organization (“NRSRO”). Therefore, credit ratings assigned by MSFJ are Non-NRSRO Credit Ratings. Non-NRSRO Credit Ratings are assigned by anentity that is not a NRSRO and, consequently, the rated obligation will not qualify for certain types of treatment under U.S. laws. MJKK and MSFJ are credit rating agencies registeredwith the Japan Financial Services Agency and their registration numbers are FSA Commissioner (Ratings) No. 2 and 3 respectively.
MJKK or MSFJ (as applicable) hereby disclose that most issuers of debt securities (including corporate and municipal bonds, debentures, notes and commercial paper) and preferredstock rated by MJKK or MSFJ (as applicable) have, prior to assignment of any credit rating, agreed to pay to MJKK or MSFJ (as applicable) for credit ratings opinions and servicesrendered by it fees ranging from JPY125,000 to approximately JPY250,000,000.
MJKK and MSFJ also maintain policies and procedures to address Japanese regulatory requirements.
REPORT NUMBER 1252442
11 31 December 2020 Northern States Power Company (Minnesota): Update to credit analysis
Docket No. E002/GR-21-630 Exhibit___(PAJ-1), Schedule 7
Page 11 of 11

Northern States Power Co.
Primary Credit Analyst:
Mayur Deval, Toronto (1) 416-507-3271; [email protected]
Secondary Contacts:
Gerrit W Jepsen, CFA, New York (1) 212-438-2529; [email protected]
Daria Babitsch, New York; [email protected]
Research Assistant:
Sumeet P Ghodke, Pune
Table Of Contents
Credit Highlights
Outlook
Our Base-Case Scenario
Company Description
Peer comparison
Business Risk
Financial Risk
Liquidity
Environmental, Social, And Governance
Group Influence
Issue Ratings - Subordination Risk Analysis
Issue Ratings - Recovery Analysis
WWW.STANDARDANDPOORS.COM/RATINGSDIRECT DECEMBER 18, 2020 1THIS WAS PREPARED EXCLUSIVELY FOR USER DARIN NORMAN.NOT FOR REDISTRIBUTION UNLESS OTHERWISE PERMITTED.
Docket No. E002/GR-21-630 Exhibit___(PAJ-1), Schedule 8
Page 1 of 12

Table Of Contents (cont.)
Ratings Score Snapshot
Related Criteria
WWW.STANDARDANDPOORS.COM/RATINGSDIRECT DECEMBER 18, 2020 2THIS WAS PREPARED EXCLUSIVELY FOR USER DARIN NORMAN.NOT FOR REDISTRIBUTION UNLESS OTHERWISE PERMITTED.
Docket No. E002/GR-21-630 Exhibit___(PAJ-1), Schedule 8
Page 2 of 12

Northern States Power Co.
Business Risk: EXCELLENT
Vulnerable Excellent
Financial Risk: SIGNIFICANT
Highly leveraged Minimal
a-a
a-
Anchor Modifiers Group/Gov't
Issuer Credit Rating
A-/Stable/A-2
Credit Highlights
Overview
Key strengths Key risks
Low-risk vertically integrated electric and natural gas utility. Operational and environmental risks associated with nuclear and coal generation.
Large, mostly residential customer base. Geographic diversity largely limited to Minnesota.
Steady utility operating cash flow. Negative discretionary cash flow, indicating external funding needs.
High-level residential customer load limits revenue impact of COVID-19. Residential customers comprise about 90%
of Northern States Power Co.'s (NSP's) customers and 33% of NSP's revenue, dampening weakened revenue from
industrial and commercial customers after a mandated pandemic-related lockdown.
We expect the company to maintain credit measures consistent with its current rating. Our base-case scenario, with
additional capital expenditure for renewable generation projects, expects NSP to maintain adjusted funds from
operations (FFO) to debt in the 20%-22% range, above the midpoint of the financial risk profile benchmark range.
Efforts underway to change the generation mix toward sustainable renewable wind energy. In line with parent Xcel
Energy Inc., NSP has taken steps to rebalance the generation mix with investments in wind generation projects in
addition to existing wind generation capacity. The gradual change toward the corporate target of 80% carbon
reduction by 2030 began in 2005.
WWW.STANDARDANDPOORS.COM/RATINGSDIRECT DECEMBER 18, 2020 3THIS WAS PREPARED EXCLUSIVELY FOR USER DARIN NORMAN.NOT FOR REDISTRIBUTION UNLESS OTHERWISE PERMITTED.
Docket No. E002/GR-21-630 Exhibit___(PAJ-1), Schedule 8
Page 3 of 12

Outlook: Stable
The stable outlook on NSP reflects that on Xcel. We base the outlook on our expectation that Xcel's management
will continue to reach constructive regulatory outcomes to avoid any significant rise in business risk for the
regulated utilities. Specifically, our base-case forecast includes adjusted FFO to debt of about 16% and assumes the
company will continue to fund its capital investments in a balanced manner to support its capital structure.
Downside scenario
We could lower the rating on Xcel and its subsidiaries, including NSP, if Xcel's financial ratios weaken and
consistently reflect adjusted FFO to debt at or below 15%. This would most likely occur if rate-case outcomes are
weaker than expected and capital spending materially rises.
Upside scenario
We could raise the ratings if Xcel improves its collective ability to manage regulatory risk across its jurisdictions,
resulting in a consistent improvement to its business risk. We could also raise the rating if the company's
consolidated financial measures consistently exceed our baseline forecast, including adjusted FFO to debt of
greater than 20%.
Our Base-Case Scenario
Assumptions
• Continued cost recovery through various regulatory mechanisms;
• Annual gross margin in the 60%-62% range;
• Annual capital spending averaging about $1.8 billion through 2022;
• Annual dividends averaging about $320 million;
• Negative discretionary cash flow indicates external funding needs; and
• All debt maturities are refinanced.
Key metrics
2020E 2021E 2022E
Adjusted FFO to debt (%) 20.5-22.5 20-22 19-21
Adjusted debt to EBITDA (x) 3.7-4.1 3.8-4.2 4-4.4
Adjusted FFO to cash interest(x) 6.4-6.8 6.1-6.5 5.7-6.1
WWW.STANDARDANDPOORS.COM/RATINGSDIRECT DECEMBER 18, 2020 4THIS WAS PREPARED EXCLUSIVELY FOR USER DARIN NORMAN.NOT FOR REDISTRIBUTION UNLESS OTHERWISE PERMITTED.
Northern States Power Co.
Docket No. E002/GR-21-630 Exhibit___(PAJ-1), Schedule 8
Page 4 of 12

E--Expected. FFO--Funds from operations.
Company Description
Minneapolis-based NSP is a vertically integrated electric and natural gas distribution utility operating in Minnesota,
North Dakota, and South Dakota.
Peer comparison
Table 1
Northern States Power Co.--Peer Comparison
Industry Sector: Electric
Northern States
Power Co.
Wisconsin Electric
Power Co.
Consumers Energy
Co.
Union Electric Co. d/b/a
Ameren Missouri
Ratings as of Oct. 27, 2020 A-/Stable/A-2 A-/Stable/A-2 A-/Stable/A-2 BBB+/Stable/A-2
--Fiscal year ended Dec. 31, 2019
(Mil. $)
Revenue 5,111.8 3,496.7 6,341.5 3,243.0
EBITDA 1,866.3 1,300.4 2,246.6 1,288.0
Funds from operations
(FFO)
1,524.5 688.0 1,813.6 982.3
Interest expense 357.8 221.5 340.1 221.3
Cash interest paid 237.4 566.6 301.1 204.7
Cash flow from operations 1,194.2 892.9 1,678.6 1,056.3
Capital expenditure 1,437.1 627.8 2,181.0 1,095.0
Free operating cash flow
(FOCF)
(243.0) 265.1 (502.5) (38.7)
Discretionary cash flow
(DCF)
(709.6) (94.3) (1,094.5) (470.2)
Cash and short-term
investments
126.3 19.1 11.0 9.0
Debt 5,979.9 4,250.8 8,369.6 4,226.0
Equity 6,081.8 3,576.3 7,737.0 4,309.0
Adjusted ratios
EBITDA margin (%) 36.5 37.2 35.4 39.7
Return on capital (%) 8.2 11.2 7.7 8.5
EBITDA interest coverage
(x)
5.2 5.9 6.6 5.8
FFO cash interest coverage
(x)
7.4 2.2 7.0 5.8
Debt/EBITDA (x) 3.2 3.3 3.7 3.3
FFO/debt (%) 25.5 16.2 21.7 23.2
Cash flow from
operations/debt (%)
20.0 21.0 20.1 25.0
FOCF/debt (%) (4.1) 6.2 (6.0) (0.9)
WWW.STANDARDANDPOORS.COM/RATINGSDIRECT DECEMBER 18, 2020 5THIS WAS PREPARED EXCLUSIVELY FOR USER DARIN NORMAN.NOT FOR REDISTRIBUTION UNLESS OTHERWISE PERMITTED.
Northern States Power Co.
Docket No. E002/GR-21-630 Exhibit___(PAJ-1), Schedule 8
Page 5 of 12

Table 1
Northern States Power Co.--Peer Comparison (cont.)
Industry Sector: Electric
Northern States
Power Co.
Wisconsin Electric
Power Co.
Consumers Energy
Co.
Union Electric Co. d/b/a
Ameren Missouri
DCF/debt (%) (11.9) (2.2) (13.1) (11.1)
Business Risk: Excellent
NSP's business risk profile incorporates its low-risk, rate-regulated utility operations that serve over 2 million electric
and natural gas customers in Minnesota, North Dakota, and South Dakota. Although NSP operates in three states,
there is limited geographic and regulatory diversity because NSP earns about 90% of its revenue in Minnesota.
Revenue stability is supported with a customer base that is about 90% residential contributing about 33% to the
revenues. NSP has implemented multiyear rate plans and benefits from credit-supportive infrastructure riders. As
NSP's generation capacity consists of nuclear (28%) and coal-fired (23%), the higher operating risk associated with
nuclear-power generation and potential environmental risks from coal generation marginally weakens the company's
business risk profile.
Financial Risk: Significant
Our stand-alone financial risk profile for NSP incorporates a base-case scenario that includes adjusted FFO to debt
weakening toward 20%, just above the midpoint of the benchmark range of the significant category. Supporting the
financial risk profile determination is the supplemental ratio of adjusted FFO cash interest coverage in the 5.7x-6.8x
range. In addition, we expect the utility's elevated capital spending, when combined with its dividend, will result in
negative discretionary cash flow. To offset the negative cash flow, we expect external funding, such as debt issuances
and cash injections within the Xcel Energy group. We expect debt leverage, as indicated by debt to EBITDA, to rise
and remain in the 3.7x-4.4x range over the next few years. Reflecting the company's steady cash flow and
rate-regulated utility operations, we base our risk assessment on our medial volatility table benchmarks. These are
more relaxed benchmarks than those used for a typical corporate issuer.
NSP's financial measures in our base-case scenario will consistently be above the midpoint of benchmark range for the
financial risk profile, albeit weakening over the next few years.
Financial summaryTable 2
Northern States Power Co.--Financial Summary
Industry Sector: Electric
--Fiscal year ended Dec. 31--
2019 2018 2017 2016 2015
(Mil. $)
Revenue 5,111.8 5,121.9 5,102.0 4,900.3 4,756.8
WWW.STANDARDANDPOORS.COM/RATINGSDIRECT DECEMBER 18, 2020 6THIS WAS PREPARED EXCLUSIVELY FOR USER DARIN NORMAN.NOT FOR REDISTRIBUTION UNLESS OTHERWISE PERMITTED.
Northern States Power Co.
Docket No. E002/GR-21-630 Exhibit___(PAJ-1), Schedule 8
Page 6 of 12

Table 2
Northern States Power Co.--Financial Summary (cont.)
EBITDA 1,866.3 1,738.3 1,852.7 1,807.8 1,459.9
Funds from operations (FFO) 1,524.5 1,580.5 1,524.3 1,524.7 1,286.4
Interest expense 357.8 356.9 378.6 372.3 346.4
Cash interest paid 237.4 246.8 257.5 244.1 226.7
Cash flow from operations 1,194.2 1,477.6 1,256.1 1,290.4 1,310.8
Capital expenditure 1,437.1 1,158.8 988.5 1,186.4 1,837.7
Free operating cash flow (FOCF) (243.0) 318.8 267.6 103.9 (526.9)
Discretionary cash flow (DCF) (709.6) (137.5) (239.0) (292.0) (786.1)
Cash and short-term investments 126.3 50.0 43.8 52.8 42.6
Gross available cash 126.3 50.0 43.8 47.6 42.6
Debt 5,979.9 5,661.7 5,605.4 5,885.9 5,734.7
Equity 6,081.8 5,573.1 5,475.6 5,355.6 5,167.1
Adjusted ratios
EBITDA margin (%) 36.5 33.9 36.3 36.9 30.7
Return on capital (%) 8.2 8.3 9.4 9.9 8.4
EBITDA interest coverage (x) 5.2 4.9 4.9 4.9 4.2
FFO cash interest coverage (x) 7.4 7.4 6.9 7.2 6.7
Debt/EBITDA (x) 3.2 3.3 3.0 3.3 3.9
FFO/debt (%) 25.5 27.9 27.2 25.9 22.4
Cash flow from operations/debt (%) 20.0 26.1 22.4 21.9 22.9
FOCF/debt (%) (4.1) 5.6 4.8 1.8 (9.2)
DCF/debt (%) (11.9) (2.4) (4.3) (5.0) (13.7)
ReconciliationTable 3
Northern States Power Co.--Reconciliation Of Reported Amounts With S&P Global Ratings' Adjusted Amounts
--12 months ended June 30, 2020--
Northern States Power Co. reported amounts (mil. $)
Debt
Shareholders'
equity Revenue EBITDA
Operating
income
Interest
expense
S&P
Global
Ratings'
adjusted
EBITDA
Cash flow
from
operations Dividends
Capital
expenditure
6,202.3 6,289.8 5,006.4 1,591.1 787.8 227.9 1,825.3 1,232.2 483.1 1,435.3
S&P Global Ratings' adjustments
Cash taxes paid -- -- -- -- -- -- (84.8) -- -- --
Cash interest paid -- -- -- -- -- -- (214.1) -- -- --
Reported lease
liabilities
566.4 -- -- -- -- -- -- -- -- --
Operating leases -- -- -- 7.7 10.3 10.3 (10.3) (2.6) -- --
Postretirement
benefit
obligations/deferred
compensation
157.9 -- -- -- -- -- -- -- -- --
WWW.STANDARDANDPOORS.COM/RATINGSDIRECT DECEMBER 18, 2020 7THIS WAS PREPARED EXCLUSIVELY FOR USER DARIN NORMAN.NOT FOR REDISTRIBUTION UNLESS OTHERWISE PERMITTED.
Northern States Power Co.
Docket No. E002/GR-21-630 Exhibit___(PAJ-1), Schedule 8
Page 7 of 12
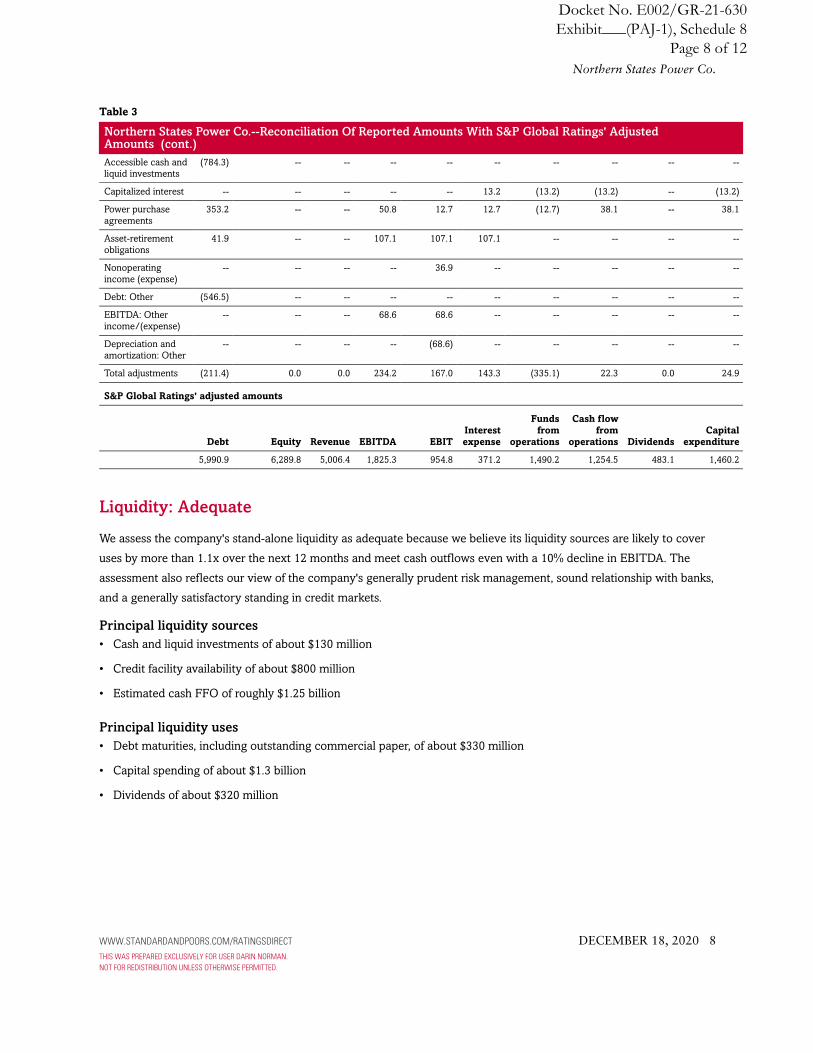
Table 3
Northern States Power Co.--Reconciliation Of Reported Amounts With S&P Global Ratings' AdjustedAmounts (cont.)
Accessible cash and
liquid investments
(784.3) -- -- -- -- -- -- -- -- --
Capitalized interest -- -- -- -- -- 13.2 (13.2) (13.2) -- (13.2)
Power purchase
agreements
353.2 -- -- 50.8 12.7 12.7 (12.7) 38.1 -- 38.1
Asset-retirement
obligations
41.9 -- -- 107.1 107.1 107.1 -- -- -- --
Nonoperating
income (expense)
-- -- -- -- 36.9 -- -- -- -- --
Debt: Other (546.5) -- -- -- -- -- -- -- -- --
EBITDA: Other
income/(expense)
-- -- -- 68.6 68.6 -- -- -- -- --
Depreciation and
amortization: Other
-- -- -- -- (68.6) -- -- -- -- --
Total adjustments (211.4) 0.0 0.0 234.2 167.0 143.3 (335.1) 22.3 0.0 24.9
S&P Global Ratings' adjusted amounts
Debt Equity Revenue EBITDA EBIT
Interest
expense
Funds
from
operations
Cash flow
from
operations Dividends
Capital
expenditure
5,990.9 6,289.8 5,006.4 1,825.3 954.8 371.2 1,490.2 1,254.5 483.1 1,460.2
Liquidity: Adequate
We assess the company's stand-alone liquidity as adequate because we believe its liquidity sources are likely to cover
uses by more than 1.1x over the next 12 months and meet cash outflows even with a 10% decline in EBITDA. The
assessment also reflects our view of the company's generally prudent risk management, sound relationship with banks,
and a generally satisfactory standing in credit markets.
Principal liquidity sources
• Cash and liquid investments of about $130 million
• Credit facility availability of about $800 million
• Estimated cash FFO of roughly $1.25 billion
Principal liquidity uses
• Debt maturities, including outstanding commercial paper, of about $330 million
• Capital spending of about $1.3 billion
• Dividends of about $320 million
WWW.STANDARDANDPOORS.COM/RATINGSDIRECT DECEMBER 18, 2020 8THIS WAS PREPARED EXCLUSIVELY FOR USER DARIN NORMAN.NOT FOR REDISTRIBUTION UNLESS OTHERWISE PERMITTED.
Northern States Power Co.
Docket No. E002/GR-21-630 Exhibit___(PAJ-1), Schedule 8
Page 8 of 12

Environmental, Social, And Governance
Governance and social factors for the company are consistent with what we see across the industry for other
publicly traded utilities.
Parent Xcel's fuel mix consists of approximately 24% renewables, 13% nuclear, 33% natural gas, 26% coal, and 4%
hydro and other sources. The company's reliance on coal-fired generation exposes it to the ongoing cost of
operating older units in the face of disruptive technological advances and the potential for more environmental
regulations requiring significant capital investments. However, the company is trying to reduce its carbon footprint;
it plans to shutter upwards of 3,100 megawatts (MW) of coal-fueled generation in the U.S. and will convert roughly
1,000 MW of coal to natural gas, invest in a combined-cycle natural gas plant, invest in 3,500 MW of solar
generation, and invest in 2,250 MW of wind generation. By pursuing greater renewable generation, the company is
meeting customer demand for greener energy. Additionally, parent Xcel operates two nuclear plants, with one
expected to remain open through 2034, that generate around 1,700 MW of power. Although carbon-free, the
company's nuclear generation portfolio increases operating risk and exposes it to longer-term nuclear waste
storage risks.
Group Influence
Under our group rating methodology, we consider NSP as a core subsidiary of parent Xcel, reflecting our view that
NSP is highly unlikely to be sold, is integral to the overall group strategy, possesses a strong long-term commitment
from senior management, and is closely linked to the parent's name and reputation. We assess NSP's issuer credit
rating to be in line with Xcel's group credit profile of 'a-'.
Issue Ratings - Subordination Risk Analysis
We base the short-term rating of 'A-2' on the issuer credit rating on the company.
Issue Ratings - Recovery Analysis
NSP's first mortgage bonds benefit from a first-priority lien on substantially all the utility's real property owned or
subsequently acquired. Collateral coverage of more than 1.5x supports a recovery rating of '1+' and an issue rating one
notch above the issuer credit rating.
Ratings Score Snapshot
Issuer Credit Rating
A-/Stable/A-2
WWW.STANDARDANDPOORS.COM/RATINGSDIRECT DECEMBER 18, 2020 9THIS WAS PREPARED EXCLUSIVELY FOR USER DARIN NORMAN.NOT FOR REDISTRIBUTION UNLESS OTHERWISE PERMITTED.
Northern States Power Co.
Docket No. E002/GR-21-630 Exhibit___(PAJ-1), Schedule 8
Page 9 of 12

Business risk: Excellent
• Country risk: Very low
• Industry risk: Very low
• Competitive position: Strong
Financial risk: Significant
• Cash flow/leverage: Significant
Anchor: a-
Modifiers
• Diversification/portfolio effect: Neutral (no impact)
• Capital structure: Neutral (no impact)
• Financial policy: Neutral (no impact)
• Liquidity: Adequate (no impact)
• Management and governance: Strong (no impact)
• Comparable rating analysis: Positive (+1 notch)
Stand-alone credit profile : a
• Group credit profile: a-
• Entity status within group: Core (-1 notch from SACP)
Related Criteria
• Criteria - Corporates - General: Reflecting Subordination Risk In Corporate Issue Ratings, March 28, 2018
• General Criteria: Methodology For Linking Long-Term And Short-Term Ratings, April 7, 2017
• Criteria - Corporates - General: Methodology And Assumptions: Liquidity Descriptors For Global Corporate Issuers,
Dec. 16, 2014
• Criteria - Corporates - General: Corporate Methodology: Ratios And Adjustments, Nov. 19, 2013
• General Criteria: Country Risk Assessment Methodology And Assumptions, Nov. 19, 2013
• General Criteria: Group Rating Methodology, Nov. 19, 2013
• Criteria - Corporates - General: Corporate Methodology, Nov. 19, 2013
• General Criteria: Methodology: Industry Risk, Nov. 19, 2013
• Criteria - Corporates - Utilities: Key Credit Factors For The Regulated Utilities Industry, Nov. 19, 2013
• Criteria - Corporates - Utilities: Collateral Coverage And Issue Notching Rules For '1+' And '1' Recovery Ratings On
Senior Bonds Secured By Utility Real Property, Feb. 14, 2013
• General Criteria: Methodology: Management And Governance Credit Factors For Corporate Entities And Insurers,
Nov. 13, 2012
WWW.STANDARDANDPOORS.COM/RATINGSDIRECT DECEMBER 18, 2020 10THIS WAS PREPARED EXCLUSIVELY FOR USER DARIN NORMAN.NOT FOR REDISTRIBUTION UNLESS OTHERWISE PERMITTED.
Northern States Power Co.
Docket No. E002/GR-21-630 Exhibit___(PAJ-1), Schedule 8
Page 10 of 12

• General Criteria: Use Of CreditWatch And Outlooks, Sept. 14, 2009
Business And Financial Risk Matrix
Business Risk Profile
Financial Risk Profile
Minimal Modest Intermediate Significant Aggressive Highly leveraged
Excellent aaa/aa+ aa a+/a a- bbb bbb-/bb+
Strong aa/aa- a+/a a-/bbb+ bbb bb+ bb
Satisfactory a/a- bbb+ bbb/bbb- bbb-/bb+ bb b+
Fair bbb/bbb- bbb- bb+ bb bb- b
Weak bb+ bb+ bb bb- b+ b/b-
Vulnerable bb- bb- bb-/b+ b+ b b-
Ratings Detail (As Of December 18, 2020)*
Northern States Power Co.
Issuer Credit Rating A-/Stable/A-2
Commercial Paper
Local Currency A-2
Senior Secured A
Issuer Credit Ratings History
23-Jun-2010 Foreign Currency A-/Stable/A-2
10-Jun-2009 BBB+/Positive/A-2
16-Oct-2007 BBB+/Stable/A-2
23-Jun-2010 Local Currency A-/Stable/A-2
10-Jun-2009 BBB+/Positive/A-2
16-Oct-2007 BBB+/Stable/A-2
*Unless otherwise noted, all ratings in this report are global scale ratings. S&P Global Ratings’ credit ratings on the global scale are comparable
across countries. S&P Global Ratings’ credit ratings on a national scale are relative to obligors or obligations within that specific country. Issue and
debt ratings could include debt guaranteed by another entity, and rated debt that an entity guarantees.
WWW.STANDARDANDPOORS.COM/RATINGSDIRECT DECEMBER 18, 2020 11THIS WAS PREPARED EXCLUSIVELY FOR USER DARIN NORMAN.NOT FOR REDISTRIBUTION UNLESS OTHERWISE PERMITTED.
Northern States Power Co.
Docket No. E002/GR-21-630 Exhibit___(PAJ-1), Schedule 8
Page 11 of 12

WWW.STANDARDANDPOORS.COM/RATINGSDIRECT DECEMBER 18, 2020 12THIS WAS PREPARED EXCLUSIVELY FOR USER DARIN NORMAN.NOT FOR REDISTRIBUTION UNLESS OTHERWISE PERMITTED.
STANDARD & POOR’S, S&P and RATINGSDIRECT are registered trademarks of Standard & Poor’s Financial Services LLC.
S&P may receive compensation for its ratings and certain analyses, normally from issuers or underwriters of securities or from obligors. S&P reserves the right to disseminateits opinions and analyses. S&P's public ratings and analyses are made available on its Web sites, www.standardandpoors.com (free of charge), and www.ratingsdirect.com(subscription), and may be distributed through other means, including via S&P publications and third-party redistributors. Additional information about our ratings fees isavailable at www.standardandpoors.com/usratingsfees.
S&P keeps certain activities of its business units separate from each other in order to preserve the independence and objectivity of their respective activities. As a result,certain business units of S&P may have information that is not available to other S&P business units. S&P has established policies and procedures to maintain theconfidentiality of certain non-public information received in connection with each analytical process.
To the extent that regulatory authorities allow a rating agency to acknowledge in one jurisdiction a rating issued in another jurisdiction for certain regulatory purposes, S&Preserves the right to assign, withdraw or suspend such acknowledgment at any time and in its sole discretion. S&P Parties disclaim any duty whatsoever arising out of theassignment, withdrawal or suspension of an acknowledgment as well as any liability for any damage alleged to have been suffered on account thereof.
Credit-related and other analyses, including ratings, and statements in the Content are statements of opinion as of the date they are expressed and not statements of fact.S&P’s opinions, analyses and rating acknowledgment decisions (described below) are not recommendations to purchase, hold, or sell any securities or to make anyinvestment decisions, and do not address the suitability of any security. S&P assumes no obligation to update the Content following publication in any form or format. TheContent should not be relied on and is not a substitute for the skill, judgment and experience of the user, its management, employees, advisors and/or clients when makinginvestment and other business decisions. S&P does not act as a fiduciary or an investment advisor except where registered as such. While S&P has obtained information fromsources it believes to be reliable, S&P does not perform an audit and undertakes no duty of due diligence or independent verification of any information it receives. Rating-related publications may be published for a variety of reasons that are not necessarily dependent on action by rating committees, including, but not limited to, the publicationof a periodic update on a credit rating and related analyses.
No content (including ratings, credit-related analyses and data, valuations, model, software or other application or output therefrom) or any part thereof (Content) may bemodified, reverse engineered, reproduced or distributed in any form by any means, or stored in a database or retrieval system, without the prior written permission ofStandard & Poor’s Financial Services LLC or its affiliates (collectively, S&P). The Content shall not be used for any unlawful or unauthorized purposes. S&P and any third-partyproviders, as well as their directors, officers, shareholders, employees or agents (collectively S&P Parties) do not guarantee the accuracy, completeness, timeliness oravailability of the Content. S&P Parties are not responsible for any errors or omissions (negligent or otherwise), regardless of the cause, for the results obtained from the useof the Content, or for the security or maintenance of any data input by the user. The Content is provided on an “as is” basis. S&P PARTIES DISCLAIM ANY AND ALL EXPRESSOR IMPLIED WARRANTIES, INCLUDING, BUT NOT LIMITED TO, ANY WARRANTIES OF MERCHANTABILITY OR FITNESS FOR A PARTICULAR PURPOSE OR USE, FREEDOMFROM BUGS, SOFTWARE ERRORS OR DEFECTS, THAT THE CONTENT’S FUNCTIONING WILL BE UNINTERRUPTED OR THAT THE CONTENT WILL OPERATE WITH ANYSOFTWARE OR HARDWARE CONFIGURATION. In no event shall S&P Parties be liable to any party for any direct, indirect, incidental, exemplary, compensatory, punitive,special or consequential damages, costs, expenses, legal fees, or losses (including, without limitation, lost income or lost profits and opportunity costs or losses caused bynegligence) in connection with any use of the Content even if advised of the possibility of such damages.
Copyright © 2020 by Standard & Poor’s Financial Services LLC. All rights reserved.
Docket No. E002/GR-21-630 Exhibit___(PAJ-1), Schedule 8
Page 12 of 12

RATING METHODOLOGY
INFRASTRUCTURE JUNE 23, 2017
Table of Contents:
SUMMARY 1 ABOUT THE RATED UNIVERSE 3 ABOUT THIS RATING METHODOLOGY 4 DISCUSSION OF THE GRID FACTORS 6 APPENDIX A: REGULATED ELECTRIC AND GAS UTILITIES METHODOLOGY FACTOR GRID 29 APPENDIX B: APPROACH TO RATINGS WITHIN A UTILITY FAMILY 35 APPENDIX C: BRIEF DESCRIPTIONS OF THE TYPES OF COMPANIES RATED UNDER THIS METHODOLOGY 38 APPENDIX D: KEY INDUSTRY ISSUES OVER THE INTERMEDIATE TERM 40 APPENDIX E: REGIONAL AND OTHER CONSIDERATIONS 44 APPENDIX F: TREATMENT OF POWER PURCHASE AGREEMENTS (“PPAS”) 46 METHODS FOR ESTIMATING A LIABILITY AMOUNT FOR PPAS 48 MOODY’S RELATED RESEARCH 49
Analyst Contacts:
NEW YORK +1.212.553.1653
Michael G. Haggarty +1.212.553.7172 Associate Managing Director [email protected]
Jim Hempstead +1.212.553.4318 Managing Director – Utilities [email protected]
Walter Winrow +1.212.553.7943 Managing Director - Global Project and Infrastructure Finance [email protected]
Jeffrey Cassella +1.212.553.1665 Vice President - Senior Analyst [email protected]
Natividad Martel +1.212.553.4561 Vice President - Senior Analyst [email protected]
» contacts continued on the last page
Regulated Electric and Gas Utilities
This rating methodology replaces “Regulated Electric and Gas Utilities” last revised on December 23, 2013. We have updated some outdated links and removed certain issuer-specific information.
Summary
This rating methodology explains our approach to assessing credit risk for regulated electric and gas utilities globally. This document does not include an exhaustive treatment of all factors that are reflected in our ratings but should enable the reader to understand the qualitative considerations and financial information and ratios that are usually most important for ratings in this sector.1
This report includes a detailed rating grid which is a reference tool that can be used to approximate credit profiles within the regulated electric and gas utility sector in most cases. The grid provides summarized guidance for the factors that are generally most important in assigning ratings to companies in the regulated electric and gas utility industry. However, the grid is a summary that does not include every rating consideration. The weights shown for each factor in the grid represent an approximation of their importance for rating decisions but actual importance may vary substantially. In addition, the grid in this document uses historical results while ratings are based on our forward-looking expectations. As a result, the grid-indicated rating is not expected to match the actual rating of each company.
1 This update may not be effective in some jurisdictions until certain requirements are met.
THIS METHODOLOGY WAS UPDATED ON AUGUST 2, 2018. WE HAVE MADE MINOR FORMATTING ADJUSTMENTS THROUGHOUT THE METHODOLOGY.
THIS RATING METHODOLOGY WAS UPDATED ON SEPTEMBER 27, 2017. WE REMOVED A DUPLICATE FOOTNOTE THAT WAS PLACED IN THE MIDDLE OF THE TEXT ON PAGE 7.
THIS RATING METHODOLOGY WAS UPDATED ON FEBRUARY 15, 2018. WE HAVE CORRECTED THE FORMATTING OF THE FACTOR 4: FINANCIAL STRENGTH TABLE ON PAGE 34.
Docket No. E002/GR-21-630 Exhibit___(PAJ-1), Schedule 9
Page 1 of 51

2 JUNE 23, 2017
RATING METHODOLOGY: REGULATED ELECTRIC AND GAS UTILITIES
INFRASTRUCTURE
The grid contains four key factors that are important in our assessment for ratings in the regulated electric and gas utility sector:
1. Regulatory Framework
2. Ability to Recover Costs and Earn Returns
3. Diversification
4. Financial Strength
Some of these factors also encompass a number of sub-factors. There is also a notching factor for holding company structural subordination.
This rating methodology is not intended to be an exhaustive discussion of all factors that our analysts consider in assigning ratings in this sector. We note that our analysis for ratings in this sector covers factors that are common across all industries such as ownership, management, liquidity, corporate legal structure, governance and country related risks which are not explained in detail in this document, as well as factors that can be meaningful on a company-specific basis. Our ratings consider these and other qualitative considerations that do not lend themselves to a transparent presentation in a grid format. The grid used for this methodology reflects a decision to favor a relatively simple and transparent presentation rather than a more complex grid that might map grid-indicated ratings more closely to actual ratings.
Highlights of this report include:
» An overview of the rated universe
» A summary of the rating methodology
» A discussion of the key rating factors that drive ratings
» Comments on the rating methodology assumptions and limitations, including a discussion of rating considerations that are not included in the grid
The Appendices show the full grid (Appendix A), our approach to ratings within a utility family (Appendix B), a description of the various types of companies rated under this methodology (Appendix C), key industry issues over the intermediate term (Appendix D), regional and other considerations (Appendix E), and treatment of power purchase agreements (Appendix F).
This methodology describes the analytical framework used in determining credit ratings. In some instances our analysis is also guided by additional publications which describe our approach for analytical considerations that are not specific to any single sector. Examples of such considerations include but are not limited to: the assignment of short-term ratings, the relative ranking of different classes of debt and hybrid securities, how sovereign credit quality affects non-sovereign issuers, and the assessment of credit support from other entities. A link to documents that describe our approach to such cross-sector credit rating methodological considerations can be found in the Related Research section of this report.
This publication does not announce a credit rating action. For any credit ratings referenced in this publication, please see the ratings tab on the issuer/entity page on www.moodys.com for the most updated credit rating action information and rating history.
Docket No. E002/GR-21-630 Exhibit___(PAJ-1), Schedule 9
Page 2 of 51

3 JUNE 23, 2017
RATING METHODOLOGY: REGULATED ELECTRIC AND GAS UTILITIES
INFRASTRUCTURE
About the Rated Universe
The Regulated Electric and Gas Utilities rating methodology applies to rate-regulated2 electric and gas utilities that are not Networks3. Regulated Electric and Gas Utilities are companies whose predominant4 business is the sale of electricity and/or gas or related services under a rate-regulated framework, in most cases to retail customers. Also included under this methodology are rate-regulated utilities that own generating assets as any material part of their business, utilities whose charges or bills to customers include a meaningful component related to the electric or gas commodity, utilities whose rates are regulated at a sub-sovereign level (e.g. by provinces, states or municipalities), and companies providing an independent system operator function to an electric grid. Companies rated under this methodology are primarily rate-regulated monopolies or, in certain circumstances, companies that may not be outright monopolies but where government regulation effectively sets prices and limits competition.
This rating methodology covers regulated electric and gas utilities worldwide. These companies are engaged in the production, transmission, coordination, distribution and/or sale of electricity and/or natural gas, and they are either investor owned companies, commercially oriented government owned companies or, in the case of independent system operators, not-for-profit or similar entities. As detailed in Appendix C, this methodology covers a wide variety of companies active in the sector, including vertically integrated utilities, transmission and distribution utilities with retail customers and/or sub-sovereign regulation, local gas distribution utility companies (LDCs), independent system operators, and regulated generation companies. These companies may be operating companies or holding companies.
An over-arching consideration for regulated utilities is the regulatory environment in which they operate. While regulation is also a key consideration for networks, a utility’s regulatory environment is in comparison often more dynamic and more subject to political intervention. The direct relationship that a regulated utility has with the retail customer, including billing for electric or gas supply that has substantial price volatility, can lead to a more politically charged rate-setting environment. Similarly, regulation at the sub-sovereign level is often more accessible for participation by interveners, including disaffected customers and the politicians who want their votes. Our views of regulatory environments evolve over time in accordance with our observations of regulatory, political, and judicial events that affect issuers in the sector.
This methodology pertains to regulated electric and gas utilities and excludes the following types of issuers, which are covered by separate rating methodologies: Regulated Networks, Unregulated Utilities and Power Companies, Public Power Utilities, Municipal Joint Action Agencies, Electric Cooperatives, Regulated Water Companies and Natural Gas Pipelines.5
The Regulated Electric and Gas Utility sector is predominantly investment grade, reflecting the stability generally conferred by regulation that typically sets prices and also limits competition, such that defaults have been lower than in many other non-financial corporate sectors. However, the nature of regulation can
2 Companies in many industries are regulated. We use the term rate-regulated to distinguish companies whose rates (by which we also mean tariffs or revenues in
general) are set by regulators. 3 Regulated Electric and Gas Networks are companies whose predominant business is purely the transmission and/or distribution of electricity and/or natural gas
without involvement in the procurement or sale of electricity and/or gas; whose charges to customers thus do not include a meaningful commodity cost component; which sell mainly (or in many cases exclusively) to non-retail customers; and which are rate-regulated under a national framework.
4 We generally consider a company to be predominantly a regulated electric and gas utility when a majority of its cash flows, prospectively and on a sustained basis, are derived from regulated electric and gas utility businesses. Since cash flows can be volatile (such that a company might have a majority of utility cash flows simply due to a cyclical downturn in its non-utility businesses), we may also consider the breakdown of assets and/or debt of a company to determine which business is predominant.
5 A link to credit rating methodologies covering these and other sectors can be found in the Related Research section of this report.
Docket No. E002/GR-21-630 Exhibit___(PAJ-1), Schedule 9
Page 3 of 51

4 JUNE 23, 2017
RATING METHODOLOGY: REGULATED ELECTRIC AND GAS UTILITIES
INFRASTRUCTURE
vary significantly from jurisdiction to jurisdiction. Most issuers at the lower end of the ratings spectrum operate in challenging regulatory environments.
About this Rating Methodology
This report explains the rating methodology for regulated electric and gas utilities in six sections, which are summarized as follows:
1. Identification and Discussion of the Rating Factors in the Grid
The grid in this rating methodology focuses on four rating factors. The four factors are comprised of sub-factors that provide further detail:
Factor / Sub-Factor Weighting - Regulated Utilities
Broad Rating Factors Broad Rating Factor
Weighting Rating Sub-Factor Sub-Factor Weighting
Regulatory Framework 25% Legislative and Judicial Underpinnings of the Regulatory Framework Consistency and Predictability of Regulation
12.5%
12.5%
Ability to Recover Costs and Earn Returns
25% Timeliness of Recovery of Operating and Capital Costs Sufficiency of Rates and Returns
12.5% 12.5%
Diversification 10% Market Position 5%*
Generation and Fuel Diversity 5%**
Financial Strength, Key Financial Metrics
40%
CFO pre-WC + Interest / Interest 7.5%
CFO pre-WC / Debt 15.0%
CFO pre-WC – Dividends / Debt 10.0%
Debt/Capitalization 7.5%
Total 100% 100%
Notching Adjustment Holding Company Structural Subordination 0 to -3
*10% weight for issuers that lack generation; **0% weight for issuers that lack generation
2. Measurement or Estimation of Factors in the Grid
We explain our general approach for scoring each grid factor and show the weights used in the grid. We also provide a rationale for why each of these grid components is meaningful as a credit indicator. The information used in assessing the sub-factors is generally found in or calculated from information in company financial statements, derived from other observations or estimated by our analysts.6 All of the quantitative credit metrics incorporate Moody’s standard adjustments to income statement, cash flow statement and balance sheet amounts for restructuring, impairment, off-balance sheet accounts, receivable securitization programs, under-funded pension obligations, and recurring operating leases.7
6 For definitions of our most common ratio terms, please see “Moody’s Basic Definitions for Credit Statistics, User’s Guide,” a link to which may be found in the
Related Research section of this report. 7 Our standard adjustments are described in “Financial Statement Adjustments in the Analysis of Non-Financial Corporations”. A link to this and other sector and
cross-sector credit rating methodologies can be found in the Related Research section of this report.
Docket No. E002/GR-21-630 Exhibit___(PAJ-1), Schedule 9
Page 4 of 51

5 JUNE 23, 2017
RATING METHODOLOGY: REGULATED ELECTRIC AND GAS UTILITIES
INFRASTRUCTURE
Our ratings are forward-looking and reflect our expectations for future financial and operating performance. However, historical results are helpful in understanding patterns and trends of a company’s performance as well as for peer comparisons. We utilize historical data (in most cases, an average of the last three years of reported results) in the rating grid. However, the factors in the grid can be assessed using various time periods. For example, rating committees may find it analytically useful to examine both historic and expected future performance for periods of several years or more, or for individual twelve month periods.
3. Mapping Factors to the Rating Categories
After estimating or calculating each sub-factor, the outcomes for each of the sub-factors are mapped to a broad Moody’s rating category (Aaa, Aa, A, Baa, Ba, B, or Caa).
4. Assumptions, Limitations and Rating Considerations Not Included in the Grid
This section discusses limitations in the use of the grid to map against actual ratings, some of the additional factors that are not included in the grid but can be important in determining ratings, and limitations and assumptions that pertain to the overall rating methodology.
5. Determining the Overall Grid-Indicated Rating8
To determine the overall grid-indicated rating, we convert each of the sub-factor ratings into a numeric value based upon the scale below.
Aaa Aa A Baa Ba B Caa Ca
1 3 6 9 12 15 18 20
The numerical score for each sub-factor is multiplied by the weight for that sub-factor with the results then summed to produce a composite weighted-factor score. The composite weighted factor score is then mapped back to an alphanumeric rating based on the ranges in the table below.
Grid-Indicated Rating
Grid-Indicated Rating Aggregate Weighted Total Factor Score
Aaa x < 1.5
Aa1 1.5 ≤ x < 2.5
Aa2 2.5 ≤ x < 3.5
Aa3 3.5 ≤ x < 4.5
A1 4.5 ≤ x < 5.5
A2 5.5 ≤ x < 6.5
A3 6.5 ≤ x < 7.5
Baa1 7.5 ≤ x < 8.5
Baa2 8.5 ≤ x < 9.5
Baa3 9.5 ≤ x < 10.5
8 In general, the grid-indicated rating is oriented to the Corporate Family Rating (CFR) for speculative-grade issuers and the senior unsecured rating for investment-
grade issuers. For issuers that benefit from ratings uplift due to parental support, government ownership or other institutional support, the grid-indicated rating is oriented to the baseline credit assessment. For an explanation of baseline credit assessment, please refer to our rating methodology on government-related issuers. Individual debt instrument ratings also factor in decisions on notching for seniority level and collateral. The documents that provide broad guidance for these notching decisions are our rating methodologies on loss given default for speculative grade non-financial companies and for aligning corporate instrument ratings based on differences in security and priority of claim. The link to these and other sector and cross-sector credit rating methodologies can be found in the Related Research section of this report.
Docket No. E002/GR-21-630 Exhibit___(PAJ-1), Schedule 9
Page 5 of 51

6 JUNE 23, 2017
RATING METHODOLOGY: REGULATED ELECTRIC AND GAS UTILITIES
INFRASTRUCTURE
Grid-Indicated Rating
Grid-Indicated Rating Aggregate Weighted Total Factor Score
Ba1 10.5 ≤ x < 11.5
Ba2 11.5 ≤ x < 12.5
Ba3 12.5 ≤ x < 13.5
B1 13.5 ≤ x < 14.5
B2 14.5 ≤ x < 15.5
B3 15.5 ≤ x < 16.5
Caa1 16.5 ≤ x < 17.5
Caa2 17.5 ≤ x < 18.5
Caa3 18.5 ≤ x < 19.5
Ca x ≥ 19.5
For example, an issuer with a composite weighted factor score of 11.7 would have a Ba2 grid-indicated rating.
6. Appendices
The Appendices present a full grid and provide additional commentary and insights on our view of credit risks in this industry.
Discussion of the Grid Factors
Our analysis of electric and gas utilities focuses on four broad factors:
» Regulatory Framework
» Ability to Recover Costs and Earn Returns
» Diversification
» Financial Strength
There is also a notching factor for holding company structural subordination.
Factor 1: Regulatory Framework (25%)
Why It Matters
For rate-regulated utilities, which typically operate as a monopoly, the regulatory environment and how the utility adapts to that environment are the most important credit considerations. The regulatory environment is comprised of two rating factors - the Regulatory Framework and its corollary factor, the Ability to Recover Costs and Earn Returns. Broadly speaking, the Regulatory Framework is the foundation for how all the decisions that affect utilities are made (including the setting of rates), as well as the predictability and consistency of decision-making provided by that foundation. The Ability to Recover Costs and Earn Returns relates more directly to the actual decisions, including their timeliness and the rate-setting outcomes.
Docket No. E002/GR-21-630 Exhibit___(PAJ-1), Schedule 9
Page 6 of 51
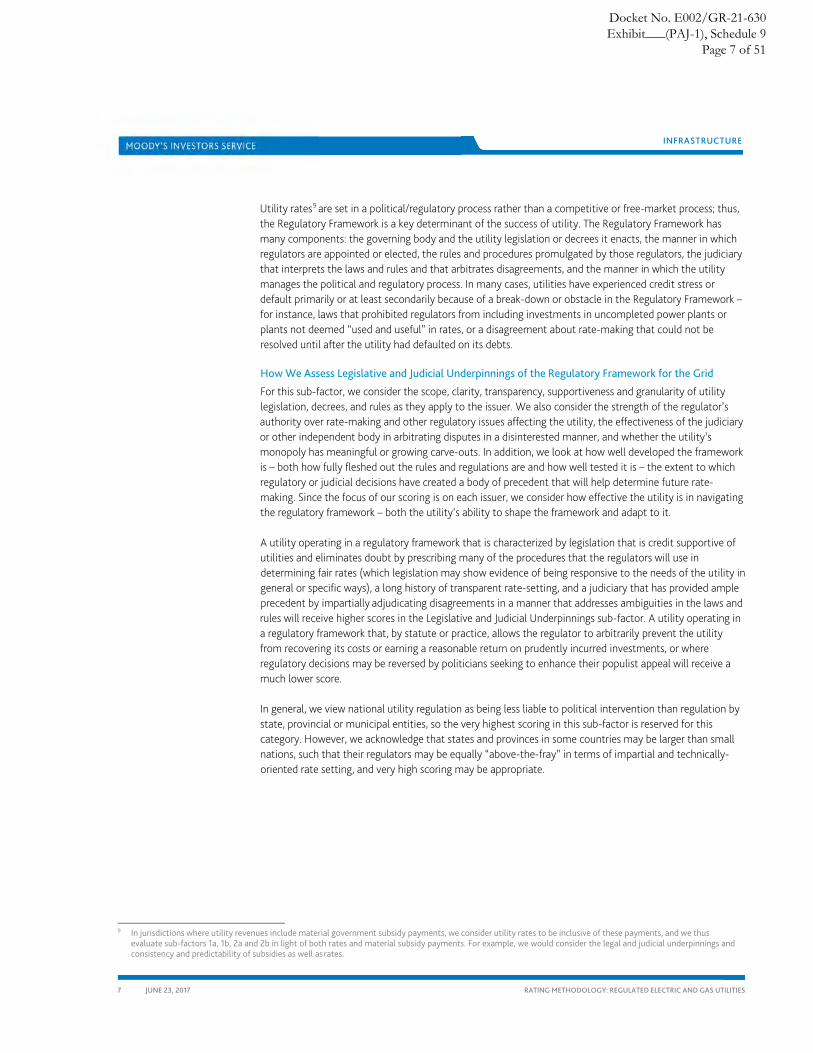
7 JUNE 23, 2017
RATING METHODOLOGY: REGULATED ELECTRIC AND GAS UTILITIES
INFRASTRUCTURE
Utility rates9 are set in a political/regulatory process rather than a competitive or free-market process; thus, the Regulatory Framework is a key determinant of the success of utility. The Regulatory Framework has many components: the governing body and the utility legislation or decrees it enacts, the manner in which regulators are appointed or elected, the rules and procedures promulgated by those regulators, the judiciary that interprets the laws and rules and that arbitrates disagreements, and the manner in which the utility manages the political and regulatory process. In many cases, utilities have experienced credit stress or default primarily or at least secondarily because of a break-down or obstacle in the Regulatory Framework – for instance, laws that prohibited regulators from including investments in uncompleted power plants or plants not deemed “used and useful” in rates, or a disagreement about rate-making that could not be resolved until after the utility had defaulted on its debts.
How We Assess Legislative and Judicial Underpinnings of the Regulatory Framework for the Grid
For this sub-factor, we consider the scope, clarity, transparency, supportiveness and granularity of utility legislation, decrees, and rules as they apply to the issuer. We also consider the strength of the regulator’s authority over rate-making and other regulatory issues affecting the utility, the effectiveness of the judiciary or other independent body in arbitrating disputes in a disinterested manner, and whether the utility’s monopoly has meaningful or growing carve-outs. In addition, we look at how well developed the framework is – both how fully fleshed out the rules and regulations are and how well tested it is – the extent to which regulatory or judicial decisions have created a body of precedent that will help determine future rate-making. Since the focus of our scoring is on each issuer, we consider how effective the utility is in navigating the regulatory framework – both the utility’s ability to shape the framework and adapt to it.
A utility operating in a regulatory framework that is characterized by legislation that is credit supportive of utilities and eliminates doubt by prescribing many of the procedures that the regulators will use in determining fair rates (which legislation may show evidence of being responsive to the needs of the utility in general or specific ways), a long history of transparent rate-setting, and a judiciary that has provided ample precedent by impartially adjudicating disagreements in a manner that addresses ambiguities in the laws and rules will receive higher scores in the Legislative and Judicial Underpinnings sub-factor. A utility operating in a regulatory framework that, by statute or practice, allows the regulator to arbitrarily prevent the utility from recovering its costs or earning a reasonable return on prudently incurred investments, or where regulatory decisions may be reversed by politicians seeking to enhance their populist appeal will receive a much lower score.
In general, we view national utility regulation as being less liable to political intervention than regulation by state, provincial or municipal entities, so the very highest scoring in this sub-factor is reserved for this category. However, we acknowledge that states and provinces in some countries may be larger than small nations, such that their regulators may be equally “above-the-fray” in terms of impartial and technically-oriented rate setting, and very high scoring may be appropriate.
9 In jurisdictions where utility revenues include material government subsidy payments, we consider utility rates to be inclusive of these payments, and we thus
evaluate sub-factors 1a, 1b, 2a and 2b in light of both rates and material subsidy payments. For example, we would consider the legal and judicial underpinnings and consistency and predictability of subsidies as well as rates.
Docket No. E002/GR-21-630 Exhibit___(PAJ-1), Schedule 9
Page 7 of 51

8 JUNE 23, 2017
RATING METHODOLOGY: REGULATED ELECTRIC AND GAS UTILITIES
INFRASTRUCTURE
The relevant judicial system can be a major factor in the regulatory framework. This is particularly true in litigious societies like the United States, where disagreements between the utility and its state or municipal regulator may eventually be adjudicated in federal district courts or even by the US Supreme Court. In addition, bankruptcy proceedings in the US take place in federal courts, which have at times been able to impose rate settlement agreements on state or municipal regulators. As a result, the range of decisions available to state regulators may be effectively circumscribed by court precedent at the state or federal level, which we generally view as favorable for the credit- supportiveness of the regulatory framework.
Electric and gas utilities are generally presumed to have a strong monopoly that will continue into the foreseeable future, and this expectation has allowed these companies to have greater leverage than companies in other sectors with similar ratings. Thus, the existence of a monopoly in itself is unlikely to be a driver of strong scoring in this sub-factor. On the other hand, a strong challenge to the monopoly could cause lower scoring, because the utility can only recover its costs and investments and service its debt if customers purchase its services. There have some instances of incursions into utilities’ monopoly, including municipalization, self-generation, distributed generation with net metering, or unauthorized use (beyond the level for which the utility receives compensation in rates). Incursions that are growing significantly or having a meaningful impact on rates for customers that remain with the utility could have a negative impact on scoring of this sub-factor and on factor 2 - Ability to Recover Costs and Earn Returns.
The scoring of this sub-factor may not be the same for every utility in a particular jurisdiction. We have observed that some utilities appear to have greater sway over the relevant utility legislation and promulgation of rules than other utilities – even those in the same jurisdiction. The content and tone of publicly filed documents and regulatory decisions sometimes indicates that the management team at one utility has better responsiveness to and credibility with its regulators or legislators than the management at another utility.
While the underpinnings to the regulatory framework tend to change relatively slowly, they do evolve, and our factor scoring will seek to reflect that evolution. For instance, a new framework will typically become tested over time as regulatory decisions are issued, or perhaps litigated, thereby setting a body of precedent. Utilities may seek changes to laws in order to permit them to securitize certain costs or collect interim rates, or a jurisdiction in which rates were previously recovered primarily in base rate proceedings may institute riders and trackers. These changes would likely impact scoring of sub-factor 2b - Timeliness of Recovery of Operating and Capital Costs, but they may also be sufficiently significant to indicate a change in the regulatory underpinnings. On the negative side, a judiciary that had formerly been independent may start to issue decisions that indicate it is conforming its decisions to the expectations of an executive branch that wants to mandate lower rates.
Docket No. E002/GR-21-630 Exhibit___(PAJ-1), Schedule 9
Page 8 of 51

9 JUNE 23, 2017
RATING METHODOLOGY: REGULATED ELECTRIC AND GAS UTILITIES
INFRASTRUCTURE
Factor 1a: Legislative and Judicial Underpinnings of the Regulatory Framework (12.5%)
Aaa Aa A Baa
Utility regulation occurs under a fully developed framework that is national in scope based on
legislation that provides the utility a nearly absolute monopoly (see note 1) within its service territory, an
unquestioned assurance that rates will be set in a manner that will permit the utility to make and
recover all necessary investments, an extremely high degree of clarity as to the manner in which utilities
will be regulated and prescriptive methods and procedures for setting rates. Existing utility law is
comprehensive and supportive such that changes in legislation are not expected to be necessary; or any
changes that have occurred have been strongly supportive of utilities credit quality in general and
sufficiently forward-looking so as to address problems before they occurred. There is an
independent judiciary that can arbitrate disagreements between the regulator and the utility
should they occur, including access to national courts, very strong judicial precedent in the
interpretation of utility laws, and a strong rule of law. We expect these conditions to continue.
Utility regulation occurs under a fully developed national, state or provincial framework based on legislation that
provides the utility an extremely strong monopoly (see note
1) within its service territory, a strong assurance, subject to limited review, that rates will be set in a manner that will
permit the utility to make and recover all necessary investments, a very high degree of clarity as to the manner
in which utilities will be regulated and reasonably prescriptive methods and procedures for setting rates. If there have been changes in utility legislation, they have
been timely and clearly credit supportive of the issuer in a manner that shows the utility has had a strong voice in the
process. There is an independent judiciary that can arbitrate disagreements between the regulator and the utility, should
they occur including access to national courts, strong judicial precedent in the interpretation of utility laws, and a strong rule of law. We expect these conditions to continue.
Utility regulation occurs under a well developed national, state or provincial framework based on legislation that provides the utility a very strong
monopoly (see note 1) within its service territory, an assurance, subject to reasonable prudency
requirements, that rates will be set in a manner that will permit the utility to make and recover
all necessary investments, a high degree of clarity as to the manner in which utilities will be
regulated, and overall guidance for methods and procedures for setting rates. If there have been
changes in utility legislation, they have been mostly timely and on the whole credit supportive for the issuer, and the utility has had a clear voice in the legislative process. There is an independent
judiciary that can arbitrate disagreements between the regulator and the utility, should
they occur, including access to national courts, clear judicial precedent in the interpretation of utility law, and a strong rule of law. We expect
these conditions to continue.
Utility regulation occurs (i) under a national, state, provincial or municipal framework based on legislation that provides the
utility a strong monopoly within its service territory that may have some exceptions such as greater self-generation (see note 1), a general assurance that, subject to prudency requirements
that are mostly reasonable, rates will be set will be set in a manner that will permit the utility to make and recover all
necessary investments, reasonable clarity as to the manner in which utilities will be regulated and overall guidance for
methods and procedures for setting rates; or (ii) under a new framework where independent and transparent regulation exists in other sectors. If there have been changes in utility
legislation, they have been credit supportive or at least balanced for the issuer but potentially less timely, and the
utility had a voice in the legislative process. There is either (i) an independent judiciary that can arbitrate disagreements
between the regulator and the utility, including access to courts at least at the state or provincial level, reasonably clear judicial precedent in the interpretation of utility laws, and a generally strong rule of law; or (ii) regulation has been applied (under a
well developed framework) in a manner such that redress to an independent arbiter has not been required. We expect these
conditions to continue.
Ba B Caa
Utility regulation occurs (i) under a national, state, provincial or municipal framework based on
legislation or government decree that provides the utility a monopoly within its service territory that is
generally strong but may have a greater level of exceptions (see note 1), and that, subject to prudency
requirements which may be stringent, provides a general assurance (with somewhat less certainty)
that rates will be set will be set in a manner that will permit the utility to make and recover necessary investments; or (ii) under a new framework where
the jurisdiction has a history of less independent and transparent regulation in other sectors. Either: (i) the judiciary that can arbitrate disagreements between
the regulator and the utility may not have clear authority or may not be fully independent of the regulator or other political pressure, but there is a
reasonably strong rule of law; or (ii) where there is no independent arbiter, the regulation has mostly been
applied in a manner such redress has not been required. We expect these conditions to continue.
Utility regulation occurs (i) under a national, state, provincial or municipal framework based on legislation or
government decree that provides the utility monopoly within its service territory that is reasonably strong but may
have important exceptions, and that, subject to prudency requirements which may be stringent or at times arbitrary, provides more limited or less certain assurance that rates will be set in a manner that will permit the utility to make
and recover necessary investments; or (ii) under a new framework where we would expect less independent and
transparent regulation, based either on the regulator's history in other sectors or other factors. The judiciary that can arbitrate disagreements between the regulator and the
utility may not have clear authority or may not be fully independent of the regulator or other political pressure, but there is a reasonably strong rule of law. Alternately, where
there is no independent arbiter, the regulation has been applied in a manner that often requires some redress adding more uncertainty to the regulatory framework. There may
be a periodic risk of creditor-unfriendly government intervention in utility markets or rate-setting.
Utility regulation occurs (i) under a national, state, provincial or municipal framework based
on legislation or government decree that provides the utility a monopoly within its service territory, but with little assurance that rates will be set in a manner that will permit the utility to make and recover necessary investments; or (ii) under a new framework where we would expect unpredictable or adverse regulation, based either on the jurisdiction's history of in other sectors or
other factors. The judiciary that can arbitrate disagreements between the regulator and the
utility may not have clear authority or is viewed as not being fully independent of the regulator or
other political pressure. Alternately, there may be no redress to an effective independent arbiter. The ability of the utility to enforce its monopoly or prevent uncompensated usage of its system may be limited. There may be a risk of creditor-
unfriendly nationalization or other significant intervention in utility markets or rate-setting.
Note 1: The strength of the monopoly refers to the legal, regulatory and practical obstacles for customers in the utility’s territory to obtain service from another provider. Examples of a weakening of the monopoly would include the ability of a city or large user to leave the utility system to set up their own system, the extent to which self-generation is permitted (e.g. cogeneration) and/or encouraged (e.g., net metering, DSM generation). At the lower end of the ratings spectrum, the utility’s monopoly may be challenged by pervasive theft and unauthorized use. Since utilities are generally presumed to be monopolies, a strong monopoly position in itself is not sufficient for a strong score in this sub-factor, but a weakening of the monopoly can lower the score.
Docket No. E002/GR-21-630 Exhibit___(PAJ-1), Schedule 9
Page 9 of 51

10 JUNE 23, 2017
RATING METHODOLOGY: REGULATED ELECTRIC AND GAS UTILITIES
INFRASTRUCTURE
How We Assess Consistency and Predictability of Regulation for the Grid
For the Consistency and Predictability sub-factor, we consider the track record of regulatory decisions in terms of consistency, predictability and supportiveness. We evaluate the utility’s interactions in the regulatory process as well as the overall stance of the regulator toward the utility.
In most jurisdictions, the laws and rules seek to make rate-setting a primarily technical process that examines costs the utility incurs and the returns on investments the utility needs to earn so it can make investments that are required to build and maintain the utility infrastructure - power plants, electric transmission and distribution systems, and/or natural gas distribution systems. When the process remains technical and transparent such that regulators can support the financial health of the utility while balancing their public duty to assure that reliable service is provided at a reasonable cost, and when the utility is able to align itself with the policy initiatives of the governing jurisdiction, the utility will receive higher scores in this sub-factor. When the process includes substantial political intervention, which could take the form of legislators or other government officials publically second- guessing regulators, dismissing regulators who have approved unpopular rate increases, or preventing the implementation of rate increases, or when regulators ignore the laws/rules to deliver an outcome that appears more politically motivated, the utility will receive lower scores in this sub-factor.
As with the prior sub-factor, we may score different utilities in the same jurisdiction differently, based on outcomes that are more or less supportive of credit quality over a period of time. We have observed that some utilities are better able to meet the expectations of their customers and regulators, whether through better service, greater reliability, more stable rates or simply more effective regulatory outreach and communication. These utilities typically receive more consistent and credit supportive outcomes, so they will score higher in this sub-factor. Conversely, if a utility has multiple rapid rate increases, chooses to submit major rate increase requests during a sensitive election cycle or a severe economic downturn, has chronic customer service issues, is viewed as frequently providing incomplete information to regulators, or is tone deaf to the priorities of regulators and politicians, it may receive less consistent and supportive outcomes and thus score lower in this sub-factor.
In scoring this sub-factor, we will primarily evaluate the actions of regulators, politicians and jurists rather than their words. Nonetheless, words matter when they are an indication of future action. We seek to differentiate between political rhetoric that is perhaps oriented toward gaining attention for the viewpoint of the speaker and rhetoric that is indicative of future actions and trends in decision- making.
Docket No. E002/GR-21-630 Exhibit___(PAJ-1), Schedule 9
Page 10 of 51

11 JUNE 23, 2017
RATING METHODOLOGY: REGULATED ELECTRIC AND GAS UTILITIES
INFRASTRUCTURE
Factor 1b: Consistency and Predictability of Regulation (12.5%)
Aaa Aa A Baa
The issuer's interaction with the regulator has led to a strong, lengthy track record of predictable,
consistent and favorable decisions. The regulator is highly credit supportive of the issuer and
utilities in general. We expect these conditions to continue.
The issuer's interaction with the regulator has a led to a considerable track record of
predominantly predictable and consistent decisions. The regulator is mostly credit
supportive of utilities in general and in almost all instances has been highly credit supportive of the issuer. We expect these conditions to continue.
The issuer's interaction with the regulator has led to a track record of largely predictable and consistent decisions. The regulator may be
somewhat less credit supportive of utilities in general, but has been quite credit supportive of
the issuer in most circumstances. We expect these conditions to continue.
The issuer's interaction with the regulator has led to an adequate track record. The regulator is
generally consistent and predictable, but there may some evidence of inconsistency or
unpredictability from time to time, or decisions may at times be politically charged. However, instances of less credit supportive decisions are
based on reasonable application of existing rules and statutes and are not overly punitive. We
expect these conditions to continue.
Ba B Caa
We expect that regulatory decisions will demonstrate considerable inconsistency or
unpredictability or that decisions will be politically charged, based either on the issuer's track record of interaction with regulators or
other governing bodies, or our view that decisions will move in this direction. The regulator may
have a history of less credit supportive regulatory decisions with respect to the issuer, but we expect that the issuer will be able to obtain
support when it encounters financial stress, with some potentially material delays. The regulator’s authority may be eroded at times by legislative or political action. The regulator may not follow the
framework for some material decisions.
We expect that regulatory decisions will be largely unpredictable or even somewhat arbitrary,
based either on the issuer's track record of interaction with regulators or other governing bodies, or our view that decisions will move in
this direction. However, we expect that the issuer will ultimately be able to obtain support when it
encounters financial stress, albeit with material or more extended delays. Alternately, the regulator is untested, lacks a consistent track record, or is undergoing substantial change. The regulator’s
authority may be eroded on frequent occasions by legislative or political action. The regulator may
more frequently ignore the framework in a manner detrimental to the issuer.
We expect that regulatory decisions will be highly unpredictable and frequently adverse, based
either on the issuer's track record of interaction with regulators or other governing bodies, or our
view that decisions will move in this direction. Alternately, decisions may have credit supportive
aspects, but may often be unenforceable. The regulator’s authority may have been seriously eroded by legislative or political action. The
regulator may consistently ignore the framework to the detriment of the issuer.
Docket No. E002/GR-21-630 Exhibit___(PAJ-1), Schedule 9
Page 11 of 51

12 JUNE 23, 2017
RATING METHODOLOGY: REGULATED ELECTRIC AND GAS UTILITIES
INFRASTRUCTURE
Factor 2: Ability to Recover Costs and Earn Returns (25%)
Why It Matters
This rating factor examines the ability of a utility to recover its costs and earn a return over a period of time, including during differing market and economic conditions. While the Regulatory Framework looks at the transparency and predictability of the rules that govern the decision-making process with respect to utilities, the Ability to Recover Costs and Earn Returns evaluates the regulatory elements that directly impact the ability of the utility to generate cash flow and service its debt over time. The ability to recover prudently incurred costs on a timely basis and to attract debt and equity capital are crucial credit considerations. The inability to recover costs, for instance if fuel or purchased power costs ballooned during a rate freeze period, has been one of the greatest drivers of financial stress in this sector, as well as the cause of some utility defaults. In a sector that is typically free cash flow negative (due to large capital expenditures and dividends) and that routinely needs to refinance very large maturities of long-term debt, investor concerns about a lack of timely cost recovery or the sufficiency of rates can, in an extreme scenario, strain access to capital markets and potentially lead to insolvency of the utility (as was the case when “used and useful” requirements threatened some utilities that experienced years of delay in completing nuclear power plants in the 1980s). While our scoring for the Ability to Recover Costs and Earn Returns may primarily be influenced by our assessment of the regulatory relationship, it can also be highly impacted by the management and business decisions of the utility.
How We Assess Ability to Recover Costs and Earn Returns
The timeliness and sufficiency of rates are scored as separate sub-factors; however, they are interrelated. Timeliness can have an impact on our view of what constitutes sufficient returns, because a strong assurance of timely cost recovery reduces risk. Conversely, utilities may have a strong assurance that they will earn a full return on certain deferred costs until they are able to collect them, or their generally strong returns may allow them to weather some rate lag on recovery of construction-related capital expenditures. The timeliness of cost recovery is particularly important in a period of rapidly rising costs. During the past five years, utilities have benefitted from low interest rates and generally decreasing fuel costs and purchased power costs, but these market conditions could easily reverse. For example, fuel is a large component of total costs for vertically integrated utilities and for natural gas utilities, and fuel prices are highly volatile, so the timeliness of fuel and purchased power cost recovery is especially important.
While Factors 1 and 2 are closely inter-related, scoring of these factors will not necessarily be the same. We have observed jurisdictions where the Regulatory Framework caused considerable credit concerns – perhaps it was untested or going through a transition to de-regulation, but where the track record of rate case outcomes was quite positive, leading to a higher score in the Ability to Recover Costs and Earn Returns. Conversely, there have been instances of strong Legislative and Judicial Underpinnings of the Regulatory Framework where the commission has ignored the framework (which would affect Consistency and Predictability of Regulation as well as Ability to Recover Costs and Earn Returns) or has used extraordinary measures to prevent or defer an increase that might have been justifiable from a cost perspective but would have caused rate shock.
One might surmise that Factors 2 and 4 should be strongly correlated, since a good Ability to Recover Costs and Earn Returns would normally lead to good financial metrics. However, the scoring for the Ability to Recover Costs and Earn Returns sub-factor places more emphasis on our expectation of timeliness and sufficiency of rates over time; whereas financial metrics may be impacted by one-time events, market conditions or construction cycles - trends that we believe could normalize or even reverse.
Docket No. E002/GR-21-630 Exhibit___(PAJ-1), Schedule 9
Page 12 of 51

13 JUNE 23, 2017
RATING METHODOLOGY: REGULATED ELECTRIC AND GAS UTILITIES
INFRASTRUCTURE
How We Assess Timeliness of Recovery of Operating and Capital Costs for the Grid
The criteria we consider include provisions and cost recovery mechanisms for operating costs, mechanisms that allow actual operating and/or capital expenditures to be trued-up periodically into rates without having to file a rate case (this may include formula rates, rider and trackers, or the ability to periodically adjust rates for construction work in progress) as well as the process and timeframe of general tariff/base rate cases – those that are fully reviewed by the regulator, generally in a public format that includes testimony of the utility and other stakeholders and interest groups. We also look at the track record of the utility and regulator for timeliness. For instance, having a formula rate plan is positive, but if the actual process has included reviews that are delayed for long periods, it may dampen the benefit to the utility. In addition, we seek to estimate the lag between the time that a utility incurs a major construction expenditures and the time that the utility will start to recover and/or earn a return on that expenditure.
How We Assess Sufficiency of Rates and Returns for the Grid
The criteria we consider include statutory protections that assure full cost recovery and a reasonable return for the utility on its investments, the regulatory mechanisms used to determine what a reasonable return should be, and the track record of the utility in actually recovering costs and earning returns. We examine outcomes of rate cases/tariff reviews and compare them to the request submitted by the utility, to prior rate cases/tariff reviews for the same utility and to recent rate/tariff decisions for a peer group of comparable utilities. In this context, comparable utilities are typically utilities in the same or similar jurisdiction. In cases where the utility is unique or nearly unique in its jurisdiction, comparison will be made to other peers with an adjustment for local differences, including prevailing rates of interest and returns on capital, as well as the timeliness of rate-setting. We look at regulatory disallowances of costs or investments, with a focus on their financial severity and also on the reasons given by the regulator, in order to assess the likelihood that such disallowances will be repeated in the future.
Docket No. E002/GR-21-630 Exhibit___(PAJ-1), Schedule 9
Page 13 of 51
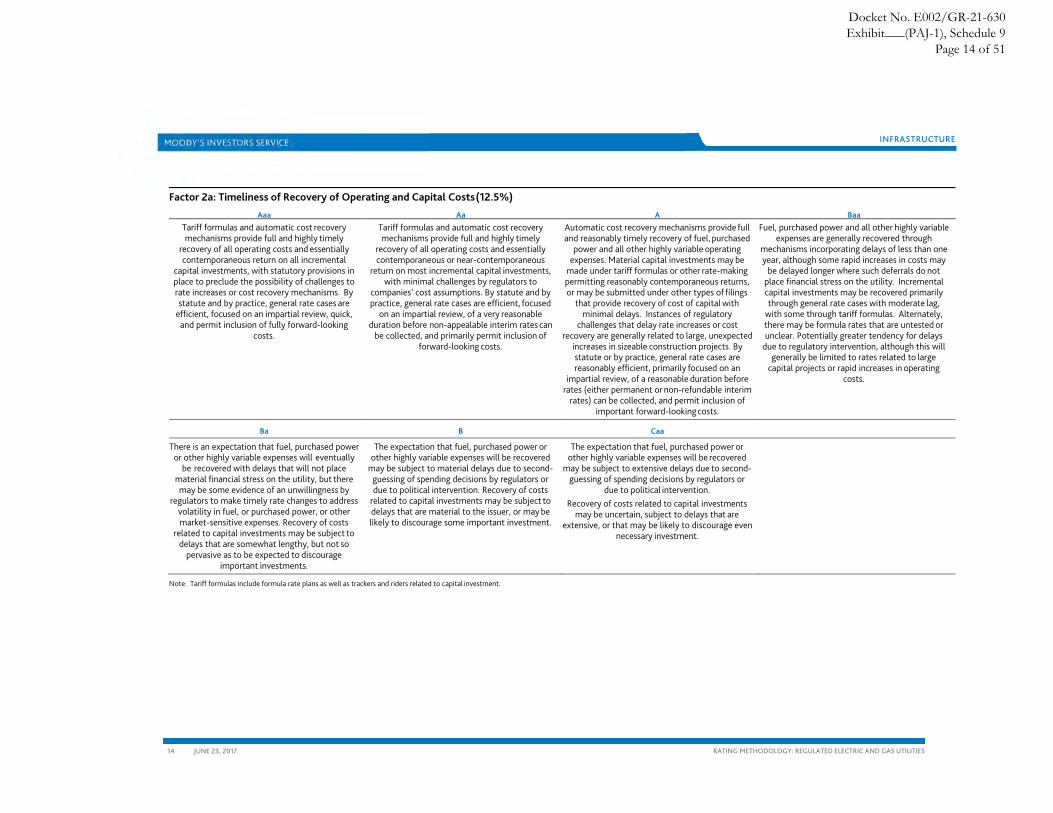
14 JUNE 23, 2017
RATING METHODOLOGY: REGULATED ELECTRIC AND GAS UTILITIES
INFRASTRUCTURE
Factor 2a: Timeliness of Recovery of Operating and Capital Costs (12.5%)
Aaa Aa A Baa
Tariff formulas and automatic cost recovery mechanisms provide full and highly timely
recovery of all operating costs and essentially contemporaneous return on all incremental
capital investments, with statutory provisions in place to preclude the possibility of challenges to rate increases or cost recovery mechanisms. By statute and by practice, general rate cases are
efficient, focused on an impartial review, quick, and permit inclusion of fully forward-looking
costs.
Tariff formulas and automatic cost recovery mechanisms provide full and highly timely
recovery of all operating costs and essentially contemporaneous or near-contemporaneous
return on most incremental capital investments, with minimal challenges by regulators to
companies’ cost assumptions. By statute and by practice, general rate cases are efficient, focused
on an impartial review, of a very reasonable duration before non-appealable interim rates can
be collected, and primarily permit inclusion of forward-looking costs.
Automatic cost recovery mechanisms provide full and reasonably timely recovery of fuel, purchased
power and all other highly variable operating expenses. Material capital investments may be
made under tariff formulas or other rate-making permitting reasonably contemporaneous returns, or may be submitted under other types of filings
that provide recovery of cost of capital with minimal delays. Instances of regulatory
challenges that delay rate increases or cost recovery are generally related to large, unexpected
increases in sizeable construction projects. By statute or by practice, general rate cases are reasonably efficient, primarily focused on an
impartial review, of a reasonable duration before rates (either permanent or non-refundable interim
rates) can be collected, and permit inclusion of important forward-looking costs.
Fuel, purchased power and all other highly variable expenses are generally recovered through
mechanisms incorporating delays of less than one year, although some rapid increases in costs may
be delayed longer where such deferrals do not place financial stress on the utility. Incremental capital investments may be recovered primarily through general rate cases with moderate lag,
with some through tariff formulas. Alternately, there may be formula rates that are untested or unclear. Potentially greater tendency for delays
due to regulatory intervention, although this will generally be limited to rates related to large
capital projects or rapid increases in operating costs.
Ba B Caa
There is an expectation that fuel, purchased power or other highly variable expenses will eventually
be recovered with delays that will not place material financial stress on the utility, but there may be some evidence of an unwillingness by
regulators to make timely rate changes to address volatility in fuel, or purchased power, or other market-sensitive expenses. Recovery of costs
related to capital investments may be subject to delays that are somewhat lengthy, but not so
pervasive as to be expected to discourage important investments.
The expectation that fuel, purchased power or other highly variable expenses will be recovered
may be subject to material delays due to second- guessing of spending decisions by regulators or due to political intervention. Recovery of costs
related to capital investments may be subject to delays that are material to the issuer, or may be likely to discourage some important investment.
The expectation that fuel, purchased power or other highly variable expenses will be recovered
may be subject to extensive delays due to second-guessing of spending decisions by regulators or
due to political intervention. Recovery of costs related to capital investments
may be uncertain, subject to delays that are extensive, or that may be likely to discourage even
necessary investment.
Note: Tariff formulas include formula rate plans as well as trackers and riders related to capital investment.
Docket No. E002/GR-21-630 Exhibit___(PAJ-1), Schedule 9
Page 14 of 51

15 JUNE 23, 2017
RATING METHODOLOGY: REGULATED ELECTRIC AND GAS UTILITIES
INFRASTRUCTURE
Factor 2b: Sufficiency of Rates and Returns (12.5%)
Aaa Aa A Baa
Sufficiency of rates to cover costs and attract capital is (and will continue to be) unquestioned.
Rates are (and we expect will continue to be) set at a level that permits full cost recovery and a fair return on all investments, with minimal challenges
by regulators to companies’ cost assumptions. This will translate to returns (measured in relation
to equity, total assets, rate base or regulatory asset value, as applicable) that are strong relative
to global peers.
Rates are (and we expect will continue to be) set at a level that generally provides full cost recovery
and a fair return on investments, with limited instances of regulatory challenges and
disallowances. In general, this will translate to returns (measured in relation to equity, total assets, rate base or regulatory asset value, as applicable) that are generally above average relative to global peers, but may at times be
average.
Rates are (and we expect will continue to be) set at a level that generally provides full operating
cost recovery and a mostly fair return on investments, but there may be somewhat more
instances of regulatory challenges and disallowances, although ultimate rate outcomes are sufficient to attract capital without difficulty. In general, this will translate to returns (measured
in relation to equity, total assets, rate base or regulatory asset value, as applicable) that are
average relative to global peers, but may at times be somewhat below average.
Ba B Caa
Rates are (and we expect will continue to be) set at a level that generally provides recovery of most operating costs but return on investments may be less predictable, and there may be decidedly more
instances of regulatory challenges and disallowances, but ultimate rate outcomes are
generally sufficient to attract capital. In general, this will translate to returns (measured in relation
to equity, total assets, rate base or regulatory asset value, as applicable) that are generally
below average relative to global peers, or where allowed returns are average but difficult to earn. Alternately, the tariff formula may not take into
account all cost components and/or remuneration of investments may be unclear or
at times unfavorable.
We expect rates will be set at a level that at times fails to provide recovery of costs other than cash costs, and regulators may engage in somewhat
arbitrary second-guessing of spending decisions or deny rate increases related to funding ongoing
operations based much more on politics than on prudency reviews. Return on investments may be
set at levels that discourage investment. We expect that rate outcomes may be difficult or
uncertain, negatively affecting continued access to capital. Alternately, the tariff formula may fail to
take into account significant cost components other than cash costs, and/or remuneration of
investments may be generally unfavorable.
We expect rates will be set at a level that often fails to provide recovery of material costs, and
recovery of cash costs may also be at risk. Regulators may engage in more arbitrary second-
guessing of spending decisions or deny rate increases related to funding ongoing operations
based primarily on politics. Return on investments may be set at levels that discourage necessary maintenance investment. We expect that rate
outcomes may often be punitive or highly uncertain, with a markedly negative impact on
access to capital. Alternately, the tariff formula may fail to take into account significant cash cost components, and/or remuneration of investments
may be primarily unfavorable.
Docket No. E002/GR-21-630 Exhibit___(PAJ-1), Schedule 9
Page 15 of 51

16 JUNE 23, 2017
RATING METHODOLOGY: REGULATED ELECTRIC AND GAS UTILITIES
INFRASTRUCTURE
Factor 3: Diversification (10%)
Why It Matters
Diversification of overall business operations helps to mitigate the risk that economic cycles, material changes in a single regulatory regime or commodity price movements will have a severe impact on cash flow and credit quality of a utility. While utilities’ sales volumes have lower exposure to economic recessions than many non-financial corporate issuers, some sales components, including industrial sales, are directly affected by economic trends that cause lower production and/or plant closures. In addition, economic activity plays a role in the rate of customer growth in the service territory and (absent energy efficiency and conservation) can often impact usage per customer. The economic strength or weakness of the service territory can affect the political and regulatory environment for rate increase requests by the utility. For utilities in areas prone to severe storms and other natural disasters, the utility’s geographic diversity or concentration can be a key determinant for creditworthiness.
Diversity among regulatory regimes can mitigate the impact of a single unfavorable decision affecting one part of the utility’s footprint.
For utilities with electric generation, fuel source diversity can mitigate the impact (to the utility and to its rate-payers) of changes in commodity prices, hydrology and water flow, and environmental or other regulations affecting plant operations and economics. We have observed that utilities’ regulatory environments are most likely to become unfavorable during periods of rapid rate increases (which are more important than absolute rate levels) and that fuel diversity leads to more stable rates over time.
For that reason, fuel diversity can be important even if fuel and purchased power expenses are an automatic pass-through to the utility’s ratepayers. Changes in environmental, safety and other regulations have caused vulnerabilities for certain technologies and fuel sources during the past five years. These vulnerabilities have varied widely in different countries and have changed over time.
How We Assess Market Position for the Grid
Market position is comprised primarily of the economic diversity of the utility’s service territory and the diversity of its regulatory regimes. We also consider the diversity of utility operations (e.g., regulated electric, gas, water, steam) when there are material operations in more than one area.
Economic diversity is a typically a function of the population, size and breadth of the territory and the businesses that drive its GDP and employment. For the size of the territory, we typically consider the number of customers and the volumes of generation and/or throughput. For breadth, we consider the number of sizeable metropolitan areas served, the economic diversity and vitality in those metropolitan areas, and any concentration in a particular area or industry. In our assessment, we may consider various information sources. For example, in the US, information sources on the diversity and vitality of economies of individual states and metropolitan areas may include Moody’s Economy.com. We also look at the mix of the utility’s sales volumes among customer types, as well as the track record of volume sales and any notable payment patterns during economic cycles. For diversity of regulatory regimes, we typically look at the number of regulators and the percentages of revenues and utility assets that are under the purview of each. While the highest scores in the Market Position sub-factor are reserved for issuers regulated in multiple jurisdictions, when there is only one regulator, we make a differentiation of regimes perceived as having lower or higher volatility.
Issuers with multiple supportive regulatory jurisdictions, a balanced sales mix among residential, commercial, industrial and governmental customers in a large service territory with a robust and diverse economy will generally score higher in this sub-factor. An issuer with a small service territory economy that
Docket No. E002/GR-21-630 Exhibit___(PAJ-1), Schedule 9
Page 16 of 51

17 JUNE 23, 2017
RATING METHODOLOGY: REGULATED ELECTRIC AND GAS UTILITIES
INFRASTRUCTURE
has a high dependence on one or two sectors, especially highly cyclical industries, will generally score lower in this sub-factor, as will issuers with meaningful exposure to economic dislocations caused by natural disasters.
For issuers that are vertically integrated utilities having a meaningful amount of generation, this sub- factor has a weighting of 5%. For electric transmission and distribution utilities without meaningful generation and for natural gas local distribution companies, this sub-factor has a weighting of 10%.
How We Assess Generation and Fuel Diversity for the Grid
Criteria include the fuel type of the issuer’s generation and important power purchase agreements, the ability of the issuer economically to shift its generation and power purchases when there are changes in fuel prices, the degree to which the utility and its rate-payers are exposed to or insulated from changes in commodity prices, and exposure to Challenged Source and Threatened Sources (see the explanations for how we generally characterize these generation sources in the table below). A regulated utility’s capacity mix may not in itself be an indication of fuel diversity or the ability to shift fuels, since utilities may keep old and inefficient plants (e.g., natural gas boilers) to serve peak load. For this reason, we do not incorporate set percentages reflecting an “ideal” or “sub-par” mix for capacity or even generation. In addition to looking at a utility’s generation mix to evaluate fuel diversity, we consider the efficiency of the utility’s plants, their placement on the regional dispatch curve, and the demonstrated ability/inability of the utility to shift its generation mix in accordance with changing commodity prices.
Issuers having a balanced mix of hydro, coal, natural gas, nuclear and renewable energy as well as low exposure to challenged and threatened sources of generation will score more highly in this sub-factor. Issuers that have concentration in one or two sources of generation, especially if they are threatened or challenged sources, will incur lower scores.
In evaluating an issuer’s degree of exposure to challenged and threatened sources, we will consider not only the existence of those plants in the utility’s portfolio, but also the relevant factors that will determine the impact on the utility and on its rate-payers. For instance, an issuer that has a fairly high percentage of its generation from challenged sources could be evaluated very differently if its peer utilities face the same magnitude of those issues than if its peers have no exposure to challenged or threatened sources. In evaluating threatened sources, we consider the utility’s progress in its plan to replace those sources, its reserve margin, the availability of purchased power capacity in the region, and the overall impact of the replacement plan on the issuer’s rates relative to its peer group. Especially if there are no peers in the same jurisdiction, we also examine the extent to which the utility’s generation resources plan is aligned with the relevant government’s fuel/energy policy.
Docket No. E002/GR-21-630 Exhibit___(PAJ-1), Schedule 9
Page 17 of 51

18 JUNE 23, 2017
RATING METHODOLOGY: REGULATED ELECTRIC AND GAS UTILITIES
INFRASTRUCTURE
Factor 3: Diversification (10%)
Weighting 10% Sub-Factor Weighting Aaa Aa A Baa
Market Position 5.00% * A very high degree of multinational and regional diversity in terms of regulatory regimes and/or service territory economies.
Material operations in three or more nations or substantial geographic regions providing very good diversity of regulatory regimes and/or service territory economies.
Material operations in two to three nations, states, provinces or regions that provide good diversity of regulatory regimes and service territory economies. Alternately, operates within a single regulatory regime with low volatility, and the service territory economy is robust, has a very high degree of diversity and has demonstrated resilience in economic cycles.
May operate under a single regulatory regime viewed as having low volatility, or where multiple regulatory regimes are not viewed as providing much diversity. The service territory economy may have some concentration and cyclicality, but is sufficiently resilient that it can absorb reasonably foreseeable increases in utility rates.
Generation and Fuel Diversity
5.00% ** A high degree of diversity in terms of generation and/or fuel sources such that the utility and rate-payers are well insulated from commodity price changes, no generation concentration, and very low exposures to Challenged or Threatened Sources (see definitions below).
Very good diversification in terms of generation and/or fuel sources such that the utility and rate-payers are affected only minimally by commodity price changes, little generation concentration, and low exposures to Challenged or Threatened Sources.
Good diversification in terms of generation and/or fuel sources such that the utility and rate-payers have only modest exposure to commodity price changes; however, may have some concentration in a source that is neither Challenged nor Threatened. Exposure to Threatened Sources is low. While there may be some exposure to Challenged Sources, it is not a cause for concern.
Adequate diversification in terms of generation and/or fuel sources such that the utility and rate-payers have moderate exposure to commodity price changes; however, may have some concentration in a source that is Challenged. Exposure to Threatened Sources is moderate, while exposure to Challenged Sources is manageable.
Sub-Factor Weighting Ba B Caa Definiitons
Market Position 5.00% * Operates in a market area with somewhat greater concentration and cyclicality in the service territory economy and/or exposure to storms and other natural disasters, and thus less resilience to absorbing reasonably foreseeable increases in utility rates. May show somewhat greater volatility in the regulatory regime(s).
Operates in a limited market area with material concentration and more severe cyclicality in service territory economy such that cycles are of materially longer duration or reasonably foreseeable increases in utility rates could present a material challenge to the economy. Service territory may have geographic concentration that limits its resilience to storms and other natural disasters, or may be an emerging market. May show decided volatility in the regulatory regime(s).
Operates in a concentrated economic service territory with pronounced concentration, macroeconomic risk factors, and/or exposure to natural disasters.
Challenged Sources are generation plants that face higher but not insurmountable economic hurdles resulting from penalties or taxes on their operation, or from environmental upgrades that are required or likely to be required. Some examples are carbon-emitting plants that incur carbon taxes, plants that must buy emissions credits to operate, and plants that must install environmental equipment to continue to operate, in each where the taxes/credits/upgrades are sufficient to have a material impact on those plants' competitiveness relative to other generation types or on the utility's rates, but where the impact is not so severe as to be likely require plant closure.
Docket No. E002/GR-21-630 Exhibit___(PAJ-1), Schedule 9
Page 18 of 51

19 JUNE 23, 2017
RATING METHODOLOGY: REGULATED ELECTRIC AND GAS UTILITIES
INFRASTRUCTURE
Generation and Fuel Diversity
5.00% ** Modest diversification in generation and/or fuel sources such that the utility or rate-payers have greater exposure to commodity price changes. Exposure to Challenged and Threatened Sources may be more pronounced, but the utility will be able to access alternative sources without undue financial stress.
Operates with little diversification in generation and/or fuel sources such that the utility or rate-payers have high exposure to commodity price changes. Exposure to Challenged and Threatened Sources may be high, and accessing alternate sources may be challenging and cause more financial stress, but ultimately feasible.
Operates with high concentration in generation and/or fuel sources such that the utility or rate-payers have exposure to commodity price shocks. Exposure to Challenged and Threatened Sources may be very high, and accessing alternate sources may be highly uncertain.
Threatened Sources are generation plants that are not currently able to operate due to major unplanned outages or issues with licensing or other regulatory compliance, and plants that are highly likely to be required to de-activate, whether due to the effectiveness of currently existing or expected rules and regulations or due to economic challenges. Some recent examples would include coal fired plants in the US that are not economic to retro-fit to meet mercury and air toxics standards, plants that cannot meet the effective date of those standards, nuclear plants in Japan that have not been licensed to re-start after the Fukushima Dai-ichi accident, and nuclear plants that are required to be phased out within 10 years (as is the case in some European countries).
* 10% weight for issuers that lack generation **0% weight for issuers that lack generation
Docket No. E002/GR-21-630 Exhibit___(PAJ-1), Schedule 9
Page 19 of 51

20 JUNE 23, 2017
RATING METHODOLOGY: REGULATED ELECTRIC AND GAS UTILITIES
INFRASTRUCTURE
Factor 4: Financial Strength (40%)
Why It Matters
Electric and gas utilities are regulated, asset-based businesses characterized by large investments in long-lived property, plant and equipment. Financial strength, including the ability to service debt and provide a return to shareholders, is necessary for a utility to attract capital at a reasonable cost in order to invest in its generation, transmission and distribution assets, so that the utility can fulfill its service obligations at a reasonable cost to rate-payers.
How We Assess It for the Grid
In comparison to companies in other non-financial corporate sectors, the financial statements of regulated electric and gas utilities have certain unique aspects that impact financial analysis, which is further complicated by disparate treatment of certain elements under US Generally Accepted Accounting Principles (GAAP) versus International Financial Reporting Standards (IFRS). Regulatory accounting may permit utilities to defer certain costs (thereby creating regulatory assets) that a non- utility corporate entity would have to expense. For instance, a regulated utility may be able to defer a substantial portion of costs related to recovery from a storm based on the general regulatory framework for those expenses, even if the utility does not have a specific order to collect the expenses from ratepayers over a set period of time. A regulated utility may be able to accrue and defer a return on equity (in addition to capitalizing interest) for construction-work-in-progress for an approved project based on the assumption that it will be able to collect that deferred equity return once the asset comes into service. For this reason, we focus more on a utility’s cash flow than on its reported net income.
Conversely, utilities may collect certain costs in rates well ahead of the time they must be paid (for instance, pension costs), thereby creating regulatory liabilities. Many of our metrics focus on Cash Flow from Operations Before Changes in Working Capital (CFO Pre-WC) because, unlike Funds from Operations (FFO), it captures the changes in long-term regulatory assets and liabilities.
However, under IFRS the two measures are essentially the same. In general, we view changes in working capital as less important in utility financial analysis because they are often either seasonal (for example, power demand is generally greatest in the summer) or caused by changes in fuel prices that are typically a relatively automatic pass-through to the customer. We will nonetheless examine the impact of working capital changes in analyzing a utility’s liquidity (see Other Rating Considerations – Liquidity).
Given the long-term nature of utility assets and the often lumpy nature of their capital expenditures, it is important to analyze both a utility’s historical financial performance as well as its prospective future performance, which may be different from backward-looking measures. Scores under this factor may be higher or lower than what might be expected from historical results, depending on our view of expected future performance. Multi-year periods are usually more representative of credit quality because utilities can experience swings in cash flows from one-time events, including such items as rate refunds, storm cost deferrals that create a regulatory asset, or securitization proceeds that reduce a regulatory asset. Nonetheless, we also look at trends in metrics for individual periods, which may influence our view of future performance and ratings.
For this scoring grid, we have identified four key ratios that we consider the most consistently useful in the analysis of regulated electric and gas utilities. However, no single financial ratio can adequately convey the relative credit strength of these highly diverse companies. Our ratings consider the overall financial strength of a company, and in individual cases other financial indicators may also play an important role.
Docket No. E002/GR-21-630 Exhibit___(PAJ-1), Schedule 9
Page 20 of 51

21 JUNE 23, 2017
RATING METHODOLOGY: REGULATED ELECTRIC AND GAS UTILITIES
INFRASTRUCTURE
CFO Pre-Working Capital Plus Interest/Interest or Cash Flow Interest Coverage
The cash flow interest coverage ratio is an indicator for a utility’s ability to cover the cost of its borrowed capital. The numerator in the ratio calculation is the sum of CFO Pre-WC and interest expense, and the denominator is interest expense.
CFO Pre-Working Capital / Debt
This important metric is an indicator for the cash generating ability of a utility compared to its total debt. The numerator in the ratio calculation is CFO Pre-WC, and the denominator is total debt.
CFO Pre-Working Capital Minus Dividends / Debt
This ratio is an indicator for financial leverage as well as an indicator of the strength of a utility’s cash flow after dividend payments are made. Dividend obligations of utilities are often substantial, quasi- permanent outflows that can affect the ability of a utility to cover its debt obligations, and this ratio can also provide insight into the financial policies of a utility or utility holding company. The higher the level of retained cash flow relative to a utility’s debt, the more cash the utility has to support its capital expenditure program. The numerator of this ratio is CFO Pre-WC minus dividends, and the denominator is total debt.
Debt/Capitalization
This ratio is a traditional measure of balance sheet leverage. The numerator is total debt and the denominator is total capitalization. All of our ratios are calculated in accordance with our standard adjustments10, but we note that our definition of total capitalization includes deferred taxes in addition to total debt, preferred stock, other hybrid securities, and common equity. Since the presence or absence of deferred taxes is a function of national tax policy, comparing utilities using this ratio may be more meaningful among utilities in the same country or in countries with similar tax policies. High debt levels in comparison to capitalization can indicate higher interest obligations, can limit the ability of a utility to raise additional financing if needed, and can lead to leverage covenant violations in bank credit facilities or other financing agreements11. A high ratio may result from a regulatory framework that does not permit a robust cushion of equity in the capital structure, or from a material write-off of an asset, which may not have impacted current period cash flows but could affect future period cash flows relative to debt.
There are two sets of thresholds for three of these ratios based on the level of the issuer’s business risk – the Standard Grid and the Lower Business Risk (LBR) Grid. In our view, the different types of utility entities covered under this methodology (as described in Appendix E) have different levels of business risk.
Generation utilities and vertically integrated utilities generally have a higher level of business risk because they are engaged in power generation, so we apply the Standard Grid. We view power generation as the highest-risk component of the electric utility business, as generation plants are typically the most expensive part of a utility’s infrastructure (representing asset concentration risk) and are subject to the greatest risks in both construction and operation, including the risk that incurred costs will either not be recovered in rates or recovered with material delays.
Other types of utilities may have lower business risk, such that we believe that they are most appropriately assessed using the LBR Grid, due to factors that could include a generally greater transfer of risk to customers, very strong insulation from exposure to commodity price movements, good protection from volumetric risks, fairly limited capex needs and low exposure to storms, major accidents and natural
10 In certain circumstances, analysts may also apply specific adjustments. 11 We also examine debt/capitalization ratios as defined in applicable covenants (which typically exclude deferred taxes from capitalization) relative to the covenant
threshold level.
Docket No. E002/GR-21-630 Exhibit___(PAJ-1), Schedule 9
Page 21 of 51

22 JUNE 23, 2017
RATING METHODOLOGY: REGULATED ELECTRIC AND GAS UTILITIES
INFRASTRUCTURE
disasters. For instance, we tend to view many US natural gas local distribution companies (LDCs) and certain US electric transmission and distribution companies (T&Ds, which lack generation but generally retain some procurement responsibilities for customers), as typically having a lower business risk profile than their vertically integrated peers. In cases of T&Ds that we do not view as having materially lower risk than their vertically integrated peers, we will apply the Standard grid. This could result from a regulatory framework that exposes them to energy supply risk, large capital expenditures for required maintenance or upgrades, a heightened degree of exposure to catastrophic storm damage, or increased regulatory scrutiny due to poor reliability, or other considerations. The Standard Grid will also apply to LDCs that in our view do not have materially lower risk; for instance, due to their ownership of high pressure pipes or older systems requiring extensive gas main replacements, where gas commodity costs are not fully recovered in a reasonably contemporaneous manner, or where the LDC is not well insulated from declining volumes.
The four key ratios, their weighting in the grid, and the Standard and LBR scoring thresholds are detailed in the following table.
Factor 4: Financial Strength
Weighting 40%
Sub-Factor Weighting Aaa Aa A Baa Ba B Caa
CFO pre-WC + Interest / Interest
7.50% ≥ 8.0x 6.0x - 8.0x 4.5x - 6.0x 3.0x - 4.5x 2.0x - 3.0x 1.0x - 2.0x < 1.0x
CFO pre-WC / Debt
15.00% Standard Grid ≥ 40% 30% - 40% 22% - 30% 13% - 22% 5% - 13% 1% - 5% < 1%
Low Business Risk Grid
≥ 38% 27% - 38% 19% - 27% 11% - 19% 5% - 11% 1% - 5% < 1%
CFO pre-WC - Dividends / Debt
10.00% Standard Grid ≥ 35% 25% - 35% 17% - 25% 9% - 17% 0% - 9% (5%) - 0% < (5%)
Low Business Risk Grid
≥ 34% 23% - 34% 15% - 23% 7% - 15% 0% - 7% (5%) - 0% < (5%)
Debt / Capitalization
7.50% Standard Grid < 25% 25% - 35% 35% - 45% 45% - 55% 55% - 65% 65% - 75% ≥ 75%
Low Business Risk Grid
< 29% 29% - 40% 40% - 50% 50% - 59% 59% - 67% 67% - 75% ≥ 75%
Notching for Structural Subordination of Holding Companies
Why It Matters
A typical utility company structure consists of a holding company (“HoldCo”) that owns one or more operating subsidiaries (each an “OpCo”). OpCos may be regulated utilities or non-utility companies. A HoldCo typically has no operations – its assets are mostly limited to its equity interests in subsidiaries, and potentially other investments in subsidiaries that are structured as advances, debt, or even hybrid securities.
Most HoldCos present their financial statements on a consolidated basis that blurs legal considerations about priority of creditors based on the legal structure of the family, and grid scoring is thus based on consolidated ratios. However, HoldCo creditors typically have a secondary claim on the group’s cash flows and assets after OpCo creditors. We refer to this as structural subordination, because it is the corporate legal structure, rather than specific subordination provisions, that causes creditors at each of the utility and non-utility subsidiaries to have a more direct claim on the cash flows and assets of their respective OpCo obligors. By contrast, the debt of the HoldCo is typically serviced primarily by dividends that are up-
Docket No. E002/GR-21-630 Exhibit___(PAJ-1), Schedule 9
Page 22 of 51
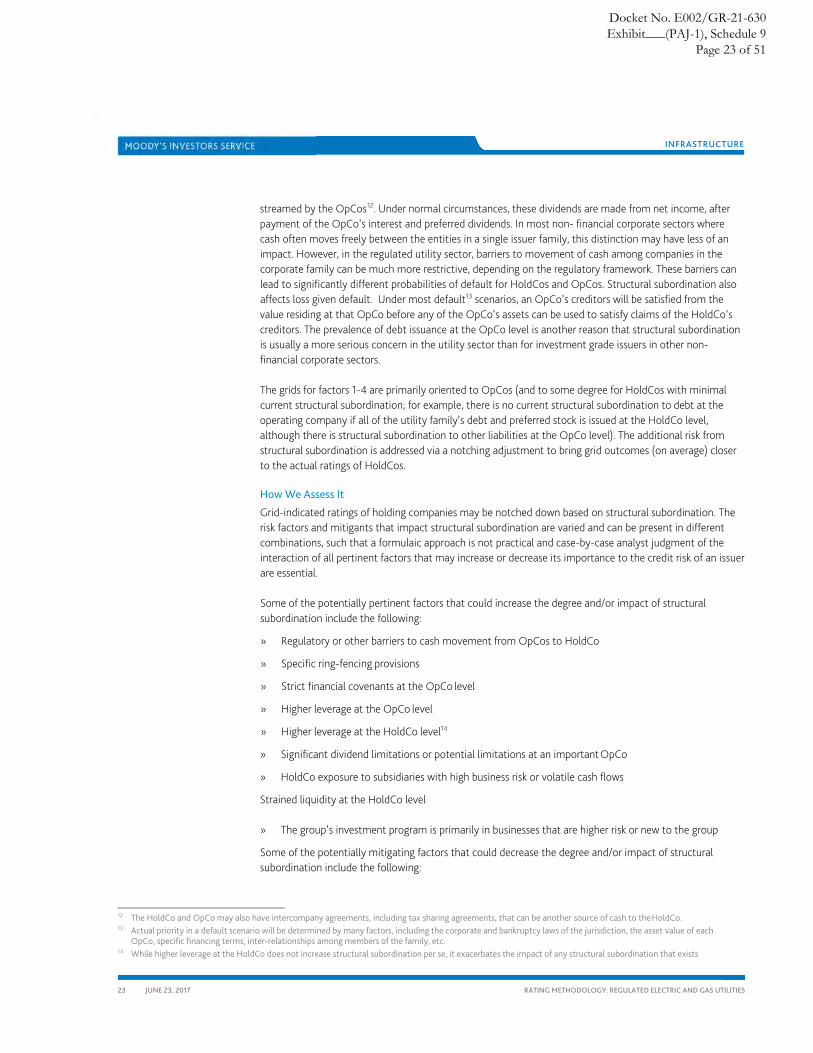
23 JUNE 23, 2017
RATING METHODOLOGY: REGULATED ELECTRIC AND GAS UTILITIES
INFRASTRUCTURE
streamed by the OpCos12. Under normal circumstances, these dividends are made from net income, after payment of the OpCo’s interest and preferred dividends. In most non- financial corporate sectors where cash often moves freely between the entities in a single issuer family, this distinction may have less of an impact. However, in the regulated utility sector, barriers to movement of cash among companies in the corporate family can be much more restrictive, depending on the regulatory framework. These barriers can lead to significantly different probabilities of default for HoldCos and OpCos. Structural subordination also affects loss given default. Under most default13 scenarios, an OpCo’s creditors will be satisfied from the value residing at that OpCo before any of the OpCo’s assets can be used to satisfy claims of the HoldCo’s creditors. The prevalence of debt issuance at the OpCo level is another reason that structural subordination is usually a more serious concern in the utility sector than for investment grade issuers in other non-financial corporate sectors.
The grids for factors 1-4 are primarily oriented to OpCos (and to some degree for HoldCos with minimal current structural subordination; for example, there is no current structural subordination to debt at the operating company if all of the utility family’s debt and preferred stock is issued at the HoldCo level, although there is structural subordination to other liabilities at the OpCo level). The additional risk from structural subordination is addressed via a notching adjustment to bring grid outcomes (on average) closer to the actual ratings of HoldCos.
How We Assess It
Grid-indicated ratings of holding companies may be notched down based on structural subordination. The risk factors and mitigants that impact structural subordination are varied and can be present in different combinations, such that a formulaic approach is not practical and case-by-case analyst judgment of the interaction of all pertinent factors that may increase or decrease its importance to the credit risk of an issuer are essential.
Some of the potentially pertinent factors that could increase the degree and/or impact of structural subordination include the following:
» Regulatory or other barriers to cash movement from OpCos to HoldCo
» Specific ring-fencing provisions
» Strict financial covenants at the OpCo level
» Higher leverage at the OpCo level
» Higher leverage at the HoldCo level14
» Significant dividend limitations or potential limitations at an important OpCo
» HoldCo exposure to subsidiaries with high business risk or volatile cash flows
Strained liquidity at the HoldCo level
» The group’s investment program is primarily in businesses that are higher risk or new to the group
Some of the potentially mitigating factors that could decrease the degree and/or impact of structural subordination include the following:
12 The HoldCo and OpCo may also have intercompany agreements, including tax sharing agreements, that can be another source of cash to the HoldCo. 13 Actual priority in a default scenario will be determined by many factors, including the corporate and bankruptcy laws of the jurisdiction, the asset value of each
OpCo, specific financing terms, inter-relationships among members of the family, etc. 14 While higher leverage at the HoldCo does not increase structural subordination per se, it exacerbates the impact of any structural subordination that exists
Docket No. E002/GR-21-630 Exhibit___(PAJ-1), Schedule 9
Page 23 of 51

24 JUNE 23, 2017
RATING METHODOLOGY: REGULATED ELECTRIC AND GAS UTILITIES
INFRASTRUCTURE
» Substantial diversity in cash flows from a variety of utility OpCos
» Meaningful dividends to HoldCo from unlevered utility OpCos
» Dependable, meaningful dividends to HoldCo from non-utility OpCos
» The group’s investment program is primarily in strong utility businesses
» Inter-company guarantees - however, in many jurisdictions the value of an upstream guarantee may be limited by certain factors, including by the value that the OpCo received in exchange for granting the guarantee
Notching for structural subordination within the grid may range from 0 to negative 3 notches. Instances of extreme structural subordination are relatively rare, so the grid convention does not accommodate wider differences, although in the instances where we believe it is present, actual ratings do reflect the full impact of structural subordination.
A related issue is the relationship of ratings within a utility family with multiple operating companies, and sometimes intermediate holding companies. Some of the key issues are the same, such as the relative amounts of debt at the holding company level compared to the operating company level (or at one OpCo relative to another), and the degree to which operating companies have credit insulation due to regulation or other protective factors. Appendix B has additional insights on ratings within a utility family.
Rating Methodology Assumptions, Limitations, and Other Rating Considerations
The grid in this rating methodology represents a decision to favor simplicity that enhances transparency and to avoid greater complexity that might enable the grid to map more closely to actual ratings. Accordingly, the four rating factors and the notching factor in the grid do not constitute an exhaustive treatment of all of the considerations that are important for ratings of companies in the regulated electric and gas utility sector. In addition, our ratings incorporate expectations for future performance, while the financial information that is used in the grid in this document is mainly historical. In some cases, our expectations for future performance may be informed by confidential information that we can’t disclose. In other cases, we estimate future results based upon past performance, industry trends, competitor actions or other factors. In either case, predicting the future is subject to the risk of substantial inaccuracy.
Assumptions that may cause our forward-looking expectations to be incorrect include unanticipated changes in any of the following factors: the macroeconomic environment and general financial market conditions, industry competition, disruptive technology, regulatory and legal actions.
Key rating assumptions that apply in this sector include our view that sovereign credit risk is strongly correlated with that of other domestic issuers, that legal priority of claim affects average recovery on different classes of debt, sufficiently to generally warrant differences in ratings for different debt classes of the same issuer, and the assumption that lack of access to liquidity is a strong driver of credit risk.
In choosing metrics for this rating methodology grid, we did not explicitly include certain important factors that are common to all companies in any industry such as the quality and experience of management, assessments of corporate governance and the quality of financial reporting and information disclosure. Therefore ranking these factors by rating category in a grid would in some cases suggest too much precision in the relative ranking of particular issuers against all other issuers that are rated in various industry sectors.
Docket No. E002/GR-21-630 Exhibit___(PAJ-1), Schedule 9
Page 24 of 51

25 JUNE 23, 2017
RATING METHODOLOGY: REGULATED ELECTRIC AND GAS UTILITIES
INFRASTRUCTURE
Ratings may include additional factors that are difficult to quantify or that have a meaningful effect in differentiating credit quality only in some cases, but not all. Such factors include financial controls, exposure to uncertain licensing regimes and possible government interference in some countries.
Regulatory, litigation, liquidity, technology and reputational risk as well as changes to consumer and business spending patterns, competitor strategies and macroeconomic trends also affect ratings. While these are important considerations, it is not possible precisely to express these in the rating methodology grid without making the grid excessively complex and significantly less transparent.
Ratings may also reflect circumstances in which the weighting of a particular factor will be substantially different from the weighting suggested by the grid.
This variation in weighting rating considerations can also apply to factors that we choose not to represent in the grid. For example, liquidity is a consideration frequently critical to ratings and which may not, in other circumstances, have a substantial impact in discriminating between two issuers with a similar credit profile. As an example of the limitations, ratings can be heavily affected by extremely weak liquidity that magnifies default risk. However, two identical companies might be rated the same if their only differentiating feature is that one has a good liquidity position while the other has an extremely good liquidity position.
Other Rating Considerations
We consider other factors in addition to those discussed in this report, but in most cases understanding the considerations discussed herein should enable a good approximation of our view on the credit quality of companies in the regulated electric and gas utilities sector. Ratings consider our assessment of the quality of management, corporate governance, financial controls, liquidity management, event risk and seasonality. The analysis of these factors remains an integral part of our rating process.
Liquidity and Access to Capital Markets
Liquidity analysis is a key element in the financial analysis of electric and gas utilities, and it encompasses a company’s ability to generate cash from internal sources as well as the availability of external sources of financing to supplement these internal sources. Liquidity and access to financing are of particular importance in this sector. Utility assets can often have a very long useful life- 30, 40 or even 60 years is not uncommon, as well as high price tags. Partly as a result of construction cycles, the utility sector has experienced prolonged periods of negative free cash flow – essentially, the sum of its dividends and its capital expenditures for maintenance and growth of its infrastructure frequently exceeds cash from operations, such that a portion of capital expenditures must routinely be debt financed. Utilities are among the largest debt issuers in the corporate universe and typically require consistent access to the capital markets to assure adequate sources of funding and to maintain financial flexibility. Substantial portions of capex are non-discretionary (for example, maintenance, adding customers to the network, or meeting environmental mandates); however, utilities were swift to cut or defer discretionary spending during the 2007-2009 recession. Dividends represent a quasi-permanent outlay, since utilities typically only rarely will cut their dividend. Liquidity is also important to meet maturing obligations, which often occur in large chunks, and to meet collateral calls under any hedging agreements.
Due to the importance of liquidity, incorporating it as a factor with a fixed weighting in the grid would suggest an importance level that is often far different from the actual weight in the rating. In normal circumstances most companies in the sector have good access to liquidity. The industry generally requires, and for the most part has, large, syndicated, multi-year committed credit facilities. In addition, utilities have demonstrated strong access to capital markets, even under difficult conditions. As a result, liquidity
Docket No. E002/GR-21-630 Exhibit___(PAJ-1), Schedule 9
Page 25 of 51

26 JUNE 23, 2017
RATING METHODOLOGY: REGULATED ELECTRIC AND GAS UTILITIES
INFRASTRUCTURE
generally has not been an issue for most utilities and a utility with very strong liquidity may not warrant a rating distinction compared to a utility with strong liquidity. However, when there is weakness in liquidity or liquidity management, it can be the dominant consideration for ratings.
Our assessment of liquidity for regulated utilities involves an analysis of total sources and uses of cash over the next 12 months or more, as is done for all corporates. Using our financial projections of the utility and our analysis of its available sources of liquidity (including an assessment of the quality and reliability of alternate liquidity such as committed credit facilities), we evaluate how its projected sources of cash (cash from operations, cash on hand and existing committed multi-year credit facilities) compare to its projected uses (including all or most capital expenditures, dividends, maturities of short and long-term debt, our projection of potential liquidity calls on financial hedges, and important issuer-specific items such as special tax payments). We assume no access to capital markets or additional liquidity sources, no renewal of existing credit facilities, and no cut to dividends. We examine a company’s liquidity profile under this scenario, its ability to make adjustments to improve its liquidity position, and any dependence on liquidity sources with lower quality and reliability.
Management Quality and Financial Policy
The quality of management is an important factor supporting the credit strength of a regulated utility or utility holding company. Assessing the execution of business plans over time can be helpful in assessing management’s business strategies, policies, and philosophies and in evaluating management performance relative to performance of competitors and our projections. A record of consistency provides us with insight into management’s likely future performance in stressed situations and can be an indicator of management’s tendency to depart significantly from its stated plans and guidelines.
We also assess financial policy (including dividend policy and planned capital expenditures) and how management balances the potentially competing interests of shareholders, fixed income investors and other stakeholders. Dividends and discretionary capital expenditures are the two primary components over which management has the greatest control in the short term. For holding companies, we consider the extent to which management is willing stretch its payout ratio (through aggressive increases or delays in needed decreases) in order to satisfy common shareholders. For a utility that is a subsidiary of a parent company with several utility subsidiaries, dividends to the parent may be more volatile depending on the cash generation and cash needs of that utility, because parents typically want to assure that each utility maintains the regulatory debt/equity ratio on which its rates have been set. The effect we have observed is that utility subsidiaries often pay higher dividends when they have lower capital needs and lower dividends when they have higher capital expenditures or other cash needs. Any dividend policy that cuts into the regulatory debt/equity ratio is a material credit negative.
Size – Natural Disasters, Customer Concentration and Construction Risks
The size and scale of a regulated utility has generally not been a major determinant of its credit strength in the same way that it has been for most other industrial sectors. While size brings certain economies of scale that can somewhat affect the utility’s cost structure and competitiveness, rates are more heavily impacted by costs related to fuel and fixed assets. Particularly in the US, we have not observed material differences in the success of utilities’ regulatory outreach based on their size. Smaller utilities have sometimes been better able to focus their attention on meeting the expectations of a single regulator than their multi-state peers.
However, size can be a very important factor in our assessment of certain risks that impact ratings, including exposure to natural disasters, customer concentration (primarily to industrial customers in a single sector) and construction risks associated with large projects. While the grid attempts to incorporate the first two of
Docket No. E002/GR-21-630 Exhibit___(PAJ-1), Schedule 9
Page 26 of 51

27 JUNE 23, 2017
RATING METHODOLOGY: REGULATED ELECTRIC AND GAS UTILITIES
INFRASTRUCTURE
these into Factor 3, for some issuers these considerations may be sufficiently important that the rating reflects a greater weight for these risks. While construction projects always carry the risk of cost over-runs and delays, these risks are materially heightened for projects that are very large relative to the size of the utility.
Interaction of Utility Ratings with Government Policies and Sovereign Ratings
Compared to most industrial sectors, regulated utilities are more likely to be impacted by government actions. Credit impacts can occur directly through rate regulation, and indirectly through energy, environmental and tax policies. Government actions affect fuel prices, the mix of generating plants, the certainty and timing of revenues and costs, and the likelihood that regulated utilities will experience financial stress. While our evolving view of the impact of such policies and the general economic and financial climate is reflected in ratings for each utility, some considerations do not lend themselves to incorporation in a simple ratings grid.15
Diversified Operations at the Utility
A small number of regulated utilities have diversified operations that are segments within the utility company, as opposed to the more common practice of housing such operations in one or more separate affiliates. In general, we will seek to evaluate the other businesses that are material in accordance with the appropriate methodology and the rating will reflect considerations from such methodologies. There may be analytical limitations in evaluating the utility and non-utility businesses when segment financial results are not fully broken out and these may be addressed through estimation based on available information. Since regulated utilities are a relatively low risk business compared to other corporate sectors, in most cases diversified non-utility operations increase the business risk profile of a utility. Reflecting this tendency, we note that assigned ratings are typically lower than grid- indicated ratings for such companies.
Event Risk
We also recognize the possibility that an unexpected event could cause a sudden and sharp decline in an issuer's fundamental creditworthiness. Typical special events include mergers and acquisitions, asset sales, spin-offs, capital restructuring programs, litigation and shareholder distributions.
Corporate Governance
Among the areas of focus in corporate governance are audit committee financial expertise, the incentives created by executive compensation packages, related party transactions, interactions with outside auditors, and ownership structure.
Investment and Acquisition Strategy
In our credit assessment we take into consideration management’s investment strategy. Investment strategy is benchmarked with that of the other companies in the rated universe to further verify its consistency. Acquisitions can strengthen a company’s business. Our assessment of a company’s tolerance for acquisitions at a given rating level takes into consideration (1) management’s risk appetite, including the likelihood of further acquisitions over the medium term; (2) share buy-back activity; (3) the company’s commitment to specific leverage targets; and (4) the volatility of the underlying businesses, as well as that of the business acquired. Ratings can often hold after acquisitions even if leverage temporarily climbs above normally acceptable ranges. However, this depends on (1) the strategic fit; (2) pro-forma
15 See also the cross-sector methodology ”How Sovereign Credit Quality May Affect Other Ratings.” A link to this and other sector and cross-sector credit rating
methodologies can be found in the Related Research section of this report.
Docket No. E002/GR-21-630 Exhibit___(PAJ-1), Schedule 9
Page 27 of 51

28 JUNE 23, 2017
RATING METHODOLOGY: REGULATED ELECTRIC AND GAS UTILITIES
INFRASTRUCTURE
capitalization/leverage following an acquisition; and (3) our confidence that credit metrics will be restored in a relatively short timeframe.
Financial Controls
We rely on the accuracy of audited financial statements to assign and monitor ratings in this sector. Such accuracy is only possible when companies have sufficient internal controls, including centralized operations, the proper tone at the top and consistency in accounting policies and procedures.
Weaknesses in the overall financial reporting processes, financial statement restatements or delays in regulatory filings can be indications of a potential breakdown in internal controls.
Docket No. E002/GR-21-630 Exhibit___(PAJ-1), Schedule 9
Page 28 of 51

29 JUNE 23, 2017
RATING METHODOLOGY: REGULATED ELECTRIC AND GAS UTILITIES
INFRASTRUCTURE
Appendix A: Regulated Electric and Gas Utilities Methodology Factor Grid
Factor 1a: Legislative and Judicial Underpinnings of the Regulatory Framework (12.5%)
Aaa Aa A Baa
Utility regulation occurs under a fully developed framework that is national in scope based on legislation that provides
the utility a nearly absolute monopoly (see note 1) within its service territory, an unquestioned assurance that rates will be set in a manner that will permit the utility to make and
recover all necessary investments, an extremely high degree of clarity as to the manner in which utilities will be regulated and prescriptive methods and procedures for setting rates. Existing utility law is comprehensive and supportive such
that changes in legislation are not expected to be necessary; or any changes that have occurred have been strongly
supportive of utilities credit quality in general and sufficiently forward- looking so as to address problems before they
occurred. There is an independent judiciary that can arbitrate disagreements between the regulator and the utility should they occur, including access to national courts, very strong judicial precedent in the interpretation of utility laws, and a strong rule of law. We expect these conditions to continue.
Utility regulation occurs under a fully developed national, state or provincial framework based on legislation that provides the
utility an extremely strong monopoly (see note 1) within its service territory, a strong assurance, subject to limited review, that rates will be set in a manner that will permit the utility to make and recover all necessary investments, a very high degree
of clarity as to the manner in which utilities will be regulated and reasonably prescriptive methods and procedures for setting rates. If there have been changes in utility legislation, they have
been timely and clearly credit supportive of the issuer in a manner that shows the utility has had a strong voice in the process. There is an independent judiciary that can arbitrate disagreements between the regulator and the utility, should they occur including access to national courts, strong judicial
precedent in the interpretation of utility laws, and a strong rule of law. We expect these conditions to continue.
Utility regulation occurs under a well developed national, state or provincial framework based on legislation that provides the utility a very strong
monopoly (see note 1) within its service territory, an assurance, subject to reasonable prudency
requirements, that rates will be set in a manner that will permit the utility to make and recover all necessary
investments, a high degree of clarity as to the manner in which utilities will be regulated, and overall guidance for methods and procedures for setting rates. If there
have been changes in utility legislation, they have been mostly timely and on the whole credit supportive for the issuer, and the utility has had a clear voice in the legislative process. There is an independent judiciary
that can arbitrate disagreements between the regulator and the utility, should they occur, including access to
national courts, clear judicial precedent in the interpretation of utility law, and a strong rule of law.
We expect these conditions to continue.
Utility regulation occurs (i) under a national, state, provincial or municipal framework based on legislation that provides the utility a strong monopoly
within its service territory that may have some exceptions such as greater self-generation (see note 1), a general assurance that, subject to prudency
requirements that are mostly reasonable, rates will be set will be set in a manner that will permit the utility to make and recover all necessary
investments, reasonable clarity as to the manner in which utilities will be regulated and overall guidance for methods and procedures for setting rates; or
(ii) under a new framework where independent and transparent regulation exists in other sectors. If there have been changes in utility legislation, they
have been credit supportive or at least balanced for the issuer but potentially less timely, and the utility had a voice in the legislative process. There is either
(i) an independent judiciary that can arbitrate disagreements between the regulator and the utility, including access to courts at least at the state or provincial level, reasonably clear judicial precedent in the interpretation of
utility laws, and a generally strong rule of law; or
(ii) regulation has been applied (under a well developed framework) in a manner such that redress to an independent arbiter has not been required. We
expect these conditions to continue.
Ba B Caa
Utility regulation occurs (i) under a national, state, provincial or municipal framework based on legislation or government decree that provides the utility a monopoly within its service territory that is generally strong but may have a greater level
of exceptions (see note 1), and that, subject to prudency requirements which may be stringent, provides a general
assurance (with somewhat less certainty) that rates will be set will be set in a manner that will permit the utility to
make and recover necessary investments; or (ii) under a new framework where the jurisdiction has a history of less
independent and transparent regulation in other sectors. Either: (i) the judiciary that can arbitrate disagreements
between the regulator and the utility may not have clear authority or may not be fully independent of the regulator or other political pressure, but there is a reasonably strong rule
of law; or (ii) where there is no independent arbiter, the regulation has mostly been applied in a manner such redress
has not been required. We expect these conditions to continue.
Utility regulation occurs (i) under a national, state, provincial or municipal framework based on legislation or government
decree that provides the utility monopoly within its service territory that is reasonably strong but may have important
exceptions, and that, subject to prudency requirements which may be stringent or at times arbitrary, provides more limited or
less certain assurance that rates will be set in a manner that will permit the utility to make and recover necessary
investments; or (ii) under a new framework where we would expect less independent and transparent regulation, based either on the regulator's history in other sectors or other
factors. The judiciary that can arbitrate disagreements between the regulator and the utility may not have clear authority or
may not be fully independent of the regulator or other political pressure, but there is a reasonably strong rule of law.
Alternately, where there is no independent arbiter, the regulation has been applied in a manner that often requires
some redress adding more uncertainty to the regulatory framework.
There may be a periodic risk of creditor-unfriendly government intervention in utility markets or rate-setting.
Utility regulation occurs (i) under a national, state, provincial or municipal framework based on legislation
or government decree that provides the utility a monopoly within its service territory, but with little assurance that rates will be set in a manner that will
permit the utility to make and recover necessary investments; or (ii) under a new framework where we
would expect unpredictable or adverse regulation, based either on the jurisdiction's history of in other
sectors or other factors. The judiciary that can arbitrate disagreements between the regulator and the utility
may not have clear authority or is viewed as not being fully independent of the regulator or other political pressure. Alternately, there may be no redress to an
effective independent arbiter. The ability of the utility to enforce its monopoly or prevent uncompensated
usage of its system may be limited. There may be a risk of creditor- unfriendly nationalization or other
significant intervention in utility markets or rate-setting.
Note 1: The strength of the monopoly refers to the legal, regulatory and practical obstacles for customers in the utility’s territory to obtain service from another provider. Examples of a weakening of the monopoly would include the ability of a city or large user to leave the utility system to set up their own system, the extent to which self-generation is permitted (e.g. cogeneration) and/or encouraged (e.g., net metering, DSM generation). At the lower end of the ratings spectrum, the utility’s monopoly may be challenged by pervasive theft and unauthorized use. Since utilities are generally presumed to be monopolies, a strong monopoly position in itself is not sufficient for a strong score in this sub-factor, but a weakening of the monopoly can lower the score.
* 10% weight for issuers that lack generation **0% weight for issuers that lack generation
Docket No. E002/GR-21-630 Exhibit___(PAJ-1), Schedule 9
Page 29 of 51

30 JUNE 23, 2017
RATING METHODOLOGY: REGULATED ELECTRIC AND GAS UTILITIES
INFRASTRUCTURE
Factor 1b: Consistency and Predictability of Regulation (12.5%)
Aaa Aa A Baa
The issuer's interaction with the regulator has led to a strong, lengthy track record of predictable, consistent and favorable
decisions. The regulator is highly credit supportive of the issuer and utilities in general.
We expect these conditions to continue.
The issuer's interaction with the regulator has a led to a considerable track record of predominantly
predictable and consistent decisions. The regulator is mostly credit supportive of utilities in general
and in almost all instances has been highly credit supportive of the issuer. We expect these
conditions to continue.
The issuer's interaction with the regulator has led to a track record of largely
predictable and consistent decisions. The regulator may be somewhat less credit
supportive of utilities in general, but has been quite credit supportive of the issuer in
most circumstances. We expect these conditions to continue.
The issuer's interaction with the regulator has led to an adequate track record. The regulator is generally consistent
and predictable, but there may some evidence of inconsistency or unpredictability from time to time, or decisions may at times be politically charged. However,
instances of less credit supportive decisions are based on reasonable application of existing rules and statutes and are not overly punitive. We expect these conditions to continue.
Ba B Caa
We expect that regulatory decisions will demonstrate considerable inconsistency or
unpredictability or that decisions will be politically charged, based either on the issuer's track record of interaction with regulators or
other governing bodies, or our view that decisions will move in this direction. The
regulator may have a history of less credit supportive regulatory decisions with respect
to the issuer, but we expect that the issuer will be able to obtain support when it encounters
financial stress, with some potentially material delays. The regulator’s authority may be eroded at times by legislative or political action. The regulator may not follow the framework for some material decisions.
We expect that regulatory decisions will be largely unpredictable or even somewhat arbitrary, based either on the issuer's track record of interaction
with regulators or other governing bodies, or our view that decisions will move in this direction.
However, we expect that the issuer will ultimately be able to obtain support when it encounters financial stress, albeit with material or more
extended delays. Alternately, the regulator is untested, lacks a
consistent track record, or is undergoing substantial change. The regulator’s authority may be eroded on frequent occasions by legislative or
political action. The regulator may more frequently ignore the framework in a manner detrimental to
the issuer.
We expect that regulatory decisions will be highly unpredictable and frequently
adverse, based either on the issuer's track record of interaction with regulators or
other governing bodies, or our view that decisions will move in this direction.
Alternately, decisions may have credit supportive aspects, but may often be
unenforceable. The regulator’s authority may have been seriously eroded by
legislative or political action. The regulator may consistently ignore the framework to
the detriment of the issuer.
Docket No. E002/GR-21-630 Exhibit___(PAJ-1), Schedule 9
Page 30 of 51

31 JUNE 23, 2017
RATING METHODOLOGY: REGULATED ELECTRIC AND GAS UTILITIES
INFRASTRUCTURE
Factor 2a: Timeliness of Recovery of Operating and Capital Costs (12.5%)
Aaa Aa A Baa
Tariff formulas and automatic cost recovery mechanisms provide full and highly timely
recovery of all operating costs and essentially contemporaneous return on all incremental
capital investments, with statutory provisions in place to preclude the possibility
of challenges to rate increases or cost recovery mechanisms. By statute and by practice, general rate cases are efficient,
focused on an impartial review, quick, and permit inclusion of fully forward -looking
costs.
Tariff formulas and automatic cost recovery mechanisms provide full and highly timely
recovery of all operating costs and essentially contemporaneous or near-contemporaneous
return on most incremental capital investments, with minimal challenges by regulators to
companies’ cost assumptions. By statute and by practice, general rate cases are efficient, focused
on an impartial review, of a very reasonable duration before non-appealable interim rates can
be collected, and primarily permit inclusion of forward- looking costs.
Automatic cost recovery mechanisms provide full and reasonably timely recovery of fuel, purchased
power and all other highly variable operating expenses. Material capital investments may be
made under tariff formulas or other rate-making permitting reasonably contemporaneous returns, or may be submitted under other types of filings
that provide recovery of cost of capital with minimal delays. Instances of regulatory challenges
that delay rate increases or cost recovery are generally related to large, unexpected increases in
sizeable construction projects. By statute or by practice, general rate cases are reasonably
efficient, primarily focused on an impartial review, of a reasonable duration before rates (either
permanent or non- refundable interim rates) can be collected, and permit inclusion of important
forward -looking costs.
Fuel, purchased power and all other highly variable expenses are generally recovered through mechanisms
incorporating delays of less than one year, although some rapid increases in costs may be delayed longer where such
deferrals do not place financial stress on the utility. Incremental capital investments may be recovered
primarily through general rate cases with moderate lag, with some through tariff formulas. Alternately, there may
be formula rates that are untested or unclear. Potentially greater tendency for delays due to regulatory
intervention, although this will generally be limited to rates related to large capital projects or rapid increases in
operating costs.
Ba B Caa
There is an expectation that fuel, purchased power or other highly variable expenses will
eventually be recovered with delays that will not place material financial stress on the
utility, but there may be some evidence of an unwillingness by regulators to make timely rate changes to address volatility in fuel, or purchased power, or other market-sensitive
expenses. Recovery of costs related to capital investments may be subject to delays that
are somewhat lengthy, but not so pervasive as to be expected to discourage important
investments.
The expectation that fuel, purchased power or other highly variable expenses will be recovered
may be subject to material delays due to second-guessing of spending decisions by regulators or due to political intervention. Recovery of costs
related to capital investments may be subject to delays that are material to the issuer, or may be likely to discourage some important investment.
The expectation that fuel, purchased power or other highly variable expenses will be recovered
may be subject to extensive delays due to second-guessing of spending decisions by regulators or due to political intervention. Recovery of costs
related to capital investments may be uncertain, subject to delays that are extensive, or that may
be likely to discourage even necessary investment.
Note: Tariff formulas include formula rate plans as well as trackers and riders related to capital investment.
Docket No. E002/GR-21-630 Exhibit___(PAJ-1), Schedule 9
Page 31 of 51

32 JUNE 23, 2017
RATING METHODOLOGY: REGULATED ELECTRIC AND GAS UTILITIES
INFRASTRUCTURE
Factor 2b: Sufficiency of Rates and Returns (12.5%)
Aaa Aa A Baa
Sufficiency of rates to cover costs and attract capital is (and will continue to be)
unquestioned.
Rates are (and we expect will continue to be) set at a level that permits full cost recovery and a fair return on all investments, with minimal challenges
by regulators to companies’ cost assumptions. This will translate to returns (measured in relation
to equity, total assets, rate base or regulatory asset value, as applicable) that are strong relative
to global peers.
Rates are (and we expect will continue to be) set at a level that generally provides
full cost recovery and a fair return on investments, with limited instances of
regulatory challenges and disallowances. In general, this will translate to returns (measured in relation to equity, total
assets, rate base or regulatory asset value, as applicable) that are generally above
average relative to global peers, but may at times be average.
Rates are (and we expect will continue to be) set at a level that generally provides full operating cost recovery and a mostly fair
return on investments, but there may be somewhat more instances of regulatory challenges and disallowances, although ultimate rate
outcomes are sufficient to attract capital without difficulty. In general, this will translate to returns (measured in relation to equity, total assets, rate base or regulatory asset value, as applicable) that are average relative to global peers, but may at times be somewhat
below average.
Ba B Caa
Rates are (and we expect will continue to be) set at a level that generally provides recovery
of most operating costs but return on investments may be less predictable, and there may be decidedly more instances of
regulatory challenges and disallowances, but ultimate rate outcomes are generally
sufficient to attract capital. In general, this will translate to returns (measured in relation to equity, total assets, rate base or regulatory asset value, as applicable) that are generally
below average relative to global peers, or where allowed returns are average but
difficult to earn. Alternately, the tariff formula may not take
into account all cost components and/or remuneration of investments may be unclear
or at times unfavorable.
We expect rates will be set at a level that at times fails to provide recovery of costs other than cash costs, and regulators may engage in somewhat
arbitrary second-guessing of spending decisions or deny rate increases related to funding ongoing
operations based much more on politics than on prudency reviews. Return on investments may be
set at levels that discourage investment. We expect that rate outcomes may be difficult or
uncertain, negatively affecting continued access to capital.
Alternately, the tariff formula may fail to take into account significant cost components other than cash costs, and/or remuneration of investments
may be generally unfavorable.
We expect rates will be set at a level that often fails to provide recovery of material costs, and recovery of cash costs may also be at risk. Regulators may engage in more
arbitrary second-guessing of spending decisions or deny rate increases related to
funding ongoing operations based primarily on politics. Return on
investments may be set at levels that discourage necessary maintenance investment. We expect that rate
outcomes may often be punitive or highly uncertain, with a markedly negative
impact on access to capital. Alternately, the tariff formula may fail to take into
account significant cash cost components, and/or remuneration of investments may
be primarily unfavorable.
Docket No. E002/GR-21-630 Exhibit___(PAJ-1), Schedule 9
Page 32 of 51
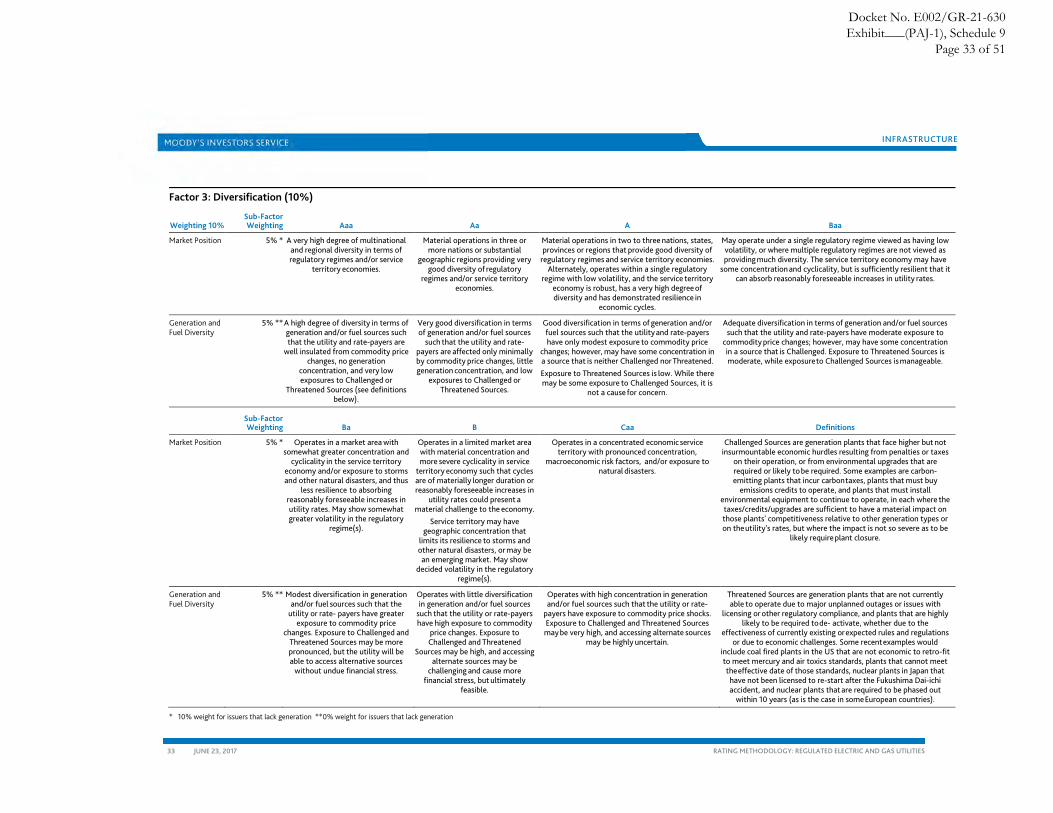
33 JUNE 23, 2017
RATING METHODOLOGY: REGULATED ELECTRIC AND GAS UTILITIES
INFRASTRUCTURE
Factor 3: Diversification (10%)
Weighting 10% Sub-Factor Weighting Aaa Aa A Baa
Market Position 5% * A very high degree of multinational and regional diversity in terms of regulatory regimes and/or service
territory economies.
Material operations in three or more nations or substantial
geographic regions providing very good diversity of regulatory
regimes and/or service territory economies.
Material operations in two to three nations, states, provinces or regions that provide good diversity of
regulatory regimes and service territory economies. Alternately, operates within a single regulatory
regime with low volatility, and the service territory economy is robust, has a very high degree of diversity and has demonstrated resilience in
economic cycles.
May operate under a single regulatory regime viewed as having low volatility, or where multiple regulatory regimes are not viewed as providing much diversity. The service territory economy may have
some concentration and cyclicality, but is sufficiently resilient that it can absorb reasonably foreseeable increases in utility rates.
Generation and Fuel Diversity
5% ** A high degree of diversity in terms of generation and/or fuel sources such that the utility and rate-payers are
well insulated from commodity price changes, no generation
concentration, and very low exposures to Challenged or
Threatened Sources (see definitions below).
Very good diversification in terms of generation and/or fuel sources
such that the utility and rate-payers are affected only minimally by commodity price changes, little generation concentration, and low
exposures to Challenged or Threatened Sources.
Good diversification in terms of generation and/or fuel sources such that the utility and rate-payers have only modest exposure to commodity price
changes; however, may have some concentration in a source that is neither Challenged nor Threatened. Exposure to Threatened Sources is low. While there may be some exposure to Challenged Sources, it is
not a cause for concern.
Adequate diversification in terms of generation and/or fuel sources such that the utility and rate-payers have moderate exposure to
commodity price changes; however, may have some concentration in a source that is Challenged. Exposure to Threatened Sources is moderate, while exposure to Challenged Sources is manageable.
Sub-Factor Weighting Ba B Caa Definitions
Market Position 5% * Operates in a market area with somewhat greater concentration and
cyclicality in the service territory economy and/or exposure to storms and other natural disasters, and thus
less resilience to absorbing reasonably foreseeable increases in utility rates. May show somewhat greater volatility in the regulatory
regime(s).
Operates in a limited market area with material concentration and more severe cyclicality in service
territory economy such that cycles are of materially longer duration or reasonably foreseeable increases in
utility rates could present a material challenge to the economy.
Service territory may have geographic concentration that
limits its resilience to storms and other natural disasters, or may be an emerging market. May show
decided volatility in the regulatory regime(s).
Operates in a concentrated economic service territory with pronounced concentration,
macroeconomic risk factors, and/or exposure to natural disasters.
Challenged Sources are generation plants that face higher but not insurmountable economic hurdles resulting from penalties or taxes
on their operation, or from environmental upgrades that are required or likely to be required. Some examples are carbon-emitting plants that incur carbon taxes, plants that must buy
emissions credits to operate, and plants that must install environmental equipment to continue to operate, in each where the taxes/credits/upgrades are sufficient to have a material impact on those plants' competitiveness relative to other generation types or on the utility's rates, but where the impact is not so severe as to be
likely require plant closure.
Generation and Fuel Diversity
5% ** Modest diversification in generation and/or fuel sources such that the
utility or rate- payers have greater exposure to commodity price
changes. Exposure to Challenged and Threatened Sources may be more pronounced, but the utility will be able to access alternative sources
without undue financial stress.
Operates with little diversification in generation and/or fuel sources
such that the utility or rate-payers have high exposure to commodity
price changes. Exposure to Challenged and Threatened
Sources may be high, and accessing alternate sources may be
challenging and cause more financial stress, but ultimately
feasible.
Operates with high concentration in generation and/or fuel sources such that the utility or rate-
payers have exposure to commodity price shocks. Exposure to Challenged and Threatened Sources may be very high, and accessing alternate sources
may be highly uncertain.
Threatened Sources are generation plants that are not currently able to operate due to major unplanned outages or issues with
licensing or other regulatory compliance, and plants that are highly likely to be required to de- activate, whether due to the
effectiveness of currently existing or expected rules and regulations or due to economic challenges. Some recent examples would
include coal fired plants in the US that are not economic to retro-fit to meet mercury and air toxics standards, plants that cannot meet the effective date of those standards, nuclear plants in Japan that have not been licensed to re-start after the Fukushima Dai-ichi accident, and nuclear plants that are required to be phased out
within 10 years (as is the case in some European countries).
* 10% weight for issuers that lack generation **0% weight for issuers that lack generation
Docket No. E002/GR-21-630 Exhibit___(PAJ-1), Schedule 9
Page 33 of 51

34 JUNE 23, 2017
RATING METHODOLOGY: REGULATED ELECTRIC AND GAS UTILITIES
INFRASTRUCTURE
Factor 4: Financial Strength
Weighting 40% Sub-Factor Weighting Aaa Aa A Baa Ba B Caa
CFO pre-WC + Interest / Interest
7.5% ≥ 8x 6x - 8x 4.5x - 6x 3x - 4.5x 2x - 3x 1x - 2x < 1x
CFO pre-WC / Debt 15% Standard Grid ≥ 40% 30% - 40% 22% - 30% 13% - 22% 5% - 13% 1% - 5% < 1%
Low Business Risk Grid ≥ 38% 27% - 38% 19% - 27% 11% - 19% 5% - 11% 1% - 5% < 1%
CFO pre-WC - Dividends / Debt 10% Standard Grid ≥ 35% 25% - 35% 17% - 25% 9% - 17% 0% - 9% (5%) - 0% < (5%)
Low Business Risk Grid ≥ 34% 23% - 34% 15% - 23% 7% - 15% 0% - 7% (5%) - 0% < (5%)
Debt / Capitalization 7.5% Standard Grid < 25% 25% - 35% 35% - 45% 45% - 55% 55% - 65% 65% - 75% ≥ 75%
Low Business Risk Grid < 29% 29% - 40% 40% - 50% 50% - 59% 59% - 67% 67% - 75% ≥ 75%
Docket No. E002/GR-21-630 Exhibit___(PAJ-1), Schedule 9
Page 34 of 51

INFRASTRUCTURE
35 JUNE 23, 2017
RATING METHODOLOGY: REGULATED ELECTRIC AND GAS UTILITIES
Appendix B: Approach to Ratings within a Utility Family
Typical Composition of a Utility Family
A typical utility company structure consists of a holding company (“HoldCo”) that owns one or more operating subsidiaries (each an “OpCo”). OpCos may be regulated utilities or non-utility companies. Financing of these entities varies by region, in part due to the regulatory framework. A HoldCo typically has no operations – its assets are mostly limited to its equity interests in subsidiaries, and potentially other investments in subsidiaries or minority interests in other companies. However, in certain cases there may be material operations at the HoldCo level. Financing can occur primarily at the OpCo level, primarily at the HoldCo level, or at both HoldCo and OpCos in varying proportions. When a HoldCo has multiple utility OpCos, they will often be located in different regulatory jurisdictions. A HoldCo may have both levered and unlevered OpCos.
General Approach to a Utility Family
In our analysis, we generally consider the stand-alone credit profile of an OpCo and the credit profile of its ultimate parent HoldCo (and any intermediate HoldCos), as well as the profile of the family as a whole, while acknowledging that these elements can have cross-family credit implications in varying degrees, principally based on the regulatory framework of the OpCos and the financing model (which has often developed in response to the regulatory framework).
In addition to considering individual OpCos under this (or another applicable) methodology, we typically16 approach a HoldCo rating by assessing the qualitative and quantitative factors in this methodology for the consolidated entity and each of its utility subsidiaries. Ratings of individual entities in the issuer family may be pulled up or down based on the interrelationships among the companies in the family and their relative credit strength.
In considering how closely aligned or how differentiated ratings should be among members of a utility family, we assess a variety of factors, including:
» Regulatory or other barriers to cash movement among OpCos and from OpCos to HoldCo
» Differentiation of the regulatory frameworks of the various OpCos
» Specific ring-fencing provisions at particular OpCos
» Financing arrangements – for instance, each OpCo may have its own financing arrangements, or the sole liquidity facility may be at the parent; there may be a liquidity pool among certain but not all members of the family; certain members of the family may better be able to withstand a temporary hiatus of external liquidity or access to capital markets
» Financial covenants and the extent to which an Event of Default by one OpCo limits availability of liquidity to another member of the family
» The extent to which higher leverage at one entity increases default risk for other members of the family
» An entity’s exposure to or insulation from an affiliate with high business risk
» Structural features or other limitations in financing agreements that restrict movements of funds, investments, provision of guarantees or collateral, etc.
» The relative size and financial significance of any particular OpCo to the HoldCo and the family
16 See paragraph at the end of this section for approaches to Hybrid HoldCos.
Docket No. E002/GR-21-630 Exhibit___(PAJ-1), Schedule 9
Page 35 of 51

INFRASTRUCTURE
36 JUNE 23, 2017
RATING METHODOLOGY: REGULATED ELECTRIC AND GAS UTILITIES
See also those factors noted in Notching for Structural Subordination of Holding Companies.
Our approach to a Hybrid HoldCo (see definition in Appendix C) depends in part on the importance of its non-utility operations and the availability of information on individual businesses. If the businesses are material and their individual results are fully broken out in financial disclosures, we may be able to assess each material business individually by reference to the relevant Moody’s methodologies to arrive at a composite assessment for the combined businesses. If non-utility operations are material but are not broken out in financial disclosures, we may look at the consolidated entity under more than one methodology. When non-utility operations are less material but could still impact the overall credit profile, the difference in business risks and our estimation of their impact on financial performance will be qualitatively incorporated in the rating.
Higher Barriers to Cash Movement with Financing Predominantly at the OpCos
Where higher barriers to cash movement exist on an OpCo or OpCos due the regulatory framework or debt structural features, ratings among family members are likely to be more differentiated. For instance, for utility families with OpCos in the US, where regulatory barriers to free cash movement are relatively high, greater importance is generally placed on the stand-alone credit profile of the OpCo.
Our observation of major defaults and bankruptcies in the US sector generally corroborates a view that regulation creates a degree of separateness of default probability. For instance, Portland General Electric (Baa1 RUR-up) did not default on its securities, even though its then-parent Enron Corp. entered bankruptcy proceedings. When Entergy New Orleans (Ba2 stable) entered into bankruptcy, the ratings of its affiliates and parent Entergy Corporation (Baa3 stable) were unaffected. PG&E Corporation (Baa1 stable) did not enter bankruptcy proceedings despite bankruptcies of two major subsidiaries - Pacific Gas & Electric Company (A3 stable) in 2001 and National Energy Group in 2003.
The degree of separateness may be greater or smaller and is assessed on a case by case basis, because situational considerations are important. One area we consider is financing arrangements. For instance, there will tend to be greater differentiation if each member of a family has its own bank credit facilities and difficulties experienced by one entity would not trigger events of default for other entities. While the existence of a money pool might appear to reduce separateness between the participants, there may be regulatory barriers within money pools that preserve separateness. For instance, non-utility entities may have access to the pool only as a borrower, only as a lender, and even the utility entities may have regulatory limits on their borrowings from the pool or their credit exposures to other pool members. If the only source of external liquidity for a money pool is borrowings by the HoldCo under its bank credit facilities, there would be less separateness, especially if the utilities were expected to depend on that liquidity source. However, the ability of an OpCo to finance itself by accessing capital markets must also be considered. Inter-company tax agreements can also have an impact on our view of how separate the risks of default are.
For a HoldCo, the greater the regulatory, economic, and geographic diversity of its OpCos, the greater its potential separation from the default probability of any individual subsidiary. Conversely, if a HoldCo’s actions have made it clear that the HoldCo will provide support for an OpCo encountering some financial stress (for instance, due to delays and/or cost over-runs on a major construction project), we would be likely to perceive less separateness.
Even where high barriers to cash movement exist, onerous leverage at a parent company may not only give rise to greater notching for structural subordination at the parent, it may also pressure an OpCo’s rating, especially when there is a clear dependence on an OpCo’s cash flow to service parent debt.
Docket No. E002/GR-21-630 Exhibit___(PAJ-1), Schedule 9
Page 36 of 51

INFRASTRUCTURE
37 JUNE 23, 2017
RATING METHODOLOGY: REGULATED ELECTRIC AND GAS UTILITIES
While most of the regulatory barriers to cash movement are very real, they are not absolute. Furthermore, while it is not usually in the interest of an insolvent parent or its creditors to bring an operating utility into a bankruptcy proceeding, such an occurrence is not impossible.
The greatest separateness occurs where strong regulatory insulation is supplemented by effective ring- fencing provisions that fully separate the management and operations of the OpCo from the rest of the family and limit the parent’s ability to cause the OpCo to commence bankruptcy proceedings as well as limiting dividends and cash transfers. Typically, most entities in US utility families (including HoldCos and OpCos) are rated within 3 notches of each other. However, it is possible for the HoldCo and OpCos in a family to have much wider notching due to the combination of regulatory imperatives and strong ring-fencing that includes a significant minority shareholder who must agree to important corporate decisions, including a voluntary bankruptcy filing.
Lower Barriers to Cash Movement with Financing Predominantly at the OpCos
Our approach to rating issuers within a family where there are lower regulatory barriers to movement of cash from OpCos to HoldCos (e.g., many parts of Asia and Europe) places greater emphasis on the credit profile of the consolidated group. Individual OpCos are considered based on their individual characteristics and their importance to the family, and their assigned ratings are typically banded closely around the consolidated credit profile of the group due to the expectation that cash will transit relatively freely among family entities.
Some utilities may have OpCos in jurisdictions where cash movement among certain family members is more restricted by the regulatory framework, while cash movement from and/or among OpCos in other jurisdictions is less restricted. In these situations, OpCos with more restrictions may vary more widely from the consolidated credit profile while those with fewer restrictions may be more tightly banded around the other entities in the corporate family group.
Docket No. E002/GR-21-630 Exhibit___(PAJ-1), Schedule 9
Page 37 of 51

INFRASTRUCTURE
38 JUNE 23, 2017
RATING METHODOLOGY: REGULATED ELECTRIC AND GAS UTILITIES
Appendix C: Brief Descriptions of the Types of Companies Rated Under This Methodology
The following describes the principal categories of companies rated under this methodology:
Vertically Integrated Utility: Vertically integrated utilities are regulated electric or combination utilities (see below) that own generation, distribution and (in most cases) electric transmission assets. Vertically integrated utilities are generally engaged in all aspects of the electricity business. They build power plants, procure fuel, generate power, build and maintain the electric grid that delivers power from a group of power plants to end-users (including high and low voltage lines, transformers and substations), and generally meet all of the electric needs of the customers in a specific geographic area (also called a service territory). The rates or tariffs for all of these monopolistic activities are set by the relevant regulatory authority.
Transmission & Distribution Utility: Transmission & Distribution utilities (T&Ds) typically operate in deregulated markets where generation is provided under a competitive framework. T&Ds own and operate the electric grid that transmits and/or distributes electricity within a specific state or region.
T&Ds provide electrical transportation and distribution services to carry electricity from power plants and transmission lines to retail, commercial, and industrial customers. T&Ds are typically responsible for billing customers for electric delivery and/or supply, and most have an obligation to provide a standard supply or provider-of-last-resort (POLR) service to customers that have not switched to a competitive supplier. These factors distinguish T&Ds from Networks, whose customers are retail electric suppliers and/or other electricity companies. In a smaller number of cases, T&Ds rated under this methodology may not have an obligation to provide POLR services, but are regulated in sub- sovereign jurisdictions. The rates or tariffs for these monopolistic T&D activities are set by the relevant regulatory authority.
Local Gas Distribution Company: Distribution is the final step in delivering natural gas to customers. While some large industrial, commercial, and electric generation customers receive natural gas directly from high capacity pipelines that carry gas from gas producing basins to areas where gas is consumed, most other users receive natural gas from their local gas utility, also called a local distribution company (LDC). LDCs are regulated utilities involved in the delivery of natural gas to consumers within a specific geographic area. Specifically, LDCs typically transport natural gas from delivery points located on large-diameter pipelines (that usually operate at fairly high pressure) to households and businesses through thousands of miles of small-diameter distribution pipe (that usually operate at fairly low pressure). LDCs are typically responsible for billing customers for gas delivery and/or supply, and most also have the responsibility to procure gas for at least some of their customers, although in some markets gas supply to all customers is on a competitive basis. These factors distinguish LDCs from gas networks, whose customers are retail gas suppliers and/or other natural gas companies. The rates or tariffs for these monopolistic activities are set by the relevant regulatory authority.
Integrated Gas Utility: Integrated gas regulated utilities are regulated utilities that deliver gas to all end users in a particular service territory by sourcing the commodity; operating transport infrastructure that often combines high pressure pipelines with low pressure distribution systems and, in some cases, gas storage, re-gasification or other related facilities; and performing other supply-related activities, such as customer billing and metering. The rates or tariffs for the totality of these activities are set by the relevant regulatory authority. Many integrated gas utilities are national in scope.
Combination Utility: Combination utilities are those that combine an LDC or Integrated Gas Utility with either a vertically integrated utility or a T&D utility. The rates or tariffs for these monopolistic activities are set by the relevant regulatory authority.
Docket No. E002/GR-21-630 Exhibit___(PAJ-1), Schedule 9
Page 38 of 51

INFRASTRUCTURE
39 JUNE 23, 2017
RATING METHODOLOGY: REGULATED ELECTRIC AND GAS UTILITIES
Regulated Generation Utility: Regulated generation utilities (Regulated Gencos) are utilities that almost exclusively have generation assets, but their activities are generally regulated like those of vertically integrated utilities. In the US, this means that the purchasers of their output (typically other investor-owned, municipal or cooperative utilities) pay a regulated rate based on the total allowed costs of the Regulated Genco, including a return on equity based on a capital structure designated by the regulator (primarily FERC). Companies that have been included in this group include certain generation companies (including in Korea and China) that are not rate regulated in the usual sense of recovering costs plus a regulated rate of return on either equity or asset value. Instead, we have looked at a combination of governmental action with respect to setting feed-in tariffs and directives on how much generation will be built (or not built) in combination with a generally high degree of government ownership, and we have concluded that these companies are currently best rated under this methodology. Future evolution in our view of the operating and/or regulatory environment of these companies could lead us to conclude that they may be more appropriately rated under a related methodology (for example, Unregulated Utilities and Power Companies).
Independent System Operator: An Independent System Operator (ISO) is an organization formed in certain regional electricity markets to act as the sole chief coordinator of an electric grid. In the areas where an ISO is established, it coordinates, controls and monitors the operation of the electrical power system to assure that electric supply and demand are balanced at all times, and, to the extent possible, that electric demand is met with the lowest-cost sources. ISOs seek to assure adequate transmission and generation resources, usually by identifying new transmission needs and planning for a generation reserve margin above expected peak demand. In regions where generation is competitive, they also seek to establish rules that foster a fair and open marketplace, and they may conduct price-setting auctions for energy and/or capacity. The generation resources that an ISO coordinates may belong to vertically integrated utilities or to independent power producers. ISOs may not be rate-regulated in the traditional sense, but fall under governmental oversight. All participants in the regional grid are required to pay a fee or tariff (often volumetric) to the ISO that is designed to recover its costs, including costs of investment in systems and equipment needed to fulfill their function. ISOs may be for profit or not-for-profit entities.
In the US, most ISOs were formed at the direction or recommendation of the Federal Energy Regulatory Commission (FERC), but the ISO that operates solely in Texas falls under state jurisdiction. Some US ISOs also perform certain additional functions such that they are designated as Regional Transmission Organizations (or RTOs).
Transmission-Only Utility: Transmission-only utilities are solely focused on owning and operating transmission assets. The transmission lines these utilities own are typically high-voltage and allow energy producers to transport electric power over long distances from where it is generated (or received) to the transmission or distribution system of a T&D or vertically integrated utility. Unlike most of the other utilities rated under this methodology, transmission-only utilities primarily provide services to other utilities and ISOs. Transmission-only utilities in most parts of the world other than the US have been rated under the Regulated Networks methodology.
Utility Holding Company (Utility HoldCo): As detailed in Appendix B, regulated electric and gas utilities are often part of corporate families under a parent holding company. The operating subsidiaries of Utility HoldCos are overwhelmingly regulated electric and gas utilities.
Hybrid Holding Company (Hybrid HoldCo): Some utility families contain a mix of regulated electric and gas utilities and other types of companies, but the regulated electric and gas utilities represent the majority of the consolidated cash flows, assets and debt. The parent company is thus a Hybrid HoldCo.
Docket No. E002/GR-21-630 Exhibit___(PAJ-1), Schedule 9
Page 39 of 51

INFRASTRUCTURE
40 JUNE 23, 2017
RATING METHODOLOGY: REGULATED ELECTRIC AND GAS UTILITIES
Appendix D: Key Industry Issues Over the Intermediate Term
Political and Regulatory Issues
As highly regulated monopolistic entities, regulated utilities continually face political and regulatory risk, and managing these risks through effective outreach to key customers as well as key political and regulatory decision-makers is, or at least should be, a core competency of companies in this sector. However, larger waves of change in the political, regulatory or economic environment have the potential to cause substantial changes in the level of risk experienced by utilities and their investors in somewhat unpredictable ways.
One of the more universal risks faced by utilities currently is the compression of allowed returns. A long period of globally low interest rates, held down by monetary stimulus policies, has generally benefitted utilities, since reductions in allowed returns have been slower than reductions in incurred capital costs. Essentially all regulated utilities face a ratcheting down of allowed and/or earned returns. More difficult to predict is how regulators will respond when monetary stimulus reverses, and how well utilities will fare when fixed income investors require higher interest rates and equity investors require higher total returns and growth prospects.
The following global snapshot highlights that regulatory frameworks evolve over time. On an overall basis in the US over the past several years, we have noted some incremental positive regulatory trends, including greater use of formula rates, trackers and riders, and (primarily for natural gas utilities) de-coupling of returns from volumetric sales. In Canada, the framework has historically been viewed as predictable and stable, which has helped offset somewhat lower levels of equity in the capital structure, but the compression of returns has been relatively steep in recent years. In Japan, the regulatory authorities are working through the challenges presented by the decision to shut down virtually all of the country’s nuclear generation capacity, leading to uncertainty regarding the extent to which increased costs will be reflected in rate increases sufficient to permit returns on capital to return to prior levels. China’s regulatory framework has continued to evolve, with fairly low transparency and some time-to-time shifts in favored versus less-favored generation sources balanced by an overall state policy of assuring sustainability of the sector, adequate supply of electricity and affordability to the general public. Singapore and Hong Kong have fairly well developed and supportive regulatory frameworks despite a trend towards lower returns, whereas Malaysia, Korea and Thailand have been moving towards a more transparent regulatory framework. The Philippines is in the process of deregulating its power market, while Indian power utilities continue to grapple with structural challenges. In Latin America, there is a wide dispersion among frameworks, ranging from the more stable, long established and predictable framework in Chile to the decidedly unpredictable framework in Argentina. Generally, as Latin American economies have evolved to more stable economic policies, regulatory frameworks for utilities have also shown greater stability and predictability.
All of the other issues discussed in this section have a regulatory/political component, either as the driver of change or in reaction to changes in economic environments and market factors.
Economic and Financial Market Conditions
As regulated monopolies, electric and gas utilities have generally been quite resistant to unsettled economic and financial market conditions for several reasons. Unlike many companies that face direct market-based competition, their rates do not decrease when demand decreases. The elasticity of demand for electricity and gas is much lower than for most products in the consumer economy.
Docket No. E002/GR-21-630 Exhibit___(PAJ-1), Schedule 9
Page 40 of 51

INFRASTRUCTURE
41 JUNE 23, 2017
RATING METHODOLOGY: REGULATED ELECTRIC AND GAS UTILITIES
When financial markets are volatile, utilities often have greater capital market access than industrial companies in competitive sectors, as was the case in the 2007-2009 recession. However, regulated electric and gas utilities are by no means immune to a protracted or severe recession.
Severe economic malaise can negatively affect utility credit profiles in several ways. Falling demand for electricity or natural gas may negatively impact margins and debt service protection measures, especially when rates are designed such that a substantial portion of fixed costs is in theory recovered through volumetric charges. The decrease in demand in the 2007-2009 recession was notable in comparison to prior recessions, especially in the residential sector. Poor economic conditions can make it more difficult for regulators to approve needed rate increases or provide timely cost recovery for utilities, resulting in higher cost deferrals and longer regulatory lag. Finally, recessions can coincide with a lack of confidence in the utility sector that impacts access to capital markets for a period of time. For instance, in the Great Depression and (to a lesser extent) in the 2001 recession, access for some issuers was curtailed due to the sector’s generally higher leverage than other corporate sectors, combined with a concerns over a lack of transparency in financial reporting.
Fuel Price Volatility and the Global Impact of Shale Gas
The ability of most utilities to pass through their fuel costs to end users may insulate a utility from exposure to price volatility of these fuels, but it does not insulate consumers. Consumers and regulators complained vociferously about utility rates during the run-up in hydro-carbon prices in 2005-2008 (oil, natural gas and, to a lesser extent, coal). The steep decline in US natural gas prices since 2009, caused in large part by the development of shale gas and shale oil resources, has been a material benefit to US utilities, because many have been able to pass through substantial base rate increases during a period when all-in rates were declining. Shale hydro-carbons have also had a positive impact, albeit one that is less immediate and direct, on non-US utilities. In much of the eastern hemisphere, natural gas prices under long-term contracts have generally been tied to oil prices, but utilities and other industrial users have started to have some success in negotiating to de-link natural gas from oil. In addition, increasing US production of oil has had a noticeable impact on world oil prices, generally benefitting oil and gas users.
Not all utilities will benefit equally. Utilities that have locked in natural gas under high-priced long- term contracts that they cannot re-negotiate are negatively impacted if they cannot pass through their full contracted cost of gas, or if the high costs cause customer dissatisfaction and regulatory backlash. Utilities with large coal fleets or utilities constructing nuclear power plants may also face negative impacts on their regulatory environment, since their customers will benefit less from lower natural gas prices.
Distributed Generation Versus the Central Station Paradigm
The regulation and the financing of electric utilities are based on the premise that the current model under which electricity is generated and distributed to customers will continue essentially unchanged for many decades to come. This model, called the central station paradigm (because electricity is generated in large, centrally located plants and distributed to a large number of customers, who may in fact be hundreds of miles away), has been in place since the early part of the 20th century. The model has worked because the economies of scale inherent to very large power plants has more than offset the cost and inefficiency (through power losses) inherent to maintaining a grid for transmitting and distributing electricity to end users.
Despite rate structures that only allow recovery of invested capital over many decades (up to 60 years), utilities can attract capital because investors assume that rates will continue to be collected for at least that long a period. Regulators and politicians assume that taxes and regulatory charges levied on electricity usage will be paid by a broad swath of residences and businesses and will not materially discourage usage of
Docket No. E002/GR-21-630 Exhibit___(PAJ-1), Schedule 9
Page 41 of 51

INFRASTRUCTURE
42 JUNE 23, 2017
RATING METHODOLOGY: REGULATED ELECTRIC AND GAS UTILITIES
electricity in a way that would decrease the amount of taxes collected. A corollary assumption is that the number of customers taking electricity from the system during that period will continue to be high enough such that rates will be reasonable and generally more attractive than other alternatives. In the event that consumers were to switch en masse to alternate sources of generating or receiving power (for instance distributed generation), rates for remaining customers would either not cover the utility’s costs, or rates would need to be increased so much that more customers may be incentivized to leave the system. This scenario has been experienced in the regulated US copper wire telephone business, where rates have increased quite dramatically for users who have not switched to digital or wireless telephone service. While this scenario continues to be unlikely for the electricity sector, distributed generation, especially from solar panels, has made inroads in certain regions.
Distributed generation is any retail-scale generation, differentiated from self-generation, which generally describes a large industrial plant that builds its own reasonably large conventional power plant to meet its own needs. While some residential property owners that install distributed generation may choose to sever their connection to the local utility, most choose to remain connected, generating power into the grid when it is both feasible and economic to do so, and taking power from the grid at other times. Distributed generation is currently concentrated in roof-top photovoltaic solar panels, which have benefitted from varying levels of tax incentives in different jurisdictions.
Regulatory treatment has also varied, but some rate structures that seek to incentivize distributed renewable energy are decidedly credit negative for utilities, in particular net metering.
Under net metering, a customer receives a credit from the utility for all of its generation at the full (or nearly full) retail rate and pays only for power taken, also at the retail rate, resulting in a materially reduced monthly bill relative to a customer with no distributed generation. The distributed generation customer has no obligation to generate any particular amount of power, so the utility must stand ready to generate and deliver that customer’s full power needs at all times. Since most utility costs, including the fixed costs of financing and maintaining generation and delivery systems, are currently collected through volumetric rates, a customer owning distributed generation effectively transfers a portion of the utility’s costs of serving that customer to other customers with higher net usage, notably to customers that do not own distributed generation. The higher costs may incentivize more customers to install solar panels, thereby shifting the utility’s fixed costs to an even smaller group of rate-payers. California is an example of a state employing net solar metering in its rate structure, whereas in New Jersey, which has the second largest residential solar program in the US, utilities buy power at a price closer to their blended cost of generation, which is much lower than the retail rate.
To date, solar generation and net metering have not had a material credit impact on any utilities, but ratings could be negatively impacted if the programs were to grow and if rate structures were not amended so that each customer’s monthly bill more closely approximated the cost of serving that customer.
In our current view, the possibility that there will be a widespread movement of electric utility customers to sever themselves from the grid is remote. However, we acknowledge that new technologies, such as the development of commercially viable fuel cells and/or distributed electric storage, could disrupt materially the central station paradigm and the credit quality of the utility sector.
Nuclear Issues
Utilities with nuclear generation face unique safety, regulatory, and operational issues. The nuclear disaster at Fukushima Daiichi had a severely negative credit impact on its owner, Tokyo Electric Power Company, Incorporated, as well as all the nuclear utilities in the country. Japan previously generated about 30% of its
Docket No. E002/GR-21-630 Exhibit___(PAJ-1), Schedule 9
Page 42 of 51

INFRASTRUCTURE
43 JUNE 23, 2017
RATING METHODOLOGY: REGULATED ELECTRIC AND GAS UTILITIES
power from 50 reactors, but all are currently either idled or shut down, and utilities in the country face materially higher costs of replacement power, a credit negative.
Fukushima Daiichi also had global consequences. Germany’s response was to require that all nuclear power plants in the country be shut by 2022. Switzerland opted for a phase-out by 2031. (Most European nuclear plants are owned by companies rated under other the Unregulated Utilities and Power Companies methodology.) Even in countries where the regulatory response was more moderate, increased regulatory scrutiny has raised operating costs, a credit negative, especially in the US, where low natural gas prices have rendered certain primarily smaller nuclear plants uneconomic. Nonetheless, we view robust and independent nuclear safety regulation as a credit-positive for the industry.
Other general issues for nuclear operators include higher costs and lower reliability related to the increasing age of the fleet. In 2013, Duke Energy Florida, Inc. decided to shut permanently Crystal River Unit 3 after it determined that a de-lamination (or separation) in the concrete of the outer wall of the containment building was uneconomic to repair. San Onofre Nuclear Generating Station was closed permanently in 2013 after its owners, including Southern California Edison Company (A3, RUR-up) and San Diego Gas & Electric Company (A2, RUR-up), decided not to pursue a re-start in light of operating defects in two steam generators that had been replaced in 2010 and 2011.
Korea Hydro and Nuclear Power Company Limited and its parent, Korea Electric Power Corporation, faced a scandal related to alleged corruption and acceptance of falsified safety documents provided by its parts suppliers for nuclear plants. Korean prosecutors’ widening probe into KHNP’s use of substandard parts at many of its 23 nuclear power plants caused three plants to be shut down temporarily.
Docket No. E002/GR-21-630 Exhibit___(PAJ-1), Schedule 9
Page 43 of 51

INFRASTRUCTURE
44 JUNE 23, 2017
RATING METHODOLOGY: REGULATED ELECTRIC AND GAS UTILITIES
Appendix E: Regional and Other Considerations
Notching Considerations for US First Mortgage Bonds
In most regions, our approach to notching between different debt classes of the same regulated utility issuer follows the guidance in the publication ”Updated Summary Guidance for Notching Bonds, Preferred Stocks and Hybrid Securities of Corporate Issuers,” including a one notch differential between senior secured and senior unsecured debt.17 However, in most cases we have two notches between the first mortgage bonds and senior unsecured debt of regulated electric and gas utilities in the US.
Wider notching differentials between debt classes may also be appropriate in speculative grade. Additional insights for speculative grade issuers are provided in the publication ”Loss Given Default for Speculative-Grade Companies.”18
First mortgage bond holders in the US generally benefit from a first lien on most of the fixed assets used to provide utility service, including such assets as generating stations, transmission lines, distribution lines, switching stations and substations, and gas distribution facilities, as well as a lien on franchise agreements. In our view, the critical nature of these assets to the issuers and to the communities they serve has been a major factor that has led to very high recovery rates for this class of debt in situations of default, thereby justifying a two notch uplift. The combination of the breadth of assets pledged and the bankruptcy-tested recovery experience has been unique to the US.
In some cases, there is only a one notch differential between US first mortgage bonds and the senior unsecured rating. For instance, this is likely when the pledged property is not considered critical infrastructure for the region, or if the mortgage is materially weakened by carve-outs, lien releases or similar creditor-unfriendly terms.
Securitization
The use of securitization, a financing technique utilizing a discrete revenue stream (typically related to recovery of specifically defined expenses) that is dedicated to servicing specific securitization debt, has primarily been used in the US, where it has been quite pervasive in the past two decades. The first generation of securitization bonds were primarily related to recovery of the negative difference between the market value of utilities’ generation assets and their book value when certain states switched to competitive electric supply markets and utilities sold their generation (so-called stranded costs). This technique was then used for significant storm costs (especially hurricanes) and was eventually broadened to include environmental related expenditures, deferred fuel costs, or even deferred miscellaneous expenses. States that have implemented securitization frameworks include Arkansas, California, Connecticut, Illinois, Louisiana, Maryland, Massachusetts, Mississippi, New Hampshire, New Jersey, Ohio, Pennsylvania, Texas and West Virginia. In its simplest form, a securitization isolates and dedicates a stream of cash flow into a separate special purpose entity (SPE). The SPE uses that stream of revenue and cash flow to provide annual debt service for the securitized debt instrument. Securitization is typically underpinned by specific legislation to segregate the securitization revenues from the utility’s revenues to assure their continued collection, and the details of the enabling legislation may vary from state to state. The utility benefits from the securitization because it receives an immediate source of cash (although it gives up the opportunity to earn a return on the corresponding asset), and ratepayers benefit because the cost of the securitized debt is
17 A link to this and other sector and cross-sector credit rating methodologies can be found in the Related Research section of this report. 18 A link to this and other sector and cross-sector credit rating methodologies can be found in the Related Research section of this report,
Docket No. E002/GR-21-630 Exhibit___(PAJ-1), Schedule 9
Page 44 of 51

INFRASTRUCTURE
45 JUNE 23, 2017
RATING METHODOLOGY: REGULATED ELECTRIC AND GAS UTILITIES
lower than the utility’s cost of debt and much lower than its all-in cost of capital, which reduces the revenue requirement associated with the cost recovery.
In the presentation of US securitization debt in published financial ratios, we make our own assessment of the appropriate credit representation but in most cases follows the accounting in audited statements under US Generally Accepted Accounting Principles (GAAP), which in turn considers the terms of enabling legislation. As a result, accounting treatment may vary. In most states utilities have been required to consolidate securitization debt under GAAP, even though it is technically non- recourse.
In general, we view securitization debt of utilities as being on-credit debt, in part because the rates associated with it reduce the utility’s headroom to increase rates for other purposes while keeping all-in rates affordable to customers. Thus, where accounting treatment is off balance sheet, we seek to adjust the company’s ratios by including the securitization debt and related revenues for our analysis. Where the securitized debt is on balance sheet, our credit analysis also considers the significance of ratios that exclude securitization debt and related revenues. Since securitization debt amortizes mortgage-style, including it makes ratios look worse in early years (when most of the revenue collected goes to pay interest) and better in later years (when most of the revenue collected goes to pay principal).
Strong levels of government ownership in Asia Pacific (ex-Japan) provide rating uplift
Strong levels of government ownership have dominated the credit profiles of utilities in Asia Pacific (excluding Japan), generally leading to ratings that are a number of notches above the Baseline Credit Assessment. Regulated electric and gas utilities with significant government ownership are rated using this methodology in conjunction with the Joint Default Analysis approach in our methodology for Government-Related Issuers.19
Support system for large corporate entities in Japan can provide ratings uplift, with limits
Our ratings for large corporate entities in Japan reflect the unique nature of the country’s support system, and they are higher than they would otherwise be if such support were disregarded. This is reflected in the tendency for ratings of Japanese utilities to be higher than their grid implied ratings. However, even for large prominent companies, our ratings consider that support will not be endless and is less likely to be provided when a company has questionable viability rather than being in need of temporary liquidity assistance.
19 A link to this and other sector and cross-sector credit rating methodologies can be found in the Related Research section of this report.
Docket No. E002/GR-21-630 Exhibit___(PAJ-1), Schedule 9
Page 45 of 51

INFRASTRUCTURE
46 JUNE 23, 2017
RATING METHODOLOGY: REGULATED ELECTRIC AND GAS UTILITIES
Appendix F: Treatment of Power Purchase Agreements (“PPAs”)
Although many utilities own and operate power stations, some have entered into PPAs to source electricity from third parties to satisfy retail demand. The motivation for these PPAs may be one or more of the following: to outsource operating risks to parties more skilled in power station operation, to provide certainty of supply, to reduce balance sheet debt, to fix the cost of power, or to comply with regulatory mandates regarding power sourcing, including renewable portfolio standards. While we regard PPAs that reduce operating or financial risk as a credit positive, some aspects of PPAs may negatively affect the credit of utilities. The most conservative treatment would be to treat a PPA as a debt obligation of the utility as, by paying the capacity charge, the utility is effectively providing the funds to service the debt associated with the power station. At the other end of the continuum, the financial obligations of the utility could also be regarded as an ongoing operating cost, with no long-term capital component recognized.
Under most PPAs, a utility is obliged to pay a capacity charge to the power station owner (which may be another utility or an Independent Power Producer – IPP); this charge typically covers a portion of the IPP’s fixed costs in relation to the power available to the utility. These fixed payments usually help to cover the IPP’s debt service and are made irrespective of whether the utility calls on the IPP to generate and deliver power. When the utility requires generation, a further energy charge, to cover the variable costs of the IPP, will also typically be paid by the utility. Some other similar arrangements are characterized as tolling agreements, or long-term supply contracts, but most have similar features to PPAs and are thus we analyze them as PPAs.
PPAs are recognized qualitatively to be a future use of cash whether or not they are treated as debt-like obligations in financial ratios
The starting point of our analysis is the issuer’s audited financial statements – we consider whether the utility’s accountants determine that the PPA should be treated as a debt equivalent, a capitalized lease, an operating lease, or in some other manner. PPAs have a wide variety of operational and financial terms, and it is our understanding that accountants are required to have a very granular view into the particular contractual arrangements in order to account for these PPAs in compliance with applicable accounting rules and standards. However, accounting treatment for PPAs may not be entirely consistent across US GAAP, IFRS or other accounting frameworks. In addition, we may consider that factors not incorporated into the accounting treatment may be relevant (which may include the scale of PPA payments, their regulatory treatment including cost recovery mechanisms, or other factors that create financial or operational risk for the utility that is greater, in our estimation, than the benefits received). When the accounting treatment of a PPA is a debt or lease equivalent (such that it is reported on the balance sheet, or disclosed as an operating lease and thus included in our adjusted debt calculation), we generally do not make adjustments to remove the PPA from the balance sheet.
However, in relevant circumstances we consider making adjustments that impute a debt equivalent to PPAs that are off-balance sheet for accounting purposes.
Regardless of whether we consider that a PPA warrants or does not warrant treatment as a debt obligation, we assess the totality of the impact of the PPA on the issuer’s probability of default. Costs of a PPA that cannot be recovered in retail rates creates material risk, especially if they also cannot be recovered through market sales of power.
Docket No. E002/GR-21-630 Exhibit___(PAJ-1), Schedule 9
Page 46 of 51

INFRASTRUCTURE
47 JUNE 23, 2017
RATING METHODOLOGY: REGULATED ELECTRIC AND GAS UTILITIES
Additional considerations for PPAs
PPAs have a wide variety of financial and regulatory characteristics, and each particular circumstance may be treated differently by Moody’s. Factors which determine where on the continuum we treat a particular PPA include the following:
» Risk management: An overarching principle is that PPAs have normally been used by utilities as a risk management tool and we recognize that this is the fundamental reason for their existence. Thus, we will not automatically penalize utilities for entering into contracts for the purpose of reducing risk associated with power price and availability. Rather, we will look at the aggregate commercial position, evaluating the risk to a utility’s purchase and supply obligations. In addition, PPAs are similar to other long-term supply contracts used by other industries and their treatment should not therefore be fundamentally different from that of other contracts of a similar nature.
» Pass-through capability: Some utilities have the ability to pass through the cost of purchasing power under PPAs to their customers. As a result, the utility takes no risk that the cost of power is greater than the retail price it will receive. Accordingly we regard these PPA obligations as operating costs with no long-term debt-like attributes. PPAs with no pass-through ability have a greater risk profile for utilities. In some markets, the ability to pass through costs of a PPA is enshrined in the regulatory framework, and in others can be dictated by market dynamics. As a market becomes more competitive or if regulatory support for cost recovery deteriorates, the ability to pass through costs may decrease and, as circumstances change, our treatment of PPA obligations will alter accordingly.
» Price considerations: The price of power paid by a utility under a PPA can be substantially above or below the market price of electricity. A below-market price will motivate the utility to purchase power from the IPP in excess of its retail requirements, and to sell excess electricity in the spot market. This can be a significant source of cash flow for some utilities. On the other hand, utilities that are compelled to pay capacity payments to IPPs when they have no demand for the power or at an above-market price may suffer a financial burden if they do not get full recovery in retail rates. We will focus particularly on PPAs that have mark-to-market losses, which typically indicates that they have a material impact on the utility’s cash flow.
» Excess Reserve Capacity: In some jurisdictions there is substantial reserve capacity and thus a significant probability that the electricity available to a utility under PPAs will not be required by the market. This increases the risk to the utility that capacity payments will need to be made when there is no demand for the power. We may determine that all of a utility’s PPAs represent excess capacity, or that a portion of PPAs are needed for the utility’s supply obligations plus a normal reserve margin, while the remaining portion represents excess capacity. In the latter case, we may impute debt to specific PPAs that are excess or take a proportional approach to all of the utility’s PPAs.
» Risk-sharing: Utilities that own power plants bear the associated operational, fuel procurement and other risks. These must be balanced against the financial and liquidity risk of contracting for the purchase of power under a PPA. We will examine on a case-by case basis the relative credit risk associated with PPAs in comparison to plant ownership.
» Purchase requirements: Some PPAs are structured with either options or requirements to purchase the asset at the end of the PPA term. If the utility has an economically meaningful requirement to purchase, we would most likely consider it to be a debt obligation. In most such cases, the obligation would already receive on-balance sheet treatment under relevant accounting standards.
» Default provisions: In most cases, the remedies for default under a PPA do not include acceleration of amounts due, and in many cases PPAs would not be considered as debt in a bankruptcy scenario and could potentially be cancelled. Thus, PPAs may not materially increase Loss Given Default for the
Docket No. E002/GR-21-630 Exhibit___(PAJ-1), Schedule 9
Page 47 of 51

INFRASTRUCTURE
48 JUNE 23, 2017
RATING METHODOLOGY: REGULATED ELECTRIC AND GAS UTILITIES
utility. In addition, PPAs are not typically considered debt for cross- default provisions under a utility’s debt and liquidity arrangements. However, the existence of non-standard default provisions that are debt-like would have a large impact on our treatment of a PPA. In addition, payments due under PPAs are senior unsecured obligations, and any inability of the utility to make them materially increases default risk.
Each of these factors will be considered by our analysts and a decision will be made as to the importance of the PPA to the risk analysis of the utility.
Methods for estimating a liability amount for PPAs
According to the weighting and importance of the PPA to each utility and the level of disclosure, we may approximate a debt obligation equivalent for PPAs using one or more of the methods discussed below. In each case we look holistically at the PPA’s credit impact on the utility, including the ability to pass through costs and curtail payments, the materiality of the PPA obligation to the overall business risk and cash flows of the utility, operational constraints that the PPA imposes, the maturity of the PPA obligation, the impact of purchased power on market-based power sales (if any) that the utility will engage in, and our view of future market conditions and volatility.
» Operating Cost: If a utility enters into a PPA for the purpose of providing an assured supply and there is reasonable assurance that regulators will allow the costs to be recovered in regulated rates, we may view the PPA as being most akin to an operating cost. Provided that the accounting treatment for the PPA is, in this circumstance, off-balance sheet, we will most likely make no adjustment to bring the obligation onto the utility’s balance sheet.
» Annual Obligation x 6: In some situations, the PPA obligation may be estimated by multiplying the annual payments by a factor of six (in most cases). This method is sometimes used in the capitalization of operating leases. This method may be used as an approximation where the analyst determines that the obligation is significant but cannot otherwise be quantified otherwise due to limited information.
» Net Present Value: Where the analyst has sufficient information, we may add the NPV of the stream of PPA payments to the debt obligations of the utility. The discount rate used will be our estimate of the cost of capital of the utility.
» Debt Look-Through: In some circumstances, where the debt incurred by the IPP is directly related to the off-taking utility, there may be reason to allocate the entire debt (or a proportional part related to share of power dedicated to the utility) of the IPP to that of the utility.
» Mark-to-Market: In situations in which we believe that the PPA prices exceed the market price and thus will create an ongoing liability for the utility, we may use a net mark-to-market method, in which the NPV of the utility’s future out-of-the-money net payments will be added to its total debt obligations.
» Consolidation: In some instances where the IPP is wholly dedicated to the utility, it may be appropriate to consolidate the debt and cash flows of the IPP with that of the utility. If the utility purchases only a portion of the power from the IPP, then that proportion of debt might be consolidated with the utility.
If we have determined to impute debt to a PPA for which the accounting treatment is not on-balance sheet, we will in some circumstances use more than one method to estimate the debt equivalent obligations imposed by the PPA, and compare results. If circumstances (including regulatory treatment or market conditions) change over time, the approach that is used may also vary.
Docket No. E002/GR-21-630 Exhibit___(PAJ-1), Schedule 9
Page 48 of 51

INFRASTRUCTURE
49 JUNE 23, 2017
RATING METHODOLOGY: REGULATED ELECTRIC AND GAS UTILITIES
Moody’s Related Research
The credit ratings assigned in this sector are primarily determined by this credit rating methodology. Certain broad methodological considerations (described in one or more credit rating methodologies) may also be relevant to the determination of credit ratings of issuers and instruments in this sector. Potentially related sector and cross-sector credit rating methodologies can be found here.
For data summarizing the historical robustness and predictive power of credit ratings assigned using this credit rating methodology, see link.
Please refer to Moody’s Rating Symbols & Definitions, which is available here, for further information. Definitions of Moody’s most common ratio terms can be found in “Moody’s Basic Definitions for Credit Statistics, User’s Guide”, accessible via this link.
Docket No. E002/GR-21-630 Exhibit___(PAJ-1), Schedule 9
Page 49 of 51

INFRASTRUCTURE
50 JUNE 23, 2017
RATING METHODOLOGY: REGULATED ELECTRIC AND GAS UTILITIES
» contacts continued from page 1
Analyst Contacts:
BUENOS AIRES +54.11.5129.2600
Daniela Cuan +54.11.5129.261 Vice President - Senior Analyst [email protected]
TORONTO +1.416.214.1635
Gavin MacFarlane +1.416.214.386 Vice President - Senior Credit Officer [email protected]
LONDON +44.20.7772.5454
Douglas Segars +44.20.7772.158 Managing Director - Infrastructure Finance [email protected]
Helen Francis +44.20.7772.542 Vice President - Senior Credit Officer [email protected]
HONG KONG +852.3551.3077
Vivian Tsang +852.375.815.3 Associate Managing Director [email protected]
SINGAPORE +65.6398.8308
Ray Tay +65.6398.830 Vice President - Senior Credit Officer [email protected]
TOKYO +81.3.5408.4100
Mihoko Manage +81.354.084.033 Associate Managing Director [email protected]
Mariko Semetko +81.354.084.20 Vice President - Senior Credit Officer [email protected]
Docket No. E002/GR-21-630 Exhibit___(PAJ-1), Schedule 9
Page 50 of 51

INFRASTRUCTURE
51 JUNE 23, 2017
RATING METHODOLOGY: REGULATED ELECTRIC AND GAS UTILITIES
Report Number: 1072530
Author Michael G. Haggarty
Production Associate Masaki Shiomi
© 2017 Moody’s Corporation, Moody’s Investors Service, Inc., Moody’s Analytics, Inc. and/or their licensors and affiliates (collectively, “MOODY’S”). All rights reserved.
CREDIT RATINGS ISSUED BY MOODY'S INVESTORS SERVICE, INC. AND ITS RATINGS AFFILIATES (“MIS”) ARE MOODY’S CURRENT OPINIONS OF THE RELATIVE FUTURE CREDIT RISK OF ENTITIES, CREDIT COMMITMENTS, OR DEBT OR DEBT-LIKE SECURITIES, AND MOODY’S PUBLICATIONS MAY INCLUDE MOODY’S CURRENT OPINIONS OF THE RELATIVE FUTURE CREDIT RISK OF ENTITIES, CREDIT COMMITMENTS, OR DEBT OR DEBT-LIKE SECURITIES. MOODY’S DEFINES CREDIT RISK AS THE RISK THAT AN ENTITY MAY NOT MEET ITS CONTRACTUAL, FINANCIAL OBLIGATIONS AS THEY COME DUE AND ANY ESTIMATED FINANCIAL LOSS IN THE EVENT OF DEFAULT. CREDIT RATINGS DO NOT ADDRESS ANY OTHER RISK, INCLUDING BUT NOT LIMITED TO: LIQUIDITY RISK, MARKET VALUE RISK, OR PRICE VOLATILITY. CREDIT RATINGS AND MOODY’S OPINIONS INCLUDED IN MOODY’S PUBLICATIONS ARE NOT STATEMENTS OF CURRENT OR HISTORICAL FACT. MOODY’S PUBLICATIONS MAY ALSO INCLUDE QUANTITATIVE MODEL-BASED ESTIMATES OF CREDIT RISK AND RELATED OPINIONS OR COMMENTARY PUBLISHED BY MOODY’S ANALYTICS, INC. CREDIT RATINGS AND MOODY’S PUBLICATIONS DO NOT CONSTITUTE OR PROVIDE INVESTMENT OR FINANCIAL ADVICE, AND CREDIT RATINGS AND MOODY’S PUBLICATIONS ARE NOT AND DO NOT PROVIDE RECOMMENDATIONS TO PURCHASE, SELL, OR HOLD PARTICULAR SECURITIES. NEITHER CREDIT RATINGS NOR MOODY’S PUBLICATIONS COMMENT ON THE SUITABILITY OF AN INVESTMENT FOR ANY PARTICULAR INVESTOR. MOODY’S ISSUES ITS CREDIT RATINGS AND PUBLISHES MOODY’S PUBLICATIONS WITH THE EXPECTATION AND UNDERSTANDING THAT EACH INVESTOR WILL, WITH DUE CARE, MAKE ITS OWN STUDY AND EVALUATION OF EACH SECURITY THAT IS UNDER CONSIDERATION FOR PURCHASE, HOLDING, OR SALE.
MOODY’S CREDIT RATINGS AND MOODY’S PUBLICATIONS ARE NOT INTENDED FOR USE BY RETAIL INVESTORS AND IT WOULD BE RECKLESS AND INAPPROPRIATE FOR RETAIL INVESTORS TO USE MOODY’S CREDIT RATINGS OR MOODY’S PUBLICATIONS WHEN MAKING AN INVESTMENT DECISION. IF IN DOUBT YOU SHOULD CONTACT YOUR FINANCIAL OR OTHER PROFESSIONAL ADVISER.
ALL INFORMATION CONTAINED HEREIN IS PROTECTED BY LAW, INCLUDING BUT NOT LIMITED TO, COPYRIGHT LAW, AND NONE OF SUCH INFORMATION MAY BE COPIED OR OTHERWISE REPRODUCED, REPACKAGED, FURTHER TRANSMITTED, TRANSFERRED, DISSEMINATED, REDISTRIBUTED OR RESOLD, OR STORED FOR SUBSEQUENT USE FOR ANY SUCH PURPOSE, IN WHOLE OR IN PART, IN ANY FORM OR MANNER OR BY ANY MEANS WHATSOEVER, BY ANY PERSON WITHOUT MOODY’S PRIOR WRITTEN CONSENT.
All information contained herein is obtained by MOODY’S from sources believed by it to be accurate and reliable. Because of the possibility of human or mechanical error as well as other factors, however, all information contained herein is provided “AS IS” without warranty of any kind. MOODY'S adopts all necessary measures so that the information it uses in assigning a credit rating is of sufficient quality and from sources MOODY'S considers to be reliable including, when appropriate, independent third-party sources. However, MOODY’S is not an auditor and cannot in every instance independently verify or validate information received in the rating process or in preparing the Moody’s publications.
To the extent permitted by law, MOODY’S and its directors, officers, employees, agents, representatives, licensors and suppliers disclaim liability to any person or entity for any indirect, special, consequential, or incidental losses or damages whatsoever arising from or in connection with the information contained herein or the use of or inability to use any such information, even if MOODY’S or any of its directors, officers, employees, agents, representatives, licensors or suppliers is advised in advance of the possibility of such losses or damages, including but not limited to: (a) any loss of present or prospective profits or (b) any loss or damage arising where the relevant financial instrument is not the subject of a particular credit rating assigned by MOODY’S.
To the extent permitted by law, MOODY’S and its directors, officers, employees, agents, representatives, licensors and suppliers disclaim liability for any direct or compensatory losses or damages caused to any person or entity, including but not limited to by any negligence (but excluding fraud, willful misconduct or any other type of liability that, for the avoidance of doubt, by law cannot be excluded) on the part of, or any contingency within or beyond the control of, MOODY’S or any of its directors, officers, employees, agents, representatives, licensors or suppliers, arising from or in connection with the information contained herein or the use of or inability to use any such information.
NO WARRANTY, EXPRESS OR IMPLIED, AS TO THE ACCURACY, TIMELINESS, COMPLETENESS, MERCHANTABILITY OR FITNESS FOR ANY PARTICULAR PURPOSE OF ANY SUCH RATING OR OTHER OPINION OR INFORMATION IS GIVEN OR MADE BY MOODY’S IN ANY FORM OR MANNER WHATSOEVER.
Moody’s Investors Service, Inc., a wholly-owned credit rating agency subsidiary of Moody’s Corporation (“MCO”), hereby discloses that most issuers of debt securities (including corporate and municipal bonds, debentures, notes and commercial paper) and preferred stock rated by Moody’s Investors Service, Inc. have, prior to assignment of any rating, agreed to pay to Moody’s Investors Service, Inc. for appraisal and rating services rendered by it fees ranging from $1,500 to approximately $2,500,000. MCO and MIS also maintain policies and procedures to address the independence of MIS’s ratings and rating processes. Information regarding certain affiliations that may exist between directors of MCO and rated entities, and between entities who hold ratings from MIS and have also publicly reported to the SEC an ownership interest in MCO of more than 5%, is posted annually at www.moodys.com under the heading “Investor Relations — Corporate Governance — Director and Shareholder Affiliation Policy.”
Additional terms for Australia only: Any publication into Australia of this document is pursuant to the Australian Financial Services License of MOODY’S affiliate, Moody’s Investors Service Pty Limited ABN 61 003 399 657AFSL 336969 and/or Moody’s Analytics Australia Pty Ltd ABN 94 105 136 972 AFSL 383569 (as applicable). This document is intended to be provided only to “wholesale clients” within the meaning of section 761G of the Corporations Act 2001. By continuing to access this document from within Australia, you represent to MOODY’S that you are, or are accessing the document as a representative of, a “wholesale client” and that neither you nor the entity you represent will directly or indirectly disseminate this document or its contents to “retail clients” within the meaning of section 761G of the Corporations Act 2001. MOODY’S credit rating is an opinion as to the creditworthiness of a debt obligation of the issuer, not on the equity securities of the issuer or any form of security that is available to retail investors. It would be reckless and inappropriate for retail investors to use MOODY’S credit ratings or publications when making an investment decision. If in doubt you should contact your financial or other professional adviser.
Additional terms for Japan only: Moody's Japan K.K. (“MJKK”) is a wholly-owned credit rating agency subsidiary of Moody's Group Japan G.K., which is wholly-owned by Moody’s Overseas Holdings Inc., a wholly-owned subsidiary of MCO. Moody’s SF Japan K.K. (“MSFJ”) is a wholly-owned credit rating agency subsidiary of MJKK. MSFJ is not a Nationally Recognized Statistical Rating Organization (“NRSRO”). Therefore, credit ratings assigned by MSFJ are Non-NRSRO Credit Ratings. Non-NRSRO Credit Ratings are assigned by an entity that is not a NRSRO and, consequently, the rated obligation will not qualify for certain types of treatment under U.S. laws. MJKK and MSFJ are credit rating agencies registered with the Japan Financial Services Agency and their registration numbers are FSA Commissioner (Ratings) No. 2 and 3 respectively.
MJKK or MSFJ (as applicable) hereby disclose that most issuers of debt securities (including corporate and municipal bonds, debentures, notes and commercial paper) and preferred stock rated by MJKK or MSFJ (as applicable) have, prior to assignment of any rating, agreed to pay to MJKK or MSFJ (as applicable) for appraisal and rating services rendered by it fees ranging from JPY200,000 to approximately JPY350,000,000.
MJKK and MSFJ also maintain policies and procedures to address Japanese regulatory requirements.
Docket No. E002/GR-21-630 Exhibit___(PAJ-1), Schedule 9
Page 51 of 51

Docket No. E002/GR-21-630 Exhibit___(PAJ-1), Schedule 10
Page 1 of 23

Docket No. E002/GR-21-630 Exhibit___(PAJ-1), Schedule 10
Page 2 of 23

Docket No. E002/GR-21-630 Exhibit___(PAJ-1), Schedule 10
Page 3 of 23

Docket No. E002/GR-21-630 Exhibit___(PAJ-1), Schedule 10
Page 4 of 23

Docket No. E002/GR-21-630 Exhibit___(PAJ-1), Schedule 10
Page 5 of 23

Docket No. E002/GR-21-630 Exhibit___(PAJ-1), Schedule 10
Page 6 of 23

Docket No. E002/GR-21-630 Exhibit___(PAJ-1), Schedule 10
Page 7 of 23
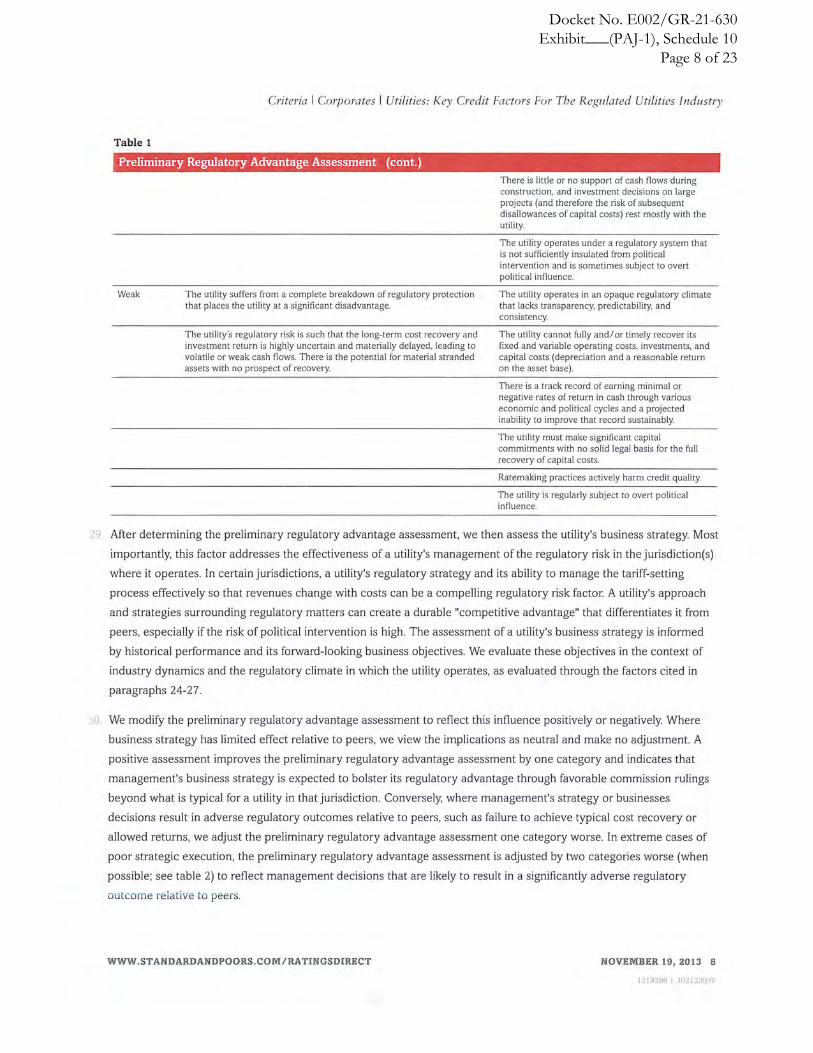
Docket No. E002/GR-21-630 Exhibit___(PAJ-1), Schedule 10
Page 8 of 23

Docket No. E002/GR-21-630 Exhibit___(PAJ-1), Schedule 10
Page 9 of 23

Docket No. E002/GR-21-630 Exhibit___(PAJ-1), Schedule 10
Page 10 of 23

Docket No. E002/GR-21-630 Exhibit___(PAJ-1), Schedule 10
Page 11 of 23

Docket No. E002/GR-21-630 Exhibit___(PAJ-1), Schedule 10
Page 12 of 23

Docket No. E002/GR-21-630 Exhibit___(PAJ-1), Schedule 10
Page 13 of 23

Docket No. E002/GR-21-630 Exhibit___(PAJ-1), Schedule 10
Page 14 of 23

Docket No. E002/GR-21-630 Exhibit___(PAJ-1), Schedule 10
Page 15 of 23

Docket No. E002/GR-21-630 Exhibit___(PAJ-1), Schedule 10
Page 16 of 23

Docket No. E002/GR-21-630 Exhibit___(PAJ-1), Schedule 10
Page 17 of 23
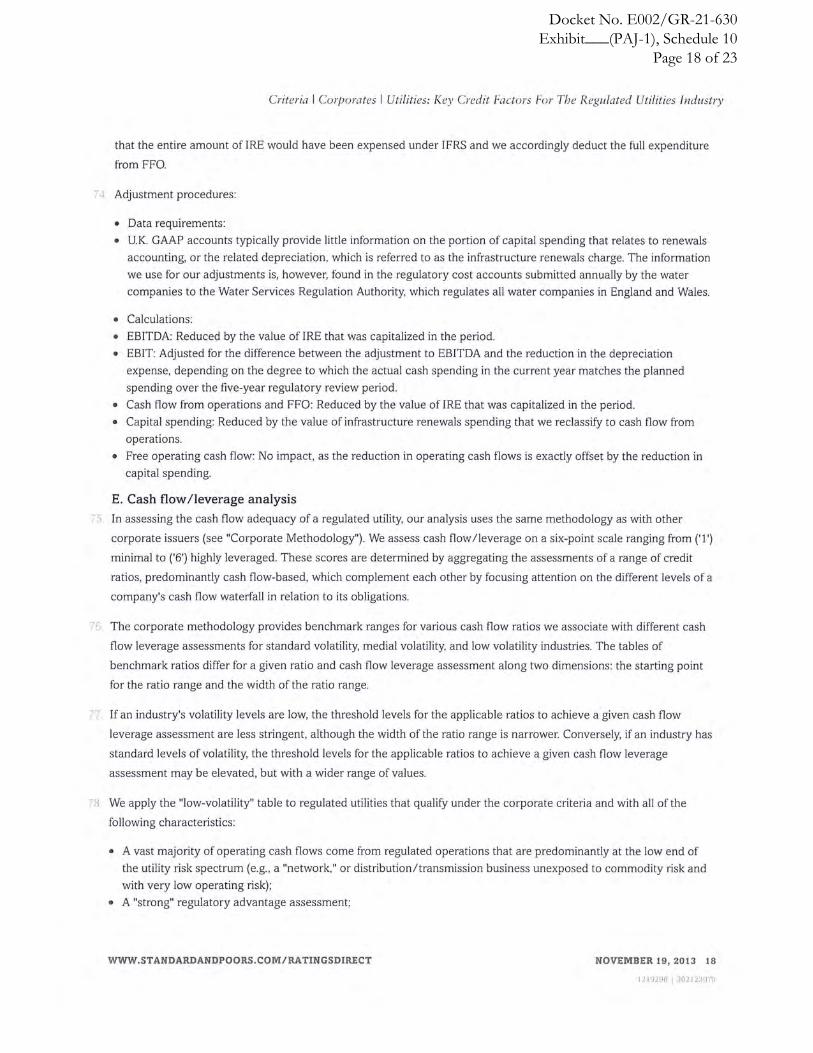
Docket No. E002/GR-21-630 Exhibit___(PAJ-1), Schedule 10
Page 18 of 23

Docket No. E002/GR-21-630 Exhibit___(PAJ-1), Schedule 10
Page 19 of 23

Docket No. E002/GR-21-630 Exhibit___(PAJ-1), Schedule 10
Page 20 of 23

Docket No. E002/GR-21-630 Exhibit___(PAJ-1), Schedule 10
Page 21 of 23

Docket No. E002/GR-21-630 Exhibit___(PAJ-1), Schedule 10
Page 22 of 23

Docket No. E002/GR-21-630 Exhibit___(PAJ-1), Schedule 10
Page 23 of 23