california comprehensive annual financial report
TRANSCRIPT

THE CITY OF
CALIFORNIA
Comprehensive Annual
Financial Report
Fiscal Year Ended
June 30, 2009

CITY OF BENICIA, CALIFORNIA
Comprehensive Annual Financial Report
Fiscal year ended June 30, 2009
Prepared by
Finance Department

CITY OF BENICIA
Comprehensive Annual Financial Report Year ended June 30, 2009
TABLE OF CONTENTS
Page
INTRODUCTORY SECTION Letter of Transmittal................................................................................................................. i List of Officials ...................................................................................................................... xi Mission Statement ................................................................................................................. xii Organization Chart ............................................................................................................... xiii City Map............................................................................................................................... xiv GFOA Certificate of Achievement.........................................................................................xv FINANCIAL SECTION Independent Auditors’ Report ..................................................................................................1 Management’s Discussion and Analysis ..................................................................................3 Basic Financial Statements: Government-wide Financial Statements: Statement of Net Assets ................................................................................................15 Statement of Activities ..................................................................................................16 Fund Financial Statements: Governmental Funds: Balance Sheet .............................................................................................................20
Reconciliation of the Balance Sheet of Governmental Funds to the Statement of Net Assets .............................................................................................21 Statement of Revenues, Expenditures and Changes in Fund Balances......................22 Reconciliation of the Statement of Revenues, Expenditures and Changes in Fund Balances of Governmental Funds to the Statement of Activities ...................23 General Fund - Schedule of Revenues and Expenditures – Budget and Actual..........24

CITY OF BENICIA
Comprehensive Annual Financial Report Year ended June 30, 2009
TABLE OF CONTENTS, (CONTINUED)
Page Proprietary Funds: Statement of Net Assets .............................................................................................26 Statement of Revenues, Expenses and Changes in Fund Net Assets .........................28 Statement of Cash Flows............................................................................................30 Fiduciary Funds: Statement of Fiduciary Net Assets .............................................................................36 Statement of Changes in Fiduciary Net Assets ..........................................................37 Notes to the Basic Financial Statements............................................................................39 Supplementary Information: Nonmajor Governmental Funds: Combining Balance Sheet .............................................................................................78 Combining Statement of Revenues, Expenditures and Changes in Fund Balances......79 Combining Balance Sheet – Special Revenue Funds....................................................80 Combining Statement of Revenues, Expenditures and Changes in Fund Balances.......... - Special Revenue Funds ............................................................................................84 Combining Balance Sheet – Debt Service Funds..........................................................88 Combining Statement of Revenues, Expenditures and Changes in Fund Balance ........... – Debt Service Funds ................................................................................................89 Combining Balance Sheet – Capital Projects Funds .....................................................90 Combining Statement of Revenues, Expenditures and Changes in Fund Balance .......... - Capital Projects Funds .............................................................................................92 Schedule of Revenues and Expenditures – Budget and Actual: Gas Tax Fund .............................................................................................................94 Residential Landscaping and Lighting District Fund.................................................95 Fleetside Lighting and Landscaping District Fund ....................................................96 Columbus Parkway Lighting and Landscaping District Fund ...................................97 East 2nd Street Lighting and Landscaping District Fund............................................98 Goodyear Road Landscaping and Lighting District Fund..........................................99 Community Development Block Grant Fund ..........................................................100 Community Services Program Fund ........................................................................101

CITY OF BENICIA
Comprehensive Annual Financial Report Year ended June 30, 2009
TABLE OF CONTENTS, (CONTINUED)
Page Library Book Fund ...................................................................................................102 Library Programs Fund ............................................................................................103 Library Measure B Fund ..........................................................................................104 Southern Pacific Depot Fund ...................................................................................105 Police and Fire Safety Grants Fund..........................................................................106 Human Services Fund ..............................................................................................107 Developer Deposits Fund .........................................................................................108 Tourtelot Mitigation Fund ........................................................................................109 Miscellaneous Grants Fund ......................................................................................110 VIP Conservation .....................................................................................................111 1997 Wastewater General Obligation Bonds ...........................................................112 Casa de Vilarrasa......................................................................................................113 Traffic Mitigation Fund............................................................................................114 Street Projects Fund..................................................................................................115 Capital License Fund................................................................................................116 Park Dedication Fund...............................................................................................117 Library Basement Project Fund................................................................................118 Storm Drain Improvements Fund.............................................................................119 Community Center Fund ..........................................................................................120 Community Donations Fund ....................................................................................121 Police Public Safety Building Fund .........................................................................122 McAllister Assessment District Fund.......................................................................123 Intermopal Transportation Center Fund ...................................................................124 Internal Service Funds: Combining Statement of Net Assets ...........................................................................126 Combining Statement of Revenues, Expenses and Changes in Fund Net Assets .......127 Combining Statement of Cash Flows..........................................................................128

CITY OF BENICIA
Comprehensive Annual Financial Report Year ended June 30, 2009
TABLE OF CONTENTS, (CONTINUED)
Page Fiduciary Funds: Combining Statement of Fiduciary Assets and Liabilities ..........................................130 Statement of Changes in Assets and Liabilities ..........................................................131 STATISTICAL SECTION Net Assets by Component ....................................................................................................135 Changes in Net Assets ..........................................................................................................136 Governmental Activities of Tax Revenues by Source .........................................................138 Fund Balances of Governmental Funds ...............................................................................139 Changes in Fund Balances of Governmental Funds ............................................................140 Assessed and Estimated Actual Value of Taxable Property ................................................142 Property Tax Rates – All Overlapping Governments ..........................................................143 Principal Property Taxpayers ...............................................................................................144 Property Tax Levies and Collections ...................................................................................145 Ratio of Outstanding Debt by Type .....................................................................................146 Ratio of General Bonded Debt Outstanding.........................................................................147 Computation of Direct and Overlapping Debt .....................................................................148 Computation of Legal Bonded Debt Margin........................................................................149 Pledged Revenue Coverage, Water and Wastewater Revenue Bonds .................................150 Demographic and Economic Statistics.................................................................................151 Principal Employers .............................................................................................................152 Full-Time Equivalent City Government Employees by Function........................................153 Operating Indicators by Function/Program..........................................................................154 Capital Asset Statistics by Function/Program......................................................................156

INTRODUCTORY SECTION


ii
The City was incorporated in April 24, 1851, under the laws of the State of California. The City is a general law city administered by a council-manager form of government. It is classified as a general law city because of its reliance upon California state law to define procedural regulations utilized by the City Council. The mayor and four council members are elected to staggered four year terms through a general election process. The City Council, serving as the primary governing body, is responsible, among other things, for passing ordinances, adopting the budget, appointing committees and hiring the City Manager and City Attorney. The City Manager is responsible for carrying out the policies and ordinances of the Council, for overseeing the day-to-day operations of the City, and for appointing directors of the various City departments. The City provides a wide range of municipal services to its citizens including public safety (fire and police), library, parks and recreation, public works, planning and zoning, water and wastewater utilities, economic development, transit, and general administrative services. The financial reporting entity includes all funds and activities of the City of Benicia. Other governmental agencies that provide services within the City include Solano County, the Benicia Unified School District, the Benicia Housing Authority and the City of Vallejo Transit. Financial information for these agencies is not included in the accompanying financial statements because each is a legally separate entity with operations separate from the City, and the City has no financial interest in their activities. Management Summary Benicia benefits from the stability of its leadership and experience. Elizabeth Patterson was elected mayor in November 2007 and has been a Council Member since 2003. Jim Erickson, hired as City Manager since February 2003, after more than 20 years as the City Manager for the City of Millbrae, leads the executive management team, which includes eight Directors that bring substantial technical expertise and managerial experience to the City of Benicia. With this level of expertise, the City continues its reputation of progressive and business-like management. The City Council and the Executive Management Team stress long-term planning and the ability to turn fiscal challenges into opportunities. The City has a ten-year General Fund budget forecasting model, which has become a guide and educational tool for the City’s management staff, Council Members and citizens. The model is updated annually to reflect the ever-changing economic environment we live in. The City’s Finance, Audit and Budget Committee also takes a very active role in monitoring the ten-year model and has recommended several enhancements to ensure the viability of the model in forecasting future operational outcomes that will support a high level of service required by a growing community. In addition to the model, the City has also developed a strategic plan that directs the City’s vision for success, which is updated every budget cycle. This plan identifies strategies and priorities that will best address issues raised by the City’s stakeholders, and serves as a framework for the City to provide the community with integrity, excellence, service and inclusiveness of all. By combining the business-like attitude with the ten-year model, taking into account the strategic issues that have been identified, the City has been able to preserve its targeted 20% Undesignated Reserve Level.

iii
ECONOMIC OUTLOOK AND CONDITION Benicia’s strategic setting on the Carquinez Strait has made it an attractive location as both a place to live and a place for industrial growth. While largely built out, families continue to be attracted to the City of Benicia’s quiet tree-lined neighborhoods, good schools, low crime rate and small-town, historic charm. The table below illustrates the City’s General Fund property, sales and utility tax collections for fiscal years 2004 through 2009:
Year Property Sales Utility
2003-04 10,502,276 4,237,439 2,747,951 2004-05 10,774,630 4,567,137 2,826,370 2005-06 11,919,854 5,373,118 3,001,316 2006-07 12,881,657 6,285,439 5,056,904 2007-08 13,534,307 6,794,114 4,190,517 2008-09 13,053,648 6,958,722 4,413,428
General Fund Tax Collections2003-04 Through 2008-09
As the table indicates, property taxes decreased $480,659 (3.73%) in fiscal year 2008-09. The decrease is a result of the continued decline in assessed valuation of real estate properties throughout the country. The City is fortunate enough that the decrease is the lowest within the county. Sales tax increased $164,608 (2.62%) in fiscal year 2008-09. This increase reflects strong performance by many of Benicia’s industrial and retail businesses. The long-term economic outlook for the City continues to be strong given the diversity of the City’s economic base and the low vacancy rate in the City’s Industrial Park. Utility user tax collections increased $222,911 (4.41%) due to higher revenues generated from Valero and the revamping of the utility users tax for communications. The City’s Industrial Park was a model for other California cities on how to transform an abandoned military base into a viable industrial park and local economic catalyst. The Benicia Industrial Park provides a strong sales tax base for the City, generating over 60% of the City’s sales tax revenue. Valero’s Northern California Petroleum Refinery is a major activity in the Park. Amports owns the deep-water Port of Benicia and maintains a large distribution center in Benicia, which processes over 150,000 passenger cars and light trucks annually. Other industrial sectors represented in the park include steel and metal fabrication, construction, wine warehousing and distribution and nutriceutical product research, general manufacturing and petro-chemical industry supplies and service. Over the last decade, the total square footage of the Benicia Industrial Park has expanded to about 7,000,000 square feet, over 400 companies, and an estimated 6,500 jobs. The types of companies locating in the Industrial Park continue to diversify Benicia’s economic base and reflect Benicia’s prominence as an industrial center located midway between the Bay Area and Sacramento markets. Access to major Northern California freeways and railways contribute to the success and viability of the Benicia Industrial Park.

iv
Discovery Builders, a major Northern California developer, owns approximately 500 acres adjacent to the Benicia Industrial Park. When approved and developed, the new Benicia Business Park will significantly increase property, sales and utility tax revenue for the City. Consistent with the City’s General Plan, the new business park will contain over 2 million square feet of light industrial uses and over 800,000 square feet of commercial space. The planning process has been stalled temporarily due to the regional economic slowdown but is expected to begin again as soon as the regional economy improves. The following is a list of the top 15 employers in the Industrial Park:
Employer Employees Type of BusinessValero Refining Co 599 Petroleum RefiningBio-Rad Laboratories, Inc. 252 Manufacture Hematology ProductsDunlop Manufacturing Inc 234 Manufacture/Distribute Musical
AccessoriesBay Valve Service & Engineering Inc. 187 Valve Service RepairCytosport 160 Dietary Sport & Nutrition ProductsAmerican Civil Constructors West Coast Inc. 160 General Engineering ContractorCoca-Cola Bottling Co. 157 Soft Drink DeliveryRadiator Express Warehouse, Inc. 133 Distribute RadiatorsThe Pepsi Bottling Group 119 Soft Drink ManufacturingBenicia Fabrication & Machine 118 Metal Products ManufacturingAPS West Coast, Inc. 113 Operate Port of BeniciaPSC Industrial Outsourcing, Inc. 95 Industrial Waste Cleaning/DisposalVeolia Industrial Outsourcing Inc 91 Industrial ServicesCycle Gear Inc. 89 Warehouse With Some Mail Order
SalesDish Network California Serv Corp 89 Satellite TV Installation FINANCIAL GOALS AND STRATEGIES The City’s financial goals and strategies center on development of stable revenue sources to provide high level services to a growing community in an efficient cost-effective manner. These goals and strategies are:
1. Maintain balanced budgets that incorporate basic services and infrastructure expansion to meet community growth envisioned by the City Council, the City’s General Plan and the City’s Strategic Plan.
2. Promote development of job and sales tax creating businesses to reduce the standing of the
City as a bedroom community by balancing housing with jobs.
3. Promote a balance of affordable housing opportunities.
4. Promote the preservation of open space, the development of cultural amenities, the encouragement of Historical Preservation and Historical Tourism, and adequate transportation.
5. Ensure growth pays its fair share.

v
6. Promote intergovernmental cooperation to reduce costs and better serve City residents.
7. Increase citizen involvement and City service responsiveness to residents.
There is also a strong focus on sound management of the City’s financial resources to allow for the stable delivery of public services and to preserve the City’s reputation in financial markets.
Balanced Budget
While the City has recovered from costly litigation concerning a storm drain improvement; the 2007 reduction in property valuation for Valero, one of the City’s major property taxpayers, and continuous State takeaways, it continues to face the challenge of the greatest economic downturn since the Great Depression. With the State’s $26 billion deficit being funded by additional borrowings from local governments, the City adopted budgets that are ambitious and challenging given the great fiscal stress the rest of the state is in. Ambitious because substantial capital projects are included and challenging because service expectations remain unchanged in spite of a hiring freeze imposed to balance the budget. In so doing, the City’s General Fund reserve has remained in a secure position to weather the fiscal challenges that are anticipated in the next five years. Benicia Market Analysis
The Benicia industrial market is diverse, strong and reflects the petro-chemical, steel fabrication and machining, construction, environmental engineering and warehouse/distribution sectors. For the last decade, the Benicia Industrial Park has been an attractive alternative to the Contra Costa market due to more affordable rents, access to affordable housing and a skilled and semi-skilled labor pool. The Benicia Industrial Park currently includes approximately 7 million square feet of built space. While other communities are experiencing significant reductions in sales tax revenue, the Benicia Industrial Park remains a stable economic engine for the City. On the eastern part of town, a 50-bedroom hotel is near completion, which will be an added source of the City’s transient occupancy tax in the near future. Long-term Financial Planning
The City updates a Capital Improvement Program (CIP) on a biennial basis based upon the “Council Priority List” of future capital and infrastructure needs. The CIP projects for fiscal year 2008-09 totaled $8.9 million. Funding comes from multiple sources, including existing funds, development taxes, and regional, state and federal funds over the next five-year period. A citywide Strategic Plan has been developed through a series of public meetings, retreats and workshops with the City Council and City Management. The budget serves as the implementation measure for this plan and sets forth five major Strategic Issues as follows:
• Protecting Community Health and Safety • Protecting and Enhancing the Environment • Strengthening Economic and Fiscal Conditions • Preserving and Enhancing Infrastructure • Maintain and Enhance a High Quality of Life

vi
As the City looks beyond its biennial budget, finances are not expected to be much better three years from now. Accordingly, maintenance of the hiring freeze throughout the budget period has been approved and further cutbacks on operating expenditures are being considered. Additionally, careful execution of capital spending will be necessary to assure that we do not spend monies that may not materialize. Housing Opportunities
According to the American Community Survey of the US Census, Benicia has just over 11,000 housing units within its jurisdiction. With a population of 27,977 persons, Benicia is the fifth largest of the seven cities in Solano County. As it has always done in the past, Benicia is in the process of updating its Housing Element to cover the period between 2007-2014. Housing Element updates are required by the State Department of Housing and Community Development, which sets forth a process by which every region plans for future population growth to ensure that enough housing is available within each city. For Benicia, this means planning for an additional 532 new units through the year 2014. Units that have been built since January 1, 2007 count toward meeting the need. From January 1, 2007 through October 31, 2009, a total of 117 new homes were built within the city. Accordingly, the city needs to show that there is enough residentially zoned land that could accommodate 415 units. Currently, the City’s Draft Housing Element shows all vacant and under-utilized land, and is under review by the State. The city expects to adopt the new Housing Element by Spring 2010. Parks, Open Space, Library, Historical Preservation and Tourism, and Transportation
The City is extremely proud of its award winning, 50-acre community park and 570-acre open space area in the northern part of the City. The City is continuing with the tenant improvements to the Benicia Community Center. Phase I will include renovation of the southern portion of the building that includes four (4) classrooms and two (2) restrooms. The Girl and Boy Scouts and after-school recreation programs will occupy the classrooms. The Commanding Officers Quarters rehabilitation project was completed in May 2009. This project consisted of complete seismic stabilization, ADA elevator and restrooms, new roof, sprinklers, exterior paint, HVAC system, electrical upgrades and partial interior restoration. The City's $6 million public library facility, opened in 1993, provides patrons with the utmost in modern technology available, including electronic access to the collection of other county and community college libraries. Users are able to borrow audiotapes of books, videotapes of movie classics and music compact discs in addition to having access to 107,756-volume collection of books. The library offers a number of special programs for children, teens and seniors. To further expand library services, the remodeling of the library basement is in progress with the design phase completed. The City of Benicia has a rich historical background as one of the nation’s foremost military compounds, multi-faceted seaports and site of the California State Capital in 1854. There are many wonderful buildings from these bygone eras that are full of cherished artifacts and architectural splendor. The City of Benicia has recognized the importance of maintaining these significant historical assets and has empowered both citizen committees and staff to protect these valuable treasures for residents, visitors and future generations.

vii
The City’s transit system “Benicia Breeze” was restructured on October 6, 2008, when Route 75 was taken over by the City of Vallejo Transit (Vallejo Transit) as the new Route 78. Benicia Breeze restructured routes, serviced by Vallejo Transit, to accommodate Route 78 that serves Vallejo, Benicia and the Pleasant Hill and Walnut Creek BART Stations. The new service in Benicia entails two flex-routes that operate in the morning and evening peak commute hours; dial-a-ride service open to all riders during non-peak commute hours; supplemental service to Benicia schools on two routes; various shuttle services to Kaiser/Sutter Hospitals; the Sun Valley Mall; Diablo Valley College in Contra Costa County; as well as ADA Para-transit Plus service. Benicia Breeze continues to maintain a taxi scrip program as well as looking to expand its services to qualified passengers. Benicia Breeze uses a fleet of two transit buses and six cutaway buses, all of which are accessible to bicycles and mobility devices. Benicia Breeze averages about 300 passengers per weekday and carries approximately 6,226 passengers per month. Currently, Benicia Breeze has been working with Vallejo Transit on a potential consolidation of both agencies. The South County Consolidation Committee was established to better facilitate the consolidation process, which is anticipated to take effect on July 1, 2010.
Growth Pays Its Own Way
Benicia's fees and taxes on new development are designed to ensure that growth pays its own way, while simultaneously ensuring that the City is not priced out of the development market. The total amount of fees paid for a "typical" new 2,758 square-foot single-family residence is approximately $35,000. The fees vary based on square footage and pay for needed public facilities, such as streets, water and wastewater facilities, parks, library books and public safety needs.
Intergovernmental Cooperation
The City of Benicia works closely with the Benicia Unified School District (BUSD) in numerous ways, including: • Providing two school resource officers at no cost to the school district • Funding the school district’s crossing guard program • Funding for various counseling services for at-risk students and student reading programs • High school baseball use of Fitzgerald Field • Library assistance to schools ordinarily provided by credentialed school librarians • Safety improvements, including the installation of a flashing crosswalk for Benicia High School
and planning for a future traffic signal • Maintenance of playing fields and turf areas at three school sites
Benicia and its neighboring city, Vallejo, continue to work together to protect open space adjacent to the Benicia Community Park, which borders both cities. Benicia and Vallejo also cooperate in other matters of mutual interest. For example, the two cities, along with Fairfield, cooperated in the acquisition and maintenance in perpetuity of large tracts of open space located between each of the cities. The cities also cooperate in the management, storage and purchase of water. Citizen Involvement
Periodically, the City engages the public in key discussions on various citywide projects. In August of 2006, the City held a two-day workshop for gathering public input on a new Downtown Mixed Use

viii
Master Plan and the Lower Arsenal Mixed Use Specific Plan. This public outreach program brought out many folks in the community that normally would not participate in such events, thus making the end product all the more successful. In October 2008, city staff conducted a two-day Housing Expo that was designed to solicit public participation regarding an update of the City’s Housing Element. This successful event serves as a basis for a draft Housing Element that will provide a blueprint for where future housing will be built in Benicia during the next 5 to 7 year period. In summary, the City manages its ongoing operations and capital improvement programs in an efficient, business-like manner, with a focus on an entrepreneurial approach to problem solving and citizen involvement. Involving our citizens in shaping Benicia’s future, preserving Benicia’s charm and planning for its orderly progress into the twenty-first century, is of paramount importance. FINANCIAL INFORMATION Internal Controls City management is responsible for establishing and maintaining an internal control structure designed to ensure government assets are protected from loss, theft or misuse and ensure adequate accounting data are compiled for the preparation of financial statements in conformity with generally accepted accounting principles. The internal control structure is designed to provide reasonable, but not absolute, assurance that these objectives are met. The concept of reasonable assurance recognizes (1) the cost of a control should not exceed the benefits likely to be derived, and (2) the valuation of costs and benefits requires estimates and judgments by management.
Budgeting Controls
The City maintains budgetary controls. The objective of these budget controls is to ensure compliance with the City Council approved, annual appropriated budget. Activities of the General Fund and Special Revenue Funds, if required, are included in the annual appropriated budget. Project-length financial plans are adopted for the Capital Improvement Projects Funds. Budgetary control is maintained at the fund level for administrative and operating expenditures, while capital improvements are maintained at the project budget total. Department directors have control of their own department budgets and if transfers between departments are needed, the City Manager has the authority to approve them. The City also maintains an encumbrance accounting system as one technique of accomplishing budgetary control. As demonstrated by the statements and schedules included in the financial section of this report, the City continues to meet its responsibility for sound financial management. Governmental and Business-Type Activities and Net Assets
For detailed information and analysis of the governmental and business-type activities and net assets, please see Management’s Discussion and Analysis.
ix
General Fund Reserves
The City has adopted a fund balance reserve policy establishing a minimum fund balance equal to 20% of the fund’s annual operating expenditures budget for the purpose of stabilizing the delivery of City services during periods of operational budget deficits. At a minimum, the reserves include the following: Economic Uncertainty of 5%, Liability Exposures Reserve of 5%, Emergency Reserves of 10%. At the end of this fiscal year, the General Fund had accumulated a 23% undesignated fund balance but, after adjusting for the $1,627,000 advance from the Wastewater Fund to repay the Valero Property Tax Loan, the reported ledger balance for the purposes of this report is 18%. The difference lies in the Governmental Accounting Standards Board (GASB) requirement that all internal fund advances be reported at their gross amount, even though the amortization period may be several years into the future. In this case, the remaining amortization period for the Valero loan served as the basis for the Wastewater Fund advance, which is six years. For budgeting purposes, the Undesignated Fund Balance will be reported as 23%. Gann Limit vs. Appropriations Subject to Limit
Proposition 4, the "Gann Initiative,” was passed by California voters in 1978 and is intended to limit government appropriations. The appropriations limit is calculated each year based upon fiscal year 1978-79 appropriations, which are modified by the composite consumer price index and population changes that have occurred in subsequent years. The City's appropriations limit and the estimated appropriations subject to the limit for the fiscal year 2008-09 amounted to $69,715,477 and $30,430,845 respectively. City appropriations subject to the limit have consistently remained far below the appropriation limits and are not expected to deviate from this trend in the foreseeable future. Cash Management
The City’s cash and investments are managed on a pooled basis. The average investment portfolio was $49,038,912. The average yield on investment in 2008-09 was 3.87%, average maturity at year-end was approximately a year and three quarters, and total interest earned was $2,170,259. Investments consisted primarily of money market funds, U.S. government securities and Local Agency Investment Fund (LAIF) deposits managed by the Treasurer of the State of California. These investments are allowed under an investment policy adopted by the City Council that defines eligible investments and maturities of the City's investment portfolio and requires securities be held by the City or by a qualified safekeeping institution and be registered in the City's name.
Debt Administration
The City has utilized bond financing for many public improvement projects in the past. The City's reputation and creditworthiness has been enhanced by its reliance on the same bond counsel and underwriter for nearly all bond issues brought to market over the past eighteen years. These consultants are intimately familiar with City activities and policies and are an invaluable asset in marketing the City to investors. Additional information on the City’s long-term debt can be found in Note 6 to the Basic Financial Statements.

x
AWARDS The Government Finance Officers Association of the United States and Canada (GFOA) awarded a Certificate of Achievement for Excellence in Financial Reporting to the City of Benicia for its Comprehensive Annual Financial Report for the fiscal year ended June 30, 2008. In order to be awarded a Certificate of Achievement, a government must publish an easily readable and efficiently organized comprehensive annual financial report. This report must satisfy both generally accepted accounting principles and applicable legal requirements. A Certificate of Achievement is valid for a period of one year. The Finance Department Staff believes this report conforms to the Certificate of Achievement Program requirements and will submit the report to the GFOA to determine its eligibility. The City of Benicia has received this award for the past 17 years and it is our goal to be awarded this Certificate once again. The award demonstrates the City’s conformance to the highest level of financial reporting standards, which will likely have a positive influence on the City’s financial rating. This will ensure cost savings in the future when the City of Benicia seeks financing for public improvements. Acknowledgements The preparation of this report could not be accomplished without the efficient and dedicated services of the entire staff of the Finance Department. I would like to express my special appreciation to Assistant Finance Director Abigail M. Urrutia and Accounting Systems Supervisor Alyson Kauzer. I would also like to thank the Mayor, City Council Members and the City Manager for their support in planning and conducting City financial affairs in a responsible and efficient manner. Respectfully submitted,
Robert Sousa Finance Director

xi
MUNICIPAL OFFICERS As of June 30, 2009
CITY COUNCIL (Elected)
Elizabeth Patterson, Mayor
November 2011
Tom Campbell, Vice Mayor November 2011Mark Hughes, Councilmember November 2009Mike Ioakimedes, Councilmember November 2011Alan Schwartzman, Councilmember November 2009
OTHER (Elected)
Lisa Wolfe, City Clerk
November 2011
Teddie Bidou, City Treasurer November 2011
PLANNING COMMISSION (Appointed) Rick Ernst
September 2011
Brad Thomas September 2011Rod Sherry September 2011Daniel Healy September 2010Richard Bortolazzo September 2010Donald Dean January 2013Lee Syracuse January 2013
PARKS, RECREATION AND CEMETARY COMMISSION (Appointed)
Sandy Moriaty
July 2009
John McGuire June 2010Rufus Bunch January 2011Annie Lloyd September 2009Nancy Cockerham September 2010Dan Moitoza March 2010Ernie Gutierrez November 2010Triya Leong September 2008
APPOINTED OFFICIALS
Jim Erickson
City Manager
Heather McLaughlin City Attorney
DEPARTMENT HEADS Robert Sousa
Finance
Sandra Spagnoli PoliceSteve Vucurevich FireMichael Alvarez Parks and Community ServicesAnne Cardwell Administrative ServicesDiane Smikahl LibraryCharles Knox Public Works & Community Development
xii
CITY OF BENICIA
MISSION STATEMENT
To serve and enhance our community with care, commitment and pride.
VISION STATEMENT
Building a great community together by preserving and strengthening:
• Our small town character • A vibrant economy • Our history • A safe and healthy environment

xiii
CITY OF BENICIA
ORGANIZATIONAL CHART
JUNE 30, 2009
CITIZENS OF BENICIA
CITY COUNCIL
Elizabeth Patterson, Mayor
CITY CLERK Tom Campbell, Vice Mayor CITY TREASURER
Lisa Wolfe Mark Hughes Teddie Bidou
Mike Ioakimedes
Alan Schwartzman
CITY MANAGER CITY ATTORNEY
Jim Erickson Heather McLaughlin
POLICE CHIEF
FIRE CHIEF
FINANCE DIRECTOR
PARKS & COMMUNITY
SERVICES DIRECTOR
Sandra Steve Robert Mike Spagnoli Vucurevich Sousa Alvarez
ADMIN
SERVICES DIRECTOR
LIBRARY DIRECTOR
PUBLIC WORKS & COMMUNITY DEVELOPMENT
DIRECTOR Anne Diane Charles Cardwell Smikahl Knox
xiv
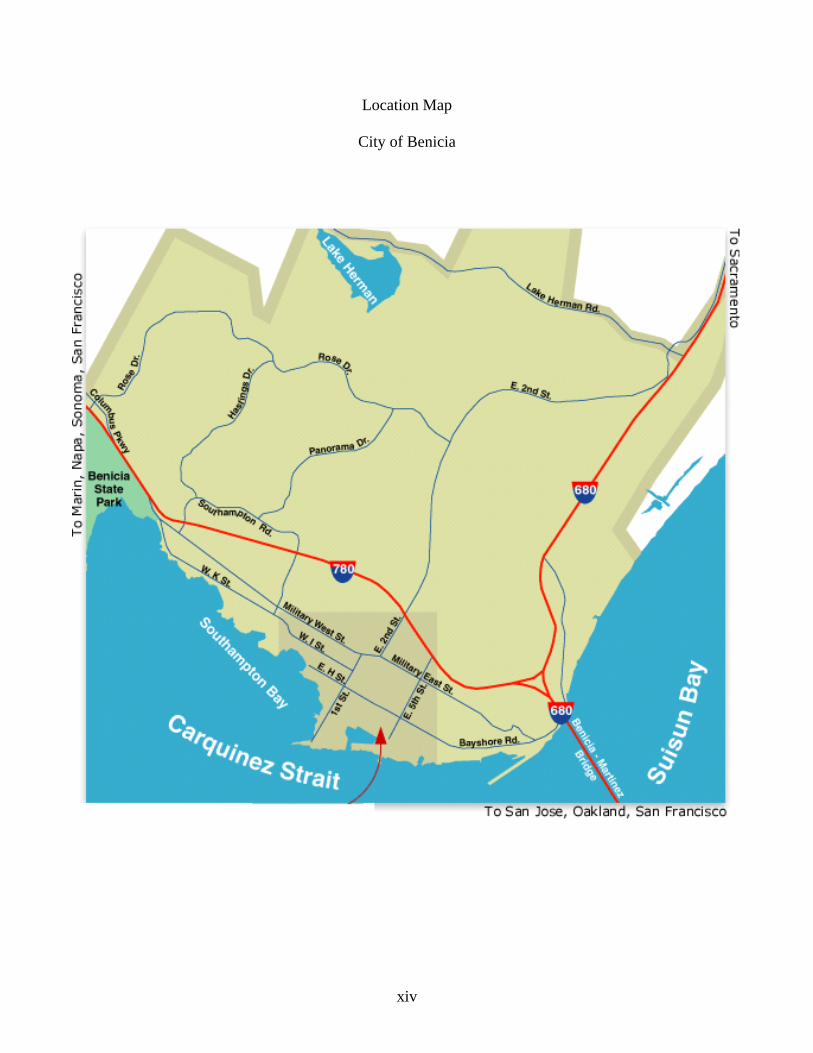
Location Map
City of Benicia

FINANCIAL SECTION

Mayer Hoffman McCann P.C. An Independent CPA Firm
84 South First Street, Third Floor San Jose, CA 95113 408-794-3545 ph 408-295-3818 fx www.mhm-pc.com
1
City Council City of Benicia, California
INDEPENDENT AUDITORS’ REPORT We have audited the accompanying financial statements of the governmental activities, business-type activities, each major fund, and the aggregate remaining fund information of the City of Benicia, California, as of and for the year ended June 30, 2009, which collectively comprise the City’s basic financial statements, as listed in the table of contents. These financial statements are the responsibility of the management of the City of Benicia. Our responsibility is to express opinions on these financial statements based on our audit. The prior year partial comparative information has been derived from the financial statements of the City of Benicia for the year ended June 30, 2008 and, in the prior auditors’ report dated November 6, 2008, an unqualified opinion was expressed on those financial statements. We conducted our audit in accordance with auditing standards generally accepted in the United States of America and the standard applicable to financial audits contained in Government Auditing Standards, issued by the Comptroller General of the United States. Those standards require that we plan and perform the audit to obtain reasonable assurance about whether the financial statements are free of material misstatement. An audit includes examining, on a test basis, evidence supporting the amounts and disclosures in the financial statements. An audit also includes assessing the accounting principles used and significant estimates made by management, as well as evaluating the overall financial statement presentation. We believe that our audit provides a reasonable basis for our opinion. In our opinion, the basic financial statements referred to above present fairly, in all material respects, the financial position of the governmental activities, business-type activities, each major fund, and the aggregate remaining fund information of the City of Benicia, California as of June 30, 2009, and the respective changes in financial position and cash flows, where applicable, of the City of Benicia, California and the respective budgetary comparison information for the general fund of the City for the year then ended in conformity with accounting principles generally accepted in the United States of America. As described further in note 11 to the financial statements, the City changed its method of accounting for postemployment benefits for fiscal years ending on or after June 30, 2009. The information identified in the accompanying table of contents as management’s discussion and analysis and required supplementary information are not a required part of the basic financial statements, but are supplementary information required by accounting principles generally accepted in the United States of America. We have applied certain limited procedures, which consisted principally of inquiries of management regarding the methods of measurement and presentation of the required supplementary information. However, we did not audit the information and express no opinion on it.

2
City Council City of Benicia, California Page Two Our audit was conducted for the purpose of forming an opinion on the financial statements that collectively comprise the City of Benicia’s basic financial statements. The combining and individual fund financial statements and schedules are presented for purposes of additional analysis and are not a required part of the basic financial statements. The combining and individual fund financial statements and schedules have been subjected to the auditing procedures applied in the audit of the basic financial statements and, in our opinion, are fairly stated in all material respects in relation to the basic financial statements taken as a whole. In accordance with Government Auditing Standards, we have also issued a report dated December 9, 2009 on our consideration of the City of Benicia’s internal control over financial reporting and our tests of its compliance with certain provisions of laws, regulations, contracts, grant agreements, and other matters. The purpose of that report is to describe the scope of our testing of internal control over financial reporting and compliance and the results of that testing, and not to provide an opinion on the internal control over financial reporting or on compliance. That report is an integral part of an audit performed in accordance with Government Auditing Standards and should be considered in assessing the results of our audit.
San Jose, California December 9, 2009

CITY OF BENICIA
Management’s Discussion and Analysis
3
This management’s discussion and analysis provides readers an overview and analysis of financial activities of the City of Benicia (City) for the fiscal year ended June 30, 2009. Please read this discussion and analysis in conjunction with the accompanying Transmittal Letter, the Basic Financial Statements and the accompanying notes to the financial statements. FINANCIAL HIGHLIGHTS
• The assets of the City exceeded its liabilities at the close of the most recent fiscal year by $224.7 million. Of this amount, $44.7 million may be used to meet the City’s ongoing obligations to citizens and creditors.
• The City’s total net assets increased by $1.0 million due to reduction of operating expenses. • As of the close of the current fiscal year, the City’s governmental funds reported combined ending fund
balances of $14.8 million, a decrease of $3.9 million in comparison with the prior year. Approximately 45.7% of this total, $6.8 million is available for spending at the City’s discretion.
• At the end of the current fiscal year, the General Fund fund balance designations are as follows: $.8
million for Economic Uncertainty, $1.6 million for Exposures Reserve and $3.2 million for Emergency Reserve.
• The City’s total debt decreased by $4.5 million as a net result of debt maturities during the year.
OVERVIEW OF THE FINANCIAL STATEMENTS This discussion and analysis is intended to serve as an introduction to the City’s basic financial statements, which consists of three parts: (1) Government-wide Financial Statements, (2) Fund Financial Statements, and (3) Notes to the Basic Financial Statements. This report also contains other supplementary information in addition to the basic financial statements. Government-wide Financial Statements The Government-wide Financial Statements provide readers with a broad view of the City’s finances, in a manner similar to a private-sector business, using the economic resources measurement focus and accrual basis of accounting. Under the accrual basis of accounting, revenues are recognized in the period in which they are earned, while expenses are recognized in the period in which liability is incurred. The Statement of Net Assets reports information about the City as a whole. This statement includes all assets (including infrastructure) as well as all liabilities (including long-term debt) of the City. Net assets are the difference between assets and liabilities, which is one way to measure the City’s financial health. Over time, increases or decreases in the City’s net assets are one indicator of whether its financial health is improving or deteriorating.

CITY OF BENICIA
Management’s Discussion and Analysis
4
In these statements City activities are reported into two categories:
• Governmental Activities - Most of the City’s basic services are reported in this category, including administration, community development, police, fire, parks and community services, public works, library services, and economic development. Property, sales and utility taxes, user fees, interest income, franchise fees, and state and federal grants are among the revenues that finance these activities.
• Business-Type Activities - The City charges a fee to customers to pay for the cost of certain services
provided. The City’s wastewater, water, marina, and transit operations are reported in this category. Fund Financial Statements A fund is a group of related accounts that is used to maintain control over resources that have been segregated for specific activities or objectives. Some funds are required to be established by State law or by bond covenants. However, the City establishes many other funds to help control and manage money for a particular purpose or to show that the City is meeting legal responsibilities for using certain taxes, grants, or other funds restricted in its use. Fund Financial Statements provide detailed information about the most significant funds, not the City as a whole. All of the funds of the City can be divided into three categories:
• Governmental Funds - Most of the City’s basic services are reported in governmental funds, using the current financial resources measurement focus and modified accrual accounting method, where revenues are recognized when measurable and available. Governmental funds are used to account for essentially the same functions reported as “governmental activities” in the Government-wide Financial Statements. However, unlike the Government-wide Financial Statements, Governmental Funds Financial Statements focus on near-term inflows and outflows of spendable resources, as well as on balances of spendable resources available at the end of the fiscal year. Such information may be useful in determining the City’s ability to finance its programs in the near future.
To better understand the City’s long-term and short-term requirements, it is useful to compare the City’s Governmental Fund Statements with the governmental activities in the Government-wide Financial Statements. A reconciliation is provided for both the governmental fund balance sheet and the statement of revenues, expenditures and changes in fund balances to facilitate this comparison.
• Proprietary Funds - When the City charges customers for services, either to outside customers or to other City departments, these services are generally reported in proprietary funds. Proprietary funds are reported in the same way in which all activities are reported in the Government-wide Financial Statements, using the accrual basis of accounting. The City’s enterprise funds are the same as the “business-type activities” reported in the government-wide financial statements, but provide more detail and additional information, such as cash flows for each enterprise fund. The City uses internal service funds to report activities that provide supplies and services to the City’s other programs and activities, such as insurance, general services, building and equipment management and the retirement stability funds. Internal service funds are reported with “governmental activities” in the Government-wide Financial Statements since services provided predominantly benefit governmental rather than business-type functions.
• Fiduciary Funds - The City is the trustee, or fiduciary, for certain funds held on behalf of third parties.
The City’s fiduciary activities are reported in a separate Statements of Fiduciary Net Assets. These

CITY OF BENICIA
Management’s Discussion and Analysis
5
activities are excluded from the City’s Government-wide Financial Statements because the City cannot use these assets to finance its operations. However, the City is responsible for ensuring that assets reported in these funds are used for their specified purposes.
Notes to the Financial Statements The notes provide additional information essential to a full understanding of the data provided in both the Government-wide Financial Statements and Fund Financial Statements. The notes to the financial statements can be found on pages 39-74 of this report. Other Information In addition to the basic financial statements and accompanying notes, this report also presents certain Required Supplementary Information concerning the City’s progress in funding its obligation to provide pension benefits to its employees. GOVERNMENT-WIDE FINANCIAL ANALYSIS The City’s combined Net Assets for the year ended June 30, 2009 are summarized below.
2009 2008 2009 2008 2009 2008
Current and other assets 38.1$ 41.4$ 31.1$ 35.4$ 69.2$ 76.8$ Capital assets 122.6 120.5 111.2 108.9 233.8 229.4
Total Assets 160.7 161.9 142.3 144.3 303.0 306.2
Long-term liabilities outstanding 24.4 23.3 47.8 47.6 72.2 70.9 Other liabilities 4.4 6.5 1.6 5.1 6.0 11.6
Total Liabilities 28.8 29.8 49.4 52.7 78.2 82.5
Net Assets:Invested in capital assets,
net of related debt 113.2 110.6 63.5 58.7 176.7 169.3 Restricted 3.2 8.0 - - 3.2 8.0 Unrestricted 15.5 13.5 29.2 32.9 44.7 46.4
Total Net Assets 131.9$ 132.1$ 92.7$ 91.6$ 224.6$ 223.7$
Summary of Net Assets(in millions)
Governmental Activities Business-type Activities Total

CITY OF BENICIA
Management’s Discussion and Analysis
6
The largest portion of the City’s net assets (78.7%) reflects its investments in capital assets, less any related debt used to acquire those assets still outstanding. The City uses these capital assets to provide services to citizens and are not available for future spending.
Restricted net assets represent 1.4% of the total net assets and are subject to external restrictions. The decrease of $4.8 million in restricted net assets was due to completion of capital projects. These monies will be available for future spending but only for specific projects within the City and for debt payments. The balance of unrestricted net assets, which represents 19.9% of the total assets, may be used to meet the City’s ongoing obligations to citizens and creditors. A Statement of Activities and Changes in Net Assets, as of June 30, 2009, is presented below.
2 0 0 9 2 0 0 8 2 0 0 9 2 0 0 8 2 0 0 9 2 0 0 8R e ve n u e s :P r o gr a m R e v e n ue s:
C h a r ge s f o r se r v ic e s 3 .9$ 3 .9$ 1 4 .1$ 1 5 .0$ 1 8 .0$ 1 8 .9$ O p e r a t in g gr a n t s a n d c o n t r ibut io n s 2 .9 1 .9 0 .6 1 .7 3 .5 3 .6 C a p it a l gr a n t s a n d c o n t r ibut io n s - 0 .3 2 .0 - 2 .0 0 .3
Ge n e r a l R e v e n ue s: - P r o p e r t y t a x e s 1 3 .8 1 4 .3 - - 1 3 .8 1 4 .3 Sa le s t a x e s 7 .7 7 .5 - - 7 .7 7 .5 U t ilit y use r s' t a x 4 .4 4 .2 - - 4 .4 4 .2 F r a n c h ise 1 .8 1 .6 - - 1 .8 1 .6 O t h e r t a x e s 0 .7 1 .6 - - 0 .7 1 .6 M o t o r v e h ic le lic e n se f e e s 2 .1 2 .0 - - 2 .1 2 .0 I n v e st m e n t e a r n in gs 0 .9 0 .9 1 .2 1 .6 2 .1 2 .5
T o t a l R e v e n ue s 3 8 .2 3 8 .2 1 7 .9 1 8 .3 5 6 .1 5 6 .5
Ex p e n s e s :A dm in ist r a t io n 3 .1 3 .2 - - 3 .1 3 .2 C o m m un it y D e v e lo p m e n t 1 .8 2 .4 - - 1 .8 2 .4 P ublic Sa f e t y - P o lic e 9 .2 8 .8 - - 9 .2 8 .8 P ublic Sa f e t y - F ir e 7 .2 7 .2 - - 7 .2 7 .2 P a r k s a n d C o m m un it y Se r v ic e s 6 .0 6 .4 - - 6 .0 6 .4 P ublic W o r k s 4 .2 4 .3 - - 4 .2 4 .3 L ibr a r y 2 .4 2 .4 - - 2 .4 2 .4 E c o n o m ic D e v e lo p m e n t 0 .5 0 .5 - - 0 .5 0 .5 Ge n e r a l Go v e r n m e n t 4 .3 2 .8 - - 4 .3 2 .8 I n t e r e st o n lo n g- t e r m de bt 0 .5 0 .5 - - 0 .5 0 .5 W a st e wa t e r - 7 .3 7 .0 7 .3 7 .0 W a t e r - 7 .3 7 .6 7 .3 7 .6 B e n ic ia M a r in a - 0 .6 0 .6 0 .6 0 .6 T r a n sit - 1 .4 1 .8 1 .4 1 .8
T o t a l E x p e n se s 3 9 .2 3 8 .5 1 6 .6 1 7 .0 5 5 .8 5 5 .5
I n c r e a se in n e t a sse t s be f o r e t r a n sf e r s ( 1 .0 ) ( 0 .3 ) 1 .3 1 .3 0 .3 1 .0 T r a n sf e r s - 0 .1 - ( 0 .1 ) - -
I n c r e a se in n e t a sse t s ( 1 .0 ) ( 0 .2 ) 1 .3 1 .2 0 .3 1 .0 N e t a sse t s - 7 /1 /0 8 ( r e st a t e d) 1 3 2 .9 1 3 2 .3 9 1 .6 9 0 .4 2 2 4 .5 2 2 2 .7
N e t a sse t s - 6 /3 0 /0 9 1 3 1 .9$ 1 3 2 .1$ 9 2 .9$ 9 1 .6$ 2 2 4 .8$ 2 2 3 .7$
S t a t e m e n t o f A c t i vi t i e s a n d C h a n g e s i n N e t A s s e t s( in m illio n s)
Go v e r n m e n t a l A c t iv it ie s B usin e ss- t y p e A c t iv it ie s T o t a l

CITY OF BENICIA
Management’s Discussion and Analysis
7
Governmental Activities Total resources available during the year to finance governmental operations were $171.1 million consisting of Net Assets at July 1, 2008, of $132.9 million, program revenues of $6.8 million and general revenues of $31.4 million. The cost of all governmental activities this year was $39.2 million. The largest governmental programs include Public Safety - both Police and Fire, and Parks and Community Services. The amount that was paid by those who directly benefited from governmental programs was $3.9 million, while operating and capital grants and contributions paid for $2.9 million of total costs. The City paid for the remaining “public benefit” portion of governmental activities with taxes and investment earnings. The following table shows the Net Cost of Governmental Activities, which totaled $32.4 million.
Net RevenueProgram (Expense) of
Expenses Revenues Activities
Administration 3,114,153$ 41,724$ (3,072,429)$ Community Development 1,821,213 799,379 (1,021,834) Public Safety - Police 9,150,887 597,877 (8,553,010) Public Safety - Fire 7,212,291 513,427 (6,698,864) Parks and Community Services 5,999,749 2,539,234 (3,460,515) Public Works 4,186,559 1,550,708 (2,635,851) Library 2,403,239 313,904 (2,089,335) Economic Development 536,124 30 (536,094) General Government 4,283,723 448,429 (3,835,294) Interest expense 525,341 - (525,341)
Total 39,233,279$ 6,804,712$ (32,428,567)$
Ne t Cost of Gove rnme ntal Activitie s

CITY OF BENICIA
Management’s Discussion and Analysis
8
Business-type Activities Total resources available during the year to finance Business-Type Activities were $109.4 million consisting of Net Assets at July 1, 2008, of $91.6 million, program revenues of $16.7 million and general revenues of $1.1 million. The cost of all Business-Type activities this year was $16.6 million. As shown in the Statement of Activities and Changes in Net Assets, the amounts paid by users of the systems were $14.1 million, while operating and capital grants and contributions were $2.6 million.
Net RevenueProgram (Expense) of
Expenses Revenues Activities
Wastewater 7,294,741$ 6,897,189$ (397,552)$ Water 7,345,574 8,772,607 1,427,033 Benicia Marina 594,863 387,034 (207,829) Transit 1,370,621 689,507 (681,114)
Total 16,605,799$ 16,746,337$ 140,538$
Net Cost of Business-Type Activities
The following chart illustrates the comparison of operating revenues and expenses by business-type activity:
$0
$2
$4
$6
$8
Wastewater Water Marina Transit
Mill
ions
Revenues Expenses

CITY OF BENICIA
Management’s Discussion and Analysis
9
FINANCIAL ANALYSIS OF THE CITY’S FUNDS In addition to the accrual-basis government-wide statements described above, the City maintains financial records at the fund level for compliance with finance-related legal requirements and for budgetary control. The Fund Financial Statements focus on individual funds of the City, reporting operations in more detail than the Government-wide Financial Statements. Governmental Funds The City’s governmental funds provide information on near-term inflows, outflows and balances of spendable resources. The City’s governmental funds reported a combined fund balance at June 30, 2009, of $14.8 million, a decrease of $3.9 million in comparison with the prior year. General Fund - The General Fund is the chief operating fund of the City. As a measure of the General Fund’s liquidity, it may be useful to compare both unreserved and total fund balance to total funding requirements. At the end of the fiscal year, total fund balance of the General Fund was $6.3 million. The City’s unreserved designated fund balance consisted of the following: $.8 million for Economic Uncertainty, $1.6 million for Exposures Reserve and $3.2 million for Emergency Reserve. Total fund balance represents 19.0% of total general fund expenditures. The General Fund realized general tax and other revenues of $32.4 million during the year to pay for $33.1 million operating expenditures, realizing a deficiency of revenues over expenditures of $.7 million. Lower property taxes, licenses and permits, and investment income fell short of the anticipated budget. The General Fund continues to have healthy reserves for future emergencies. Proprietary Funds The City’s proprietary funds provide the same type of information found in the Government-wide Financial Statements, but in more detail. Wastewater Fund – The City’s wastewater utility fund collected $6.9 million in user fees to maintain the system. The fund has $65.7 million in capital assets, net of accumulated depreciation, financed with $24.2 million of long-term debt. The fund made debt service payments of $2.3 million during the year. Water Fund – The City’s water utility fund collected $6.8 million in user fees to sustain the system. The system has $41.4 million in capital assets, net of accumulated depreciation, financed with $16.6 million of long-term debt. The fund made $1.7 million in debt service payments for the year. Benicia Marina – The City’s Marina collected $.3 million in user fees to support its operating and debt service costs. The Marina has $3.5 million in capital assets, net of accumulated depreciation, financed with $3.9 million of long-term debt. Debt service payments for the year were $.3 million. The fund continues to have deficit net assets. The City continues to evaluate options for a long-term operating solution. Transit – The City’s Transit system operates bus, para-transit, taxi service for the citizens of Benicia. The City collected user fees of $.2 million, which was supplemented by an additional $.5 million in federal, state and local grants to support operations. The fund has $0.6 million in capital assets, net of accumulated depreciation, financed by intergovernmental revenues.

CITY OF BENICIA
Management’s Discussion and Analysis
10
GENERAL FUND BUDGETARY HIGHLIGHTS Over the course of the year, the City Council may revise the City budget on more than one occasion. The Approved Budget is adopted by the City Council prior to the July 1 start of the fiscal year (“Original Budget”). The City Council may add appropriations or change revenue estimates during the course of the fiscal year, primarily at midyear budget review. Finally, the revenue and expenditure estimates for the current fiscal year are revised as part of the Approved Budget (“Final Budget”). Fiscal year 2008-09 was the second year of a two-year budget. The original budget for 2007-09 was developed in early 2007. The original budget for the General Fund revenues was $33.0 million, while expenditures were at $32.9 million. The final budget estimates for revenues was $33.8 million, an increase of $.8 million, and $36.4 million for expenditures, an increase of $3.4 million. The main components of the increases are as follows:
• $.4 million additional revenues for utility users tax in anticipation of higher revenues from various utility providers
• $.2 million additional revenues for other taxes in anticipation of higher franchise fees and transient occupancy taxes due to a stronger local economy
• $.2 million additional investment income from long-term investments • $.4 million additional appropriations for salary and benefit adjustments for all departments as a
result of the negotiated labor agreements • $1.5 million additional transfers out for project completions • $1.4 million additional expenditures for pre-paying the Valero property tax loan
During the year, revenues fell short of the anticipated budget by $1.3 million. The largest revenue variance was the reclassification of proceeds from the loan from the Water Fund to the General Fund as and advance for prepayment of the Valero property tax loan. Actual expenditures were .5 million less than the final budget due to cutbacks on operating expenditures and the hiring freeze throughout the City. CAPITAL ASSETS The capital assets of the City are those assets, which are used in the performance of the City’s functions including infrastructure assets. This investment in capital assets includes land and easements, infrastructure, buildings and improvements, equipment and construction in progress. At June 30, 2009, net capital assets of the governmental activities totaled $122.6 million and the net capital assets of the business-type activities totaled $111.2 million. Depreciation on capital assets is recognized in the Government-wide Financial Statements.

CITY OF BENICIA
Management’s Discussion and Analysis
11
The following table provides a breakdown of the City’s capital assets at June 30, 2009:
2009 2008 2009 2008 2009 2008
Land 18.0$ 18.0$ 2.6$ 2.6$ 20.6$ 20.6$ Buildings & Improvements 21.4 17.9 90.6 90.6 112.0 108.5 Machinery & Equipment 8.1 8.1 9.8 9.3 17.9 17.4 Infrastructure 132.2 130.3 72.0 71.4 204.2 201.7 Construction in Progress 5.0 4.8 2.6 2.3 7.6 7.1 Water Rights - - 5.0 - 5.0 -
Total Capital Assets 184.7 179.1 182.6 176.2 367.3 355.3
Accumulated Depreciation (62.1) (58.6) (71.4) (67.3) (133.5) (125.9)
Net Assets 122.6$ 120.5$ 111.2$ 108.9$ 233.8$ 229.4$
Capital Assets(in millions)
Governmental Activities Business-type Activities Total
Land
Buildings & Improvements
Machinery & Equipment
Infrastructure
Construction in Progress
Water Rights
Land Buildings & Improvements Machinery & EquipmentInfrastructure Construction in Progress Water Rights
This year’s major capital asset additions were machinery and equipment – a Fire engine, a dump truck, backhoe and turbo blowers; and water rights. Additional information on the City’s capital assets can be found in Note 5 on pages 55-57 of this report.

CITY OF BENICIA
Management’s Discussion and Analysis
12
DEBT ADMINISTRATION The City uses a variety of indebtedness to finance various capital acquisitions. At June 30, 2009, the City’s long-term debt outstanding was $72.2 million. Of this total, $24.4 million was in governmental activities and $47.8 was in business-type activities. The City’s governmental activities increased by $1.1 million as a result of the General Fund advance from the Wastewater Fund, and business-type activities increased by $.2 million as a net result of a new lease obligation for the fire engine and debt maturities. The percentage of net bonded debt to taxable property valuation, and the amount of bonded debt per capita are useful indicators of the City’s debt position. Per capita debt outstanding decreased by $143 per capita from $2,669 to $2,526 from the previous fiscal year. The following is a summary of the City’s long-term debt obligations at June 30, 2009:
2009 2008 2009 2008 2009 2008
General Obligation Bonds 6.1$ 6.6$ -$ -$ 6.1$ 6.6$ Pension Obligation Bonds 13.7 14.3 - - 13.7 14.3 Capital Lease 3.3 3.2 - - 3.3 3.2 Utility Revenue Bonds - - 10.5 11.4 10.5 11.4 Loans Payable - - 37.1 39.1 37.1 39.1
Total Indebtedness 23.1$ 24.1$ 47.6$ 50.5$ 70.7$ 74.6$
Long-term Debt(in millions)
Governmental Activities Business-type Activities Total
Additional information on the City’s long-term debt can be found in Note 6 on pages 58-64 of this report. ECONOMIC FACTORS AND NEXT YEAR’S BUDGET The City prepares biennial budget, which focuses on long-term financial viability and allows decision-makers to better understand the on-going impact of current policy decisions. Through the budget, the Council sets the direction of the City, allocates its resources and establishes its priorities. Due to current economic climate, maintenance of the hiring freeze throughout the budget period and further cutbacks on operating expenditures have been implemented in developing the budget for fiscal year 2009-10. Furthermore, careful execution of capital spending will be necessary to assure that we do not spend money that may not materialize. CONTACTING THE CITY’S FINANCIAL MANAGEMENT This financial report is designed to provide our citizens, taxpayers, customers, investors and creditors with a general overview of the City’s finances and to show the City’s accountability for the money it receives. If you have questions about this report or need any additional financial information, contact the Finance Department at 250 East “L” Street, Benicia, CA 94510, phone (707) 746-4225.

CITY OF BENICIA
GOVERNMENT-WIDE FINANCIAL STATEMENTS
STATEMENT OF NET ASSETS AND STATEMENT OF ACTIVITIES


Governmental Business-TypeActivities Activities 2009 2008
Assets:Cash and investments (Note 2) 20,044,175$ 25,477,883 45,522,058 53,752,448 Receivables:
Accounts 2,602,404 1,861,293 4,463,697 3,825,398 Interest 25,772 22,700 48,472 167,900 Lease - 460,364 460,364 475,280 Notes and loans (Note 4) 3,317,090 1,889,587 5,206,677 4,772,149
Inventory 15,170 267,594 282,764 174,399 Prepaid items 76,427 81,524 157,951 175,759 Deferred charges - 455,624 455,624 528,941 Interfund balances (587,679) 587,679 - - Prepaid PERS contribution (Note 6) 12,601,889 - 12,601,889 12,938,284 Capital assets, not depreciated (Note 5) 22,955,551 5,196,958 28,152,509 27,664,198 Capital assets, depreciated, net (Note 5) 99,671,810 105,994,234 205,666,044 201,784,792
Total assets 160,722,609 142,295,440 303,018,049 306,259,548
Liabilities:Accounts payable and accrued expenses 3,248,453 747,469 3,995,922 3,596,531 Interest payable 176,786 413,945 590,731 622,661 Deposits payable 1,192 99,941 101,133 993,194 Claims and judgments payable (Note 12) 651,912 - 651,912 169,038 Unearned revenue - 365,028 365,028 379,694 Other postemployment benefits (Note 11) 297,978 - 297,978 - Noncurrent liabilities (Note 6):
Due within one year 2,759,425 3,293,738 6,053,163 5,865,118 Due in more than one year 21,661,976 44,519,778 66,181,754 70,894,096
Total liabilities 28,797,722 49,439,899 78,237,621 82,520,332
Net Assets:Invested in capital assets, net of related debt 113,264,434 63,624,158 176,888,592 170,461,576 Restricted for:
Capital projects 2,201,796 - 2,201,796 4,674,297 Special revenue projects 993,543 - 993,543 2,250,748
Unrestricted 15,465,114 29,231,383 44,696,497 46,352,595
Total net assets 131,924,887$ 92,855,541 224,780,428 223,739,216
CITY OF BENICIA
June 30, 2009Statement of Net Assets
Totals
(with comparative information for the prior year)
15

Operating CapitalCharges for Contributions Contributions
Expenses Services and Grants and GrantsGovernmental activities:
Administration 3,114,153$ 41,724 - - Public safety - police 9,150,887 200,824 397,053 - Public safety - fire 7,212,291 425,753 87,674 - Parks and community services 5,999,749 1,687,534 851,700 - Public works 4,186,559 265,001 1,285,707 - Library 2,403,239 186,595 127,309 - Community development 1,821,213 771,524 27,855 - Economic development 536,124 30 - - General government 4,283,723 316,230 132,199 - Interest expense 525,341 - - -
Total governmental activities 39,233,279 3,895,215 2,909,497 -
Business-type activities:Wastewater 7,294,741 6,897,189 - - Water 7,345,574 6,772,607 - 2,000,000 Benicia Marina 594,863 323,034 64,000 - Transit 1,370,621 153,573 535,934 - Total business-type activities 16,605,799 14,146,403 599,934 2,000,000
Total 55,839,078$ 18,041,618 3,509,431 2,000,000
General revenues: Taxes: Property Sales and use Utilities users' tax Franchise Other Motor vehicle in lieu, unrestricted Investment income Gain from disposal of capital assetsTransfers, net
Total general revenues
Change in net assets
Net assets at beginning of year, as restated (Note 15)
Net assets at end of year
CITY OF BENICIAStatement of Activities
Fiscal year ended June 30, 2009(with comparative information for the prior year)
Program Revenues
16

Governmental Business-typeActivities Activities 2009 2008
(3,072,429) - (3,072,429) (2,767,732) (8,553,010) - (8,553,010) (8,222,774) (6,698,864) - (6,698,864) (6,719,959) (3,460,515) - (3,460,515) (5,318,199) (2,635,851) - (2,635,851) (2,728,212) (2,089,335) - (2,089,335) (2,020,473) (1,021,834) - (1,021,834) (1,263,276)
(536,094) - (536,094) (472,311) (3,835,294) - (3,835,294) (2,368,323)
(525,341) - (525,341) (472,189)
(32,428,567) - (32,428,567) (32,353,448)
- (397,552) (397,552) (68,455) - 1,427,033 1,427,033 (430,716) - (207,829) (207,829) (13,189) - (681,114) (681,114) 186,934 - 140,538 140,538 (325,426)
(32,428,567) 140,538 (32,288,029) (32,678,874)
13,812,912 - 13,812,912 14,275,802 7,688,775 - 7,688,775 7,514,259 4,413,428 - 4,413,428 4,190,516 1,851,511 - 1,851,511 1,589,752
747,468 - 747,468 1,644,732 2,059,561 - 2,059,561 1,992,604
851,097 1,151,428 2,002,525 2,507,248 - 5,598 5,598 27,900
30,415 (30,415) - -
31,455,167 1,126,611 32,581,778 33,742,812
(973,400) 1,267,149 293,749 1,063,938
132,898,287 91,588,392 224,486,679 222,675,278
131,924,887$ 92,855,541 224,780,428 223,739,216
Totals
Net (Expense) Revenue and Changes in Net Assets
17


CITY OF BENICIA
Fund Financial Statements
The fund described below was determined to be a Major Fund by the City in fiscal year 2009. Individual non-major funds may be found in the Supplemental section. GENERAL FUND The General fund is used for all of the general revenues of the City not specifically levied or collected for other City funds and the related expenditures.

NonmajorGeneral Governmental
Fund Funds 2009 2008
Cash and investments 6,743,672$ 9,919,074 16,662,746 19,918,345 Receivables:
Accounts 1,058,223 1,544,181 2,602,404 1,443,469 Interest 14,888 8,004 22,892 71,297 Notes and loans (Note 4) 1,192,578 2,124,512 3,317,090 3,075,076
Due from other funds (Note 3) 966,714 575,687 1,542,401 912,154 Prepaid items 37,000 16,479 53,479 48,903 Advances to other funds (Note 3) 364,164 - 364,164 250,000
Total assets 10,377,239$ 14,187,937 24,565,176 25,719,244
Liabilities:Accounts payable 1,149,862$ 983,147 2,133,009 2,357,179 Accrued payroll 116,614 899,868 1,016,482 199,662 Deposits payable 1,192 - 1,192 894,585 Due to other funds (Note 3) - 858,909 858,909 277,430 Deferred revenue 1,192,578 2,900,199 4,092,777 3,233,497 Advances from other funds (Note 3) 1,627,009 - 1,627,009 -
Total liabilities 4,087,255 5,642,123 9,729,378 6,962,353
Fund balances:Reserved:
Encumbrances 226,523 509,613 736,136 3,614,679 Debt service - 1,123,535 1,123,535 1,126,958 Prepaid items 37,000 16,479 53,479 48,903 Open space - 110,000 110,000 110,000 Advances to other funds 364,164 - 364,164 250,000
Unreserved:Designated for:
Future projects 45,574 - 45,574 2,209,014 aCable grant 35,489 - 35,489 94,894
Economic uncertainty 807,458 - 807,458 1,592,669 Exposures reserve 1,591,259 - 1,591,259 1,592,669 Emergency reserve 3,182,517 - 3,182,517 3,185,339
Undesignated, reported in:General fund - - - 621,895 Special revenue - 3,406,367 3,406,367 3,169,621 Debt service - - - - Capital projects - 3,379,820 3,379,820 1,140,250
Total fund balances 6,289,984 8,545,814 14,835,798 18,756,891
Total liabilities and fund balances 10,377,239$ 14,187,937 24,565,176 25,719,244
Assets
Liabilities and Fund Balances
Total Governmental Funds
CITY OF BENICIAGovernmental Funds
Balance SheetJune 30, 2009
(with comparative information for the prior year)
20

Fund balances of governmental funds 14,835,798$
Amounts reported for governmental activities in the statement of net assets are different because:
Capital assets have not been included as financial resources in governmental fund activity:
Capital assets 168,771,108 Accumulated depreciation (55,044,728)
Long term debt and compensated absences that have not been included in governmental fund activity:
Bonds payable (9,034,954) Compensated absences (1,382,097) Claims payable (101,742) Other post employment benefits (297,978)
Accrued interest payable for the current portion of interest due on bonds payable has not been reported in the governmental funds. (142,047)
Deferred revenue balances relating to certain receivables are not reported as liabilities in the Statement of Net Assets since revenue recognition is not based upon measurable and available criteria. 4,092,777
Internal service funds are used by management to charge the costs of certain activities, such as equipment management, to individual funds. The assets and liabilities of the internal service funds must be added to the statement of net assets. 10,228,750
Net assets of governmental activities 131,924,887$
June 30, 2009
CITY OF BENICIAGovernmental Funds
Reconciliation of the Balance Sheet of Governmental Fundsto the Statement of Net Assets
21

Non-majorGeneral Governmental
Fund Funds 2009 2008Revenues:
Property taxes 13,053,648$ 759,264 13,812,912 14,275,801 Sales and use taxes 6,958,722 730,053 7,688,775 7,514,258 Utility users' taxes 4,413,428 - 4,413,428 4,190,517 Other taxes 2,598,979 - 2,598,979 2,390,562 Special assessments - 565,996 565,996 442,713 License and permits 323,241 - 323,241 349,130 Fines and forfeitures 115,596 - 115,596 128,770 Investment income 588,099 287,370 875,469 1,494,578 Rents and leases 124,174 3,810 127,984 134,074 Intergovernmental 2,205,716 2,245,522 4,451,238 4,599,537 Charges for services 1,714,122 630,695 2,344,817 2,475,882 Donations 1,996 117,690 119,686 135,786 Miscellaneous revenues 296,167 76,988 373,155 255,517
Total revenues 32,393,888 5,417,388 37,811,276 38,387,125
ExpendituresCurrent:
Administration 2,975,571 - 2,975,571 2,729,399 Public safety - police 8,228,318 316,372 8,544,690 8,292,356 Public safety - fire 6,974,688 - 6,974,688 6,782,268 Parks and community services 5,172,847 499,323 5,672,170 5,764,217 Public works 1,908,541 312,215 2,220,756 1,912,747 Library 1,285,346 1,036,913 2,322,259 2,262,383 Community development 1,392,965 875,438 2,268,403 2,263,730 Economic development 485,904 31,364 517,268 466,322 General government 4,187,891 - 4,187,891 3,025,451
Capital outlay 476,422 4,407,554 4,883,976 4,227,287 Debt service:
Principal - 734,049 734,049 698,064 Interest - 451,063 451,063 481,502
Total expenditures 33,088,493 8,664,291 41,752,784 38,905,726
Excess (deficiency) of revenues over (under) expenditures (694,605) (3,246,903) (3,941,508) (518,601)
Other financing sources (uses):Proceeds from sale of capital assets - - - 21,980 Transfers in (Note 3) 99,826 3,349,092 3,448,918 2,653,351 Transfers out (Note 3) (2,822,795) (605,708) (3,428,503) (2,662,273)
Total other financing sources (uses) (2,722,969) 2,743,384 20,415 13,058
Net change in fund balances (3,417,574) (503,519) (3,921,093) (505,543)
Fund balances at beginning of year 9,707,558 9,049,333 18,756,891 19,262,434
Fund balances at end of year 6,289,984$ 8,545,814 14,835,798 18,756,891
Total Governmental Funds
CITY OF BENICIAGovernmental Funds
Statement of Revenues, Expenditures and Changes in Fund BalancesFiscal year ended June 30, 2009
(with comparative information for the prior year)
22
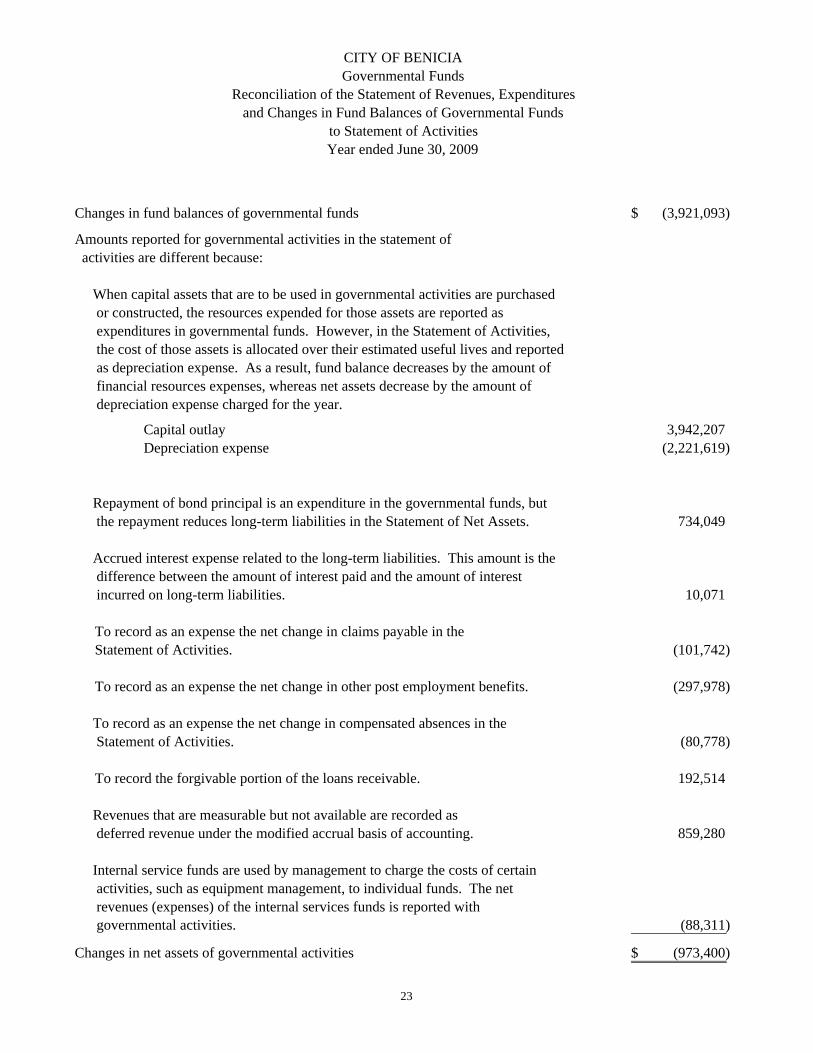
Changes in fund balances of governmental funds (3,921,093)$
Amounts reported for governmental activities in the statement of activities are different because:
When capital assets that are to be used in governmental activities are purchased or constructed, the resources expended for those assets are reported as expenditures in governmental funds. However, in the Statement of Activities, the cost of those assets is allocated over their estimated useful lives and reported as depreciation expense. As a result, fund balance decreases by the amount of financial resources expenses, whereas net assets decrease by the amount of depreciation expense charged for the year.
Capital outlay 3,942,207 Depreciation expense (2,221,619)
Repayment of bond principal is an expenditure in the governmental funds, but the repayment reduces long-term liabilities in the Statement of Net Assets. 734,049
Accrued interest expense related to the long-term liabilities. This amount is the difference between the amount of interest paid and the amount of interest incurred on long-term liabilities. 10,071
To record as an expense the net change in claims payable in theStatement of Activities. (101,742)
To record as an expense the net change in other post employment benefits. (297,978)
To record as an expense the net change in compensated absences in the Statement of Activities. (80,778)
To record the forgivable portion of the loans receivable. 192,514
Revenues that are measurable but not available are recorded as deferred revenue under the modified accrual basis of accounting. 859,280
Internal service funds are used by management to charge the costs of certain activities, such as equipment management, to individual funds. The net revenues (expenses) of the internal services funds is reported with governmental activities. (88,311)
Changes in net assets of governmental activities (973,400)$
to Statement of ActivitiesYear ended June 30, 2009
CITY OF BENICIAGovernmental Funds
Reconciliation of the Statement of Revenues, Expendituresand Changes in Fund Balances of Governmental Funds
23

Variance withFinal Budget Prior
Positive YearOriginal Final Actual (Negative) Actual
Revenues:Property taxes 14,530,620$ 13,250,795 13,053,648 (197,147) 13,534,307 Sales and use tax 6,563,420 6,442,435 6,958,722 516,287 6,794,113 Utility users' taxes 4,042,940 4,403,510 4,413,428 9,918 4,190,517 Other taxes 2,407,970 2,634,880 2,598,979 (35,901) 2,390,562 Licenses and permits 350,000 295,130 323,241 28,111 349,130 Fines and forfeitures 130,000 115,500 115,596 96 128,770 Investment income 717,130 974,105 588,099 (386,006) 1,021,289 Rents and leases 135,410 136,830 124,174 (12,656) 119,674 Intergovernmental 2,453,930 2,460,065 2,205,716 (254,349) 2,176,590 Charges for services 1,421,450 1,185,950 1,714,122 528,172 1,598,978 Donations - 1,300 1,996 696 - Miscellaneous revenues 124,470 1,776,450 296,167 (1,480,283) 244,177
Total revenues 32,877,340 33,676,950 32,393,888 (1,283,062) 32,548,108
Expenditures:Current:
Administration 2,766,115 3,026,895 2,975,571 51,324 2,729,399 Public safety - police 8,182,155 8,084,480 8,228,318 (143,838) 7,980,703 Public safety - fire 6,920,275 7,143,200 6,974,688 168,512 6,782,268 Parks and community services 5,518,490 5,573,110 5,172,847 400,263 5,234,434 Public works 2,011,000 2,049,560 1,908,541 141,019 1,892,290 Library 1,241,465 1,276,140 1,285,346 (9,206) 1,209,775 Community development 1,457,370 513,805 1,392,965 (879,160) 1,426,218 Economic development 482,720 4,056,100 485,904 3,570,196 464,110 General 2,690,065 330,370 4,187,891 (3,857,521) 3,025,451
Capital outlay 321,455 1,486,165 476,422 1,009,743 394,489
Total expenditures 31,591,110 33,539,825 33,088,493 451,332 31,139,137
Excess (deficiency) of revenuesover expenditures 1,286,230 137,125 (694,605) (831,730) 1,408,971
Other financing sources (uses):Proceeds from sale of capital assets - - - - 21,980 Transfers in 80,415 80,415 99,826 19,411 94,813 Transfers out (1,353,380) (2,837,250) (2,822,795) 14,455 (2,087,234)
Total other financing sources (uses): (1,272,965) (2,756,835) (2,722,969) 33,866 (1,970,441)
Net change in fund balance 13,265 (2,619,710) (3,417,574) (797,864) (561,470)
Fund balance at beginning of year 9,707,558 9,707,558 9,707,558 - 10,287,098
Fund balance at end of year 9,720,823$ 7,087,848 6,289,984 (797,864) 9,725,628
CITY OF BENICIAGeneral Fund
Statement of Revenues, Expenditures, and Changes in Fund Balances
Budget
Budget and ActualFiscal year ended June 30, 2009
(With comparative information for the prior year)
24

CITY OF BENICIA
Major Proprietary Funds
Proprietary funds account for City operations financed and operated in a manner similar to a private business enterprise. The intent of the City is that the cost of providing goods and services be financed primarily through user charges. The City reported all of its Enterprise Funds as major funds in fiscal 2009. WASTEWATER Accounts for the transport, treatment and disposal of wastewater for residents and businesses located within the City. WATER Accounts for the purchase, treatment and distribution of water to residents and businesses located within the City. BENICIA MARINA Accounts for the operation and management of the City Marina. TRANSIT Accounts for the operation and management of the City transit operations.

Wastewater Water Marina Transit TotalsAssets:
Current assets:Cash and investments 11,608,289$ 13,869,594 - - 25,477,883 Accounts receivable 642,334 668,771 70,685 479,503 1,861,293 Interest receivable 11,010 11,690 - - 22,700 Inventory 28,595 238,999 - - 267,594 Prepaid items - 6,524 75,000 - 81,524
Total current assets 12,290,228 14,795,578 145,685 479,503 27,710,994
Non-current assets:Prepaid PERS contribution - - - - - Deferred charges 195,058 260,566 - - 455,624 Loans receivable 986,865 902,722 - - 1,889,587 Lease receivable - - 460,364 - 460,364 Advances to other funds (Note 3) 1,627,009 - - - 1,627,009 Capital assets, net of accumulated depreciation 65,724,546 41,380,685 3,470,047 615,914 111,191,192
Total non-current assets 68,533,478 42,543,973 3,930,411 615,914 115,623,776
Total assets 80,823,706$ 57,339,551 4,076,096 1,095,417 143,334,770
Liabilities:Current liabilities:
Accounts payable 183,368$ 306,780 - 257,321 747,469 Interest payable 209,566 45,353 159,026 - 413,945 Deposits payable - 24,015 75,000 926 99,941 Due to other funds (Note 3) - - 79,590 595,576 675,166 Unearned revenue 329,028 36,000 - - 365,028 Workers' compensation claims - - - - - Compensated absences 119,731 126,751 - - 246,482 Current portion of long-term debt 1,726,144 1,170,650 150,462 - 3,047,256
Total current liabilities 2,567,837 1,709,549 464,078 853,823 5,595,287
Long-term liabilities:Workers' compensation claims - - - - - Utility revenue bonds 3,196,801 6,355,101 - - 9,551,902 Loans payable 20,969,424 10,293,736 3,704,716 - 34,967,876 Lease obligation - - - - - Pension obligation bonds - - - - - Advances from other funds (Note 3) - - 160,321 203,843 364,164
Total long-term liabilities 24,166,225 16,648,837 3,865,037 203,843 44,883,942
Total liabilities 26,734,062 18,358,386 4,329,115 1,057,666 50,479,229
Net assets:Invested in capital assets, net of related debt 39,832,177 23,561,198 (385,131) 615,914 63,624,158 Unrestricted 14,257,467 15,419,967 132,112 (578,163) 29,231,383
Total net assets (deficit) 54,089,644$ 38,981,165 (253,019) 37,751 92,855,541
Business-Type Activities - Enterprise Funds
CITY OF BENICIAProprietary Funds
Statement of Net AssetsJune 30, 2009
(with comparative information for the prior year)
26

GovernmentalActivities
Internal ServiceFunds 2009 2008
3,381,430 28,859,313 33,834,103 - 1,861,293 2,381,929
2,880 25,580 96,603 15,170 282,764 174,399 22,948 104,472 126,856
3,422,428 31,133,422 36,613,890
12,601,889 12,601,889 12,938,284 - 455,624 528,941 - 1,889,587 1,889,587 - 460,364 475,280
314,853 1,941,862 343,460 8,900,981 120,092,173 118,190,661
21,817,723 137,441,499 134,366,213
25,240,151 168,574,921 170,980,103
98,963 846,432 1,208,728 34,739 448,684 470,543
- 99,941 98,609 8,326 683,492 634,724
- 365,028 379,694 200,200 200,200 200,200
- 246,482 241,400 885,000 3,932,256 3,684,785
1,227,228 6,822,515 6,918,683
349,970 349,970 411,691 - 9,551,902 10,493,092 - 34,967,876 37,065,131
327,973 327,973 - 12,791,377 12,791,377 13,592,593
314,853 679,017 593,460
13,784,173 58,668,115 62,155,967
15,011,401 65,490,630 69,074,650
8,573,008 72,197,166 67,997,829 1,655,742 30,887,125 33,907,624
10,228,750$ 103,084,291 101,905,453
Total Proprietary Funds
27

Wastewater Water Marina Transit TotalsOperating revenues:
Charges for services 6,627,115$ 6,644,772 - 146,836 13,418,723 Connection fees 178,341 109,704 - - 288,045 Rentals - - 323,034 - 323,034 Other 91,733 18,131 - 6,737 116,601
Total operating revenues 6,897,189 6,772,607 323,034 153,573 14,146,403
Operating expenses:Wages and benefits 2,249,417 2,425,030 - 27,713 4,702,160 Materials and supplies 649,260 672,715 - - 1,321,975 Operations and maintenance 1,548,655 1,624,872 231,228 1,160,884 4,565,639 Purchased water - 366,306 - - 366,306 Claims - - - - - Depreciation 2,192,791 1,648,734 189,612 172,024 4,203,161
Total operating expenses 6,640,123 6,737,657 420,840 1,360,621 15,159,241
Operating income 257,066 34,950 (97,806) (1,207,048) (1,012,838)
Nonoperating revenues (expenses):Interest income 505,384 623,951 22,093 - 1,151,428 Interest (expense) (631,077) (549,331) (174,023) (10,000) (1,364,431) Amortization of issuance cost of debt (23,541) (58,586) - - (82,127) Intergovernmental revenue - - 64,000 535,934 599,934 Pension obligation amortization - - - - - Gain from sale of capital assets 1,503 4,095 - - 5,598
Total nonoperating revenues (expenses) (147,731) 20,129 (87,930) 525,934 310,402
Income (loss) beforetransfers and contributions 109,335 55,079 (185,736) (681,114) (702,436)
Transfers and capital contributions:Capital contributions - 2,000,000 - - 2,000,000 Transfers in (note 3) - - - 50,000 50,000 Transfers out (note 3) (32,165) (48,250) - - (80,415)
Total transfers and capital contributions (32,165) 1,951,750 - 50,000 1,969,585
Change in net assets 77,170 2,006,829 (185,736) (631,114) 1,267,149
Net assets (deficits) at beginning of year 54,012,474 36,974,336 (67,283) 668,865 91,588,392
Net assets (deficits) at end of year 54,089,644$ 38,981,165 (253,019) 37,751 92,855,541
Business-Type Activities - Enterprise Funds
CITY OF BENICIAProprietary Funds
Statement of Revenues, Expenses and Changes in Fund Net AssetsFiscal year ended June 30, 2009
(with comparative information for the prior year)
28
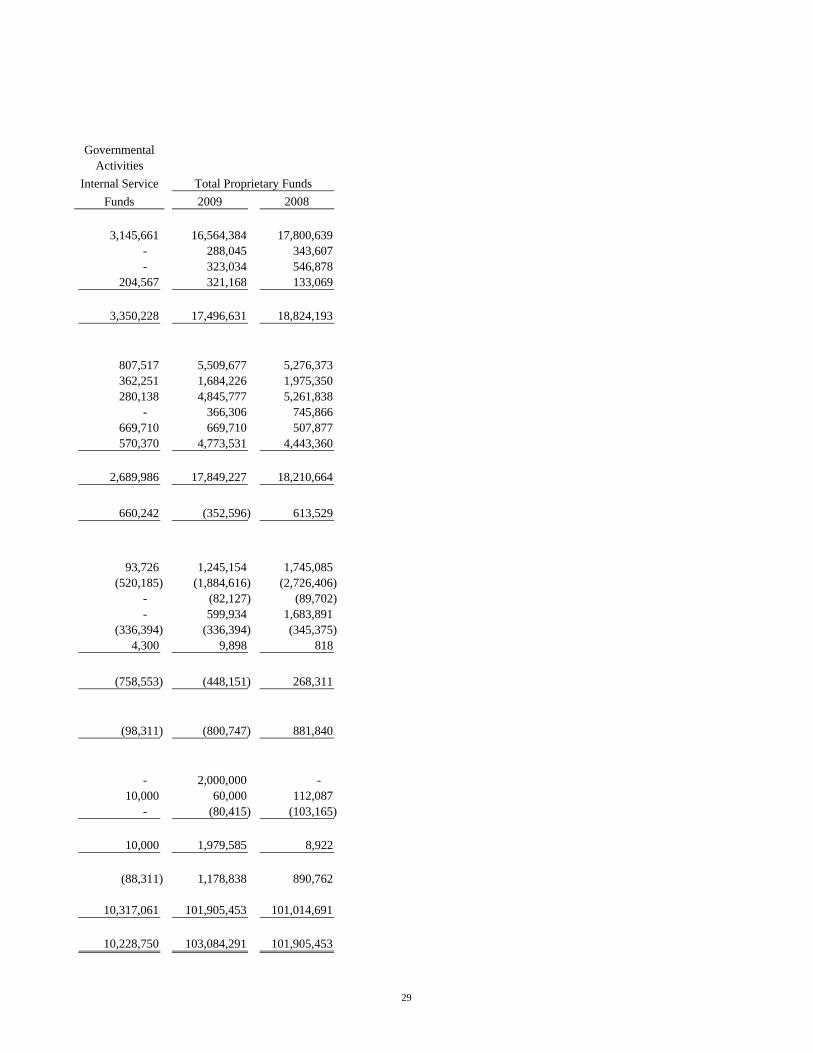
GovernmentalActivities
Internal ServiceFunds 2009 2008
3,145,661 16,564,384 17,800,639 - 288,045 343,607 - 323,034 546,878
204,567 321,168 133,069
3,350,228 17,496,631 18,824,193
807,517 5,509,677 5,276,373 362,251 1,684,226 1,975,350 280,138 4,845,777 5,261,838
- 366,306 745,866 669,710 669,710 507,877 570,370 4,773,531 4,443,360
2,689,986 17,849,227 18,210,664
660,242 (352,596) 613,529
93,726 1,245,154 1,745,085 (520,185) (1,884,616) (2,726,406)
- (82,127) (89,702) - 599,934 1,683,891
(336,394) (336,394) (345,375) 4,300 9,898 818
(758,553) (448,151) 268,311
(98,311) (800,747) 881,840
- 2,000,000 - 10,000 60,000 112,087
- (80,415) (103,165)
10,000 1,979,585 8,922
(88,311) 1,178,838 890,762
10,317,061 101,905,453 101,014,691
10,228,750 103,084,291 101,905,453
Total Proprietary Funds
29

Wastewater Water Marina Transit Totals
Cash flows from operating activities:Receipts from customers 6,933,837$ 6,885,561 267,265 581,958 14,668,621 Payments to suppliers for goods and services (2,195,532) (3,163,545) (240,134) (1,090,383) (6,689,594) Payments to employees for services (2,251,002) (2,418,363) - (27,713) (4,697,078)
Net cash provided by (used for) operating activities 2,487,303 1,303,653 27,131 (536,138) 3,281,949
Cash flows from non-capital and related financing activities:
Operating grants and contributions - - 64,000 535,934 599,934 Principal paid in non-capital debt - - - - - Interest paid in non-capital debt - - - - - Transfers in - - - 50,000 50,000 Transfers (out) (32,165) (48,250) - - (80,415) Advances to other funds (1,627,009) - - - (1,627,009) Advances from other funds - - 210,721 6,361 217,082
Net cash provided by (used for) non-capital and related financing activities (1,659,174) (48,250) 274,721 592,295 (840,408)
Cash flows from capital and related financing activities:Principal paid on debt (1,691,554) (1,139,248) (143,982) (46,157) (3,020,941) Proceeds from capital lease - - - - - Capital contributions - 2,000,000 - - 2,000,000 Interest paid on debt (644,457) (552,435) (179,963) (10,000) (1,386,855) Acquisition of capital assets (352,280) (6,123,822) - - (6,476,102) Proceeds from sale of capital assets 1,503 4,095 - - 5,598
Net cash provided by (used for) capital and related financing activities (2,686,788) (5,811,410) (323,945) (56,157) (8,878,300)
Cash flows from investing activities:Interest received 532,888 660,648 22,093 - 1,215,629
Net cash provided by (used for) investing activities 532,888 660,648 22,093 - 1,215,629
Net increase (decrease) in cash and cash equivalents (1,325,771) (3,895,359) - - (5,221,130)
Cash and cash equivalents at beginning of year 12,934,060 17,764,953 - - 30,699,013
Cash and cash equivalents at end of year 11,608,289$ 13,869,594 - - 25,477,883
CITY OF BENICIAProprietary Funds
Statement of Cash FlowsFiscal year ended June 30, 2009
(with comparative information for the prior year)
30

GovernmentalActivities
Internal ServiceFunds 2009 2008
3,350,228 18,018,849 18,565,629 (1,382,870) (8,072,464) (8,520,081)
(807,517) (5,504,595) (5,564,581)
1,159,841 4,441,790 4,480,967
- 599,934 - (710,000) (710,000) (470,000) (414,729) (414,729) (414,667)
10,000 60,000 - - (80,415) 2,061,191
28,607 (1,598,402) (103,165) (36,600) 180,482 -
(1,122,722) (1,963,130) 1,073,359
(37,027) (3,057,968) (3,168,978) 365,000 365,000 -
- 2,000,000 - (24,660) (1,411,515) (1,546,755)
(198,941) (6,675,043) (3,661,566) 4,300 9,898 11,485
108,672 (8,769,628) (8,365,814)
100,549 1,316,178 1,840,737
100,549 1,316,178 1,840,737
246,340 (4,974,790) (970,751)
3,135,090 33,834,103 34,804,854
3,381,430 28,859,313 33,834,103
Totals
31

Wastewater Water Marina Transit TotalsReconciliation of operating income to net cash provided by operating activities:
Operating income (loss) 257,066$ 34,950 (97,806) (1,207,048) (1,012,838) Adjustments to reconcile operating income (loss) to net cash provided by operating activities:
Depreciation 2,192,791 1,648,734 189,612 172,024 4,203,161 (Increase) decrease in accounts receivable 51,314 111,894 (55,769) 428,113 535,552 (Increase) decrease in prepaid items - (6,524) - - (6,524) (Increase) decrease in inventory 1,751 (117,616) - - (115,865) (Increase) decrease in other assets - - - - - Increase (decrease) in accounts payable 632 (375,512) (8,906) 70,501 (313,285) Increase (decrease) in deferred revenue (14,666) - - (14,666) Increase (decrease) in deposits payable - 1,060 - 272 1,332 Increase (decrease) in compensated absences (1,585) 6,667 - - 5,082 Increase (decrease) in workers' compensation claims - - - - -
Net cash provided by (used for) operating activities 2,487,303$ 1,303,653 27,131 (536,138) 3,281,949
There were no significant noncash investing or financing activities for the year ended June 30, 2009.
(Continued)
CITY OF BENICIAProprietary Funds
Statement of Cash Flows
32

GovernmentalActivities
Internal ServiceFunds 2009 2008
660,242 (352,596) 613,529
570,370 4,773,531 4,443,360 - 535,552 140,683
28,908 22,384 - 7,500 (108,365) (3,663)
- - 81,880 (45,458) (358,743) (318,428)
- (14,666) (370,926) - 1,332 (28,395) - 5,082 1,149
(61,721) (61,721) (78,222)
1,159,841 4,441,790 4,480,967
Totals
33


CITY OF BENICIA
Fiduciary Funds
Trust funds are used to account for assets held by the City as a trustee agent for individuals, private organizations. and other governments. The financial activities of these funds are excluded from the Entity-wide financial statements, but are presented in separate Fiduciary Fund financial statements. The City maintains a Trust Fund for the Affordable Housing Private Purpose Trust. Agency funds are used to account for assets held by the City as an agent for individuals, private organizations, and other governments. The financial activities of these funds are excluded from the Entity-wide financial statements, but are presented in separate Fiduciary Fund financial statements. The City maintains its Agency Funds for its assessment districts.

Affordable HousingPrivate Purpose Agency
Trust Funds 2009 2008Assets
Cash and investments (Note 2) 19,160$ 3,217,885 3,237,045 3,187,507 Interest receivable 17 2,701 2,718 8,645
Total assets 19,177$ 3,220,586 3,239,763 3,196,152
Liabilities
Due to bondholders -$ 3,220,586 3,220,586 3,177,570
Total liabilities - 3,220,586 3,220,586 3,177,570
Net Assets
Held in trust for:Other governments 19,177 19,177 18,582
Total Net Assets 19,177$ 19,177 18,582
Totals
CITY OF BENICIAFiduciary Funds
Statement of Fiduciary Net AssetsJune 30, 2009
(with comparative information for the prior year)
36

2009 2008Additions
Investment income 595$ 755
Total additions 595 755
Change in net assets 595 755
Net assets, beginning of year 18,582 17,827
Net assets, end of year 19,177$ 18,582
Affordable HousingPrivate Purpose Trust
CITY OF BENICIAFiduciary Funds
Statement of Changes in Fiduciary Net AssetsFiscal year ended June 30, 2009
(with comparative information for the prior year)
37


CITY OF BENICIA
Notes to the Basic Financial Statements
39
Note 1 - Summary of Significant Accounting Policies
The City of Benicia was incorporated as a general law city on April 24, 1851. The City operates under the Council-Manager form of government and provides the following services: public safety (police and fire), highways and streets, water. wastewater, culture-recreation, public improvements, planning and zoning, transit and general administration
The financial statements and accounting policies of the City conform with generally accepted accounting principles applicable to governments. The Governmental Accounting Standards Board (GASB) is the accepted standard-setting body for establishing governmental accounting and financial reporting principles. Significant accounting policies are summarized below:
A. Reporting Entity
The financial statements of the City of Benicia include the financial activities of the City.
B. Basis of Presentation
The City’s Basic Financial Statements are prepared in conformity with accounting principles generally accepted in the United States of America. The Government Accounting Standards Board is the acknowledged standard setting body for establishing accounting and financial reporting standards followed by governmental entities in the U.S.A.
These Standards require that the financial statements described below be presented.
Government-wide Statements: The Statement of Net Assets and the Statement of Activities display information about the primary government (the City). These statements include the financial activities of the overall City government, except for fiduciary activities. These statements distinguish between the governmental and business-type activities of the City. Governmental activities generally are financed through taxes, intergovernmental revenues, and other nonexchange transactions. Business-type activities are financed in whole or in part by fees charged to external parties.
The Statement of Activities presents a comparison between direct expenses and program revenues for each segment of the business-type activities of the City and for each function of the City’s governmental activities. Direct expenses are those that are specifically associated with a program or function and, therefore, are clearly identifiable to a particular function. Program revenues include (a) charges paid by the recipients of goods or services offered by the programs, (b) grants and contributions that are restricted to meeting the operational needs of a particular program and (c) fees, grants and contributions that are restricted to financing the acquisition or construction of capital assets. Revenues that are not classified as program revenues, including all taxes, are presented as general revenues.
Fund Financial Statements: The fund financial statements provide information about the City’s funds, including fiduciary funds. Separate statements for each fund category— governmental, proprietary, and fiduciary are presented. The emphasis of fund financial statements is on major individual governmental and enterprise funds, each of which is displayed in a separate column. All remaining governmental and enterprise funds are aggregated and reported as nonmajor funds.

CITY OF BENICIA
Notes to the Basic Financial Statements
40
Note 1 - Summary of Significant Accounting Policies, (Continued)
Proprietary fund operating revenues, such as charges for services, result from exchange transactions associated with the principal activity of the fund. Exchange transactions are those in which each party receives and gives up essentially equal values. Nonoperating revenues, such as subsidies and investment earnings, result from nonexchange transactions or ancillary activities.
C. Major Funds Major funds are defined as funds that have either assets, liabilities, revenues or expenditures/expenses equal to ten percent of their fund-type total and five percent of the grand total. The General Fund is always a major fund. The City may also select other funds it believes should be presented as major funds.
The City reported the following major governmental fund in the accompanying financial statements:
General Fund – The General Fund is used for all the general revenues of the City not specifically levied or collected for other City funds and the related expenditures. The general fund accounts for all financial resources of a governmental unit, which are not accounted for in another fund.
The City reported all of its enterprise funds as major funds in the accompanying financial statements:
Wastewater Fund – Accounts for the transport, treatment and disposal of wastewater for residents and businesses located within the City.
Water Fund – Accounts for the distribution of water to residents and businesses located within the City.
Benicia Marina Fund – Accounts for activities of the City’s Marina.
Transit Fund – Accounts for the operation and management of the City transit operations.
The City also reports the following fund types:
Fiduciary Funds - The City maintains two types of Fiduciary Funds - Trust Funds and Agency Funds. The Trust Fund accounts for activities of an individual private trust fund for the benefit of the Affordable Housing. Agency Funds are used to account for assets held by the City as an agent for the Fleetside Industrial Assessment District, East 2nd Street Assessment District, Combined Drake/Gateway Assessment District and McAllister Assessment District. The financial activities of these funds are excluded from the Government-wide financial statement.
D. Basis of Accounting
The government-wide and proprietary financial statements are reported using the economic resources measurement focus and the full accrual basis of accounting. Revenues are recorded when earned and expenses are recorded at the time liabilities are incurred, regardless of when the related cash flows take place.

CITY OF BENICIA
Notes to the Basic Financial Statements
41
Note 1 - Summary of Significant Accounting Policies, (Continued)
Governmental funds are reported using the current financial resources measurement focus and the modified accrual basis of accounting. Under this method, revenues are recognized when measurable and available. The City considers all revenues reported in the governmental funds to be available if the revenues are collected within sixty days after year-end. Expenditures are recorded when the related fund liability is incurred, except for principal and interest on general long-term debt, claims and judgments, and compensated absences, which are recognized as expenditures to the extent they have matured. Governmental capital asset acquisitions are reported as expenditures in governmental funds. Proceeds of governmental long-term debt and acquisitions under capital leases are reported as other financing sources.
Those revenues susceptible to accrual at both the City-wide and Fund level are property, sales and franchise taxes, current service charges, and interest revenue. Fines and licenses and permits are not susceptible to accrual because they are not measurable until received in cash.
Non-exchange transactions, in which the City gives or receives value without directly receiving or giving equal value in exchange, include taxes, grants, entitlements, and donations. On the accrual basis, revenue from taxes is recognized in the fiscal year for which the taxes are levied or assessed. Revenues from grants, entitlements, and donations are recognized in the fiscal year in which all eligibility requirements have been satisfied.
Grant revenues are recognized in the fiscal year in which all eligibility requirements are met. Under the terms of grant agreements, the City may fund certain programs with a combination of cost-reimbursement grants, categorical block grants and general revenues. Thus, both restricted and unrestricted net assets may be available to finance program expenditures. The City’s policy is to first apply restricted grant resources to such programs, followed by general revenues if necessary,
Certain indirect costs are included in program expenses reported for individual functions and activities.
The City follows Statements and Interpretations of the Financial Accounting Standards Board and its predecessors that were issued on or before November 30, 1989, in accounting for its business-type activities, unless they conflict with Government Accounting Standards Board pronouncements.
As a general rule, the effect of interfund activity has been eliminated from the government-wide financial statements. Exceptions to this general rule are payments-in-lieu of taxes and other charges between the government’s business-type activities and various other functions of the government. Elimination of these charges would distort the direct costs and program revenues reported for the various functions concerned.
Amounts reported as program revenues include 1) charges to customers or applicants for goods, services, or privileges provided, 2) operating grants and contributions, and 3) capital grants and contributions, including special assessments. Internally dedicated resources are reported as general revenues rather than as program revenues. Likewise, general revenues include all taxes.

CITY OF BENICIA
Notes to the Basic Financial Statements
42
Note 1 - Summary of Significant Accounting Policies, (Continued)
Proprietary funds distinguish operating revenues and expenses from nonoperating items. Operating revenues and expenses generally result from providing services and producing and delivering goods in connection with a proprietary fund’s principal ongoing operations. The principal operating revenues of the City’s enterprise funds and internal service funds are charges to customers for sales and services. The City also recognizes as operating revenue the portion of tap fees intended to recover the cost of connecting new customers to the system. Operating expenses for enterprise funds and internal service funds include the cost of sales and services, administrative expenses and depreciation on capital assets. All revenues and expenses not meeting this definition are reported as nonoperating revenues and expenses.
E. Property Tax Revenues
Solano County assesses properties and bills, collects, and distributes property taxes to the City. The County remits the entire amount levied and handles all delinquencies, retaining interest and penalties. Secured and unsecured property taxes are levied on January 1.
Secured property tax is due in two installments, on November 1 and March 1, and becomes a lien on those dates. It becomes delinquent on December 10 and April 10, respectively. Unsecured property tax is due on July 1, and becomes delinquent on August 31.
The term “unsecured” refers to taxes on personal property other than real estate, land and buildings. These taxes are secured by liens on the property being taxed. Property tax revenues are recognized by the City in the fiscal year they are assessed, provided they become available as defined above.
F. Revenue Recognition For Water and Sewer Revenues are recognized based on cycle billings rendered to customers. Revenues for services provided but not billed at the end of a fiscal period are accrued at the end of the fiscal year.
G. Cash and Investments
Investments are reported in the accompanying balance sheet at fair value. Changes in fair value that occur during a fiscal year are recognized as investment income reported for that fiscal year. Investment income includes interest earnings, changes in fair value, and any gains or losses realized upon the liquidation, maturity, or sale of investments. The City pools cash and investments of all funds, except for assets held by fiscal agents. Each fund’s share of this pool is displayed in the accompanying financial statements as cash and investments. Investment income earned by the pooled investments is allocated to the various funds based on each fund’s average cash and investment balance.

CITY OF BENICIA
Notes to the Basic Financial Statements
43
Note 1 - Summary of Significant Accounting Policies, (Continued)
H. Capital Assets All capital assets are valued at historical cost or estimated historical cost if actual historical cost is not available. Contributed capital assets are valued at their estimated fair market value on the date contributed. The City defines capital assets as assets with an initial individual cost of more than $25,000 and an estimated useful life in excess of three years with the exception of Federally funded acquisitions, which are $5,000 or more. Land and infrastructure are capitalized at an initial individual cost of more than $150,000.
Depreciation is provided using the straight-line method which means the cost of the asset is divided by its expected useful life in years and the result is charged to expense each year until the asset is fully depreciated. The City has assigned the useful lives listed below to capital assets:
Buildings & Improvements 15-50 years Machinery & Equipment 5-30 years Treatment Plant, Water & Sewer Pipes 40-60 years Other Infrastructures 10-85 years Water Rights 20 years
Major outlays for capital assets and improvements are capitalized as projects are constructed. Interest incurred during the construction phase is reflected in the capitalized value of the asset constructed, net of interest earned on the invested proceeds over the same period.
I. Inventory and Prepaid Items Inventory and prepaid items are held for consumption and are valued at cost using the first-in-first-out basis. The cost is recorded as an expenditure at the time individual items are consumed.
Certain payments to vendors reflect costs applicable to future accounting periods and are recorded as prepaid items in both government-wide and fund financial statements.
J. Compensated Absences Compensated absences are comprised of unpaid vacation and certain compensated time off, which are accrued as earned. A liability for these amounts is reported in governmental funds only if they have matured, for example, as a result of employee resignations and retirements. The City’s liability for compensated absences is recorded in the General, Water and Wastewater funds as appropriate. The liability for compensated absences is determined annually. However, such compensated absences payments are not distinguished from regular payroll paid during the fiscal year. Amounts expected to be paid out of current financial resources are recorded as fund liabilities; the long-term portion is recorded in the Statement of Net Assets.
Compensated absences are liquidated by the fund that has recorded the liability. The long-term portion of
governmental activities compensated absences is liquidated primarily by the General Fund.

CITY OF BENICIA
Notes to the Basic Financial Statements
44
Note 1 - Summary of Significant Accounting Policies, (Continued) K. Budgeting Procedures
The City follows these procedures in establishing the budgetary data reflected in the financial statements:
1. The City Manager submits to the City Council a proposed bi-annual operating budget for the next two
fiscal years commencing the following July 1. The operating budget includes proposed expenditures and the means of financing them.
2. Public hearings are conducted to obtain taxpayer comments.
3. The bi-annual budget is adopted by City Council resolution prior to July 1.
4. Expenditures may not legally exceed budgeted appropriations at the fund level.
5. All budget adjustments and transfers between funds must be approved by the City Council by resolution
during the fiscal year. The City Manager and Finance Director are authorized to transfer unencumbered appropriations within a department and between departments.
6. Formal budgetary integration, including the recording of encumbrances, is employed as a management
control device during the year in all budgeted funds. Under encumbrance accounting, purchase orders, contracts and other commitments for the expenditure of moneys are recorded in order to reserve that portion of the applicable appropriation. Encumbrances outstanding at year-end are reported as reservations of fund balances since they do not constitute expenditures or liabilities at that date.
7. Remaining appropriations lapse at year-end and must be reappropriated in the following year.
8. Budgets are adopted on a basis consistent with generally accepted accounting principles (GAAP) for all
governmental funds except for the Developer Deposits Special Revenue fund, which is not budgeted. The City adopts project budgets for the Capital Project funds.
Budgeted amounts are as originally adopted or as amended by the City Council. Individual amendments were not material in relation to the original appropriations. Budget and actual comparison for the General Fund are presented at the department level except for Administration which is composed of City Council, City Manager, Treasurer, Finance, City Attorney, Human Resources and City Clerk.
L. Prior Year Data
Selected information regarding the prior year has been included in the accompanying financial statements. This information has been included for comparison purposes only and does not represent a complete presentation in accordance with generally accepted accounting principles. Accordingly, such information should be read in conjunction with the City’s prior year financial statements, from which this selected data was derived. Certain minor reclassifications of prior year data may have been made in order to enhance their comparability with current year figures.

CITY OF BENICIA
Notes to the Basic Financial Statements
45
Note 2 - Cash and Investments
The City pools cash from all sources and all funds except cash and investments held by trustees so that it can be invested at the maximum yield consistent with safety and liquidity, while individual funds can make expenditures at any time.
A. Policies California Law requires banks and savings and loan institutions to pledge government securities with a market value of 110% of the City‘s cash on deposit, or first trust deed mortgage notes with a market value of 150% of the deposit, as collateral for these deposits. Under California law, this collateral is held in a separate investment pool by another institution in the City’s name and places the City ahead of general creditors of the institution.
The City invests in individual investments and in investment pools. Individual investments are evidenced by specific identifiable securities instruments, or by an electronic entry registering the owner in the records of the institution issuing the security, called the book entry system. In order to increase security, the City employs the Trust Department of a bank as the custodian of certain City managed investments, regardless of their form.
The City’s investments are carried at fair value, as required by generally accepted accounting principles. The City adjusts the carrying value of its investments to reflect their fair value at each fiscal year end, and it includes the effects of these adjustments in income for that fiscal year.
B. Classification
Cash and investments are classified in the financial statements as shown below, based on whether or not their use is restricted under the terms of City debt instruments or Agency agreements.
Statement of Net Assets:
Cash and investments available for City operations 45,446,723$ Cash with fiscal agent 75,335 Total City cash and investments 45,522,058
Fiduciary Funds 3,237,045 Total cash and investments 48,759,103$
Cash and investments as of June 30, 2009 consist of the following:
Cash on hand 4,731$ Deposits with financial institutions 896,061Investments 47,858,311 Total cash and investments 48,759,103$
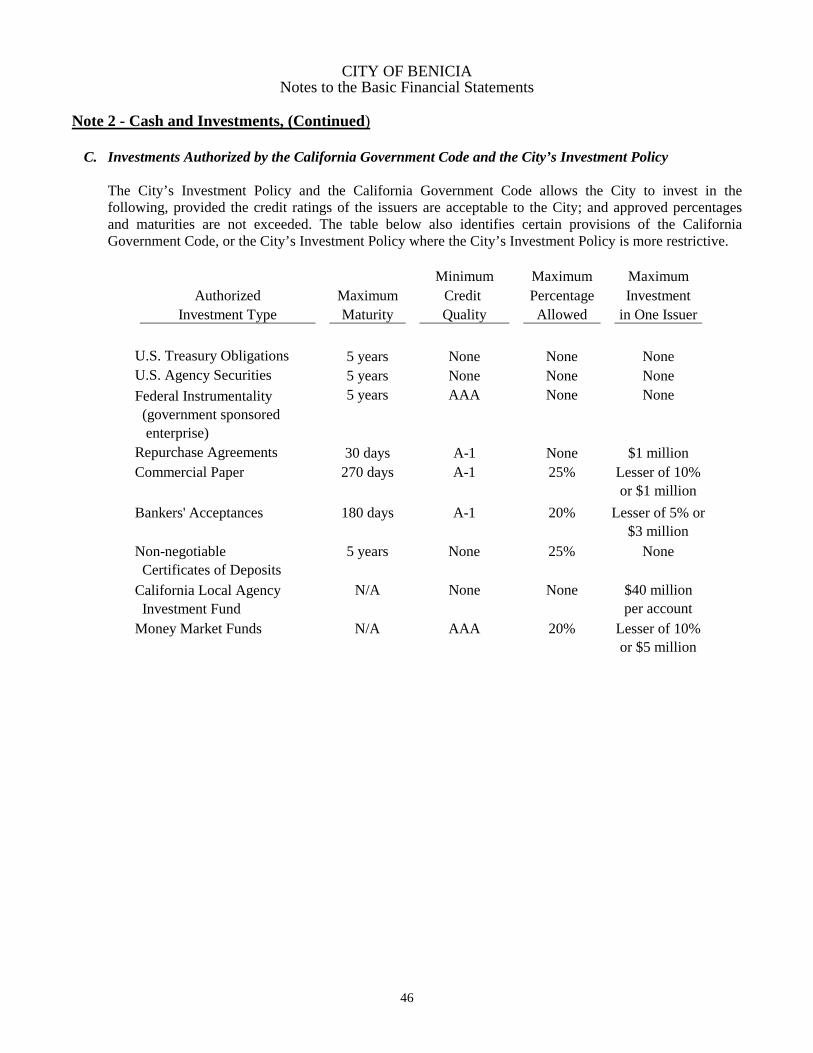
CITY OF BENICIA
Notes to the Basic Financial Statements
46
Note 2 - Cash and Investments, (Continued)
C. Investments Authorized by the California Government Code and the City’s Investment Policy
The City’s Investment Policy and the California Government Code allows the City to invest in the following, provided the credit ratings of the issuers are acceptable to the City; and approved percentages and maturities are not exceeded. The table below also identifies certain provisions of the California Government Code, or the City’s Investment Policy where the City’s Investment Policy is more restrictive.
Minimum Maximum Maximum
Authorized Maximum Credit Percentage InvestmentInvestment Type Maturity Quality Allowed in One Issuer
U.S. Treasury Obligations 5 years None None NoneU.S. Agency Securities 5 years None None NoneFederal Instrumentality (government sponsored enterprise)
5 years AAA None None
Repurchase Agreements 30 days A-1 None $1 millionCommercial Paper 270 days A-1 25% Lesser of 10%
or $1 millionBankers' Acceptances 180 days A-1 20% Lesser of 5% or
$3 millionNon-negotiable Certificates of Deposits
5 years None 25% None
California Local Agency Investment Fund
N/A None None $40 million per account
Money Market Funds N/A AAA 20% Lesser of 10% or $5 million

CITY OF BENICIA
Notes to the Basic Financial Statements
47
Note 2 - Cash and Investments, (Continued)
D. Investments Authorized by Debt Agreements
The City must maintain required amounts of cash and investments with trustees or fiscal agents under the terms of certain debt issues. These funds are unexpended bond proceeds or are pledged reserves to be used if the City fails to meet its obligations under these debt issues. The California Government Code requires these funds to be invested in accordance with City resolutions, bond indentures or State statutes. The table below identifies the investment types that are authorized for investments held by fiscal agents. The bond indentures contain no limitations for the maximum investment in any one issuer or the maximum percentage of the portfolio that may be invested in any one investment type. The table also identifies certain provisions of these debt agreements:
Authorized Investment Type Maximum Maturity Minimum Credit Quality
U.S. Treasury Bonds, Notes and Bills None No LimitBankers' Acceptances 360 days A-1State General Obligations None AMunicipal Obligations None Aaa/AAAU.S. Government Agency Securities None to 3 years AAAU.S. Government Sponsored Securities None to 3 years AAAFederal Housing Administration Debentures
None N/A
Commercial Paper 270 days A-1+Repurchase Agreements None to 1 year AState of California Local Agency Investment Fund (LAIF)
N/A N/A
Money Market Funds None AamDefeased Securities N/A N/APre-refunded Municipal Obligations None AAAInvestment Agreements N/A AAUnsecured Certificates of Deposit 30 days A-1CalTrust None N/A
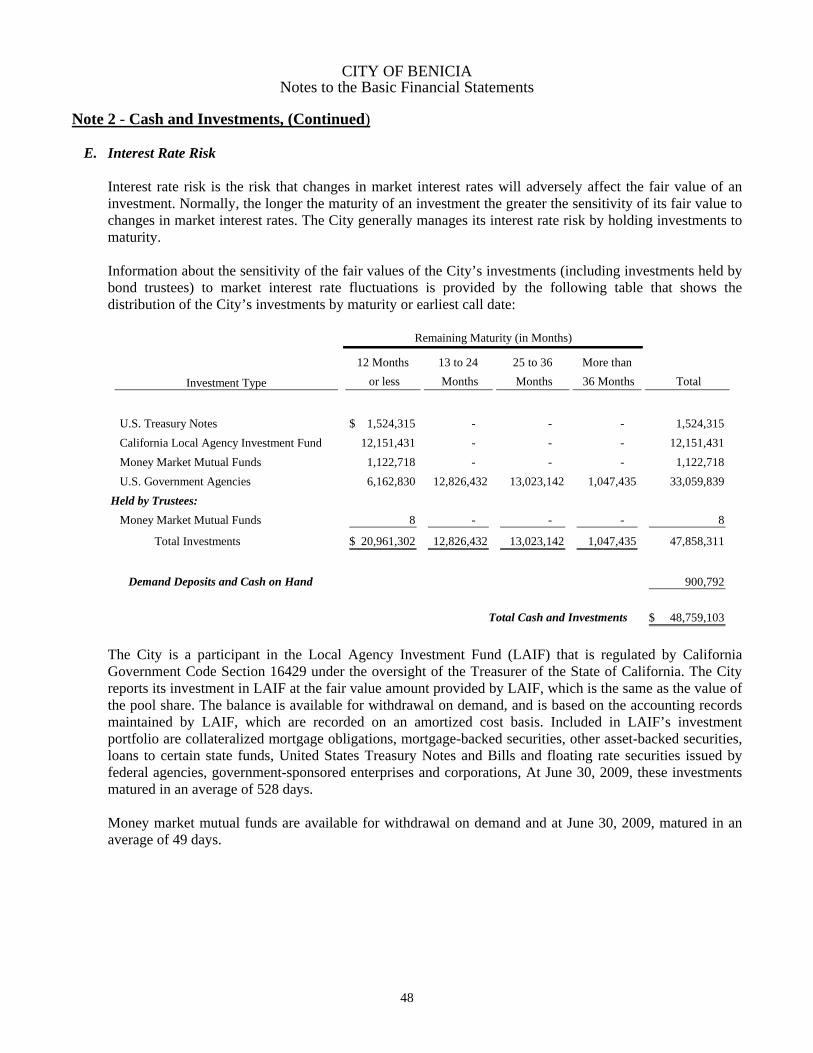
CITY OF BENICIA
Notes to the Basic Financial Statements
48
Note 2 - Cash and Investments, (Continued)
E. Interest Rate Risk
Interest rate risk is the risk that changes in market interest rates will adversely affect the fair value of an investment. Normally, the longer the maturity of an investment the greater the sensitivity of its fair value to changes in market interest rates. The City generally manages its interest rate risk by holding investments to maturity.
Information about the sensitivity of the fair values of the City’s investments (including investments held by bond trustees) to market interest rate fluctuations is provided by the following table that shows the distribution of the City’s investments by maturity or earliest call date:
12 Months 13 to 24 25 to 36 More than or less Months Months 36 Months Total
U.S. Treasury Notes 1,524,315$ - - - 1,524,315 California Local Agency Investment Fund 12,151,431 - - - 12,151,431 Money Market Mutual Funds 1,122,718 - - - 1,122,718 U.S. Government Agencies 6,162,830 12,826,432 13,023,142 1,047,435 33,059,839 Held by Trustees: Money Market Mutual Funds 8 - - - 8
Total Investments 20,961,302$ 12,826,432 13,023,142 1,047,435 47,858,311
Demand Deposits and Cash on Hand 900,792
Total Cash and Investments 48,759,103$
Remaining Maturity (in Months)
Investment Type
The City is a participant in the Local Agency Investment Fund (LAIF) that is regulated by California Government Code Section 16429 under the oversight of the Treasurer of the State of California. The City reports its investment in LAIF at the fair value amount provided by LAIF, which is the same as the value of the pool share. The balance is available for withdrawal on demand, and is based on the accounting records maintained by LAIF, which are recorded on an amortized cost basis. Included in LAIF’s investment portfolio are collateralized mortgage obligations, mortgage-backed securities, other asset-backed securities, loans to certain state funds, United States Treasury Notes and Bills and floating rate securities issued by federal agencies, government-sponsored enterprises and corporations, At June 30, 2009, these investments matured in an average of 528 days.
Money market mutual funds are available for withdrawal on demand and at June 30, 2009, matured in an average of 49 days.

CITY OF BENICIA
Notes to the Basic Financial Statements
49
Note 2 - Cash and Investments, (Continued)
F. Credit Risk
Credit risk is the risk that an issuer of an investment will not fulfill its obligation to the holder of the investment. This is measured by the assignment of a rating by a nationally recognized statistical rating organization.
Investment Type Amount AAA Rated:Held by City: U.S. Government-Sponsored Enterprise Agencies Non-callable 23,701,539$ Callable 9,358,300 Money Market Mutual Funds 1,122,718 Held by Trustees: Money Market Mutual Funds 8 Not rated: California Local Agency Investment Fund 12,151,431 Exempt from credit rating disclosure: U.S. Treasury Notes 1,524,315
Demand Deposits and Cash on Hand 900,792 Total Cash and Investments 48,759,103$ Concentration of Credit Risk - The following significant investments in any one issuer other than U.S. Treasury securities, mutual funds, and external investment pools are as follows:
Issuer Reporting Unit Reported Amount
Federal Farm Credit Bank Government Activities $ 4,114,216 Federal Home Loan Bank 3,834,577 Federal Home Loan Mortgage Corporation 5,680,445

CITY OF BENICIA
Notes to the Basic Financial Statements
50
Note 3 - Interfund Transactions
A. Transfers between Funds With Council approval, resources may be transferred from one City fund to another. Transfers between funds during the fiscal year ended June 30, 2009 were as follows:
Transfers Out Transfers In AmountGeneral Fund Nonmajor Governmental Funds 2,762,795$ (a)(b)
Transit 50,000 (a)(b)(c)Internal Service Fund 10,000 (b)
2,822,795
Nonmajor Governmental Funds General Fund 19,411 (a) Nonmajor Governmental Funds 586,297 (a)(b)
605,708
Wastewater General Fund 32,165 (d)
Water General Fund 48,250 (d)
3,508,918$
(a) Transfer to fund City operations(b) Transfer to fund capital improvements(c) Transfer to fund debt service payments(d) Transfer to fund administrative expenses
Interfund transfers were principally used for the following purposes:
B. Current Interfund Balances
Current interfund balances arise in the normal course of business and are expected to be repaid shortly after the end of the fiscal year. At June 30, 2009, the following funds have balances due to the General Fund:
Due from other funds Due to other funds Amount
General Fund Nonmajor Governmental funds 283,222$ Benicia Marina fund 79,590 Transit fund 595,576 Internal Service funds 8,326
966,714
Nonmajor Governmental funds Nonmajor Governmental funds 575,687
Total 1,542,401$

CITY OF BENICIA
Notes to the Basic Financial Statements
51
Note 3 - Interfund Transactions (Continued)
C. Advances Between Funds During fiscal year 2009, an advance in the amount of $160,321 was made from the General Fund to the Benicia Marina Enterprise Fund to finance expenses related to modifications to the City’s storm water system that impacted the Benicia Marina Basin. The advance will accrue interest at the current portfolio earnings rate and is expected to be fully repaid by 2028. The Benicia Marina Enterprise Fund will begin repaying the loan to the General Fund when the outstanding loans due to the Department of Boating and Waterways are paid off. The outstanding balance was $160,321 as of June 30, 2009. During fiscal year 2009, an advance in the amount of $1,627,009 was made from the Wastewater Enterprise Fund to the General Fund to finance property tax settlement payments to Valero Energy Corporation. The advance is to be repaid with interest of 4% over seven years starting June 30, 2009. The outstanding balance at June 30, 2009 was $1,627,009. During fiscal year 2008, an advance in the amount of $250,000 was made from the General Fund to the Transit Enterprise Fund to finance the purchase of emissions devices for Benicia Breeze buses. The advance is being repaid with interest of 4% over five years. The outstanding balance was $203,843 as of June 30, 2009.
During fiscal year 2008, an advance in the amount of $343,460 was made from the Insurance Internal Service Fund to the Building and Equipment Management Internal Service Fund to finance the purchase of a fire engine. The advance is being repaid with interest of 4% over ten years. The outstanding balance at June 30, 2009 was $314,853.

CITY OF BENICIA
Notes to the Basic Financial Statements
52
Note 4 - Loans Receivable
At June 30, 2009, the City had the following housing related loans receivable:
Governmental Business-typeActivities Activities Total
Housing Rehabilitation Loan Program 396,112$ - 396,112 Burgess Point,
Benicia Housing Partners 550,000 - 550,000 Benicia Housing Authority 340,000 845,000 1,185,000
Hearthstone Village,Affordable Housing Affiliation 192,514 191,572 384,086
Bay Ridge Affordable Housing - 756,750 756,750 Casa De Vilarrasa,
Benicia Housing Authority 1,630,332 - 1,630,332 Fee Deferals
Suraj Investments, LLC 58,254 96,265 154,519 Bruce Blankenhorn 149,878 - 149,878
Total Loans Receivable 3,317,090 1,889,587 5,206,677 Less: Forgivable Amounts (192,514) (948,322) (1,140,836) Total 3,124,576$ 941,265 4,065,841
Balance at June 30, 2009
A. Housing Rehabilitation Loan Program
The City administers a Housing Rehabilitation Loan Program using the Housing and Community Development Act funds. Under this program, residents with incomes below a certain level are eligible to receive low interest loans, secured by deeds of trust, for construction work on their homes. Federal grants are used to fund these loans. Upon approval of loans, the City disburses the funds, and arranges for and collects repayments. As of June 30, 2009, residents owed the City $396,112 in loans offered by this Program.
B. Burgess Point, Benicia Housing Partners
On July 1, 2003, the City authorized a loan to Benicia Housing Partners for an amount of $550,000. The loan bears simple interest at eight percent annually and is secured by a deed of trust. The purpose of the loan was to provide funding for the construction of 56 units of tax credit rental housing. Annual payments are made from residual receipts collected by the developer, to the extent such funds are available. Such payments continue until the loan and interest are paid in full or the remaining principal and interest is due in full on the earliest of: 1) the date of any transfer not authorized by the City, 2) the date of any default, or 3) December 31, 2035.

CITY OF BENICIA
Notes to the Basic Financial Statements
53
Note 4 - Loans Receivable (Continued)
C. Burgess Point, Benicia Housing Authority
On July 23, 2003, the City authorized a loan to Benicia Housing Authority for an amount of $1,185,000. The loan bears simple interest at six percent annually and is unsecured. The loan was to provide funding for the purchase of building permits by Benicia Housing Partners. Benicia Housing Authority makes annual payments from funds received from Benicia Housing Partners based upon a loan agreement. Such payments continue until the loan and interest is paid in full or the remaining principal and interest is due in full on the earliest of: 1) the date of any transfer not authorized by the City, 2) the date of any default, or 3) December 31, 2035.
D. Hearthstone Village, Affordable Housing Affiliation
On May 21, 2003, the City authorized loans to the Affordable Housing Affiliation in the amount of $96,000 and $288,086 in deferred fees, totaling $384,086. The purpose of the loan was to assist with the construction of a twelve unit project, Hearthstone Village, which consists of seven single-family houses, one duplex, one triplex and three parking structures. All twelve of these units are to be occupied by low- and very low-income persons or families. The loan payments are deferred and the loan receivable will not be recognized unless, within ten years from date of occupancy, the property ceases to be used in accordance with the terms and conditions set forth in the regulatory agreement. However, the loan is secured by a deed of trust creating a valid lien, not lower than third priority, upon the property.
E. Bay Ridge Affordable Housing
On November 12, 2002, developer fees were deferred in the form of a loan receivable for fifty affordable low-income household units in the Bay Ridge Affordable Housing Project. The Water and Wastewater Connection fees were deferred by a promissory note for $381,750 and $375,000, respectively, for a total deferred amount of $756,750. The note bears simple interest at 5.5% annually. The loans will not be recognized unless there is a failure to comply with the eligibility terms in the loan agreement. The City waived other fees in the amount of $253,250 to assist the low-income housing project. This waiver was a one-time waiver of fees that occurred in 2003.
F. Casa de Vilarrasa, Benicia Housing Authority
On January 6, 2005, the City authorized a loan to Benicia Housing Authority in an amount up to $1.4 million. The loan bears simple interest not to exceed 10% a year and is unsecured. The loan was used to fund the improvements of the Casa de Vilarrasa housing project. The loan will be paid in full on or before April 1, 2016. The City loaned the Benicia Housing Authority an additional $113,812 in fiscal year 2009. As of June 30, 2009, the outstanding amount of this loan was $1,630,332.
CITY OF BENICIA
Notes to the Basic Financial Statements
54
Note 4 - Loans Receivable (Continued)
G. Fee Deferrals
On September 19, 2006, the City authorized a fee deferral payment agreement, secured by a deed of trust, with Suraj Investment Group, LLC to defer developer fees in the amount of $213,328, The fees are deferred in the form of a loan receivable for water, sewer, capital license and traffic impact fees associated with the commercial project located at 1375 East 5th Street. As of June 30, 2009, the developer had incurred deferred permit fees of $154,519. Repayment of the loan is due in eight annual installments of $26,666 plus interest of 5.125% beginning at the issuance of the building permit.
On September 5, 2006, the City authorized a special fee deferral payment agreement, secured by a deed of trust, with Bruce Blankenhorn, to defer developer fees in the amount of $149,878. The fees are deferred in the form of a loan receivable for development impact fees and pro-rata improvement costs of the East N Street residential project located at 660/670 East N Street. Repayment of the loan is due in five equal annual installments of $23,980 subsequent to the issuance of the building permit. Additionally, a down payment of $29,975 is due to the City as a condition preceding the issuance of a certificate of occupancy on the first unit of the East N Street project.

CITY OF BENICIA
Notes to the Basic Financial Statements
55
Note 5 - Capital Assets
A. Capital additions and retirements – Capital assets at June 30 comprise:
Balances at Balances atJuly 1, 2008* Additions Deletions Transfers June 30, 2009
Governmental activitiesCapital assets, not depreciated: Land 17,989,044$ - - - 17,989,044 Construction in progress 4,781,346 3,956,027 - (3,770,866) 4,966,507
Total capital assets, not depreciated 22,770,390 3,956,027 - (3,770,866) 22,955,551
Capital assets, being depreciatedBuildings and improvements 17,918,231 - - 3,561,245 21,479,476 Machinery and equipment 8,129,358 198,941 (225,197) - 8,103,102 Infrastructure 132,010,509 - - 209,621 132,220,130
Total cost of depreciable assets 158,058,098 198,941 (225,197) 3,770,866 161,802,708
Buildings and improvements (5,940,433) (500,086) - - (6,440,519) Machinery and equipment (5,310,072) (390,068) 211,377 - (5,488,763) Infrastructure (48,299,781) (1,901,835) - - (50,201,616)
Total accumulated depreciation (59,550,286) (2,791,989) 211,377 - (62,130,898)
Net depreciable assets 98,507,812 (2,593,048) (13,820) 3,770,866 99,671,810
Governmental activity capital assets, net 121,278,202$ 1,362,979 (13,820) - 122,627,361
* Beginning balances have been adjusted to include traffic signals that were not previously recorded See Note 17.
Less accumulated depreciation:

CITY OF BENICIA
Notes to the Basic Financial Statements
56
Note 5 - Capital Assets (Continued)
Balances at Balances atJuly 1, 2008 Additions Deletions Transfers June 30, 2009
Business-type activities:Capital assets, not depreciated: Land and improvements 2,584,081$ - - - 2,584,081 Construction in progress 2,309,727 303,150 - - 2,612,877
Total capital assets, not depreciated 4,893,808 303,150 - - 5,196,958
Capital assets, being depreciatedBuildings and improvements 90,572,331 - - - 90,572,331 Machinery and equipment 9,332,906 590,404 (80,367) - 9,842,943 Infrastructure 71,390,616 582,548 - - 71,973,164 Water rights - 5,000,000 - - 5,000,000
Total cost of depreciable assets 171,295,853 6,172,952 (80,367) - 177,388,438
Buildings and improvements (30,128,977) (2,253,018) - - (32,381,995) Machinery and equipment (3,376,702) (619,533) 80,367 - (3,915,868) Infrastructure (33,765,731) (1,330,610) - - (35,096,341)
Total accumulated depreciation (67,271,410) (4,203,161) 80,367 - (71,394,204)
Net depreciable assets 104,024,443 1,969,791 - - 105,994,234
Business-type activity capital assets, net 108,918,251$ 2,272,941 - - 111,191,192
Less accumulated depreciation:
B. Project Commitment
At June 30, 2009, the City had outstanding commitments with contractors for the following projects:
Project CommitmentRose Drive Overcrossing 26,553$ Commanding Officers Quarters 51,457 Community Center 308,073 Jack London Park Restroom 150,797

CITY OF BENICIA
Notes to the Basic Financial Statements
57
Note 5 - Capital Assets (Continued) C. Depreciation Allocation
Depreciation expense is charged to functions and programs based on their usage of the related assets. The amounts allocated to each function or programs are as follows:
Governmental Activities:
Administration $ 5,194 Community development 8,487 Public safety-police 103,627 Public safety-fire 172,236 Parks and community services 554,760 Public works 1,906,979 Library 8,232 General government 32,474
Total Governemental activities $ 2,791,989
Business-type activities:Wastewater 2,192,791$ Water 1,648,734 Benicia Marina 189,612 Transit 172,024
Total Business-type acvtivities 4,203,161$

CITY OF BENICIA
Notes to the Basic Financial Statements
58
Note 6 - Long-Term Liabilities
The City generally incurs long-term debt to finance projects or purchase assets, which will have useful lives equal to or greater than the related debt.
The City’s debt issues and transactions are summarized below and discussed in detail thereafter.
A. Current Year Transactions and Balances
Governmental:
Balance at Additions/ Balance at Due WithinJuly 1, 2008 Accretion Deletions June 30, 2009 One Year
1997 General Obligation Wastewater Bonds, Series A $ 3,175,000 - (250,000) 2,925,000 260,000
1997 General Obligation Wastewater Bonds, Series B 3,410,000 - (235,000) 3,175,000 250,000
2006 Pension Obligation Bonds Series A-1 (Current Interest Bonds) 6,990,000 - (630,000) 6,360,000 - Series A-2 (Capital Appreciation Bonds) 7,312,593 83,784 (80,000) 7,316,377 885,000
Casa de Vilarrasa - Capital Lease 1,348,112 - (54,249) 1,293,863 56,718
Fire Truck Capital Lease - 365,000 (37,027) 327,973 30,512
Police and Marina Storm Drain Improvements Capital Lease 1,835,891 - (194,800) 1,641,091 203,824
Compensated Absences 1,301,319 1,154,149 (1,073,371) 1,382,097 1,073,371
Total Governmental activity debt 25,372,915$ 1,602,933 (2,554,447) 24,421,401 2,759,425
CITY OF BENICIA
Notes to the Basic Financial Statements
59
( 6 ) Long-Term Liabilities (Continued)
Business-type:Balance at Additions/ Balance at Due Within
July 1, 2008 Accretion Deletions June 30, 2009 One Year
2002 Water Revenue Refunding Bonds $ 7,720,000 - (665,000) 7,055,000 685,000
2005 Wastewater Refunding Revenue Bonds 3,770,000 - (260,000) 3,510,000 265,000
Less unamortized original issue discount (71,908) - 8,810 (63,098) -
Total utility bonds, net of discount 11,418,092 - (916,190) 10,501,902 950,000
State of California Marina Loans 3,999,160 - (143,983) 3,855,177 150,462
State Revolving Loan Fund-WWTP 13,886,003 - (957,415) 12,928,588 974,677
State Revolving Loan Fund -I&I 9,976,119 - (474,139) 9,501,980 486,467
State Revolving Loan Fund - Water Treatment Plant 11,253,634 - (474,248) 10,779,386 485,650
Compensated Absences 241,400 219,732 (214,650) 246,482 246,482
Total Business-type activity debt 50,774,408$ 219,732 (3,180,624) 47,813,516 3,293,738
B. I997 General Obligation Wastewater Bonds, Series A and B
In 1997, the City’s voters approved issuance of up to $30 million in general obligation debt to improve the City’s wastewater treatment plant. The 1997 General Obligation Wastewater Bonds totaling $10 million were issued in August 1997 (Series A) and May 1998 (Series B). Principal payments are payable annually on August 1 and interest payments are paid semi-annually on February 1 and August 1.
C. 2006 Pension Obligation Bonds
On June 15, 2006, the California Statewide Communities Development Authority issued the 2006 Series A-1 Current Interest Bonds and Series A-2 Capital Appreciation Bonds in the amounts of $27,985,000 and $34,828,647, of which $7,430,000 and $6,542,596 were the City’s portion. The bond proceeds were used to prepay the unfunded liability of the Miscellaneous and Safety pension plans through the California Public Employees’ Retirement System. As of June 30, 2009, the City’s prepaid pension obligation amounted to $12,601,889.
The Series A-1 Current Interest Bonds bear interest rates of 5.69%-5.93%. Principal payments are due annually through 2036. Interest payments are payable semi-annually on June 1 and December 1.

CITY OF BENICIA
Notes to the Basic Financial Statements
60
Note 6 - Long-Term Liabilities (Continued)
The Series A-2 Capital Appreciation Bonds unaccreted discount totaled $5,088,625 at June 30, 2009. The Bonds do not pay periodic interest. Interest on the Bonds will accrete in value at the rates of 5.67% to 6.12%. Repayments of the accreted principal commenced on June 1, 2008.
D. Casa de Vilarrasa- Capital Lease
In March 2005, the City entered into a Capital Lease for $1.4 million, at 4.5% interest, to finance the purchase and rehabilitation of the Casa de Vilarrasa forty-unit senior housing complex. Semi-annual payments are due on September 1 and March 1 each year. The first four payments are interest only and are financed from the lease proceeds. The loan principal is to be amortized over 20 years. However, it is anticipated the loan will be repaid in 2014. Ownership of the housing complex will be reverted to the City at the end of the lease. Since the lease is in essence a financing arrangement, the cost of the above project and the amount of the lease have been included in the City’s financial statements.
E. Fire Engine — Capital Lease
In April 2008, the City entered into a Capital Lease for $365,000, at 3.92% interest, to finance the purchase of a fire engine. Semi-annual payments are due on September 30 and March 31 each year. Ownership of the vehicle will be reverted to the City at the end of the lease.
F. Police Building and Marina Area Storm Drain Improvements - Capital Lease In May 2006, the City entered into a Capital Lease for $2.2 million, at 4.58% interest, to finance the improvements to the Police Building and the portion of the storm drain system located in the Marina Area. Semi-annual payments are due on December 22 and June 22 each year. Ownership of the improvements will be reverted to the City at the end of the lease. Since the lease is in essence a financing arrangement, the cost of the improvements and the amount of the lease have been included in the City’s financial statements.

CITY OF BENICIA
Notes to the Basic Financial Statements
61
Note 6 - Long-Term Liabilities (Continued)
G. Debt Service Requirements
Annual debt service requirements are shown below for governmental activities long-term debt: Government Obligation Bonds
Year ending June 30 Principal Interest
2010 510,000$ 252,202 2011 535,000 233,428 2012 565,000 213,238 2013 595,000 191,903 2014 630,000 169,428
2015-2020 3,265,000 481,188
Total 6,100,000$ 1,541,387
Pension Obligation Bonds
Year ending June 30 Principal Interest
2010 885,000$ 374,237 2011 925,000 374,237 2012 1,010,000 332,415 2013 1,060,000 332,415 2014 1,105,000 332,415
2015-2020 4,650,000 1,595,534 2021-2025 2,045,000 1,088,155 2026-2030 2,630,000 1,088,155 2031-2036 4,455,000 934,568
Total 18,765,000$ 6,452,130
(A) Includes unaccreted discount totaling $5,088,623
(A)

CITY OF BENICIA
Notes to the Basic Financial Statements
62
Note 6 - Long-Term Liabilities (Continued)
Capital Leases
Year ending June 30 Principal Interest
2010 291,054$ 144,332 2011 304,413 130,973 2012 318,386 117,000 2013 333,001 102,385 2014 348,286 87,100
2015-2020 1,161,036 255,771 2021-2025 506,751 64,802
Total 3,262,927$ 902,363
H. 2002 Water Revenue Refunding Bonds
In September 2002, the City issued Water Revenue Refunding Bonds in the amount of $10,805,000. The proceeds were used to defease the 1991 Water System Refunding Project Certificates of Participation, prepay the City’s 1997 Community Drought Relief Promissory Note, purchase a reserve fund surety bond and pay the costs of issuing the bonds. The Water Revenue Refunding Bonds are secured by a pledge of the available net revenues of the City’s Water System and are subject to the prior lien of the 1967 Bonds. Interest rates range from 1.25% to 4.40%. Principal payments are payable annually on November 1 and interest payments semiannually on May 1 and November 1.
The pledge of future available net revenues of the Water Fund ends upon repayment of the $8,413,082 in remaining debt service on the bonds which is scheduled to occur in fiscal year 2018. As disclosed in the official statement, available net revenues are expected to provide coverage over debt service of 1.20 over the life of the bonds. For fiscal year 2009, gross Water Fund Revenues including operating revenues and non-operating interest earnings totaled $7,396,558 and operating costs, not including depreciation or amortization, totaled $5,088,923. Net Revenues available for debt service totaled $2,307,635 which represented coverage of 2.44 of debt service payment of $946,430.
I. 2005 Wastewater Refunding Revenue Bonds
In September 2005, the City issued the 2005 Wastewater Refunding Revenue Bonds in the amount of $4,260,000. The proceeds were used to partially finance the refunding of the 1993 Refunding Wastewater Revenue Bonds in the outstanding principal amount of $4,435,000. The 2005 Revenue Bonds are payable solely from and secured by a pledge of the net revenues derived from the wastewater operation. Principal payments are payable annually on December 1 and interest payments semi-annually on May I and November 1.

CITY OF BENICIA
Notes to the Basic Financial Statements
63
Note 6 - Long-Term Liabilities (Continued)
The pledge of future net revenues of the Wastewater Fund ends upon repayment of the $4,301,000 in remaining debt service on the bonds which is scheduled to occur in fiscal year 2020. As disclosed in the official statement, available net revenues are expected to provide coverage over debt service of 1.20 over the life of the bonds. For fiscal year 2009, Wastewater Fund Revenues including operating revenues and non-operating investment income totaled $7,402,573 and operating costs, not including depreciation or amortization totaled $4,447,332. Net Revenues available for debt service totaled to $2,955,241 which represented coverage of 7.54 of debt service payment of $391,813.
J. State of California Marina Loans
From I976 through 1984, the State of California loaned the City a total of $6,046,730 for various construction projects for the City’s marina. Interest and principal are payable annually on August 1 through 2027. Debt service is payable from marina revenues.
K. State Revolving Loan Fund - Wastewater Treatment Plant (WWTP)
In 1998, the City negotiated a State Revolving Fund Loan with the State Water Resources Control Board to finance the remainder of the wastewater treatment plant improvements. The loan is a long-term liability of the Wastewater Enterprise Fund, which borrowed the maximum available of $20,129,576. While the loan bears no stated interest, the City is required to pay an amount termed Local/State Match in addition to the principal amount of the loan. The City has imputed an interest rate of 1.8% to provide for the payment of this match. Payments are due annually in December through 2020.
L. State Revolving Loan Fund - Inflow & Infiltration (I & I)
In 2003, the City entered into a State Revolving Fund Loan agreement with the State Water Resources Control Board to finance the $12 million inflow and infiltration project at a rate of 2.6%. The loan is a long-term liability of the Wastewater Enterprise Fund, which borrowed the maximum available of $11,296,658. Payments are due annually on April 10 through 2025.
M. State Revolving Loan Fund- Water Treatment Plant
In 2004, the City entered into a State Revolving Fund loan agreement with the State Department of Water Resources to assist financing the Water Treatment Plant Improvement Project, which will enable the City to meet safe drinking water standards set by the State. The loan is a long-term liability of the Water Enterprise Fund, bearing interest of 2.39%. Principal and interest are payable semi-annually on January I and July 1 of each year, commencing January 1, 2008. The maximum amount the City can borrow is $13,600,000; however, the City only borrowed $11,716,747. As of June 30, 2009, the outstanding principal amount was $10,779,386.
CITY OF BENICIA
Notes to the Basic Financial Statements
64
Note 6 - Long-Term Liabilities (Continued) N. Debt Service Requirements
Annual debt service requirements are shown below for business-type activities long-term debt:
Revenue Bonds
Year ending June 30 Principal Interest
2010 950,000$ 400,098 2011 975,000 370,780 2012 1,015,000 338,318 2013 1,040,000 303,140 2014 1,080,000 265,530
2015-2020 5,505,000 671,263
10,565,000 2,349,128 Less unamortized discount: (63,098)
Total 10,501,902$
Revolving Loans
Year ending June 30 Principal Interest
2010 2,097,256$ 908,380 2011 2,145,924 859,711 2012 2,195,824 809,811 2013 2,246,990 758,645 2014 2,286,812 706,178
2015-2020 15,856,699 2,997,722 2021-2025 8,165,715 1,071,637 2026-2030 2,069,912 91,298
Total 37,065,131$ 8,203,381

CITY OF BENICIA
Notes to the Basic Financial Statements
65
Note 7 - Special Assessment Debt With No Government Commitment
At June 30, 2009, the outstanding principal amount of bonded debt issued by special assessment districts in the City was as follows:
McAllister 10,585,000$ East Second Street 2,790,000 Combined Drake/Gateway 356,000 Fleetside Industrial Refunding 2,185,000
The City has no legal or moral responsibility with respect to the payment of this debt and has therefore not recorded it as a liability. However, the City is responsible for the construction of the improvements financed by the Districts; therefore, the related Capital Projects Funds are reflected in the City’s financial statements. The City is also responsible, as the Districts’ agent, for recording the Districts’ cash receipts, disbursements and balances, which are reported as Agency fund transactions in the financial statements.
Note 8 - Fund Balances
A. Fund Balance Reserves
Reserves are placed by outside entities, such as other governments, which restrict the expenditures of the reserved funds to the purpose intended by the entity that provided the funds. The City cannot modify or remove these reserves. At June 30, 2009 reserves included the following: Debt Service reserve are the balance of debt service funds legally restricted for the payment of principal and interest on long-term debt, or the portion of proprietary funds retained earnings reserved to retire bond principal.
Prepaid Items reserve is the portion of fund balance set aside to indicate these items do not represent available, spendable resources even though they are a component of assets. Encumbrances reserve represents the portion of fund balance set aside for open purchase orders. Open Space reserve is the portion of fund balance set aside for open space improvement. Advances to Other Funds reserve indicates that the portion of fund balance is set aside and does not represent available, spendable resources even through they are a component of assets.

CITY OF BENICIA
Notes to the Basic Financial Statements
66
Note 8 - Fund Balances (Continued) B. Fund Balance Designations
Designations are imposed by City Council to reflect future spending plans or concerns about the availability of future resources. Designations may be modified, amended or removed by Council action. At June 30, 2009, designations included the following:
Designated for future projects includes $45,574 for economic and community development projects.
Designated for the cable grant is the portion of fund balance to be used for communication equipment purchases.
Designated for economic uncertainty is to mitigate the affects of major economic uncertainties, local disasters, and other severe financial hardships resulting from unforeseen changes in revenues and or expenditures.
Designated for exposures reserve is a set aside of resources for potential costs not covered by the City’s insurance programs.
Designated for emergency reserve is to mitigate all unforeseen events not covered in Economic Uncertainty and Exposures Reserve.
C. Fund Equity Deficits
The Developer Deposits Special Revenue Fund had a deficit fund balance of $24 at June 30, 2009. This will be offset by developer reimbursements in fiscal year 2010. The Library Book Fund had a deficit fund balance of $3,364 at June 30, 2009. Future service charges are expected to offset the deficit in fiscal year 2010. The Miscellaneous Grants Fund had a deficit fund balance of $3,576 at June 30, 2009. Future grant revenues are expected to offset the deficit in fiscal year 2010. The Street Projects Capital Projects Fund had a deficit fund balance of $120,292 at June 30, 2009. Future grant revenues are expected to offset the deficit in fiscal year 2010.
The Community Center Capital Projects Fund had a deficit fund balance of $151,428 at June 30, 2009. Community donations are expected to offset the deficit in fiscal year 2010.
The Benicia Marina Enterprise Fund had a deficit fund balance of $253,019 at June 30, 2009. Future rental revenues are expected to offset this deficit in fiscal year 2010.
The Insurance Fund has deficit net assets of $42,136. Future service charges are expected to offset this deficit in fiscal year 2010. The Retirement Stability Internal Service Fund has deficit net assets of $167,149. Future service charges are expected to offset this deficit in fiscal year 2010.
CITY OF BENICIA
Notes to the Basic Financial Statements
67
Note 9 - Deferred Compensation Plan
City employees may defer a portion of their compensation under a City sponsored Deferred Compensation Plan created in accordance with Internal Revenue Code Section 457. Under this plan, participants are not taxed on the deferred portion of their compensation until distributed to them. Distributions may be made only at termination, retirement, death or in an emergency as defined by the Plan. The laws governing deferred compensation plan assets require plan assets to be held by a Trust for the exclusive benefit of plan participants and their beneficiaries. Since assets held under these plans are not the City’s property and are not subject to City control, they have been excluded from theses financial statements.
Note 10 - Defined Benefit Pension Plan (PERS)
The City of Benicia contributes to the California Public Employees Retirement System (PERS), a cost sharing multiple-employer public employee defined benefit pension plan for miscellaneous employees and a cost-sharing multiple-employer public employee defined benefit plan for safety employees. PERS provides retirement, disability benefits, and death benefits to plan members and beneficiaries. PERS acts as a common investment and administrative agent for participating public entities within the State of California. PERS issues a publicly available financial report that includes financial statements and required supplementary information for the cost sharing plans that are administered by PERS. Copies of PERS’ annual financial reports may be obtained from its executive office at 400 “Q” Street, Sacramento, California 95811. Miscellaneous and safety participants are required to contribute 8% to 9%, respectively, of their annual covered salary. The City makes the contributions required of City employees on their behalf and for their account. Benefit provisions and all other requirements are established by state statute and City contract with employee bargaining groups. For each of the fiscal years shown below, the City has contributed at the actuarially determined rate provided by PERS’ actuaries. Under GASB 27, an employer reports an annual pension cost (APC) equal to the annual required contribution (ARC) plus an adjustment for the cumulative difference between the APC and the employer’s actual plan contributions for the year. The cumulative difference is called the net pension obligation (NPO). The ARC for the period July 1, 2008 to June 30, 2009 has been determined by an actuarial valuation of the plan as of June 30, 2006. The contribution rate indicated for the period is 20.158% of payroll for the safety plan and 12.179% of payroll for the miscellaneous plan. In order to calculate the dollar value of the ARC for inclusion in financial statements prepared as of June 30, 2009, the contribution rate is multiplied by the payroll of covered employees that were paid during the period from July 1, 2008 to June 30, 2009.

CITY OF BENICIA
Notes to the Basic Financial Statements
68
Note 10 - Defined Benefit Pension Plan (PERS) (Continued) A summary of principle assumptions and methods used to determine the ARC is shown below.
Miscellaneous Plan Safety Plan
Valuation Date June 30, 2006 June 30, 2006Actuarial Cost Method Entry Age Actuarial Cost Method Entry Age Actuarial Cost MethodAmortization Method Level Percent of Payroll Level Percent of PayrollAverage Remaining Period 24 Years as of the Valuation Date 17 Years as of the Valuation DateAsset Valuation Method 15 Year Smoothed Market 15 Year Smoothed MarketActuarial Assumptions Investment Rate of Return 7.75% (net of administrative expenses) 7.75% (net of administrative expenses) Projected Salary Increases 3.25% to 14.45% depending on Age, 3.25% to 14.45% depending on Age,
Service, and type of employment Service, and type of employment Inflation 3.00% 3.00% Payroll Growth 3.25% 3.25% Individual Salary Growth A merit scale varying by duration of A merit scale varying by duration of
employment coupled with an assumed employment coupled with an assumedannual inflation growth of 3.0% annual inflation growth of 3.0%and an annual production growth of and an annual production growth of0.25% 0.25%
Initial unfunded liabilities are amortized over a closed period that depends on the plan’s date of entry into CalPERS. Subsequent plan amendments are amortized as a level percentage of pay over a closed 20-year period. Gains and losses that occur in the operation of the plan are amortized over a rolling 30 year period, which results in an amortization of 6% of unamortized gains and losses each year. If the plan’s accrued liability exceeds the actuarial value of plan assets, then the amortization payment on the total unfunded liability may not be lower than the payment calculated over a 30 year amortization period. Three-Year Trend Information
Fiscal Percentage of Net PensionYear Safety Miscellaneous APC Contributed Obligation
6/30/07 $1,292,242 1,077,392 100% - 6/30/08 1,370,958 1,246,392 100% - 6/30/09 1,483,256 1,482,387 100% -

CITY OF BENICIA
Notes to the Basic Financial Statements
69
Note 11 - Other Post Employment Benefits
A. Plan Description
The City of Benicia contracts with Kaiser, Health Net, Ameritas Dental & Vision and United Healthcare to provide medical, dental, and vision benefits to both active and retired employees. The City pays no direct financial contribution towards retiree health benefits; however, due to the fact that retirees and active employees are insured in the same pool it indirectly subsidizes their premiums through payments for current employees.
B. Eligibility
Employees (and their spouses) are eligible for retiree health benefits if they retire from the City on or after age 50 with at least 5 years of service and are eligible for a PERS pension. Retirees younger than age 65 are required to contribute the full amount of the monthly medical insurance premiums that are in effect for active employees. Retirees who are age 65 or older are required to contribute the full amount of the monthly premium rates in effect for Medicare Supplement insurance.
C. City’s Funding Policy
The contribution requirements of plan members and the City are established and may be amended by City Council. The contribution required to be made under City Council and labor agreement requirements is based on a pay-as-you-go basis (i.e., as medical insurance premiums become due). The City has not established a trust that is administered by the City for the purpose of holding assets accumulated for plan benefits.
D. Annual OPEB Cost and Net OPEB Obligation
The City’s annual other postemployment benefit (OPEB) cost (expense) is calculated based on the annual required contribution of the employer (ARC), an amount actuarially determined in accordance with the parameters of GASB Statement No. 45. The ARC represents a level of funding that, if paid on an ongoing basis, is projected to cover normal cost each year and amortize any unfunded actuarial liabilities (or funding excess) over a period not to exceed thirty years. The following table shows the components of the City’s annual OPEB cost for the year, the amount actually contributed to the plan, and changes in the City’s net OPEB obligation for these benefits:
Annual required contribution 448,137$ Interest on net OPEB obligation - Adjustment to annual required contribution -
Annual OPEB cost (expense) 448,137 Contributions made (including premiums paid) (150,159)
Increase in net OPEB obligation 297,978 Net OPEB obligation—beginning of year - Net OPEB obligation—end of year 297,978$

CITY OF BENICIA
Notes to the Basic Financial Statements
70
Note 11 - Other Post Employment Benefits (Continued)
The City’s annual OPEB cost, the percentage of annual OPEB cost contributed to the plan, and the net OPEB obligation for 2009 and the two preceding years were as follows:
Percentage of
Fiscal Annual Annual OPEB Net OPEBYear End OPEB Cost Cost Contributed Obligation
6/30/07 N/A N/A N/A6/30/08 N/A N/A N/A6/30/09 $448,137 34% 297,978
Actuarial valuations of an ongoing plan involve estimates of the value of reported amounts and assumptions about the probability of occurrence of events far into the future. Examples include assumptions about future employment, mortality, and the healthcare cost trend. Amounts determined regarding the funded status of the plan and the annual required contributions of the employer are subject to continual revision as actual results are compared with past expectations and new estimates are made about the future. The schedule of funding progress, presented as required supplementary information following the notes to the financial statements, presents multi-year trend information about whether the actuarial value of plan assets is increasing or decreasing over time relative to the actuarial accrued liabilities for the benefits.
E. Actuarial Methods and Assumptions
Projections of benefits for financial reporting purposes are based on the substantive plan (the plan as understood by the employer and the plan members) and include the types of benefits provided at the time of each valuation and the historical pattern of sharing of benefit costs between employer and plan members to that point. The actuarial methods and assumptions used include techniques that are designed to reduce the effects of short-term volatility in actuarial accrued liabilities and the actuarial assets, consistent with the long-term perspective of the calculations. The actuarial cost method used for determining the benefit obligations is the Entry Age Normal Cost Method. The actuarial assumptions included a 4.50 percent investment rate of return, which is the assumed rate of the expected long-term investment returns on plan assets calculated based on the funded level of the plan at the valuation date, and an annual healthcare cost trend rate of 10 percent initially, reduced by decrements of 1% per year to an ultimate rate of 5 percent after the sixth year. Both rates included a 3.0 percent inflation assumption. The UAAL is being amortized as a level percentage of projected payroll over 30 years. It is assumed the City’s payroll will increase 3.25% per year.

CITY OF BENICIA
Notes to the Basic Financial Statements
71
Note 11 - Other Post Employment Benefits (Continued)
Actuarial Valuation
Date
Actuarial Value of Assets (a)
Actuarial Accrued
Liability (AAL)- Entry Age (b)
Unfunded AAL (UAAL)
(b)-(a) Funded Ratio
(a)/(b) Covered
Payroll (c)
UAAL as a Percentage of
Covered Payroll (b)-
(a)/(c)
6/30/07 N/A N/A N/A N/A N/A N/A6/30/08 N/A N/A N/A N/A N/A N/A6/30/09 -$ 4,401,160 4,401,160 0.00% 19,529,818 23%
SCHEDULE OF FUNDING PROGRESS
Note 12 - Risk Management
A. Coverages
City employees are covered under a medical and prescriptions policy with coverage limited to $2,000,000 in the aggregate. The City provides group dental and vision coverage to employees through programs that are administered by a service agent. The City pays all dental and vision claims.
The City is a member of the Association of Bay Area Governments (ABAG), which provides general liability coverage of $5,000,000 above the City’s deductible of $25,000 per occurrence, and property damage insurance up to $1,000,000,000 above the City’s deductible of $1,000 to $250,000, for property damage. ABAG is governed by a board consisting of representatives from member municipalities. The board controls the operations of ABAG, including selection of management and approval of operating budgets, independent of any influence by member municipalities beyond their representation on the Board.
Actual surpluses or losses are shared according to a formula developed from overall loss costs and spread to member entities on a percentage basis after a retrospective rating. During the fiscal year ended June 30, 2009, the City contributed $620,359 for current year coverage.
Audited financial statements may be obtained from ABAG Services, P.O. Box 2050, Oakland, CA 94604-2050. The Local Agency Workers’ Compensation Excess Insurance Joint Powers Authority (LAWCX) covers workers’ compensation up to statutory limits. The City has a deductible or uninsured liability of up to $350,000 per claim. During the fiscal year ended June 30, 2009, the City contributed $112,807 for current year coverage. The City has purchased an additional of $20 million in excess coverage in current fiscal year.
LAWCX’s financial statements may be obtained from Bickmore & Associates, 6371 Auburn Boulevard, Citrus Heights, CA 95621.

CITY OF BENICIA
Notes to the Basic Financial Statements
72
Note 12 - Risk Management (Continued) B. Liability for Uninsured Claims
The City’s liability for uninsured claims, including estimated claims incurred but not reported, was estimated by management based on prior years claims experience and was computed as follows as of June 30:
Workers' General Compensation Liability Total 2008
Beginning claims payable 611,891$ 169,038 780,929 786,147
Liability for current year claims and
change in prior year claims estimate 135,434 48,371 183,805 439,304 Claims paid (197,155) (115,667) (312,822) (444,522) Ending claims payable balance 550,170$ 101,742 651,912 780,929
Claims liabilities due within one year 188,608$ 162,490 351,098 369,238
2009
For the years ended June 30, 2009, 2008, and 2007, the amount of settlements did not exceed insurance coverage.
Note 13 - Joint Powers Authorities
The City participates in joint ventures discussed below through separate entities established under the Joint Exercise of Powers Act of the State of California. As separate legal entities, these entities exercise full powers and authorities within the scope of the related Joint Powers Agreements including the preparation of annual budgets, accountability for all funds, the power to make and execute contracts and the right to sue and be sued. Each joint venture is governed by a board consisting of representatives from member municipalities. Each board controls the operations of the respective joint venture, including selection of management and approval of operating budgets, independent of any influence by member municipalities beyond their representation on that board. Obligations and liabilities of these joint ventures are not the City’s responsibility and the City does not have an equity interest in the assets of each joint venture except upon dissolution of the joint venture.

CITY OF BENICIA
Notes to the Basic Financial Statements
73
Note 13 - Joint Powers Authorities (Continued) A. Solano Water Authority
Solano Water Authority was established to coordinate water procurement and use among the Cities and County of Solano.
Members share the Water Authority’s expenses equally and each member has one representative on the commission that governs the Water Authority. Audited financial statements may be obtained from the Solano Water Authority at 508 Elmira Road, Vacaville, California, 95687.
B. Solano Transportation Authority
Solano Transportation Authority (STA) was established to develop regional strategies and meet regional transit and paratransit needs and to cooperatively address Solano County transportation issues.
The City’s payments to STA are in accordance with a formula under which each member entity pays a proportionate share of expenditures based on the entity’s population.
Audited financial statements may be obtained from STA at One Harbor Center, Suite 130, Suisun City, California, 94585.
Note 14 - Operating Lease
The City has signed a lease agreement with the Benicia Unified School District (BUSD), commencing April 1, 2007 and ending on March 31 2047, to lease the Mills School building and grounds located at 380 L Street, Benicia, for City use as a Community Center. This agreement can be renewed for two (2) additional ten (l0) year term.
The annual rent for said property shall be One Hundred Twenty Thousand Dollars ($120,000), payable in equal monthly payments of Ten Thousand Dollars ($10,000). Beginning in 2011, the monthly rent will be adjusted annually for each succeeding years using the Consumer Price Index for all Urban Consumers (CPI-U) San Francisco — Oakland — San Jose Metropolitan Area as published for June 2011 (or the nearest preceding month if not published for that month). The first such adjustment shall occur on July 1, 2011. Subsequent yearly adjustment calculation shall be determined by the April index and become effective on July 1 for each succeeding year of the lease.
City shall pay for all water, gas, light, heat, power, telephone, security service, garbage pick-up, sewage fees and all other services supplied on the premises. The City may, at its sole cost and expense, construct any improvements including buildings, roadways, sidewalks, fences, playgrounds, parking areas, utilities, signs, monuments and landscaping which City deems necessary to the operations of its business. In addition, the City shall maintain the existing premises and BUSD shall have no maintenance or repair obligations with respect to the premises being leased.
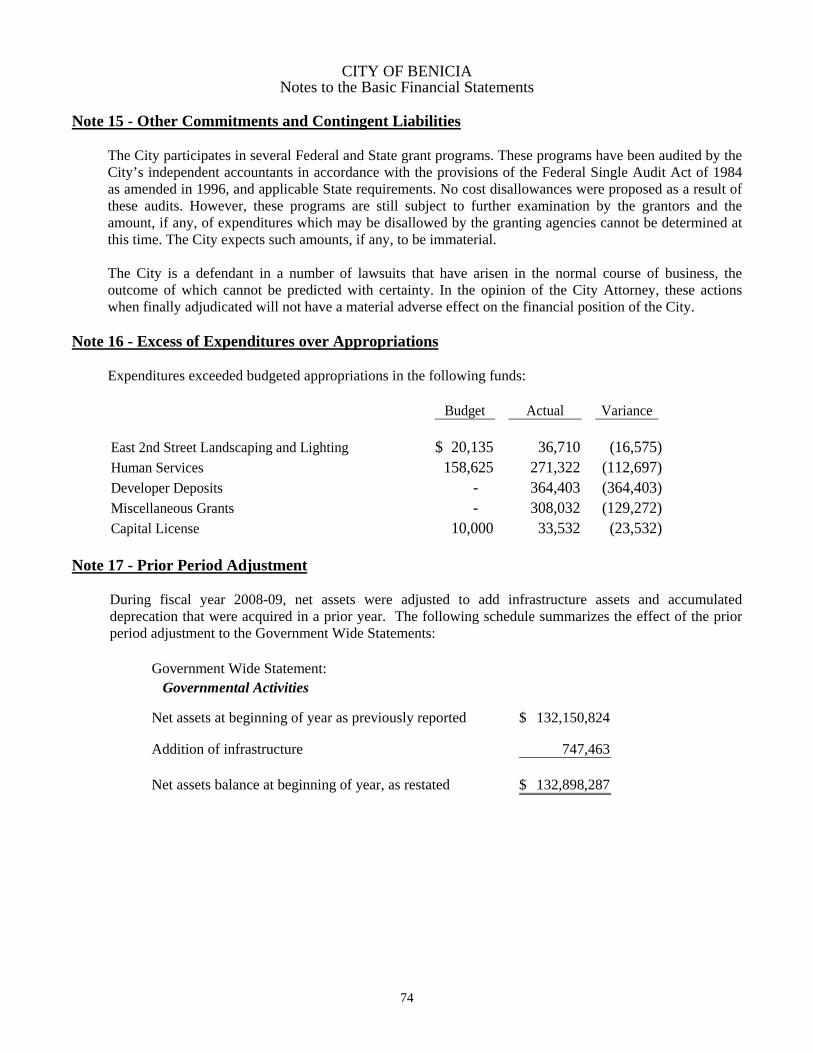
CITY OF BENICIA
Notes to the Basic Financial Statements
74
Note 15 - Other Commitments and Contingent Liabilities
The City participates in several Federal and State grant programs. These programs have been audited by the City’s independent accountants in accordance with the provisions of the Federal Single Audit Act of 1984 as amended in 1996, and applicable State requirements. No cost disallowances were proposed as a result of these audits. However, these programs are still subject to further examination by the grantors and the amount, if any, of expenditures which may be disallowed by the granting agencies cannot be determined at this time. The City expects such amounts, if any, to be immaterial.
The City is a defendant in a number of lawsuits that have arisen in the normal course of business, the outcome of which cannot be predicted with certainty. In the opinion of the City Attorney, these actions when finally adjudicated will not have a material adverse effect on the financial position of the City.
Note 16 - Excess of Expenditures over Appropriations
Expenditures exceeded budgeted appropriations in the following funds:
Budget Actual Variance
East 2nd Street Landscaping and Lighting 20,135$ 36,710 (16,575) Human Services 158,625 271,322 (112,697) Developer Deposits - 364,403 (364,403) Miscellaneous Grants - 308,032 (129,272) Capital License 10,000 33,532 (23,532)
Note 17 - Prior Period Adjustment
During fiscal year 2008-09, net assets were adjusted to add infrastructure assets and accumulated deprecation that were acquired in a prior year. The following schedule summarizes the effect of the prior period adjustment to the Government Wide Statements:
Government Wide Statement:Governmental Activities
Net assets at beginning of year as previously reported 132,150,824$
Addition of infrastructure 747,463
Net assets balance at beginning of year, as restated 132,898,287$

SUPPLEMENTARY SCHEDULES

CITY OF BENICIA
76
NON-MAJOR GOVERNMENTAL FUNDS SPECIAL REVENUE FUNDS Gas Tax - Accounts for monies received and expended from state gas tax allocation to cities. Landscaping and Lighting Districts: Residential, Fleetside, Columbus Parkway, East 2nd Street, and Goodyear Road - Accounts for monies received from property owners and allocated for the maintenance of landscaping of paths in walkways and lighting of streetlights within the bounds of the specified districts. Community Development Block Grant - Accounts for moneys received and expended by the City as a participant in the Federal Community Development Block Grant program. Community Services Program - Accounts for moneys received from developers, grants, and cemetery fees for expenditures to maintain childcare facilities in the City and the City Cemetery. Library Book - Accounts for fees collected from developers for the purchase of books for the main library. Library Programs - Accounts for donations and grant funds intended to promote literacy in the City. Library Measure B - Accounts for funds from Solano County Measure B sales tax to be used for enhancement of library services. Southern Pacific Depot - Accounts for community donations and rent receipts expended for the Southern Pacific Depot. Police and Fire Safety Grants - Accounts for various public safety grant revenues and their expenditures. Human Services - Accounts for citizen donations and General Fund allocations to assist residents within the City. Developer Deposits - Accounts for developer deposits, fees and related expenditures incurred for specific projects. Tourtelot Mitigation - Accounts for the cost of maintaining open space in the project area. Sources of revenue include fees paid by the developer and investment earnings. Miscellaneous Grants - Accounts for the BCDC grant used for the removal of four derelict barges from the Bay, and the BAAQMD grant used for a climate action plan to reduce greenhouse gas emissions within the City. VIP (Valero Improvement Project) Conservation Fund – Accounts for the Valero settlement monies required for environmental impact to be used for water conservation. DEBT SERVICE FUNDS 1997 Wastewater General Obligation Bond - Accounts for property tax levies for the payment of voter-approved debt principal and interest of the 1997 Wastewater General Obligation Bonds.

CITY OF BENICIA
77
NONMAJOR GOVERNMENTAL FUNDS (Continued) DEBT SERVICE FUNDS, Continued Casa De Vilarrasa - Accounts for the payment of debt principal and interest of the Casa De Vilarrasa Capital Lease. Sources of revenue include debt proceeds, investments earnings, and residual receipts from the project and General Fund advances. CAPITAL PROJECTS FUNDS Traffic Mitigation – Accounts for installation of new traffic signals and modification of streets for standardization of intersections. Sources of revenue include investment earnings, State grants, development fees and interfund transfers. Street Projects – Accounts for the construction of public improvements. Sources of revenue include local, state and federal funds. Capital License – Accounts for the construction of various capital projects throughout the City. Sources of revenue include investment earnings and capital license fees. Park Dedication – Accounts for construction and capital improvements of the City’s parks, trails and open lands. Sources of revenue include investment earnings, Parkland dedication fees, local and state grants. Library Basement Project – Accounts for costs of remodeling the basement of the Library and to provide expanded services for customers and staff. Storm Drain Improvements – Accounts for costs of replacing storm drains throughout the City. Community Center – Accounts for expenditures for the proposed Community Center. Sources of funding include proceeds from the sale of City owned land and investment earnings. Community Donations – Accounts for community donations for specific capital projects and the use of these revenues. Police Public Safety Building – Accounts for funding and renovation of the Police Department Building. Primary sources of revenue are fund transfers provided by the General Fund, debt proceeds and investment earnings. McAllister Assessment District – The McAllister Assessment District Capital Projects Fund accounts for the construction of public improvements benefiting the property within the bounds of the Assessment District, which is located north of Rose Drive and to the west of East Second Street. Source revenues include investment earnings and proceeds from bonds. Intermodal Transportation Center – Accounts for funding and construction of a proposed intermodal transportation center. Sources of revenue will come from transfers provided by the General Fund debt proceeds, investment earnings and grant funding. Casa De Vilarrasa – Accounts for the capital improvements and rehabilitation of the project. Sources of revenue include investment earnings and proceeds from bonds.

Special Debt CapitalRevenue Service Projects
Funds Funds Funds 2009 2008
Cash and investments 4,422,178$ 1,122,854 4,374,042 9,919,074 10,941,175 Accounts receivable 238,494 - 1,305,687 1,544,181 523,502 Interest receivable 3,295 931 3,778 8,004 27,304 Notes and loans receivable 407,477 - 1,717,035 2,124,512 1,996,310 Due from other funds - - 575,687 575,687 - Prepaid items 16,479 - - 16,479 18,163
Total assets 5,087,923$ 1,123,785 7,976,229 14,187,937 13,506,454
Liabilities:Accounts payable 264,391$ 250 718,506 983,147 1,131,047 Deposits payable 899,868 - - 899,868 893,913 Due to other funds 11,500 - 847,409 858,909 277,430 Deferred revenue 407,477 - 2,492,722 2,900,199 2,154,731
Total liabilities 1,583,236 250 4,058,637 5,642,123 4,457,121
Fund balances:Reserved:
Encumbrances 81,841 - 427,772 509,613 3,484,341 Debt service - 1,123,535 - 1,123,535 1,126,958 Open space - - 110,000 110,000 110,000 Prepaid items 16,479 - - 16,479 18,163
Unreserved:Undesignated, reported in:
Undesignated 3,406,367 - 3,379,820 6,786,187 4,309,871
Total fund balances 3,504,687 1,123,535 3,917,592 8,545,814 9,049,333
Total liabilities and fund balances 5,087,923$ 1,123,785 7,976,229 14,187,937 13,506,454
CITY OF BENICIACombining Balance Sheet
Nonmajor Governmental FundsJune 30, 2009
(with comparative information for the prior year)
Liabilities and Fund Balances
Assets
Totals
78

Special Debt CapitalRevenue Service Projects
Funds Funds Funds 2009 2008Revenues:
Property taxes -$ 759,264 - 759,264 741,494 Sales and use taxes 730,053 - - 730,053 720,144 Special assessments 565,996 - - 565,996 442,713 Investment income 121,024 31,934 134,412 287,370 487,689 Rents and leases 110 - 3,700 3,810 - Intergovernmental 1,270,522 - 975,000 2,245,522 2,422,947 Charges for services 478,513 - 152,182 630,695 843,818 Donations 114,990 - 2,700 117,690 135,786 Miscellaneous revenues 57,453 - 19,535 76,988 44,426
Total revenues 3,338,661 791,198 1,287,529 5,417,388 5,839,017
ExpendituresCurrent:
Public safety - police 316,372 - - 316,372 311,653 Parks and community services 499,323 - - 499,323 511,713 Public works 312,215 - - 312,215 20,457 Library 1,036,913 - - 1,036,913 1,052,608 Community development 875,438 - - 875,438 837,512 Economic development 31,364 - - 31,364 2,212
Capital outlay 55,648 - 4,351,906 4,407,554 3,832,798 Debt service:
Principal - 734,049 - 734,049 698,064 Interest and fiscal charges - 451,063 - 451,063 481,502
Total expenditures 3,127,273 1,185,112 4,351,906 8,664,291 7,748,519
Excess (deficiency) of revenues over (under) expenditures 211,388 (393,914) (3,064,377) (3,246,903) (1,909,502)
Other financing sources (uses):Transfers in 408,406 390,491 2,550,195 3,349,092 2,558,538 Transfers out (450,884) - (154,824) (605,708) (575,039)
Total other financing sources (uses) (42,478) 390,491 2,395,371 2,743,384 1,983,499
Net change in fund balances 168,910 (3,423) (669,006) (503,519) 73,997
Fund balances at beginning of year 3,335,777 1,126,958 4,586,598 9,049,333 8,975,336
Fund balances at end of year 3,504,687$ 1,123,535 3,917,592 8,545,814 9,049,333
Total
CITY OF BENICIACombining Statement of Revenues, Expenditures and Changes in Fund Balances
Nonmajor Governmental FundsFiscal year ended June 30, 2009
(with comparative information for the prior year)
79

Columbus Residential Fleetside Parkway
Landscaping Landscaping Landscaping and and and
Gas Tax Lighting Lighting Lighting
Cash and investments 543,578$ 170,236 147,295 90,319 Accounts receivable 56,379 - - - Interest receivable 442 162 147 78 Notes and loans receivable - - - - Prepaid items 16,479 - - -
Total assets 616,878$ 170,398 147,442 90,397
Liabilities and Fund Balances
Liabilities:Accounts payable 32,792$ 2,078 391 112 Deposits payable - - - - Due to other funds - - - - Deferred revenue - - - -
Total liabilities 32,792 2,078 391 112
Fund balances:Reserved for:
Encumbrances 7,422 - - - Prepaid items 16,479 - - -
Unreserved:Undesignated 560,185 168,320 147,051 90,285
Total fund balances (deficits) 584,086 168,320 147,051 90,285
Total liabilities and fund balances (deficits) 616,878$ 170,398 147,442 90,397
Assets
CITY OF BENICIANonmajor Special Revenue Funds
Combining Balance SheetJune 30, 2009
(with comparative information for the prior year)
80

East 2nd Street Goodyear RoadLandscaping Landscaping Community Community
and and Development Services Library Library Lighting Lighting Block Grant Program Book Programs
31,387 40,842 329,101 200,293 - 275,796 - - - - - - 28 35 218 171 - 242
- - 396,112 - 11,365 - - - - - - -
31,415 40,877 725,431 200,464 11,365 276,038
862 75 - - 79 18,649 - - - - - - - - - - 3,285 - - - 396,112 - 11,365 -
862 75 396,112 - 14,729 18,649
- - - - - - - - - - - -
30,553 40,802 329,319 200,464 (3,364) 257,389
30,553 40,802 329,319 200,464 (3,364) 257,389
31,415 40,877 725,431 200,464 11,365 276,038
81

Library Southern Police and Fire Human Measure B Pacific Depot Safety Grants Services
Cash and investments 221,153$ 130,248 402,900 141,058 Accounts receivable 86,840 - 77,474 3,921 Interest receivable 236 112 330 131 Notes and loans receivable - - - - Prepaid items - - - -
Total assets 308,229$ 130,360 480,704 145,110
Liabilities and Fund Balances
Liabilities:Accounts payable -$ 578 63,148 5,084 Deposits payable - - 40,611 - Due to other funds - - - - Deferred revenue - - - -
Total liabilities - 578 103,759 5,084
Fund balances:Reserved for:
Encumbrances - - 69,945 - Prepaid items - - - -
Unreserved:Undesignated 308,229 129,782 307,000 140,026
Total fund balances (deficits) 308,229 129,782 376,945 140,026
Total liabilities and fund balances (deficits) 308,229$ 130,360 480,704 145,110
Assets
CITY OF BENICIANonmajor Special Revenue Funds
Combining Balance SheetJune 30, 2009
(with comparative information for the prior year)
82

Developer Tourtelot Miscellaneous VIPDeposits Mitigation Grants Conservation 2009 2008
990,179 707,793 - - 4,422,178 4,149,009 - - 10,000 3,880 238,494 359,080 356 607 - - 3,295 10,167 - - - - 407,477 279,275 - - - - 16,479 18,163
990,535 708,400 10,000 3,880 5,087,923 4,875,902
131,302 - 5,361 3,880 264,391 368,025 859,257 - - - 899,868 890,613
- - 8,215 - 11,500 2,212 - - - - 407,477 279,275
990,559 - 13,576 3,880 1,583,236 1,540,125
- - 4,474 - 81,841 147,993 - - - - 16,479 18,163
(24) 708,400 (8,050) - 3,406,367 3,169,621
(24) 708,400 (3,576) - 3,504,687 3,335,777
990,535 708,400 10,000 3,880 5,087,923 4,875,902
Totals
83

Columbus Residential Fleetside Parkway
Landscaping Landscaping Landscaping and and and
Gas Tax Lighting Lighting Lighting
Sales and use taxes -$ - - - Special assessments - 299,886 218,309 15,800 Investment income 20,697 3,944 2,588 2,569 Rents and leases - - - - Intergovernmental 702,855 - - - Charges for services - - - - Donations - - - - Miscellaneous revenues - - - -
Total revenues 723,552 303,830 220,897 18,369
Expenditures:Current:
Public safety - police - - - - Parks and community services - 322,433 128,355 6,626 Public works 307,359 - - - Library - - - - Community development - - - - Economic development - - - -
Capital outlay - - - -
Total expenditures 307,359 322,433 128,355 6,626
Excess (deficiency) of revenues over (under) expenditures 416,193 (18,603) 92,542 11,743
Other financing sources (uses):Transfers in - - - - Transfers out (449,010) - - -
Total other financing sources (uses) (449,010) - - -
Net change in fund balances (32,817) (18,603) 92,542 11,743
Fund balances (deficits) at beginning of year 616,903 186,923 54,509 78,542
Fund balances (deficits) at end of year 584,086$ 168,320 147,051 90,285
Revenues:
CITY OF BENICIANonmajor Special Revenue Funds
Combining Statement of Revenues, Expenditures and Changes in Fund BalancesFiscal year ended June 30, 2009
(with comparative information for the prior year)
84

East 2nd Street Goodyear RoadLandscaping Landscaping Community Community
and and Development Services Library Library Lighting Lighting Block Grant Program Book Programs
- - - - - - 28,001 4,000 - - - -
957 1,194 25,293 5,311 224 8,175 - - - - - - - - - - - 53,961 - - - 41,075 2,474 106,118 - - - - - 84,135 - - - 100 - -
28,958 5,194 25,293 46,486 2,698 252,389
- - - - - - 36,710 921 - 4,278 - -
- - - - - - - - - - 16,423 279,306 - - 137,718 - - - - - - - - - - - - - - -
36,710 921 137,718 4,278 16,423 279,306
(7,752) 4,273 (112,425) 42,208 (13,725) (26,917)
- - - 10,000 - 72,750 - - - - - -
- - - 10,000 - 72,750
(7,752) 4,273 (112,425) 52,208 (13,725) 45,833
38,305 36,529 441,744 148,256 10,361 211,556
30,553 40,802 329,319 200,464 (3,364) 257,389
85

Library Southern Police and Fire Human Measure B Pacific Depot Safety Grants Services
Sales and use taxes 730,053$ - - - Special assessments - - - - Investment income 8,666 4,208 10,462 4,636 Rents and leases - 110 - - Intergovernmental - - 387,803 - Charges for services - - - - Donations - - 3,000 27,855 Miscellaneous revenues - - 17,916 -
Total revenues 738,719 4,318 419,181 32,491
Expenditures:Current:
Public safety - police - - 316,372 - Parks and community services - - - - Public works - - - - Library 741,184 - - - Community development - - - 271,322 Economic development - - - -
Capital outlay - 7,122 48,526 -
Total expenditures 741,184 7,122 364,898 271,322
Excess (deficiency) of revenues over (under) expenditures (2,465) (2,804) 54,283 (238,831)
Other financing sources (uses):Transfers in - - 59,830 265,826 Transfers out - - (1,874) -
Total other financing sources (uses) - - 57,956 265,826
Net change in fund balances (2,465) (2,804) 112,239 26,995
Fund balances (deficits) at beginning of year 310,694 132,586 264,706 113,031
Fund balances (deficits) at end of year 308,229$ 129,782 376,945 140,026
Revenues:
CITY OF BENICIANonmajor Special Revenue Funds
Combining Statement of Revenues, Expenditures and Changes in Fund BalancesFiscal year ended June 30, 2009
(with comparative information for the prior year)
86

Developer Tourtelot Miscellaneous VIPDeposits Mitigation Grants Conservation 2009 2008
- - - - 730,053 720,144 - - - - 565,996 442,713 - 22,100 - - 121,024 187,029 - - - - 110 - - - 125,903 - 1,270,522 1,451,949
328,846 - - - 478,513 692,931 - - - - 114,990 110,786
35,557 - - 3,880 57,453 19
364,403 22,100 125,903 3,880 3,338,661 3,605,571
- - - - 316,372 311,653 - - - - 499,323 511,713 - 4,856 - - 312,215 20,457 - - - - 1,036,913 1,052,608
364,403 - 98,115 3,880 875,438 837,512 - - 31,364 - 31,364 2,212 - - - - 55,648 450,275
364,403 4,856 129,479 3,880 3,127,273 3,186,430
- 17,244 (3,576) - 211,388 419,141
- - - - 408,406 387,855 - - - - (450,884) (67,878)
- - - - (42,478) 319,977
- 17,244 (3,576) - 168,910 739,118
(24) 691,156 - - 3,335,777 2,596,659
(24) 708,400 (3,576) - 3,504,687 3,335,777
Totals
87

1997 WastewaterGeneral Casa de
Obligation Bond Vilarrasa 2009 2008
Cash and investments 1,122,854$ - 1,122,854 1,123,940 Interest receivable 931 - 931 3,018
Total assets 1,123,785$ - 1,123,785 1,126,958
Liabilities and Fund Balances
Liabilities:Accounts payable 250$ - 250 -
Total liabilities 250 - 250 -
Fund balances:Reserved:
Debt service 1,123,535 - 1,123,535 1,126,958
Total fund balances 1,123,535 - 1,123,535 1,126,958
Total liabilities and fund balances 1,123,785$ - 1,123,785 1,126,958
Totals
Assets
CITY OF BENICIANonmajor Debt Service Funds
Combining Balance SheetJune 30, 2009
(with comparative information for the prior year)
88

1997 WastewaterGeneral Casa de
Obligation Bond Vilarrasa 2009 2008Revenues:
Property taxes 759,264$ - 759,264 741,494 Investment income 31,934 - 31,934 42,327 Miscellaneous revenues - - - 2,689
Total revenues 791,198 - 791,198 786,510
Expenditures:Debt service:
Principal 485,000 249,049 734,049 698,064 Interest and fiscal charges 309,124 141,939 451,063 481,502
Total expenditures 794,124 390,988 1,185,112 1,179,566
Excess (deficiency) of revenues over (under) expenditures (2,926) (390,988) (393,914) (393,056)
Other financing sources (uses):Transfers in - 390,491 390,491 388,294 Transfers out - - - (277,827)
Total other financing sources (uses) - 390,491 390,491 110,467
Net change in fund balance (2,926) (497) (3,423) (282,589)
Fund balances at beginning of year 1,126,461 497 1,126,958 1,409,547
Fund balances at end of year 1,123,535$ - 1,123,535 1,126,958
Totals
CITY OF BENICIANonmajor Debt Service Funds
Combining Statement of Revenues, Expenditures and Changes in Fund BalancesFiscal year ended June 30, 2009
(with comparative information for the prior year)
89

LibraryTraffic Street Capital Park Basement Storm Drain
Mitigation Projects License Dedication Project Improvements
Cash and investments 1,896,159$ 490,542 227,585 - 324,695 52,279 Accounts receivable - 575,687 - 530,000 - - Interest receivable 2,146 387 193 444 279 - Notes and loans receivable 61,860 - 58,225 196,950 - - Due from other funds 575,687 - - - - -
Total assets 2,535,852$ 1,066,616 286,003 727,394 324,974 52,279
Liabilities and Fund Balances
Liabilities: Accounts payable 146$ 35,534 - 319,703 - 52,279 Deposits payable - - - - - - Due to other funds - 575,687 - 120,644 - - Deferred revenue 61,860 575,687 58,225 196,950 - -
Total liabilities 62,006 1,186,908 58,225 637,297 - 52,279
Fund balances:Reserved:
Encumbrances 1,646 26,553 - 51,457 2,479 9,500 Open space - - - 110,000 - -
Unreserved:Undesignated 2,472,200 (146,845) 227,778 (71,360) 322,495 (9,500)
Total fund balances 2,473,846 (120,292) 227,778 90,097 324,974 -
Total liabilities and fund balances 2,535,852$ 1,066,616 286,003 727,394 324,974 52,279
CITY OF BENICIANonmajor Capital Projects Funds
Combining Balance SheetJune 30, 2009
Assets
(with comparative information for the prior year)
90
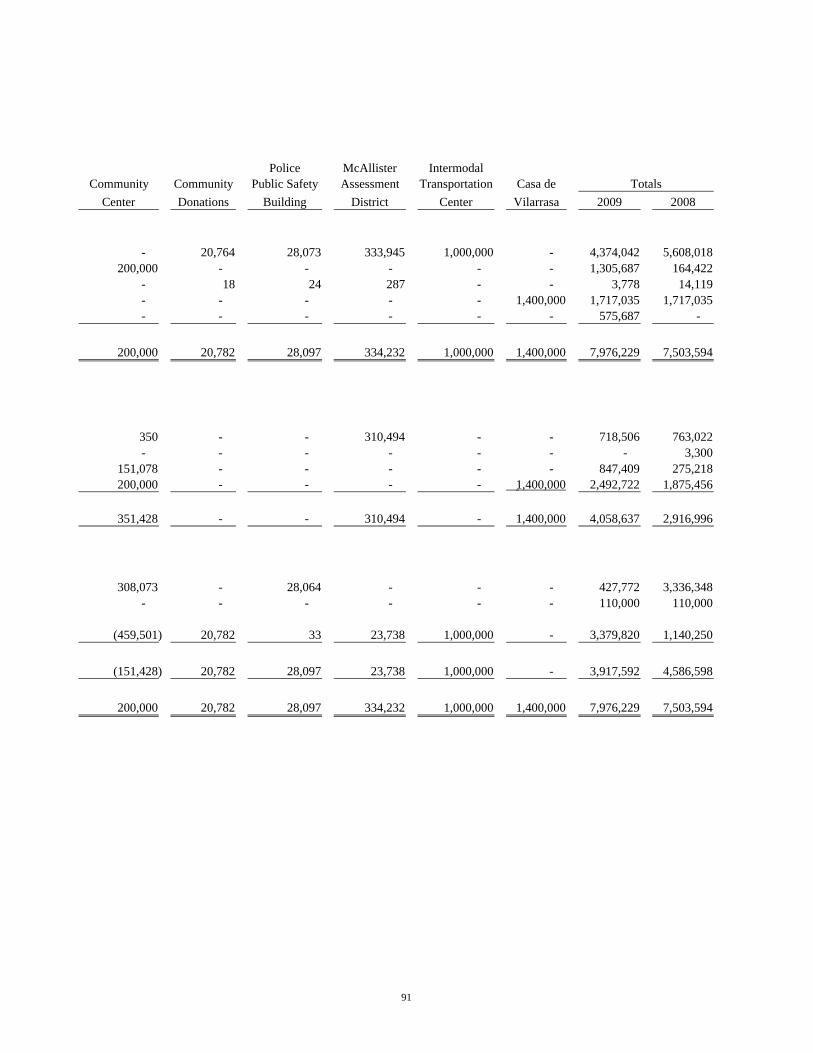
Police McAllister IntermodalCommunity Community Public Safety Assessment Transportation Casa de
Center Donations Building District Center Vilarrasa 2009 2008
- 20,764 28,073 333,945 1,000,000 - 4,374,042 5,608,018 200,000 - - - - - 1,305,687 164,422
- 18 24 287 - - 3,778 14,119 - - - - - 1,400,000 1,717,035 1,717,035 - - - - - - 575,687 -
200,000 20,782 28,097 334,232 1,000,000 1,400,000 7,976,229 7,503,594
350 - - 310,494 - - 718,506 763,022 - - - - - - - 3,300
151,078 - - - - - 847,409 275,218 200,000 - - - - 1,400,000 2,492,722 1,875,456
351,428 - - 310,494 - 1,400,000 4,058,637 2,916,996
308,073 - 28,064 - - - 427,772 3,336,348 - - - - - - 110,000 110,000
(459,501) 20,782 33 23,738 1,000,000 - 3,379,820 1,140,250
(151,428) 20,782 28,097 23,738 1,000,000 - 3,917,592 4,586,598
200,000 20,782 28,097 334,232 1,000,000 1,400,000 7,976,229 7,503,594
Totals
91

LibraryTraffic Street Capital Park Basement Storm Drain
Mitigation Projects License Dedication Project ImprovementsRevenues:
Investment income 92,373$ 2,673 7,796 18,037 9,990 - Rents and leases - - - - - - Intergovernmental - 125,000 - 850,000 - - Charges for services 66,061 - 21,475 64,546 - 100 Donations - - - - 2,700 - Miscellaneous revenues - - - 14,963 - 3,949
Total revenues 158,434 127,673 29,271 947,546 12,690 4,049
Expenditures:Capital outlay 265,154 542,267 33,532 3,142,637 2,407 242,790
Total expenditures 265,154 542,267 33,532 3,142,637 2,407 242,790
Excess (deficiency) of revenues over (under) expenditures (106,720) (414,594) (4,261) (2,195,091) 10,283 (238,741)
Other financing sources (uses):Transfers in - 449,010 - 1,853,145 2,407 148,753 Transfers out - - (33,777) (103,510) - -
Total other financing sources (uses) - 449,010 (33,777) 1,749,635 2,407 148,753
Net change in fund balance (106,720) 34,416 (38,038) (445,456) 12,690 (89,988)
Fund balances at beginning of year 2,580,566 (154,708) 265,816 535,553 312,284 89,988
Fund balances at end of year 2,473,846$ (120,292) 227,778 90,097 324,974 -
Fiscal year ended June 30, 2009
CITY OF BENICIANonmajor Capital Projects Funds
Combining Statement of Revenues, Expenditures and Changes in Fund Balances
92

Police McAllister IntermodalCommunity Community Public Safety Assessment Transportation Casa de
Center Donations Building District Center Vilarrasa 2009 2008
- 644 921 1,978 - - 134,412 258,333 3,700 - - - - - 3,700 -
- - - - - - 975,000 970,998 - - - - - - 152,182 150,887 - - - - - - 2,700 25,000 - - 623 - - - 19,535 41,718
3,700 644 1,544 1,978 - - 1,287,529 1,446,936
70,951 - 31,074 - 21,094 - 4,351,906 3,382,523
70,951 - 31,074 - 21,094 - 4,351,906 3,382,523
(67,251) 644 (29,530) 1,978 (21,094) - (3,064,377) (1,935,587)
93,510 - 3,370 - - - 2,550,195 1,782,389 - - - - (17,537) - (154,824) (229,334)
93,510 - 3,370 - (17,537) - 2,395,371 1,553,055
26,259 644 (26,160) 1,978 (38,631) - (669,006) (382,532)
(177,687) 20,138 54,257 21,760 1,038,631 - 4,586,598 4,969,130
(151,428) 20,782 28,097 23,738 1,000,000 - 3,917,592 4,586,598
Totals
93

Variance withFinal Budget Prior
Final Positive YearBudget Actual (Negative) Actual
Revenues:Investment income 2,120$ 20,697 18,577 8,670 Intergovernmental 827,115 702,855 (124,260) 957,297
Total revenues 829,235 723,552 (105,683) 965,967
Expenditures:Current:
Public works 238,220 - 238,220 - Capital outlay 610,570 307,359 303,211 373,918
Total expenditures 848,790 307,359 541,431 373,918
Excess (deficiency) of revenues over (under) expenditures (19,555) 416,193 435,748 592,049
Other financing sources (uses):Transfers out (449,010) (449,010) - -
Total other financing sources (uses) (449,010) (449,010) - -
Net change in fund balance (468,565) (32,817) 435,748 592,049
Fund balance at beginning of year 616,903 616,903 - 24,854
Fund balance at end of year 148,338$ 584,086 435,748 616,903
(with comparative information for the prior year)Fiscal year ended June 30, 2009
CITY OF BENICIAGas Tax
Schedule of Revenues, Expenditures andChanges in Fund Balance - Budget and Actual
94

Variance withFinal Budget Prior
Final Positive YearBudget Actual (Negative) Actual
Revenues:Special assessments 300,000$ 299,886 (114) 299,886 Investment income 2,500 3,944 1,444 6,656
Total revenues 302,500 303,830 1,330 306,542
Expenditures:Current:
Parks and community services 366,890 322,433 44,457 321,551 Capital outlay 2,000 - 2,000 -
Total expenditures 368,890 322,433 46,457 321,551
Excess (deficiency) of revenues over (under) expenditures (66,390) (18,603) 47,787 (15,009)
Net change in fund balance (66,390) (18,603) 47,787 (15,009)
Fund balance at beginning of year 186,923 186,923 - 201,932
Fund balance at end of year 120,533$ 168,320 47,787 186,923
(with comparative information for the prior year)Fiscal year ended June 30, 2009
Changes in Fund Balance - Budget and Actual
CITY OF BENICIAResidential Landscaping and Lighting
Schedule of Revenues, Expenditures and
95

Variance withFinal Budget Prior
Final Positive YearBudget Actual (Negative) Actual
Revenues:Special assessments 95,025$ 218,309 123,284 95,026 Investment income 1,200 2,588 1,388 1,834
Total revenues 96,225 220,897 124,672 96,860
Expenditures:Current:
Parks and community services 129,035 128,355 680 113,884 Capital outlay 16,530 - 16,530 -
Total expenditures 145,565 128,355 17,210 113,884
Excess (deficiency) of revenues over (under) expenditures (49,340) 92,542 141,882 (17,024)
Net change in fund balance (49,340) 92,542 141,882 (17,024)
Fund balance at beginning of year 54,509 54,509 - 71,533
Fund balance at end of year 5,169$ 147,051 141,882 54,509
(with comparative information for the prior year)Fiscal year ended June 30, 2009
CITY OF BENICIAFleetside Landscaping and Lighting
Schedule of Revenues, Expenditures andChanges in Fund Balance - Budget and Actual
96

Variance withFinal Budget Prior
Final Positive YearBudget Actual (Negative) Actual
Revenues:Special assessments 15,800$ 15,800 - 15,800 Investment income 700 2,569 1,869 2,952
Total revenues 16,500 18,369 1,869 18,752
Expenditures:Current:
Parks and community services 19,145 6,626 12,519 8,337 Capital outlay 13,400 - 13,400 -
Total expenditures 32,545 6,626 25,919 8,337
Excess (deficiency) of revenues over (under) expenditures (16,045) 11,743 27,788 10,415
Net change in fund balance (16,045) 11,743 27,788 10,415
Fund balance at beginning of year 78,542 78,542 - 68,127
Fund balance at end of year 62,497$ 90,285 27,788 78,542
(with comparative information for the prior year)Fiscal year ended June 30, 2009
CITY OF BENICIAColumbus Parkway Landscaping and Lighting
Schedule of Revenues, Expenditures andChanges in Fund Balance - Budget and Actual
97
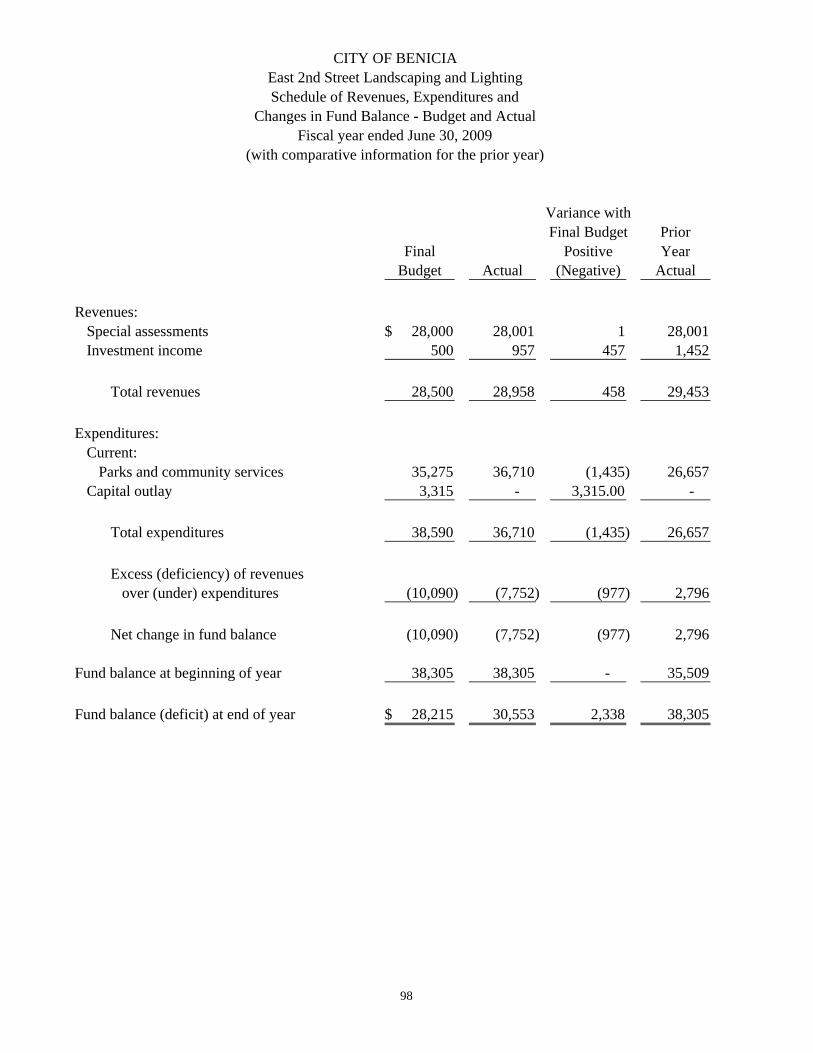
Variance withFinal Budget Prior
Final Positive YearBudget Actual (Negative) Actual
Revenues:Special assessments 28,000$ 28,001 1 28,001 Investment income 500 957 457 1,452
Total revenues 28,500 28,958 458 29,453
Expenditures:Current:
Parks and community services 35,275 36,710 (1,435) 26,657 Capital outlay 3,315 - 3,315.00 -
Total expenditures 38,590 36,710 (1,435) 26,657
Excess (deficiency) of revenues over (under) expenditures (10,090) (7,752) (977) 2,796
Net change in fund balance (10,090) (7,752) (977) 2,796
Fund balance at beginning of year 38,305 38,305 - 35,509
Fund balance (deficit) at end of year 28,215$ 30,553 2,338 38,305
(with comparative information for the prior year)Fiscal year ended June 30, 2009
CITY OF BENICIAEast 2nd Street Landscaping and LightingSchedule of Revenues, Expenditures and
Changes in Fund Balance - Budget and Actual
98
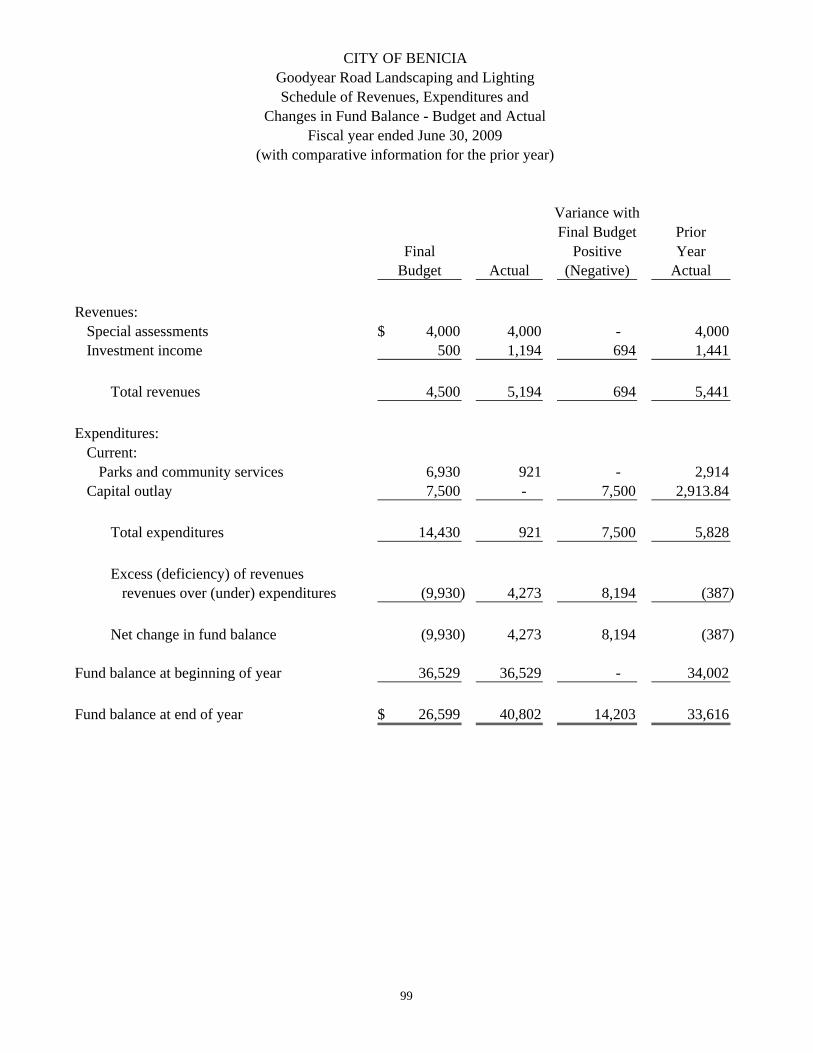
Variance withFinal Budget Prior
Final Positive YearBudget Actual (Negative) Actual
Revenues:Special assessments 4,000$ 4,000 - 4,000 Investment income 500 1,194 694 1,441
Total revenues 4,500 5,194 694 5,441
Expenditures:Current:
Parks and community services 6,930 921 - 2,914 Capital outlay 7,500 - 7,500 2,913.84
Total expenditures 14,430 921 7,500 5,828
Excess (deficiency) of revenues revenues over (under) expenditures (9,930) 4,273 8,194 (387)
Net change in fund balance (9,930) 4,273 8,194 (387)
Fund balance at beginning of year 36,529 36,529 - 34,002
Fund balance at end of year 26,599$ 40,802 14,203 33,616
(with comparative information for the prior year)Fiscal year ended June 30, 2009
CITY OF BENICIAGoodyear Road Landscaping and LightingSchedule of Revenues, Expenditures and
Changes in Fund Balance - Budget and Actual
99

Variance withFinal Budget Prior
Final Positive YearBudget Actual (Negative) Actual
Revenues:Investment income 26,000$ 25,293 (707) 68,435
Total revenues 26,000 25,293 (707) 68,435
Expenditures:Current:
Community development 167,500 137,718 29,782 -
Total expenditures 167,500 137,718 29,782 -
Excess (deficiency) of revenues over (under) expenditures (141,500) (112,425) 29,075 68,435
Net change in fund balance (141,500) (112,425) 29,075 68,435
Fund balance at beginning of year 441,744 441,744 - 373,309
Fund balance at end of year 300,244$ 329,319 29,075 441,744
(with comparative information for the prior year)Fiscal year ended June 30, 2009
CITY OF BENICIACommunity Development Block Grant
Schedule of Revenues, Expenditures andChanges in Fund Balance - Budget and Actual
100

Variance withFinal Budget Prior
Final Positive YearBudget Actual (Negative) Actual
Revenues:Investment income 3,810$ 5,311 1,501 5,025 Charges for services 30,000 41,075 11,075 53,277 Miscellaneous revenues - 100 100 -
Total revenues 33,810 46,486 12,676 58,302
Expenditures:Current:
Parks and community services - 4,278 (4,278) 38,370 Capital outlay 80,515 - 80,515 -
Total expenditures - 4,278 (4,278) 38,370
Excess (deficiency) of revenues over (under) expenditures 33,810 42,208 8,398 19,932
Other financing sources (uses):Transfers in 10,000 10,000 - - Transfers out - - - (4,829)
Total other financing sources (uses) 10,000 10,000 - (4,829)
Net change in fund balance 43,810 52,208 8,398 15,103
Fund balance at beginning of year 148,256 148,256 - 133,153
Fund balance at end of year 192,066$ 200,464 8,398 148,256
(with comparative information for the prior year)Fiscal year ended June 30, 2009
CITY OF BENICIACommunity Services Program
Schedule of Revenues, Expenditures andChanges in Fund Balance - Budget and Actual
101

Variance withFinal Budget Prior
Final Positive YearBudget Actual (Negative) Actual
Revenues:Investment income 1,410$ 224 (1,186) 870 Charges for services 10,000 2,474 (7,526) 3,261
Total revenues 11,410 2,698 (8,712) 4,131
Expenditures:Current:
Library 25,000 16,423 8,577 24,428
Total expenditures 25,000 16,423 8,577 24,428
Excess (deficiency) of revenues over (under) expenditures (13,590) (13,725) (135) (20,297)
Net change in fund balance (13,590) (13,725) (135) (20,297)
Fund balance at beginning of year 10,361 10,361 - 30,658
Fund balance (deficit) at end of year (3,229)$ (3,364) (135) 10,361
(with comparative information for the prior year)Fiscal year ended June 30, 2009
CITY OF BENICIALibrary Book
Schedule of Revenues, Expenditures andChanges in Fund Balance - Budget and Actual
102

Variance withFinal Budget Prior
Final Positive YearBudget Actual (Negative) Actual
Revenues:Investment income 1,750$ 8,175 6,425 10,447 Intergovernmental 56,755 53,961 (2,794) 61,553 Charges for services 120,000 106,118 (13,882) 127,868 Donations 75,275 84,135 8,860 69,181 Miscellaneous revenues 200 - (200) 19
Total revenues 253,980 252,389 (1,591) 269,068
Expenditures:Current:
Library 360,760 279,306 81,454 296,515 Capital outlay 102,300 - 102,300 -
Total expenditures 463,060 279,306 81,454 296,515
Excess (deficiency) of revenues over (under) expenditures (209,080) (26,917) 79,863 (27,446)
Other financing sources (uses):Transfers in 122,750 72,750 (50,000) 116,580 Transfers out (50,000) - 50,000 (50,000)
Total other financing sources (uses) 72,750 72,750 50,000 66,580
Net change in fund balance (136,330) 45,833 129,863 39,133
Fund balance at beginning of year 211,556 211,556 - 172,423
Fund balance at end of year 75,226$ 257,389 182,163 211,556
(with comparative information for the prior year)Fiscal year ended June 30, 2009
CITY OF BENICIALibrary Programs
Schedule of Revenues, Expenditures andChanges in Fund Balance - Budget and Actual
103

Variance withFinal Budget Prior
Final Positive YearBudget Actual (Negative) Actual
Revenues:Sales and use taxes 735,420$ 730,053 (5,367) 720,144 Investment income 4,000 8,666 4,666 13,205
Total revenues 739,420 738,719 (701) 733,349
Expenditures:Current:
Library 885,710 741,184 144,526 731,665 Capital outlay 7,140 - 7,140 -
Total expenditures 892,850 741,184 151,666 731,665
Excess (deficiency) of revenues over (under) expenditures (153,430) (2,465) 150,965 1,684
Net change in fund balance (153,430) (2,465) 150,965 1,684
Fund balance at beginning of year 310,694 310,694 - 309,010
Fund balance at end of year 157,264$ 308,229 150,965 310,694
(with comparative information for the prior year)Fiscal year ended June 30, 2009
CITY OF BENICIALibrary Measure B
Schedule of Revenues, Expenditures andChanges in Fund Balance - Budget and Actual
104

Variance withFinal Budget Prior
Final Positive YearBudget Actual (Negative) Actual
Revenues:Investment income 5,380$ 4,208 (1,172) 5,655 Rental income 500 110 (390) 14,400
Total revenues 5,880 4,318 (1,562) 20,055
Expenditures:Current:
Parks and community services 7,500 - 7,500 - Capital outlay 9,040 7,122 1,918 15,065
Total expenditures 16,540 7,122 9,418 15,065
Excess (deficiency) of revenues over (under) expenditures (10,660) (2,804) 7,856 4,990
Net change in fund balance (10,660) (2,804) 7,856 4,990
Fund balance at beginning of year 132,586 132,586 - 127,596
Fund balance at end of year 121,926$ 129,782 7,856 132,586
(with comparative information for the prior year)Fiscal year ended June 30, 2009
CITY OF BENICIASouthern Pacific Depot
Schedule of Revenues, Expenditures andChanges in Fund Balance - Budget and Actual
105

Variance withFinal Budget Prior
Final Positive YearBudget Actual (Negative) Actual
Revenues:Investment income 2,570$ 10,462 7,892 11,263 Intergovernmental 522,595 387,803 (134,792) 356,502 Donations - 3,000 3,000 13,399 Miscellaneous revenues 12,935 17,916 4,981 -
Total revenues 538,100$ 419,181 (118,919) 381,164
Expenditures:Current:
Public safety - police 428,105 316,372 111,733 311,653 Capital outlay 295,005 48,526 246,479 61,292
Total expenditures 723,110 364,898 358,212 372,945
Excess (deficiency) of revenues over (under) expenditures (185,010) 54,283 239,293 8,219
Other financing sources (uses):Transfers in 59,830 59,830 - 56,575 Transfers out - (1,874) (1,874) (1,470)
Total other financing sources (uses) 59,830 57,956 (1,874) 55,105
Net change in fund balance (125,180) 112,239 237,419 63,324
Fund balance at beginning of year 264,706 264,706 - 201,382
Fund balance at end of year 139,526$ 376,945 237,419 264,706
(with comparative information for the prior year)Fiscal year ended June 30, 2009
CITY OF BENICIAPolice and Fire Safety Grants
Schedule of Revenues, Expenditures andChanges in Fund Balance - Budget and Actual
106

Variance withFinal Budget Prior
Final Positive YearBudget Actual (Negative) Actual
Revenues:Investment income 4,600$ 4,636 36 5,834 Donations 31,000 27,855 (3,145) 28,206
Total revenues 35,600 32,491 (3,109) 34,040
Expenditures:Current:
Community development 257,995 271,322 (13,327) 254,602
Total expenditures 257,995 271,322 (13,327) 254,602
Excess (deficiency) of revenues over (under) expenditures (222,395) (238,831) (16,436) (220,562)
Other financing sources (uses):Transfers in 221,170 265,826 44,656 216,170
Total expenditures 221,170 265,826 44,656 216,170
Net change in fund balance (1,225) 26,995 28,220 (4,392)
Fund balance at beginning of year 113,031 113,031 - 117,423
Fund balance at end of year 111,806$ 140,026 28,220 113,031
(with comparative information for the prior year)Fiscal year ended June 30, 2009
CITY OF BENICIAHuman Services
Schedule of Revenues, Expenditures andChanges in Fund Balance - Budget and Actual
107

Variance withFinal Budget Prior
Final Positive YearBudget Actual (Negative) Actual
Revenues:Charges for services -$ 328,846 328,846 508,525 Miscellaneous revenues - 35,557 35,557 -
Total revenues - 364,403 364,403 508,525
Expenditures:Current:
Community development - 364,403 (364,403) 508,525
Total expenditures - 364,403 (364,403) 508,525
Excess (deficiency) of revenues over (under) expenditures - - - -
Net change in fund balance - - - -
Fund balance (deficit) at beginning of year (24) (24) - (24)
Fund balance (deficit) at end of year (24)$ (24) - (24)
(with comparative information for the prior year)Fiscal year ended June 30, 2009
CITY OF BENICIADeveloper Deposits
Schedule of Revenues, Expenditures andChanges in Fund Balance - Budget and Actual
108

Variance withFinal Budget Prior
Final Positive YearBudget Actual (Negative) Actual
Revenues:Investment income 18,250$ 22,100 3,850 28,890
Total revenues 18,250 22,100 3,850 28,890
Expenditures:Current:
Public works 43,000 4,856 38,144 20,457 Capital outlay 69,975 - 69,975 -
Total expenditures 112,975 4,856 108,119 20,457
Excess (deficiency) of revenues over (under) expenditures (94,725) 17,244 111,969 8,433
Other financing sources (uses):Transfers out - - - (13,049)
Total other financing sources (uses) - - - (13,049)
Net change in fund balance (94,725) 17,244 111,969 (4,616)
Fund balance at beginning of year 691,156 691,156 - 695,772
Fund balance at end of year 596,431$ 708,400 111,969 691,156
(with comparative information for the prior year)Fiscal year ended June 30, 2009
CITY OF BENICIATourtelot Mitigation
Schedule of Revenues, Expenditures andChanges in Fund Balance - Budget and Actual
109

Variance withFinal Budget Prior
Final Positive YearBudget Actual (Negative) Actual
Revenues:Intergovernmental revenues 40,000$ 125,903 85,903 76,597
Total revenues 40,000 125,903 85,903 76,597
Expenditures:Current:
Community development - 98,115 (98,115) 74,385 Economic development 37,790 31,364 6,426 2,212
Total expenditures 37,790 129,479 (91,689) 76,597
Excess (deficiency) of revenues over (under) expenditures 2,210 (3,576) (5,786) -
Net change in fund balance 2,210 (3,576) (5,786) -
Fund balance at beginning of year - - - -
Fund balance at end of year 2,210$ (3,576) (5,786) -
(with comparative information for the prior year)Fiscal year ended June 30, 2009
CITY OF BENICIAMiscellaneous Grants
Schedule of Revenues, Expenditures andChanges in Fund Balance - Budget and Actual
110
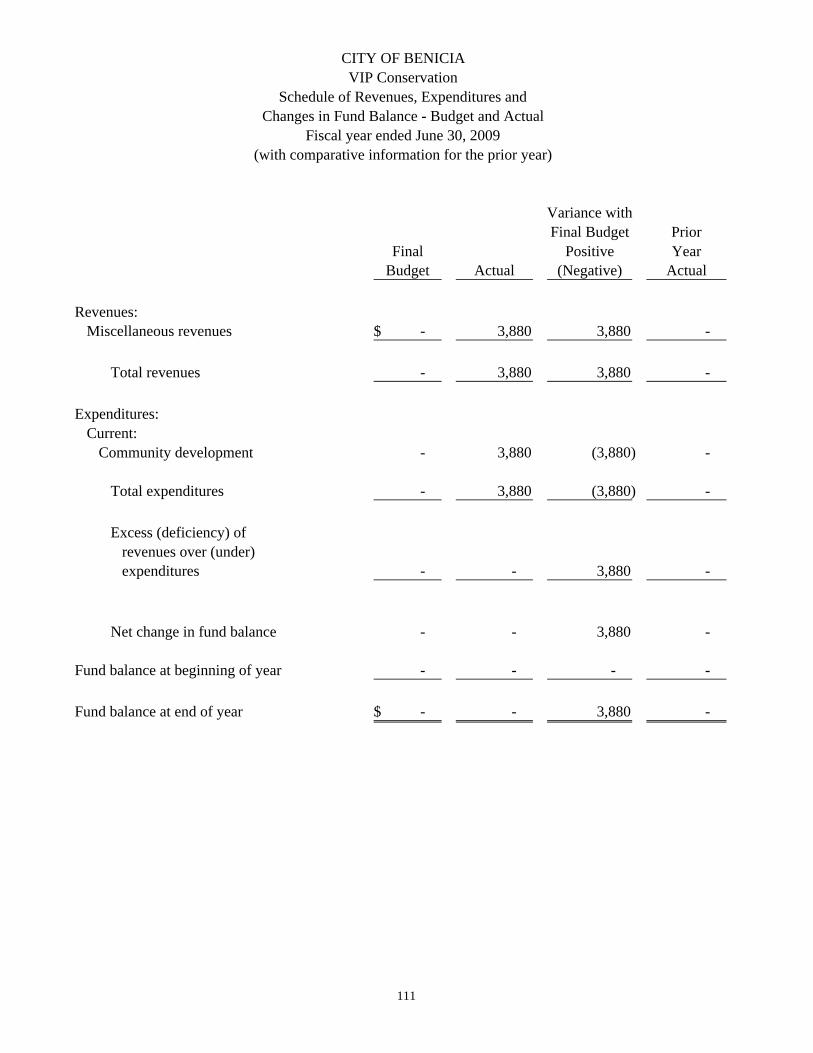
Variance withFinal Budget Prior
Final Positive YearBudget Actual (Negative) Actual
Revenues:Miscellaneous revenues -$ 3,880 3,880 -
Total revenues - 3,880 3,880 -
Expenditures:Current:
Community development - 3,880 (3,880) -
Total expenditures - 3,880 (3,880) -
Excess (deficiency) of revenues over (under) expenditures - - 3,880 -
Net change in fund balance - - 3,880 -
Fund balance at beginning of year - - - -
Fund balance at end of year -$ - 3,880 -
Fiscal year ended June 30, 2009(with comparative information for the prior year)
CITY OF BENICIAVIP Conservation
Schedule of Revenues, Expenditures andChanges in Fund Balance - Budget and Actual
111

Variance withFinal Budget Prior
Final Positive YearBudget Actual (Negative) Actual
Revenues:Property taxes 864,360$ 759,264 (105,096) 741,494 Investment income 11,330 31,934 20,604 41,525
Total revenues 875,690 791,198 (84,492) 783,019
Expenditures:Debt Service Principal 460,000 485,000 (25,000) 460,000 Interest and fiscal charges 329,755 309,124 20,631 328,226
Total expenditures 789,755 794,124 (4,369) 788,226
Excess (deficiency) of revenues over (under) expenditures 85,935 (2,926) (88,861) (5,207)
Net change in fund balance 85,935 (2,926) (88,861) (5,207)
Fund balance at beginning of year 1,126,461 1,126,461 - 1,131,668
Fund balance at end of year 1,212,396$ 1,123,535 (88,861) 1,126,461
(with comparative information for the prior year)Fiscal year ended June 30, 2009
CITY OF BENICIA1997 Wastewater General Obligation BondSchedule of Revenues, Expenditures and
Changes in Fund Balance - Budget and Actual
112

Variance withFinal Budget Prior
Final Positive YearBudget Actual (Negative) Actual
Revenues:Investment income -$ - - 802 Miscellaneous revenues 5,000 - (5,000) 2,689
Total revenues 5,000 - (5,000) 3,491
Expenditures:Debt service: Principal 249,050 249,049 1 238,064 Interest and fiscal charges 141,945 141,939 6 153,276
Total expenditures 390,995 390,988 7 391,340
Excess (deficiency) of revenues over (under) expenditures (385,995) (390,988) (4,993) (387,849)
Other financing sources (uses):Transfers in 385,995 390,491 4,496 388,294 Transfers out - - - (277,827)
Total other financing sources (uses) 385,995 390,491 4,496 110,467
Net change in fund balance - (497) (497) (277,382)
Fund balance at beginning of year 497 497 - 277,879
Fund balance at end of year 497$ - (497) 497
(with comparative information for the prior year)Fiscal year ended June 30, 2009
CITY OF BENICIACasa de Vilarrasa
Schedule of Revenues, Expenditures andChanges in Fund Balance - Budget and Actual
113

Variance withFinal Budget Prior
Final Positive YearBudget Actual (Negative) Actual
Revenues:Investment income 94,500$ 92,373 (2,127) 132,056 Charges for services 150,000 66,061 (83,939) 59,621 Miscellaneous revenues - - - 4,000
Total revenues 244,500 158,434 (86,066) 195,677
Expenditures:Capital outlay 1,395,650 265,154 1,130,496 260,370
Total expenditures 1,395,650 265,154 1,130,496 260,370
Excess (deficiency) of revenues over (under) expenditures (1,151,150) (106,720) 1,044,430 (64,693)
Other financing sources (uses):Transfers in 47,000 - (47,000) 69,579
Total other financing sources (uses) 47,000 - (47,000) 69,579
Net change in fund balance (1,104,150) (106,720) 997,430 4,886
Fund balance at beginning of year 2,580,566 2,580,566 - 2,575,680
Fund balance at end of year 1,476,416$ 2,473,846 997,430 2,580,566
(with comparative information for the prior year)Fiscal year ended June 30, 2009
CITY OF BENICIATraffic Mitigation
Schedule of Revenues, Expenditures andChanges in Fund Balance - Budget and Actual
114
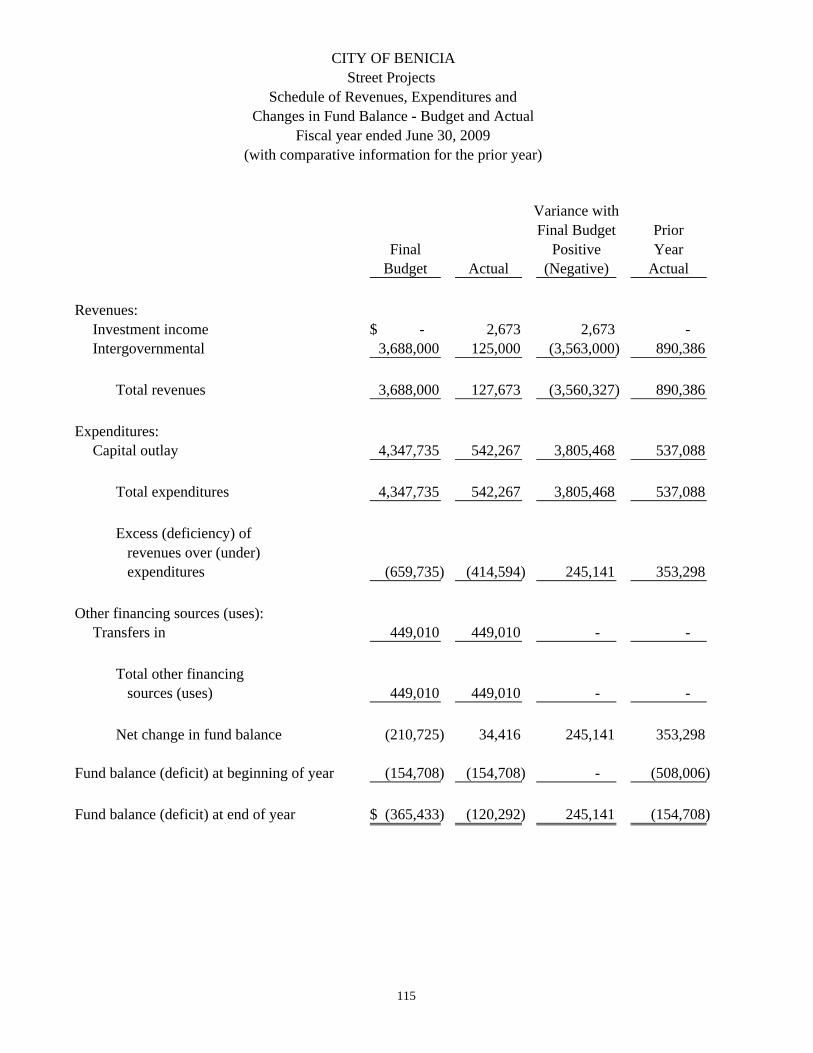
Variance withFinal Budget Prior
Final Positive YearBudget Actual (Negative) Actual
Revenues:Investment income -$ 2,673 2,673 - Intergovernmental 3,688,000 125,000 (3,563,000) 890,386
Total revenues 3,688,000 127,673 (3,560,327) 890,386
Expenditures:Capital outlay 4,347,735 542,267 3,805,468 537,088
Total expenditures 4,347,735 542,267 3,805,468 537,088
Excess (deficiency) of revenues over (under) expenditures (659,735) (414,594) 245,141 353,298
Other financing sources (uses):Transfers in 449,010 449,010 - -
Total other financing sources (uses) 449,010 449,010 - -
Net change in fund balance (210,725) 34,416 245,141 353,298
Fund balance (deficit) at beginning of year (154,708) (154,708) - (508,006)
Fund balance (deficit) at end of year (365,433)$ (120,292) 245,141 (154,708)
(with comparative information for the prior year)Fiscal year ended June 30, 2009
CITY OF BENICIAStreet Projects
Schedule of Revenues, Expenditures andChanges in Fund Balance - Budget and Actual
115

Variance withFinal Budget Prior
Final Positive YearBudget Actual (Negative) Actual
Revenues:Investment income 560$ 7,796 7,236 19,352 Charges for services 20,000 21,475 1,475 30,250
Total revenues 20,560 29,271 8,711 49,602
Expenditures:Capital outlay 189,360 33,532 155,828 214,673
Total expenditures 189,360 33,532 155,828 214,673
Excess (deficiency) of revenues over (under) expenditures (168,800) (4,261) 164,539 (165,071)
Other financing sources (uses):Transfers out (28,000) (33,777) (5,777) (157,474)
Total other financing sources (uses) (28,000) (33,777) (5,777) (157,474)
Net change in fund balance (196,800) (38,038) 158,762 (322,545)
Fund balance at beginning of year 265,816 265,816 - 588,361
Fund balance at end of year 69,016$ 227,778 158,762 265,816
(with comparative information for the prior year)Fiscal year ended June 30, 2009
CITY OF BENICIACapital License
Schedule of Revenues, Expenditures andChanges in Fund Balance - Budget and Actual
116

Variance withFinal Budget Prior
Final Positive YearBudget Actual (Negative) Actual
Revenues:Investment income -$ 18,037 18,037 39,010 Intergovernmental 900,000 850,000 (50,000) 80,612 Charges for services 95,000 64,546 (30,454) 60,916 Miscellaneous revenues - 14,963 14,963 -
Total revenues 995,000 947,546 (47,454) 180,538
Expenditures:Capital outlay 3,369,575 3,142,637 226,938 1,218,986
Total expenditures 3,369,575 3,142,637 226,938 1,218,986
Excess (deficiency) of revenues over (under) expenditures (2,374,575) (2,195,091) 179,484 (1,038,448)
Other financing sources (uses):Transfers in 1,853,145 1,853,145 - 724,918 Transfers out (103,510) (103,510) - (21,155)
Total other financing sources (uses) 1,853,145 1,749,635 - 703,763
Net change in fund balance (521,430) (445,456) 179,484 (334,685)
Fund balance at beginning of year 535,553 535,553 - 870,238
Fund balance at end of year 14,123$ 90,097 75,974 535,553
(with comparative information for the prior year)Fiscal year ended June 30, 2009
CITY OF BENICIAPark Dedication
Schedule of Revenues, Expenditures andChanges in Fund Balance - Budget and Actual
117

Variance withFinal Budget Prior
Final Positive YearBudget Actual (Negative) Actual
Revenues:Investment income -$ 9,990 9,990 12,284 Donations 2,700 2,700 - -
Total revenues 2,700 12,690 9,990 12,284
Expenditures:Capital outlay 375,270 2,407 372,863 36,729
Total expenditures 375,270 2,407 372,863 36,729
Excess (deficiency) of revenues over (under) expenditures (372,570) 10,283 382,853 (24,445)
Other financing sources (uses):Transfers in - 2,407 2,407 36,729
Total other financing sources (uses) - 2,407 2,407 36,729
Net change in fund balance (372,570) 12,690 385,260 12,284
Fund balance at beginning of year 312,284 312,284 - 300,000
Fund balance at end of year (60,286)$ 324,974 385,260 312,284
(with comparative information for the prior year)Fiscal year ended June 30, 2009
CITY OF BENICIALibrary Basement Project
Schedule of Revenues, Expenditures andChanges in Fund Balance - Budget and Actual
118

Variance withFinal Budget Prior
Final Positive YearBudget Actual (Negative) Actual
Revenues:Charges for services -$ 100 100 100 Miscellaneous revenues - 3,949 3,949 36,949
Total revenues - 4,049 4,049 37,049
Expenditures:Capital outlay 290,290 242,790 47,500 502,592
Total expenditures 290,290 242,790 47,500 502,592
Excess (deficiency) of revenues over (under) expenditures (290,290) (238,741) 51,549 (465,543)
Other financing sources (uses):Transfers in 290,290 148,753 (141,537) 646,090
Total other financing sources (uses) 290,290 148,753 (141,537) 646,090
Net change in fund balance - (89,988) (89,988) 180,547
Fund balance at beginning of year 89,988 89,988 - (90,559)
Fund balance at end of year 89,988$ - (89,988) 89,988
(with comparative information for the prior year)Fiscal year ended June 30, 2009
CITY OF BENICIAStorm Drain Improvements
Schedule of Revenues, Expenditures andChanges in Fund Balance - Budget and Actual
119

Variance withFinal Budget Prior
Final Positive YearBudget Actual (Negative) Actual
Revenues:Investment income -$ - - 333 Rental income 3,700 3,700 - - Donations - - - 25,000 Valero improvement project settlement 158,000 - (158,000) -
Total revenues 161,700 3,700 (158,000) 25,333
Expenditures:Capital outlay 1,773,995 70,951 1,703,044 438,278
Total expenditures 1,773,995 70,951 1,703,044 438,278
Excess (deficiency) of revenues over (under) expenditures (1,612,295) (67,251) 1,545,044 (412,945)
Other financing sources (uses):Transfers in 93,510 93,510 - 91,480
Total other financing sources (uses) 93,510 93,510 - 91,480
Net change in fund balance (1,518,785) 26,259 1,545,044 (321,465)
Fund balance (deficit) at beginning of year (177,687) (177,687) - 143,778
Fund balance (deficit) at end of year (1,696,472)$ (151,428) 1,545,044 (177,687)
(with comparative information for the prior year)Fiscal year ended June 30, 2009
CITY OF BENICIACommunity Center
Schedule of Revenues, Expenditures andChanges in Fund Balance - Budget and Actual
120

Variance withFinal Budget Prior
Final Positive YearBudget Actual (Negative) Actual
Revenues:Investment income -$ 644 644 809 Miscellaneous revenues - - - 769
Total revenues - 644 644 1,578
Expenditures:Capital outlay 13,175 - 13,175 -
Total expenditures 13,175 - 13,175 -
Excess (deficiency) of revenues over (under) expenditures (13,175) 644 13,819 1,578
Other financing sources (uses):Transfers out - - - (2,527)
Total other financing sources (uses) - - - (2,527)
Net change in fund balance (13,175) 644 13,819 (949)
Fund balance at beginning of year 20,138 20,138 - 21,087
Fund balance at end of year 6,963$ 20,782 13,819 20,138
(with comparative information for the prior year)Fiscal year ended June 30, 2009
CITY OF BENICIACommunity Donations
Schedule of Revenues, Expenditures andChanges in Fund Balance - Budget and Actual
121

Variance withFinal Budget Prior
Final Positive YearBudget Actual (Negative) Actual
Revenues:Investment income -$ 921 921 501 Miscellaneous revenues - 623 623 -
Total revenues - 1,544 1,544 501
Expenditures:Capital outlay 78,375 31,074 47,301 173,807
Total expenditures 78,375 31,074 47,301 173,807
Excess (deficiency) of revenues over (under) expenditures (78,375) (29,530) 48,845 (173,306)
Other financing sources (uses):Transfers in - 3,370 3,370 213,593 Transfers out - - - (16,648)
Total other financing sources (uses) - 3,370 3,370 196,945
Net change in fund balance (78,375) (26,160) 52,215 23,639
Fund balance at beginning of year 54,257 54,257 - 30,618
Fund balance at end of year (24,118)$ 28,097 52,215 54,257
(with comparative information for the prior year)Fiscal year ended June 30, 2009
CITY OF BENICIAPolice Public Safety Building
Schedule of Revenues, Expenditures andChanges in Fund Balance - Budget and Actual
122

Variance withFinal Budget Prior
Final Positive YearBudget Actual (Negative) Actual
Revenues:Investment income -$ 1,978 1,978 1,161
Total revenues - 1,978 1,978 1,161
Excess (deficiency) of revenues over (under) expenditures - 1,978 1,978 1,161
Net change in fund balance - 1,978 1,978 1,161
Fund balance at beginning of year 21,760 21,760 - 20,599
Fund balance at end of year 21,760$ 23,738 1,978 21,760
(with comparative information for the prior year)Fiscal year ended June 30, 2009
CITY OF BENICIAMcAllister Assessment District
Schedule of Revenues, Expenditures andChanges in Fund Balance - Budget and Actual
123

Variance withFinal Budget Prior
Final Positive YearBudget Actual (Negative) Actual
Revenues:Investment income 47,000$ - (47,000) 52,827
Total revenues 47,000 - (47,000) 52,827
Expenditures:Capital outlay 126,700 21,094 105,606 -
Total expenditures 126,700 21,094 105,606 -
Excess (deficiency) of revenues over (under) expenditures (79,700) (21,094) 58,606 52,827
Other financing sources (uses):Transfers out (47,000) (17,537) 29,463 (31,530)
Total other financing sources (uses) (47,000) (17,537) 29,463 (31,530)
Net change in fund balance (126,700) (38,631) 88,069 21,297
Fund balance at beginning of year 1,038,631 1,038,631 - 1,017,334
Fund balance at end of year 911,931$ 1,000,000 88,069 1,038,631
(with comparative information for the prior year)Fiscal year ended June 30, 2009
CITY OF BENICIAIntermodal Transportation Center
Schedule of Revenues, Expenditures andChanges in Fund Balance - Budget and Actual
124

CITY OF BENICIA
125
INTERNAL SERVICE FUNDS
INSURANCE FUND Accounts for the accumulation and allocation of costs associated with the administration of medical coverage, temporary disability payments, safety training to all employees and maintaining excess insurance coverage for Workers’ Compensation. GENERAL SERVICES Accounts for the accumulation and allocation of costs pertaining to utility billing, liability insurance and property insurance of the Water and Wastewater Funds. The Fund also accounts for the preparation, maintenance and repair of mechanical equipment and vehicles for other departments. BUILDING AND EQUIPMENT MANAGEMENT Accounts for the maintenance and remodeling of City owned buildings and facilities and acquisition of replacement vehicles and equipment. RETIREMENT STABILITY FUND Provides for equalization of retirement costs. Sources of revenue include investment earnings, and service charges to departments.

Building andGeneral Equipment Retirement
Insurance Services Maintenance Stability 2009 2008Assets:
Current assets:Cash and investments 226,402$ 5,360 2,214,370 935,298 3,381,430 3,135,090 Interest receivable 223 - 1,930 727 2,880 9,702 Inventory - 15,170 - - 15,170 22,670 Prepaid items - 20,448 - 2,500 22,948 51,856
Total current assets 226,625 40,978 2,216,300 938,525 3,422,428 3,219,318
Noncurrent assetsPrepaid PERS contribution - - - 12,601,889 12,601,889 12,938,284 Advances to other funds 314,853 - - - 314,853 343,460 Capital assets, net of
accumulated depreciation - - 8,900,981 - 8,900,981 9,272,410
Total assets 541,478 40,978 11,117,281 13,540,414 25,240,151 25,773,472
Liabilities:Current liabilities:
Accounts payable 33,444 32,652 32,867 - 98,963 147,974 Interest payable - - 3,553 31,186 34,739 34,174 Due to other funds - 8,326 - - 8,326 16,319 Workers' compensation claims 200,200 - - - 200,200 200,200 Current portion of long-term liabilities - - - 885,000 885,000 710,000
Total current liabilities 233,644 40,978 36,420 916,186 1,227,228 1,108,667
Noncurrent liabilities:Workers' compensation claims 349,970 - - - 349,970 411,691 Lease obligation - - 327,973 - 327,973 - Pension obligation bonds - - - 12,791,377 12,791,377 13,592,593 Advances from other funds - - 314,853 - 314,853 343,460
Total liabilities 583,614 40,978 679,246 13,707,563 15,011,401 15,456,411
Net assets:Invested in capital assets, net of related debt - - 8,573,008 - 8,573,008 9,272,410 Unrestricted (42,136) - 1,865,027 (167,149) 1,655,742 1,044,651
Total net assets (42,136)$ - 10,438,035 (167,149) 10,228,750 10,317,061
Totals
CITY OF BENICIAInternal Service Funds
Combining Statement of Net AssetsJune 30, 2009
(with comparative information for the prior year)
126

Building andGeneral Equipment Retirement
Insurance Services Maintenance Stability 2009 2008
Operating revenues:Charges for services 308,959$ 1,195,767 531,505 1,109,430 3,145,661 3,754,311 Other 27,500 62 177,005 - 204,567 92,891
Total operating revenues 336,459 1,195,829 708,510 1,109,430 3,350,228 3,847,202
Operating expenses:Wages and benefits 55,125 752,392 - - 807,517 745,310 Materials and supplies - 36,574 325,677 - 362,251 656,914 Operations and maintenance 64,184 215,954 - - 280,138 277,750 Claims and insurance 478,801 190,909 - - 669,710 507,877 Depreciation - - 570,370 - 570,370 556,680
Total operating expenses 598,110 1,195,829 896,047 - 2,689,986 2,744,531
Operating income (loss) (261,651) - (187,537) 1,109,430 660,242 1,102,671
Nonoperating revenues (expenses):Interest income 23,101 - 53,530 17,095 93,726 151,662 Interest expense - - (24,660) (495,525) (520,185) (1,295,933) Pension obligation amortization - - - (336,394) (336,394) (345,375) Gain (loss) on disposal of assets - - 4,300 - 4,300 (5,102)
Total nonoperating revenues 23,101 - 33,170 (814,824) (758,553) (1,494,748)
Income (loss) before transfers (238,550) - (154,367) 294,606 (98,311) (392,077)
Transfers:Transfers in - - 10,000 - 10,000 102,324 Transfers out - - - - - (25,000)
Total transfers - - 10,000 - 10,000 77,324
Change in net assets (238,550) - (144,367) 294,606 (88,311) (314,753)
Net assets (deficit) at beginning of year 196,414 - 10,582,402 (461,755) 10,317,061 10,631,814
Net assets (deficit) at end of year (42,136)$ - 10,438,035 (167,149) 10,228,750 10,317,061
Totals
CITY OF BENICIAInternal Service Funds
Combining Statement of Revenues, Expenses and Changes in Fund Net AssetsFiscal year ended June 30, 2009
(with comparative information for the prior year)
127

Building andGeneral Equipment Retirement
Insurance Services Management Stability 2009 2008Cash flows from operating activities:
Receipts from customers 336,459$ 1,195,829 708,510 1,109,430 3,350,228 3,847,202 Payments to suppliers for goods and services (582,712) (443,236) (356,922) - (1,382,870) (1,227,322) Payments to employees for services (55,125) (752,392) - - (807,517) (1,034,667)
Net cash provided by (used for) operating activities (301,378) 201 351,588 1,109,430 1,159,841 1,585,213
Cash flows from non-capital financing activities:Principal paid in non-capital debt - - - (710,000) (710,000) (470,000) Interest paid on non-capital debt - - - (414,729) (414,729) (414,667) Transfers in - - 10,000 - 10,000 117,150 Transfers (out) - - - - - (25,000) Advances to other funds 28,607 - - - 28,607 - Advances from other funds - (7,993) (28,607) - (36,600) -
Net cash provided by (used for) non-capital and related activities 28,607 (7,993) (18,607) (1,124,729) (1,122,722) (792,517)
Cash flows from capital and related financing activities:Principal paid on debt - - (37,027) - (37,027) - Interest paid on debt - - (24,660) - (24,660) - Proceeds from capital lease - - 365,000 - 365,000 - Acquisition of capital assets, net - - (198,941) - (198,941) (1,089,925) Proceeds from sale of capital assets - - 4,300 - 4,300 5,565
Net cash provided by (used for) capital and related financing activities - - 108,672 - 108,672 (1,084,360)
Cash flows from investing activities:Interest received on investments 25,029 - 55,839 19,681 100,549 160,326
Net cash provided by (used for) investing activities 25,029 - 55,839 19,681 100,549 160,326
Net increase (decrease) in cash and cash equivalents (247,742) (7,792) 497,492 4,382 246,340 (131,338)
Cash and cash equivalents at beginning of year 474,144 13,152 1,716,878 930,916 3,135,090 3,266,428
Cash and cash equivalents at end of year 226,402$ 5,360 2,214,370 935,298 3,381,430 3,135,090
Reconciliation of operating income to net cash provided by operating activities:
Operating income (loss) (261,651)$ - (187,537) 1,109,430 660,242 1,102,671 Adjustments to reconcile operating income (loss) to net cash provided by operating activities:
Depreciation - 570,370 - 570,370 556,680 (Increase) decrease in materials, parts and supplies - 7,500 - - 7,500 (13,105) (Increase) decrease in prepaid items - 28,908 - - 28,908 (23,322) Increase (decrease) in accounts payable 21,994 (36,207) (31,245) - (45,458) 40,511 Increase (decrease) in deferred revenue - - - - Increase (decrease) in claims and judgments payable (61,721) - - - (61,721) (78,222)
Net cash provided by (used for) operating activities (301,378)$ 201 351,588 1,109,430 1,159,841 1,585,213
CITY OF BENICIAInternal Service Funds
Combining Statement of Cash FlowsFiscal year ended June 30, 2009
(with comparative information for the prior year)
Totals
128

CITY OF BENICIA
129
AGENCY FUNDS
ASSESSMENT DISTRICTS Accounts for the collection of assessments and disbursements to District bondholders for Assessment Districts debt without City commitment.

Fleetside CombinedIndustrial East 2nd Street Drake/Gateway McAllister
Assessment Assessment Assessement AssessmentDistrict District District District 2009 2008
Assets:Cash and investments 628,443$ 687,368 154,202 1,747,872 3,217,885 3,168,976 Interest receivable 532 582 131 1,456 2,701 8,594
Total assets 628,975 687,950 154,333 1,749,328 3,220,586 3,177,570
Liabilities:Due to bondholders 628,975 687,950 154,333 1,749,328 3,220,586 3,177,570
Total liabilities 628,975$ 687,950 154,333 1,749,328 3,220,586 3,177,570
Totals
CITY OF BENICIAAgency Funds
Combining Balance SheetJune 30, 2009
(with comparative information for the prior year)
130

Balance BalanceJune 30, 2008 Additions Deletions June 30, 2009
AssetsRestricted cash and investments 602,554$ 450,031 424,142 628,443 Interest receivable 1,639 532 1,639 532
Total Assets 604,193$ 450,563 424,142 628,975
LiabilitiesDue to bondholders 604,193$ 450,563 425,781 628,975
Total liabilities 604,193$ 450,563 425,781 628,975
AssetsRestricted cash and investments 670,298$ 496,549 479,479 687,368 Interest receivable 1,823 582 1,823 582
Total Assets 672,121$ 497,131 479,479 687,950
LiabilitiesDue to bondholders 672,121$ 497,131 481,302 687,950
Total liabilities 672,121$ 497,131 481,302 687,950
AssetsRestricted cash and investments 216,432$ 85,181 147,411 154,202 Interest receivable 591 131 591 131
Total Assets 217,023$ 85,312 147,411 154,333
LiabilitiesDue to bondholders 217,023$ 85,312 148,002 154,333
Total liabilities 217,023$ 85,312 148,002 154,333
Fleetside Industrial Assessment District
CITY OF BENICIAAgency Fund
Statement of Changes in Assets and LiabilitiesFiscal year Ended June 30, 2009
East 2nd Street Assessment District
Combined Drake/Gateway Assessment District
131

Balance BalanceJune 30, 2008 Additions Deletions June 30, 2009
AssetsRestricted cash and investments 1,679,692$ 932,715 864,535 1,747,872 Interest receivable 4,541 1,456 4,541 1,456
Total Assets 1,684,233$ 934,171 864,535 1,749,328
LiabilitiesDue to bondholders 1,684,233$ 934,171 869,076 1,749,328
Total liabilities 1,684,233$ 934,171 869,076 1,749,328
AssetsRestricted cash and investments 3,168,976$ 1,964,476 1,915,567 3,217,885 Interest receivable 8,594 2,701 8,594 2,701
Total Assets 3,177,570$ 450,563 424,142 3,220,586
LiabilitiesDue to bondholders 3,177,570$ 1,967,177 1,924,161 3,220,586
Total Liabilities 3,177,570$ 1,967,177 1,924,161 3,220,586
CITY OF BENICIAAgency Funds
Statement of Changes in Assets and LiabilitiesFiscal year Ended June 30, 2009
Total Agency Funds
McAllister Assessment District
132
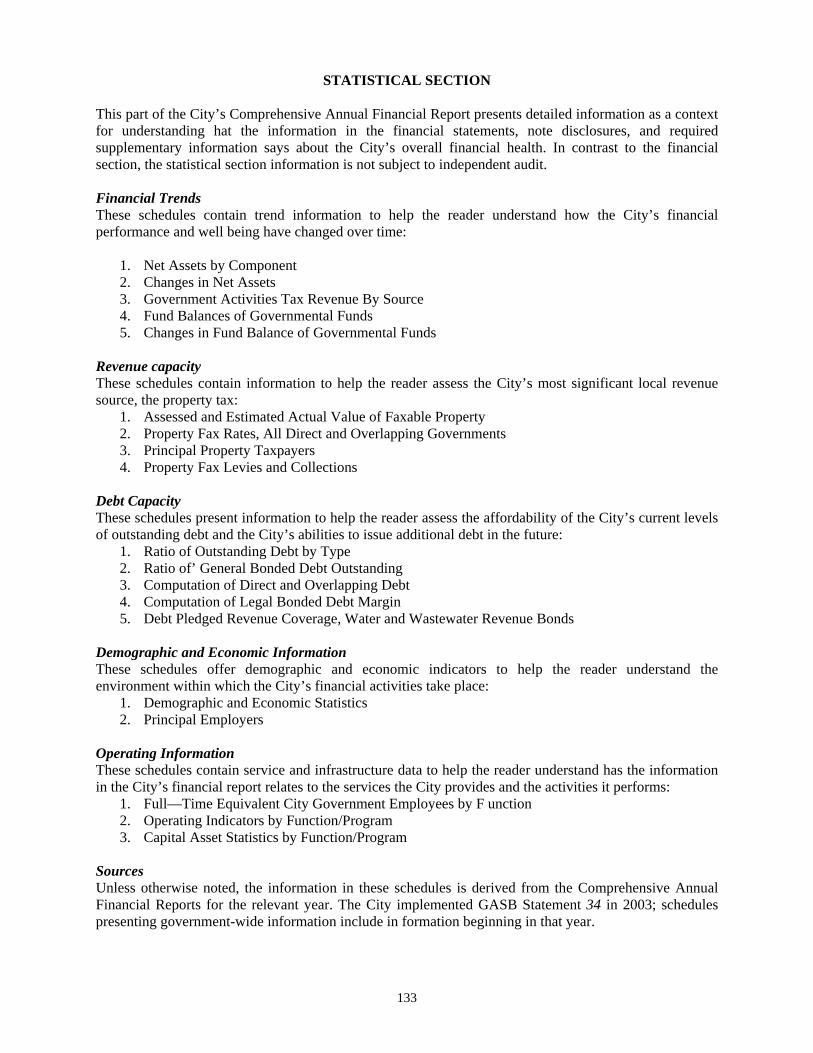
133
STATISTICAL SECTION This part of the City’s Comprehensive Annual Financial Report presents detailed information as a context for understanding hat the information in the financial statements, note disclosures, and required supplementary information says about the City’s overall financial health. In contrast to the financial section, the statistical section information is not subject to independent audit. Financial Trends These schedules contain trend information to help the reader understand how the City’s financial performance and well being have changed over time:
1. Net Assets by Component 2. Changes in Net Assets 3. Government Activities Tax Revenue By Source 4. Fund Balances of Governmental Funds 5. Changes in Fund Balance of Governmental Funds
Revenue capacity These schedules contain information to help the reader assess the City’s most significant local revenue source, the property tax:
1. Assessed and Estimated Actual Value of Faxable Property 2. Property Fax Rates, All Direct and Overlapping Governments 3. Principal Property Taxpayers 4. Property Fax Levies and Collections
Debt Capacity These schedules present information to help the reader assess the affordability of the City’s current levels of outstanding debt and the City’s abilities to issue additional debt in the future:
1. Ratio of Outstanding Debt by Type 2. Ratio of’ General Bonded Debt Outstanding 3. Computation of Direct and Overlapping Debt 4. Computation of Legal Bonded Debt Margin 5. Debt Pledged Revenue Coverage, Water and Wastewater Revenue Bonds
Demographic and Economic Information These schedules offer demographic and economic indicators to help the reader understand the environment within which the City’s financial activities take place:
1. Demographic and Economic Statistics 2. Principal Employers
Operating Information These schedules contain service and infrastructure data to help the reader understand has the information in the City’s financial report relates to the services the City provides and the activities it performs:
1. Full—Time Equivalent City Government Employees by F unction 2. Operating Indicators by Function/Program 3. Capital Asset Statistics by Function/Program
Sources Unless otherwise noted, the information in these schedules is derived from the Comprehensive Annual Financial Reports for the relevant year. The City implemented GASB Statement 34 in 2003; schedules presenting government-wide information include in formation beginning in that year.


2003 2004 2005 2006 2007 2008 2009Governmental activities
Invested in capital assets, net of related debt $104,537,453 $103,928,682 $106,131,111 $106,154,667 $109,082,400 $110,609,618 $113,264,434
Restricted 6,580,574 6,542,947 8,273,480 14,218,067 7,848,173 8,052,003 3,195,339 Unrestricted 9,138,044 10,649,209 15,644,661 10,153,833 15,361,828 13,489,203 15,465,114
Total governmental activities net assets $120,256,071 $121,120,838 $130,049,252 $130,526,567 $132,292,401 $132,150,824 $131,924,887
Business-type activitiesInvested in capital assets,
net of related debt $49,773,778 $53,923,197 $52,003,981 $50,368,665 $56,818,976 $58,724,744 $63,624,158Restricted 1,489,729 441,326 1,058,372 648,123 360 256 - Unrestricted 23,693,578 23,316,541 29,788,462 36,731,790 33,563,541 32,863,392 29,231,383
Total business-type activities net assets $74,957,085 $77,681,064 $82,850,815 $87,748,578 $90,382,877 $91,588,392 $92,855,541
Primary governmentInvested in capital assets,
net of related debt $154,311,231 $157,851,879 $158,135,092 $156,523,332 $165,901,376 $169,334,362 $176,888,592Restricted 8,070,303 6,984,273 9,331,852 14,866,190 7,848,533 8,052,259 3,195,339Unrestricted 32,831,622 33,965,750 45,433,123 46,885,623 48,925,369 46,352,595 44,696,497
Total primary government net assets $195,213,156 $198,801,902 $212,900,067 $218,275,145 $222,675,278 $223,739,216 $224,780,428
CITY OF BENICIANet Assets by ComponentLast Seven Fiscal Years
(accrual basis of accounting)
$0
$50,000
$100,000
$150,000
$200,000
$250,000
Tho
usan
ds
2003 2004 2005 2006 2007 2008 2009
Net of Related Debt Restricted Unrestricted
135

2003 2004 2005 2006 2007 2008 2009
ExpensesGovernmental Activities:
Administration $3,394,829 $3,262,692 $3,563,133 $3,544,980 $3,300,970 $2,824,341 $3,114,153Community Development 1,845,085 1,357,960 1,788,216 1,394,644 2,095,746 2,384,853 1,821,213 Public Safety - Police 5,319,673 6,138,029 7,531,528 7,132,974 10,439,354 8,774,285 9,150,887 Public Safety - Fire 3,793,711 4,578,727 4,955,345 6,082,806 6,335,969 7,089,431 7,212,291 Parks & Community Services 3,881,257 4,194,633 3,994,390 5,357,910 5,966,185 6,650,653 5,999,749 Public Works 3,996,472 4,740,810 6,432,754 4,572,017 5,605,290 4,273,248 4,186,559 Library 1,811,380 1,849,493 1,895,726 1,882,507 2,153,638 2,349,721 2,403,239 Economic Development 266,233 273,132 158,738 746,765 385,726 473,311 536,124 General 2,689,137 2,795,502 1,677,467 2,571,342 2,864,213 3,182,776 4,283,723 Interest on Long-Term Debt 437,013 399,337 447,403 421,796 503,819 472,189 525,341
Total Governmental Activities Expenses 27,434,790 29,590,315 32,444,700 33,707,741 39,650,910 38,474,808 39,233,279Business-Type Activities:
Wastewater 5,693,686 5,156,056 5,461,603 6,199,104 6,853,399 7,023,768 7,294,741 Water 5,049,775 5,280,652 5,394,061 5,940,193 6,614,679 7,572,285 7,345,574 Benicia Marina 818,109 760,507 564,568 564,438 579,184 624,611 594,863 Transit 1,156,656 1,123,274 1,203,930 1,450,093 1,847,674 1,765,644 1,370,621
Total Business-Type Activities Expenses 12,718,226 12,320,489 12,624,162 14,153,828 15,894,936 16,986,308 16,605,799Total Primary Government Expenses $40,153,016 $41,910,804 $45,068,862 $47,861,569 $55,545,846 $55,461,116 $55,839,078
Program RevenuesGovernmental Activities:
Charges for Services:Administration $21,665 $50,879 $195,782 $16,191 $32,950 $56,609 $41,724Community Development 386,175 716,866 1,531,625 1,471,896 1,284,313 1,092,871 771,524
Public Safety - Police 302,992 117,414 206,046 248,691 199,039 190,136 200,824 Public Safety - Fire 120,366 25,444 145,959 83,945 196,361 223,919 425,753 Parks & Community Services 1,903,106 1,976,731 2,557,003 2,583,196 1,768,794 1,226,842 1,687,534
Public Works 57,156 399,918 368,068 384,481 444,159 146,363 265,001 Library 237,128 222,233 229,642 234,124 246,302 205,981 186,595 Economic Development 25,000 - 80 40 - 1,000 30 General 703,039 557,634 170,077 531,642 - 712,131 316,230
Operating Grants and Contributions 1,318,279 1,595,353 2,063,235 1,427,752 557,754 1,898,958 2,909,497 Capital Grants and Contributions 232,621 1,054,873 9,385,834 206,918 1,827,358 366,550 -
Total Government Activities Program Revenues 5,307,527 6,717,345 16,853,351 7,188,876 6,557,030 6,121,360 6,804,712Business-Type Activities:
Charges for Services:Wastewater 5,302,028 6,528,485 7,409,921 8,078,749 7,223,062 6,955,313 6,897,189 Water 5,979,387 7,501,883 7,694,339 8,343,298 7,465,686 7,141,569 6,772,607 Benicia Marina 298,096 328,133 332,066 325,172 284,187 547,422 323,034 Transit 179,718 198,619 188,654 218,998 290,474 332,687 153,573
Operating Grants and Contributions 920,052 1,025,439 906,999 1,114,734 1,383,596 1,683,891 599,934 Capital Grants and Contributions - - 1,518,000 337,829 395,271 - 2,000,000
Total Business-Type Activities Program Revenu 12,679,281 15,582,559 18,049,979 18,418,780 17,042,276 16,660,882 16,746,337Total Primary Government Program Revenues $17,986,808 $22,299,904 $34,903,330 $25,607,656 $23,599,306 $22,782,242 $23,551,049
Net (Expense)/RevenueGovernmental Activities ($22,127,263) ($22,872,970) ($15,591,349) ($26,518,865) ($33,093,880) ($32,353,448) ($32,428,567)Business-Type Activities (38,945) 3,262,070 5,425,817 4,264,952 1,147,340 (325,426) 140,538Total Primary Government Net Expense ($22,166,208) ($19,610,900) ($10,165,532) ($22,253,913) ($31,946,540) ($32,678,874) ($32,288,029)
(Accrual Basis of Accounting)
CITY OF BENICIAChanges in Net Assets
Last Seven Fiscal Years
136

2003 2004 2005 2006 2007 2008 2009
General Revenues and Other Changes in Net AssetsGovernmental Activities:
Taxes:Property Taxes $10,900,163 $11,280,618 $11,853,045 $13,095,234 $13,942,074 $14,275,801 $13,812,912Sales Tax 4,180,368 4,758,335 4,890,592 5,974,307 6,986,922 7,514,258 7,688,775 Utility Users Tax 2,739,530 2,747,951 2,826,370 3,001,316 5,056,904 4,190,517 4,413,428 Franchise Fees - - - - - 1,589,752 1,851,511 Other Taxes 1,358,955 1,934,761 1,702,584 2,070,425 2,131,710 1,644,732 747,468
Motor Vehicle in Lieu 1,614,474 1,241,512 2,071,395 1,958,532 2,015,234 1,992,604 2,059,561 Investment Earnings 310,508 1,020,649 540,441 749,606 3,390,122 913,825 851,097 Gain from Disposal of Capital Assets 732,124 39,446 26,851 5,850 2,000 21,980 - Transfers 443,150 714,465 608,485 140,910 77,993 68,402 30,415
Total Government Activities 22,279,272 23,737,737 24,519,763 26,996,180 33,602,959 32,211,871 31,455,167Business-Type Activities:
Interest Earnings 485,257 331,809 349,704 773,496 1,559,891 1,593,423 1,151,428 Gain (Loss) from Disposal of Capital Assets - (155,435) 2,715 225 4,761 5,920 5,598 Transfers (443,150) (714,465) (608,485) (140,910) (77,993) (68,402) (30,415)
Total Business-Type Activities 42,107 (538,091) (256,066) 632,811 1,486,659 1,530,941 1,126,611Total Primary Government $22,321,379 $23,199,646 $24,263,697 $27,628,991 $35,089,618 $33,742,812 $32,581,778
Change in Net AssetsGovernmental Activities $152,009 $864,767 $8,928,414 $477,315 $509,079 ($141,577) (973,400) Business-Type Activities 3,162 2,723,979 5,169,751 4,897,763 2,633,999 1,205,515 1,267,149 Total Primary Government $155,171 $3,588,746 $14,098,165 $5,375,078 $3,143,078 $1,063,938 $293,749
Last Seven Fiscal Years(Accrual Basis of Accounting)
CITY OF BENICIAChanges in Net Assets
(continued)
137

Fiscal Property Sales Utility UsersYear Tax Tax Tax Other Taxes Total
2000 8,933,886 3,921,581 2,286,667 281,907 15,424,0412001 9,158,717 4,060,367 2,546,594 315,762 16,081,4402002 9,971,652 3,698,722 2,648,033 787,664 17,106,0712003 10,900,163 4,180,368 2,739,530 1,358,955 19,179,0162004 11,280,618 4,758,335 2,747,951 1,934,761 20,721,6652005 11,853,045 4,890,592 2,826,370 1,702,584 21,272,5912006 12,780,912 5,974,307 3,001,316 985,088 22,741,6232007 13,633,623 6,986,922 5,056,904 1,032,343 26,709,7922008 14,275,801 7,514,259 4,190,516 2,390,562 28,371,1382009 13,812,912 7,688,775 4,413,428 2,598,979 28,514,094
CITY OF BENICIAGovernmental Activities Tax Revenues By Source
Last Ten Fiscal Years(accrual basis of accounting)
138

Fund Balances of Governmental FundsLast Ten Fiscal Years
(Modified Accrual Basis of Accounting)
Fiscal Year Ended June 30,2000 2001 2002 2003 2004 2005 2006 2007 2008 2009
General FundReserved $2,146,211 $1,534,114 $1,465,577 $1,396,791 $961,703 $534,805 $240,831 $359,361 $411,078 $627,687Unreserved 4,128,929 4,490,366 5,543,123 7,597,068 8,326,733 9,144,553 7,736,096 9,927,737 9,296,480 5,662,297
Total General Fund $6,275,140 $6,024,480 $7,008,700 $8,993,859 $9,288,436 $9,679,358 $7,976,927 $10,287,098 $9,707,558 $6,289,984 (a)
All Other Governmental FundsReserved $1,889,644 $1,663,193 $2,724,500 $2,472,659 $1,375,669 $1,482,587 $6,026,937 $2,756,636 $4,739,462 $1,759,627Unreserved, reported in: Special revenue funds 857,653 2,069,741 2,186,863 1,907,327 2,159,603 2,680,139 2,877,038 2,532,927 3,169,621 3,406,367 Capital project funds 2,302,479 3,978,197 3,536,102 2,766,542 3,806,758 9,450,507 7,436,806 3,685,773 1,140,250 3,379,820
Total all other governmental funds $5,049,776 $7,711,131 $8,447,465 $7,146,528 $7,342,030 ########## $16,340,781 $8,975,336 $9,049,333 $8,545,814
(a) The change in total fund balance for the General Fund and other governmental funds is explained in Management's Discussion and Analysis
$0
$5,000
$10,000
$15,000
$20,000
$25,000
Thousands
2000 2001 2002 2003 2004 2005 2006 2007 2008 2009
Reserved Unreserved
139

CITY OF BENICIAChanges in Fund Balance of Governmental Funds
Last Ten Fiscal Years(Modified Accrual Basis of Accounting)
Fiscal Year Ended June 30,2000 2001 2002 2003 2004
RevenuesTaxes $15,852,071 $16,538,846 $17,106,071 $18,184,822 $19,275,764Licenses, permits and fees 1,041,409 1,212,403 1,697,119 1,249,966 1,820,934Fines and forfeitures 211,740 178,523 127,111 116,426 113,731Use of money and property 597,490 929,551 405,560 310,508 201,991Intergovernmental revenues 3,061,481 4,098,541 3,577,630 3,203,978 3,311,483Charges for services 1,853,486 1,626,405 2,134,605 2,216,140 3,040,407Other 572,262 613,451 678,989 1,137,193 888,187
Total Revenues 23,189,939 25,197,720 25,727,085 26,419,033 28,652,497
ExpendituresCurrent:
Administration 2,066,531 2,436,650 2,785,416 3,310,286 3,188,510Community development 1,138,148 1,526,718 1,643,641 1,843,907 1,356,782Public Safety - Police 3,763,626 4,040,185 4,676,638 5,090,826 5,816,993Public Safety - Fire 2,903,315 3,094,305 3,395,140 3,686,728 4,457,242Parks & Community Services 2,798,427 2,907,105 3,283,061 3,678,977 4,021,893Public Works 1,745,750 1,794,595 1,748,891 1,907,666 1,983,554Library 752,487 791,043 876,737 1,626,987 1,684,413Economic Development 205,223 192,843 243,999 256,322 272,690General 2,238,349 1,939,618 2,103,346 1,911,287 2,774,007
Capital outlay 1,992,737 3,020,766 3,128,837 2,564,166 2,804,971Debt service:
Principal repayment 410,000 460,000 490,000 545,000 370,000Interest and fiscal charges 538,352 509,009 478,435 447,075 408,724
Total Expenditures 20,552,945 22,712,837 24,854,141 26,869,227 29,139,779
Excess (deficiency) of revenues over (under) expenditures 2,636,994 2,484,883 872,944 (450,194) (487,282)
Other Financing Sources (Uses)Transfers in 1,931,415 3,447,330 1,822,615 1,386,935 1,303,265Transfers (out) (1,622,395) (3,521,518) (1,402,650) (943,785) (588,800)State water resources loans 10,062,422General obligation bonds issuedCapital lease issuedBond issue costsContribution from other entity/land ownersSale of capital assets 427,645 766,274 262,896
Total other financing sources (uses) 10,371,442 (74,188) 847,610 1,209,424 977,361
Net Change in fund balances $13,008,436 $2,410,695 $1,720,554 $759,230 $490,079
Debt service as a percentage ofnoncapital expenditures (a) (a) (a) (a) 3.0%
NOTE:(a) The City implemented GASB Statement 34 in fiscal year 2003. Therefore this calculation is included only
for fiscal years subsequent to that date.
140

Fiscal Year Ended June 30,2005 2006 2007 2008 2009
$20,363,436 $23,184,336 $27,152,426 $28,813,851 $29,080,0901,840,903 2,111,252 1,829,485 349,130 323,241
122,161 124,583 109,744 128,770 115,596588,076 770,987 1,768,089 1,628,652 1,003,453
4,439,778 3,279,587 3,278,054 4,576,701 4,451,2384,917,147 4,146,512 2,856,369 2,310,008 2,344,817
310,460 385,325 749,500 580,013 492,841
32,581,961 34,002,582 37,743,667 38,387,125 37,811,276
3,808,377 3,440,007 3,256,967 2,729,399 2,975,5711,850,714 1,336,391 1,765,245 2,263,730 2,268,4036,623,787 6,908,386 7,531,759 8,292,356 8,544,6905,013,129 5,772,527 6,110,150 6,782,268 6,974,6883,948,215 4,772,498 5,286,401 5,764,217 5,672,1703,660,641 1,707,728 1,750,115 1,912,747 2,220,7561,744,702 1,837,995 2,073,228 2,262,383 2,322,259
159,933 693,089 333,337 466,322 517,2681,941,904 2,324,258 2,554,884 3,025,451 4,187,8916,665,306 3,702,523 11,123,214 4,227,287 4,883,976
395,000 420,000 617,933 698,064 734,049388,431 426,508 511,846 481,502 451,063
36,200,139 33,341,910 42,915,079 38,905,726 41,752,784
(3,618,178) 660,672 (5,171,412) (518,601) (3,941,508)
2,359,714 1,743,366 4,382,451 2,653,351 3,448,918(1,751,229) (3,584,771) (4,268,313) (2,662,273) (3,428,503)
1,400,000 2,200,000(50,033)
8,295,00026,851 5,850 2,000 21,980 -
10,280,303 364,445 116,138 13,058 20,415
$6,662,125 $1,025,117 ($5,055,274) ($505,543) ($3,921,093)
2.7% 2.9% 3.6% 3.4% 2.9%
141

Real Property Total Real TotalFiscal Residential Commercial Industrial Secured Unsecured Total Estimated DirectYear Property Property Property Other Property Property Assessed (a) Full Market (a) Tax Rate (b)
2000 1,538,016,322 95,328,854 881,706,244 49,606,357 2,564,657,777 154,480,328 2,719,138,105 2,719,138,105 0.26980%2001 1,638,678,509 98,389,465 904,588,050 70,409,318 2,712,065,342 156,242,220 2,868,307,562 2,868,307,562 0.27047%2002 1,771,391,915 105,823,296 1,127,681,109 58,450,497 3,063,346,817 159,986,840 3,223,333,657 3,223,333,657 0.29260%2003 1,877,242,130 115,871,808 1,395,918,255 48,987,127 3,438,019,320 178,013,190 3,616,032,510 3,616,032,510 0.29718%2004 2,007,330,232 120,150,588 1,417,063,456 50,007,479 3,594,551,755 179,959,785 3,774,511,540 3,774,511,540 0.29257%2005 2,165,141,847 124,906,264 1,426,651,050 69,656,432 3,786,355,593 190,108,523 3,976,464,116 3,976,464,116 0.26611%2006 2,426,738,885 131,146,054 1,438,207,502 116,638,859 4,112,731,300 201,105,380 4,313,836,680 4,313,836,680 0.26313%2007 2,823,114,166 142,156,389 1,546,655,534 83,018,745 4,594,944,834 212,949,929 4,807,894,763 4,807,894,763 0.26560%2008 3,082,710,837 149,511,998 1,278,262,415 78,174,389 4,588,659,639 218,303,830 4,806,963,469 4,806,963,469 0.26295%2009 3,068,156,685 176,210,305 1,509,076,085 70,419,724 4,823,862,799 229,137,903 5,053,000,702 5,053,000,702 0.26382%
Source: Solano County Assessor 1997/98 - 2006/07 Combined Tax Rolls
(a) In 1978, the voters of the State of California passed Proposition 13 which limited taxes to a total maximum rate of 1%, based upon the assessed value of the propertybeing taxed. Each year, the assessed value of the property may be increased by an "inflation factor" (limited to a maximum of 2%). With few exceptions, property is onlyreassessed as a result of new construction activity or at the time it is sold to a new owner. At that point, the property is reassessed based upon the added value of theconstruction or at the purchase price (market value) or economic value of the property sold. The assessed valuation data shown above represents the only datacurrently available with respect to the actual market value of taxable property and is subject to the limitations described above.
(b) California cities do not set their own direct tax rate. The state constitution establishes the rate at 1% and allocates a portion of that amount, by an annual calculation, to all the taxing entities within a tax rate area.
CITY OF BENICIAASSESSED AND ESTIMATED ACTUAL VALUE OF TAXABLE PROPERTY
LAST TEN FISCAL YEARS
$0
$1,000
$2,000
$3,000
$4,000
$5,000
$6,000
2000 2001 2002 2003 2004 2005 2006 2007 2008 2009
Mill
ions
Unsecured Property Secured Property
142

CITY OF BENICIAPROPERTY TAX RATES
ALL DIRECT AND OVERLAPPING GOVERNMENTS(PER $100 OF ASSESSED VALUE)
LAST TEN FISCAL YEARS
Fiscal Basic County School City Other TotalYear Wide Levy District Levy Levy Levy Levy
2000 1.0000 0.0773 0.0348 0.0200 1.13212001 1.0000 0.0638 0.0341 0.0200 1.11792002 1.0000 0.0682 0.0295 0.0200 1.11772003 1.0000 0.0701 0.0198 0.0343 1.12422004 1.0000 0.0701 0.0198 0.0200 1.10992005 1.0000 0.0723 0.0192 0.0353 1.12682006 1.0000 0.0803 0.0187 0.0387 1.13772007 1.0000 0.0774 0.0170 0.0370 1.13142008 1.0000 0.0823 0.0157 0.0200 1.11802009 1.0000 0.0701 0.0159 0.0350 1.1210
Source: Solano County Auditor-Controller's Office
2000 2001 2002 2003 2004 2005 2006 2007 2008 2009
$0.0
$0.3
$0.5
$0.8
$1.0
$1.3
Per H
undr
ed $
Other Levy City Levy School District Levy County Levy
143

CITY OF BENICIAPrincipal Property Taxpayers
Current Year and Nine Years Ago
2008-09 1999-00Percentage Percentage
of Total City of Total CityTaxable Taxable Taxable TaxableAssessed Assessed Assessed Assessed
Taxpayer Value Rank Value Value Rank Value
Valero Refining Company California $923,239,604 1 18.27%
Walton CWCA 169,932,000 2 3.36%
Benicia Industries 66,578,271 3 1.32% 55,057,271 3 2.02%
WRI Golden State LLC 24,822,277 4 0.49%
SPK Industrial Portfolio LLC 22,414,500 5 0.44%
Club Pacifica LLC 21,625,473 6 0.43%
Tulloch Construction Inc. 21,618,899 7 0.43% 9,767,047 9 0.4%
PPF Ind 4701 4799 Industrial Way LP 15,130,038 8 0.30%
MP Benicia Logistics LLC 13,563,452 9 0.27%
5001 LLC 12,997,222 10 0.26%
Exxon Corp 602,805,326 1 22.07%
Spieker Properties Limited Partnership 58,484,718 2 2.14%
BPP Golden State Acq. LLC 17,518,717 4 0.64%
Tri State Properties Company 14,200,000 5 0.52%
Western Container Corporation 11,403,031 6 0.42%
Cambridge Circle Investment Company 11,840,505 7 0.43%
West Coast Beauty Supply Company 10,174,851 8 0.37%
Sequoia Glen Partners 9,435,783 10 0.35%
Total $1,291,921,736 25.57% $800,687,249 29.32%
Total Net Assessed Valuation:Fiscal Year 2008-2009 $5,053,000,702Fiscal Year 1999-2000 $2,731,009,518
Source: HdL, Coren & Cone Report
144

CITY OF BENICIAPROPERTY TAX LEVIES AND COLLECTIONS
LAST TEN FISCAL YEARS
###
Current Percent Collections Total Fiscal Total Tax of Levy in Subsequent Collections Year Tax Levy (a) Collections Collected Years to Date
2000 n/a n/a n/a n/a n/a2001 n/a n/a n/a n/a n/a2002 $9,745,064 $9,729,153 99.8367% n/a n/a2003 10,590,048 10,572,364 99.8330% n/a n/a2004 11,129,665 11,114,556 99.8642% n/a n/a2005 12,020,080 11,989,000 99.7414% n/a n/a2006 13,227,173 13,209,063 99.8631% n/a n/a2007 12,863,706 12,796,607 99.4784% n/a n/a2008 12,898,327 12,814,858 99.3529% n/a n/a2009 12,346,920 12,280,522 99.4622% n/a n/a
Source: Solano County Auditor-Controller's OfficeNote: Current tax collections beginning in 1993 have been reduced by a mandatory
tax reallocation imposed by the State of California
Total Tax Levy (a)
$0.0
$2.0
$4.0
$6.0
$8.0
$10.0
$12.0
$14.0
2000 2001 2002 2003 2004 2005 2006 2007 2008 2009
Mill
ions
Total Tax Levy (a)
145

CITY OF BENICIARatio of Outstanding Debt by Type
Last Ten Fiscal Years
Governmental ActivitiesGeneral Pension
Fiscal Obligation Obligation LeaseYear Bonds Bonds Obligation Total
2000 10,165,000 10,165,0002001 9,705,000 9,705,0002002 9,215,000 9,215,0002003 8,670,000 8,670,0002004 8,300,000 8,300,0002005 7,905,000 $1,400,000 9,305,0002006 7,485,000 $13,972,596 3,600,000 25,057,5962007 7,045,000 $13,891,327 3,422,067 24,358,3942008 6,585,000 $14,302,593 3,184,003 24,071,5962009 6,100,000 $13,676,377 3,262,926 23,039,303
Business-Type ActivitiesWater Sewer Total Percentage
Fiscal Revenue Revenue Loans Primary of Personal PerYear Bonds Bonds Payable Total Government Income (a) Capita (a)
2000 13,450,000 5,325,000 21,956,391 40,731,391 50,896,391 5.16% 1,754.812001 12,890,000 5,160,000 25,257,395 43,307,395 53,012,395 5.50% 1,948.992002 12,295,000 4,990,000 24,293,039 41,578,039 50,793,039 5.19% 1,880.112003 12,065,000 4,815,000 23,055,898 39,935,898 48,605,898 4.82% 1,791.262004 11,285,000 4,630,000 22,064,776 37,979,776 46,279,776 4.51% 1,714.702005 10,425,000 4,435,000 32,349,308 47,209,308 56,514,308 5.26% 2,068.382006 9,550,000 4,260,000 41,620,216 55,430,216 80,487,812 7.12% 2,946.222007 8,650,000 4,015,000 41,118,395 53,783,395 78,141,789 6.51% 2,799.182008 7,720,000 3,770,000 39,114,917 50,604,917 74,676,513 5.95% 2,669.122009 7,055,000 3,510,000 37,065,133 47,630,133 70,669,436 5.60% 2,525.98
Note : Debt amounts exclude any premiums, discounts, or other amortization amounts
Sources: City of BeniciaState of California, Department of Finance (population)U.S. Department of commerce, Bureau of the Census (income)
(a) See page 151 (Demographic Statistics) for personal income and population data.
$0
$10
$20
$30
$40
$50
$60
$70
$80
$90
2000 2001 2002 2003 2004 2005 2006 2007 2008 2009
Mill
ions
Total Governmental Total Business
146

CITY OF BENICIARatio of General Bonded Debt Outstanding
Last Ten Fiscal Years
Percentage ofGeneral Actual Taxable
Fiscal Obligation Value of PerYear Bonds Total Property (1) Capita (2)
2000 10,165,000 10,165,000 0.37% 350.47
2001 9,705,000 9,705,000 0.34% 356.80
2002 9,215,000 9,215,000 0.29% 341.09
2003 8,670,000 8,670,000 0.24% 319.51
2004 8,300,000 8,300,000 0.22% 307.52
2005 7,905,000 7,905,000 0.20% 289.32
2006 7,485,000 7,485,000 0.17% 273.99
2007 7,045,000 7,045,000 0.15% 252.36 2008 6,585,000 6,585,000 0.14% 235.36 2009 6,100,000 6,100,000 0.12% 218.04
Note: Details regarding the city's outstanding debt can be found in the notes to thefinancial statements.
(1) See Schedule of Assessed Value and Estimated Actual Value of Taxable Propertyfor property value data.
(2) Population data can be found in the Schedule of Demographic and EconomicStatistics.
147
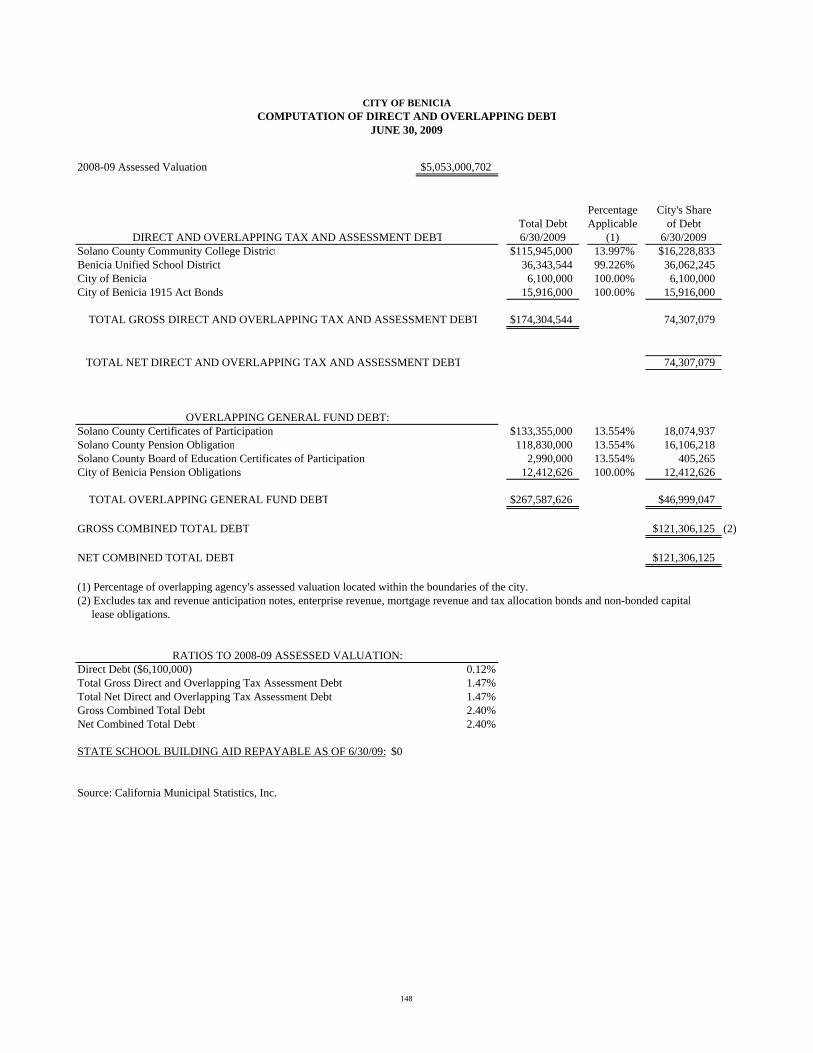
CITY OF BENICIACOMPUTATION OF DIRECT AND OVERLAPPING DEBT
JUNE 30, 2009
2008-09 Assessed Valuation $5,053,000,702
Percentage City's ShareTotal Debt Applicable of Debt
DIRECT AND OVERLAPPING TAX AND ASSESSMENT DEBT 6/30/2009 (1) 6/30/2009Solano County Community College District $115,945,000 13.997% $16,228,833Benicia Unified School District 36,343,544 99.226% 36,062,245City of Benicia 6,100,000 100.00% 6,100,000City of Benicia 1915 Act Bonds 15,916,000 100.00% 15,916,000
TOTAL GROSS DIRECT AND OVERLAPPING TAX AND ASSESSMENT DEBT $174,304,544 74,307,079
TOTAL NET DIRECT AND OVERLAPPING TAX AND ASSESSMENT DEBT 74,307,079
OVERLAPPING GENERAL FUND DEBT:Solano County Certificates of Participation $133,355,000 13.554% 18,074,937Solano County Pension Obligation 118,830,000 13.554% 16,106,218Solano County Board of Education Certificates of Participation 2,990,000 13.554% 405,265City of Benicia Pension Obligations 12,412,626 100.00% 12,412,626
TOTAL OVERLAPPING GENERAL FUND DEBT $267,587,626 $46,999,047
GROSS COMBINED TOTAL DEBT $121,306,125 (2)
NET COMBINED TOTAL DEBT $121,306,125
(1) Percentage of overlapping agency's assessed valuation located within the boundaries of the city.(2) Excludes tax and revenue anticipation notes, enterprise revenue, mortgage revenue and tax allocation bonds and non-bonded capital lease obligations.
RATIOS TO 2008-09 ASSESSED VALUATION:Direct Debt ($6,100,000) 0.12%Total Gross Direct and Overlapping Tax Assessment Debt 1.47%Total Net Direct and Overlapping Tax Assessment Debt 1.47%Gross Combined Total Debt 2.40%Net Combined Total Debt 2.40%
STATE SCHOOL BUILDING AID REPAYABLE AS OF 6/30/09: $0
Source: California Municipal Statistics, Inc.
148

CITY OF BENICIACOMPUTATION OF LEGAL BONDED DEBT MARGIN
JUNE 30, 2009
ASSESSED VALUATION:
Secured property assessed value, net ofexempt real property $4,823,862,799
BONDED DEBT LIMIT (3.75% OF ASSESSED VALUE) (a) $180,894,855
AMOUNT OF DEBT SUBJECT TO LIMIT:
Total Bonded Debt $30,041,377
Less Revenue Bonds, Certificate of Participation not subject to limit 23,941,377
Amount of debt subject to limit 6,100,000
LEGAL BONDED DEBT MARGIN $174,794,855
Total net debt Total Net Debt Legal applicable to the limit
Fiscal Debt Applicable to Debt as a percentageYear Limit Limit Margin of debt limit
2000 96,174,667 10,165,000 86,009,667 11.82%2001 101,702,450 9,705,000 91,997,450 10.55%2002 114,875,506 9,215,000 105,660,506 8.72%2003 128,925,725 8,670,000 120,255,725 7.21%2004 134,795,691 8,300,000 126,495,691 6.56%2005 141,988,335 7,905,000 134,083,335 5.90%2006 154,227,424 7,485,000 146,742,424 5.10%2007 172,310,431 7,045,000 165,265,431 4.26%2008 172,074,736 6,585,000 165,489,736 3.98%2009 180,894,855 6,100,000 174,794,855 3.49%
NOTE:(a) California Government Code, Section 43605 sets the debt limit at 15%. The
Code section was enacted prior to the change in basing assessed value to full market value when it was previously 25% of market value. Thus, the limit shown as 3.75% is one-fourth the limit to account for the adjustment of showing assessed valuationat full cash value.
149

CITY OF BENICIAPLEDGED-REVENUE COVERAGE
WATER AND WASTEWATER REVENUE BONDSLAST TEN FISCAL YEARS
Debt Service RequirementsNet Revenue
Fiscal Gross Operating Available forYear Revenue (1) Expenses (2) Debt Service Principal Interest Total Coverage
2000 11,972 5,226 6,746 685 1,111 1,796 3.762001 11,645 5,133 6,512 725 1,072 1,797 3.622002 12,247 6,252 5,995 765 1,012 1,777 3.372003 11,723 6,153 5,570 805 540 1,345 4.142004 14,570 6,349 8,221 965 642 1,607 5.122005 15,426 6,837 8,589 1,055 620 1,675 5.132006 17,165 6,837 10,328 875 458 1,333 7.752007 16,222 7,477 8,745 1,145 482 1,627 5.372008 15,668 9,689 5,979 1,175 446 1,621 3.692009 14,804 9,536 5,268 925 413 1,338 3.94
Notes: (1) Includes all Water & Wastewater Operating Revenues, Non-operating Interest Revenue, Connection Fees and other Non-operating Revenue(2) Includes all Water & Wastewater Operating Expenses less Depreciation and Interest
Source: City of Benicia
(amounts expressed in thousands)
0.00
1.00
2.00
3.00
4.00
5.00
6.00
7.00
8.00
9.00
2000 2001 2002 2003 2004 2005 2006 2007 2008 2009
Coverage
150

CITY OF BENICIADEMOGRAPHIC AND ECONOMIC STATISTICS
LAST TEN FISCAL YEARS
Total Per Capita CityFiscal City Personal Personal Unemployment County PopulationYear Population Income Income Rate (%) Population % of County
2000 29,004 985,559,783 33,980 4.7% 397,207 7.30%2001 27,200 963,355,805 35,417 4.6% 406,212 6.70%2002 27,016 978,310,453 36,212 6.0% 411,821 6.56%2003 27,135 1,008,953,921 37,183 6.8% 415,405 6.53%2004 26,990 1,026,744,714 38,042 6.1% 419,270 6.44%2005 27,323 1,073,505,323 39,289 5.6% 421,657 6.48%2006 27,319 1,129,806,279 41,356 5.1% 422,848 6.46%2007 27,916 1,200,213,884 42,994 3.3% 424,823 6.57%2008 27,978 1,254,489,947 44,838 4.5% 426,757 6.56%2009 27,977 1,262,222,668 45,116 7.1% 426,729 6.56%
Sources: California State Department of Finance & EDD
2000 2001 2002 2003 2004 2005 2006 2007 2008 20090.00%
2.50%
5.00%
7.50%
10.00%
Unemployment Rate (%)
2000 2001 2002 2003 2004 2005 2006 2007 2008 20095.00%
6.00%
7.00%
8.00%
9.00%
City Population as a % of County Population
$0.00
$0.40
$0.80
$1.20
2000 2001 2002 2003 2004 2005 2006 2007 2008 2009
Billions
Total Personal Income
$30
$40
$50
2000 2001 2002 2003 2004 2005 2006 2007 2008 2009
Thou
sand
s
Per Capita Personal Income
151
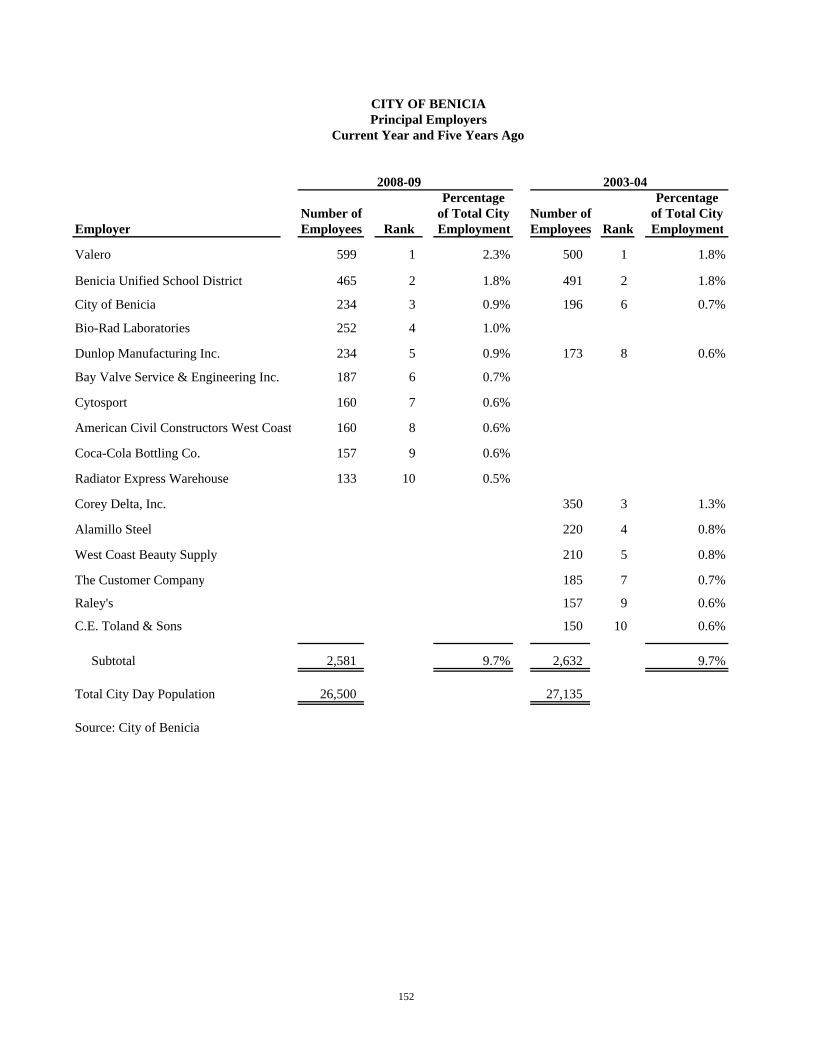
CITY OF BENICIAPrincipal Employers
Current Year and Five Years Ago
2008-09 2003-04Percentage Percentage
Number of of Total City Number of of Total CityEmployer Employees Rank Employment Employees Rank Employment
Valero 599 1 2.3% 500 1 1.8%
Benicia Unified School District 465 2 1.8% 491 2 1.8%
City of Benicia 234 3 0.9% 196 6 0.7%
Bio-Rad Laboratories 252 4 1.0%
Dunlop Manufacturing Inc. 234 5 0.9% 173 8 0.6%
Bay Valve Service & Engineering Inc. 187 6 0.7%
Cytosport 160 7 0.6%
American Civil Constructors West Coast 160 8 0.6%
Coca-Cola Bottling Co. 157 9 0.6%
Radiator Express Warehouse 133 10 0.5%
Corey Delta, Inc. 350 3 1.3%
Alamillo Steel 220 4 0.8%
West Coast Beauty Supply 210 5 0.8%
The Customer Company 185 7 0.7%
Raley's 157 9 0.6%
C.E. Toland & Sons 150 10 0.6%
Subtotal 2,581 9.7% 2,632 9.7%
Total City Day Population 26,500 27,135
Source: City of Benicia
152

CITY OF BENICIAFull-Time Equivalent City Government Employees by Function
Last Ten Fiscal Years
Adopted for Fiscal Year Ended June 30,2000 2001 2002 2003 2004 2005 2006 2007 2008 2009
FunctionAdministration 18.25 18.75 20.00 20.75 20.75 21.00 21.00 21.00 22.50 22.50Public Safety 86.00 86.00 88.50 88.00 88.00 88.00 89.00 89.00 90.00 90.00Public Works 15.40 15.40 16.95 16.95 16.95 17.55 17.45 17.45 18.95 18.95Community Development 8.00 8.00 9.00 9.00 9.00 8.40 10.50 10.50 9.00 9.00Parks & Community Services 27.00 30.00 30.00 31.00 31.00 31.00 34.00 34.00 35.00 35.00Water 18.30 18.80 21.45 21.45 21.45 22.45 22.45 22.45 22.95 22.95Wastewater 18.30 18.80 20.60 20.60 20.60 20.60 20.60 20.60 21.10 21.10Library 13.00 13.00 14.00 14.75 14.75 14.75 14.75 14.75 15.00 15.00Total 204.25 208.75 220.50 222.50 222.50 223.75 229.75 229.75 234.50 234.50
Source: City of Benicia
0
50
100
150
200
250FT
E's
2000 2001 2002 2003 2004 2005 2006 2007 2008 2009
Administration Public Safety Public WorksCommunity Development Parks & Community Services WaterWastewater Library
153

2000 2001 2002 2003 2004
Function/ProgramPublic safety:
Fire: Fire calls for service 2,034 2,004 2,025 1,958 1,970 Primary fire inspections conducted (estimate) 750 750 750 750 750Police: Police calls for Service 15,169 15,149 15,878 14,609 14,022 Law violations: Physical arrests (adult and juvenile) 1,238 998 930 1,026 1,077 Traffic violations 2,504 1,681 1,366 1,876 1,679 Parking violations 773 1,025 706 744 466
Public WorksStreet resurfacing (miles) n/a n/a n/a n/a n/aPotholes repaired (square miles) n/a n/a n/a n/a n/a
Parks & Community Services:Community Services: Recreation class programs n/a n/a 640 706 822 Recreation class participants n/a n/a 8,723 10,394 11,375
Library: Volumes in Collection (thousands) n/a n/a n/a n/a 106,927 Total Volumes Borrowed (thousands) n/a n/a n/a n/a 34,302
WaterWater service connections n/a n/a n/a n/a n/aWater main breaks n/a n/a n/a n/a n/aAverage daily consumption (thousands of gallons) n/a n/a n/a n/a n/a
WastewaterStorm drain inlets n/a n/a n/a n/a n/aSewer service connections n/a n/a n/a n/a n/aSewer main blockages n/a n/a n/a n/a n/aAverage daily treatment (thousands of gallons) n/a n/a n/a n/a n/a
Source: City of BeniciaNote: n/a denotes information not available.
Fiscal Year
CITY OF BENICIAOperating Indicators by Function/Program
Last Ten Fiscal Years
154

2005 2006 2007 2008 2009
1,984 1,703 1,915 2,040 2,243750 750 200 200 1,074
14,410 14,981 14,374 15,934 17,302
1,099 1,036 1,139 1,056 8381,873 2,027 2,649 2,208 3,671
794 759 665 646 434
n/a 1.5 1.0 0.3 0n/a 1,000 1,200 1,200 1,200
880 834 978 824 77312,393 11,610 10,482 10,622 8,291
110,214 116,996 113,470 111,145 107,75634,164 47,295 320,873 346,106 371,581
n/a 9,380 9,576 9,370 9,506n/a 11 17 17 14n/a 4,170 4,437 4,610 4,209
n/a 2,000 2,010 2,040 2,040n/a 9,380 9,310 9,109 9,243n/a 101 30 59 51n/a 2,860 2,200 2,600 2,195
Fiscal Year
155
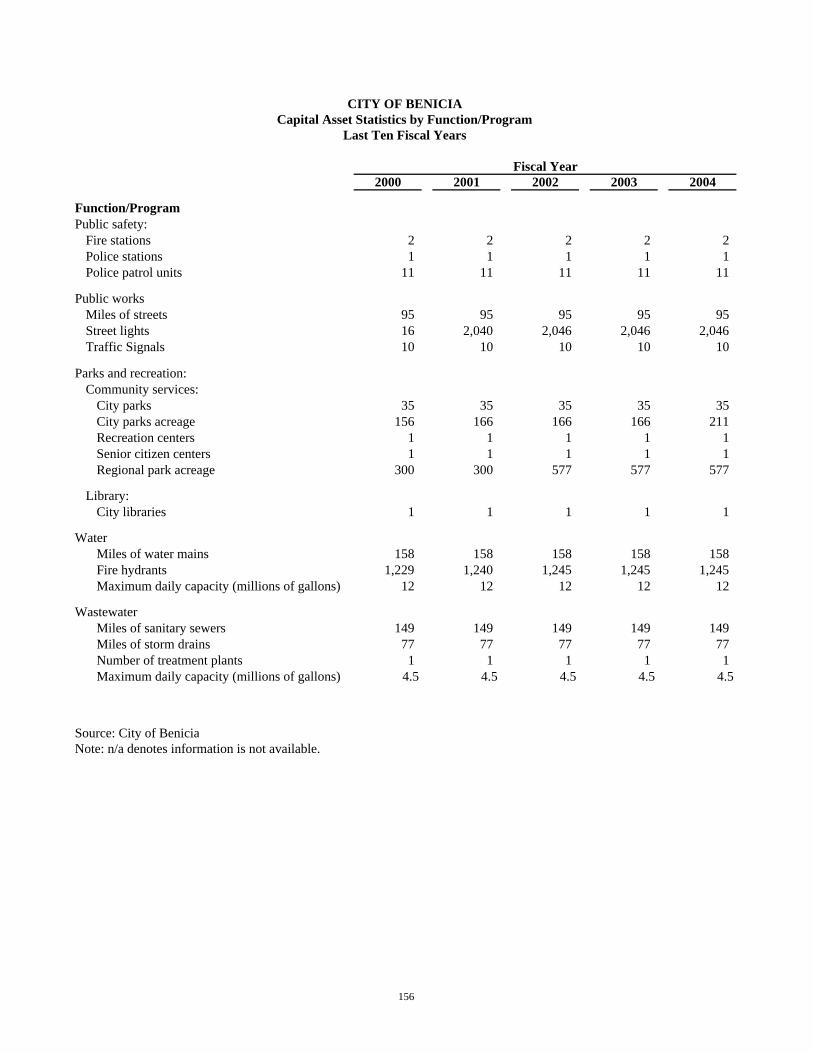
2000 2001 2002 2003 2004
Function/ProgramPublic safety:
Fire stations 2 2 2 2 2Police stations 1 1 1 1 1Police patrol units 11 11 11 11 11
Public worksMiles of streets 95 95 95 95 95Street lights 16 2,040 2,046 2,046 2,046Traffic Signals 10 10 10 10 10
Parks and recreation:Community services:
City parks 35 35 35 35 35City parks acreage 156 166 166 166 211Recreation centers 1 1 1 1 1Senior citizen centers 1 1 1 1 1Regional park acreage 300 300 577 577 577
Library:City libraries 1 1 1 1 1
WaterMiles of water mains 158 158 158 158 158Fire hydrants 1,229 1,240 1,245 1,245 1,245Maximum daily capacity (millions of gallons) 12 12 12 12 12
WastewaterMiles of sanitary sewers 149 149 149 149 149Miles of storm drains 77 77 77 77 77Number of treatment plants 1 1 1 1 1Maximum daily capacity (millions of gallons) 4.5 4.5 4.5 4.5 4.5
Source: City of BeniciaNote: n/a denotes information is not available.
Fiscal Year
CITY OF BENICIACapital Asset Statistics by Function/Program
Last Ten Fiscal Years
156

2005 2006 2007 2008 2009
2 2 2 2 21 1 1 1 1
11 13 13 13 13
95 95 95 97 972,046 2,046 2,062 2,100 2,100
10 10 10 10 10
35 36 36 36 36214 214 214 214 214
1 1 1 2 21 1 1 1 1
577 577 577 577 577
1 1 1 1 1
158 158 158 160 1601,245 1,194 1,203 1,259 1,427
12 12 12 12 12
149 149 149 150 15077 77 77 78 78
1 1 1 1 14.5 4.5 4.5 4.5 4.5
Fiscal Year
157