county of mono state of california … of california comprehensive annual financial report ......
TRANSCRIPT

COUNTY OF MONO
STATE OF CALIFORNIA
Comprehensive Annual Financial Report
For the Year Ended June 30, 2016
Prepared by the Department of Finance

THIS PAGE INTENTIONALLY LEFT BLANK

TABLE OF CONTENTS
Page(s)
INTRODUCTORY SECTION
Letter of Transmittal .............................................................................................................................................. i-v
Organization Chart of Elected and Appointed Officials .......................................................................................... vi
Directory of Public Officials ................................................................................................................................... vii
FINANCIAL SECTION
Independent Auditor’s Report ............................................................................................................................. 1-2
Management’s Discussion and Analysis (Required Supplementary Information) ..............................................3-14
Basic Financial Statements:
Government-Wide Financial Statements:
Statement of Net Position ......................................................................................................................... 15
Statement of Activities .........................................................................................................................16-17
Fund Financial Statements:
Governmental Funds:
Balance Sheet ...................................................................................................................................18-19
Reconciliation of the Balance Sheet to the Statement of Net Position ................................................... 21
Statement of Revenues, Expenditures and Changes in Fund Balances ...........................................22-23
Reconciliation of the Statement of Revenues, Expenditures and Changes in Fund Balance to the
Statement of Activities .......................................................................................................................... 25
Proprietary Funds:
Statement of Fund Net Position.............................................................................................................. 26
Statement of Revenues, Expenses and Changes in Fund Net Position ................................................. 27
Statement of Cash Flows ..................................................................................................................28-29
Fiduciary Funds:
Statement of Fiduciary Net Position ....................................................................................................... 30
Statement of Changes in Fiduciary Net Position .................................................................................... 31
Notes to the Basic Financial Statements ...............................................................................................33-67
Required Supplementary Information:
Schedule of Changes in Net Pension Liability and Related Ratios .......................................................69-71
Schedule of Funding Progress – County Other Post-Employment Benefits ............................................... 72
Budgetary Comparison Schedule:
General Fund ......................................................................................................................................73-74
Road Fund................................................................................................................................................ 75
Mental Health Services Act ...................................................................................................................... 76
Round Fire................................................................................................................................................ 77
Budgetary Basis of Accounting .................................................................................................................. 78

TABLE OF CONTENTS
Page(s)
Combining and Individual Fund Statements:
Nonmajor Governmental Funds:
Definition .................................................................................................................................................. 79
Combining Balance Sheet ...................................................................................................................81-84
Combining Statement of Revenues, Expenditures and Changes in Fund Balances ...........................85-88
Nonmajor Enterprise Funds:
Definition .................................................................................................................................................. 89
Combining Statement of Fund Net Position ............................................................................................. 91
Combining Statement of Revenues, Expenses and Changes in Fund Net Position................................. 92
Combining Statement of Cash Flows ..................................................................................................93-94
Internal Service Funds:
Definition .................................................................................................................................................. 95
Combining Statement of Fund Net Position ............................................................................................. 97
Combining Statement of Revenues, Expenses and Changes in Fund Net Position................................. 98
Combining Statement of Cash Flows ................................................................................................99-100
Investment Trust Fund:
Definition ................................................................................................................................................ 101
Combining Statement of Fiduciary Net Position ..................................................................................... 103
Combining Statement of Changes in Fiduciary Net Position .................................................................. 104
STATISTICAL SECTION (UNAUDITED)
Tax Levies and Collections – General Fund Secured Roll .................................................................................. 105
Property Tax Value Allocation Collection .....................................................................................................106-107
Distribution of Pooled Property Tax .................................................................................................................... 108
Tax Collections ................................................................................................................................................... 109
Triple Flip ............................................................................................................................................................ 110
Miscellaneous Statistical Information ...........................................................................................................111-112

INTRODUCTORY SECTION

THIS PAGE INTENTIONALLY LEFT BLANK

i
DEPARTMENT OF FINANCE AUDITOR-CONTROLLER COUNTY OF MONO
Stephanie M. Butters Assistant Finance Director Auditor-Controller
Janet Dutcher, CPA, CGFM Director of Finance
P.O. Box 556 Bridgeport, California 93517
(760) 932-5490 Fax (760) 932-5491
March 22, 2017 To the Board of Supervisors and Citizens of Mono County: The Comprehensive Annual Financial Report (CAFR) of the County of Mono (County) for the fiscal year ended June 30, 2016, is hereby submitted in compliance with Section 25250 and 25253 of the Government Code of the State of California. Management assumes full responsibility for the completeness and reliability of the information contained in this report, based upon a comprehensive internal control framework established for this purpose. Because the cost of internal controls should not exceed anticipated benefits, the objective is to provide reasonable, rather than absolute, assurance that the financial statements are free of any material misstatements. The independent auditor’s report is located at the front of the financial section of this report. CliftonLarsonAllen LLP, a firm of licensed certified public accountants, has issued an unmodified (“clean” opinion) on the County’s financial statements for the fiscal year ended June 30, 2016. The Management’s Discussion and Analysis (MD&A) immediately follows the independent auditor’s report and provides a narrative introduction, overview, and analysis of the financial statements. The MD&A complements this letter of transmittal and should be read in conjunction with it. PROFILE OF THE GOVERNMENT Incorporated in 1861, Mono County is a rural county located on the eastern side of the Sierra Nevada Mountains. The County has an area of 3,103 square miles and a total population of 13,909 (2015 US Census Statistics). Other than Mammoth Lakes, the County’s only incorporated area which boasts a year round population of 7,000, the remainder of the County consists of small communities ranging in population from less than 300 to about 1,200 people. The northern part of the County encompasses the small towns of Topaz, Walker and Coleville. Bridgeport, the County seat, is 35 miles south of these small communities. The central part of the County includes the communities of Lee Vining, June Lakes, Crowley Lake, the Wheeler Crest communities, and of course, Mammoth Lakes. In the southeast sector lie Benton and Chalfont. During periods of heavy recreational usage, the Town of Mammoth Lakes population approaches 35,000. Approximately 94 percent of Mono County is public land administered by the U.S. Forest Service, the Bureau of Land Management, the State of California, and the Los Angeles Department of Water and Power. The scenic and recreational attributes of this public land help support tourism and recreation as the major industry in the county. Approximately 80 percent of all employment is directly, or indirectly, associated with this industry. Annually, more than 6 million visitor-days of use occur on public lands in Mono County. The majority of these visitors travel to and through the county on the state highway system. Major attractions include Mammoth and June Mountain ski areas, Yosemite National Park, Mono Lake, Devils Postpile National Monument, Bodie State Historic Park, and the many lakes, streams and backcountry attractions accessed through Mono County communities. The County government functions as a local government body to serve the needs of its residents. As geographical and political subdivisions of the state, counties serve a dual role; providing municipal services in the unincorporated areas and acting as

ii
administrative agents for state and federal government programs and services. As a general-law county, Mono County is bound by state law as to the number and duties of County elected officials. The County has five districts that are approximately equal in population with boundaries adjusted every ten years following the federal census. Policymaking and legislative authority are vested in the County Board of Supervisors (the Board). Board members are elected to four-year staggered terms, and each member represents one of the County’s five districts. The County has three elected department heads: Assessor, District Attorney, and Sheriff-Coroner. The Board appoints other department heads. The County employed 299 full-time equivalent employees in FY 2015-2016 in order to provide a full range of services to its residents. The County’s principal functions include seven major areas: general government, public protection, public ways and facilities, health and sanitation, public assistance, education and recreation and cultural services. The State and Federal governments mandate certain minimum levels of services in the public assistance and health areas. The majority of services performed by the County are provided for all residents, regardless of whether those residents live in the County’s one incorporated town or in the unincorporated areas. Every County resident directly or indirectly benefits from these services. Included in operations are various component units, which provide specific services County-wide or to distinct geographic areas within the County. The governmental reporting entity consists of the County and its component units. Component units are legally separate organizations for which the Board is financially accountable. Financial accountability is defined as the appointment of a voting majority of the component unit’s governing board, and either (i) the County’s ability to impose its will on the organization or (ii) the potential for the organization to provide a financial benefit to or impose a financial burden on the County. The following four component units, although legally separate entities, are considered to be part of the primary government for financial reporting purposes: Community Service Area #1 – Crowley, Community Service Area #5 – Bridgeport, Community Service Area #2 – Benton and the County of Mono Economic Development Corporation.
The County is required by State law to adopt a final budget each year. This annual budget serves as the foundation for the County’s financial planning and control. Budgets are adopted for most governmental and proprietary funds. The County maintains budgetary controls to assure compliance with legal provisions embodied in the annual appropriated budget approved by the Board. Activities of the general and special revenue funds are included in the annually appropriated budget. Unencumbered annual appropriations lapse at year-end. The legal level of control for appropriations is exercised at the department level within each fund. Appropriations beyond that level may only be adjusted during the year with approval of the Board. Management may make adjustments at their discretion below that level. Such adjustments by the Board and management are reflected in the revised budgetary data presented in the financial statements.
REQUESTS FOR INFORMATION
Questions concerning any of the information provided in this report or requests for additional financial information should be addressed to the Mono County Finance Department, P.O. Box 556, Bridgeport, California 93517.
FINANCIAL AND ECONOMIC INDICATORS State Government The County is a political subdivision of the State of California and as such, its government is subject to State subventions and regulations. Therefore, the County’s financial health is closely tied to the financial condition of the State government. The County cannot predict whether the State will encounter budgetary difficulties in the current or future fiscal years. The County also cannot predict the impact future budgets will have on the County’s finances and operations. Current and future State budgets will be affected by national and State economic conditions and other factors outside the County’s control. Mono County Economy The local economy continues to improve in the wake of the “Great Recession”, albeit at a slower but steady rate. Property and real property transfer taxes are projected to grow at a moderate pace of about 2 to 4% annually although assessed valuation has yet to reach its pre-recession peak. Sales tax collections are estimated to increase 3% annually through 2018. Tourism is
iii
a major economic sector in Mono County and represents an important revenue stream. This fiscal year, transient occupancy tax (TOT) reached an all-time high of over $3 million. Although historically volatile, recent TOT growth has been strong with collections increasing close to 7.8% annually over the past three years. Based on the first two quarters of fiscal year 2016-2017, TOT is expected to continue this trend. Program revenues essential to departments’ ability to maintain public services continues to hold steady. Building permit activity continues to be strong, doubling in volume since the low point of the recession years. With several large residential developments in progress, the local economy is expected to improve in the near-term and position the County favorably for future growth.
MAJOR INITIATIVES
The County completed many initiatives in FY 2015-2016 while maintaining core services during the year. The following highlights only represent a partial list of the many accomplishments and on-going initiatives of the Mono County organization in FY 2015-2016:
By the end of the fiscal year, the County ended a budget-cutting program of hiring freezes, furloughs and frozen pay increases.
Total property tax collections were 94% of total billed in FY 2015-2016. Of the 6% of uncollected taxes remaining, only 72% was delinquent as of June 30, 2016.
The General Fund continued its subsidy ($600,000 in FY 2015-2016) to the County’s Road Fund as a way to counter declining transportation related revenues and increasing road maintenance needs.
The Board of Supervisors adopted a strategic plan framework and in FY 2015-2016 adopted strategic focus areas. Animal Control successfully completed of all seven 2016 vaccination and licensing clinics held throughout the
County. Departments continued to meet mandates related to Health Care Reform / Affordable Care Act. Behavioral Health
began implementation of Visual Health Record to replace the Electronic Health Record system. Public Health participated in the Walker Health Fair and Mammoth Health & Safety Fair providing education and outreach on a variety of public health programs. The Department also administered vaccinations countywide, including flu clinics in every community and school.
Behavioral Health’s MHSA division received the CSAC Merit Award for their “Dinner and a Movie” program held in Benton and Bridgeport.
Emergency preparedness was enhanced by developing and conducting the 2015 Statewide Medical and Health Exercise based on a pandemic influenza scenario for seventeen participating organization. An after action report and improvement plan was completed. Social Services collaborated with American Red Cross to provide emergency preparedness training to residents.
The Mono County EMS Ad-Hoc committee held several meetings throughout the year to consolidate ideas for bringing fiscal sustainability and countywide coverage of emergency medical services. Several recommendations were drafted and brought forward. Work on this initiative continues into FY 2016-2017.
Community Development worked to update the County’s General Plan and took the lead role of reviewing transient rental policies and enforcement guidelines by collaborating with the County’s Planning Commission and Regional Planning Advisory Committees.
Sheriff’s Office continued collaboration with Mammoth Lakes Fire Department and Mammoth Lakes Police Department to develop a county-wide All Hazards Incident Management Team.
The Planning Department received a national conservation award for work supporting the favorable USFWS decision to not list the sage grouse as threatened. The Department received a grant of $50,000 annually for five years to support sage grouse conservation activities consistent with the Bi-State Action Plan.
The Board adopted the Mono County Legislative Platform to strengthen the County’s advocacy at the state and federal level by providing Board-adopted guidelines articulating issues that are important to Mono County and its citizens.
The first ever joint Town (Mammoth) / County Council / Board of Supervisors meeting was held. Drug Court was formed and is operating as a problem-solving program to provide accountability and intensive
supervision to drug offenders.

iv
The 2nd annual State of the County was held for the business community with keynote speakers from a variety of economic and business related fields. Over 80 people from small business, agencies, organizations, local governments, non-profits and chambers of commerce were in attendence.
Finance implemented the County’s new finance accounting system and efforts are underway to implement a new fully integrated payroll system.
Probation Department fully implemented and went live with the CMS system, connecting to RIMS, the Superior Court, District Attorney, and Sheriff’s Office giving access to all justice partners and increasing communication.
Public Works continued work on several key projects that included June Lake Streets, Rock Creek Road Rehabilitation, Convict Lake Road Rehabilitation, Stock Drive Realignment, Industrial Stormwater Quality and the White Mountain Estates Phase 2 Tract Map.
Progress was made at funding and completing several projects on the County’s Capital Improvement Program including emergency generators, relocation of the Bridgeport Campus out of the old hospital, Bridgeport Memorial Hall renovations, and several ADA related improvement projects. Work was in progress with the Bridgeport Shop Biomass project that will be completed in FY 2016-2017.
ACCOUNTING AND BUDGETARY POLICIES The County maintains accounting controls, which are designed to safeguard assets, and the reliability of financial records for financial statement presentation. These controls include systems of authorization and approval, separation of duties, physical control and custody over assets. Internal accounting controls are designed to provide reasonable, but not absolute, assurance regarding the safeguarding of assets against loss from unauthorized use or disposition and the reliability of financial records for preparing financial statements and maintaining accountability for assets. The concept of reasonable assurance recognizes that the cost of a control should not exceed the benefits likely to be delivered and the evaluation of costs and benefits requires estimates and judgments of management. All internal control evaluations occur within this framework. We believe that the County’s internal accounting controls adequately safeguard assets and provide reasonable assurance of proper recording of financial transactions. The County’s budget must balance expenditure appropriations with resources. Any deviation from a balanced budget is not permitted by the California State Government Code, which states: “In the recommended, adopted and final budgets the funding sources shall equal the financing uses” (Government Code 29009). The County establishes a general reserve account striving to maintain a balance at 5% to 15% of annual general fund expenditures. The general reserve is available upon adoption of a resolution by the Board of Supervisors for spending related to natural disasters, public health crisis, destruction of public facilities and other calamities. A contingency appropriation of 1% of General Fund appropriations is included in each year’s budget as a means to accommodate unexpected increases in expenditures, which could not have reasonably been anticipated at the time the budget was developed. The objectives of the County’s debt policy include using debt when appropriate and at levels the County can afford. Long-term debt is not to be used to finance ongoing operational costs. Before considering debt financing, other sources of funding such as pay as you go or grant funding is explored. The County uses self-supporting debt first before considering general fund obligated debt. Annual debt service, excluding self-supporting debt, is limited to 7% of annual general fund discretionary revenue. Efforts are undertaken to maintain and improve the County’s bond ratings so borrowing costs are minimized and access to credit is preserved. Cash temporarily idle during the fiscal year was invested with the County Treasury pooled cash. This investment pool is composed of deposits and investments allowed by California Government Code and the Mono County investment policy. The pooled investment concept allows the various funds within the County Treasury to earn interest based on their average daily cash balance. The County, pursuant to the adopted investment policy, invested in United States Government Agency Obligations, California Municipalities, Negotiable Certificates of Deposit (CD), Corporate Bonds and the State Local Agency Investment Fund (LAIF).


vi
Mono County Organization ChartElected and Appointed Officials
Combined Court
MONO COUNTY CITIZENS
Board of Supervisors
County Administrative
Officer
Appointed Officials
Clerk‐Recorder/Elections
Finance Director Health Officer
Behavioral Health Director
ProbationPublic Health
Director
Public Works
Roads
Public Works Engineering
Social Services Director
County Counsel
District Attorney Sheriff/CoronerAssessor
Superintendent of Schools

vii
COUNTY OF MONO DIRECTORY OF PUBLIC OFFICIALS
March 8, 2017
DEPARTMENT DEPARTMENT OFFICIAL
ELECTED OFFICIALS
Assessor Barry Beck
Board of Supervisors
District #1 Larry Johnston, Vice-Chair
District #2 Fred Stump
District #3 Bob Gardner
District #4 John Peters
District #5 Stacey Coreless, Chair
District Attorney
Tim Kendall
Sheriff- Coroner Combined Court Superintendent of Schools
Ingrid Braun Stan Eller Stacey Alder
APPOINTED OFFICIALS
County Administrative Officer Leslie Chapman
County Counsel Stacey Simon
Behavioral Health Director Robin Roberts
Clerk-Recorder/Clerk of the Board Shannon Kendall
Finance Director Janet Dutcher, CPA, CGFM
Health Officer Richard Johnson, MD
Probation Chief Karin Humiston
Public Health Director Lynda Salcido
Public Works Director Jeff Walters
Social Services Director Kathy Peterson

THIS PAGE INTENTIONALLY LEFT BLANK

FINANCIAL SECTION

THIS PAGE INTENTIONALLY LEFT BLANK


MANAGEMENT’S DISCUSSION AND ANALYSIS

THIS PAGE INTENTIONALLY LEFT BLANK
COUNTY OF MONO Management’s Discussion and Analysis June 30, 2016
The management of the County of Mono (County) offers readers of the County’s annual financial report this narrative overview and analysis of the financial activities of the County for the fiscal year ended June 30, 2016. It should be read in conjunction with the transmittal letter at the front of this report and the County’s basic financial statements following this section.
FINANCIAL HIGHLIGHTS • The County’s net position was $29,841,630 at June 30, 2016 and exceeded the prior year by $10,671,414 (55.7%), after
restatement of the 2015 balance primarily for the understatement of the net pension liability.
• The County’s overall assets exceeded its liabilities at the close of the most recent fiscal year by $29,841,630 (net position). Of this amount, $43,407,690 is invested in Capital Assets net of debt; $19,437,290 is restricted for various programs; and ($33,003,350) is unrestricted for governmental activities. The unrestricted deficit is due to the implementation of GASB 68 and the required reporting of the net pension liability.
• As of June 30, 2016, the County’s governmental funds reported combined ending fund balances of $27,858,013, an increase of $9,680,900, or 53.3%, in comparison with the prior year.
• At the end of the current fiscal year, unassigned fund balance for the governmental type funds was $3,919,848, or 8.1% of total general government expenditures, a 16.2% decrease in unassigned fund balance from last year.
• Total long-term liabilities in the Solid Waste enterprise fund decreased by $207,958 during the fiscal year. Closure/post closure costs accounted for $143,107 of this decrease. The net pension liability is included and increased by $156,268 from the prior fiscal year.
• In September 2010 and September 2011, the Board of Supervisors authorized interest free inter-fund loans from General Reserves to the Solid Waste Enterprise fund totaling $1,950,000 to be repaid over 10 years (final payments due 2021 and 2022). The Solid Waste enterprise fund has been making the payments as scheduled and the balance owing to the General Fund is now $855,000 and is reflected in Internal Balances.
OVERVIEW OF THE FINANCIAL STATEMENTS This discussion and analysis is intended to serve as an introduction to the County’s basic financial statements. The County’s basic financial statements are comprised of three components: (1) government-wide financial statements, (2) fund financial statements, and (3) notes to the basic financial statements. Required supplementary information is included in addition to the basic financial statements.
Government-Wide Financial Statements
The government-wide financial statements are designed to provide readers with a broad overview of the County’s finances, using accounting methods similar to those of a private-sector business, that is, using the accrual basis of accounting. The financial statements demonstrate Mono County’s accountability by showing the extent to which it has met operating objectives efficiently and effectively, using all resources available, and whether it can continue to do so. These statements provide both long-term and short-term information about the County’s overall financial status. The Statement of Net Position presents information on all of the County’s assets, liabilities, and deferred inflows/outflows of resources, with the difference reported as net position. Over time, increases or decreases in net position may serve as a useful indicator of whether the financial position of the County is improving or deteriorating.
3

COUNTY OF MONO Management’s Discussion and Analysis June 30, 2016
The Statement of Activities presents information on expenses and revenues to show how the government’s net position changed during the fiscal year. All changes in net position are reported as soon as the underlying event giving rise to the change occurs, regardless of the timing of related cash flows. Thus, revenues are reported as soon as earned and expenses are reported as soon as incurred even though the related cash flows may not take place until future fiscal periods (e.g., uncollected taxes and earned but unused vacation leave). Both of the government-wide financial statements distinguish functions of the County that are principally supported by taxes and intergovernmental revenues (governmental activities) from other functions that are intended to recover all or a significant portion of their costs through user fees and charges (business-type activities). The governmental activities of the County include general government, public protection, public ways and facilities, health and sanitation, public assistance, education and recreation. The business-type activities include the solid waste program, airport fund, cemetery fund and campground fund. In 2009 two internal service funds were created to develop self-sustaining funds for operation and replacement of equipment. These two internal service funds, Motor Pool and Copier Pool, are considered governmental activities. Two more internal service funds were established at the end of fiscal year 2013, the Tech Refresh and Insurance Pool. These two internal service funds provide for the regular updating of County computer equipment and the distribution of insurance costs, both liability and workers’ compensation.
Fund Financial Statements
The fund financial statements provide evidence of accountability by demonstrating compliance with budgetary decisions made in public forum. A fund is a grouping of related accounts that are used to maintain control over resources that have been segregated for specific activities or purposes stipulated by laws, regulations or policies. The funds of the County are divided into three categories: governmental, proprietary and fiduciary. Governmental funds are used to account for essentially the same functions reported as governmental activities in the government-wide financial statements. However, unlike the government-wide financial statements, governmental fund financial statements focus on near-term inflows and outflows of spendable resources, as well as on balances of spendable resources available at the end of the fiscal year. Such information may be useful in evaluating a government’s near-term financing requirements. Because the focus of governmental funds is narrower than that of the government-wide financial statements, it is useful to compare the information presented for governmental funds with similar information presented, for governmental activities in the government-wide financial statements. By doing so, readers may better understand the long-term impact of the government’s near-term financing decisions. Both the governmental fund balance sheet and the governmental funds statement of revenues, expenditures, and changes in fund balances provide a reconciliation to facilitate this comparison between governmental funds and governmental activities. The County maintains 255 individual funds, including 186 fiduciary funds, organized according to type (governmental, fiduciary, or proprietary). On the financial statements for governmental funds, information is presented separately for five major funds: General Fund, the Road Fund, the Realignment Fund, the Mental Health Services Act Fund, and the Round Fire Fund. Data from the other non-major governmental funds are aggregated into a single column. However, data for each of these non-major governmental funds is provided in the combining statements located in the Other Supplementary Information section of this report. The County adopts an annual appropriated budget for its General Fund and most special revenue funds. A budgetary comparison statement has been provided for these funds to demonstrate compliance with this budget. Proprietary funds provide the same type of information as the government-wide financial statements, only in more detail. The County maintains two different types of proprietary funds: enterprise funds and internal service funds.
4

COUNTY OF MONO Management’s Discussion and Analysis June 30, 2016
Enterprise funds are included in the government-wide financial statements as business-type. The County uses enterprise funds to account for its solid waste program, airport, cemetery and campground funds. Internal service funds are included in the government-wide financial statements under governmental activities as they predominantly benefit governmental rather than business-type functions. These funds are used to accumulate and allocate costs internally among the County’s various internal functions. The County uses internal service funds to account for its motor pool, copier pool, insurance pool, and tech refresh pool. Proprietary fund statements provide separate information for solid waste and airport, major enterprise funds. The non-major enterprise funds, cemetery and campground are aggregated into a single column. All internal service funds are combined into a single, aggregated presentation in the proprietary fund financial statements. Individual fund data for the non-major enterprise funds and all of the internal service funds is provided in the form of combining statements elsewhere in this report. Fiduciary funds account for resources held for the benefit of parties outside the county government such as special districts and schools. Fiduciary funds are not reflected in the government-wide financial statement because the resources of those funds are not available to support the County’s programs. In the fiduciary fund category, the County maintains several agencies’ funds. The accounting used for fiduciary funds is similar to that used for proprietary funds.
Notes to the Basic Financial Statements
The Notes to the Basic Financial Statements provide additional information that is essential to a full understanding of the data provided in the government-wide and fund financial statements. Other Information
In addition to the basic financial statements and accompanying notes, this report presents certain required supplementary information (RSI) that includes budgetary comparisons for the General Fund and the major special revenue funds. The schedule of changes in net pension liability, schedule of the County’s retirement plan contributions and schedule of OPEB funding progress are also presented as RSI. The combining statements referred to earlier in connection with non-major governmental funds, non-major enterprise funds, internal service funds, and non-major component units are presented immediately following the required supplementary information. Following the combining statements, an unaudited statistical section is presented for the benefit of the readers of the comprehensive annual financial report. The objectives of the statistical section information are to provide financial statement users with additional historical perspective, context, and detail to assist in using the information in the financial statements, notes to the financial statements, and required supplementary information to understand and assess a government’s economic condition.
5

COUNTY OF MONO Management’s Discussion and Analysis June 30, 2016
GOVERNMENT-WIDE FINANCIAL ANALYSIS
As noted earlier, net position may serve over time as a useful indicator of a government’s financial condition. Prior year assets and liabilities are shown below for the purpose of providing comparative data on a government-wide level.
Condensed Statement of Net Position
Governmental Activities Business-Type Activities Total
2016 2015 2016 2015 2016 2015
Current and other assets 44,993,534$ 35,597,732$ 4,861,884$ 4,014,141$ 49,855,418$ 39,611,873$
Capital assets 37,058,137 37,457,469 6,416,220 6,694,009 43,474,357 44,151,478
Total Assets 82,051,671 73,055,201 11,278,104 10,708,150 93,329,775 83,763,351
Deferred outflows of resources
Deferred pensions 3,901,710 3,721,083 59,015 60,641 3,960,725 3,781,724
Current and other liabilities 7,388,554 6,651,892 223,416 136,011 7,611,970 6,787,903
Long term liabilities 45,077,438 40,461,535 10,347,379 10,555,337 55,424,817 51,016,872
Total Liabilities 52,465,992 47,113,427 10,570,795 10,691,348 63,036,787 57,804,775
Deferred inflows of resources
Deferred pensions 4,352,742 7,659,538 59,341 119,269 4,412,083 7,778,807
Net investment in capital assets 37,058,137 37,457,469 6,349,553 6,627,342 43,407,690 44,084,811
Restricted 19,407,068 16,168,103 30,222 30,222 19,437,290 16,198,325
Unrestricted (27,330,558) (31,622,253) (5,672,792) (6,699,390) (33,003,350) (38,321,643)
Total Net Position 29,134,647$ 22,003,319$ 706,983$ (41,826)$ 29,841,630$ 21,961,493$
The County’s net position was $29,841,630 as of June 30, 2016, an increase of $10,671,414, or 55.7%, during the fiscal year, after restatement of the 2015 balance primarily for understatement of the net pension liability, as described in the following paragraphs. Investment in capital assets net of related debt reflects the County’s investment in capital assets (i.e. its land, structures and improvements, infrastructure and equipment). The County uses these capital assets to provide services to citizens; consequently, these assets are not available for future spending. Although the County’s investment in its capital assets is reported net of related debt, it should be noted that the resources needed to repay this debt must be provided from other sources, since the capital assets themselves cannot be used to liquidate these liabilities. The only capital related debt at this time is found in the Solid Waste program. This original $500,000 interest free loan will be paid off completely during the 2016-17 fiscal year. Restricted net position represents resources that are subject to external restrictions on how they may be used. The County’s restricted net position of $19,437,290 or 65.1% of total net position is comprised of the following resources:
• Road projects – 5.2% of total net position • Health and social services –24% of total net position • County service areas –7.5% of total net position • Community development – 2.6% of total net position • Grant programs –19.1% of total net position • General county programs – 6.7% of total net position • Endowment – 0.1% of total net position
During the fiscal year ended June 30, 2016, restricted net position increased $3,238,965 or 20%. Unrestricted net position (deficit) is ($33,003,350) or (110.6%) of total net position. The majority of the deficit is due to financial reporting for the net pension liability.
6

COUNTY OF MONO Management’s Discussion and Analysis June 30, 2016
The following table presents the activities that accounted for the changes in net position for governmental and business-type activities. The Primary Government (Governmental and Business-type activities) increased net position by $10,671,414, or 55.7%, to $29,841,630 for the year ended June 30, 2016, after restatement of the 2015 balance for the net pension liability.
Statement of Activities
Governmental Activities Business-Type Activities Total
2016 2015 2016 2015 2016 2015
Program revenues:
Fees, Fines & Charges for Services 6,999,158$ 7,106,835$ 2,885,906$ 2,962,429$ 9,885,064$ 10,069,264$
Operating grants 21,422,359 27,527,859 40,000 30,000 21,462,359 27,557,859
Capital grants 4,054,304 157,241 22,884 30,011 4,077,188 187,252
General revenues:
Property taxes 19,992,544 18,653,314 -- -- 19,992,544 18,653,314
Sales and use taxes 643,086 511,011 -- -- 643,086 511,011
Other taxes 3,058,934 2,751,260 -- -- 3,058,934 2,751,260
Other revenue -- 113,063 -- 52,021 -- 165,084
Interest/Investment earnings 190,778 199,428 43,356 36,993 234,134 236,421
Total Revenues 56,361,163 57,020,011 2,992,146 3,111,454 59,353,309 60,131,465
Expenses:
General government 8,527,686 9,495,667 -- -- 8,527,686 9,495,667
Public protection 17,026,030 15,022,593 -- -- 17,026,030 15,022,593
Public ways and facilities 7,655,712 9,115,279 -- -- 7,655,712 9,115,279
Health and Sanitation 8,564,376 8,638,229 -- -- 8,564,376 8,638,229
Public assistance 4,407,906 4,280,862 -- -- 4,407,906 4,280,862
Education 39,784 39,164 -- -- 39,784 39,164
Culture and recreation 104,588 110,690 -- -- 104,588 110,690
Interest and fiscal charges 112,476 138,475 -- -- 112,476 138,475
Solid Waste Landfill -- -- 1,778,162 2,018,282 1,778,162 2,018,282
Airport -- -- 426,882 509,576 426,882 509,576
Campgrounds -- -- 22,590 45,894 22,590 45,894
Cemeteries -- -- 15,703 3,017 15,703 3,017
Total Expenses 46,438,558 46,840,959 2,243,337 2,576,769 48,681,895 49,417,728
Change in net position before transfers 9,922,605 10,179,052 748,809 534,685 10,671,414 10,713,737
Transfers -- (2,000) -- 2,000 -- --
Change in net position 9,922,605 10,177,052 748,809 536,685 10,671,414 10,713,737
Net position - beginning 22,003,319 53,743,253 (41,826) (115,299) 21,961,493 53,627,954
Prior period adjustment (2,791,277) (41,916,986) -- (463,212) (2,791,277) (42,380,198)
Net position - beginning, as restated 19,212,042 11,826,267 (41,826) (578,511) 19,170,216 11,247,756
Net position, ending 29,134,647$ 22,003,319$ 706,983$ (41,826)$ 29,841,630$ 21,961,493$
Analysis of Governmental Activities
Governmental Activities increased the County’s net position by $9,922,605 before transfers, a decrease of $254,447 over the prior year, accounting for 93% of the County’s total increase in net position. Business-type activities attributed to the increase in net position by $748,809, an increase of $212,124 over the prior year, and accounts for the remaining 7% of the County’s total increase in net position.
Revenues: Revenues for the County’s governmental activities had an overall decrease from the prior year of $658,848, or 1.2%, to $56,361,163. Revenues are divided into two categories: Program Revenues and General Revenues.
Program Revenues includes revenues such as fees, fines, and charges for services as well as operating and capital grants. Program revenues decreased overall by $2,316,114, or 6.7%, from the prior year to $32,475,821, with the majority of the reduction attributable to operating grants. Operating grants include grants such as that of the Road fund which received less grant funding for the fiscal year ended June 30, 2016 as compared to the prior fiscal year. Charges for services also had a decrease which can be related to a reduction in services, reduced property tax late payment fines and fees, and general administrative service cost reimbursement.
7
COUNTY OF MONO Management’s Discussion and Analysis June 30, 2016
General Revenues include property taxes, sales and use taxes, other taxes/revenues, and interest/investment earnings. General revenues increased by $1,657,266, or 7.5%, from the prior year to $23,885,342. The increase is primarily due to increased property tax receipts and transient occupancy tax, both attributable to a recovering economy.
Expenses: Governmental activities had a decrease in total expenses of $402,401, or 0.9%.
Analysis of Business-Type Activities
Business-type activities change in net position increased by $212,124, or 39.5%, to $748,809 for the year end June 30, 2016, accounting for 7% of the County’s total increase in net position.
Revenues for the County’s Business-Type Activities had a small decrease from the prior year of $119,308 before transfers, or 3.8%, to $2,992,146. Expenses decreased as well over the prior year by $333,432, or 12.9%, to $2,243,337.
FINANCIAL ANALYSIS OF THE GOVERNMENT’S FUNDS
As noted earlier, the County uses fund accounting to ensure and demonstrate compliance with budgetary and legal requirements.
Governmental funds The County’s general governmental functions are contained in the General Fund, Special Revenue, Capital Project and Debt Service Funds. The focus of the County’s governmental funds is to provide information on near-term inflows, outflows, and balances of spendable resources. Such information is useful in assessing the County’s financing requirements. In particular, unassigned fund balance may serve as a useful measure of the County’s net resources available for spending at the end of the fiscal year. At June 30, 2016, the County’s governmental funds reported combined ending fund balances of $27,858,013, an increase of $9,702,662, or 53.4%, in comparison with the prior year (for more information see Note 9 – Net Position/Fund Balances). The components of fund balance are as follows:
• Nonspendable fund balance, $1,296,791, consists of amounts that are not spendable in form or are legally or contractually required to be maintained intact and consists of:
• Advances - $855,000 • Prepaid expenses - $77,532 • Inventories - $364,259
• Restricted fund balance, $17,033,022, consists of amounts with constraints put on their use by externally imposed
creditors, grantors, laws, regulations and enabling legislation and consist of amounts restricted to:
• Road projects - $1,173,598 • Health and social services - $7,144,236 • County service areas - $2,243,991 • Community development - $762,013 • Grant programs - $5,709,184
• Committed fund balance, $540,656, consists of amounts that have been committed to specific purposes by the Board
of Supervisors and consists of amounts committed to:
• Disaster assistance (Round Fire) - $540,656
8

COUNTY OF MONO Management’s Discussion and Analysis June 30, 2016
• Assigned fund balance, $5,067,696, represents amounts intended for use as determined by the Board of Supervisors and consists of amounts assigned to:
• Eliminate projected FY 16/17 budgetary deficit - $4,567,500 • Capital projects - $359,706 • Tourism - $117,377 • Conway Ranch - $23,113
• Unassigned fund balance, $3,919,848, represents the residual classification for the General Fund and negative
amounts from other governmental funds, if any. Unassigned fund balance represents approximately 14.1% (a decrease over last year) of the total governmental fund balance, which may be used to meet the County’s ongoing obligations to citizens and creditors. The remainder of fund balance is reserved to indicate that it is not available for new spending because it: 1) reflects inventories and the amount due from other funds that are long-term in nature and does not represent spendable resources, 2) liquidates contractual commitments of the prior period, and 3) provides funds for any type of disaster. In addition, funds may not be available to meet general obligations because the terms of the revenue/funds may be restricted, committed, or assigned by Board of Supervisors or other prevailing law. General Fund The General Fund is the main operating fund of the County. At June 30, 2016, unassigned fund balance of the general fund was $4,015,851 while total fund balance reached $9,637,190. As measures of this fund’s liquidity, it is useful to note that unassigned fund balance represents 14.3% of total fund expenditures, while total fund balance represents 34.3% of that same amount. Other Major Governmental Funds As compared with the prior year, the total fund balances of the remaining governmental funds increased by 183.9%, or $11,803,034, to $18,220,823 with the following significant changes:
• The Realignment Fund had a fund balance of $4,858,907 which was all restricted. This was a $1.83 million increase over the prior year due primarily to an increase in state revenues.
• The Mental Health Services Act Fund and the Round Fire Disaster Fund were aggregated in the Other Governmental
column for the prior fiscal year but for 16/17 was included as a separate major governmental fund. The Mental Health Services Act Fund, Round fire Disaster Fund, and the Other Governmental funds had a combined total fund balance of $11,825,325, an increase of $7,751,041 over the prior year. The Round Fire Disaster Fund had an increase in fund balance primarily due to a receivable of approximately $1.7 million. The Mental Health Service Act Fund had an increase in fund balance, all restricted, due to an increase in state revenues received.
• The unassigned fund balance of negative $96,003 reflects delays in funding reimbursement for expenditure driven programs once the expenditures have been made. The general fund covers this deficit while waiting for reimbursement.
9

COUNTY OF MONO Management’s Discussion and Analysis June 30, 2016
Revenues: Revenues for governmental funds totaled $58,249,951 for fiscal year 2015-16, which represents an increase of 4.1% from fiscal year 2014-15. The following table presents the revenues from various sources as well as increases or decreases from the prior year in the governmental funds.
Revenue sources
Amount % of Total Amount % of Total Amount % of Change
Taxes 23,694,564$ 40.68% 21,915,585$ 39.18% 1,778,979$ 8.12%
Licenses and permits 660,820 1.13% 659,532 1.18% 1,288 0.20%
Fines, forfeitures & penalties 907,136 1.56% 836,368 1.50% 70,768 8.46%
Use of money & property 224,169 0.38% 165,637 0.30% 58,532 35.34%
Intergovernmental 27,441,774 47.11% 25,421,960 45.45% 2,019,814 7.95%
Charges for services 4,234,113 7.27% 5,841,674 10.44% (1,607,561) -27.52%
Other 1,087,375 1.87% 1,093,503 1.95% (6,128) -0.56%
Total 58,249,951$ 100% 55,934,259$ 100% 2,315,692$ 4.14%
Revenues Classified by Source - Governmental Funds
FY 2016 FY 2015 Change
• Taxes – Tax revenues include a multitude of taxes including sales taxes, transient occupancy taxes and property taxes.
Mono County relies on tourism to bring in sales tax and transient occupancy taxes and while those numbers fell dramatically in past years due to the economic downturn, we have now seen an increase in these types of revenues. Tax revenues in the general fund increased by $1,771,085, or 8.2%, over the prior fiscal year due primarily to the continued gradual recovery of the real estate market which in turn increased real estate values and therefore county property tax revenues.
• Licenses and Permits – Licenses and permits were relatively flat in Mono County with a nominal increase of $1,288, or
.2% over the prior fiscal year.
• Use of money and property – Better interest rates and higher cash balances resulted in higher earnings for 2015-16, resulting in an increase of $58,532, or 35.3% over the prior fiscal year.
• Intergovernmental Revenues – These types of revenues increased by $2,019,814, or 7.9%, in part due to 2011 Realignment and some programs that received growth allocations. Realignment is funded by various taxes paid to the state and allocated based on a set formula.
• Charges for services – A decrease of $1,607,561, or 27.5%, in these types of revenues can be partly attributed to a decrease in use of services, reduced late penalties and fees on property tax revenue, and reduced general administration service fees.
10

COUNTY OF MONO Management’s Discussion and Analysis June 30, 2016
Expenditures: The following table presents expenditures by function compared to prior year’s amounts in the governmental funds.
Amount % of Total Amount % of Total Amount % of Change
General government 9,241,315$ 19.12% 10,310,419$ 19.95% (1,069,104)$ -10.37%
Public protection 17,237,927 35.66% 15,458,350 29.91% 1,779,577 11.51%
Public ways and facilities 7,102,319 14.69% 11,144,707 21.56% (4,042,388) -36.27%
Health and sanitation 8,999,912 18.62% 8,839,953 17.10% 159,959 1.81%
Public assistance 4,581,365 9.48% 4,348,726 8.41% 232,639 5.35%
Education 39,784 0.08% 39,164 0.08% 620 1.58%
Debt Service, Principal 647,700 1.34% 596,300 1.15% 51,400 8.62%
Debt service, Interest and other costs 115,754 0.24% 139,494 0.27% (23,740) -17.02%
Capital outlay 378,428 0.78% 805,922 1.56% (427,494) -53.04%
Total Expenditures 48,344,504$ 100% 51,683,035$ 100% (3,338,531)$ -6.46%
Expenditures Classified by Function - Governmental Funds
ChangeFY 2015FY 2016
• General government – A decrease of $1,069,104, or 10.4%, in expenditures resulted primarily from continued budgetary
constraints, negotiated furlough agreements with certain employee bargaining units and vacant positions in general government departments.
• Public protection – This expenditure group had an increase of $1,779,577, or 11.5%, that can be primarily attributed to vacant positions being filled, negotiated retroactive pay for certain bargaining groups, and increased benefit amounts, that resulted in increased salary and benefits.
• Public ways and facilities – Many road and transportation projects are grant funded. There was a $4,042,388, or 36.3%, decrease in public ways and facilities expenditures due primarily to a reduction in new road projects during the 2015-16 fiscal year.
• Public assistance – FY 2015-16 saw an 5.3% increase over the prior fiscal year, or $232,639. Public assistance can fluctuate widely depending upon availability of State and Federal funding and the need in any particular year. While there are normal salary and benefit increases as in all departments, the bulk of expenditures are reflected in the needs of the community at any given time and good management practices.
• Debt service – The County refunded the PERS Side fund late in fiscal year 2012. Every year until the refunded PERS Side fund debt has been repaid there will be a shift between increased principal payments and interest payments. Principal payments will go up and interest payments will go down.
Proprietary Funds
The County’s proprietary funds provide the same type of information found in the government-wide financial statements, but in more detail. Enterprise funds include the solid waste program, airport fund, cemetery fund and campground fund. Additionally, there are four internal service funds that are presented in aggregate: Motor Pool, Copier Pool, Tech Refresh Pool and Insurance Pool. Factors affecting the financial results of these funds were discussed earlier in the business-type activities of Mono County.
• The total net position of County enterprise funds increased by $748,809 in the current fiscal year to $706,983. The solid waste enterprise fund increased their net position by $1,120,098, decreasing their deficit net position from the prior fiscal year. The airport enterprise fund decreased their net position from the prior fiscal year by $373,153, primarily due to capital asset depreciation.
11

COUNTY OF MONO Management’s Discussion and Analysis June 30, 2016
• The total net position of internal service funds decreased by $401,734 from $3,731,847 to $3,330,113 primarily due to changes in the insurance pool within cash balances held with fiscal agents and claims liability increases.
General Fund Budgetary Highlights
The Board adopted their initial budget August 18, 2015, after much hard work and public hearings. This initial adopted budget allowed for revenues of $33,915,775 and expenditures of $36,181,380. The gap was met through prior year fund balance and use of other financing sources. A few minor changes were made throughout the year and a mid-year budget review occurred in February 2016 that resulted in an increase of $135,502 in revenues offset by an increase of $135,502 in expenditures causing no change to fund balance.
CAPITAL ASETS AND DEBT ADMINISTRATION
Capital Assets
The County’s investment in capital assets for its Governmental Activities, as of June 30, 2016, totals $37,058,137 (net of accumulated depreciation). This investment in capital assets includes land, structures and improvements, equipment, infrastructure and construction in progress. The total decrease in the County’s governmental net investment in capital assets for the current period was $399,332, or 1.1% (net of accumulated depreciation). Current depreciation for governmental type funds is $3,280,030. Business-type function assets saw a decrease of $277,789, or 4.1%. Business-type activities total $330,589 in current year depreciation and total assets net of depreciation is $6,416,220. The county both purchases and constructs capital assets throughout the year. When a capital project will be completed in a subsequent fiscal year, related current year expenditures are recorded as Construction in progress (CIP). In the year of completion, a project’s CIP is allocated to the appropriate capital asset classification(s). As of June 30, 2016, total CIP decreased by $2,194,218, consisting of $2,707,432 in transfers due to project completion and transfers/disposals and $513,214 in CIP additions due to new projects. More detailed discussion can be found in Note 4 in the Notes to the Financial Statements section in this report.
Capital Assets (Net of Depreciation)
Governmental Activities Business-Type Activities Total
2016 2015 2016 2015 2015 2014
Land 6,793,617$ 6,793,617$ 286,135$ 233,335$ 7,079,752$ 7,026,952$
Construction in progress 1,976,976 4,171,194 -- -- 1,976,976 4,171,194
Infrastructure 93,754,058 89,814,386 -- -- 93,754,058 89,814,386
Structures & improvements 18,577,483 18,100,383 7,730,944 7,730,944 26,308,427 25,831,327
Equipment 17,275,185 17,322,582 1,532,463 1,532,463 18,807,648 18,855,045
Intangibles 1,148,577 1,148,577 -- -- 1,148,577 1,148,577
Accumulated Depreciation (102,467,759) (99,893,270) (3,133,322) (2,802,733) (105,601,081) (102,696,003)
Total 37,058,137$ 37,457,469$ 6,416,220$ 6,694,009$ 43,474,357$ 44,151,478$
The County elected to report its general infrastructure assets beginning July 1, 2003, and hired a consultant to value the infrastructure. The County has maintained and updated is initial valuation as necessary to keep current. It is important to note, assets are valued at their acquisition cost and not as a market value or replacement cost.
12

COUNTY OF MONO Management’s Discussion and Analysis June 30, 2016
Debt Administration
At June 30, 2016, the County Governmental activities had total long-term liabilities outstanding of $45,077,438: Long Term Liabilities
Governmental Activities Business-Type Activities Total
2016 2015 2016 2015 2016 2015
Pension obligation bonds 2,161,600$ 2,809,300$ --$ --$ 2,161,600$ 2,809,300$
Compensated absences 3,192,000 3,084,923 78,237 84,756 3,270,237 3,169,679
Net pension liability 38,065,504 35,522,088 767,312 611,044 38,832,816 36,133,132
Claims liability 1,658,334 1,383,097 -- -- 1,658,334 1,383,097
Refunded certificates of participation -- -- 2,406,000 2,620,600 2,406,000 2,620,600
Loan payable -- -- 66,667 66,667 66,667 66,667
Landfill postlcosure cost -- -- 7,029,163 7,172,270 7,029,163 7,172,270
Total 45,077,438$ 42,799,408$ 10,347,379$ 10,555,337$ 55,424,817$ 53,354,745$
* The 2015 balance of net pension liability for governmental activities has been restated. See Note 10 for further information.
Total long-term liabilities increased by $2,070,072, or 3.9%, during the fiscal year ended June 30, 2016 largely in part to adjustments in net pension liability. Claims liability also increased by $275,237, or 19.9%, over the prior fiscal year.
ECONOMIC FACTORS AND NEXT YEAR’S BUDGET
•••• The County’s Net Position increased by $10,671,414, after restatement of the 2015 balance for net pension liability, as County revenues exceeded expenses.
•••• The unemployment rate for Mono County annualized for 2015 was 5.3% and for 2016 was 4.9%. The State’s average unemployment rate for 2016 was 5.4%. The unemployment rate for Mono County dropped by .4% when compared to 6.2% for 2015. Mono County’s scenic and recreational attributes help support tourism and recreation which is the major industry and directly affects the employment rate.
•••• Property tax values have stabilized and are expected to increase at a moderate pace of about 2 to 4% annually after years of decline. New construction is still slow and the Assessor continues to monitor Prop 8 values. There should be fewer decreases and slow re-growth as defaulted property is resold and property tax appeals are settled and as the economy as a whole within the state and nation improves. Total assessed valuations in Mono County increased 2.6% from the 2015 to the 2016 total roll value.
•••• Continuing from the 2015-16 budget, MOU negations resulted in a slight increase in employee participation in health benefits as well as salary freezes and furloughs to contain costs. Furloughs for employees will sunset July 1, 2016.
•••• The 2016-17 budget will also incorporate a reduction in post-employee benefit costs. As this liability reduces each year, so does the amount needed to budget to cover the required contribution. The employer payment of the PERS unfunded liability, however, is an increase to be considered in 2016-17. In addition to the normal cost rate that will be going up an average of 1% for each employee group, the lump sum payment due for the unfunded liability for 2016-17 is $688,800.
•••• Road Funding for 2016-17 is expected to continue to encounter declining transportation related revenues and increasing road maintenance needs. A General Fund subsidy of $850,000 to the County’s Road Fund is budgeted for 2016-17 as a way to counter the shortfall.
•••• For revenue, transient occupancy tax (TOT) reached an all-time high of over $3 million for the fiscal year ended June 30, 2016 due to tourism, a major economic industry in Mono County. Sales tax is looking strong and collections are estimated to increase 3% annually through 2018. The cost of living adjustment for property taxes effective 1-1-2017 is set at 2% creating cautious optimism for the future.
These factors plus others were considered in preparing the County’s budget for the 2016-17 fiscal year.
13
COUNTY OF MONO Management’s Discussion and Analysis June 30, 2016
The 2016-17 adopted budget is sufficient to:
• Provide core services and programs while avoiding significant reductions to other programs and services;
• Restore MCPEA salaries after two years of furloughs, include 2% cost of living adjustment as of 1-1-2017, and restore step increases;
• Allocate an amount of $256,909 to the General Fund Reserves to continue towards funding the policy minimum as
well as $1,117,516 allocated to the Economic Stabilization Fund to fund future personnel actions and/or other unfunded projects;
• Provide for contingencies in the adopted amount of $383,390;
• Continue funding the County Emergency Medical Services without decreasing service levels;
• Maintain Mono County’s commitment to the Senior Services Program; and
• Partially fund the gap caused by a reduction in Highway User Tax for roads and provide minimal funding for road
maintenance and repairs in the contribution amount to the Road Fund in the amount of $850,000.
REQUESTS FOR INFORMATION
This financial report is designed to demonstrate accountability by the Mono County government by providing both a long-term and near-term views of the County’s finances. Questions or comments regarding any of the information presented in this report or requests for additional financial information should be addressed to:
Director of Finance County of Mono P.O. Box 556
Bridgeport, CA 93517-0556 (760) 932-5490\
14

BASIC FINANCIAL STATEMENTS
GOVERNMENT WIDE FINANCIAL STATEMENTS

THIS PAGE INTENTIONALLY LEFT BLANK

COUNTY OF MONO
Statement of Net Position
June 30, 2016Primary Government
Governmental Business-Type
Activities Activities Totals
ASSETS
Cash and investments 28,563,911$ 2,294,297$ 30,858,208$ Cash with fiscal agent 62,557 74,430 136,987 Restricted cash - 3,041,508 3,041,508 Accounts receivable 1,145,005 288,495 1,433,500 Due from other governments 6,229,547 16,042 6,245,589 Taxes receivable 373,354 - 373,354 Deposits with others 2,894,060 - 2,894,060 Prepaid expense 77,532 - 77,532 Inventories 364,259 2,112 366,371 Other assets - Other Post Employment Benefits 4,428,309 - 4,428,309 Internal balances 855,000 (855,000) - Capital assets:
Nondepreciable 8,770,593 286,135 9,056,728 Depreciable, net 28,287,544 6,130,085 34,417,629
Total Assets 82,051,671 11,278,104 93,329,775
DEFERRED OUTFLOWS OF RESOURCES
Deferred amounts related to pensions 3,901,710 59,015 3,960,725
LIABILITIES
Accounts payable 3,117,100 148,320 3,265,420 Salaries and benefits payable 2,903,501 56,359 2,959,860 Interest payable 7,751 18,737 26,488 Deposits from others 800 - 800 Unearned revenue 1,359,402 - 1,359,402 Long-term liabilities:
Portion due or payable within one year 3,787,348 318,017 4,105,365 Portion due or payable after one year 41,290,090 10,029,362 51,319,452
Total Liabilities 52,465,992 10,570,795 63,036,787
DEFERRED INFLOWS OF RESOURCES
Deferred amounts related to pensions 4,352,742 59,341 4,412,083
NET POSITION
Net investment in capital assets 37,058,137 6,349,553 43,407,690 Restricted for:Road projects 1,536,591 - 1,536,591 Health and Social Services 7,164,607 - 7,164,607 County Service Areas 2,243,991 - 2,243,991 Community Development 762,013 - 762,013 Grant Programs 5,709,262 - 5,709,262 General County Programs 1,990,604 - 1,990,604 Endowment - 30,222 30,222
Unrestricted (27,330,558) (5,672,792) (33,003,350) Total Net Position 29,134,647$ 706,983$ 29,841,630$
See accompanying notes to the basic financial statements.15

COUNTY OF MONO
Statement of Activities
For the Year Ended June 30, 2016
Program Revenues
Fees, Fines and Operating Capital
Charges for Grants and Grants and
Expenses Services Contributions Contributions
FUNCTION / PROGRAM ACTIVITIES
Primary Government
Governmental Activities:
General government 8,527,686$ 2,604,571$ 3,251,597$ -$
Public protection 17,026,030 1,715,559 5,540,719 -
Public ways and facilities 7,655,712 524,684 1,020,857 4,054,304
Health and sanitation 8,564,376 2,015,266 6,219,790 -
Public assistance 4,407,906 139,078 5,388,489 -
Education 39,784 - 907 -
Recreation and culture 104,588 - - -
Interest on long-term debt 112,476 - - -
Total Governmental Activities 46,438,558 6,999,158 21,422,359 4,054,304
Business-Type Activities
Solid Waste 1,778,162 2,837,439 20,000 -
Airport 426,882 9,021 20,000 22,884
Campgrounds 22,590 39,376 - -
Cemeteries 15,703 70 - -
Total Business-type Activities 2,243,337 2,885,906 40,000 22,884
Total Primary Government 48,681,895$ 9,885,064$ 21,462,359$ 4,077,188$
GENERAL REVENUES AND TRANSFERS
Taxes:
Property
Sales and use
Transient occupancy
Unrestricted investment earnings
Total General Revenues
CHANGES IN NET POSITION
Net Position - Beginning of Year, restated
NET POSITION, END OF YEAR
See accompanying notes to the basic financial statements.16

Net (Expense) Revenue and
Changes in Net Position
Primary Government
Business-
Governmental Type
Activities Activities Total
FUNCTION / PROGRAM ACTIVITIES
Primary Government
Governmental Activities:
(2,671,518)$ -$ (2,671,518)$ General government
(9,769,752) - (9,769,752) Public protection
(2,055,867) - (2,055,867) Public ways and facilities
(329,320) - (329,320) Health and sanitation
1,119,661 - 1,119,661 Public assistance
(38,877) - (38,877) Education
(104,588) - (104,588) Recreation and culture
(112,476) - (112,476) Interest on long-term debt
(13,962,737) - (13,962,737) Total Governmental Activities
Business-Type Activities
- 1,079,277 1,079,277 Solid Waste
- (374,977) (374,977) Airport
- 16,786 16,786 Campgrounds
- (15,633) (15,633) Cemeteries
- 705,453 705,453 Total Business-type Activities
(13,962,737) 705,453 (13,257,284) Total Primary Government
GENERAL REVENUES AND TRANSFERS
Taxes:
19,992,544 - 19,992,544 Property
643,086 - 643,086 Sales and use
3,058,934 - 3,058,934 Transient occupancy
190,778 43,356 234,134 Unrestricted investment earnings
23,885,342 43,356 23,928,698 Total General Revenues
9,922,605 748,809 10,671,414 CHANGES IN NET POSITION
19,212,042 (41,826) 19,170,216 Net Position - Beginning of Year, restated
29,134,647$ 706,983$ 29,841,630$ NET POSITION, END OF YEAR
See accompanying notes to the basic financial statements.17

THIS PAGE INTENTIONALLY LEFT BLANK

BASIC FINANCIAL STATEMENTS
FUND FINANCIAL STATEMENTS
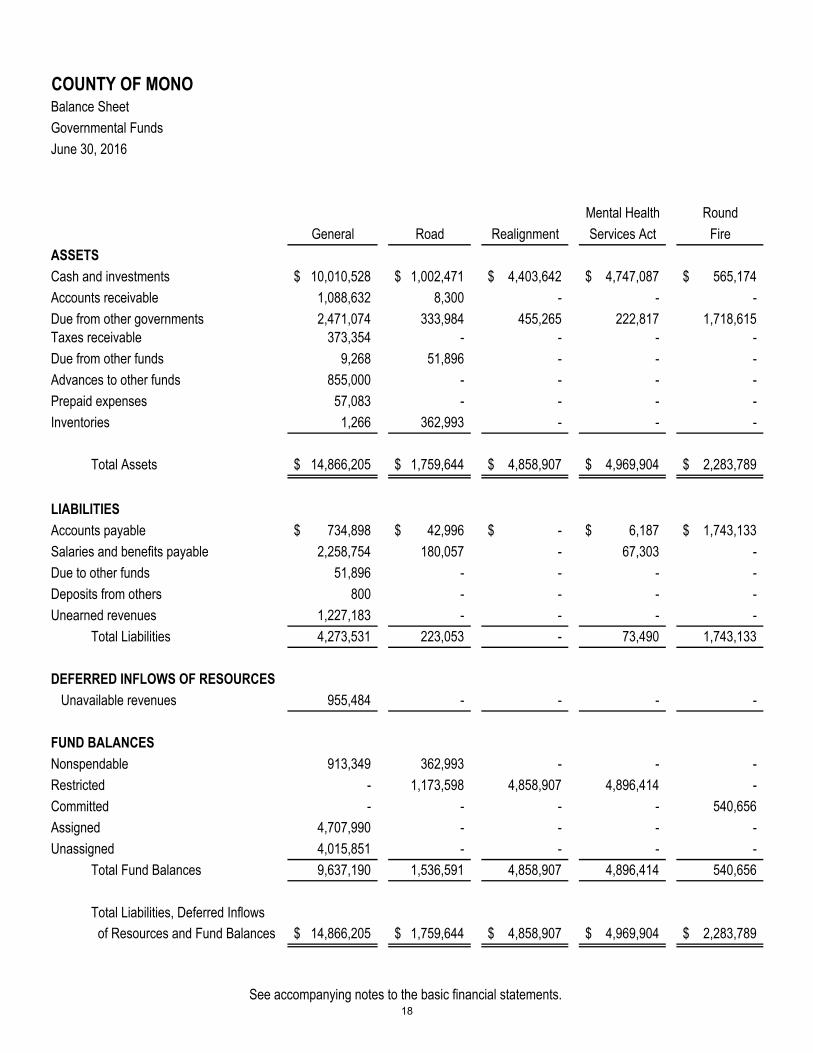
COUNTY OF MONO
Balance Sheet
Governmental Funds
June 30, 2016
Mental Health Round
General Road Realignment Services Act Fire
ASSETS
Cash and investments 10,010,528$ 1,002,471$ 4,403,642$ 4,747,087$ 565,174$
Accounts receivable 1,088,632 8,300 - - -
Due from other governments 2,471,074 333,984 455,265 222,817 1,718,615
Taxes receivable 373,354 - - - -
Due from other funds 9,268 51,896 - - -
Advances to other funds 855,000 - - - -
Prepaid expenses 57,083 - - - -
Inventories 1,266 362,993 - - -
Total Assets 14,866,205$ 1,759,644$ 4,858,907$ 4,969,904$ 2,283,789$
LIABILITIES
Accounts payable 734,898$ 42,996$ -$ 6,187$ 1,743,133$
Salaries and benefits payable 2,258,754 180,057 - 67,303 -
Due to other funds 51,896 - - - -
Deposits from others 800 - - - -
Unearned revenues 1,227,183 - - - -
Total Liabilities 4,273,531 223,053 - 73,490 1,743,133
DEFERRED INFLOWS OF RESOURCES
Unavailable revenues 955,484 - - - -
FUND BALANCES
Nonspendable 913,349 362,993 - - -
Restricted - 1,173,598 4,858,907 4,896,414 -
Committed - - - - 540,656
Assigned 4,707,990 - - - -
Unassigned 4,015,851 - - - -
Total Fund Balances 9,637,190 1,536,591 4,858,907 4,896,414 540,656
Total Liabilities, Deferred Inflows
of Resources and Fund Balances 14,866,205$ 1,759,644$ 4,858,907$ 4,969,904$ 2,283,789$
See accompanying notes to the basic financial statements.18
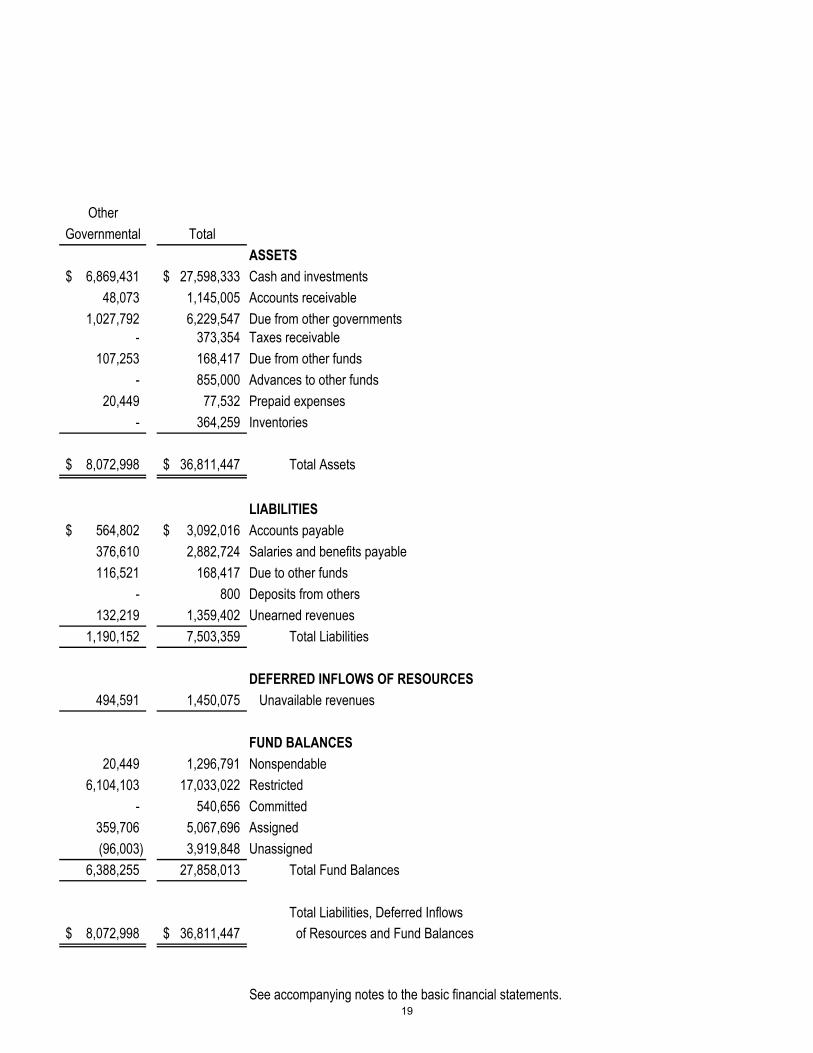
Other
Governmental Total
ASSETS
6,869,431$ 27,598,333$ Cash and investments
48,073 1,145,005 Accounts receivable
1,027,792 6,229,547 Due from other governments
- 373,354 Taxes receivable
107,253 168,417 Due from other funds
- 855,000 Advances to other funds
20,449 77,532 Prepaid expenses
- 364,259 Inventories
8,072,998$ 36,811,447$ Total Assets
LIABILITIES
564,802$ 3,092,016$ Accounts payable
376,610 2,882,724 Salaries and benefits payable
116,521 168,417 Due to other funds
- 800 Deposits from others
132,219 1,359,402 Unearned revenues
1,190,152 7,503,359 Total Liabilities
DEFERRED INFLOWS OF RESOURCES
494,591 1,450,075 Unavailable revenues
FUND BALANCES
20,449 1,296,791 Nonspendable
6,104,103 17,033,022 Restricted
- 540,656 Committed
359,706 5,067,696 Assigned
(96,003) 3,919,848 Unassigned
6,388,255 27,858,013 Total Fund Balances
Total Liabilities, Deferred Inflows
8,072,998$ 36,811,447$ of Resources and Fund Balances
See accompanying notes to the basic financial statements.19

THIS PAGE INTENTIONALLY LEFT BLANK
20

COUNTY OF MONO
Reconciliation of the Balance Sheet to the Statement of Net Position
Governmental Funds and Activities
June 30, 2016
Fund balance - total governmental funds 27,858,013$
Amounts reported for governmental activities in the statement of net position are different
because:
Certain amounts are not available to pay for current period expenditures and, therefore,
are not reported in the governmental funds.
Other post employment benefit asset 4,428,309
Deferred outflow amounts related to pensions 3,870,078
Deferred inflow amounts related to pensions (4,334,316)
Capital assets used in governmental activities are not financial resources and, therefore,
are not reported in the governmental funds 35,718,628
Unavailable revenues represent amounts that are not available to fund current
expenditures and, therefore, are not reported in the governmental funds. 1,450,075
Internal service funds are used by management to charge the cost of motor pool, copier
pool, insurance and other activities to individual funds. The assets, deferred outflows,
liabilities and deferred inflows of the internal service funds are included in governmental
activities in the statement of net position. 3,330,113
Long-term liabilities, including capital leases, are not due and payable in the current
period, and therefore are not reported in the governmental funds.
Bonds payable (2,161,600)
Compensated absences (3,192,000)
Net pension liability (37,824,902)
Interest payable (7,751)
Net position of governmental activities 29,134,647$
See accompanying notes to the basic financial statements.21
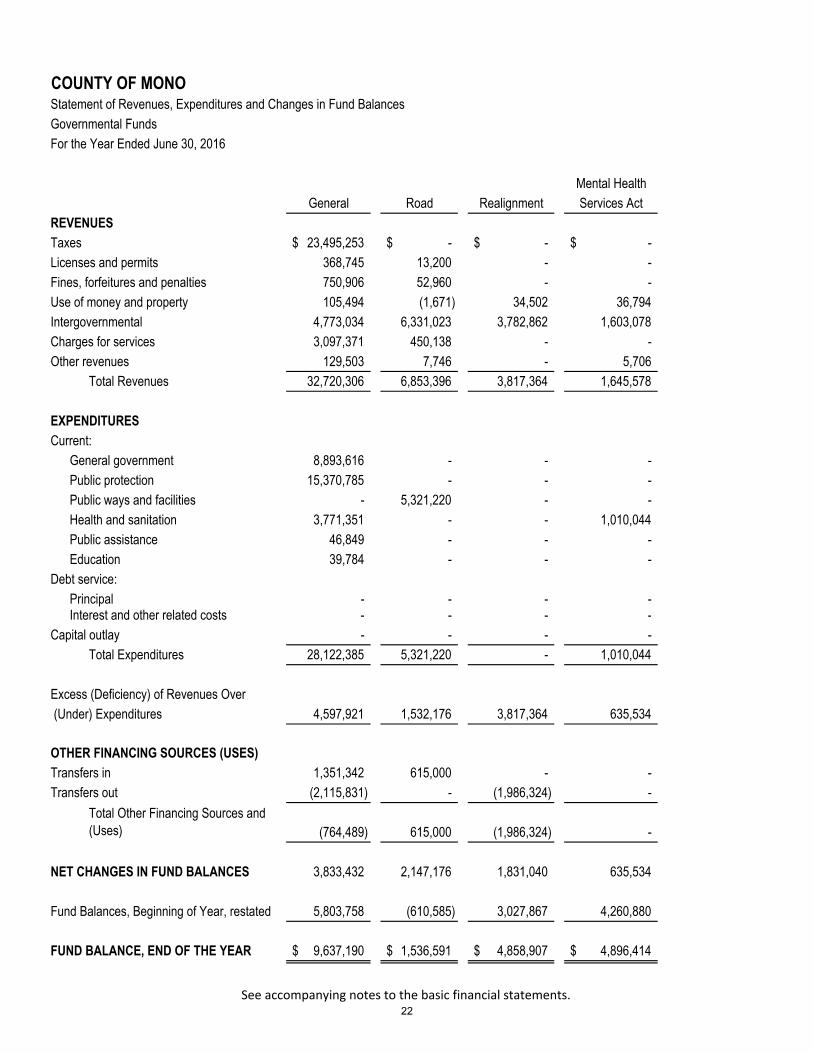
COUNTY OF MONOStatement of Revenues, Expenditures and Changes in Fund Balances
Governmental Funds
For the Year Ended June 30, 2016
Mental Health
General Road Realignment Services Act
REVENUES
Taxes 23,495,253$ -$ -$ -$
Licenses and permits 368,745 13,200 - -
Fines, forfeitures and penalties 750,906 52,960 - -
Use of money and property 105,494 (1,671) 34,502 36,794
Intergovernmental 4,773,034 6,331,023 3,782,862 1,603,078
Charges for services 3,097,371 450,138 - -
Other revenues 129,503 7,746 - 5,706
Total Revenues 32,720,306 6,853,396 3,817,364 1,645,578
EXPENDITURES
Current:
General government 8,893,616 - - -
Public protection 15,370,785 - - -
Public ways and facilities - 5,321,220 - -
Health and sanitation 3,771,351 - - 1,010,044
Public assistance 46,849 - - -
Education 39,784 - - -
Debt service:
Principal - - - - Interest and other related costs - - - -
Capital outlay - - - -
Total Expenditures 28,122,385 5,321,220 - 1,010,044
Excess (Deficiency) of Revenues Over
(Under) Expenditures 4,597,921 1,532,176 3,817,364 635,534
OTHER FINANCING SOURCES (USES)
Transfers in 1,351,342 615,000 - -
Transfers out (2,115,831) - (1,986,324) -
Total Other Financing Sources and
(Uses) (764,489) 615,000 (1,986,324) -
NET CHANGES IN FUND BALANCES 3,833,432 2,147,176 1,831,040 635,534
Fund Balances, Beginning of Year, restated 5,803,758 (610,585) 3,027,867 4,260,880
FUND BALANCE, END OF THE YEAR 9,637,190$ 1,536,591$ 4,858,907$ 4,896,414$
See accompanying notes to the basic financial statements.
22

Round Other
Fire Governmental Total
REVENUES
-$ 199,311$ 23,694,564$ Taxes
- 278,875 660,820 Licenses and permits
- 103,270 907,136 Fines, forfeitures and penalties
3,582 45,468 224,169 Use of money and property
1,788,540 9,163,237 27,441,774 Intergovernmental
- 686,604 4,234,113 Charges for services
170,312 774,108 1,087,375 Other revenues
1,962,434 11,250,873 58,249,951 Total Revenues
EXPENDITURES
Current:
- 347,699 9,241,315 General government
- 1,867,142 17,237,927 Public protection
1,781,099 - 7,102,319 Public ways and facilities
- 4,218,517 8,999,912 Health and sanitation
- 4,534,516 4,581,365 Public assistance
- - 39,784 Education
Debt service:
- 647,700 647,700 Principal- 115,754 115,754 Interest and other related costs
- 378,428 378,428 Capital outlay
1,781,099 12,109,756 48,344,504 Total Expenditures
Excess (Deficiency) of Revenues Over
181,335 (858,883) 9,905,447 (Under) Expenditures
OTHER FINANCING SOURCES (USES)
- 2,449,830 4,416,172 Transfers in
- (538,564) (4,640,719) Transfers out
- 1,911,266 (224,547)
Total Other Financing Sources and
(Uses)
181,335 1,052,383 9,680,900 NET CHANGES IN FUND BALANCES
359,321 5,335,872 18,177,113 Fund Balances, Beginning of Year, restated
540,656$ 6,388,255$ 27,858,013$ FUND BALANCE, END OF THE YEAR
See accompanying notes to the basic financial statements.
23

THIS PAGE INTENTIONALLY LEFT BLANK
24
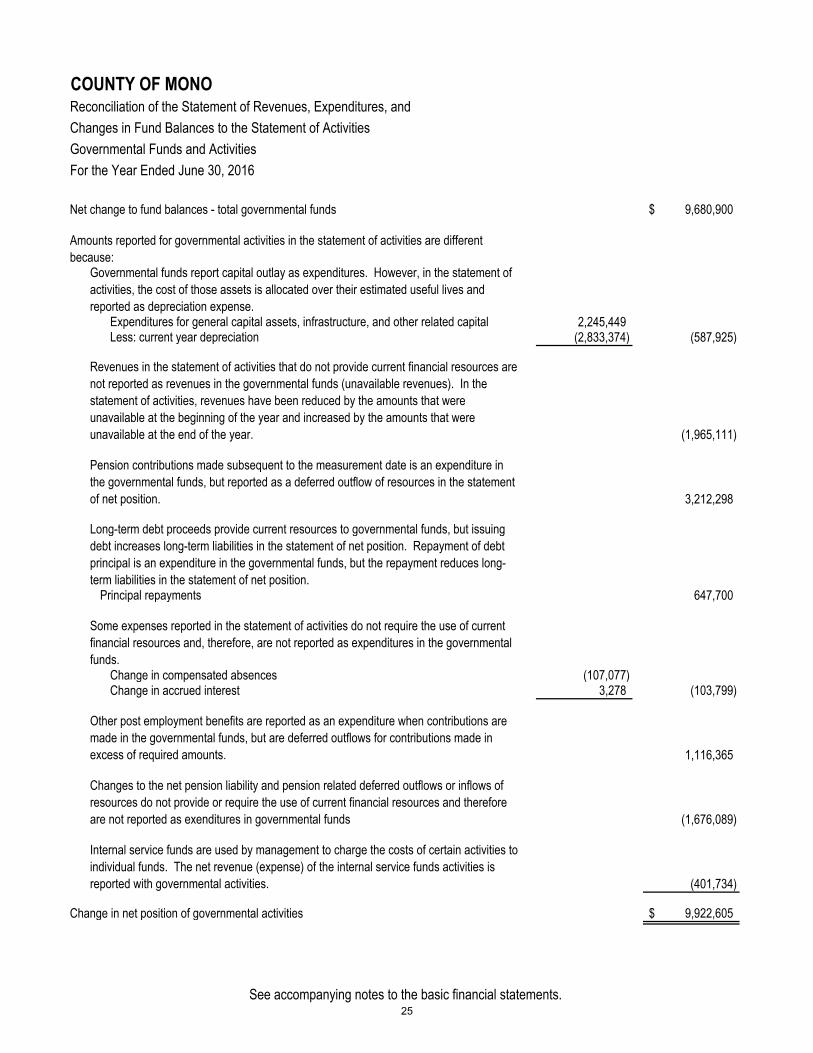
COUNTY OF MONO
Reconciliation of the Statement of Revenues, Expenditures, and
Changes in Fund Balances to the Statement of Activities
Governmental Funds and Activities
For the Year Ended June 30, 2016
Net change to fund balances - total governmental funds 9,680,900$
Amounts reported for governmental activities in the statement of activities are different
because:Governmental funds report capital outlay as expenditures. However, in the statement of
activities, the cost of those assets is allocated over their estimated useful lives and
reported as depreciation expense.Expenditures for general capital assets, infrastructure, and other related capital 2,245,449 Less: current year depreciation (2,833,374) (587,925)
Revenues in the statement of activities that do not provide current financial resources are
not reported as revenues in the governmental funds (unavailable revenues). In the
statement of activities, revenues have been reduced by the amounts that were
unavailable at the beginning of the year and increased by the amounts that were
unavailable at the end of the year. (1,965,111)
Pension contributions made subsequent to the measurement date is an expenditure in
the governmental funds, but reported as a deferred outflow of resources in the statement
of net position. 3,212,298
Long-term debt proceeds provide current resources to governmental funds, but issuing
debt increases long-term liabilities in the statement of net position. Repayment of debt
principal is an expenditure in the governmental funds, but the repayment reduces long-
term liabilities in the statement of net position. Principal repayments 647,700
Some expenses reported in the statement of activities do not require the use of current
financial resources and, therefore, are not reported as expenditures in the governmental
funds.Change in compensated absences (107,077) Change in accrued interest 3,278 (103,799)
Other post employment benefits are reported as an expenditure when contributions are
made in the governmental funds, but are deferred outflows for contributions made in
excess of required amounts. 1,116,365
Changes to the net pension liability and pension related deferred outflows or inflows of
resources do not provide or require the use of current financial resources and therefore
are not reported as exenditures in governmental funds (1,676,089)
Internal service funds are used by management to charge the costs of certain activities to
individual funds. The net revenue (expense) of the internal service funds activities is
reported with governmental activities. (401,734)
Change in net position of governmental activities 9,922,605$
See accompanying notes to the basic financial statements.25

COUNTY OF MONO
Statement of Fund Net Position
Proprietary Funds
June 30, 2016Governmental
Activities
Nonmajor Total Internal
Solid Enterprise Enterprise Service
Waste Airport Funds Funds Funds
ASSETS
Current Assets:
Cash and investments 2,009,458$ 203,022$ 81,817$ 2,294,297$ 965,578$
Cash with fiscal agent 74,430 - - 74,430 62,557
Accounts receivable 288,040 - 455 288,495 -
Due from other governments 16,042 - - 16,042 -
Deposits with others - - - - 2,894,060
Inventory - 2,112 - 2,112 -
Total Current Assets 2,387,970 205,134 82,272 2,675,376 3,922,195
Noncurrent Assets:
Restricted cash in Treasury 3,041,508 - - 3,041,508 -
Capital assets:
Non-depreciable 52,800 233,335 - 286,135 -
Depreciable, net 827,011 5,303,074 - 6,130,085 1,339,509
Total Noncurrent Assets 3,921,319 5,536,409 - 9,457,728 1,339,509
Total Assets 6,309,289 5,741,543 82,272 12,133,104 5,261,704
DEFERRED OUTFLOWS
Deferred amounts related to pensions 59,015 - - 59,015 31,632
LIABILITIES
Current Liabilities:
Accounts payable 105,332 41,433 1,555 148,320 25,084
Salaries and benefits payable 56,359 - - 56,359 20,777
Interest payable 18,737 - - 18,737 -
Advances from other funds 195,000 - - 195,000 -
Refunded certificates of participation 223,300 - - 223,300 -
Loan payable 66,667 - - 66,667 -
Compensated absences 28,050 - - 28,050 -
Claims liability - - - - 1,658,334
Total Current Liabilities 693,445 41,433 1,555 736,433 1,704,195
Noncurrent Liabilities:
Advances from other funds 660,000 - - 660,000 -
Refunded certificates of participation 2,182,700 - - 2,182,700 -
Compensated absences 50,187 - - 50,187 -
Closure and post closure liability 7,029,163 - - 7,029,163 -
Net pension liability 767,312 - - 767,312 240,602
Total Noncurrent Liabilities 10,689,362 - - 10,689,362 240,602
Total Liabilities 11,382,807 41,433 1,555 11,425,795 1,944,797
DEFERRED INFLOWS
Deferred amounts related to pensions 59,341 - - 59,341 18,426
NET POSITION
Net investment in capital assets 813,144 5,536,409 - 6,349,553 1,339,509
Restricted - - 30,222 30,222 -
Unrestricted (5,886,988) 163,701 50,495 (5,672,792) 1,990,604
Total Net Position (5,073,844)$ 5,700,110$ 80,717$ 706,983$ 3,330,113$
Business-Type Activities - Enterprise Funds
See accompanying notes to the basic financial statements.26
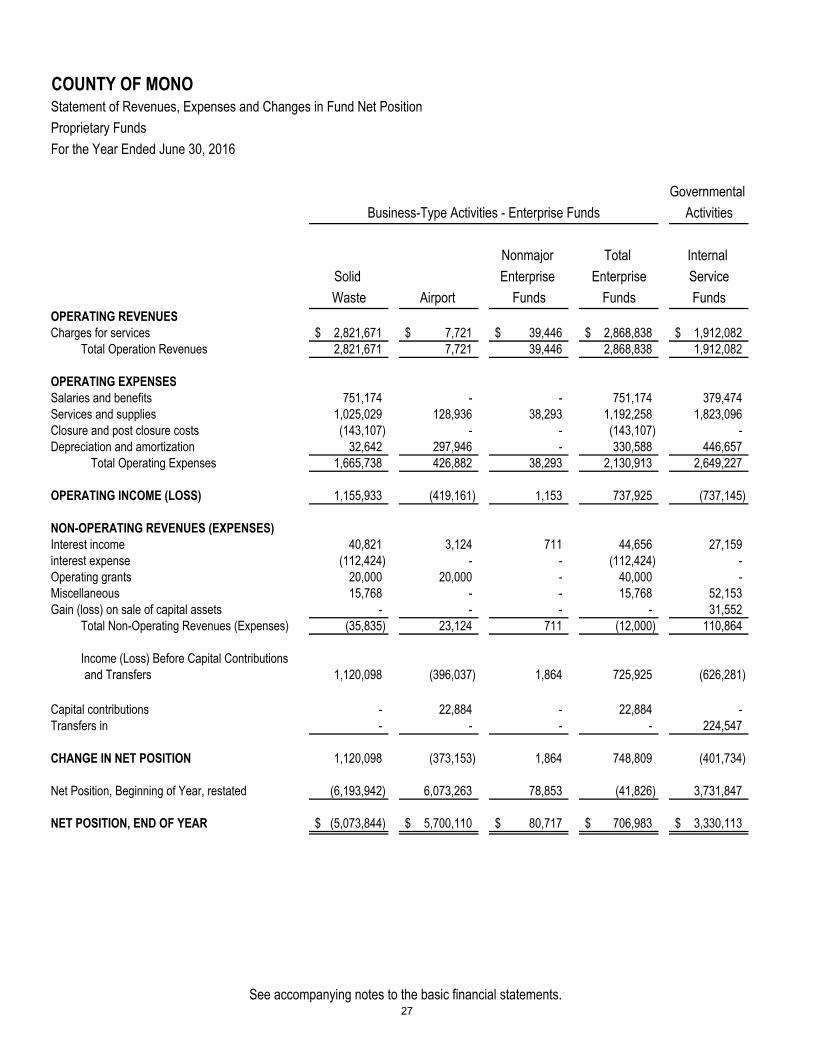
Governmental
Activities
Nonmajor Total Internal
Solid Enterprise Enterprise Service
Waste Airport Funds Funds Funds
OPERATING REVENUES
Charges for services 2,821,671$ 7,721$ 39,446$ 2,868,838$ 1,912,082$ Total Operation Revenues 2,821,671 7,721 39,446 2,868,838 1,912,082
OPERATING EXPENSES
Salaries and benefits 751,174 - - 751,174 379,474 Services and supplies 1,025,029 128,936 38,293 1,192,258 1,823,096 Closure and post closure costs (143,107) - - (143,107) - Depreciation and amortization 32,642 297,946 - 330,588 446,657
Total Operating Expenses 1,665,738 426,882 38,293 2,130,913 2,649,227
OPERATING INCOME (LOSS) 1,155,933 (419,161) 1,153 737,925 (737,145)
NON-OPERATING REVENUES (EXPENSES)
Interest income 40,821 3,124 711 44,656 27,159 interest expense (112,424) - - (112,424) - Operating grants 20,000 20,000 - 40,000 - Miscellaneous 15,768 - - 15,768 52,153 Gain (loss) on sale of capital assets - - - - 31,552
Total Non-Operating Revenues (Expenses) (35,835) 23,124 711 (12,000) 110,864
Income (Loss) Before Capital Contributionsand Transfers 1,120,098 (396,037) 1,864 725,925 (626,281)
Capital contributions - 22,884 - 22,884 - Transfers in - - - - 224,547
CHANGE IN NET POSITION 1,120,098 (373,153) 1,864 748,809 (401,734)
Net Position, Beginning of Year, restated (6,193,942) 6,073,263 78,853 (41,826) 3,731,847
NET POSITION, END OF YEAR (5,073,844)$ 5,700,110$ 80,717$ 706,983$ 3,330,113$
Business-Type Activities - Enterprise Funds
COUNTY OF MONOStatement of Revenues, Expenses and Changes in Fund Net Position
Proprietary Funds
For the Year Ended June 30, 2016
See accompanying notes to the basic financial statements.27

COUNTY OF MONOStatement of Cash Flows
Proprietary Funds
For the Year Ended June 30, 2016Governmental
Activities
Nonmajor Total Internal
Solid Enterprise Enterprise Service
Waste Airport Funds Funds Funds
CASH FLOWS FROM OPERATING ACTIVITIES
Cash receipts from customers 2,856,958$ 7,692$ 38,991$ 2,903,641$ -$
Cash receipts from internal fund services provided - - - - 1,650,854
Cash paid to employees for services (654,308) - - (654,308) (261,121)
Cash paid to suppliers for goods and services (982,349) (88,069) (39,754) (1,110,172) (1,382,794)
Net Cash Provided (Used) by Operating Activities 1,220,301 (80,377) (763) 1,139,161 6,939
CASH FLOWS FROM NONCAPITAL FINANCING ACTIVITIES
Payment on advances from other funds (195,000) - - (195,000) -
Miscellaneous receipts 15,768 - - 15,768 52,153
Operating grants 20,000 20,000 - 40,000 -
Repayment of debt not attributable to capital purposes (214,600) - - (214,600) -
Interest paid (112,424) - - (112,424) -
Net Cash Provided (Used) by Noncapital Financing
Activities (486,256) 20,000 - (466,256) 52,153
CASH FLOWS FROM CAPITAL AND RELATED FINANCING
ACTIVITIES
Capital grants - 22,884 - 22,884 -
Transfers in for capital asset purchases - - - - 224,547
Payments related to the acquisition of capital assets (52,800) - - (52,800) (635,250)
Proceeds from the sale of capital assets - - - - 31,552
Net Cash Provided (Used) by Capital and Related
Financing Activities (52,800) 22,884 - (29,916) (379,151)
CASH FLOWS FROM INVESTING ACTIVITIES
Interest received 40,821 3,124 711 44,656 27,159
Net Cash Provided by Investing Activities 40,821 3,124 711 44,656 27,159
Net Increase (Decrease) in Cash and Cash Equivalents 722,066 (34,369) (52) 687,645 (292,900)
Cash and Cash Equivalents, Beginning of Year 4,403,330 237,391 81,869 4,722,590 1,321,035
Cash and Cash Equivalents, End of Year 5,125,396$ 203,022$ 81,817$ 5,410,235$ 1,028,135$
Reconciliation of Cash and Cash Equivalents
to the Statement of Fund Net Position
Cash and investments 2,009,458$ 203,022$ 81,817$ 2,294,297$ 965,578$
Cash with fiscal agent 74,430 - - 74,430 62,557 Restricted cash in Treasury 3,041,508 - - 3,041,508 -
Total Cash and Cash Equivalents 5,125,396$ 203,022$ 81,817$ 5,410,235$ 1,028,135$
continued
Business-Type Activities - Enterprise Funds
See accompanying notes to the basic financial statements.28

COUNTY OF MONOStatement of Cash Flows (continued)Proprietary Funds For the Year Ended June 30, 2016
Governmental
Activities
Nonmajor Total Internal
Solid Enterprise Enterprise Service
Waste Airport Funds Funds Funds
Reconciliation of Operating Income (Loss)
to Net Cash Provided (Used) by Operating Activities
Operating income (loss) 1,155,933$ (419,161)$ 1,153$ 737,925$ (737,145)$
Adjustment to reconcile operating income (loss) to net cash provided
(used) by operating activities
Depreciation 32,642 297,947 - 330,589 446,657
Changes in assets and liabilities
Receivables 35,287 70 (455) 34,902 -
Deposits with others - - - - 120,244
Deferred outflows (87,249) - - (87,249) (36,379)
Accounts payable 42,680 40,867 (1,461) 82,086 (216,407)
Accrued salaries and benefits 5,419 - - 5,419 1,317
Unearned revenue - (100) - (100) -
Claims liability - - - - 275,237
Closure and postclosure liability (143,107) - - (143,107) -
Liability for compensated absences (6,519) - - (6,519) -
Net pension liability 156,268 - - 156,268 139,903
Deferred inflows 28,947 - - 28,947 13,512
Net Cash Provided (Used) by Operating Activities 1,220,301$ (80,377)$ (763)$ 1,139,161$ 6,939$
Business-Type Activities - Enterprise Funds
See accompanying notes to the basic financial statements.29

COUNTY OF MONO
Statement of Fiduciary Net Position
Fiduciary Funds
June 30, 2016
Investment
Trust Agency
ASSETS
Pooled Cash and investments 38,905,824$ 18,871,947$
Total Assets 38,905,824 18,871,947
LIABILITIES
Agency funds held for others - 18,871,947
Total Liabilities - 18,871,947
NET POSITION
Net position held in trust for investment pool participants 38,905,824 -
Total Net Position 38,905,824$ -$
See accompanying notes to the basic financial statements.30

COUNTY OF MONO
Statement of Changes in Fiduciary Net Position
Fiduciary Funds
For the Year Ended June 30, 2016
Investment
Trust
ADDITIONS
Contributions 67,147,702$
Investment income 351,276
Total Additions 67,498,978
DEDUCTIONS
Distributions 64,862,353
Total Deductions 64,862,353
CHANGE IN NET POSITION 2,636,625
Net Position, Beginning of Year 36,269,199
NET POSITION, END OF THE YEAR 38,905,824$
See accompanying notes to the basic financial statements.31

THIS PAGE INTENTIONALLY LEFT BLANK
32

COUNTY OF MONO Notes to the Basic Financial Statements For the Year Ended June 30, 2016
NOTE 1: SUMMARY OF SIGNIFICANT ACCOUNTING POLICIES
The accounting policies of the County of Mono (the County) conform to accounting principles generally accepted in the United States of America as applicable to governmental entities. The more significant of the County’s accounting policies are described below.
A. The Reporting Entity
The County is a legal subdivision of the State of California whereby it can exercise the powers specified by the constitution and statutes of the State of California. The County operates under an Administrator-Board of Supervisors form of government with legislative and executive control held by an elected five member Board of Supervisors. Major services provided by the County to its citizens include public protection, public ways and facilities, health and sanitation, public assistance, education, culture and recreation, and general services. In addition, the County administers various special districts governed by the Board and provides services to other special districts governed by independent local boards. These special districts are located within the boundaries of the County and were established under various sections of the California Government Code. The County provides fiscal agent and accounting services to many of these districts.
These financial statements present the County (the primary government) and its component units, entities for which the government considers itself financially accountable under the criteria set by Governmental Accounting Standards Board (GASB) Statement No. 61, “Financial Reporting Entity: Omnibus”. Reporting for component units on the County’s financial statements is either blended or discretely presented. Blended component units, although legally separate entities, are in substance, part of the government’s operations because the County’s Board generally is their governing body. Discretely presented component units are reported in a separate column in the government-wide financial statements to emphasize they are legally separate from the County. Each component unit has a June 30th year end.
Blended Component Units
There are four entities which meet the criteria of a blended component unit. These dependent entities are Community Service Districts whose Advisory Boards are governed by the Board of Supervisors. The affected districts are Community Service Area #1 – Crowley; Community Service Area #5 – Bridgeport; and Community Service Area #2 – Benton. The County of Mono Economic Development Corporation is also a blended component unit. The governing body of the Corporation is the County’s governing body. The Corporation was formed to assist with financing public improvements of the County.
Discretely Presented Component Units
There are no entities which meet the criteria of a discretely presented component unit.
B. Basis of Presentation
Government-Wide Financial Statements
The statement of net position and statement of activities display information about the primary government (the County) and its component units. These statements include the financial activities of the overall government, except for fiduciary activities. Eliminations have been made to minimize the double counting of internal activities. These statements distinguish between the governmental and business-type activities of the County. Governmental
33
COUNTY OF MONO Notes to the Basic Financial Statements For the Year Ended June 30, 2016
activities, which normally are supported by taxes and intergovernmental revenues, are reported separately from business-type activities, which rely to a significant extent on fees charged to external parties.
The statement of activities presents a comparison between direct expenses and program revenues for each segment of the business-type activities of the County and for each function of the County’s governmental activities. Direct expenses are those that are specifically associated with a program or function and, therefore, are clearly identifiable to a particular function. Program revenues include 1) charges paid by the recipients of goods or services offered by the programs and 2) grants and contributions that are restricted to meeting the operational or capital requirements of a particular program. Revenues that are not classified as program revenues, including all taxes, are presented instead as general revenues.
Fund Financial Statements
The fund financial statements provide information about the County’s funds, including fiduciary funds and blended component units. Separate statements for each fund category – governmental, proprietary and fiduciary – are presented. The emphasis of fund financial statements is on major governmental and enterprise funds, each displayed in a separate column. All remaining governmental and enterprise funds are separately aggregated and reported as nonmajor funds.
Proprietary fund operating revenues, such as charges for goods or services are provided by the fund as part of its principal activity and result from exchange transactions. Exchange transactions are those in which each party receives and gives up essentially equal values. Nonoperating revenues, such as subsidies and investment earnings, result from nonexchange transactions or ancillary activities. Operating expenses include the costs of providing services and delivering goods. All other expenses not meeting this definition are reported as nonoperating expenses.
The County reports the following major governmental funds:
• The General Fund is the County’s primary operating fund and is used to account for all revenues and expenditures necessary to carry out basic governmental activities of the County that are not accounted for through other funds. For the County, the General Fund includes such activities as public protection, public ways and facilities, health and sanitation, public assistance, education, recreation and cultural services and general administration.
• The Road Fund provides for maintenance and construction of roadways. Revenues consist primarily of the County’s share of state highway users tax supplemented by federal and state funds.
• The Realignment Fund accounts for State realigned revenues generated from sales taxes and vehicle license fees that are restricted to expenditure for specific social, health, mental health and public safety programs..
• The Mental Health Services Act Fund accounts for Proposition 63 funding passed in 2004 to expand and further develop mental health services in the County. It uses state funding to provide services such as wellness center programs, school programs, community garden projects and community social events.
• The Round Fire Fund accounts for transactions related to the Round Fire disaster that occurred in 2015. It is classified as a major fund because this year’s transactions are significant but it is a temporary fund that will be closed out once all transactions relating to the disaster have cleared.
34
COUNTY OF MONO Notes to the Basic Financial Statements For the Year Ended June 30, 2016
The County reports the following major enterprise funds:
• The Solid Waste Fund accounts for revenues and expenses incurred in providing waste collection services at transfer stations throughout the County and waste disposal services at three County landfills. The Division oversees the permitting, monitoring and maintenance of the County’s three active landfills, as well as three closed landfills. The Division also oversees and implements recycling programs throughout the County in an effort to maintain and enhance diversion efforts.
• The Airport Fund accounts for the operation and maintenance of the County’s two airports that include Bryant Field and Lee Vining Airport. Airport operations include applying for and administering grants to complete Airport Capital Improvement Programs and administration of leases and sub-leases on airport property.
The County reports the following additional fund types:
• Internal Service Funds account for financing of goods or services provided by one department to other County departments on a cost reimbursement basis. Activities include the County’s copier pool which purchases and maintains copy machines, technology refresh pool which accounts for the replacement of county desktop computers, laptops, servers and other technology items, self-insurance programs, and the County’s motor pool which purchases and maintains vehicles.
• The Investment Trust Fund accounts for the assets of legally separate entities, which invest in the County Treasurer’s investment pool. These entities include school districts, other special districts governed by local boards, regional boards and authorities and pass through funds for tax collections for the County’s one incorporated town. These funds represent the assets, primarily cash and investments, and the related liability of the County to disburse these monies on demand.
• Agency Funds account for assets held by the County as an agent for various individuals or other local governments. These funds are custodial in nature and do not involve measurement of results or operations. Such funds have no equity accounts since all assets are due to individuals or entities at some future time.
C. Basis of Accounting
The government-wide, proprietary and investment trust fund financial statements are reported using the economic resources measurement focus and the accrual basis of accounting. Revenues are recorded when earned and expenses are recorded at the time liabilities are incurred, regardless of when the related cash flows take place. Nonexchange transactions, in which the County gives (or receives) value without directly receiving (or giving) equal value in exchange, include property and sales taxes, grants, entitlements and donations. On an accrual basis, revenue from property taxes is recognized in the fiscal year for which the taxes are levied. Revenues from sales taxes are recognized when the underlying transactions take place. Revenues from grants, entitlements and donations are recognized in the fiscal year in which all eligible requirements have been satisfied.
Governmental funds are reported using the current financial resources measurement focus and the modified accrual basis of accounting. Under this method, revenues are recognized when measurable and available. Property and sales taxes, interest, certain state and federal grants and charges for services are accrued when their receipt occurs within sixty days after the end of the accounting period so as to be measurable and available. Licenses, permits, fines, forfeitures, and other revenues are recorded as revenues when received in cash because they are generally not measurable until actually received. Expenditures are generally recorded when a liability is incurred, as under accrual accounting. However, debt service expenditures, as well as expenditures related to compensated absences
35
COUNTY OF MONO Notes to the Basic Financial Statements For the Year Ended June 30, 2016
and claims and judgments are recorded only when payment is due. General capital assets acquisitions are reported as expenditures in governmental funds. Proceeds of general long-term debt and capital leases are reported as other financing sources.
Agency funds apply the accrual basis of accounting but do not have a measurement focus.
D. Cash and Investments
The County follows the practice of pooling cash and investments of all funds with the County Treasurer. In accordance with GASB Statement No. 31, “Accounting and Financial Reporting for Certain Investments and External Investment Pools” and GASB Statement No. 72, “Fair Value Measurement and Application”, investments generally are stated at fair value in the statement of net position and balance sheet and the corresponding changes in the fair value of investments are recognized in the year in which the change occurred.
The investment pool includes both voluntary and involuntary participation from external entities. The State of California statutes require certain special districts and other governmental entities to maintain their cash surplus with the County Treasurer.
The fair value of investments is determined annually. Interest earned on pooled investments is apportioned quarterly to certain participating funds based on each fund’s respective average daily balance for that quarter with all remaining interest deposited in the County’s General Fund.
For purpose of the statement of cash flows, the proprietary funds consider all highly liquid investments (including restricted assets) with a maturity of three months or less and pooled cash and investments to be cash equivalents.
E. Restricted Cash and Investments
Restricted assets in the enterprise funds represent cash and investments held to finance closure and postclosure costs as required by state and federal laws and regulations.
F. Inventory
Inventories consist of materials and supplies held for consumption and are valued at cost. Inventory consists of expendable supplies held for consumption. The cost is recorded as expenditures at the time individual inventory items are consumed. Inventories in the governmental funds are equally offset by a corresponding nonspendable fund balance amount, which indicates that inventories do not represent expendable available resources.
G. Receivables, Unavailable Revenue and Unearned Revenue
The County uses a 60-day time period for recognizing accruals in the governmental funds. Management believes its receivables are fully collectible and, accordingly, no allowance for doubtful accounts is included. Governmental funds report unavailable revenue in connection with these receivables not considered available within the 60 day period. Governmental and enterprise funds report unearned revenue in connection with resources received, but eligibility requirements have not been satisfied.
Certain grant revenues are recognized when specific related expenditures have been incurred. In other grant programs, monies are virtually unrestricted as to purpose of expenditure and are only revocable for failure to comply with prescribed compliance requirements. These revenues are recognized at the time of receipt, or earlier if
36

COUNTY OF MONO Notes to the Basic Financial Statements For the Year Ended June 30, 2016
susceptible to accrual criteria is met. Cash received prior to incurrence of the related expenditure is recorded as unearned revenue.
H. Prepaid Expenses/Items and Deposits
Certain payments to vendors reflect costs applicable to future accounting periods and are recorded as prepaid expenses in both the government-wide and fund financial statements. Payments made in advance of the receipt of goods or property is recorded as deposits. The cost of prepaid expense is recorded an expense when consumed rather than when purchased. Prepaid expenses and deposits in the governmental fund financial statements are equally offset by a corresponding nonspendable fund balance amount, which indicates that prepaid expenses and deposits do not represent expendable available resources.
I. Capital Assets
Capital assets include land, land improvements, buildings and improvements, machinery and equipment, infrastructure (e.g. roads, bridges, sidewalks, and similar items), and intangible assets (e.g. land easements and computer software). Assets that are purchased or constructed are reported at historical costs or at estimated historical cost is actual cost is not available. Donated capital assets are valued at their estimated acquisition value on the date of donation.
Normal maintenance and repairs are charged to operations when incurred. Betterments and major improvements that significantly increase values, change capacities or extend useful lives are capitalized. Upon sale or retirement of capital assets, the cost and related accumulated depreciation are removed from the respective accounts and any resulting gain or loss is included in the results of operations.
Capital outlays are recorded as expenditures in the governmental funds and as additions to capital assets in the proprietary and the government-wide financial statements, in accordance with the County’s capitalization policy. The County defines capital assets as assets with an initial, individual cost of more than $5,000 and an estimated useful life in excess of one year. Capital assets used in operations are depreciated or amortized (assets under capital leases) in the government-wide statements and proprietary funds using the straight-line method over the lesser of the capital lease period or their estimated useful lives.
The estimated useful lives are as follows:
Infrastructure 20 to 50 years Structures and improvements 20 to 50 years Equipment 3 to 15 years
The County has four networks of infrastructure assets – roads, lighting, drainage, and flood control.
J. Deferred Outflows/Inflows of Resources
The County recognizes deferred outflows and inflows of resources. A deferred outflow of resources is defined as a consumption of net position that is applicable to a future reporting period. A deferred inflow of resources is defined as an acquisition of net position that is applicable to a future reporting period.
37

COUNTY OF MONO Notes to the Basic Financial Statements For the Year Ended June 30, 2016
K. Net Position/Fund Balance
The government-wide and proprietary fund financial statements utilize a net position presentation. Net position is categorized as follows:
• Net Investment in Capital Assets – This category groups all capital assets, including infrastructure, into one component of net position. Accumulated depreciation and the outstanding balances of debt that are attributable to the acquisition, construction or improvement of these assets reduce the balance in this category.
• Restricted Net Position – This category presents external restrictions imposed by creditors, grantors, contributors or laws or regulations of other governments and restrictions imposed by law through constitutional provisions or enabling legislation.
• Unrestricted Net Position – This category represents net position of the County, not restricted for any project or
other purpose. When both restricted and unrestricted net position are available, the County considers restricted net position to have been depleted before unrestricted net position is applied.
In the fund financial statements, governmental funds report fund balance in the following categories based primarily on the extent to which the county is bound to honor constraints on how specific amounts can be spent:
• Nonspendable fund balance – Amounts that cannot be spent because they are either not in spendable form or are legally or contractually required to remain intact.
• Restricted fund balance – Amounts with constraints placed on their use that are externally imposed by creditors, grantors, contributors, or laws and regulations of other governments. Constraints may also be imposed by law through constitutional provisions or enabling legislation.
• Committed fund balance – Amounts that can only be used for specific purposes determined by formal action of the Board of Supervisors and that remain binding unless removed in the same manner. The underlying action that imposed the limitation needs to occur prior to the end of the reporting period. The amount subject to the constraint may be determined in the subsequent period.
• Assigned fund balance – Amounts that are constrained by the County’s intent to use resources for specific purposes. Intent can be expressed by the Board of Supervisors or by an official or body designated for that purpose. This is also the classification for residual fund balance in all governmental funds other than the General Fund.
• Unassigned fund balance – The residual classification for the County’s General Fund that includes all amounts not contained in the other classifications. In other funds, the unassigned classification is used only if the expenditures incurred for specific purposes exceed the amounts restricted, committed or assigned to those purposes (i.e., deficit fund balance).
The Board of Supervisors establishes, modifies or rescinds fund balance commitments by passage of a resolution or an ordinance, each resulting in equally binding constraints.
38

COUNTY OF MONO Notes to the Basic Financial Statements For the Year Ended June 30, 2016
When both restricted and unrestricted resources are available for use, it is the County’s policy to use restricted resources first, followed by the committed, assigned and unassigned resources as they are needed.
L. Property Tax Revenue
Property taxes, including tax rates, are regulated by the State and are administered locally by the County. The County is responsible for assessing, collecting and distributing property taxes in accordance with state law. The County’s property taxes are levied on July 1 (unsecured roll) and October 1 (secured roll) on assessed values established on the lien date of the previous January 1 for all taxable property located within the County. Taxes are due in one installment (unsecured roll) by July 1 and are subject to late payment penalties if paid after August 31, or two installments (secured roll) due November 1 and February 1, and again subject to late payment penalties if paid after December 10 and April 10, respectively. Additionally, supplemental property taxes are levied on a pro rata basis when changes in assessed valuation occur due to sales transactions or the completion of construction.
All general property taxes are allocated to the various taxing entities per the legislation implementing Article XIII of the California Constitution (commonly referred to as Proposition 13). Property is reappraised from the 1975-76 base year value to current full value upon either (1) a change in ownership or (2) new construction, as of the date of such transaction or completion of construction (only the newly constructed portion of the property is reappraised). General property taxes are based on a flat one percent rate applied to the property’s assessed value. Absence the change in valuation described above, taxable values on properties can rise at a maximum rate of two percent per year. The method of allocation used by the County is subject to review by the State of California. The County recognizes property tax revenues in the period for which the taxes are levied subject to the availability criteria in the governmental funds financial statements.
M. Interfund Transactions
Interfund transactions are reflected as either loans, services provided, reimbursements or transfers. Loans are reported as receivables and payables as appropriate, are subject to elimination upon consolidation and are referred to as either “due to/from other funds” (i.e., the current portion of interfund loans) or “advances to/from other funds” (i.e., the noncurrent portion of interfund loans). Any residual balances outstanding between the governmental activities and the business-type activities are reported in the government-wide financial statements as “internal balances”. Advances between funds, as reported in the fund financial statements, are offset by a nonspendable fund balance amount in the applicable governmental funds to indicate that they are not available for appropriation and are not available financial resources.
Services provided, deemed to be at market or near market rates, are treated as revenues and expenditures/expenses. Reimbursements are when one fund incurs a cost, charges the appropriate benefiting fund and reduces its related cost as a reimbursement. All other interfund transactions are treated as transfers. Transfers between governmental or proprietary funds are netted as part of the reconciliation to the government-wide presentation.
N. Compensated Absences
Under the terms of union contracts, the County grants employees vacation and sick leave in varying amounts depending upon their respective bargaining unit. Vacation pay is subject to certain maximum accumulations and is payable upon termination. Sick leave may be accumulated without limitation and is payable upon termination at varying amounts depending on bargaining unit and length of service.
39
COUNTY OF MONO Notes to the Basic Financial Statements For the Year Ended June 30, 2016
Because vacation, sick leave and other compensated absence balances do not require the use of current financial resources, no liability is recorded within the governmental funds. However, this liability is reflected in the government-wide statement of net position. In proprietary funds, the liability for compensated absences is recorded in the period that the benefits accrue to employees.
O. Pensions
In the government-wide financial statements, pensions are recognized and disclosed using the accrual basis of accounting regardless of the amount recognized as pension expenditures on the modified accrual basis of accounting. The County recognizes a net pension liability for each qualified pension plan in which it participated, which represents the excess of the total pension liability over the fiduciary net position of the qualified pension plan, measured as of the County’s fiscal year-end or the County’s proportionate share thereof in the case of a cost-sharing multiple-employer plan. Changes in the net pension liability during the period are recorded as pension expense, or as deferred inflows or outflows of resources depending on the nature of the change, in the period incurred. Those changes in net pension liability that are recorded as deferred inflows or outflows of resources that arise from changes in actuarial assumptions or other inputs and differences between expected or actual experience are amortized over the weighted average remaining service life of all participants including retires, in the respective qualified pension plan and recorded as a component of pension expense beginning with the period in which they arose. Projected earnings on qualified pension plan investments are recognized as a component of pension expense. Differences between projected and actual investment earnings are reported as deferred inflows or outflows of resources and amortized as a component of pension expense on a closed basis over a five-year period beginning with the period in which the difference occurred. P. Estimates
The preparation of basic financial statements in conformity with generally accepted accounting principles requires management to make estimates and assumptions that affect certain reported amounts and disclosures. Accordingly, actual results could differ from those estimates.
Q. Implementation of New Accounting Pronouncements
The requirements of the following GASB Statements are effective for the purpose of implementation, if applicable to the County, for the fiscal year ended June 30, 2016:
GASB Statement No. 72, Fair Value Measurement and Application, is effective for reporting periods beginning after June 15, 2015 (FY 2015/16). The objective of this Statement is to address accounting and financial reporting issues related to fair value measurements.
GASB Statement No. 73, Accounting and Financial Reporting for Pensions and Related Assets That Are Not within the Scope of GASB Statement 68, and Amendments to Certain Provisions of GASB Statements 67 and 68, is effective for reporting periods beginning after June 15, 2015 (FY 2015/16). The objective of this Statement is to improve the usefulness of information about pensions included in the general-purpose external financial reports of state and local governments for making decisions and assessing accountability. This statement did not impact the County’s financial statements.
40

COUNTY OF MONO Notes to the Basic Financial Statements For the Year Ended June 30, 2016
GASB Statement No. 76, The Hierarchy of Generally Accepted Accounting Principles for State and Local Governments, is effective for reporting periods beginning after June 15, 2015 (FY 2015/16). The objective of this Statement is to identify—in the context of the current governmental financial reporting environment—the hierarchy of generally accepted accounting principles (GAAP).
R. Future Pronouncements
The County is currently analyzing its accounting and financial reporting practices to determine the potential impact on the financial statements of the following GASB Statements:
GASB Statement No. 74, Financial Reporting for Postemployment Benefit Plans Other Than Pension Plans, is effective for reporting periods beginning after June 15, 2016. (FY 2016/17) The objective of this Statement is to improve the usefulness of information about postemployment benefits other than pensions (other postemployment benefits or OPEB) included in the general purpose external financial reports of state and local governmental OPEB plans for making decisions and assessing accountability. GASB Statement No. 75, Accounting and Financial Reporting for Postemployment Benefits Other Than Pensions, is effective for fiscal years beginning after June 15, 2017. (FY 2017/18) The primary objective of this Statement is to improve accounting and financial reporting by state and local governments for postemployment benefits other than pensions (other postemployment benefits or OPEB). It also improves information provided by state and local governmental employers about financial support for OPEB that is provided by other entities. GASB Statement No. 77, Tax Abatement Disclosures, is effective for fiscal years beginning after December 15, 2015. (FY 2016/17) The objective of this Statement is to provide transparency in financial statements prepared by state and local governments in conformity with generally accepted accounting principles, provide citizens and taxpayers, legislative and oversight bodies, municipal bond analysts, and others with information they need to evaluate the financial health of governments, make decisions, and assess accountability. GASB Statement No. 78, Pensions Provided through Certain Multiple-Employer Defined Benefit Pension Plans, is effective for reporting periods beginning after December 15, 2015. (FY 2016/17) The objective of this Statement is to address certain pensions provided through certain multiple-employer defined benefit pension plans and to state or local governmental employers whose employees are provided with such pensions. GASB Statement No. 79, Certain External Investment Pools and Pool Participants, is effective for reporting periods beginning after June 15, 2015, except for the provisions in paragraphs 18, 19, 23–26, and 40, which are effective for reporting periods beginning after December 15, 2015. (FY 2016/17) The objective of this Statement is to address accounting and financial reporting for certain external investment pools and pool participants. It establishes criteria for an external investment pool to qualify for making the election to measure all of its investments at amortized cost for financial reporting purposes. GASB Statement No. 80, Blending Requirements for Certain Component Units—an amendment of GASB Statement No. 14, is effective for reporting periods beginning after June 15, 2016. (FY 2016/17) The objective of this Statement is to improve financial reporting by clarifying the financial statement presentation requirements for certain component units. GASB Statement No. 81, Irrevocable Split-Interest Agreements, is effective for reporting periods beginning after December 15, 2015. (FY 2017/18) The objective of this Statement is to improve accounting and financial reporting
41
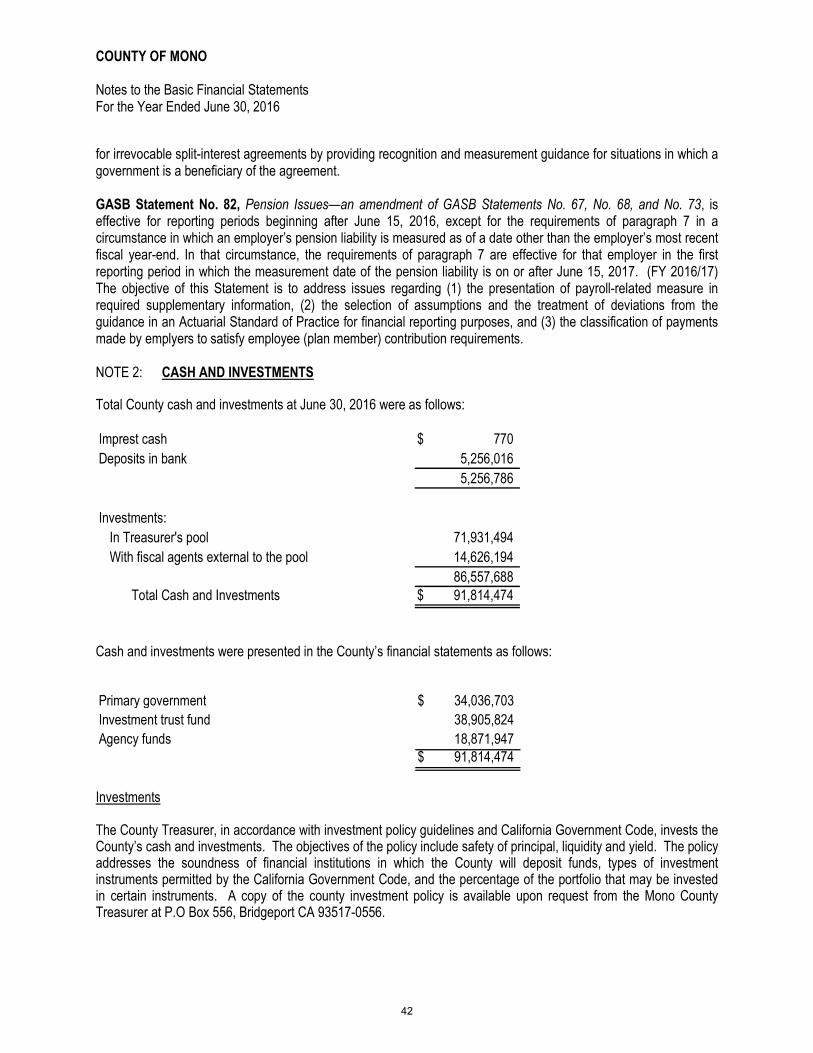
COUNTY OF MONO Notes to the Basic Financial Statements For the Year Ended June 30, 2016
for irrevocable split-interest agreements by providing recognition and measurement guidance for situations in which a government is a beneficiary of the agreement. GASB Statement No. 82, Pension Issues—an amendment of GASB Statements No. 67, No. 68, and No. 73, is effective for reporting periods beginning after June 15, 2016, except for the requirements of paragraph 7 in a circumstance in which an employer’s pension liability is measured as of a date other than the employer’s most recent fiscal year-end. In that circumstance, the requirements of paragraph 7 are effective for that employer in the first reporting period in which the measurement date of the pension liability is on or after June 15, 2017. (FY 2016/17) The objective of this Statement is to address issues regarding (1) the presentation of payroll-related measure in required supplementary information, (2) the selection of assumptions and the treatment of deviations from the guidance in an Actuarial Standard of Practice for financial reporting purposes, and (3) the classification of payments made by emplyers to satisfy employee (plan member) contribution requirements. NOTE 2: CASH AND INVESTMENTS
Total County cash and investments at June 30, 2016 were as follows:
Imprest cash 770$
Deposits in bank 5,256,016
5,256,786
Investments:
In Treasurer's pool 71,931,494
With fiscal agents external to the pool 14,626,194
86,557,688
Total Cash and Investments 91,814,474$
Cash and investments were presented in the County’s financial statements as follows:
Primary government 34,036,703$
Investment trust fund 38,905,824
Agency funds 18,871,947 91,814,474$
Investments The County Treasurer, in accordance with investment policy guidelines and California Government Code, invests the County’s cash and investments. The objectives of the policy include safety of principal, liquidity and yield. The policy addresses the soundness of financial institutions in which the County will deposit funds, types of investment instruments permitted by the California Government Code, and the percentage of the portfolio that may be invested in certain instruments. A copy of the county investment policy is available upon request from the Mono County Treasurer at P.O Box 556, Bridgeport CA 93517-0556.
42

COUNTY OF MONO Notes to the Basic Financial Statements For the Year Ended June 30, 2016
The County investment pool is not registered with the Securities and Exchange Commission as an investment company. The Treasury Oversight Committee has oversight for all monies deposited into the Treasury Pool. The Committee requires an annual audit to ensure the County’s Investment Portfolio complies with its policy and California Government Code Section 53601.
The Board of Supervisors reviews and approves the investment policy annually. The County Treasurer prepares and submits a comprehensive investment report to the Board of Supervisors every quarter. The report covers the type of investments in the pool, maturity dates, par value, actual costs and fair value. The table below identifies the investment types that are authorized for the County by the California Government Code or the County’s investment policy, where more restrictive. The table also identifies certain provisions of the County’s investment policy that address interest rate risk, credit risk, and concentration risk. Not addressed in the table are investments with external agents external to the pool. A separate investment policy governs these investments.
Maximum Maximum
Authorized Maximum Percentage Investment
Investment Type Maturity of Portfolio in One Issuer
Federal Agency Obligations 5 years None None
U.S. Treasury Bills 5 years None NoneLocal Agency Bonds and Obligations 5 years None None
State of California Notes & Bonds 5 years None None
Notes & Bonds of Other 49 States 5 years None None
Supranational Bonds 5 years 30% None
Banker's Acceptances 180 days 40% 30%
Commercial Paper - Selected Agencies 270 days 40% 10%
Commercial or Savings Bank and Credit Union N/A 30% 10%
Negotiable Certificates of Deposit 5 years 30% None
Reverse Repurchase Agreements 92 days 20% None
Medium-Term Corporate Notes 5 years 30% None
Money Market Mutual Funds N/A 20% 10%
Local Agency Investment Fund (LAIF) N/A None NoneCalifornia Asset Management Program N/A None None
At June 30, 2016, the County had the following investments:
Fair WAM
Interest Rates Maturities Par Value (Years)
Investments in Investment Pool
Federal Agency Issues - Coupon .625% - 2.1% 11/01/16-5/24/21 22,000,000$ 21,987,800$ 3.37
Medium Term Corporate Bonds .90% - 2.35% 1/15/17-11/3/20 5,500,000 5,524,026 1.84
Negotiable Certificates of Deposit .50% - 2.25% 7/29/16-5/5/21 10,000,000 9,999,482 2.24
Municipal Bonds .00%-2.096% 10/1/16-8/1/20 5,945,000 5,959,568 1.52
Treasury Loans 1.25% 6/30/2019 198,014 198,014 3.00
LAIF Variable On Demand 28,262,604 28,262,604 0.00Total investments in investment pool 71,905,618$ 71,931,494$ 1.62
Investments outside Investment Pool
Cash held with fiscal agent
Money Market Mutual Funds Variable On Demand 14,626,194$ 14,626,194$
43

COUNTY OF MONO Notes to the Basic Financial Statements For the Year Ended June 30, 2016
Interest Rate Risk
Interest rate risk is the risk that changes in interest rates will adversely affect the fair value of an investment. The general rule is the longer the maturity of an investment, the greater the sensitivity of its fair value to changes in market interest rates. The County manages its exposure to declines in fair values by purchasing a combination of shorter term and longer-term investments and by timing maturities to provide the necessary cash flow and liquidity needed for operations. The benchmark used by the County is to limit the weighted average maturity (WAM) of its investment portfolio to two years or less in accordance with its investment policy.
Credit Risk
Generally, credit risk is the risk that an issuer of an investment will not fulfill its obligation to the holder of the investment. This is measured by the assignment of a rating by a nationally recognized statistical rating organization. State law and the County’s Investment Policy limit investments in commercial paper to the rating of A1 by Standards & Poor’s or P-1 by Moody’s Investors Service. State law and the County’s Investment Policy also limit investments in corporate bonds to the rating of A by Standard & Poor’s and Moody’s Investors Service. The County does not impose credit limits on government agency securities.
Concentration of Credit Risk
The following is a summary of the credit quality distribution and concentration of credit risk by investment type as a percentage of pooled investments at June 30, 2016.
% of
Quality Rating Range Portfolio
Municipal Bonds AAA to A1 8.30%
Federal Agency Issues - Coupon AAA to AA+ 30.60%
Local Agency Investment Fund (LAIF) Unrated 39.11%
Negotiable Certificates of Deposit Unrated 14.03%
Medium Term Corporate Notes AAA to A1 7.69%
Treasury Loans Unrated 0.27%Total 100.00%
The County investment policy contains no limitations on the amount that can be invested in any one issuer beyond that stipulated by the California Government Code. Investments in any one issuer (Other than U.S. Treasury securities, mutual funds or external investment pools) that represent 5 percent or more of the total County pooled investments are as follows:
Issuer Investment Type
Percentage
Holdings Amount
Federal National Mortgage Association Federal Agency Obligations 8.32% 5,982,701$
Federal Home Loan Mortgage Corporation Federal Agency Obligations 12.52% 9,006,204
Federal Farm Credit Banks Federal Agency Obligations 5.56% 3,999,713
44

COUNTY OF MONO Notes to the Basic Financial Statements For the Year Ended June 30, 2016
Custodial Credit Risk
Custodial credit risk for deposits is the risk that, in the event of the failure of a depository financial institution, the County will not be able to recover its deposits or will not be able to recover collateral securities that are in the possession of an outside party. The California Government Code requires that a financial institution secure deposits made by state or local governmental units by pledging securities in an undivided collateral pool held by a depository regulated under state law. The market value of the pledged securities in the collateral pool must equal to at least 110% of the total amount deposited by the public agencies.
The custodial credit risk for investments is the risk that, in the event of the failure of the counterparty to a transaction, a government will not be able to recover the value of its investment or collateral securities that are in possession of another party. The California Government Code and the County’s investment policy do not contain legal or policy requirements that would limit the exposure to custodial credit risk for deposits or investments.
The County considered none of its deposits or investments at June 30, 2016, unnecessarily exposed to custodial credit risk.
Local Agency Investment Fund
The County Treasurer’s Pool maintains an investment in the State of California Local Agency Investment Fund (LAIF). LAIF is part of the Pooled Money Investment Account (PMIA), an investment pool consisting of funds held by the state in addition to those deposited in LAIF. All PMIA funds are managed by the Investment Division of the State Treasurer’s Office. This fund is not registered with the Securities and Exchange Commission as an investment company, but is required to invest according to California Government Code. Participants in the pool include voluntary and involuntary participants, such as special districts and school districts for which there are legal provisions regarding their investments. The Local Investment Advisory Board (Board) has oversight responsibility for LAIF. The Board consists of five members as designated by State Statute. The County’s total investment in the Local Agency Investment Fund (LAIF), managed by the Treasurer for the State of California was $28,262,604. The total amount invested by all public agencies in LAIF at June 30, 2016, was $73.4 billion, the majority of which is invested in non-derivative financial products. The average maturity of PMIA investments was 167 days as of June 30, 2016. The value of pool shares in LAIF, which may be withdrawn, is determined on an amortized cost basis, which is different from the fair value of the pooled treasury’s portion in the pool. County Investment pool Condensed Financial Statements
The following represents a condensed statement of net position and changes in net position for the Treasurer’s investment pool as of and for the fiscal year ended June 30, 2016:
45
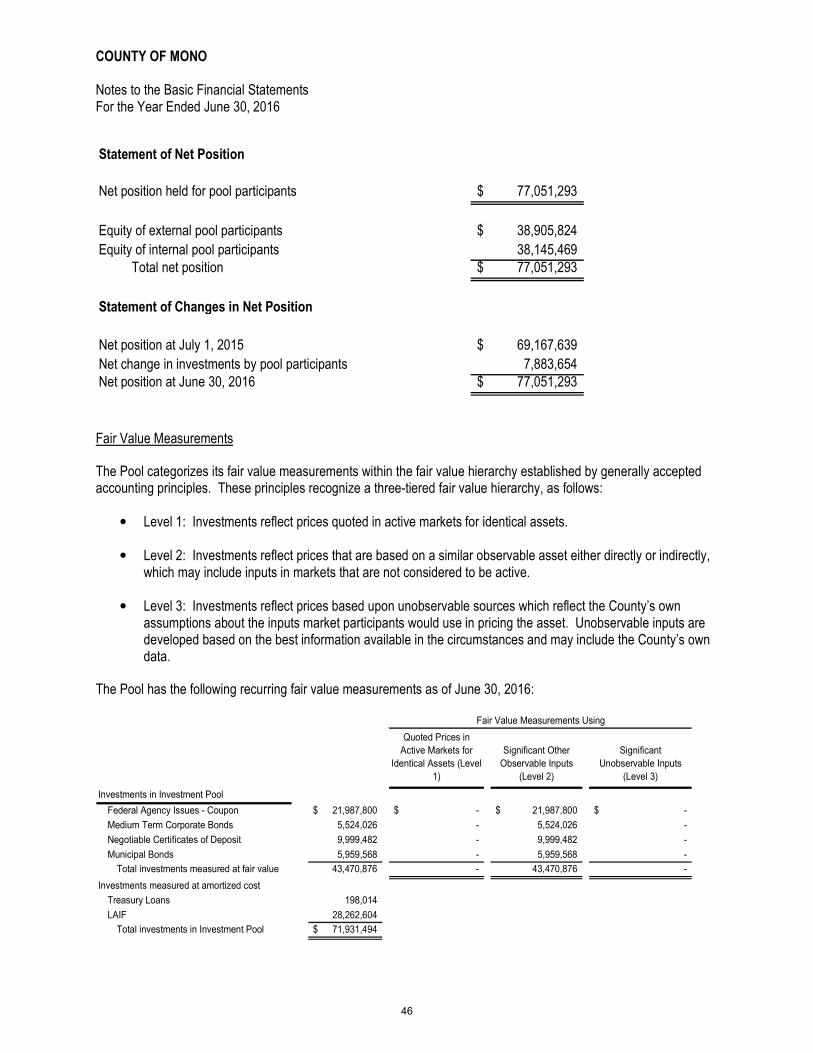
COUNTY OF MONO Notes to the Basic Financial Statements For the Year Ended June 30, 2016
Statement of Net Position
Net position held for pool participants 77,051,293$
Equity of external pool participants 38,905,824$
Equity of internal pool participants 38,145,469Total net position 77,051,293$
Statement of Changes in Net Position
Net position at July 1, 2015 69,167,639$
Net change in investments by pool participants 7,883,654 Net position at June 30, 2016 77,051,293$
Fair Value Measurements
The Pool categorizes its fair value measurements within the fair value hierarchy established by generally accepted accounting principles. These principles recognize a three-tiered fair value hierarchy, as follows:
• Level 1: Investments reflect prices quoted in active markets for identical assets.
• Level 2: Investments reflect prices that are based on a similar observable asset either directly or indirectly, which may include inputs in markets that are not considered to be active.
• Level 3: Investments reflect prices based upon unobservable sources which reflect the County’s own assumptions about the inputs market participants would use in pricing the asset. Unobservable inputs are developed based on the best information available in the circumstances and may include the County’s own data.
The Pool has the following recurring fair value measurements as of June 30, 2016:
Quoted Prices in
Active Markets for
Identical Assets (Level
1)
Significant Other
Observable Inputs
(Level 2)
Significant
Unobservable Inputs
(Level 3)
Investments in Investment Pool
Federal Agency Issues - Coupon 21,987,800$ -$ 21,987,800$ -$
Medium Term Corporate Bonds 5,524,026 - 5,524,026 -
Negotiable Certificates of Deposit 9,999,482 - 9,999,482 -
Municipal Bonds 5,959,568 - 5,959,568 -
Total investments measured at fair value 43,470,876 - 43,470,876 -
Investments measured at amortized cost
Treasury Loans 198,014
LAIF 28,262,604
Total investments in Investment Pool 71,931,494$
Fair Value Measurements Using
46

COUNTY OF MONO Notes to the Basic Financial Statements For the Year Ended June 30, 2016
NOTE 3: INTERFUND TRANSACTIONS
The composition of interfund balances as of June 30, 2016, is as follows:
Due to/from other funds:
Receivable Fund Payable Fund Amount
General Fund Nonmajor Governmental Funds 9,268$
Road General Fund 51,896
Nonmajor Governmental Funds Nonmajor Governmental Funds 107,253
168,417$
The above balances reflect temporary loans to cover cash deficits at June 30 and the time lag between the dates when transactions are recorded and payments are made between funds.
Advances to/from other funds:
Advances to/from other funds represent interfund loans not anticipated to be paid within the subsequent year.
Receivable Fund Payable Fund Amount
General Fund Solid Waste Fund 855,000$
855,000$
The above represents two interest-free loans provided to the Solid Waste Fund. During the 2010/11 budget year, the Board of Supervisors approved an interest-free loan to the Mono County Solid Waste Enterprise Fund of $1,200,000, as the Solid Waste Enterprise Fund reorganized and adjusted expenses and revenues (fee restructure). Repayment is amortized over ten (10) years, with zero percent (0%) interest and a repayment amount of $30,000 quarterly, or $120,000 annually. Final payment is scheduled for June 30, 2020. The balance of this loan as of June 30, 2016, was $480,000.
The Board of Supervisors approved a second loan during the 2011/12 budget year for $750,000. Repayment term is amortized over ten (10) years, with zero percent (0%) interest and a repayment amount of $18,750 quarterly, or $75,000 annually. Final payment is scheduled for June 30, 2021. The balance of this loan as of June 30, 2016, was $375,000.
47

COUNTY OF MONO Notes to the Basic Financial Statements For the Year Ended June 30, 2016
Transfers:
Transfers are indicative of funding for capital projects, debt service, subsidies of various County operations and re-allocations of special revenues.
Transfer from Transfer to Amount
General Fund Road 615,000$
Nonmajor Governmental Funds 1,500,831
2,115,831
Realignment Fund General Fund 1,177,102
Nonmajor Governmental Funds 809,222
1,986,324
Nonmajor Governmental General Fund 174,240
Funds Nonmajor Governmental Funds 139,777
Internal Service Funds 224,547
538,564 Total 4,640,719$
48

COUNTY OF MONO Notes to the Basic Financial Statements For the Year Ended June 30, 2016
NOTE 4: CAPITAL ASSETS
Capital asset activity for the year ended June 30, 2016, was as follows:
Balance Balance
July 1, 2015 Additions Transfers Retirements June 30, 2016
Governmental Activities
Capital assets, not being depreciated:
Land 6,793,617$ --$ --$ --$ 6,793,617$
Construction in progress 4,171,194 513,214 (2,707,432) -- 1,976,976
Total capital assets, not being depreciated 10,964,811 513,214 (2,707,432) -- 8,770,593
Capital assets, being depreciated:
Infrastructure 89,814,386 1,690,413 2,249,259 -- 93,754,058
Structures and improvements 18,100,383 18,927 458,173 -- 18,577,483
Equipment 17,322,582 658,144 -- (705,541) 17,275,185
Intangibles 1,148,577 -- -- -- 1,148,577
Total capital assets, being depreciated 126,385,928 2,367,484 2,707,432 (705,541) 130,755,303
Less accumulated depreciation for:
Infrastructure (76,382,172) (2,102,125) -- -- (78,484,297)
Structures and improvements (7,900,098) (481,655) -- -- (8,381,753)
Equipment (14,512,264) (675,492) -- 705,541 (14,482,215)
Intangibles (1,098,736) (20,758) -- -- (1,119,494)
Total accumulated depreciation (99,893,270) (3,280,030) -- 705,541 (102,467,759)
Total capital assets, being depreciated, net 26,492,658 (912,546) 2,707,432 -- 28,287,544
Governmental activities capital assets, net 37,457,469$ (399,332)$ --$ --$ 37,058,137$
Business-Type Activities
Capital assets, not being depreciated:
Land 233,335$ 52,800$ --$ --$ 286,135$
Total capital assets, not being depreciated 233,335 52,800 -- -- 286,135
Capital assets, being depreciated:
Structures and improvements 7,730,944 -- -- -- 7,730,944
Equipment 1,532,463 -- -- -- 1,532,463
Total capital assets, being depreciated 9,263,407 -- -- -- 9,263,407
Less accumulated depreciation for:
Structures and improvements (1,254,398) (328,887) -- -- (1,583,285)
Equipment (1,548,335) (1,702) -- -- (1,550,037)
Total accumulated depreciation (2,802,733) (330,589) -- -- (3,133,322)
Total capital assets, being depreciated, net 6,460,674 (330,589) -- -- 6,130,085
Business-type activities capital assets, net 6,694,009$ (277,789)$ --$ --$ 6,416,220$
49
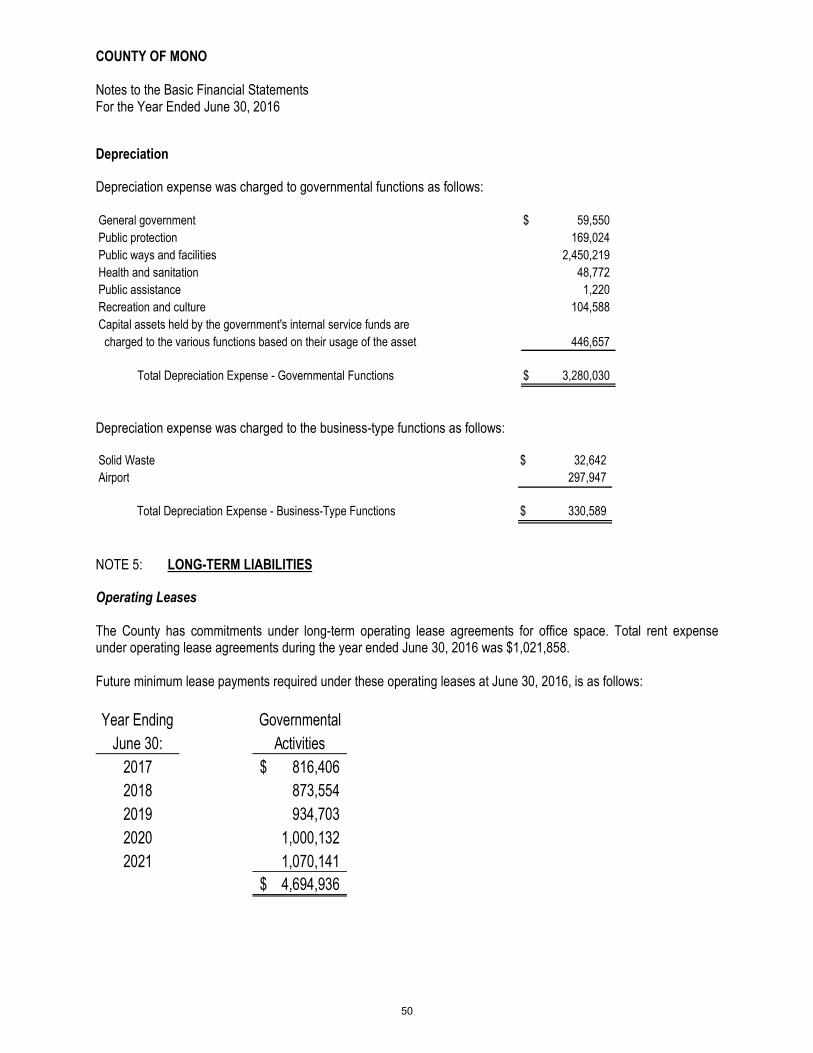
COUNTY OF MONO Notes to the Basic Financial Statements For the Year Ended June 30, 2016
Depreciation
Depreciation expense was charged to governmental functions as follows:
General government 59,550$
Public protection 169,024
Public ways and facilities 2,450,219
Health and sanitation 48,772
Public assistance 1,220
Recreation and culture 104,588
Capital assets held by the government's internal service funds are
charged to the various functions based on their usage of the asset 446,657
Total Depreciation Expense - Governmental Functions 3,280,030$
Depreciation expense was charged to the business-type functions as follows:
Solid Waste 32,642$
Airport 297,947
Total Depreciation Expense - Business-Type Functions 330,589$
NOTE 5: LONG-TERM LIABILITIES
Operating Leases The County has commitments under long-term operating lease agreements for office space. Total rent expense under operating lease agreements during the year ended June 30, 2016 was $1,021,858. Future minimum lease payments required under these operating leases at June 30, 2016, is as follows:
Year Ending Governmental
June 30: Activities
2017 816,406$
2018 873,554
2019 934,703
2020 1,000,132
2021 1,070,141
4,694,936$
50
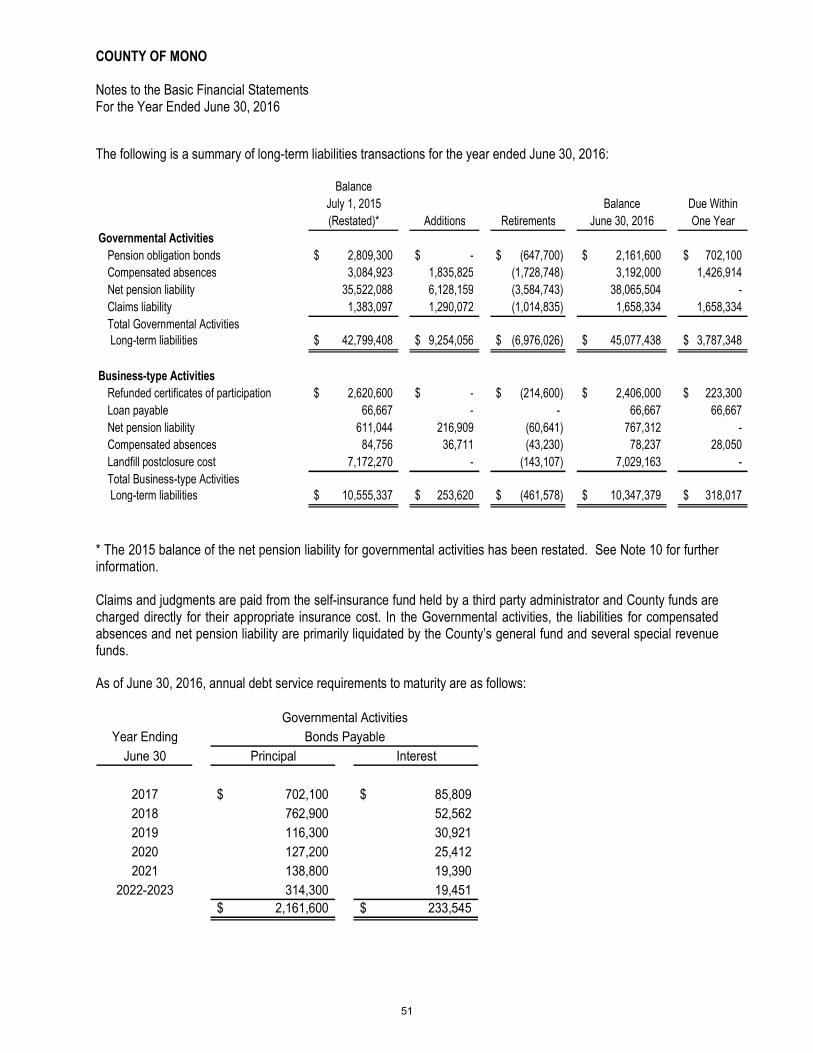
COUNTY OF MONO Notes to the Basic Financial Statements For the Year Ended June 30, 2016
The following is a summary of long-term liabilities transactions for the year ended June 30, 2016:
Balance
July 1, 2015 Balance Due Within
(Restated)* Additions Retirements June 30, 2016 One Year
Governmental Activities
Pension obligation bonds 2,809,300$ -$ (647,700)$ 2,161,600$ 702,100$
Compensated absences 3,084,923 1,835,825 (1,728,748) 3,192,000 1,426,914
Net pension liability 35,522,088 6,128,159 (3,584,743) 38,065,504 -
Claims liability 1,383,097 1,290,072 (1,014,835) 1,658,334 1,658,334
Total Governmental Activities Long-term liabilities 42,799,408$ 9,254,056$ (6,976,026)$ 45,077,438$ 3,787,348$
Business-type Activities
Refunded certificates of participation 2,620,600$ -$ (214,600)$ 2,406,000$ 223,300$
Loan payable 66,667 - - 66,667 66,667
Net pension liability 611,044 216,909 (60,641) 767,312 -
Compensated absences 84,756 36,711 (43,230) 78,237 28,050
Landfill postclosure cost 7,172,270 - (143,107) 7,029,163 -
Total Business-type Activities Long-term liabilities 10,555,337$ 253,620$ (461,578)$ 10,347,379$ 318,017$
* The 2015 balance of the net pension liability for governmental activities has been restated. See Note 10 for further information. Claims and judgments are paid from the self-insurance fund held by a third party administrator and County funds are charged directly for their appropriate insurance cost. In the Governmental activities, the liabilities for compensated absences and net pension liability are primarily liquidated by the County’s general fund and several special revenue funds.
As of June 30, 2016, annual debt service requirements to maturity are as follows:
Year Ending
June 30 Principal Interest
2017 702,100$ 85,809$
2018 762,900 52,562
2019 116,300 30,921
2020 127,200 25,412
2021 138,800 19,390
2022-2023 314,300 19,451
2,161,600$ 233,545$
Governmental Activities
Bonds Payable
51
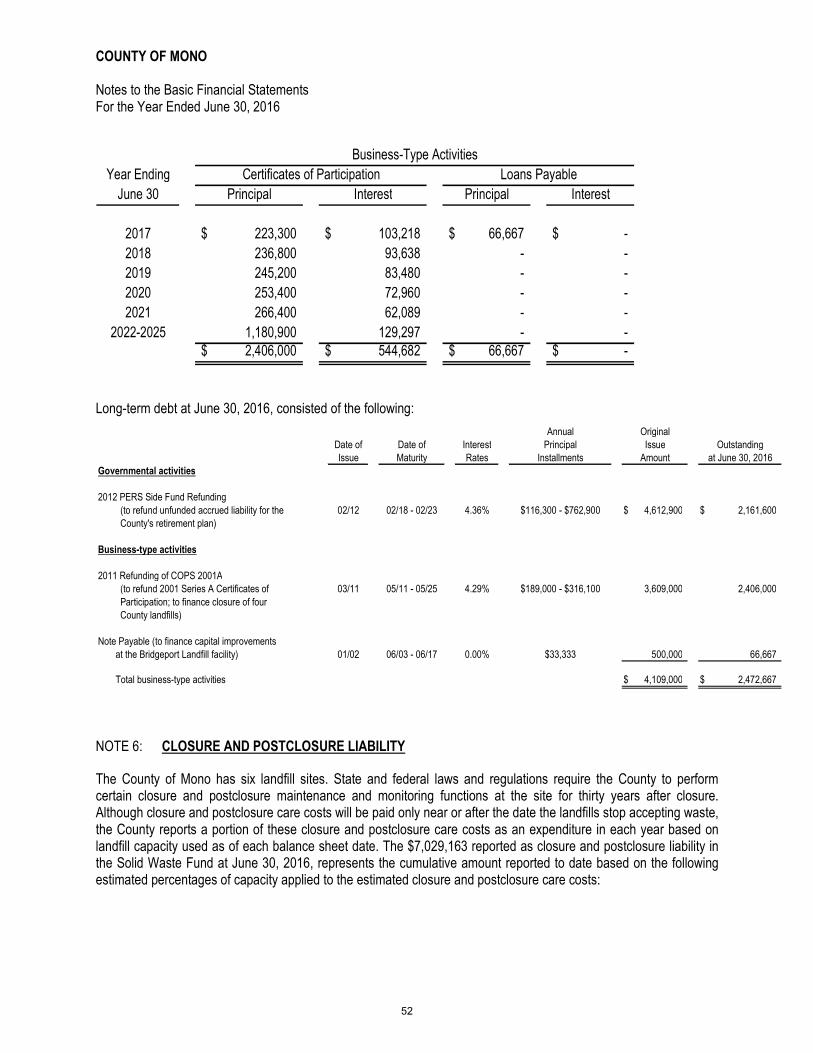
COUNTY OF MONO Notes to the Basic Financial Statements For the Year Ended June 30, 2016
Business-Type Activities
Year Ending Certificates of Participation Loans Payable
June 30 Principal Interest Principal Interest
2017 223,300$ 103,218$ 66,667$ -$
2018 236,800 93,638 - -
2019 245,200 83,480 - -
2020 253,400 72,960 - -
2021 266,400 62,089 - -
2022-2025 1,180,900 129,297 - - 2,406,000$ 544,682$ 66,667$ -$
Long-term debt at June 30, 2016, consisted of the following:
Annual Original
Date of Date of Interest Principal Issue Outstanding
Issue Maturity Rates Installments Amount at June 30, 2016
Governmental activities
2012 PERS Side Fund Refunding
(to refund unfunded accrued liability for the 02/12 02/18 - 02/23 4.36% $116,300 - $762,900 4,612,900$ 2,161,600$
County's retirement plan)
Business-type activities
2011 Refunding of COPS 2001A
(to refund 2001 Series A Certificates of 03/11 05/11 - 05/25 4.29% $189,000 - $316,100 3,609,000 2,406,000
Participation; to finance closure of four
County landfills)
Note Payable (to finance capital improvements
at the Bridgeport Landfill facility) 01/02 06/03 - 06/17 0.00% $33,333 500,000 66,667
Total business-type activities 4,109,000$ 2,472,667$
NOTE 6: CLOSURE AND POSTCLOSURE LIABILITY
The County of Mono has six landfill sites. State and federal laws and regulations require the County to perform certain closure and postclosure maintenance and monitoring functions at the site for thirty years after closure. Although closure and postclosure care costs will be paid only near or after the date the landfills stop accepting waste, the County reports a portion of these closure and postclosure care costs as an expenditure in each year based on landfill capacity used as of each balance sheet date. The $7,029,163 reported as closure and postclosure liability in the Solid Waste Fund at June 30, 2016, represents the cumulative amount reported to date based on the following estimated percentages of capacity applied to the estimated closure and postclosure care costs:
52

COUNTY OF MONO Notes to the Basic Financial Statements For the Year Ended June 30, 2016
Estimated Estimated Estimated Landfill
Total Remaining Capacity Percentage of Closure and
Estimated Estimated Total Capacity Capacity Used Capacity Used Postclosure
Closure Postclosure Estimated (Cubic (Cubic (Cubic through Liability at
Landfill Site Costs Costs Cost Yards) Yards) Yards) June 30, 2016 June 30, 2016
Benton Crossing $ 4,546,436 $ 2,165,269 $ 6,711,705 2,253,100 959,936 1,293,164 57.39% $ 3,852,175
Pumice Valley 1,335,167 1,554,020 2,889,187 347,112 231,572 115,540 33.29% 961,696
Walker 1,547,582 1,165,596 2,713,177 340,716 276,398 64,318 18.88% 512,176
Benton* -- 753,485 753,485 -- -- -- 0.00% 514,500
Bridgeport* -- 931,861 931,861 -- -- -- 0.00% 666,600
Chalfant* -- 729,743 729,743 -- -- -- 0.00% 522,016
Total $ 7,429,185 $ 7,299,974 $ 14,729,158 $ 2,940,928 $ 1,467,906 $ 1,473,022 50.09% $ 7,029,163
* Landfills are closed and tracking of statistics is no longer required or useful.
The County will recognize the remaining estimated cost of closure and postclosure care of $7,699,995 as the remaining estimated capacity is filled. These amounts are based on what it would cost to perform all closure and post-closure care in 2016. Actual costs may be higher due to inflation, change in technology, or changes in regulations.
The County is required by state and federal laws and regulations to make annual contributions to a trust or pledge future revenues to finance closure and postclosure costs. At June 30, 2016, cash and investments of $3,041,508 were held as restricted cash for these purposes. The County expects that future inflation costs will be paid from interest earnings on these annual contributions. However, if interest earnings are inadequate or additional postclosure care requirements are determined (due to changes in technology or applicable laws or regulations, for example) these costs may need to be covered by charges to future landfill users or from future tax revenues. The County has elected to utilize the Pledge of Revenue financial assurance mechanism.
NOTE 7: DEFINED BENEFIT PENSION PLAN
Plan Description All qualified permanent and probationary employees of Mono County and Mono County Superior Court (non-judicial employees) are eligible to participate in the County’s separate Safety (sheriff, emergency medical services and certain district attorney members) or Miscellaneous (all others) Plans. The County’s Safety Plan is a cost-sharing multiple-employer defined benefit plan while the Miscellaneous Plan is an agent multiple-employer defined benefit pension plan. The County’s Safety and Miscellaneous Plans are part of the California Public Employees Retirement System (CalPERS), a public employee retirement system that acts as a common investment and administrative agent for participating public entities within the State of California. Benefit provisions and other requirements are established by State statute and County resolution. CalPERS issues publicly available reports that include a full description of the pension plans regarding benefit provisions, assumptions and membership information that can be found on the CalPERS website.
Benefits Provided CalPERs provides service retirement and disability benefits, annual cost of living adjustments and death benefits to plan members upon retirement, disability or death of members. Retirement benefits are based on years of service, final average compensation, and retirement age. Employees terminating before accruing five years of retirement service credit forfeit the right to receive retirement benefits unless they establish reciprocity with another public
53
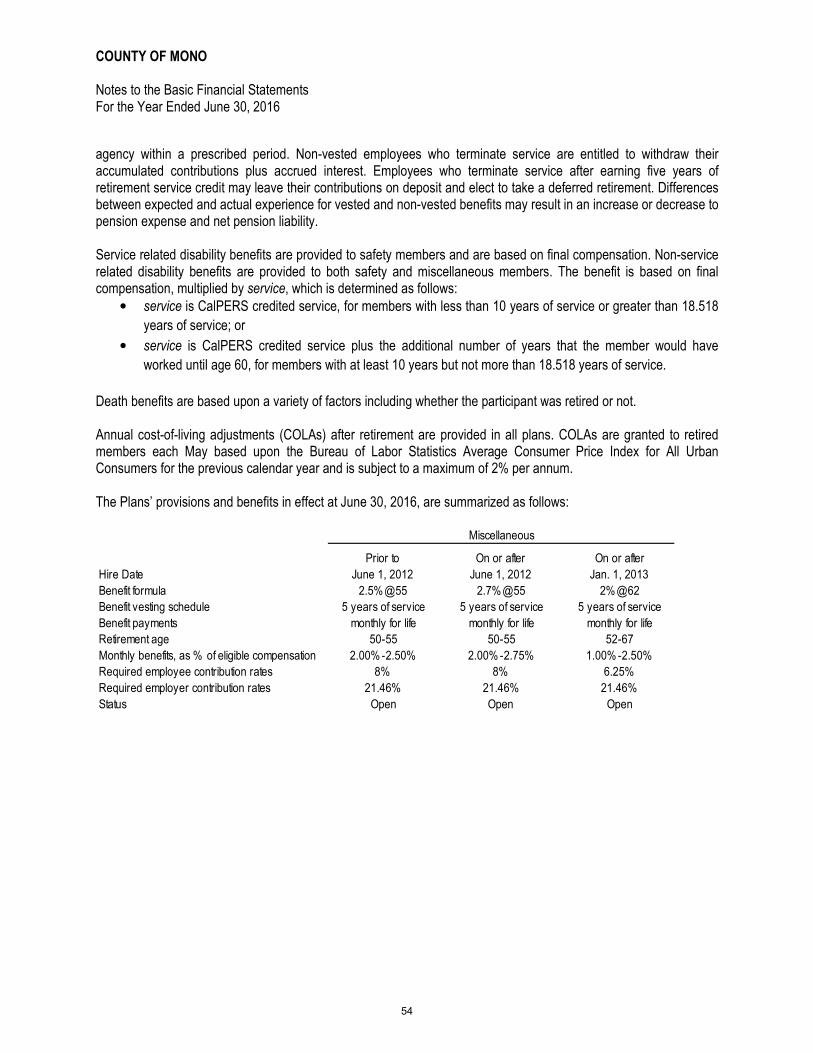
COUNTY OF MONO Notes to the Basic Financial Statements For the Year Ended June 30, 2016
agency within a prescribed period. Non-vested employees who terminate service are entitled to withdraw their accumulated contributions plus accrued interest. Employees who terminate service after earning five years of retirement service credit may leave their contributions on deposit and elect to take a deferred retirement. Differences between expected and actual experience for vested and non-vested benefits may result in an increase or decrease to pension expense and net pension liability. Service related disability benefits are provided to safety members and are based on final compensation. Non-service related disability benefits are provided to both safety and miscellaneous members. The benefit is based on final compensation, multiplied by service, which is determined as follows:
• service is CalPERS credited service, for members with less than 10 years of service or greater than 18.518
years of service; or
• service is CalPERS credited service plus the additional number of years that the member would have
worked until age 60, for members with at least 10 years but not more than 18.518 years of service.
Death benefits are based upon a variety of factors including whether the participant was retired or not. Annual cost-of-living adjustments (COLAs) after retirement are provided in all plans. COLAs are granted to retired members each May based upon the Bureau of Labor Statistics Average Consumer Price Index for All Urban Consumers for the previous calendar year and is subject to a maximum of 2% per annum. The Plans’ provisions and benefits in effect at June 30, 2016, are summarized as follows:
Miscellaneous
Hire Date
Prior to
June 1, 2012
On or after
June 1, 2012
On or after
Jan. 1, 2013
Benefit formula 2.5%@55 2.7%@55 2%@62
Benefit vesting schedule 5 years of service 5 years of service 5 years of service
Benefit payments monthly for life monthly for life monthly for life
Retirement age 50-55 50-55 52-67
Monthly benefits, as % of eligible compensation 2.00%-2.50% 2.00%-2.75% 1.00%-2.50%
Required employee contribution rates 8% 8% 6.25%
Required employer contribution rates 21.46% 21.46% 21.46%
Status Open Open Open
54

COUNTY OF MONO Notes to the Basic Financial Statements For the Year Ended June 30, 2016
Safety
County Sheriff Fire
Peace Officer Sheriff Tier II Tier I
Hire Date
Prior to
Jan. 1, 2013
Prior to
Jan. 1, 2013
On or after
Dec. 27, 2012
Prior to
July 1, 2007
Benefit formula 3%@50 3%@50 3%@55 3%@50
Benefit vesting schedule 5 years of service 5 years of service 5 years of service 5 years of service
Benefit payments monthly for life monthly for life monthly for life monthly for life
Retirement age 50 50 55 50
Monthly benefits, as % of eligible compensation 3.00% 3.00% 3.00% 3.00%
Required employee contribution rates 11.50% 9.00% 11.50% 9.00%
Required employer contribution rates 27.85% 28.10% 15.43% 27.85%
Status Open Open Open Open
Fire Pepra-Safety Pepra-Safety Pepra-Safety
Tier II Peace Officer Sheriff Fire
Hire Date
On or after
July 1, 2007/
Prior to
Jan. 1, 2013
On or after
Jan 1. 2013
On or after
Jan 1. 2013
On or after
Jan 1. 2013
Benefit formula 2%@50 2.7%@57 2.7%@57 2.7%@57
Benefit vesting schedule 5 years of service 5 years of service 5 years of service 5 years of service
Benefit payments monthly for life monthly for life monthly for life monthly for life
Retirement age 50 57 57 57
Monthly benefits, as % of eligible compensation 2.00% 2.70% 2.70% 2.70%
Required employee contribution rates 9.00% 11.50% 11.50% 11.50%
Required employer contribution rates 20.92% 11.50% 11.50% 11.50%
Status Open Open Open Open
Employees Covered At June 30, 2016, the following employees were covered by the benefit terms for the Miscellaneous Plan. The corresponding data is not available for employees included in the Safety Plan as the plan is a cost-sharing multiple employer plan:
Miscellaneous
Inactive employees or beneficiaries currently receiving benefits 297
Inactive employees entitled to but not yet receiving benefits 197
Active employees 203
697
Contributions Section 20814(c) of the California Public Employees’ Retirement Law requires the employer contribution rates for all public employers be determined on an annual basis by the actuary and shall be effective on the July 1 following notice of a change in the rate. Funding contributions for all Plans are determined annually on an actuarial basis as of June 30 by CalPERS. The actuarially determined rate is the estimated amount necessary to finance the costs of benefits earned by employees during the year, with an additional amount to finance any unfunded accrued liability. The County is required to contribute the difference between the actuarially determined rate and the contribution rate of employees.
55

COUNTY OF MONO Notes to the Basic Financial Statements For the Year Ended June 30, 2016
For the year ended June 30, 2016, contributions recognized as part of pension expense for the plan were as follows:
Total Miscellaneous Safety
Governmental activities:
Governmental funds 3,574,749$ 2,365,922$ 1,208,827$
Motor Pool ISF 9,994 9,994 -
Total governmental activities 3,584,743 2,375,916 1,208,827
Business type activities
Solid Waste fund 60,641 60,641 -
3,645,384$ 2,436,557$ 1,208,827$
Pension Liabilities As of June 30, 2016, the County reported net pension liabilities for its proportionate shares of the net pension liability of each Plan as follows:
Total Miscellaneous Safety
Governmental Activities:
Governmental funds 37,824,902$ 24,238,162$ 13,586,740$
Motor Pool ISF 240,602 240,602 -
Total governmental activities 38,065,504 24,478,764 13,586,740
Business type activities
Solid Waste fund 767,312 767,312 -
Total Mono County 38,832,816 25,246,076$ 13,586,740$
Courts 1,660,535
40,493,351$
The County’s net pension liability for the Miscellaneous Plan is the plan’s liability accounted for separately from all other CalPERS plans. The County’s net pension liability for the Safety Plan is the Plan’s proportionate share of the net pension liability. The net pension liability of each Plan is measured as the total pension liability, less the pension plan’s fiduciary net position. The net pension liability of each of the Plans is measured as of June 30, 2015, using an annual actuarial valuation as of June 30, 2014 rolled forward to June 30, 2015 using standard update procedures. For the Safety Plan (a cost-sharing plan), the County’s proportion of the net pension liability was based on a projection of the County’s long-term share of contributions to the pension plans relative to the projected contributions of all participating employers, actuarially determined. The County’s net pension liability and related Plan proportion for the Safety Plan is as follows:
56

COUNTY OF MONO Notes to the Basic Financial Statements For the Year Ended June 30, 2016
Plan
Plan's Proportion to
Total Pool @ June 30,
2014
Plan's Proportion to
Total Pool @ June 30,
2015
Plan's Proportionate
Share of Net Pension
Liability
Safety
County Peace Officer 0.05989% 0.10745% 4,427,280$
PEPRA - Safety Peace Officer 0.00000% -0.00001% (330)
Fire Tier I 0.03757% 0.06733% 2,774,260
Fire Tier II 0.00111% 0.00138% 56,922
PEPRA - Fire 0.00000% 0.00000% (49)
Sheriff 0.08755% 0.15401% 6,345,936
Sheriff Tier II 0.00000% -0.00041% (17,072)
PEPRA - Safety Sheriff 0.00000% -0.00050% (207)
13,586,740$
Actuarial Assumptions The total pension liabilities in the June 30, 2014 actuarial valuations were determined using the following actuarial assumptions:
Miscellaneous Safety
Valuation Date June 30, 2014 June 30, 2014
Measurement Date June 30, 2015 June 30, 2015
Actuarial Cost Method
Actuarial Assumptions:
Discount Rate 7.65% 7.65%
Inflation 2.75% 2.75%
Payroll Growth 3.00% 3.00%
Projected Salary Increase
Investment Rate of Return 7.50%(1)
7.50%(1)
Mortality
(1) Net of pension plan investment expenses, including inflation.
Entry-Age Normal Cost Method
Varies by entry age and service
Derived using CalPERS' Membership Data
for All Funds
The underlying mortality assumptions and all other actuarial assumptions used in the June 30, 2014 valuation were based on the results of the 2010 actuarial experience study for the period 1997 to 2007. Further details of the Experience Study can be found on the CalPERS website. Discount Rate The discount rate used to measure the total pension liability was 7.65% for each Plan. To determine whether the municipal bond rate should be used in the calculation of a discount rate for each plan, CalPERS stress tested plans that would most likely result in a discount rate that would be different from the actuarially assumed discount rate.
57

COUNTY OF MONO Notes to the Basic Financial Statements For the Year Ended June 30, 2016
Based on the testing, none of the tested plans ran out of assets. Therefore, the current 7.65 percent discount rate is adequate and the use of the municipal bond rate calculation is not necessary. The long term expected discount rate of 7.65 percent will be applied to all plans in the Public Employees Retirement Fund (PERF). The stress test results are presented in a detailed report that can be obtained from the CalPERS website. According to Paragraph 30 of Statement 68, the long-term discount rate should be determined without reduction for pension plan administrative expense. The 7.50 percent investment return assumption used in this accounting valuation is net of administrative expenses. Administrative expenses are assumed to be 15 basis points. An investment return excluding administrative expenses would have been 7.65 percent. Using this lower discount rate has resulted in a slightly higher Total Pension Liability and Net Pension Liability. CalPERS checked the materiality threshold for the difference in calculation and did not find it to be a material difference. CalPERS is scheduled to review all actuarial assumptions as part of its regular Asset Liability Management (ALM) review cycle that is scheduled to be completed in February 2018. Any changes to the discount rate will require Board action and proper stakeholder outreach. For these reasons, CalPERS expects to continue using a discount rate net of administrative expenses for GASB 67 and 68 calculations through at least the 2017-2018 fiscal year. CalPERS will continue to check the materiality of the difference in calculation until there is a change in methodology. The long-term expected rate of return on pension plan investments was determined using a building-block method in which best-estimate ranges of expected future real rates of return (expected returns, net of pension investment expense and inflation) are developed for each major asset class. The long-term expected rate of return includes both short-term and long-term market return expectations as well as the expected pension fund cash flows. Such cash flows were developed assuming that both members and employers will make their required contributions on time and as scheduled in all future years. Using historical returns of all the funds’ asset classes, expected compound (geometric)returns were calculated over the short-term (first 10 years) and the long-term (11-60 years) using a building-block approach. Using the expected nominal returns for both short-term and long-term, the present value of benefits was calculated for each fund. The expected rate of return was set by calculating the single equivalent expected return that arrived at the same present value of benefits for cash flows as the one calculated using both short-term and long-term returns. The expected rate of return was then set equivalent to the single equivalent rate calculated above and rounded down to the nearest one quarter of one percent. The table below reflects long-term expected real rate of return by asset class. The rate of return was calculated using the capital market assumptions applied to determine the discount rate and asset allocation. These geometric rates of return are net of administrative expenses.
Asset Class
Strategic
Allocation
Real Return
Years 1-10 (1)
Real Return Years
11-60 (2)
Global Equity 50.0% 5.25% 5.71%
Global Fixed Income 17.0 0.99 2.43
Inflation Sensitive 4.0 0.45 3.36
Private Equity 14.0 6.83 6.95
Real Estate 11.0 4.50 5.13
Infrastructure and Forestland 0.0 4.50 5.09
Liquidity 4.0 (0.55) (1.05)(1) An expected inflation rate of 2.5% used for this period
(2) An expected inflation rate of 3.0% used for this period
58
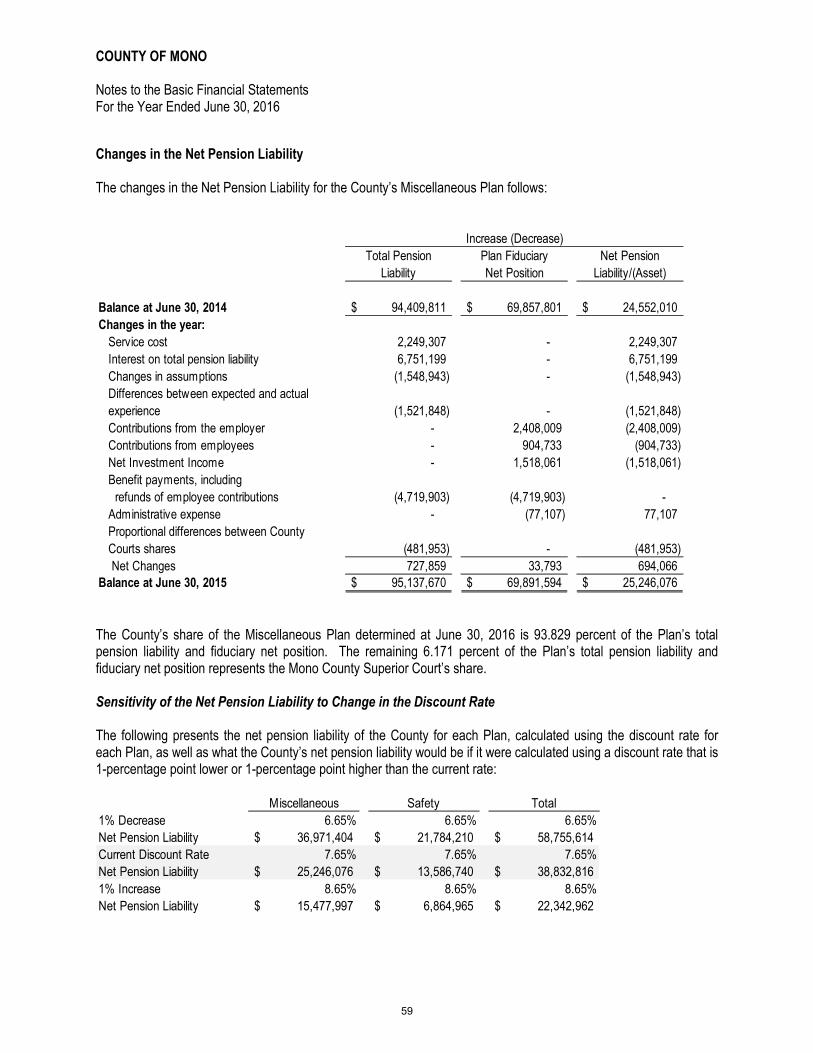
COUNTY OF MONO Notes to the Basic Financial Statements For the Year Ended June 30, 2016
Changes in the Net Pension Liability The changes in the Net Pension Liability for the County’s Miscellaneous Plan follows:
Total Pension Plan Fiduciary Net Pension
Liability Net Position Liability/(Asset)
Balance at June 30, 2014 94,409,811$ 69,857,801$ 24,552,010$
Changes in the year:
Service cost 2,249,307 - 2,249,307
Interest on total pension liability 6,751,199 - 6,751,199
Changes in assumptions (1,548,943) - (1,548,943)
Differences between expected and actual
experience (1,521,848) - (1,521,848)
Contributions from the employer - 2,408,009 (2,408,009)
Contributions from employees - 904,733 (904,733)
Net Investment Income - 1,518,061 (1,518,061)
Benefit payments, including
refunds of employee contributions (4,719,903) (4,719,903) -
Administrative expense - (77,107) 77,107
Proportional differences between County
Courts shares (481,953) - (481,953)
Net Changes 727,859 33,793 694,066
Balance at June 30, 2015 95,137,670$ 69,891,594$ 25,246,076$
Increase (Decrease)
The County’s share of the Miscellaneous Plan determined at June 30, 2016 is 93.829 percent of the Plan’s total pension liability and fiduciary net position. The remaining 6.171 percent of the Plan’s total pension liability and fiduciary net position represents the Mono County Superior Court’s share. Sensitivity of the Net Pension Liability to Change in the Discount Rate The following presents the net pension liability of the County for each Plan, calculated using the discount rate for each Plan, as well as what the County’s net pension liability would be if it were calculated using a discount rate that is 1-percentage point lower or 1-percentage point higher than the current rate:
Miscellaneous Safety Total
6.65% 6.65% 6.65%
Net Pension Liability 36,971,404$ 21,784,210$ 58,755,614$
Current Discount Rate 7.65% 7.65% 7.65%
Net Pension Liability 25,246,076$ 13,586,740$ 38,832,816$
1% Increase 8.65% 8.65% 8.65%
Net Pension Liability 15,477,997$ 6,864,965$ 22,342,962$
1% Decrease
59

COUNTY OF MONO Notes to the Basic Financial Statements For the Year Ended June 30, 2016
Detailed information about each pension plan’s fiduciary net position is available in the separately issued CalPERS financial reports. For the year ended June 30, 2016, the County recognized pension expense of ($1,321,208). Pension expense represents the change in the net pension liability during the measurement period, adjusted for actual contributions and the deferred recognition of changes in investment gain/loss, actuarial gain/loss, actuarial assumptions or method, and plan benefits. At June 30, 2016, the County reported deferred outflows of resources and deferred inflows of resources related to pensions from the following sources:
Deferred Outflows of
Resources
Deferred Inflows of
Resources
Pension contributions subsequent to measurement date 3,289,818$ -$
Changes in assumptions - (1,853,205)
Differences between actual and expected experiences - (1,149,081)
Adjustment due to differences in proportions 657,780 (316,881)
Net differences between projected and actual earnings on
pension plan investments 13,127 (1,092,916)
Total 3,960,725$ (4,412,083)$
The deferred outflows of resources of $3,289,818 results from pension contributions made subsequent to the measurement date and will be recognized as a reduction of the net pension liability in the next fiscal year. Other amounts reported as deferred outflows and inflows of resources related to pensions will be recognized in pension expense as follows:
Year Ending June 30,
2017 (2,417,501)$
2018 (1,944,971)
2019 (655,954)
2020 1,277,250
(3,741,176)$
NOTE 8: OTHER POST EMPLOYMENT BENEFITS (OPEB)
Plan Description
The County administers a postemployment healthcare plan, a single-employer defined benefit post employment healthcare plan. The County established a post employment health benefit (OPEB) trust with the Public Agency Retirement Services (PARS) which is used to accumulate resources to fund future benefits, however it does not represent the activities of the plan. The Plan provides medical, dental and vision insurance benefits to eligible retirees.
The County provides post-retirement health care benefits, in accordance with County employment contracts, to all employees who retire, on a tiered basis. Employees hired prior to January 1, 2002, who have attained the age of 55
60
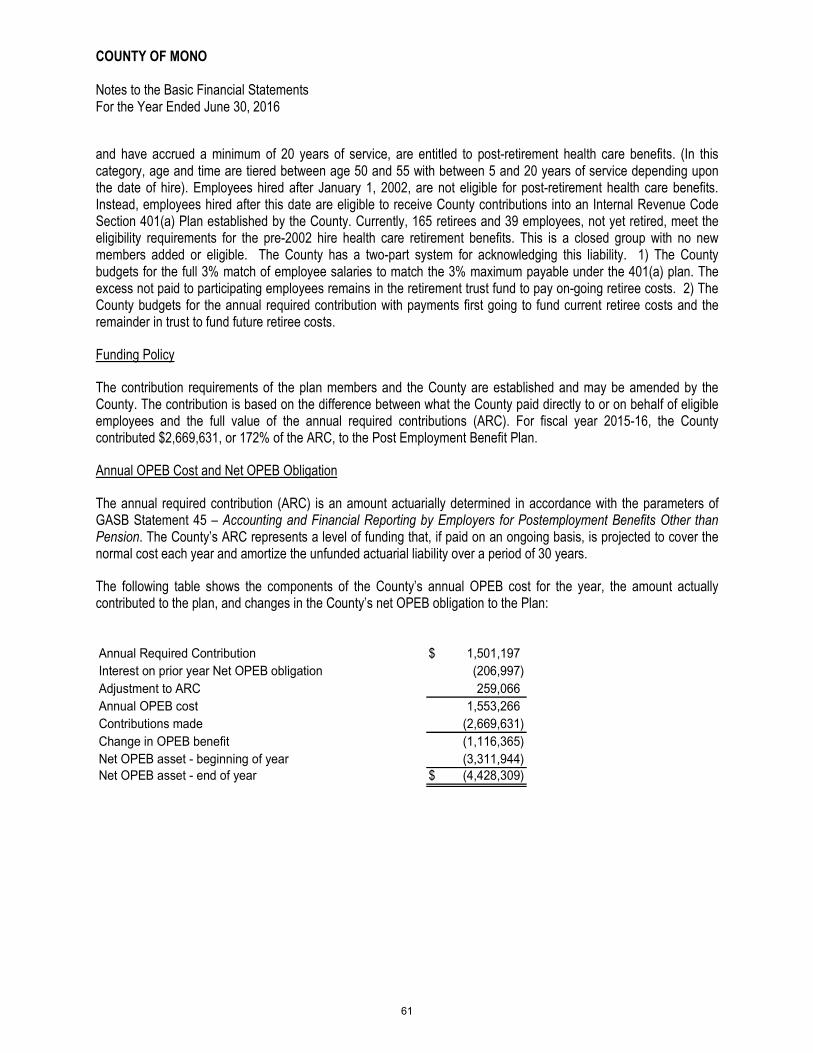
COUNTY OF MONO Notes to the Basic Financial Statements For the Year Ended June 30, 2016
and have accrued a minimum of 20 years of service, are entitled to post-retirement health care benefits. (In this category, age and time are tiered between age 50 and 55 with between 5 and 20 years of service depending upon the date of hire). Employees hired after January 1, 2002, are not eligible for post-retirement health care benefits. Instead, employees hired after this date are eligible to receive County contributions into an Internal Revenue Code Section 401(a) Plan established by the County. Currently, 165 retirees and 39 employees, not yet retired, meet the eligibility requirements for the pre-2002 hire health care retirement benefits. This is a closed group with no new members added or eligible. The County has a two-part system for acknowledging this liability. 1) The County budgets for the full 3% match of employee salaries to match the 3% maximum payable under the 401(a) plan. The excess not paid to participating employees remains in the retirement trust fund to pay on-going retiree costs. 2) The County budgets for the annual required contribution with payments first going to fund current retiree costs and the remainder in trust to fund future retiree costs.
Funding Policy
The contribution requirements of the plan members and the County are established and may be amended by the County. The contribution is based on the difference between what the County paid directly to or on behalf of eligible employees and the full value of the annual required contributions (ARC). For fiscal year 2015-16, the County contributed $2,669,631, or 172% of the ARC, to the Post Employment Benefit Plan.
Annual OPEB Cost and Net OPEB Obligation
The annual required contribution (ARC) is an amount actuarially determined in accordance with the parameters of GASB Statement 45 – Accounting and Financial Reporting by Employers for Postemployment Benefits Other than Pension. The County’s ARC represents a level of funding that, if paid on an ongoing basis, is projected to cover the normal cost each year and amortize the unfunded actuarial liability over a period of 30 years.
The following table shows the components of the County’s annual OPEB cost for the year, the amount actually contributed to the plan, and changes in the County’s net OPEB obligation to the Plan:
Annual Required Contribution 1,501,197$
Interest on prior year Net OPEB obligation (206,997)
Adjustment to ARC 259,066
Annual OPEB cost 1,553,266
Contributions made (2,669,631)
Change in OPEB benefit (1,116,365)
Net OPEB asset - beginning of year (3,311,944)
Net OPEB asset - end of year (4,428,309)$
61

COUNTY OF MONO Notes to the Basic Financial Statements For the Year Ended June 30, 2016
The County’s annual OPEB cost, the percentage of annual OPEB cost contributed to the plan (as described in the funding policy above), and the Net OPEB Asset is as follows:
Fiscal Percentage of NetYear Annual Annual OPEB OPEBEnded OPEB Cost Cost Contributed Asset
6/30/14 1,986,824$ 130% 2,265,074$ 6/30/15 1,501,197 172% 3,311,944 6/30/16 1,553,266 172% 4,428,309
Funded Status and Funding Progress
The funded status of the plan, based on an actuarial valuation as of January 1, 2016, the plan’s most recent actuarial valuation date, was as follows:
Actuarial accrued liability (AAL) 33,863,468$
Actuarial value of plan assets 14,369,915
Unfunded actuarial accrued liability (UAAL) 19,493,553
Funded ratio (actuarial value of plan assets/AAL) 42.43%
Covered payroll (active Plan members) n/a
UAAL as a percentage of covered payroll n/a
Actuarial Methods and Assumptions
Actuarial valuations of an ongoing plan involve estimates of the value of reported amounts and assumptions about the probability of occurrence of events far into the future. Examples include assumptions about future employment, mortality, and the healthcare cost trend. Amounts determined regarding the funded status of the plan and the annual required contributions of the employer are subject to continual revision as actual results are compared with past expectations and new estimates are made about the future. The schedule of funding progress, presented as required supplementary information following the notes to the financial statements, presents multi-year trend information about whether the actuarial value of plan assets is increasing or decreasing over time relative to the actuarial accrued liabilities for benefits.
Projections of benefits for financial reporting purposes are based on the substantive plan (the plan as understood by the employer and the plan members) and include the types of benefits provided at the time of each valuation and the historical pattern of sharing of benefit costs between the employer and plan members to that point. The actuarial methods and assumptions used include techniques that are designed to reduce the effects of short-term volatility in actuarial accrued liabilities and the actuarial value of assets, consistent with the long-term perspective of the calculations.
In the January 1, 2016 actuarial valuation, the entry age normal actuarial cost method was used. The actuarial assumptions included a 6.25% investment rate of return, an inflation rate of 2.5% per year, and assumed medical
62

COUNTY OF MONO Notes to the Basic Financial Statements For the Year Ended June 30, 2016
inflation of 8% graded down to 6% over 9 years. The OPEB plan’s unfunded actuarial liability is being amortized by level percent of payroll contributions over 30 years. The remaining amortization period at June 30, 2016, was 22 years.
NOTE 9: NET POSITION/FUND BALANCES
Fund balances at June 30, 2016 were classified as follows:
Other
General Road Realignment Mental Health Round Governmental
Fund Fund Fund Services Act Fire Funds Total
Nonspendable:
Advances to other funds 855,000$ -$ -$ -$ -$ -$ 855,000$
Prepaids and inventory 58,349 362,993 - - - 20,449 441,791
Total Nonspendable 913,349 362,993 - - - 20,449 1,296,791
Restricted for:
Road projects - 1,173,598 - - - - 1,173,598
Health and social services - - - 4,896,414 - 2,247,822 7,144,236
County service areas - - - - - 2,243,991 2,243,991
Community development - - - - - 762,013 762,013
Grant programs - - 4,858,907 - - 850,277 5,709,184
Total Restricted - 1,173,598 4,858,907 4,896,414 - 6,104,103 17,033,022
Committed:
Disaster assistance - - - - 540,656 - 540,656
Assigned:
Eliminate projected FY 16/17
budgetary deficit 4,567,500 - - - - - 4,567,500
Capital projects - - - - - 359,706 359,706
Tourism 117,377 - - - - - 117,377
Conway Ranch 23,113 - - - - - 23,113
Total Assigned 4,707,990 - - - - 359,706 5,067,696
Unassigned 4,015,851 - - - - (96,003) 3,919,848 Total Fund Balance 9,637,190$ 1,536,591$ 4,858,907$ 4,896,414$ 540,656$ 6,388,255$ 27,858,013$
During this year’s budget process, the County Board of Supervisors re-established a general reserve of $1,663,091 in the General Fund. This general reserve is subject to the provisions of Government Code sections 29085, 29086 and 29127, whereby appropriation from the general reserve may be used only in cases of certain emergency situations. Because this stabilization arrangement does not meet the criteria described in GASB Statement No. 54, Fund Balance Reporting and Governmental Fund Type Definitions, to be reported within the restricted or committed fund balance categories, it has been classified as unassigned in these statements.
63
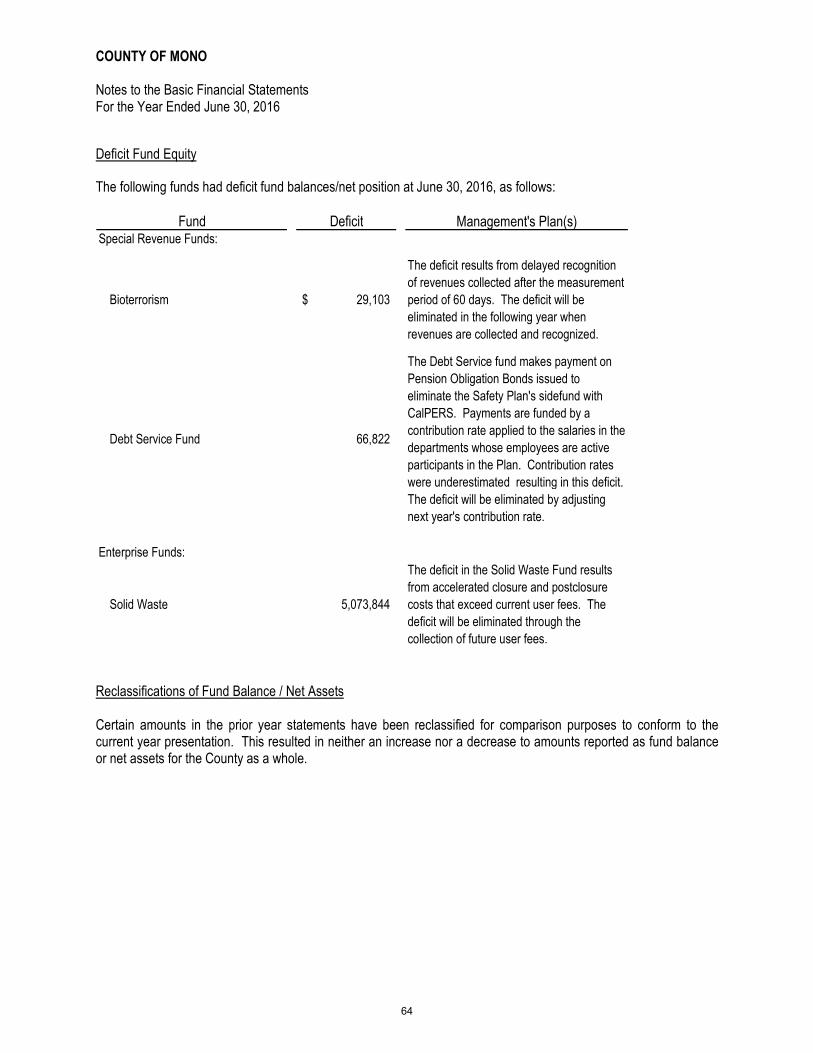
COUNTY OF MONO Notes to the Basic Financial Statements For the Year Ended June 30, 2016
Deficit Fund Equity
The following funds had deficit fund balances/net position at June 30, 2016, as follows:
Fund Deficit Management's Plan(s)Special Revenue Funds:
Bioterrorism 29,103$
The deficit results from delayed recognition
of revenues collected after the measurement
period of 60 days. The deficit will be
eliminated in the following year when
revenues are collected and recognized.
Debt Service Fund 66,822
The Debt Service fund makes payment on
Pension Obligation Bonds issued to
eliminate the Safety Plan's sidefund with
CalPERS. Payments are funded by a
contribution rate applied to the salaries in the
departments whose employees are active
participants in the Plan. Contribution rates
were underestimated resulting in this deficit.
The deficit will be eliminated by adjusting
next year's contribution rate.
Enterprise Funds:
Solid Waste 5,073,844
The deficit in the Solid Waste Fund results
from accelerated closure and postclosure
costs that exceed current user fees. The
deficit will be eliminated through the
collection of future user fees.
Reclassifications of Fund Balance / Net Assets Certain amounts in the prior year statements have been reclassified for comparison purposes to conform to the current year presentation. This resulted in neither an increase nor a decrease to amounts reported as fund balance or net assets for the County as a whole.
64

COUNTY OF MONO
Notes to the Basic Financial Statements For the Year Ended June 30, 2016
The impact of these reclassifications on the beginning fund balance of governmental funds is as follows:
Prior year balance as
reported at June 30,
2015 Reclassification
Prior year balances
as reclassified at July
1, 2015
Fund balance of Governmental Funds
General 11,737,562$ (5,881,908)$ 5,855,654$
Road (684,362) 119 (684,243)
Realignment 3,027,867 - 3,027,867
Mental Health Services Act - 4,260,880 4,260,880
Round fire - 359,321 359,321
Other governmental 4,074,284 1,261,588 5,335,872
18,155,351$ -$ 18,155,351$
Restatements of Fund Balance / Net Position Adjustments resulting from errors or a change to comply with provisions of the accounting standards are treated as adjustments to prior periods. Accordingly, the County reports these changes as restatements of beginning fund balance / net position. Restatements as of the beginning of the fiscal year were made to correct the reporting of prior year revenues and expenses / expenditures. In the current year, the County reported a prior period adjustment to include the net pension liability and related deferred inflows and outflows of resources of the Safety Fire First Tier Retirement Plan which was excluded in the prior year. Other adjustments were made to correct the reporting of prior year revenues, expenditures and depreciation. The impact of the restatements on the fund balances / net position as previously reported after reclassification is presented below:
Government-Wide
Statements Internal
Governmental
Activities General Road
Service
Funds
Fund balance / net position, June 30, 2015,
after reclassification 22,003,319$ 5,855,654$ (684,243)$ 3,748,218$
Corrections:
Prior year expenditures - (51,896) 51,896 -
Prior year revenues 21,762 - 21,762 -
Correct depreciation - - - (16,371)
Net pension liability understated (2,813,039) - - -
Total corrections (2,791,277) (51,896) 73,658 (16,371)
Fund balance / net position, July 1, 2015, after
reclassification and as restated 19,212,042$ 5,803,758$ (610,585)$ 3,731,847$
Governmental Funds
65

COUNTY OF MONO Notes to the Basic Financial Statements For the Year Ended June 30, 2016
NOTE 10: RISK MANAGEMENT
The County is exposed to various risks of loss related to torts, theft of, damage to, and destruction of assets, errors and omissions, injuries to employees and natural disasters. The County has established an internal service fund (ISF) to account for and finance risks for general liability and workers’ compensation. The County retains the risk of loss up to a maximum of $125,000 for each workers’ compensation claim and $25,000 for each general liability claim, up to four claims per year.
The County is a member of the Trindel Insurance Fund, a joint powers agency, established to provide coverage for workers’ compensation and general liability exposures and to pay for the administration of the program. The agreement for the formation of Trindel provides that the system will be self-sustaining through member premiums and will reinsure through a commercial company for claims in excess of self-insured retention. Trindel retains a self-insured retention of $125,000 for workers’ compensation and $100,000 for general liability. Excess insurance coverage is provided for risk of loss above the self-insured retention. Trindel Insurance Fund is classified as a claims-servicing or account pool, wherein the County retains the risk of loss and is considered self-insured with regard to liability coverage for general and property liability and workers’ compensation.
The County holds a deposit with Trindel Insurance from which claims are paid. At June 30, 2016, the balance of the deposit was $2,894,060. Each member of Trindel pays an annual premium to the insurance system that is evaluated each year based on the number of personnel, estimated payroll and an experience factor.
The County is a member of the California State Association of Counties Excess Insurance Authority (CSACEIA), a joint powers authority. CSACEIA, along with other commercial carriers, increases the coverage for general liability to $15 million. In addition, CSACEIA, along with other commercial carriers, covers replacement cost on property up to $600 million with a $1,000 deductible per occurrence. CSACEIA is a public entity risk pool currently operating as a common risk management and insurance program. The County pays an annual premium to the Authority for excess insurance coverage. Should actual losses among participants be greater than anticipated, the County will be assessed its pro rata share of the deficiency. Conversely, if the actual losses are less than anticipated, the County will be refunded its pro rata share of the excess. Settled claims have not exceeded commercial coverage in any of the past three fiscal years.
Complete audited financial statements for CSACEIA can be obtained from the Authority’s Office at 3017 Gold Canal Drive, Suite 300, Rancho Cordova California 95670.
All funds of the County participate in the program and make payments to the Self-Insurance internal service fund based on historical cost and actuarial estimates of the amounts needed to pay prior and current year claims and to allow accrual of estimated incurred but not reported claims. The total historical and actuarially determined claims liability at June 30, 2016 is $1,658,334.
Changes in the County’s claims liability amount for the fiscal years ending June 30, 2016 and 2015 were as follows:
Current Year
Fiscal Balance at Claims and Balance at
Year Beginning of Changes in Claims End of
Ended Fiscal Year Estimates Payments Fiscal Year
2015 1,444,407$ 422,655$ (483,965)$ 1,383,097
2016 1,383,097 1,290,072 (1,014,835) 1,658,334
66

COUNTY OF MONO Notes to the Basic Financial Statements For the Year Ended June 30, 2016
NOTE 11: COMMITMENTS AND CONTINGENCIES
The County is involved in several lawsuits. Due to the nature of the cases, County Counsel is unable to estimate at this time the probability of favorable or unfavorable outcomes. Therefore, no provision has been made in the financial statements for a loss contingency.
67

THIS PAGE INTENTIONALLY LEFT BLANK
68

REQUIRED SUPPLEMENTARY INFORMATION

THIS PAGE INTENTIONALLY LEFT BLANK
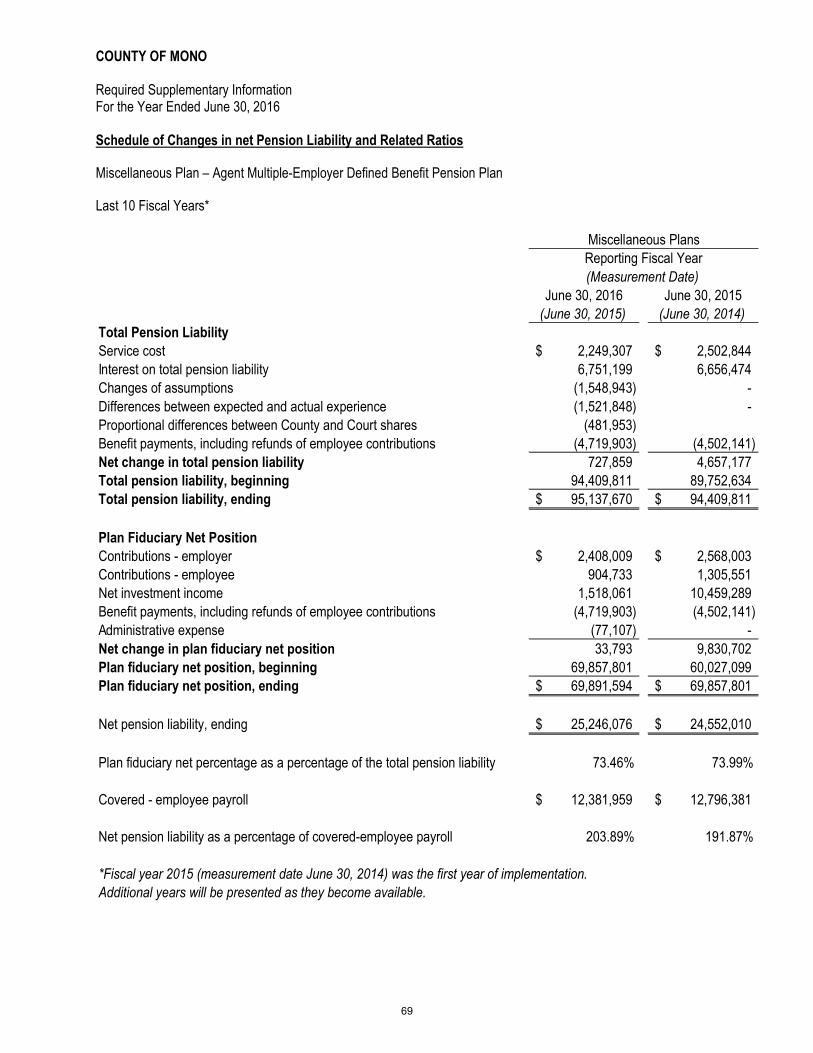
COUNTY OF MONO Required Supplementary Information For the Year Ended June 30, 2016
Schedule of Changes in net Pension Liability and Related Ratios
Miscellaneous Plan – Agent Multiple-Employer Defined Benefit Pension Plan
Last 10 Fiscal Years*
June 30, 2016 June 30, 2015
(June 30, 2015) (June 30, 2014)
Total Pension Liability
Service cost 2,249,307$ 2,502,844$
Interest on total pension liability 6,751,199 6,656,474
Changes of assumptions (1,548,943) -
Differences between expected and actual experience (1,521,848) -
Proportional differences between County and Court shares (481,953)
Benefit payments, including refunds of employee contributions (4,719,903) (4,502,141)
Net change in total pension liability 727,859 4,657,177
Total pension liability, beginning 94,409,811 89,752,634
Total pension liability, ending 95,137,670$ 94,409,811$
Plan Fiduciary Net Position
Contributions - employer 2,408,009$ 2,568,003$
Contributions - employee 904,733 1,305,551
Net investment income 1,518,061 10,459,289
Benefit payments, including refunds of employee contributions (4,719,903) (4,502,141)
Administrative expense (77,107) -
Net change in plan fiduciary net position 33,793 9,830,702
Plan fiduciary net position, beginning 69,857,801 60,027,099
Plan fiduciary net position, ending 69,891,594$ 69,857,801$
Net pension liability, ending 25,246,076$ 24,552,010$
Plan fiduciary net percentage as a percentage of the total pension liability 73.46% 73.99%
Covered - employee payroll 12,381,959$ 12,796,381$
Net pension liability as a percentage of covered-employee payroll 203.89% 191.87%
*Fiscal year 2015 (measurement date June 30, 2014) was the first year of implementation.
Additional years will be presented as they become available.
Miscellaneous Plans
Reporting Fiscal Year
(Measurement Date)
69
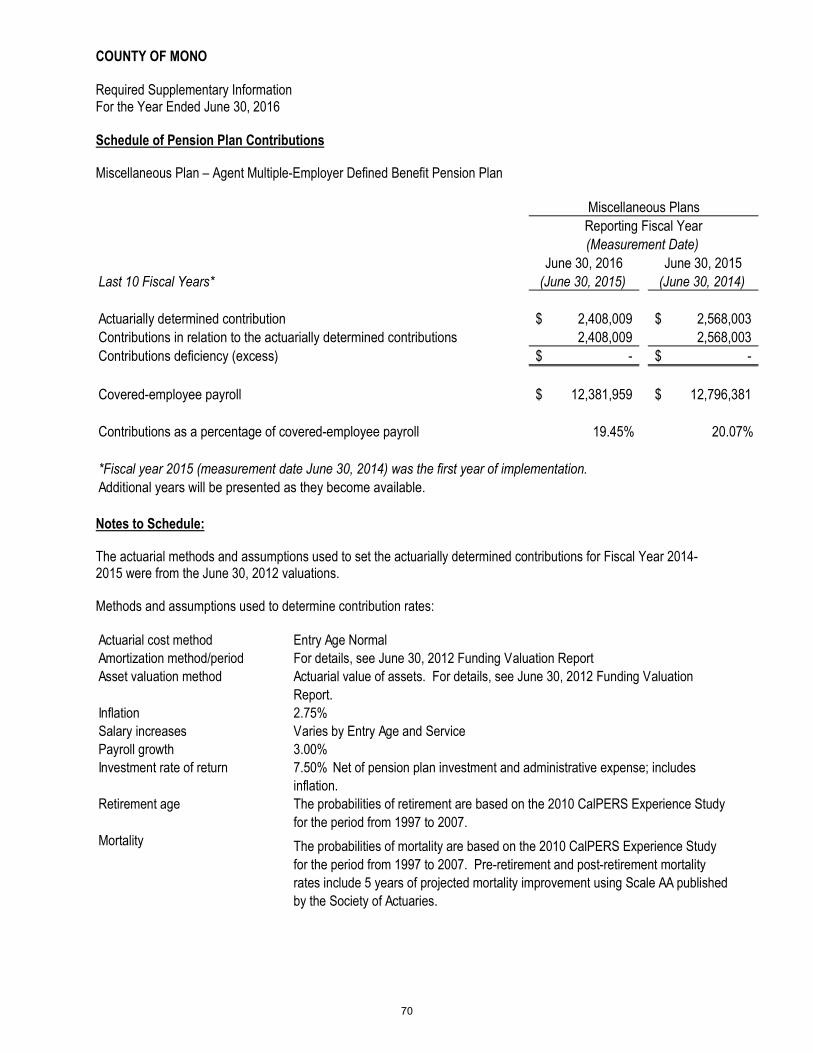
COUNTY OF MONO Required Supplementary Information For the Year Ended June 30, 2016
Schedule of Pension Plan Contributions
Miscellaneous Plan – Agent Multiple-Employer Defined Benefit Pension Plan
June 30, 2016 June 30, 2015
Last 10 Fiscal Years* (June 30, 2015) (June 30, 2014)
Actuarially determined contribution 2,408,009$ 2,568,003$
Contributions in relation to the actuarially determined contributions 2,408,009 2,568,003
Contributions deficiency (excess) -$ -$
Covered-employee payroll 12,381,959$ 12,796,381$
Contributions as a percentage of covered-employee payroll 19.45% 20.07%
*Fiscal year 2015 (measurement date June 30, 2014) was the first year of implementation.
Additional years will be presented as they become available.
Miscellaneous Plans
Reporting Fiscal Year
(Measurement Date)
Notes to Schedule:
The actuarial methods and assumptions used to set the actuarially determined contributions for Fiscal Year 2014-2015 were from the June 30, 2012 valuations.
Methods and assumptions used to determine contribution rates:
Actuarial cost method Entry Age Normal
Amortization method/period For details, see June 30, 2012 Funding Valuation Report
Asset valuation method Actuarial value of assets. For details, see June 30, 2012 Funding Valuation
Report.
Inflation 2.75%
Salary increases Varies by Entry Age and Service
Payroll growth 3.00%
Investment rate of return 7.50% Net of pension plan investment and administrative expense; includes
inflation.
Retirement age The probabilities of retirement are based on the 2010 CalPERS Experience Study
for the period from 1997 to 2007.
Mortality The probabilities of mortality are based on the 2010 CalPERS Experience Study
for the period from 1997 to 2007. Pre-retirement and post-retirement mortality
rates include 5 years of projected mortality improvement using Scale AA published
by the Society of Actuaries.
70

COUNTY OF MONO Required Supplementary Information For the Year Ended June 30, 2016
Schedule of Proportionate Share of the Net Pension Liability / (Asset) and Related Ratios as of the Measurement Date
Safety Plans – Cost-Sharing Multiple-Employer Defined Benefit Pension Plans
June 30, 2016 June 30, 2015
Last 10 years* (June 30, 2015) (June 30, 2014**)
Proportion of the net pension liability 0.32974% 0.18612%
Proportionate share of the net pension liability 13,586,740$ 11,581,122$
Covered - employee payroll 5,575,424$ 5,969,340$
Proportionate share of the net pension liability as percentage of covered-
employee payroll 243.69% 194.01%
Plan's fiduciary net position 49,276,094 50,204,330$
Plan fiduciary net position as a percentage of the total pension liability 78.39% 81.26%
*Fiscal year 2015 (measurement date June 30, 2014) was the first year of implementation.
Additional years will be presented as they become available.
Safety Plans
Reporting Fiscal Year
(Measurement Date)
Schedule of Pension Plan Contributions
Safety Plans – Cost-Sharing Multiple-Employer Defined Benefit Pension Plans
June 30, 2016 June 30, 2015
Last 10 fiscal years* (June 30, 2015) (June 30, 2014**)
Actuarially determined contribution 1,451,026$ 1,476,254$
Contributions related to the actuarially determined contribution 1,451,026 1,476,254
Contribution deficiency (excess) -$ -$
County's covered-employee payroll 5,575,424$ 5,969,340$
Contributions as a percentage of covered-employee payroll 26.03% 24.73%
*Fiscal year 2015 (measurement date June 30, 2014) was the first year of implementation.
Additional years will be presented as they become available.
**Restated.
Safety Plans
(Measurement Date)
Reporting Fiscal Year
71
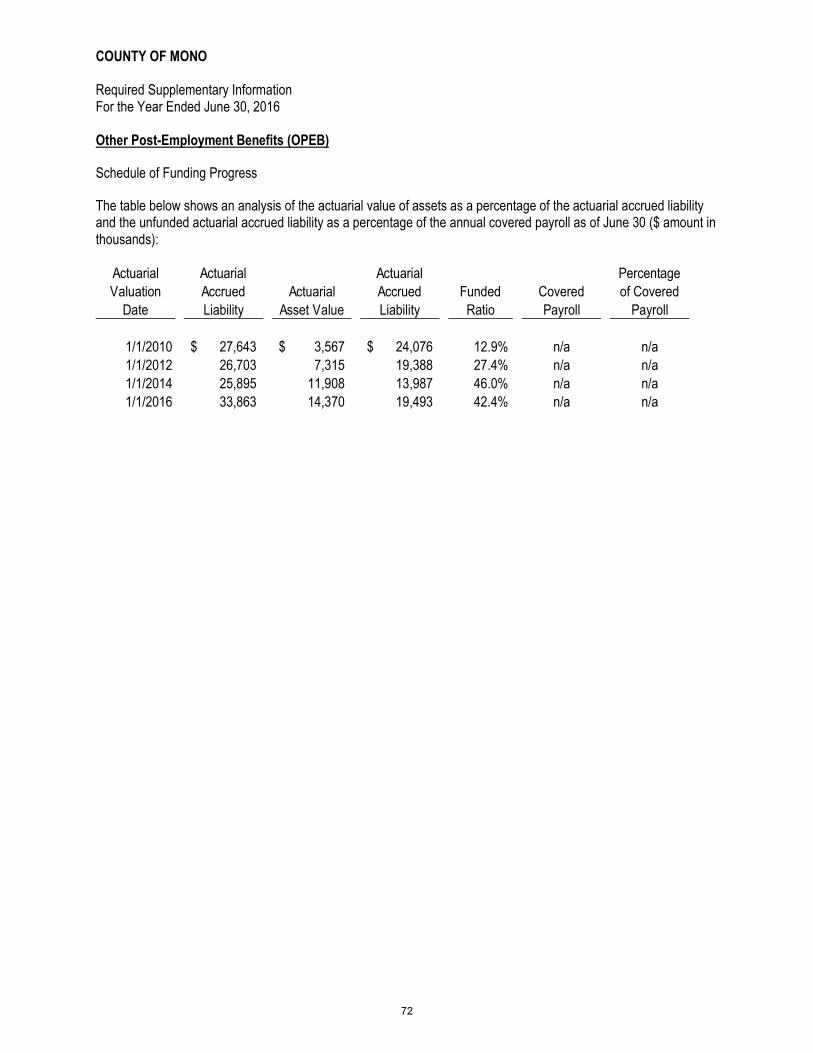
COUNTY OF MONO Required Supplementary Information For the Year Ended June 30, 2016
Other Post-Employment Benefits (OPEB)
Schedule of Funding Progress
The table below shows an analysis of the actuarial value of assets as a percentage of the actuarial accrued liability and the unfunded actuarial accrued liability as a percentage of the annual covered payroll as of June 30 ($ amount in thousands):
Actuarial
Valuation
Date
Actuarial
Accrued
Liability
Actuarial
Asset Value
Actuarial
Accrued
Liability
Funded
Ratio
Covered
Payroll
Percentage
of Covered
Payroll
1/1/2010 27,643$ 3,567$ 24,076$ 12.9% n/a n/a
1/1/2012 26,703 7,315 19,388 27.4% n/a n/a
1/1/2014 25,895 11,908 13,987 46.0% n/a n/a
1/1/2016 33,863 14,370 19,493 42.4% n/a n/a
72

COUNTY OF MONOBudgetary Comparison Schedule
General Fund
For the Year Ended June 30, 2016
Budgeted Amounts Actual Variance withOriginal Final Amounts Final Budget
Revenues
Taxes 20,342,000$ 20,185,657$ 23,240,446$ 3,054,789$ Licenses and permits 345,694 325,694 368,745 43,051 Fines, forfeitures and penalties 527,950 528,625 750,906 222,281 Use of money and property 36,500 38,500 81,549 43,049 Intergovernmental 5,232,285 5,362,171 4,754,759 (607,412) Charges for services 5,117,068 5,236,978 5,052,756 (184,222) Other revenues 256,695 342,003 129,503 (212,500) Transfers in 2,057,583 2,031,649 1,363,410 (668,239)
Total Revenues 33,915,775 34,051,277 35,742,074 1,690,797
Expenditures
General governmentBoard of Supervisors 501,967 501,967 485,506 16,461 Administrative Officer 563,246 623,903 566,819 57,084 Department of Finance 2,261,573 2,328,541 1,875,613 452,928 General Fund Operating Transfers 1,700,867 1,751,447 1,675,173 76,274 Assessor 1,333,703 1,333,703 958,047 375,656 County Counsel 1,024,453 1,183,845 1,036,161 147,684 Election Division 255,345 252,830 199,137 53,693 Information Technology 1,552,973 1,572,973 1,575,686 (2,713) Public Works 861,409 868,060 742,805 125,255 County Facilities 2,468,122 2,468,122 2,298,011 170,111 Economic Development 439,162 439,162 409,937 29,225 Total general government 12,962,820 13,324,553 11,822,895 1,501,658
Public protection County MOE 709,132 709,132 691,336 17,796 Public Defender 658,000 658,000 618,002 39,998 Grand Jury 8,300 8,300 1,347 6,953 District Attorney - Prosecution 1,825,986 1,819,936 1,637,076 182,860 DA - Justice Administration Grant 299,820 299,820 118,825 180,995 Victim/Witness 72,189 88,878 114,046 (25,168) Sheriff 5,496,573 5,547,610 5,011,988 535,622 Boating Law Enforcement 135,543 151,593 122,843 28,750 Search and Rescue 23,125 23,125 20,827 2,298 Court Security 441,434 441,349 376,070 65,279 Jail 2,807,708 2,805,110 2,562,285 242,825 Emergency Services 481,387 483,986 478,483 5,503 Adult Probation Services 1,787,600 1,840,517 1,466,605 373,912 Juvenile Probation Services 503,915 445,915 393,704 52,211 Agricultural Commissioner 211,431 217,481 217,481 - County Clerk / Recorder 757,448 770,879 525,005 245,874 Animal Control 478,388 478,388 462,483 15,905 Planning & Transportation 966,065 966,065 911,652 54,413 Housing Development 719,188 719,188 21,298 697,890 Code Enforcement 109,762 110,172 107,173 2,999 Planning Commission 15,007 15,007 12,152 2,855
Continued
73

COUNTY OF MONOBudgetary Comparison Schedule (continued)
General Fund
For the Year Ended June 30, 2016
Budgeted Amounts Actual Variance withOriginal Final Amounts Final Budget
Expenditures (continued)
Public protection (continued)LAFCO 11,533 11,533 9,341 2,192 Building Inspector 344,357 343,947 326,138 17,809 Total public protection 18,863,891 18,955,931 16,206,160 2,749,771
Health and sanitationBridgeport Clinic 124,000 124,000 93,764 30,236 Paramedic Program 3,780,669 3,814,778 3,799,723 15,055 Total health and sanitation 3,904,669 3,938,778 3,893,487 45,291
Public assistance Veterans' Services Officer 47,000 47,000 46,849 151 Farm Advisor 40,000 40,000 39,784 216 Total public assistance 87,000 87,000 86,633 367
Contingency 365,000 12,620 - 12,620 Total expenditures 36,183,380 36,318,882 32,009,175 4,309,707
Net Change in Fund Balances (2,267,605) (2,267,605) 3,732,899 6,000,504
Budgetary Fund Balances - Beginning of Year, restated 4,111,008 4,111,008 4,111,008 -
Budgetary Fund Balances - End of Year 1,843,403$ 1,843,403$ 7,843,907$ 6,000,504$
Reconciliation of Budgetary Inflows and Outflows to GAAP Revenues and ExpendituresSources/inflows of resourcesActual amounts available for appropriation from the budgetary comparison schedule 35,742,074$ Differences - budget to GAAP:Revenues from sub-funds combined with the General Fund for financial reporting purposes are not budgeted as available for appropriation for budgetary purposes 331,707 A87 cost reimbursement is a budgetary resource but is not current-year revenue for financial reporting purposes (1,990,065) Transfers from other funds are inflows of budgetary resources but are not revenues for financial reporting purposes (1,363,410)
Total revenues as reported on the statement of revenues, expenditures, and changes in fund balances - governmental funds 32,720,306$
Uses/outflows of resources:Actual charges to appropriations from the budgetary comparison schedule above 32,009,175$ Differences - budget to GAAP:Expenditures from sub-funds combined with the General Fund for financial reporting purposes are not budgeted as charges to appropriations for budgetary purposes 590,682
A87 cost reimbursement reported as a reduction of expenditures for financial reporting purposes but is not budgeted as a charge to appropriations for budgetary purposes (1,990,065) Transfers to other funds are outflows of budgetary resources but are not expenditures for financial reporting purposes (2,487,407)
Total expenditures as reported on the statement of revenues, expenditures and changes in fund balances - governmental fund 28,122,385$
74

COUNTY OF MONOBudgetary Comparison Schedule
Road Fund
For the Year Ended June 30, 2016
Budgeted Amounts Actual Variance with
Original Final Amounts Final Budget
Revenues
Licenses and permits 6,000$ 6,000$ 13,200$ 7,200$
Fines, forfeitures and penalties 40,000 40,000 52,960 12,960
Use of money and property 1,000 1,000 (1,671) (2,671)
Intergovernmental 6,054,665 5,982,174 6,331,023 348,849
Charges for services 500,000 500,000 450,138 (49,862)
Other revenues 5,000 5,000 7,746 2,746
Transfers in 600,000 615,000 615,000 -
Total Revenues 7,206,665 7,149,174 7,468,396 319,222
Expenditures
Public ways and facilities 7,608,741 7,551,250 5,321,220 2,230,030
Total Expenditures 7,608,741 7,551,250 5,321,220 2,230,030
Net Change in Fund Balances (402,076) (402,076) 2,147,176 2,549,252
Fund Balances - Beginning of Year, restated (610,585) (610,585) (610,585) -
Fund Balances - End of Year (1,012,661)$ (1,012,661)$ 1,536,591$ 2,549,252$
Reconciliation of Budgetary Inflows and Outflows to GAAP Revenues and Expenditures
Sources/inflows of resources
Actual amounts available for appropriation from the budgetary comparison schedule 7,468,396$
Differences - budget to GAAP:
Transfers from other funds are inflows of budgetary resources but are not revenues for financial
reporting purposes (615,000)
Total revenues as reported on the statement of revenues, expenditures, and
changes in fund balances - governmental funds 6,853,396$
75
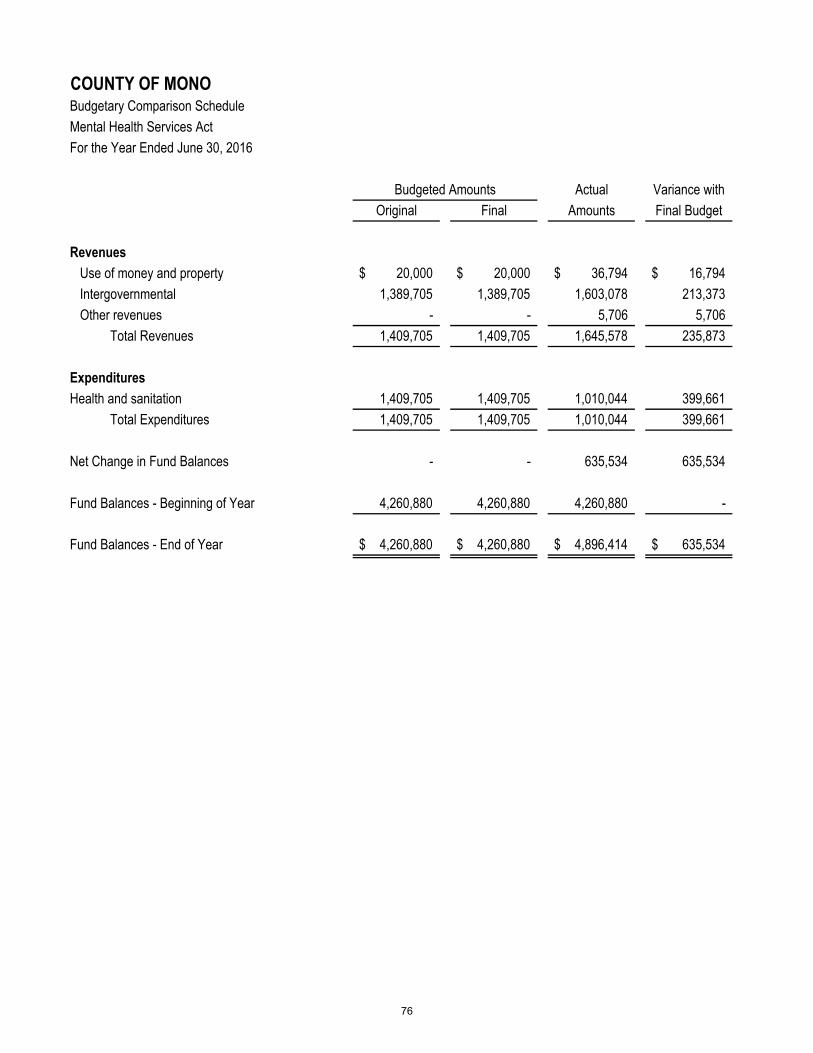
COUNTY OF MONOBudgetary Comparison Schedule
Mental Health Services Act
For the Year Ended June 30, 2016
Budgeted Amounts Actual Variance with
Original Final Amounts Final Budget
Revenues
Use of money and property 20,000$ 20,000$ 36,794$ 16,794$
Intergovernmental 1,389,705 1,389,705 1,603,078 213,373
Other revenues - - 5,706 5,706
Total Revenues 1,409,705 1,409,705 1,645,578 235,873
Expenditures
Health and sanitation 1,409,705 1,409,705 1,010,044 399,661
Total Expenditures 1,409,705 1,409,705 1,010,044 399,661
Net Change in Fund Balances - - 635,534 635,534
Fund Balances - Beginning of Year 4,260,880 4,260,880 4,260,880 -
Fund Balances - End of Year 4,260,880$ 4,260,880$ 4,896,414$ 635,534$
76

COUNTY OF MONOBudgetary Comparison Schedule
Round Fire
For the Year Ended June 30, 2016
Budgeted Amounts Actual Variance with
Original Final Amounts Final Budget
Revenues
Use of money and property 191$ 191$ 3,582$ 3,391$
Intergovernmental 397,451 397,451 1,788,540 1,391,089
Other revenues 663,841 663,841 170,312 (493,529)
Total Revenues 1,061,483 1,061,483 1,962,434 900,951
Expenditures
Public ways and facilities 925,458 925,458 1,781,099 (855,641)
Transfers out 497,986 497,986 - 497,986
Total Expenditures 1,423,444 1,423,444 1,781,099 (357,655)
Net Change in Fund Balances (361,961) (361,961) 181,335 543,296
Fund Balances - Beginning of Year 359,321 359,321 359,321 -
Fund Balances - End of Year (2,640)$ (2,640)$ 540,656$ 543,296$
77

COUNTY OF MONO Required Supplementary Information For the Year Ended June 30, 2016
BUDGETARY BASIS OF ACCOUNTING
In accordance with the provisions of Sections 29000 and 29143, inclusive, of the California Government Code and other statutory provisions, commonly known as the County Budget Act, the County prepares a budget for each fiscal year. A tentative budget approved no later than June 30, of each year establishes the legal authority for county spending in the following fiscal year until a final budget is adopted on or before October 2nd. Prior to adoption of the final budget, a public hearing is held to receive comments prior to adoption.
From the effective date of the budget, which is adopted and controlled at the department level, the amounts stated therein as proposed expenditures become appropriations to the various County departments. However, the legal level of control is the fund level. The Board of Supervisors may amend the budget by a four-fifths majority vote during the fiscal year. Department heads may, upon approval of the Finance Director, make transfers from one object or purpose to another within the same budget unit. All other budget amendments must be approved by the Board. It is this final revised budget that is presented in the required supplementary information section of this financial report. Appropriations lapse at year end.
Budgets are adopted for the General Fund, most special revenue funds, the capital projects fund and the debt service fund. Accounting principles applied for purposes of developing data on a budgetary basis are materially the same as those used to present financial statements in conformity with GAAP, except that transfers are regarded as inflows of resources for budgetary purposes and not revenues for GAAP financial statement presentation purposes and transfers out are considered outflows of resources for budgetary purposes but not expenditures for GAAP financial statement presentation purposes.
The County did not adopt a budget for the Realignment fund.
Expenditures in the Round Fire fund for the year ended June 30, 2016 exceeded budgeted appropriations by $357,655.
78

COMBINING AND INDIVIDUAL FUND STATEMENTS

THIS PAGE INTENTIONALLY LEFT BLANK

NONMAJOR GOVERNMENTAL FUNDS
Special Revenue Funds are used to account for and report the proceeds of specific revenue sources that are
restricted or committed to expenditure for specified purposes other than debt service or capital projects.
Capital Project Funds are used to account for and report financial resources that are restricted, committed or
assigned to expenditure for capital outlays, including that acquisition or construction of capital facilities and other
capital assets.
Debt Service Funds are used to account for and report the accumulation of resources for, and the payment of,
general long-term debt principal and interest.
79

THIS PAGE INTENTIONALLY LEFT BLANK
80
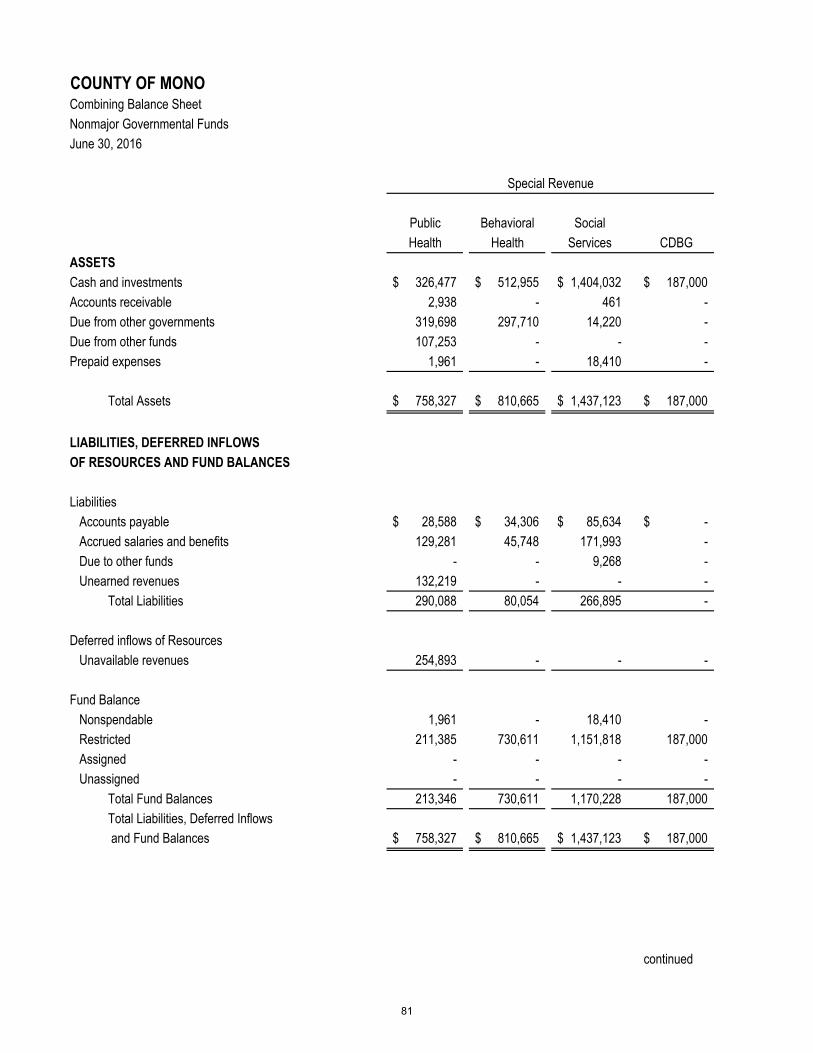
COUNTY OF MONO
Combining Balance Sheet
Nonmajor Governmental Funds
June 30, 2016
Public Behavioral Social
Health Health Services CDBG
ASSETS
Cash and investments 326,477$ 512,955$ 1,404,032$ 187,000$
Accounts receivable 2,938 - 461 -
Due from other governments 319,698 297,710 14,220 -
Due from other funds 107,253 - - -
Prepaid expenses 1,961 - 18,410 -
Total Assets 758,327$ 810,665$ 1,437,123$ 187,000$
LIABILITIES, DEFERRED INFLOWS
OF RESOURCES AND FUND BALANCES
Liabilities
Accounts payable 28,588$ 34,306$ 85,634$ -$
Accrued salaries and benefits 129,281 45,748 171,993 -
Due to other funds - - 9,268 -
Unearned revenues 132,219 - - -
Total Liabilities 290,088 80,054 266,895 -
Deferred inflows of Resources
Unavailable revenues 254,893 - - -
Fund Balance
Nonspendable 1,961 - 18,410 -
Restricted 211,385 730,611 1,151,818 187,000
Assigned - - - -
Unassigned - - - -
Total Fund Balances 213,346 730,611 1,170,228 187,000
Total Liabilities, Deferred Inflows
and Fund Balances 758,327$ 810,665$ 1,437,123$ 187,000$
continued
Special Revenue
81
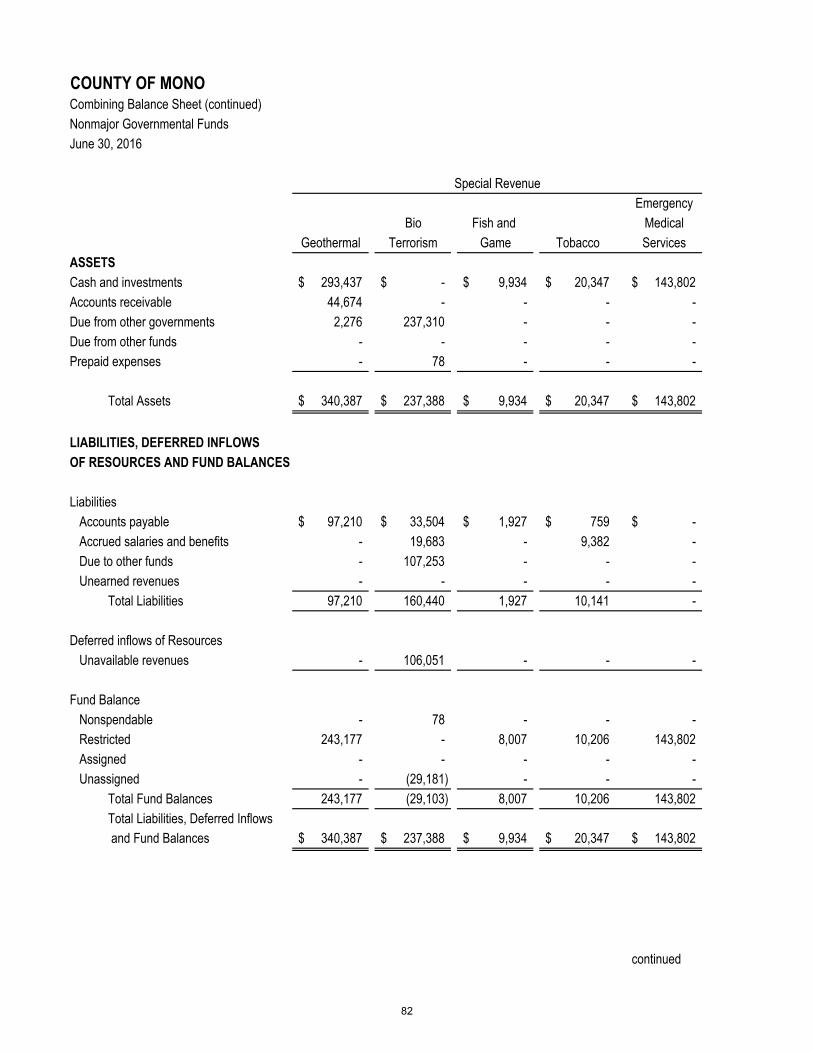
COUNTY OF MONO
Combining Balance Sheet (continued)
Nonmajor Governmental Funds
June 30, 2016
Emergency
Bio Fish and Medical
Geothermal Terrorism Game Tobacco Services
ASSETS
Cash and investments 293,437$ -$ 9,934$ 20,347$ 143,802$
Accounts receivable 44,674 - - - -
Due from other governments 2,276 237,310 - - -
Due from other funds - - - - -
Prepaid expenses - 78 - - -
Total Assets 340,387$ 237,388$ 9,934$ 20,347$ 143,802$
LIABILITIES, DEFERRED INFLOWS
OF RESOURCES AND FUND BALANCES
Liabilities
Accounts payable 97,210$ 33,504$ 1,927$ 759$ -$
Accrued salaries and benefits - 19,683 - 9,382 -
Due to other funds - 107,253 - - -
Unearned revenues - - - - -
Total Liabilities 97,210 160,440 1,927 10,141 -
Deferred inflows of Resources
Unavailable revenues - 106,051 - - -
Fund Balance
Nonspendable - 78 - - -
Restricted 243,177 - 8,007 10,206 143,802
Assigned - - - - -
Unassigned - (29,181) - - -
Total Fund Balances 243,177 (29,103) 8,007 10,206 143,802
Total Liabilities, Deferred Inflows
and Fund Balances 340,387$ 237,388$ 9,934$ 20,347$ 143,802$
continued
Special Revenue
82

COUNTY OF MONO
Combining Balance Sheet (continued)
Nonmajor Governmental Funds
June 30, 2016
County
Mitigation Service Development
Fee Areas Impact
ASSETS
Cash and investments 120,291$ 2,248,527$ 211,545$
Accounts receivable - - -
Due from other governments - - -
Due from other funds - - -
Prepaid expenses - - -
Total Assets 120,291$ 2,248,527$ 211,545$
LIABILITIES, DEFERRED INFLOWS
OF RESOURCES AND FUND BALANCES
Liabilities
Accounts payable -$ 4,013$ -$
Accrued salaries and benefits - 523 -
Due to other funds - - -
Unearned revenues - - -
Total Liabilities - 4,536 -
Deferred inflows of Resources
Unavailable revenues - - -
Fund Balance
Nonspendable - - -
Restricted 120,291 2,243,991 211,545
Assigned - - -
Unassigned - - -
Total Fund Balances 120,291 2,243,991 211,545
Total Liabilities, Deferred Inflows
and Fund Balances 120,291$ 2,248,527$ 211,545$
continued
83
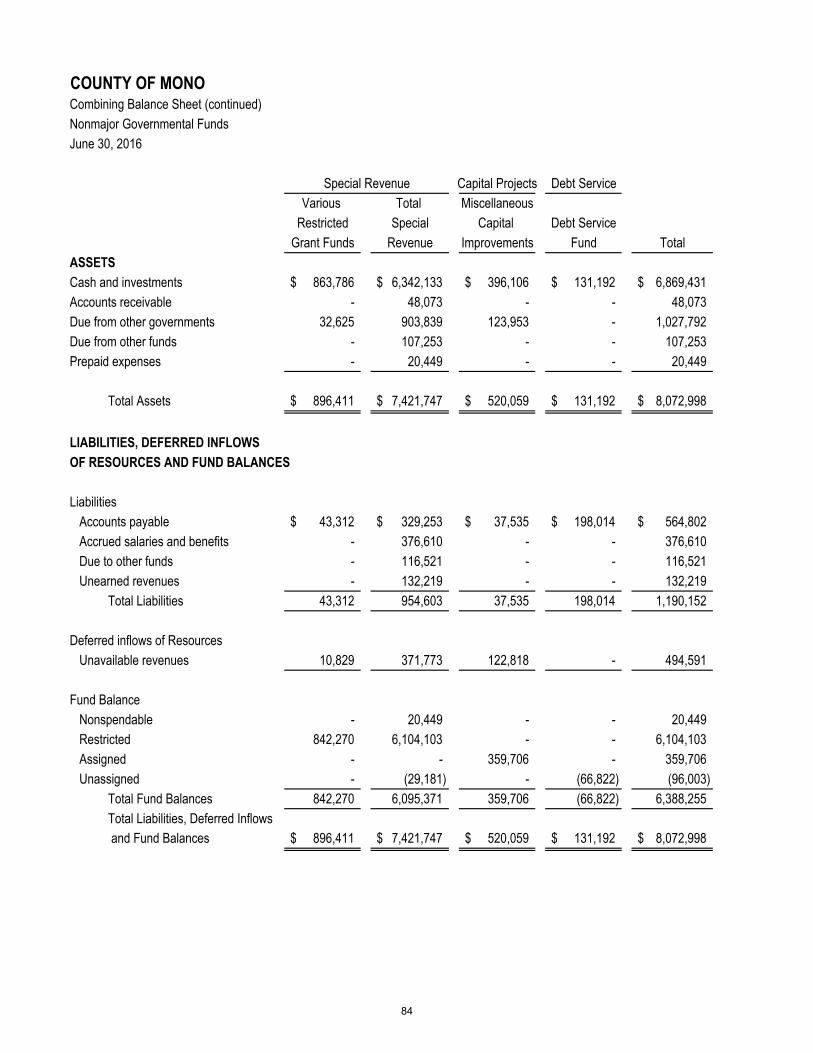
COUNTY OF MONO
Combining Balance Sheet (continued)
Nonmajor Governmental Funds
June 30, 2016
Capital Projects Debt Service
Various Total Miscellaneous
Restricted Special Capital Debt Service
Grant Funds Revenue Improvements Fund Total
ASSETS
Cash and investments 863,786$ 6,342,133$ 396,106$ 131,192$ 6,869,431$
Accounts receivable - 48,073 - - 48,073
Due from other governments 32,625 903,839 123,953 - 1,027,792
Due from other funds - 107,253 - - 107,253
Prepaid expenses - 20,449 - - 20,449
Total Assets 896,411$ 7,421,747$ 520,059$ 131,192$ 8,072,998$
LIABILITIES, DEFERRED INFLOWS
OF RESOURCES AND FUND BALANCES
Liabilities
Accounts payable 43,312$ 329,253$ 37,535$ 198,014$ 564,802$
Accrued salaries and benefits - 376,610 - - 376,610
Due to other funds - 116,521 - - 116,521
Unearned revenues - 132,219 - - 132,219
Total Liabilities 43,312 954,603 37,535 198,014 1,190,152
Deferred inflows of Resources
Unavailable revenues 10,829 371,773 122,818 - 494,591
Fund Balance
Nonspendable - 20,449 - - 20,449
Restricted 842,270 6,104,103 - - 6,104,103
Assigned - - 359,706 - 359,706
Unassigned - (29,181) - (66,822) (96,003)
Total Fund Balances 842,270 6,095,371 359,706 (66,822) 6,388,255
Total Liabilities, Deferred Inflows
and Fund Balances 896,411$ 7,421,747$ 520,059$ 131,192$ 8,072,998$
Special Revenue
84

COUNTY OF MONOCombining Statement of Revenues, Expenditures
and Changes in Fund Balances
Nonmajor Governmental Funds
For the Year Ended June 30, 2016
Public Behavioral Social
Health Health Services CDBG
REVENUES
Taxes -$ -$ -$ -$
Licenses and permits 278,875 - - -
Fines, forfeitures and penalties 1,341 6,586 - -
Use of money and property 2,159 4,820 7,966 -
Intergovernmental 2,113,276 1,056,162 3,688,598 187,000
Charges for services 258,044 164,274 127,208 -
Miscellaneous 16,856 1,504 4,308 -
Total Revenues 2,670,551 1,233,346 3,828,080 187,000
EXPENDITURES
Current
General government - - - -
Public protection - - - -
Health and sanitation 2,778,512 1,267,229 - -
Public assistance - - 4,427,327 -
Debt service
Principal - - - -
Interest and issuance cost - - - -
Capital outlay - - - -
Total Expenditures 2,778,512 1,267,229 4,427,327 -
Excess (Deficiency) of Revenues
Over (Under) Expenditures (107,961) (33,883) (599,247) 187,000
OTHER FINANCING SOURCES (USES)
Transfers in 16,924 37,372 1,270,272 -
Transfers out (58,426) (4,905) (26,989) -
Total Other Financing Sources (Uses) (41,502) 32,467 1,243,283 -
NET CHANGE IN FUND BALANCES (149,463) (1,416) 644,036 187,000
Fund Balances, Beginning of Year 362,809 732,027 526,192 -
FUND BALANCES, END OF THE YEAR 213,346$ 730,611$ 1,170,228$ 187,000$
continued
Special Revenue
85
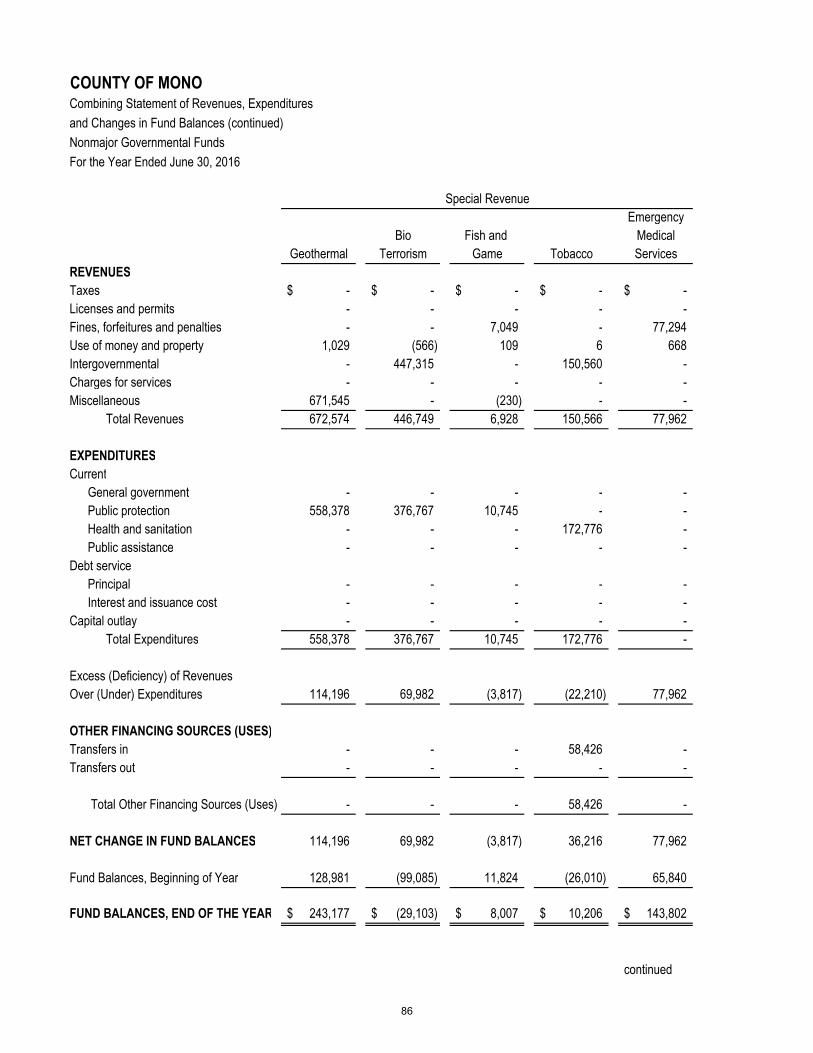
COUNTY OF MONOCombining Statement of Revenues, Expenditures
and Changes in Fund Balances (continued)
Nonmajor Governmental Funds
For the Year Ended June 30, 2016
Emergency
Bio Fish and Medical
Geothermal Terrorism Game Tobacco Services
REVENUES
Taxes -$ -$ -$ -$ -$
Licenses and permits - - - - -
Fines, forfeitures and penalties - - 7,049 - 77,294
Use of money and property 1,029 (566) 109 6 668
Intergovernmental - 447,315 - 150,560 -
Charges for services - - - - -
Miscellaneous 671,545 - (230) - -
Total Revenues 672,574 446,749 6,928 150,566 77,962
EXPENDITURES
Current
General government - - - - -
Public protection 558,378 376,767 10,745 - -
Health and sanitation - - - 172,776 -
Public assistance - - - - -
Debt service
Principal - - - - -
Interest and issuance cost - - - - -
Capital outlay - - - - -
Total Expenditures 558,378 376,767 10,745 172,776 -
Excess (Deficiency) of Revenues
Over (Under) Expenditures 114,196 69,982 (3,817) (22,210) 77,962
OTHER FINANCING SOURCES (USES)
Transfers in - - - 58,426 -
Transfers out - - - - -
Total Other Financing Sources (Uses) - - - 58,426 -
NET CHANGE IN FUND BALANCES 114,196 69,982 (3,817) 36,216 77,962
Fund Balances, Beginning of Year 128,981 (99,085) 11,824 (26,010) 65,840
FUND BALANCES, END OF THE YEAR 243,177$ (29,103)$ 8,007$ 10,206$ 143,802$
continued
Special Revenue
86

COUNTY OF MONOCombining Statement of Revenues, Expenditures
and Changes in Fund Balances (continued)
Nonmajor Governmental Funds
For the Year Ended June 30, 2016
County
Mitigation Service Development
Fee Area Impact
REVENUES
Taxes -$ 199,311$ -$
Licenses and permits - - -
Fines, forfeitures and penalties - - -
Use of money and property 999 20,818 1,757
Intergovernmental - - -
Charges for services - 130,807 -
Miscellaneous - 11,255 -
Total Revenues 999 362,191 1,757
EXPENDITURES
Current
General government - 347,699 -
Public protection - - -
Health and sanitation - - -
Public assistance - - -
Debt service
Principal - - -
Interest and issuance cost - - -
Capital outlay - - -
Total Expenditures - 347,699 -
Excess (Deficiency) of Revenues
Over (Under) Expenditures 999 14,492 1,757
OTHER FINANCING SOURCES (USES)
Transfers in - - -
Transfers out - - -
Total Other Financing Sources (Uses) - - -
NET CHANGE IN FUND BALANCES 999 14,492 1,757
Fund Balances, Beginning of Year 119,292 2,229,499 209,788
FUND BALANCES, END OF THE YEAR 120,291$ 2,243,991$ 211,545$
continued
87
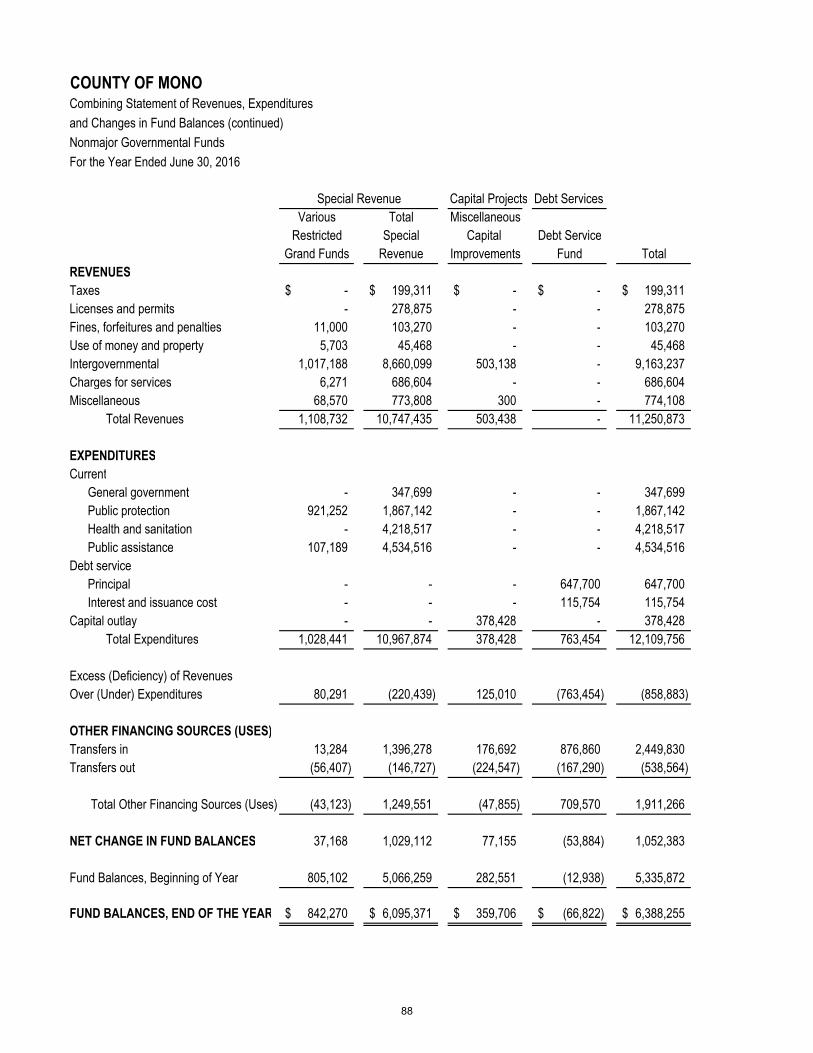
COUNTY OF MONOCombining Statement of Revenues, Expenditures
and Changes in Fund Balances (continued)
Nonmajor Governmental Funds
For the Year Ended June 30, 2016
Capital Projects Debt Services
Various Total Miscellaneous
Restricted Special Capital Debt Service
Grand Funds Revenue Improvements Fund Total
REVENUES
Taxes -$ 199,311$ -$ -$ 199,311$
Licenses and permits - 278,875 - - 278,875
Fines, forfeitures and penalties 11,000 103,270 - - 103,270
Use of money and property 5,703 45,468 - - 45,468
Intergovernmental 1,017,188 8,660,099 503,138 - 9,163,237
Charges for services 6,271 686,604 - - 686,604
Miscellaneous 68,570 773,808 300 - 774,108
Total Revenues 1,108,732 10,747,435 503,438 - 11,250,873
EXPENDITURES
Current
General government - 347,699 - - 347,699
Public protection 921,252 1,867,142 - - 1,867,142
Health and sanitation - 4,218,517 - - 4,218,517
Public assistance 107,189 4,534,516 - - 4,534,516
Debt service
Principal - - - 647,700 647,700
Interest and issuance cost - - - 115,754 115,754
Capital outlay - - 378,428 - 378,428
Total Expenditures 1,028,441 10,967,874 378,428 763,454 12,109,756
Excess (Deficiency) of Revenues
Over (Under) Expenditures 80,291 (220,439) 125,010 (763,454) (858,883)
OTHER FINANCING SOURCES (USES)
Transfers in 13,284 1,396,278 176,692 876,860 2,449,830
Transfers out (56,407) (146,727) (224,547) (167,290) (538,564)
Total Other Financing Sources (Uses) (43,123) 1,249,551 (47,855) 709,570 1,911,266
NET CHANGE IN FUND BALANCES 37,168 1,029,112 77,155 (53,884) 1,052,383
Fund Balances, Beginning of Year 805,102 5,066,259 282,551 (12,938) 5,335,872
FUND BALANCES, END OF THE YEAR 842,270$ 6,095,371$ 359,706$ (66,822)$ 6,388,255$
Special Revenue
88
NONMAJOR ENTERPRISE FUNDS
Enterprise Funds are used to account for operations that are financed and operated in a manner similar to private
business enterprises where the intent of the governing body is that the costs of providing goods or services to the
general public on a continuing basis be financed primarily through user charges; or where the County has decided
that periodic determination of revenues earned, expenses incurred and/or net income is appropriate for capital
maintenance, public policy, management control, accountability or other purposes.
89

THIS PAGE INTENTIONALLY LEFT BLANK
90

COUNTY OF MONO
Combining Statement of Net Position
Nonmajor Enterprise Funds
June 30, 2016
Campgrounds Cemeteries Total
ASSETS
Current Assets
Pooled cash and investments 61,805$ 20,012$ 81,817$
Accounts receivable 455 - 455
Total Assets 62,260 20,012 82,272
LIABILITIES
Current Liabilities
Accounts payable 1,555 - 1,555
Total Liabilities 1,555 - 1,555
NET POSITION
Restricted - 30,222 30,222
Unrestricted 60,705 (10,210) 50,495
Total Net Position 60,705$ 20,012$ 80,717$
91

COUNTY OF MONO
Combining Statement of Revenues, Expenses and Changes in Net Position
Nonmajor Enterprise Funds
For the Year Ended June 30, 2016
Campgrounds Cemeteries Total
OPERATING REVENUES
Charges for services 39,376$ 70$ 39,446$
Total Operating Revenues 39,376 70 39,446
OPERATING EXPENSES
Services and supplies 22,590 15,703 38,293
Total Operating Expenses 22,590 15,703 38,293
Operating Income (loss) 16,786 (15,633) 1,153
NON-OPERATING REVENUES (EXPENSES)
Interest income (expenses) 470 241 711
Total Non-Operating Revenues 470 241 711
CHANGE IN NET POSITION 17,256 (15,392) 1,864
Net Position, Beginning of Year 43,449 35,404 78,853
NET POSITION, END OF YEAR 60,705$ 20,012$ 80,717$
92
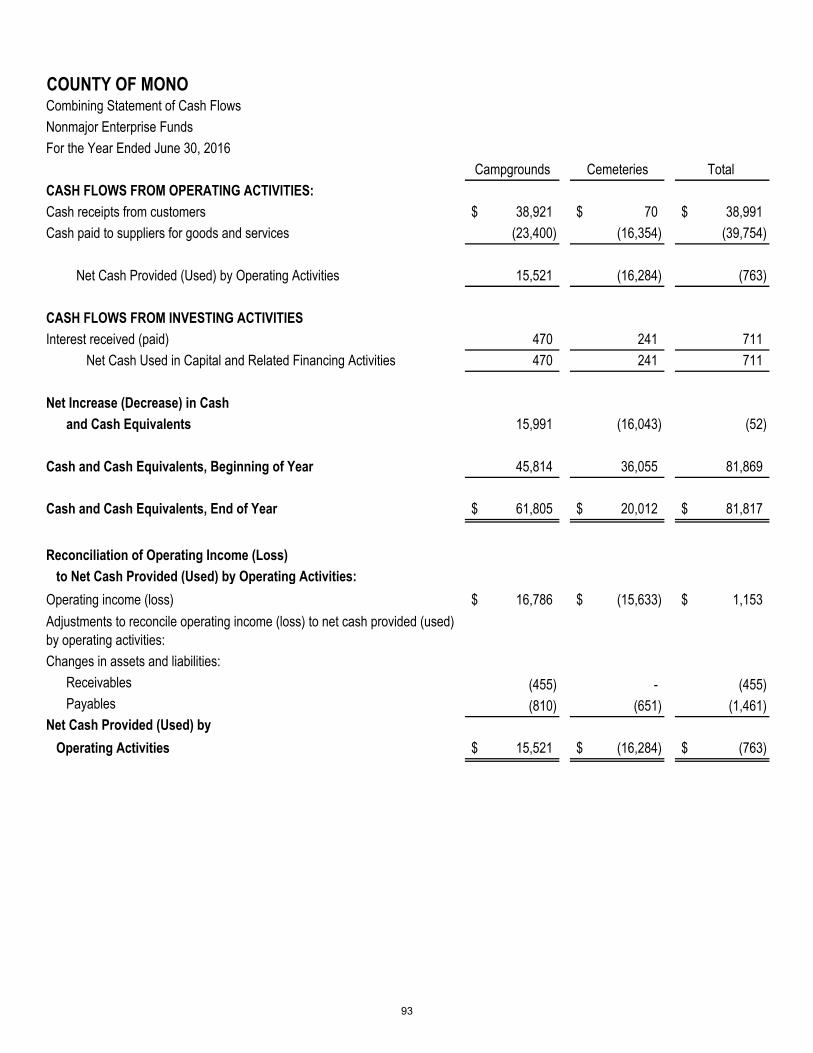
COUNTY OF MONOCombining Statement of Cash Flows
Nonmajor Enterprise Funds
For the Year Ended June 30, 2016
Campgrounds Cemeteries Total
CASH FLOWS FROM OPERATING ACTIVITIES:
Cash receipts from customers 38,921$ 70$ 38,991$
Cash paid to suppliers for goods and services (23,400) (16,354) (39,754)
Net Cash Provided (Used) by Operating Activities 15,521 (16,284) (763)
CASH FLOWS FROM INVESTING ACTIVITIES
Interest received (paid) 470 241 711
Net Cash Used in Capital and Related Financing Activities 470 241 711
Net Increase (Decrease) in Cash
and Cash Equivalents 15,991 (16,043) (52)
Cash and Cash Equivalents, Beginning of Year 45,814 36,055 81,869
Cash and Cash Equivalents, End of Year 61,805$ 20,012$ 81,817$
Reconciliation of Operating Income (Loss)
to Net Cash Provided (Used) by Operating Activities:
Operating income (loss) 16,786$ (15,633)$ 1,153$
Adjustments to reconcile operating income (loss) to net cash provided (used)
by operating activities:
Changes in assets and liabilities:
Receivables (455) - (455)
Payables (810) (651) (1,461)
Net Cash Provided (Used) by
Operating Activities 15,521$ (16,284)$ (763)$
93

THIS PAGE INTENTIONALLY LEFT BLANK
94

INTERNAL SERVICE FUNDS
Internal Service Funds are used to account for the financing of goods or services provided by one department or
agency to other departments or agencies of the government and to other government units, on a cost reimbursement
basis.
95

THIS PAGE INTENTIONALLY LEFT BLANK
96
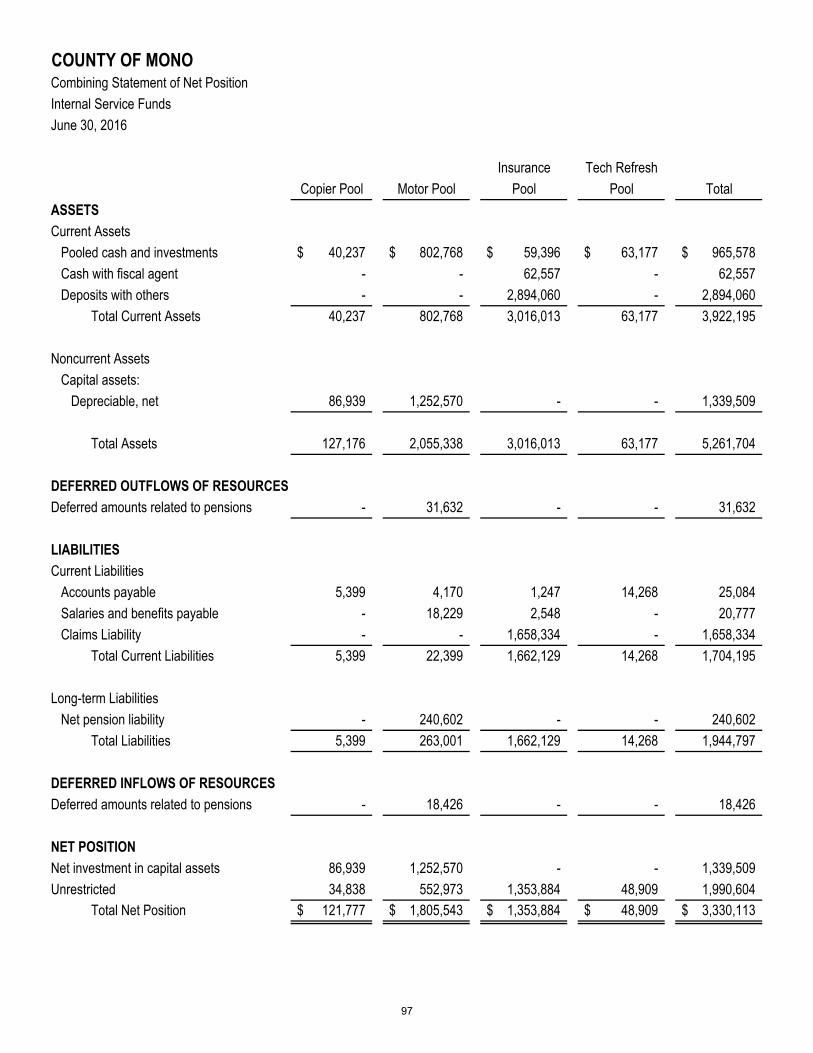
COUNTY OF MONO
Combining Statement of Net Position
Internal Service Funds
June 30, 2016
Insurance Tech Refresh
Copier Pool Motor Pool Pool Pool Total
ASSETS
Current Assets
Pooled cash and investments 40,237$ 802,768$ 59,396$ 63,177$ 965,578$
Cash with fiscal agent - - 62,557 - 62,557
Deposits with others - - 2,894,060 - 2,894,060
Total Current Assets 40,237 802,768 3,016,013 63,177 3,922,195
Noncurrent Assets
Capital assets:
Depreciable, net 86,939 1,252,570 - - 1,339,509
Total Assets 127,176 2,055,338 3,016,013 63,177 5,261,704
DEFERRED OUTFLOWS OF RESOURCES
Deferred amounts related to pensions - 31,632 - - 31,632
LIABILITIES
Current Liabilities
Accounts payable 5,399 4,170 1,247 14,268 25,084
Salaries and benefits payable - 18,229 2,548 - 20,777
Claims Liability - - 1,658,334 - 1,658,334
Total Current Liabilities 5,399 22,399 1,662,129 14,268 1,704,195
Long-term Liabilities
Net pension liability - 240,602 - - 240,602
Total Liabilities 5,399 263,001 1,662,129 14,268 1,944,797
DEFERRED INFLOWS OF RESOURCES
Deferred amounts related to pensions - 18,426 - - 18,426
NET POSITION
Net investment in capital assets 86,939 1,252,570 - - 1,339,509
Unrestricted 34,838 552,973 1,353,884 48,909 1,990,604
Total Net Position 121,777$ 1,805,543$ 1,353,884$ 48,909$ 3,330,113$
97

COUNTY OF MONOCombining Statement of Revenues, Expenses and
Changes in Net Position
Internal Service Funds
For the Year Ended June 30, 2016
Copier Insurance Tech Refresh
Pool Motor Pool Pool Pool Total
OPERATING REVENUES
Charges for services 91,576 654,319 1,092,049 74,138 1,912,082
TotalOperating Revenues 91,576 654,319 1,092,049 74,138 1,912,082
OPERATING EXPENSES
Salaries and benefits - 329,787 49,687 - 379,474
Services and supplies 51,977 132,195 1,585,465 53,459 1,823,096
Depreciation 21,019 425,638 - - 446,657
Total Operating Expenses 72,996 887,620 1,635,152 53,459 2,649,227
Operating Income (Loss) 18,580 (233,301) (543,103) 20,679 (737,145)
NON-OPERATING REVENUES (EXPENSES)
Interest income (expense) 153 5,348 21,237 421 27,159
Sale of capital assets - 31,552 - - 31,552
Miscellaneous - 4,297 47,856 - 52,153
Total Non-Operating Revenues 153 41,197 69,093 421 110,864
INCOME (LOSS) BEFORE TRANSFERS 18,733 (192,104) (474,010) 21,100 (626,281)
Transfers in - 224,547 - - 224,547
CHANGE IN NET POSITION 18,733 32,443 (474,010) 21,100 (401,734)
Net Position, Beginning of Year, restated 103,044 1,773,100 1,827,894 27,809 3,731,847
NET POSITION, END OF YEAR 121,777$ 1,805,543$ 1,353,884$ 48,909$ 3,330,113$
98

COUNTY OF MONOCombining Statement of Cash Flows
Internal Service Funds
For the Year Ended June 30, 2016Insurance Tech Refresh
Copier Pool Motor Pool Pool Pool Total
CASH FLOWS FROM OPERATING ACTIVITIES:
Cash receipts from interfund services provided 91,576$ 654,319$ 830,821$ 74,138$ 1,650,854$
Cash paid to employees for services - (210,220) (50,901) - (261,121)
Cash paid to suppliers for goods and services (53,581) (362,513) (927,509) (39,191) (1,382,794)
Net Cash Provided (Used) by Operating Activities 37,995 81,586 (147,589) 34,947 6,939
CASH FLOWS FROM NONCAPITAL FINANCING
ACTIVITIES
Other revenues - 4,297 47,856 - 52,153
Net Cash Provided (Used) by Noncapital Financing - 4,297 47,856 - 52,153
CASH FLOWS FROM CAPITAL AND RELATED
FINANCING ACTIVITIES
Payments related to the acquisition of capital assets (38,325) (596,925) - - (635,250)
Transfers in - 224,547 - - 224,547
Sale of capital assets - 31,552 - - 31,552
Net Cash Provided (Used) by Capital and Related
Financing Activities (38,325) (340,826) - - (379,151)
CASH FLOWS FROM INVESTING ACTIVITIES
Interest received (paid) 153 5,348 21,237 421 27,159
Net Cash Provided by Investing Activities 153 5,348 21,237 421 27,159
Net Increase (Decrease) in Cash
and Cash Equivalents (177) (249,595) (78,496) 35,368 (292,900)
Cash and Cash Equivalents, Beginning of Year 40,414 1,052,363 200,449 27,809 1,321,035
- Cash and Cash Equivalents, End of Year 40,237$ 802,768$ 121,953$ 63,177$ 1,028,135$
Reconciliation of Operating Income (Loss)
to Net Cash Provided (Used) by Operating Activities
Operating income (loss) 18,580$ (233,301)$ (543,103)$ 20,679$ (737,145)$ Adjustments to reconcile operating income (loss) to net cash
Depreciation 21,019 425,638 - - 446,657 Changes in assets and liabilities
Deposits with others - - 120,244 - 120,244 Deferred outflows - (36,379) - - (36,379) Claims liability - - 275,237 - 275,237 Accrued salaries and benefits - 2,531 (1,214) - 1,317 Payables (1,604) (230,318) 1,247 14,268 (216,407) Net Pension liability - 139,903 - - 139,903 Deferred inflows - 13,512 - - 13,512
Net Cash Provided (Used) by
Operating Activities 37,995$ 81,586$ (147,589)$ 34,947$ 6,939$
99

THIS PAGE INTENTIONALLY LEFT BLANK
100
INVESTMENT TRUST FUND
The Investment Trust Fund accounts for the assets of legally separate entities that deposit cash with the County
Treasurer. These entities include school and community college districts, other special districts governed by local
boards, regional boards and authorities and pass through funds for tax collections for cities. These funds represent
the assets, primarily cash and investments, and the related liability of the County to disburse these monies on
demand.
101

THIS PAGE INTENTIONALLY LEFT BLANK
102

COUNTY OF MONO
Combining Statement of Fiduciary Net Position
Investment Trust Fund
June 30, 2016
Local School
Districts Funds Total
ASSETS
Pooled cash and investments 15,984,664$ 22,921,160$ 38,905,824$
Total Assets 15,984,664$ 22,921,160$ 38,905,824$
NET POSITION
Net position held in trust for investment
pool participants 15,984,664$ 22,921,160$ 38,905,824$
103
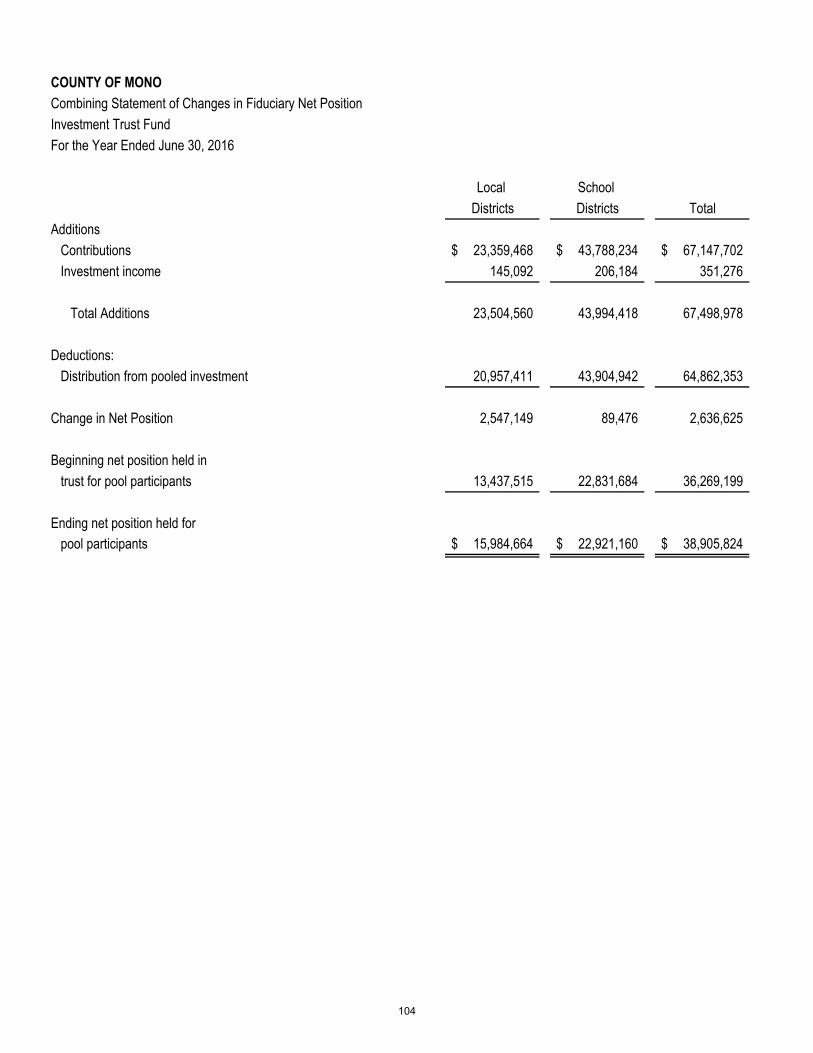
COUNTY OF MONO
Combining Statement of Changes in Fiduciary Net Position
Investment Trust Fund
For the Year Ended June 30, 2016
Local School
Districts Districts Total
Additions
Contributions 23,359,468$ 43,788,234$ 67,147,702$
Investment income 145,092 206,184 351,276
Total Additions 23,504,560 43,994,418 67,498,978
Deductions:
Distribution from pooled investment 20,957,411 43,904,942 64,862,353
Change in Net Position 2,547,149 89,476 2,636,625
Beginning net position held in
trust for pool participants 13,437,515 22,831,684 36,269,199
Ending net position held for
pool participants 15,984,664$ 22,921,160$ 38,905,824$
104

STATISTICAL SECTION (UNAUDITED)

THIS PAGE INTENTIONALLY LEFT BLANK

Current Percent
Fiscal Secured Taxes Percent Delinquent Total of Levy
Year Tax Levy Collected of Levy Collections Collections Collected
1992-93 $ 5,677,052 $ 5,939,621 103.30% $ 255,980 $ 6,195,601 107.75%
1993-94 4,841,678 5,066,272 104.64% 217,070 5,283,342 109.12%
1994-95 5,047,309 5,372,192 106.44% 228,890 5,601,082 110.97%
1995-96 4,962,551 5,024,418 101.19% 238,335 5,262,753 106.12%
1996-97 5,309,141 5,243,350 98.76% 156,743 5,400,093 101.71%
1997-98 5,977,025 5,236,546 87.61% 175,404 5,411,950 90.55%
1998-99 6,120,181 5,420,929 88.57% 185,983 5,606,912 91.61%
1999-00 6,420,655 5,699,096 88.77% 166,327 5,865,423 91.35%
2000-01 6,880,850 6,464,711 93.95% 139,088 660,379 95.97%
2001-02 7,073,947 6,992,736 98.85% 151,339 7,144,075 100.99%
2002-03 8,271,224 8,307,872 100.44% 250,939 8,558,811 103.48%
2003-04 8,426,505 8,523,576 101.15% 69,133 8,592,709 101.97%
2004-05 9,536,891 9,449,034 99.08% 58,669 9,507,703 99.69%
2005-06 11,362,185 10,892,350 95.86% 85,125 10,977,475 96.61%
2006-07 13,630,827 13,805,122 101.28% 122,857 13,927,980 102.18%
2007-08 15,706,796 16,120,226 102.63% 85,260 16,205,486 103.17%
2008-09 17,388,237 16,726,245 96.19% 145,777 16,872,022 97.03%
2009-10 17,600,670 16,124,835 91.61% 604,423 16,729,257 95.05%
2010-11 16,514,331 14,230,471 86.17% 578,940 14,809,410 89.68%
2011-12 14,392,453 14,296,942 99.34% 505,527 14,802,468 102.85%
2012-13 15,368,593 15,038,334 97.85% 340,237 15,378,571 100.06%
2013-14 15,889,566 14,384,146 90.53% 435,043 14,819,189 93.26%
2014-15 16,152,775 15,713,842 97.28% 205,656 15,919,498 98.56%
2015-16 16,486,505 16,415,898 99.57% 199,666 16,615,564 100.78%
COUNTY OF MONO
Tax Levies and Collections
General Fund Secured Roll
1992-93 through 2015-16
** Includes all charges, paid and unpaid. Redeemed delinquent taxes now included in taxes collected section.105

Real Property Personal
Fiscal Year Inc. HOPTR % Chg Property % Chg Total % Chg
1992-93 $ 1,475,079,312 $ 235,660,094 $ 1,710,739,406
1993-94 1,528,919,793 3.65% 242,890,893 3.07% 1,771,810,686 3.57%
1994-95 1,596,913,764 4.45% 231,701,331 -4.61% 1,828,615,095 3.21%
1995-96 1,592,321,372 -0.29% 215,419,598 -7.03% 1,807,740,970 -1.14%
1996-97 1,597,912,626 0.35% 224,837,451 4.37% 1,822,750,077 0.83%
1977-98 1,632,980,213 2.19% 225,309,948 0.21% 1,858,290,161 1.95%
1998-99 1,676,009,395 2.64% 229,640,519 1.92% 1,905,649,914 2.55%
1999-00 1,779,593,856 6.18% 229,350,947 -0.13% 2,008,944,803 5.42%
2000-01 1,989,414,352 11.79% 196,039,081 -14.52% 2,185,453,433 8.79%
2001-02 2,215,280,910 11.35% 224,479,974 14.51% 2,439,760,884 11.64%
2002-03 2,430,999,676 9.74% 252,782,477 12.61% 2,683,782,153 10.00%
2003-04 2,762,004,268 13.62% 265,105,692 4.88% 3,027,109,960 12.79%
2004-05 3,085,979,775 11.73% 267,934,406 1.07% 3,353,914,181 10.80%
2005-06 3,550,462,443 15.05% 260,084,308 -2.93% 3,810,546,751 13.61%
2006-07 4,278,126,257 20.49% 281,570,435 8.26% 4,559,696,692 19.66%
2007-08 5,015,813,891 17.24% 302,045,338 7.27% 5,317,859,229 16.63%
2008-09 5,554,102,507 10.73% 318,725,408 5.52% 5,872,827,915 10.44%
2009-10 5,634,656,131 1.45% 282,290,022 -11.43% 5,916,946,153 0.75%
2010-11 5,096,159,613 -9.56% 418,506,072 48.25% 5,514,665,685 -6.80%
2011-12 4,964,600,710 -2.58% 413,444,230 -1.21% 5,378,044,940 -2.48%
2012-13 4,957,878,484 -0.14% 360,781,678 -12.74% 5,318,660,162 -1.10%
2013-14 4,911,028,555 -0.94% 383,101,102 6.19% 5,294,129,657 -0.46%
2014-15 4,990,657,506 1.62% 392,756,377 2.52% 5,383,413,883 1.69%
2015-16 5,106,845,276 2.33% 389,673,020 -0.79% 5,496,518,296 2.10%
COUNTY OF MONO
Property Tax Value Allocation Collection
1992-93 through 2015-16
AB-8 VALUES
106
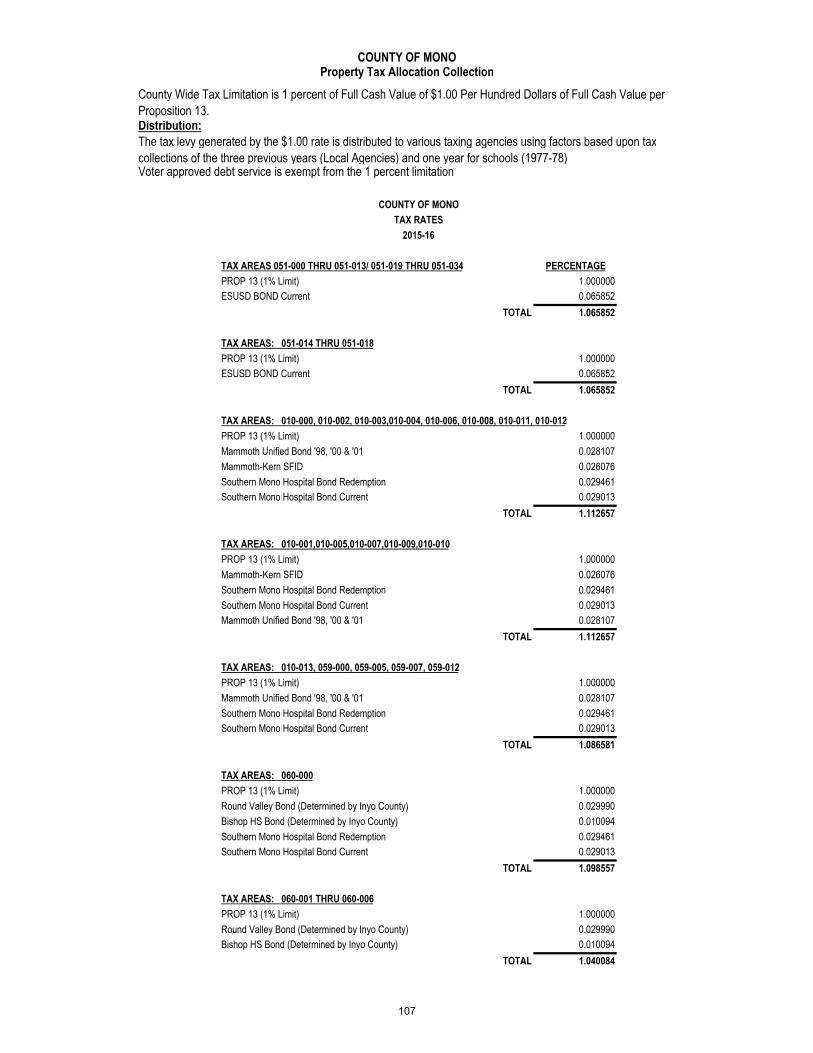
Distribution:
TAX AREAS 051-000 THRU 051-013/ 051-019 THRU 051-034 PERCENTAGE
PROP 13 (1% Limit) 1.000000
ESUSD BOND Current 0.065852
TOTAL 1.065852
TAX AREAS: 051-014 THRU 051-018
PROP 13 (1% Limit) 1.000000
ESUSD BOND Current 0.065852
TOTAL 1.065852
TAX AREAS: 010-000, 010-002, 010-003,010-004, 010-006, 010-008, 010-011, 010-012
PROP 13 (1% Limit) 1.000000
Mammoth Unified Bond '98, '00 & '01 0.028107
Mammoth-Kern SFID 0.026076
Southern Mono Hospital Bond Redemption 0.029461
Southern Mono Hospital Bond Current 0.029013
TOTAL 1.112657
TAX AREAS: 010-001,010-005,010-007,010-009,010-010
PROP 13 (1% Limit) 1.000000
Mammoth-Kern SFID 0.026076
Southern Mono Hospital Bond Redemption 0.029461
Southern Mono Hospital Bond Current 0.029013
Mammoth Unified Bond '98, '00 & '01 0.028107
TOTAL 1.112657
TAX AREAS: 010-013, 059-000, 059-005, 059-007, 059-012
PROP 13 (1% Limit) 1.000000
Mammoth Unified Bond '98, '00 & '01 0.028107
Southern Mono Hospital Bond Redemption 0.029461
Southern Mono Hospital Bond Current 0.029013
TOTAL 1.086581
TAX AREAS: 060-000
PROP 13 (1% Limit) 1.000000
Round Valley Bond (Determined by Inyo County) 0.029990
Bishop HS Bond (Determined by Inyo County) 0.010094
Southern Mono Hospital Bond Redemption 0.029461
Southern Mono Hospital Bond Current 0.029013
TOTAL 1.098557
TAX AREAS: 060-001 THRU 060-006
PROP 13 (1% Limit) 1.000000
Round Valley Bond (Determined by Inyo County) 0.029990
Bishop HS Bond (Determined by Inyo County) 0.010094
TOTAL 1.040084
COUNTY OF MONO
TAX RATES
2015-16
COUNTY OF MONOProperty Tax Allocation Collection
County Wide Tax Limitation is 1 percent of Full Cash Value of $1.00 Per Hundred Dollars of Full Cash Value per
Proposition 13.
The tax levy generated by the $1.00 rate is distributed to various taxing agencies using factors based upon tax
collections of the three previous years (Local Agencies) and one year for schools (1977-78).Voter approved debt service is exempt from the 1 percent limitation.
107

Town Schools
of Mammoth Library Special
Fiscal Year County Lakes and ERAF Districts Total
1992-93 38.10% 2.93% 31.80% 27.17% 100.00%
1993-94 32.52% 3.02% 41.18% 23.28% 100.00%
1994-95 31.89% 3.03% 41.52% 23.56% 100.00%
1995-96 31.17% 3.96% 42.34% 22.53% 100.00%
1996-97 32.41% 3.07% 42.67% 21.85% 100.00%
1997-98 33.60% 3.05% 41.27% 22.08% 100.00%
1998-99 31.86% 3.06% 41.28% 23.80% 100.00%
1999-00 31.70% 3.19% 41.04% 24.07% 100.00%
2000-01 31.45% 3.58% 40.40% 24.57% 100.00%
2001-02 30.97% 3.64% 40.79% 24.60% 100.00%
2002-03 30.75% 3.74% 40.79% 24.72% 100.00%
2003-04 30.51% 3.89% 40.64% 24.96% 100.00%
2004-05 30.32% 4.00% 40.51% 25.17% 100.00%
2005-06 30.04% 4.17% 42.01% 23.78% 100.00%
2006-07 29.78% 4.29% 41.84% 24.08% 100.00%
2007-08 29.60% 4.43% 40.06% 25.91% 100.00%
2008-09 29.51% 4.50% 40.01% 25.97% 100.00%
2009-10 29.65% 4.46% 40.18% 25.71% 100.00%
2010-11 29.85% 4.37% 40.37% 25.42% 100.00%
2011-12 29.85% 4.36% 42.06% 23.73% 100.00%
2012-13 29.96% 4.30% 40.18% 25.56% 100.00%
2013-14 30.01% 4.29% 42.22% 23.48% 100.00%
2014-15 30.00% 4.30% 40.54% 25.16% 100.00%
2015-16 29.99% 4.30% 42.21% 23.50% 100.00%
COUNTY OF MONO
Distribution of Pooled Property Tax
1992-93 through 2015-16
108

School
Districts and
Fiscal Town of Augmentation Special
Year Secured Unsecured Mammoth Fund Districts Totals
1992-93 $ 5,939,621 $ 862,128 $ 522,068 $ 6,716,833 $ 5,361,881 $ 19,402,531
1993-94 5,066,272 755,388 540,072 6,802,385 5,701,810 18,865,927
1994-95 5,372,192 741,145 577,391 8,161,950 5,785,370 20,638,048
1995-96 5,024,418 682,488 759,583 8,283,649 4,268,796 19,018,934
1996-97 5,243,350 729,092 583,068 7,768,595 472,288 14,796,393
1997-98 5,448,545 719,526 571,570 7,730,443 4,451,114 18,921,198
1998-99 5,582,040 731,930 588,337 7,930,027 4,572,566 19,404,900
1999-00 5,778,043 723,824 647,065 8,306,363 4,794,903 20,250,198
2000-01 6,264,163 616,687 782,357 8,817,667 5,238,415 21,719,289
2001-02 7,073,947 695,136 825,121 7,085,768 5,591,710 21,271,682
2002-03 7,534,894 772,978 953,355 11,204,067 6,080,626 26,545,920
2003-04 8,523,576 807,741 1,158,647 12,615,367 6,936,400 30,041,730
2004-05* 9,449,034 706,107 1,348,916 13,642,275 7,916,718 33,063,050
2005-06* 11,455,149 765,220 1,592,687 16,021,241 9,067,830 38,902,127
2006-07* 12,910,660 894,463 2,295,078 18,389,553 11,787,382 46,277,136
2007-08* 14,515,638 870,916 2,624,774 22,147,747 12,860,888 53,019,963
2008-09* 14,933,794 ** 919,168 ** 2,653,891 ** 23,571,923 ** 15,301,520 ** 57,380,296
2009-10* 15,165,933 ** 1,260,670 ** 2,417,595 ** 25,336,531 ** 11,152,009 ** 55,332,738
2010-11* 15,209,742 ** 2,409,465 ** 2,409,465 ** 22,262,705 ** 12,855,279 ** 55,146,657
2011-12* 14,822,535 ** 1,288,349 ** 2,355,391 ** 22,694,146 ** 12,800,764 ** 53,961,185
2012-13* 14,814,123 ** 1,122,030 ** 2,286,660 ** 22,419,290 ** 12,544,531 ** 53,186,634
2013-14* 14,697,811 ** 1,149,583 ** 2,269,698 ** 22,354,923 ** 12,476,495 ** 52,948,509
2014-15* 14,935,887 ** 1,146,281 ** 2,341,781 ** 21,402,568 ** 14,014,837 ** 53,841,353
2015-16* 15,801,348 1,164,420 2,369,745 22,847,929 12,844,465 55,027,908
After June 30, property is transferred to the delinquent roll. Beginning July 1, additional penalties of 1% per month for the first year and 1/2% per
month thereafter until the property is redeemed. After five years, the property may be sold for taxes due.
Taxes may be paid in two installments. First installment is due November 1, and becomes delinquent on December 10, with 10% penalty added.
Second installment is due February 1, and becomes delinquent on April 10, with 10% penalty and $10.00 per parcel added for costs.
General Fund Secured and Unsecured
1992-93 through 2015-16
County General Fund
The lien or assessment date is the first Monday in January
COUNTY OF MONO
Tax Collections
** These figures are based upon the AB-8 Allocation and not actual receipts
* Triple-Flip Adjustments not recognized in these figures
109
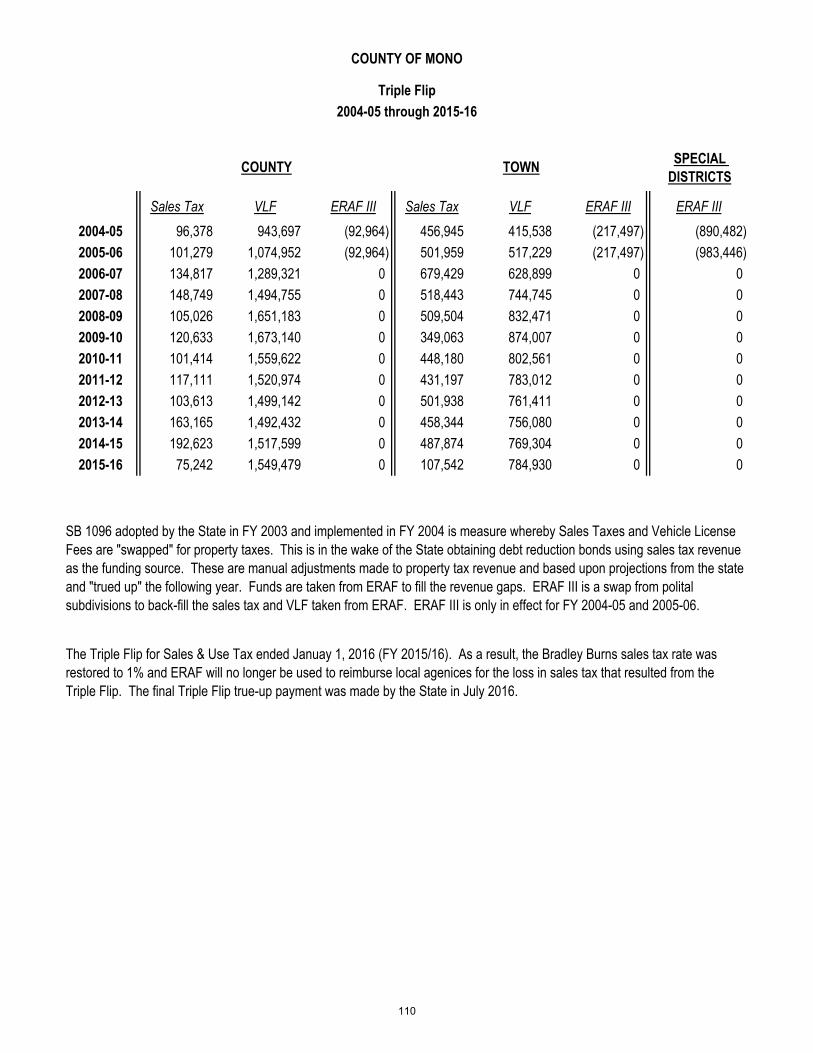
SPECIAL
DISTRICTS
Sales Tax VLF ERAF III Sales Tax VLF ERAF III ERAF III
2004-05 96,378 943,697 (92,964) 456,945 415,538 (217,497) (890,482)
2005-06 101,279 1,074,952 (92,964) 501,959 517,229 (217,497) (983,446)
2006-07 134,817 1,289,321 0 679,429 628,899 0 0
2007-08 148,749 1,494,755 0 518,443 744,745 0 0
2008-09 105,026 1,651,183 0 509,504 832,471 0 0
2009-10 120,633 1,673,140 0 349,063 874,007 0 0
2010-11 101,414 1,559,622 0 448,180 802,561 0 0
2011-12 117,111 1,520,974 0 431,197 783,012 0 0
2012-13 103,613 1,499,142 0 501,938 761,411 0 0
2013-14 163,165 1,492,432 0 458,344 756,080 0 0
2014-15 192,623 1,517,599 0 487,874 769,304 0 0
2015-16 75,242 1,549,479 0 107,542 784,930 0 0
SB 1096 adopted by the State in FY 2003 and implemented in FY 2004 is measure whereby Sales Taxes and Vehicle License
Fees are "swapped" for property taxes. This is in the wake of the State obtaining debt reduction bonds using sales tax revenue
as the funding source. These are manual adjustments made to property tax revenue and based upon projections from the state
and "trued up" the following year. Funds are taken from ERAF to fill the revenue gaps. ERAF III is a swap from polital
subdivisions to back-fill the sales tax and VLF taken from ERAF. ERAF III is only in effect for FY 2004-05 and 2005-06.
The Triple Flip for Sales & Use Tax ended Januay 1, 2016 (FY 2015/16). As a result, the Bradley Burns sales tax rate was
restored to 1% and ERAF will no longer be used to reimburse local agenices for the loss in sales tax that resulted from the
Triple Flip. The final Triple Flip true-up payment was made by the State in July 2016.
COUNTY OF MONO
Triple Flip
2004-05 through 2015-16
COUNTY TOWN
110
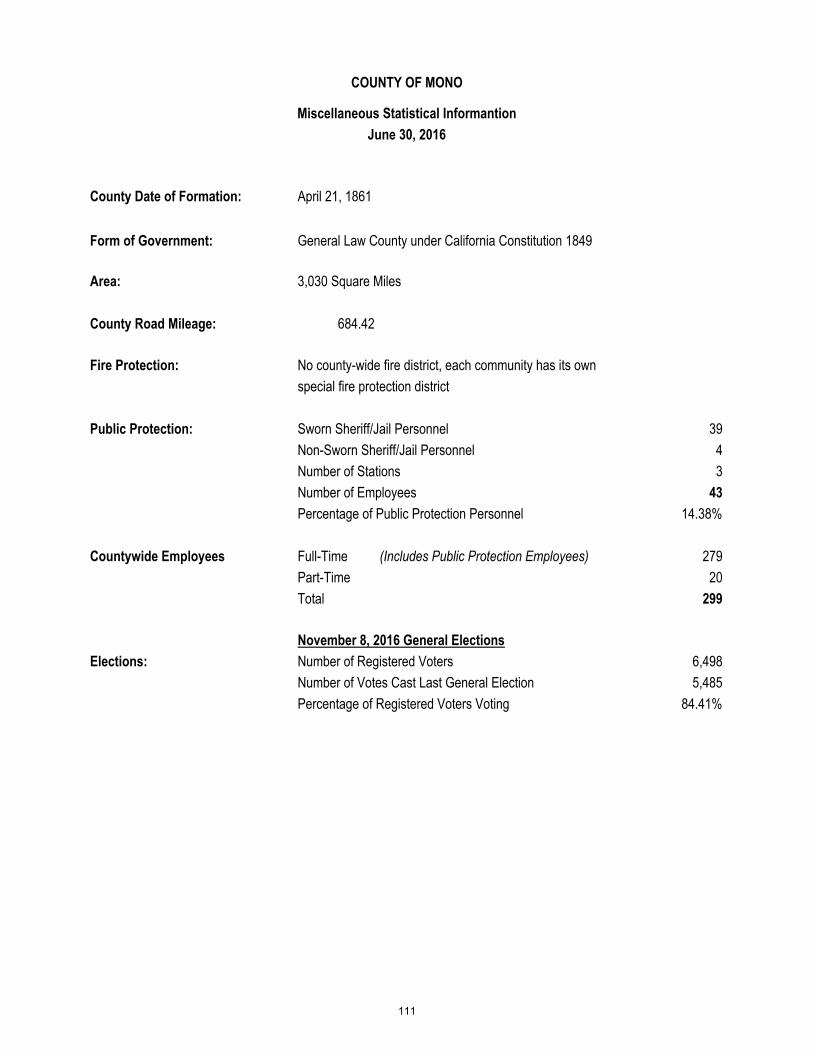
County Date of Formation: April 21, 1861
Form of Government: General Law County under California Constitution 1849
Area: 3,030 Square Miles
County Road Mileage: 684.42
Fire Protection: No county-wide fire district, each community has its own
special fire protection district
Public Protection: Sworn Sheriff/Jail Personnel 39
Non-Sworn Sheriff/Jail Personnel 4
Number of Stations 3
Number of Employees 43
Percentage of Public Protection Personnel 14.38%
Countywide Employees Full-Time (Includes Public Protection Employees) 279
Part-Time 20
Total 299
Elections: Number of Registered Voters 6,498
Number of Votes Cast Last General Election 5,485
Percentage of Registered Voters Voting 84.41%
COUNTY OF MONO
Miscellaneous Statistical Informantion
June 30, 2016
November 8, 2016 General Elections
111

COUNTY OF MONO
Miscellaneous Statistical Informantion
June 30, 2016
Population: FY Year County Incorporated Total
(Bodie Only) 1879 8,000 8,000
1910 2,042 2,042
1920 960 960
1930 1,360 1,360
1940 2,299 2,299
1950 2,115 2,115
1960 2,213 2,213
1970 4,016 4,016
1980 8,577 8,577
1990 *** 10,350
2000 *** 10,293
Department of Finance as of 1/1/** 2001 *** 12,799
2002 *** 13,250
2003 *** 13,350
2004 5,946 7,617 13,563
2005 5,982 7,667 13,649
2006 5,880 7,717 13,597
2007 6,346 7,413 13,759
2008 6,214 7,413 13,627
2009 6,318 7,299 13,617
2010 5,819 8,209 14,028
2011 5,890 8,286 14,176
2012 5,819 8,209 14,028
2013 6,186 8,307 14,493
2014 6,045 8,098 14,143
2015 6,285 8,410 14,695
2016 5,697 8,024 13,721
*** No Data Kept for these years
112